The Structure of Vocational Interests in Iceland: Examining Holland's and Gati's RIASEC Models
Upload
northamptonCategory
view
2download
0
ARTICLE IN PRESS
0277-3791/$ - se
doi:10.1016/j.qu
�CorrespondE-mail addr
Quaternary Science Reviews 25 (2006) 2314–2331
Early Holocene climate variability and the timing and extent of theHolocene thermal maximum (HTM) in northern Iceland
Chris Caseldine�, Peter Langdon, Naomi Holmes
Department of Geography, School of Geography, Archaeology and Earth Resources, University of Exeter, Exeter EX4 4RJ, UK
Received 7 July 2005; accepted 2 February 2006
Abstract
The magnitude and timing of Holocene maximum warmth in the Arctic and sub-Arctic has been the subject of considerable recent
interest, particularly in the context of future climate change. Although lying at a crucial location in the North Atlantic close to significant
atmospheric and oceanic boundaries, terrestrial Holocene climatic data from Iceland are few and predominantly derive from glacial and
palaeoecological evidence. Here we present new datasets from Trollaskagi, based on chironomid-inferred temperatures (CI-T), using sub-
fossil chironomids from the same lake sediments supplemented by pollen data. July air temperatures have been derived using an Icelandic
training set, and the data suggest optimal temperatures at sea level up to 1.5 1C above current levels around 8 k cal. yr BP, a time when
birch woodland was well developed in Trollaskagi, but when woodland had still not fully developed in the more isolated NW peninsula.
Our data thus suggest that optimal summer warmth did not occur in Iceland until 8 kcal. yr BP at the earliest, possibly lasting until
6.7 kcal. yr BP. The amount of warming for July was therefore at least 1.5 1C, but possibly up to 2–3 1C higher than the 1961–1990
average on the basis of the tree-line data. Comparison with data from elsewhere in adjacent Arctic regions, Greenland and Eastern Arctic
Canada show peak warmth to be later in Iceland, and less pronounced. It also appears that there were enhanced temperature gradients
during the first half of the Holocene between the two study areas Trollaskagi and the NW Peninsula and that they influenced patterns of
vegetation colonisation, with current spatial temperature patterns only developing as Holocene climate deteriorated after around
6 kcal. yr BP.
r 2006 Elsevier Ltd. All rights reserved.
1. Introduction
Understanding the nature of climatic variability duringthe first half of the Holocene, and in particular the timingand extent of the Holocene thermal maximum (HTM), is ofcritical importance for understanding the nature oforbitally-forced interglacial climate variability (Ruddiman,2003) and for testing models of the linkages between theocean–atmosphere–land systems and possible cyclicities inNorth Atlantic climate (e.g. O’Brien et al., 1995; Alleyet al., 1997; Bianchi and McCave, 1999; McDermott et al.,2001; Langdon et al., 2003; Turney et al., 2005). The NorthAtlantic region as a whole has been a focus for such studieswith particular emphasis on the marine record (e.g. Bondet al., 1997, 2001; Eirıksson et al., 2000a; Andrews et al.,2001b; Bauch et al., 2001; Jiang et al., 2001; Andersen
e front matter r 2006 Elsevier Ltd. All rights reserved.
ascirev.2006.02.003
ing author. Fax: +44 139 226 3342.
ess: [email protected] (C. Caseldine).
et al., 2004; Eynaud et al., 2004) but as yet there isrelatively little terrestrial evidence for locations such asIceland that are heavily influenced by North Atlanticoceanic and atmospheric circulation. There has also been atendency in recent years to focus on the impact of eventssuch as the ‘8.2 ka’ event (Alley and Agustdottir, 2005)rather than trying to establish longer-term climaticvariability from terrestrial evidence.Although lying close to sharply defined atmospheric and
oceanic boundaries, terrestrial evidence for climate changefrom Iceland has been extremely sparse. Studies of glacialchange have concentrated on the Later Holocene due to alack of evidence from the earlier period (Stotter et al., 1999;Mackintosh et al., 2002) and biological evidence hasrelied on a rather generalised view of vegetation changefrom pollen and macrofossil evidence (Hallsdottir andCaseldine, 2005) with a limited range of detailed site studiesfor the Early Holocene (Hallsdottir, 1991; Rundgren, 1995,1998, 1999; Rundgren and Ingolfsson, 1999). This was

ARTICLE IN PRESSC. Caseldine et al. / Quaternary Science Reviews 25 (2006) 2314–2331 2315
improved with the first chironomid-based tempera-ture reconstruction from Efstadalsvatn in NW Iceland(Caseldine et al., 2003), but this work was based on the useof a Norwegian training set for deriving mean Julytemperatures. There has, however, been a significantexpansion in evidence from marine sediments off northernand western Iceland over recent years (Eiriksson et al.,2000a, b; Andrews et al., 2001a, b, 2003; Jiang et al., 2001,2002; Knudsen and Eirıksson, 2002; Andrews and Gir-audeau, 2003; Castaneda et al., 2004; Giraudeau et al.,2004; Knudsen et al., 2004; Andresen et al., 2005; Smithet al., 2005).
In this paper, we present pollen, chironomid andsedimentary data from two neighbouring sites on theTrollaskagi peninsula covering the period ca 10.2–7.0 kcal.yr BP and provide the first quantitative estimate oftemperature change for terrestrial sites based on anIcelandic chironomid training set (Langdon, unpublisheddata).
2. Study area, field sampling and stratigraphy
The Trollaskagi peninsula lies between Eyjafjorjur andSkagafjorjur just below the Arctic Circle in northernIceland (Fig. 1). Palaeoecological data have previouslybeen presented from Vesturardalur at around 400m (Wastl
NO
R
TH
WE
S
Snæfellsnes Peninsula
Efstadalsvatn
H ú n a f
Í s a f j a r ð a r d j u p B997-332
B997-324
B997-32
B997-33
MD99-2269
KN158-4-72GCC
Other pollen sites / palaeo sites
Marine cores
Analysed sites (this paper)
66°
24° 22°
24°
65°
22°
Fig. 1. Map of N and NW Iceland showing location of the sample sites, terrest
KN158-4-72GCC (Andresen et al., 2005); MD997-324/332/329/330 (summarise
2269 (Andersen et al., 2004).
et al., 2001) but here data are presented for the EarlyHolocene from two small basin sites at lower altitudes:Hamundarstajahals—(651580N 181270W) a small,
90� 60m diameter kettle hole now infilled with peat lyingat an altitude of 100m. The analysed core, HH8, was takenfrom the centre of the basin.Vatnamyri—(651540N 181180W) a more complex larger
basin almost 2 km long by 0.5 km wide at 220m, currentlylargely infilled but with occasional open water. The selectedcore was obtained in two parts, Vatnamyri 2 and 3 (VAT2and VAT3), above and below the almost impenetrableSaksunarvatn tephra layer (Gronvold et al., 1995; Bjorcket al., 2001), from the western and deepest part of thebasin. Current mean July temperature at sea level based on1961–1990 data is 10.5 1C.In both cases, upper sediments were cored by hand using
Russian corers with power-assisted coring required torecover lower sediments penetrating the Saksunarvatntephra layer. Cores were sub-sampled in the field and keptat 4 1C prior to later laboratory analyses. Materialpresented here was taken from the lowermost lacustrinesediments, principally silty clays with gyttjas underlyingterrestrial peat (Carex–Equisetum) that dominated theupper 3m at HH8 and 4.5m at Vatnamyri. The followingstratigraphical characteristics are important for the deriva-tion of age–depth models and are highlighted in thepercentage total carbon (%C) curve (Fig. 2).
0 50km
T I C
E L A N D
Hámundarstaðahals
Hafratjörn
Krosshólsmýri
Hella Árskogsströnd
Vatnskotsvatn Vesturárdalur
Vatnamýri
Eyjaf jö
rðu
r
Skagi Trö l laskag i
Torfadalsvatn
l ó i
9
0
HM107-04
HM107-05
66°
20° 18°
North Alantic Ocean
NO
RW
AY
NO
RW
AY
ICELANDG R E E N L A N D
G R E E N L A N D
rial sites and selected marine cores discussed in the text. For marine cores:
d in Castaneda et al., 2004); HM107-04/05 (Knudsen et al., 2004); MD99-
ARTICLE IN PRESS
S a k s u n a r v a t n t e p h r a
HH8 age model (weighted)
S a k s u n a r v a t n t e p h r a
VAT2/3 age model (weighted)
(a)
(b)
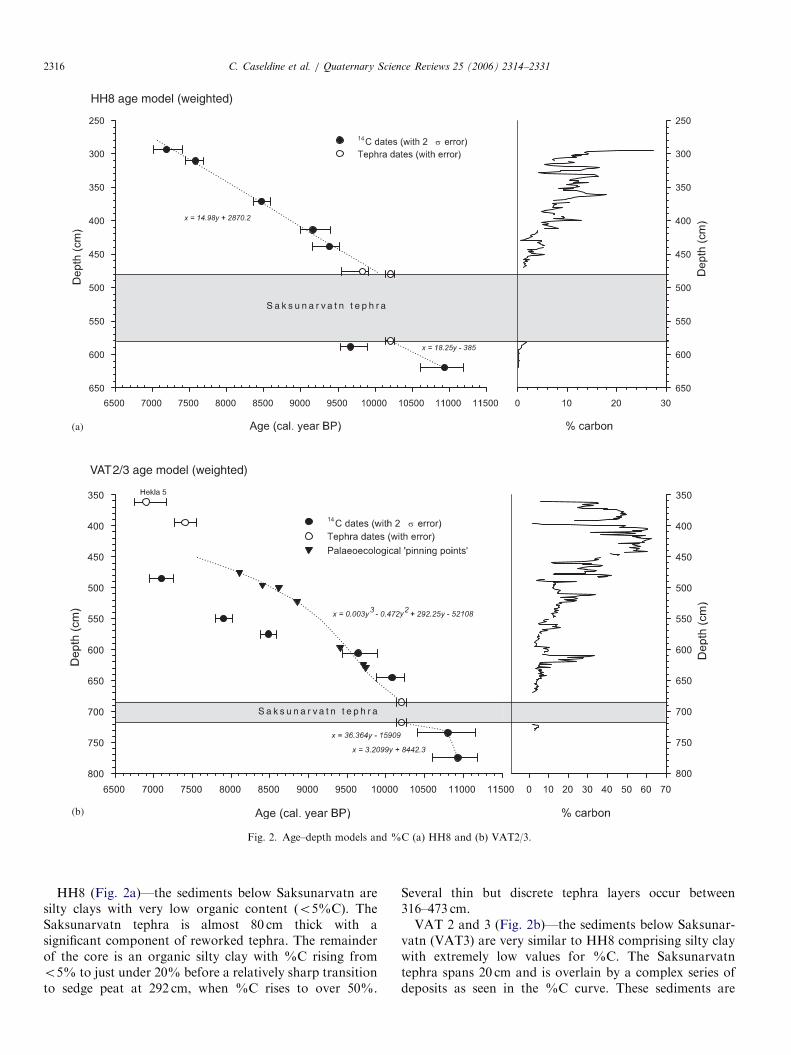
Fig. 2. Age–depth models and %C (a) HH8 and (b) VAT2/3.
C. Caseldine et al. / Quaternary Science Reviews 25 (2006) 2314–23312316
HH8 (Fig. 2a)—the sediments below Saksunarvatn aresilty clays with very low organic content (o5%C). TheSaksunarvatn tephra is almost 80 cm thick with asignificant component of reworked tephra. The remainderof the core is an organic silty clay with %C rising fromo5% to just under 20% before a relatively sharp transitionto sedge peat at 292 cm, when %C rises to over 50%.
Several thin but discrete tephra layers occur between316–473 cm.VAT 2 and 3 (Fig. 2b)—the sediments below Saksunar-
vatn (VAT3) are very similar to HH8 comprising silty claywith extremely low values for %C. The Saksunarvatntephra spans 20 cm and is overlain by a complex series ofdeposits as seen in the %C curve. These sediments are
ARTICLE IN PRESSC. Caseldine et al. / Quaternary Science Reviews 25 (2006) 2314–2331 2317
primarily organic silty clay with %C values generally less than10% below 550 cm; between 550–490 cm they are below 20%,between 490–450 cm below 30%, with sedge peat formingabove 450 cm (%C450%). These sediments are also,however, punctuated by numerous primary and secondarythin (usually 273mm) tephra horizons. In VAT2 there are,however, also short sections of much higher organiccomposition, especially between 620–610 and 520–510 cm.
2.1. Dating and development of age–depth models
Both profiles contained several tephra layers, the resultsof which are discussed by Wastl (2000). Apart from thethick deposit of Saksunarvatn tephra (10180760 cal. yr BP,Gronvold et al., 1995), the identification of later Heklatephras in the upper peats, and a possible Snæfell light-coloured tephra at 476 cm in HH8, dated to87707110 14C yr BP (Table 1) in an adjacent core (Wastl,2000), no other layers that were identified or geochemicallyanalysed could be used as marker horizons for the coresanalysed. The tephrochronology of the region (Wastl,2000; Wastl et al., 2001) has proved difficult to establish asthere are variable numbers of very similar tephras at closely
Table 1
Radiocarbon dates and tephra dates from Hamundarstajahals (HH8) and Va
Depth (cm) 14C date BP Error71 S.E. Lab. code R
2s
Radiocarbon
Hamundarstajahals
HH8
589a 8673 56 AA-44909 98
439 8371 56 AA-44910 95
414 8162 69 AA-44911 93
371 7663 70 AA-44912 85
311 6742 69 AA-44913 76
294 6289 57 AA-44914 74
Vatnamyri
VAT3
734.5 9460 120 AA-44915 11
VAT2
645.5a 8969 66 AA-44916 10
606a 8608 86 AA-44917 98
575a 7680 61 AA-44918 85
550a 7108 52 AA-44919 80
485.5a 6168 57 AA-44920 72
450.5a 5668 59 AA-44921 65
Tephras
Depth (cm) Tephra 14C date
BP
Error
71 S.E.
R
2s
Hamundarstajahals (HH8)
476 Light tephra (Snaefell) 8770 110 99
Vatnamyri (VAT2)
361.5 Hekla 5 6065 55 71
236.5 Hekla 4 3935 50 45
157.5 Hekla 3 2840 45 31
aDates not used in the age–depth model.
located sites. Thus, for example at Vatnamyri, below theSaksunarvatn tephra, the type profile examined and datedby Wastl (2000) had 11 geochemically analysed tephras in70 cm of sediment, many of which were inseparablegeochemically; the parallel core analysed here (VAT3) onlyhad pollen in the top 30 cm below Saksunarvatn with amore limited number (seven) of generally thin tephras,none of which could be assigned to a reliable age estimate.Samples for radiocarbon dating were taken from all
three cores and the results are summarised in Table 1. Inthe absence of sufficient plant macrofossils for dating alldeterminations are on bulk C and it is clear that some dateshave significant errors. For Hamundarstajahals, the datedtephras and radiocarbon dates, except for a single datebelow Saksunarvatn, are considered reliable and anage–depth curve has been constructed for the period10.2 k–7.5 kcal. yr BP (Fig. 2a). At Vatnamyri, the majorityof radiocarbon dates have significant errors and are allthought to be too young. The approach adopted has beento construct an age–depth profile by establishing a smallnumber of fixed points using the dated tephras and thencarry out curve matching based on the pollen andchironomid results, assuming that where patterns are
tnamyri (VAT2/3)
ange (cal. yr BP)
error
Age (cal. yr BP)
used in model
d13C
88–9533 9670 �23.5
23–9151 9380 �25.0
99–8992 9170 �25.8
89–8355 8470 �28.0
91–7440 7580 �28.4
07–7013 7170 �27.9
159–10406 10800 �21.4
237–9873 10080 �21.1
89–9437 9640 �22.3
88–8380 8480 �21.5
22–7791 7900 �24.0
50–6943 7100 �29.1
68–6308 6440 �29.5
ange (cal. yr BP)
error
Age (cal. yr BP)
used in model
Reference: Lab code
10–9540 9700 Wastl (2000) AA-23876
56–6747 6900 Wastl et al. (2001) AA-28985
21–4186 4370 Wastl et al. (2001) AA-28982
55–2793 2960 Wastl et al. (2001) AA-30906

ARTICLE IN PRESSC. Caseldine et al. / Quaternary Science Reviews 25 (2006) 2314–23312318
identical given the proximity of the sites they should reflectlocal changes occurring more or less synchronously giventhe proximity of the sites. In more detail:
Hamundarstajahals: This has the simplest lithostratigra-phy and the most robust age determinations. It is notpossible to date sediments below Saksunarvatn because theradiocarbon date is clearly too young (i.e. younger thenthat of the tephra above). Above this level, it is possible toconstruct a model based on the radiocarbon and tephradates that gives a linear fit (Fig. 2a). This is only valid forthe predominantly inorganic sediments, hence the age ofthe uppermost peat is less certain. Although Hekla 5 (H5)was not found in this particular profile it was widely foundin adjacent cores occurring between 25–32 cm above thegyttja/peat transition. Extrapolation of the age model tothe surface through an estimated H5 level at 28 cm abovethe transition implies a change of accumulation rate from15 yr cm�1 in the gyttja to 25 yr cm�1 in the peat. Estimateddates below Saksunarvatn are discussed below.
Vatnamyri: The date below Saksunarvatn is consideredto be reliable by comparison with similar Icelandicsequences (Rundgren, 1999; Hallsdottir and Caseldine,2005). Above the Saksunarvatn tephra the radiocarbondates appear to be increasingly too young (Table 1), anassumption confirmed by the presence of Hekla 5 at361.5 cm in the overlying peat (Maria Wastl, pers. comm.).Although the two lowest dates appear to be possibly valid(see Fig. 2b) there are insufficient reliable data to develop asound age–depth model using them. Any model is likely tobe complex because of the changes in sediment type as seenmost clearly in the %C data, with the more organic layersrepresenting drying out and presumably a slower sedimen-tation rate, and the numerous, albeit thin, tephra layersaccelerating sedimentation. An age–depth model wasdeveloped for VAT2 using the following criteria: (i)Saksunarvatn at 685 cm; (ii) Hekla 5 at 361.5 cm (notedin field); (iii) +47 yr at surface; (iv) aligning peaks in thepalaeoecological record (CI-T; Betula % curve; Juniperus
% curve) assumed likely to be local features found both atVatnamyri and Hamundarstajahals in order to accommo-date changing sedimentation rates (see above and discus-sion below). This produced an age–depth model aboveSaksunarvatn with a third order polynomial fit (Fig. 2b).
Because it has not been possible to establish reliable basaldates for either site, the oldest radiocarbon date found ateither of the two sites, 96607100 14CyrBP (AA-23883;10,970–10,560 cal. yrBP, Wastl, 2000) has been taken as areasonable estimate of the oldest biostratigraphic data (thepoint at which pollen is preserved in sufficient quantities toanalyse). At Hamundarstajahals, linear sedimentation to theSaksunarvatn tephra was assumed, as the only radiocarbondate from this part of the core is clearly too young. While theuniform accumulation may not be likely, as seen in thevarying%C record, this is the only possible solution at presentand hence all dates are treated with caution. The age profilecreated for Vatnamyri incorporates the radiocarbon date, andtwo equations are used to create the VAT3 age model
(Fig. 2b). These reflect assumed changes in sedimentation ratefollowing deglaciation and development and stabilisation ofsoils and vegetation within the catchment area of the lake.Support for these assumptions comes from comparing thepalaeoecological data with those from other early Holocenesites (Rundgren, 1999) where very similar radiocarbon agesare found and similar ecosystem developments identified.
3. Laboratory and statistical analyses
A range of palaeoecological and sedimentologicalanalyses were performed on the sediments. Total carbon(C) and total nitrogen (N) were measured using a CarloErba Elemental Analyser model NA2500. Pollen analysisutilised subsamples of up to 1 cm3, which were processedusing standard procedures (Moore et al., 1999) at varyingintervals through the cores, usually 2 cm but at 1 cm belowSaksunarvatn, and tablets of Lycopodium spores wereadded to facilitate calculation of pollen concentrations.Local pollen assemblage zones have been defined usingCONISS (Fig. 3a and b). Morphometric data werecollected for all measureable Betula grains and results forHamundarstajahals have been published (Caseldine,2001). On the diagrams there is a single curve includingall Betula with inferences concerning the relative impor-tance of tree/shrub/dwarf birch made in the text.Chironomid analysis followed standard preparation
methods by deflocculating sediments in 10% KOH andmounting head capsules in Hydromatrixs (Brooks andLangdon, in prep.). Sample sizes of up to 1 cm3 were used,with a minimum of 50 head capsules being counted persample, enough for robust statistical inferences (Heiri andLotter, 2001; Quinlan and Smol, 2001). Taxonomicidentification followed Brooks and Langdon (in prep.).Local chironomid assemblage zones were defined and arepresented with the chironomid diagrams (Fig. 4a and b).Mean July air temperature estimates were reconstructed
from the chironomid data using a transfer functiondeveloped from a contemporary training set of 52 lakesin NW Iceland (Langdon, unpublished data). A weightedaverage partial least squares (WA-PLS) model was used, ofwhich the second component performed best, withr2jack ¼ 0.66 and RMSEPjack ¼ 1.10 1C. Detrended corre-spondence analysis (DCA) was undertaken on bothchironomid datasets in order to assess whether patternsof taxa change were similar to reconstructed temperatures.DCA was performed using CANOCO 4.5.2 (ter Braak andSmilauer, 1998) and used square-root transformation ofspecies data and down-weighting of rare taxa.
4. General biostratigraphic patterns and trends
4.1. Pollen
Both the taxa represented and the general patterns ofchange are very similar to those found at other sites in the

ARTICLE IN PRESS
300
320
340
360
380
400
420
440
460
480
500
520
540
560
580
600
620
2020
4020
4060
8020
4060
8020
4020
4060
8020
2040
6080
100
200
300
Betula
Depth
Age cal. years
BP
Sorbus type
Salix
Juniperus communis
Poaceae undiff.
Cyperaceae undiff.Empetru
mEric
ales Angelica sylve
stris
LactuceaeAsteroideae
Armeria
mariti
ma
Caltha palustris
Caryophyllaceae
Campanulaceae
Chenopodiaceae
Brassicaceae
Filipendula
Mentha type
Koenigia islandica
Oxyria Plantago mariti
ma
Potentilla ty
pe
Polygonum aviculare
Polygonum bistorta
Rhinanthus type
Ranunculaceae
RosaceaeRubiaceaeRumex a
cetosa
Rumex acetosella
Saxifragaceae
Sedum Succisa Thalictru
mUrtic
a type
ApiaceaeVicia undiff.
Botrychium lu
naria
Equisetum
Lycopodium annotin
um
Huperzia selago
Lycopodium undiff.
PolypodiumDryopteris
felix
mas type
Selaginella selaginoides
Pteropsida (monolete) u
ndet.
Myriophyllu
m alterniflo
rum
Potamogeton natans type
Typha angustifolia
/Sparganium
Hippuris vulgaris
Isoëtes echinospora
SphagnumPinus s
ylvestris
Ulmus Alnus g
lutinosa
Corylus ave
llana
Pollen concentra
tion
Zon
e
HH
8 i
HH
8 ii
HH
8 iii
HH
8 iv
HH
8 v
HH
8 vi
HH
8 vi
i
AB
CL
E
8000
8500
9000
9500
1000
0
1050
0
Sa
ks
un
arv
atn
te
ph
raS
ak
su
na
rva
tn t
ep
hra
(a)
Fig.3.Pollen
diagramsfor(a)HH8and(b)VAT.Arrangem
entoftaxafollowsHallsdottir(1987):A—
dry
landtaxa;B—
sporesofpteridophytes;C—
aquaticplants;E—
Sp
ha
gn
um;L—exotictaxanot
foundin
indigenousIcelandic
flora.Taxaare
calculatedas
A¼
%S
A;
B¼
%S
A+
B;
C¼
SA+
B+
C;
E¼
SA+
E;
L¼
SA+
L.Concentrationisin
grains�103cm�3.
C. Caseldine et al. / Quaternary Science Reviews 25 (2006) 2314–2331 2319

ARTICLE IN PRESS
46
0
48
0
50
0
520
54
0
56
0
58
0
60
0
620
64
0
660
68
0
700
720
740
2040
6020
2040
6020
4060
8020
4060
8010
020
2020
2020
2020
4020
2020
4060
8020
4060
8010
020
2020
100
300
500
Vat
iV
at ii
Vat
iii
Vat
iv
Vat
v
Vat
vi
Vat
vii
Vat
viii
Vat
ix
Betula
Juniperus communis
Salix
Sorbus typePoaceae undiff.
Cyperaceae undiff.
Calluna vulgaris
Empetrum Pyrola Ericales Apiaceae
AsteroideaeBrassicaceae
Campanulaceae
Caryophyllaceae
Centaurea type
Chenopodiaceae
LactuceaeLamiaceaeRanunculaceae
RosaceaeRubiaceaeSaxifra
gaceae
Armeria
maritima
Artemisia
\Caltha palustris type
Cirsium type
Dryas octopetala
Gentianella campestris type
Filipendula
Helianthemum
Hydrocharis
Koenigia islandica
Lotus Lychnis flos-cuculi
Mentha type
Oxyria Parnassia palustris
Plantago maritima
Plantago lanceolata
Polygonum bistorta
Polygonum viviparum
Potentilla type
Rhinanthus type
Rubus typeRumex acetosa
Rumex acetosella
Rumex/Oxyria
Rumex undiff.
Sagina Saxifraga nivalis
Saxifraga stellaris type
Saxifraga oppositifo
lia type
Sedum Thalictrum
Trifolium type
Urtica dioica
Viola palustris type
Botrychium lunaria
EquisetumHuperzia selago
Lycopodium annotinum
Lycopodium undiff.
Cryptogramma crispa
PolypodiumPteropsida (m
onolete) undet.
Selaginella selaginoides
Thelypteris palustris
Isoëtes echinospora
Littorella uniflo
ra
Myriophyllum alterniflo
rumMyrio
phyllum spicatum
Myriophyllum undiff.
Potamogeton natans type Hippuris vulgarisMenyanthes SphagnumUnidentifie
d
Alnus Corlyus Hedera PinusQuercus Pollen concentra
tion
Zon
e
Vat
nam
ýri
AB
CL
E
Sparganium / Typha angustifo
lia
Depth
Age cal. years
BP
7500
8000
8500
9000
9500
1000
0
1050
0
Sa
ks
un
arv
atn
te
ph
raS
ak
su
na
rva
tn t
ep
hra
(b)
Fig.3.(C
on
tin
ued)
C. Caseldine et al. / Quaternary Science Reviews 25 (2006) 2314–23312320
ARTICLE IN PRESS
320
34
0
36
0
38
0
40
0
420
44
0
46
0
48
0
50
0
520
54
0
56
0
58
0
60
0
20Mac
ropelo
pia
20
Procla
dius
Tany
podin
ae u
ndiff
20
Coryn
oneur
a sc
utel
lata
Cricot
opus
pul
chrip
es ty
pe
Cricot
opus
sylve
stris
type
Cricot
opus
trem
ulus
type
Lim
nophy
es
20
Orthoc
ladius
cons
obrin
us typ
e
2040
Psect
rocla
dius s
ordi
dellu
s typ
e
Pseud
osm
ittia
Smitt
ia Orthoc
ladiin
ae u
ndiff
.
20
Chiron
omus
ant
hrac
inus t
ype
Chirono
min
i larv
ula
2040
Dicrot
endi
pes
2040
60
Tany
tars
us lu
gens
type
20
Parat
anyt
arsu
s pen
icilla
tus t
ype
2040
Micr
opse
ctra
spp
Tany
tars
ini u
ndiff
.
100
200
300
400
500
Conce
ntra
tion
Zon
e
HH
8-5
HH
8-4
HH
8-3
HH
8-2
HH
8-1
Chi
rono
mid
ae
8000
8500
9000
9500
1000
0
1050
0
Depth
(cm
)
Age ca
l. yea
rs B
P
Sa
ks
un
arv
atn
te
ph
raS
ak
su
na
rva
tn t
ep
hra
(a)
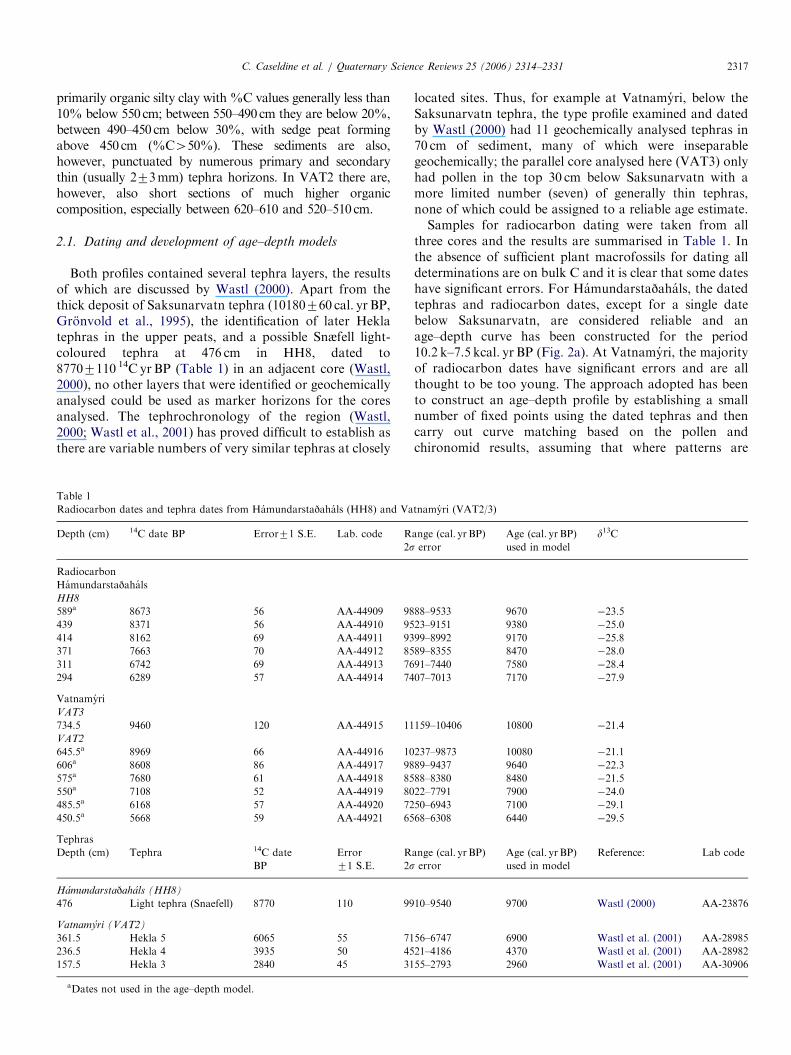
Fig.4.Chironomid
assem
blages
(a)HH8and(b)VAT2/3.Percentages
are
oftotalnumber
ofheadcapsulesidentified.
C. Caseldine et al. / Quaternary Science Reviews 25 (2006) 2314–2331 2321

ARTICLE IN PRESS
46
0
48
0
50
0
520
54
0
56
0
58
0
60
0
620
64
0
660
68
0
700
720
740
760
780
2040
6020
2020
2020
4020
2020
4060
2040
2040
6080
100
2020
040
060
080
0
Diamesa sp.
Depth (cm)
Pseudodiamesa branickii
Parochlus kieffe
ri
AblabesmyiaMacro
pelopia
Procladius Thienemannymia group
Tanypodinae undiff.
Corynoneura lobata
Corynoneura scutellata Cric
otopus pulchrip
es type
Cricotopus s
ylvestris
type
Cricotopus t
remulus type
Cricotopus s
p. A
Krenosmittia
Limnophye
sHeterotris
socladius grim
shawi
Metriocnemus h
ygropetricus
Orthocladius c
onsobrinus t
ype
Orthocla
dius typ
e
Orthocla
dius/Cric
otopus spp.
Paraphaenocladius
Parasmittia Pse
ctrocla
dius sordidellus t
ype
Pseudosm
ittia
Smittia Orthocla
diinae undiff.
Chironomus a
nthracinus t
ype
Chironomini la
rvula
Dicrotendipes
Tanytarsu
s lugens g
roup
Paratanytarsu
s penicil
latus typ
e
Micropse
ctra sp
p.
Tanytarsi
ni undiff
Unidentified Chiro
nomidae
Concentra
tion
Zon
e
VA
T 5
VA
T 4
VA
T 3
VA
T 2
VA
T 1
Chi
rono
mid
ae
Age cal. years
BP
Sa
ks
un
arv
atn
te
ph
raS
ak
su
na
rva
tn t
ep
hra
7500
8000
8500
9000
9500
1000
0
1050
0
1100
0
(b)
Fig.4.(C
on
tin
ued)
C. Caseldine et al. / Quaternary Science Reviews 25 (2006) 2314–23312322

ARTICLE IN PRESSC. Caseldine et al. / Quaternary Science Reviews 25 (2006) 2314–2331 2323
region; and nomenclature and diagram constructionfollowed Hallsdottir (1987).
Below the Saksunarvatn tephra, pollen concentrationsare generally very low (generally o500 grains cm�3), and arange of open ground taxa predominate, such as Poaceae,Cyperaceae and Salix (probably Salix herbacea). Empe-
trum and Ericales undiff., probably mainly Vaccinium sp.,appear before the deposition of the tephra but all tree taxarepresented almost certainly derived from outside Iceland.Overall the patterns are very similar between the sites.Pollen concentrations gradually increase after Saksunar-vatn (up to 10,000–16,000 grains cm�3 in HH8, generallynearer 10,000 grains cm�3 at Vatnamyri; 500–800 and1000 grains cm�2 yr�1, respectively), although there is quitea lot of variability with occasional much higher valuestending to correlate with periods of higher %C and short-term slowing of the sedimentation rate. Nevertheless, theseinflux rates compare well with the limited data oncontemporary deposition rates in comparable environ-ments (Hicks, 2001). Low pollen concentrations are usuallydue to samples including quantities of tephra. As values forBetula and other shrub taxa rise there is a reduction inspecies diversity, especially at Vatnamyri, with the smallerbasin at Hamundarstajahals reflecting the local persistenceof a greater range of low-growing taxa as seen in almostcontinuous curves for Brassicaceae, Ranunculaceae andRubiaceae. Because both sites represent open-water en-vironments there are no problems with over-representationof local terrestrial taxa, but aquatic taxa are wellrepresented, especially Isoetes echinospora at HH8 andMyriophyllum and Potamogeton at Vatnamyri, the formerpredominantly Myriophyllum alterniflorum.
4.2. Chironomids
Both chironomid profiles (Fig. 4a and 4b) show cleartrends from being dominated by cold stenotherms at thebase, such as Tanytarsus lugens-type, Orthocladius conso-
brinus-type and Micropsectra spp., to a dominance ofrelatively more thermophilic taxa towards the top, such asParatanytarsus penicillatus-type, Dicrotendipes, and Chir-
onomus anthracinus-type. It is also clear from bothchironomid diagrams that there are rapid fluctuations inrelative percentage taxa abundance superimposed on thesegeneral trends, as indicated in the mean July temperaturereconstructions (Fig. 5) and DCA axis 1 scores (Fig. 6).The reconstructions and DCA results (Fig. 6) agreeremarkably well, indicating that early Holocene fluctua-tions in chironomid assemblages were most likely driven bytemperature, or another environmental factor that co-varied with temperature during this period.
There are some interesting faunal differences betweenthese sites and the only other early Holocene chiron-omid stratigraphy from Iceland, that from Efstadalsvatn(Caseldine et al., 2003). The most noticeable difference isthe lack of Heterotrissocladius grimshawi at both Hamun-darstajahals and Vatnamyri (there are very small amounts,
o3%, at 2 levels from Vatnamyri), whereas at Efstadals-vatn this taxon formed a large part of the fauna post-Saksunarvatn. This could be due to colonisation routes,which may also explain the later arrival of some Cricotopus
taxa, (cf. Efstadalsvatn—Caseldine et al., 2003), althoughthis could also be related to temperature. H. grimshawi iscommon in contemporary Icelandic lakes (Hrafnsdottiret al., 2000; Hrafnsdottir, 2005; Langdon, unpublisheddata) and thus there might be other reasons why it is notpresent in HH8 and Vatnamyri. One other point of notefrom the chironomid stratigraphies is an unusual faunalcomposition at 610 cm (ca 9.6 kcal. yr BP) from Vatnamyri.This level is dominated by Paraphaenocladius and Limno-
phyes, and also includes other semi-terrestrial taxa such asKrenosmittia and Parasmittia. The associated rapid rise in%C and increase in pollen concentration (Fig. 5) indicatethat the site may have dried out, or water depth and/or lakehydrology was severely altered at this time, as indicated bythe increased presence of the semi-terrestrial chironomidtaxa. This leads to what is likely to be an anomalously highchironomid-inferred temperature (CI-T) for this level(Fig. 5). The following level shows chironomid assemblages,%C and pollen concentrations all returning to previousvalues, suggesting that the perturbation was probably shortlived and did not affect the lake development significantly.
5. Climatic and environmental change in north Iceland
10.8–7 kcal. yr BP
5.1. Ca 10.8–10.2 kcal. yr BP (pre-Saksunarvatn)
Both sites show very similar patterns in the pollen record(Figs. 3a, b and 5) from the earliest period of organicdeposition following local deglaciation to the deposition ofthe thick Saksunarvatn tephra. The first record for anyvegetation cover reveals a very open grass-dominatedlandscape with a range of open ground taxa characteristicof disturbed environments: Caryophyllaceae (over 20% atVatnamyri), Rumex/Oxyria, Apiaceae, Saxifragaceae, Hu-
perzia selago, Brassicaceae and occasional grains ofKoenigia islandica as examples. It is possible that theVatnamyri record is slightly earlier, for at Hamundarsta-jahals Salix was already well established by the start of therecord whilst absent at the former. This could however alsorepresent the influence of proximity to wasting ice marginswith ice persisting in the higher basin. The presence ofpollen from ‘exotic’ trees including Pinus, Betula and Alnus
in the very lowest sediments is taken as indicative of verylow local pollen production (influx estimates are almostcertainly o500 grains cm�2 yr�1 despite dating uncertain-ties) with significant representation of pollen from extremelong distance sources outside Iceland. Both the dating andthe nature of the vegetation support the Preboreal ice limitsproposed by Norjdahl and Petursson (2005), whosereconstruction of ice margins in the area indicate that icemust have covered or lain very close to both sites duringthe preceding Younger Dryas.
ARTICLE IN PRESS
0 10 20 30 40 50
C/NTC
11000
10500
10000
9500
9000
8500
8000
7500
5 6 7 8 9 10 11 1211000
10500
10000
9500
9000
8500
8000
7500
0 10 20 30 40 50 60
Cal
yea
rs B
P
Betula Juniperus communis TLP concentration TC and C/N Chironomid-inferredtemperature
% abundance % abundance Number of pollen grains % Degrees Celcius0 5 10 15 20 25 0 10000 30000 50000
11000
10500
10000
9500
9000
8500
8000
7500
0 20 40 60 80 100
Cal
yea
r B
P
0 2 4 6 8 10 12 14 0 100000 200000 300000 5 10 15 20
Betula Juniperus communis TLP concentration TC and C/N Chironomid-inferredtemperature
% abundance % abundance Number of pollen grains % Degrees Celcius
C/NTC
11000
10500
10000
9500
9000
8500
8000
7500
8 9 10 11 1276
(a)
(b)
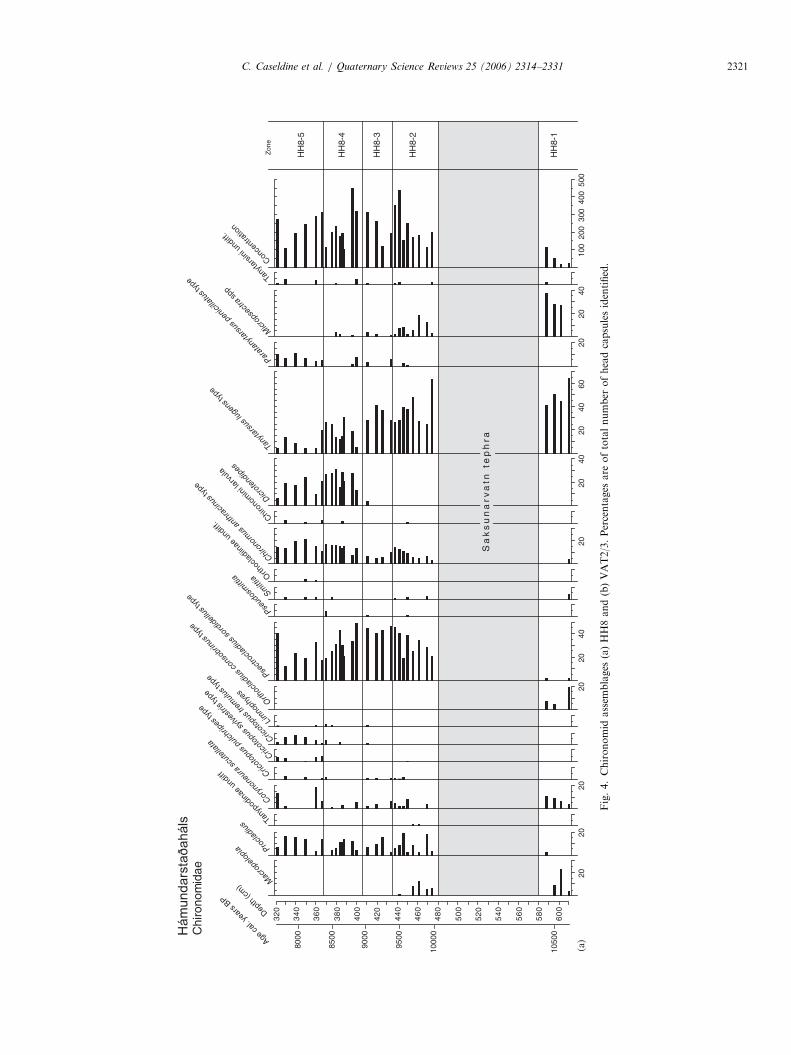
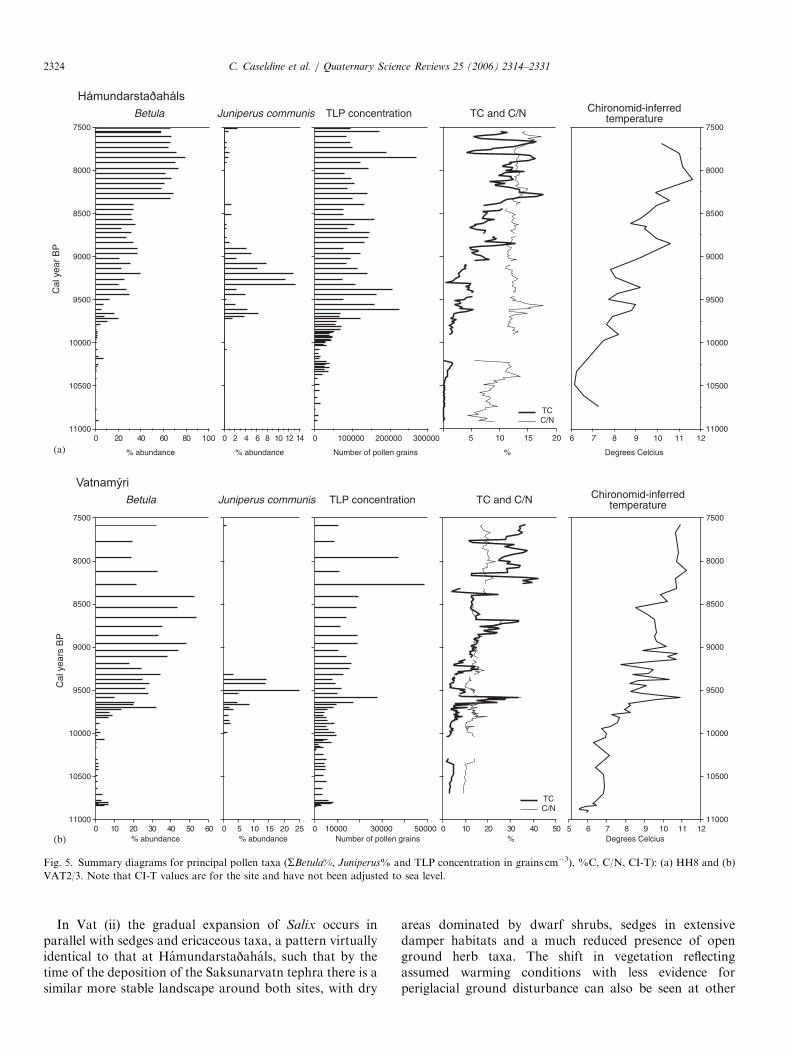
Fig. 5. Summary diagrams for principal pollen taxa (SBetula%, Juniperus% and TLP concentration in grains cm�3), %C, C/N, CI-T): (a) HH8 and (b)
VAT2/3. Note that CI-T values are for the site and have not been adjusted to sea level.
C. Caseldine et al. / Quaternary Science Reviews 25 (2006) 2314–23312324
In Vat (ii) the gradual expansion of Salix occurs inparallel with sedges and ericaceous taxa, a pattern virtuallyidentical to that at Hamundarstajahals, such that by thetime of the deposition of the Saksunarvatn tephra there is asimilar more stable landscape around both sites, with dry
areas dominated by dwarf shrubs, sedges in extensivedamper habitats and a much reduced presence of openground herb taxa. The shift in vegetation reflectingassumed warming conditions with less evidence forperiglacial ground disturbance can also be seen at other
ARTICLE IN PRESS
0 1 0 50 6011000
10500
10000
9500
9000
8500
8000
7500
0 20 40 60 80 100
Cal
yea
r B
P
HH8 Betula
% abundance
0 20 30 4
VAT Betula
% abundance
11000
10500
10000
9500
9000
8500
8000
7500
5 6 7 8 9 10 11 12
VATHH8
Chironomid-inferredtemperature
Degrees Celcius
HH8 DCA axis 1 scores
SD units
3 2.5 2 1.5 1 0.5 0
SD units
3 2.5 2 1.5 1 0.5 0
VAT DCA axis 1 scores
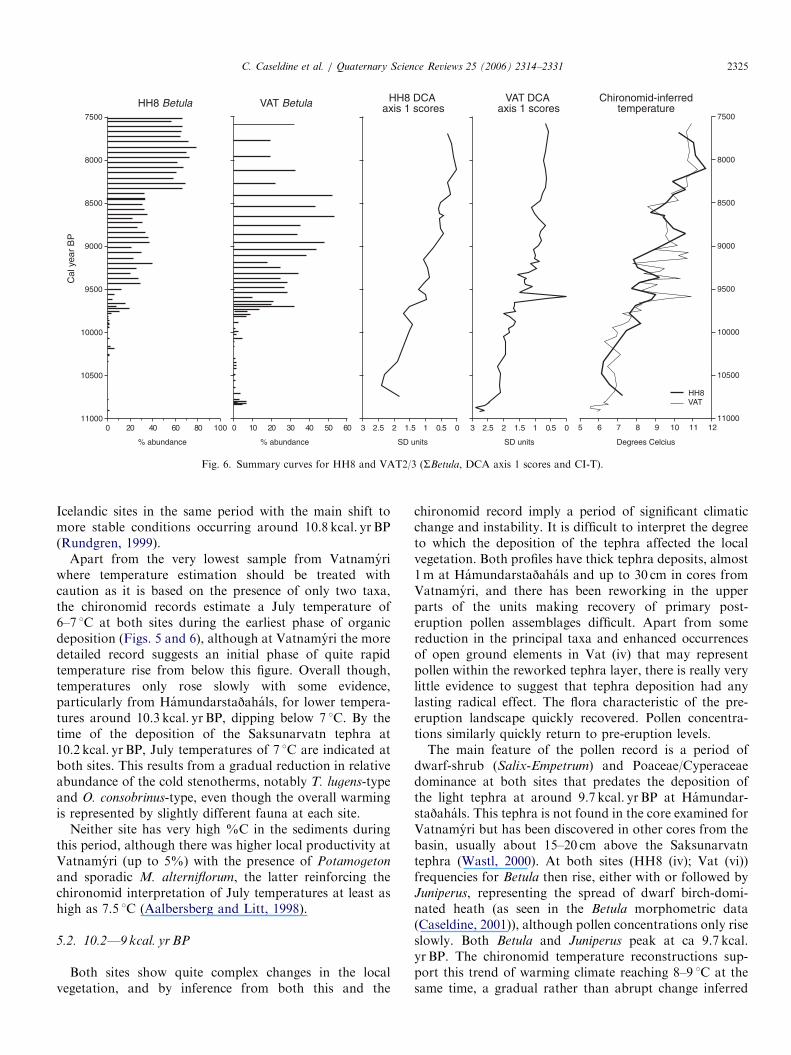
Fig. 6. Summary curves for HH8 and VAT2/3 (SBetula, DCA axis 1 scores and CI-T).
C. Caseldine et al. / Quaternary Science Reviews 25 (2006) 2314–2331 2325
Icelandic sites in the same period with the main shift tomore stable conditions occurring around 10.8 kcal. yr BP(Rundgren, 1999).
Apart from the very lowest sample from Vatnamyriwhere temperature estimation should be treated withcaution as it is based on the presence of only two taxa,the chironomid records estimate a July temperature of6–7 1C at both sites during the earliest phase of organicdeposition (Figs. 5 and 6), although at Vatnamyri the moredetailed record suggests an initial phase of quite rapidtemperature rise from below this figure. Overall though,temperatures only rose slowly with some evidence,particularly from Hamundarstajahals, for lower tempera-tures around 10.3 kcal. yr BP, dipping below 7 1C. By thetime of the deposition of the Saksunarvatn tephra at10.2 kcal. yr BP, July temperatures of 7 1C are indicated atboth sites. This results from a gradual reduction in relativeabundance of the cold stenotherms, notably T. lugens-typeand O. consobrinus-type, even though the overall warmingis represented by slightly different fauna at each site.
Neither site has very high %C in the sediments duringthis period, although there was higher local productivity atVatnamyri (up to 5%) with the presence of Potamogeton
and sporadic M. alterniflorum, the latter reinforcing thechironomid interpretation of July temperatures at least ashigh as 7.5 1C (Aalbersberg and Litt, 1998).
5.2. 10.2—9 kcal. yr BP
Both sites show quite complex changes in the localvegetation, and by inference from both this and the
chironomid record imply a period of significant climaticchange and instability. It is difficult to interpret the degreeto which the deposition of the tephra affected the localvegetation. Both profiles have thick tephra deposits, almost1m at Hamundarstajahals and up to 30 cm in cores fromVatnamyri, and there has been reworking in the upperparts of the units making recovery of primary post-eruption pollen assemblages difficult. Apart from somereduction in the principal taxa and enhanced occurrencesof open ground elements in Vat (iv) that may representpollen within the reworked tephra layer, there is really verylittle evidence to suggest that tephra deposition had anylasting radical effect. The flora characteristic of the pre-eruption landscape quickly recovered. Pollen concentra-tions similarly quickly return to pre-eruption levels.The main feature of the pollen record is a period of
dwarf-shrub (Salix-Empetrum) and Poaceae/Cyperaceaedominance at both sites that predates the deposition ofthe light tephra at around 9.7 kcal. yr BP at Hamundar-stajahals. This tephra is not found in the core examined forVatnamyri but has been discovered in other cores from thebasin, usually about 15–20 cm above the Saksunarvatntephra (Wastl, 2000). At both sites (HH8 (iv); Vat (vi))frequencies for Betula then rise, either with or followed byJuniperus, representing the spread of dwarf birch-domi-nated heath (as seen in the Betula morphometric data(Caseldine, 2001)), although pollen concentrations only riseslowly. Both Betula and Juniperus peak at ca 9.7 kcal.yr BP. The chironomid temperature reconstructions sup-port this trend of warming climate reaching 8–9 1C at thesame time, a gradual rather than abrupt change inferred

ARTICLE IN PRESSC. Caseldine et al. / Quaternary Science Reviews 25 (2006) 2314–23312326
mainly on the basis of the replacement of T. lugens-type byrelatively more thermophilic taxa, such as Psectrocladius atboth sites. At Vatnamyri there is also a local expansion ofthe aquatic flora with a shift from Potamogeton to M.
alterniflorum.This is followed by a very similar sequence in the pollen
records at both sites with the dwarf shrubs almostdisappearing and sedges expanding. At Vatnamyri it isclear that the site dries out as %C values rise to 33% andthere is a change in the chironomid fauna to semi-terrestrial taxa. This change leads to an apparent rise inthe temperature reconstruction but as the transfer functionis based on lake data this can be seen as an artefact of theprocedure, not a genuine rise in temperature. At Hamun-darstajahals where water depths are not obviously affectedthere is a drop in temperature of almost 1.5 1C by9.5 kcal. yr BP. This period of retrogressive vegetationdevelopment, reduced temperatures and increased drynessprobably lasted only 100–200 yr at most, the brief record atVatnamyri reflecting very slow sedimentation due to dryingout. By just after 9.5 kcal. yr BP both Betula (predomi-nantly B. nana) and Juniperus had recovered. CI-T stillonly rose erratically and appeared highly unstable atVatnamyri in particular until around 9 kcal. yr BP whentemperatures possibly reached between 9–10 1C.
Overall the period between 9.5–9 kcal. yr BP saw vegeta-tion recover and stabilise with a period of maximumdevelopment for juniper growing in an upright form abovethe dwarf birch allowing for greater production anddispersal of pollen. At Vatnamyri, frequencies reached20% suggesting increased importance with altitude, achiev-ing levels of pollen representation not seen in Icelandduring the rest of the Holocene. Whether it was favouredby the particular climatic regime of the time, with enhancedseasonality-driven continentality allowing it to outcompeteother dwarf shrubs in the absence of taller tree birches, isuncertain, but this phase can be seen at a range of sitesacross Iceland. At Vatnskotsvatn to the west (Hallsdottir,1995) there is a comparable Juniperus phase, and on thenorth of the Skagi peninsula at Torfadalsvatn Rundgren(1999) identified a phase with persistent high Juniperus
values after 9 kcal. yr BP, although there are datingproblems in this part of the core. In NW Iceland atEfstadalsvatn juniper also peaks between 9.5–9 kcal. yr BP,although in this area it also persists for much longer in theabsence of competition from tree birches (Caseldine et al.,2003). In both areas the CI-T data support the idea thatJuly temperatures were not yet high enough for tree birchesto successfully spread (see below).
At around 9 kcal. yr BP the chironomid data show anisolated peak of higher temperatures, 10 1C at Hamundar-stajahals and 11 1C at Vatnamyri, although the latterreconstruction may have been influenced by the shallowernature of the site. The similarity between the sites (Fig. 6) isbelieved to reflect a genuine climatic effect. Examination ofthe single assemblage on which the reconstruction is basedat Vatnamyri shows that the sample is composed of several
semi-terrestrial taxa (although in relatively small abun-dances), which produced an artificially high temperatureearlier around 9.6 kcal. BP. The basins themselves showdifferent characteristics during this period with Hamun-darstajahals dominated by Isoetes suggesting a very clearsmall lake, with a depth of around 2m (Hannon andGaillard, 1997), possibly slightly deeper (Schierup et al.,2002), producing sediments with o10%C, and Vatnamyrishowing further shallowing with Potamogeton becomingdominant and %C values steadily rising to 20% by9 kcal. yr BP.
5.3. 9–8 kcal. yr BP
By 9 kcal. yr BP Juniperus had disappeared from Vatna-myri and had almost gone from Hamundarstajahals.Pollen concentrations at both sites, although showing alot of inter-sample variability, were relatively stable andhigher than in the previous millennium. At the lower siteSalix remained an important part of the local flora inassociation with Betula, grasses and sedges whilst atVatnamyri the pollen assemblages are dominated by Betula
and Cyperaceae. What this represents in terms of thespread of birch woodland is open to question and haspreviously been discussed for Hamundarstajahals byCaseldine (2001). Measurement of pollen grains of Betula
in these and subsequent levels, and comparison with datafrom current Icelandic birch woodland and from Scandi-navian sites purportedly having comparable tree species(Betula pubescens ssp. tortuosa), show very clearly thatduring this period, full birch woodland dominated by treesthe same as those comprising the present Icelandic birchwoodland had not yet occurred. Diameters reflect probableshrub birch (i.e. diameters had not reached valuescomparable with tree birches today although there was ashift to larger diameters at 9 kcal. yr BP (Caseldine, 2001)).It is though noticeable that by this date CI-T for July hadreached a value considered suitable for tree growth (seebelow). Thus the record from 9kcal. yr BP to at least8.4 kcal. yr BP appears to represent a time when birch wasspreading as a tree, possibly hybridising leading toextensive lower-growing shrub birches and eventuallybecoming dominant within the landscape. Because of thelack of any direct size equivalence in the pollen of treebirches between the Early and Middle Holocene andcurrent trees, it is not known where, and when, the originaltree forms arrived in Iceland. It is possible, althoughconsidered unlikely, that tree birches did arrive before theYounger Dryas and survived in very favourable locations(Rundgren and Ingolfsson, 1999) but there is no directevidence for this from the few sites covering this period.Similarly there is no direct evidence at any site for any earlypost-Younger Dryas arrival of trees. Until more sites havebeen examined for both pollen and macrofossils thisproblem will remain unsolved.At 8.4 kcal. yr BP at Hamundarstajahals, there is a sharp
rise in percentages for Betula (up to 80%), with more

ARTICLE IN PRESSC. Caseldine et al. / Quaternary Science Reviews 25 (2006) 2314–2331 2327
consistent and larger mean grain diameters (although still3-4 mm lower than in current tree populations (Caseldine,2001)), as woodland completely dominated the immediatearea. At Vatnamyri, birch percentages drop due to theexpansion of sedge-dominated peat across the basinisolating the coring site further and further away fromthe nearest woodland, hence determining the actual localimportance of woodland is difficult. On the western slopesof Eyjafjorjur it appears that just after 9 kcal. yr BP ashrub (tree?) birch community became established, but stillwithin a mosaic of developing low-lying bogs (the originalhallamyri) in the valley floors, and other dwarf-shrubcommunities on higher valley sides, presumably havingout-competed the previously significant juniper.
Temperatures between 9–8.5 kcal. yr BP based on thechironomid data show a consistent pattern with the initialpeak preceding a long period of reduced temperatures,down as low as 8.5 1C by 8.5 kcal. yr BP, only returning tolevels as high as 11 1C by 8.1–8.2 kcal. yr BP, althoughreconstructions from Vatnamyri are complicated by thisdate due to terrestrialisation of the site and the spread ofpeat. The consistency of the pattern from the chironomidfauna, however, underlines the duration of the period ofthe suppressed temperatures over several centuries and,notwithstanding any concerns over the validity of thechronology, it is apparent that reduced temperaturesoccurred well before any ‘8.2k event’. It should perhapsbe noted that at both sites there is a very small dip inreconstructed temperatures close to 8.2 kcal. yr BP but thisis more of a retardation of a rising temperature signal byonly 0.5 1C rather than any major temperature decline andin neither site is it possible to identify any short-termvegetation response. Such variations are also within theerror terms of the transfer function.
The apparently limited effect of the ‘8.2 k event’ in anarea close to one of the strongest signals (the GISP andGRIP/NGRIP records from the Greenland ice cap)appears surprising, but the chironomid data emphasisethat 8.2 k was embedded in a longer period of lowerJuly temperatures. This longer phase of reduced tempera-tures, albeit with some variability, is now well establishedfrom a range of records summarised in Rohling and Palike(2005). Furthermore if recent interpretations of the 8.2 ksignal are correct (Alley and Agustdottir, 2005; Denton etal., 2005) then the impact was predominantly on wintertemperatures. It would be possible therefore for recon-structed July temperatures not to reflect any significantchange, especially if the event was of relatively shortduration, and for the local vegetation cover to barelyregister any change, apart from an inability for trees toexpand further.
5.4. Post 8 kcal. yr BP
There are only a few levels representative of the periodafter 8 kcal. yr BP. At Hamundarstajahals up to the changeto peat after 7.4 kcal. yr BP birch levels remain high, and at
Vatnamyri despite the difficulties in interpretation due topeat expansion birch is still important at this time. CI-T areat their highest at both sites around 8 kcal. yr BP at 11 1C,reflecting a dominance of Dicrotendipes and Paratanytarsus
penicillatus type at Hamundarstajahals and increases inParatanytarsus at Vatnamyri. There is some slight indica-tion of temperature lowering by 7.6 kcal. yr BP with a dip inbirch but the evidence for this is slight. On the basis of allthe evidence from the two sites it is argued thattemperatures were at their highest in the early to middleHolocene by 8 kcal. yr BP with a relatively stable vegetationcover of birch woodland dominating the drier areas,representing both the HTM and the nearest to thermalmaximum equilibrium vegetation conditions that probablyoccurred during the Holocene.The results from Eyjafjorjur are supplemented at this
time by tree-line studies from 450m at Vesturardalur at thehead of Skıjadalur (Wastl et al., 2001). Although anisolated find of macrofossils of tree birch occurred before8 kcal. yr BP the real development of woodland at thisaltitude, as represented both by pollen and macrofossils,only occurred after 7.6 kcal. yr BP, and lasted until around6.8 kcal. yr BP, with a short dip around 7 kcal. yr BP, thedating of this being based both on radiocarbon and thepresence of the Hekla 5 tephra. Rather than assume thatthere are problems with the dating at one of the locations itis argued that woodland spread to higher altitudes afterstabilisation at the lower sites and that it is possible that thereal HTM occurred slightly after the chironomid recordterminates at Hamundarstajahals and Vatnamyri, i.e.between 7.6–6.8 kcal. yr BP.Support for this hypothesis also comes from using the
birch pollen/macrofossil data from Vesturardalur toreconstruct temperatures. Birch is strongly correlated withsummer temperatures at the tree line in Scandinavia(Odland, 1996; Mook and Vorren, 1996), whether Julytemperature alone or tri- or tetratherms. Even assumingthat Icelandic tree birch differed to some extent fromScandinavian species it is probable that its behaviour at thetree line was affected by similar thermal factors. In simplestterms, with a 10 1C July isotherm as the limiting factor anda lapse rate of 0.65 1C100m�1, the presence of trees at450m would mean a July temperature of 12.3 1C at thelowest of the sites, Hamundarstajahals, about a degreeabove the optimum reconstructed temperature. Althoughwithin the error of the CI-T reconstruction, the delay inmigration to the higher site is taken as representing aslightly higher HTM value for the area than the youngestchironomid-reconstructed figure, with a sea-level Julytemperature of 13 1C between 7.5–6.8 kcal. yr BP, 2.5 1Chigher than the 1961–90 mean for the area (Bjornsson,2003). The similarity between the birch-derived estimateand the inferred chironomid-reconstructed data addsweight to the overall interpretation providing the firstquantitative estimates of Early and Middle Holocenetemperature for Iceland, incorporating what is believed tobe the HTM.

ARTICLE IN PRESSC. Caseldine et al. / Quaternary Science Reviews 25 (2006) 2314–23312328
To the west of Trollaskagi at Vatnskotsvatn (Fig. 1)Betula pollen concentrations peaked around 8 kcal. yr BPbefore falling off towards low later Holocene levels after7 kcal. yr BP (Hallsdottir, 1995), causing Hallsdottir toremark that ‘‘during the time interval of 7200 (8000) to6000 (7000) yr BP [14C yr] the landscape of northernIceland was as close to being forested as it ever became’’(p. 22). Further to the west a similar pattern is seen atHafratjorn (Vasari and Vasari, 1990) although the spreadof tree birches was later, and on the NW Peninsula birchonly really peaked at 7 kcal. yr BP (Caseldine et al., 2003).This delay and the relatively low values for Betula pollen incomparison with the north, albeit from a much larger lakesystem, suggest either that birch had physical problemsmigrating into the northwest, or that temperatures werelower than in the Skagi-Trollaskagi area. This may haveprecluded successful tree birch colonisation, perhapsleading to enhanced hybridisation with dwarf birch, aphenomenon still observable at present in the area(Elkington, 1968). Differences of up to 3 1C in CI-T areapparent between Efstadalsvatn and Trollaskagi at thistime, the latter being warmer, although the 1961–1990observed temperatures overlap. It seems increasingly likelyfrom the palaeoecological evidence that there wereenhanced temperature gradients during the first half ofthe Holocene between the two areas and that theyinfluenced patterns of vegetation colonisation, with currentspatial temperature patterns only developing as Holoceneclimate deteriorated after around 6 kcal. yr BP. The limiteddensity of pollen sites does, however, also show differencesin birch pollen representation within regions, as seen forinstance in the pollen diagram for Hella Arskogsstrond, apeat site that lies just above sea level on the western edge ofEyjafjorjur (Hallsdottir and Caseldine, 2005), whereBetula pollen percentages were very low for much of theearly Holocene despite the clear presence of dense wood-land nearby at Hamundarstajahals.
6. Early Holocene climate change and links with offshore
and wider records
The climate of Iceland has been closely linked to thenature and relative strength of ocean currents derivingfrom the south west, the Irminger current that is a warmsaline branch of the North Atlantic Current, and from thenorth, the East Greenland Current originating in the ArcticOcean that brings much colder and fresher water from thenorth, particularly affecting north and north west Iceland(Jonsson and Valdimarsson, 2005). Over the historicalperiod, the contrast has been manifested by varyingamounts of sea-ice impacting on the Icelandic coast leadingto severe climate, especially in summer, and hardship forhuman settlement (Ogilvie, 1984, 1997). Considerableattention has been paid to the Weichselian and Holoceneevolution of marine conditions to the west and north ofIceland following several successful coring cruises,although Andrews and Giraudeau (2003) have pointed
out the paradox of a lack of agreement between differentproxies, in their case for productivity and sea surfacetemperature (SST). Climate on Iceland might be expectedto respond principally to SST and the interplay between thedominance of northern and southern (western) currents,especially in terms of responses at the timescales identifiedin the pollen and chironomid record rather than longermillennial periodicities.The initial warming seen in both records on Trollaskagi,
and echoed elsewhere in northern Iceland, was clearly aresponse to warmer SSTs around Iceland identified at ca11 kcal. yr BP in various records (Knudsen et al., 2004;Andersen et al., 2004), representing the appearance ofwarm Atlantic water in the Irminger current and probablypreventing the formation of annual sea ice. The slight dropin temperatures around 10.3 kcal. yr BP, which althoughwithin the error terms of the reconstruction is in both theTrollaskagi and Efstadalsvatn chironomid records, corre-lates well with IRD event 7 (VM 29-1910 (Bond et al.,1997)), with a drop in temperature seen in the marinerecord north of Iceland (Castaneda et al., 2004), withincreased basalt/plagioclase indicative of enhanced IRD offNW Iceland (Andresen et al., 2005) (Fig. 7), with coolingidentified in the Faroes and other locations by Bjorck et al.(2001) and Hannon et al. (2003), as well as in the GISP andGRIP ice cores where there are lower accumulation rates atthe same time (Fig. 7) (Grootes et al., 1993). Despite theproximity to the potential source of cold water flowingdown through the Denmark Strait and the widespreadsignature of this event, it should be noted that Icelandicterrestrial ecosystems barely registered any change; therewas for instance only a slight drop in %C values in thelakes, and July temperatures fell by less than a degree, i.e.conditions tended to stabilise rather than continue toimprove.Looking at marine records for the period between
10–7.5 kcal. yr BP, the general signal is one of a persistentadvection of warm Atlantic water modulated by fluctua-tions of up to 2–3 1C in SST (Andrews and Giraudeau,2003; Knudsen et al., 2004; Smith et al., 2005), the latterassumed to represent inflow of cold arctic water due toenhanced melt events, supplemented by IRD evidence(Andresen et al., 2005). The period of drier conditions withlower temperatures seen on land centred on 9.6 kcal. yr BPwas possibly triggered by ocean cooling dated to 9.8 kcal.yr BP (Andersen et al., 2004) with the persistence ofnortherly airstreams significantly reducing precipitationover Iceland. This period is particularly evident in veryhigh plagioclase/basalt ratios off NW Iceland centred on9.6–9.4 cal. yr BP (Fig. 7), interpreted as indicating highIRD rates bringing material from eastern Greenland due toincreased northwesterly/northerly wind frequency. Thesubsequent recovery of SST is matched by a recovery interrestrial temperatures and the short duration temperature‘spike’ seen in the chironomids has a parallel in the NorthAtlantic deepwater (NAD) coccolith record from Hunafloi(Andrews and Giraudeau, 2003), reconstructed August

ARTICLE IN PRESS
5
6
7
8
9
10
11
127500 8000 8500 9000 9500 10000 10500 11000
3.4
3.2
3.0
2.8
2.6
2.4
2.2
2.0
1.8
1.6
0.16
0.18
0.2
0.22
0.24
0.26
1
1.2
1.4
1.6
1.8
2
2.2
2.4
7500 8000 8500 9000 9500 10000 10500 11000
HH8Vat
Cal years BP
C-I
T (
˚C)
Mar
ine
core
B99
7-32
9 d1
80
GIS
P2
accu
m r
ate
Bas
alt/
Pla
gioc
lase
rat
io 3
pt m
ean
Cal years BP
Fig. 7. Comparison of CI-T records from HH8 and VAT2/3 with: d18O in
foraminifera from B997-329 (Castaneda et al., 2004) (Fig. 1); GISP2
accumulation rate (Grootes et al., 1993); basalt/plagioclase ratios in the
63–100mm fraction off NW Iceland (Andresen et al., 2005).
C. Caseldine et al. / Quaternary Science Reviews 25 (2006) 2314–2331 2329
SSTs from the North Iceland shelf (Andersen et al., 2004)and in the Greenland ice core temperature record (Alley,2000).
After 9 kcal. yr BP a continuation of warm, but notoptimal marine conditions on the N. Iceland shelf, is seenin all records; conditions were warmer than before with theconsistent presence of N. Atlantic water, but not at HTMlevels. Castaneda et al. (2004) point out that although the‘8.2 k event’ registers as slightly heavier d18O values on theN. Iceland shelf the change is relatively slight, becomingmore noticeable with distance offshore and in sites furtherto the east (Eirıksson et al., 2000a, b; Knudsen et al, 2004)and south (Andersen et al., 2004). Andersen et al. (2004)similarly noted little change in surface ocean temperaturesbut a clear signal in oxygen isotope values and radiolarian-based records indicative of changes in deeper ocean waterand the degree of stratification, with a decoupling ofsurface and sub-surface temperatures. As it is likely that
terrestrial climate is closely linked to surface oceanconditions then it is perhaps not surprising that the lackof an oceanic surface response leads to little terrestrialvariation. The relationship of these marine records to theterrestrial evidence reinforces the view that in general theHTM (at least as reflected in July temperature) had notbeen reached in Northern and NW Iceland during thisperiod and that temperatures were still not stable with thebrief effect of the ‘8.2 k event’ barely impacting onecosystem development as conditions were still only justsuitable for a slow successional change allowing woodland,or at best shrubby woodland, to develop.Castaneda et al. (2004) argue that the marine HTM on
the N. Iceland shelf occurred between 7.8–6.2 kcal. yr BP,dates that agree well with the terrestrial evidence presentedhere for the onshore record, although Andersen et al.(2004) argue that the Irminger Current as measured on theReykjanes Ridge south of Iceland was strongest only after7 kcal. yr BP. Thus the HTM appears to have developedvirtually immediately after any ‘8.2 k’ impact and generallypersisted for between 1–1.5 ka, albeit with possible furtherminor coolings over this period. This was therefore a timewhen temperatures were not only warmer than the presentboth offshore and on land, by between 2–3 1C, but alsorelatively stable and by the end of this period woodlanddeveloped to its maximum extent across northern Icelandmarking optimal sustained Holocene vegetation develop-ment. These results therefore provide a much clearerdefinition of the timing and nature of the HTM in Icelandthan previously published (Kaufman et al., 2004).
7. Conclusions
In comparing the terrestrial and offshore reconstructedtemperature conditions for the Early to Middle Holocene,it is possible to determine close links between SSTs andJuly air temperatures reflecting the changing directinfluences of warm Atlantic and cold Arctic currents onterrestrial climate in Iceland. The relative importance ofthese currents was to some extent modified by orbitally-enhanced seasonality, but it is difficult to infer annual andwinter temperatures for the land because the availablebiological proxies are mainly influenced by summerconditions. Nevertheless, all records clearly demonstratesome temperature variability in the Early Holocene, withina generally rising trend, which eventually leads to HTM ofconditions warmer than today after 8–7.8 kcal. yr BP thatlasted for about 1–1.5 ka, at least 2 ka later than HTMconditions at higher Arctic latitudes (Kaufman et al.,2004).
Acknowledgements
We thank Hans Stotter and Maria Wastl from theUniversity of Innsbruck for coring the site with studentsfrom the University of Munich and for all their assistanceand helpful discussions; the NERC RCLSC for awarding

ARTICLE IN PRESSC. Caseldine et al. / Quaternary Science Reviews 25 (2006) 2314–23312330
the 14C determinations and Charlotte Bryant and the RCLin East Kilbride for their help and support; AslaugGeirsdottir from the University of Iceland, Giff Millerfrom INSTAAR and RANNIS for field support indeveloping the chironomid-based transfer function; ArtAmes for the laboratory work in Exeter; Jackie Hatton forsome of the pollen analyses and Sue Rouillard forpreparing the diagrams. Matts Rundgren and Les Cwynarprovided valuable comments on an earlier version of themanuscript. Naomi Holmes was supported by NERC(Award No. NER/S/A/2002/10368A).
References
Aalbersberg, G., Litt, T., 1998. Multiproxy climate reconstructions for the
Eemian and Early Weichselian. Journal of Quaternary Science 13,
376–390.
Alley, R.B., 2000. The Younger Dryas cold interval as viewed from
Central Greenland. Quaternary Science Reviews 19, 213–226.
Alley, R.B., Agustdottir, A.M., 2005. The 8 k event: cause and
consequences of a major Holocene abrupt climate change. Quaternary
Science Reviews 24, 1123–1149.
Alley, R.B., Mayewski, P.A., Sowers, T., Stuiver, M., Taylor, K.C., Clark,
P.U., 1997. Holocene climate instability: a prominent widespread event
8200 yr ago. Geology 25, 483–486.
Andersen, C., Koc- , N., Moros, M., 2004. A highly unstable Holocene
climate in the subpolar North Atlantic: evidence from diatoms.
Quaternary Science Reviews 23, 2155–2166.
Andresen, C.S., Bond, G., Kuijpers, A., Knutz, P.C., Bjorck, S., 2005.
Holocene climate variability at multidecadal time scales detected by
sedimentological indicators in a shelf core NW off Iceland. Marine
Geology 214, 323–338.
Andrews, J.T., Giraudeau, J., 2003. Multi-proxy records showing
significant Holocene environmental variability on the inner North
Iceland Shelf (Hunafloı). Quaternary Science Reviews 22, 175–193.
Andrews, J.T., Caseldine, C., Weiner, N.J., Hatton, J., 2001a. Late
Quaternary (�4 ka) marine and terrestrial environmental change in
Reykjarfjorjur, N. Iceland: climate and/or settlement? Journal of
Quaternary Science 16, 133–144.
Andrews, J.T., Helgadottir, G., Geirsdottir, A., Jennings, A.E., 2001b.
Multicentury-scale records of carbonate (hydrographic?) variability on
the N. Iceland margin over the last 5000 yrs. Quaternary Research 56,
199–206.
Andrews, J.T., Harjardottir, J., Stoner, J.S., Mann, M.E., Kristjansdottir,
G.B., Koc- , N., 2003. Decadal to millennial-scale periodicities in North
Iceland Shelf sediments over the last 12,000 cal. yrs: long-term North
Atlantic oceanographic variability and solar forcing. Earth and
Planetary Science Letters 210, 453–465.
Bauch, H.A., Erlenkauser, H., Spielhagen, R.F., Struck, U., Matthiessen,
J., Thiede, J., Heinemeier, J., 2001. A multiproxy reconstruction of the
evolution of deep and surface waters in the subarctic Nordic seas over
the last 30,000 yr. Quaternary Science Reviews 20, 659–678.
Bianchi, G.G., McCave, I.N., 1999. Holocene periodicity in North
Atlantic climate and deep-ocean flow south of Iceland. Nature 397,
515–517.
Bjorck, S., Muscheler, R., Kromer, B., Andresen, C.S., Heinemeier, J.,
Johnsen, S.J., Conley, D., Koc- , N., Spurk, M., Veski, S., 2001. High-
resolution analyses of an early Holocene climate event may imply
decreased solar forcing of an important climate trigger. Geology 29,
1107–1110.
Bjornsson, H. 2003. The annual cycle of temperature in Iceland: The
1961–1990 average. Technical Report, Icelandic Meteorology Office.
Bond, G., Showers, W., Cheseby, M., Lotti, R., Almasi, P., deMenocal,
P., Priore, P., Cullen, H., Hajdas, I., Bonani, G., 1997. A pervasive
millennial-scale cycle in North Atlantic Holocene and glacial climates.
Science 278, 1257–1266.
Bond, G., Kromer, B., Beer, J., Muscheler, R., Evans, M.N., Showers, W.,
Hoffman, S., Lotti-Bond, R., Hajdas, I., Bonani, G., 2001. Persistent
solar influence on North Atlantic climate during the Holocene. Science
294, 2130–2136.
Caseldine, C., 2001. Changes in Betula in the Holocene record from
Iceland—a paleoclimate record or evidence for early Holocene
hybridization? Review of Palaeobotany and Palynology 117, 139–152.
Caseldine, C., Geirsdottir, A., Langdon, P., 2003. Efstadalsvatn—a multi-
proxy study of a Holocene lacustrine sequence from NW Iceland.
Journal of Paleolimnology 30, 55–73.
Castaneda, I.S., Smith, L.M., Kristjansdottir, G.B., Andrews, J.T., 2004.
Temporal changes in Holocene d18O records from the northwest and
central North Iceland Shelf. Journal of Quaternary Science 19,
321–334.
Denton, G.H., Alley, R.B., Comer, G.C., Broecker, W.S., 2005. The role
of seasonality in abrupt climate change. Quaternary Science Reviews
24, 1159–1182.
Eirıksson, J., Knudsen, K.-L., Haflidason, H., Henriksen, P., 2000a. Late-
glacial and Holocene palaeoceanography of the North Icelandic shelf.
Journal of Quaternary Science 15, 23–42.
Eirıksson, J., Knudsen, K.-L., Haflidason, H., Heinemeier, J., 2000b.
Chronology of late Holocene climatic events in the northern North
Atlantic based on AMS 14C dates and tephra markers from the
volcano Hekla, Iceland. Journal of Quaternary Science 15, 573–580.
Elkington, T.T., 1968. Introgressive hybridisation between Betula nana L.
and B. pubescens Ehrh. in North-West Iceland. New Phytologist 67,
109–118.
Eynaud, F., Turon, J.L., Duprat, J., 2004. Comparison of the Holocene
and Eemian paleoenvironments in the South Icelandic Basin: dino-
flagellate cysts as proxies for the North Atlantic surface circulation.
Review of Palaeobotany and Palynology 128, 55–79.
Giraudeau, J., Jennings, A.E., Andrews, J.T., 2004. Timing and
mechanisms of surface and intermediate water circulation changes in
the Nordic Seas over the last 10,000 cal years: a view from the North
Iceland Shelf. Quaternary Science Reviews 23, 2127–2139.
Grootes, P.M., Stuiver, M., White, J.W.C., Johnsen, S.L., Jouzel, J., 1993.
Comparison of oxygen isotope records from the GISP2 and GRIP
Greenland ice cores. Nature 366, 552–554.
Gronvold, K., Oskarsson, K., Johnsen, S.J., Clausen, H.B., Hammer,
C.U., Bond, G., Bard, E., 1995. Tephra layers from Iceland in the
Greenland GRIP ice core correlated with oceanic and land sediments.
Earth and Planetary Science Letters 135, 149–155.
Hallsdottir, M., 1987. Pollen analytical studies of human influence on
vegetation in relation to the Landnam tephra layer in southwest
Iceland. LUNDQUA Thesis 18, Lund University, Department of
Quaternary Geology, 46pp.
Hallsdottir, M., 1991. Studies in the vegetational history of north Iceland,
a radiocarbon-dated pollen diagram from Flateyjardalur. Jokull 40,
67–81.
Hallsdottir, M., 1995. On the pre-settlement history of Icelandic
vegetation. Icelandic Agricultural Sciences 9, 17–29.
Hallsdottir, M., Caseldine, C., 2005. The Holocene vegetation history of
Iceland, state-of-the-art and future research. In: Caseldine, C., Russell,
A., Harjardottir, J., Knudsen, O. (Eds.), Iceland: Modern Processes
and Past Environments. Elsevier, Amsterdam, pp. 319–334.
Hannon, G.E., Gaillard, M.-J., 1997. The plant-macrofossil record of past
lake-level changes. Journal of Paleolimnology 18, 15–28.
Hannon, G.E., Bradshaw, R.H.W., Wastegard, S., 2003. Rapid vegetation
change during the early Holocene in the Faroe Islands detected in
terrestrial and aquatic ecosystems. Journal of Quaternary Science 18,
615–619.
Heiri, O., Lotter, A.F., 2001. Effects of low count sums on quantitative
environmental reconstructions: an example using subfossil chirono-
mids. Journal of Paleolimnology 26, 343–350.
ARTICLE IN PRESSC. Caseldine et al. / Quaternary Science Reviews 25 (2006) 2314–2331 2331
Hicks, S., 2001. The use of annual arboreal pollen deposition values for
delimiting tree-lines in the landscape and exploring models of pollen
dispersal. Review of Palaeobotany and Palynology 117, 1–29.
Hrafnsdottir, T., 2005. Chironomidæ of Iceland. The Zoology of Iceland.
Zoological Museum, University of Copenhagen, 169pp.
Hrafnsdottir, T., Olafsson, J.S., Olafsson, E., 2000. Occurrence and
distribution of Chironomidae in Iceland. In: Hoffrichter, O. (Ed.),
Late 20th Century Research on Chironomidae: an Anthology from the
13th International Symposium on Chironomidae. Shaker Verlag,
Aachen, pp. 517–523.
Jiang, H., Siedenkrantz, M.-S., Knudsen, K.L., Eirıksson, J., 2001.
Diatom surface sediment assemblages and their relationships to
oceanic environmental variables. Marine Micropaleontology 41,
73–96.
Jiang, H., Siedenkrantz, M.-S., Knudsen, K.L., Eirıksson, J., 2002. Late-
Holocene summer sea-surface temperatures based on a diatom record
from the north Icelandic shelf. The Holocene 12, 137–147.
Jonsson, S., Valdimarsson, H., 2005. Recent developments in oceano-
graphic research in Icelandic waters. In: Caseldine, C., Russell, A.,
Harjardottir, J., Knudsen, O. (Eds.), Iceland: Modern Processes and
Past Environments. Elsevier, Amsterdam, pp. 79–92.
Kaufman, D.S., Ager, T.A., Anderson, J.T., Nartlein, P.J., Brubaker,
L.B., Coats, L.L., Cwynar, L.C., Duvall, M.L., Dyke, A.S., Edwards,
M.E., Eisner, W.R., Gajewski, K., Geirsdottir, A., Hu, F.S., Jennings,
A.E., Kaplan, M.R., Kerwin, M.W., Lozhkin, A.V., MacDonald,
G.M., Miller, G.H., Mock, C.J., Oswald, W.W., Otto-Bleisner, B.L.,
Porinchu, D.F., Ruhland, K., Smol, J., Steig, E.J., Wolfe, B.B., 2004.
Holocene thermal maximum in the western Arctic (0–180W).
Quaternary Science Reviews 23, 529–560.
Knudsen, K.L., Eirıksson, J., 2002. Application of tephrochronology to
the timing and correlation of palaeoceanographic events recorded in
Holocene and Late Glacial shelf sediments off North Iceland. Marine
Geology 191, 165–188.
Knudsen, K.L., Jiang, H., Jansen, E., Eirıksson, J., Heinemeier, J.,
Seidenkrantz, M.-S., 2004. Environmental changes off North Iceland
during the deglaciation and Holocene: foraminifera, diatoms and
stable isotopes. Marine Micropaleontology 50, 273–305.
Langdon, P.G., Barber, K.E., Hughes, P.D.M., 2003. A 7500-year peat-
based palaeoclimatic reconstruction and evidence for an 1100-year
cyclicity in bog surface wetness from Temple Hill Moss, Pentland Hills
southeast Scotland. Quaternary Science Reviews 22, 259–274.
Mackintosh, A.N., Dugmore, A.J., Hubbard, A.L., 2002. Holocene
climatic changes in Iceland: evidence from modelling glacier length
fluctuations at Solheimajokull. Quaternary International 91, 39–52.
McDermott, F., Mattey, D.O., Hawkesworth, C., 2001. Centennial-scale
Holocene climate variability revealed by a high-resolution speleothem
d18O record from SW Ireland. Science 294, 1328–1331.
Mook, R., Vorren, K.D., 1996. The temperature climate at the altitudinal
vegetation limits in Skibotn, northern Norway. Palaoklimaforschung
20, 61–74.
Moore, P.D., Webb, J.A., Collinson, M.E., 1999. Pollen Analysis.
Blackwell, Oxford, 216pp.
Norjdahl, H., Petursson, H., 2005. Relative sea-level change in Iceland:
new aspects of the Weichselian deglaciation of Iceland. In: Caseldine,
C., Russell, A., Harjardottir, J., Knudsen, O. (Eds.), Iceland: Modern
Processes and Past Environments. Elsevier, Amsterdam, pp. 25–78.
O’Brien, S.R., Mayewski, P.A., Meeker, L.D., Meese, D.A., Twickler,
M.S., Whitlow, S.I., 1995. Complexity of Holocene climate as
reconstructed from a Greenland ice core. Science 270, 1962–1964.
Odland, A., 1996. Differences in the vertical distribution patterns of Betula
pubescens in Norway and its ecological significance. Palaoklima-
forschung 20, 43–59.
Ogilvie, A.E., 1984. The past climate and sea-ice record from Iceland. Part
1: Data to A.D.1780. Climatic Change 6, 131–152.
Ogilvie, A.E., 1997. Fisheries, climate and sea ice in Iceland: an historical
perspective. In: Vickers, D. (Ed.), Marine Resources and Human
Societies in the North Atlantic Since 1500. Institute of Social and
Economic Research, Memorial University, St. Johns, pp. 69–87.
Quinlan, R., Smol, J.P., 2001. Setting minimum head capsule abundance
and taxa deletion criteria in chironomid-based inference models.
Journal of Paleolimnology 26, 327–342.
Rohling, E.J., Palike, H., 2005. Centennial-scale climate cooling with a
sudden cold event around 8,200 years ago. Nature 434, 975–979.
Ruddiman, W.F., 2003. The anthropogenic greenhouse era began
thousands of years ago. Climatic Change 61, 261–293.
Rundgren, M., 1995. Biostratigraphic evidence of the Allerod—Younger
Dryas—Preboreal oscillation in northern Iceland. Quaternary
Research 44, 405–416.
Rundgren, M., 1998. Early-Holocene vegetation of northern Iceland:
pollen and plant macrofossil evidence from the Skagi peninsula. The
Holocene 8, 553–564.
Rundgren, M., 1999. A summary of the environmental history of the
Skagi peninsula northern Iceland, 11,300–7800BP. Jokull 4, 1–19.
Rundgren, M., Ingolfsson, O., 1999. Plant survival in Iceland during
periods of glaciation? Journal of Biogeography 26, 387–396.
Smith, L.M., Andrews, J.T., Castaneda, I.S., Kristjansdottir, G.B.,
Jennings, A.E., Sveinbjornsdottir, A.E., 2005. Temperature recon-
structions for SW and N Iceland waters over the last 10 cal ka based on
d18O records from planktic and benthic foraminifera. Quaternary
Science Reviews 24, 1723–1740.
Schierup, H.-H., Mjelde, M., Bagger, J., 2002. Aquatic macrophytes in six
Faroese lakes. Annales Societas Færoensis Supplement 36, 47–58.
Stotter, J., Wastl, M., Caseldine, C., Haberle, T., 1999. Holocene
palaeoclimate reconstruction in northern Iceland: approaches and
results. Quaternary Science Reviews 18, 457–474.
ter Braak, C.J.F., Smilauer, P., 1998. CANOCO Reference Manual and
User’s Guide to Canoco for Windows: Software for Canonical
Community Ordination (version 4.5.2). Microcomputer Power, Ithaca,
NY, USA, 352pp.
Turney, C., Baillie, M., Clemens, S., Brown, D., Palmer, J., Pilcher, J.,
Reimer, P., Leuschner, H.H., 2005. Testing solar forcing of pervasive
Holocene climate cycles. Journal of Quaternary Science 20, 511–518.
Vasari, Y., Vasari, A., 1990. L’histoire holocene des lacs Islandais. In:
Devers, S. (Ed.), Pour Jean Malaurie. 102 temoignages en homage a
quarante ans d’etudes arctiques. Editions Plon, Paris, pp. 277–293.
Wastl, M., 2000. Reconstruction of Holocene palaeoclimatic conditions in
Northern Iceland based on investigations of glacier and vegetation
history. Unpublished Ph.D. Thesis, University of Innsbruck.
Wastl, M., Stotter, J., Caseldine, C., 2001. Reconstruction of Holocene
variations of the upper limit of tree or shrub birch growth in northern
Iceland based on evidence from Vesturardalur—Skıjadalur, Trollas-
kagi. Arctic, Antarctic and Alpine Research 33, 191–203.
Copyright © 2022 FDOKUMEN