Dynamics of modified glass networks
11
J. Phys.: Condens. Matter 12 (2000) 6979–6989. Printed in the UK PII: S0953-8984(00)13484-8 Dynamics of modified glass networks H Uhlig†, S Bennington†‡ and J-B Suck† † TU Chemnitz, Institute of Physics, Materials Research and Liquids, D-09107 Chemnitz, Germany ‡ ISIS Facility, Rutherford Appleton Laboratory, Chilton, Didcot, Oxfordshire OX11 0QX, UK Received 25 April 2000 Abstract. A comparative study of the atomic dynamics of a-Li 2 Si 2 O 5 and pure SiO 2 glass was performed using neutron inelastic scattering and applying the isotope substitution technique to suppress the coherent scattering from the network modifying Li atoms. The generalized vibrational density of states G(ω) determined in the full energy range up to 150 meV differs clearly in the high energy range and also at low energies. A strong broadening and a shift to lower energies of the sharp lines in the spectrum of SiO 2 is observed in the spectrum of the modified network glass. A detailed analysis of the measured dynamic structure factor S(Q, ω) is used to determine the change of the SiO 2 network force constants by the network modifier, which again is used to support a specific model of the modification in the Si–O network. 1. Introduction The influence of alkali ions on the structure of the network of silica glasses has been well studied to date by x-ray and neutron diffraction. Various series of glasses [1–3] containing different alkali ions were studied. Using the isotopic substitution technique, diffraction experiments were successfully performed for glasses containing Ca or Li ions [4–6]. In spite of the fact that structural modifications are readily detectable in the total static structure factors, only a few efforts were made to detect the influence of the network modification by alkali ions on the dynamics of the network. Exceptions are the investigations of the effect of potassium ions [7] and 7 Li ions [8]. Here we report on an extension of the latter investigations to a much larger range of energy transfer ¯ hω and momentum transfer ¯ hQ. The specific advantage of this experiment is the use of the isotopic substitution technique in the determination of the dynamic structure factor, i.e. the measurement of the dynamics of the modified network without coherent scattering from the network modifier. For this advantage one pays, however, with a reduction of the statistical accuracy of the data due to the high absorption cross sections of 6 Li for thermal neutrons using zero scattering lithium (a mixture of 6 Li and 7 Li ions) as the network modifier. Thus only the atomic dynamics of the modified SiO 2 network is investigated in the coherent part of the scattered intensity. Pure SiO 2 has successfully been investigated in a large region of Q–ω-space before [9, 10]. The structural units of silica glasses are SiO 4 tetrahedra connected to each other by shared oxygen corners. This is suggested by a value of nearly 2 which is found for the number of nearest Si–O neighbours, Z SiO . This value indicates almost full connectivity. The average bond angle is about 144 ◦ with a distribution of 25 ◦ (FWHM). This value is not affected by the introduction of network modifiers [5]. 0953-8984/00/306979+11$30.00 © 2000 IOP Publishing Ltd 6979
-
Upload
tu-chemnitz -
Category
Documents
-
view
10 -
download
0
Transcript of Dynamics of modified glass networks

J. Phys.: Condens. Matter 12 (2000) 6979–6989. Printed in the UK PII: S0953-8984(00)13484-8
Dynamics of modified glass networks
H Uhlig†, S Bennington†‡ and J-B Suck†† TU Chemnitz, Institute of Physics, Materials Research and Liquids, D-09107 Chemnitz,Germany‡ ISIS Facility, Rutherford Appleton Laboratory, Chilton, Didcot, Oxfordshire OX11 0QX, UK
Received 25 April 2000
Abstract. A comparative study of the atomic dynamics of a-Li2Si2O5 and pure SiO2 glass wasperformed using neutron inelastic scattering and applying the isotope substitution technique tosuppress the coherent scattering from the network modifying Li atoms. The generalized vibrationaldensity of states G(ω) determined in the full energy range up to 150 meV differs clearly in the highenergy range and also at low energies. A strong broadening and a shift to lower energies of thesharp lines in the spectrum of SiO2 is observed in the spectrum of the modified network glass. Adetailed analysis of the measured dynamic structure factor S(Q,ω) is used to determine the changeof the SiO2 network force constants by the network modifier, which again is used to support aspecific model of the modification in the Si–O network.
1. Introduction
The influence of alkali ions on the structure of the network of silica glasses has been well studiedto date by x-ray and neutron diffraction. Various series of glasses [1–3] containing differentalkali ions were studied. Using the isotopic substitution technique, diffraction experimentswere successfully performed for glasses containing Ca or Li ions [4–6]. In spite of the factthat structural modifications are readily detectable in the total static structure factors, only afew efforts were made to detect the influence of the network modification by alkali ions onthe dynamics of the network. Exceptions are the investigations of the effect of potassium ions[7] and 7Li ions [8]. Here we report on an extension of the latter investigations to a muchlarger range of energy transfer h̄ω and momentum transfer h̄Q. The specific advantage of thisexperiment is the use of the isotopic substitution technique in the determination of the dynamicstructure factor, i.e. the measurement of the dynamics of the modified network without coherentscattering from the network modifier. For this advantage one pays, however, with a reductionof the statistical accuracy of the data due to the high absorption cross sections of 6Li for thermalneutrons using zero scattering lithium (a mixture of 6Li and 7Li ions) as the network modifier.Thus only the atomic dynamics of the modified SiO2 network is investigated in the coherentpart of the scattered intensity. Pure SiO2 has successfully been investigated in a large region ofQ–ω-space before [9, 10]. The structural units of silica glasses are SiO4 tetrahedra connectedto each other by shared oxygen corners. This is suggested by a value of nearly 2 which is foundfor the number of nearest Si–O neighbours, ZSiO . This value indicates almost full connectivity.The average bond angle is about 144◦ with a distribution of 25◦ (FWHM). This value is notaffected by the introduction of network modifiers [5].
0953-8984/00/306979+11$30.00 © 2000 IOP Publishing Ltd 6979

6980 H Uhlig et al
2. Theoretical background
In neutron inelastic scattering experiments, the intensity I (k0,k) of the scattered neutronsis measured as a function of the wave vector of the neutron before (k0) and after scattering(k). From these, the momentum transfer h̄k and the energy transfer h̄ω are calculated herefor isotropic (amorphous) samples. From the scattered intensity, the double differential crosssection d2σ/d� dE is extracted after the correction and normalization procedures have beencarried out. From this the dynamical structure factor S(Q,ω) can be calculated:
S(Q,ω) = 4πk0
σ sck
d2σ
d� dE. (1)
For a sample made up of several elements the total scattering cross section σ sc is theconcentration weighted sum of the coherent and incoherent scattering cross section.
The experimentally accessible total S(Q,ω) is the weighted sum of the partial dynamicstructure factors Sij (Q,ω) and the self-term of the dynamic structure factors:
S(Q,ω) = 4π
σ sccoh
n∑i,j
bibj cicjSij (Q,ω) +1
σ scinc
n∑i
σ inci ciS
self
i (Q,ω) (2)
with
σ sccoh = 4π
∑ij
bibj cicj
σ scinc =
∑i
ciσinci
ci = atomic concentration of element i
bi = bound coherent scattering length for neutron scattering of element i.
3. Experiment
3.1. Sample preparation
The sample of the composition Li2Si2O5 was obtained using the powder route includingdensification before melting and homogenization. Details of the sample preparation havebeen given elsewhere [5]. In order to prevent crystallization, the melt was poured into a coldplatinum die giving an amount of 10 g of usable material. It was analysed for composition andhomogeneity by inductively coupled Ar-plasma optical emission spectrometry (ICP-OES) andx-ray fluorescence spectrometry. Commercially produced pure silica glass (Suprasil, SchottGlaswerke AG, Mainz, Germany) was used for the comparative measurements.
3.2. Scattering experiments
The scattering experiments were performed at the thermal neutron time-of-flight (TOF)spectrometer MARI at the ISIS spallation neutron source using an incident neutron energyof 220 meV. The energy resolution is about 2% of the incident energy, i.e. 4 meV. The samplewas kept in a cryostat under vacuum at a temperature of 20 K to minimize the contributionof multiphonon scattering in the neutron energy loss spectra. The Li2Si2O5 sample, the SiO2
sample and the empty Al can were measured for 24 hours each. This set of measurements wascompleted with three vanadium runs for the calibration of the detectors.
The results were corrected for scattering angle and energy dependent background andabsorption and the energy dependence of the detector efficiency. The resulting intensity was

Dynamics of modified glass networks 6981
normalized with the help of the vanadium calibration runs. It was not necessary to performmultiple scattering corrections because of the low scattering probability (<2%) due to the highabsorption cross section of 0Li in the Li2Si2O5 sample (see section 4.2).
Figure 1. GVDOS of a-SiO2 (circles) and a-Li2Si2O5 (squares).
4. Experimental results
4.1. Generalized vibrational density of states
The normal mode analysis is made via the generalized vibrational density of states (GVDOS).This is obtained by the weighted sum of the TOF spectra and an iterative subtraction ofmultiphonon contributions until self-consistency was obtained. In figure 1 the GVDOSs ofthe glasses SiO2 and 0Li2Si2O5 are presented. The curve of pure silica glass (circles) agreeswell with the results of Arai et al [10] and of a previous study [9]. In this presentation fourpronounced energy bands at 50, 98, 133 and 145 meV are visible for a-SiO2. The GVDOSs ofa-0Li2Si2O5 (squares) and a-SiO2 (circles) are essentially the same between 30 and 50 meV.It cannot finally be decided whether the small differences are produced by some weaknessof the absorption corrections of the a-0Li2Si2O5 or are a result of the network modification.More pronounced deviations are detected above 40 meV and especially in the range of 90–110 meV where the expected mode at about 100 meV (a-SiO2) is shifted towards lower energies(92 meV) for a-0Li2Si2O5. For this sample we can state that the incoherent contribution for 0Liis 0.25 barn compared to the coherent contribution from the Si–O network of 2.83 barn. Wecan see a small hump in the GVDOS left from the maximum ωR at 50 meV, at 43.3 meV (ω0),and on the right side at 55.8 meV (ω1). A small peak is detected at 68.5 meV. Additional smallhumps are found at 61 meV and 75 meV. These modes have been related to breathing modesof planar four-membered and three-membered rings [11]. The peak (ω3) at about 100 meV(a-SiO2) is shifted towards 90 meV for a-Li2Si2O5. Obvious differences are observed in therange above 110 meV. Beginning with 110 meV, a broad peak with an inherent double peak

6982 H Uhlig et al
structure in the GVDOS of a-Li2Si2O5 occurs with a maximum at 135 meV and ending at150 meV. The GVDOS of a-SiO2 exhibits two sharp maxima at 133 meV and at 145 meV.For further interpretation one has to keep in mind that the incoherent contribution from the Liatoms is smaller than 10% of the total scattered intensity and therefore cannot be responsiblefor the deviations observed. The differences found in these curves are due to the effect ofthe network modifier on the network neglecting the incoherent scattered contribution of thenetwork modifier lithium. A detailed analysis of the intensities along ω = constant lines ofthe S(Q,ω = constant) will be necessary for a more extended interpretation. The indexing ofthe peaks is explained in section 5 in detail.
4.2. Total dynamic structure factors
In figure 2(a) the S(Q,ω) of a-SiO2 is presented. The statistics is remarkably good andallows a reliable interpolation to S(Q = constant, ω). The results are in good agreementwith the S(Q,ω) published by Price and Carpenter [9]. Also the total dynamic structurefactor S(Q,ω) of a-Li2Si2O5 exhibits oscillations along cuts at ω = constant. However, thestatistical accuracy is not of the same quality as in the case of a-SiO2 due to the large absorptioncross section of the sample. The quality of the data could not be improved by the additionof further runs but only by integrating 10 meV along the sections. The absence of intensityat about 100 meV in the case of a-Li2Si2O5 is obvious from a comparison of the two curvesin figure 3. S(Q,ω) of a-SiO2 contains a small amount of multiple scattering which is notthe case for S(Q,ω) of a-Li2Si2O5 where lithium, acting as a strong absorber, drasticallyreduces the probability of multiple scattering. In order to estimate the amount of multiplyscattered intensity, we assume the multiply scattered intensity to be mainly caused by doublescattering processes. The ratio δ of double scattered intensity to single scattered intensity (inthe quasi-isotropic approximation) for cylindrical samples is given by [12]
δ = �s
(−d
2ln
(d√
(2r)2 + d2
)+
8r
3π
(π
2− tan−1
(2r
d
)))(3)
with
�s = nσsdensity of atoms × total scattering cross section
d = height of the sample
r = radius of the sample.
The insertion of the values r = 2.15 cm and d = 6 cm into equation (3) leads to the ratio ofδ = 0.085. The contribution of triple and higher order multiple scattering is usually reducedby a factor of six, so all multiple scattered intensity is slightly below 10% of all scatteredintensity for a-SiO2. Thus we have to attribute about 8% of the measured intensity to multiplyscattered neutrons in the SiO2 spectra.
4.3. Sections at constant energies
4.3.1. E = 1.5 meV. In figure 3 sections through S(Q,ω) at E = 1.5 meV are presented.The curves are the result of the addition of three adjacent spectra except at S(Q, 0), wherethe spectra were contaminated by some remaining Bragg peaks of the aluminum cylinders.Thus these curves essentially represent the structure of S(Q). Reasonable values are foundfor Q > 1.5 Å−1, therefore a detailed investigation of the region of the first sharp diffractionpeak is not possible here. The maxima located at about Q = 2.5 Å−1 and Q = 5.0 Å−1 arewell pronounced in both curves. The structure of these curves agrees well with that of the

Dynamics of modified glass networks 6983
(a)
(b)
Figure 2. (a) 3D representation of the total dynamic structure factor S(Q,ω) of a-SiO2 measured at20 K. (b) 3D representation of the total dynamic structure factor S(Q,ω) of a-Li2Si2O5 measuredat 20 K.

6984 H Uhlig et al
Figure 3. Total dynamic structure factors S(Q, h̄ω = 1.5 meV) of amorphous SiO2 (upper curve)and a-Li2Si2O5 (lower curve).
Figure 4. Total dynamic structure factors S(Q, h̄ω = 45 meV) of amorphous SiO2 (upper curve)and a-Li2Si2O5 (lower curve).
static structure factors S(Q) [5]. The two weak maxima in the region between 8 and 10 Å−1
expected from the diffraction experiment could not be well resolved in this inelastic neutronscattering experiment which has a coarse Q-resolution for intensity reasons compared with
Dynamics of modified glass networks 6985
normal diffraction experiments. The maxima at about 12.5 Å−1 and the small humps at 15 Å−1
agree with the maxima in S(Q) from diffraction experiments [5].
4.3.2. E = 45 meV. From the GVDOS shown in figure 1, the region between h̄ω = 40 and50 meV is expected to carry similar vibrational modes in both glasses. In figure 4 we presentthe intensity obtained by integrating S(Q,ω) from 40 to 50 meV indicated with the meanvalue of 45 meV. The similarities are obvious for the presented Q-range with the restrictionthat the oscillations in the curve of a-Li2Si2O5 are less pronounced compared to those of a-SiO2
especially at Q-values below 7.5 Å−1.
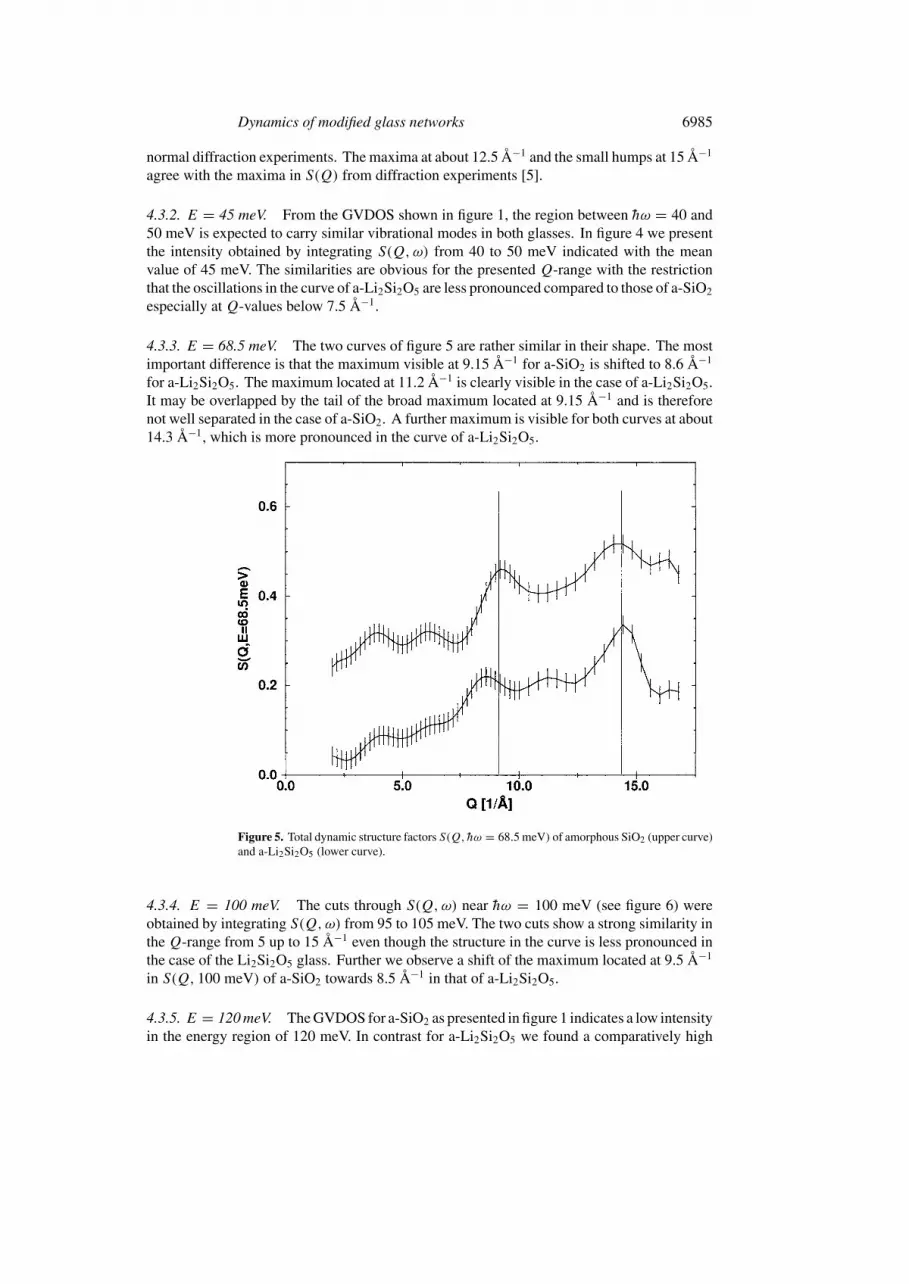
4.3.3. E = 68.5 meV. The two curves of figure 5 are rather similar in their shape. The mostimportant difference is that the maximum visible at 9.15 Å−1 for a-SiO2 is shifted to 8.6 Å−1
for a-Li2Si2O5. The maximum located at 11.2 Å−1 is clearly visible in the case of a-Li2Si2O5.It may be overlapped by the tail of the broad maximum located at 9.15 Å−1 and is thereforenot well separated in the case of a-SiO2. A further maximum is visible for both curves at about14.3 Å−1, which is more pronounced in the curve of a-Li2Si2O5.
Figure 5. Total dynamic structure factors S(Q, h̄ω = 68.5 meV) of amorphous SiO2 (upper curve)and a-Li2Si2O5 (lower curve).
4.3.4. E = 100 meV. The cuts through S(Q,ω) near h̄ω = 100 meV (see figure 6) wereobtained by integrating S(Q,ω) from 95 to 105 meV. The two cuts show a strong similarity inthe Q-range from 5 up to 15 Å−1 even though the structure in the curve is less pronounced inthe case of the Li2Si2O5 glass. Further we observe a shift of the maximum located at 9.5 Å−1
in S(Q, 100 meV) of a-SiO2 towards 8.5 Å−1 in that of a-Li2Si2O5.
4.3.5. E = 120 meV. The GVDOS for a-SiO2 as presented in figure 1 indicates a low intensityin the energy region of 120 meV. In contrast for a-Li2Si2O5 we found a comparatively high

6986 H Uhlig et al
Figure 6. Total dynamic structure factors S(Q, h̄ω = 100 meV) of amorphous SiO2 (upper curve)and a-Li2Si2O5 (lower curve).
Figure 7. Total dynamic structure factors S(Q, h̄ω = 120 meV) of amorphous SiO2 anda-Li2Si2O5.
intensity together with pronounced maxima in S(Q, h̄ω = 120 meV) (see figure 7). Thisobservation justifies the assumption of a mode at 120 meV, which could be the antisymmetricstretching mode which is expected in this energy region.

Dynamics of modified glass networks 6987
Figure 8. Total dynamic structure factors S(Q, h̄ω = 133 meV) of amorphous SiO2 (upper curve)and a-Li2Si2O5 (lower curve).
4.3.6. E = 133 meV. In figure 8 the cuts through S(Q,ω) of the samples continue to differat the most pronounced maximum, now located right from 10.2 Å−1 for a-SiO2 and 9.8 Å−1
for a-Li2Si2O5, which is less pronounced here. The maximum at 13 Å−1 is not shifted for theLi2Si2O5 glass but is slightly more pronounced and broadened.
5. Discussion
The aim of this investigation was to study the influence of a network modifier (lithium ions) onthe short range dynamics of the Si–O network. The starting point of this discussion is thereforethe static structure of the two samples. In the experimentally determined pair distributionfunctions one observes only some small changes in the first coordination sphere of Si withincreasing Li content. Especially the shape of the Si–O pair correlation is not affected byincreasing the Li2O content [5]. However, the average O–O distance of the first coordinationsphere is slightly elongated with increasing Li content. It varies from 2.60 Å (SiO2) up to2.64 Å for a-Li2Si2O5. This tendency has been found by several authors [1, 5] and can beunderstood in terms of a softening of the Si–O bonds of non-bridging oxygens.
The breathing mode of the SiO4 tetrahedron is observable in the region of 50 meV in theGVDOS (see figure 1). The intensity is reduced and the peak is broadened for the Li2Si2O5
glass, which indicates also a softening of the Si–O bond in the tetrahedra for non-bridgingoxygens.
Since the Q–ω range is related to the short range structure of the network we will discussthe results in the light of the central force model derived by Sen and Thorpe [13]. In figure 9, theassumed short range order of a common AX2 network is drawn schematically. The structuralunit is an AX4 tetrahedron with corner sharing X atoms. All A–X distances are the sameand all X–A–X angles have the value of 109.5◦. The symbol SS stands for the symmetric

6988 H Uhlig et al
Figure 9. Explanations of the motions in an AX2 network [14]. The X-atom motions shown aredefined as symmetric stretch (SS), antisymmetric stretch (AS) and rocking (R) modes.
stretch mode, AS for the antisymmetric stretch mode and R stands for the rocking modeperpendicular to the AXA plane. Although there is some weakness in the application of thismodel, as the explanation of reasonable values for the intertetrahedral angle θ fails, this modelis useful for the interpretation of neutron scattering data as well as Raman spectra. The furtherinterpretation of the data uses the concepts presented by Galeener et al [14]. Equation (4) wasfirst derived by Kulas and Thorpe [15] and is used for the estimation of the non-central forceconstant β. Equations (5)–(8) are the band limit formulas for central forces only, derived bySen and Thorpe [13]. This model excludes all non-central forces from the consideration. Alsoexcluded from this model is the special ring statistics and a certain statistical distribution ofthe dihedral angle. Only the masses of the participating atoms and the intertetrahedral angleθ are included in this model. This set of equations describes the dynamics common to AX2
glasses [16]:
ω20 = 2β/mX (4)
ω21 = (α/mX)(1 + cos θ) (5)
ω22 = (α/mX)(1 − cos θ) (6)
ω23 = (α/mX)(1 + cos θ) + 4α/3mA (7)
ω24 = (α/mX)(1 − cos θ) + 4α/3mA. (8)
Galeener [17] used this set of equations for the estimation of the force constants and the bondangles. Using equations (5) and (7) one obtains
α = (ω23 − ω2
1)(3mA/4) (9)
cos(θ) + 1 = ω21(ω
23 − ω2
1)−1(4mx/3mA). (10)
The value of ω0 was taken from the small hump on the left of the main peak ωR . For the furtherassignment of the frequenciesωi see [14]. Although this model does not give the precise valuesfor θ , we want to use it in order to estimate the force constants α and β.
The constant β for non-central forces is independent of the Li content in the glass.Using the values ofω3 andω1 from the GVDOS we can calculate the central force constant
α. The values obtained (see table 1) indicate a softening with increasing Li content. We

Dynamics of modified glass networks 6989
Table 1. Calculated force constants α, β and intertetrahedral angle θ using ωi values as measuredfor SiO2 and 0Li2Si2O5 glasses.
h̄ω0 h̄ω1 h̄ω2 h̄ω3 h̄ω4 α β
[meV] [meV] [meV] [meV] [meV] [N m−1] [N m−1] θ
SiO2 43.3 55.8 — 98.8 145 549 58 131.70Li2Si2O5 43.3 55.8 120 90.5 — 412 58 122.4
assume that the softening is caused by non-bridging oxygen atoms because Si–O–Si bondsare highly covalent, while the Li–O–Si bonds for non-bridging oxygen have partially ioniccharacter. Therefore, a softening of these bonds is observed, which is accompanied by a slightelongation of the Si–O bonds with increasing Li content. From the dynamic structure factorpresented in figures 2–8 we can conclude that these changes are not the result of numerous newvibrational modes. The S(Q,ω = constant) cuts have largely the same structure for a-SiO2
and a-Li2Si2O5.The lower intensity at the position of ω4 (LO mode) can be discussed in the light of the
decreasing degree of connectivity in the network of a Li2Si2O5 network. As result of thedecrease of the connectivity, the AS (antisymmetric stretching, see figure 9) mode becomespossible, especially in the case of non-bridging oxygen atoms.
5.1. Conclusions
The change of the short range dynamics of the SiO2 networks with increasing Li content isreflected in the GVDOS. The intensity shifts observed here are used to calculate the forceconstants of the model applied. A softening of the Si–O bonds is observed together with anincreasing intensity for the antisymmetric stretching mode and a decreasing intensity at the LOmode for a-Li2Si2O5. These results are in good agreement with those of neutron diffractionexperiments, where a slight elongation of Si–O bonds is observed together with the decreaseof the degree of connectivity of the SiO network with increasing Li content. For further detailscomputer simulations will be needed.
References
[1] Waseda Y 1980 The Structure of Non Crystalline Materials (New York: McGraw-Hill)[2] Yasui I, Hasegawa H and Imaoka M 1983 Phys. Chem. Glasses 24 65[3] Misawa M, Price D L and Suzuki K 1980 J. Non-Cryst. Solids 37 85[4] Gaskell P H 1993 Proc. ILL/ESRF Workshop on Methods in the Determination of Partial Structure Factors ed
J-B Suck, P Chieux, D Raoux and C Riekel (Singapore: World Scientific)[5] Uhlig H, Hoffmann M J, Bellissent R, Lamparter H P, Aldinger F and Steeb S 1996 J. Am. Ceram. Soc. 79 2833[6] Zhao J, Gaskell P H and Soper A K 1998 J. Non-Cryst. Solids 232–234 721[7] Dove M T, Harris M H, Hannon A C, Parker J M, Swainson I P and Gambhir M 1997 Phys. Rev. Lett. 78 1070[8] Uhlig H, Mentese S, Longeville S and Suck J-B 1999 submitted[9] Price D L and Carpenter J M 1987 J. Non-Cryst. Solids 92 153
[10] Arai M, Hannon A C, Otomo T, Hiramatsu A and Hishiima T 1995 J. Non-Cryst. Solids 192/193 230[11] Galeener F L 1982 Solid State Commun. 44 1037[12] Sears V F 1975 Adv. Phys. 24 1[13] Sen P N and Thorpe M F 1977 Phys. Rev. B 15 4030[14] Galeener F L, Leadbetter A J and Stringfellow M W 1983 Phys. Rev. B 27 1052[15] Kulas R and Thorpe M F 1976 Structure and Excitations of Amorphous Solids, Proc. 176th Williamsburg Meeting
Division Struct. Excitation Amorphous Solids Am. Phys. Soc. ed G Lucovsky and F L Galeener (New York:AIP)
[16] Bell R J, Dean P and Hibbins-Butler D C 1970 J. Phys. C: Solid State Phys. 3 2111[17] Galeener F L 1979 Phys. Rev. B 19 4292