
Dynamic temperature dependence patterns in future energy demand models in the context of climate...
10
Dynamic temperature dependence patterns in future energy demand models in the context of climate change M. Hekkenberg * , H.C. Moll, A.J.M. Schoot Uiterkamp University of Groningen, Center for Energy and Environmental Studies IVEM, Nijenborg 4, 9747AG Groningen, Netherlands article info Article history: Received 6 January 2009 Received in revised form 7 July 2009 Accepted 22 July 2009 Available online 15 August 2009 Keywords: Energy demand Degree days Climate change Cooling Heating Outdoor temperature abstract Energy demand depends on outdoor temperature in a ‘u’ shaped fashion. Various studies have used this temperature dependence to investigate the effects of climate change on energy demand. Such studies contain implicit or explicit assumptions to describe expected socio-economic changes that may affect future energy demand. This paper critically analyzes these implicit or explicit assumptions and their possible effect on the studies’ outcomes. First we analyze the interaction between the socio-economic structure and the temperature dependence pattern (TDP) of energy demand. We find that socio-economic changes may alter the TDP in various ways. Next we investigate how current studies manage these dynamics in socio-economic structure. We find that many studies systematically misrepresent the possible effect of socio-economic changes on the TDP of energy demand. Finally, we assess the consequences of these misrepresentations in an energy demand model based on temperature dependence and climate scenarios. Our model results indicate that expected socio-economic dynamics generally lead to an underestimation of future energy demand in models that misrepresent such dynamics. We conclude that future energy demand models should improve the incorporation of socio-economic dynamics. We propose dynamically modeling several key parameters and using direct meteorological data instead of degree days. Ó 2009 Elsevier Ltd. All rights reserved. 1. Introduction The possible effect of climate change on energy demand has recently renewed the interest in the relation between energy demand and outdoor temperature [1–7]. Various empirical studies have found total energy demand [2], combined natural gas and electricity demand [8] and electricity demand [9–13] to depend on outdoor temperature in a u-shaped fashion; low temperatures correspond to relatively high energy demand, intermediate temperatures correspond to lower energy demand, and high temperatures correspond to higher energy demand again. Such a ‘‘temperature dependence pattern’’ (TDP) 1 may be explained by a higher energy demand for heating processes at low temperatures and a higher energy demand for cooling processes at high temperatures. A u-shaped TDP suggests that climate change may have ambiguous consequences for future energy demand. Increasing outdoor temper- atures could generally reduce heating demand, but could also increase cooling demand. Given spatial and seasonal variations in the relative importance of these opposing effects, the sign of the overall balance for energy demand may thus vary regionally and seasonally. Obviously, assessing future energy demand is important for the purpose of future energy supply planning and economic assessments. Moreover, given that the current energy systems are at the base of greenhouse gas emissions, demand variation resulting from climate change may have implications for future greenhouse gas emission reduction require- ments and abatement options both regionally and globally. Therefore, future energy demand projections may be improved by including the energy demand effects of climate change. The approach to project regional or global energy demand implicitly assumed above, requires an expected TDP to describe energy demand at given temperatures and an expected climate pattern to describe the projected frequency distribution of given temperatures throughout the year. The sum of products of TDP and climate pattern results in the projected annual energy demand. Comparison of the projected energy demand resulting from a given TDP in various climate scenarios can clarify the effect of climate change on energy demand. The required climate patterns can be taken from climate models, but can also be composed by simply adding a given number of degrees to the currently observed climate pattern. However, the estimation of the TDP depends on many underlying socio-economic parameters. * Corresponding author. Tel.: þ31 50 363 4609; fax: þ31 50 363 7168. E-mail address: [email protected] (M. Hekkenberg). 1 In this study, TDP is defined as the function of expected daily energy demand at a continuum of outdoor temperatures. Contents lists available at ScienceDirect Energy journal homepage: www.elsevier.com/locate/energy 0360-5442/$ – see front matter Ó 2009 Elsevier Ltd. All rights reserved. doi:10.1016/j.energy.2009.07.037 Energy 34 (2009) 1797–1806
-
Upload
independent -
Category
Documents
-
view
1 -
download
0
Transcript of Dynamic temperature dependence patterns in future energy demand models in the context of climate...

lable at ScienceDirect
Energy 34 (2009) 1797–1806
Contents lists avai
Energy
journal homepage: www.elsevier .com/locate/energy
Dynamic temperature dependence patterns in future energy demandmodels in the context of climate change
M. Hekkenberg*, H.C. Moll, A.J.M. Schoot UiterkampUniversity of Groningen, Center for Energy and Environmental Studies IVEM, Nijenborg 4, 9747AG Groningen, Netherlands
a r t i c l e i n f o
Article history:Received 6 January 2009Received in revised form7 July 2009Accepted 22 July 2009Available online 15 August 2009
Keywords:Energy demandDegree daysClimate changeCoolingHeatingOutdoor temperature
* Corresponding author. Tel.: þ31 50 363 4609; faxE-mail address: [email protected] (M. Hekken
1 In this study, TDP is defined as the function of expa continuum of outdoor temperatures.
0360-5442/$ – see front matter � 2009 Elsevier Ltd.doi:10.1016/j.energy.2009.07.037
a b s t r a c t
Energy demand depends on outdoor temperature in a ‘u’ shaped fashion. Various studies have used thistemperature dependence to investigate the effects of climate change on energy demand. Such studiescontain implicit or explicit assumptions to describe expected socio-economic changes that may affectfuture energy demand.
This paper critically analyzes these implicit or explicit assumptions and their possible effect on the studies’outcomes. First we analyze the interaction between the socio-economic structure and the temperaturedependence pattern (TDP) of energy demand. We find that socio-economic changes may alter the TDP invarious ways. Next we investigate how current studies manage these dynamics in socio-economic structure.We find that many studies systematically misrepresent the possible effect of socio-economic changes on theTDP of energy demand. Finally, we assess the consequences of these misrepresentations in an energydemand model based on temperature dependence and climate scenarios. Our model results indicate thatexpected socio-economic dynamics generally lead to an underestimation of future energy demand in modelsthat misrepresent such dynamics. We conclude that future energy demand models should improve theincorporation of socio-economic dynamics. We propose dynamically modeling several key parameters andusing direct meteorological data instead of degree days.
� 2009 Elsevier Ltd. All rights reserved.
1. Introduction
The possible effect of climate change on energy demand hasrecently renewed the interest in the relation between energy demandand outdoor temperature [1–7]. Various empirical studies have foundtotal energy demand [2], combined natural gas and electricity demand[8] and electricity demand [9–13] to depend on outdoor temperaturein a u-shaped fashion; low temperatures correspond to relatively highenergy demand, intermediate temperatures correspond to lowerenergy demand, and high temperatures correspond to higher energydemand again. Such a ‘‘temperature dependence pattern’’ (TDP)1 maybe explained by a higher energy demand for heating processes at lowtemperatures and a higher energy demand for cooling processes athigh temperatures.
A u-shaped TDP suggests that climate change may have ambiguousconsequences for future energy demand. Increasing outdoor temper-atures could generally reduce heating demand, but could also increasecooling demand. Given spatial and seasonal variations in the relative
: þ31 50 363 7168.berg).ected daily energy demand at
All rights reserved.
importance of these opposing effects, the sign of the overall balance forenergy demand may thus vary regionally and seasonally. Obviously,assessing future energy demand is important for the purpose of futureenergy supply planning and economic assessments. Moreover, giventhat the current energy systems are at the base of greenhouse gasemissions, demand variation resulting from climate change may haveimplications for future greenhouse gas emission reduction require-ments and abatement options both regionally and globally. Therefore,future energy demand projections may be improved by including theenergy demand effects of climate change.
The approach to project regional or global energy demandimplicitly assumed above, requires an expected TDP to describeenergy demand at given temperatures and an expected climatepattern to describe the projected frequency distribution of giventemperatures throughout the year. The sum of products of TDP andclimate pattern results in the projected annual energy demand.Comparison of the projected energy demand resulting from a givenTDP in various climate scenarios can clarify the effect of climatechange on energy demand. The required climate patterns can betaken from climate models, but can also be composed by simplyadding a given number of degrees to the currently observed climatepattern. However, the estimation of the TDP depends on manyunderlying socio-economic parameters.

M. Hekkenberg et al. / Energy 34 (2009) 1797–18061798
Total energy demand and the TDP are influenced by a wide array ofstructural indicators, such as the general degree of economic welfare,the extent of electrification, the availability of other energy carriers,the prevalence of energy efficient technologies, the prevailing climateand cultural habits [2,4,6,14]. There are large differences in the socio-economic structure underlying energy demand throughout the worldboth relative to the total energy demand and on an absolute scale. Allthese regional structural differences may naturally result in differentregional TDPs. The TDP of a given region can thus be regarded as anindicator of the underlying socio-economic system.
However, the TDP may not only vary by location; structural socio-economic developments, such as increasing the capacity or energyefficiency of heating or cooling applications, may also change a localTDP over time. Moral-Carcedo and Vicens-Ocero [9] have modeledthe Spanish TDP for electricity in a rolling average of 3-yr periods,and show that it is subject to change. Bessec and Fouquau [13] havesuggested similar findings for the EU-15 and Hekkenberg et al. [15]shows the pattern in the Netherlands has also been changing.Accurately projecting a future TDP thus requires data on both currentregional details and expected regional developments.
Many studies modeling the effect of climate change on energydemand to date focus solely on the effects of temperature change[5,12,16,17], and thereby assume implicitly that the socio-economicstructure does not change. Others use more explicit assumptionsthat do allow some socio-economic dynamics that may influencethe studied effects [1–4,11].
This article critically explores the implicit or explicit assumptionsin studies investigating the effects of climate change on futureenergy demand. It analyzes the possible effects of socio-economicdynamics on the TDP (Section 2) and investigates how currentstudies approach these dynamics (Sections 3 and 4). Next it modelsthe consequences of misrepresenting such dynamics in studies thatmodel the effect of climate change on future energy demand(Sections 5 and 6) and discusses possible implications (Section 7).Finally, Section 8 presents the conclusions of the study. Note that thestudy aims to improve the methodology of future energy demandforecasts, rather than forecast energy demand itself.
2. Socio-economic differences and developments in thetemperature dependence pattern
In describing the effect of various socio-economic differencesin the TDP, we can discriminate between continuous heating orcooling processes and comfort related heating or cooling processes.
Fig. 1. Schematic representation of energy requirement to maintain space temperature wichanges. a¼ increase in heating efficiency; b¼ improved insulation; c¼ improved cooling
Continuous processes may be expected to operate regardless of theoutdoor temperature, whereas comfort related processes may beexpected to operate within a certain temperature range only.
Continuous heating demand may e.g. be expected in variousindustrial processes. Continuous cooling demand may e.g. be expectedin food processing and storage, both industrially, commercially anddomestically.
For industrial processes, heating and cooling demands are oftenconsidered to be independent of outdoor temperature [2], possiblybecause the temperature difference to bridge in such processes isoften much larger than the outdoor temperature fluctuations. Also,many other continuous processes operate at relatively stablesurrounding temperatures and thus have a relatively stable demand.However, e.g. continuous cooling processes related to food pro-cessing and storage have relatively small temperature differences tobridge, and thus possibly are more dependent on outdoor temper-ature, especially since these cooling processes often exchange heatto the outdoor air. Therefore, part of the continuous demand may beexpected to be temperature dependent. The combined positive,negative or neutral effect of these continuous processes depends onthe relative contribution and temperature dependencies of contin-uous heating and cooling processes in the total energy demand.Socio-economic developments may increase or decrease the relativeshare of these continuous processes in total energy demand and thuspossibly change their aggregated temperature dependence.
Comfort related heating and cooling demands may be expected inmany places where people live or work. These processes are aimed atraising or lowering the ambient temperature in a living or workingspace within a certain human comfort zone. The temperature at whichno heating or cooling is required to keep the indoor temperature at therequired level is generally called the balance temperature [5].
Fig. 1 shows a schematic representation of the heating and coolingdemands in indoor spaces conditioned towards a given humancomfort level. Various developments are shown that may alter theneed for heating or cooling at given temperatures [6]. From thisrepresentation we can see that increasing insulation, increasingheating efficiency, increasing internal heat gains (e.g. from more use ofelectric appliances) and a changing human comfort pattern (e.g.thicker clothing) may shift the need for heating towards lowertemperatures. Obviously, shifts towards higher temperatures couldalso occur from opposite developments. Similarly, the need for coolingmay be shifted by various structural changes. Noteworthy is thatincreasing internal heat gains lead to decreasing heating demand, butalso to increasing cooling demand. Arguably, the sum of societal
thin a specified comfort zone and examples of shifting demand by various structuralefficiency; d¼ increasing internal heat gains; e¼ changing human comfort patterns.

Coolingdemand
Heatingdemand
Tb
Energy Dem
and
Outdoor Temperature
Temperature independent
demand
α β
Fig. 2. TDP based on a degree day approach.
M. Hekkenberg et al. / Energy 34 (2009) 1797–1806 1799
trends, such as better insulation, increased internal heat gains in(office) buildings from e.g. computers or a decreasing tolerance forheat, leads to a general shift towards lower heating demand andhigher cooling demand [6]. Efficiency improvements and betterinsulation can reduce both heating and cooling demands and possiblyfurther shift the temperature range in which such demand occurs.
Summarizing, various socio-economic factors may influence thetotal energy demand for heating and cooling related to spaceconditioning and may thus influence the TDP.
3. Current approaches to establish the temperaturedependence pattern
Several current approaches to assess the effect of climate changeon energy demand [1,2,11,12,16–18] conceptually build on and extendinto the future the existing successful approaches to describe theeffect of temperature variation on the intra-daily, daily or monthlyelectricity demand [9,10,13,19–21] or energy demand [2,8] by corre-lating historic demand variation with temperature variations. Othersuse models that simulate building characteristics in order to calculateenergy demand at various temperatures bottom upwards [5,22,23].
The best known approach to link energy demand with outdoortemperature is through the concept of degree days. Heating degreedays (HDDs) and cooling degree days (CDDs) describe the departure ofdaily average temperature down or up from a threshold temperature(Tb). Clearly, these names suggest that degree days coincide with therequirement of heating or cooling at the given temperature. Thesummed totals of HDDs and CDDs over a given period therefore formindicators for cold and heat stress respectively, and form relativelysimple metrics to describe a region’s climate. Higher HDD and CDDtotals have both been successfully correlated with higher electricitydemand [10,21,24] or natural gas consumption [2,8]. Mathematically,the degree day model may be represented through equation (1)
ED ¼ d*EDTbþ a*ðHDDÞ þ ß*ðCDDÞ (1)
In which
ED¼ total energy demand over a given period,EDTb
¼ base daily energy demand (at T¼ Tb),d¼ number of days in given period,HDD¼ summed daily temperature deviation down from Tb ingiven period,CDD¼ summed daily temperature deviation up from Tb in givenperiod,a¼ regional dependence of ED on cold stress,b¼ regional dependence of ED on heat stress.
Because degree days are basically a simple conversion of outdoortemperature, a TDP can be derived from equation (1) by calculatingexpected daily energy demand at a given daily temperature. Theobserved u-shaped relation between energy demand and temperatureis thus simplified by two linear functions of temperature in a v-shape(e.g. Ref. [2]). Approaches to assess energy demand generally presumethese functions to represent heating demand and cooling demand. Theslopes of these functions (given by a and b in equation (1)) determinethe TDP of energy demand (see Fig. 2). Hence we can describe heatingand cooling demands in such a TDP as follows:
HD ¼ aðTb � TÞ for ðT < TbÞ (2)
CD ¼ ßðT � TbÞ for ðT > TbÞ (3)
In which
HD¼ heating demand,CD¼ cooling demand,
a¼ regional dependence of ED on cold stress,b¼ regional dependence of ED on heat stress,T¼ daily average temperature,Tb¼ threshold temperature between heating demand andcooling demand,
The TDP is completed by adding the temperature independentdemand that exists at all temperatures.
As discussed in Section 2, temporal dynamics may influence theslopes of the pattern as well as the threshold temperature forheating and cooling demands. Allowing for variation in the slopesof the functions for heating and cooling demands and a regionallyvariable threshold temperature in the TDP is needed to allow forspatial and temporal socio-economic dynamics in future energydemand projections.
However, the regression based TDPs are principally static,because a and b are derived by regression of aggregated data. Still,a and b could be adjusted to enable incorporating some of the socio-economic dynamics, although the exact influence of dynamics onthese parameters remains unclear because the regression providesno explanatory mechanisms. Bottom up approaches [5,22,23] aretherefore generally better suited to incorporate dynamics.
4. Current approaches to incorporate dynamics in thetemperature dependence pattern
This section discusses how various studies have dealt withspatial and temporal variations and point out several observedmisrepresentations of this variation. Various studies deal witha single region only [2,5,11,12] and can therefore neglect the issue ofregional structural differences. They establish the regional TDPfrom electricity or energy data for each region. Studies that covermultiple regions, generally establish the TDP separately for eachregion being investigated [3,8].
Many studies neglect structural changes during the investigatedperiod. Such studies implicitly assume that the observed regionalTDP, or some of its key elements, is static. For investigating short-term energy or electricity demand variation this would be justified,since manifestation of structural changes is negligible on a day to daybasis. However, studies that use the TDP for assessments of theeffects of climate change on future energy demand clearly havea long-term scope. Although these studies usually include obviouseconomic parameters such as gross national product (GNP) andpopulation growth rates, they often neglect possible structuralchanges that may change the relative TDP [4,5,11,12,22]. Therefore,

Table 1Possible misrepresented parameters of the TDP from misrepresented dynamics.
Main effect on TDP
Slope Thresholdtemperature
Observed shortcomingsin study methodologies
Misrepresentation ofregional differences
X
Misrepresentation oftemporal dynamics
X X
Errors resulting fromdegree day approachcharacteristics
Falsely including or excludingprocesses in heating orcooling demand estimate
X
Interaction betweensocio-economic developments
X
Interaction between heatingand cooling demand
X X
M. Hekkenberg et al. / Energy 34 (2009) 1797–18061800
structural changes in the relative importance of heating or coolingprocesses in regional economies are not accounted for, even thoughthese may be significant in long-term forecasting.
Still, other studies do include various structural changes in theirenergy demand forecast. For instance Sailor and Pavlova [1], esti-mate regional energy demand for space conditioning based onfuture societal penetration of air conditioning applications. Isaac andVan Vuuren [3] additionally include energy efficiency developmentand projected future income in a global assessment of residentialsector energy demand for heating and air conditioning. Belzer et al.[25] and Scott et al. [23] model changes in space conditioning systemand building characteristics. In terms of the TDP, these approachesdynamically model the slope parameters (a and b) of the pattern,which is crucial for including the dynamics of structural develop-ments. Thus, these studies address some of the major deficits foundin other studies. However, many studies use the degree days conceptto establish the TDP. We argue that this concept has fundamentalshortcomings, which may lead to a misrepresentation of future TDP.
The observed correlation between degree days and energydemand is usually logically linked to energy demand for heating andcooling processes. The comparison of the degrees days based TDP inFig. 2 and the graphical bottom up representation of heating andcooling demands in Fig.1 shows remarkable similarities. However, weargue that the fundaments leading to the graphs should not bematched without due consideration. After all, other societal processescould possibly similarly explain (part of) the observed correlation. Forinstance, electricity use for lighting is also generally correlated totemperature, since winter months are usually colder but also darker. Ifsuch processes are falsely included as heating demand, a decrease inheating demand due to climate change may be overestimated, sincelighting demand may be expected not to be influenced by climatechange. In essence the degree days approach is a regression approach,which can serve as an underpinning of but not as the base for logicalexplanation. Moreover, the usual approach to aggregate data fromlong time series to establish correlations inhibits the revelation ofpossible historic dynamics. Using a similar approach to forecast futuredemand similarly neglects possible future dynamics.
The degree days concept generally presumes a static thresholdtemperature of 18 �C (65 F) by default. As can be deducted from Fig.1,this threshold temperature is not necessarily equal for heating andcooling demands. Moreover, threshold temperatures for heating andcooling may vary individually, due to socio-economic developmentsor behavioral changes. Various studies report that a differentthreshold temperature would better represent the observed data ina given region [2,8], however some use the default thresholdtemperature to be in line with other studies and thus disregard thepossibly existing regional differences [3]. Some [2,5,22] use separatethreshold temperatures to model heating and cooling demands, butdo not assume any dynamics in these temperatures. Others domodel a slightly changing threshold temperature [25] or include thechoice of threshold temperature in their sensitivity analysis [22].
Moreover, the degree days approach assumes that heatingdemand and cooling demand never co-exist. Although this may seemplausible for space conditioning (as represented in Fig. 1), it disre-gards the share of demand that serves other purposes, such as foodconservation or industrial heating and cooling processes, which wediscussed in Section 2. We2 suggest that degree day correlationshould be explained as the result of interaction between heating andcooling demand (and other societal processes), rather than as the
2 In the Netherlands cooling demand for air conditioning, refrigeration and freezingprocesses is collectively estimated at 4–5% of total national electricity demand (KWA,2005), even though average daily temperatures rarely rise above 18 �C. At the usualthreshold temperature of 18 �C, a degree days approach cannot estimate such demand.
manifestation of just either one of them. In this interpretation, theobserved slope of the TDP reflects the difference between the changein heating demand and the change in cooling demand resultingfrom temperature variation. Since the slopes of heating and coolingdemands have opposite signs, the individual slopes of heating andcooling demand separately may be larger than the observedcombined slope. Therefore, socio-economic developments that affectheating or cooling demand may be underestimated if the combinedslope is treated as the individual heating or cooling slope. Moreover,because of such interaction between various types of demand, socio-economic developments may result in a shifting of the temperaturewith minimum energy demand.
Summarizing, studies assessing the effects of climate change onenergy demand do not always accurately represent spatial differencesand temporal dynamics leading to TDP variation. The misrepresen-tation of the present or future TDP may lead to errors in the energydemand forecasts. Misrepresenting spatial differences may lead toerroneous baselines on which to base the projections, whereasmisrepresenting temporal developments may lead to erroneousprojections. Consequently, misrepresentations may lead to errors inthe resulting assessment of the effects of climate change on energydemand. Table 1 summarizes the discussed misrepresentations andthe TDP parameters that they may influence.
5. A linear model to analyze structural dynamicsin climate change scenarios
We have developed a linear Microsoft Excel model to analyzethe consequences of the shortcomings discussed in the previoussection. Equation (4) formally describes the model’s energydemand calculation.
ED ¼Pn
i¼1ðTIDþ asHðTbH � TiÞ þ bsCðTi � TbCÞ þ gTiÞ
sH ¼�
0;1;
TbH � Ti < 0TbH � Ti � 0
sC ¼�
0;1;
Ti � TbC < 0Ti � TbC � 0
(4)
In which
ED¼ annual energy demand,n¼ number of days in a year,TID¼ daily temperature independent demand,a¼ temperature dependence of heating demand,b¼ temperature dependence of cooling demand,g¼ temperature dependence of continuous temperaturedependent demand,Ti¼ average temperature on day i,TbH¼ upper threshold temperature for heating demand,
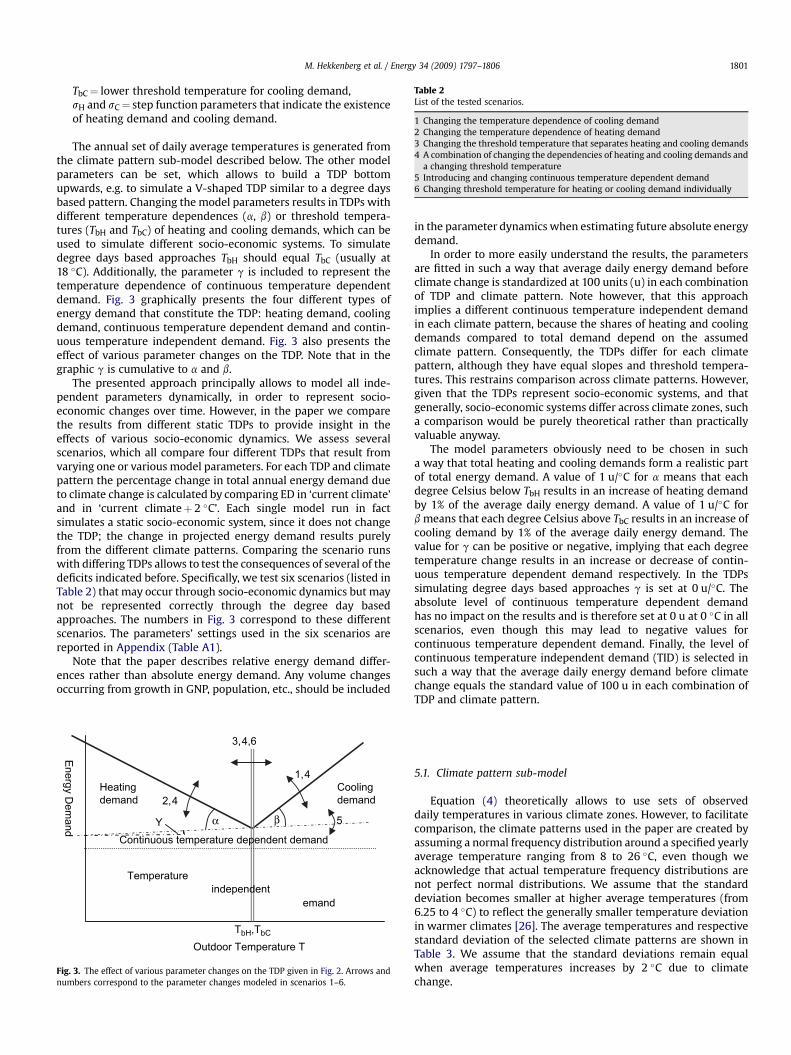
Table 2List of the tested scenarios.
1 Changing the temperature dependence of cooling demand2 Changing the temperature dependence of heating demand3 Changing the threshold temperature that separates heating and cooling demands4 A combination of changing the dependencies of heating and cooling demands and
a changing threshold temperature5 Introducing and changing continuous temperature dependent demand6 Changing threshold temperature for heating or cooling demand individually
M. Hekkenberg et al. / Energy 34 (2009) 1797–1806 1801
TbC¼ lower threshold temperature for cooling demand,sH and sC¼ step function parameters that indicate the existenceof heating demand and cooling demand.
The annual set of daily average temperatures is generated fromthe climate pattern sub-model described below. The other modelparameters can be set, which allows to build a TDP bottomupwards, e.g. to simulate a V-shaped TDP similar to a degree daysbased pattern. Changing the model parameters results in TDPs withdifferent temperature dependences (a, b) or threshold tempera-tures (TbH and TbC) of heating and cooling demands, which can beused to simulate different socio-economic systems. To simulatedegree days based approaches TbH should equal TbC (usually at18 �C). Additionally, the parameter g is included to represent thetemperature dependence of continuous temperature dependentdemand. Fig. 3 graphically presents the four different types ofenergy demand that constitute the TDP: heating demand, coolingdemand, continuous temperature dependent demand and contin-uous temperature independent demand. Fig. 3 also presents theeffect of various parameter changes on the TDP. Note that in thegraphic g is cumulative to a and b.
The presented approach principally allows to model all inde-pendent parameters dynamically, in order to represent socio-economic changes over time. However, in the paper we comparethe results from different static TDPs to provide insight in theeffects of various socio-economic dynamics. We assess severalscenarios, which all compare four different TDPs that result fromvarying one or various model parameters. For each TDP and climatepattern the percentage change in total annual energy demand dueto climate change is calculated by comparing ED in ‘current climate’and in ‘current climateþ 2 �C’. Each single model run in factsimulates a static socio-economic system, since it does not changethe TDP; the change in projected energy demand results purelyfrom the different climate patterns. Comparing the scenario runswith differing TDPs allows to test the consequences of several of thedeficits indicated before. Specifically, we test six scenarios (listed inTable 2) that may occur through socio-economic dynamics but maynot be represented correctly through the degree day basedapproaches. The numbers in Fig. 3 correspond to these differentscenarios. The parameters’ settings used in the six scenarios arereported in Appendix (Table A1).
Note that the paper describes relative energy demand differ-ences rather than absolute energy demand. Any volume changesoccurring from growth in GNP, population, etc., should be included
1,4 Heatingdemand
TbH,TbC
Energy Dem
and
Outdoor Temperature T
Coolingdemand2,4
3,4,6
5
Continuous temperature dependent demand
Temperature independent
emand
Y α β
Fig. 3. The effect of various parameter changes on the TDP given in Fig. 2. Arrows andnumbers correspond to the parameter changes modeled in scenarios 1–6.
in the parameter dynamics when estimating future absolute energydemand.
In order to more easily understand the results, the parametersare fitted in such a way that average daily energy demand beforeclimate change is standardized at 100 units (u) in each combinationof TDP and climate pattern. Note however, that this approachimplies a different continuous temperature independent demandin each climate pattern, because the shares of heating and coolingdemands compared to total demand depend on the assumedclimate pattern. Consequently, the TDPs differ for each climatepattern, although they have equal slopes and threshold tempera-tures. This restrains comparison across climate patterns. However,given that the TDPs represent socio-economic systems, and thatgenerally, socio-economic systems differ across climate zones, sucha comparison would be purely theoretical rather than practicallyvaluable anyway.
The model parameters obviously need to be chosen in sucha way that total heating and cooling demands form a realistic partof total energy demand. A value of 1 u/�C for a means that eachdegree Celsius below TbH results in an increase of heating demandby 1% of the average daily energy demand. A value of 1 u/�C forb means that each degree Celsius above TbC results in an increase ofcooling demand by 1% of the average daily energy demand. Thevalue for g can be positive or negative, implying that each degreetemperature change results in an increase or decrease of contin-uous temperature dependent demand respectively. In the TDPssimulating degree days based approaches g is set at 0 u/�C. Theabsolute level of continuous temperature dependent demandhas no impact on the results and is therefore set at 0 u at 0 �C in allscenarios, even though this may lead to negative values forcontinuous temperature dependent demand. Finally, the level ofcontinuous temperature independent demand (TID) is selected insuch a way that the average daily energy demand before climatechange equals the standard value of 100 u in each combination ofTDP and climate pattern.
5.1. Climate pattern sub-model
Equation (4) theoretically allows to use sets of observeddaily temperatures in various climate zones. However, to facilitatecomparison, the climate patterns used in the paper are created byassuming a normal frequency distribution around a specified yearlyaverage temperature ranging from 8 to 26 �C, even though weacknowledge that actual temperature frequency distributions arenot perfect normal distributions. We assume that the standarddeviation becomes smaller at higher average temperatures (from6.25 to 4 �C) to reflect the generally smaller temperature deviationin warmer climates [26]. The average temperatures and respectivestandard deviation of the selected climate patterns are shown inTable 3. We assume that the standard deviations remain equalwhen average temperatures increases by 2 �C due to climatechange.

Table 3Average temperatures and corresponding standard deviations selected as climatepatterns.
Average temperature (�C) 8 10 12 14 16 18 20 22 24 26Standard deviation (�C) 6.25 6 5.75 5.5 5.25 5 4.75 4.5 4.25 4
-4.0%
-3.0%
-2.0%
-1.0%
0.0%
1.0%
2.0%
3.0%
8 10 12 14 16 18 20 22 24 26
En
erg
y d
em
an
d ch
an
ge fro
m 2ºC
clim
ate
ch
an
ge
pattern Apattern Bpattern Cpattern D
Climate pattern average temperature (ºC)
Fig. 5. Results from scenario 2. Patterns A–D reflect TDPs in which the temperaturedependence of heating demand decreases from patterns A to D.
M. Hekkenberg et al. / Energy 34 (2009) 1797–18061802
6. Model results
The results from the six tested scenarios are presented in Figs.4–9.
Each figure shows the results of a simulation of 4 different TDPs(patterns A–D) for 10 different climate scenarios. The depicted barsrepresent the relative difference in energy demand resulting froma 2 �C temperature increase for each combination of TDP andclimate scenario.
The differences resulting from using different TDPs show thatthe effects of climate change depend on the assumed TDP. Becausewe use hypothetical parameter values as input in our model, thechanges in energy demand from individual model runs are not veryrelevant; choosing different values leads to different outcomes.When evaluating the results, we should therefore look at therelative changes between model runs rather than the absolutenumbers of the model runs themselves.
As explained in Section 5, the results for different climate patternsare based on different TDPs, albeit with equal slopes and thresholdtemperatures. Therefore, the resulting values cannot be comparedacross the climate patterns. However, comparing the direction ofchanges across the climate patterns can indicate the significance of theeffects from socio-economic changes on a globally aggregated scale.
6.1. Scenario 1 – effect of changing cooling dependence
In this scenario (Fig. 4), patterns A–D reflect TDPs in which thetemperature dependence of cooling demand increases from patternsA to D, while keeping other temperature dependent parameters equal.
The results show that an increased cooling dependence leads toa smaller decrease or a larger increase of energy demand intemperature scenarios that result in a decrease or increase of energydemand respectively. Underestimating the temperature dependenceof cooling demand (by assuming a too low value for b) apparentlyleads to underestimation of the total energy demand in climatechange scenarios. Overestimating the temperature dependenceobviously leads to overestimating the demand. This effect is pro-jected under all climate conditions, but is the largest in warmer
-3.0%
-2.0%
-1.0%
0.0%
1.0%
2.0%
3.0%
4.0%
5.0%
6.0%
8 10 12 14 16 18 20 22 24 26
En
erg
y d
em
an
d ch
an
ge fro
m 2ºC
clim
ate
ch
an
ge
pattern Apattern Bpattern Cpattern D
Climate pattern average temperature (ºC)
Fig. 4. Results from scenario 1. Patterns A–D represent TDPs in which the temperaturedependence of cooling demand increases from patterns A to D.
climates. Under some climate conditions the increasing temperaturedependence of cooling demand results in an increase in energydemand rather than a decrease. Apparently, an increasing tempera-ture dependence of cooling demand results in a shift of the ‘‘balanceclimate’’ towards a lower average temperature. The balance climateis the climate pattern at which increasing cooling demand due toclimate change exactly compensates the decreasing heating demand.In colder climates climate change results in lower total energydemand and in warmer climates the opposite occurs.
6.2. Scenario 2 – effect of changing heating dependence
In this scenario (Fig. 5), patterns A-D reflect TDPs in which thetemperature dependence of heating demand decreases frompatterns A to D, while keeping other temperature dependentparameters equal. The effects of a decreasing temperature depen-dence of heating demand are essentially similar to those of anincreasing temperature dependence of cooling demand, except thatin this scenario, colder climates show a larger effect than warmerclimates. Underestimating the temperature dependence of heatingdemand thus leads to overestimation of energy demand, whereasoverestimating the temperature dependence of heating demandleads to underestimation of energy demand. A decreasing temper-ature dependence of heating demand results in a shift of the balanceclimate towards lower average temperature.
-3.0%
-2.0%
-1.0%
0.0%
1.0%
2.0%
3.0%
4.0%
8 10 12 14 16 18 20 22 24 26Climate pattern average temperature (ºC)
En
erg
y d
em
an
d ch
an
ge fro
m 2ºC
clim
ate
ch
an
ge
pattern Apattern Bpattern Cpattern D
Fig. 6. Results from scenario 3. Patterns A–D reflect TDPs in which the base temper-ature shifts towards lower temperatures from patterns A to D.

-4.0%
-2.0%
0.0%
2.0%
4.0%
6.0%
8.0%
8 10 12 14 16 18 20 22 24 26Climate pattern average temperature (ºC)
En
erg
y d
em
an
d ch
an
ge fro
m 2ºC
clim
ate
ch
an
ge
pattern Apattern Bpattern Cpattern D
Fig. 7. Results from scenario 4. Patterns A–D reflect a combination of the TDPs inscenarios 1–3.
-3.0%
-2.0%
-1.0%
0.0%
1.0%
2.0%
3.0%
8 10 12 14 16 18 20 22 24 26
En
erg
y d
em
an
d ch
an
ge fro
m 2ºC
clim
ate
ch
an
ge
pattern Apattern Bpattern Cpattern D
Climate pattern average temperature (ºC)
Fig. 9. Results from scenario 6. Patterns A–D reflect TDPs in which the base temper-ature for heating demand shifts towards lower temperatures from patterns A to D.
M. Hekkenberg et al. / Energy 34 (2009) 1797–1806 1803
6.3. Scenario 3 – changing the threshold temperature thatseparates heating and cooling demands
In this scenario (Fig. 6), patterns A–D reflect TDPs in which thethreshold temperature shifts towards lower temperatures frompatterns A to D, while keeping other temperature dependentparameters equal.
The results show that a lower threshold temperature leads, again,to a smaller decrease or a larger increase of energy demand intemperature scenarios that result in a decrease or increase of energydemand respectively. The largest differences are observed in climatepatterns around Tb. Neglecting a downwards shifting thresholdtemperature leads to an underestimation of energy demand resultingfrom a temperature increase. As may be expected, a lower Tb resultsin a shift of the balance climate towards lower average temperature.
6.4. Scenario 4 – combining the changes in the dependencies ofheating and cooling demands and a changing threshold temperature
In this scenario (Fig. 7), patterns A–D reflect a combination of theprevious TDPs. The results show large differences between thepatterns, in the same general direction as described in the earlier 3scenarios. This scenario is designed to show that the simultaneousoccurrence of several developments may augment the effects. The
-4.0%
-3.0%
-2.0%
-1.0%
0.0%
1.0%
2.0%
3.0%
4.0%
5.0%
8 10 12 14 16 18 20 22 24 26
En
erg
y d
em
an
d ch
an
ge fro
m 2ºC
clim
ate
ch
an
ge
pattern Apattern Bpattern Cpattern D
Climate pattern average temperature (ºC)
Fig. 8. Results from scenario 5. Patterns A–D reflect TDPs that include a continuoustemperature dependent demand which is modeled to change from negative to positivefrom patterns A to D.
combination of parameters is therefore chosen in such a way thattheir effects on the results are all augmenting. A different combina-tion of developments would obviously lead to less drastic differences.
6.5. Scenario 5 – introducing and shifting continuoustemperature dependent demand
In this scenario (Fig. 8), patterns A–D reflect TDPs that includea continuous temperature dependent demand. The continuoustemperature dependent demand is modeled to change from negativeto positive from patterns A to D, while keeping other temperaturedependent parameters equal. In fact the effect of this change is similaras the effect of simultaneously increasing cooling demand tempera-ture dependence and decreasing heating demand temperaturedependence. Therefore the results show similar trends as in previousscenarios. The negligence of changes in continuous temperaturedependent demand may therefore lead to underestimation or over-estimation of total demand, depending on the direction of change.
6.6. Scenario 6 – changing threshold temperaturefor heating or cooling demand individually
In this scenario (Fig. 9), patterns A–D reflect TDPs in which thethreshold temperature for heating demand shifts towards lowertemperatures from patterns A to D, while keeping other temperaturedependent parameters, including the threshold temperature forcooling demand equal. Thus, the TDP in patterns B–D showa temperature independent plateau between these the thresholdtemperature for heating and cooling. The results once more showsimilar trends as in previous scenarios. Neglecting a downward shiftof heating demand threshold temperature thus results in anunderestimation of energy demand. Neglecting an upward shift ofthis temperature however, results in overestimating energy demand.
Repeating this exercise with an increasing cooling demandthreshold temperature and a stable heating demand thresholdtemperature results in exactly opposite trends. Neglecting anupward shift of cooling demand threshold temperature thus resultsin an overestimation of energy demand. Neglecting a downwardshift of this temperature however, results in underestimatingenergy demand. Note that a decreasing TbH has limited effect inwarm climates, where temperatures below TbH do not occurfrequently; in such climates, heating demand is relatively low,therefore total energy demand is relatively insensitive to changes inheating demand.

M. Hekkenberg et al. / Energy 34 (2009) 1797–18061804
7. Discussion
7.1. Implications of model results
Our results show how differences in the TDP affect the effectsof climate change on energy demand. We have modeled variouschanges in pattern parameters to represent possible socio-economicchanges that may lead to a changing TDP. Our model calculates thedifference in energy demand resulting from climate change ina static context. However, the comparison of the results in thescenarios provides a dynamic perspective, as discussed in Section 5.
The first four scenarios maintain the general form of the degreedays based approaches, in which heating and cooling demands arelinear functions sloping downward or upward, respectively and areseparated at one threshold temperature. The results of thesescenarios show that a decreasing relative importance of heatingdemand (a), an increasing relative importance of cooling demand(b), and a downward shift of the threshold temperature (TbH¼ TbC),affect the modeled effects of climate change on energy demand ina similar fashion. Models that assume any of these three changes inthe TDP project a higher energy demand after climate change thanmodels that assume a fixed TDP. Obviously, changes in the oppositedirection lead to opposite results. Therefore, when these changesare presumed to occur randomly and lead to cancellation of eachother’s effects, neglecting the variability for the sake of keeping themodel simple could be quite acceptable. However, there is reason tobelieve that the effects of expected global socio-economic devel-opment on the TDP are non-random, and will add to eachothers effects. The developments are expected to lead to increasingeconomic welfare globally. This increasing economic welfare maybe expected to affect the TDP in a similar way throughout theworld.
Firstly, cooling and heating demands depend on the prevailingclimate pattern in a given region. In general, ‘‘warm’’ regions havelittle need for heating, whereas ‘‘cold’’ regions have little need forcooling. In regions that fall somewhere in between, both coolingand heating may be demanded. In general, cooling may beconsidered to be less essential for human survival than heating.Therefore, cooling demand may be regarded as a ‘luxury’, althoughmore so in cold climates than in warm climates. Moreover, heatingis often fueled by oil, natural gas or wood, which are generally moreeasily accessible than the electricity that is usually required forcooling. In any given region, existing heating demand is expected tobe met with little regard for economic welfare, whereas coolingdemand may be expected to be met depending on a combination ofprevailing climate and economic capacity. Given the current globaldistribution of welfare and climate patterns, we may expect thatmuch of the global heating demand is already manifest in the TDPs,whereas much of the global cooling demand is still latent.
Secondly, international climate policy has put energy efficiencyhigh on the agenda in the most developed countries, in whichheating demand is currently (still) more prominent than coolingdemand. Technological developments for energy efficiency maytherefore be expected to focus first on optimizing heating efficiencyand only later on cooling efficiency. Efficiency improvements maythus be expected to reduce heating demand more than coolingdemand in the near future. In the long run, the large potential forreduction of cooling demand may be addressed. Nonetheless, weexpect the increase in cooling demand to be more important for thetemperature dependence of cooling demand than the decrease dueto efficiency improvements. After all, if there is little coolingdemand, there is little incentive to improve its efficiency.
Lastly, economic development generally leads to more electricappliances operated indoors. Therefore internal heat gains areexpected to increase with economic development. These heat gains
lead to downward shift in the threshold temperature, due toa decrease of heating demand and an increase in cooling demand.
Thus, economic development may be expected to lead to anincreasing cooling demand, a possible decrease of heating demandand a downward shift of the threshold temperature. As we haveseen from our modeling results, these changes of the TDP all lead tounderestimation of future energy demand in models that do notaccurately incorporate them.
Scenarios 5 and 6 diverge from the general form of degree daysbased models; either one of them adds an additional parameter tothe model, which makes the model slightly more complex, butallows better incorporation of the developments described inSection 2. Scenario 5 adds the idea of continuous temperaturedemand. Its’ results show that the additional continuous tempera-ture dependent demand parameter g behaves similarly as changingheating demand and cooling demand simultaneously. Because ofthis double effect, relatively small changes in continuous tempera-ture dependent demand may have a relatively large impact on theeffects of climate change on energy demand. Current models basedon the degree days approach neglect this continuous temperaturedependent demand, although they could incorporate it by esti-mating its effect on the modeled heating and cooling demands.
Scenario 6 splits the threshold temperature parameters intoseparate parameters for heating and cooling, so that the tempera-ture ranges for heating and cooling demands may vary indepen-dently. This allows modeling the behavioral changes that influencethe comfort zone depicted in Fig. 1, such as e.g. a societal trend todress lightly in winter or to overdress in summer, which could leadto a higher threshold temperature for heating and a lower thresholdtemperature for cooling. The scenario shows that a decreasingcomfort zone can influence the expected effect of climate change onenergy demand. However, since most current studies do not includesuch a comfort zone, they cannot model such trends.
The results further show that changing the parameters thatinfluence heating demand results in larger differences in relativelycool climates whereas changing the parameters that influencecooling demand results in larger differences in relatively warmclimates. This finding can be explained by the relative shares ofheating or cooling demand in cold or warm climates respectively;e.g. the effect of an increased importance of cooling demand will berelatively limited in a relatively cold climate, since on most daysthere is no cooling demand anyway. In a relatively warm climatehowever, the effect of such a change would be much morepronounced.
7.2. General discussion
Summarizing, the results from the linear model point to theimportance of a correct representation of the future TDP whenmodeling the future energy demand resulting from climate change.A misrepresentation of the TDP may result in a misrepresentationof the projected effects. We argue that socio-economic dynamicsmay systematically alter the TDP in such a way that the results ofstudies not including such dynamics may underestimate theprojected future energy demand resulting from climate change.
Therefore, we propose that future energy demand modelsshould consider dynamically modeling each of the parameters a, b,g, TbH and TbC, because our model results show that variation ineach of these parameters may influence the model results. Variousstudies already include some dynamics in temperature dependenceof heating and cooling demands. E.g. Isaac and Van Vuuren [3]dynamically model various indicators that influence the energydemand per degree day for heating and cooling, such as floor spacearea, heating and cooling efficiencies and penetration rate of airconditioning. These indicators are supposed to vary with GNP,

M. Hekkenberg et al. / Energy 34 (2009) 1797–1806 1805
climate pattern and in time. Energy demand per degree daycorresponds to the temperature dependence parameters a andb used in this article. Belzer et al. [25] include a changing a, b,TbH and TbC in their model of the commercial sector in US. Unfor-tunately, this approach is highly data intensive, which makesextending it to the global scale virtually impossible. Moreover, it isbased on regression analysis, which cannot adequately project thefuture. We suggest that a viable combination should be developed,in which the parameters that are modeled bottom up by Belzeret al. are based on top down indicators as in Isaac and Van Vuuren.Since Isaac and Van Vuuren have already incorporated dynamics ina and b, we believe only limited additional adaptation would berequired. Until the bottom up parameters are effectively linked totop down indicators, one could still estimate the key parameters indynamic models from regression, but try to estimate in which wayfuture societal development may influence them. Such estimationand an accompanying error-analysis may at least provide insight inpossible errors resulting from socio-economic change.
Furthermore, we propose that future energy demand modelsshould not convert temperature to degree days. We believe that suchconversion is not necessary to describe a functional relation betweenoutdoor temperature and energy demand and unnecessarily limitsmodeling the dynamics because of the described limitations of thedegree days concept. Instead, this relation could be described directlyfrom meteorological data, which enables varying the thresholdtemperatures TbH and TbC. Additionally, modeling temperaturedependent energy demand without the degree days’ concepts enablesthe inclusion of continuous temperature dependent demand, bydynamically modeling g. Modeling the threshold temperature varia-tion, as well as the variation of the other parameters, requires furtherresearch to assess their relation with top down indicators such astechnological development, GNP and climate zone, which in turn mayinfluence effective space conditioned area, level of insulation, humancomfort patterns, etc.
Our results are relevant for both warm and moderate climates.The largest socio-economic developments are expected in regionswith a warm climate. Static modeling of the TDP in these regionsmay therefore lead to the largest errors. Moreover, our resultssuggest that global developments may lead to a shifting balanceclimate. Since such a shift may mean the difference between anexpected decrease or increase in energy demand as a result ofglobal warming, the results are also relevant for regions that arecurrently at or near the balance climate.
Furthermore, our analysis of the socio-economic dynamics of theTDP points towards an expected increasing importance of coolingdemand throughout the world although we have not numericallyanalyzed this. Rapid developments will enable the increasedapplication of cooling for space conditioning and food security inwarm but currently poor regions. The increasing number of electricappliances producing indoor heat and the possible occurrence ofheat waves in further developing rich countries in moderateclimates may also lead to an increasing use of cooling applications inthese regions, especially with expected climate change in mind.
The effects of such socio-economic developments on totalregional or global energy demand probably are much larger than theeffects of climate change as such. However, given the challenge ofkeeping global energy demand within its greenhouse limits, anyadditional percentage of demand may be relevant. Given theexpected large increase in cooling demand globally and the generallylong lifetime of buildings, efforts to analyze expected heating andcooling demands are essential for projecting the building construc-tions required to meet this growing demand with optimal energyefficiency. Moreover energy efficiency improvements of cooling aswell as heating appliances may reduce the existing as well futureexpected energy demand.
7.3. Methodological discussion of the model
Our scenarios aim to show the effects on energy demand ofchanges in the TDP due to possible socio-economic developmentsin order to make modelers aware of the deficits of currently usedmethodologies. Preferably, data on the actual effects on TDP of suchstructural changes should have been used. However, no studies thatnumerically link changing TDPs to structural changes are known tothe authors. Therefore, the model uses hypothetical, relative TDPsto investigate the effects of possible socio-economic changes. Therelative TDPs we have modeled may not represent any existingTDP. Still, relative TDPs may take many different shapes in differentregions; the slopes of the various types of temperature dependentdemand depend on the relative contribution of temperaturedependent applications to the total energy demand. Changes in theslopes of the TDPs therefore occur from relative volume changes.The values for a, b, g, TbH and TbC may vary considerably betweencountries with different socio-economic structures in differentworld regions. The values used for a and b in the scenarios havebeen chosen to represent a conceivable range around the observedslopes in the graphs of Valor et al. [10]. The values used for g, TbH
and TbC also represent realistically the ranges we may expect to findin various socio-economic systems. Thus we believe that the usedset of TDP estimations is sufficiently extended for the statedpurpose of methodological discussion. Further research shouldinvestigate the actual numerical relation between the parametersand the socio-economic system in order to enable actual futureenergy demand forecasts.
Various studies suggest that besides temperature, weathervariables such as relative humidity and wind speed may alsoinfluence energy demand and in turn may also be influenced byclimate change. However, in order not to burden the model and thediscussion, our model considers only temperature.
Any simplification to model the TDP may impose restrictions uponthe pattern’s characteristics and the model’s ability to include possiblesocio-economic developments. Other approaches that correlatedemand variation with temperature variation try to capture theu-shaped relation in non-linear functions [9,13]. These approaches aresaid to better fit the energy demand projection to observed demand,and may thus perform better in present energy demand forecasts.Bottom up analysis also suggests that heating and cooling demandsmay principally be non-linearly related to outdoor temperature[14,23]. Principally, non-linear patterns could also be used in longterm demand forecasts, however, no such attempt is currently knownto the authors. Moreover, such approaches do not automaticallygenerate better possibilities to include socio-economic developmentsthan the simpler linear approach does. Therefore we restricted ourassessment to linear dependencies.
In the TDPs resulting from our model, energy demand increasesunlimitedly at the extreme ends of the temperature spectrum.Actual socio-economic systems will be limited by physical bound-aries. In reality energy demand may level off towards the extremeends of the temperature spectrum. Since most systems are expec-ted to be adapted to their specific climate pattern, such occurrencesmay be rare and thus have only limited influence on total energydemand. Therefore, we believe our unlimited model approachadequately captures total energy demand.
Lastly, our model aggregates annual energy demand for heatingand cooling. In reality heating and cooling demands are often metby different energy carriers, e.g. natural gas and electricity.A decreasing heating demand and an increasing cooling demand asa result of climate change therefore influences the relative shares ofthese energy carriers. Moreover, climate change may change thetemporal distribution of demand throughout the year, includingpeak demand. Our model does not address any one of these issues.
M. Hekkenberg et al. / Energy 34 (2009) 1797–18061806
8. Conclusion
This study has investigated the possible effect of socio-economicchanges on the TDP of present and future energy demands in thecontext of climate change in order to improve future energydemand models. First we have analyzed the temperature depen-dence of heating and cooling demands. We investigated the inter-action between the socio-economic structure and the TDP ofenergy demand. We concluded that socio-economic changes mayalter the TDP in various ways.
Next we have analyzed how current studies approach thesedynamics in socio-economic structure. We found that most studiesmisrepresent the possible dynamics in their models to assess theeffect of climate change on future energy demand, although somestudies do include some dynamics. The misrepresentation stemspartly from simply neglecting the possible dynamics altogether andpartly from using degree days as a basis for long term demandforecasting, which unnecessarily restricts variation in some keyparameters that determine the TDP.
Finally, we have assessed the consequences of these misrepresen-tations in an energy demand model based on temperature dependenceand climate scenarios. We argue that generally, future socio-economicdevelopments may be expected to result in increasing coolingdemand, possibly decreasing heating demand and a downward shift ofthreshold temperatures. Our model results indicate that suchdynamics lead to an underestimation of future energy demand inmodels that misrepresent them. We therefore conclude that futureenergy demand models should incorporate socio-economic dynamics.We propose dynamically modeling several key parameters that arelacking in currently existing approaches, such as threshold tempera-ture and continuous temperature dependent demand, and using directmeteorological data instead of degree days. However, future researchshould clarify the relations between socio-economic developmentsand these parameters to implement them successfully.
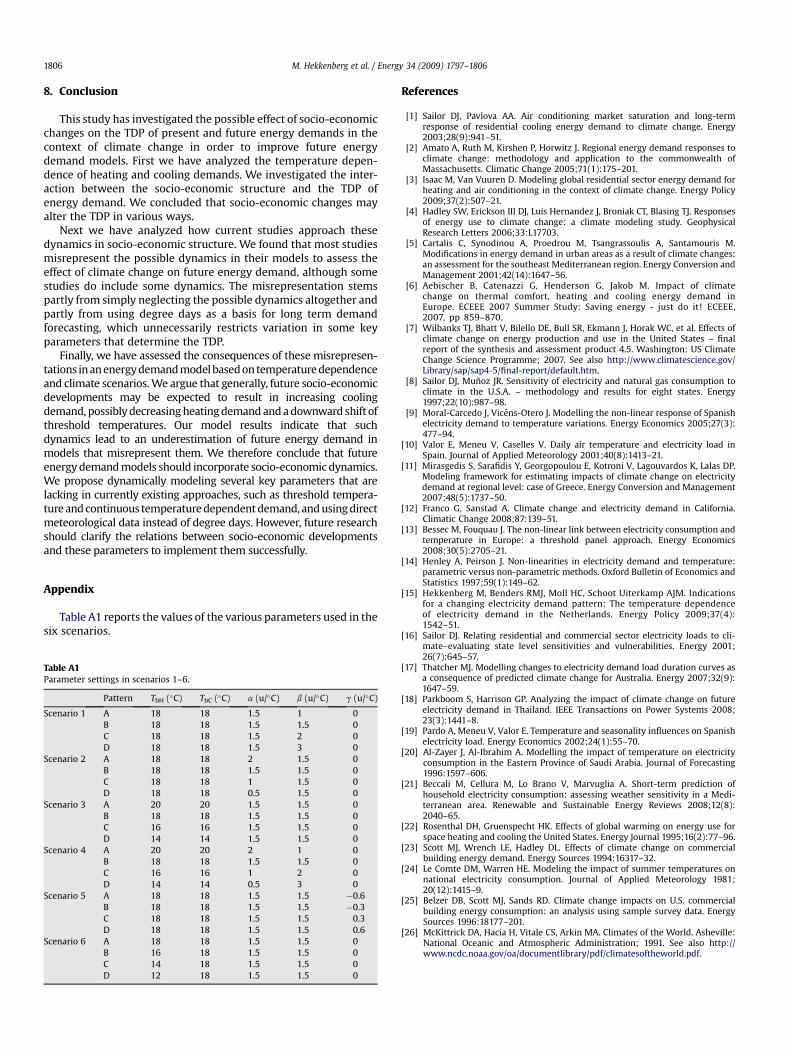
Appendix
Table A1 reports the values of the various parameters used in thesix scenarios.
Table A1Parameter settings in scenarios 1–6.
Pattern TbH (�C) TbC (�C) a (u/�C) b (u/�C) g (u/�C)
Scenario 1 A 18 18 1.5 1 0B 18 18 1.5 1.5 0C 18 18 1.5 2 0D 18 18 1.5 3 0
Scenario 2 A 18 18 2 1.5 0B 18 18 1.5 1.5 0C 18 18 1 1.5 0D 18 18 0.5 1.5 0
Scenario 3 A 20 20 1.5 1.5 0B 18 18 1.5 1.5 0C 16 16 1.5 1.5 0D 14 14 1.5 1.5 0
Scenario 4 A 20 20 2 1 0B 18 18 1.5 1.5 0C 16 16 1 2 0D 14 14 0.5 3 0
Scenario 5 A 18 18 1.5 1.5 �0.6B 18 18 1.5 1.5 �0.3C 18 18 1.5 1.5 0.3D 18 18 1.5 1.5 0.6
Scenario 6 A 18 18 1.5 1.5 0B 16 18 1.5 1.5 0C 14 18 1.5 1.5 0D 12 18 1.5 1.5 0
References
[1] Sailor DJ, Pavlova AA. Air conditioning market saturation and long-termresponse of residential cooling energy demand to climate change. Energy2003;28(9):941–51.
[2] Amato A, Ruth M, Kirshen P, Horwitz J. Regional energy demand responses toclimate change: methodology and application to the commonwealth ofMassachusetts. Climatic Change 2005;71(1):175–201.
[3] Isaac M, Van Vuuren D. Modeling global residential sector energy demand forheating and air conditioning in the context of climate change. Energy Policy2009;37(2):507–21.
[4] Hadley SW, Erickson III DJ, Luis Hernandez J, Broniak CT, Blasing TJ. Responsesof energy use to climate change: a climate modeling study. GeophysicalResearch Letters 2006;33:L17703.
[5] Cartalis C, Synodinou A, Proedrou M, Tsangrassoulis A, Santamouris M.Modifications in energy demand in urban areas as a result of climate changes:an assessment for the southeast Mediterranean region. Energy Conversion andManagement 2001;42(14):1647–56.
[6] Aebischer B, Catenazzi G, Henderson G, Jakob M. Impact of climatechange on thermal comfort, heating and cooling energy demand inEurope. ECEEE 2007 Summer Study: Saving energy - just do it! ECEEE,2007, pp 859–870.
[7] Wilbanks TJ, Bhatt V, Bilello DE, Bull SR, Ekmann J, Horak WC, et al. Effects ofclimate change on energy production and use in the United States – finalreport of the synthesis and assessment product 4.5. Washington: US ClimateChange Science Programme; 2007. See also http://www.climatescience.gov/Library/sap/sap4-5/final-report/default.htm.
[8] Sailor DJ, Munoz JR. Sensitivity of electricity and natural gas consumption toclimate in the U.S.A. – methodology and results for eight states. Energy1997;22(10):987–98.
[9] Moral-Carcedo J, Vicens-Otero J. Modelling the non-linear response of Spanishelectricity demand to temperature variations. Energy Economics 2005;27(3):477–94.
[10] Valor E, Meneu V, Caselles V. Daily air temperature and electricity load inSpain. Journal of Applied Meteorology 2001;40(8):1413–21.
[11] Mirasgedis S, Sarafidis Y, Georgopoulou E, Kotroni V, Lagouvardos K, Lalas DP.Modeling framework for estimating impacts of climate change on electricitydemand at regional level: case of Greece. Energy Conversion and Management2007;48(5):1737–50.
[12] Franco G, Sanstad A. Climate change and electricity demand in California.Climatic Change 2008;87:139–51.
[13] Bessec M, Fouquau J. The non-linear link between electricity consumption andtemperature in Europe: a threshold panel approach. Energy Economics2008;30(5):2705–21.
[14] Henley A, Peirson J. Non-linearities in electricity demand and temperature:parametric versus non-parametric methods. Oxford Bulletin of Economics andStatistics 1997;59(1):149–62.
[15] Hekkenberg M, Benders RMJ, Moll HC, Schoot Uiterkamp AJM. Indicationsfor a changing electricity demand pattern: The temperature dependenceof electricity demand in the Netherlands. Energy Policy 2009;37(4):1542–51.
[16] Sailor DJ. Relating residential and commercial sector electricity loads to cli-mate–evaluating state level sensitivities and vulnerabilities. Energy 2001;26(7):645–57.
[17] Thatcher MJ. Modelling changes to electricity demand load duration curves asa consequence of predicted climate change for Australia. Energy 2007;32(9):1647–59.
[18] Parkboom S, Harrison GP. Analyzing the impact of climate change on futureelectricity demand in Thailand. IEEE Transactions on Power Systems 2008;23(3):1441–8.
[19] Pardo A, Meneu V, Valor E. Temperature and seasonality influences on Spanishelectricity load. Energy Economics 2002;24(1):55–70.
[20] Al-Zayer J, Al-Ibrahim A. Modelling the impact of temperature on electricityconsumption in the Eastern Province of Saudi Arabia. Journal of Forecasting1996:1597–606.
[21] Beccali M, Cellura M, Lo Brano V, Marvuglia A. Short-term prediction ofhousehold electricity consumption: assessing weather sensitivity in a Medi-terranean area. Renewable and Sustainable Energy Reviews 2008;12(8):2040–65.
[22] Rosenthal DH, Gruenspecht HK. Effects of global warming on energy use forspace heating and cooling the United States. Energy Journal 1995;16(2):77–96.
[23] Scott MJ, Wrench LE, Hadley DL. Effects of climate change on commercialbuilding energy demand. Energy Sources 1994:16317–32.
[24] Le Comte DM, Warren HE. Modeling the impact of summer temperatures onnational electricity consumption. Journal of Applied Meteorology 1981;20(12):1415–9.
[25] Belzer DB, Scott MJ, Sands RD. Climate change impacts on U.S. commercialbuilding energy consumption: an analysis using sample survey data. EnergySources 1996:18177–201.
[26] McKittrick DA, Hacia H, Vitale CS, Arkin MA. Climates of the World. Asheville:National Oceanic and Atmospheric Administration; 1991. See also http://www.ncdc.noaa.gov/oa/documentlibrary/pdf/climatesoftheworld.pdf.