Dynamic regulation of 5-hydroxymethylcytosine in mouse ES cells and during differentiation
29
Reports / http://www.sciencemag.org/content/early/recent / 26 April 2012 /Page 1/ 10.1126/science.1220671 5-Methylcytosine (5mC) is an epigenetic DNA mark that plays im- portant roles in gene silencing and genome stability, and is found en- riched at CpG dinucleotides (1). In metazoa, 5mC can be oxidised to 5- hydroxymethylcytosine (5hmC) by the ten-eleven translocation (TET) enzyme-family (2, 3). 5hmC may be an intermediate in active DNA demethylation but could also constitute an epigenetic mark per se (4). Levels of 5hmC in genomic DNA can be quantified by analytical meth- ods (2, 5, 6) and mapped by enrichment of 5hmC-containing DNA frag- ments that are then sequenced (7–13). Such approaches have relatively poor resolution and give only relative quantitative information. Single nucleotide sequencing of 5mC has been performed using bisulfite se- quencing (BS-Seq), but this method cannot discriminate 5mC from 5hmC (14, 15). Single molecule real time sequencing (SMRT) can detect derivatised 5hmC in genomic DNA (16). However, enrichment of 5hmC-containing DNA fragments is required, which causes loss of quantitative information (16). Furthermore, SMRT has a relatively high rate of sequencing errors (17) and the peak calling of modifications is imprecise (16). Protein and solid-state nanopores can resolve 5mC from 5hmC and have the potential to sequence unamplified DNA (18, 19). We observed the decarbonylation and deamination of 5- formylcytosine (5fC) to uracil (U) under bisulfite conditions that would leave 5mC unchanged (Fig. 1A and SOM text). Thus 5hmC sequencing would be possible if 5hmC could be selectively oxidised to 5fC and then converted to U in a two step procedure (Fig. 1B). While BS-Seq leads to both 5mC and 5hmC being detected as Cs, this ‘oxidative bisulfite’ se- quencing (oxBS-Seq) approach would yield Cs only at 5mC sites and therefore allow us to determine the amount of 5hmC at a particular nu- cleotide position by subtraction of this readout from a BS-Seq one (Fig. 1C). Specific oxidation of 5hmC to 5fC (table S1) was achieved with potassi- um perruthenate (KRuO 4 ). In our reactivity studies on a synthetic 15mer single stranded DNA (ssDNA) con- taining 5hmC we established condi- tions under which KRuO 4 reacted specifically with the primary alcohol of 5hmC (Fig. 2A). 15mer ssDNA that contained C or 5mC did not show any base-specific reactions with KRuO 4 (fig. S1, A and B). For 5hmC in DNA we only observed the aldehyde (5fC) and not the carboxylic acid (20), even with a moderate excess of oxidant. The KRuO 4 oxidation can oxidize 5hmC in samples presented as double stranded DNA (dsDNA), with an ini- tial denaturing step before addition of the oxidant; this results in a quantita- tive conversion of 5hmC to 5fC (Fig. 2B). To test the efficiency and selectiv- ity of the oxidative bisulfite method, three synthetic dsDNAs containing either C, 5mC or 5hmC were each oxidised with KRuO 4 and then sub- jected to a conventional bisulfite con- version protocol. Sanger sequencing revealed that 5mC residues did not convert to U, whereas both C and 5hmC residues did convert to U (fig. S2). As Sanger sequencing is not quantitative, to gain a more accurate measure of the efficiency of trans forming 5hmC to U, Illumina sequencing was carried out on the synthet- ic DNA containing 5hmC (122mer) after oxidative bisulfite treatment. Fig. 1. A method for single-base resolution sequencing of 5hmC. (A) Reaction of 2’-deoxy-5-formylcytidine (d5fC) with NaHSO3 (bisulfite) quenched by NaOH at different time points then analyzed by high performance liquid chromatography (HPLC). Data are mean ± SD of 3 replicates. (B) Oxidative bisulfite reaction scheme: oxidation of 5hmC to 5fC followed by bisulfite treatment and NaOH to convert 5fC to U. The R group is DNA. (C) Diagram and table outlining the BS-Seq and oxBS-Seq techniques. Quantitative Sequencing of 5-Methyl- cytosine and 5-Hydroxymethylcytosine at Single-Base Resolution Michael J. Booth, 1 * Miguel R. Branco, 2,3 * Gabriella Ficz, 2 David Oxley, 4 Felix Krueger, 5 Wolf Reik, 2,3 † Shankar Balasubramanian 1,6,7 † 1 Department of Chemistry, University of Cambridge, Cambridge CB2 1EW, UK. 2 Epigenetics Programme, The Babraham Institute, Cambridge CB22 3AT, UK. 3 Centre for Trophoblast Research, University of Cambridge, Cambridge CB2 3EG, UK. 4 Proteomics Research Group, The Babraham Institute, Cambridge CB22 3AT, UK. 5 Bioinformatics Group, The Babraham Institute, Cambridge CB22 3AT, UK. 6 School of Clinical Medicine, The University of Cambridge, Cambridge CB2 0SP, UK. 7 Cancer Research UK, Cambridge Research Institute, Li Ka Shing Centre, Cambridge CB2 0RE, UK. *These authors contributed equally to this work. †To whom correspondence should be addressed. E-mail: [email protected] (W.R.); [email protected] (S.B.) 5-Methylcytosine can be converted to 5-hydroxymethylcytosine (5hmC) in mammalian DNA by the TET enzymes. We introduce oxidative bisulfite sequencing (oxBS-Seq), the first method for quantitative mapping of 5hmC in genomic DNA at single nucleotide resolution. Selective chemical oxidation of 5hmC to 5- formylcytosine (5fC) enables bisulfite conversion of 5fC to uracil. We demonstrate the utility of oxBS-Seq to map and quantify 5hmC at CpG islands (CGIs) in mouse embryonic stem (ES) cells and identify 800 5hmC-containing CGIs that have on average 3.3% hydroxymethylation. Notably, high levels of 5hmC were found in CGIs associated with transcriptional regulators and in LINE1 elements, suggesting that these regions might undergo epigenetic reprogramming in ES cells. Our results open new questions on 5hmC dynamics and sequence-specific targeting by TETs. on April 27, 2012 www.sciencemag.org Downloaded from
-
Upload
independent -
Category
Documents
-
view
4 -
download
0
Transcript of Dynamic regulation of 5-hydroxymethylcytosine in mouse ES cells and during differentiation
Reports
/ http://www.sciencemag.org/content/early/recent / 26 April 2012 /Page 1/ 10.1126/science.1220671
5-Methylcytosine (5mC) is an epigenetic DNA mark that plays im-portant roles in gene silencing and genome stability, and is found en-riched at CpG dinucleotides (1). In metazoa, 5mC can be oxidised to 5-hydroxymethylcytosine (5hmC) by the ten-eleven translocation (TET) enzyme-family (2, 3). 5hmC may be an intermediate in active DNA demethylation but could also constitute an epigenetic mark per se (4). Levels of 5hmC in genomic DNA can be quantified by analytical meth-ods (2, 5, 6) and mapped by enrichment of 5hmC-containing DNA frag-ments that are then sequenced (7–13). Such approaches have relatively poor resolution and give only relative quantitative information. Single nucleotide sequencing of 5mC has been performed using bisulfite se-quencing (BS-Seq), but this method cannot discriminate 5mC from 5hmC (14, 15). Single molecule real time sequencing (SMRT) can detect derivatised 5hmC in genomic DNA (16). However, enrichment of 5hmC-containing DNA fragments is required, which causes loss of quantitative information (16). Furthermore, SMRT has a relatively high rate of sequencing errors (17) and the peak calling of modifications is imprecise (16). Protein and solid-state nanopores can resolve 5mC from 5hmC and have the potential to sequence unamplified DNA (18, 19).
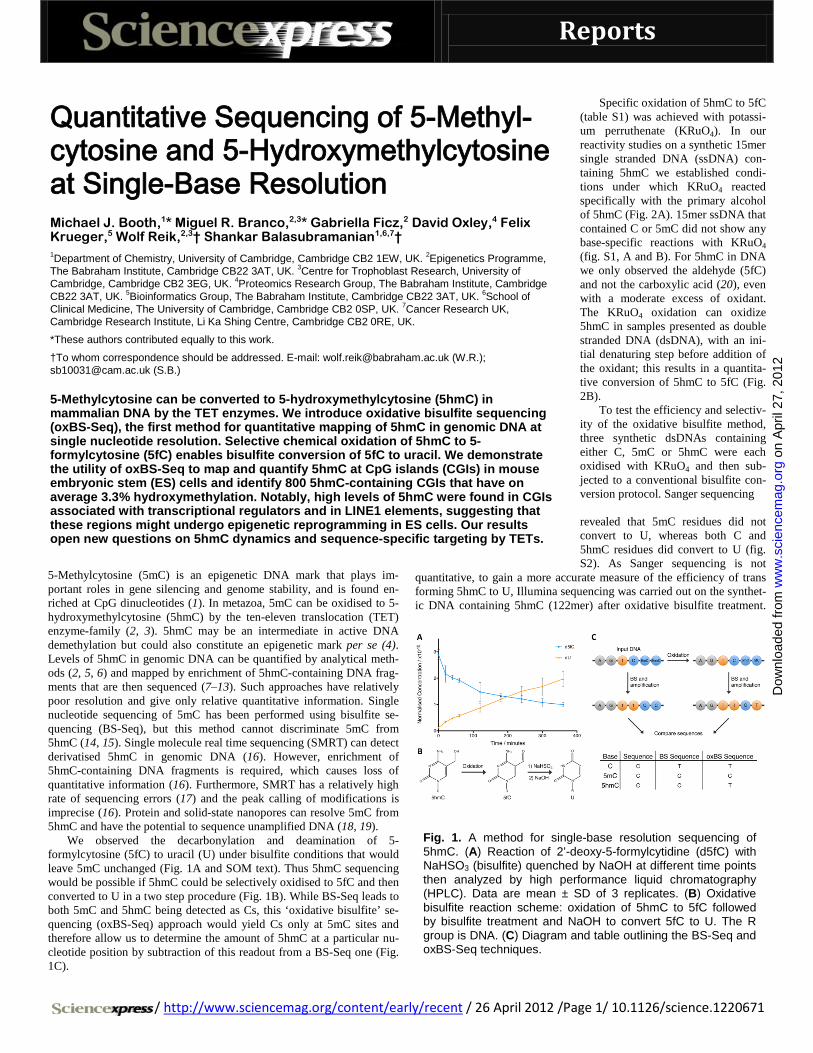
We observed the decarbonylation and deamination of 5-formylcytosine (5fC) to uracil (U) under bisulfite conditions that would leave 5mC unchanged (Fig. 1A and SOM text). Thus 5hmC sequencing would be possible if 5hmC could be selectively oxidised to 5fC and then converted to U in a two step procedure (Fig. 1B). While BS-Seq leads to both 5mC and 5hmC being detected as Cs, this ‘oxidative bisulfite’ se-quencing (oxBS-Seq) approach would yield Cs only at 5mC sites and therefore allow us to determine the amount of 5hmC at a particular nu-cleotide position by subtraction of this readout from a BS-Seq one (Fig. 1C).
Specific oxidation of 5hmC to 5fC (table S1) was achieved with potassi-um perruthenate (KRuO4). In our reactivity studies on a synthetic 15mer single stranded DNA (ssDNA) con-taining 5hmC we established condi-tions under which KRuO4 reacted specifically with the primary alcohol of 5hmC (Fig. 2A). 15mer ssDNA that contained C or 5mC did not show any base-specific reactions with KRuO4 (fig. S1, A and B). For 5hmC in DNA we only observed the aldehyde (5fC) and not the carboxylic acid (20), even with a moderate excess of oxidant. The KRuO4 oxidation can oxidize 5hmC in samples presented as double stranded DNA (dsDNA), with an ini-tial denaturing step before addition of the oxidant; this results in a quantita-tive conversion of 5hmC to 5fC (Fig. 2B).
To test the efficiency and selectiv-ity of the oxidative bisulfite method, three synthetic dsDNAs containing either C, 5mC or 5hmC were each oxidised with KRuO4 and then sub-jected to a conventional bisulfite con-version protocol. Sanger sequencing revealed that 5mC residues did not convert to U, whereas both C and 5hmC residues did convert to U (fig. S2). As Sanger sequencing is not
quantitative, to gain a more accurate measure of the efficiency of trans forming 5hmC to U, Illumina sequencing was carried out on the synthet-ic DNA containing 5hmC (122mer) after oxidative bisulfite treatment.
Fig. 1. A method for single-base resolution sequencing of 5hmC. (A) Reaction of 2’-deoxy-5-formylcytidine (d5fC) with NaHSO3 (bisulfite) quenched by NaOH at different time points then analyzed by high performance liquid chromatography (HPLC). Data are mean ± SD of 3 replicates. (B) Oxidative bisulfite reaction scheme: oxidation of 5hmC to 5fC followed by bisulfite treatment and NaOH to convert 5fC to U. The R group is DNA. (C) Diagram and table outlining the BS-Seq and oxBS-Seq techniques.
Quantitative Sequencing of 5-Methyl-cytosine and 5-Hydroxymethylcytosine at Single-Base Resolution Michael J. Booth,1* Miguel R. Branco,2,3* Gabriella Ficz,2 David Oxley,4 Felix Krueger,5 Wolf Reik,2,3† Shankar Balasubramanian1,6,7† 1Department of Chemistry, University of Cambridge, Cambridge CB2 1EW, UK. 2Epigenetics Programme, The Babraham Institute, Cambridge CB22 3AT, UK. 3Centre for Trophoblast Research, University of Cambridge, Cambridge CB2 3EG, UK. 4Proteomics Research Group, The Babraham Institute, Cambridge CB22 3AT, UK. 5Bioinformatics Group, The Babraham Institute, Cambridge CB22 3AT, UK. 6School of Clinical Medicine, The University of Cambridge, Cambridge CB2 0SP, UK. 7Cancer Research UK, Cambridge Research Institute, Li Ka Shing Centre, Cambridge CB2 0RE, UK.
*These authors contributed equally to this work.
†To whom correspondence should be addressed. E-mail: [email protected] (W.R.); [email protected] (S.B.)
5-Methylcytosine can be converted to 5-hydroxymethylcytosine (5hmC) in mammalian DNA by the TET enzymes. We introduce oxidative bisulfite sequencing (oxBS-Seq), the first method for quantitative mapping of 5hmC in genomic DNA at single nucleotide resolution. Selective chemical oxidation of 5hmC to 5-formylcytosine (5fC) enables bisulfite conversion of 5fC to uracil. We demonstrate the utility of oxBS-Seq to map and quantify 5hmC at CpG islands (CGIs) in mouse embryonic stem (ES) cells and identify 800 5hmC-containing CGIs that have on average 3.3% hydroxymethylation. Notably, high levels of 5hmC were found in CGIs associated with transcriptional regulators and in LINE1 elements, suggesting that these regions might undergo epigenetic reprogramming in ES cells. Our results open new questions on 5hmC dynamics and sequence-specific targeting by TETs.
on
Apr
il 27
, 201
2w
ww
.sci
ence
mag
.org
Dow
nloa
ded
from

/ http://www.sciencemag.org/content/early/recent / 26 April 2012 /Page 2/ 10.1126/science.1220671
An overall 5hmC to U conversion level of 94.5% was observed (Fig. 2C and fig. S14). The oxidative bisulfite protocol was also applied to a syn-thetic dsDNA that contained multiple 5hmC residues (135mer) in a range of different contexts that showed a similarly high conversion effi-ciency (94.7%) of 5hmC to U (Fig. 2C and fig. S14). Finally, the KRuO4 oxidation was carried out on genomic DNA and showed a quantitative conversion of 5hmC to 5fC by mass spectrometry (Fig. 2D) with no significant degradation of C (fig. S1C). Thus the oxidative bisulfite pro-tocol specifically converts 5hmC to U in DNA, leaving C and 5mC un-changed, enabling quantitative, single nucleotide resolution sequencing on widely available platforms (oxBS-Seq).
We then used oxBS-Seq to quantitatively map 5hmC at high resolu-tion in the genomic DNA of mouse ES cells. We chose to combine oxi-dative bisulfite with reduced representation bisulfite sequencing (RRBS) (21), which allows deep, selective sequencing of a fraction of the ge-nome that is highly enriched for CpG islands (CGIs). We generated RRBS and oxRRBS datasets, achieving an average sequencing depth of ~120 reads per CpG, which when pooled yielded an average of ~3,300 methylation calls per CGI (fig. S3). After applying depth and breadth cutoffs (Materials and Methods), 55% (12,660) of all CGIs (22) were covered in our datasets.
To identify 5hmC-containing CGIs, we tested for differences be-tween the RRBS and oxRRBS datasets using stringent criteria, yielding a false discovery rate of 3.7% (supplementary materials, materials and methods). We identified 800 5hmC-containing CGIs, which had an aver-age of 3.3% (range 0.2-18.5%) CpG hydroxymethylation (Fig. 3, A and B). We also identified 4,577 5mC-containing CGIs averaging 8.1% CpG methylation (Fig. 3B). We carried out sequencing on an independent
biological duplicate sample of the same ES cell line but at a different passage number, which by mass spectrometry had reduced levels of 5hmC (0.10% versus 0.16% of all Cs) and consistently we found fewer 5hmC-containing CGIs (SOM text). 5hmC-containing CGIs present in both samples showed good quantitative reproducibility (fig. S5). In non-CpG contexts we found very few CGIs (n = 71) with levels of 5mC above the bisulfite conversion error (0.2%) (fig. S9) and no CGIs with significant levels of 5hmC.
Genes associated with 5mC-containing CGIs included Dazl, which is known to be methylated in ES cells (fig. S7) (23). Similarly, we found that Zfp64 and Ecat1 had significant levels of 5hmC (7). Genes with >5% 5hmC at transcription start site (TSS) CGIs were associated with gene ontology terms related to transcription factor activity, and in partic-ular were enriched in developmentally relevant genes encoding for Homeobox-containing proteins (e.g., Irx4, Gbx1, Hoxc4). To validate our method, we quantified 5hmC and 5mC levels at 21 CGIs containing MspI restriction sites by glucMS-qPCR (Fig. 3D) (24). We found a good correlation between the quantification by oxRRBS and glucMS-qPCR (r=0.86, p=5E-7 and r=0.52, p=0.01 for 5mC and 5hmC, respectively), showing that oxRRBS reliably measures 5hmC at individual CpGs. We also found a good correlation between oxRRBS and our previously pub-lished (h)MeDIP-Seq datasets (fig. S8) (7). Across CGIs both 5mC and 5hmC levels are inversely correlated with CpG density, and intragenic and intergenic CGIs contain significantly higher levels of either modification than those overlapping TSSs (Fig. 4, A and B, and fig. S6) (13, 22). TET1 is enriched at TSSs and thus a high turnover of 5mC and 5hmC that would keep the steady-state levels low
Fig. 3. Quantification of 5mC and 5hmC levels at CGIs by oxRRBS. (A) Fraction of unconverted cytosines per CGI; 5hmC-containing CGIs (red) have a statistically significant lower fraction in the oxRRBS dataset; a false discovery rate of 3.7% was estimated from the CGIs with the opposite pattern (black). (B) 5mC and 5hmC levels within CGIs with significant levels of the respective modification. (C) Examples of genomic RRBS and oxRRBS profiles overlapped with (h)MeDIP-Seq profiles (7). Green bars represent CGIs; data outside CGIs was masked (grey areas). Each bar in the oxRRBS tracks represents a single CpG (in either DNA strand). (D) 5mC and 5hmC levels at selected MspI sites were validated by glucMS-qPCR. OxRRBS data are percentage ± 95% CI. Mean glucMS-qPCR values are shown, with the black dots representing individual replicates.
Fig. 2. Quantification of 5hmC oxidation. (A) Levels of 5hmC and 5fC (normalised to T) in a 15mer ssDNA oligonucleotide before and after KRuO4 oxidation, measured by mass spectrometry. (B) Levels of 5hmC and 5fC (normalised to 5mC in primer sequence) in a 135mer dsDNA fragment before and after KRuO4 oxidation. (C) C to T conversion levels as determined by Illumina sequencing of two dsDNA fragments containing either a single 5hmCpG (122mer) or multiple 5hmCpGs (135mer) following oxidative bisulfite treatment. 5mC was also present in these strands. (D) Levels of 5hmC and 5fC (normalised to 5mC in primer sequence) in ES cell DNA measured before and after oxidation. Data are mean ± SD.
on
Apr
il 27
, 201
2w
ww
.sci
ence
mag
.org
Dow
nloa
ded
from
/ http://www.sciencemag.org/content/early/recent / 26 April 2012 /Page 3/ 10.1126/science.1220671
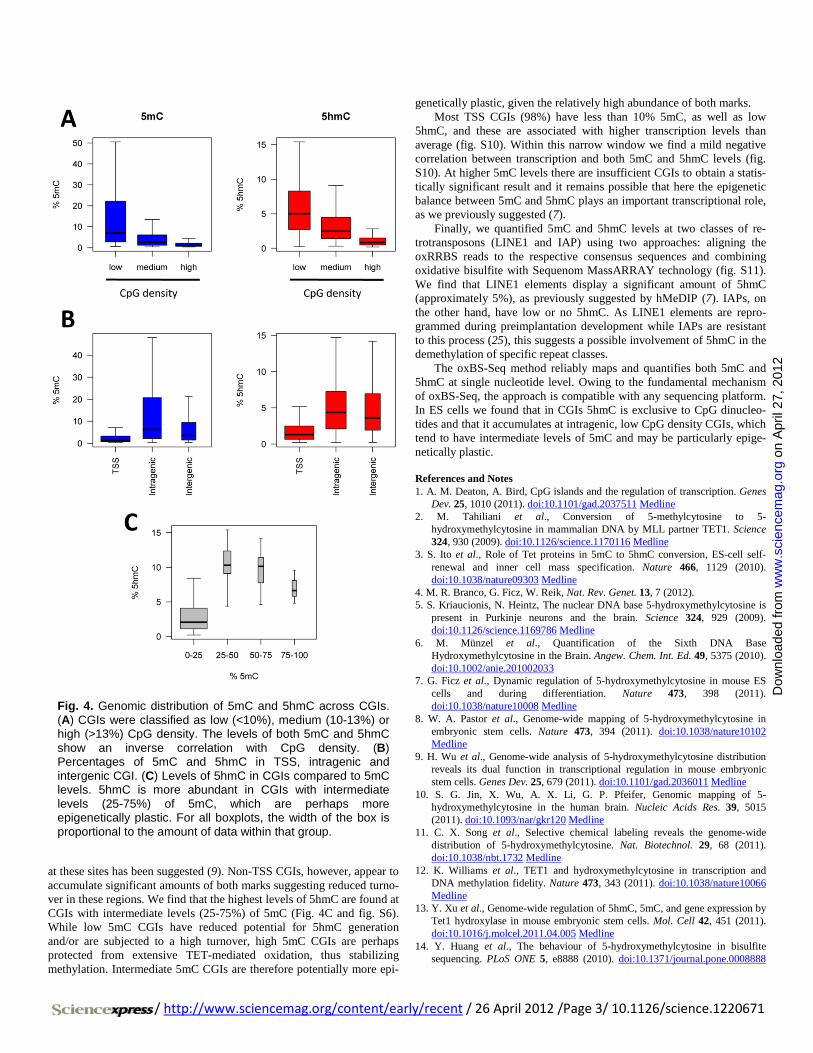
at these sites has been suggested (9). Non-TSS CGIs, however, appear to accumulate significant amounts of both marks suggesting reduced turno-ver in these regions. We find that the highest levels of 5hmC are found at CGIs with intermediate levels (25-75%) of 5mC (Fig. 4C and fig. S6). While low 5mC CGIs have reduced potential for 5hmC generation and/or are subjected to a high turnover, high 5mC CGIs are perhaps protected from extensive TET-mediated oxidation, thus stabilizing methylation. Intermediate 5mC CGIs are therefore potentially more epi-
genetically plastic, given the relatively high abundance of both marks. Most TSS CGIs (98%) have less than 10% 5mC, as well as low
5hmC, and these are associated with higher transcription levels than average (fig. S10). Within this narrow window we find a mild negative correlation between transcription and both 5mC and 5hmC levels (fig. S10). At higher 5mC levels there are insufficient CGIs to obtain a statis-tically significant result and it remains possible that here the epigenetic balance between 5mC and 5hmC plays an important transcriptional role, as we previously suggested (7).
Finally, we quantified 5mC and 5hmC levels at two classes of re-trotransposons (LINE1 and IAP) using two approaches: aligning the oxRRBS reads to the respective consensus sequences and combining oxidative bisulfite with Sequenom MassARRAY technology (fig. S11). We find that LINE1 elements display a significant amount of 5hmC (approximately 5%), as previously suggested by hMeDIP (7). IAPs, on the other hand, have low or no 5hmC. As LINE1 elements are repro-grammed during preimplantation development while IAPs are resistant to this process (25), this suggests a possible involvement of 5hmC in the demethylation of specific repeat classes.
The oxBS-Seq method reliably maps and quantifies both 5mC and 5hmC at single nucleotide level. Owing to the fundamental mechanism of oxBS-Seq, the approach is compatible with any sequencing platform. In ES cells we found that in CGIs 5hmC is exclusive to CpG dinucleo-tides and that it accumulates at intragenic, low CpG density CGIs, which tend to have intermediate levels of 5mC and may be particularly epige-netically plastic.
References and Notes 1. A. M. Deaton, A. Bird, CpG islands and the regulation of transcription. Genes
Dev. 25, 1010 (2011). doi:10.1101/gad.2037511 Medline 2. M. Tahiliani et al., Conversion of 5-methylcytosine to 5-
hydroxymethylcytosine in mammalian DNA by MLL partner TET1. Science 324, 930 (2009). doi:10.1126/science.1170116 Medline
3. S. Ito et al., Role of Tet proteins in 5mC to 5hmC conversion, ES-cell self-renewal and inner cell mass specification. Nature 466, 1129 (2010). doi:10.1038/nature09303 Medline
4. M. R. Branco, G. Ficz, W. Reik, Nat. Rev. Genet. 13, 7 (2012). 5. S. Kriaucionis, N. Heintz, The nuclear DNA base 5-hydroxymethylcytosine is
present in Purkinje neurons and the brain. Science 324, 929 (2009). doi:10.1126/science.1169786 Medline
6. M. Münzel et al., Quantification of the Sixth DNA Base Hydroxymethylcytosine in the Brain. Angew. Chem. Int. Ed. 49, 5375 (2010). doi:10.1002/anie.201002033
7. G. Ficz et al., Dynamic regulation of 5-hydroxymethylcytosine in mouse ES cells and during differentiation. Nature 473, 398 (2011). doi:10.1038/nature10008 Medline
8. W. A. Pastor et al., Genome-wide mapping of 5-hydroxymethylcytosine in embryonic stem cells. Nature 473, 394 (2011). doi:10.1038/nature10102 Medline
9. H. Wu et al., Genome-wide analysis of 5-hydroxymethylcytosine distribution reveals its dual function in transcriptional regulation in mouse embryonic stem cells. Genes Dev. 25, 679 (2011). doi:10.1101/gad.2036011 Medline
10. S. G. Jin, X. Wu, A. X. Li, G. P. Pfeifer, Genomic mapping of 5-hydroxymethylcytosine in the human brain. Nucleic Acids Res. 39, 5015 (2011). doi:10.1093/nar/gkr120 Medline
11. C. X. Song et al., Selective chemical labeling reveals the genome-wide distribution of 5-hydroxymethylcytosine. Nat. Biotechnol. 29, 68 (2011). doi:10.1038/nbt.1732 Medline
12. K. Williams et al., TET1 and hydroxymethylcytosine in transcription and DNA methylation fidelity. Nature 473, 343 (2011). doi:10.1038/nature10066 Medline
13. Y. Xu et al., Genome-wide regulation of 5hmC, 5mC, and gene expression by Tet1 hydroxylase in mouse embryonic stem cells. Mol. Cell 42, 451 (2011). doi:10.1016/j.molcel.2011.04.005 Medline
14. Y. Huang et al., The behaviour of 5-hydroxymethylcytosine in bisulfite sequencing. PLoS ONE 5, e8888 (2010). doi:10.1371/journal.pone.0008888
Fig. 4. Genomic distribution of 5mC and 5hmC across CGIs. (A) CGIs were classified as low (<10%), medium (10-13%) or high (>13%) CpG density. The levels of both 5mC and 5hmC show an inverse correlation with CpG density. (B) Percentages of 5mC and 5hmC in TSS, intragenic and intergenic CGI. (C) Levels of 5hmC in CGIs compared to 5mC levels. 5hmC is more abundant in CGIs with intermediate levels (25-75%) of 5mC, which are perhaps more epigenetically plastic. For all boxplots, the width of the box is proportional to the amount of data within that group.
on
Apr
il 27
, 201
2w
ww
.sci
ence
mag
.org
Dow
nloa
ded
from
/ http://www.sciencemag.org/content/early/recent / 26 April 2012 /Page 4/ 10.1126/science.1220671
Medline 15. C. Nestor, A. Ruzov, R. Meehan, D. Dunican, Enzymatic approaches and
bisulfite sequencing cannot distinguish between 5-methylcytosine and 5-hydroxymethylcytosine in DNA. Biotechniques 48, 317 (2010). doi:10.2144/000113403 Medline
16. C. X. Song et al., Sensitive and specific single-molecule sequencing of 5-hydroxymethylcytosine. Nat. Methods 8, 75 (2011). doi:10.1038/nmeth.1779
17. J. Eid et al., Real-time DNA sequencing from single polymerase molecules. Science 323, 133 (2009). doi:10.1126/science.1162986 Medline
18. E. V. Wallace et al., Identification of epigenetic DNA modifications with a protein nanopore. Chem. Commun. (Camb.) 46, 8195 (2010). doi:10.1039/c0cc02864a
19. M. Wanunu et al., Discrimination of Methylcytosine from Hydroxymethylcytosine in DNA Molecules. J. Am. Chem. Soc. 133, 486 (2010). doi:10.1021/ja107836t
20. G. Green, W. P. Griffith, D. M. Hollinshead, S. V. Ley, M. Schroder, J. Chem. Soc., Perkin Trans. 1 1, 681 (1984). doi:10.1039/p19840000681
21. A. Meissner et al., Genome-scale DNA methylation maps of pluripotent and differentiated cells. Nature 454, 766 (2008). Medline
22. R. S. Illingworth et al., Orphan CpG islands identify numerous conserved promoters in the mammalian genome. PLoS Genet. 6, e1001134 (2010). doi:10.1371/journal.pgen.1001134 Medline
23. J. Borgel et al., Targets and dynamics of promoter DNA methylation during early mouse development. Nat. Genet. 42, 1093 (2010). doi:10.1038/ng.708 Medline
24. S. M. Kinney et al., Tissue-specific distribution and dynamic changes of 5-hydroxymethylcytosine in mammalian genomes. J. Biol. Chem. 286, 24685 (2011). doi:10.1074/jbc.M110.217083 Medline
25. N. Lane et al., Resistance of IAPs to methylation reprogramming may provide a mechanism for epigenetic inheritance in the mouse. Genesis 35, 88 (2003). doi:10.1002/gene.10168 Medline
26. E. P. Quinlivan, J. F. Gregory, 3rd, DNA digestion to deoxyribonucleoside: a simplified one-step procedure. Anal. Biochem. 373, 383 (2008). doi:10.1016/j.ab.2007.09.031 Medline
27. H. Gu et al., Preparation of reduced representation bisulfite sequencing libraries for genome-scale DNA methylation profiling. Nat. Protoc. 6, 468 (2011). doi:10.1038/nprot.2010.190 Medline
28. F. Krueger, S. R. Andrews, C. S. Osborne, Large scale loss of data in low-diversity illumina sequencing libraries can be recovered by deferred cluster calling. PLoS ONE 6, e16607 (2011). doi:10.1371/journal.pone.0016607 Medline
29. F. Krueger, S. R. Andrews, Bismark: a flexible aligner and methylation caller for Bisulfite-Seq applications. Bioinformatics 27, 1571 (2011). doi:10.1093/bioinformatics/btr167 Medline
30. S. A. Schichman, N. B. Adey, M. H. Edgell, C. A. Hutchison, 3rd, L1 A-monomer tandem arrays have expanded during the course of mouse L1 evolution. Mol. Biol. Evol. 10, 552 (1993). Medline
31. J. L. Goodier, E. M. Ostertag, K. Du, H. H. Kazazian, Jr., A novel active L1 retrotransposon subfamily in the mouse. Genome Res. 11, 1677 (2001). doi:10.1101/gr.198301 Medline
32. Y. Zhang et al., Model-based analysis of ChIP-Seq (MACS). Genome Biol. 9, R137 (2008). doi:10.1186/gb-2008-9-9-r137 Medline
33. T. J. Johnson, R. A. Jones, The chemistry of terpenes—VIII Characterisation of the bisulphite adducts of α,β-unsaturated aldehydes by NMR spectroscopy. Tetrahedron 34, 547 (1978). doi:10.1016/0040-4020(78)80050-7
34. C. Fehr, A. K. Buzas, O. Knopff, J. Y. de Saint Laumer, (+)-(R,Z)-5-Muscenone and (-)-(R)-muscone by enantioselective aldol reaction and Grob fragmentation. Chemistry 16, 2487 (2010). doi:10.1002/chem.200902774 Medline
35. T. Pfaffeneder et al., The discovery of 5-formylcytosine in embryonic stem cell DNA. Angew. Chem. Int. Ed. Engl. 50, 7008 (2011). doi:10.1002/anie.201103899 Medline
36. S. Ito et al., Tet proteins can convert 5-methylcytosine to 5-formylcytosine and 5-carboxylcytosine. Science 333, 1300 (2011). doi:10.1126/science.1210597 Medline
37. Y. F. He et al., Tet-mediated formation of 5-carboxylcytosine and its excision by TDG in mammalian DNA. Science 333, 1303 (2011). doi:10.1126/science.1210944 Medline
38. A. Meissner et al., Genome-scale DNA methylation maps of pluripotent and
differentiated cells. Nature 454, 766 (2008). Medline 39. M. B. Stadler et al., DNA-binding factors shape the mouse methylome at
distal regulatory regions. Nature 480, 490 (2011). Medline 40. C. Qin et al., Intracisternal A particle genes: Distribution in the mouse
genome, active subtypes, and potential roles as species-specific mediators of susceptibility to cancer. Mol. Carcinog. 49, 54 (2010). doi:10.1002/mc.20576 Medline
Acknowledgments: We thank Tony Green and Raphaël Rodriguez for helpful discussions and Judith Webster for help with mass spectrometry. We thank the Biotechnology and Biological Sciences Research Council (BBSRC) for a studentship (MJB). The WR lab is supported by BBSRC, MRC, the Wellcome Trust, EU EpiGeneSys and BLUEPRINT. The SB lab is supported by core funding from Cancer Research UK. MJB and SB are inventors on a provisional application filed for a US patent on oxBS-Seq. OxRRBS data are deposited in the EMBL-EBI ArrayExpress Archive (http://www.ebi.ac.uk/arrayexpress) under the accession number E-MTAB-1042. Shankar Balasubramanian is an advisor to Illumina Inc.
Supplementary Materials www.sciencemag.org/cgi/content/full/science.[ms. no.]/DC1 Materials and Methods Supplementary Text Figs. S1 to S15 Tables S1 and S2 References (26–40)
16 February 2012; accepted 13 April 2012 Published online 26 April 2012 10.1126/science.1220671
on
Apr
il 27
, 201
2w
ww
.sci
ence
mag
.org
Dow
nloa
ded
from
www.sciencemag.org/cgi/content/full/science.1220671/DC1
Supplementary Material for
Quantitative Sequencing of 5-Methylcytosine and 5-Hydroxymethylcytosine at Single-Base Resolution
Michael J. Booth, Miguel R. Branco, Gabriella Ficz, David Oxley, Felix Krueger, Wolf Reik,* Shankar Balasubramanian*
*To whom correspondence should be addressed. E-mail: [email protected] (W.R.);
[email protected] (S.B.)
Published 26 April 2012 on Science Express DOI: 10.1126/science.1220671
This PDF file includes:
Materials and Methods
Supplementary Text
Figs. S1 to S15
Tables S1 and S2
References (26–40)
1
Materials and Methods Synthesis and bisulfite timecourse of modified nucleoside monomers d5hmCTP oxidation to d5fCTP and d5caCTP with MnO2 2.5 µL d5hmCTP (100 mM, Bioline) in 497.5 µL H2O with 51.6 mg (for d5fC) or 500 mg (for d5caC) MnO2 (Alpha Aeser) was shaken at 50 degrees for 2 h and 30 min. Then MnO2 was removed by filtration using Amicon Ultra 0.5 mL 10 kDa columns (Millipore) and the sample was lyophilized. The nucleotide triphosphate was resuspended (5 mM) and dephosphorylated with alkaline phosphatase (New England Biolabs) overnight at 37°C. BS timecourse with d5fC and d5caC nucleoside 9 µL d5fC or d5caC (5 mM), 0.5 µL dA (0.1 M, Roche) and 2.5 µL H2O were mixed and then 33 µL 4 M NaHSO3 (MP Biochemicals) was added. This was split into three 15 µL reactions and held at 50°C in the dark. 0.5 µL fractions were taken out at various time points and worked up in 2.5 µL H2O and 2 µL NaOH (1 M). After being held for at least 30 min at room temperature they were injected into the HPLC. Peak areas were measured at 260 nm, correlated to a calibration curve of d5fC, d5caC, dC or dU, and standardised to the level of dA in the chromatogram. DNA digestion and HPLC analysis DNA was digested as by a literature protocol (26), purified with Amicon Ultra 0.5 mL 10 kDa columns and analysed by HPLC using an Agilent 1100 HPLC with a flow of 1 mL/min over an Eclipse XDB-C18 3.5 µm, 3.0x150mm column. The column temperature was maintained at 45°C. Eluting buffers were buffer A (500 mM Ammonium Acetate (Fisher) pH 5), Buffer B (Acetonitrile) and Buffer C (H2O). Buffer A was held at 1% throughout the whole run and the gradient for the remaining buffers was 0 min – 0.5% B, 2 min – 1% B, 8 min – 4% B, 10 min – 95% B. The retention times of 2’-deoxynucleosides are as follows: 2’-deoxy-5-carboxycytidine (1.0 min), 2’-deoxycytidine (1.8 min), 2’-deoxy-5-hydroxymethylcytidine (2.1 min), 2’-deoxyuridine (2.7 min), 2’-deoxy-5-methylcytidine (4.0 min), 2’-deoxyguanosine (4.5 min), 2’-deoxy-5-formylcytidine (5.4 min), 2’-deoxythymidine (5.7 min), 2’-deoxyadeosine (7.4 min). Single and double stranded DNA sequences 15mer oligos (Table S2) were purchased from IBA containing either cytosine, 5-methylcytosine, or 5-hydroxymethylcytosine. 122mer and 135mer dsDNA template and primers (Table S2) were purchased from Biomers. All Cs in the primers are 5mC. The Cs at all other positions are either cytosine, 5mC or 5hmC and were added to the strand by PCR, using dCTP, d5mCTP (New England Biolabs) or d5hmCTP and DreamTaq Polymerase (Fermentas). DNA oxidations General oxidation DNA was made up to 24 µL with NaOH (0.05 M final concentration) on ice, then 1 μL of a KRuO4 (Alpha Aeser) solution (15 mM in 0.05 M NaOH) was added and the reaction was held on ice for 1 hour, with occasional vortexing. The reaction was purified with a mini quick spin oligo column (Roche) (after four 600 µL H2O washes).

2
ssDNA oxidation 1 µg of 15mer synthetic ssDNA was oxidised according to the general oxidation. Synthetic dsDNA double oxidation The dsDNA was precipitated with ethanol and then filtered through a mini quick spin oligo column (after four 600 uL H2O washes). A double oxidation was required for synthetic dsDNA as NaOH denaturation is not 100% efficient with a solution of a single homologous DNA fragment (unlike genomic DNA). 1 µg of DNA was denatured in 0.05 M NaOH (total volume 19 µL) for 30 min at 37°C. The reaction was then snap cooled on ice for 5 min. The reaction was then oxidised according to the general oxidation but with a total volume of 20 µL. This DNA was re-denatured in 0.05 M NaOH (total volume 24 µL) for 30 min at 37°C. The reaction was again snap cooled on ice for 5 min and oxidised according to the general oxidation. General oxidation for genomic DNA Genomic DNA (1 µg or less) was precipitated with ethanol prior to oxidation and then filtered through a mini quick spin oligo column (after four 600 µL H2O washes). DNA was denatured in 0.05 M NaOH (24 µL total volume) for 30 min at 37°C. This was then snap cooled on ice and left for 5 min and oxidised according to the general oxidation. Sanger and Illumina sequencing of oxidative bisulfite treated dsDNA For Sanger sequencing, 1 µg of 122mer DNA containing C, 5mC and 5hmC was oxidised according to the dsDNA double oxidation and bisulfite-treated using the Qiagen Epitect kit, according to the manufacturer’s instructions for FFPE samples, except that the thermal cycle was run twice over. These samples were then submitted to Sanger sequencing (Source BioScience). For Illumina sequencing, 1 µg of 122mer and 135mer DNA containing 5hmC was digested overnight with DraI (2 µL, New England Biolabs) and SspI (1 µL, New England Biolabs). The digested bands were gel purified with the Fermentas GeneJET gel extraction kit and methylated adaptors (Illumina) were ligated using the NEBNext DNA sample prep master mix set 1. After oxidation and bisulfite treatment as above, ligated fragments were amplified (18 cycles) using Pfu Turbo Cx (Agilent) and adaptor-specific primers (Illumina), followed by purification using AMPure XP beads (Agencourt). Mass Spectrometry Nucleosides were derived from DNA by digestion with DNA Degradase Plus (Zymo Research) according to the manufacturer’s instructions and were analysed by LC-MS/MS on a LTQ Orbitrap Velos mass spectrometer (Thermo Scientific) fitted with a nanoelectrospray ion-source (Proxeon). Mass spectral data for 5hmC, 5fC, and where relevant 5mC and T, were acquired in high resolution full scan mode (R >40,000 for the protonated pseudomolecular ions and >50,000 for the accompanying protonated base fragment ions), and also in selected reaction monitoring (SRM) mode, monitoring the transitions 258 -> 142.0611 (5hmC), 256 -> 140.0455 (5fC), 242 -> 126.0662 (5mC) and 243 -> 127.0502 (T). Parent ions were selected for SRM with a 4 mass unit isolation window and fragmented by HCD with a relative collision energy of 20%, with R >14,000 for the fragment ions. Peak areas from extracted ion chromatograms of the relevant ions for 5hmC and 5fC were normalised to those from either 5mC (where present) or T, and quantified by external
3
calibration relative to standards obtained by digestion of nucleotide triphosphates or oligonucleotides. ES cell culture and DNA extraction J1 ES cells (129S4/SvJae) were purchased from ATCC (Cat. SCRC-1010) and cultured on a γ-irradiated pMEF feeder layer at 37°C and 5% CO2 in complete ES medium (DMEM 4500 mg/L glucose, 4 mM L-glutamine and 110 mg/L sodium pyruvate, 15% fetal bovine serum, 100 U of penicillin/100 µg of streptomycin in 100 mL medium, 0.1mM non-essential amino acids, 50 μM β-mercaptoethanol, 103U LIF ESGRO®). Genomic DNA was prepared from ES cells at passage 14 or 20 using the Qiagen Allprep DNA/RNA mini kit. oxRRBS RRBS libraries from oxidised and non-oxidised DNA were prepared based on a previously published protocol (27). Briefly, 2 µg of genomic DNA were digested with MspI (Fermentas) followed by end repair and A-tailing with Klenow (Fermentas) and ligation of methylated adaptors (Illumina) with T4 DNA ligase (NEB). Adaptor-ligated MspI-digested DNA was run on a 3% agarose gel and size selected (110-380 bp), followed by purification with the Qiagen QIAquick gel purification quick and ethanol precipitation. Prior to oxidation, size-selected DNA was filtered through a mini quick spin oligo column (after four 600 µL H2O washes) to remove any last remaining buffers/salts and adjusted to a final volume of 25 µL. 5 µL of this solution were kept for generation of the non-oxidised library. The remaining was oxidised according to the general oxidation for genomic DNA. Both oxidised and non-oxidised DNA samples were bisulfite-treated using the Qiagen Epitect kit, according to the manufacturer’s instructions for FFPE samples, except that the thermal cycle was run twice over. Final library amplification (18 cycles) was done using Pfu Turbo Cx (Agilent) and adaptor-specific primers (Illumina), after which the libraries were purified using AMPure XP beads (Agencourt). Sequencing and read alignment Sequencing (single-end, 40 bp reads) was performed on the Illumina GAIIx platform. Bases were called by reprocessing raw images using OLB version 1.8 after applying bareback-processing to the first three base pairs (28). Bisulfite read alignments to the mouse genome (build NCBIM37) were carried out using Bismark v0.6.4 (29), using options -n 1 -l 40 --phred64-quals --vanilla. Bismark alignments to individual LINE1 5’ monomer sequences were performed slightly more stringently (-n 0); published consensus sequences were used for alignment of reads to L1A (30), L1Tf and L1Gf (31) monomer subtypes. Bisulfite conversion rates were estimated from the number of unconverted cytosines at Klenow filled-in 3’ MspI sites of sequencing reads that were short enough to read through these sites. Read phred quality remained high at 3’ ends. Estimated bisulfite conversion rates varied between 99.8% and 99.9%. oxRRBS data processing The numbers of converted and unconverted cytosines within CGIs (22) were extracted from each BS and oxBS dataset. For each CpG position, the amount of 5mC was taken as the percentage of unconverted cytosines in each oxBS dataset, and the amount of 5hmC was calculated by subtracting this value from the percentage of unconverted cytosines in the corresponding BS dataset. An overall value per CGI was calculated by pooling data from all the CpGs covered within each CGI. CpGs with fewer than 10 reads were excluded, as were
4
CpGs for which the 5mC estimation deviated from the overall CGI 5mC value by more than 20% or the 5hmC estimation deviated from the overall value by more than 10%. After this outlier filtration step, only CGIs with 5 representative CpGs or more were analyzed. To test for CGIs that contained 5mC levels significantly above the bisulfite conversion error of the oxBS dataset, a binomial test was applied using a Benjamini-Hochberg corrected p-value cutoff of 0.01. Similarly, a binomial test was used to select CGIs with significant amounts of unconverted cytosines in the BS dataset; within these, differences between the BS and oxBS datasets were tested by applying a Fisher’s test and using a corrected p-value cutoff of 0.05. To estimate a false discovery rate (FDR) we drew a parallel from standard peak analysis in ChIP experiments, whereby peaks detected in the input sample are taken as false positives of the statistical test and used to calculate an FDR (32). Similarly, whilst CGIs with a significantly lower fraction of unconverted cytosines in the oxBS dataset were taken as hydroxymethylated CGIs, CGIs with the opposite pattern were assumed to be false positives and used to estimate the FDR. Sequenom MassARRAY Oxidised and non-oxidised genomic DNA was bisulfite treated using the Qiagen Epitect kit, according to the manufacturer’s instructions for FFPE samples, except that the thermal cycle was run twice over. PCR amplification of target regions (primer sequences in Table S2), in vitro transcription and cleavage of the products for MassARRAY analysis were performed according to the manufacturer’s instructions. GlucMS-qPCR Quantification of 5mC and 5hmC levels at MspI sites by glucMS-qPCR was performed as previously described (7) Primers used are in Table S2.
5
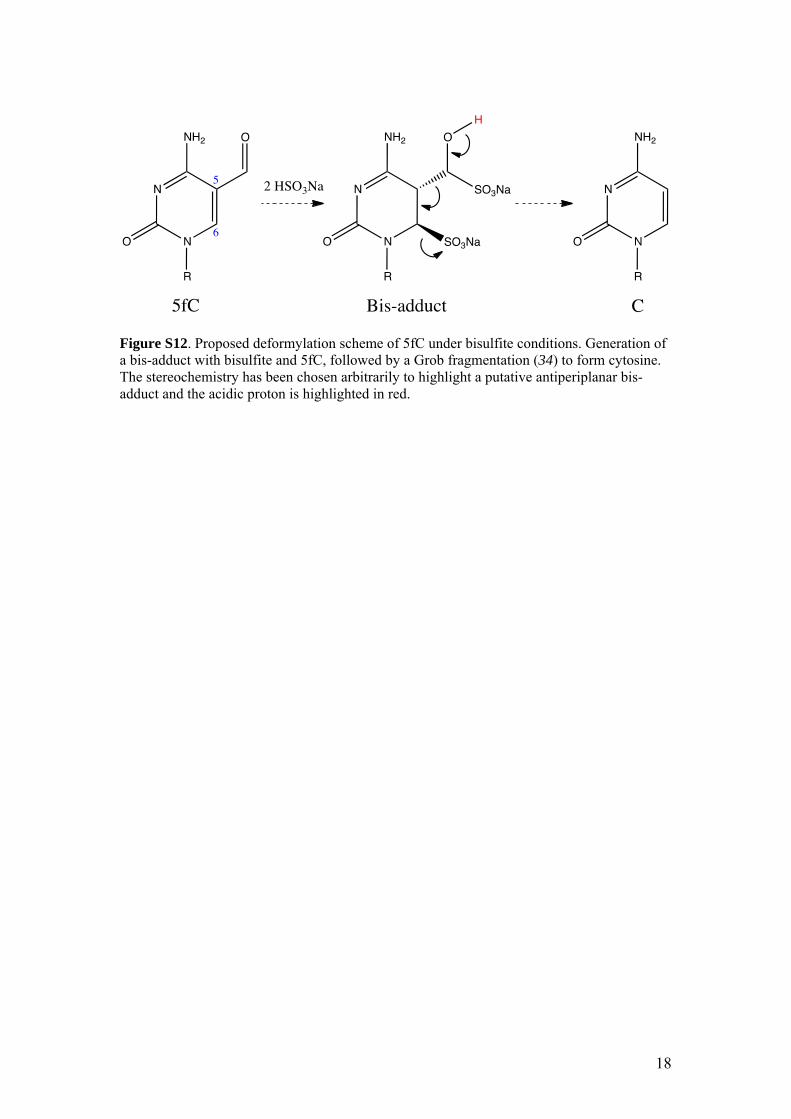
Supplementary Text Deformylation mechanism To the best of our knowledge there is no prior report on the deformylation of 5fC. We propose a plausible mechanism in Fig S12. Owing to the electron withdrawing nature of the C-5 aldehyde, the nucleophilic bisulfite may first add across the C-5/C-6 double bond followed by a second addition to the aldehyde group itself to afford the bis-adduct. Our preliminary mass spectrometry data indicate the formation of such a bis-adduct and this chemical reactivity is well documented (33). We suggest this bis-adduct would have a trans geometry across the C-5/C-6 bond, relating to the SO3Na and the CHOHSO3Na groups, which would allow spontaneous Grob fragmentation (34) to generate cytosine. Behaviour of genomic 5fC and 5caC in oxBS The presence of 5fC and 5caC has recently been reported in mammalian DNA (35, 36). Both 5fC (Fig. 1A) and 5caC (37) (Fig. S13) are converted to U under bisulfite conditions. Therefore genomic 5fC and 5caC are read as T in both the bisulfite and oxidative bisulfite samples and thus the only modification that has a differential behaviour between the BS-Seq and oxBS-Seq is 5hmC. This allows the specific detection of 5hmC as compared to all the other known mammalian cytosine modifications. DNA degradation during oxBS Degradation of DNA during standard bisulfite treatment is a well-known constraint that hinders the application of the method to very small-scale samples. Whilst establishing the oxBS method we noted that the oxidation step also degraded DNA. Initial measurements of overall DNA yield by HPLC indicated that around 40% of the DNA was being degraded during oxidation. We also performed a more stringent preliminary test to quantify what proportion of sonicated DNA fragments were cleaved at least once (by qPCR of a sequencing library prepared from sonicated gDNA). We estimate that the oxidation step cleaves about 95% of the DNA fragments and bisulfite treatment cleaves about 90%, leaving around 0.5% of the original DNA fragments intact. The key practical consideration is the minimum amount of initial DNA sample required. In our oxRRBS experiments we started with 2 µg of genomic DNA, which is readily extractable from any cell line and most tissues. Furthermore, this DNA was size selected before oxidation and bisulfite, therefore only about 40 ng of DNA were actually used as input material. Therefore, DNA degradation would only constitute a limitation in the application of the method to more rare samples, such as primordial germ cells and preimplantation embryos, where much smaller quantities of DNA would be available. There is scope for future improvements to the method that may allow for sequencing of such samples as well. Analysis of biological duplicates As stated in the main text, we carried out oxRRBS on two independent biological duplicate samples of the same ES cell line but at a different passage number. We found by mass spectrometry that the later passage sample had reduced levels of 5hmC (0.10% versus 0.16% of all Cs). Nonetheless, analysis of oxRRBS data from both samples yielded similar results (Fig. 4 and Fig. S6). Expression analysis revealed that Tet1 levels were reduced by ~30%, but Oct4 levels were the same between samples (not shown). This suggests that TET1 and 5hmC may be particularly sensitive to cell culture conditions, even in the absence of cell differentiation. Surprisingly, we found that the later passage ES cells had higher levels of 5mC at CGIs with intermediate levels of methylation (Fig. S5). Genes associated with these CGIs include lysine demethylase Kdm2b and various zinc-finger proteins. Interestingly, this group of CGIs includes those for which we detected the highest levels of 5hmC in the lower
6
passage ES cells (Fig. 4), suggesting that 5hmC is involved in maintaining reduced 5mC levels at these CGIs. When compared with published RRBS and BS-Seq datasets (21, 38, 39), we find a better correlation with our later passage ES cells than with the lower passage ones (Fig. S4). Detection limit and sequencing depth Given that the amount of 5hmC in the genome is relatively low, detection of 5hmC at single cytosines by sequencing brings a new challenge to current sequencing platforms. The detection limit is mostly driven by the sequencing depth, but is also slightly influenced by the amount of 5mC at each cytosine position. The latter is because statistical testing of differences between the oxidized and non-oxidized samples is influenced by the scale of the proportions being tested. We performed a simple theoretical evaluation of how a basic Fisher’s test would perform in detecting 5hmC at a single cytosine position (Fig. S15A). This shows that to detect a single cytosine with 5% 5hmC a sequencing depth of around 500 would be needed. A similar conclusion is reached when calculating 95% confidence intervals for the quantification of 5hmC, i.e., around 500 reads are needed to measure 5% 5hmC with a confidence interval smaller than 0-10% (Fig. S15B). Thus, detection of 5hmC values below 5% at single cytosines would be difficult to achieve with current platforms when sequencing a whole genome. Other more target-focused strategies (such as the oxRRBS approach presented here) would achieve a better detection limit. Pooling of data from a few adjacent cytosines (as we did for whole CGIs) also increases detectability, and we show that for some CGIs we detected 5hmC values close to 1% that were reproducible between replicates Fig. S5A. Such data pooling is a compromise between resolution and statistical power, but even with pooling the method still delivers on the aspect of absolute quantitation and allows to distinguish between CpG and non-CpG sequence contexts within the same genomic region.
7
Supplementary Figures
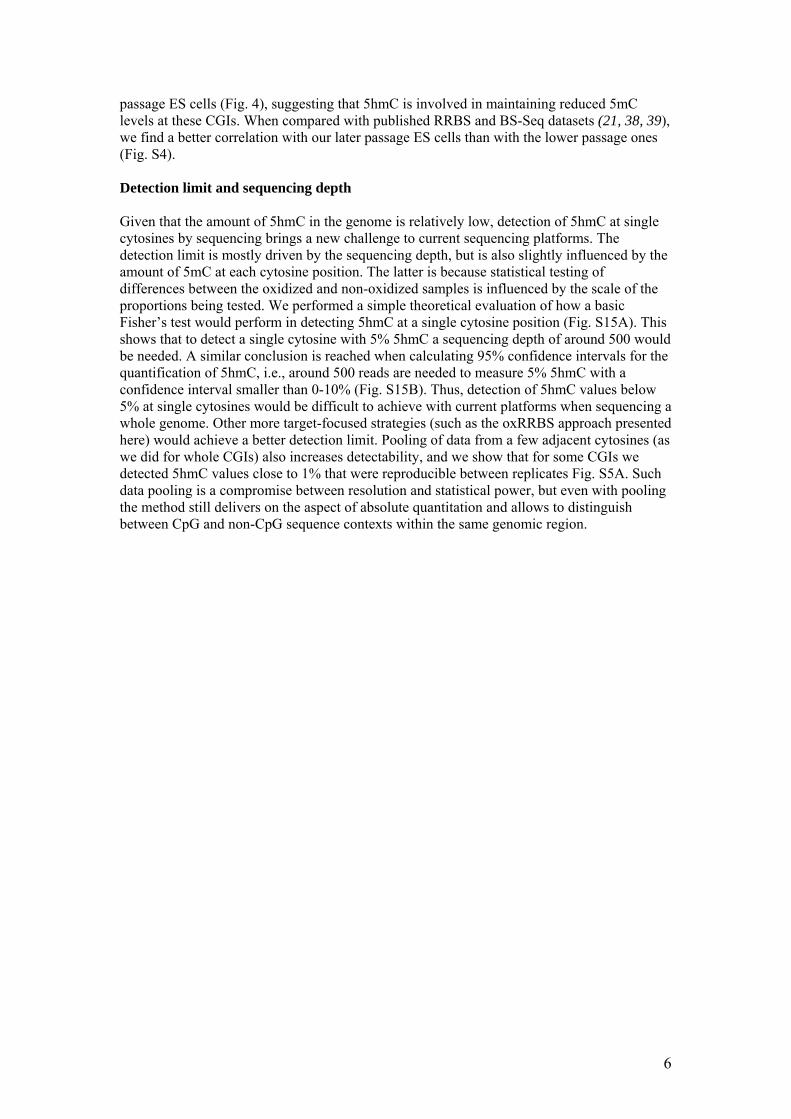
Figure S1. Measurements to detect degradation of each specific nucleoside within DNA under the oxBS-Seq KRuO4 oxidation conditions. We used DNA that was either not oxidised or oxidised with KRuO4. We then digested the DNA strands to nucleosides and separated them with HPLC and quantified the peak areas at 260 nm. We took the ratio of all the nucleoside peak areas from each chromatogram (e.g. C/T, C/A and C/G). We then calculated the percentage change of these ratios after oxidation divided by the ratios before oxidation (the y-axis). This change then represents any loss of a specific nucleoside (e.g. by chemical modification). 0% represents no change in the ratio, +100% represents a complete loss of the ‘denominator’ nucleoside and -100% represents a complete loss of the ‘numerator’ nucleoside. For example in synthetic 5hmC DNA, the percentage change in ratio of the nucleoside peaks of 5hmC/T, 5hmC/A and 5hmC/G is -100%, as a result of complete oxidation (loss) of 5hmC to 5fC. A) synthetic 15mer ssDNA containing C (three replicates), B) synthetic 15mer ssDNA containing 5mC (three replicates) and C) genomic ES cell J1 DNA (2 replicates of sonicated and 2 of non-sonicated). In all cases presented in charts A-C the changes in nucleoside peak ratios are not significant, within experimental error, thus confirming the selectivity of the KRuO4 reaction for 5hmC. Data are mean ± SD.
8
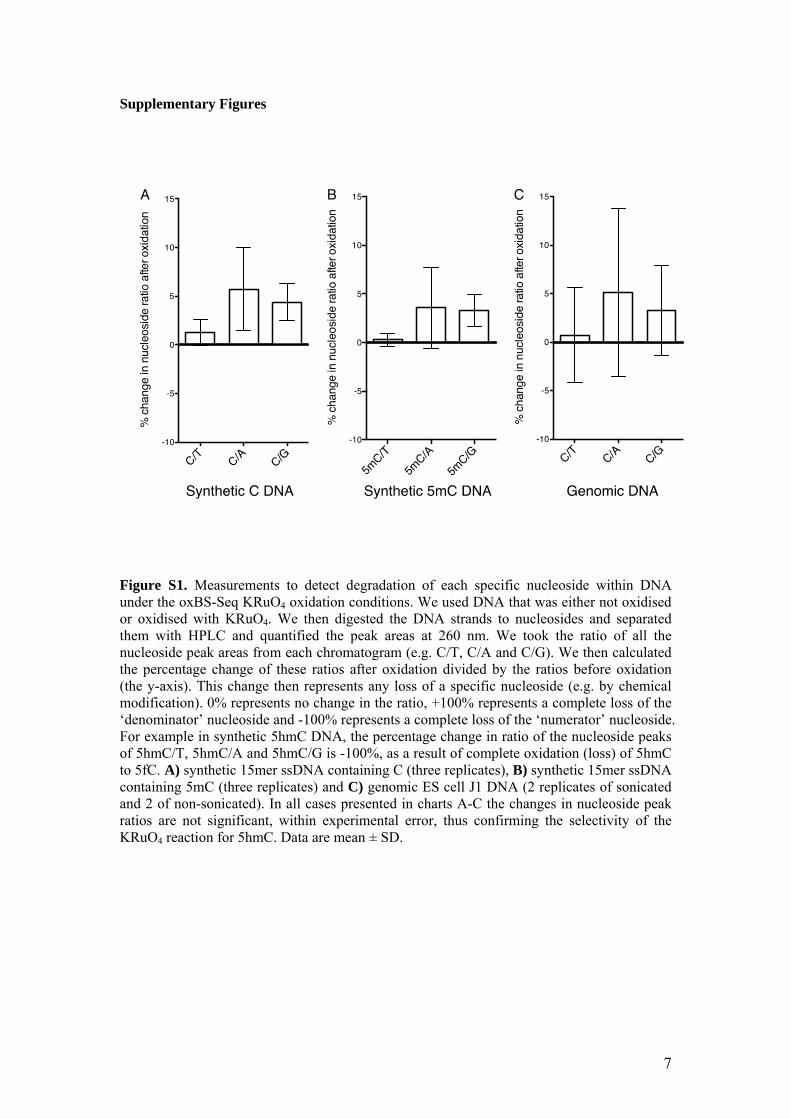
Figure S2. Sanger sequencing of the 122mer DNA strand with a ClaI site (ATCGAT) containing either C, 5mC or 5hmC after oxBS treatment. The chromatogram shows the opposite sequence to the template strand. In the C DNA the C in the opposite strand is fully converted to a U, shown as an A in the chromatogram instead of a G. The 5mC DNA is not converted, showing a G in the chromatogram. The 5hmC DNA is mostly converted, showing an A in the chromatogram, with a small trace of unconverted G in this run.

9
Figure S3. Coverage of the oxRRBS datasets from two biological replicates. A) Histogram of the number of reads (or methylation calls) per CpG within CGIs; solid lines refer to the RRBS datasets and dashed lines to the oxRRBS datasets. B) Histogram of the number of CpGs covered (≥10 reads in all datasets) per CGI. C) Histogram of the number of pooled methylation calls per CGI.
10
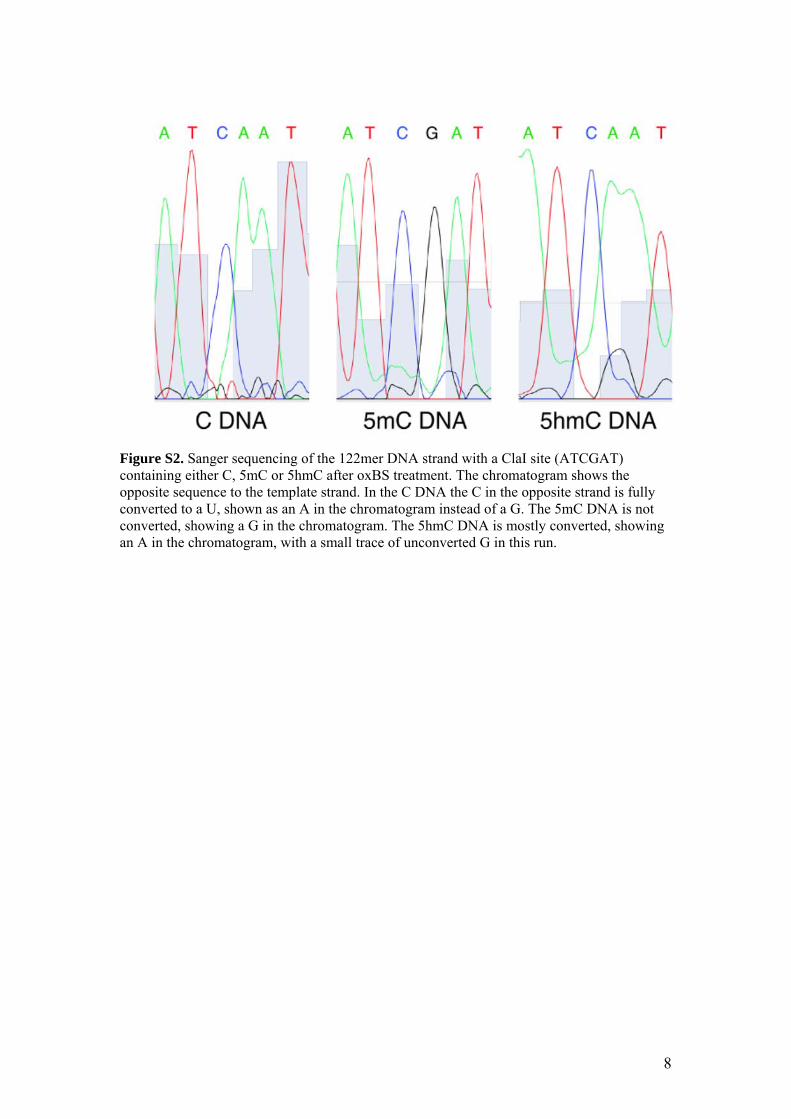
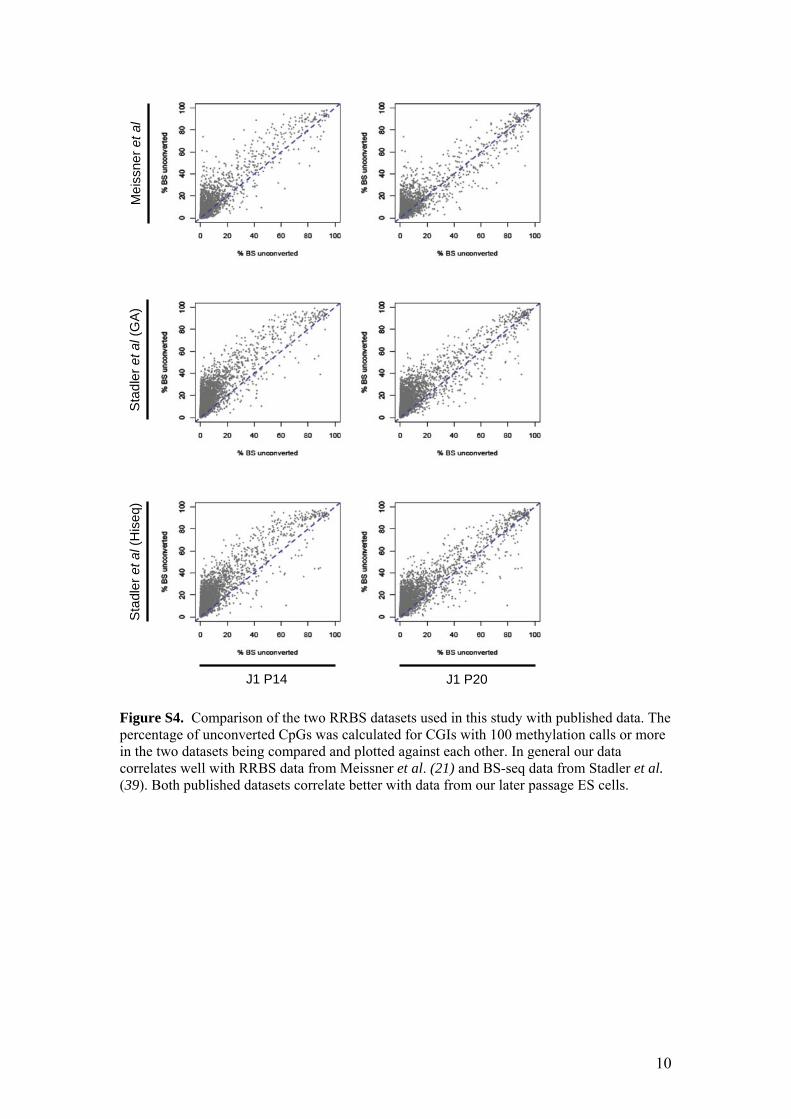
Figure S4. Comparison of the two RRBS datasets used in this study with published data. The percentage of unconverted CpGs was calculated for CGIs with 100 methylation calls or more in the two datasets being compared and plotted against each other. In general our data correlates well with RRBS data from Meissner et al. (21) and BS-seq data from Stadler et al. (39). Both published datasets correlate better with data from our later passage ES cells.
Mei
ssne
r et a
l S
tadl
er e
t al (
GA)
S
tadl
er e
t al (
His
eq)
J1 P14 J1 P20
11
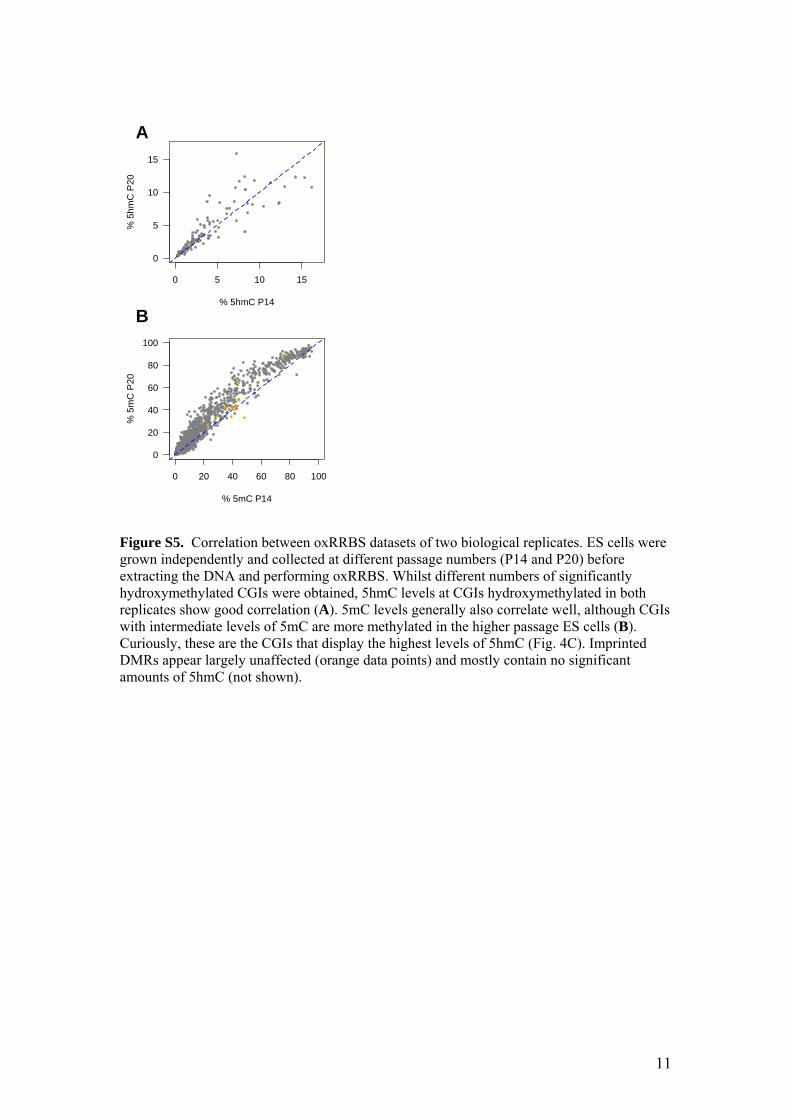
Figure S5. Correlation between oxRRBS datasets of two biological replicates. ES cells were grown independently and collected at different passage numbers (P14 and P20) before extracting the DNA and performing oxRRBS. Whilst different numbers of significantly hydroxymethylated CGIs were obtained, 5hmC levels at CGIs hydroxymethylated in both replicates show good correlation (A). 5mC levels generally also correlate well, although CGIs with intermediate levels of 5mC are more methylated in the higher passage ES cells (B). Curiously, these are the CGIs that display the highest levels of 5hmC (Fig. 4C). Imprinted DMRs appear largely unaffected (orange data points) and mostly contain no significant amounts of 5hmC (not shown).
0 20 40 60 80 100
0
20
40
60
80
100
% 5mC P14
% 5
mC
P20
0 5 10 15
0
5
10
15
% 5hmC P14
% 5
hmC
P20
A
B

12
Figure S6. Data analysis of the second biological replicate. As for the first replicate (Fig. 4), both 5mC and 5hmC anti-correlate with CpG density (A) and are present at higher levels at intragenic CGIs (B), and higher levels of 5hmC are found at CGIs with intermediate levels of 5mC (C).
low medium high
0
20
40
60
80
5mC%
5m
C
low medium high
0
5
10
15
5hmC
% 5
hmC
TSS
Intra
geni
c
Inte
rgen
ic
0
20
40
60
80
5mC
% 5
mC
TSS
Intra
geni
c
Inte
rgen
ic
0
5
10
15
5hmC
% 5
hmC
CpG density CpG density
0-25 25-50 50-75 75-100
0
5
10
15
% 5mC
% 5
hmC
A
B
C

13
Figure S7. Additional examples of the oxRRBS data. CGIs are indicated by the green bars; for the purposes of clarity data outside CGIs was masked (grey areas). As previously described, we find high levels of 5mC close to the promoter of Dazl (23) and substantial amounts of 5hmC associated with Zfp64 and Ecat1 (MspI sites where 5hmC was previously found by glucMS-qPCR are indicated by the arrow heads) (7).
0
50
100
0
50
100
0
4
8
0
15
30
0
15
30
0
4
8
0
50
100
0
50
100
0
4
8
0
15
30
0
15
30
0
4
8
0
50
100
0
50
100
0
4
8
0
15
30
0
15
30
0
4
8
Dazl Zfp64 Ecat1
% 5
mC
ox
RR
BS
log2 reads MeDIP
% 5
hmC
ox
RR
BS
log2 reads hMeDIP
14
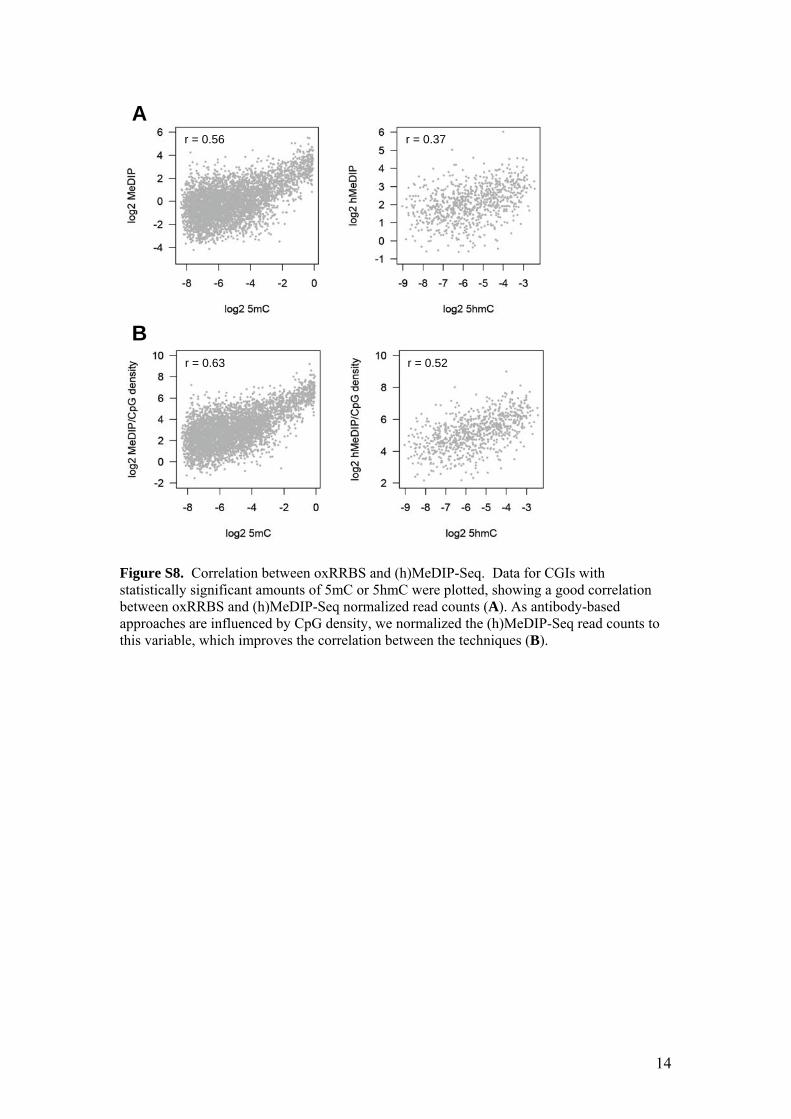
Figure S8. Correlation between oxRRBS and (h)MeDIP-Seq. Data for CGIs with statistically significant amounts of 5mC or 5hmC were plotted, showing a good correlation between oxRRBS and (h)MeDIP-Seq normalized read counts (A). As antibody-based approaches are influenced by CpG density, we normalized the (h)MeDIP-Seq read counts to this variable, which improves the correlation between the techniques (B).
r = 0.56 r = 0.37
r = 0.63 r = 0.52
A
B
15
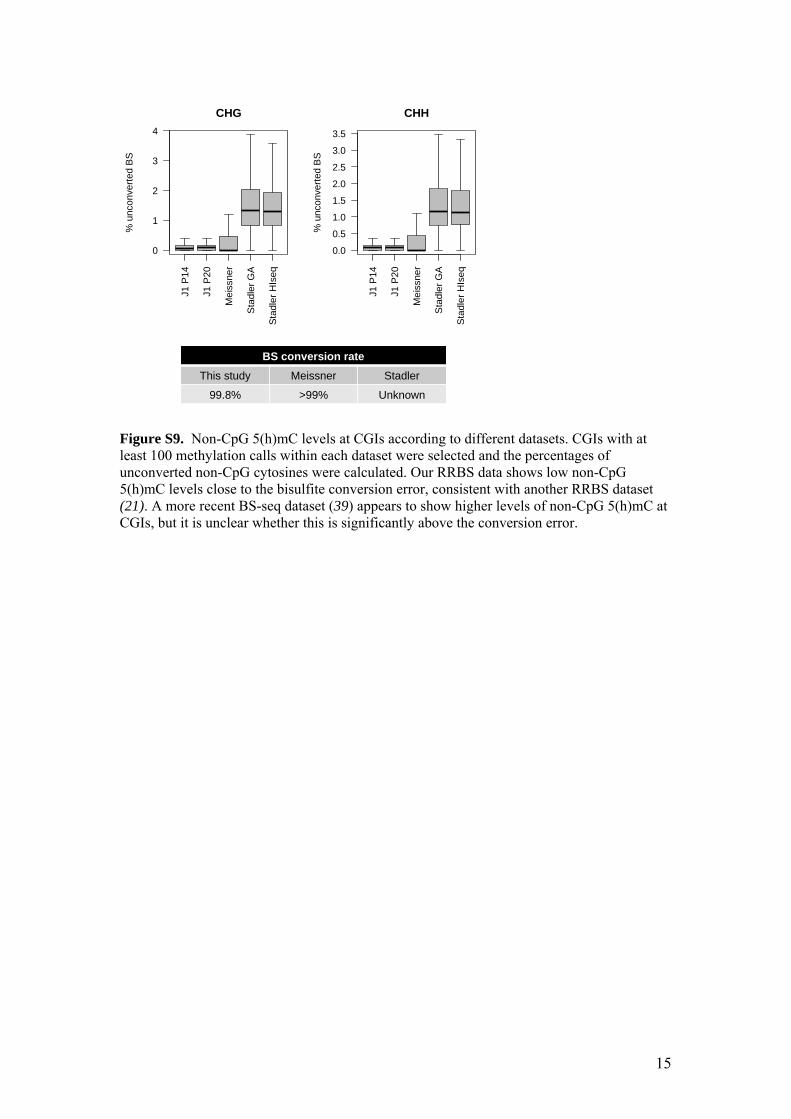
Figure S9. Non-CpG 5(h)mC levels at CGIs according to different datasets. CGIs with at least 100 methylation calls within each dataset were selected and the percentages of unconverted non-CpG cytosines were calculated. Our RRBS data shows low non-CpG 5(h)mC levels close to the bisulfite conversion error, consistent with another RRBS dataset (21). A more recent BS-seq dataset (39) appears to show higher levels of non-CpG 5(h)mC at CGIs, but it is unclear whether this is significantly above the conversion error.
J1 P
14
J1 P
20
Mei
ssne
r
Sta
dler
GA
Stad
ler H
Iseq
0
1
2
3
4
CHG%
unc
onve
rted
BS
J1 P
14
J1 P
20
Mei
ssne
r
Sta
dler
GA
Stad
ler H
Iseq
0.0
0.5
1.0
1.5
2.0
2.5
3.0
3.5
CHH
% u
ncon
verte
d B
S
BS conversion rate This study Meissner Stadler
99.8% >99% Unknown

16
Figure S10. Correlation between gene expression and 5(h)mC at CGIs. Gene expression data was extracted from our own published dataset (7). A) Genes with CGI-containing TSSs represented in the oxRRBS data are expressed above the genome average; most of these genes have low 5mC and 5hmC levels. B) TSS-associated CGIs with significant levels of 5mC or 5hmC were selected and the expression levels of the associated genes were obtained. Gene expression shows a mild negative correlation with both 5mC and 5hmC, but it is worth noting that most of the data lies within a narrow range where both modifications are present at low levels.
-9 -8 -7 -6 -5 -4 -3
-50
5
log2 5hmC
log2
exp
ress
ion
r = -0.122, p = 0.017
-8 -6 -4 -2 0
-50
510
log2 5mC
log2
exp
ress
ion
r = -0.122, p = 2E-9
All TSS CGI TSS
-5
0
5
10
log2
exp
ress
ion
A
B
17
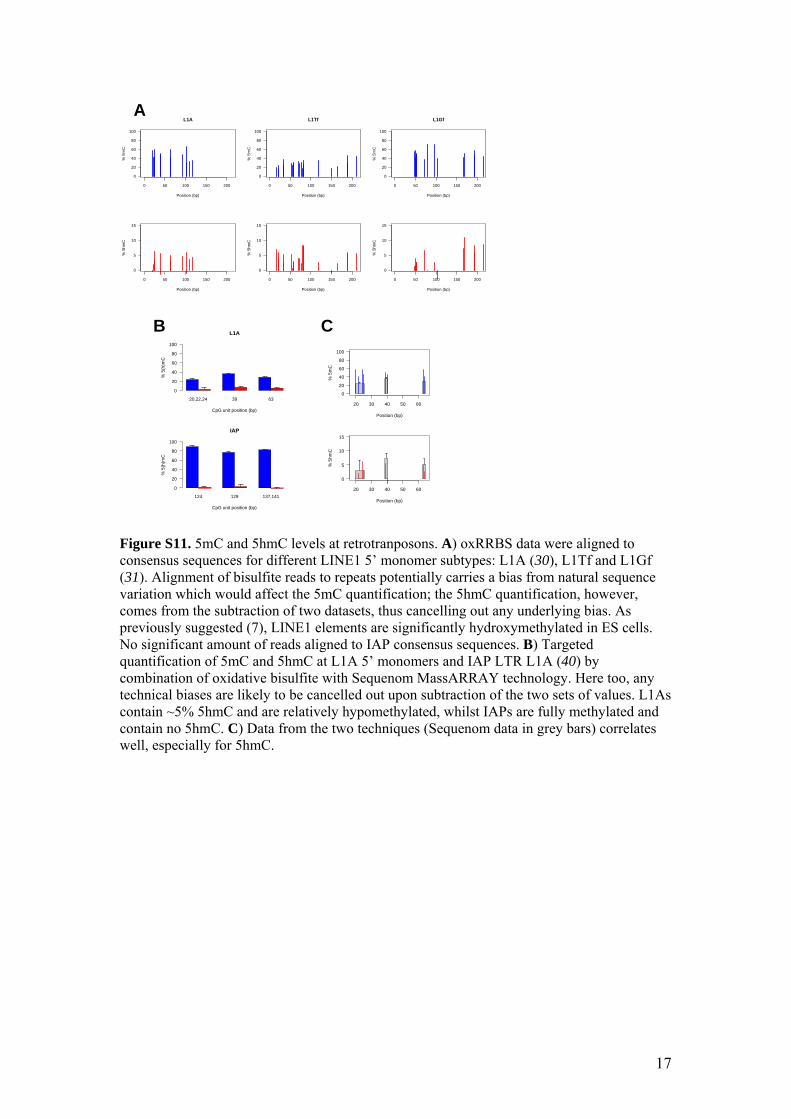
Figure S11. 5mC and 5hmC levels at retrotranposons. A) oxRRBS data were aligned to consensus sequences for different LINE1 5’ monomer subtypes: L1A (30), L1Tf and L1Gf (31). Alignment of bisulfite reads to repeats potentially carries a bias from natural sequence variation which would affect the 5mC quantification; the 5hmC quantification, however, comes from the subtraction of two datasets, thus cancelling out any underlying bias. As previously suggested (7), LINE1 elements are significantly hydroxymethylated in ES cells. No significant amount of reads aligned to IAP consensus sequences. B) Targeted quantification of 5mC and 5hmC at L1A 5’ monomers and IAP LTR L1A (40) by combination of oxidative bisulfite with Sequenom MassARRAY technology. Here too, any technical biases are likely to be cancelled out upon subtraction of the two sets of values. L1As contain ~5% 5hmC and are relatively hypomethylated, whilst IAPs are fully methylated and contain no 5hmC. C) Data from the two techniques (Sequenom data in grey bars) correlates well, especially for 5hmC.
A
0 50 100 150 200
0
20
40
60
80
100
L1A
Position (bp)
% 5
mC
0 50 100 150 200
0
5
10
15
Position (bp)
% 5
hmC
0 50 100 150 200
0
20
40
60
80
100
L1Tf
Position (bp)
% 5
mC
0 50 100 150 200
0
5
10
15
Position (bp)
% 5
hmC
0 50 100 150 200
0
20
40
60
80
100
L1Gf
Position (bp)
% 5
mC
0 50 100 150 200
0
5
10
15
Position (bp)
% 5
hmC
20,22,24 39 63
L1A
CpG unit position (bp)
% 5
(h)m
C
0
20
40
60
80
100
124 129 137,141
IAP
CpG unit position (bp)
% 5
(h)m
C
0
20
40
60
80
100
B C
20 30 40 50 60
0
20
40
60
80
100
Position (bp)
% 5
mC
20 30 40 50 60
0
5
10
15
Position (bp)
% 5
hmC
18
Figure S12. Proposed deformylation scheme of 5fC under bisulfite conditions. Generation of a bis-adduct with bisulfite and 5fC, followed by a Grob fragmentation (34) to form cytosine. The stereochemistry has been chosen arbitrarily to highlight a putative antiperiplanar bis-adduct and the acidic proton is highlighted in red.

19
Supplementary Figure 13. Reaction of 2’-deoxy-5-carboxylcytidine (d5caC) with NaHSO3 (bisulfite) quenched by NaOH at different time points then analyzed by high performance liquid chromatography (HPLC). Data are mean ± SD of 3 replicates.

20
Figure S14. Detailed sequencing data of the results in Figure 2C. Two synthetic dsDNA templates (122mer and 135mer) containing both 5mC (blue circles) and 5hmC (red circles) in different sequence contexts were digested to allow sequencing of the internal 5hmCs; deep sequencing was performed on an Illumina platform following oxidation and bisulfite treatment. Only cytosine positions covered by the reads (green lines) were analysable. The data show that for all analyzed positions 5hmC is efficiently converted to T (thus being read as ‘unmethylated’) whereas 5mC remains unconverted.
0
20
40
60
80
100
% M
ethy
latio
n
C A C A T C C C A C A C T A T A C A C T C A T A C A T A C C A T T T A A C G A T A A A T T A C A A T A A C G T A T C T A A T C A T A T C G A T T A A C T A A T C G A A A T A A T A A T T A C G C A T T A A T
% M
ethy
latio
n
G T G T A G G G T G T G A T A T G T G A G T A T G T A T G G T A A A T T G C T A T T T A A T G T T A T T G C A T A G A T T A G T A T A G C T A A T T G A T T A G C T T T A T T A T T A A T G C G T A A T T A
100
80
60
40
20
0
!" #$%&' #$
%&( $%&' #$
0
20
40
60
80
100
% M
ethy
latio
n
A A A T A A A T T A A A T A A T A T T A A T A T A T C G A T T A A T A A T A A A T A A T A A T T A A T T A A T A T T G G G A A G T A G T G A G T A G A T T G T A G T A A G G A G
% M
ethy
latio
n
T T T A T T T A A T T T A T T A T A A T T A T A T A G C T A A T T A T T A T T T A T T A T T A A T T A A T T A T A A C C C T T C A T C A C T C A T C T A A C A T C A T T C C T C
100
80
60
40
20
0
!" #$%&' #$
%&( $%&' #$
! "#$%&$' () **+ $,(
! "#$%&$' () ‐ . + $,(

21
Figure S15. Detectability of 5hmC at a single cytosine position. A) Amount of 5hmC needed to achieve a p-value of 0.05 using a Fisher’s test (to compare the oxidized and non-oxidized samples) for a given sequencing depth. The detectability of 5hmC is also slightly influenced by the amount of 5mC at the respective cytosine position. B) The accuracy of 5hmC quantitation was estimated by calculating the 95% confidence intervals for different amounts of measured 5hmC. The dashed line represents 100% ‘error’ based on the confidence interval. Data for three sequencing depths are shown.
0 200 400 600 800 1000
Number of reads
% 5
hmC
1
2
5
10
20
50
100
0 5 10 15 20
0
5
10
15
20
n = 100
% 5hmC
95%
CI
0 5 10 15 20
0
5
10
15
20
n = 500
% 5hmC
95%
CI
0 5 10 15 20
0
5
10
15
20
n = 1000
% 5hmC
95%
CI
! "
#"
! "# $%&' $
%"# $%&' $
( "# $%&' $
References and Notes 1. A. M. Deaton, A. Bird, CpG islands and the regulation of transcription. Genes Dev. 25, 1010
(2011). doi:10.1101/gad.2037511 Medline
2. M. Tahiliani et al., Conversion of 5-methylcytosine to 5-hydroxymethylcytosine in mammalian DNA by MLL partner TET1. Science 324, 930 (2009). doi:10.1126/science.1170116 Medline
3. S. Ito et al., Role of Tet proteins in 5mC to 5hmC conversion, ES-cell self-renewal and inner cell mass specification. Nature 466, 1129 (2010). doi:10.1038/nature09303 Medline
4. M. R. Branco, G. Ficz, W. Reik, Nat. Rev. Genet. 13, 7 (2012).
5. S. Kriaucionis, N. Heintz, The nuclear DNA base 5-hydroxymethylcytosine is present in Purkinje neurons and the brain. Science 324, 929 (2009). doi:10.1126/science.1169786 Medline
6. M. Münzel et al., Quantification of the sixth DNA base hydroxymethylcytosine in the brain. Angew. Chem. Int. Ed. 49, 5375 (2010). doi:10.1002/anie.201002033 Medline
7. G. Ficz et al., Dynamic regulation of 5-hydroxymethylcytosine in mouse ES cells and during differentiation. Nature 473, 398 (2011). doi:10.1038/nature10008 Medline
8. W. A. Pastor et al., Genome-wide mapping of 5-hydroxymethylcytosine in embryonic stem cells. Nature 473, 394 (2011). doi:10.1038/nature10102 Medline
9. H. Wu et al., Genome-wide analysis of 5-hydroxymethylcytosine distribution reveals its dual function in transcriptional regulation in mouse embryonic stem cells. Genes Dev. 25, 679 (2011). doi:10.1101/gad.2036011 Medline
10. S. G. Jin, X. Wu, A. X. Li, G. P. Pfeifer, Genomic mapping of 5-hydroxymethylcytosine in the human brain. Nucleic Acids Res. 39, 5015 (2011). doi:10.1093/nar/gkr120 Medline
11. C. X. Song et al., Selective chemical labeling reveals the genome-wide distribution of 5-hydroxymethylcytosine. Nat. Biotechnol. 29, 68 (2011). doi:10.1038/nbt.1732 Medline
12. K. Williams et al., TET1 and hydroxymethylcytosine in transcription and DNA methylation fidelity. Nature 473, 343 (2011). doi:10.1038/nature10066 Medline
13. Y. Xu et al., Genome-wide regulation of 5hmC, 5mC, and gene expression by Tet1 hydroxylase in mouse embryonic stem cells. Mol. Cell 42, 451 (2011). doi:10.1016/j.molcel.2011.04.005 Medline
14. Y. Huang et al., The behaviour of 5-hydroxymethylcytosine in bisulfite sequencing. PLoS ONE 5, e8888 (2010). doi:10.1371/journal.pone.0008888 Medline
15. C. Nestor, A. Ruzov, R. Meehan, D. Dunican, Enzymatic approaches and bisulfite sequencing cannot distinguish between 5-methylcytosine and 5-hydroxymethylcytosine in DNA. Biotechniques 48, 317 (2010). doi:10.2144/000113403 Medline
16. C. X. Song et al., Sensitive and specific single-molecule sequencing of 5-hydroxymethylcytosine. Nat. Methods 9, 75 (2012). doi:10.1038/nmeth.1779 Medline
17. J. Eid et al., Real-time DNA sequencing from single polymerase molecules. Science 323, 133 (2009). doi:10.1126/science.1162986 Medline
1
18. E. V. Wallace et al., Identification of epigenetic DNA modifications with a protein nanopore. Chem. Commun. (Camb.) 46, 8195 (2010). doi:10.1039/c0cc02864a Medline
19. M. Wanunu et al., Discrimination of Methylcytosine from Hydroxymethylcytosine in DNA Molecules. J. Am. Chem. Soc. 133, 486 (2010). doi:10.1021/ja107836t Medline
20. G. Green, W. P. Griffith, D. M. Hollinshead, S. V. Ley, M. Schroder, J. Chem. Soc., Perkin Trans. 1 1, 681 (1984). doi:10.1039/p19840000681
21. A. Meissner et al., Genome-scale DNA methylation maps of pluripotent and differentiated cells. Nature 454, 766 (2008). Medline
22. R. S. Illingworth et al., Orphan CpG islands identify numerous conserved promoters in the mammalian genome. PLoS Genet. 6, e1001134 (2010). doi:10.1371/journal.pgen.1001134 Medline
23. J. Borgel et al., Targets and dynamics of promoter DNA methylation during early mouse development. Nat. Genet. 42, 1093 (2010). doi:10.1038/ng.708 Medline
24. S. M. Kinney et al., Tissue-specific distribution and dynamic changes of 5-hydroxymethylcytosine in mammalian genomes. J. Biol. Chem. 286, 24685 (2011). doi:10.1074/jbc.M110.217083 Medline
25. N. Lane et al., Resistance of IAPs to methylation reprogramming may provide a mechanism for epigenetic inheritance in the mouse. Genesis 35, 88 (2003). doi:10.1002/gene.10168 Medline
26. E. P. Quinlivan, J. F. Gregory, 3rd, DNA digestion to deoxyribonucleoside: a simplified one-step procedure. Anal. Biochem. 373, 383 (2008). doi:10.1016/j.ab.2007.09.031 Medline
27. H. Gu et al., Preparation of reduced representation bisulfite sequencing libraries for genome-scale DNA methylation profiling. Nat. Protoc. 6, 468 (2011). doi:10.1038/nprot.2010.190 Medline
28. F. Krueger, S. R. Andrews, C. S. Osborne, Large scale loss of data in low-diversity illumina sequencing libraries can be recovered by deferred cluster calling. PLoS ONE 6, e16607 (2011). doi:10.1371/journal.pone.0016607 Medline
29. F. Krueger, S. R. Andrews, Bismark: a flexible aligner and methylation caller for Bisulfite-Seq applications. Bioinformatics 27, 1571 (2011). doi:10.1093/bioinformatics/btr167 Medline
30. S. A. Schichman, N. B. Adey, M. H. Edgell, C. A. Hutchison, 3rd, L1 A-monomer tandem arrays have expanded during the course of mouse L1 evolution. Mol. Biol. Evol. 10, 552 (1993). Medline
31. J. L. Goodier, E. M. Ostertag, K. Du, H. H. Kazazian, Jr., A novel active L1 retrotransposon subfamily in the mouse. Genome Res. 11, 1677 (2001). doi:10.1101/gr.198301 Medline
32. Y. Zhang et al., Model-based analysis of ChIP-Seq (MACS). Genome Biol. 9, R137 (2008). doi:10.1186/gb-2008-9-9-r137 Medline
33. T. J. Johnson, R. A. Jones, The chemistry of terpenes—VIII Characterisation of the bisulphite adducts of α,β-unsaturated aldehydes by NMR spectroscopy. Tetrahedron 34, 547 (1978). doi:10.1016/0040-4020(78)80050-7
2
3
34. C. Fehr, A. K. Buzas, O. Knopff, J. Y. de Saint Laumer, (+)-(R,Z)-5-Muscenone and (-)-(R)-muscone by enantioselective aldol reaction and Grob fragmentation. Chemistry 16, 2487 (2010). doi:10.1002/chem.200902774 Medline
35. T. Pfaffeneder et al., The discovery of 5-formylcytosine in embryonic stem cell DNA. Angew. Chem. Int. Ed. Engl. 50, 7008 (2011). doi:10.1002/anie.201103899 Medline
36. S. Ito et al., Tet proteins can convert 5-methylcytosine to 5-formylcytosine and 5-carboxylcytosine. Science 333, 1300 (2011). doi:10.1126/science.1210597 Medline
37. Y. F. He et al., Tet-mediated formation of 5-carboxylcytosine and its excision by TDG in mammalian DNA. Science 333, 1303 (2011). doi:10.1126/science.1210944 Medline
38. A. Meissner et al., Genome-scale DNA methylation maps of pluripotent and differentiated cells. Nature 454, 766 (2008). Medline
39. M. B. Stadler et al., DNA-binding factors shape the mouse methylome at distal regulatory regions. Nature 480, 490 (2011). Medline
40. C. Qin et al., Intracisternal A particle genes: Distribution in the mouse genome, active subtypes, and potential roles as species-specific mediators of susceptibility to cancer. Mol. Carcinog. 49, 54 (2010). doi:10.1002/mc.20576 Medline