
Dynamic Effects of Migrant Remittances on Growth: An Econometric Model with an Application to...
38
1 Dynamic Effects of Migrant Remittances on Growth: An Econometric Model with an Application to Mediterranean Countries Nicholas P. Glytsos Centre of Planning and Economic Research The collaboration of Yulie Papaconstantinou and the assistance of Eleni Papaioannou are gratefully acknowledged Address: 22 Hippokratous St., 106 80, Athens, Greece Tel.: 3010 3676428, FAX: 3010 3630122 e-mail: [email protected] Athens, June 2001
-
Upload
independent -
Category
Documents
-
view
3 -
download
0
Transcript of Dynamic Effects of Migrant Remittances on Growth: An Econometric Model with an Application to...
1
Dynamic Effects of Migrant Remittances on Growth: An Econometric
Model with an Application to Mediterranean Countries
Nicholas P. Glytsos
Centre of Planning and Economic Research
The collaboration of Yulie Papaconstantinou and the assistance of Eleni Papaioannou are gratefully acknowledged
Address:
22 Hippokratous St., 106 80, Athens, Greece
Tel.: 3010 3676428, FAX: 3010 3630122
e-mail: [email protected]
Athens, June 2001
2
Dynamic Effects of Migrant Remittances on Growth: An Econometric Model with an Application to Mediterranean Countries
Nicholas P. Glytsos
Centre of Planning and Economic Research
Athens, Greece
Abstract
This paper builds a Keynesian type econometric model with a dynamic
perspective and a sound theoretical basis, for investigating the impact of remittances on
consumption, investment, imports and output. It estimates short and long-run multiplier
effects of exogenous shocks of remittances, with data from five Mediterranean
countries. The analysis reveals a uniform country performance of instability and
uncertainty, with great temporal and inter-country fluctuations of remittance effects. The
findings point to different inter-country priorities of remittance spending and to an
asymmetric impact of remittance changes, in the sense that the good done to growth by
rising remittances is not as great as the bad done by falling remittances.
Keywords: Migration, Remittances, Growth, Dynamic Model, Mediterranean Countries.
JEL-Code : F22, O11, O19
3
Dynamic Effects of Migrant Remittances on Growth: An Econometric Model with an Application to Mediterranean Countries
Nicholas P. Glytsos
Centre of Planning and Economic Research
Athens, Greece
1. Introduction
Migrant remittances are a significant and vital financial source for labor exporting
countries, therefore the issue of their effects is of utmost importance. In many of the
labor exporting countries, migrant remittances represent a very high proportion of their
foreign exchange proceeds and an indispensable source for covering the balance of
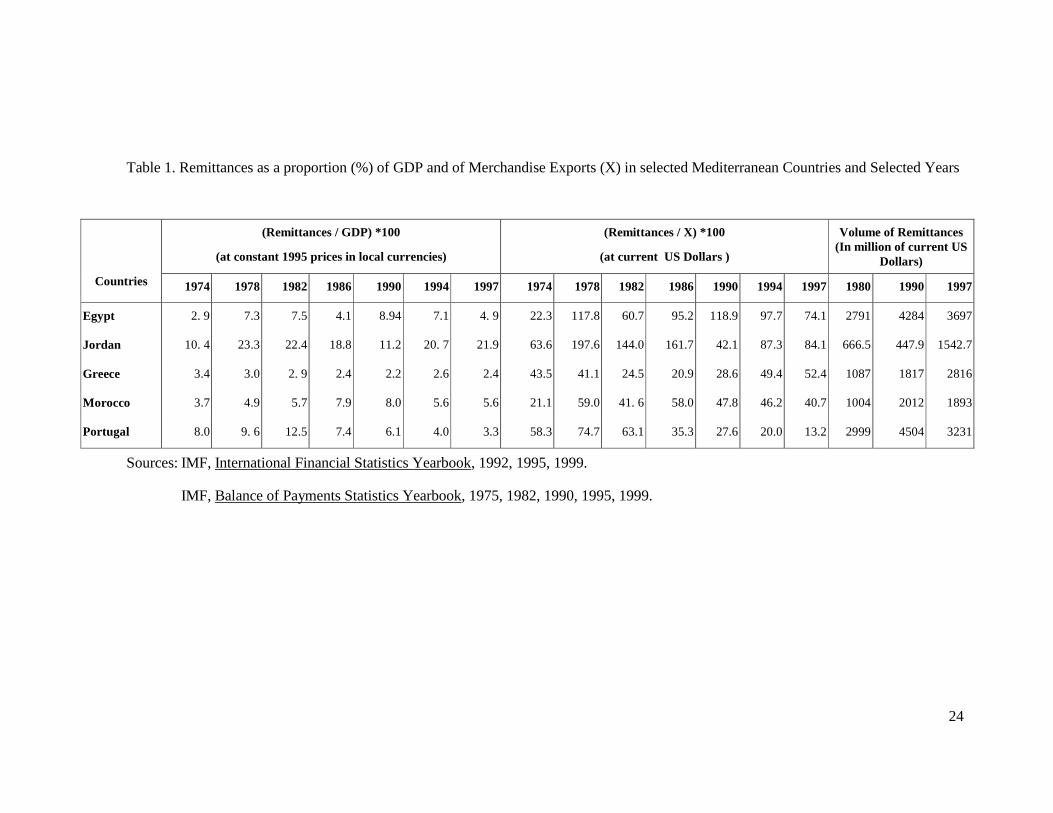
payments deficits1. In Egypt, remittances have been at times higher than the sum of
foreign exchange from oil exports, the Suez Canal dues and tourism, and exceed
considerably merchandise exports (by 45 per cent in 1993); in Morocco remittances
ranged in the last decade between 5.5 - 8.0 per cent of GDP. As a proportion of
merchandise exports, remittances reached in some countries high levels in recent years:
Jordan 84.0 per cent; Morocco 41.0 per cent. In most of the labor exporting countries
mentioned in this paper, the volume of remittances increased greatly over the last 20 or
so years (Table 1).
The relevant literature discusses particularly the impact of remittances on poverty
and income distribution (e.g. Lundahl, 1985; Djajic, 1986; Kirwan and Holden, 1986;
Rivera - Batiz, 1986; Stark, Taylor and Yitzhaki, 1986; Stark, 1991). A large part of it is
qualitative, assessing the situation in different countries, or presenting more general
surveys (e.g. Richards and Martin, 1983; Russell, 1986, 1992; Keely and Tran, 1989;
Glytsos, 1998; Farrag, 1996; Wahba, 1996). Systematic quantitative or econometric
work on the macroeconomic effects of remittances is very limited (e.g. Oberai and
Singh, 1980; Kandil and Metwally, 1990; Looney, 1990; Adams, 1991; Glytsos, 1993;
Taylor and Wyatt, 1996).
Qualitative empirical discussions based on particular countries entertain often the
thought that these voluminous funds flowing into a country in a more or less regular
manner and for a long-time, cannot but contribute to development or, conversely
dismiss rather easily any arguments of positive effects, denying that any good comes out
of these financial flows. And the question is: to what extent could country differences be
justified by different conditions, and to what extent could they result from the lack of
4
concrete empirical analysis, hiding perhaps some uniformities among countries and
leaving enough room for speculation and judgmental propositions?
This paper will try to respond empirically to some of these questions and estimate
the relative effects of remittances and the time distribution of these effects for different
sectors of the economy or macroeconomic variables that have a bearing on development
and growth. The tool of our analysis is a macroeconometric model, which will be
applied to a number of countries on both sides of the Mediterranean basin, with the great
majority of their migrants being either in the oil-rich Arab countries or in Europe.
2. Remittances and Development: Some preliminary observations.
In its various forms foreign exchange influences economic development and
growth through demand and supply channels. Chenery and Bruno (1962) consider the
lack of foreign exchange in LDC’s as an “external strangulation” for development
impeding the required capital imports. Given the chronic problems in the balance of
trade of these countries as well as the ineffectiveness of foreign aid and the difficulties
of borrowing, the often voluminous migrant remittances can substitute for the scarcity of
the other sources of foreign exchange.
As private flows of foreign exchange remittances are spent partly on consumption
and partly on investment and may have complex positive and negative affects on
development and growth. Some contain that the significance of these flows risk
generating a dependency on this source of finance which may in effect raise the need for
more foreign exchange through increasing imports (Kritz et al, 1981). Remittances even
in the cases that they are abundant may thus distort rather than promote growth and
structural change, because they may misdirect government policies away from measures
of improving structural changes and rendering competitive the remittance recipient
countries. For instance, the inflation that remittance are able to generate by boosting
excess demand or raising reservation wages may even cancel some of their beneficial
effects (e.g. Feiler, 1987, Looney, 1990). The literature presents some strong arguments
in favor of the contribution of remittances to development and growth, but equally also
objections to that effect.
In countries of high emigration, remittances may induce structural transformation
that has both economic and social implications on poverty, income distribution and
economic welfare, which are impacting on consumption patterns and savings with
ultimate effects on growth and trade.
A considerable part of the relevant literature argues that remittances are mostly
spent on consumption, housing and land, and are not used for productive investment that
5
would contribute to long-run development. As we have argued elsewhere (Glytsos,
1998a), this view seems to ignore that, apart from the direct investment by migrants or
recipients, the “productive use” of remittances may be served in a variety of other ways:
management of remittances (e.g. by banks); extension of investment credit allowed by
the increase in the liquidity of banks from remittance deposits; liberalization of other
resources from consumption; investment in human capital in the form of spending on
certain consumption items (e.g. education, health); purchase of more investment goods
from abroad, made possible by remittances; growth of investment as a result of the
multiplier effects of spending on consumption. Considering only some of these
potentials is to underestimate, as the literature often does, the extent of the productive
use of remittances.
If that is the case, the question is whether remittances are a stable and dependable
source of funds for development. Evidence shows that those coming from migrants in
the Arab Gulf oil-rich countries are more volatile because they are sensitive to oil price
shocks, impacting on the host country economies and entailing massive movements of
migrants between host and home countries. Such was, for instance, the case in the oil
windfalls of 1973 and 1979, and during the price drops in 1982 and 1986, which
generated very serious problems of adjustment in the labor exporting Middle East
countries. The gradual switch of demand from the large numbers of unskilled labor to
smaller numbers of skilled and well educated workers with easier family unification in
the Gulf countries, is an additional dampening factor of remittances in the Middle East.
North African and Southern European labor exporting countries, with more
permanent migrants in Western Europe, mostly France and Germany, have not been
exposed to similar extreme experiences, because of the relative stability of the host
country economies, suffering however from milder economic setbacks, which affected
analogously the employment of migrants and often, but not always, their remitting
capacity. In fact, there is some evidence that during the economic recession in France,
Moroccans and Tunisians increased their remittances (Garson, 1994).
Developing economies are particularly concerned with growth and structural
change. A major objective of labor exporting developing countries is to widen the basis
of economic activity, raise competitiveness and reduce their dependence on injections of
foreign resources. Changing remittance flows may have both short-run and long-run
implications, which this paper will try to evaluate. Its objective is to estimate the effects
of the demand from remittances on certain macroeconomic variables, that are related to
short-run economic changes and to determine how these changes move the economy to
long-run growth and development.
6
3. The Model
For our purposes in this paper, a very simple linear macroeconometric model
would be appropriate, comprising four major features, that is, be demand oriented; be
aggregate enough to have room for a number of different countries, offering comparable
estimates and setting aside detailed individual or sectoral characteristics2; satisfy a
certain minimum of accepted econometric standards; and, last but not least, make good
theoretical sense, compatible with the kind of economies to which it will be applied.
The model adopted, on these lines is of a Keynesian basis, but with a dynamic
perspective3, and consists of three behavioral equations, namely, a consumption
function, an investment function and an imports function, and a national income
identity. The focal point of the model is to determine first the short-run effects of an
exogenous shock of remittances on these four endogenous variables and, second, to
trace the long-run path, through which remittances move the economy ahead.
There are four phases in our analysis: the first is the construction and estimation of
the econometric model; the second concerns the use of the estimates of the model to
obtain short- and long-run remittance multipliers; the third phase is to apply these
multipliers on the series of data for each country, in order to determine the magnitudes
of the effects of remittances on the economies of these countries over time. Finally, in
the fourth phase we try to estimate the relative significance of various factors that
differentiate the induced effects of remittances on output growth among countries and
over time.
3.1 Structure of the model
After experimenting with alternative forms of the consumption function, backed
by different theoretical hypotheses4, we apply equation (1) that performs best for almost
all countries of our sample.
Ct = α0 + α1Yt + α2Ct-1 (1)
where C = Private Consumption, Y = GDP + Remittances, subscript t standing for
time.
This is a dynamic long-run consumption equation and is backed by two different
distributed-lag hypotheses, i.e. adaptive expectations and partial adjustment model5, and
may produce estimates of short- and long-run effects of income on consumption. This
equation seems to satisfy our criterion for a model suitable for developing countries,
where various uncertainties are present concerning income changes, with the component
of remittances generating, as we noted, considerable income fluctuations. This is more
7
true for certain of the MENA countries that are under some kind of transition, given
their efforts to move to privatization and the liberalization of their economies, having
joined the World Trade Organization and signed agreements with the European Union
for liberalizing trade.
Following some theoretical views (see Duesenberry, 1958; Christ, 1966;
Pavlopoulos, 1966), we assume that private investment is correlated with business
profits and that profits are positively related to national income and negatively related to
the stock of capital, in the sense that there is some desired stock of capital toward which
businessmen are orienting their investment activity (Christ, 1966, pp.582-583).
Consequently, investment (I) is a positive function of income (Y) and a negative
function of a lagged capital stock (Kt-1), allowing some time for investment to adjust to
that stock6.
It = β0 + β1Yt + β2 Kt-1 (2)
The import equation comes straight from the life-cycle hypothesis as developed
for consumption by Ando and Modigliani and others (see Davidson, Hendry et al, 1978),
incorporating the influence of income and wealth7 and is of the form
Mt = γ0 + γ1Yt + γ2 Yt-1 + γ3 Mt-1 (3)
For the countries investigated, imports make up a relatively high proportion of
consumption, to which the life-cycle hypothesis may apply more than it does to
domestically produced very basic goods. Variable Mt-1 carries the effect of past incomes
on current imports, indicating adaptive expectations. The coefficients of equation (3)
may be expressed in terms of the theoretical parameters in note 7 as follows: γ1 = λ, γ2
= (δ - r) - λ and γ3 = 1 - (δ - r), overidentifying the value of (δ - r).
By construction of the import function, (δ - r)>0, therefore γ2 ><0, depending on
(δ - r)>< γ1. In other words, lagged income will affect imports positively (negatively) if
the marginal propensity to import with respect to current wealth (δ - r) is higher (lower)
than the marginal propensity to import with respect to current income (γ1 ). The lagged
imports coefficient γ3 will be positive, since (δ - r)<1.
To summarize, our structural model consists of equations (1), (2) and (3), and an
income identity, which also includes remittances8, i.e.:
Ct = α0 + α1Yt + α2Ct-1 (1)
It = β0 + β1Yt + β2 Kt-1 (2)
Mt = γ0 + γ1Yt + γ2 Yt-1 + γ3 Mt-1 (3)
8
Yt = Ct + It + Gt + Xt - Mt + Rt (4)
List of Variables :
Endogenous variables:
C = private consumption expenditure ; I = gross domestic investment
(private and public), including change in stocks ; M = Imports of goods and non-
factor services ; Y = a kind of national disposable income, made up of GDP and
the volume of migrant remittances
Exogenous variables:
K = cumulative gross domestic investment ∑∑∑∑1998
1969tI (as proxy of capital stock) ; G
= general government consumption expenditure ; X = exports of goods and non-
factor services ; R = migrant remittances deflated by the consumer price index ;
t = stands for time.
3.2 Dynamic Features of the Model
The dynamic nature of the model emerges from the introduction of lagged
endogenous variables into the system. The relationship between an endogenous variable
and all the predetermined variables of our system of equations, i.e. the reduced form
expression of the structural equations (1) - (4) is of the form:
Xit = π0 + π1 Ct-1 + π2 Y t-1 +π3 M t-1 + π4 K t-1 + π5 G t + π6 X t + π7 Rt (5)
where X any of our endogenous variables C, I, M, Y.
The parameters π’s are the partial derivatives of the endogenous variable Xi with
respect to any predetermined variable Z, i.e. ∂∂
πX
Zit
iti= . Estimates of the π’s may be
obtained either directly by OLS from equation (5), or by solving the TSLS expressions
of π’s in terms of the estimated structural parameters (see Appendix). The former are
unconstrained by the structure of the model and the interactions of the endogenous
variables, which bind the solved TSLS coefficients.
In discrete variable notation, the partial derivatives of equation (5) are equivalent
to ∆Χ = π ∆Ζ, which tells that π is a multiplier, called “impact multiplier”, that
represents the magnitudes of direct and indirect effects of a unit change in any
predetermined variable Z on any endogenous variable X of the system, in the first year
of the change in Z. Subsequent effects during the years 2, 3, ..., n come as a result of the
9
dynamic nature of the model, through the lagged dependent variables in the form of time
distributed interim multipliers, moving the system forward towards long-term
equilibrium if certain conditions of convergence exist. The sum of interim multipliers
gives therefore the opportunity of evaluating the overall exogenous effects of
remittances on the three endogenous variables of the model. More specifically, the
dynamic nature of the model allows the possibility of estimating short- and long-run
effects of changes in remittances and tracing the time path and the speed of these effects.
(see, for instance, Pavlopoulos, 1966).
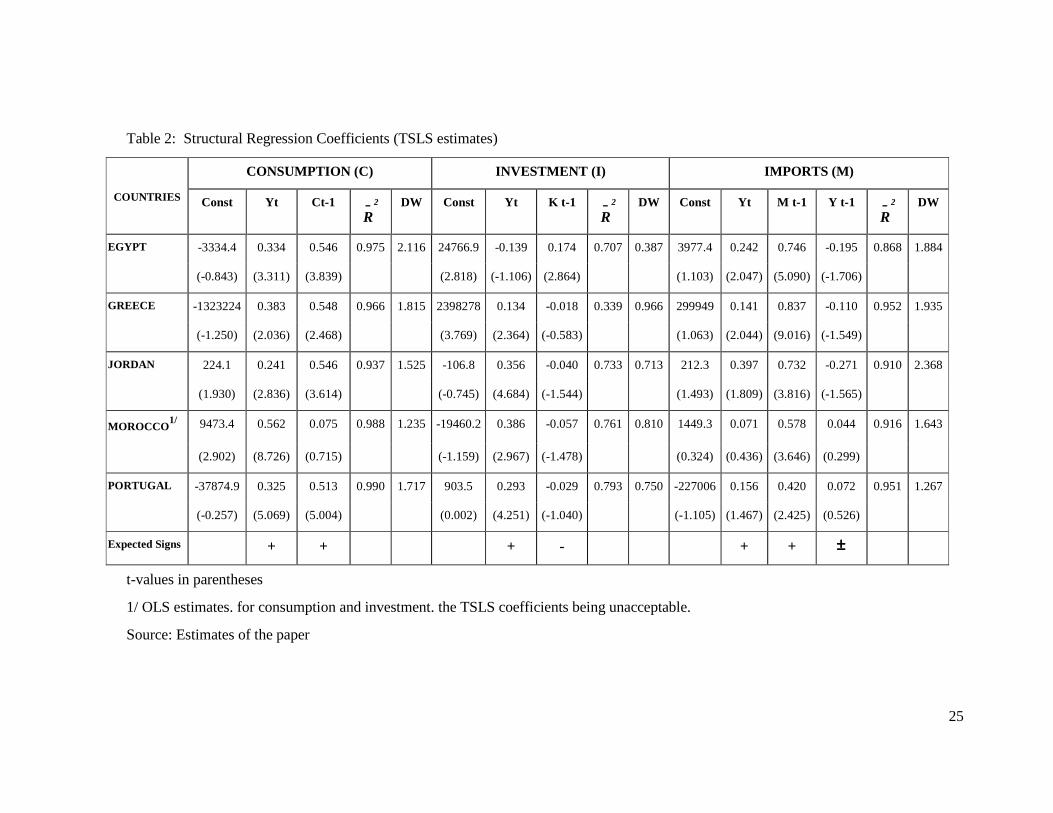
4. Estimation of the Model and Empirical Results
The model is estimated by two-stage least squares (TSLS) and is applied individually to
5 countries: Egypt, Greece, Jordan, Morocco and Portugal. Egypt and Jordan have
generally temporary migrants in the oil-rich Arab States, Morocco has mostly permanent
migrants in Europe, particularly in France and the Southern European relatively more
advanced countries, Greece and Portugal, members of the European Union, have more
or less permanent migrants in Germany and France but also in overseas territories. The
data used are annual figures of the period 1969-1998. All figures are obtained from IMF,
International Financial Statistics Yearbook, 1992, 1995, 1999, IMF, Balance of
Payments Statistics Yearbook, 1975, 1982, 1990, 1995, 1999 and are expressed in local
currencies at constant 1995 prices. The estimates of the model are presented in Table 2.
4.1 Structural Parameters
The model seems to fit rather well the data of all 5 countries, with all signs
(except two) as theoretically expected, and with very significant coefficients in most of
the cases. The lagged dependent variable in the consumption and imports equations,
expressing the dynamic nature of the model, are all (except one) highly significant.
These findings confirm the hypothesized permanent income behavior in all countries
and the presence of time distribution effects of the demand for consumption and
imports. More on this in the next section of the paper. We may therefore detect a
remarkably uniform performance of these different in several respects countries, with
their particularities reflected in the magnitude and not the nature and significance of the
various structural responses of the model.
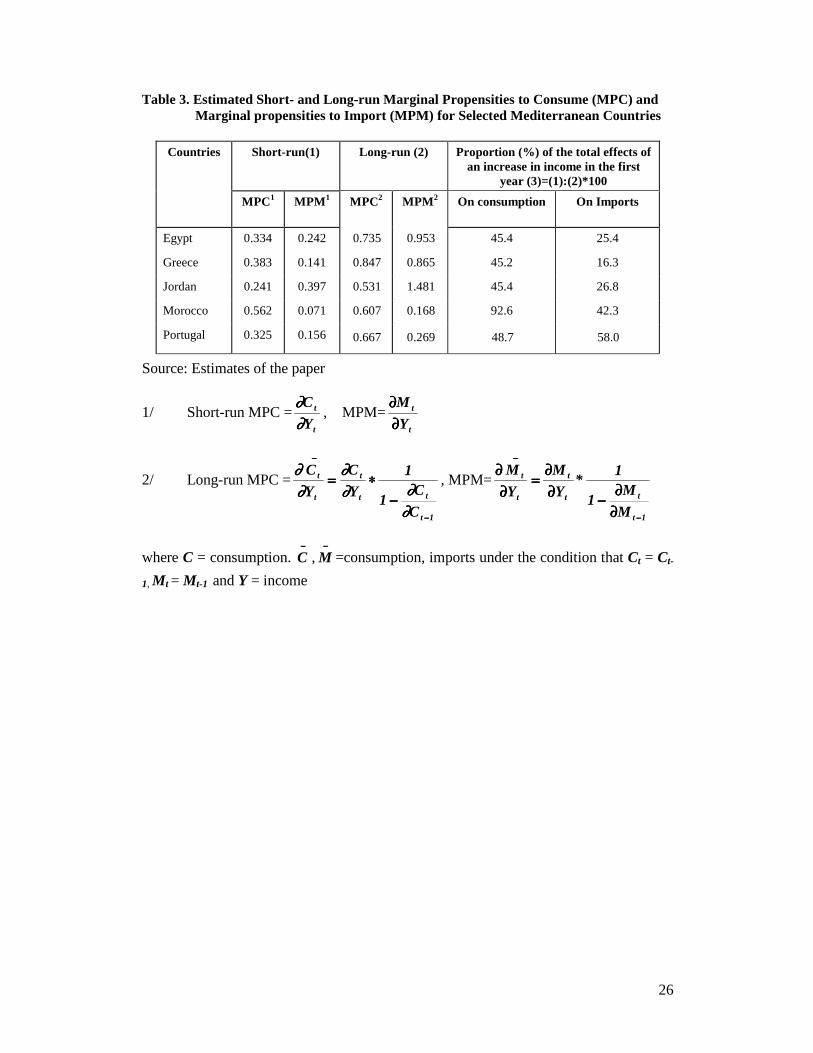
The short- and long-run marginal propensities to consume (MPC) are expressed
respectively by ∂∂C
Yt
t
and ∂∂
∂∂ ∂
∂
C
Y
C
Y C
C
t
t
t
t t
t
−
−
=−
( )1
11
, tC−
indicating the long-run
10
equilibrium of consumption (Ct = Ct-1 ). Analogously are expressed the corresponding
marginal propensities to import (MPM). The findings show that the effect of an income
change on consumption in the current year is almost identical in Egypt, Greece and
Portugal, with a MPC = 0,3 roughly, much lower 0,2 for Jordan, and much higher 0,6
for Morocco, the latter being relatively more anxious to increase its current
consumption, following any increase in income (Table 3).
Table 3 provides evidence of a remarkable uniformity as to the short-long run
spending behavior out of an increase in income. At least the four countries demonstrate
an almost identical short- / long-run MPC ratio, signalizing an almost equal speed in the
course of their development in two opposite directions: higher spending in the current
year generates a higher new demand that may induce more output (or more imports or
inflation), but it also means a lower additional saving in the current period, with
possible dampening effects on output on the supply side. Since remittances are part of
disposable income, their influence on the economy is reflected in this behavior, as we
will discuss extensively in a while. For the time being, we may conclude that all
countries behave in a permanent income perspective and all but one adapt rather
uniformly their consumer spending in the face of income increases.
Turning to imports, Egypt, Greece and Portugal with, as we saw, very similar
moderate sized short-run marginal propensities to consume, experience low short-run
marginal propensities to import, and Egypt and Greece high long-run marginal
propensities to import. This suggests that the immediate concern of consumers in these
countries is to raise their consumption (that naturally includes imported goods), but to
increase imports relatively less impatiently. Jordan and Morocco occupy two extreme
positions. The former with a relatively low short-run MPC=0,241 and a relatively higher
short-run MPM=0,397, but also a high long-run MPM=1,481, and the latter with the
reverse, a high short-run MPC=0,562 and a very low short-run MPM=0,071, but also a
low long-run MPM=0,168. The relationship of short-/long-run MPM does not however
demonstrate the roughly uniform spending behavior found for consumption. Thus, the
priorities of these countries seem to be different with respect to the timing of spending
remittances on consumption and imports.
The negative sign of lagged income in the import equation for Egypt, Greece and
Jordan demonstrates, according to our theoretical hypothesis, a hesitation to liquidate
assets for buying imports. In contrast, the corresponding positive sign for Morocco and
Portugal would be an indication of asset liquidation, but such a possibility is negligible
and statistically insignificant. The large positive and highly significant coefficient of
11
lagged imports in all five countries is an indication of a strong influence of adaptive
expectations in the purchase of imports.
The estimated investment equation behaves uniformly and as expected in all
countries but Egypt, with highly significant coefficients of the income variable, which
reflects profits, demonstrating a prompt response in investing them. The investment
restraining factor of the capital stock has the right behavior but has very low statistical
significance.
4.2 Remittance Multipliers
Based on best results (signs of coefficients and their long-run convergence
towards zero), we choose for our calculations of impact and interim multipliers the
solved TSLS estimates for all countries except Morocco , for which the reduced form
estimates are used. Under the assumption of a change of remittances by one unit ∆R = 1,
sustained for subsequent years, that is, with no further increase (∆R = 0) in years 2, 3, ....
, n, all other predetermined variables in the equation remaining unchanged for t = 1, 2,
........, n years, the calculated interim multipliers are for most cases declining towards
zero 6 years after the flow of remittances(Table 4). Notice that the current year
multiplier has in all cases the highest value than in any other single year. One may
observe here wide fluctuations of short and long-run multipliers for all four variables
among countries, and also different time patterns of the distributed effects of a change in
remittances.
The impact on all variables (except investment in Egypt) is positive for both the
short and the long-run and so are the distributed time effects, with only negative interim
multipliers in Morocco for consumption and income, for which however the positive
short-run multipliers prevail, giving a positive overall effect. In the Middle East
countries, Egypt and Jordan, the effects on consumption are delayed more than in other
countries, perhaps because of the greater uncertainty concerning the sustainability of
remittance flows in these countries, as we noted earlier. In contrast, Greeks, Moroccans
and Portuguese are more anxious to raise their consumption immediately probably
because they have an experience of more stable flows of remittances from their migrants
in Europe.
The immediate effect of remittances on investment (including housing) is rather
high in Morocco (impact multiplier 1,23) and moderate in the other countries (very
small negative in Egypt). In all of them the effect on investment and also on imports
wears out in the first or second year. Finally, the short-run income multiplier as the sum
of the multipliers of income components and the unit increase in remittances ranges
12
among countries between 0,95 for Egypt and 2,80 for Morocco. The corresponding
long-run cumulative multiplier ranges between 1,50 in Egypt and 4,06 in Greece, which
compared with the short-run values show a sparse time distribution for Jordan, Morocco
and Portugal and a more dense distribution for the rest.
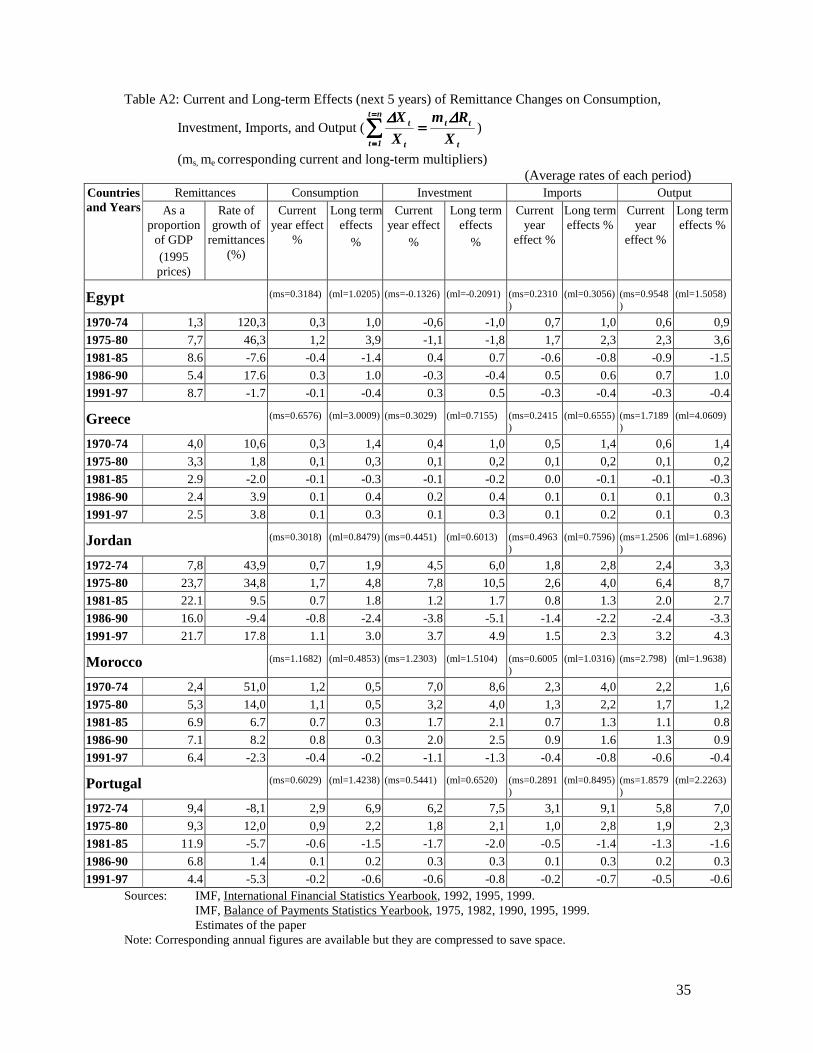
5. Estimated Macroeconomic Effects of Remittances
These multipliers naturally give the unit potential impact of remittances, but the
magnitudes of overall effects on growth of our macroeconomic variables depend on the
size of remittances and their annual changes. There are two possibilities -that serve two
different purposes- of estimating the magnitudes of these effects: first, calculate the
effects of current and past remittances on current year’s value of the variables
concerned, or second, calculate the overall impact of a current change of remittances on
current and future variables, over a number of years. The former may be expressed by
the formula:
jt
nj
0j jt
tt R*
R
XX −−−−
====
==== −−−−∑∑∑∑==== ∆∆∆∆
∂∂∂∂∂∂∂∂∆∆∆∆ (6)
and the latter by the formula:
∑∑∑∑∑∑∑∑====
==== −−−−
====
==== ∂∂∂∂∂∂∂∂====
nj
0j jt
tt
nt
1tt R
X)R(X ∆∆∆∆∆∆∆∆ , (6α)
or setting ∑∑∑∑====
==== −−−−∂∂∂∂∂∂∂∂====
nj
0j jt
tx R
Xm ,
the overall long-term effect is given by
∑∑∑∑====
========
nt
1txt )Rt(mX ∆∆∆∆∆∆∆∆ (6β)
where ∂
∂πX
Rt
t jj
−
= the multiplier of year j, ∆Rt j− = the actual change of remittances
between year (t-j) and {(t-j)-1}, Xt = any of our four endogenous variables: C, I, M and
Y, mx = long-term (truncated ) multiplier for each X, j= 0,1,2,…,n the number of years
over which the effects of remittances are distributed, converging to zero, t stands for
time and ∆ means the difference over two consecutive years. Then, the proportional
contribution of remittances in year t on any of the X’s is calculated as ( / ) *100∆X Xt t .
When the long-term multiplier is positive, which is true for all cases except one,
the increase of current remittances has positive long-term effects and the decrease of
13
current remittances negative long-term effects. But inversely, the current year’s, induced
growth rates, carrying past years’ changes in remittances (positive or negative) may not
have the same sign as the current remittance change. This is because of the dynamic
effects of remittances , i.e., because their impact spans over a number of years in the
future.
For calculating the distributed quantitative effects on consumption, investment,
imports and output, we apply the estimated interim multipliers to the actual annual
changes of remittances.
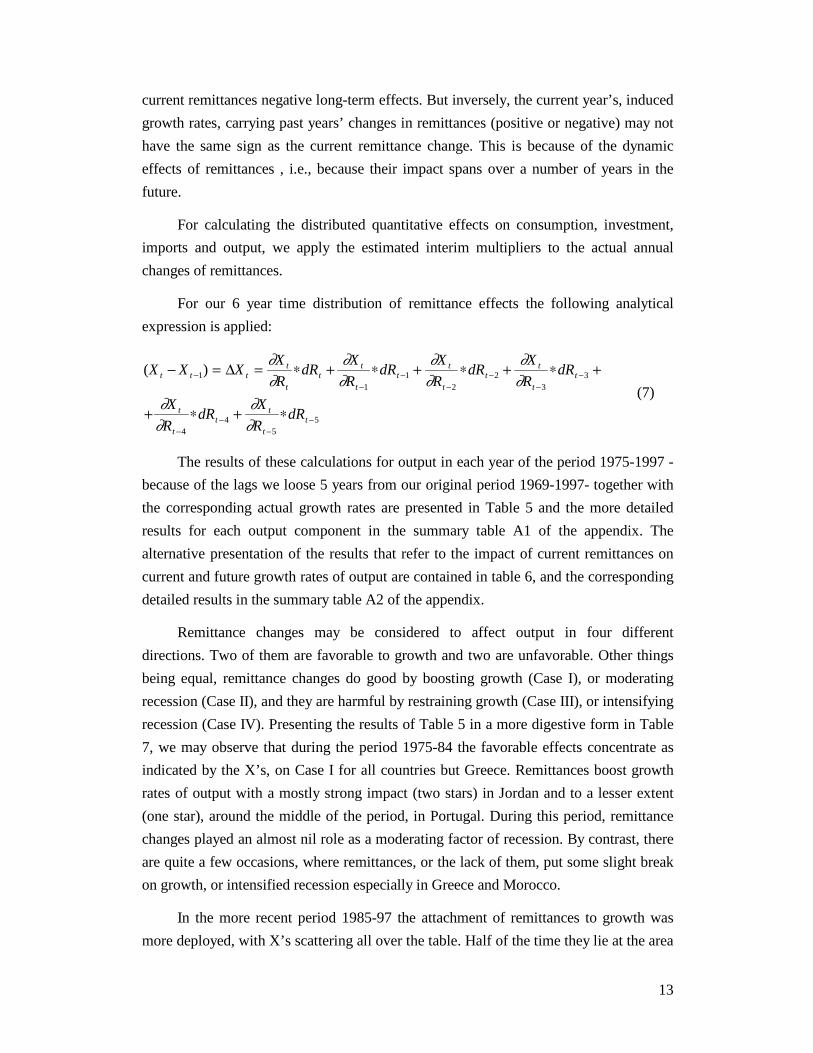
For our 6 year time distribution of remittance effects the following analytical
expression is applied:
( )X X XX
RdR
X
RdR
X
RdR
X
RdR
X
RdR
X
RdR
t t tt
tt
t
tt
t
tt
t
tt
t
tt
t
tt
− = = ∗ + ∗ + ∗ + ∗ +
+ ∗ + ∗
−−
−−
−−
−
−−
−−
11
12
23
3
44
55
∆ ∂∂
∂∂
∂∂
∂∂
∂∂
∂∂
(7)
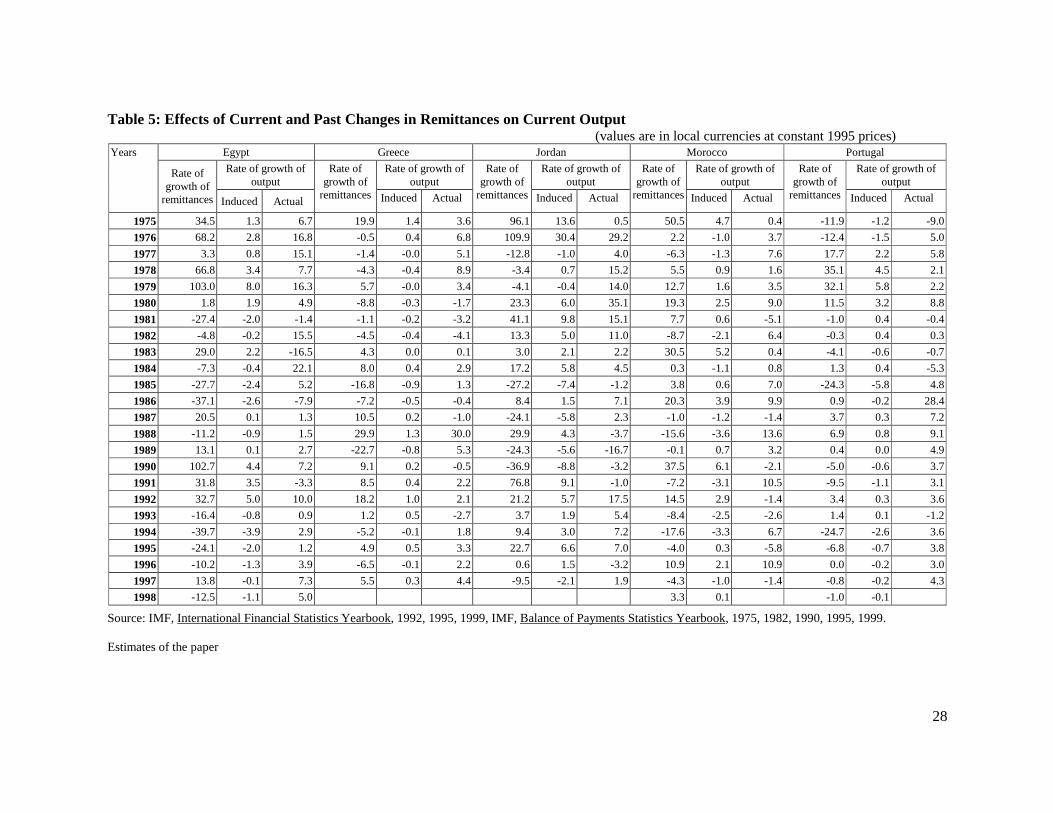
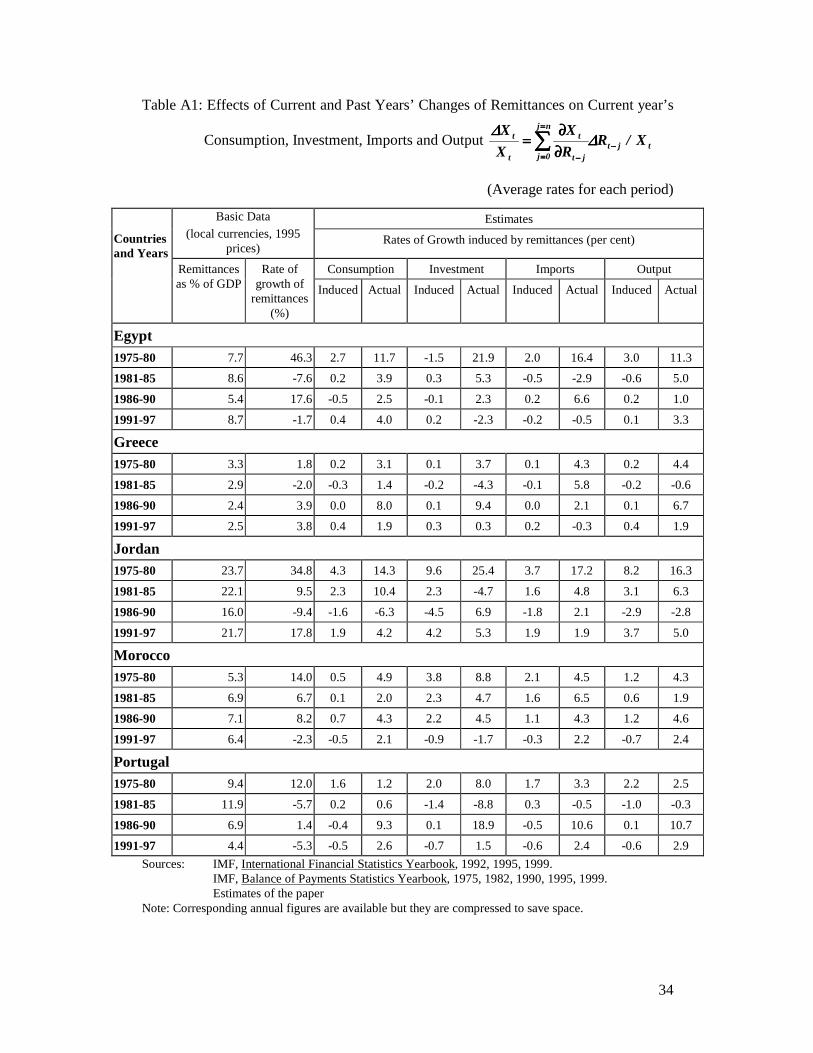
The results of these calculations for output in each year of the period 1975-1997 -
because of the lags we loose 5 years from our original period 1969-1997- together with
the corresponding actual growth rates are presented in Table 5 and the more detailed
results for each output component in the summary table A1 of the appendix. The
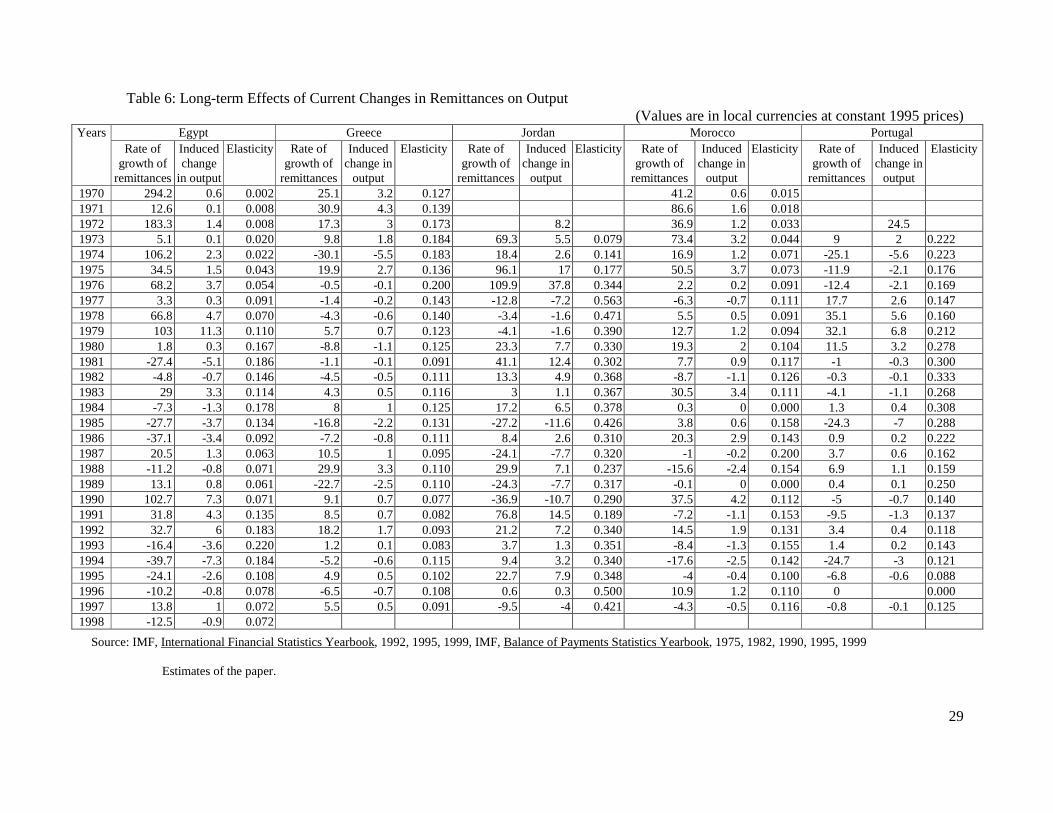
alternative presentation of the results that refer to the impact of current remittances on
current and future growth rates of output are contained in table 6, and the corresponding
detailed results in the summary table A2 of the appendix.
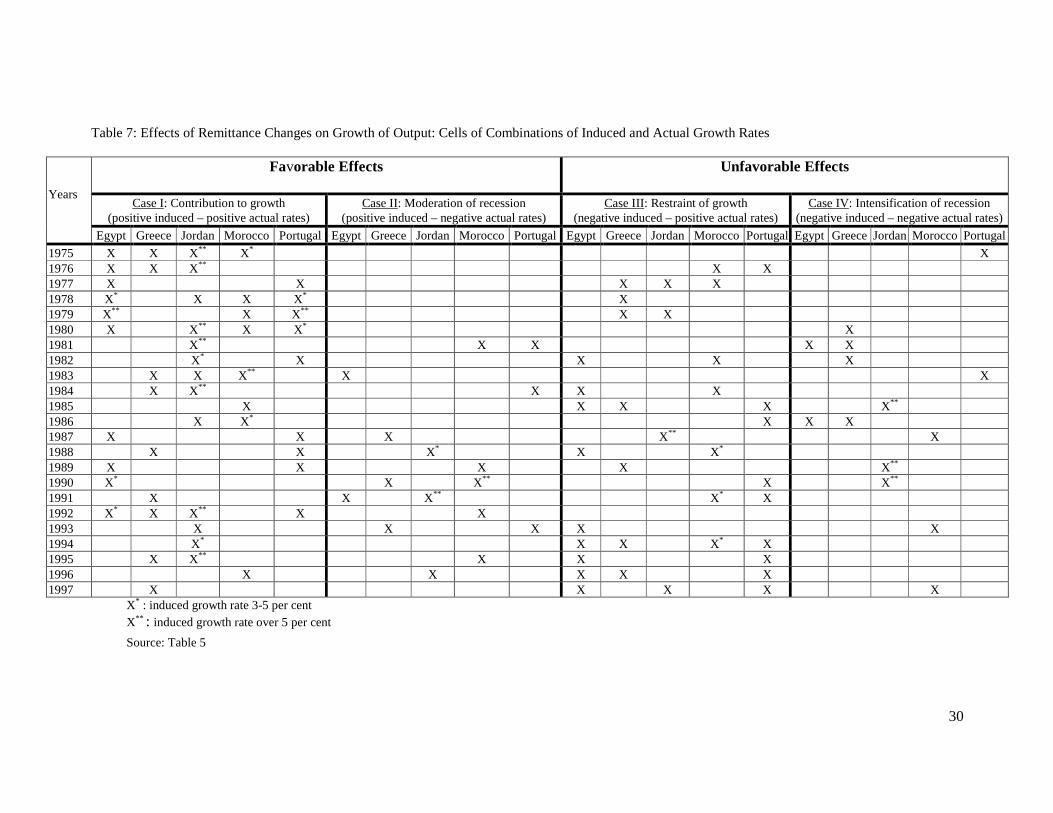
Remittance changes may be considered to affect output in four different
directions. Two of them are favorable to growth and two are unfavorable. Other things
being equal, remittance changes do good by boosting growth (Case I), or moderating
recession (Case II), and they are harmful by restraining growth (Case III), or intensifying
recession (Case IV). Presenting the results of Table 5 in a more digestive form in Table
7, we may observe that during the period 1975-84 the favorable effects concentrate as
indicated by the X’s, on Case I for all countries but Greece. Remittances boost growth
rates of output with a mostly strong impact (two stars) in Jordan and to a lesser extent
(one star), around the middle of the period, in Portugal. During this period, remittance
changes played an almost nil role as a moderating factor of recession. By contrast, there
are quite a few occasions, where remittances, or the lack of them, put some slight break
on growth, or intensified recession especially in Greece and Morocco.
In the more recent period 1985-97 the attachment of remittances to growth was
more deployed, with X’s scattering all over the table. Half of the time they lie at the area

14
of favorable cases for all countries together and the other half to the area of unfavorable
cases, but with the stronger effects allocated to the promotion of growth or the restraint
of recession. Countries that are relatively more favored in this respect are Jordan in the
later part of the period, and to a lesser extent Morocco and Greece which are very
weakly influenced. In the years 1985, 1989 and 1990, remittances seem to have
intensified recession very strongly in Jordan, with induced negative growth rates over 10
per cent.
In Egypt, the 1990 invasion to Kuwait cost the deportation of half a million
Egyptian workers, leaving behind their savings and their unpaid earnings, which by
itself tended to reduce the flow of remittances (Farrag, 1996). Nevertheless, the flow
actually increased greatly in 1991 and 1992, very probably as the result of the
devaluation of the Egyptian pound by 25 per cent in these years, that attracted
remittances from the black market. This, according to our findings, raised output after
several years of being in the red, mostly through imports and consumption. On the other
hand, Egypt has several spells, especially in mid and late 1990’s, and Greece fewer
spells of a weak restraint of growth.
In Morocco remittances imposed a strong restraint on growth (between 3 and 5 per
cent induced negative growth rates) in 1988, 1991 and 1994, and in Portugal a weak
restraint over several years. Other evidence for Morocco (Wahba, 1996,p.19) testifies to
a negative impact of remittances on agricultural output, due to abandoned cultivation by
recipients who can afford to live out of remittances, spending also high amounts on
housing. In heavy migration regions about 75 to 80 per cent of new houses belong to
migrants (Bencherifa, et al., 1992, p.99). Our findings seem to support this evidence. In
several years induced output was negative and in others the positive rates were very low,
whereas induced investment growth that includes housing and induced growth of
imports, particularly in the 1970’s and 1980’s, were often higher than induced output
rates. These developments very probably show that investment concerns mostly
housing, imports concern mostly consumer goods and the low or negative GDP rates
reflect the drop of agricultural production.
One conclusion in this context is that in reference to the whole period covered in
this paper, with the exception of Jordan, and a few years of an extremely weak impact
for Greece, recession has not been intensified by remittances, or the lack of them, in the
rest of the countries concerned. There has been however a problem of remittances
restraining growth which is generally slim except of Morocco in 1988,1991 and 1994,
and Jordan in 1987, where the problem is more serious. One may wonder after the
discussion in this section whether, as it is put by several authors and reiterated by
15
Adams (1991, p.12), remittances contribute to development in the Third World. Our
findings cannot provide any concrete universal answer on this issue. However, for part
of the time and for some of the countries the answer is in the affirmative. These findings
may also put in question the argument that the literature for Middle East demonstrates
that remittances have not contributed to development (Wabha, 1996, p.19). The finding
of positive and often high impact of remittances on growth in the 1970’s for Egypt and
even the much stronger findings for most of the period concerned for Jordan supports
the view that remittances are generally a contributing factor to development of these
countries. But at the same time the very low or negative induced output growth in the
1980’s in Egypt may partly justify the contention that the impact of remittances on
development is marginal for this country (Looney, 1990).
Concerning the rest of the endogenous variables in our model, for which the
annual estimates are compressed in Table A1, in Greece all induced growth rates,
positive or negative, are below 1 per cent, demonstrating very weak effects in either
direction. In Egypt, the impact of remittances on all three variables is generally weak,
but whenever it is strong is on the side of favorable effects as for consumption in 1979
and 1992 and for imports in 1978, 1979, 1990 and 1992. In Jordan, the induced positive
growth rates prevail and are mostly strong and simultaneous for all variables, as in the
years 1975, 1976, 1981, 1982, 1984 and 1995. But negative and simultaneous effects are
also present, as in 1990, for all three variables, and for investment and imports in 1985,
1987 and 1989. Our results for Jordanian investment and imports are compatible with
Keely and Saket (1984) finding that in certain periods of the 1970’s and 1980’s
remittances contributed to imports of this country, and by implication they are beneficial
and not harmful to the economy, through the imported production goods (Russell, 1992,
p.274). Remittance induced effects are generally small for Portugal, most of the time are
positive for investment, but not for consumption or imports, with many years of
negative induced growth rates. Strong effects, positive or negative, are rather few and
simultaneous in sign and direction for all three variables. Positive for 1978, 1979 and
1980 and negative for 1985 and 1994. For the rest of the years, remittances affect our
macroeconomic variables weakly and in both directions.
The paper sheds some light on the debate of whether remittances contribute to
investment, with most literature taking a negative stand. Our findings demonstrate
positive and very often high rates of induced investment during a considerable part of
the period investigated for Jordan and Morocco, and for a few years in the late 1970’s
for Portugal, but also several years of negative spells of induced investment. Egypt’s
negative induced investment growth rates for most of the period corroborates Feiler’s
(1987) contention that remittances influence Egyptian investment negatively and
16
Farrag’s (1996) claim that investment financed by remittances is limited in Egypt.
Jordan’s investment, and output, was most favored during the period 1980-1984, in
which a very high proportion of Jordan’s labor force was working outside the country
(40% in 1984) (Samha, 1992). We may also note that this strong boost to growth took
place in a period where 70 to 80 per cent of remittances were spent on consumption
(Samha, 1992). This suggests, as it has often been argued, that spending remittances
even in consumption may be productive through its diffused effects on the economy.
One conclusion of this discussion is that, as a rule, there is quite a uniformity, but
with different timing in the way in which remittances affect the variables of our model
for the different countries investigated. This is even more the case when the induced
growth rates, positive or negative, are relatively high.
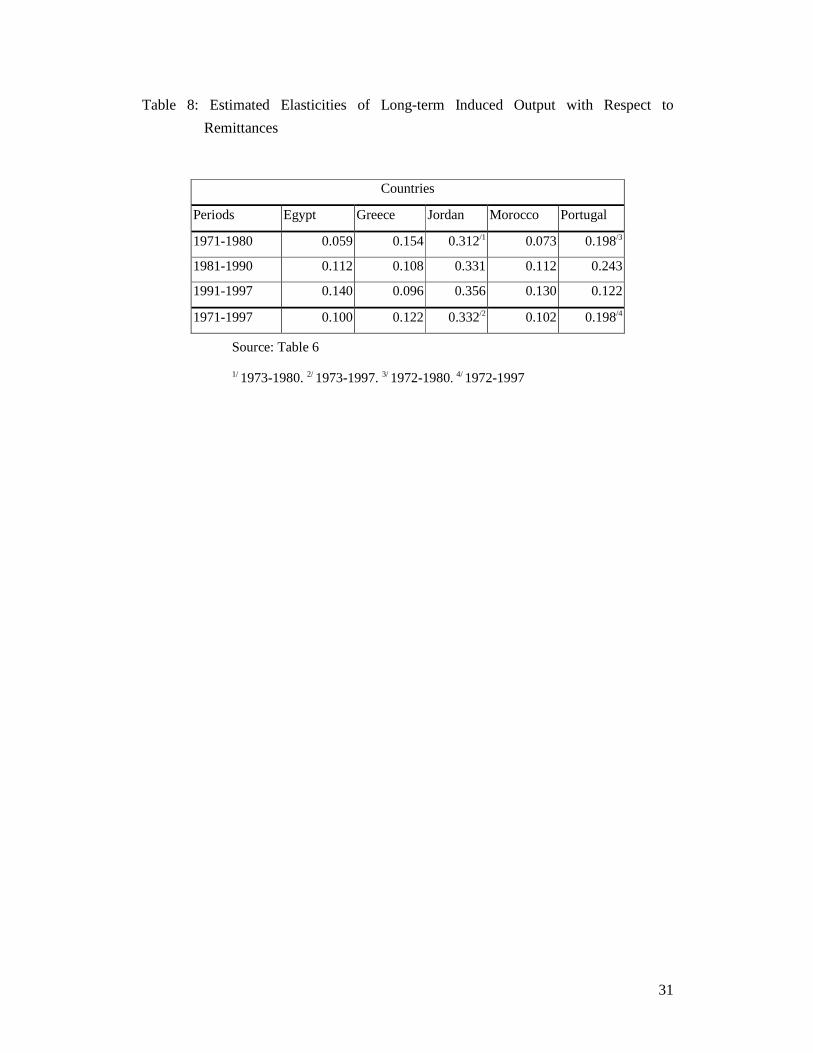
6. Analyzing Further the Growth Generating Capacity of Remittances
For our purposes in this paper, the growth generating capacity of remittances is
demonstrated by the elasticity of long-term induced growth rates of output with respect
to the growth rates of remittances. Table 6 shows that for each country these elasticities
are generally changing over time within very narrow limits, and they range on the
average narrowly among countries. Dividing the whole period in three sub-periods, we
may observe for most of the countries very close values in each time period (Table 8).
For Egypt, Greece and Morocco, the average values for the whole period are
correspondingly 0.10 and 0.12, for Portugal 0.20 and for Jordan 0.33. In other words, in
Jordan the growth generating capacity of remittances is three times higher than that of
Egypt, Greece and Morocco, with Portugal occupying an intermediate place. The
elasticity is rising considerably over time in Egypt and Morocco, slightly in Jordan, is
falling drastically in Greece, rising and subsequently falling in Portugal, but, as table 6
shows, with wide annual fluctuations above zero in the 1980’s and below zero in the
1990’s.
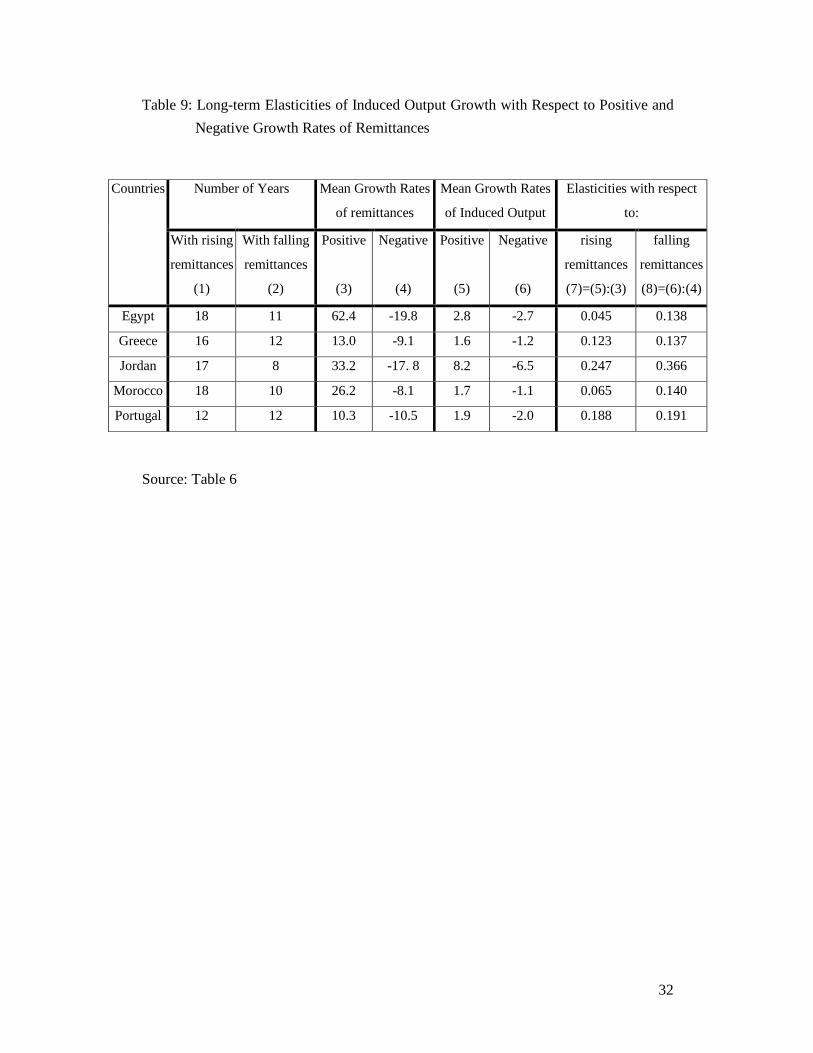
It is interesting to observe in Table 6 that there appears to be an asymmetry in the
positive or negative response of output to remittance changes, which is particularly
marked for Egypt, Jordan and Morocco. For these countries, the growth generating
capacity of rising remittances is much smaller than the growth destroying capacity of
falling remittances. This is indicated by the finding that the elasticities of induced
negative growth rates of output with respect to falling remittances are much higher
compared to the corresponding elasticities with respect to rising remittances (Table 9).
They are about three times higher for Egypt and Morocco, and almost 1,5 times higher
for Jordan. On the other hand, Greece and Portugal experience each just about the same
17
elasticities in the years of rising and the years of falling remittances. Thus, at least for
the less developed non-European countries in our sample, the good done by remittances
when they rise is not as great as the bad done when they fall. Among countries, this
diversification of elasticities is wider in the years of rising remittances and, except for
Jordan, more convergent, during the years of falling remittances. In other words,
countries are on the average more uniformly affected during the downturn, than during
the upturn of remittance flows.
Concluding, the wide fluctuations in the real value of remittances contribute often
to wide fluctuation of output growth and add a strong element of instability in the
economies concerned. These economies seem to be weakly sheltered against the
damaging impact of falling remittances which is, in effect, a reflection of the Dutch
disease problem that is generated by the euphoria and the comfort brought about by
sustained periods of large flows of remittances.
These diverging findings call for an explanation concerning the factors that
differentiate the inter-country and inter-temporal responses of the economies to
remittance changes. Such factors could be the relative weight of remittances in the
economy, expressed by the ratio of remittances over GDP (RGDP); the growth rates of
remittances (GREM), standing for the relative liquidity and demand that they generate,
and the growth rate of GDP (GGDP) indicating the phase of the business cycle. We
experiment by regressing against these variables alternatively the estimated cross-
country time series induced growth rates of output, or the estimated elasticity of output
with respect to remittances, adding also four dummies for capturing country specific
conditions, attitudes or policies that, one way or another, may contribute to this
differentiation. In an effort to document the asymmetry observed, apart from running
regressions with the whole sample we also run regressions for the elasticity variable, by
using separately the sub-sample of rising remittances and the sub-sample of falling
remittances.
The estimated regressions are presented in Table 10. In all four equations the
relative weight of remittances in the economy (RGDP) has, as should be expected, a
strong and highly significant impact on both induced output and long-term elasticity.
The liquidity generated by remittance changes (GREM) is also a positive and highly
significant factor for induced output, and a negative, as it should be, and highly
significant factor for the elasticity. GDP growth rates exert a procyclical impact on both
dependent variables. The country dummies are in almost all cases significant, suggesting
that particular attitudes, conditions and policies in each country contribute to the
differentiation of the two dependent variables. Finally, the above detected asymmetry in
18
the sensitivity of output with respect to remittances is supported by these findings. This
support is manifested in the relatively higher coefficients of all variables in the
equations with the negative growth rates of remittances, compared with the equations
with positive rates. The coefficients of the weight of remittances in the economy and of
the rate of decline of remittances are considerably higher relatively to the corresponding
coefficients in the equations of the sub-sample with rising remittances.
Concluding, the inter-country and inter-temporal induced output differentiation is
generated by the relative weight of remittances in the economy and the speed of change
in the volume of remittances, whereas the impact of economic growth or recession is
procyclical. Rising remittances are relatively less powerful to generate output as falling
remittance are powerful to reduce output.
7. Concluding Remarks
This paper is motivated by the uncertainties surrounding the role of remittances in
growth and development of labor exporting countries. Experimenting with a model of
simultaneous equations, separately with five developing countries, having different
migratory characteristics and migrant destinations, could possibly run the risk of
troublesome econometric misfits and nonsensical results. Fortunately, this does not
seem to be the case. The estimated model offers some common ground for discussion
but also the opportunity of assessing the particularities of the countries involved. It is a
dynamic demand oriented model, with a sound theoretical basis, suitable, in our view,
for the issue at hand, and appropriate for pinpointing short- and long-run structural
characteristics and effects. The distributed-lag feature of the model is able to determine
the time distribution of the effects of remittances on the endogenous macroeconomic
variables and to trace their growth path over time.
The estimated model demonstrates a great structural uniformity in the experiences
of different countries, but it also exhibits the relative significance of country specific
conditions through which the effects of remittances are differentiated in size but not in
nature. The short-/long-run distinction of remittance effects reveals different inter-
country priorities in the urgency of remittance spending on consumption, investment or
imports. The model through its consecutive phases culminates with the estimation of the
growth generating capacity of remittance flows for each country over time and reveals a
rather unstable situation in all countries, with fluctuating positive and negative effects of
remittances. There are good cases where remittances boost growth, or moderate
recession, and bad cases where remittances restraint growth or accentuate recession, but
the good cases are generally more than the bad cases.

19
The diversification of output effects of remittances is explained by their relative
weight in the economy, the liquidity generated by them and the phase of the business
cycle, as well as conditions, attitudes and policies in individual countries. An asymmetry
is detected in the way the economy responds to positive or negative growth of
remittance flows. The response is stronger to falling than to rising remittances.
Furthermore, countries are more uniformly affected by the fall than by the rise of
remittances, witnessing the often discussed vulnerability of the economies that depend
heavily on remittances and a common inability of protecting themselves against the bad
turn of remittance flows.
20
References
Adams, Richard, H. (1991), The Effects of International Remittances on Poverty, Inequality and
Development in Rural Egypt. International Food Policy Research Institute, Research
Report 96.
Ando, A. and Modigliani, F. (1963), The Life-Cycle Hypothesis of Saving: Aggregate
Implications and Tests”, American Economic Review, March: 54-84.
Bencherifa, A. Berriane, M. and Refass, M. (1992) Etude des Mouvements Migratoires du
Maroc vers la Communauté Européene. Etude pour la Commission. Rapport Final,
Group d’Etudes et de Recherches Appliquées. Faculté des Lettres et des Sciences
Humaines, Rabat, (mimeo).
Brown, T. M. (1952), “Habit Persistence and Lags in Consumer Behavior”, Econometrica, Vol.
20: 355-371.
Chenery, H. B. and Bruno, M. (1962) “Development Alternatives in an Open Economy: The
Case of Israel”. Economic Journal, 72: 79-103.
Christ, Carl, F. (1966), Econometric Models and Methods. John Wiley and Sons, Inc. New
York.
Davidson, J. E. H., Hendry, D. F., Srba, F. And Yeo, S. (1978), “Econometric Modelling of the
Aggregate Time Series Relationship between Consumers’ Expenditure and Income in
the U.K.”, Economic Journal, 88: 661-692.
Davis, E. P. (1984), “The Consumption Function in Macroeconomic Models: A Comparative
Study”. Applied Economics, 16: 799-838.
Djajic, S. (1986), “International Migration, Remittances and Welfare in a Dependent Economy”.
Journal of Development Economics, 21, May: 229-234.
Duesenberry, J. S. (1958), Business Cycles and Economic Growth, McGraw-Hill, New York.
Elbadawi, Ibrahim, A., Rocha, Robert de Rezende (1992), “Determinants of Expatriate
Workers’ Remittances in North Africa and Europe”. Policy Research Working Paper,
WPS 1038, World Bank, November.
Farrag, Mayar (1996), “Emigration Dynamics in Egypt”. IOM/UNFRA, Policy Workshop on
Emigration Dynamics in the Arab Region, Paper No 1, Geneva, Switzerland, 7-8
October (mimeo).
Feiler, G. (1987), “Scope and Some Effects of Remittances of Egyptian Migrant Workers in the
Arab Oil-Producing Countries: 1973-1984”. Asian and African Studies, Vol. 21: 305-
325.
Friedman, M. (1957), A Theory of the Consumption Function, NBER, Princeton.
21
Garson, Jean-Pierre (1994), “The Implications for the Maghrebian Countries of Financial
Transfers from Emigrants”. In Migration and Development New Partnerships for Co-
operation, OECD, Paris.
Glytsos, Nicholas, P. (1993), “Measuring the Income Effects of Migrant Remittances: A
Methodological Approach Applied to Greece”. Economic Development and Cultural
Change, Vol. 42, No. 1, October: 131-168.
Glytsos, Nicholas, P. (1998) “La Migration Comme Moteur de l’Intégration Régionale:
L’Example des Transferts de Fonds”. In OCDE, Migrations, Libre-echange et
Intégration Régionale dans Le Bassin Méditerranéen, OCDE, Paris, pp. 173-186.
Glytsos, Nicholas, P. (1998a), “Migrant Remittances in the MENA Region: Issues and Policies
for Consideration”, Forum, (Newsletter of the Economic Research Forum for the Arab
Countries, Iran and Turkey), Vol. 5, No. 1, May.
Goldberger, A. S. (1959), Impact Multipliers and Dynamic Properties of the Klein-Goldberger
Model, Contributions to Economic Analysis XIX, North-Holland Publishing Company,
Amsterdam.
Gujarati, D. N. (1988), Basic Econometrics, Second Edition, McGraw-Hill, New York.
Johnston, J. (1972), Econometric Methods, 2nd edition, McGraw-Hill, New York.
Kandil, M and Metwally, M.F. (1990), “The Impact of Migrants’ Remittances on the Egyptian
Economy”. International Migration, Vol. XXVIII, No. 2, June: 159-179.
Keely, C. B. And Saket, B. (1984), “Jordanian Migrant Workers in the Arab Region: A Case
Study of Consequences for Labour Supplying Countries”, The Middle East Joutnal,
Vol. 38, No. 4: 685-698.
Keely, C. and Tran, B.N., (1989), “Remittances from Labor Migration: Evaluations,
Performance and Implications.” International Migration Review, 23(3): 500-525.
Kirwan, F. and Holden, D. (1986), Emigrants’ Remittances, Non-Traded Goods and Economic
Welfare in the Source Country”. Journal of Economic Studies, Vol. 13, No. 2: 52-58.
Kritz, M. M., Keely, C. B. and Tomasi, S. M. (eds), (1981), Global Trends in Migration Centre
for Migration Studies, Staten Island.
Looney, R.E. (1990), “Macroeconomic Impacts of Worker Remittances on Arab World Labour
Exporting Countries”. International Migration, Vol. 28: 25-44.
Lundahl, Mats (1985), “International Migration, Remittances and Real Incomes: Effects on the
Source Country”. Scandinavian Journal of Economics 87(4): 647-657.
Oberai, A.S. and Singh, H. K. M. (1980), “Migration, Remittances and Rural Development:
Findings of a Case Study in the Indian Punjab”. International Labour Review, Vol. 119,
No. 2, March-April: 229-241.
22
Pavlopoulos, P. (1966), A Statistical Model for the Greek Economy, 1949-1959. Contributions
to Economic Analysis, No. 44. North-Holland Publishing Company, Amsterdam.
Richards, A. and Martin, P.L. (1983), “The Laissez-faire Approach to International Labor
Migration: The Case of the Arab Middle East”. Economic Development and Cultural
Change, 31: 455-474.
Rivera-Batiz, F. (1986), “International Migration, Remittances and Economic Welfare in the
Source Country”. Journal of Economic Studies, Vol. 13, No. 3: 3-19.
Russell, Sharon Stanton (1986), “Remittances from International Migration: A Review in
Perspective” World Development, vol. 14, No 6: 677-696.
Russell, Sharon Stanton, (1992), “Migrant Remittances and Development”. International
Migration, Vol. XXX, No. 3/4 (Special Issue): 267-287.
Samha, M. (1992), “The Impact of Migratory Flows on Population Changes in Jordan: A
Middle Eastern Case Study”. International Migration, Vol. XXX, No. 2.
Stark, O., Taylor, J. E., Yitzhaki, S. (1986), “Remittances and Inequality”. Economic Journal,
96, September: 722-740.
Taylor, J. E. and Wyatt, T. J. (1996), “The Shadow Value of Migrant Remittances, Income and
Inequality in a Household-farm Economy”, The Journal of Development Studies, Vol.
32. No. 6, August: 899-912.
Wahba, J. (1996), “Remittances in the Middle East: A Review”. Paper presented in the
Conference on Labor Markets and Human Resource Development, Kuwait, 16-18
September. Sponsored by the Economic Research Forum for the Arab Countries, Iran
and Turkey, mimeo.
23
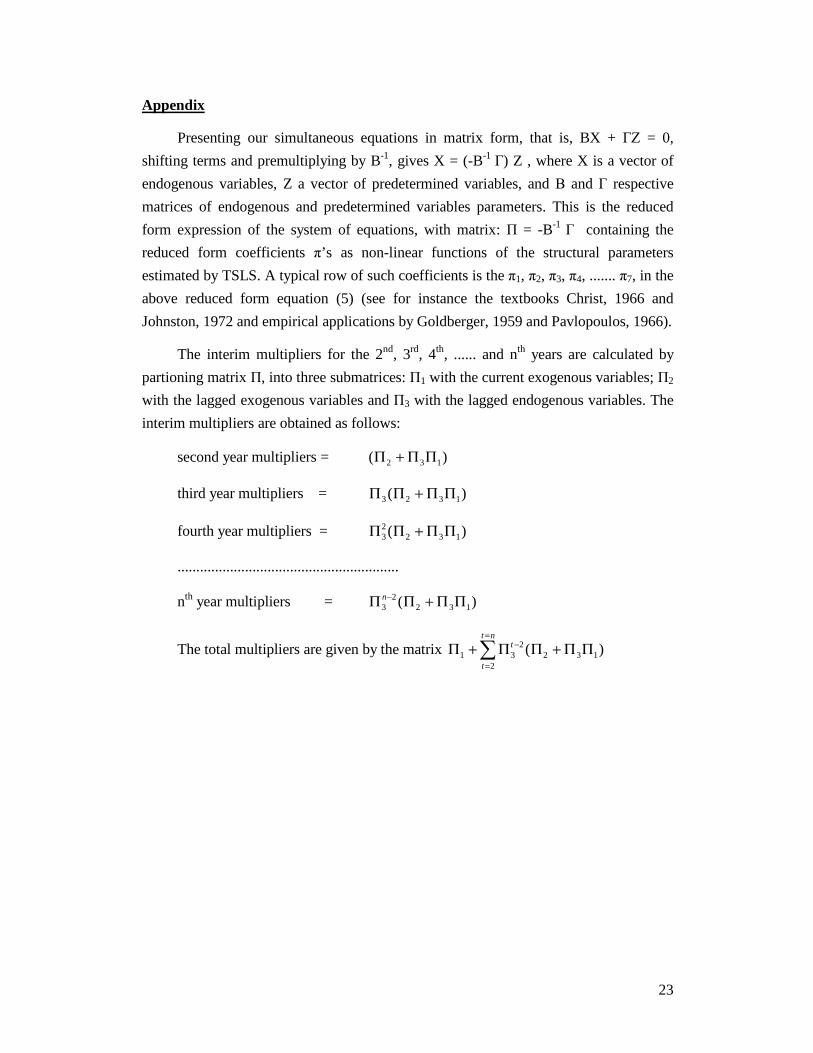
Appendix
Presenting our simultaneous equations in matrix form, that is, BX + ΓΖ = 0,
shifting terms and premultiplying by B-1, gives X = (-B-1 Γ) Z , where X is a vector of
endogenous variables, Z a vector of predetermined variables, and Β and Γ respective
matrices of endogenous and predetermined variables parameters. This is the reduced
form expression of the system of equations, with matrix: Π = -B-1 Γ containing the
reduced form coefficients π’s as non-linear functions of the structural parameters
estimated by TSLS. A typical row of such coefficients is the π1, π2, π3, π4, ....... π7, in the
above reduced form equation (5) (see for instance the textbooks Christ, 1966 and
Johnston, 1972 and empirical applications by Goldberger, 1959 and Pavlopoulos, 1966).
The interim multipliers for the 2nd, 3rd, 4th, ...... and nth years are calculated by
partioning matrix Π, into three submatrices: Π1 with the current exogenous variables; Π2
with the lagged exogenous variables and Π3 with the lagged endogenous variables. The
interim multipliers are obtained as follows:
second year multipliers = ( )Π Π Π2 3 1+
third year multipliers = Π Π Π Π3 2 3 1( )+
fourth year multipliers = Π Π Π Π32
2 3 1( )+
...........................................................
nth year multipliers = Π Π Π Π32
2 3 1n− +( )
The total multipliers are given by the matrix Π Π Π Π Π1 32
22 3 1+ +−
=
=
∑ t
t
t n
( )
24
Table 1. Remittances as a proportion (%) of GDP and of Merchandise Exports (X) in selected Mediterranean Countries and Selected Years
(Remittances / GDP) *100
(at constant 1995 prices in local currencies)
(Remittances / X) *100
(at current US Dollars )
Volume of Remittances (In million of current US
Dollars)
Countries 1974 1978 1982 1986 1990 1994 1997 1974 1978 1982 1986 1990 1994 1997 1980 1990 1997
Egypt 2. 9 7.3 7.5 4.1 8.94 7.1 4. 9 22.3 117.8 60.7 95.2 118.9 97.7 74.1 2791 4284 3697
Jordan 10. 4 23.3 22.4 18.8 11.2 20. 7 21.9 63.6 197.6 144.0 161.7 42.1 87.3 84.1 666.5 447.9 1542.7
Greece 3.4 3.0 2. 9 2.4 2.2 2.6 2.4 43.5 41.1 24.5 20.9 28.6 49.4 52.4 1087 1817 2816
Morocco 3.7 4.9 5.7 7.9 8.0 5.6 5.6 21.1 59.0 41. 6 58.0 47.8 46.2 40.7 1004 2012 1893
Portugal 8.0 9. 6 12.5 7.4 6.1 4.0 3.3 58.3 74.7 63.1 35.3 27.6 20.0 13.2 2999 4504 3231
Sources: IMF, International Financial Statistics Yearbook, 1992, 1995, 1999.
IMF, Balance of Payments Statistics Yearbook, 1975, 1982, 1990, 1995, 1999.
25
Table 2: Structural Regression Coefficients (TSLS estimates)
CONSUMPTION (C) INVESTMENT (I) IMPORTS (M)
COUNTRIES Const Yt Ct-1 2
R−−−−
DW Const Yt K t-1 2
R−−−−
DW Const Yt M t-1 Y t-1 2
R−−−−
DW
EGYPT -3334.4 0.334 0.546 0.975 2.116 24766.9 -0.139 0.174 0.707 0.387 3977.4 0.242 0.746 -0.195 0.868 1.884
(-0.843) (3.311) (3.839) (2.818) (-1.106) (2.864) (1.103) (2.047) (5.090) (-1.706)
GREECE -1323224 0.383 0.548 0.966 1.815 2398278 0.134 -0.018 0.339 0.966 299949 0.141 0.837 -0.110 0.952 1.935
(-1.250) (2.036) (2.468) (3.769) (2.364) (-0.583) (1.063) (2.044) (9.016) (-1.549)
JORDAN 224.1 0.241 0.546 0.937 1.525 -106.8 0.356 -0.040 0.733 0.713 212.3 0.397 0.732 -0.271 0.910 2.368
(1.930) (2.836) (3.614) (-0.745) (4.684) (-1.544) (1.493) (1.809) (3.816) (-1.565)
MOROCCO1/
9473.4 0.562 0.075 0.988 1.235 -19460.2 0.386 -0.057 0.761 0.810 1449.3 0.071 0.578 0.044 0.916 1.643
(2.902) (8.726) (0.715) (-1.159) (2.967) (-1.478) (0.324) (0.436) (3.646) (0.299)
PORTUGAL -37874.9 0.325 0.513 0.990 1.717 903.5 0.293 -0.029 0.793 0.750 -227006 0.156 0.420 0.072 0.951 1.267
(-0.257) (5.069) (5.004) (0.002) (4.251) (-1.040) (-1.105) (1.467) (2.425) (0.526)
Expected Signs + + + - + + ±±±±
t-values in parentheses
1/ OLS estimates. for consumption and investment. the TSLS coefficients being unacceptable.
Source: Estimates of the paper
26
Table 3. Estimated Short- and Long-run Marginal Propensities to Consume (MPC) and Marginal propensities to Import (MPM) for Selected Mediterranean Countries
Short-run(1) Long-run (2)
Proportion (%) of the total effects of an increase in income in the first
year (3)=(1):(2)*100
Countries
MPC1 MPM1 MPC2 MPM2 On consumption On Imports
Egypt 0.334 0.242 0.735 0.953 45.4 25.4
Greece 0.383 0.141 0.847 0.865 45.2 16.3
Jordan 0.241 0.397 0.531 1.481 45.4 26.8
Morocco 0.562 0.071 0.607 0.168 92.6 42.3
Portugal 0.325 0.156 0.667 0.269 48.7 58.0
Source: Estimates of the paper
1/ Short-run MPC =t
t
Y
C
∂∂∂∂∂∂∂∂
, MPM=t
t
Y
M
∂∂∂∂∂∂∂∂
2/ Long-run MPC =
1t
tt
t
t
t
C
C1
1Y
C
Y
C
−−−−
−−−−
−−−−∗∗∗∗====
∂∂∂∂∂∂∂∂∂∂∂∂
∂∂∂∂∂∂∂∂∂∂∂∂
, MPM=
1t
tt
t
t
t
M
M1
1*
Y
M
Y
M
−−−−
−−−−
∂∂∂∂∂∂∂∂−−−−∂∂∂∂
∂∂∂∂====∂∂∂∂
∂∂∂∂
where C = consumption. −−−−C ,
−−−−M =consumption, imports under the condition that Ct = Ct-
1, Mt = Mt-1 and Y = income

27
Table 4. Time Distribution of the Effects of a Unit Change in Remittances (∆R=1) on Certain Macroeconomic Variables (impact and dynamic multipliers)
(∆R=1. sustained over the years)
Impact multipliers (short-run
effect)
Interim (dynamic) multipliers
Years
Countries
and
Variables
Year 1 2 3 4 5 6
Truncated total multipliers
(long-run effects)
(sum of the 6 years)
EGYPT
Consumption 0.3184 0.2339 0.1727 0.1282 0.0956 0.0717 1.0205
Investment -0.1326 -0.0250 -0.0187 -0.0141 -0.0107 -0.0081 -0.2091
Imports 0.2310 0.0293 0.0193 0.0126 0.0082 0.0052 0.3056
Income 0.9549 0.1797 0.1347 0.1014 0.0768 0.0584 1.5058
GREECE
Consumption 0.6576 0.5882 0.5235 0.4637 0.4089 0.3590 3.0009
Investment 0.3029 0.1050 0.0927 0.0815 0.0713 0.0622 0.7155
Imports 0.2415 0.0974 0.0901 0.0827 0.0754 0.0683 0.6555
Income 1.7189 0.5957 0.5260 0.4625 0.4048 0.3529 4.0609
JORDAN
Consumption 0.3018 0.2070 0.1406 0.0945 0.0628 0.0411 0.8479
Investment 0.4451 0.0625 0.0408 0.0263 0.0165 0.0102 0.6013
Imports 0.4963 0.0940 0.0667 0.0470 0.0329 0.0228 0.7596
Income 1.2506 0.1755 0.1147 0.0738 0.04647 0.0285 1.6896
MOROCCO
Consumption 1.1682 -0.6270 -0.0432 -0.0045 -0.0058 -0.0024 0.4853
Investment 1.2303 0.2434 0.0083 0.0176 0.0080 0.0028 1.5104
Imports 0.6005 0.3040 0.0784 0.0309 0.0128 0.0050 1.0316
Income 2.7980 -0.6880 -0.1133 -0.0178 -0.0107 -0.0045 1.9638
PORTUGAL
Consumption 0.6029 0.3411 0.2073 0.1314 0.0852 0.0559 1.4238
Investment 0.5441 0.0289 0.0293 0.0227 0.0161 0.0110 0.6520
Imports 0.2891 0.2714 0.1367 0.0767 0.0464 0.0293 0.8495
Income 1.8579 0.0986 0.0999 0.0774 0.0549 0.0376 2.2263
Source: Estimates of the paper
28
Table 5: Effects of Current and Past Changes in Remittances on Current Output (values are in local currencies at constant 1995 prices)
Egypt Greece Jordan Morocco Portugal
Rate of growth of output
Rate of growth of output
Rate of growth of output
Rate of growth of output
Rate of growth of output
Years
Rate of growth of
remittances Induced Actual
Rate of growth of
remittances Induced Actual
Rate of growth of
remittances Induced Actual
Rate of growth of
remittances Induced Actual
Rate of growth of
remittances Induced Actual
1975 34.5 1.3 6.7 19.9 1.4 3.6 96.1 13.6 0.5 50.5 4.7 0.4 -11.9 -1.2 -9.0
1976 68.2 2.8 16.8 -0.5 0.4 6.8 109.9 30.4 29.2 2.2 -1.0 3.7 -12.4 -1.5 5.0
1977 3.3 0.8 15.1 -1.4 -0.0 5.1 -12.8 -1.0 4.0 -6.3 -1.3 7.6 17.7 2.2 5.8
1978 66.8 3.4 7.7 -4.3 -0.4 8.9 -3.4 0.7 15.2 5.5 0.9 1.6 35.1 4.5 2.1
1979 103.0 8.0 16.3 5.7 -0.0 3.4 -4.1 -0.4 14.0 12.7 1.6 3.5 32.1 5.8 2.2
1980 1.8 1.9 4.9 -8.8 -0.3 -1.7 23.3 6.0 35.1 19.3 2.5 9.0 11.5 3.2 8.8
1981 -27.4 -2.0 -1.4 -1.1 -0.2 -3.2 41.1 9.8 15.1 7.7 0.6 -5.1 -1.0 0.4 -0.4
1982 -4.8 -0.2 15.5 -4.5 -0.4 -4.1 13.3 5.0 11.0 -8.7 -2.1 6.4 -0.3 0.4 0.3
1983 29.0 2.2 -16.5 4.3 0.0 0.1 3.0 2.1 2.2 30.5 5.2 0.4 -4.1 -0.6 -0.7
1984 -7.3 -0.4 22.1 8.0 0.4 2.9 17.2 5.8 4.5 0.3 -1.1 0.8 1.3 0.4 -5.3
1985 -27.7 -2.4 5.2 -16.8 -0.9 1.3 -27.2 -7.4 -1.2 3.8 0.6 7.0 -24.3 -5.8 4.8
1986 -37.1 -2.6 -7.9 -7.2 -0.5 -0.4 8.4 1.5 7.1 20.3 3.9 9.9 0.9 -0.2 28.4
1987 20.5 0.1 1.3 10.5 0.2 -1.0 -24.1 -5.8 2.3 -1.0 -1.2 -1.4 3.7 0.3 7.2
1988 -11.2 -0.9 1.5 29.9 1.3 30.0 29.9 4.3 -3.7 -15.6 -3.6 13.6 6.9 0.8 9.1
1989 13.1 0.1 2.7 -22.7 -0.8 5.3 -24.3 -5.6 -16.7 -0.1 0.7 3.2 0.4 0.0 4.9
1990 102.7 4.4 7.2 9.1 0.2 -0.5 -36.9 -8.8 -3.2 37.5 6.1 -2.1 -5.0 -0.6 3.7
1991 31.8 3.5 -3.3 8.5 0.4 2.2 76.8 9.1 -1.0 -7.2 -3.1 10.5 -9.5 -1.1 3.1
1992 32.7 5.0 10.0 18.2 1.0 2.1 21.2 5.7 17.5 14.5 2.9 -1.4 3.4 0.3 3.6
1993 -16.4 -0.8 0.9 1.2 0.5 -2.7 3.7 1.9 5.4 -8.4 -2.5 -2.6 1.4 0.1 -1.2
1994 -39.7 -3.9 2.9 -5.2 -0.1 1.8 9.4 3.0 7.2 -17.6 -3.3 6.7 -24.7 -2.6 3.6
1995 -24.1 -2.0 1.2 4.9 0.5 3.3 22.7 6.6 7.0 -4.0 0.3 -5.8 -6.8 -0.7 3.8
1996 -10.2 -1.3 3.9 -6.5 -0.1 2.2 0.6 1.5 -3.2 10.9 2.1 10.9 0.0 -0.2 3.0
1997 13.8 -0.1 7.3 5.5 0.3 4.4 -9.5 -2.1 1.9 -4.3 -1.0 -1.4 -0.8 -0.2 4.3
1998 -12.5 -1.1 5.0 3.3 0.1 -1.0 -0.1
Source: IMF, International Financial Statistics Yearbook, 1992, 1995, 1999, IMF, Balance of Payments Statistics Yearbook, 1975, 1982, 1990, 1995, 1999.
Estimates of the paper
29
Table 6: Long-term Effects of Current Changes in Remittances on Output (Values are in local currencies at constant 1995 prices)
Egypt Greece Jordan Morocco Portugal Years Rate of
growth of remittances
Induced change
in output
Elasticity Rate of growth of
remittances
Induced change in
output
Elasticity Rate of growth of
remittances
Induced change in
output
Elasticity Rate of growth of
remittances
Induced change in
output
Elasticity Rate of growth of
remittances
Induced change in
output
Elasticity
1970 294.2 0.6 0.002 25.1 3.2 0.127 41.2 0.6 0.015 1971 12.6 0.1 0.008 30.9 4.3 0.139 86.6 1.6 0.018 1972 183.3 1.4 0.008 17.3 3 0.173 8.2 36.9 1.2 0.033 24.5 1973 5.1 0.1 0.020 9.8 1.8 0.184 69.3 5.5 0.079 73.4 3.2 0.044 9 2 0.222 1974 106.2 2.3 0.022 -30.1 -5.5 0.183 18.4 2.6 0.141 16.9 1.2 0.071 -25.1 -5.6 0.223 1975 34.5 1.5 0.043 19.9 2.7 0.136 96.1 17 0.177 50.5 3.7 0.073 -11.9 -2.1 0.176 1976 68.2 3.7 0.054 -0.5 -0.1 0.200 109.9 37.8 0.344 2.2 0.2 0.091 -12.4 -2.1 0.169 1977 3.3 0.3 0.091 -1.4 -0.2 0.143 -12.8 -7.2 0.563 -6.3 -0.7 0.111 17.7 2.6 0.147 1978 66.8 4.7 0.070 -4.3 -0.6 0.140 -3.4 -1.6 0.471 5.5 0.5 0.091 35.1 5.6 0.160 1979 103 11.3 0.110 5.7 0.7 0.123 -4.1 -1.6 0.390 12.7 1.2 0.094 32.1 6.8 0.212 1980 1.8 0.3 0.167 -8.8 -1.1 0.125 23.3 7.7 0.330 19.3 2 0.104 11.5 3.2 0.278 1981 -27.4 -5.1 0.186 -1.1 -0.1 0.091 41.1 12.4 0.302 7.7 0.9 0.117 -1 -0.3 0.300 1982 -4.8 -0.7 0.146 -4.5 -0.5 0.111 13.3 4.9 0.368 -8.7 -1.1 0.126 -0.3 -0.1 0.333 1983 29 3.3 0.114 4.3 0.5 0.116 3 1.1 0.367 30.5 3.4 0.111 -4.1 -1.1 0.268 1984 -7.3 -1.3 0.178 8 1 0.125 17.2 6.5 0.378 0.3 0 0.000 1.3 0.4 0.308 1985 -27.7 -3.7 0.134 -16.8 -2.2 0.131 -27.2 -11.6 0.426 3.8 0.6 0.158 -24.3 -7 0.288 1986 -37.1 -3.4 0.092 -7.2 -0.8 0.111 8.4 2.6 0.310 20.3 2.9 0.143 0.9 0.2 0.222 1987 20.5 1.3 0.063 10.5 1 0.095 -24.1 -7.7 0.320 -1 -0.2 0.200 3.7 0.6 0.162 1988 -11.2 -0.8 0.071 29.9 3.3 0.110 29.9 7.1 0.237 -15.6 -2.4 0.154 6.9 1.1 0.159 1989 13.1 0.8 0.061 -22.7 -2.5 0.110 -24.3 -7.7 0.317 -0.1 0 0.000 0.4 0.1 0.250 1990 102.7 7.3 0.071 9.1 0.7 0.077 -36.9 -10.7 0.290 37.5 4.2 0.112 -5 -0.7 0.140 1991 31.8 4.3 0.135 8.5 0.7 0.082 76.8 14.5 0.189 -7.2 -1.1 0.153 -9.5 -1.3 0.137 1992 32.7 6 0.183 18.2 1.7 0.093 21.2 7.2 0.340 14.5 1.9 0.131 3.4 0.4 0.118 1993 -16.4 -3.6 0.220 1.2 0.1 0.083 3.7 1.3 0.351 -8.4 -1.3 0.155 1.4 0.2 0.143 1994 -39.7 -7.3 0.184 -5.2 -0.6 0.115 9.4 3.2 0.340 -17.6 -2.5 0.142 -24.7 -3 0.121 1995 -24.1 -2.6 0.108 4.9 0.5 0.102 22.7 7.9 0.348 -4 -0.4 0.100 -6.8 -0.6 0.088 1996 -10.2 -0.8 0.078 -6.5 -0.7 0.108 0.6 0.3 0.500 10.9 1.2 0.110 0 0.000 1997 13.8 1 0.072 5.5 0.5 0.091 -9.5 -4 0.421 -4.3 -0.5 0.116 -0.8 -0.1 0.125 1998 -12.5 -0.9 0.072
Source: IMF, International Financial Statistics Yearbook, 1992, 1995, 1999, IMF, Balance of Payments Statistics Yearbook, 1975, 1982, 1990, 1995, 1999
Estimates of the paper.
30
Table 7: Effects of Remittance Changes on Growth of Output: Cells of Combinations of Induced and Actual Growth Rates
Favorable Effects Unfavorable Effects
Case I: Contribution to growth (positive induced – positive actual rates)
Case II: Moderation of recession (positive induced – negative actual rates)
Case III: Restraint of growth (negative induced – positive actual rates)
Case IV: Intensification of recession (negative induced – negative actual rates)
Years
Egypt Greece Jordan Morocco Portugal Egypt Greece Jordan Morocco Portugal Egypt Greece Jordan Morocco Portugal Egypt Greece Jordan Morocco Portugal
1975 X X X** X* X 1976 X X X** X X 1977 X X X X X 1978 X* X X X* X 1979 X** X X** X X 1980 X X** X X* X 1981 X** X X X X 1982 X* X X X X 1983 X X X** X X 1984 X X** X X X 1985 X X X X X** 1986 X X* X X X 1987 X X X X** X 1988 X X X* X X* 1989 X X X X X** 1990 X* X X** X X** 1991 X X X** X* X 1992 X* X X** X X 1993 X X X X X 1994 X* X X X* X 1995 X X** X X X 1996 X X X X X 1997 X X X X X
X* : induced growth rate 3-5 per cent X** : induced growth rate over 5 per cent
Source: Table 5
31
Table 8: Estimated Elasticities of Long-term Induced Output with Respect to
Remittances
Countries
Periods Egypt Greece Jordan Morocco Portugal
1971-1980 0.059 0.154 0.312/1 0.073 0.198/3
1981-1990 0.112 0.108 0.331 0.112 0.243
1991-1997 0.140 0.096 0.356 0.130 0.122
1971-1997 0.100 0.122 0.332/2 0.102 0.198/4
Source: Table 6
1/ 1973-1980. 2/ 1973-1997. 3/ 1972-1980. 4/ 1972-1997
32
Table 9: Long-term Elasticities of Induced Output Growth with Respect to Positive and
Negative Growth Rates of Remittances
Number of Years Mean Growth Rates
of remittances
Mean Growth Rates
of Induced Output
Elasticities with respect
to:
Countries
With rising
remittances
(1)
With falling
remittances
(2)
Positive
(3)
Negative
(4)
Positive
(5)
Negative
(6)
rising
remittances
(7)=(5):(3)
falling
remittances
(8)=(6):(4)
Egypt 18 11 62.4 -19.8 2.8 -2.7 0.045 0.138
Greece 16 12 13.0 -9.1 1.6 -1.2 0.123 0.137
Jordan 17 8 33.2 -17. 8 8.2 -6.5 0.247 0.366
Morocco 18 10 26.2 -8.1 1.7 -1.1 0.065 0.140
Portugal 12 12 10.3 -10.5 1.9 -2.0 0.188 0.191
Source: Table 6

33
Table 10: Regressions of Estimated Current Induced Output and of Estimated Long-
term Elasticity of Induced Output with Respect to Remittances on Selected
Exogenous Variables
Dependent Variables
Long-term Elasticity of Induced Output with Respect to Remittances (ELA)
Independent Variables Induced Growth
Rate of Output (IGGDP) All
Sample All Sample Positive Growth Rates of Remittances
Negative Growth Rates of Remittances
-0.043 0.021 0.009 -0.053 Constant (C)
(-6.001) (1.818) (0.593) (-2.896)
0.416 1.408 1.279 2.133 Ratio of Remittances to GDP (RGDP) (5.630) (12.193) (9.735) (14.951)
0.072 0.073 0.109 0.149 Growth Rate of GDP (GGDP) (2.718) (1.453) (1.864) (2.430)
0.104 -0.064 -0.039 -0.190 Growth Rate of Remittances (GREM)
(11.718) (-6.544) (-3.298) (-4.240)
0.028 0.058 0.066 0.104 Dummy for Greece (DG) (3.990) (4.618) (4.071) (7.050)
-0.033 -0.034 0.033 0.007 Dummy for Jordan (DJ) (-2.813) (1.749) (1.433) (0.340)
0.012 0.004 0.012 0.030 Dummy for Morocco (DM) (1.981) (0.384) (0.803) (2.204)
0.008 0.054 0.066 0.067 Dummy for Portugal (DP) (1.269) (4.392) (4.016) (5.370)
2
R−−−−
0.759 0.849 0.853 0.946
DW 1.71 1.65 1.59 1.97
Number of Observations
110 134 82 52
Source: Estimates with figures from Tables 5 and 6
t values in parentheses
34
Table A1: Effects of Current and Past Years’ Changes of Remittances on Current year’s
Consumption, Investment, Imports and Output tjt
nj
0j jt
t
t
t X/RR
X
X
X−−−−
====
==== −−−−∑∑∑∑ ∂∂∂∂
∂∂∂∂==== ∆∆∆∆∆∆∆∆
(Average rates for each period)
Estimates Basic Data (local currencies, 1995
prices) Rates of Growth induced by remittances (per cent)
Consumption Investment Imports Output
Countries and Years
Remittances as % of GDP
Rate of growth of
remittances (%)
Induced Actual Induced Actual Induced Actual Induced Actual
Egypt 1975-80 7.7 46.3 2.7 11.7 -1.5 21.9 2.0 16.4 3.0 11.3
1981-85 8.6 -7.6 0.2 3.9 0.3 5.3 -0.5 -2.9 -0.6 5.0
1986-90 5.4 17.6 -0.5 2.5 -0.1 2.3 0.2 6.6 0.2 1.0
1991-97 8.7 -1.7 0.4 4.0 0.2 -2.3 -0.2 -0.5 0.1 3.3
Greece 1975-80 3.3 1.8 0.2 3.1 0.1 3.7 0.1 4.3 0.2 4.4
1981-85 2.9 -2.0 -0.3 1.4 -0.2 -4.3 -0.1 5.8 -0.2 -0.6
1986-90 2.4 3.9 0.0 8.0 0.1 9.4 0.0 2.1 0.1 6.7
1991-97 2.5 3.8 0.4 1.9 0.3 0.3 0.2 -0.3 0.4 1.9
Jordan
1975-80 23.7 34.8 4.3 14.3 9.6 25.4 3.7 17.2 8.2 16.3
1981-85 22.1 9.5 2.3 10.4 2.3 -4.7 1.6 4.8 3.1 6.3
1986-90 16.0 -9.4 -1.6 -6.3 -4.5 6.9 -1.8 2.1 -2.9 -2.8
1991-97 21.7 17.8 1.9 4.2 4.2 5.3 1.9 1.9 3.7 5.0
Morocco
1975-80 5.3 14.0 0.5 4.9 3.8 8.8 2.1 4.5 1.2 4.3
1981-85 6.9 6.7 0.1 2.0 2.3 4.7 1.6 6.5 0.6 1.9
1986-90 7.1 8.2 0.7 4.3 2.2 4.5 1.1 4.3 1.2 4.6
1991-97 6.4 -2.3 -0.5 2.1 -0.9 -1.7 -0.3 2.2 -0.7 2.4
Portugal 1975-80 9.4 12.0 1.6 1.2 2.0 8.0 1.7 3.3 2.2 2.5
1981-85 11.9 -5.7 0.2 0.6 -1.4 -8.8 0.3 -0.5 -1.0 -0.3
1986-90 6.9 1.4 -0.4 9.3 0.1 18.9 -0.5 10.6 0.1 10.7
1991-97 4.4 -5.3 -0.5 2.6 -0.7 1.5 -0.6 2.4 -0.6 2.9
Sources: IMF, International Financial Statistics Yearbook, 1992, 1995, 1999. IMF, Balance of Payments Statistics Yearbook, 1975, 1982, 1990, 1995, 1999. Estimates of the paper
Note: Corresponding annual figures are available but they are compressed to save space.
35
Table A2: Current and Long-term Effects (next 5 years) of Remittance Changes on Consumption,
Investment, Imports, and Output (t
ttnt
1t t
t
X
Rm
X
X ∆∆∆∆∆∆∆∆ ====∑∑∑∑====
====)
(ms, me corresponding current and long-term multipliers) (Average rates of each period)
Remittances Consumption Investment Imports Output Countries and Years As a
proportion of GDP (1995 prices)
Rate of growth of
remittances (%)
Current year effect
%
Long term effects
%
Current year effect
%
Long term effects
%
Current year
effect %
Long term effects %
Current year
effect %
Long term effects %
Egypt (ms=0.3184) (ml=1.0205) (ms=-0.1326) (ml=-0.2091) (ms=0.2310)
(ml=0.3056) (ms=0.9548)
(ml=1.5058)
1970-74 1,3 120,3 0,3 1,0 -0,6 -1,0 0,7 1,0 0,6 0,9
1975-80 7,7 46,3 1,2 3,9 -1,1 -1,8 1,7 2,3 2,3 3,6
1981-85 8.6 -7.6 -0.4 -1.4 0.4 0.7 -0.6 -0.8 -0.9 -1.5
1986-90 5.4 17.6 0.3 1.0 -0.3 -0.4 0.5 0.6 0.7 1.0
1991-97 8.7 -1.7 -0.1 -0.4 0.3 0.5 -0.3 -0.4 -0.3 -0.4
Greece (ms=0.6576) (ml=3.0009) (ms=0.3029) (ml=0.7155) (ms=0.2415)
(ml=0.6555) (ms=1.7189)
(ml=4.0609)
1970-74 4,0 10,6 0,3 1,4 0,4 1,0 0,5 1,4 0,6 1,4
1975-80 3,3 1,8 0,1 0,3 0,1 0,2 0,1 0,2 0,1 0,2
1981-85 2.9 -2.0 -0.1 -0.3 -0.1 -0.2 0.0 -0.1 -0.1 -0.3
1986-90 2.4 3.9 0.1 0.4 0.2 0.4 0.1 0.1 0.1 0.3
1991-97 2.5 3.8 0.1 0.3 0.1 0.3 0.1 0.2 0.1 0.3
Jordan (ms=0.3018) (ml=0.8479) (ms=0.4451) (ml=0.6013) (ms=0.4963)
(ml=0.7596) (ms=1.2506)
(ml=1.6896)
1972-74 7,8 43,9 0,7 1,9 4,5 6,0 1,8 2,8 2,4 3,3
1975-80 23,7 34,8 1,7 4,8 7,8 10,5 2,6 4,0 6,4 8,7
1981-85 22.1 9.5 0.7 1.8 1.2 1.7 0.8 1.3 2.0 2.7
1986-90 16.0 -9.4 -0.8 -2.4 -3.8 -5.1 -1.4 -2.2 -2.4 -3.3
1991-97 21.7 17.8 1.1 3.0 3.7 4.9 1.5 2.3 3.2 4.3
Morocco (ms=1.1682) (ml=0.4853) (ms=1.2303) (ml=1.5104) (ms=0.6005)
(ml=1.0316) (ms=2.798) (ml=1.9638)
1970-74 2,4 51,0 1,2 0,5 7,0 8,6 2,3 4,0 2,2 1,6
1975-80 5,3 14,0 1,1 0,5 3,2 4,0 1,3 2,2 1,7 1,2
1981-85 6.9 6.7 0.7 0.3 1.7 2.1 0.7 1.3 1.1 0.8
1986-90 7.1 8.2 0.8 0.3 2.0 2.5 0.9 1.6 1.3 0.9
1991-97 6.4 -2.3 -0.4 -0.2 -1.1 -1.3 -0.4 -0.8 -0.6 -0.4
Portugal (ms=0.6029) (ml=1.4238) (ms=0.5441) (ml=0.6520) (ms=0.2891)
(ml=0.8495) (ms=1.8579)
(ml=2.2263)
1972-74 9,4 -8,1 2,9 6,9 6,2 7,5 3,1 9,1 5,8 7,0
1975-80 9,3 12,0 0,9 2,2 1,8 2,1 1,0 2,8 1,9 2,3
1981-85 11.9 -5.7 -0.6 -1.5 -1.7 -2.0 -0.5 -1.4 -1.3 -1.6
1986-90 6.8 1.4 0.1 0.2 0.3 0.3 0.1 0.3 0.2 0.3
1991-97 4.4 -5.3 -0.2 -0.6 -0.6 -0.8 -0.2 -0.7 -0.5 -0.6 Sources: IMF, International Financial Statistics Yearbook, 1992, 1995, 1999.
IMF, Balance of Payments Statistics Yearbook, 1975, 1982, 1990, 1995, 1999. Estimates of the paper
Note: Corresponding annual figures are available but they are compressed to save space.

36

37
Notes:
1 It should be noted that particularly in the MENA countries very large amounts of
remittances do not go through official channels, because the black market premium in
foreign exchange is very profitable. When such a premium is reduced, as for instance in
Egypt after the exchange rate unification in the early 1990’s, considerable funds were
attracted to official transferring channels. A cross-section econometric analysis including
Algeria, Morocco, Portugal, Turkey and former Yugoslavia found a minus 0,3 elasticity of
official remittances with respect to black market exchange rate premium (Elbadawi and
Rocha, 1992).
2 Data restrictions would in any case not permit any disaggregated analysis of major
consumption or investment items such as durables, residential housing, etc that would have
made for a more refined model, but at the risk of perhaps loosing the forest for the trees.
3 The reason for extending the basic Keynesian consumption function was to deal with the
usually low short-run MPC which is reflected in many earlier theoretical works (Davidson,
Hendy et al. 1978, pp. 693-706).
4 Three major hypotheses with some variant expressions in each case have been tested, i.e.
the permanent income hypothesis, the life-cycle hypothesis, -both having a sound
theoretical basis (see Friedman, 1957; Ando and Modigliani, 1963)- and the error
correction model, whose structure is empirical rather than theoretical (Davidson, Hendry,
Srba and Yeo, 1978; and Davis, 1984).
5 Adaptive expectations of income or partial adjustment of consumption are expressed
correspondingly by . Ct = β1 + β2 Yt* + ut and Ct* = γ1 + γ2 Yt + ut, where Ct = current
consumption, Yt*=permanent income, Ct*= long-run desired consumption and ut is the
error term. These two hypotheses give the same estimable equation which includes lagged
consumption. The two equations differ, however, with respect to the statistical issues of
efficiency and reliability. Coefficient β2 is the MPC on permanent income and γ2 the long-
run MPC. It is therefore an empirical matter how to interpret the estimated coefficients in
different countries. In case that “habit persistence or inertia” in the behavior of consumers
prevails, the partial adjustment model is involved. But if consumption is “forward
looking”, adaptive expectations are involved (see among others Duesenberry, 1958, p.87;
Brown, 1952; Davis, 1984, p.800; and Gujarati, 1988 p. 532). One deviation of our
empirical consumption function from the theoretical postulates of the model is that the
income variable is not the private disposable income as it should be, but a kind of a
national disposable income summing GDP and remittances.
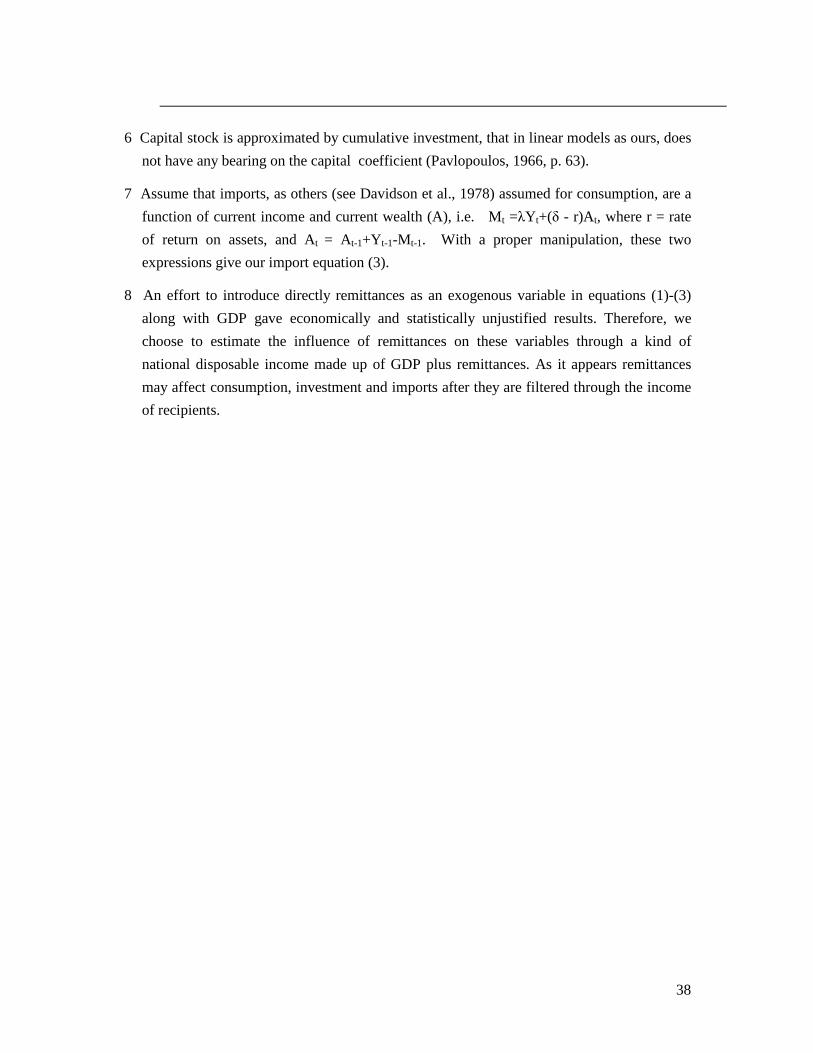
38
6 Capital stock is approximated by cumulative investment, that in linear models as ours, does
not have any bearing on the capital coefficient (Pavlopoulos, 1966, p. 63).
7 Assume that imports, as others (see Davidson et al., 1978) assumed for consumption, are a
function of current income and current wealth (A), i.e. Mt =λYt+(δ - r)At, where r = rate
of return on assets, and At = At-1+Yt-1-Mt-1. With a proper manipulation, these two
expressions give our import equation (3).
8 An effort to introduce directly remittances as an exogenous variable in equations (1)-(3)
along with GDP gave economically and statistically unjustified results. Therefore, we
choose to estimate the influence of remittances on these variables through a kind of
national disposable income made up of GDP plus remittances. As it appears remittances
may affect consumption, investment and imports after they are filtered through the income
of recipients.