Pathways for salvage and protection of the heart under stress

Dynamic Changes of Edema and Late Gadolinium Enhancementafter Acute Myocardial Infarction and Their Relationship toFunctional Recovery and Salvage Index
Erica Dall’Armellina, MD, Nina Karia, MB BS, Alistair C. Lindsay, MB ChB, DPhil,Theodoros D. Karamitsos, MD, PhD, Vanessa Ferreira, BSc, MD, and Matthew D Robson,PhDDepartment of Cardiovascular Medicine, University of Oxford, John Radcliffe Hospital, Oxford,OX3 9DU, United Kingdom
Peter Kellman, PhD*
Jane Francis, DCR(R), DNMDepartment of Cardiovascular Medicine, University of Oxford, John Radcliffe Hospital, Oxford,OX3 9DU, United Kingdom
Colin Forfar, MD, PhD=, Bernard Prendergast, MD=, and Adrian P Banning, MD=
Keith M Channon, MDDepartment of Cardiovascular Medicine, University of Oxford, John Radcliffe Hospital, Oxford,OX3 9DU, United Kingdom
Rajesh K Kharbanda, MB ChB, PhD=
Stefan Neubauer, MD and Robin P Choudhury, DMDepartment of Cardiovascular Medicine, University of Oxford, John Radcliffe Hospital, Oxford,OX3 9DU, United Kingdom*Laboratory of Cardiac Energetics, National Heart, Lung and Blood Institute, National Institutes ofHealth, Department of Health and Human Services, Bethesda, Md, 20892-1061, USA=Department of Cardiology, John Radcliffe Hospital, Oxford, OX3 9DU, United Kingdom
AbstractBackground—Changes in the myocardium in acute ischemia are dynamic and complex and thecharacteristics of myocardial tissue on cardiovascular magnetic resonance (CMR) in the acutesetting are not fully defined. We investigated changes in edema and late gadolinium enhancement(LGE) with serial imaging early after acute MI, relating these to global and segmental myocardialfunction at 6 months.
Methods and Results—CMR scans were performed on 30 patients with ST elevation MI(STEMI) treated by primary PCI at each of 4 time points: 12-48 hours (24H); 5-7 days (1W);14-17 days (2W); and 6 months (6M). All patients showed edema at 24H. The mean volume ofedema (% LV) was 37 ± 16 at 24H and 39 ± 17 at 1W with a reduction to 24 ± 13 (P < 0.01) by
Correspondence to: Robin Choudhury Department of Cardiovascular Medicine University of Oxford, John Radcliffe HospitalOxford, OX3 9DU, United Kingdom Phone: +44 (0)1865 234664 Fax: +44 (0)1865 234667 [email protected].
Disclosures None.
This is a PDF file of an unedited manuscript that has been accepted for publication. As a service to our customers we are providingthis early version of the manuscript. The manuscript will undergo copyediting, typesetting, and review of the resulting proof before itis published in its final citable form. Please note that during the production process errors may be discovered which could affect thecontent, and all legal disclaimers that apply to the journal pertain.
Europe PMC Funders GroupAuthor ManuscriptCirc Cardiovasc Imaging. Author manuscript; available in PMC 2011 November 01.
Published in final edited form as:Circ Cardiovasc Imaging. 2011 May ; 4(3): 228–236. doi:10.1161/CIRCIMAGING.111.963421.
Europe PM
C Funders A
uthor Manuscripts
Europe PM
C Funders A
uthor Manuscripts
2W. Myocardial segments with edema also had increased signal on LGE at 24H (kappa = 0.77; P< 0.001). The volume of LGE decreased significantly between 24H and 6M (27 ± 15 % vs. 22 ±12 %; P = 0.002). Of segments showing LGE at 24H, 50% showed resolution by six months. Insegments with such a reduction in LGE, 65% also showed improved wall motion (P < 0.0001).The area of LGE measured at 6M correlated more strongly with troponin at 48h (r = 0.9; P < 0.01)than LGE at 24H (r = 0.7). The difference in LGE between 24H and 6M had profound effects onthe calculation of salvage index (26 ± 21 % at 24H vs. 42 ± 23 % at 6M; P = 0.02).
Conclusions—Myocardial edema is maximal and constant over the first week post MI,providing a stable window for the retrospective evaluation of area at risk. By contrast, myocardialareas with high signal intensity in LGE images recede over time with corresponding recovery offunction, indicating that acutely detected LGE does not necessarily equate with irreversible injuryand may severely underestimate salvaged myocardium.
Keywordsmyocardial salvage; myocardial edema; late gadolinium enhancement; magnetic resonanceimaging; acute coronary syndrome
Cardiac magnetic resonance (CMR) is established as a key non-invasive modality for theevaluation of patients with stable coronary disease. It is the gold standard technique for theassessment of function (cine CMR) and the quantification of scarred myocardium in patientswith previous myocardial infarction (MI) (late gadolinium enhancement, [LGE]).1
Recently, the development of T2-weighted (T2W) edema-sensitive sequences has enabledthe identification of acutely ischemic myocardium, which is of particular interest in theevaluation of myocardial status in acute MI.2-5 By comparing the area ‘at risk’, determinedby T2W imaging, and the final infarct size, obtained with LGE CMR imaging, myocardialsalvage following treatment can be derived, and expressed as proportion of myocardialvolume initially presumed at risk.6, 7 A number of clinical trials have used this measure,assessed in the acute setting, as a primary endpoint.8-10
However, to capitalize fully on these quantitative CMR techniques requires clearunderstanding of the dynamic features of each in the context of the rapidly changingpathological conditions that pertain in the myocardium after acute ischemic injury andreperfusion.11 Under these circumstances, there are profound changes in perfusion pressure;small vessel patency and permeability; pH; tissue water content and cellular composition.11
Over time, there is resorption of edema, resolution of inflammation and replacement ofirreversibly injured myocytes with fibrous tissue.12 In the acute setting, although it is knownthat CMR edema imaging may identify both infarct and myocardium at risk and LGEoverestimates the infarct zone, acute LGE is still considered a robust prognostic factorthough whether it necessarily always reflects irreversible injury is still debated.13-15
Accordingly, we designed a detailed early time course CMR evaluation in patients within48h of technically successful percutaneous coronary intervention (PCI) for acute MI. Wequantified (1) myocardial edema at 4 time points post MI (12-48 hours; 5-7 days; 14-17 daysand 6 months) and (2) characteristics of LGE early (12-48 hours) and late (6 months) afterischemic injury. We relate each of these parameters to temporally matched measurements ofmyocardial function at both global and segmental levels.
Our aims were to establish the longitudinal changes of myocardial edema by CMR and todetermine the extent to which edema and LGE, obtained in the acute phase, predictedrecovery of global and regional LV function at six months. Clarification of these acutedynamic changes of edema and LGE is crucial to the correct interpretation of CMR data in
Dall’Armellina et al. Page 2
Circ Cardiovasc Imaging. Author manuscript; available in PMC 2011 November 01.
Europe PM
C Funders A
uthor Manuscripts
Europe PM
C Funders A
uthor Manuscripts

the acute setting and has important implications for the design and the calculation of samplesize of clinical trials with myocardial salvage as endpoint.
MethodsPatient population
This prospective study was undertaken in a single tertiary centre. The study protocol wasapproved by the local ethics committee and all patients gave written informed consent.Patients with first ST segment elevation MI (STEMI) were eligible if the onset of symptomshad been < 12 hours before PCI and if they had ST-segment elevation of at least 0.1 mV in ≥2 contiguous limb leads or at least 0.2 mV ≥ 2 contiguous precordial leads. Patients withprevious MI, previous revascularization procedure (coronary artery bypass grafts [CABG] orPCI), severe heart valve disease, known cardiomyopathy or hemodynamic instability lastinglonger than 12 hours following revascularization were not enrolled. Further exclusioncriteria were contraindications to CMR, including implanted pacemakers, defibrillators, orother metallic implanted devices and claustrophobia. Acute clinical management was at thediscretion of the responsible physician, with the intention to reflect contemporary practiceand guidelines (including use of aspiration catheters; glycoprotein IIb IIIa receptor inhibitorsand high-dose clopidogrel loading). Blood samples were collected for Troponin I at the timeof admission and every 12 hours post PCI.
CMRFour separate 3Tesla CMR scans were performed on each patient at the following timepoints post-PCI: 12 - 48 hours (24H); 5 - 7 days (1W); 14 - 17 days (2W); and 6 months(6M). The first and last CMR scans assessed LV function, edema, and LGE. The second andthird scans acquired function and edema imaging only (Figure 1). Identical short axis imagesat matching slice position with functional images were acquired using T2W and LGEimaging. Edema imaging was performed using a T2 prep-SSFP single shot sequence withcoil signal intensity correction.3 A spine coil and a phased array 6-channel flexible surfacecoil were used. If necessary, shimming and center frequency adjustments were performedbefore T2W imaging to generate images free from off-resonance artifacts. LGE-CMR wasperformed with a T1-weighted segmented inversion-recovery gradient echo-phase sensitive-inversion recovery (GRE_PSIR) sequence 5 to 10 minutes after the administration of 0.1mmol / kg contrast agent (Gadodiamide, Omniscan™, GE Healthcare, Amersham, UK). Theinversion time was meticulously adjusted for optimal nulling of remote normal myocardium.(Refer to online supplement of acquisition parameters for both edema and LGE imaging)
Post-processing analysisQuantification of LV volumes and wall motion were performed as previously described.16,17 For objective quantification of edema or LGE, a reference region of interest (ROI) wasplaced in remote myocardium. The signal intensity threshold indicating edema / LGE wasimposed 2 standard deviations above the mean intensity of the reference ROI, as previouslydescribed.7 (online supplement)
Statistical AnalysesValues of continuous variables are expressed as mean (± SD). In order to investigatedifferences at multiple time points in LV volumes, EF, WMSI, myocardial volume of edemaand LGE assessed by CMR, ANOVA analyses with adjustment for repeated measurementswere performed. The Bonferroni procedure, where the overall Type I error (0.05) isdistributed across multiple hypothesis tests, was used for post-hoc comparisons. Forcategorical variables, Wilcoxon signed-rank test was used to compare regional wall motion
Dall’Armellina et al. Page 3
Circ Cardiovasc Imaging. Author manuscript; available in PMC 2011 November 01.
Europe PM
C Funders A
uthor Manuscripts
Europe PM
C Funders A
uthor Manuscripts

abnormalities with segmental scoring of edema and late gadolinium. A chi-squared test anda logistic regression model with a repeated-measures variable for the patient (to adjust forthe non-independence of the data) were used to assess the relationship between thetransmural extent of myocardial injury i.e. edema / LGE and improvement in regionalfunction. The relationship between the improvement in wall motion along 6 months and theclinical and CMR characteristics were evaluated using linear regression analyses. Bland-Altman test for continuous T2W measurements and Cohen’s Kappa coefficient for T2W,LGE and wall motion abnormalities categorical measurements were performed to evaluateinter-observer variability for edema assessment and for transmurality grading and wallmotion scoring respectively
All statistical tests were two-tailed, and all P values of less than 0.05 were consideredstatistically significant.
ResultsPatient characteristics are given in Table 1. All patients presented with ST segment elevationon the ECG and were treated by primary PCI (except for 2 who were transferred from adifferent hospital and received thrombolysis and rescue PCI). All PCI took place within 12hours of chest pain onset, with the mean time from onset of pain to balloon treatment 253 ±150 minutes. Of 33 patients enrolled, 2 could not complete the first CMR examination dueto claustrophobia, 1 patient was excluded due to urgent re-intervention, 2 did not undergothird scan due to technical difficulties or because of patient refusal (Figure online datasupplement). The first CMR took place at 29 ± 10 hours from the PCI (24H), the second(1W) at 6 ± 1.4 days post PCI, the third (2W) at 16 ± 2.7 days post PCI and the fourth (6M)at 6.2 ± 1 months post PCI.
CMR findingsThe total number of successful scans was 112 (30 at 24H and 1W, 28 at 2W and 24 at 6M)and all were suitable for analysis. In segmental analyses, 8 segments at 24H and 12 at 2Wshowed off resonance artifacts in T2W images and were excluded from analyses at all TP(Table online data supplement). Both Bland-Altman (bias = 2 ± 10%) for continuous T2Wmeasurements and Cohen’s Kappa coefficient (kappa = 0.8) for T2W, LGE and wall motionabnormalities categorical measurements indicated excellent levels of agreement for inter-observer variability assessments.
Time course assessment of global left ventricular function and myocardial edemaAll patients had positive findings for myocardial injury assessed by T2W imaging at 24Hexcept one. In this particular case, the lesion as assessed by LGE and edema, was confinedto the apical segment only. As indicated in Methods, the apical slices were excluded to avoidpartial volume artifacts.
The mean volume of edema was stable over the first week (37 ± 16% of the LV myocardiumat 24H and 39 ± 17 % at 1W) with a reduction by 2W (24 ± 13%; P < 0.01) and nearresolution (7 ± 10%; P < 0.001) by 6M (Figure 2). The ejection fraction (EF) was wellconserved (53 ± 9 %) at 24H and not significantly different at 6 months (59 ± 6 %; P = n.s.)(Table 2).
Time course assessment of edema and LGE on a segmental level: relations to wall motion(24H-2W)
At 24H, 151 out of 428 (35 %) segments were positive for myocardial edema; 133 / 428(31%) showed LGE, and 139 / 428 (32%) segments showed abnormal function (Table
Dall’Armellina et al. Page 4
Circ Cardiovasc Imaging. Author manuscript; available in PMC 2011 November 01.
Europe PM
C Funders A
uthor Manuscripts
Europe PM
C Funders A
uthor Manuscripts

online data supplement). Segments with evidence of injury assessed by T2W or LGEimaging and those with wall motion abnormalities were co-localized (location agreement,Kappa = 0.77; P < 0.001) with 120 / 133 (90%) showing all of edema, LGE and wall motionabnormalities. Similarly, of 277 segments with no edema, 257 (93%) showed normal wallmotion, while of those with no LGE, 264 (89%) showed no myocardial edema either. Only31 / 428 (7%) of segments were positive for edema in the absence of LGE.
In order to assess whether or not the extent of the acute myocardial injury determinesregional dysfunction, we examined the relationship between within-segment injury (%segment affected by edema or LGE) and the presence or absence of wall motion impairmentin that segment. At 24H, the proportion of segments with wall motion impairment increasedin relation to the extent of both myocardial edema (P < 0.01; Figure 3A) and LGE (P < 0.01;Figure 3B). Of the injured segments (those having either edema or positive for LGE), 75(17%) had improved motion in the first 2 weeks. This was associated with an improvementin WMSI (from 1.52 ± 0.3 at 24H hrs to 1.3 ± 0.3 at 2W, P < 0.01) (Table 2).
LGE volume reduction over 6 monthsThe volume of LGE decreased significantly between the first time point (27 ± 15% of LVmyocardial volume) and the last time point at 6M (22 ± 12%, P = 0.002) (Figure 4A).Furthermore, on a patient by patient basis, there was considerable variation in the extent ofreduction in LGE. The reduction in LGE from acute to 6M was up to 68%, with 46% ofpatients showing some reduction in LGE at 6 months. LGE was also reduced when analyzedat segmental level. Out of the 336 segments analyzed at 6M, 108 had been positive for LGEat 24H of which 54 (50%) showed resolution of LGE at 6M(representative examples areshown in Figure 5).
Recovery of function accompanies resolution of LGEWe next examined whether resolution of LGE could be associated with recovery of functionin affected segments. Out of 336 segments analyzed at 6M, 79 had shown abnormal functionat 24H of which 68 (86%) showed recovery of function at 6M.
Importantly, of those segments that showed an improvement in LGE at 6 months 35 / 54(65%) also showed an improvement in wall motion (P < 0.0001) indicating that LGE at 24Hdid not necessarily signify irreversible myocardial injury.
Conversely, only 8% (6/68) of segments with persistent transmural LGE at 6M hadimproved function (P < 0.01) (Figure 4B). Furthermore, on multivariate analysis the onlyCMR measure that was predictive of functional recovery was the infarct size determined byLGE CMR (% LVscore) at 6M (P = 0.015). The importance of CMR assessment of infarctsize at 6 months is further emphasized by the strong correlation between the infarct size (%LVscore) assessed at 6 months and troponin I, assessed at 48 hrs (r = 0.9; P < 0.01); while theequivalent relationship with LGE measured at 24H was relatively weak (r = 0.7, P < 0.01;Figure 6).
Effects of timing of LGE measurement on the calculation of salvage indexCalculation of myocardial salvage [index] depends both on (a) the acutely determined areaat risk (T2W image) and (b) the final infarct size (LGE). Given the variation in LGEdescribed above, we calculated the effect of its assessment early (24H) vs. late (6M) on theestimation of salvage. Depending on the imaging time for LGE, the salvaged myocardiumindex was substantially different: 26 ± 21% at 24H vs. 42 ± 23% at 6M (P = 0.02). Thus,LGE timing critically determines the calculated salvage index.
Dall’Armellina et al. Page 5
Circ Cardiovasc Imaging. Author manuscript; available in PMC 2011 November 01.
Europe PM
C Funders A
uthor Manuscripts
Europe PM
C Funders A
uthor Manuscripts

DiscussionOptimal application and accurate interpretation of CMR in acute myocardial ischemiarequire that the nature and patterns of change of CMR features are fully defined. We reportthe first detailed time course study that examines early changes in myocardial function,edema and LGE in patients treated with primary PCI for STEMI, and which relates theseearly features to late measures of infarct size and functional recovery at global andsegmental levels.
The principal findings are that: (1) edema was present in virtually all cases; the volume ofedema remained unchanged over the first week but decreased significantly by 15 days. (2) Alarge majority of segments that were positive for edema also showed evidence of LGE,assessed at 24H. (3) In 46% of the patients, LGE present on early scans had diminished insize by 6 months and, in some cases, dramatically. (4) Acute LGE was a weak predictor offunctional recovery compared to chronic LGE, as even segments with transmural LGE at24H, showed an improvement in contractility at 6 months. (5) The reduction in LGE at thelater time had a profound effect on the calculation of salvage index, which varied by up to~60%, depending on the time point used. These findings have important implications for thetiming and interpretation of CMR after acute STEMI, including in the estimation of viablevs. infarcted tissue and on the design and implementation of clinical trials that use salvageindex as an end point.
Acute myocardial ischemia-reperfusion is a dynamic process, involving a complex cascadeof intracellular and interstitial changes that affect: oxygenation and pH in the myocardium;intravascular pressure, small vessel permeability and patency; tissue water content,inflammatory cell infiltration and local hemorrhage.18 These changes potentially alter boththe inherent MR characteristics of the tissue and the delivery, distribution and removal ofexogenous contrast agents, compared to the stable setting.19 Specifically, the kinetics ofgadolinium distribution and precise tissue specificity in acute infarction are not fullyunderstood13-15 and the potential for accumulation of LGE even in viable myocardium hasnot been excluded.
Myocardial edemaBoth intracellular edema due to decoupling of water molecules from proteins20 and/or tissueaccumulation of water leads to a prolongation of T221 that appears as transmural brightsignal on T2W images.22 In dogs, myocardial edema has been demonstrated after 30minutes ischemia.5 Previous reports have identified persistence of edema signal for at least12 days post infarction,3, 6 but the timing of maximal myocardial edema and its earlyevolution had not been defined. This information is important in order to establish theoptimal imaging window for the assessment of salvaged myocardium6, 7 and for estimationof prognosis.23, 24 We demonstrate that edema is maximal and constant during the firstweek post MI, reducing thereafter. Therefore, the window for retrospective quantification ofmyocardium ‘at risk’ is up to 7 days, with a risk of underestimation after that time.
Late gadolinium enhancementLate gadolinium enhancement occurs following myocardial infarction. In the context ofestablished MI and scar formation, the area of myocardial fibrosis is very closely linked tothe extent and distribution of LGE.1, 12 Furthermore, the extent of LGE can be used topredict recovery of myocardial function after revascularization,1, 25 with the transmuralsegmental extent of LGE / scar inversely correlating with the probability of functionalrecovery. Reduction in LGE has been previously reported from the acute phase to a chronic
Dall’Armellina et al. Page 6
Circ Cardiovasc Imaging. Author manuscript; available in PMC 2011 November 01.
Europe PM
C Funders A
uthor Manuscripts
Europe PM
C Funders A
uthor Manuscripts

stage, and attributed to “shrinking of the scar”, together with compensatory hypertrophy ofadjacent myocardium.26, 27
Although LGE occurs in context of acute MI, this cannot reflect tissue fibrosis, which takesseveral weeks to develop. In a dog model, Fieno et al showed that fibrosis increased 11-foldbetween 3 and 60 days after permanent coronary artery occlusion.28 Conversely, in a modelof acute MI, LGE can be positive within 1 hour of injury.29 Given the variant tissuecomposition between acute and chronic states, it cannot be assumed that the presence ofLGE necessarily always implies irreversible injury. We found that the overall volume ofLGE decreased by 22% between the first time point and six months and, that on a patient bypatient basis, there was considerable variation in the extent of reduction in LGE.Importantly, of those myocardial segments showing reduction in LGE at 6 months, 68% alsoshowed an improvement in wall motion (P < 0.0001). Using a technique based ondifferential signal intensity threshold analysis, Yan et al identified an peri-infarct ‘borderzone’ on the periphery of the LGE area.30 However, recovery confined to a putative ‘borderzone’ is unlikely to account for the observations in the current study, since 51% of segmentsshowing improved function had transmural (or near-transmural) LGE extent when imaged <48 hours after primary PCI. These findings indicate that LGE within this time frame doesnot necessarily reflect irreversible injury. Our findings do not identify the tissue correlate ofLGE at early time points, but do stress the important possibility of resolution, even oftransmural LGE, in association with recovery of myocardial function in that area.
LGE and recovery of functionThe ability of LGE obtained in the acute setting to predict later functional recovery iscontentious.31-34 Choi et al found that improvement in segmental contractile functionbetween < 7 days post infarct and 8-12 weeks later was inversely related to the transmuralextent of infarction on the first scan.32 That work differs from the current study in severalimportant respects. Most importantly, the second CMR scan did not include assessment ofLGE, making it impossible to know if LGE had changed between scans. While earlyassessment of LGE will, on average, indicate injured tissues, our work demonstrates thatLGE early after an event does not always reflect irreversibly injured, non-viable tissue, andeven transmural LGE early after acute ischemia can be associated with recovery of functionin that segment. In keeping with these findings, Beek et al reported that 25 % of segmentswith transmural hyperenhancement 7 ± 3 days post MI had the potential for functionalimprovement after 13 weeks.33
Our findings of resolving LGE are further consistent with a recent clinical study showingthat LGE diminishes within one week of acute MI.35 The authors speculated that reductionin LGE may have reflected initial LGE in reversibly injured myocardium. By incorporatingedema imaging, to demonstrate the extent of the ischemia zone, and combining this with (a)early and late phase LGE and (b) functional assessment at a segmental level, the currentstudy demonstrates conclusively that this is indeed the case — and that early LGE does notalways lead to late scar. Our findings cannot determine mechanisms of ‘shrinkage’ of theLGE area or whether there is hypertrophy of adjacent viable myocardium in the long term36,37 which may contribute to recovery of function at a later stage.
Salvage indexThe difference between volume of myocardium at risk and of that eventually infarcted givesa measure of myocardial salvage that can be indexed to the area at risk to provide thesalvage index.6 In clinical trials, this indexed measure should reduce the inter-patientvariability associated with measures of absolute infarct size, with a consequent reduction insample size38 needed to assess therapies intended to reduce infarct size.9
Dall’Armellina et al. Page 7
Circ Cardiovasc Imaging. Author manuscript; available in PMC 2011 November 01.
Europe PM
C Funders A
uthor Manuscripts
Europe PM
C Funders A
uthor Manuscripts
Our data suggest that, given the tendency to reduction in LGE over time, studiesincorporating imaging time points as early as 12 hours23 will markedly overestimate the areaof irreversible injury in some patients. Based on our findings the magnitude of theunderestimate of salvage that could be introduced in assessment < 48 hours post MI (vs. 6months) is 38 % ± 14%, with important implications for trial design and implementation.
Study limitationsOur data suggest almost complete resolution of edema at 6 months. However, in smallnumber of cases persistently increased T2 signal intensity was identified at 6 months. Fromexperimental studies, resolution of myocardial edema occurs within 2 months of acute MI.39
While accumulation of lipid may occur in the very early phases post acute MI,40 this wouldnot contribute significantly to T2 relaxation properties. A further possibility may relate tothe threshold for edema quantification. While efforts were made to impose a recognized andobjective segmentation protocol, it is possible that an alternative segmentation strategy orthe measurement of absolute myocardial relaxivity values may provide additional benefit.The use of new CMR techniques as T2 mapping should provide a better understanding oftissue composition both in acute stage and chromic stage; however further research will beneeded to validate these techniques. The patients in this study were subject to an intensivesequence of MR scans, including 3 CMR scans within 15 days of acute MI. For reasons ofsafety, gadolinium was not given at each time point, but reserved for the first and last. Forthis reason, we were unable to define the precise time course of resolution of LGE. AlthoughLGE resolution was associated with improved myocardial segmental function, we did notundertake any additional evaluation of myocardial viability, specifically no comparativestudy using positron emission tomography (PET), nor, in this clinical study, werehistological samples available to define precisely the tissue correlates during each MR timepoint. Finally, the patients included in the study were mostly white and men and thereforefurther investigation will be needed in order to establish potential application of these data tothose of other race and gender.
ConclusionsEdema of the myocardium occurs in almost all cases of STEMI and primary PCI. It ismaximal and constant over the first week post MI, providing a stable window for theretrospective evaluation of area at risk. By contrast, LGE, while present early in acute MI,recedes over time and acutely detected LGE does not necessarily equate with irreversibleinjury. These findings have important implications for the interpretation of CMR early afteracute MI and the design of clinical research studies using CMR-derived infarction or salvageindex as endpoints.
CLINICAL PERSPECTIVE
Late gadolinium enhancement (LGE) and edema imaging are used to assess acutemyocardial injury, area at risk and salvaged myocardium post reperfusion. Lategadolinium enhancement (LGE) is currently considered the gold standard for myocardialinfarct visualization both in acute and chronic myocardial infarction and an accuratepredictor of recovery of wall motion post revascularization. The present study shows thatCMR features of acute myocardial infarction are dynamic and change for both LGE andedema. Following revascularization, edema is shown to peak within the first week postreperfusion. LGE performed in the first 24H does not necessarily indicate irreversibleinjury; our results show that 51 % of the segments with transmural LGE at 24H postreperfusion recovered function at 6 months. A detailed knowledge of the early dynamic
Dall’Armellina et al. Page 8
Circ Cardiovasc Imaging. Author manuscript; available in PMC 2011 November 01.
Europe PM
C Funders A
uthor Manuscripts
Europe PM
C Funders A
uthor Manuscripts

changes of both LGE and edema imaging is crucial in assessing final infarct size andmyocardium salvage, especially when designing clinical trials using CMR.
Supplementary MaterialRefer to Web version on PubMed Central for supplementary material.
AcknowledgmentsThe authors thank the staff of the Heart Centre at John Radcliffe Hospital and OCMR for their support and help.The authors gratefully acknowledge technical advice from Dr. A. Arai, NIH, Bethesda, US.
Sources of Funding The study was funded by the Oxford Comprehensive Biomedical Research Center, NIHRfunding scheme. RC is a Wellcome Trust Senior Research Fellow in Clinical Science. SN and RC acknowledge thesupport of the BHF Centre of Research Excellence, Oxford.
References1. Kim RJ, Wu E, Rafael A, Chen EL, Parker MA, Simonetti O, Klocke FJ, Bonow RO, Judd RM. The
use of contrast-enhanced magnetic resonance imaging to identify reversible myocardial dysfunction.N Engl J Med. 2000; 343:1445–1453. [PubMed: 11078769]
2. Aletras AH, Tilak GS, Natanzon A, Hsu L-Y, Gonzalez FM, Hoyt RF Jr. Arai AE. Retrospectivedetermination of the area at risk for reperfused acute myocardial infarction with t2-weighted cardiacmagnetic resonance imaging: Histopathological and displacement encoding with stimulated echoes(dense) functional validations. Circulation. 2006; 113:1865–1870. [PubMed: 16606793]
3. Kellman P, Aletras AH, Mancini C, McVeigh ER, Arai AE. T2-prepared ssfp improves diagnosticconfidence in edema imaging in acute myocardial infarction compared to turbo spin echo. MagnReson Med. 2007; 57:891–897. [PubMed: 17457880]
4. Cury RC, Shash K, Nagurney JT, Rosito G, Shapiro MD, Nomura CH, Abbara S, Bamberg F,Ferencik M, Schmidt EJ, Brown DF, Hoffmann U, Brady TJ. Cardiac magnetic resonance with t2-weighted imaging improves detection of patients with acute coronary syndrome in the emergencydepartment. Circulation. 2008; 118:837–844. [PubMed: 18678772]
5. Abdel-Aty H, Cocker M, Meek C, Tyberg JV, Friedrich MG. Edema as a very early marker foracute myocardial ischemia: A cardiovascular magnetic resonance study. J Am Coll Cardiol. 2009;53:1194–1201. [PubMed: 19341860]
6. Friedrich MG, Abdel-Aty H, Taylor A, Schulz-Menger J, Messroghli D, Dietz R. The salvaged areaat risk in reperfused acute myocardial infarction as visualized by cardiovascular magneticresonance. J Am Coll Cardiol. 2008; 51:1581–1587. [PubMed: 18420102]
7. Berry C, Kellman P, Mancini C, Chen MY, Bandettini WP, Lowrey T, Hsu LY, Aletras AH, AraiAE. Magnetic resonance imaging delineates the ischemic area-at-risk and myocardial salvage inpatients with acute myocardial infarction. Circ Cardiovasc Imaging. 2010; 3:527–535. [PubMed:20631034]
8. Francone M, Bucciarelli-Ducci C, Carbone I, Canali E, Scardala R, Calabrese FA, Sardella G,Mancone M, Catalano C, Fedele F, Passariello R, Bogaert J, Agati L. Impact of primary coronaryangioplasty delay on myocardial salvage, infarct size, and microvascular damage in patients with st-segment elevation myocardial infarction: Insight from cardiovascular magnetic resonance. Journalof the American College of Cardiology. 2009; 54:2145–2153. [PubMed: 19942086]
9. Larose E, Tizon-Marcos H, RodÈs-Cabau J, Rinfret S, DÈry J-P, Nguyen CM, Gleeton O,Boudreault J-R, Roy L, NoÎl B, Proulx G, Rouleau J, Barbeau G, LarochelliËre RD, Bertrand OF.Improving myocardial salvage in late presentation acute st-elevation myocardial infarction withproximal embolic protection. Catheterization and Cardiovascular Interventions. 2010; 76:461–470.[PubMed: 20506154]
10. Ortiz, PÈrez JT.; Lee, DC.; Meyers, SN.; Davidson, CJ.; Bonow, RO.; Wu, E. Determinants ofmyocardial salvage during acute myocardial infarction: Evaluation with a combined angiographic
Dall’Armellina et al. Page 9
Circ Cardiovasc Imaging. Author manuscript; available in PMC 2011 November 01.
Europe PM
C Funders A
uthor Manuscripts
Europe PM
C Funders A
uthor Manuscripts

and cmr myocardial salvage index. JACC: Cardiovascular Imaging. 2010; 3:491–500. [PubMed:20466344]
11. Buja LM. Myocardial ischemia and reperfusion injury. Cardiovascular Pathology. 2005; 14:170–175. [PubMed: 16009313]
12. Kim RJ, Fieno DS, Parrish TB, Harris K, Chen E-L, Simonetti O, Bundy J, Finn JP, Klocke FJ,Judd RM. Relationship of mri delayed contrast enhancement to irreversible injury, infarct age, andcontractile function. Circulation. 1999; 100:1992–2002. [PubMed: 10556226]
13. de Roos A, Doornbos J, van der Wall E, van Voorthuisen A. Mr imaging of acute myocardialinfarction: Value of gd-dtpa. Am. J. Roentgenol. 1988; 150:531–534. [PubMed: 3257603]
14. Saeed M, Bremerich J, Wendland MF, Wyttenbach R, Weinmann HJ, Higgins CB. Reperfusedmyocardial infarction as seen with use of necrosis-specific versus standard extracellular mrcontrast media in rats. Radiology. 1999; 213:247–257. [PubMed: 10540668]
15. Klein C, Schmal TR, Nekolla SG, Schnackenburg B, Fleck E, Nagel E. Mechanism of lategadolinium enhancement in patients with acute myocardial infarction. J Cardiovasc Magn Reson.2007; 9:653–658. [PubMed: 17578720]
16. Karamitsos TD, Hudsmith LE, Selvanayagam JB, Neubauer S, Francis JM. Operator inducedvariability in left ventricular measurements with cardiovascular magnetic resonance is improvedafter training. J Cardiovasc Magn Reson. 2007; 9:777–783. [PubMed: 17891615]
17. Dall’Armellina E, Morgan TM, Mandapaka S, Ntim W, Carr JJ, Hamilton CA, Hoyle J, Clark H,Clark P, Link KM, Case D, Hundley WG. Prediction of cardiac events in patients with reduced leftventricular ejection fraction with dobutamine cardiovascular magnetic resonance assessment ofwall motion score index. Journal of the American College of Cardiology. 2008; 52:279–286.[PubMed: 18634983]
18. van Gaal WJ, Banning AP. Percutaneous coronary intervention and the no-reflow phenomenon.Expert Rev Cardiovasc Ther. 2007; 5:715–731. [PubMed: 17605650]
19. Lima JAC, Judd RM, Bazille A, Schulman SP, Atalar E, Zerhouni EA. Regional heterogeneity ofhuman myocardial infarcts demonstrated by contrast-enhanced mri : Potential mechanisms.Circulation. 1995; 92:1117–1125. [PubMed: 7648655]
20. Kuntz ID Jr. Brassfield TS, Law GD, Purcell GV. Hydration of macromolecules. Science. 1969;163:1329–1331. [PubMed: 5765111]
21. Friedrich MG. Myocardial edema--a new clinical entity. Nat Rev Cardiol. 2010; 7:292–296.[PubMed: 20309007]
22. Karolle BL, Carlson RE, Aisen AM, Buda AJ. Transmural distribution of myocardial edema bynmr relaxometry following myocardial ischemia and reperfusion. Am Heart J. 1991; 122:655–664.[PubMed: 1877442]
23. Larose E, RodÈs-Cabau J, Pibarot P, Rinfret S, Proulx G, Nguyen CM, DÈry J-P, Gleeton O, RoyL, NoÎl B, Barbeau G, Rouleau J, Boudreault J-R, Amyot M, De LarochelliËre R, Bertrand OF.Predicting late myocardial recovery and outcomes in the early hours of st-segment elevationmyocardial infarction: Traditional measures compared with microvascular obstruction, salvagedmyocardium, and necrosis characteristics by cardiovascular magnetic resonance. Journal of theAmerican College of Cardiology. 2010; 55:2459–2469. [PubMed: 20510213]
24. Raman SV, Simonetti OP, Winner MW Iii, Dickerson JA, He X, Mazzaferri EL Jr, Ambrosio G.Cardiac magnetic resonance with edema imaging identifies myocardium at risk and predicts worseoutcome in patients with non-st-segment elevation acute coronary syndrome. Journal of theAmerican College of Cardiology. 2010; 55:2480–2488. [PubMed: 20510215]
25. Selvanayagam JB, Kardos A, Francis JM, Wiesmann F, Petersen SE, Taggart DP, Neubauer S.Value of delayed-enhancement cardiovascular magnetic resonance imaging in predictingmyocardial viability after surgical revascularization. Circulation. 2004; 110:1535–1541. [PubMed:15353496]
26. Ingkanisorn WP, Rhoads KL, Aletras AH, Kellman P, Arai AE. Gadolinium delayed enhancementcardiovascular magnetic resonance correlates with clinical measures of myocardial infarction. JAm Coll Cardiol. 2004; 43:2253–2259. [PubMed: 15193689]
27. Ichikawa Y, Sakuma H, Suzawa N, Kitagawa K, Makino K, Hirano T, Takeda K. Late gadolinium-enhanced magnetic resonance imaging in acute and chronic myocardial infarction. Improved
Dall’Armellina et al. Page 10
Circ Cardiovasc Imaging. Author manuscript; available in PMC 2011 November 01.
Europe PM
C Funders A
uthor Manuscripts
Europe PM
C Funders A
uthor Manuscripts
prediction of regional myocardial contraction in the chronic state by measuring thickness ofnonenhanced myocardium. J Am Coll Cardiol. 2005; 45:901–909. [PubMed: 15766827]
28. Fieno DS, Hillenbrand HB, Rehwald WG, Harris KR, Decker RS, Parker MA, Klocke FJ, Kim RJ,Judd RM. Infarct resorption, compensatory hypertrophy, and differing patterns of ventricularremodeling following myocardial infarctions of varying size. J Am Coll Cardiol. 2004; 43:2124–2131. [PubMed: 15172424]
29. Schulz-Menger J, Gross M, Messroghli D, Uhlich F, Dietz R, Friedrich MG. Cardiovascularmagnetic resonance ofacute myocardial infarction at a very early stage. Journal of the AmericanCollege of Cardiology. 2003; 42:513–518. [PubMed: 12906982]
30. Yan AT, Shayne AJ, Brown KA, Gupta SN, Chan CW, Luu TM, Di Carli MF, Reynolds HG,Stevenson WG, Kwong RY. Characterization of the peri-infarct zone by contrast-enhanced cardiacmagnetic resonance imaging is a powerful predictor of post-myocardial infarction mortality.Circulation. 2006; 114:32–39. [PubMed: 16801462]
31. Gerber BL, Garot J, Bluemke DA, Wu KC, Lima JA. Accuracy of contrast-enhanced magneticresonance imaging in predicting improvement of regional myocardial function in patients afteracute myocardial infarction. Circulation. 2002; 106:1083–1089. [PubMed: 12196333]
32. Choi KM, Kim RJ, Gubernikoff G, Vargas JD, Parker M, Judd RM. Transmural extent of acutemyocardial infarction predicts long-term improvement in contractile function. Circulation. 2001;104:1101–1107. [PubMed: 11535563]
33. Beek AM, Kühl HP, Bondarenko O, Twisk JWR, Hofman MBM, van Dockum WG, Visser CA,van Rossum AC. Delayed contrast-enhanced magnetic resonance imaging for the prediction ofregional functional improvement after acute myocardial infarction. Journal of the AmericanCollege of Cardiology. 2003; 42:895–901. [PubMed: 12957439]
34. Rogers WJ Jr. Kramer CM, Geskin G, Hu YL, Theobald TM, Vido DA, Petruolo S, Reichek N.Early contrast-enhanced mri predicts late functional recovery after reperfused myocardialinfarction. Circulation. 1999; 99:744–750. [PubMed: 9989958]
35. Engblom H. Rapid initial reduction of hyperenhanced myocardium after reperfused firstmyocardial infarction suggests recovery of the peri-infarction zone: One year follow up by mri.Circulation cardiovascular imaging. 2009; 2:47–55. [PubMed: 19808564]
36. Rehwald WG, Fieno DS, Chen E-L, Kim RJ, Judd RM. Myocardial magnetic resonance imagingcontrast agent concentrations after reversible and irreversible ischemic injury. Circulation. 2002;105:224–229. [PubMed: 11790705]
37. Holmes JW, Yamashita H, Waldman LK, Covell JW. Scar remodeling and transmural deformationafter infarction in the pig. Circulation. 1994; 90:411–420. [PubMed: 8026026]
38. Klocke FJ. Cardiac magnetic resonance measurements of area at risk and infarct size in ischemicsyndromes. J Am Coll Cardiol. 2010; 55:2489–2490. [PubMed: 20510216]
39. Reimer KA, Jennings RB. The changing anatomic reference base of evolving myocardialinfarction. Underestimation of myocardial collateral blood flow and overestimation ofexperimental anatomic infarct size due to tissue edema, hemorrhage and acute inflammation.Circulation. 1979; 60:866–876. [PubMed: 476891]
40. Bilheimer DW, Buja LM, Parkey RW, Bonte FJ, Willerson JT. Fatty acid accumulation andabnormal lipid deposition in peripheral and border zones of experimental myocardial infarcts. JNucl Med. 1978; 19:276–283. [PubMed: 204755]
Dall’Armellina et al. Page 11
Circ Cardiovasc Imaging. Author manuscript; available in PMC 2011 November 01.
Europe PM
C Funders A
uthor Manuscripts
Europe PM
C Funders A
uthor Manuscripts

Figure 1. Study protocolImaging time points (TP) in relation to the acute myocardial infarction (MI) and primarypercutaneous coronary intervention (PPCI). For each TP, the CMR data acquired is given.CMR = cardiovascular magnetic resonance; LGE = late gadolinium enhancement.
Dall’Armellina et al. Page 12
Circ Cardiovasc Imaging. Author manuscript; available in PMC 2011 November 01.
Europe PM
C Funders A
uthor Manuscripts
Europe PM
C Funders A
uthor Manuscripts

Figure 2. Time course of edemaA Mean percentage of LV volume positive for myocardial edema at each time point. Thevolume of edema remained stable in the first week post event with a significant decrease at15 -17 days with near resolution by 6 months. B. The time course of edema and resolution isgiven for each patient. There was a large range of LV % volume of edema (0 to 60%). Thisanalysis on an individual level confirms the constancy of edema measured in the first 5-7days, that is suggested in Panel A, with marked variation thereafter. Using the objectivethresholding methods described in the text, a small number of patients had a substantialvolume of apparent residual edema at 6 months.
Dall’Armellina et al. Page 13
Circ Cardiovasc Imaging. Author manuscript; available in PMC 2011 November 01.
Europe PM
C Funders A
uthor Manuscripts
Europe PM
C Funders A
uthor Manuscripts

Figure 3. Impaired segments (% affected) as a function of the extent of segment positive for (A)edema and (B) LGE at 24HSegments with acute myocardial injury as identified either by presence of late gadolinium(LGE) and/or edema. For both edema and LGE, the probability of segmental dysfunctionincreased with the fraction of segment affected. For unaffected segments, as expected, alarge majority showed normal function.
Dall’Armellina et al. Page 14
Circ Cardiovasc Imaging. Author manuscript; available in PMC 2011 November 01.
Europe PM
C Funders A
uthor Manuscripts
Europe PM
C Funders A
uthor Manuscripts

Figure 4. (A) Myocardial LGE early (12-48hrs) vs. late (6 months) and (B) wall motionimprovement abnormalitiesA. The myocardial volume (mean % ± SD) positive for LGE, decreased significantly from12 - 48 hrs to 6 months. The change in extent of LGE is also shown for each patient. Patientswith unchanged LGE at 6 months are shown in red while those with decreased LGE inblack. Eleven patients out of 24 (46%) who underwent CMR at 6 months time, showed areduction in LGE volume (of 38 ± 14%). In the remaining 13 patients, no reduction in sizeof the LGE volume was identified (23% ± 14% vs. 23% ± 14% respectively). B. Segmentswith improved function at six months (n = 68) broken down by extent of LGE within thatsegment LGE (none; 1-75% = partial thickness and 76-100% = full thickness) at both 24Hand 6M. Across categories, the extent of LGE, measured at 12 - 48 hours (dark bars) was apoor predictor of functional recovery. Significantly, even segments showing full thicknessLGE were associated with functional recovery. By contrast, LGE extent at 6 months (lightbars) was strongly inversely correlated with improved function in that segment.
Dall’Armellina et al. Page 15
Circ Cardiovasc Imaging. Author manuscript; available in PMC 2011 November 01.
Europe PM
C Funders A
uthor Manuscripts
Europe PM
C Funders A
uthor Manuscripts
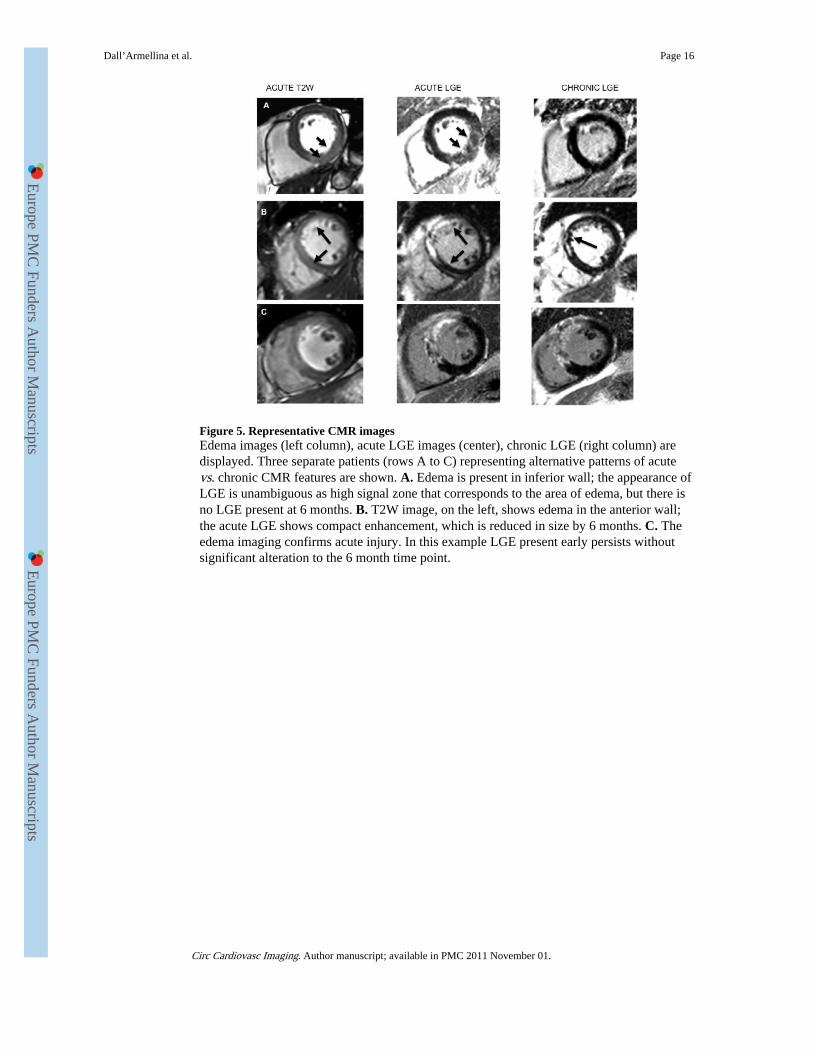
Figure 5. Representative CMR imagesEdema images (left column), acute LGE images (center), chronic LGE (right column) aredisplayed. Three separate patients (rows A to C) representing alternative patterns of acutevs. chronic CMR features are shown. A. Edema is present in inferior wall; the appearance ofLGE is unambiguous as high signal zone that corresponds to the area of edema, but there isno LGE present at 6 months. B. T2W image, on the left, shows edema in the anterior wall;the acute LGE shows compact enhancement, which is reduced in size by 6 months. C. Theedema imaging confirms acute injury. In this example LGE present early persists withoutsignificant alteration to the 6 month time point.
Dall’Armellina et al. Page 16
Circ Cardiovasc Imaging. Author manuscript; available in PMC 2011 November 01.
Europe PM
C Funders A
uthor Manuscripts
Europe PM
C Funders A
uthor Manuscripts

Figure 6. Relationship between the extent of late gadolinium (LGE) and the Troponin I at 48 hrsThe correlation between the LV % of LGE (% LVscore) assessed at 6 months and troponin Iassessed at 48 hrs (r = 0.9; P < 0.01) is shown in comparison to the equivalent relationshipwith LGE measured at 12 - 48 hours (r = 0.7, P < 0.01).
Dall’Armellina et al. Page 17
Circ Cardiovasc Imaging. Author manuscript; available in PMC 2011 November 01.
Europe PM
C Funders A
uthor Manuscripts
Europe PM
C Funders A
uthor Manuscripts

Europe PM
C Funders A
uthor Manuscripts
Europe PM
C Funders A
uthor Manuscripts
Dall’Armellina et al. Page 18
Table 1
Variable Value (mean ± SD)
Age (yrs) 56 ± 9
Sex (M:F) 26:4
Ethnicity (Caucasian: Asian) 29:1
BMI 29 ± 6
Risk Factors [No (%)]
Smoking 16 (53)
Hypertension 11 (37)
Diabetes 3 (10)
Family history 9 (30)
Hyperlipidemia 11 (37)
Troponin I (12 hours post PCI) (mg / mL) 40 ± 16
Pain to balloon time (mins) 253 ± 150
Door to balloon Time (mins)[median (interquartiles)] 44 (30; 62)
Culprit coronary artery [No (%)]
LAD 15 (50)
LCx 2 (6)
RCA 13 (43)
Number of vessels diseased [No (%)]
1 20 (67)
2 6 (20)
3 4 (13)
TIMI FLOW pre PCI [No (%)] 0.6 ± 1
0 21 (70)
1 3 (10)
2 4 (13)
3 2 (6)
TIMI FLOW post PCI [No (%)] 2.5 ± 0.6
0 0
1 2 (6)
2 10 (33)
3 18 (60)
Medications during PCI [No (%)]
GP IIb/IIIa inhibitor 23 (76)
Clopidogrel 30 (100)
Heparin 28 (90)
Aspirin 30 (100)
Concomitant medications on admission [No (%)]
Beta-blockers 1 (3)
Ace-inhibitors 6 (20)
Statins 4 (13)
Circ Cardiovasc Imaging. Author manuscript; available in PMC 2011 November 01.

Europe PM
C Funders A
uthor Manuscripts
Europe PM
C Funders A
uthor Manuscripts
Dall’Armellina et al. Page 19
Variable Value (mean ± SD)
Medications post infarct
Beta-blockers 28 (93)
Ace-inhibitors 30 (100)
Statins 30 (100)
Aspirin 30 (100)
Diuretic 3 (10)
Nitrates 8 (27)
Circ Cardiovasc Imaging. Author manuscript; available in PMC 2011 November 01.

Europe PM
C Funders A
uthor Manuscripts
Europe PM
C Funders A
uthor Manuscripts
Dall’Armellina et al. Page 20
Tabl
e 2
24 h
ours
(n=3
0)5-
7 da
ys(n
=30)
14-1
7 da
ys(n
=28)
6 m
onth
s(n
=23)
p-va
lue
Pos
t-H
OC
EF
(%)
53 ±
955
± 1
054
± 8
59 ±
60.
91.
0
ED
V (
mL
)14
4 ±
25
153
± 3
315
6 ±
37
158
± 2
20.
2
1.0
(24H
vs
1W,
24H
vs
2W,
24H
vs
6M )
0.1
(24H
vs
2W)
0.3
(24H
, vs
6M)
ESV
(m
L)
68 ±
22
72 ±
30
73 ±
27
57 ±
24
0.6
1.0
(24H
vs
1W,
2W, 6
M )
SV76
± 1
582
± 1
482
± 1
688
± 1
70.
31.
0 (2
4H v
s 1W
,24
H v
s 2W
)0.
7(24
H, v
s 6M
)
WM
SI1.
52 ±
0.3
1.4
± 0
.31.
35 ±
0.3
1.36
± 0
.3<
0.00
1<
0.01
(24
H v
s 1W
,24
Hvs
2W
,24
H v
s 6M
)
ED
EM
A(L
V%
)37
± 1
639
± 1
724
± 1
36
± 9
<0.
001
0.00
1 (2
4H v
s 2W
)0.
001
(1W
vs
2W)
0.00
1 (2
4H,2
,3 v
s6M
)
LG
E (
LV
%)
27 ±
15
21 ±
11
0.00
20.
002
Circ Cardiovasc Imaging. Author manuscript; available in PMC 2011 November 01.
Copyright © 2022 FDOKUMEN