
DUPIC Fuel Compatibility Assessment - International Nuclear ...
760
Illl KR0000544 KAERI/RR-1999/99 A Study on Direct Use of Spent PWR Fuel in CANDU Reactors DUPIC DUPIC Fuel Compatibility Assessment r ttT-7| 11/4
-
Upload
khangminh22 -
Category
Documents
-
view
2 -
download
0
Transcript of DUPIC Fuel Compatibility Assessment - International Nuclear ...

IlllKR0000544
KAERI/RR-1999/99
A Study on Direct Use of Spent PWR Fuel inCANDU Reactors
DUPICDUPIC Fuel Compatibility Assessment
r ttT-7|
11/4

Please be aware that all of the Missing Pages in this document wereoriginally blank pages
KAERI/RR-1999/99
7)
"DUPIC
2000 \ i 3
- 1 -

KAERI/RR-1999/99
n.
7\.
DUPIC
DUPIC
DUPIC ^ ^ S -y-g-SH- tftt 71
(1997.7.21-2000.3.31)
DUPIC
4
DUPIC
(2000.4.1-2002.3.31)
DUPIC ^
: ^ DUPIC
DUPIC
- 3 -

KAERI/RR-1999/99
. DUPIC
DUPIC
DUPIC
^1(1997.7.21 - 2000.3.31)
DUPIC 7 ) ^ DUPIC
DUPIC
DUPIC ^ ^ [ S ^-§-^f ^^-^1 7]
, DUPIC , o\
DUPIC
DUPIC
DUPIC
- 4 -

KAERI/RR-1999/99
DUPIC
in. ^ 9 - ^ Ml-g-
DUPIC
- 600-FPD
Tll-f- -
- 5 -

KAERI/RR-1999/99
DUPIC
DUPIC
nf) DUPIC
- DUPIC
IV.
DUPIC 71
DUPIC . DUPIC
DUPIC
0.73%
5%
^ 80%
^ : MCNP
MCNP
WIMS library*!
- 6 -

KAERI/RR-1999/99
DUPIC
JiLg-
0.2%Sk
(rms
fe WIMS/SHETAN/RFSP
3%
15%
10%
2) DUPIC
DUPIC
71
ADUPIC
600-FPD
95%!- ^ ^ ^ ^ 4 4 6935 kW iJ 888 kWS.
SLS., zielja. 4 ^ ^ ^ ^ ] ^^lfe 0.2-0.8^
. W13. ^ DUPIC i i ^ ^ Jg-f ^ ^ ^ t : } ^ # ^ 0 ) 3+BI
DUPIC f
# 2 ] ^ ^ : DUPIC2}
0.12% g| 0.15%S. 71*1 CVSL
44$11 1-. tc}B}A-] DUPIC
- 7 -

KAERI/RR-1999/99
7l$
DUPIC i n ^ £ | ^ - f 8124 kg/s3>| 7 j $ 4l4-§-£} ^ - f 8300 kg/sif H]a.*H 2%
^ M , ^ f l ^ - ^ ^ DUPIC JcgoJH 26.7 kg/sS
2% ^ W fl23.9 kg/s<HH 718 kPaS. 7]
g^ 5148 kWS. 7]& ±^$1 4966 kW< l H]*H 3.5%
DUPIC i i ^ S ] < i ^ Jg^ol 7 ] $ ii^ofl H]*1( L}«L*1 ^ ^ #
DUPIC ic^2j- 7]^- i t^of l^ 4 4 1.502 J
sac]-. A| |^ ^ # 1 «>1I>H^ £-£! - ui3-t> ^2} DUPIC
4 4 3.9%DUPIC ^
3) ^ > S . 4
>. DUPIC
shim
DUPIC
ROP S^j - i ^ * ] # ^ 7 } # JH*H 2327^
4$, DUPIC ii-SSl ROP S U ^ ^ § ^ 1 ^ 123%S
fe 72.571$
20% 2teM-3-# *H*]-5icK 71
^ ^ r ^ ^ 7151

KAERI/RR-1999/99
HlJ2.*M 'S^^SirK 4 ^ 7 ] ^ 840 J/g# 71^-AS DUPIC
3.9% # ° l ^ c } .
l - ^ ^ 27fl#
^ 120 W n j , -§-7]^ 3.71 fe S>^ 53.3 cm,
15 cm ZLSlJL # ^ ^ f xf3 1-§- #BH1^^! 10 cmolt:}. 10^
^ ii 2 m 7leHlA-]i| ^ % ^ 7l§*l 200 mrem/hr ^ 10 mrem/hr-
eftf ^ - s ^ ^ # -g-7lfe cfl^^^l ^47> ^ 17(30 ] | ^ l ^ ^} ^ ^ 1
DUPIC ^«=1S ^7^l£fe 7 1 ^ ^ # a o v ^ - ^ ^ - ^ ^ v ^ ^ - T - 0.923
MW
DUPIC ^ 1 ^ 5 . ^ \d^> w o ^ ^ e o ^ -n-3- € ^ 1 ^ H 6.47
DUPIC
#717]
DUPIC
. DUPIC
^ ms. #<>1^T:K
- 9 -

KAERI/RR-1999/99
o|
DUPIC
DUPIC 30%
4)
2-3%
DUPIC
DUPIC
GENOVA -. 600-FPD
1.3% ZL51JL »Kg-.£ 7% ol^J-^
- 10 -

KAERI/RR-1999/99
DUPIC m$.SM -7^*M *ms. aM *fl*j# *Mg**&t}. n*\ ^ 4 a]cflDUPIC
5) DUPIC
DUPIC ^ ^ S . ^l^Wl-g- ^ 7 f # ^1*> ^]^Al>g 7U^ ^Tfl^- 4 2 A1^-§-BO* 400
] g ^ - 558
275
65 $/kgUiLt;fe 4 - f a ^ojt:].. n. °}^ DUPIC
x:}. n<&3. *K2*] - f e t e ^ 7 H *)*y «!-§- ^ ^ s . ^7>*>$glfecfl, SEUif DU#
6.5% g| 10.8%# M^ ^ - T - l^wl-g^. 619 $/kgU^.
DUPIC «?<aS^ ^^MH^l - i -^ r OECD/NEA(1993)
DUPIC « | ^ S ^ ^^/^^J-wl-g-^- 170 $/kgHM
DUPIC
7] ttl-8-ol ^^«>t:]-. 2000^ 7]-S-
a]-8-AS. ^ - t > * ^ 5.13 $/kgHMol
DUPIC «}^S. *l-gvM-a S ^ ^ r ^l-^fcf^l room-and-pillar
, ^LB]JI DUPIC ^o4S^l ^^-Hl-8-^r 4 4 403,
118 g£ 220 $/kgHM<>li:K OECD/NEA
4 4 610 ^ 73
DUPIC
- 11 -

KAERI/RR-1999/99
£ one-batch
5.25-5.43 mills/kWh,
tcfef DUPIC
5.19-5.24 mills/
0.34-0.38 mi
^ . DUPIC
DUPIC
. DUPIC
DUPIC ROP
7]
DUPIC
) , DUPIC
DUPIC
3L#
- 12 -

KAERI/RR-1999/99
S U M M A R Y
I. Project Title
DUPIC Fuel Compatibility Assessment
II. Objective and Importance of Project
A. Objective
The purpose of this study is to assess the compatibility of DUPIC (Direct Use of Spent PWR
Fuel in CANDU Reactors) fuel with the current CANDU 6 reactor, which is one of the technology
being developed to utilize the spent PWR fuel in CANDU reactors. The objective of this project
has been set as follows;
- Final Objectives
• Assessment of DUPIC fuel compatibility with CANDU reactors
• Economic analysis of DUPIC fuel cycle
• Technical feasibility analysis for practical use of DUPIC fuel
- Objectives of Phase I (1997.7.21-2000.3.31)
• Feasibility analysis on applicability of the current core design method
• Feasibility analysis on operation of the DUPIC fuel core
• Compatibility analysis on individual reactor system
• Sensitivity analysis on the fuel composition
• Economic analysis on DUPIC fuel cycle
- Objectives of Phase II (2000.4.1-2002.3.31)
• Reactor safety analysis and licensing possibility
• Development of DUPIC fuel core design method
• Technology development for providing optimum DUPIC fuel material
• Technical feasibility analysis for practical use of DUPIC fuel
- 13 -

KAERI/RR-1999/99
B. Importance of Research and Development
As the nuclear power generation continues, the accumulation of spent fuel and its disposal become
an urgent problem and, therefore, each country is developing its own technology for the back-end
fuel cycle. The DUPIC technology has been developed to convert the spent PWR fuel into the
CANDU fuel, which can resolve the accumulation of spent PWR fuel and reduce the spent
CANDU fuel. In order to prove the feasibility of the DUPIC technology, the compatibility analysis
of DUPIC fuel with current CANDU reactors and the economic analysis have been performed
by Korea Atomic Energy Research Institute (KAERI) during Phase I period (1997.7.21 -
2000.3.31).
In order to prove the compatibility of the DUPIC fuel, the reference DUPIC fuel composition
was determined, the performance of the reactor analysis code was assessed, the compatibility
of individual reactor system was analyzed, and the uncertainty due to the fuel composition was
estimated. These studies have demonstrated that the current DUPIC fuel model is compatible
with the current CANDU 6 reactor. This result will be used as a basis for Phase II study, which
focuses on the feasibility of practical use of the DUPIC fuel and the reactor safety analysis.
Once the safety analysis is completed, the DUPIC fuel compatibility analysis will be accomplished.
Based on this, the possibility of licensing and key issues for the practical use of DUPIC fuel
can be discussed.
- Technical Aspect of Research and Development
The reactor physics analysis on the DUPIC fuel core utilizes the existing analysis method but
also requires new methods that can quantitatively estimate the sensitivity of the core performance
parameters to the fuel composition and power distribution. Therefore, it is possible to improve
the current CANDU core analysis technology and acquire a leading technology in CANDU fuel
development by establishing the DUPIC fuel core analysis method.
- Economic/Industrial Aspect of Research and Development
- 14 -

KAERI/RR-1999/99
Until now, the CANDU core design and analysis are partly dependent on the foreign technology.
During the Phase I period, it was possible to develope and localize a part of such technology.
As far as the compatibility analysis is concerned, it is more important to have the technology
that can be used to determine the compatibility of the DUPIC fuel than the compatibility of
the DUPIC fuel itself. It is expected that the localization of technology will contribute to the
import substitute in the future.
- Social/Cultural Aspect of Research and Development
There are diverse technical questions on the feasibility of loading DUPIC fuel in a CANDU
reactor, because the CANDU reactor was originally designed for natural uranium fuel. In order
to resolve those technical uncertainties and to provide a rationale to develope safeguardable
DUPIC technology, the compatibility analysis of the DUPIC fuel should be performed.
HI. Scope and Contents of Project
A) Feasibility analysis on applicability of the current core design method
• Design parameter
- Nuclear fuel and reactor core design data
- Physics and thermal-hydraulic design requirements
• Physics, thermal-hydraulic and safety analysis
- Analysis model and input parameters for computer codes
• Computer codes for operation
- Benchmark calculation using reactor physics measurement results
B) Feasibility analysis on operation of the DUPIC fuel core
• Neutronic characteristics analysis - Fuel bundle and channel power distribution
• Thermal-hydraulic characteristics analysis - Thermal-hydraulic parameters
• Operation characteristics analysis - 600-FPD refueling simulation
• Safety of key performance parameters - Assessment of ten reactivity coefficients
C) Compatibility analysis on individual reactor system
- 15 -

KAERI/RR-1999/99
• Reactor control system - Reactivity and power controllability
• Reactor shutdown system - Shutdown capability
• Fuel transportation system - Criticality and radiation level
• Fuel storage system - Criticality and cooling capacity
• Fuel handling system - Radiation level
• Fuel loading system - Loading path and fueling machine capacity
• Reactor structural material - Radiation effect on welding and joint area
D) Sensitivity analysis on the fuel composition
• DUPIC fuel composition analysis - Analysis on 3600 spent PWR fuel assemblies
• Sensitivity study on DUPIC fuel composition
- Uncertainty estimation of core performance parameters
E) Economic analysis on DUPIC fuel cycle
• Fuel fabrication cost - Preliminary conceptual design and cost estimation
• Fuel cycle unit cost - Fuel handling and disposal cost estimation
• Fuel cycle cost - Calculation of DUPIC and direct disposal fuel cycle cost
IV. Results and Proposal for Applications
A. Results of Research and Development
1) Feasibility analysis on applicability of the current core design method
The major differences between DUPIC and standard CANDU fuel are the fuel bundle
configuration and fuel material composition. The DUPIC fuel bundle adopts 43- element model
which has been developed for natural and slightly enriched uranium (SEU), while the standard
fuel has 37 fuel elements. For the fuel composition, the center rod of DUPIC fuel bundle contains
burnable poison material, while the standard fuel has no poison material. The DUPIC core model
is the same as the standard CANDU 6 reactor model. However, the fuel management method
of the DUPIC core is a 2-bundle shift refueling scheme, while the standard core uses an 8-bundle
shift scheme. For the analysis of the DUPIC fuel system, a transport code WIMS-AECL is
- 16 -

KAERI/RR-1999/99
used for lattice calculations and SHETAN code is used for the reactivity device analysis. Other
computer codes for the core and safety analysis are the same as those used for the standard
core analysis.
The benchmark calculation of the lattice code WIMS-AECL has been performed for the DUPIC
fuel using MCNP code. For the criticality calculation, the eigenvalue (koo) error was within
0.73% 5" k. In general, the error increases as the fuel burnup increases. The void reactivity
estimated by WIMS-AECL matches that of MCNP within 5%. However, the fuel temperature
(Doppler) coefficient has a relatively large error of 80% at the discharge state. The results of
benchmark calculations have shown that the WIMS-AECL is in general acceptable for DUPIC
physics design and analysis. However, for the slow transient that includes the fuel temperature
chang, there is a slight loss of accuracy due to the imperfectness of the temperature data.
The validation calculation of WIMS/SHETAN/RFSP code system, which is used for the DUPIC
core analysis, was performed using Wolsong 2 physics measurement data. The validation
calculation includes the calibration of boron reactivity, adjuster rod worth, shutoff rod worth,
mechanical control absorber worth, temperature coefficients of the coolant and moderator, and
power distribution. The results have shown that the average error of zone controller unit (ZCU)
worth is less 3%, which enhances an error of 0.2% 5" k for criticality. In general, the error of
reactivity device worth is less than the permissible error of 15%. The flux scan error is about
10% which is also less than permissible root-mean-square (RMS) error of 15%. The coolant
temperature coefficient was consistent with the measurement result. The results of validation
calculations have confirmed that the current core analysis system is acceptable for the feasibility
study of the DUPIC fuel compatibility analysis.
2) Feasibility analysis on operation of the DUPIC fuel core
At the initial burnup state, the reactivity coefficients of DUPIC fuel are different from those
of natural uranium fuel For natural uranium, as the fuel burnup increases, the reactivity
coefficients such as the fuel and moderator temperature coefficients increase rapidly because
Pu content increases significantly. On the other hand, the reactivity coefficients of the DUPIC
fuel are not favorable as compared with natural uranium fuel at the initial burnup stage. However,
- 17 -

KAERI/RR-1999/99
the change of the reactivity coefficient is small because Pu content changes little as the fuel
burnup increases. Therefore, the overall behavior of the DUPIC fuel is better than that of natural
uranium fuel at the equilibrium burnup state.
To assess the performance of the operating reactor, the probability to exceed the administrative
limits was estimated based on the result of 600-FPD refueling simulation. For convenience, the
administrative limit was set as 95% of the operation limit. The administrative limits for the
channel and bundle powers are 6935 kW and 888 kW, respectively. The channel power peaking
factor of 1.10 and ZCU level of 0.2-0.8 were chosen as the administrative limits. For the DUPIC
fuel core, the administrative limits of the channel and bundle powers were not exceeded, whereas
the natural uranium core has the probability of 0.3%, which shows there is no significant difference
in the reactor power characteristics between two cores. The probability to exceed the limit of
channel power peaking factor was 0.17% for DUPIC core whereas the natural uranium core
was found to never exceed this limit. For ZCU level, the probability was 0.12% and 0.15%
for the DUPIC and natural uranium cores, respectively. This revealed that both cores are almost
the same in the viewpoint of the operational performance.
The thermal-hydraulic properties were assessed for the time-average cores. The total coolant
flow rate for DUPIC core is 8124 kg/s, which is 2% less than that of natural uranium core.
The maximum channel flow is 26.7 kg/s for the DUPIC core, which is also 2% less than that
of natural uranium core. Therefore the coolant flow rate of DUPIC core meets the design
requirement. The maximum channel pressure drop is 718 kPa at the flow of 23.9 kg/s, which
also meets the design requirement. The minimum critical channel power for DUPIC core is
5148 kW, which is a 3.5% improvement over that of natural uranium core. Therefore it can
be concluded that the thermal-hydraulic performance of DUPIC core is no worse than that of
natural uranium core. The critical channel power ratio is 1.502 and 1.440 for the DUPIC and
natural uranium core, respectively, which satisfy the design requirement of 1.12. The exit quality
of the hottest channel is 3.9% and 3.7% for the DUPIC and natural uranium core, respectively,
which also meet the design requirement of 4.0%. Based on these results, the thermal-hydraulic
characteristics of the DUPIC core are not significantly different from those of natural uranium
core.
- 18 -

KAERI/RR-1999/99
3) Compatibility analysis on individual reactor system
For ZCU system, the spatial control capability after refixeling was assessed. The Xe transient
analysis has shown that the power oscillation is controlled for both the DUPIC and natural uranium
cores. For the adjuster system, the functional requirements were confirmed for the power flattening
capability, Xe reactivity compensation during the restart after a shutdown, shim operation during
the malfunctioning of the refueling machine, and reactor power level change. A distinctive feature
of the DUPIC core from the standard core is that the time necessary to reach the full power
is delayed, which is partially due to Xe feedback effect of the DUPIC core. However, the time
delay does not cause any adverse effect on the operation of DUPIC fuel core. For regional
overpower protection (ROP) trip set points, a comparative study has been performed for 232
design base cases. As a result, the ROP trip set point of DUPIC core was found to be 123%,
which is acceptable as compared with 122% for natural uranium core.
For shutdown system 1, the dynamic reactivity is 72.5 mk for DUPIC core, which is large
enough keep the reactor subcriticality. The insertion characteristics of the shutdown rods are
similar to those of natural uranium core. For the assessment of shutdown rod performance, the
reactor inlet header (RIH) 20% loss of coolant accident (LOCA) was analyzed. Though the power
pulse for DUPIC core rises a little earlier as compared with natural uranium core, the overall
integrated thermal energy deposition in the fuel during first 3 sec is almost the same for both
cores. The possibility of fuel disrupture was assessed based on the accumulated thermal energy
during the power pulse. The margin to the fuel rupture criterion, 840 J/g, for DUPIC core decreases
by 3.9% compared with natural uranium core.
For the fuel transportation technology, a transportation cask was conceptually studied, which
contains two spent fuel baskets being used for the dry storage facility at Wolsong nuclear plant.
The transportation capacity is 120 fuel bundles. The overall dimension of the cask is 53.3 cm
in radius, 15 cm in lead shield for photon shielding, and 10 cm in polyethylene for neutron
shielding. The radiation level on the surface and 2 m away from the surface of the cask satisfies
the design requirements of 200 mrem/hr and 10 mrem/hr, when the spent DUPIC fuel cooled
for 10 years is used as the source term. The weight of the cask is —17 ton including the spent
fuel, which can be handled by the head crain of the plant (the maximum capacity of 30 ton).
- 19 -

KAERI/RR-1999/99
The criticality of the transportation cask has no problem.
In the storage pool, the criticality of DUPIC fuel is 0.923 when piled up in the conventional
way. Therefore the subcriticality requirement (0.95) is satisfied. The storage capacity corresponds
to the amount of spent fuel from 12 years operation. In this case the cooling capacity of the
storage pool needs to be increased by 1 MW, considering the decay heat from the spent DUPIC
fuel. "When the cooling system is down, the time for the storage pool to reach 49°C is 10 hours
and, therefore, the cooling system should be restored in that time.
The annual dose of the fresh DUPIC fuel is 6.47 Sv/y for the whole body and, therefore, the
DUPIC fuel should be handled and transported by remote operation. When the DUPIC fuel
is transferred to the plant, they should be located at the loading system by either manual or
remote handling. First of all, the fresh fuel needs to be moved from the storage area to the
loading station (designed for dry storage facility). Once the transportation cask is opened in
the loading station, the basket containing the fuel is taken out and moved to the tilt station.
The fuel basket is moved horizontally to the fuel tray using the tilt station. Therefore, if the
DUPIC fuel transportation cask is compatible with the loading station and the fuel basket is
compatible with the tilt station, there would be no technical problem in handling the fresh DUPIC
fuel.
The compatibility of the fueling machine needs to be considered in two aspects: the endurance
time and thermal capacity. In case of DUPIC fuel, when four channels are refueled everyday
with two fuel bundles loaded in a channel, the endurance time could be reduced by a half.
The heavy water inside the magazine of the refueling machine should meet the normal operating
condition (maximum magazine temperature < 57°C) and design requirement (maximum magazine
temperature < 149°C). This requirement is satisfied if the fueling machine takes fuel bundles
necessary to load two channels at a time. Therefore there is no need to modify the fueling
machine cooling system.
The radiation shielding analysis has shown that the radiation dose outside the primary shield
of the DUPIC fuel core is less than those of natural uranium core except the end shield. Even
for the end shield, the design requirement is satisfied for th DUPIC fuel core. The heat flux
- 20 -

KAERI/RR-1999/99
and temperature requirements for the thermal shield are also met for the DUPIC fuel core.
Radiation damage rate of the critical reactor component was assessed by calculating displacement
per atom (DPA). The analyses have been performed for roll joint, calandria welding area, and
edges/corners of calandria tank assuming 30 years operation, and the results have shown that
the lifetime of the critical component of the DUPIC core could be reduced by 30% compared
with that of natural uranium core.
4) Sensitivity analysis on the fuel composition
Once three inter-assembly mixing operations are taken for 3600 spent PWR fuel assemblies,
there will be 450 distinctive fuel compositions. The distribution of these fuel compositions was
computed with 95% confidence level. In principle, there is no variation in U235 and Pu239
content if the fissile isotopic content is adjusted to the target value. On the other hand, the
standard deviation of fissile content is 2-3% when the reactivity is adjusted to the target value.
The burnup-dependency of nuclear characteristics was assessed through the depletion calculation.
For the fissile content adjustment method, the dispersion of the initial reactivity is relatively
large but it gradually decreases as the fuel burns. However, the trend is reversed for the reactivity
control method. Therefore it can be said that the fissile content adjustment method is more
effective in reducing the DUPIC fuel composition heterogeneity effect than the reactivity
adjustment method.
The uncertainty of the core performance parameter due to the variation of DUPIC fuel composition
has been estimated using a computer code GENOVA which was developed in the course of
this project. The uncertainty of the maximum channel power was obtained based on 600-FPD
refueling simulation. The uncertainty is 1.3% and 7.0% for the fissile content adjustment and
reactivity control method, respectively. To confirm the uncertainty level of the core performance
parameter obtained by the deterministic method and to realistically simulate the composition
heterogeneity on the core performance parameter, a refueling simulation was performed using
30 different DUPIC fuel types. As a result, the uncertainty of the maximum channel power
was confirmed to be less than 1%. Therefore, it can be concluded that the DUPIC fuel composition
heterogeneity does not to impose any serious effect on the reactor operation if the fuel composition
is adjusted.
- 21 -

KAERI/RR-1999/99
5) Economic analysis on DUPIC fuel cycle
In order to estimate DUPIC fuel fabrication cost, a conceptual design of the DUPIC fuel
fabrication facility was performed for the fabrication capacity of 400 MTHE/yr. The levelized
fuel fabrication cost was estimated to be 558 $/kgU. The DUPIC fuel fabrication cost is much
higher than the current light water reactor (LWR) fuel fabrication cost of 275 $/kgU and heavy
water reactor (HWR) fuel fabrication cost of 65 $/kgU, which is due to the fuel fabrication
facility construction cost that requires remote hot cell processes. The effect of using fresh uranium
to control the fuel composition was assessed too. For example, when the slightly enriched and
depleted uranium is added by 6.5% and 10.8%, respectively, the DUPIC fuel fabrication cost
619 $/kgU.
The cost of DUPIC fuel transportation and storage was indirectly estimated based on that of
LWR spent fuel (230 $/kgHM) quoted from OECD/NEA(1993) publication, uisng the decay
heat ratio. As a result, the transportation and storage cost of the DUPIC fuel was found to
be 170 $/kgHM. The DUPIC fuel handling cost was estimated too, which includes the design
modifications to load the DUPIC fuel following the reverse path in the plant. Considering both
the hardware and software modifications, the DUPIC fuel handing cost was estimated to 4500
million Won (reference year 2000), which is then converted to the levelized cost of 5.13 $/kgHM.
The DUPIC fuel disposal facility model utilizes Canadian room-and-pillar design concept. In
order to estimate the appropriate disposal cost, the domestic reactor type strategy was established
at first. Then, the disposal cost was estimated by interpolating the cost data based on the domestic
electricity generation capacity. The levelized cost was calculated by discounting the cost for
the operation period. The disposal costs for the spent LWR1, HWR and DUPIC fuel are 403,
118, and 220 $/kgHM. Considering that the current spent LWR and HWR fuel disposal costs
are 610 and 73 $/kgHM in OECD/NEA publication, the disposal costs estimated in this study
are significantly conservative to be used for the DUPIC fuel cycle cost analysis.
The DUPIC fuel cycle cost was estimated using one-batch model and compared with the direct
disposal fuel cycle. For the estimation of fuel cycle cost, both the deterministic and Monte Carlo
- 22 -

KAERI/RR-1999/99
methods were used. The deterministic analysis has shown that the DUPIC fuel cycle cost is
5.25-5.43 mills/kWh depending on the composition adjustment method while the direct disposal
fuel cycle cost is 5.19-5.24 mills/kWh. However the Monte Carlo simulation has shown that
the standard deviation of the fuel cycle cost is 0.34-0.38 mills/kWh. Therefore, it is believed
that the DUPIC fuel cycle is comparable to the once-through fuel cycle.
B. Proposals for Application
The DUPIC core analysis technology can be used for assessing the compatibility of the advanced
HWR fuel to be developed in the future with the standard CANDU core and for designing
a new HWR core. By developing DUPIC core and compatibility analysis technology, the design
and analysis technology of the standard CANDU core can also be improved. If the accuracy
of the CANDU core design and analysis method is confirmed through the experimental
verification, it is possible to achieve the technology independence for the CANDU core design
and analysis.
The ROP analysis and computer codes developed (fuel management program and perturbation
code) during Phase I of DUPIC project are expected to replace the technology imported for
the HWR core design and analysis. Also the advanced design and analysis method developed
during the course of DUPIC project can be used continuously to the development of advanced
CANDU fuels and could be exported to the developing countries in the future.
Because DUPIC core design and analysis technology includes new analysis methods as well
as the existing methodology, it can be used for the analyses of fuel loading behavior and other
related characteristics, which is necessary to demonstrate the performance of the advanced fuel
being developed. It can also be used for the following research activities;
• Cobalt production in a HWR
• Higher actinide transmutation under high thermal flux
• Thorium fuel cycle.
- 23 -

KAERI/RR-1999/99
C O N T E N T
PREFACE 1
SUMMARY (KOREAN) 3
SUMMARY (ENGLISH) , 13
CONTENT 25
TABLE CONTENT 51
FIGURE CONTENT 59
CHAPTER 1. INTRODUCTION - 69
1.1 PURPOSE OF PROJECT 72
1.2 OBJECTIVES AND SCOPE 73
1.3 CURRENT STATUS OF TECHNOLOGY DEVELOPMENT 16
1.3.1 Foreign Technology 76
1.3.2 Domestic Technology • 77
1.3.3 Review of Technology Development Cases 78
1.4 DETAILED TECHNOLOGY ITEMS 80
1.4.1 Foreign Technology 80
1.4.1.1 Design/analysis code validation 80
1.4.1.2 Reactor design/analysis method 80
1.4.1.3 Reactor system compatibility assessment 80
1.4.1.4 Reactor safety analysis 81
1.4.1.5 Fuel handling technology 81
1.4.1.6 Fuel cycle economics analysis 81
1.4.2 Domestic Technology 81
1.4.2.1 Design/analysis code validation 81
1.4.2.2 Reactor design/analysis method 82
1.4.2.3 Reactor system compatibility assessment 82
- 25 -

KAERI/RR-1999/99
1.4.2.4 Reactor safety analysis 82
1.4.2.5 Fuel handling technology 83
1.4.2.6 Fuel cycle economics analysis 83
1.5 REFERENCES 84
CHAPTER 2. VALIDATION OF NUCLEAR DESIGN METHOD 87
2.1 CANDU CORE ANALYSIS METHODOLOGY 90
2.1.1 Core Analysis Procedure 90
2.1.1.1 Lattice calculation 90
2.1.1.2 Representation of reactivity devices 90
2.1.1.3 Core calculation 91
2.1.1.4 Kinetics calculation 91
2.1.1.5 Reactor stability and control 91
2.1.1.6 Fuel management strategy • 92
2.1.2 Nuclear Design Data 92
2.1.3 Computer Codes • 92
2.1.3.1 Lattice code 92
2.1.3.2 Core analysis code 93
2.2 LATTICE CODE VALIDATION 107
2.2.1 Calculation Model 107
2.2.2 Natural Uranium Fuel 108
2.2.2.1 Burnup reactivity 108
2.2.2.2 Coolant void reactivity • 108
2.2.2.3 Fuel temperature coefficient 109
2.2.2.4 Primary heat transport system reactivity I l l
2.2.2.5 Relative pin power ratio 112
2.2.2.6 Reaction rates 112
2.2.3 DUPIC Fuel 113
2.2.3.1 Burnup reactivity 113
- 26 -

KAERI/RR-1999/99
2.2.3.2 Coolant void reactivity 113
2.2.3.3 Fuel temperature coefficient 114
2.2.3.4 Primary heat transport system reactivity 115
2.2.3.5 Relative pin power ratio 115
2.2.3.6 Reaction Rates 115
2.2.4 Summary 115
2.3 VALIDATION OF CORE ANALYSIS CODE 146
2.3.1 Calculation Procedure 146
2.3.1.1 Lattice model 146
2.3.1.2 Reactivity device model , 147
2.3.1.3 Core analysis model • 151
2.3.2 Natural Uranium Fresh Core 152
2.3.2.1 Criticality measurement 152
2.3.2.2 Reactivity device worth 152
2.3.2.3 Reactivity coefficient measurement 154
2.3.2.4 Flux distribution 154
2.3.3 Natural Uranium Equilibrium Core 155
2.3.3.1 Time-average core • 155
2.3.3.2 Refueling simulation 157
2.3.3.3 Summary 158
2.3.4 DUPIC Fuel Equilibrium Core 158
2.3.4.1 DUPIC core model 158
2.3.4.2 Comparison of results 159
2.4 SUMMARY AND CONCLUSION 196
2.5 REFERENCE 197
CHAPTER 3. REACTOR PHYSICS DESIGN AND ANALYSIS 201
3.1. PHYSICS DESIGN REQUIREMENTS OF A CANDU REACTOR 204
- 27 -

KAERI/RR-1999/99
3.1.1 Power Controllability 204
3.1.2 Compliance to Design Limits during Normal and Transient Conditions 205
3.1.3 Reactivity Controllability 205
3.1.4 Shutdown System 206
3.1.5 On-line Flux Mapping 206
3.1.6 Regional Overpower Protection 206
3.2. REACTOR PHYSICS ANALYSIS METHOD 207
3.2.1 DUPIC Fuel Cross-Section Generation 207
3.2.1.1 Base cross-section 207
3.2.1.2 Incremental cross-section 208
3.2.1.3 Xenon cross-section 208
3.2.2 DUPIC Fuel Core Calculation 209
3.2.2.1 Time-average core model 209
3.2.2.2 Instantaneous core model 210
3.2.2.3 Refueling simulation model 211
3.3. REFERENCE DUPIC FUEL COMPOSITION 217
3.3.1 Fissile Content Adjustment Option 217
3.3.1.1 Reference DUPIC fuel composition 218
3.3.1.2 Multiple spent PWR fuel mixing 218
3.3.1.3 Fuel cycle cost 219
3.3.2 Reactivity Control Option by SEU/DU 219
3.3.2.1 Spent PWR fuel mixing 219
3.3.2.2 Reactivity control by SEU/DU 220
3.3.2.3 Optimum target reactivity 221
3.3.3 Reactivity Control Option by Natural Uranium 221
3.3.3.1 Utilization of high reactivity fuel 221
3.3.3.2 Utilization of linear reactivity fuel 222
3.3.3.3 Optimum target reactivity 222
3.3.4 Characteristics of DUPIC Fuel 223
3.3.4.1 Fissile content 224
- 28 -

KAERI/RR-1999/99
3.3.4.2 Plutonium content 224
3.3.4.3 Fission products 224
3.3.5 Summary 225
3.4. DUPIC FUEL LATTICE PROPERTY 238
3.4.1 Comparison of Lattice Property 238
3.4.1.1 Lattice parameters 238
3.4.1.2 Relative pin power distribution 238
3.4.1.3 Delayed neutrons 238
3.4.2 Temperature Reactivity Effect 239
3.4.2.1 Moderator temperature reactivity effect 240
3.4.2.2 Coolant temperature reactivity effect 240
3.4.2.3 Fuel temperature reactivity effect 241
3.4.2.4 Reactivity change from full power to zero power 241
3.4.3 Void Reactivity Effect 242
3.4.3.1 Void reactivity 242
3.4.3.2 Void reactivity versus degree of voiding 242
3.4.3.3 Void reactivity versus fuel irradiation 242
3.4.3.4 Effects of absorbers on void reactivity 243
3.4.3.5 Detailed core simulation for coolant voiding 243
3.4.4 Power Coefficient 243
3.4.4.1 DUPIC fuel core • 244
3.4.4.2 Natural uranium core 244
3.4.5 Miscellaneous Reactivity Perturbations 245
3.4.5.1 Moderator purity reactivity effect 245
3.4.5.2 Coolant purity reactivity effect 245
3.5. COMPATIBILITY OF REACTIVITY DEVICES 266
3.5.1 Zone Controller Unit 266
3.5.1.1 Static reactivity worth 266
3.5.1.2 Adequacy of zone control system in suppressing spatial oscillation 267
3.5.1.3 Effect of draining zone controllers 268
3.5.2 Adjuster Rod System 269
- 29 -
KAERI/RR-1999/99
3.5.2.1 Static reactivity worths 269
3.5.2.2 Adjuster bank reactivity insertion characteristics 269
3.5.2.3 Startup after a short shutdown 270
3.5.2.4 Startup after a poison-out 271
3.5.2.5 Reactivity shim operation 271
3.5.2.6 Power reduction (stepback) 272
3.5.3 Mechanical Control Absorber 273
3.5.4 Shut-Down System 273
3.5.4.1 Static reactivity of shut-off rods 274
3.5.4.2 Performance of shut-off rod system 275
3.5.4.3 Performance of liquid poison injection system 276
3.5.5 Xenon Transient 277
3.5.5.1 Shutdown from various power levels 278
3.5.5.2 Transients after startup 278
3.5.5.3 Power stepbacks from full power 278
3.5.5.4 30-minute xenon load 279
3.5.6 Xenon Spatial Oscillation 279
3.5.6.1 Xenon oscillation 279
3.5.6.2 Instability analysis 281
3.5.7 Summary 283
3.6. REGIONAL OVERPOWER PROTECTION SYSTEM 328
3.6.1 ROP Analysis Model • 329
3.6.1.1 Trip coverage equation 329
3.6.1.2 ROP detector 329
3.6.2 ROP Calculation Procedure 330
3.6.2.1 Flux shape and channel powers 330
3.6.2.2 Thermal-hydraulic analysis 330
3.6.2.3 Detector response 331
3.6.2.4 Ripple calculation 331
3.6.2.5 Trip setpoint calculation 331
3.6.3 Result of ROP Trip Setpoint Calculation 332
- 30 -

KAERI/RR-1999/99
3.6.3.1 ROP trip setpoint 332
3.6.3.2 Single-detector failure 333
3.6.3.3 REFORM calculation 333
3.7. DUPIC FUEL CORE CHARACTERISTICS 337
3.7.1 Reference Core Simulation 337
3.7.1.1 Time-Average core 337
3.7.1.2 Instantaneous core • 338
3.7.1.3 Refueling simulation 339
3.7.2 Deterministic Analysis of Fuel Composition Heterogeneity 340
3.7.2.1 Sensitivity method for CANDU core analysis 340
3.7.2.2 Perturbation method 344
3.7.2.3 Uncertainty estimation 347
3.7.3 Statistical Analysis of Fuel Composition Heterogeneity 349
3.7.3.1 Heterogeneous core 349
3.7.3.2 Equilibrium core 352
3.7.4 Summary 353
3.8. SUMMARY AND CONCLUSION 394
3.9 REFERENCE 396
CHAPTER 4. RADIATION PHYSICS ANALYSIS 399
4.1. COMPUTER CODES AND LIBRARIES 403
4.1.1 Shielding Analysis Codes 403
4.1.2 Assessment of Shielding Analysis Code 405
4.1.2.1 Natural uranium core calculation 405
4.1.2.2 DUPIC core calculation 409
4.2. PRIMARY SHIELD ANALYSIS OF CANDU REACTOR 420
4.2.1 CANDU Primary Shield System 420
- 31 -

KAEM/RR-1999/99
4.2.1.1 End shield 420
4.2.1.2 Side shield 421
4.2.1.3 Top shield 421
4.2.1.4 Bottom shield 421
4.2.2 Primary Shield Design Criteria 421
4.2.3 Primary Shield Analysis for DUPIC Fuel 422
4.2.3.1 Source term calculation 422
4.2.3.2 End shield calculation 423
4.2.3.3 Side shield calculation 424
4.2.3.4 Top shield calculation 425
4.2.3.5 Bottom shield calculation 426
4.2.4 Radiation Heat Generation 426
4.2.4.1 Axial shield heat deposition 426
4.2.4.2 Radial shield heat deposition 427
4.2.5 Summary 428
4.3. RADIATION EFFECT ON REACTOR HARDWARE 451
4.3.1 Radiation Damage Analysis 451
4.3.1.1 Fuel channel system 452
4.3.1.2 Calandria shell system 454
4.3.2 Thermal Shield Analysis 455
4.3.2.1 Side thermal shield 455
4.3.2.2 End thermal shield 457
4.4 DUPIC FUEL HANDLING, TRANSPORTATION AND STORAGE 467
4.4.1 Dose Rate of DUPIC Fuel Bundle 468
4.4.1.1 Calculation model 468
4.4.1.2 Fresh DUPIC fuel 469
4.4.1.3 Spent DUPIC fuel 471
4.4.2 Transportation Cask for DUPIC Fuel 471
4.4.2.1 Transportation cask model for DUPIC fuel 471
4.4.2.2 Radiation source 473
- 32 -
KAERI/RR-1999/99
4.4.2.3 Shielding analysis of transportation cask 475
4.4.3 Criticality Calculation for Storage Bay 478
4.4.3.1 Stack model 478
4.4.3.2 Calculation method 480
4.4.3.3 Results and discussion 481
4.5. SUMMARY AND CONCLUSION 508
4.6 REFERENCE 510
CHAPTER 5. THERMAL-HYDRAULICS ANALYSIS 515
5.1 THERMAL-HYDRAULIC ANALYSIS MODEL 518
5.1.1 Thermal-hydraulic Design Requirements for CANDU 6 518
5.1.2 Thermal-hydraulic Model 518
5.1.2.1 Pressure drop model 519
5.1.2.2 Heat transfer model 520
5.1.2.3 Critical channel power calculation 521
5.1.3 Input Parameters and Operating Conditions 522
5.1.3.1 Feeders 522
5.1.3.2 Fuel channel and fuel bundle 523
5.1.3.3 Header-to-header boundary condition 523
5.2 RESULTS OF THERMAL-HYDRAULIC ANALYSIS 529
5.2.1 Results and Discussion 529
5.2.1.1 Channel power distribution 529
5.2.1.2 Channel flow rates 529
5.2.1.3 Critical channel power 530
5.2.1.4 Critical power ratio 530
5.2.1.5 Channel Exit Quality 531
5.2.2 Uncertainty of Critical Channel Power Prediction 531
5.2.2.1 Source of uncertainty in critical channel power calculation 531
- 33 -

KAERMRR-1999/99
5.2.2.2 Radial correction factor and associated uncertainty 532
5.3 VALIDITY OF MODELS AND CODES 555
5.3.1 NUCIRC Critical Heat Flux Model 555
5.3.2 ASSERT Code Validation 556
5.4 CONCLUSION 565
5.5 REFERENCE 566
CHAPTER 6. FUEL CYCLE ECONOMICS ANALYSIS 569
6.1 DUPIC FUEL FABRICATION COST 572
6.1.1 DUPIC Facility Design Requirements 573
6.1.1.1 Facility performance requirements 573
6.1.1.2 DUPIC fuel processing requirements 576
6.1.2 Conceptual Design of DUPIC Process System 577
6.1.2.1 Process mass balance 577
6.1.2.2 Conceptual design of fuel process system 579
6.1.2.3 Facility description 581
6.1.3 Fabrication Cost Estimation 582
6.1.3.1 Cost evaluation data 582
6.1.3.2 Fuel fabrication cost 584
6.1.4 Conclusion and recommendations 587
6.2. DUPIC FUEL HANDLING COST 608
6.2.1 Current Fuel Loading and Unloading Path 609
6.2.2 DUPIC Fuel Loading and Unloading Method 609
6.2.2.1 Utilization of current loading path 610
6.2.2.2 Utilization of current unloading path (reverse path) 612
6.2.3 Fueling Machine and Spent Fuel Storage Bay 613
6.2.3.1 Fueling machine cooling capacity 615
- 34 -

KAERI/RR-1999/99
6.2.3.2 Storage bay requirements and capacity 618
6.2.3.3 Storage bay cooling capacity 620
6.2.4 DUPIC Fuel Handling Cost in Wolsong Nuclear Power Plant 625
6.2.4.1 Compatibility of dry storage facility and DUPIC fuel handling equipment ••• 625
6.2.4.2 Pushing ram and dryer 626
6.2.4.3 Spent fuel storage and reception bay cooling system 626
6.2.4.4 Gamma detector for refueling operation 626
6.2.4.5 Fuel handling program change 627
6.2.4.6 Design documentation change 627
6.2.5 Design Modification Items and Cost 628
6.2.5.1 Fuel handling cost 628
6.2.5.2 Fuel handling unit cost 628
6.2.6 Summary and Conclusion 629
6.3. SPENT FUEL DISPOSAL COST 668
6.3.1 Basic Design Concept of Disposal Facility 669
6.3.1.1 Current status of HLW disposal technology 669
6.3.1.2 Disposal facility model • 670
6.3.2. Estimation of Scaled Disposal Cost of Spent Fuel 672
6.3.2.1 Reference disposal cost model 672
6.3.2.2 Disposal container model 674
6.3.2.3 Disposal vault layout 675
6.3.2.4 Cost of spent fuel disposal 677
6.3.3 Levelized Unit Cost of Spent Fuel Disposal 678
6.3.3.1 Analysis of electricity generation size in Korea 678
6.3.3.2 Levelized unit disposal cost 679
6.3.4 Conclusion 681
6.4 DUPIC FUEL CYCLE COST 699
6.4.1 Reference DUPIC Fuel Model 700
6.4.1.1 Fissile content adjustment (Option 1) 701
6.4.1.2 Reactivity control by SEU/DU (Option 2) 701
- 35 -

KAERI/RR-1999/99
6.4.1.3 Isotopic composition control by partial mixing (Option 3) 701
6.4.2 Unit Cost of DUPIC Fuel Cycle Composition 702
6.4.2.1 DUPIC fuel fabrication cost 702
6.4.2.2 DUPIC fuel handling cost 702
6.4.2.3 Interim storage cost •• 703
6.4.2.4 Spent fuel disposal cost 703
6.4.3 Fuel Cycle Cost Analysis 704
6.4.3.1 Fuel cycle cost calculation method 704
6.4.3.2 Reference plant and fuel cycle model 706
6.4.3.3 Fuel cycle cost calculation 707
6.4.4 Summary and Recommendations 710
6.5 REFERENCE 739
CHAPTER 7. ACHIEVEMENT OF OBJECTIVE AND FUTURE WORKS 743
7.1. ACHIEVEMENT OF OBJECTIVE 746
7.1.1 Major Achievement of Detailed Research Objective 746
7.1.2 Summary and Discussion of Detailed Research Objective 747
7.1.2.1 Feasibility analysis on applicability of current core design method 747
7.1.2.2 Feasibility analysis on operation of DUPIC fuel core 747
7.1.2.3 Compatibility analysis on individual reactor system 747
7.1.2.4 Sensitivity analysis on fuel composition 748
7.1.2.5 Economic analysis on DUPIC fuel cycle 748
7.1.3 Research Products 749
7.1.3.1 Summary table • 749
7.1.3.2 Foreign SCI journal publication 749
7.1.3.3 Foreign conference publication 750
7.1.3.4 Domestic conference publication 752
7.1.3.5 Technical report 753
7.1.3.6 Computer program 755
- 36 -

KAERI/RR-1999/99
7.2 FUTURE WORKS • 756
7.2.1 Application of Research Product 756
7.2.1.1 Economic/Industrial aspect of research and development 756
7.2.1.2 Social/Cultural aspect of research and development 756
7.2.1.3 Technical aspect of research and development 756
7.2.2 Future Works • 757
7.2.2.1 Validation of nuclear design method 757
7.2.2.2 Reactor physics design and analysis 758
7.2.2.3 Radiation physics analysis 760
7.2.2.4 Thermal-hydraulic analysis 761
7.2.2.5 Fuel cycle economics analysis 761
7.2.3 Research and Development Strategy for Phase-II 763
7.2.3.1 Final objective 763
7.2.3.2 Annual research objective and content 764
7.2.3.3 Research and development strategy 765
7.2.3.4 Research and development organization 766
- 37 -

KAERI/RR-1999/99
3
§ ^ ; 13
^ *} 38
a ^ *\ 51
59
1 ^ . 1 € 69
1-1 "S^fl^ *g.S/$ 72
1.2 <£^-7fliBl ^ ^ ig*l 73
1.3 q-L |^ 7 l ^ 7 B ^ « % : 76
1.3.1 SJ-3-SJ ^ - f 76
1.3.2 ^^$] ^ - f 77
1.3.3 <£9-7fliM}B)Jofl t^ty x } - ^ ^ ^ T£ ^ 7 f ^ 2 f 78
1.4 AflJ?- 7 ] ^ 4 % ^ ^ S ^ r^^2} 80
1.4.1 i]^-^ -f 80
1.4.1.1 ^7|]/SB^ 3-^- ^ 80
1.4.1.2 &*}S. -i^|/*fl^ a o ^ € : 80
1.4.1.3 ^ 4 S Tflf- ^ ^ 5 § 7 f 80
1.4.1.4 QX\3L Q&'g ^7} 81
1.4.1.5 ^ £ S 41^- 7]^- 81
1.4.1.6 ^ £ 5 . ^ 7 1 ^ 4 ^ 3§7> 81
1.4.2 q-iJlSj ^ - f - 81
1.4.2.1 ^7^1/sH^ S ^ ^ ^ 81
1.4.2.2 QX\3L -i7fl/*H ao ^ € : 82
1.4.2.3 ^^I-S. Tll f- ^3 ]A^ 3g7|. 82
- 38 -

KAERI/RR-1999/99
1.4.2.4 #*}$. <£&*£ 7} 82
1.4.2.5 «|«iS. ^ 7]& 83
1.4.2.6 «}^S.^7l 3*H $7} 83
1.5 ^^L^rt i 84
2 ^ . DUPIC ^ ^Tfl HHl^ l*W8 87
2.1 CANDU i ^ SfH *#$ 90
2.1.1 Jt-y *H £*} 90
2.1.1.1 3* f 7fl^ 90
2.1.1.2 «>-§-£ 7]^- 90
2.1.1.3 i i ^ 7l} > 91
2.1.1.4 J§~IHg <^ ?- 91
2.1.1.5 #*}3. <il$^3t x\}°] 91
2.1.1.6 ^ ^ ^ 9i4i£A|- 3fe] 92
2.1.2 ^ ^ T j l *}& 92
2.1.3 7^)^1:3.^. *ll?j) 92
2.1.3.1 ^4SH 922.1.3.2 i i ^ is^m 3.^ 93
2.2 2\*} SS^l t-}^ 107
2.2.1 7f|^ 3.&1 107
2.2.2 ^<£ - f e f e ^<$.g. 108
2.2.2.1 ^ 4 : £ ^ ] tcj>g. «>-§--£ 108
2.2.2.2 uJ4^fl 7|S ^ - ^ • 108
2.2.2.3 «?&5. ^rSTJl^ 109
2.2.2.4 <&%} <i ^ ^ 7^]^^1 «Vg-S. I l l
2.2.2.5 ^ H ^ 0 4 ^ . -g- # ^ «1 112
2.2.2.6 ^ - § - ^ - 112
2.2.3 DUPIC ^<$.£. 113
2.2.3.1 «*U£J£ofl ttf^r «>-§-£ 113
- 39 -

KAERI/RR-1999/99
2.2.3.2 ^4*fl 7]5E «l-§-£ *cHr 113
2.2.3.3 « 1 ^ S £S.7lHr 114
2.2.3.4 <£*} < i ^ ^ ?\W£\ ?!-%•£- 115
2.2.3.5 -tftfl ^<*l£. -g. # ^ t i | 115
2.2.3.6 « H - # 115
2.2.4 «fi.*J • 115
2.3 i i ^ *JH 3.^2) *£}*£*§ 146
2.3.1 7fl^ £*} 146
2.3.1.1 A*\ SM : 146
2.3.1.2 ^>-§-S. ^ H ^ l S. 'i 147
2.3.1.3 Jfc/fe] §1H 3.*i 151
2.3.2 ^^- f -Bfe ^ & 5 . 3-7] in^| 152
2.3.2.1 <y?fl:£ ^ -^ 152
2.3.2.2 ^-§-5. ^ ] < > | ^ ] ^ S1-3-S.71- 152
2.3.2.3 ^-§-5.7)1^ ^-^g 154
2.3.2.4 ipg*} ^ ^ r S 154
2.3.3 ^*?i -T'fifw ^ 9 l S . ^ ^ i i ^ i 155
2.3.3.1 •*] - ^ ^ in^i 155
2.3.3.2 ^H^1"^ 3.*} 157
2.3.3.3 &.<$ 158
2.3.4 DUPIC ^<g.3. ^ ^ i i ^ • 158
2.3.4.1 DUPIC ^ < £ S ii-y 3.*i 158
2.3.4.2 ^ i j - Hj.2. 159
2.4 A«| 5J ^ $ 196
2.5 ?&3- -S-^i 197
>«fl 3 ^-. DUPIC «?^i^. ^ ^ } S . 6(f^^ 'H^ 201
3.1 ic-§-S| ^7^| ^.^i 203
- 40 -

KAERI/RR-1999/99
3.1.1 # ^ 3^4. ^ 204
3.1.2 %<# i i 4 S - ^ l | o f l ^ ^ ^711 *)!*>*] 5&$ 205
3.1.3 «K§-J& * W ^ 205
3.1.4 #x}3. $*} Tfl^ • 206
3.1.5 On-line i ^ * H f Mapping 206
3.1.6 -SHjL :2*#3} iLJf 7 f l ^ • 206
3.2 iL#el §H ^ ^ * 207
3.2.1 DUPIC ^ ^ S . ^ ^ ^ ^ ^ 207
3.2.1.1 7]^: ^ ^ ^ 207
3.2.1.2 # ^ ^ ^ 208
3.2.1.3 ^|fe ^ ^ ^ 208
3.2.2 DUPIC i i ^ ^-i> 209
3.2.2.1 Al^>-3g$ ±^ S « i 209
3.2.2.2 ^?> i t ^ S « i 210
3.2.2.3 3J&S. JS. !| «H^ 211
3.3 71$ DUPIC ^ ^ S ^ 217
3.3.1 ^ < g ^ 1-€^I ^ ^ ^ tio^ 217
3.3.1.1 7}& DUPIC «}£5. 3 : ^ 218
3.3.1.2 t}# ^ ^ 218
3.3.1.3 ^<&g. ^7]H] 219
3.3.2 «>-§-.£ S ^ »|J-*> 219
3.3.2.1 AHHf ^ g ^ ^ ^ ^ 5 . ^ ^ 219
3.3.2.2 SEU/DU< 1 ^*> «>-§-£ S ^ 220
3.3.2.3 2\Z$ ^S. ^b-§-£ 221
3.3.3 *i<£ -f e f e # 4^- t l ^ § - £ ^ ^ 221
3.3.3.1 JL«>-g-£. ^ ^ ^ . ©I-g- 221
3.3.3.2 >a% tiJ-§--E « I ^ S o]-g- 222
3.3.3.3 £ H - ^ S *>-§•.£ 222
3.3.4 DUPIC ^ ^ ^ . ^ - ^ 223
3.3.4.1 «J-g-^-$ # ^ S ^ 224
- 41 -

KAERI/RR-1999/99
3.3.4.2 IHf-S.-^- ^ 224
3.3.4.3 tq&<& ^ 1 " 224
3.3.5 £.<$ 225
3.4 DUPIC ^<&£. 4*> ^ g 238
3.4.1 A*} ^ «|J2. 238
3.4.1.1 A*} &r 238
3.4.1.2 ^tfl -g-#^ £ 3 . 238
3.4.1.3 *1U; -§-$*} 238
3.4.2 ^rS. *>-§-2. M 2393.4.2.1 # ^ j | •££- SH-S SJ\ 239
3.4.2.2 ^ 4 4 £•£. SM-S. JL2]- 240
3.4.2.3 q<&3. ^:S. «>-§-£ 5 1 ^ 241
3.4.2.4 *I#3!o1H ^ # ^ A S ^Sl-A] aV-g-S. ^3]- 241
3.4.3 7]SL «J>S-JE 512} 242
3.4.3.1 7]S «Mv£ 2423.4.3.2 7]S3O^1 tcfs. «>-§-£ ^S|. 242
3.4.3.3 ^ ^ S «g^<Hl 4-g- a>-g-J£ ^ 242
3.4.3.4 ^ ^ 1 - ^H**I|S1 <§%* 243
3.4.3.5 « l i i ^ ^ 4 ^ r A o ^ *H^ 243
3.4.4 # ^ 7fl^ 243
3.4.4.1 DUPIC ^<^S. %& ±-M 244
3.4.4.2 ^ ^ - f e f e 1%<&3. %& ±^ 244
3.4.5 7M «>-§-£ 3L3\ • 245
3.4.5.1 #<S}*j| ^ S . «>-§-£ 5 : ^ 245
3.4.5.2 ^4*11 ^ £ Sl-i-S. 3-3} 245
3.5 «>-§-:£ 7}^- <$%^ 266
3.5.1 ^ * H 3i4 %%] 266
3.5.1.1. ^ «hg-£.7}- 266
3.5.1.2 ^-#^ 4^ -^^ ; 2673.5.1.3 *1<3 S ^ ^ 1 ^ 1 ^g^ ^ 1 - 3 L ^ 268
- 42 -

KAERI/RR-1999/99
3.5.2 S^J-g- 7)1^ 269
3.5.2.1 ^m 1M-S7} 269
3.5.2.2 ^§-g- «g3. «H-S. #<y ^ 269
3.5.2.3 ^7]# £3^*] *1|7HH ^ ^ 270
3.5.2.4 Poison-out ^ *1|7HF>M ^ ^ H 271
3.5.2.5 «MrJE shim ^ ^ 271
3.5.2.6 # ^ # 1 * (Stepback) S^j-g- ^ ^ ^ 272
3.5.3 g g- 273
3.5.4 #x\S. %z\ 4-f" 273
3.5.4.1 ^g^l-g- ^ ^ «>-§-£ ^ 274
3.5.4.2 ^x]-g- 7)1^ ^ 7}- 275
3.5.4.3 < *)1 ^ - 1 - ^ ^<y 7^1# J$ig- $7} 276
3.5.5 ^f|fe ^ o ) 277
3.5.5.1 4 t-^^H*|£| ^>S 81 278
3.5.5.2 Q*}£. 7\^^ ^ o | 278
3.5.5.3 *l#3oM #^^a^ 278
3.5.5.4 30£ 4 ^ -f *> 279
3.5.6 4 f e g-?> ^l^i- , • 279
3.5.6.1 *fiir *!-§• 279
3.5.6.2 # * > ^ ^ *H^ 281
3.5.7 A ^ 283
3.6 ^H f 2 f # ^ JLSL 7)1^ *H^ 328
3.6.1 ROP 711A> ^ ^ - g - • 329
3.6.1.1 ^ °}^+\ 329
3.6.1.2 ROP ?j)^-7l 329
3.6.2 ROP 7j] > ^x\ 330
3.6.2.1 ^ * H T "S ^ *1I^ %^ 330
3.6.2.2 ^ ! ^ ^ &q 330
3.6.2.3 4^-7] -g-^- 331
3.6.2.4 Ripple Tjl l •' 331
3.6.2.5 HtJ ^ ^ ^ 1 7j]^ 331
- 43 -

KAERI/RR-1999/99
3.6.3 S^J -g^* l >n-t> ^ 332
3.6.3.1 M.% -£^*1 332
3.6.3.2 I7fl 711^71 *&J£ 333
3.6.3.3 REFORM 7 ^ ^ 2 } 333
3.7 DUPIC i - £ ^ ^ H 337
3.7.1 7]& ±M * H 337
3.7.1.1 ^ l ^ - ^ ^ r i i ^ 337
3.7.1.2 ^ # ic^J 338
3.7.1.3 Al V ^ ^ - * 1 | ^ S 4 339
3.7.2 : g ^ € - 3 yo^°fl ^ t > «15:^S. «fl 4 340
3.7.2.1 CANDU J c ^ * H # - S l t t *&&£. ^^4 tio^^- 340
3.7.2.2 ^ ^ Hf 344
3.7.2.3 - i-^S. TflAl; 347
3.7.3 ^-7)1^ UO <H1 ^?> Hl^gJE «H^ 349
3.7.3.1 tif^l ii-y 349
3.7.3.2 *m j-Ell ic^J 352
3.7.4 A«? 353
3.8 -S.<^ ^ ^ ^ r 394
3.9 Q3. ۥ*! 396
4 ^ . DUPIC J n ^ «ol-A>>a #&1 «l|^ 399
4.1 <&-£3^. 51 « J 4 S 403
4.1.1 2}sfl*lH 2 H 403
4.1.2 ^ H * H SH5] ^7> 405
4.1.2.1 ^ - f e j - f f Jn-y 7}R! 405
4.1.2.2 DUPIC Jt-y ^^> 409
4.2 CANDU ^ } S . ^ 1*1- 1 * H 420
- 44 -

KAERI/RR-1999/99
4.2.1 CANDU 1*} ^ l 7 i l # 420
4.2.1.1 ##*M 420
4.2.1.2 <§^I*M 421
4.2.1.3 ^ * M 421
4.2.1.4 *Ff*M • 421
4.2.2 1*> xMXW ^ 4 *)ltt*l • 421
4.2.3 DUPIC ^SH&S.oW c M \x\ ^ 1 ^ 1 1 - i%q 422
4.2.3.1 ^ ^ 7fl# 422
4.2.3.2 ^ > * } s f l X k ] ; 423
4.2.3.3 4^W^1^> 424
4.2.3.4 ^^WR!: 425
4.2.3.5 Sff^MTiRV 426
4.2.4 <i ^ - ^ fltm 426
4.2.4.1 ^«oVtS *&*¥$ $}# • • 426
4.2.4.2 «>3 W ^ ^ ^ ^]^> 427
4.2.5 &.<$ 428
4.3 #x\S. ^ S # ^ l tH*> ^ H l <%> 451
4.3.1 aouHd ^ J - *1N 451
4.3.1.1 ^<&£. *H^ l-f- 452
4.3.1.2 2HKE:TIM ^^|] 454
4.3.2 <ixM Sfl^ 455
4.3.2.1 ^ <i }3fl 455
4.3.2.2 f^> «i^H 457
4.4 «?<£S 41^-, ^ ^ ^ ^ *M • 467
4.4.1 DUPUC ^<&M. c>^5} ^ i ^ l - 468
4.4.1.1 ^1^> s.ig 468
4.4.1.2 DUPIC *!^<*IS 469
4.4.1.3 DUPIC ^HH^ ^(&g. 471
4.4.2 DUPIC ^<£5. £ ^ § 7 l 471
4.4.2.1 DUPIC ^<gSt:>^ 1 ^ § 7 ] JE.'i 471
- 45 -

KAERI/RR-1999/99
4.4.2.2 uo
uRl-& • 473
4.4.2.3 ^£-§-71 ^j-spB^ 475
4.4.3 CANDU «|&& t\^ ^%3&% ^ t > ti^HS. Jg7} 478
4.4.3.1 * | # a.«i 478
4.4.3.2 7fl*> J2.«i 480
4.4.3.3 ^2]- ^ SL$] 481
4.5 &.<% *i ^-g- 508
4.6 ^JL^rt i 510
4 5 # . DUPIC «|«iS. <g^M 6<f^^ ^ r ^ 515
5.1 < g ^ ^ sfl^j j u g 518
5.1.1 CANDU-6 <i^ ^7^| A 3 518
5.1.2 < i ^ ^ J3.»i 518
5.1.2.1 ^ ^ - * > S-^i 519
5.1.2.2 ^ ^ ^ S.<i 520
5.1.2.3 ^ ^ l ^ l l ^ l - ^ 7fl4>i«i 521
5.1.3 ti^^>S H ^ ^ ^ 3 522
5.1.3.1 i^7] 522
5.1.3.2 ^«SS. ^B^ 9i ^ ^ ^ - 523
5.1.3.3 ^lt^^> ^ 7 f l ^ ^ 523
5.2 < i ^ *H ^^4 529
5.2.1 ^3} ^J ^ ^ 529
5.2.1.1 fl #^ ^:S 529
5.2.1.2 ^ - f r ^ 529
5.2.1.3 ^ ^ H ^ 1 -^ 530
5.2.1.4 ^7fl#^Hl 530
5.2.1.5 ^H^#9- &S. 531
5.2.2 ^ T p f l ^ - t ^ 1 - % ^ ^ 531
- 46 -

KAERI/RR-1999/99
5.2.2.1 1 - S H I ^ Q°A 531
5.2.2.2 «>^nj-^ ^ 9i 1 - % ^ 532
5.3 S . ^2} SH.SI -frJBL^ 555
5.3.1 NUCIRC 2 H S ] <£7i|<i^r S . ^ 555
5.3.2 ASSERT 2 E £ ^ • 556
5.4 ^ § 565
5.5 #^*i 566
*il 6 # . DUPIC ^# .§ .^7 ] 3 * 8 ^ ^Sj 569
6.1 DUPIC ^ < £ S a|jS«l-g- 572
6.1.1 DUPIC *]<£ -iTfl^L^ 573
6.1.1.1 A]>y ^ A ^ 573
6.1.1.2 DUPIC ^<&g. %•% SL& 576
6.1.2 DUPIC «}<£S ^§-^ 7fl [ -g7(1 • 577
6.1.2.1 ^g #^ ^# 577
6.1.2.2 ^ ^ S . ^ 1 ^ ^ - ^ ! 7H^ -gTfl 579
6.1.2.3 A ^ 7flJSL 581
6.1.3 ^ 1 S Hj-g- ^ 7 } • 582
6.1.3.1 H|-§- 3g7]- >S 582
6.1.3.2 ^<&£. ^JiHl-g- 584
6.1.4 2 [ ^ ^J ^ J S l ' W 587
6.2 DUPIC ^ « ^ S ^l^-Hj-g- 608
6.2.1 7 ]^ - ^ ^ S . ^<& *£ «1# 7&S. 609
6.2.2 DUPIC « ? g £ ^ 6 J ^ Hjj^. «t-o> 6 0 9
6.2.2.1 7 ] ^ ^ - ^ $3. %-§- »^^> 610
6.2.2.2 7 | § «ol-# ?gS %-§- aoK> ( ^ ^ ^ Ho^) 612
6.2.3 ^<&g. J3J&7] vjl Af-g-^ m&g. ^ H V S ^-^4 613
- 47 -

KAERI/RR-1999/99
6.2.3.1 DUPIC ^<^^.J2.%7] ^4-§-eoV^r^ 615
6.2.3.2 4 3 - W & 5 . *\%&. J2L# 5l a^-fHg 618
6.2.3.3 ^ H ^ f ^ S ^#2. zHHl? r*l 620
6.2.4 DUPIC *?«i&Sl 4}^ &*}£- *J-§- «]-§- ^ 625
6.2.4.1 ?l*l*|# ^Hjif DUPIC ^<&g. ^ J ^ H l S j J S L ^ 625
6.2.4.2 *HH=. ^ £ 5 . 1 M #*J 7l-^(ram) J ^3:7] .' 626
6.2.4.3 4 - g ^ «f^lS ^ ^ 3 : 51 ^ r ^ 4^1-f- 626
6.2.4.4 DUPIC ^ ^ S . 3>B 4^°11 ^ r ^ l ^ ^ ^ 4 ^ # 7 ] 626
6.2.4.5 ^ ^ S . ^ l ^ - ^ 1 ^ ^f lolSSH^ ^ ^ 627
6.2.4.6 -i l -H ^ 3 627
6.2.5 ^ U | ^ %KE. ^ ^ § al-g- 628
6.2.5.1 ^<$.£. 4-1^-al-S- 628
6.2.5.2 ^ ^ S . 4 1 ^ - ^Jflttl-ig- 628
6.2.6 ^ 5 | ^ - 629
6.3 Aj~§-^ ^<&3. *|£-ti]-g- 668
6.3.1 ^ ^ ) ^ ^ 1 7 l ^ ^ ^ l 7B^ 669
6.3.1.1 J L ^ l l 7 l # ^^71^51 ^ ^ § 669
6.3.1.2 * ^ l i i JS.^ 670
6.3.2 Aj-g-^ ^ ^ S 5 ] *|-gHl-g- 3g7V 672
6.3.2.1 7|^- ^-S-al-g- S -^ 672
6.3.2.2 ^^-§-7] SM 674
6.3.2.3 x\& #S tifl^l 675
6.3.2.4 4 - § - ^ «*^1S *|£Hl-g- 677
6.3.3 4 - § - ^ ^ ^ ^ ^ ^ r ^ Jg^Sf ^>^1 «!-§- 678
6.3.3.1 ^-4 ^ ^ 3 . Sfl*} • 678
6.3.3.2 ^ § 2 f T£4\ ^^r«l-g- 679
6.3.4 ^-g- 681
6.4 DUPIC ^ < £ ^ 7 ] al-g- 699
6.4.1 7 ] ^ *$<&S. 3.*i 700
6.4.1.1 ^^:<i^ # ^ i Q$<£ 1) 701
- 48 -

KAERI/RR-1999/99
6.4.1.2 SEU/DUofl £J«> **•§-.£ 2& (yoK> 2) 701
6.4.1.3 - f £ ^o\] SR> - § ^ 4 : 2& (*£*> 3) 701
6.4.2 DUPIC ^<$.£. ^ 7 ] - f & l ^>7f 702
6.4.2.1 DUPIC ^ £ 5 . 4^ H l -§" 702
6.4.2.2 DUPIC «JgS. 4l^-«)-§- 702
6.4.2.3 -§•#*!# 91 T^«l-§- • 703
6.4.2.4 A>^f ^<&3. *!•§• B]-§- 703
6.4.3 n<&£. ^7l«]-g- ^ 4 704
6.4.3.1 « } £ l ^ 7 l Hj-g- 7?1 > ^ 704
6.4.3.2 7 ] ^ t&Ufc 91 «J«1S. ^ 7 ] J2.ig 706
6.4.3.3 ^ ^ 5 . ^ 7 1 Hl-g- TiKl 707
6.4.4 ^ . ^ 91 ^JJL A> J- 710
6.5 ^ 3 . £ r ^ 739
7 # . «!9-7l|«i ^ -S ^ ^ S . «1 *^^ «a^- 743
7.1 ^9-711 ^ " S Tg^S. 746
7.1.1 M]^- 919- •^•S'i ^ . S . ^ ^ 746
7.1.2 Afl-f <*Kz- ^ - ^ ^ A ^ 91 ^ ^ . 747
7.1.2.1 71$ i ^ ^ i l T f l ^ S } *)-§- B > ^ ^7> 747
7.1.2.2 DUPIC ^<££. ^^f^ ^gr^ B>^-^ ^ 747
7.1.2.3 Qx\S. 4 ^ l * ^ - ^ 6ovUA^ ^7 f 747
7.1.2.4 ^<&g. # ^ 3L^ ^ l ^ S . ^r^4 748
7.1.2.5 DUPIC ^ < £ S >g^j|^ ^ - ^ 748
7.1.3 <£^- ^ 4 # 749
7.1.3.1 #^S • 749
7.1.3.2 ^j-S] SCI 7114 ^ € r • 749
7.1.3.3 ^r$\ & *Hr 750
7.1.3.4 ^-t(I ^ S fe^ 752
7.1.3.5 7l^(*l2g-^H4) M.3L*\ 753
7.1.3.6 ££12^4 755
- 49 -

KAERI/RR-1999/99
7.2 *£%-
7.2.1
7.2.1.1
7.2.1.2
7.2.1.3
7.2.2
7.2.2.1
7.2.2.2
7.2.2.3
7.2.2.4
7.2.2.5
7.2.3 2 ^
7.2.3.1
7.2.3.2
7.2.3.3
7.2.3.4
756
756
756
756
• 756
757
757
# ] H^ 758
1-51 * H ^ 760
761
761
763
763
764
765
766
- 50 -

KAERI/RR-1999/99
Table 2.1-1 Design Data of Nominal Core 96
Table 2.1-2 Design Data of Fuel Channel • 97
Table 2.1-3 Design Data of Fuel 98
Table 2.1-4 Description of Computer Codes used in CANDU Core Physics
Analysis 99
Table 2.2-1 Comparison of km for Natural Uranium Fuel Lattice 117
Table 2.2-2 Comparison of Void Reactivity for Natural Uranium Fuel 118
Table 2.2-3 Comparison of Fuel Temperature Coefficient for Natural Uranium
Fuel 119
Table 2.2-4 Relative Changes in Four Factors for Natural Uranium Fuel
at Fresh State 120
Table 2.2-5 Relative Changes in Four Factors for Natural Uranium Fuel
at Equilibrium State 121
Table 2.2-6 Relative Changes in Four Factors for Natural Uranium Fuel
at Discharge State 122
Table 2.2-7 Relative Pin Power for Natural Uranium Fuel 123
Table 2.2-8 Reaction Rate Ratio for Natural Uranium Fuel 124
Table 2.2-9 Comparison of km for DUPIC Fuel Lattice 125
Table 2.2-10 Comparison of Void Reactivity for DUPIC Fuel 126
Table 2.2-11 Comparison of Fuel Temperature Coefficient for DUPIC Fuel 127
Table 2.2-12 Relative Pin Power for DUPIC Fuel 128
Table 2.2-13 Reaction Rate Ratio for DUPIC Fuel 129
Table 2.3-1 Lattice Parameters for Natural Uranium Initial Core 161
Table 2.3-2 Lattice Parameters for Irradiated Natural Uranium Fuel 162
Table 2.3-3 Incremental Cross-sections for Initial Core 163
Table 2.3-4 Incremental Cross-sections for Equilibrium Core 164
Table 2.3-5 Reactivity Change with Boron Concentration in Moderator 165
Table 2.3-6 Comparison of ZCU Reactivity Worth 166
Table 2.3-7 Calibration of Zone Controller 167
Table 2.3-8 Comparison of Average Zone Level Worth 168
- 51 -

KAERI/RR-1999/99
Table 2.3-9 Reactivity Worth of Individual Adjuster Rod 169
Table 2.3-10 Reactivity Worth of adjuster Bank 170
Table 2.3-11 Reactivity Worth of Individual Mechanical Control Absorber 171
Table 2.3-12 Reactivity Worth of Mechanical Control Absorber Bank 172
Table 2.3-13 Reactivity Worth of Individual Shutoff Rod 173
Table 2.3-14 Reactivity Change due to Heat Transport System Temperature 174
Table 2.3-15 Reactivity Change due to Moderator Temperature 175
Table 2.3-16 Comparison of Critical Core Performance Parameters 176
Table 2.3-17 Comparison of Fixed Burnup Core Performance Parameters 177
Table 2.3-18 Comparison of Zone Controller Unit Worth 178
Table 2.3-19 Comparison of Adjuster Rod Worth 179
Table 2.3-20 Comparison of Mechanical Control Absorber Worth 180
Table 2.3-21 Comparison of Shutoff Rod Worth 181
Table 2.3-22 Comparison of 600-FPD Refueling Simulation 182
Table 3.3-1 Composition Variation for Fissile Content Adjustment Option 226
Table 3.3-2 Summary of Fissile Content Adjustment Option 227
Table 3.3-3 Unit Cost of Fuel Cycle Components 228
Table 3.3-4 Summary of Reactivity Control by SEU/DU 229
Table 3.3-5 Summary of Utilization of Linear Reactivity Fuel 230
Table 3.3-6 Comparison of k<» and Isotopic Composition 231
Table 3.3-7 Comparison of koo Variation 232
Table 3.3-8 Comparison of Thermal Absorption Cross-Section 233
Table 3.3-9 Comparison of Neutron Production Cross-section (X100) 234
Table 3.4-1 Comparison of Design Parameters for DUPIC and Natural Uranium
Fuel 246
Table 3.4-2 Lattice Parameters for DUPIC Fuel 247
Table 3.4-3 Lattice Parameters for Natural Uranium Fuel 248
Table 3.4-4 Kinetic Parameters of DUPIC Fuel 249
Table 3.4-5 Kinetic Parameters of Natural Uranium Fuel 250
Table 3.4-6 Comparison of void Reactivity 251
Table 3.4-7 Reactivity Feedback (mk) due to Power Level Change 252
- 52 -

KAERI/RR-1999/99
Table 3.5-1 Reactivity Worth and Power Tilt vs. ZCU Level for DUPIC Core •• 285
Table 3.5-2 Reactivity Worth and Power Tilt vs. ZCU Level for Natural Uranium
Core 286
Table 3.5-3 Comparison of Form Factor vs. ZCU Level 287
Table 3.5-4 Power Perturbation Coefficients in DUPIC Core 288
Table 3.5-5 Thermal Flux Perturbation Coefficients in DUPIC Core 289
Table 3.5-6 Adjuster Band Reactivity Insertion Characteristics for DUPIC Core 290
Table 3.5-7 Adjuster Bank Reactivity Insertion Characteristics for Natural Uranium
Core 291
Table 3.5-8 Simulation of Startup after Short Shutdown for DUPIC Core 292
Table 3.5-9 Simulation of Startup after Short Shutdown for Natural Uranium Core •• 293
Table 3.5-10 Simulation of Startup after Poison-out Shutdown for DUPIC Core 294
Table 3.5-11 Simulation of Startup after Poison-out Shutdown for Natural Uranium
Core 295
Table 3.5-12 Simulation of Adjuster Shim Operation for DUPIC Core 296
Table 3.5-13 Simulation of Adjuster Shim Operation for Natural Uranium Core 297
Table 3.5-14 Simulation of Stepback to 60% Full Power for DUPIC Core 298
Table 3.5-15 Simulation of Stepback to 60% Full Power for Natural Uranium Core 299
Table 3.5-16 Comparison of SOR Static Reactivity Worth 300
Table 3.5-17 Comparison of SOR Insertion Characteristics 301
Table 3.5-18 Damping Factors for Xenon Oscillation 302
Table 3.5-19 Damping Factors of DUPIC Fuel Core for Different Power Levels 303
Table 3.5-20 Damping Factors of DUPIC Fuel Core fir Various Refueling Schemes •• 304
Table 3.6-1 Estimated ROP Errors and Uncertainties for DUPIC Core
(90% Confidence) 334
Table 3.6-2 Confidence for DUPIC Fuel Core with ROP Setpoint of 125%
(25 worst cases) 335
Table 3.6-3 Setpoints for Single Detecter Failure 336
Table 3.7-1 Characteristics of DUPIC Core vs. Refueling Scheme 355
Table 3.7-2 Summary of 30 Instantaneous Calculations 356
Table 3.7-3 Comparison of Refueling Simulation for 600-FPD 357
Table 3.7-4 Comparison of Probability to Exceed Administrative Limits 358
- 53 -

KAERI/RR-1999/99
Table 3.7-5 Constrained Sensitivity to Thermal Absorption Cross Section 359
Table 3.7-6 Constrained Sensitivity to Neutron Production Cross Section 360
Table 3.7-7 Comparison of Sensitivity to Thermal Absorption Cross Section 361
Table 3.7-8 Comparison of Sensitivity to Neutron Production Cross Section 362
Table 3.7-9 Sensitivity Coefficient to Thermal Absorption Cross Section for Selected
Burnup 363
Table 3.7-10 Sensitivity Coefficient to Neutron Production 364
Table 3.7-11 Uncertainty of Lattice Parameters for DUPIC Fuel Option 1 365
Table 3.7-12 Uncertainty of Lattice Parameters for DUPIC Fuel Option 2 366
Table 3.7-13 Uncertainty of Lattice Parameters for DUPIC Fuel Option 3 367
Table 3.7-14 Uncertainty of Performance Parameters for DUPIC Fuel Option 1 368
Table 3.7-15 Uncertainty of Performance Parameters for DUPIC Fuel Option 2 369
Table 3.7-16 Uncertainty of Performance Parameters for DUPIC Fuel Option 3 370
Table 3.7-17 Sensitivity of Clustering Group 371
Table 3.7-18 Uncertainty due to Group-average Fuel Type 372
Table 3.7-19 Comparison of Performance Parameters by Refueling Simulation 373
Table 4.1-1 Atomic Densities of Materials Used in CANDU Primary Shield
Calculation 411
Table 4.1-2 Reference Number of Meshes and Dimensions Used in End Shield
ANISN Calculation 412
Table 4.1-3 Comparison of Dose Rate through End Shield between ANISN and
MCNP-4B • 413
Table 4.1-4 Comparison of Dose Rate through End Shield for DUPIC Fuel Core .... 414
Table 4.2-1 Summary of CANDU Primary Shield Thickness and Design Criteria 430
Table 4.2-2 Comparison of Dose Rates through Primary Shields 431
Table 4.2-3 Number of Meshes and Dimensions for side shield Calculation 432
Table 4.2-4 Number of Meshes and Dimensions for Top Shield Calculation 433
Table 4.2-5 Number of Meshes and Dimensions for Bottom Shield Calculation 434
Table 4.2-6 Total Heating in Two End Shield Components during Reactor
Operation 435
Table 4.2-7 Total Heating in Side Shield Components during Reactor Operation 436
- 54 -

KAERI/RR-1999/99
Table 4.3-1 DPA at Innermost Groove of Pressure Tube to End-Fitting Rolled Joint
during 30 Years Reactor Operation 459
Table 4.3-2 DPA at Weld between Heavy Steel Plates used to Construct Calandria
Side Tube Sheets during 30 Years Reactor Operation 460
Table 4.3-3 DPA at Corner of Calandria Sub-shells and Annular Plates during
30-Years Reactor Operation 461
Table 4.4-1 Percentage of Volatile and Semi-Volatile Fission Products Removed 485
Table 4.4-2 Actinide Activity and Annual Doses from Airborne Contamination
from Fresh DUPIC Fuel 486
Table 4.4-3 Annual Gamma Dose Rates from Fresh DUPIC Bundle 487
Table 4.4-4 Neutron Sources from Spent Natural Uranium Fuel According to Cooling
Time (Unit: Meuirons/sec.MTHM) 488
Table 4.4-5 Neutron Sources from Nominal Spent DUPIC Fuel According to
Cooling Time (Unit: Meutrons/secMTHM) 489
Table 4.4-6 Neutron Sources from Over-Burned Spent DUPIC Fuel According to
Cooling Time (Unit: Meutrons/sec.MTHM) 490
Table 4.4-7 Total Gamma Source Spectrum for Conventional Spent Natural Uranium
Fuel (Unit: Meutrons/sec.MTHM) 491
Table 4.4-8 Total Gamma Source Spectrum for Nominal Spent DUPIC Fuel
(Unit: Meutrons/secMTHM) 492
Table 4.4-9 Total Gamma Source Spectrum for Over-burned Spent DUPIC Fuel
(Unit: Meutrons/sec.MTHM) 493
Table 4.4-10 Dose Rates through Cask Axial Shield 494
Table 4.4-11 Dose Rates through Cask Radial Shield 495
Table 4.4-12 Dose Rates through Cask Radial Shield Depending on Gamma Shield
Thickness 496
Table 4.4-13 keff of One Core-Load of Fuel Bundles in Contact with Each Other .... 497
Table 4.4-14 keff of One Core-Load of Fuel Bundles in 0.4 mm Separation
(Moderator-to-Volume Ratio = 1.0811) - 498
Table 4.4-15 keSf for Fuel Bundles Infinitely Stacked Criss-Crossed 499
Table 4.4-16 keff for Fuel Bundles in Single Transport Module 500
Table 4.4-17 keff for Fuel Bundles in Infinite Transport Module 501
- 55 -

KAERI/RR-1999/99
Table 5.2-1 Result of Sensitivity Analysis 534
Table 5.2-2 Selected Fuel Channels for Radial Correction Factor Calculation 535
Table 5.2-3 Radial Correction Factor 536
Table 6.1-1 Characteristics of DUPIC Fuel Bundle 588
Table 6.1-2 Nominal Level of Recycle Stream for DUPIC Process 589
Table 6.1-3 Material Flow in Main Process Building 590
Table 6.1-4 Estimated DUPIC Direct Capital Cost - 591
Table 6.1-5 Estimated Annual DUPIC Labor Cost 592
Table 6.1-6 Estimated Annual DUPIC Non-Labor Cost 593
Table 6.1-7 Inputs for Life Cycle and Unit Cost Estimation 594
Table 6.1-8 Life Cycle Cost and Unit Cost Estimation of DUPIC Fuel Fabrication
. (Discount 5 % Capacity 400 MT, Contingency 25%) 595
Table 6.1-9 Estimated Costs for DUPIC Fuel Fabrication Plant of 400 MTHE/yr
Capacity 596
Table 6.1-10 Sensitivity Analysis on Cost Parameters 597
Table 6.1-11 Sensitivity Analysis for Adding Natural Uranium 598
Table 6.1-12 Sensitivity Analysis for Adding Slightly Enriched Uranium 599
Table 6.2-1 Comparison of DUPIC Fuel Loading Path (Front Loading) 631
Table 6.2-2 Comparison of DUPIC Fuel Loading Path (Reverse Loading) 632
Table 6.2-3 Time History for Defueling of 8 Bundles per Channel 633
Table 6.2-4 Time History for Defueling of 4 Bundles in 2 Channels
(2 Bundles per Channel) 634
Table 6.2-5 Parameters for Calculation of D2O Temperature in Fueling Machine 635
Table 6.2-6 Parameters for Calculation of D2O Temperature in Storage Bay 636
Table 6.2-7 Storage Bay Temperature and Heat Load due to Spent Fuel Decay
Heat 637
Table 6.2-8 Heat Load in Storage Bay due to Instantaneous Discharge of
Full and Half Core 638
Table 6.2-9 Storage Bay Temperature and Decay Heat of Spent Fuel due to
Core Discharge 639
- 56 -

KAERI/RR-1999/99
Table 6.2-10 Time to Reach 49°C due to Malfunction of Storage Bay Cooling
System 640
Table 6.2-11 Fatigue Usage Factor for Fueling Machine 641
Table 6.2-12 Capital Cost for DUPIC Fuel Handling 642
Table 6.2-13 Unit Cost and Economic Parameters of DUPIC Fuel Handling 643
Table 6.2-14 Life Cycle and Unit Cost of DUPIC Fuel Handling 644
Table 6.3-1 Cost Estimates for Packaging and Geological Disposal of Spent Fuel •••• 682
Table 6.3-2 Comparison of Disposal Containers 683
Table 6.3-3 Summary of Repository Data for 5000 TWh Electricity Production 684
Table 6.3-4 Summary of Repository Operation Data 685
Table 6.3-5 Breakdown of Disposal Costs (1991 U$ million) 686
Table 6.3-6 Nuclear System Scenario up to 2030 687
Table 6.3-7 Results of Material Flow and Electricity Generation for Fuel Cycle
Options • 688
Table 6.3-8 Cost Break-Down for Disposal Facility (1991 U$ million) 689
Table 6.3-9 Discounted Disposal Costs for CANDU-NU Spent Fuel 690
Table 6.3-10 Discounted Disposal Costs for CANDU-DUPIC Spent Fuel 691
Table 6.3-11 Discounted Disposal Costs for PWR Spent Fuel 692
Table 6.3-12 Disposal Unit Costs for Three Different Spent Fuels 693
Table 6.4-1 Characteristics of Reference DUPIC Fuel 712
Table 6.4-2 Input Values for Fuel Cycle Components 713
Table 6.4-3 Distribution Parameters of Input Values for Uncertainty analysis 714
Table 6.4-4 Characteristics of Reference Reactors and Fuels for Once-through
and DUPIC Fuel Cycles 715
Table 6.4-5 Material Flow of Once-through Fuel Cycle based on One-Batch
Equilibrium Model 716
Table 6.4-6 Material Flow of once -through Fuel Cycle Based in One CANDU
Reactor 717
Table 6.4-7 Levelized Costs (mills/kWh) of Once-through and DUPIC Fuel Cycle
for Option 1 (Deterministic Method) 718
Table 6.4-8 Levelized Costs (mills/kWh) of Once-through and DUPIC Fuel Cycle
for Option 2 (Deterministic Method) 719
- 57 -

KAERI/RR-1999/99
Table 6.4-9 Levelized Costs (mills/kWh) of Once-through and DUPIC Fuel Cycle
for Option 3 (Deterministic Method) 720
Table 6.4-10 Summary of Levelized Fuel Cycle Costs by Deterministic
Method (mills/kWh) 721
Table 6.4-11 Results of Monte Carlo Simulation for Uncertainty Analysis of Fuel
Cycle Cost (Statistical Parameters and Percentile) 722
Table 6.4-12 Summary of Environmental Benefit of DUPIC Fuel Cycle 723
- 58 -

KAERI/RR-1999/99
Figure 2.1-1 A Simple Chart of Physics Analysis for a CANDU Reactor 100
Figure 2.1-2 Configuration of a DUPIC Fuel Lattice 101
Figure 2.1-3 Face View of Reactor Showing Fuel Channels and Calandria Shell 102
Figure 2.1-4 Plan View of Reactor Showing Layout of Reactivity Devices 103
Figure 2.1-5 Face View of Reactor Showing Zone Controllers and Adjusters 104
Figure 2.1-6 SHETAN Model of a Lattice Cell 105
Figure 2.1-7 Time-Average 8-Bundle Shift in a 12-Bundle Channel 106
Figure 2.2-1 Variation of kw for Natural Uranium Fuel Lattice 130
Figure 2.2-2 Void Reactivity Change for Natural Uranium Fuel at Fresh State 131
Figure 2.2-3 Void Reactivity Change for Natural Uranium Fuel at Equilibrium State 132
Figure2.2-4 Void Reactivity Change for Natural Uranium Fuel at Discharge State ••• 133
Figure 2.2-5 Temperature Reactivity Change for Natural Uranium Fuel
at Fresh State 134
Figure 2.2-6 Temperature Reactivity Change for Natural Uranium Fuel
at Equilibrium State 135
Figure 2.2-7 Temperature Reactivity Change for Natural Uranium Fuel
at Discharge state 136
Figure 2.2-8 Reactivity Change versus System Temperature Following a Reactor
Shutdown 137
Figure 2.2-9 Variation of km for DUPIC Fuel Lattice 138
Figure 2.2-10 Void Reactivity Change for DUPIC Fuel at Fresh State 139
Figure 2.2-11 Void Reactivity Change for DUPIC Fuel at Equilibrium State 140
Figure 2.2-12 Void Reactivity Change for DUPIC Fuel at Discharge State 141
Figure 2.2-13 Temperature Reactivity Change for DUPIC Fuel at Fresh State 142
Figure2.2-14 Temperature Reactivity Change for DUPIC Fuel at Equilibrium state •••- 143
Figure 2.2-15 Temperature Reactivity Change for DUPIC Fuel at Discharge State 144
Figure 2.2-16 Reactivity Change versus System Temperature Following a Reactor
Shutdown 145
Figure 2.3-1 SHETAN Model for Fuel Channel 183
Figure 2.3-2 SHETAN Model for Reactivity Device 184
- 59 -

KAERI/RR-1999/99
Figure 2.3-3 WIMS-AECL Slab Model for Structural Materials 185
Figure 2.3-4 Typical RFSP Nodal Model for XY Plane 186
Figure 2.3-5 Typical RFSP Nodal Model for XZ Plane 187
Figure 2.3-6 Calibration of Zone Controller 188
Figure 2.3-7 Heat Transport System Temperature Effect 189
Figure 2.3-8 Moderator Temperature Effect 190
Figure 2.3-9 Horizontal Flux Scan 191
Figure 2.3-10 Vertical Flux Scan 192
Figure 2.3-11 Comparison of Channel Power for Equilibrium Natural Uranium Core
(Critical Core) 193
Figure 2.3-12 Comparison of Channel Power for Equilibrium Natural Uranium Core
(Fixed Burnup) 194
Figure 2.3-13 Comparison of Bundle Power Distribution for Equilibrium DUPIC Core 195
Figure 3.2-1 DUPIC Fuel Lattice Model 212
Figure 3.2-2 SHETAN Model for Fuel Channel 213
Figure 3.2-3 SHETAN Model for Reactivity Device 214
Figure 3.2-4 Front View of CANDU-6 Core 215
Figure 3.2-5 Plan View of Reactivity Device Layout 216
Figure 3.3-1 Distribution of k«, for Fissile Content Adjustment Option 235
Figure 3.3-2 Distribution of kM for Spent PWR Fuel 236
Figure 3.3-3 Distribution of k» for Reactivity Control Option 237
Figure 3.4-1 Variation of £„ and keff with Burnup (PPV+WIMS) 253
Figure 3.4-2 Variation of Relative Element Linear Power with Burnup 254
Figure 3.4-3 Reactivity Change due to Moderator Temperature (WIMS) 255
Figure 3.4-4 Reactivity Change due to Coolant Temperature (WIMS) 256
Figure 3.4-5 Reactivity Change due to Fuel Temperature (WIMS) 257
Figure 3.4-6 Reactivity Change due to System Temperature Following a Reactor
Shutdown (WIMS) 258
Figure 3.4-7 Reactivity Increase due to Complete and Partial Voiding of
Coolant (WIMS) 259
Figure 3.4-8 Variation of Coolant Void Reactivity with Fuel Burnup (WIMS) - 260
- 60 -

KAERI/RR-1999/99
Figure 3.4-9 Dependence of Coolant Void Reactivity on Amount of Boron in
Moderator and Coolant Purity for DUPIC Fuel 261
Figure 3.4-10 Dependence of Coolant Void Reactivity on Amount of Boron in Moderator
and Coolant Purity for Natural Uranium Fuel (WIMS) 262
Figure3.4-ll Comparison of Power Coefficients 263
Figure 3.4-12 Reactivity Change due to Moderator D2O Purity (WIMS) 264
Figure 3.4-13 Reactivity Change due to Coolant D2O Purity (WIMS) 265
Figure 3.5-1 Comparison of ZCU Static Reactivity Worth 305
Figure 3.5-2 Power Tilts after Refueling Transient 306
Figure 3.5-3 Comparison of Xenon Load at 30-min after Shutdown 307
Figure 3.5-4 Comparison of ADJ Bank Insertion Characteristics 308
Figure 3.5-5 Xenon Buildup after Shutdown 309
Figure 3.5-6 Static Reactivity Worth of MCA 310
Figure 3.5-7 Comparison of Static Reactivity Worth Insertion Characteristics 311
Figure 3.5-8 Reactor Power for 20% RIH Break LOCA Shutdown by SDS1 312
Figure 3.5-9 Dynamic Reactivity for 20% RIH Break LOCA Shutdown by SDS1 313
Figure 3.5-10 Reactor Power for 100% RIH LOCA Shutdown by SDS2 314
Figure 3.5-11 Dynamic Reactivity for 100% RIH LOCA Shutdown by SDS2 315
Figure 3.5-12 Xenon Load after Reactor Shutdown 316
Figure 3.5-13 Xenon Load after Reactor Startup 317
Figure 3.5-14 Xenon Load after Power Setback from Full Power 318
Figure 3.5-15 Comparison of Top-to-Bottom Tilt 319
Figure 3.5-16 Comparison of Side-to-Side Tilt 320
Figure 3.5-17 Comparison of Front-to-Back Tilt 321
Figure 3.5-18 Comparison of Top-to-Bottom Oscillation with Different Power Levels
for DUPIC Core 322
Figure 3.5-19 Axial Power Shape of Central Channel for Various Refueling Schemes 323
Figure 3.5-20 Comparison of Front-to-Back Tilt for Various Refueling Schemes of
DUPIC Core 324
Figure 3.5-21 ZCU Controllability of Top-to-Bottom Oscillation of DUPIC Core 325
Figure 3.5-22 ZCU Controllability of Side-to-Side Oscillation of DUPIC Core 326
Figure 3.5-23 ZCU Controllability of Front-to-Back Oscillation of DUPIC Core 327
- 61 -

KAERI/RR-1999/99
Figure 3.7-1 Comparison of Axial Power of Channel L-3 374
Figure 3.7-2 Comparison of Horizontal Channel Power for Row M 375
Figure 3.7-3 Comparison of Vertical Channel Power for Column 11 376
Figure 3.7-4 Axial Power Shape for 2-Bundle Shift Core 377
Figure 3.7-5 Channel Power Map of Reference DUPIC Core 378
Figure 3.7-6 Maximum Channel Power for 600-FPD Simulation 379
Figure 3.7-7 Maximum Bundle Power for 600-FPD Simulation 380
Figure 3.7-8 Zone Controller Level for 600-FPD Simulation 381
Figure 3.7-9 Channel Power Peaking Factor 600-FPD Simulation 382
Figure 3.7-10 Flow Diagram of Sensitivity Calculation 383
Figure3.7-ll Age Distribution of Instantaneous Core 384
Figure 3.7-12 Distribution km for 30 Fuel Types (Option 1) 385
Figure 3.7-13 B5U Content Distribution for 30 Fuel Types (Option 2) 386
Figure 3.7-14 235U Content Distribution for 30 Fuel Types (Option 3) 387
Figure 3.7-15 Channel Power Uncertainty due to Group-Average Fuel Property
(Option 1) 388
Figure 3.7-16 Bundle Power (Position 6) Uncertainty due to Group-Average Fuel
Property (Option 1) 389
Figure 3.7-17 Channel Power Peaking Factor Uncertainty due to Group-Average
Fuel Property (Option 1) 390
Figure 3.7-18 Heterogeneity Effect on MCP during 600-FPD Simulation 391
Figure 3.7-19 Heterogeneity Effect on MBP during 600-FPD Simulation 392
Figure 3.7-20 Heterogeneity Effect on CPPF during 600-FPD Simulation 393
Figure 4.1-1 One-dimensional Model for the End Shield System 415
Figure 4.1-2 Core Channel Map for CANDU-6 Reactor 416
Figure 4.1-3 Comparison of Total Dose Rate for End Shield 417
Figure 4.1-4 Comparison of Heat Deposition Rate through End Shield for Natural
Uranium Core 418
Figure 4.1-5 Comparison of Heat Deposition Rate through End Shield
for DUPIC Core 419
Figure 4.2-1 CANDU Primary Shield System 437
- 62 -

KAERI/RR-1999/99
Figure 4.2-2 Fission Neutron Spectrum for both Natural Uranium and DUPIC Fuel •• 438
Figure 4.2-3 Coordinates Used for Source Term Generation 439
Figure 4.2-4 Axial Power Distribution for End Shield Calculation
(Average over Channels L-ll , L-12, M-ll and M-12) 440
Figure 4.2-5 Comparison of Dose Rates through End Shield 441
Figure 4.2-6 Bundle Power Distribution on Core Side
(Average over Channels L-l, L-22, M-l and M-22) 442
Figure 4.2-7 Radial Power Distribution for Side Shield Calculation 443
Figure 4.2-8 Comparison of Dose Rates through Side Shield • 444
Figure 4.2-9 Radial Power Distribution for Top Shield Calculation 445
Figure 4.2-10 Comparison of Dose Rates through Top Shield 446
Figure 4.2-11 Radial Power Distribution for Bottom Shield Calculation 447
Figure 4.2-12 Comparison of Dose Rates through Bottom Shield 448
Figure 4.2-13 Comparison of Heat Deposition Rates through End Shield during
Full Power Operation 449
Figure 4.2-14 Comparison of Heat Deposition Rates through Side Shield during
Full Power Operation 450
Figure 4.3-1 Fuel Channel System 462
Figure 4.3-2 Calandria Shell 463
Figure 4.3-3 Configuration of Natural Uranium Fuel Lattice 464
Figure 4.3-4 Configuration of DUPIC Fuel Lattice 465
Figure 4.3-5 End Thermal Shielding 466
Figure 4.4-1 a-n and Fission Neutrons from Fuel Bundle after 10-Year Decay 502
Figure 4.4-2 Spent DUPIC Fuel Storage Basket 503
Figure 4.4-3 Spontaneous Fission Spectrum of 2i2Cf 504
Figure 4.4-4 keff of Infinite Hexagonal Lattice of 37-Element Standard Natural Uranium
Fuel Bundle at Discharge Burnup State 505
Figure 4.4-5 keff of Infinite Hexagonal Lattice of 43-Element DUPIC Fuel Bundle
at Fresh Burnup State 506
Figure 4.4-6 kef/ of Infinite Hexagonal Lattice of 43-Element DUPIC Fuel Bundle
at Discharge Burnup State 507
- 63 -

KAERI/RR-1999/99
Figure 5.1-1 Slave Channel Analysis Model in NUCIRC Code 525
Figure 5.1-2 CCP Calculation Scheme in NUCIRC 526
Figure 5.1-3 Geometry of Inlet Feeder to Channel N19 527
Figure 5.1-4 Feeder Geometry Input of NUCIRC 528
Figure 5.2-1 Channel Power Distribution of DUPIC Core (kW) 537
Figure 5.2-2 Channel power Distribution of Standard Core (kW) 538
Figure 5.2-3 Axial Power Distribution of DUPIC and Standard Fuel for Channel
Ll l at 100% F.P. Normal Operating Condition 539
Figure 5.2-4 Channel Flow Rate of DUPIC Core (kg/s) 540
Figure 5.2-5 Channel Flow of Standard Core (kg/s) 541
Figure 5.2-6 Critical Channel Power in DUPIC Core 542
Figure 5.2-7 Critical Channel Power in Standard Core 543
Figure 5.2-8 Critical Power Ratio in DUPIC Core 544
Figure 5.2-9 Critical Power Ratio in Standard Core 545
Figure 5.2-10 Channel Exit Quality of DUPIC Core 546
Figure 5.2-11 Channel Exit Quality of standard Core 547
Figure5.2-12 Enthalpy of DUPIC fuel in Channel Ll l under CHF Condition 548
Figure5.2-13 Enthalpy of Standard Fuel in Channel Ll l under CHF Condition 549
Figure5.2-14 Void Distribution of DUPIC Fuel in Channel L l l under CHF
Condition 550
Figure 5.2-15 Void Distribution of Standard Fuel in Channel Ll l under CHF
Condition 551
Figure5.2-16 CHFR of DUPIC Fuel in Channel L l l under CHF Condition 552
Figure5.2-17 CHFR of Standard Fuel in Channel Ll l under CHF Condition 553
Figure5.2-18 Axial Distribution of CHFR in Channel Ll l under CHF Condition 554
Figure 5.3-1 Heat Flux Versus Quality at Location of BT, Freon-114 Annulus Data,
Dl=0.563 in., D2=0.875 in. and 12 ft Heated Length 558
Figure 5.3-2 Critical Quality Versus Boiling Length, Freon-114 Annulus Data 559
Figure 5.3-3 Critical Quality Versus Boiling Length Data, 12.6 mm Round Tube
3.66 m Heated Length 560
Figure 5.3-4 Subchannel and Rod Numbering in ASSERT Validation for Standard
Fuel Bundle Simulation 561
- 64 -
KAERI/RR-1999/99
Figure 5.3-5 Pressure Drop and Void Profiles Simulated by ASSERT Code 562
Figure 5.3-6 Measured and Computed Fuel Rod Surface Temperature in Different
Subchannels 563
Figure 5.3-7 Measured and Computed CHF for Standard Fuel Bundle Experiments ••• 564
Figure 6.1-1 Schematic Process for DUPIC Facility Cost Evaluation 600
Figure 6.1-2 Configuration of DUPIC Fuel Bundle 601
Figure 6.1-3 Accounting Methodology in DUPIC 602
Figure 6.1-4 Pictorial Illustration of DUPIC Process 603
Figure 6.1-5 DUPIC Process Mass Balance Schematic 604
Figure 6.1-6 DUPIC Facility Area Plot 605
Figure 6.1-7 Main Process Building Floor Plot 606
Figure 6,1-8 Sensitivity of Cost Parameters 607
Figure 6.2-1 CANDU-6 Refueling Sequence 645
Figure 6.2-2 Current CANDU-6 Fuel Transfer Path 646
Figure 6.2-3 CANDU-6 Fuel Handling System 647
Figure 6.2-4 Spent Fuel Discharge Elevator 648
Figure 6.2-5 Spent Fuel Transfer Equipment 649
Figure 6.2-6 Spent Fuel Storage Tray 650
Figure 6.2-7 Spent Fuel Shielded Basket Drying and Welding Station 651
Figure 6.2-8 Short-Term Spent DUPIC Fuel Decay Heat per Bundle 652
Figure 6.2-9 Long-Term Spent DUPIC Fuel Decay Heat per Bundle 653
Figure 6.2-10 Magazine Temperature from 4-Bundle Shift (2 Bundles per Channel)
Refueling 654
Figure 6.2-11 Magazine Temperature from 8-Bundle Shift (2 Bundles per Channel)
Refueling • 655
Figure 6.2-12 Magazine Temperature from 8-Bundle Shift Refueling per Channel 656
Figure 6.2-13 Storage Bay Temperature from Spent Fuel Spent Fuel Decay Heat 657
Figure 6.2-14 Storage Bay Heat Load from Spent Fuel Decay Heat 658
Figure 6.2-15 Storage Bay Temperature from Full Core Dump after 31-Years
of Reactor Operation 659
Figure 6.2-16 Storage Bay Heat Load form Full Core Dump after 31-Years
- 65 -

KAERI/RR-1999/99
of Reactor Operation 660
Figure 6.2-17 Storage Bay Temperature from Full Core Dump after 12-Years
of Reactor Operation 661
Figure 6.2-18 Storage Bay Heat Load from Full core Dump after 12-Years
of Reactor Operation 662
Figure 6.2-19 Storage Bay Temperature from Half Core Dump after 31-Years
of Reactor Operation 663
Figure 6.2-20 Storage Bay Heat Load from Half Core Dump after 31-Years
of Reactor Operation 664
Figure 6.2-21 Storage Bay Temperature from Half Core Dump after 12-Years
of Reactor Operation 665
Figure 6.2-22 Storage Bay Heat Load from Half Core Dump after 12-Years
of Reactor Operation 666
Figure 6.2-23 DUPIC Fuel Transfer Path 667
Figure 6.3-1 Procedure of HLW Disposal Cost Estimation 694
Figure 6.3-2 Spent Fuel Disposal Facility Perspective 695
Figure 6.3-3 Waste Emplacement Geometry for an Underground Facility 696
Figure 6.3-4 Installed Capacity of Nuclear Power Plants 697
Figure 6.3-5 Disposal Unit Costs for Spent CANDU-NU, CANDU-DUPIC and
PWR Fuels 698
Figure 6.4-1 Procedure of Cost Analysis of DUPIC Fuel Cycle 724
Figure 6.4-2 Triangular Distribution Function of Natural Uranium
(Minimum=15, Mode=19.2 and Maximum=35$/kg) 725
Figure 6.4-3 Components and Time Frame of Once-through and DUPIC Fuel Cycles 726
Figure 6.4-4 Histogram of Fuel Cycle Cost for DUPIC Fuel Option 1 727
Figure 6.4-5 Histogram of Fuel Cycle Cost for DUPIC Fuel Option 2 728
Figure 6.4-6 Histogram of Fuel Cycle Cost for DUPIC Fuel Option 3 729
Figure 6.4-7 Comparison of Probabilistic Density Function of Fuel Cycle Cost for
Option 1 730
Figure 6.4-8 Comparison of Probabilistic Density Function of Fuel Cycle Cost for
Option 2 731
Figure 6.4-9 Comparison of Probabilistic Density Function of Fuel Cycle Cost for
- 66 -
KAERI/RR-1999/99
Option 3 732
Figure 6.4-10 Sensitivity of Fuel Cycle Component for Option 1 733
Figure 6.4-11 Sensitivity of Fuel Cycle Component for Option 2 734
Figure 6.4-12 Sensitivity of Fuel Cycle Component for Option 3 735
Figure 6.4-13 Natural Uranium Saving and Spent Fuel Reduction for DUPIC Fuel
Option 1 (based on annual requirement of one CANDU reactor) 736
Figure 6.4-14 Natural Uranium Saving and Spent Fuel Reduction for DUPIC Fuel
Option 2 (based on annual requirement of one CANDU reactor) 737
Figure 6.4-15 Natural Uranium Saving and Spent Fuel Reduction for DUPIC Fuel
Option 3 (based on annual requirement of one CANDU reactor) 738
- 67 -

KAERI/RR-1999/99
KAERI/RR-1999/99
1. M
DUPIC
(SEU),M
AIROX
y 1990 1
DUPIC ^ ^ ^ ^ 7 ] 71^-
2000V1 3 ^ 31 <g
A ^ ^ ^ S . 1997V1 7 ^ 21
DUPIC ^ ^ S ^ 7 ] 71^-
DUPIC
©1-g- 7 } # #
- 71 -

KAERI/RR-1999/99
1.1
fe<>l-8-*H
127]S)
DUPIC
DUPIC
. n sm DUPIC4^5171
DUPIC
- 72 -

KAERI/RR-1999/99
1.2
DUPIC 7]
DUPIC
71$
, DUPIC
DUPIC
. DUPIC
, ZL # DUPIC ^ DUPIC
DUPIC 71
DUPIC
DUPIC D U P I C
DUPIC
lfe DUPIC
DUPIC
- 73 -

KAERI/RR-1999/99
-&
(1997.7.21-
1998.3.31)
DUPIC
DUPIC
, Poison
7]
•ROP
DUPIC
•DUPIC
• DUPIC
DUPIC
(1998.4.1-
1999.3.31)
DUPIC
- DUPIC
- DUPIC
- 74 -

KAERl/RR-1999/99
(1998.4.1-
1999.3.31)
(1999.4.1-
2000.3.31)
DUPIC i^QS.
DUPIC ^<&.g.
- DUPIC ^g^l
• *%<&£. M
- DUPIC ic>y
- DUPIC ^<?1
•«»-*— jzt ^i O
- DUPIC 5g^l
8"*1 7 1 ^ Jg7|-
• ^ 1 ' ^ . ' ^ (^1^.5.
- -U} ^ 7]- ^J 7fl
I'M 7 1 ^ ^l"1?)"^
^ TJlf- ^ 7 f
>
I 71 ^
«£)
431,
- 75 -

KAERI/RR-1999/99
1.3 ^ l f l * &%
1.3.1
-b <* 3.5
Pu239/241
1.2-1.5
^ . e ^ 235^ ^HO>O] o.7
wt% ILK} 3.7] n^6\)
7 ] # 3 . AIROX
AIROX
MOX ^ ^ S . A f ^ H1J2. ^ 7 } 1 - ^*5t> ^ ^ 1 - AIROX
^ CANDU 7||3O> *%<&$. ^7]S.x\ ^ ^ ^ f s f e (SEU),
(RU), ^ ^ « f ^ S (MOX) ^ - l 4
TANDEM
NRC ^*)1*W AECLo]
3.71]
- 76 -
KAERI/RR-1999/99
CANDU
22 «f 84
-fettle ^ 50%<Hl
20%
MOX-if
SEU
.11 1.2 wt%
25-50%
^r WIMS
DIREN#
PIJXYZ
1.3.2
40%
7]
n| • 9}
1990^ ^1 8^} *> • 9} ^
(coprocessing)
n|1991^
7)
91
91 id
- 77 -

KAERI/RR-1999/99
DUPIC
7]
DUPIC
, O.B]JL DUPIC
DUPIC ^ ^ 5
} i a]a.
DUPIC
DUPIC ^<£^ 4i^Sofl c||t> OT^ ^ 7 f e DUPIC
1.3.3
7}
nl DUPIC
SEU
^ ZL
- 78 -

KAERI/RR-1999/99
n.
- 79 -

KAERI/RR-1999/99
1.4 4 l } ^ j £ ^ ^
1.4.1
1.4.1.1 ^Tfl/SJH 2 H
POWDERPUFS-Vofl ZL
^ SHETAN) ^
^ ^ S j 5 i c > . ZLB|T4 SEU iJ
n ^ ^ ^ ^ ^ . *H<>1| ^f§-5l^I ^ f e WIMS
AECL<H!
1.4.1.2
^r CANDU 6
. AECL^j
1.4.1.3
DUPIC J n ^ ^ ^ ^ j g 7 ^ <*m6\]x\ ^*$51 aj- ^u]-. ZL^X} AECL^
SEU
MOX ^ ^ 5 . 5 ] - f ^ S ^ " ^ B>^Jg 04^-i- 4 ^ * 1 - H 5 , DUPIC

KAERI/RR-1999/99
1.4.1.4 # ^ ^ }
43.3. ^ ^ < > 1 ^^5|<H 51^ . DUPIC
1.4.1.5
7 l ^ & o)n)
. ZLB]V|- DUPIC « | 1 ^ | ^ V 4 ^ ^ ^
O.T4 DUPIC «)<&^ 4 l ^ # 3.6^% ttfl
1.4.1.6
It:}
1.4.2
1.4.2.1
o
Q1 _

KAERI/RR-1999/99
. DUPIC ^ ^
MCNP#
1.4.2.2
DUPIC
AECLO]
DUPIC
1.4.2.3
DUPIC
|, DUPIC
4 T^^ofl cfl*H
1.4.2.4
DUPIC AECLo]
- 82 -

1.4.2.5
1.4.2.6
KAERI/RR-1999/99
DUPIC AECLo] $1
DUPIC
- 83 -

KAERI/RR-1999/99
1.5 ^ J L ^ r ^ i
1. P.S.W. CHAN and A.R. DASTUR, "Fuelling Schemes for the Conversion of Existing
CANDU's from Natural to Enriched Fuel Cycles", Proc. Topical Meeting on Advances in
Fuel Management, Pinehurst, USA, 1986.
2. P.G. BOCZAR, H.G. BLUNDELL and MT. VAN DYK, "Fuel Management Simulations
for a Part-Core Loading of Slightly Enriched Uranium in a CANDU-600", AECL-9530, Atomic
Energy of Canada Limited, 1987.
3. M.H. YOUNIS and P.G. BOCZAR, "Equilibrium Fuel-Management Simulations for 1.2%
SEU in a CANDU 6", AECL-9986, Atomic Energy of Canada Limited, 1989.
4. M.H. YOUNIS and P.G. BOCZAR, "Axial Shuffling Fuel-Management Schemes for 1.2%
SEU in CANDU", AECL-10055, Atomic Energy of Canada Limited, 1989.
5. P.G. BOCZAR, IJ. HASTINGS and A. CELLI, "Recycling in CANDU of Uranium and/or
Plutonium from Spent LWR Fuel", AECL-10018, Atomic Energy of Canada Limited, 1989.
6. R.E. GREEN, P.G. BOCZAR and I.J. HASTINGS, "Advanced Fuel Cycles for CANDU
Reactors", AECL-9755, Atomic Energy of Canada Limited, 1988.
7. S.N. JAHSHAN and T.J. MCGEEHAN, "An Evaluation of the Deployment of AIROX-
Recycled Fuel in Pressurized Water Reactors", Nucl. Tech. Vol.106, 1994.
8. H. FEINROTH, "An Overview of the AIROX Process and Its Potential for Nuclear Fuel
Cycle", Proc. Int. Conf. and Tech. Exhibition on Future Nuclear System: Emerging Fuel Cycles
and Waste Disposal Options, GLOBAL'93, Seattle, USA, 1993.
9. L.L. PEREZ TUMINI et al., "Study of a Tandem Fuel Cycle Between a Brazilian PWR
(ANGRA-I) and an Argentinean CANDU (EMBALSE)", Annals of Nuclear Energy Vol.22,
pp. 1-10, 1995.
- 84 -

KAERI/RR-1999/99
10. D.F. TORGERSON, P.G. BOCZAR and A.R. DASTUR, "CANDU Fuel Cycle Flexibility",
9th Pacific Basin Nuclear Conference, Sydney, May 1994.
11. G. HORHOIANU, D.R. MOSCALU, G. OLTEANU and D.V. IONESCU, "Development
of SEU-43 Fuel Bundle for CANDU Type Reactors", Annals of Nuclear Energy, Vol.25,
pp.1363-1372, 1998.
12. I. PATRULESCU, M. CONSTANTIN, E. RADES and V. BALACEANU, "Development
of CANDU Reactor Physics Calculation System Based on WIMS Code", Annals of Nuclear
Energy, Vol.24, pp.1105-1125, 1997.
13. J.B. SLATERr and C.S. RIM, "AECL-KAERI Joint Research Program TANDEM Fuel Cycles
Phase I Program - 1983", CRNL-2772, Atomic Energy of Canada Limited, 1984.
14. ^ ^ 4,
, KAERI/RR-1123/92, June 1992.
15. H.B. CHOI, B.W. RHEE and H.S. PARK, "Physics Study on Direct Use of Spent Pressurized
Water Reactor Fuel in CANDU (DUPIC)", Nucl. Sci. Eng: 126, pp.80-93, 1997.
16. a l % ^ }, % ^
, KAERI/RR-1696/96, July 1997.
17. H.B. CHOI, J.W. CHOI and M.S. YANG, "Composition Adjustment on Direct Use of Spent
Pressurized Water Reactor Fuel in CANDU", Nucl. Sci. Eng: 131, pp.62-77, 1999.
18. C.J. JEONG and H.B. CHOI, "Compatibility Analysis on Existing Reactivity Devices in
CANDU 6 Reactors for DUPIC Fuel Cycle", Nucl. Sci. Eng: 134, pp.1-16, 2000.
- 85 -

KAERI/RR-1999/99
K DUPIC
- 87 -

KAERI/RR-1999/99
2. DUPIC
DUPIC
DUPIC
CANDU
. DUPIC
1.45 wt%# 7)
DUPIC
POWDERPUFS-V (PPV) [Ref. 4], MULTICELL [Ref. 5],
H-i- Af§-$Vfe ^>^^1, DUPIC ^ ^ 5 . *H^^fe ^
[Ref. 7], 3 ^ } ^ ^ - ^ a . S ^ l SHETAN [Ref. 8], ~Le]Jl
RFSP [Ref. 6] 3.
.JE. WIMS-AECL
3.^*1 RFSP#
^ CANDU
[Ref.
DUPIC
CANDU
DUPIC
DUPIC
DUPIC
MCNP a n
WIMS 3 .
JE. 1 MCNP
, SHETAN,
RFSP
MCNP
WIMS/RFSP
PPV/MULTICELL/RFSP
DUPIC ^<&£.
^ DUPIC
CANDU
g: WIMS/SHETAN/
- 89 -

KAERI/RR-1999/99
2.1 CANDU
CANDU
CANDU
2.1.1
CANDU
2.1.1.1
.1-2fe CANDU-6 DUPIC
DUPIC WIMS-AECL#
2.1.1.2
CANDU
|fe <&&%. RFSP
He)jl 71B}
- 90 -

KAERI/RR-1999/99
SHETAN
2.1.1.3
'gsj ^S^^af ^ 3 . % ^ 4-]^Bo> ^ °-^)^2ZL1-,
^ ^ 1 # ^ ^ ^ ^ 5Uf- DUPIC
.fe RFSP7}
2.1.1.4
CERBERUS [Ref. 11]
2.1.1.5
h§^fe 3-^-& RFSPSORGHUM [Ref. 12]3f CHEBEXEMAX [Ref. 13]7>
- 91 -

KAERI/RR-1999/99
2.1.1.6
RFSP 3.B.7}
, 4
2.1.2
3J& 2.1-3
4 4 X 2.1-1, 2.1-2 ZL
^ 4 4 ^^f^ ^3>^s]o} 3.7]
H ^ 2.1-56j|
2.1.3
CANDU
2.1.3.1
DUPIC ^
91 WIMS-AECLo] Aj-g-s^u]-. o)
WIMS-AECL 3.
WIMS
- 92 -

KAERI/RR-1999/99
4
£: SHETAN fl}
.el^l ^^^B <8<3£| ^ r ^ ^ r * WIMS-AECL
$ # } SHETAN
SHETAN S ^ f e fl^ £
1/8 ^<$.S. t\*£ SMio] ^^g-g-^) tflsfl n^J 2.1-6^1
2.1.3.2
2ZL1- ^ > 3 H t i RFSP
. RFSP S ^ #
1 r"2
= -f- J Ha)dm (2.1-1)
- 93 -

KAERI/RR-1999/99
L, Aa> = 0)2
. A 0)1= 4
(2.1-2)
ZL 0)2 7} ^ ^ 1
_1 —
coo
(2-1-4)
- 94 -

KAERI/RR-1999/99
5}
Silt:}.
RFSP
f(i,i)*(o>2(k) - (2.1-5)
±3. RFSP S ^
- 95 -

Table 2.1-1
Design Data of Nominal Core
KAERI/RR-1999/99
Number of fuel channels
Lattice pitch
Inner radius of main calandria
Inner radius of subcalandria
Length of calandria notch
Length of fuel channel (12 fuel bundles)
Extrapolated* length of fuel channel
Extrapolated reactor radius
Reactor core radius+
Reflector thickness
380
28.575 cm (square)
379.7 cm
337.8 cm
96.52 cm
594.4 cm
606.0 cm
384.7 cm
314.3 cm
65.6 cm
Moderator/reflector volumetric average temperature
Moderator/reflector D2O purity
69 °C"
99.85 wt%+
Number of adjusters
Number of light water zone control units
Number of mechanical control absorbers (cadmium)
Number of shutoff rods (cadmium)
Number of liquid poison injection nozzles
Number of vertical flux detector assemblies
Number of horizontal flux detector assemblies
21
6
4
28
6
26
7
Total fission power
Total reactor power
Total electrical power
2158.5 MW
2061.4 MW(th)
713 MW(e)"'
**
***
Extrapolated boundaries are used for the purpose of core diffusion calculations.
This is given by K X (core radius)2 = 380 x (pitch)2
Temperature at the moderator outlet.
Nominal design value, operating purity might be higher to improve fuel burnup.
Gross nominal
- 96 -

KAERI/RR-1999/99
Table 2.1-2
Design Data of Fuel Channel
Number of fuel channels 380
Length of fuel channel (12 bundles) 594.4 cm
Pressure tube (Zr-2.5% Nb) inside diameter 10.3378 cm
Average pressure tube wall thickness 0.4343 cm
Calandria tube (Zr-2) inside diameter 12.8956 cm
Average calandria tube wall thickness 0.1397 cm
Coolant temperature averaged over channel 288 °C+
Coolant D2O Purity 99.10 wt%+
Average-to-maximum channel power in core (Radial form factor) 0.821*
Average-to-maximum bundle power in core (Overall form factor) 0.559*
Average-to-maximum bundle power in a channel,
averaged for all channels (Axial form factor) 0.672*
* Assuming bi-directional eight-bundle shift fueling
+ Nominal design value
- 97 -

KAERI/RR-1999/99
Table 2.1-3
Design Data of Fuel
Bundle design
Element (sheath) outside diameter
Average sheath wall thickness
Pellet outside diameter
Stack length
43-element cluster
1.350 cm (large), 1.150 cm (small)
0.039 cm (large), 0.036 cm (small)
1.2665 cm (large), 1.0725 cm (small)
48.2 cm
Fuel material
Pellet density23SU content239Pu content
Fissile content
Dysprosium in center rod
(U-Pu-X)O2, spent PWR fuel
10.4 g/cm3
1.0 wt%
0.45 wt%
1.488 wt%
4.64 wt%
Weight per bundle (kg)
Uranium
Plutonium
Actinides
(U-Pu-X)
(U-Pu-X)O2
17.686
0.131
17.844
18.372
20.837
- 98 -

KAERI/RR-1999/99
Table 2.1-4
Description of Computer Codes used in CANDU Core Physics Analysis
Type Name Description
Lattice codes POWDERPUFS-V Basically a one-group (Westcott) treatment; uses
(one-dimensional) semi-empirical expressions derived from experiment
data
WIMS-AECL Multi-group transport code used to provide lattice cell
data benchmark purposes
Supercell codes MULTICELL
SHETAN
3-D two-group diffusion calculation using the
supercell approach
3-D multi-group transport code
Core design code RFSP Flux calculation module based on CHEBY; calculates
time-average and instantaneous fluxes, power and
burnup distributions, simulates different kinds of
reactor operation (in particular, refueling under
various rules) by taking time steps based on
previously calculated fluxes.
Kinetic code CERBERUS 3-D two group kinetics code based on the Improved
Quasi-static Method
Also exists as module CERBERUS in RFSP
Spatial control RFSP Diffusion calculation based on CHEBY; calculates
xenon transients and spatial control; automatically
searches the time when the change in xenon balances
a defined reactivity insertion.
- 99 -
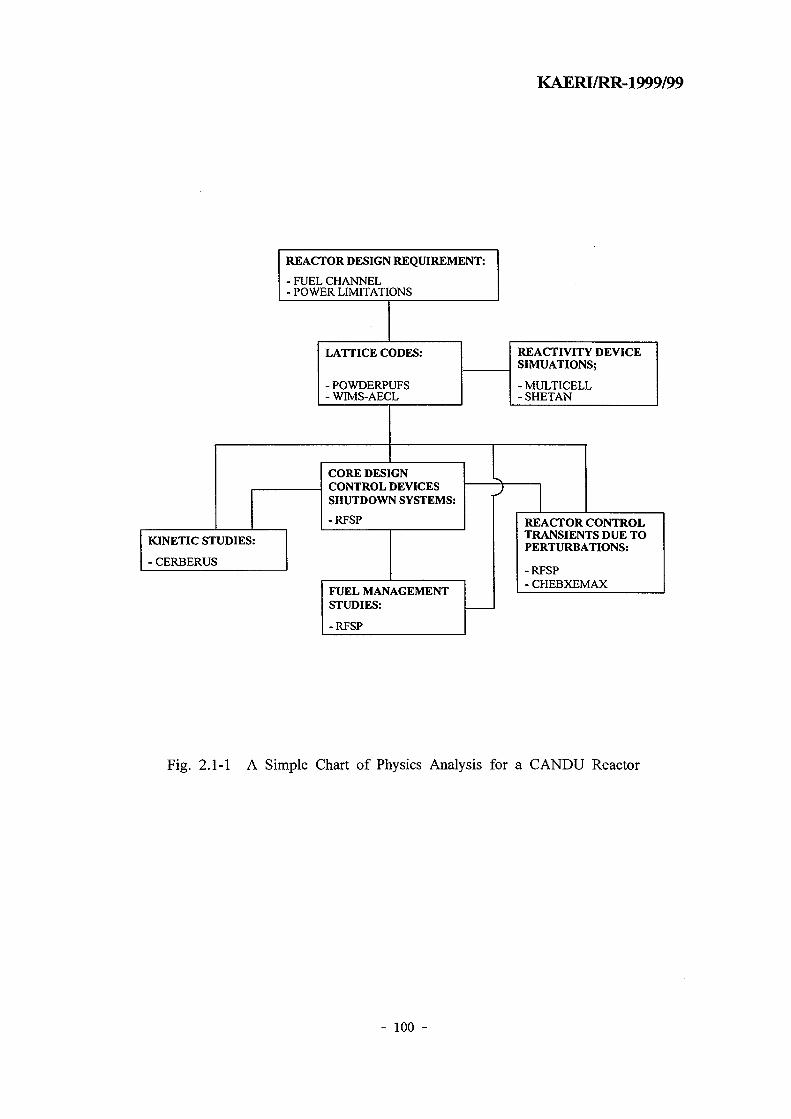
KAERI/RR-1999/99
REACTOR DESIGN REQUIREMENT:
-FUELCHANNEL- POWER LIMITATIONS
KINETIC STUDIES:
- CERBERUS
LATTICE CODES:
- POWDERPUFS- WIMS-AECL
CORE DESIGNCONTROL DEVICESSHUTDOWN SYSTEMS:
-RFSP
FUEL MANAGEMENTSTUDIES:
-RFSP
1I]
REACTIVITY DEVICESIMUATIONS;
- MULTICELL-SHETAN
^ ,J
REACTOR CONTROLTRANSIENPERTURBS
-RFSP- CHEBXEIV
TS DUE TOLTIONS:
1AX
Fig. 2.1-1 A Simple Chart of Physics Analysis for a CANDU Reactor
- 100 -

KAERI/RR-1999/99
Fuel Elements
D2O Primary Coolan
Pressure Tube
Gas Annulus
Calandria Tube
Moderator
Fig. 2.1-2 Configuration of a DUPIC Fuel Lattice
- 101 -

KAERI/RR-1999/99
CHANNEL COLUMNDESIGNATIONS
CHANNEL ROWDESIGNATIONS
20 21
uV
w
\ \\
22
337.8cm
379.7cm
Fig. 2.1-3 Face View of Reactor Showing Fuel Channels and Calandria Shell
- 102 -
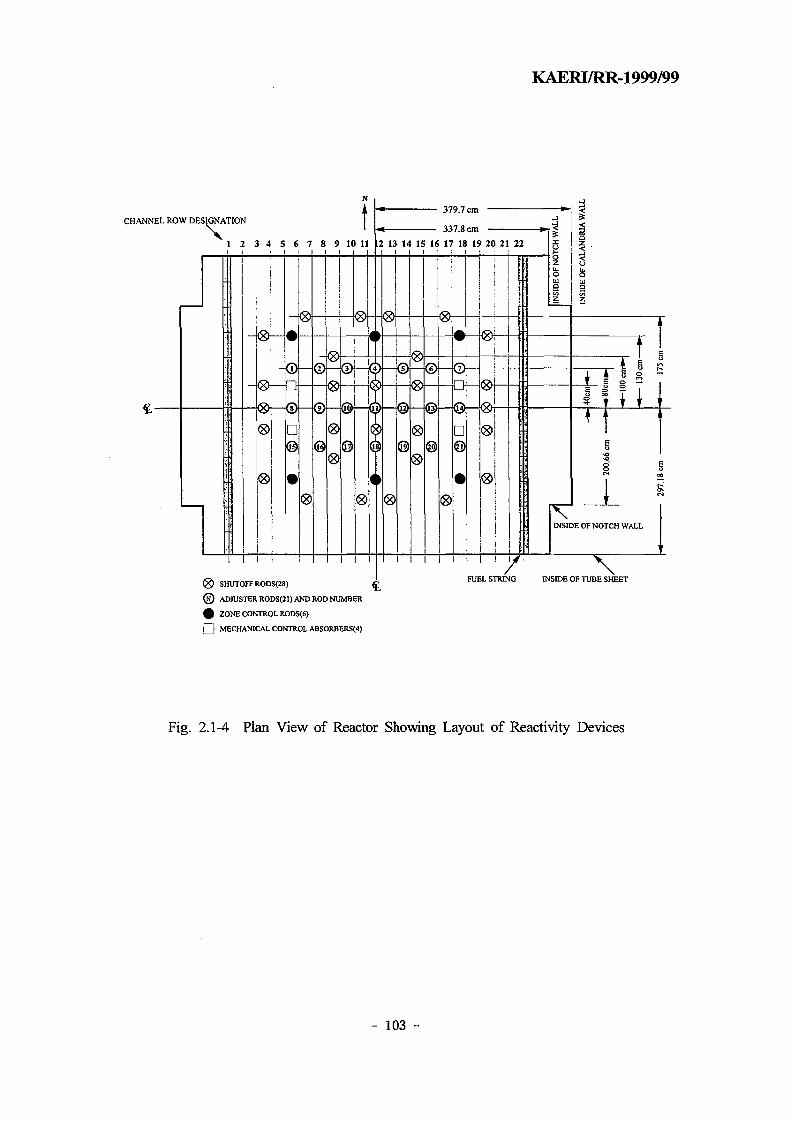
KAERI/RR-1999/99
N
CHANNEL ROW DESIGNATION T
1 2 3 4 5 6 7 8 9 10 11
SIGNA'379.7 cm
337.8 cm
2 13 14 15 16 17 18 19 20 21 22i i i i
FUEL STRING INSIDE OF TUBE SHEET\
© ADJUSTER RODS(21) AND ROD NUMBER
0 ZONE CONTROL RODS(6)
l2 MECHANICAL CONTROL ABSORBERSC-t)
Fig. 2.1-4 Plan View of Reactor Showing Layout of Reactivity Devices
- 103 -

KAERI/RR-1999/99
LIQUID ZONECONTROLLERS
GRADED ADJUSTERS
L.P.=LATTICE PITCH
Fig. 2.1-5 Face View of Reactor Showing Zone Controllers and Adjusters
- 104 -

KAERI/RR-1999/99
\
x Stainless SteelTube-and-RodAdjuster
\Fuel Channel
Fig. 2.1-6 SHETAN Model of a Lattice Cell
- 105 -

KAERI/RR-1999/99
POSITION 1 2 3 4 5 6 7 8 9 10 II 12
FLUX (J) • 0. ^) ^J, ^ ) , i$ . 0- 0K 0 ^ i n ^ ^
t = 0
t = T
1 = 0
O>,=
0
C02 =
0
0 ) , =
0
C04=
0
" 5 =
0
" 6 =
0
0 ) , =
0 0
0 ) 9 =
q>,T cp,T
C012 =
<P4T
c o , = 0) , -'2
(D,T <t>+T
0 ) 7 =
<t>7T
£0, &),„= w,,=
0), CO2 =
o" 6 co ,=
CP2T
co 1 2 =
AVERAGE DISCHARGE =1/8 ( O 5
IRRADIIAT1ONT/8 { ( D , + 0 2 +
Fig. 2.1-7 Time-Average 8-Bundle Shift in a 12-Bvindle Channel
- 106 -

KAERI/RR-1999/99
2.2
WIMS-AECL
[15-19H . DUPIC
Mosteller^ 20
MCNPt-
CANDU
. WIMS-AECL S H f e
DUPIC
J£#5|(doppler)
MCNP
*H ENDF/B-VI release
}B.e |B |^ TRX-1, 2, BAPL-1, 2,
i f BAPL
# Wfe 2 STD(Standard Deviations)
KENO
ENDF60-2J- ENDF50 Bl-o]a.
KENO
}-. TRX
MCNP «>-§-
MCNP BW^-eMfe
2.2.1
CANDU
-t>#>JL MCNP 7i
VI e fo l^^Bl^ - Afg-*H
4 1362} 7 S
>. MCNP 7)1 A
^- WIMS-AECL^
WIMS-AECL 2{x} ENDF/B-Vi]-
0.5
- 107 -
te «J4(specular reflection)
40007fl£| ^
KAERI/RR-1999/99
. JE.^- MCNP
1000 % ^
2.2.2
CANDU
71S
o, 3980, 7228
2.2.2.1
>. ENDF/B-V
r MCNP#
^ o | WIMS-AECL
WIMS-AECL
0.42% dk
o]t\. ZLS]v} ENDF/B-VI B>oia.
2.2.2.2
7]5. ^^rfe
. WIMS-AECL#
3. 0.0001
MCNP 7Jl^>^- 0.807859^ 0.0001
CANDU
0.807859, 0.7, 0.5, 0.3, 0.1
7}*]
- 108 -

KAERI/RR-1999/99
(0.807859 g/c
av («*)== 1000 xf-r-1
L "nominominal "perturb
ZL^J 2.2-2, 2.2-3, ZLZ]3L 2.2-4<Hl £^|*fSdt^-^, S 2.2-2
0.0001 g/cm3AM l ^Sf^ ^ 4 4 71S ^^M- 4 <
WIMS-AECLofl
MCNPif H]3.*||# icfl 5%
2.2.23
CANDU
7]
(2-2"2)
A,21- A2fe 4 4
960.16°K
MCNPif
- 109 -

KAERI/RR-1999/99
WIMS-AECL (ENDF/B-V) Tfl-tftteJ ^tfl M _£*fe 0.68 X 1O*JA/K°|;2, ^tfl
^ ~77%o]t:}. ENDF/B-VI
WIMS-AECL-^
1.51*10*
MCNPSJ
2STD l ) R > |
293.16, 473.16, 673.16, 873.16, 960.16, 1073.16, 1273.16 H.?]3. 1473.16°K«H]
T x 1 (2.2-3)"960.16 A ( A J
ZL^ 2.2-5O1H 2.2-7^
1 / f e 1STD ^ 68%^ ^1S]S.# ^ ^ c } . ENDF/B-V
WIMS-AECL^ «>-§-£ A ^ MCNPl- o|-g-«> ^ ^ 3 f «]3 .*H # 4 2STD
(95.5%^ - i l^£)5] ^ ^ o f l ^ <y*l*M, ENDF/B-VI
oflA-] 1STD ^^1
WIMS-AECL
(2.2-4)
- 110 -

/ =
5L7\
2.2.2.4
cell
KAERI/RR-1999/99
(2.2-6)
(2.2-7)
(2.2-8)
o)t:f. 2.2-6^ 4
o]
4- CZP
PHTS
56O.16°K<H1
1 96O.16°K<>11
2.2-8^)
7il<i
- Ill -

KAERI/RR-1999/99
3.71
ENDF/B-V e M - * M s l # °]-8"t> WIMS-AECL^ PHTS
MCNP TllAVl^if H]J2.*J; ttfl 1STD3} ^ $ J
2STDJit:l- QQ 3.7\] ^cfl ^ 7 } % T : > . ENDF/B-VI B M ^ -
WIMS-AECL^} PHTS «>-§-,£ 7 } ] ^ ^ 3:7) ^EUoJ-Hfe- I S T D L H H z±
2STD o]* fa 2f^ 3§ 7>^r:f. O]BJ^> ^ ^ - ^ ZL^| 2.2-6<Hl
fl ENDF/B-VI-1- 4-§-*ffe WIMS-AECL
2.2.2.5
(2-2-9)
z i
2.2-7^1
K ENDF/B-VSf -VI
-g-MCNP
ENDF/B-V
Milgramol26
WIMS-AECLS
2.0%
# 4 , ENDF/B-VI
WIMS-AECL T
I CANDU
2.2.2.6
h§-
- 112 -

KAERI7RR-1999/99
, a28, P2 8 , c* )#
£ a|j3L*H a 2.2-8&J1
WIMS-AECL «>-§--§•
. ENDF/B-VI B H J ^ -
ENDF/B-V B H -
2.2.3 DUPIC
CANDU
DUPIC
DUPIC
CANDU
. H5lu> DUPIC
0, 7419 ^ 14825
2.2.3.1
DUPIC
MCNP
fi= MCNP
] WIMS-AECL^
ENDF/B-Vif ENDF/B-VI
*Hfe 4 4 0.73 0.05%
WIMS-AECL
i|ofl ^ i r} . MCNP
ENDF/B-V e}o)a.
ENDF/B-VI e W
o ] # S 2.2-9^1
WIMS-AECL^
2.2.3.2
2.2-10
0.0001
- 113 -

KAERI/RR-1999/99
g/cm3*}*!
^ MCNP
H ] 3 . ^ ttfl WIMS-AECL
2STD
> WIMS-AECL 7
. 7 1 5
2.2-
MCNP
ENDF/B-Vi} -VI a H ^ -
4 4 3.4
DUPIC
2.2.3.3
DUPIC ^
$- <&£[ rfe MCNP
WIMS-AECL ^l^^l - MCNP
fe fi 2.2-1- ENDF/B-V e}ol«.
1STD
]. ENDF/B-VI
(50%)o]t;>. DUPIC ^ ^ S - S WIMS-AECL5.
^ ^ i S . ۥ A*>7} sac>. nelvl- MCNP ^]
ufl, WIMS-AECLol ofl^.*}^ ^ - s . ^ ] ^ ^ MCNP
, 239Pu ^
DUPIC
, DUPIC
DUPIC
MCNP
fe MCNP
MCNP
^ 2STD
WIMS-AECL
WIMS-AECLS.
. ZL ^2}fe ^ ^ 2.2-13 J j ^ 2.2-15^1
1STD (68% ^.S\S.
ENDF-V s>o| H.
; ENDF/B-VI 3 H
- 114 -

KAERI/RR-1999/99
2.2.3.4 £} £ | | K
PHTS^ «hg-S.^3H- ZL J 2.2-16«^
H«R ^ * 3ter ^ - f 5 f e (transuranic)
H f * h } ) ^ > o|-j | .s, DUPIC ^ ^ ^ . ^ PHTS
}. ENDF/B-v eH-^-
PHTS «>-§-£ 7ll>iKgr MCNP
A-] ^ *i*l*}fe a J ^ ENDF/B-VI e}oia . s le ]^ . o|-g-«> WIMS-
AECL3| PHTS «}-§-£ Til^^r ZL^ 2.2-8^
2.2.3.5
fffl # 3. -S-M DUPIC2.2-12ofl
oB ^ ^ 5 - ^- # ^ ^ ^^H *Hfe ENDF/B-v f -vi tiHH.2.6 91
2.2.3.6
DUPIC ^ ^ ^ ^ « K g ^ i - WIMS-AECL5.
2.2-13oH A^*>5ic.>. WIMS-AECL2]- MCNP Afo]^
2.2.4
LH*1 WIMS-AECL-i-
^ H ^ ^ ^ S . ^ - ^^ [ -T-5 | -H- ^ DUPIC
7 ] ^ & ^ ^ 1 ^ : MCNPl- A]-g-*|-^[i:l-. ^<?l-?-e}^ ^<aS.^l tW<*l, WIMS-
- 115 -

KAERI/RR-1999/99
AECL
fe ENDF/B-V
3.$^ DUPIC
MCNP
ENDF/B-VI
CANDU
MCNPAj-
WIMS-AECL 7
DUPIC ^^S<HI
WIMS-AECL611
5% <>
MCNP 0.73%8k
f. ZL5^u>, WIMS-AECL#
WIMS-AECL BMH.
DUPIC
- 116 -

KAERI/RR-1999/99
Comparison ofTable 2.2-1for Natural Uranium Fuel Lattice
Bumup
(MWd/T)
0
3980
7228
khot
1.11776±0.00047a
1.11678 (-0.00098)
1.11870 (0.00094)
1.04389 ±0.00043
1.04803 (0.00414)
1.04559 (0.00170)
0.98907 ±0.00037
0.99331 (0.00424)
0.99015 (0.00108)
Kvoid
1.13846 ±0.00047
1.13820 (-0.00026)
1.13978 (0.00132)
1.06025 ±0.00042
1.06382 (0.00357)
1.06116 (0.00091)
1.00285 ±0.00039
1.00744 (0.00459)
1.00410 (0.00125)
kcold
1.12869±0.00046
1.12990 (0.00121)
1.13057 (0.00188)
1.04744 ±0.00042
1.05146 (0.00402)
1.04776 (0.00032)
0.98979 ±0.00038
0.99318 (0.00339)
0.98886( -0.00093)
Code
MCNP
WIMS(V)
WIMS(VI)
MCNP
WIMS(V)
WIMS(VI)
MCNP
WIMS(V)
WIMS(VI)aone standard deviation
( ) difference from MCNP
WIMS(V): WIMS-AECL calculation with ENDF/B-V library
WIMS(VI): WIMS-AECL calculation with ENDF/B-VI library
- 117 -

KAERI/RR-1999/99
Table 2.2-2
Comparison of Void Reactivity8 for Natural Uranium Fuel
Burnup
(MWd/T)
0
3980
7228
MCNP
16.267 ±0.587"
14.782 ±0.573
13.893±0.538
WIMS-AECL
ENDF/B-V
16.851 (0.584)
14.163 (-0.619)
14.120 (0.227)
WIMS-AECL
ENDF/B-VI
16.532 (0.266)
14.033 (-0.749)
14.031 (0.139)
Computed as (.i/kM-i/kv<M)^im , (mk)
computed as V oL* (1000//&,,)2 + aL,* (1000/*L
( ) difference from MCNP
- 118 -

KAERI/RR-1999/99
Table 2.2-3Comparison of Fuel Temperature Coefficient*1 for Natural Uranium Fuel
Burnup
(MWd/T)
0
3980
7228
MCNP
-11.345 ±0.934"
2.261 ±0.868
4.659 ±0.802
WIMS-AECL
ENDF/B-V
-13.665 (-2.320)
0.507 (-1.754)
4.815 (0.156)
WIMS-AECL
ENDF/B-VI
-12.164 (-0.819)
2.027 (-0.234)
6.238 (1.579)
"computed as (*n73.I6-*96(>.16)/(1473.16 K-960.16K)xl06 ,
bcomputed as VUO6/(1473.16 K-960. i6K)} 2 x(4 n i 6 + (&,.„.)
( ) difference from MCNP
- 119 -

KAERI/RR-1999/99
Table 2.2-4
Relative Changes in Four Factors for Natural Uranium Fuel at Fresh State
FuelTemp.(K)
4°r
Aal<e>
API<P>
4f/<f>
293.16
10.397
3.314
-0.636
7.601
1.393
473.16
7.095
2.309
-0.415
5.117
0.936
673.16
3.594
1.220
-0.203
2.484
0.511
873.16
1.041
0.366
-0.055
0.705
0.149
960.16
0.000
0.000
0.000
0.000
0.000
1073.16
-1.325
-0.496
0.074
-0.873
-0.192
1273.16
-3.542
-1.352
0.240
-2.311
-0.532
1473.16
-5.656
-2.177
0.378
-3.642
-0.862
< > denotes average value of reference (960.16 K) and selected temperature
* ApT is slightly different from the sum of four factor changes. This is due to a slightly
different meaning of the milli-k (mk) used in ApT and four-factor changes.
- 120 -

KAERI/ER-1999/99
Table 2.2-5
Relative Changes in Four Factors for Natural Uranium Fuel at Equilibrium State
FuelTemp.(K)
ApT
Aq/<v>
Aef<e>
Apf<p>
Afl<f>
293.16
3.113
-3.869
0.138
8.371
-1.371
473.16
1.554
-2.991
0.157
5.661
-1.201
673.16
0.319
-1.819
0.129
2.798
-0.782
873.16
0.064
-0.528
0.037
0.776
-0.227
960.16
0.000
0.000
0.000
0.000
0.000
1073.16
-0.046
0.663
-0.046
-0.971
0.283
1273.16
0.018
1.868
-0.120
-2.551
0.815
1473.16
0.237
3.117
-0.212
-4.036
1.358
< > denotes average value of reference (960.16 K) and selected temperature
* ApT is slightly different from the sum of four factor changes. This is due to a slightly
different meaning of the milli-k (mk) used in ApT and four-factor changes.
- 121 -

KAERI/RR-1999/99
Table 2.2-6
Relative Changes in Four Factors for Natural Uranium Fuel at Discharge State
FuelTemp.(K)
ApT
As/<s>
Ap/<p>
4fKf>
293.16
-0.132
-6.808
0.404
8.634
-2.373
473.16
-0.842
-5.117
0.358
5.853
-1.935
673.16
-1.075
-3.023
0.239
2.907
-1.209
873.16
-0.345
-0.880
0.064
0.819
-0.357
960.16
0.000
0.000
0.000
0.000
0.000
1073.16
0.446
1.096
-0.092
-1.016
0.437
1273.16
1.397
3.069
-0.239
-2.682
1.231
1473.16
2.497
5.060
-0.395
-4.241
2.046
< > denotes average value of reference (960.16 K) and selected temperature
* ApT is slightly different from the sum of four factor changes. This is due to a slightly
different meaning of the milli-k (mk) used in ApT and four-factor changes.
- 122 -

KAERI/RR-1999/99
Table 2.2-7Relative Pin Power for Natural Uranium Fuel
Burnup
(MWd/T)
0
3980
7228
Ring 1
0.2109
±0.175%
(1.336%)
(0.981%)0.2123
±0.194%
(1.764%)
(1.098%)0.2155
±0.191%
(1.921%)
(1.214%)
Ring 2
0.2218
±0.108%
(0.569%)
(0.339%)0.2228
±0.108%
(1.481%)
(0.489%)0.2254
±0.106%
(0.963%)
(0.480%)
Ring 3
0.2520
±0.081%
(0.005%)
(0.009%)0.2517
±0.081%
(-0.172%)
(-0.059%)0.2510
±0.096%
(-0.042%)
(-0.026%)
Ring 4
0.3153
±0.072%
(-1.297%)
(-0.902%)0.3132
±0.072%
(-2.110%)
(-1.044%)0.3081
±0.078%
(-2.014%)
(-1.179%)
Code
MCNP
WIMS(V)
WIMS(VI)MCNP
WIMS(V)
WIMS(VI)MCNP
WIMS(V)
WIMS(VI)
WIMS(V): WIMS-AECL calculation with
WIMS(VI): WIMS-AECL calculation with
ENDF/B-V library.
ENDF/B-VI library.
- 123 -

KAERI/RR-1999/99
Table 2.2-8Reaction Rate Ratio for Natural Uranium Fuel
289
Sr
*286r
C
Ring 1
0.4664±0.629%(-1.200%)(-3.359%)
0.0354±0.432%(-0.483%)(-0.722%)
0.0712±0.338%(-2.924%)(-3.153%)
0.9826±0.298%(-0.228%)(-0.997%)
Ring 2
0.4453±0.288%(-0.606%)(-2.878%)
0.0337±0.237%
(0.151%)(-0.120%)
0.0667±0.172%(-0.135%)(-0.348%)
0.9681±0.149%(-0.075%)(-0.841%)
Ring 3
0.4057±0.206%(-2.259%)(-4.716%)
0.0299±0.237%
(0.508%)(-0.001%)
0.0556±0.142%
(0.205%)(-0.215%)
0.9401±0.122%(-0.588%)(-1.332%)
Ring 4
0.3831±0.171%(-1.774%)(-4.686%)
0.0245±0.135%
(2.040%)(0.930%)0.0385
±0.099%(0.805%)(0.049%)0.9216
±0.085%(-0.527%)(-1.302%)
Average
0.4028±0.118%(-1.705%)(-4.330%)
0.0280±0.111%
(1.055%)(0.346%)0.0495
±0.075%(0.236%)
(-0.258%)0.9368
±0.063%(-0.463%)(-1.226%)
Code
MCNP
WIMS(V)WIMS(VI)MCNP
WIMS(V)WIMS(VI)MCNP
WIMS(V)WIMS(VI)MCNP
WIMS(V)WIMS(VI)
WIMS(V): WIMS-AECL calculation with ENDF/B-V library.
WIMS(VI): WIMS-AECL calculation with ENDF/B-VI library.
- 124 -

KAERI/RR-1999/99
Table 2.2-9Comparison of k^ for DUPIC Fuel Lattice
Burnup
(MWd/T)
0
7419
14825
khot
1.15099 ±0.00047a
1.15222 (0.00123)
1.15049 (-0.00050)
1.03880 ±0.00041
1.04397 (0.00517)
1.03879 (-0.00001)
0.91889 ±0.00033
0.92617 (0.00728)
0.91802 (-0.00010)
1.16371 ±0.00048
1.16505 (0.00134)
1.16330 (-0.00041)
1.05243 ±0.00041
1.05727 (0.00484)
1.05213 (-0.00030)
0.93097 ±0.00035
0.93832 (0.00735)
0.93103 (0.00006)
kcold
1.15865±0.00046
1.15972 (0.00107)
1.15622 (-0.00243)
1.04296 ±0.00040
1.04779 (0.00483)
1.04173 (-0.00123)
0.91980 ±0.00033
0.92564 (0.00584)
0.91761 (-0.00219)
Code
MCNP
WIMS(V)
WIMS(VI)
MCNP
WIMS(V)
WIMS(VI)
MCNP
WIMS(V)
WIMS(VI)aone standard deviation
( ) difference from MCNP
WIMS(V): WIMS-AECL calculation with ENDF/B-V library
WIMS(VI): WIMS-AECL calculation with ENDF/B-VI library
- 125 -

KAER17RR-1999/99
Table 2.2-10
Comparison of Void Reactivity11 for DUPIC Fuel
Burnup
(MWd/T)
0
7419
14825
MCNP
9.497±0.580b
12.467 ±0.552
14.121 ±0.523
WIMS-AECL
ENDF/B-V
9.558 (0.061)
12.050 (-0.418)
13.981 (-0.140)
WIMS-AECL
ENDF/B-VI
9.571 (0.075)
12.206 (-0.262)
14.309 (0.188)
"computed as
Computed as
, (mk)
L x (iooo/*L)2 + o
( ) difference from MCNP
- 126 -

KAERI/RR-1999/99
Table 2.2-11Comparison of Fuel Temperature Coefficient8 for DUPIC Fuel
Burnup
(MWd/T)
0
7419
14825
MCNP
-5.497 ±1.219°
-1.891 ±1.096
4.522 ±0.997
WIMS-AECL
ENDF/B-V
-5.517 (-0.019)
-1.715 (0.175)
3.840 (-0.682)
WIMS-AECL
ENDF/B-VI
-4.581 (-0.916)
-0.936 (0.955)
4.425 (-0.097)
"computed as (*I4J3.,6-*960.,6)/(i473.l6 K-960.i6K)xio6
Computed as ^{IO6/(1473.16 K-960.16 K)}2x (a{mM + <&,.„,)
( ) difference from MCNP
- 127 -

KAERI/RR-1999/99
Table 2.2-12Relative Pin Power for DUPIC Fuel
Burnup
(MWd/T)
0
7419
14825
Ring 1
0.1143
±0.263%
(2.101%)
(1.317%)0.1547
±0.243%
(1.717%)
(0.939%)0.1938
±0.194%
(1.451%)
(0.712%)
Ring 2
0.1998
±0.127%
(2.638%)
(2.008%)0.2226
±0.117%
(2.002%)
(1.456%)0.2338
±0.112%
(1.657%)
(1.180%)
Ring 3
0.2727
±0.089%
(0.874%)
(0.805%)0.2724
±0.090%
(0.412%)
(0.430%)0.2626
±0.093%
(0.098%)
(0.183%)
Ring 4
0.4132
±0.072%
(-2.434%)
(-1.867%)0.3503
±0.072%
(-2.351%)
(-1.674%)0.3099
±0.077%
(-2.240%)
(-1.491%)
Code
MCNP
WIMS(V)
WIMS(VI)MCNP
WIMS(V)
WIMS(VI)MCNP
WIMS(V)
WIMS(VI)
WIMS(V): WIMS-AECL calculation with ENDF/B-V library.
WIMS(VI): WIMS-AECL calculation with ENDF/B-VI library.
- 128 -

KAERI/RR-1999/99
Table 2.2-13Reaction Rate Ratio for DUPIC Fuel
P28
Ring 1
2.7260±0.698%(-6.427%)(-7.211%)
0.1737±0.526%(-3.131%)(-1.714%)
0.2413±0.410%
(0.068%)(0.703%)1.5367
±0.538%(-3.996%)(-5.005%)
Ring 2
1.5002±0.295%(-3.280%)(-4.619%)
0.0985±0.250%(-2.520%)(-1.455%)
0.1447±0.198%(-2.238%)(-1.845%)
1.0842±0.213%(-1.617%)(-2.668%)
Ring 3
1.1219±0.233%(-3.469%)(-5.443%)
0.0727±0.180%(-1.257%)(-0.757%)
0.1041±0.142%(-1.269%)(-1.302%)
0.9341±0.150%(-1.659%)(-2.839%)
Ring 4
0.8870±0.184%(-3.566%)(-6.077%)
0.0494±0.140%
(2.375%)(1.951%)0.0631
±0.100%(0.306%)
(-0.200%)0.8391
±0.108%(-1.745%)(-2.928%)
Average
1.1435±0.097%(-3.664%)(-5.566%)
0.0706±0.079%(-0.612%)(-0.172%)
0.0982±0.063%(-1.011%)(-1.000%)
0.9409±0.062%(-1.799%)(-2.940%)
Code
MCNP
WIMS(V)WIMS(VI)MCNP
WIMS(V)WIMS(VI)MCNP
WIMS(V)WIMS(VI)MCNP
WIMS(V)WIMS(VI)
WIMS(V): WIMS-AECL calculation with ENDF/B-V library.
WIMS(VI): WIMS-AECL calculation with ENDF/B-VI library.
- 129 -

KAERI/RR-1999/99
1.00-
0.98-
- - - - - WIMS(ENDF5)- ° - WIMS(ENDF6)—*— MCNP-4B
1000 2000 3000 4000 5000 6000 7000 8000
Bumup (MWD/T)
Fig. 2.2-1 Variation of k^ for Natural Uranium Fuel Lattice
- 130 -

KAERI/RR-1999/99
2 -
-• WIMS-AECLx—MCNP-4B
0.0 0.1 0.2 0.3 0.4 0.5 0.6
Coolant Density (g/cc)
0.8
Fig. 2.2-2 Void Reactivity Change for Natural Uranium Fuel at Fresh State
- 131 -

KAERI/RR-1999/99
16
14-J
£ 12-cCD
$
I
§O
10-
8-
6 -
4 -
2 -
•
I.
I.
I ,
^ \
• 1 • 1 • 1 • 1 • 1
• 1 • J 1
-----WIMS-AECL—*— MCNP-4B •
0.0 0.1 0.2 0.3 0.4 0.5 0.6 0.7 0.8Coolant Density (g/cc)
Fig. 2.2-3 Void Reactivity Change for Natural Uranium Fuel at Equilibrium State
- 132 -

KAERI/RR-1999/99
3?
14
12-
10-
f 8oroa>a:
IJ5ooO
6 -
•£ 4 -
2 -
-—- WIMS-AECL-*— MCNP-4B
0.0 0.1 0.2 0.3 0.4 0.5 0.6 0.7 0.8Coolant Density (g/cc)
Fig. 2.2-4 Void Reactivity Change for Natural Uranium Fuel at Discharge State
- 133

KAERI/RR-1999/99
1 0 -
— - WlMS(ENDF5)- - • - WIMS{ENDF6)— MCNP-4B
400 600 800 1000
Fuel Temperature (K)
1200 1400
Fig. 2.2-5 Temperature Reactivity Change for Natural Uranium Fuel at Fresh State
- 134 -

KAERI/RR-1999/99
encco
6I
3.0-
2.5-
1.5-
f 1.0-
0.0
WIMS(ENDF5)WIMS(ENDF6)MCNP-4B
-0.5-
-1.0400 600 800 1000
Fuel Temperature (K)
1200 1400
Fig. 2.2-6 Temperature Reactivity Change for Natural Uranium Fuel at Equilibrium State
- 135 -

KAERI/RR-1999/99
3.5-r-
3.0-
2.5-
2.0-
1.5-
1.0-
0.5-
0.0 - •
-0.5-
-1.0-
-1.5-
-2.0 - •
I1o
----- WIMS{ENDF5)--O- WIMS(ENDF6)- * — MCNP-4B
400 600 800 1000
Fuel Temperature (K)
1200 1400
Fig. 2.2-7 Temperature Reactivity Change for Natural Uranium Fuel at Discharge State
- 136 -

KAERI/RR-1999/99
CO
O>,
sa:
1 2 -
10-
8 -
6 -
4 -
2 -
0 -
- 2 -
-4 -
- 6 -
•
1
1 *
— " ^ - C l
*
•
^¥—
•
'
i *
• | i j i
X—
Fresh Stc
: _.
Equilibrii
•
- W!MS(ENDF5)- WIMS(ENDF6)- MCNP-4B
ate
m Fuel
.....
1
300 400 500 600 700
Temperature (K)
800 900 1000
Fig. 2.2-8 Reactivity Change versus System Temperature Following a Reactor Shutdown
- 137 -

KAERI/RR-1999/99
o•cCOu
oQ.
3
I
1.15-<
1.10-
1.05-
1.00-
0.95-
0.90- 1 • I • I . 1 . 1
1 ' 1
- - . -WIMS(ENDF5)- D - WIMS(ENDF6)
- x — MCNP-4B-
-
2000 4000 6000 8000 10000 12000 14000 16000
Bumup (MVMDAT)
Fig. 2.2-9 Variation of £M for DUPIC Fuel Lattice
- 138 -

KAERI/RR-1999/99
—- WIMS-AECL— MCNP-4B
0.1 0.2 0.3 0.4 0.5 0.6 0.7 0.8
Coolant Density (g/cc)
Fig. 2.2-10 Void Reactivity Change for DUPIC Fuel at Fresh State
- 139 -

KAERI7RR-1999/99
%Qi
C03szO
'>t5TO
a:•o'o>
ola
oo
1 3 -
12 -J
11 -
1 0 -
9 -
8 -
7 -
6 -
5 -
4 -
3 -
2 -
1 -
0 -
1 I ' ) ' 1
: ^
• I ' I ' 1
• 1 ' 1
• i • i
i • i • i
-
- • - -WIMS-AECL—«— MCNP-4B
_
•
_
--
•
-
•
-
-
• i * i • i
0.0 0.1 0.2 0.3 0.4 0.5 0.6
Coolant [Density (g/cc)
0.7 0.8
Fig. 2.2-11 Void Reactivity Change for DUPIC Fuel at Equilibrium State
- 140 -

KAERI/RR-1999/99
- - - W I M S - A E C L—*— MCNP-4B
0.3 0.4 0.5 0.6 0.7 0.8
Coolant Density (g/cc)
Fig. 2.2-12 Void Reactivity Change for DUPIC Fuel at Discharge State
- 141 -

KAERI/RR-1999/99
—• - WIMS(ENDF5)- ° - WIMS(ENDF6)-*— MCNP-4B
400 600 800 1000
Fuel Temperature (K)
1200 1400
Fig. 2.2-13 Temperature Reactivity Change for DUPIC Fuel at Fresh State
- 142 -

KAERI/RR-1999/99
-—WIMS(ENDF5)-°-WMS(ENDF6)—*— MCNP-4B
-1 -
400 600 800 1000
Fuel Temperature (K)
1200 1400
Fig. 2.2-14 Temperature Reactivity Change for DUPIC Fuel at Equilibrium State
- 143 -

KAERI/RR-1999/99
3.5
3.0-
2.5--
? 0 -
- . -WIMS(ENDF5)- ° - VUMS(ENDF6)—*— MCNP-4B
-1.0-
-1.5-
-2.0
*•—
400 600 800 1000
Fuel Temperature (K)
1200 1400
Fig. 2.2-15 Temperature Reactivity Change for DUPIC Fuel at Discharge State
- 144 -

KAERI/RR-1999/99
3 -
2 -
t I"cCO
6>
0 -
-1 -
- 2 -
- 3 -
- 4 -
WIMS(ENDF5)WIMS(ENDF6)
— MCNP-4B
300 400 500 600 700
Temperature (K)
800 900 1000
Fig. 2.2-16 Reactivity Change versus System Temperature Following a Reactor Shutdown
- 145 -
KAERI/RR-1999/99
2.3
CANDU RFSP 3-S. RFSP 1 H
RFSP
SHETAN
MCNP S ^
MULTICELL# ^*fl ^flg^^x;}.. DUPIC ^ ^
^\^^S\ ^§-^r^^$] ^ A > ^ - 4 4 WIMS-AECLi)-
. WIMS-AECL ^ SHETAN2J- #&Q RFSP 3 £ * | Bj-
Phase-B i i # 5 l >y^ ^5f
87}# fl«H WIMS-AECL4
RFSP s s s
i DUPIC
CANDU
2.3.1
RFSP S E
2.3.1.1
CANDU-6
4 308.12, 308.12, 308.12 ^ 302.16°K.
4 960.16, 561.16, 561.16 ^ 342.16°K.
^-Tilfe 19.1 kg.
| ^ 48.2 cm.
49.53 cm tfofl
4
4
- 146 -

KAERI/RR-1999/99
89 ofiM*! -L## ol-g-^uK ^ # 7 1 1 ^ #n Benoist
"Bl W # ^f§-^K ^^x£ 1 5 . ^^>^l 3*M<H^=r WIMCORE [Ref. 33]
2.3.1.2
CANDU £U)-5.oM ^-%-S. *\}o]%x\ (ADJ, ZCU, MCA, HB}3. SOR)ij-
(guide tube, liquid poison injection tube, tension spring, locator, 7]Bf)i) ^
7}.
2.3-1 g 2.3-2AJ-
WIMS-AECL# *]-§-«]
>. SHETAN
. SHETAN
i, ^ ^ 8 } ^ # > f e ? ^ # ^ ^ ] ^ ^ - ^ SS304 (p =
7.9 g/cm3)^. -7-^Sj<H SI^-^ ^ 1 ^ ^ : 3.81 cm<>lt:}.
- 147 -

KAERI/RR-1999/99
71
Zircaloy-2 ( p = 6.55 g/cm3)S-
r 4.579/4.572 cmo]^ , <
4 4 6.38/6.53 ^ 0.939/1.042
^ Zircaloy-2S. ^>#«^5l-*.^ v f l i l ^ ^ ^ . 4 4 2.54 cm ^ 2.79 cm<>lt;K
7fl 1-<H ^o.v> H 3.7]7}
7? ttfl^-ofl SHETAN S^^lA-Jfe t f l l ^ A S ^ ^ # 2.79 c m £
^ ^ ^ ^ ^ S ^ 6.5232
^- 4 4 5.715/5.842 cm©]*}.
CANDU
WIMS-AECL#
- 148 -

KAERI/RR-1999/99
Inconel 0=f l* l iS^) , Zircaloy
SHETANofl
3-2]
r WIMS-AECL
SHETAN^r ^ ] ^ 3 ^ 1 ^ 7 # WIMS-AECL^]^
Inconel
SHETAN
cfl*>
fe 6.26
0.9525 g| 1.5621
4 4 1.5875 gj 1.56845
2.4, 2.4 ZLH]3. 2.6
SHETAN
-^: Zircaloy
. o]
itfl,
- 149 -

KAERI/RR-1999/99
71
^ \A 108.111224.195 cm3ol^ %• eo>^ 2.6 kgolcK
3.7}
7} 3.3. -^07> «^^cf. 4=-i-;g ^«y^- ^1^1 >*1 a l ^ ^ - ^ l ^ J ^ 13.97x18.7325x
12.7 cm ° H ^-^fe 1-27 cmo]!} 7lE} ^l^l^S] ^l-^^: 9.525x16.8295x12.7 cm
1^ 0.9525 cm
SHETAN#
0.635 cmoln^ ^ . 3§2>A] -O1^ ^ > ^ ^ - 7.62
2730.06 cm3
M 1^ Phase-B
2.3-3011
2.3-4^1
- 150 -

KAERI/RR-1999/99
2.3.1.3
RFSP 2 H
fe 4 4 XY 1LP
CANDU
°l n l 44x36x225.
"L^ 2.3-4 g 2.3-5<Hl
. X
. Y-
2.3-46)1
X-Y-Z
(1-7), (8-14), 1151:2. (15-21)5. /fl 7f£|
. 4
- 151 -

KAERI/RR-1999/99
2.3.2
W1MS-AECL 91 SHETAN4 g j ^ RFSP 3 E S ] ^ ^ . o . ^*H, Phase-B
}. Phase-Bfe ^
2.3.2.1
WIMS/RFSP f
^ . ^ , Phase-B
16.94%©lt:l-.
1)if ?J4f45l £J£fe 4 4 99.63 ^ 99.84 wt%o)t:f.
4 ^ - 4 ^ ^S.fe 4 4 308.12 9J 302.16°Ko|cl-.
55% ^<a^t:>.
9.0 ±0.5
l 3 rak ^ u f 0.997ol^JL,
^ ^ l f %51 -^^}# 4 ^ 8.5
if ^
2.3.2.2
7}.
RFSP 3.B.-
. ZCU£) #-§v£7fe
-£-3. RFSP SH<>1|
152 -

KAERI/RR-1999/99
7.7495 mk°lt:)-.
0, 10, 20, 40, 55, 60, 80, ZLB]JL 100%<H ufl ZCU
^ *HH>M SM-S.7H z%*Y PPV/RFSP^ ^
2.3-64 i-tB}i|5it|-. PPV^l^^ 71^-^S. WIMS-AECLJf V]^ 4
^ ^ 0.058 ppmoH, o | ^ -0.45
= Az3 + £22 + Cz+ D (2.3-1)
^ 2.3-6^1
0.01 K ]$^^\\ §
3.0%
RFSP
^-§-£7} i ^ f e 20% o|*fo]t^, RMS (Root Mean Square)
9.2%o]n]-. S ^ ^ - ^ - ^ 7^1^^4fe S 2.3-104 ^ M ^ l ^ K WIMS/RFSP
PPV/RFSP
14%
2.3-124
2.3-134
- 153 -

KAERI/RR-1999/99
RMS J2.*fe 4 4 11.16.8% RMS J2.*fe 4 4
25.54} 12.
WIMS/RFSP
7}
2.3.2.3
^ 8.5
ppmojt:]-. 35dfl^
fe 99.64
2.3-14 *£ ZL^ 2.3-
fe 8.5 69-f-B] 35°C7W
-c- 99.84
2.3-155} a^J 2.3-8*11
WIMS/RFSP# fe WIMS/RFSP
2.3.2.4
Phase-B
154 -

KAERI/RR-1999/99
Case 1:
Case 2: ^r 50% ^ ^ S ] a , JS
Case 3: JS.^
Case 4:
Case 5:
1, 2, 3, H <>]
8.5
91
6.6%o]t:f.
fe 34.469%^.
^ RFSP SS .u |{^ INTREP
VFD #19i} HFD #1
2.3-9^ 2.3-10
RMS ^^fe 4
2.3.3
RFSP
CANDU
RFSP#
2.3.3.1
PPV/RFSP1-
- 155 -

KAERI/RR-1999/99
50%o] u>.
7}. ti^H i
PPV/RFSP , WIMS/RFSP
WIMS/RFSP
}. ofs}# ^cfl
RMS
0.5%
4 4 4.95} 1.
^Ai 3711 l-fB
. WIMS/RFSP
. S 2.3-16^
WIMS/RFSP
WIMS/RFSP ^ 1 ^ ^
. WIMS/RFSPA]- PPV/RFSP
RMS Hfe 4 4
PPV/RFSP
0.03%
2.5%o]%3L,
2.3-17ofl
WIMS/RFSP
PPV/RFSPi}
2.3-18, 2.3-19, 2.3-20 D.
- 156 -

KAERI/RR-1999/99
2.3-2lofl
5% o]i4|S UB»gtc>. n}BM WIMS/RFSP
. 71^- PPV/RFSP SJEJ>]
4 4 4% 51 6
2.3.3.2
, 600-FPD >. DUPIC
IFPD #q±
(CPPF) - CPPF^ ROPT
•Elimination -
•Ordering -
• Selection - -f «h§-S.
- 157 -

KAERI/RR-1999/99
PPV £ fl e ^ } 4 M H r# 3 3 ^ ^ # 45- ^ ^ ^ 1 S 2.3-22<Hl AW&uf. 600-
FPD ^*> *§^ i ajcfl af l^t-s^ PPV £ WIMS 7]& >H*HH AA 6849 ^6853 kWojcf. ^-^ -f-<Hl cJ|*H *J4 ^>#1-^^: 4 4 855 «J 852
0.01 o j^oju} . ©]if ^ - ^ ^ 2 f ^ WIMS/RFSP
^ 1)71171- 2\o]5L $.<&^Z}^ n<&3.o)) t%*± CANDU
2.3.3.3
WIMS/RFSP
, WIMS/RFSP S . ^ 7 l ^ ^ CANDU
2.3.4 DUPIC
lfe. PPVAf- RFSP
^-SlM- DUPIC
f MCNP
2.3.4.1 DUPIC
DUPIC Jn'gS] ^H-fe ^ I ^ S ^ -f-W-oIcf. nfBfA] DUPIC «|
-. DUPIC
- 158 -

KAERI/RR-1999/99
RFSP 2 H S 4h&*}&t:]-. 4
CANDU
>. ZLB|x+ MCNP a.Ho
, RFSP
1/4 ^ i i f g ]7964 ^J 7206 MWd/T
4 3 7 ^
LAT» ^V§-*>Saa, 7]& ^^H-3,7} ^«> JjLg-i- <g^*}7l 41
*H U(Universe)l- A]^-tr}^o.^, 7 ] ^ 4 4 ^ S » ^fl# - f"^# <&7]*}7] 41*11
FILL ^ ^ > # AVg-*>Sit:f. <>]e|*i
2.3.4.2
t-gr DUPIC «J«1S in^J^ ^ti||7Jl^^- # ^ ^ - S # ^7] 41 *H
K MCNP Tj]^:^ i^7]# 100,000 <y^Aj- ^ 120^711-
t l ^ I # ^•«ll>II41fe 1.03825±0.00024
4 -S^fe ^cN 0.12%5koli:}. ZLe]i+
ZL^ 2.3-13OH £ A ] ^ ^ ^ ) ^ 3}tj) A^f7} 7.2%S>|
^ f ^ # ^ ^ r RFSP 3 = .
- 159 -

KAERI/RR-1999/99
MCNP
A12 ^ L22
^ RFSP MCNP
3%!-
o|
- 160 -

KAERI/RR-1999/99
Table 2.3-1
Lattice Parameters for Natural Uranium Initial Core
Natural
Uranium
Depleted
Uranium
Reflector
-£trl
2.4711E-01
2.4712E-01
2.5686E-01
-£ti2
3.7684E-01
3.7662E-01
4.0369E-01
1.6590E-03
1.6224E-03
Za2
4.0828E-03
3.7528E-03
3.8712E-04
v In
5.1039E-03
4.0697E-03
8.9448E-03
8.9660E-03
9.9859E-03
H
0.27282
0.21732
- 161 -

KAERI/RR-1999/99
Table 2.3-2
Lattice Parameters for Irradiated Natural Uranium Fuel
Burnup
(MWd/T).0
3.2
157.0
791.1
1582.4
2372.5
3161.8
3950.4
4738.8
5526.9
6314.8
7102.7
7890.5
8678.3
9466.3
10254.2
11042.3
11830.4
12618.7
13407.0
14195.5
14984.0
15772.5
16561.2
17349.9
18138.6
18927.4
19716.3
20505.1
21294.1
22083.0
22871.9
23660.9
24449.8
-£trl
2.3905E-01
2.3905E-01
2.3904E-01
2.3905E-01
2.3907E-01
2.3908E-01
2.3910E-01
2.3911E-01
2.3912E-01
2.3913E-01
2.3914E-01
2.3915E-01
2.3915E-01
2.3916E-01
2.3916E-01
2.3917E-01
2.3917E-01
2.3918E-01
2.3918E-01
2.3918Er01
2.3919E-01
2.3919E-01
2.3919E-01
2.3919E-01
2.3919E-01
2.3920E-01
2.3920E-01
2.3920E-01
2.3919E-01
2.3920E-01
2.3920E-01
2.3921E-01
2.3919E-01
2.3919E-01
Eta
3.6147E-01
3.6151E-01
3.6165E-01
3.6192E-01
3.6217E-01
3.6233E-01
3.6244E-01
3.6252E-01
3.6259E-01
3.6263E-01
3.6267E-01
3.6270E-01
3.6271E-01
3.6274E-01
3.6274E-01
3.6277E-01
3.6277E-01
3.6278E-01
3.6280E-01
3.6280E-01
3.6283E-01
3.6284E-01
3.6284E-01
3.6285E-01
3.6287E-01
3.6288E-01
3.6289E-01
3.6290E-01
3.6290E-01
3.6291E-01
3.6293E-01
3.6294E-01
3.6295E-01
3.6295E-01
1.6506E-03
1.6506E-03
1.6504E-03
1.6639E-03
1.6932E-03
1.7230E-03
1.7496E-03
1.7725E-03
1.7925E-03
1.8103E-03
1.8263E-03
1.8410E-03
1.8546E-03
1.8674E-03
1.8795E-03
1.8910E-03
1.9019E-03
1.9124E-03
1.9225E-03
1.9323E-03
1.9417E-03
1.9508E-03
1.9597E-03
1.9682E-03
1.9765E-03
1.9845E-03
1.9923E-03
1.9997E-03
2.0070E-03
2.0142E-03
2.0211E-03
2.0277E-03
2.0342E-03
2.0405E-03
3.5245E-03
3.5359E-03
3.6015E-03
3.7130E-03
3.8057E-03
3.8653E-03
3.9058E-03
3.9341E-03
3.9543E-03
3.9689E-03
3.9798E-03
3.9883E-03
3.9954E-03
4.0014E-03
4.0068E-03
4.0120E-03
4.0172E-03
4.0224E-03
4.0279E-03
4.0337E-03
4.0398E-03
4.0461 E-03
4.0527E-03
4.0594E-03
4.0662E-03
4.0731 E-03
4.0800E-03
4.0868E-03
4.0936E-03
4.1003E-03
4.1069E-03
4.1133E-03
4.1196E-03
4.1257E-03
v Ea
4.6937E-03
4.6811E-03
4.6105E-03
4.7831 E-03
4.9171E-03
4.9782E-03
4.9970E-03
4.9889E-03
4.9639E-03
4.9279E-03
4.8854E-03
4.8396E-03
4.7933E-03
4.7469E-03
4.7019E-03
4.6591E-03
4.6192E-03
4.5823E-03
4.5487E-03
4.5185E-03
4.4915E-03
4.4676E-03
4.4464E-03
4.4277E-03
4.4114E-03
4.3971 E-03
4.3845E-03
4.3734E-03
4.3637E-03
4.3551E-03
4.3474E-03
4.3405E-03
4.3343E-03
4.3286E-03
ER
8.6383E-03
8.6383E-03
8.6381E-03
8.6270E-03
8.6023E-03
8.5771E-03
8.5546E-03
8.5352E-03
8.5184E-03
8.5035E-03
8.4902E-03
8.4780E-03
8.4668E-03
8.4565E-03
8.4467E-03
8.4375E-03
8.4289E-03
8.4206E-03
8.4127E-03
8.4052E-03
8.3980E-03
8.391 OE-03
8.3843E-03
8.3779E-03
8.3717E-03
8.3657E-03
8.3598E-03
8.3543E-03
8.3489E-03
8.3437E-03
8.3386E-03
8.3337E-03
8.3289E-03
8.3243E-03
H
.25094
.25025
.24582
.25086
.25401
.25427
.25290
.25056
.24766
.24443
.24107
.23771
.23445
.23130
.22833
.22556
.22302
.22069
.21858
.21670
.21503
.21355
.21225
.21110
.21010
.20921
.20844
.20777
.20717
.20665
.20618
.20577
.20540
.20506
- 162 -

KAERI/RR-1999/99
Table 23-3
Incremental Cross-sections for Initial Core
D-TYPEC-OUTERC-INNERB-TYPE
A-OUTERA-INNER
ADJGT
SORGT
VFDGT
LPIGN
SOR/MCA
ZCRTS
ADJTS
SORTS
MODIN
ZCRBL
ADJBL
MCABL
VFDBL
ADJSB
ADJSC
ZCRNUT
ADJNUT
SORNUT
ZCAIR1
ZCAIR2
ZCAIR3
ZCH2O1
ZCH2O2
ZCH2O3
ZCRD2O
8.3098E-047.7719E-042.0964E-032.1142E-031.0179E-031.1413E-03
-4.9889E-05
-1.1012E-04
-5.4896E-05
-7.9364E-05
1.6947E-03
-1.5860E-03
-8.2475E-03
-1.3340E-03
2.4255E-02
-1.6699E-03
-3.1814E-03
-3.2742E-03
-5.8271E-03
-2.8551E-05
7.1436E-05
1.6506E-02
-4.4693E-03
2.1655E-02
-1.3629E-02
-1.7417E-02
-1.0267E-02
2.2657E-02
2.6746E-02
1.8978E-02
-9.3430E-05
1.6139E-031.4923E-033.4226E-033.4752E-03
1.9013E-032.1312E-03
-2.4244E-04
-9.7927E-04
-1.1796E-04
-6.7058E-04
8.3499E-03
-3.1247E-03
-3.7007E-03
-9.4947E-04
2.4659E-02
1.8206E-03
1.7908E-03
1.6076E-03
2.0840E-03
-1.2376E-03
5.7876E-05
4.1125E-03
-1.5992E-03
9.5742E-03
-1.9477E-02
-3.0468E-02
-8.2894E-03
1.6531E-01
1.8309E-01
1.4718E-01
-7.4697E-04
1.8248E-051.7026E-054.4053E-054.4412E-052.2182E-052.4940E-05
3.4485E-06
8.5162E-06
2.1302E-06
7.0960E-06
2.0496E-04
4.6328E-04
9.3310E-05
5.0620E-04
7.5433E-04
5.0613E-05
3.2130E-06
8.1900E-06
-7.4404E-05
1.3742E-05
5.0345E-06
6.1480E-04
7.3030E-06
7.1071E-04
-2.3138E-05
-5.6720E-05
6.4995E-06
1.8565E-04
2.2126E-04
1.5393E-04
7.0564E-06
4.7338E-044.3746E-04
9.8971E-041.0061E-035.5575E-046.2287E-04
8.4201E-06
3.7670E-05
4.9602E-06
2.4120E-05
5.8185E-03
8.4548E-04
-2.0700E-05
1.5804E-03
7.8126E-03
7.5609E-04
7.1506E-04
7.1558E-04
7.6774E-04
2.8540E-05
5.1210E-05
2.1703E-03
1.4874E-04
3.3836E-03
1.3014E-04
4.7100E-05
2.1748E-04
1.2491E-03
1.3785E-03
L1145E-03
2.7270E-05
1.2843E-041.1906E-042.7026E-042.7399E-04
1.5150E-041.6915E-04
4.6394E-06
1.8703E-05
4.1504E-06
1.1315E-05
1.5334E-03
0.0000E+00
0.0000E+00
0.0000E+O0
0.0000E+00
O.OOOOE+00
O.OOOOE+00
O.0000E+00
O.OOOOE+00
1.0059E-05
1.4384E-05
O.OOOOE+00
O.OOOOE+00
O.OOOOE+00
5.9792E-05
5.9323E-05
6.4975E-05
1.9735E-04
2.0770E-04
1.8215E-04
1.3063E-05
-4.6426E-06-1.1363E-05-8.0904E-05-8.1714E-05-1.3826E-05-1.0418E-05
-1.2143E-05
-3.4526E-05
-3.3304E-06
-2.0867E-05
-1.9035E-04
2.4219E-02
2.4284E-02
2.4016E-02
5.0044E-03
2.4860E-02
1.6329E-02
2.5370E-02
1.0074E-02
-1.0242E-05
5.9344E-06
2.4161E-02
2.0741E-02
2.4532E-02
-4.1472E-04
-6.9732E-04
-1.7105E-04
1.4150E-03
1.7131E-03
1.1541E-03
-2.5337E-05
6.4811E-036.0086E-031.3639E-021.3827E-02
7.6456E-038.5363E-03
2.3413E-04
9.4390E-04
2.0942E-04
5.7101E-04
7.7386E-02
O.OOOOE+00
O.OOOOE+00
O.OOOOE+00
O.OOOOE+00
O.OOOOE+00
O.OOOOE+00
O.OOOOE+00
O.OOOOE+00
5.0762E-04
7.2590E-04
O.OOOOE+00
O.OOOOE+00
O.OOOOE+00
3.0175E-03
2.9938E-03
3.2790E-03
9.9597E-03
1.0482E-02
9.1926E-03
6.5923E-04
- 163 -

KAERI/RR-1999/99
Table 2.3-4
Incremental Cross-sections for Equilibrium Core
A-INNERA-OUTERB-TYPE
C-IINNERC-OUTERD-TYPE
ZCH201ZCAIR1ZCH202ZCAIR2ZCH203ZCAIR3
SOR/MCA
ADJGTSORGTVFDGTLPIGN
ZCRD20ADJSBADJSC
ADJTSZCRTSSORTS
ADJUNTZCRNUTSORNUT
ADJBLZCRBLMCABLVFDBLMODIN
1.0814E-031.7147E-031.8710E-031.5957E-038.8084E-041.6676E-03
1.8277E-02-1.2996E-022.1351E-02
-1.5813E-021.5446E-02
-0.0431E-02
1.4875E-03
-9.8050E-062.3484E-051.5706E-05
-3.4273E-061.3411E-058.4937E-05
-1.2577E-06
1.0652E-021.6708E-021.7026E-02
1.5238E-025.498E-024.0863E-02
1.6947E-021.8005E-021.6409E-021.4348E-024.5594E-02
7.3037E-046.8393E-041.0200E-039.5502E-044.6411E-046.6051E-04
1.6592E-01-1.9172E-02
1.8334E-01-1.9347E-02
1.4819E-01-8.7079E-03
2.7164E-02
-5.7408E-04-9.7942E-04-3.9753E-04-7.4506E-04-7.2628E-04-8.6811E-04
1.6630E-05
3.3O39E-O34.0286E-036.2321E-03
5.5299E-031.1604E-021.7194E-02
8.8995E-038.9312E-038.7059E-039.1403E-033.2451E-02
AS*
2.2379E-058.1587E-054.2268E-053.5353E-054.0298E-058.0176E-05
1.1068E-03-2.6164E-042.2993E-03
-1.6589E-051.0773E-039.4225E-04
3.5110E-04
6.2969E-069.8608E-063.8903E-067.7015E-067.5123E-061.0151E-052.9779E-07
5.9065E-049.8182E-041.0313E-03
4.8169E-041.0883E-031.1910E-03
4.8672E-045.2269E-044.7931E-044.0750E-041.2949E-03
5.8670E-045.2827E-048.9088E-047.9733E-043.5166E-045.0680E-04
1.1822E-031.4154E-041.3042E-036.6180E-051.1568E-032.2022E-04
5.5623E-03
1.8510E-053.6580E-051.1391E-052.2940E-052.4111E-052.8850E-051.2100E-05
1.9332E-032.7858E-033.4687E-03
2.0989E-034.0915E-035.2820E-03
2.6380E-032.6347E-032.6724E-032.6724E-039.4873E-03
AvEn
1.1846E-041.1354E-041.8061E-041.6081E-047.4229E-051.0914E-04
7.8823E-055.3540E-057.9021E-055.9665E-057.5835E-055.0427E-05
1.0705E-03
7.3439E-061.8118E-054.4042E-067.7914E-069.1461E-061.1058E-054.6296E-06
0000E+00OOOOE+000000E+00
0000E+000000E+000000E+00
0000E+000000E+000000E+000000E+000000E+00
-7.5577E-058.9456E-04
-6.1804E-05-6.6685E-05
3.5375E-048.9811E-04
1.4371E-03-3.3652E-04
1.7317E-03-6.0985E-041.1635E-03-8.6142E-05
8.5676E-04
-1.5253E-05-2.2230E-05
1.0040E-05-1.2175E-05-1.2172E-05-1.3395E-05
2.3925E-05
-1.4028E-03-1.6888E-03-1.8813E-03
-3.7996E-03-1.6955E-03-1.3851E-03
-7.1686E-03-9.6484E-04-6.1141E-04-1.2776E-02-2.0651E-02
AH
5.9784E-035.7301E-039.1144E-038.1152E-033.7460E-035.5080E-03
3.9778E-032.7019E-033.9878E-033.0110E-033.8271E-032.5448E-03
5.4022E-02
3.7259E-049.1434E-042.2227E-043.9318E-044.6158E-045.5805E-042.3365E-04
0000E+000000E+00OOOOE+00
0000E+00OOOOE+000000E+00
0000E+000000E+000000E+00OOOOE+000000E+00
- 164 -

KAERI/RR-1999/99
Table 2.3-5
Reactivity Change with Boron Concentration in Moderator
Boron Concentration (ppm)
6
7
8
9
10
Average
Excessive Reactivity (mk)
19.432
11.635
3.869
-3.867
-11.566
Boron Coefficient (mk/ppm)
7.797
7.766
7.736
7.699
7.750*
* 8.310 by PPV/RFSP
- 165 -

KAERI/RR-1999/99
Table 2.3-6
Comparison of ZCU Reactivity Worth
Average Zone Level
(%)
0
10
20
40
55
60
80
100
Reactivity Worth (mk)
PPV/RFSP
0
0.733
1.475
2.962
4.029
4.359
5.524
6.405
RFSP/RFSP
0.784
1.566
3.119
4.229
4.561
5.742
6.608
Difference (%)
-
6.96
6.17
5.30
4.96
4.63
3.95
3.17
- 166 -

KAERI/RR-1999/99
Table 2.3-7
Calibration of Zone Controller
Batch
1
2
3
4
5
6
7
8
9
10
11
Total
Boron
(ppm)
0.058
0.057
0.058
0.058
0.058
0.058
0.058
0.058
0.058
0.058
0.057
0.635
Reactivity
(ink)
0.449
0.442
0.451
0.449
0.449
0.445
0.447
0.449
0.453
0.445
0.444
4.924
Measured
ZCU Level
Change(%)
10.1
8.59
7.18
6.54
6.64
6.15
6.14
5.98
5.96
6.37
6.12
77.87
WIMS/RFSP
ZCU Level
Change(%)
9.560
8.090
7.430
6.980
6.450
6.050
5.900
5.860
6.000
6.000
5.630
73.950
ZCU Worth
(mk/%AVZL)
0.0470
0.0547
0.0607
0.0644
0.0697
0.0736
0.0757
0.0767
0.0755
0.0742
0.0799
- 167 -

KAERI/RR-1999/99
Table 2.3-8
Comparison of Average Zone Level Worth
AVZL(%)
20 ~ 60
20 ~ 80
Measured
0.07166 mk/%AVZL
0.06769 mk/%AVZL
WIMS/RFSP
0.07368 mk/%AVZL
0.06938 mk/%AVZL
Difference(%)
2.818
2.496
- 168 -

KAERI/RR-1999/99
Table 2.3-9
Reactivity Worth of Individual Adjuster Rod
Adjuster
Withdrawn
1
2
3
4
5
6
7
8
9
10
11
12
13
14
15
16
17
18
19
20
21
Total
Measurement
0.215
0.551
0.696
0.381
0.703
0.553
0.215
0.247
0.674
0.904
0.518
0.911
0.723
0.284
0.216
0.520
0.700
0.370
0.709
0.572
0.219
10.881
WIMS/RFSP
0.199
0.519
0.642
0.353
0.644
0.513
0.189
0.229
0.660
0.850
0.490
0.847
0.657
0.225
0.194
0.514
0.644
0.350
0.644
0.510
0.187
10.06
Difference(%)
-7.41
-5.84
-7.79
-7.32
-8.45
-7.29
-12.06
-7.41
-2.07
-5.93
-5.35
-7.04
-9.07
-20.87
-10.19
-1.06
-7.93
-5.43
-9.19
-10.85
-14.57
-7.54
PPV/RFSP
0.232
0.584
0.726
0.374
0.727
0.577
0.235
0.265
0.726
0.94
0.501
0.943
0.717
0.267
0.232
0.577
0.731
0.374
0.727
0.577
0.232
11.264
Difference(%)
7.95
5.96
4.27
-1.81
3.35
4.28
9.34
7.15
7.73
4.03
-3.22
3.50
-0.76
-6.12
7.41
11.07
4.51
1.06
2.51
0.87
5.99
3.52
- 169 -

KAERI/RR-1999/99
Table 2.3-10
Reactivity Worth of Adjuster Bank
Adjuster Bank
Withdrawn
1
2
3
4
5
6
7
Total
No. rod
1,7,11,15,21
2,6,18
4,16,20
8,9,13,14
3,14
5,17
10,12
Measurement
1.36
1.53
1.51
2.33
1.77
1.79
3.37
13.66
WIMS/RFSP
1.236
1.399
1.387
2.021
1.500
1.524
2.703
11.77
Difference
(%)
-9.12
-8.56
-8.15
-13.26
-15.25
-14.86
-19.79
-13.84
PPV/RFSP
1.38
1.53
1.52
2.27
1.69
1.71
3.02
13.12
Difference
(%)
1.47
0.00
0.66
-2.58
-4.52
-4.47
-10.39
-3.95
- 170 -

KAERI/RR-1999/99
Table 2.3-11
Reactivity Worth of Individual Mechanical Control Absorber
MCA rod
Inserted
1
2
3
4
Total
Measurement
1.885
1.944
1.876
2.009
7.713
WIMS/RFSP
2.070
2.068
2.097
2.092
8.327
Difference(%)
9.84
6.38
11.80
4.12
7.96
PPV/RFSP
2.080
2.065
2.075
2.065
8.285
Difference(%)
10.37
6.22
10.63
2.78
7.41
- 171 -

KAERI/RR-1999/99
Table 2.3-12
Reactivity Worth of Mechanical Control Absorber Bank
MCA Bank
Inserted
1 (MCA#1, #4)
2 (MCA#2, #3)
Total
Measurement
4.85
4.73
9.58
WIMS/RFSP
5.60
5.60
11.20
Difference(%)
15.42
18.39
16.89
PPV/RFSP
5.437
5.436
10.873
Difference(%)
12.10
14.93
13.50
- 172 -

KAERI/RR-1999/99
Table 2.3-13
Reactivity Worth of Individual Shutoff Rod
SOR inserted
1
2
3
4
5
6
7
8
9
10
11
12
13
14
15
16
17
18
19
20
21
22
23
24
25
26
27
28
Total
Measurement
1.292
1.601
1.598
1.310
0.913
1.891
1.957
0.980
1.313
2.266
2.398
2.321
1.395
1.314
1.421
1.573
2.210
2.363
2.334
1.382
0.906
1.846
1.946
1.008
1.264
1.593
1.630
1.351
45.378
WIMS/RFSP
1.328
1.645
1.64
1.323
1.043
2.206
2.213
1.042
1.533
2.456
2.563
2.448
1.527
1.601
1.596
1.549
2.498
2.612
2.494
1.549
1.095
2.317
2.312
1.1
1.43
1.795
1.788
1.427
50.13
Difference(%)
2.75
2.78
2.60
0.96
14.24
16.63
13.10
6.41
16.76
8.39
6.88
5.46
9.43
21.81
12.29
-1.52
13.03
10.52
6.88
12.05
20.89
25.48
18.82
9.09
13.14
12.71
9.64
5.59
10.47
PPV/RPSP
1.288
1.635
1.634
1.284
0.964
2.173
2.157
0.954
1.495
2.497
2.567
2.483
1.479
1.476
1.463
1.497
2.493
2.567
2.484
1.481
0.957
2.161
2.161
0.952
1.29
1.635
1.632
1.283
48.142
Difference(%)
-0.34
2.15
2.23
-2.02
5.59
14.89
10.24
-2.57
13.87
10.20
7.05
6.97
5.99
12.30
2.94
-4.82
12.80
8.62
6.45
7.13
5.66
17.04
11.06
-5.59
2.06
2.66
0.074
-5.06
6.09
- 173 -

KAERI/RR-1999/99
Table 2.3-14
Reactivity Change due to Heat Transport System Temperature
Coolant Temperature
(°C)
35.25
50.06
64.87
79.92
96.85
110.84
125.53
140.82
155.26
174.14
187.21
199.78
215.04
230.07
245.09
259.84
Measured (mk)
-
-0.890
-0.738
-0.733
-0.738
-0.674
-0.725
-0.597
-0.537
-0.576
-0.487
-0.339
-0.408
-0.307
-0.254
-0.200
WIMS (mk)
0
-0.809
-0.761
-0.739
-0.818
-0.624
-0.627
-0.623
-0.537
-0.636
-0.448
-0.393
-0.433
-0.358
-0.289
-0.219
Difference (%)
-
-9.09
3.12
0.82
10.84
-7.41
-13.52
4.38
-0.02
10.42
-8.09
15.89
6.25
16.45
13.71
9.41
- 174 -

KAERI/RR-1999/99
Table 2.3-15
Reactivity Change due to Moderator Temperature
Moderator Temperature
CO)
69
65
60.06
54.45
50.25
45.52
40.42
34.99
Measured (mk)
-
-0.104
-0.172
-0.188
-0.158
-0.189
-0.225
-0.274
WIMS/RFSP (mk)
-
-0.057
-0.081
-0.097
-0.085
-0.105
-0.117
-0.146
Difference (%)
-
-45.02
-52.93
-48.38
-46.09
-44.55
-48.08
-46.64
- 175 -

KAERI/RR-1999/99
Table 2.3-16
Comparison of Critical Core Performance Parameters
keff
Maximum channel power (kW)
Maximum bundle power (kW)
Radial peaking factor
Discharge burnup (MWhr/Bundle)
Inner Core
Outer Core
Whole Core
Reference
(PPV/RFSP)
1.00000
6702
832
0.809
3623
3128
3301
WIMS/RFSP
1.00000
6734
827
0.806
3536
3189
3314
Difference(%)
0.0
0.5
-0.6
-0.4
-2.4
2.0
0.4
- 176 -

KAERI/RR-1999/99
Table 2.3-17
Comparison of Fixed Burnup Core Performance Parameters
keff
Maximum channel power (kW)
Maximum bundle power (kW)
Radial peaking factor
Discharge burnup (MWhr/bundle)
Inner core
Outer core
Whole core
Reference
(PPV/RFSP)
1.00000
6702
832
0.809
3623
3128
3301
WIMS/RFSP
0.99997
6747
830
0.804
3622
3129
3298
Difference(%)
-0.003
0.7
-0.2
-0.6
-
-
-
- 177 -
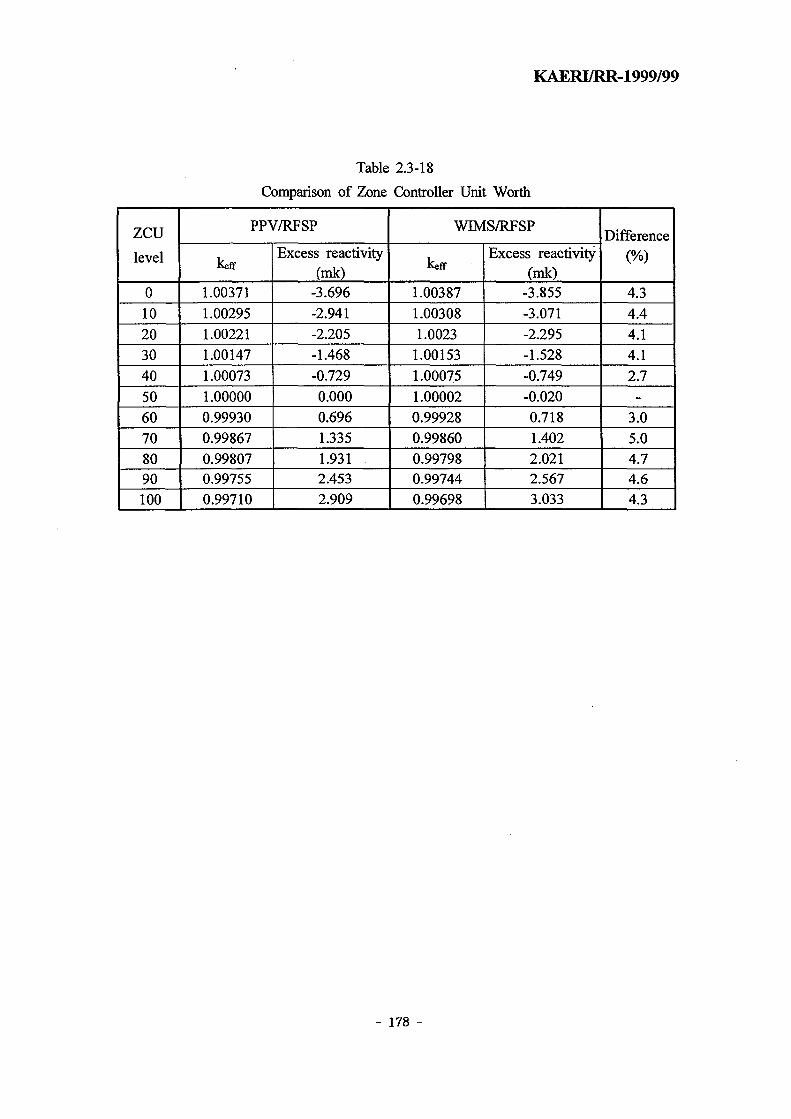
KAERI/RR-1999/99
Table 2.3-18
Comparison of Zone Controller Unit Worth
zculevel
0102030405060708090
100
PPV/RFSP
keff
1.00371
1.00295
1.00221
1.00147
1.00073
1.00000
0.99930
0.99867
0.998070.997550.99710
Excess reactivity(mk)
-3.696-2.941-2.205-1.468-0.7290.0000.6961.3351.9312.4532.909
WIMS/RFSP
keff
1.003871.003081.00231.001531.000751.000020.999280.998600.997980.997440.99698
Excess reactivity(mk)
-3.855-3.071-2.295-1.528-0.749-0.0200.7181.4022.0212.5673.033
Difference
(%)
4.34.44.14.12.7-
3.05.04.74.64.3
- 178 -

KAERI/RR-1999/99
Table 2.3-19
Comparison of Adjuster Rod Worth
123456789101112131415161718192021All
SUM
PPV/RFSP
keff
1.000241.000781.001091.000661.001081.000771.000241.000281.000861.001181.000741.001181.000861.000281.000241.000771.001081.000661.001071.000761.000241.01705
Rod worth(ink)0.2400.7791.0890.6601.0790.7690.2400.2800.8591.1790.7391.1790.8590.2800.2400.7691.0790.6601.0690.7590.24016.76415.047
WIMS/RFSP
keff
1.000211.000741.001081.00061.001071.000741.000211.000241.000831.001191.000691.001181.000811.000251.000211.000741.001081.000601.001091.000731.000211.01666
Rod worth(mk)0.2100.7391.0790.6001.0690.7390.2100.2400.8291.1890.6901.1790.8090.2500.2100.7391.0790.6001.0890.7290.21016.38714.488
Difference
(%)
-12.50-5.12-0.92-9.09-0.92-3.89-12.50-14.28-3.490.85-6.750.00-5.81-10.71-12.50-3.890.00-9.091.87-3.94-12.50-2.25-3.72
179 -

KAERI/RR-1999/99
Table 2.3-20
Comparison of Mechanical Control Absorber Worth
1
2
3
4
All
SUM
PPV/RFSP
keff
0.99750
0.99754
0.99750
0.99754
0.98809
Rod worth (mk)
2.503
2.466
2.504
2.470
12.059
9.944
WIMS/RFSP
keff
0.99752
0.99757
0.99753
0.99757
0.98802
Rod worth (mk)
2.485
2.441
2.478
2.433
12.126
9.837
Difference
(%)
-0.72
-1.02
-1.04
-1.51
0.56
-1.07
- 180 -

KAERI/RR-1999/99
Table 2.3-21
Comparison of Shutoff Rod Worth
.12345678910111213141516171819202122232425262728AllSUM
PPV/RFSP
keff
0.9987500.9984580.9984660.9987720.9989650.9976030.9976180.9989870.9983590.9969300.9966790.9969590.9983950.9982980.9983320.9983630.9969220.9966760.9969550.9984000.9989740.9976060.9976200.9989880.9987570.9984650.9984680.9987730.929665
Rod worth (ink)
1.2521.5441.5361.2301.0362.4032.3881.0141.6443.0793.3323.0501.6081.7051.6711.6403.0883.3353.0541.6031.0272.4002.3861.0131.2451.5371.5341.22975.65653.551
WIMS/RFSP
keff
0.9987590.9984800.9984830.9987750.9989480.9976540.9976850.9989760.9983450.9970260.9968010.9970560.9983900.9982750.9983200.9983500.9970260.9968160.9970590.9983910.9989550.9976560.9976850.9989750.9987550.9984800.9984870.9987750.931262
Rod worth
(mk)1.2431.5221.5191.2271.0532.3522.3201.0251.6582.9833.2092.9531.6131.7281.6831.6532.9833.1942.9501.6121.0462.3502.3201.0261.2471.5221.5151.22773.81252.730
Difference (%)
-0.72-1.43-1.11-0.241.64-2.13-2.821.090.85-3.14-3.69-3.200.311.350.720.80-3.39-4.23-3.430.561.85-2.09-2.741.290.16-0.98-1.24-0.16-2.44-1.59
- 181 -

KAERI/RR-1999/99
Table 2.3-22
Comparison of 600-FPD Refueling Simulation
Peak channel power (kW)
Peak bundle power (kW)
Channel power peaking factor
Zone controller level
Inner core discharge burnup (MWhr/kgU)
Outer core discharge burnup (MWhr/kgU)
Inner core refueling Rate (channels/FPD)
Outer core refueling Rate (channels/FPD)
Whole core refueling Rate (channels/FPH
Reference(PPV/RFSP)
6849
855
1.055
0.50
188
161
0.69
1.30
1.99
WIMS/RFSP
6853
852
1.063
0.50
182
163
0.71
1.28
1.99
Difference(%)
0.06
-0.35
0.76
0.0
-3.19
1.23
2.90
-1.54
0.0
- 182 -

KAERI/RR-1999/99
24.765cm,
/ / /
>// /i
14.2875cm
r /
/
S/\ / /// / /
// /
/ // /
/ // /
71
/ // // // //// /
W
///
V
//
/
//
f
////
/£•••
J*
/
/
/
V
/
/
/
V
//.—V
/
/
)
/
V
Fig. 2.3-1 SHETAN Model for Fuel Channel
- 183 -

KAERI/RR-1999/99
24.765c
14.2875cm
/ / / /
/ 7 / /
/_ /_
7
/ y
/ ..-••
Liir
///M
/
V
/
/
/
/
Fig. 2.3-2 SHETAN Model for Reactivity Device
- 184 -

KAERI/RR-1999/99
1 2
GT
3
TS
4
CN
5
CR
6
BL
7
Source
Vacuum
Calandria
SHETAN-modelled Region
No.
1
2
3
4
5
6
7
Coordinate (cm)
14.2875
28.595
51.459
54.015
60.295
79.375
82.2325
Material
FuelD2OGuide tubeD2OTension springCoupling rodGuide tubeCoupling rodCoupling nutGuide tubeD2OCoupling rodD2OCoupling rodLocatorBracketD2O
Stainless steel
Fig. 2.3-3 WIMS-AECL Slab Model for Structural Materials
- 185 -

KAERI/RR-1999/99
A
B
C
D
F.
F
G
H
T
K
L
M
N
0
P
Q
R
S
T
U
V
W
...
1 2 3 4
|
5 e
1/8
2/9
...
7
;
9
444-i
:
10 i i 12 13
_ m I.. Li_LLJ_|
3/10
4/11
5/12
14 15 16
TTTTTTT
17 18
_ ! _
7/14
19
i
20 21
! i
22
-•
l
9
10
12
13
14
15
17
18
19
20
22
23
24
25
27
28
29
30
31
32
33
34
35
1 2 3 4 5 8 9 11 13 15 17 19 21
10 12 14 16 18 20
2 3 2 5 2 7 2 9 31 3 3 3 5 37
2 2 2 4 2 6 2 8 3 0 3 2 3 J 3 6
39 40 41 42 *
Fig. 2.3-4 Typical RFSP Nodal Model for XY Plane
- 186 -

KAERI/RR-1999/99
-*1 2 3 4
LZC
1/2
ADJ
1
ADJ
8
ADJ
IS
Lzca9
7 S
ADJ
2
ADJ
9
ADJ
16
c 10
ADJ
3
ADJ
10
ADJ
17
11 12
3/4/S
ALIJ
4
ADJ
11
ADJ
IS
LZC1
0/11
m
3
AD.
5
AD
12
AD;
11
4 IS 16
ADJ
6
ADJ13
ADJ
20
17 IS
LZC
57
ADJ
7
ADJ
14
ADJ
?!
LZC1
VI4
19 20 21 22
" 1
2
3
5
6
7
8
9
10
11
12
« 24
44
1 2 3 4 5 6 7 9 10 12 14 16 IS 20 22 24 26 28 30 32 34 36 37 38
11 13 15 17 19 21 23 2L 2 29 31 33 35
Fig. 2.3-5 Typical RFSP Nodal Model for XZ Plane
- 187 -

KAERI/RR-1999/99
-WIMS/RFSP
Measurement
4 5 6 7Boron Batch
Figure 2.3-6 Calibration of Zone Controller
- 188 -

KAERI7RR-1999/99
I1/1
5a
2 -
- 2 -
- 4 -
- 6 -
- 8 -
-10
- WXMS/RFSP
M«asurment
50 100 150 200
Temperature <°C)
2 5 0 300
Figure 2.3-7 Heat Transport System Temperature Effect
- 189 -

KAERI/RR-1999/99
0.5-
£ 0 0
"•§ -0.5 -
3a« - i o -u
a-1.5-
-2.0-
WIMSflRFSP
• Measurment
••
30 35 40 45 50 55 60 65Temperature (°C)
70
Figure 2.3-8 Moderator Temperature Effect
- 190 -
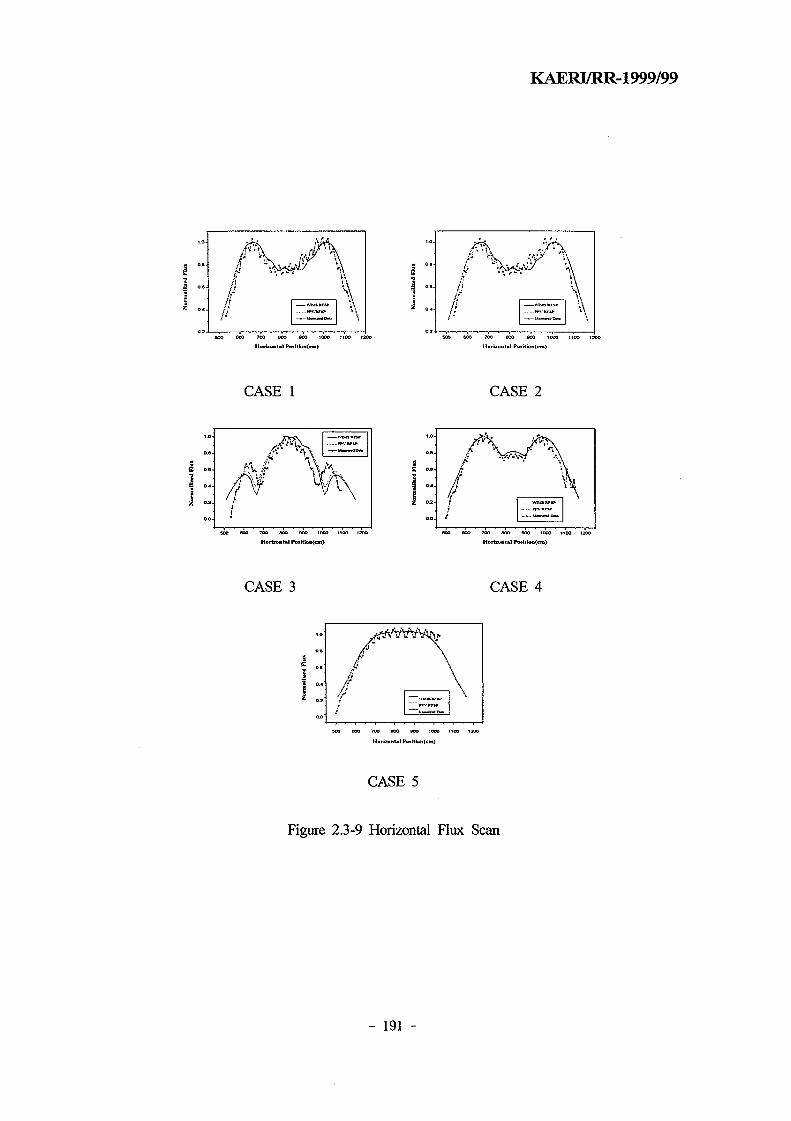
KAERI/RR-1999/99
1.0-
o».
O.4.111 '
MS 'A
\
\
500 600 TOO 000 BOO 1000 1100 I20O
l P«itk>n<cm>
f'j
If'/ • '
JrS.hf \
• \
.1r rrrTrr,500 600 700 600
Hurizonlal Po»hion(™>
CASE 1 CASE 2
I ..:
CASE 3 CASE 4
Horfaunt.l PoiiUon(cm)
CASE 5
Figure 2.3-9 Horizontal Flux Scan
- 191 -

KAERI/RR-1999/99
>TOO SOO 900 1000 1100 I20O 1300
V r t k a l Po*Hk>n<cm>
CASE 1 CASE 2
0 6 .
O.2
/
WMSitnr
900 1000 1100 1200 1300 1400
V*rtle»l potttfa>n<cm)
1.0-
as-
0.0-
o.a /
* \
\
wmurtr V7DD tOO SCO 1100 1300 1300
Vert ical PMhfe*Kcm>
CASE 3 CASE 4
TOO aOO 900 1000 JIOO I ICO 1300 \AC
Vrr tkat Po*itlun(cm>
CASE 5
Figure 2.3-10 Vertical Flux Scan
- 192 -

KAERI/RR-1999/99
8 9 10 11 12 13 14 15 16 17 18 19 20 21 22
A
B
r.D
F.
F
G
H
J
K
1,
M
N
O
P
0R
S
T
U
V
W
3.4
2.7
2.9 2.2
2.7 1.6
2.4 1.3
2.4 1.2
2.5
2.3
1.2
14
1.4
16
MaximumAverage ]
3.7
3.4
2.8
1.8
1.2
.7
.3
.3
.3
.4
.9
.8
.4
3.6
3 ?
2.5
1.7
.9
.4
1
0
-.3
-5
-6
- 4
-.3
-.5
-1.1
3 7
3.2
7 4
1.7
.9
.2
.0
6
5
.1
-8
-1 3
-14
-15
-1.8
-1.7
-7 3
4.93%.54%
3.9
3 4
2.4
18
1.4
.8
.2
.5
9
10
9
.5
-4
-14
-15
-19
-2.4
-2.3
-7.3
-3 3
3.4
7 5
1.7
14
1.5
1.7
1.1
.6
4
7
0
-.2
-4
-5
- 6
-16
-2.5
-2.8
-7..9
-3?
2.9
7 0
1.3
1 1
1.4
1.8
1.2
.7
3
0
-.4
-5
-4
- 6
-16
-Z7
-3 1
-3 5
3.1
2.6
.9
8
1.5
1.5
1.0
.5
1
- 4
-.6
-7
-8
- 9
- . 5
-2.9
-3 4
-3 6
-3 7
-4.9
3.3
2.2
1 1
.5
1.3
1.4
.9
.4
-1
- 5
- 7
-.9
-9
-9
-10
-17
-3.2
-3 8
-40
-40
-4.3
3.3
2.1
8
4
1.8
2.2
1.6
.6
-8
-1 1
-1.1
-7
-3
-13
-3.4
-41
-44
-4?
-4.4
3.2
2.1
8
.2
4
1.8
2.2
1.6
.6
- 8
-1 1
-1.1
-7
-3
-13
-3.5
-41
-44
-4?
-4.4
3.2
2.1
1 1
.5
4
1.3
1.3
.9
.4
-1
- 5
- 8
-.9
-9
-1 0
-1 1
-17
-3.2
-3 8
-41
-4 1
-4.4
3.0
2.5
1 5
.8
7
1.4
1.4
.9
.5
0
- 3
- 5
-.7
-8
-9
-10
-16
-3.0
-3 5
-3 7
-3 7
-4.9
2.8
19
1.2
10
1.3
1.7
1.1
.5
1
-1
-4
-.5
-6
-6
- 7
-17
-2.8
-3?
-3 4
-3 5
3.3
7 4
1.5
17
1.4
1.6
1.0
.5
0
-•>
-.3
-5
-6
- 7
-17
-2.7
-3 0
-3 0
-3 3
3.7
3 3
2.3
16
1.2
.6
.0
.3
7
8
7
.3
-6
-1 6
-17
-2.0
-2.5
-7 5
-7 5
-3 5
3 5
3.0
7 ?
1.5
.7
.0
-.2
4
-.2
-10
-1 6
- 1 6
-1.8
-2.1
-19
-7 4
3.3
7 9
2.2
1.4
.6
.1
- 3
- 5
-.6
-8
-8
- 6
-.6
-.7
-13
3 4
3.1
2.5
1.5
.8
4
n-.1
0
i
6
.5
.2
3.0
2.3
1.8 2.4
1.2 2.3
.9 2 0
8 1 9
.8
1.0
1 1
1.3
2.1
19
Fig. 2.3-11 Comparison of Channel Power for Equilibrium Natural Uranium Core (Critical Core)
- 193 -

KAERI/RR-1999/99
7 8 9 10 11 12 13 14 15 16 17 18 19 20 21 22
A
R
C
D
E
F
G
H
J
K
L
M
N
0
P
Q
R
S
T
U
V
w
5.0
48
4.5
44
45
4?
5.5
4.7
4.1
35
3.1
30
30
31
3.2
3.3
5.9
55
4.7
3.6
2.9
?3
2.0
1 8
1 7
17
1.9
2.4
2.4
2.0
5.7
5.2
44
3.4
2.3
1.7
1 ?
1.0
8
6
5
.5
.8
1.0
.9
.4
5.9
5.2
4.2
33
2.1
1.1
.7
.9
7
3
-5
-.8
-.6
-6
-.7
-.4
L?
61
5.5
4.3
3.3
76
1.5
.4
.0
1
.1
-1
-4
-1 1
-1.5
-1.4
-1.4
-1.5
-1.3
-1.1
1-2.0
57
4.5
3.4
2.6
7?
1.5
.4
-.6
-1 1
-1.5
-1 7
-18
-18
-1.6
-1.3
-1.5
-2.0
-2.0
-1.8
-2.0
51
3.9
2.8
2.1
17
1.1
-.1
-1.1
-19
-2.3
-7 6
-?fi
-7.5
-2.2
-1.8
-2.0
-2.4
-2.4
-2.3
-2.3
5.3
47
3.3
2.3
1.5
1?
.3
-.8
-1.7
-7 4
-2.9
-3?
-3 3
-3?
-2.9
-2.6
-2.5
-2.9
-2.9
-2.8
-2.6
-3.7
5.5
4?
2.8
1.8
1.0
7
.0
-1.1
-2.1
-7 9
-3.5
-3 8
-3 8
-3 7
-3.4
-3.0
-2.9
-3.4
-3.4
-3.3
-3.0
-3.2
5.5
47
2.5
1.4
.9
11
.6
-.6
-2.1
-3?
-3.9
-43
-47
-3 7
-2.9
-2.4
-2.7
-3.8
-3.8
-3.7
-3.2
-3.2
5.5
4?
2.5
1.4
.9
10
.5
-.7
-2.1
-3?
-4.0
-43
-4?
-3 7
-2.9
-2.4
-2.7
-3.8
-3.8
-3.7
-3.2
-3.2
5.5
4?
2.8
1.7
1.0
7
-.1
-1.2
-2.2
-3 0
-3.6
-3 9
-3 9
-3 7
-3.4
-3.0
-3.0
-3.5
-3.5
-3.3
-3.0
-3.2
5.3
46
3.3
2.2
1.4
1 1
.2
-.9
-1.8
-?6
-3.0
-3 4
-3 4
-3 3
-3.0
-2.7
-2.6
-3.0
-3.0
-2.9
-2.7
-3.8
50
3.8
2.7
2.0
16
.9
-.3
-1.3
-7 0
-2.5
.->-}
-7 8
-7 7
-2.3
-2.0
-2.1
-2.6
-2.6
-2.4
-2.4
55
4.4
3.2
2.5
71
1.3
.2
-.8
-1 4
-1.7
-1 9
-7 0
-7 0
-1.8
-1.5
-1.7
-2.2
-2.1
-1.9
-2.1
60
5.3
4.1
3.1
2.4
1.3
.2
-.2
-4
-.1
-3
-7
-14
-1.8
-1.6
-1.6
-1.7
-1.4
-1.3
-2.2
5.7
5.0
3.9
3.0
1.8
.8
.4
6
.6
4
0
-7
-1.1
-.9
-.9
-1.0
-.6
-1.1
5.5
4.9
4.1
3.1
2.0
1.3
9
.6
4
3
7
.2
.5
.7
.6
.1
5.5
5.1
4.3
3.2
2.5
1 9
1.6
1 4
1 3
13
1.5
2.0
2.0
1.7
5.0
4.3
3.7
3 1
2.7
?S
">5
2.6
2.7
2.9
4.4
43
4.0
3R
39
3.7
Maximum 6.10%Average 2.45%
Fig. 2.3-12 Comparison of Channel Power for Equilibrium Natural Uranium Core (Fixed Burnup)
- 194 -

KAERI/RR-1999/99
A
B
C
u
b
r
\3
14ri
j
V
1
122700.562814.07356
3560.0428A AA4280.04890.41488
-0.205250.405280.575450.39544
-0.185610.385630.365850.37580
-0.855940.37592
-0.346050.37601
-0.666050.386050.0
132660.552743.01343A AQ3481.46420A AAv.*r*r
4210.244830.41481
-0.415270.39522
-0.955390.38538
-0.195580.385590.185750.375750.05920.36588
-0.686000.36596
-0.676030.37601
-0.33
142590.562704.25328A CfiKJ.jyJ
3341.83405n A S4050.04620.424660.875100.405100.05280.395290.195510.38550
-0.185690.37566
-0.535830.37579
-0.695870.375880.175920.375920.0
15
310A ciU.Jl
3172.26381A A£.
3820.264440.424440.04950.40491
-0.815340.39525
-1.695410.38537
-0.745600.37554
-1.075700.37567
-0.535800.37575
-0.865780.385800.35
16
2750.542843.27344n Aftu.^o3491.454140.44413
-0.244720.41463
-1.705140.40502
-1.185250.39518
-1.335400.38537
-0.565580.38550
-1.435660.37559
-1.245650.38564
-0.18
17
2350.592527.23302A CO3102.653710.473730.544300.43426
-0.934780.41470
-1.675080.40502
-1.185350.39525
-1.875360.38529
-1.315420.38539
-0.555520.38544
-1.45
18
261U.JO
2755.363150.503273.813790.463800.264260.434270.234650.41464
-0.225000.40491
-1.805160.39510
-1.165310.39522
-1.695350.39528
-1.31
19
2710.552834.433150.503273.813700.463741.084110.444130.494430.434440.234720.41466
-1.274880.41481
-1.434950.41488
-1.41
20MCNP%STDRFSP%DIFF
2610.562765.753090.513182.913460.483521.733870.46382
-1.294080.44406
-0.494250.43421
-0.944330.44429
-0.92
21
DIFF(%)=
22
(R-MVMX100
T
InnerCore
2810.542986.053140.513181.273320.493350.903490.483490.03570.48356
-0.28
2580.522704.652680.552742.242770.562811.44
Fig. 2.3-13 Comparison of Bundle Power Distribution for Equilibrium DUPIC Core
- 195 -

KAERI/RR-1999/99
2.4
DUPIC
MCNP DUPIC
0.73%
5%
10"6(5k/K),
2STD
A U (1.75x
MCNP5]
irfl, WIMS-AECLofl MCNP
WIMS/RFSP
RMS
RMS
0.3%5k
- 1 2 %
, PPV/RFSP
}, WIMS/RFSP
71
DUPIC ^
MCNP S«i^& CANDU
ZL ^ 3 f i - WIMS/RFSP
4 0.12% 5 k
] ^ . MCNP
MCNPif WIMS/RFSP
WIMS/RFSP 7j-i>ol
DUPIC
MCNP
fe DUPIC
DUPIC
- 196 -

KAERI/RR-1999/99
1. H. KEIL, P.G. BOCZAR, and H.S. PARK, "Options for the Direct Use of Spent PWR Fuel
in CANDU (DUPIC)", Proceedings of Third International Conference of CANDU Fuel, Chalk
River, Canada, 1992.
2. J.S. LEE et al., "Reaserch and Development Program of KAERI for DUPIC (Direct Use
of Spent PWR Fuel in CANDU Reactors)", Proceedings of International Conference and
Technology Exhibition on Future Nuclear System: Emerging Fuel Cycles and Waste Disposal
Options, GLOBAL'93, Seattle, USA, 1993.
3. H.B. CHOI, B.W. RHEE, and H.S. PARK, "Physics Study on Direct Use of Spent PWR
Fuel in CANDU (DUPIC)", Nucl. Sci. Eng.: 126, pp.80-93, May 1997.
4. E.S.Y. TIN and P.C. LOKEN, "POWDERPUFS-V Physics Manual", TDAI-31 Part 1, Atomic
Energy of Canada Limited, 1979.
5. A.R. DASTUR et al., "MULTICELL User's Manual", TDAI-208, Atomic Energy of Canada
Limited, 1979.
6. D.A. JENKINS and B. ROUBEN, "Reactor Fuelling Simulation Program - RFSP: User's
Manual for Microcomputer Version", TTR-321, Atomic Energy of Canada Limited, 1993.
7. J.V. DONNELLY, "WIMS-CRNL: A User's Manual for the Chalk River Version of WIMS",
AECL-8955, Atomic Energy of Canada Limited, 1986.
8. H. CHOW and M.H.M. ROSHD, "SHETAN - A Three-Dimensional Integral Transport Code
for Reactor Analysis", AECL-6787, Atomic Energy of Canada Limited , 1980.
9. J.F. BRIESMEISTER, ed., "MCNP- A General Monte Carlo N-Particle Transport Code,
Version 4B," LA-12625-M, Los Alamos National Laboratory, 1997.
- 197 -

KAERI/RR-1999/99
10. M.A. SHAD, "RFSP Reactor Physics Model for Point Lepreau Generating Station Unit 1",
TTR-386 Rev.l, Atomic Energy of Canada Limited, 1994.
11. B. ROUBEN and A.R. DASTUR, "CERBERUS User's Manual (Revision 1)", TDAI-177,
Atomic Energy of Canada Limited, 1986.
12. CM. BAILEY, P. AKHTAR, P.E. TREMBLAY, O.A TROJAN and J.H. CARSWELL,
Jr., "The SORGHUM Code: Program Description and User's Guide", TDAI-133, Atomic
Energy of Canada Limited, 1980.
13. B. ROUBEN et al., "CHEBXEMAX User's Manual", TDAI-187, Atomic Energy of Canada
Limited, 1980.
14. M.H.M. ROSHD and H.C. CHOW, "The Analysis of Flux Peaking at Nuclear Fuel Bundle
Ends Using PEAKAN", AECL-6174, Atomic Energy of Canada Limited, 1978.
15. D.S. CRAIG, "Testing ENDF/B-V Data for Thermal Reactors", AECL-7690, Atomic Energy
of Canada Limited, 1984.
16. J.V. DONNELLY, "Progress in the Development of WIMS at Chalk River", AECL-8807,
Atomic Energy of Canada Limited, 1985.
17. J.V. DONNELLY, "Validation of WIIMS with ENDF/B-V Data for Pin-cell Lattices",
AECL-9564, Atomic Energy of Canada Limited, 1988.
18. J.V. DONNELLY, "Description of the Resonance Treatment in WIMS-AECL", AECL-10550,
Atomic Energy of Canada Limited, 1993.
19. J.V. DONNELLY, "Acceptance Tests for a New WIMS-AECL ENDF/B-V Nuclear Data
Library", FFC-RCP-010 Rev.0, Atomic Energy of Canada Limited, 1997.
20. R.D. MOSTELLAR and L.D. EISENHART, "Benchmark Calculation for the Doppler
- 198 -

KAERI/RR-1999/99
Coefficient of Reactivity," Nucl Sci. Eng., 107, 265 (1991)
21. F. RAHNEMA et al., "Boiling Water Reactor Benchmark Calculations", Nuclear Technology
184, 117, 1997.
22. "Cross-Section Evaluation Working Group Benchmark Specifications," BNL-19302
(ENDF-202), Brookhaven National Laboratory, 1974.
23. L.M. PETRIE and N.F. LANDERS, "KENO V.a An Improved Monte Carlo Criticality
Program with Supergrouping," Section Fl l , NUREC/CR-0200, Vol. 2, U.S. Nuclear
Regulatory Commission, 1984.
24. G.H. ROH and H.B. CHOI, "Assessment of Neutron Transport Codes for Application to
CANDU Fuel Lattice Analysis", KAERI/TR-1377/99, Korea Atomic Energy Research
Institute, 1999.
25. G.H. ROH, H.B. CHOI, and J.W. PARK, "Sensitivity Analysis on Various Parameters for
Lattice Analysis of DUPIC Fuel with WIMS-AECL Code", Proceedings of the Korean Nuclear
Society Autumn Meeting, Taegu, Korea, Oct. 1997.
26. M.S. MILGRAM, "A Comparison of the Reactor Physics Predictions for CANFLEX Fuel
Using the Codes MCNP, WIMS-AECL and LATRAP", Topical Meetings on Advances in
Reactor Physics, Charleston, 1992.
27. D.A. JENKINS, "Comparison of RFSP with HBAL and with Phase rB' Experiments at Point
Lepreau", Appendix D of Addendum to TDAI-440 Part I, Atomic Energy of Canada Limited,
1991.
28. M.A. SHAD and A.C. MAO, "Comparison of History-Based Core Tracking and Powermap
Simulations with Conventional Production Runs for Point Lepreau", TTR-486, Atomic Energy
of Canada Limited, 1994.
- 199 -

KAERI/RR-1999/99
29. H.C. CHOW, "Post-Simulation of 1992 Point Lepreau Restart Physics Tests", TTR-480,
Atomic Energy of Canada Limited, 1994.
30. D.A. JENKINS, "Simulation of 1992 SDS1 Trip Test at Point Lepreau", TTR-532, Atomic
Energy of Canada Limited, 1994.
31. H.C. CHOW and D.A. JENKINS, "RFSP Simulation of Point Lepreau Derating Events",
TTR-544, Atomic Energy of Canada Limited, 1994.
32. E.V. CARRUTHERS and J.V. DONNELLY, "Validation of WIMS-AECL against Actual
Operating History: Core Following of Point Lepreau Nuclear Generating Station with
POWDERPUFS-V and WIMS-AECL", 5th International Conference on Simulation Methods
in Nuclear Engineering, Montreal, Canada, 1996.
33. J. GRIFFITHS, "WIMCORE: An Interface between WIMS-AECL and the codes FMDP,
RFSP, HQSIMEX, SHETAN and GETRANS", Internal Memorandum RC-906, Chalk River
Laboratories, 1993.
34. D. JENKINS et al., "AMAD for Physics Simulations", Addendum to TDAI-440 Part I, Atomic
Energy of Canada Limited, 1991.
35. H. CHOW and C. NEWMAN, "Post-Simulation of the Point Lepreau 1992 Startup Physics
Tests", 4th International Conference on Simulation Methods in Nuclear Engineering, Montreal,
1994.
36. H.B. CHOI, "A fast-running fuel management program for a CANDU reactor", Annals of
Nuclear Energy, Vol.27, pp.1-10, 1999.
- 200 -

KAERI/RR-1999/99
. DUPIC
- 201 -

KAERI7RR-1999/99
3. DUPIC m°*^ ^
^ | fl DUPIC
CANDU
. U DUPIC
DUPIC
CANDU
^ DUPIC «|«iJ5. ^ 7 1 ^ ^-^^r, DUPIC
4 , CANDU $J*f.3AiH && ^ $Xr}. o ] # ^«B CANDU
DUPIC ^ ^ ^ ^ o ^ j g « .^^- ^ * J ^ ^ o . ^ 5 o | ^ 7]^ . CANDU
DUPIC
DUPIC ^ ^ S 5 ] Efig-^^- i i l -e l ^7)| ^ ^ J | - 7> g- 2f^o] 61-5-^, °lfe DUPIC
CANDU Qx}M.$\ ^ - ^ # ^ ^ * W ^ ^
] 4 ^ . DUPIC
fg 7]^. DUPIC
l.45wt%olt:|-.3
CANDU ^
fe DUPIC ^ ^ S i f 7 ] ^ CANDU 6
il 3 .2^<H1A^ CANDU
7]^- DUPIC ^ ^ S S ^ ^ ^ 5| ^^f - ^ - i - 3.3^ ^ 3.4^<^1 4 4 7l
. DUPIC ^
- 203 -

KAERI/RR-1999/99
3.1
CANDU
CANDU
^ 27H1-
CANDU
CANDU
3.1.1
CANDU
51
- 204 -

KAERI/RR-1999/99
4^0.14
5% - 95%
3.1.2
4 4 800 kW 91 6500 4 4 935 kW
7300 kWojt:]-.
CANDU 9S4
fonn factor7|-
9J 9J shim
3.1.3
n]
91
- 205 -

KAERI/RR-1999/99
16.6
.^- 14.9
3.1.4
4 ^^1 ^ 1 ^ ^ #*}MM %*}M*i 5X3- *}*Anm ^ m ^r $ls-
>. CANDU
7 1 1 ^ 3 ^ ^ - o U i , ^ 2 3 ^
o|-g-«>c:f. 4 3*1 Tfl-fvg: ij4i ^§-7f^ 7)-^ ^^(Minimum Acceptable
Performance Specifications; MAPS)*H^
3.1.5 On-line i f ^ * H r Mapping
mapping 7«^&
of 7fl ofl Af§-^nf. On-line #3*Hf-^3E ^>Sfe 3 ^ 5l ^ 1 ^ S. S^ofl cfl
*1I 4^-€^>. -£3*Hr mapping
3.1.6 ^-Jf- 3 ^ # ^ J i ^ Tfl-f-
7 1-f- (Regional Overpower Protection; ROP)^- in^fl
(SDS1 : 10.8%/s, SDS2: 17.3%/s)o]r:>.
- 206 -

KAERI/RR-1999/99
3.2
CANDU POWDERPUFS-V(PPV) [Ref. 5]
^ RFSP [Ref. 7]
fe DUPIC
^ RFSP
MULTICELL [Ref. 6]
. DUPIC
31-SrM WIMS-AECL [Ref. 8] 3.
SHETAN [Ref. 9] 3 £ <
c>. DUPIC
3.2.1 DUPIC
3.2-1^ ^ o ] DUPIC
ENDF/B-V
437|
K WIMS-AECL 89-$
3.2.1.1
WIMS-AECL
. RFSP S ^
RFSP
(3.2-1)
- 207 -
KAERI/RR-1999/99
3.2.1.2
CANDU ^l
S. 719-71-S^<a SHETAN 3 H S Tll^^c}. <§•£ ^^^^Sr ^ ^ - ^ ^©1 #
719-7}
^r ZL^ 3.2-2 iJ 3.2-3ofl
3.2.1.3
RFSP T i l t H ^ 135Xe
61
(3.2-3)
(3.2-4)
= £(r)(x(r)-xref) (3.2-5)
- 208 -

KAERI/RR-1999/99
. RFSP S H
, 7 l f e 135Te
WIMS-AECL 3 .H
3.2.2 DUPIC
3.2.2.1
CANDU 4 l > f e fla ^ ^
i i ^ ^ ^^^"Ell 71 -^ - £71 $J*H RFSP S ^
J t
r 26co
o>2fe- 4 4
CANDU 6 ^ 4
3.2-4^} ^-o) DUPIC
(3.2-6)
o*
(3.2-7)
. SDS-21- ^ l ^ t > tiJ:-§-£ 7)^- ^|*1 J g ^ S . # H ^ 3.2-5<Hl
- 209 -

KAERI/RR-1999/99
3.2.2.2
H,
(Maximum Channel Power; MCP>§- o j [ ^ ^ afl,
( P m a x )
RFSP
o>(i,j.k) = ^ ( k ) + f(i,j) x (a,2(k) - (3.2-8)
91
4 * B ^91
si7]
- 210 -

KAERI/RR-1999/99
to,
3.2.2.3
± RFSP
: 4
}Hi o|
CANDU |-.10 o| a
- 211 -

KAERI/RR-1999/99
Moderator
Fuel RodCoolantPressure TubeAir GapCalandria Tube
Fig. 3.2-1 DUPIC Fuel Lattice Model
- 212 -

KAERI/RR-1999/99
y_24.765CI
* / / / / /
V / \/ / /
Fig. 3.2-2 SHETAN Model for Fuel Channel
- 213 -

KAERI/RR-1999/99
*A / / / /// y / / /
24.765v / / / /
V / A / /</ / /
V / /
14.2875cm
/ / ^
LWCic.
Fig. 3.2-3 SHETAN Model for Reactivity Device
- 214 -

KAERI/RR-1999/99
1 2 3 4 5 6 7 8 9 10 11 12 13 14 15 16 17 18 19 20 21 22
A
B
C
D
E
F
G
H
J
K
L
M
N
O
P
Q
R
S
T
U
V
w
o
o
o
o
o
o
o
o
0
0
o
o
o
0
0
0
o
o
o
o
o
o
o
o
o
o
o
o
o
o
o
o
o
o
o
o
o
o
o
o
o
o
o
o
o
o
o
o
o
o
o
o
o
o
o
o
o
o
o
o
o
o
o
o
o
o
o
o
o
o
o
o
o
o
o
o
o
o
o
o
o
o
o
o
0
0
o
o
o
o
o
0
o
o
o
o
o
o
o
o
0
o
o
o
o
o
o
o
o
o
o
o
0
o
o
0
o
0
o
o
o
o
o
o
o
o
o
0
o
o
o
o
o
o
o
o
o
o
0
0
o
o
o
o
o
o
o
0
o
o
o
o
o
0
o
o
o
o
o
o
o
o
o
o
o
o
o
o
o
o
o
o
o
o
o
o
o
o
o
o
o
o
o
o
o
o
o
o
o
0
o
o
o
o
o
o
o
o
o
o
o
o
o
o
o
o
o
o
o
o
o
o
o
o
o
o
o
o
o
o
o
o
o
o
o
o
o
o
o
o
o
o
o
o
o
o
o
o
o
o
o
o
o
o
o
o
o
o
o
o
o
o
o
o
o
o
o
0
o
o
o
o
o
o
o
o
o
o
o
o
o
o
o
o
o
o
o
o
o
o
o
0
o
o
o
o
o
o
o
o
o
o
o
o
o
o
o
o
o
o
o
o
o
o
o
o
0
o
o
o
o
o
o
o
o
o
o
0
o
o
0
0
0
o
o
0
o
o
o
o
o
o
o
o
o
o
o
o
o
o
o
o
o
o
o
o
o
o
o
o
o
o
o
o
o
o
o
o
o
0
o
0
o
o
o
o
o
o
o
o
o
o
o
o
o
o
o
o
o
o
Fig. 3.2-4 Front View of CANDU-6 Core
- 215 -

KAERI/RR-1999/99
>-» x-direction
Back Side
••
o•••••
•
•
•
•
•
•
•
•
o••••D
a
a
••
a
a
•
oa•a•a
•••
o o• •
o
Front Side
• Adjuster Rod (21) • Shutoff Rods (28)
O Zone Controller Units (14) • Mechanical Control Absorber (4)
Fig. 3.2-5 Plan View of Reactivity Device Layout
- 216 -
KAERI/RR-1999/99
3.3 7)^ DUPIC m& %
DUPIC
ofl, DUPIC t*}<£3.^ J2.-5.
o] ^Sf^>u>. o]e|^> ^ ^ ^ a l ^ ^ A ^ D U P I C
CANDU
DUPIC
- DUPIC
s-a-- DUPIC «|«iS. ^ 7 l H l # ^ ^ S Hl^^: ^ ^ S ^71H1J2X1- ^711
3.5wt% ^ 1 ^ ^ -f-B}w (Slightly enriched uranium; SEU), 0.25wt%
SEU 9J DU
SEU 91
36007fl*l
2/tf-i- ^^* f7 l ^ * H CASMO3 [Ref. 11]
91 0RIGEN2 [Ref. 12] S ^ # 4-§-*}^3., DUPIC ^ 9 l S 5 l ^ ^ - ^ WIMS-
AECL S J ^ #
- 217 -

KAERI/RR-1999/99
H f e iB % |-fe 239Pu239Pu 2.$ ^^m £\&Sk*W-c\.
SEU tfl DU£f a l l - a i ^ ^ ^ S . ^ ^-^«> 235U
3.3.1.1 7 l ^ DUPIC
DUPIC ^ « 1 S . ^ S ^ ^ : 1.0wt% 235U ^ 0.45wt%
:^*H-H *J 90%^ A^g-^ ^ ^ S . ^ ^ ^ . 7 } 7]
DUPIC ^ « ^ S 5 | ^ ^ # W * } ^ * I DUPIC 3 ) ^ 1 5 . ^fl7}^-l ^ sac>. o|n||,SEU ^J DU^ 6O> . 4 4 ^^| | A^J . « .^o | 7>8 ni
^>€- i-g- DUPIC
, CANDU
) 4 ] DUPIC
(5.46 mills/kWh)14
3.3.1.2
can]..
2 3 9Pu
~7 el 3 3_1— ZF ^ ^ } - ^ ^ ^ ^ a > - g - i ^5j -#- T-J-EMTL o l r t ti]-M- J?.— DUPIC
3.3-l<H| a]J2.*>Sit:>. ^ ^ ^ ^ ^ ^ 7 }
- 218 -

KAERI/RR-1999/99
DUPIC
3.3.1.3
3.3-2&fl
DUPIC
7]-g- DUPIC «J<*I5.£1 ^ l^Hlfe 558 $/kgHMS^15 DUPIC
DUPIC
3.3-3^1
DUPIC ^
^ H ^ 0.03
3.3.2
DUPIC ^<^.g.S>) «>-§-S.7}
2 3 5 u
DUPIC
3.3.2.1
«K§-3£.
3.3-2^
- 219 -

KAERI/RR-1999/99
CANDU #
5 *> 90%
(>1.25811) 7}
ZL J 3.3-3^ -f Bfeo] ^ 7 ^ 7 ] * H $1}"^ -^^ ^ofl rc}$
f } \ > | U ^ ^ f ^ J l ! £ ^ ^ f l ^ h g ] 1 . 1 6 6 ±
0 . 0 0 1 4 f l 1 1 ^ ^ i }
3.3.2.2 SEU/DUofl
SEUi} DU «K§-S. A>o]6l| S i A ^ , DUPIC
SEU1- ^ ^ t l c } . ^ ^ - ^ ^ SEU^ ° o ^ DUPIC
^ 1 ^ ±0.001
DUPIC
SEU/DU# A|~§-*> «>-§-£ ^ ^ 4 ^ ^ a 3.3-4611 v|-E}i-jj$at:}. o|
SEU
SEU/DU
- DUPIC *<|<5i£. «a^H7} ^ 7 } * H ^ ^ 5 . 7 1 Hi 7} ^ ^ = 5 . a ] ^ ^ - 7} 2} a]
CANDU
- 220 -

KAERI/RR-1999/99
3.3.2.3
SEU/DU»
37W
1.19
DU
DUPIC
43.1.17
, SEU/
^ 1.185.
3.
100%
3.3.3.1
DUPIC
. 35]
^r DUPIC
«>-§-£# 1.16 g 1.21 A>o]6JI ^ 7 1
25%
- 221 -

KAERI/RR-1999/99
B k
(2%
7}
= 1.21)51
).
3.3.3.2 <>)-§-
°l-8-i-ol
3.3-2)<Hl $ a ^
SEU
88%
3.3.3.3
- 222 -

KAERI/RR-1999/99
CPPF# 1.064
1.197}
3.3.4 DUPIC
DUPIC
239Pu
3.3-7~3.3-9<Hl
3.c}. a
SEU/DU S i
DUPIC
DUPIC n^S.^ ^ «J-S-^^ 1-14 4 1.46 wt% g| 0.57 wt%o]u}. ojAJ.
37}x)
- 223 -

KAERI/RR-1999/99
3.3.4.1
DUPIC i ^ H H f e 2-
3.3.4.2
DUPIC
9%
7] $M DUPIC
Doppler
3000 MWd/t
3.3.4.3
DUPIC
oilDUPIC
DUPIC
7}
- 224 -

KAERI/RR-1999/99
3.3.5 £.<$
-M^Hr DUPIC
96o/o7}
^r DUPIC ^ £
CANDUAf ^ ^ ^J^>Sofl>fc| ^J-^o] SjuK SEU/
g-^-°l 3.4%7}
7} t<[£<£^ # ^
y,i^-H S^oU^fe A ^ ^ T -fete^ ^ & o?-8^o1 *l=fl 88%ol
SEU/DUcHl
- 225 -

KAERI/RR-1999/99
Table 3.3-1
Composition Variation for Fissile Content Adjustment Option
Actinides
Fission
Products
2 3 5 u
239Pu241Pu240Pu
241Am
155Gd149Sm143Nd15ISmI03Rh
Number of Mixing Operation
0
0.0*
0.0
20.3
8.9
11.4
21.2
4.3
7.6
6.7
9.0
1
0.0
0.0
14.7
8.8
10.7
18.7
1.7
8.7
6.4
10.1
2
0.0
0.0
9.8
5.6
6.6
12.1
0.9
5.1
4.1
6.1
3
0.0
0.0
6.7
4.1
5.1
8.3
0.7
3.0
2.6
3.9
* Two standard deviations in percent
- 226 -

KAERI/RR-1999/99
Table 3.3-2
Summary of Fissile Content Adjustment Option
Number of assemblies mixed
Spent PWR fuel utilization (%)
DUPIC fuel composition (wt%)
Spent PWR fuel
SEU feed
DU feed
Manufacturing process (400 t/yr capacity)
Annual SEU feed (MTU)
Annual SEU cost (M$) - O&M cost
Manufacturing Cost ($/kgU)
Fuel cycle cost (mills/kWh)
First Mixing
2
90
82.5
7.8
9.7
31.2
29.3
631
5.49
Second Mixing
4
90
82.6
7.3
10.1
29.2
27.4
627
5.48
Third Mixing
8
96
82.7
6.5
10.8
26.0
24.4
619
5.46
- 227 -

KAERI/RR-1999/99
Table 3.3-3
Unit Cost of Fuel Cycle Components
Component
Uranium(U3O8) ($/lb)
- PWR
- CANDU
Conversion ($/kgU)
- PWR
- CANDU
Enrichment ($/SWU)
Fabrication ($/kgU)
- PWR
- CANDU
- DUPIC
Transportation ($/kgHM)
- DUPIC
Transportation &
Storage ($/kgHM)
- PWR
- CANDU
- DUPIC
Disposal ($/kgHM)
- PWR
- CANDU
- DUPIC
Loss Rate
(%)
0.5
0.5
1
1
1
Lead/Lag time
(months)
-24
-17
-18
-13
-12
-6
-10
-10
120
120
120
120
360
360
360
Unit Cost
19.2
19.2
8
8
110
275
65
558
50
230
48a
170b
610
73
316C
a transportation cost [Ref. 14] + storage cost [Ref. 16]b transportation & storage cost for DUPIC = transportation and storage cost for CANDU
x 4.5c disposal cost for DUPIC = disposal cost for CANDU X 4.33
- 228 -

KAERI/RR-1999/99
Table 3.3-4
Summary of Reactivity Control by SEU/DU
Average ka>
Poisoned koo
Spent PWR fuel utilization
Fuel composition (wt%)
Spent PWR fuel
SEU feed
DU feed
Dysprosium in center rod
Manufacturing process (400 T/year)
Annual SEU feed (MTU)
Annual SEU cost (M$) - O&M
Manufacturing cost ($/kgU)
Discharge burnup (MWd/T)
Fuel cycle cost (mills/kWh)
Target Reactivity ( koo )
1.16
1.16022
1.12749
100.0
90.6
0.0
9.4
4.22
0.0
0.0
558
11954
5.53
1.17
1.17053
1.13736
100.0
92.7
0.9
6.4
4.85
3.6
3.4
566
13395
5.43
1.18
1.18021
1.14650
100.0
96.6
2.3
1.1
5.15
9.4
8.8
580
14523
5.36
1.19
1.19012
1.15589
100.0
95.9
4.1
0.0
5.27
16.3
15.3
596
15562
5.32
1.20
1.20005
1.16506
100.0
93.9
6.1
0.0
5.45
24.4
23.0
615
16570
5.28
1.21
1.21008
1.17435
100.0
91.8
8.2
0.0
5.63
32.7
30.8
635
17590
5.24
- 229 -

KAERI/RR-1999/99
Table 3.3-5
Summary of Utilization of Linear Reactivity Fuel
Average kco
Poisoned koo
Spent PWR fuel utilization
DUPIC Fuel composition (wt%)
Spent PWR fuel
Natural uranium feed
Dysprosium in center rod
Manufacturing process (400 T/year)
Annual NU feed (MTU)
Annual NU cost (k$) - O&M
Manufacturing cost ($/kgU)
Discharge burnup (MWd/T)
Fuel cycle cost (mills/kWh)
Target Reactivity ( koo )
1.16
1.16018
1.12813
87.8
99.9
0.1
4.72
0.4
20
558
12522
5.45
1.17
1.16995
1.13712
77.4
99.8
0.2
4.84
0.8
40
558
13274
5.40
1.18
1.18006
1.14640
66.2
99.2
0.8
4.93
3.2
160
558
14006
5.35
1.19
1.18998
1.15572
54.7
99.9
0.1
5.10
0.4
20
558
14866
5.30
1.20
1.19984
1.16494
43.3
99.6
0.4
5.27
1.6
80
558
15700
5.25
1.21
1.20999
1.17444
32.4
99.7
0.3
5.49
1.2
60
558
16627
5.19
- 230 -

KAERI/RR-1999/99
Table 3.3-6
Comparison of koo and Isotopic Composition
Isotope
Koo
Actinides
Fission
Products
235U
B 9Pu
241Pu
240Pu
241Am
155Gd
I49Sm
M3Nd
151Sm
103Rh
Fissile Content
Adjustment
1.15623
10000.0
4500.0
423.7
1758.9
617.1
8.8
3.3
608.6
10.3
318.6
± 1.26%*
±0.0%
±0.0%
±6.7%
±4.1%
±5.1%
±8.3%
±0.7%
±3.0%
±2.6%
±3.9%
Reactivity Control
by SEU/DU
1.14614
9663.8
5325.4
500.7
2075.4
727.7
10.4
3.9
720.0
12.2
376.4
±0.20%
±2.9%
±1.7%
±7.0%
±2.9%
±4.1%
±5.6%
± 1.6%
±4.3%
±3.6%
±4.1%
Reactivity
by Natural
1.12817
8660.3
5473.0
520.8
2153.7
758.8
10.7
4.0
742.4
12.5
389.3
Control
Uranium
±0.25%
±3.3%
±3.6%
± 10.4%
±5.0%
±6.5%
±7.9%
±2.1%
±6.6%
±4.9%
±6.4%
* Average ± two standard deviations
- 231 -

KAERI/RR-1999/99
Table 3.3-7
Comparison of koo Variation
Burnup (MWD/T)
.0
3.3
164.8
824.9
1650.1
2474.9
3299.5
4124.2
4948.9
5773.4
6598.0
7422.6
8247.4
9072.1
9896.7
10721.4
11546.1
12370.8
13195.7
14020.5
14845.4
Equilibrium
Fissile Content
Adjustment
1.15619
1.15204
1.14695
1.15393
1.14305
1.12997
1.11634
1.10247
1.08849
1.07448
1.06047
1.04649
1.03258
1.01878
1.00511
.99160
.97829
.96520
.95235
.93980
.92755
1.04616
±.01453*
±.01434
±.01191
±.00960
±.00894
±.00851
±.00813
±.00777
±.00742
±.00708
±.00676
±.00643
±.00613
±.00584
±.00555
±.00528
±.00502
±.00477
±.00453
±.00431
±.00410
± .00642
Reactivity Control
by SEU/DU
1.14614
1.14219
1.13945
1.14904
1.13858
1.12554
1.11187
1.09796
1.08396
1.06992
1.05592
1.04198
1.02814
1.01440
1.00084
.98745
.97426
.96132
.94862
.93623
.92414
1.04568
±.00231
±.00244
±.00279
±.00456
±.00530
±.00577
±.00620
±.00659
±.00696
±.00731
± .00762
±.00790
±.00815
±.00835
±.00850
± .00861
±.00868
±.00870
±.00866
±.00858
± .00845
±.00783
Reactivity
by Natural
1.12817
1.12431
1.12408
1.13392
1.12295
1.10940
1.09525
1.08091
1.06654
1.05220
1.03796
1.02384
1.00988
.99612
.98258
.96929
.95627
.94355
1.04596
Control
Uranium
±.00286
±.00302
±.00299
±.00553
±.00653
± .00714
±.00765
±.00811
±.00852
±.00890
±.00923
± .00951
±.00973
±.00990
±.01001
±.01006
±.01005
± .00998
±.00904
* Two standard deviations
- 232 -

KAERI7RR-1999/99
Table 3.3-8
Comparison of Thermal Absorption Cross-Section
1
Burnup (MWD/T)
.0
3.3
164.8
824.9
1650.1
2474.9
3299.5
4124.2
4948.9
5773.4
6598.0
7422.6
8247.4
9072.1
9896.7
10721.4
11546.1
12370.8
13195.7
14020.5
14845.4
Equilibrium
Fissile Content
Adjustment
.53647
.53712
.53599
.53015
.52591
.52185
.51783
.51382
.50985
.50590
.50199
.49813
.49431
.49056
.48687
.48325
.47972
.47628
.47294
.46970
.46658
.49804
± .00259*
±.00256
±.00226
±.00204
±.00207
±.00211
±.00216
±.00220
±.00224
±.00228
±.00231
±.00233
± .00235
± .00237
±.00238
±.00239
±.00239
±.00238
±.00238
±.00236
±.00234
± .00233
Reactivity Control
by SEU/DU
.54905
.54965
.54816
.54184
.53735
.53311
.52890
.52473
.52059
.51648
.51242
.50840
.50443
.50053
.49669
.49292
.48923
.48563
.48212
.47871
.47541
.50947
±.00679
±.00676
±.00682
±.00675
±.00681
±.00670
±.00698
±.00705
±.00711
±.00716
±.00720
±.00723
±.00724
±.00724
±.00723
±.00720
±.00716
±.00710
±.00702
±.00693
±.00682
± .00722
Reactivity
by Natural
.54778
.54839
.54639
.53972
.53502
.53058
.52620
.52187
.51759
.51335
.50918
.50507
.50103
.49706
.49319
.48940
.48571
.48213
.51152
Control
Uranium
±.01133
±.01129
±.01146
±.01132
±.01136
±.01143
± .01149
±.01153
±.01155
±.01156
±.01155
±.01152
±.01147
±.01140
±.01131
±.01121
±.01107
±.01092
±.01156
* Two standard deviations
- 233 -

KAERI/RR-1999/99
Table 3.3-9
Comparison of Neutron Production Cross-section (XlOO)
Burnup (MWD/T)
.0
3.3
164.8
824.9
1650.1
2474.9
3299.5
4124.2
4948.9
5773.4
6598.0
7422.6
8247.4
9072.1
9896.7
10721.4
11546.1
12370.8
13195.7
14020.5
14845.4
Equilibrium
Fissile Content
Adjustment
.78249
.78063
.77551
.77167
.75830
.74389
.72930
.71472
.70025
.68595
.67183
.65793
.64427
.63089
.61780
.60503
.59260
.58054
.56886
.55759
.54674
.65761
±.00507*
±.00501
± .00399
± .00295
± .00255
±.00226
±.00203
±.00184
±.00167
± .00155
±.00145
±.00139
±.00136
±.00135
±.00136
±.00138
±.00141
±.00143
±.00146
±.00148
±.00149
±.00139
Reactivity Control
by SEU/DU
.79785
.79599
.79187
.78922
.77555
.76062
.74547
.73035
.71536
.70054
.68594
.67159
.65751
.64373
.63027
.61713
.60435
.59195
.57993
.56833
.55715
.67540
±.01396
±.01396
±.01415
±.01529
±.01569
±.01590
±.01606
±.01619
±.01627
±.01632
±.01632
±.01629
±.01622
±.01611
±.01595
±.01576
±.01552
±.01524
±.01492
±.01455
±.01415
±.01630
Reactivity
by Natural
.78362
.78180
.77873
.77588
.76168
.74627
.73069
.71520
.69992
.68488
.67013
.65569
.64160
.62787
.61453
.60157
.58904
.57694
.67842
Control
Uranium
±.02199
±.02198
±.02215
±.02373
±.02413
±.02427
±.02430
± .02428
±.02420
± .02407
±.02388
±.02365
±.02336
±.02304
±.02264
±.02220
±.02171
±.02116
±.02399
* Two standard deviations
- 234 -

KAERI/RR-1999/99
300
1.12 1.14 1.16 1.18 1.20
300
250-
g 200-
8 ISO-
'S 100-
62 50-
Second Mixing
" . 1
1.12 1.14 1.16 1.18 1.20
XIE<s>
fd2
250-
200-
150-
100-
50-
0-
Third Mixing
•B
•
• • • •1.10 1.12 1.14 1.16 1.18 1.20
k-inf
Fig. 3.3-1 Distribution of k«> for Fissile Content Adjustment Option
- 235 -

KAERI/RR-1999/99
0 500 1000 1500 2000 2500 3000 3500
Assembly Number
Fig. 3.3-2 Distribution of k«> for Spent PWR Fuel
- 236 -

era
oo
g2,
No. of Assembly No. of Assembly No. of Assembly
I
H
x'(D
3 N
5

KAERI/RR-1999/99
3.4 DUPIC
WIMS-AECL
, «Kg-s.
DUPIC
DUPIC 37-g-
3.4.1
3.4.1.1
DUPIC
fe DUPIC 3.4-24J-
25-
. DUPIC
], DUPIC
3.4.1.2
-LH 3.4-2^ DUPIC
>. DUPIC
, DUPIC
3.4.1.3
CANDU
CANDU
- 238 -

KAERI/RR-1999/99
f ^ ^ } fi 3.4-4
DUPIC ^<^.3.6\) tfl# ^lU -§"8*1- $ # 2 f -§-3j
fe- S 3A-5O]}
3.4.2
WIMS-AECL
(Fresh Clean Fuel)
2 - 3
K DUPIC |
(Equilibrium Fuel)
3.4.2.1
- 239 -

KAERI/RR-1999/99
(resonance
escape probability)*!] <3*<M" u]*M, <>}$.
f «>-§- #^S>] ^ S f ^ < i ^ ^ ^ f 4 ^ - ^ 61^]- (thermal
reproduction factor)^] r)*\
HQ 3.4-3^
(poisoned) ^ ^ f l L f S 4 ^ i « } £ S # J i e } ^ tc|f,
3.4.2.2
fe oj
. DUPIC
-L5]vf, DUPIC
^ > } H ^ > ^ ^ f e I & ) fe <^ 140°C
- 240 -

KAERI/RR-1999/99
3.4.2.3 JL:zf
6\]
fet;)-. DUPIC 37-g-
MX-}
3.4.2.4
ZL^ 3.4-6 «>-§-J£*l
shutdown)^
shutdown)^
DUPIC
^fe 4f 12
- 241 -

KAERI/RR-1999/99
3.4.3
3.4.3.1 713E
JL
. DUPIC
Hl«H 7.3 mk7} 4 ^ :
37-g- m<&3.°\) «1«J 2.1 mk
9.6 mkti^l, <>lfe 37-g-
DUPIC ^
3.4.3.2
3.4-7^
O] ^ s f s ^ - B j , 7]
^ - 7 f e DUPIC ^l^S.ol] T=H«H Jicf
DUPIC ^<£S7l- ^ 4 ^ r 71 a «
Ufl^ofl, 37-g- ^ ^ -
3.4.3.3
DUPIC
71
- 242 -

KAERI/RR-1999/99
>. ZLQ 3.4-8
3.4.3.4
7)S
D2O H2O
713E
3.4-10<HJ
3.4.3.5
71S
. Helvf, CANDU-6 44
RFSP
71S 6.51
fl 0.89 mk
DUPIC
3.4.4
- 243 -

KAERI/RR-1999/99
7}
3.4.4.1 DUPIC
100%
3.4-11611 100% £ # e
, DUPIC
«1*H
DUPIC 71SE4I-S 7l^-7]
DUPIC
^ S . , DUPIC
3.4.4.2
CANDU-6 , WIMS-AECL
fe 3.71. 100% , 0.31
-0.45
WIMS-
- 244 -

KAERI/RR-1999/99
, WIMS-AECL e>o}tt.
3.4.5
^ 7|E}- «!-§-£ J L ^ # # 7 1 ^ * ^ © . ^ , o]Bj$> jL3ffe WIMS-AECL
3.4.5.1
fe 99.85 wt% (99.833 at%)o]nf ^ t^^) 0.15 wt%fe
) 3.7}
98.0-99.8 at%
17.5 mk/at%, ^g^Jn^ ^ ^ S ^ A - | f e 20.9 mk/at%3.
3.4.5.2
^^1 47] ofi -cHl
ofl H]s|| £ ^ * 1 4^1-. 3 . ^ 3.4-13^
-. 99.2-99.8 at% ^^6flA-| ^4*fl ^ £ T J ^ ^ . e l S ^ ^ - c - 0.36 mk/at%,
fe 0.46 mk/at%S
- 245 -

KAERI/RR-1999/99
Table 3.4-1
Comparison of Design Parameters for DUPIC and Natural Uranium Fuel
Parameters
Bundle Design
Element outside diameter (cm)
Average sheath wall thickness (cm)
Pellet outside diameter (cm)
Stack length (cm)
Fuel Material
Pellet density (g/cm3)235U content (wt%)239Pu content (wr%)
Fissile content (wt%)
Dy in center rod
Weight per Bundle (kg)
(U-Pu-X)
U
(U-Pu-X)O2
UO2
DUPIC
43-element
1.350 (large), 1.150 (small)
0.039 (large), 0.036 (small)
1.267 (large), 1.073 (small)
48.2
(U-Pu-X)O2, Spent PWR fuel
10.4
1.0
0.45
1.488
4.64
18.372
20.837
Natural Uranium
37-element
1.308
0.040
1.220
48.2
UO2
10.6
0.711
0.711
19.100
21.782
- 246 -

KAERI/RR-1999/99
Table 3.4-2
Lattice Parameters for DUPIC Fuel
Burnup
(MWd/T)
.02.5
123.71238.72477.03715.24953.36191.47429.68667.99906.1
11144.512382.813621.314859.916098.517337.318576.419815.620435.221055.021674.922294.722914.623534.624154.624774.625394.726014.926635.127255.427875.728496.029116.5
I*
2.3857E-012.3857E-012.3857E-012.3857E-012.3858E-012.3859E-012.3859E-012.3859E-012.3860E-012.3860E-012.3861E-012.3861E-012.3861E-012.3862E-012.3861E-012.3861E-012.3862E-012.3861E-012.3861E-012.3861E-012.3860E-012.3860E-012.3860E-012.3859E-012.3859E-012.3859E-012.3858E-012.3858E-012.3858E-012.3858E-012.3857E-012.3857E-012.3857E-012.3857E-01
Eta
3.6489E-013.6491E-013.6493E-013.6476E-013.6465E-013.6455E-013.6443E-013.6433E-013.6422E-013.6412E-013.6401E-013.6392E-013.6383E-013.6373E-013.6365E-013.6357E-013.6349E-013.6341E-013.6336E-013.6331E-013.6329E-013.6326E-013.6324E-013.6322E-0I3.6318E-013.6315E-013.6314E-013.6311E-013.6310E-013.6308E-013.6306E-013.6303E-013.6302E-013.6301E-01
2.1611E-032.1610E-032.1604E-032.1596E-032.1597E-032.1598E-032.1600E-032.1603E-032.1606E-032.1610E-032.1613E-032.1618E-032.1623E-032.1630E-032.1638E-032.1649E-032.1659E-032.1672E-032.1686E-032.1693E-032.1701E-032.1709E-032.1718E-032.1727E-032.1736E-032.1745E-032.1755E-032.1765E-032.1775E-032.1785E-032.1796E-032.1807E-032.1818E-032.1829E-03
5.3628E-035.3683E-035.3656E-035.2760E-035.2147E-035.1544E-035.0946E-035.0354E-034.9772E-034.9200E-034.8644E-034.8102E-034.7582E-034.7083E-034.6609E-034.6163E-034.5746E-034.5360E-034.5006E-034.4842E-034.4685E-034.4536E-034.4394E-034.4261E-034.4135E-034.4016E-034.3904E-034.3799E-034.3700E-034.3607E-034.3520E-034.3439E-034.3363E-034.3292E-03
Xn
7.8110E-037.7956E-037.7414E-037.6541E-037.4395E-037.2197E-037.0015E-036.7869E-036.5770E-036.3727E-036.1748E-035.9842E-035.8015E-035.6277E-035.4632E-035.3087E-035.1646E-035.0312E-034.9087E-034.8516E-034.7971E-034.7453E-034.6962E-034.6496E-034.6056E-034.5640E-034.5248E-034.4879E-034.4532E-034.4206E-034.3900E-034.3614E-034.3345E-034.3094E-03
IK
8.2904E-038.2904E-038.2905E-038.2886E-038.2860E-038.2834E-038.2809E-038.2785E-038.2760E-038.2737E-038.2714E-038.2692E-038.2670E-038.2649E-038.2628E-038.2606E-038.2585E-038.2564E-038.2543E-038.2533E-038.2522E-038.2512E-038.2501 E-038.2491E-038.2480E-038.2470E-038.2460E-038.2449E-038.2439E-038.2428E-038.2417E-038.2407E-038.2396E-038.2386E-03
H
.39320
.39242
.38964
.38446
.37284
.36100
.34926
.33771
.32642
.31543
.30478
.29454
.28473
.27539
.26657
.25829
.25058
.24345
.23692
.23387
.23097
.22822
.22561
.22313
.22080
.21859
.21652
.21457
.21273
.21101
.20940
.20789
.20648
.20516
- 247 -

KAERI/RR-1999/99
Table 3.4-3
Lattice Parameters for Natural Uranium Fuel
Burnup
(MWd/T)
.03.2
157.0791.1
1582.42372.53161.83950.44738.85526.96314.87102.77890.58678.39466.3
10254.211042.311830.412618.713407.014195.514984.015772.516561.217349.918138.618927.419716.320505.121294.122083.022871.923660.924449.8
, . ,
2.3905E-012.3905E-012.3904E-012.3905E-012.3907E-012.3908E-012.3910E-012.3911E-012.3912E-012.3913E-012.3914E-012.3915E-012.3915E-012.3916E-012.3916E-012.3917E-012.3917E-012.3918E-012.3918E-012.3918E-012.3919E-012.3919E-012.3919E-012.3919E-012.3919E-012.3920E-012.3920E-012.3920E-012.3919E-012.3920E-012.3920E-012.3921E-012.3919E-012.3919E-01
r-
3.6147E-013.6151E-013.6165E-013.6192E-013.6217E-013.6233E-013.6244E-013.6252E-013.6259E-013.6263E-013.6267E-013.6270E-013.6271E-013.6274E-013.6274E-013.6277E-013.6277E-013.6278E-013.6280E-013.6280E-013.6283E-013.6284E-013.6284E-013.6285E-013.6287E-013.6288E-013.6289E-013.6290E-013.6290E-013.6291E-013.6293E-013.6294E-013.6295E-013.6295E-01
Xal
1.6506E-031.6506E-031.6504E-031.6639E-031.6932E-031.7230E-031.7496E-031.7725E-031.7925E-031.8103E-031.8263E-031.8410E-031.8546E-031.8674E-031.8795E-031.8910E-031.9019E-031.9124E-031.9225E-031.9323E-031.9417E-031.9508E-031.9597E-031.9682E-031.9765E-031.9845E-031.9923E-031.9997E-032.0070E-032.0142E-032.0211E-032.0277E-032.0342E-032.0405E-03
3.5245E-033.5359E-033.6015E-033.7130E-033.8057E-033.8653E-033.9058E-033.9341 E-033.9543E-033.9689E-033.9798E-033.9883E-033.9954E-034.0014E-034.0068E-034.0120E-034.0172E-034.0224E-034.0279E-034.0337E-034.0398E-034.0461 E-034.0527E-034.0594E-034.0662E-034.0731 E-034.0800E-034.0868E-034.0936E-034.1003E-034.1069E-034.1133E-034.1196E-034.1257E-03
la
4.6937E-034.6811E-034.6105E-034.7831E-034.9171E-034.9782E-034.9970E-034.9889E-034.9639E-034.9279E-034.8854E-034.8396E-034.7933E-034.7469E-034.7019E-034.6591E-034.6192E-034.5823E-034.5487E-034.5185E-034.49I5E-034.4676E-034.4464E-034.4277E-034.4114E-034.3971E-034.3845E-034.3734E-034.3637E-034.3551E-034.3474E-034.3405E-034.3343E-034.3286E-03
SR
8.6383E-038.6383E-038.6381E-038.6270E-038.6023E-038.5771 E-038.5546E-038.5352E-038.5184E-038.5035E-038.4902E-038.4780E-038.4668E-038.4565E-038.4467E-038.4375E-038.4289E-038.4206E-038.4127E-038.4052E-038.3980E-038.3910E-038.3843E-038.3779E-038.3717E-038.3657E-038.3598E-038.3543E-038.3489E-038.3437E-038.3386E-038.3337E-038.3289E-038.3243E-03
H
.25094
.25025
.24582
.25086
.25401
.25427
.25290
.25056
.24766
.24443
.24107
.23771
.23445
.23130
.22833
.22556
.22302
.22069
.21858
.21670
.21503
.21355
.21225
.21110
.21010
.20921
.20844
.20777
.20717
.20665
.20618
.20577
.20540
.20506
- 248 -

KAERI/RR-1999/99
Table 3.4-4
Kinetic Parameters of DUPIC Fuel
Group
1
2
3
4
5
6
lP
A
Vl
V2
Fresh Condition*
(0 MWd/T)
B.000284
.001121
.000983
.002235
.000735
.000180
.005537
A
.000595
.031482
.121806
.317582
1.394136
3.759629
0.000513 sec
0.000453 sec
9.54 X106 cm/sec
2.88 X105 cm/sec
Equilibrium Condition
(7442 MWd/T)
0.000263
.001072
.000930
.002106
.000714
.000172
.005257
A
.000563
.031344
.123257
.320546
1.404731
3.729208
0.000553 sec
0.000539 sec
9.55 XI06 cm/sec
2.87 X105 cm/sec
* No boron in moderator
- 249 -

KAERI/RR-1999/99
Table 3.4-5
Kinetic Parameters of Natural Uranium Fuel
Group
1
2
3
4
5
6
lP
A
V]
V2
Fresh Condition*
(0 MWD/T)
B.000380
.001496
.001356
.003192
.001022
.000233
.007680
A
.000726
.031731
.117089
.312620
1.401893
3.910627
0.000826 sec
0.000757 sec
9.17X106 cm/sec
2.85 x 10s cm/sec
Equilibrium Condition
(3977 MWD/T)
0.000282
.001093
.000964
.002179
.000717
.000183
.005417
A
.000591
.031527
.122425
.317652
1.384846
3.758042
0.000731 sec
0.000712 sec
9.26 X106 cm/sec
2.85 x l 05 cm/sec
* No boron in moderator
- 250 -

KAERI/RR-1999/99
Table 3.4-6
Comparison of Void Reactivity
Fresh Clean Fuel
Equilibrium Fuel
DUPIC
9.284 mk
11.779 mk
Natural Uranium
16.584 mk
13.879 mk
- 251 -

KAERI/RR-1999/99
Table 3.4-7
Reactivity Feedback (mk) due to Power Level Change
Power
Level
(%)
130
120
110
100
90
80
70
60
50
DUPIC Fuel Core
TfUel
-0.29
-0.19
-0.10
0.0
0.10
0.19
0.27
0.37
0.45
Icool
1.11
0.57
0.20
0.0
-0.10
-0.18
-0.25
-0.34
-0.40
Pcool
-1.57
-1.16
-0.65
0.0
0.76
1.90
3.36
5.29
7.91
Natural Uranium Core
Tfuel
-0.11
-0.09
-0.04
0.0
0.06
0.12
0.17
0.25
0.31
Pcool
1.19
0.62
0.20
0.0
-0.11
-0.20
-0.27
-0.38
-0.45
Xenon
-0.94
-0.71
-0.39
0.0
0.45
1.13
2.01
3.35
5.17
- 252 -

KAERI/RR-1999/99
- Natural Uranium•DUPIC
0 2000 4000 6000 8000 10000 12000 14000
Bumup (MWD/T)
Fig. 3.4-1 Variation of *„, and kelf with Burnup (PPV+WIMS)
- 253 -

1.3
co
but
istr
Q
(U
oX
ive
at
a:
1.2 -
1.1 -
1.0 -
0.9 -
0.8 -
0.7 -
0.6 -
0.5 -
0.4 -
KAERL/RR-1999/99
OUTER
INTERMEDIATE
SCENTER
- Natural Uranium•DUPIC
2000 4000 6000 8000 10000 12000 14000
Burnup (MWD/T)
Fig. 3.4-2 Variation of Relative Element Linear Power with Burnup
- 254 -

KAERI/RR-1999/99
I
Ias
DC
10 20 40 50 60
Moderator Temperature (Xi)
70 80 90
Fig. 3.4-3 Reactivity Change due to Moderator Temperature (WIMS)
- 255 -

KAERI/RR-1999/99
-2 -
CD
-4 -O
USas
s. -6
- 8 -
Equilibrium - Natural Uranium- DUPIC
40 80 120 160 200 240
Coolant Temperature ( t ! )
280 320
Fig. 3.4-4 Reactivity Change due to Coolant Temperature (WIMS)
- 256 -

KAERI/RR-1999/99
1 0 -
8 -
6 -
t- 4 _a>O)
1 2 -o
ts8. -2-
- 4 -
- 6 -
i | • | * | i
\ ^
Fresh r-^N.
Equilibriurn ^ ^ . . . ' " - - ^~\^^
-
DUPIC
-
-
•
^ " \ ^ ^ -
200 400 600 800
Fuel Temperature CC)
1000 1200
Fig. 3.4-5 Reactivity Change due to Fuel Temperature (WIMS)
- 257 -

KAERI/RR-1999/99
100 200 300 400
Temperature (t;)
500 600 700
Fig. 3.4-6 Reactivity Change due to System Temperature Following a Reactor
Shutdown (WIMS)
- 258 -

KAERI/RR-1999/99
- Natural Uranium-DUPIC
0.000 0.125 0.250 0.375 0.500 0.625
Coolant Density (g/cc)
0.750 0.875
Fig. 3.4-7 Reactivity Increase due to Complete and Partial Voiding of Coolant
(WIMS)
- 259 -

KAERI/RR-1999/99
0 2000 4000 6000 8000 10000 12000 14000
Burnup (MWD/U)
Fig. 3.4-8 Variation of Coolant Void Reactivity with Fuel Burnup (WIMS)
- 260 -

KAERI/RR-1999/99
24-
2 2 -
2 0 -
-eas
o
i>
Rea
ctiv
void
Coo
lant
18
16
14
12
1 0 -
- Coolant Purity = 99.00 a/o- Coolant Purity = 97.23 a/o
Equilibrium Fuel
0.00 1.25 2.50 3.75 5.00 6.25 7.50
Moderator Boron Concentration (ppm)
8.75 10.00
Fig. 3.4-9 Dependence of Coolant Void Reactivity on Amount of Boron in Moderator
and Coolant Purity for DUPIC Fuel
- 261 -

KAERI/RR-1999/99
24
1 0 -
- Coolant Purity = 99.00 a/o- Coolant Purity = 97.23 a/o
0.00 1.25 2.50 3.75 5.00 6.25 7.50
Moderator Boron Concentration (ppm)
8.75 10.00
Fig. 3.4-10 Dependence of Coolant Void Reactivity on Amount of Boron in
Moderator and Coolant Purity for Natural Uranium Fuel (WIMS)
- 262 -

KAERI/RR-1999/99
t
1.0015
1.0010
1.0005
1.0000
WIMS-AECL/RFSP
50 60 70 80 90 100
Reactor Power
Natural Uranium >
110 120 130
Fig. 3.4-11 Comparison of Power Coefficients
- 263 -

KAERI/RR-1999/99
10
-10-
C03
o
101
8.
-30-
-50-
-60
Fresh
--"7Equilibrium
\Fresh
- Natural Uranium-DUPIC
98.00 98.25 98.50 98.75 99.00 99.25 99.50
Moderator Purity (atom percent)
99.75 100.00
Fig. 3.4-12 Reactivity Change due to Moderator D2O Purity (WIMS)
- 264 -

KAERI/RR-1999/99
(U
cto
O
8.
-0.5-
-1.0-
-1.597.6 98.0 98.4 98.8 99.2
Coolant Purity (atom percent)
99.6
Fig. 3.4-13 Reactivity Change due to Coolant D2O Purity (WIMS)
- 265 -

KAERI/RR-1999/99
3.5 719"
CANDU-6 ^^}S.<^lfe 3^~g- (Adjuster rods: ADS), ^ *] ^ ^ * ] (Zone controUer
unit: ZCU), £L*|-5. ^{*] 7)|J§- (Shutdown system: SDS), - I K ^ r (Mechanical control absorber:
^£ 47}*]
. (H^l 3.2-5
3.5.1
ZCU
(bulk control) (spatial control)
3.5.1.1
(AZL)
Sum of volumes of water in all compartmentsTotal volume of all compartments 1UU
100%
- 266 -

KAERI/RR-1999/99
4 5.76 mk 9| 3.22 inkS.
91 3.65 mkS
37-g-
100% 9| 50%<^ 4 4 6.50 mk
JE 3.5-12} & 3.5-2^- ^ 4 Hhg-5.7]- 7fl*H o]-g-S}
DUPIC n<&£. 9J
DUPIC 9J 3.5-2^ n}
top-to-bottom tilt(%) == (Pi + p3 + ps) ~ (P2 + Ps + PT)-h Jf 2 X ( 3 5 . 2 )
side-to-side tilt(%) = 100 (3.5-3)
3.5-3<H]
i = 1. 2, - ,
form factor^
DUPIC 9J
H]jZ«fl
JE-^-
3.5.1.2
RFSP
form factor7l-
(Spatial Oscillation)
600-FPDitJ
. DUPIC 9J
- 267 -

KAERI/RR-1999/99
J-14, S-3,
J-14
L-97>
S-3 Hi L-9
& DUPIC
, DUPIC
3.5.1.3
^AS.
14711
(mk), 4
- 268 -

KAERI/RR-1999/99
3.5-45+ fi 3.5-5< ) 7 ) 1 ^ # 3 ^ Tfl^ *£ # ^ * H r $& 7fl<M- 4 4 M"H|*B DUPIC
DUPIC
nl*>c}. ^ , DUPIC ^
7}
3.5.2
. o) %6\)x\±; DUPIC
shim
3.5.2.1
RFSP 3 H 5 ) A]
DUPIC 51 ^^-^-efe ^"€ i=--y^] tfl^H 4 4 10.2 mkif 16.6 mk^
DUPIC 91 ^ ^ 1 f f e 8 ^ ^ n flH fl<x) ^ 30^ ^ ]^# afi^ ^^- -f-^fe 6.8
3.4 mk W
DUPIC
3.5.2.2
- 269 -

KAERI/RR-1999/99
$ 50%5L
DUPIC «£ ££-T-BBr #*l ii-fcH cfl*H 4 4 S 3.5-6
3.5-7ofl
383 cm ^ 1 \ \ }
171 cm o H ^ I ^*11>^. S^> ^1^> ^2f, DUPIC
. ZL^xln>, DUPIC J ^ ^ i | ^^-^1 S^-g-51 ^o) b |
3.5.2.3
^ ^ ^ 50%«
^ i DUPIC ^ ^<a-fefe «?^1S ^ i i^^l cfl*H 4 4 S 3.5-83.5-9«Hl A^*>Sii:>. fi 3.5-8^ ^
^: 4
DUPIC
DUPIC ^ ^ ^ ^190^o] x]<&5\o\ 3 9 5 ^ ]
, DUPIC J^ ^ f
- 270 -

KAERI/RR-1999/99
DUPIC
$fe 90%
3.5.2.4 Poison-out
°) £4
DUPIC
50%
ufl
36.4*1 #
DUPIC
H ^ 3.5-5^1
DUPIC 3.5-102f
3.5-1H] DUPIC
3.5.2.5 «>-§-£ shim
7 ] ^ , CANDU
CANDU-6
mk/FPDo]i;|-. DUPIC
3.5-13^]
. DUPIC
4 4 0.40 mk/FPDAf 0.48
3.5-12^]
| ^ shim 47H5] 7J[SJ
- 271 -

KAERI/RR-1999/99
Shim
&JL 94%S - f r * ] ^ - . Shim
1.11 mkS
2.8
shim
(FPD)
4.0<H
, DUPIC
31*1
6> ZLelU, shim
3.5.2.6 # ^ ^»J (Stepback)
60%
DUPIC
3.5-145} a 3.5-15^] 4 4
DUPIC 84
70%
DUPIC
DUPIC
- 272 -

KAER1/RR-1999/99
3.5.3
CANDU-6
(MCA)©]
471151
DUPIC 8.36
2.99 mk7>
3.0
3.5-6^1
EL7\]
3.5.4
V. CANDU-6
- 273 -

KAERI/RR-1999/99
o}Jf- ^7K&el breakup assessment)^
A}JL(1OSS of coolant accident: LOCA)A| ^ n i z^*\ 3 ^ c|^-<^ ^
>. LOCAA] ^ 7 ] f e power pulse %•<& o|AfSf
71^^1*1 840
k W V t W ^^peaking)]
840 j / r (3-5-5)
20%
100%
3.5.4.1 ^g^j-g- ^8^ «hg-J£
£4
71 S3
3.5-16cHl M-B>LflSdc>. DUPIC
72.5 mk^Ic-il,
.7>7> 40.5
, 287fl ut 267H3] ^ ^ 1 ^ - ^ cfltl ^z\ «K§-£7fe 4 4 87 mki} 56 mk
£4
- 274 -

KAERI/RR-1999/99
'6 o
3.5-172]- ZL% 3.5-7^1
3.5.4.2
DUPIC
(reactor inlet header: R1H) 20%
*> s a * . ^ ,4% crept
0.00528S
28.3% ]<H1 HlSfl DUPIC
^ DUPIC
10.6% 335.
ZL1] 3.5-8^ 3.5-9^ 20%
power pulse7f DUPIC high log rate S
high log rate S H
- 275 -

KAERI/RR-1999/99
61 *> power pulsed ^ &£ 7\$ *}Q]7\ &-b 5 ^ S
DUPIC ii^<HH i-M*M itfl ofl ^ ^ ) n } * ! ^ DUPIC
RFSP 3.B.*\ CERBERUS 3L#ofl £|Sj} 7 ) 1 ^ u>^ 5]cfl 3j-g-^°1H*l-c- DUPIC
5} 3*^- 3257.1 kW • solJL, 7 l $ i ^ £ j -f- 3274.3 kW • &o\x%. oMy ^ 2.7} # ^ o | DUPIC5] ^g-f 745.8 kWo]jL 7]^% ^ - f 789.4
ig. o]A>S}~f e ] ^ / # ^ . S ^ 5 j -7117> DUPIC ^ - f 20.8 kg
21.7kgo]^, c } ^ ufl «>3J*y-*o* peaking factor7> DUPIC j
1.13H71 itjl-g-oll, ^ 2 f ^ ^ . S DUPIC I fuel breakup
*1*1, DUPIC i i ^ ^ n>xlol 7l^i^^ofl HlSfl 3t>^7]^o] 840
3.9% #
3.5.4.3
SDS25] ^ ^ ^ 7 ] - l - $}*t DUPIC
^ o ] SDS2^ ^•^3g7]- 7l^A>jLol ^^>S. Q^t (RIH) «J|^ 100%
37.8%^«^] Hl«H DUPIC
c>. SDSl^ ^-f^ l WlH nj-xtol 3 . o]-^-^ RIH 100% ^ - f blowdown rate7>
tc|-B> power pulse7> RIH 20% ^ - f 6\] ti^jj ^.*] ^-7>*>i^, o]oj| rc>B|-
£ RIH
ZLQ 3.5-103]- 3.5-11^- -T- i^of l tH*M ^^>S. ^ ^ - ^ nfl^ 100%
power pulse7l- DUPIC ±M°) ^ ^ ^7>*}<^ high log rate
< 0.95^
S high log rate S U ^ . S . ^^l£|o1 ^ 0.953:^
2.39# Ji&irt-L °M ijtll # ^ ^ ^ *}$, *1*1 power pulsed ^
- 276 -

KAERI/RR-1999/99
, 7]Bf
o}
DUPICS]
. ^ CERBERUS
2276.2 kW
850.7
peaking factor^ ^ } o | S <&%%, DUPIC5|
^ ^ # n l ^ , ^ 3 ] - ^ A 5 . DUPIC
840 J/g^- 7 l ^ A 5 . 5.8%
DUPIC
Sj*1|
2138.8
713.8
^-71]
DUPIC
24.4%,
3.5.5
( I 3 5Xe, I0SRh, I 13Cd, I 4 9Sm, I 5 1Sm
29
40%!-
7] 135Xe
0o]
4-f
70%#,
135 80 mkS
- 277 -
KAERI/RR-1999/99
35A) # 28
. CANDU-6
3.5.5.1
3.5-12^ 4
, DUPIC
20, 40, 60, 80, 100%
37-g-
37-g-
ioo%
37%
3.5.5.2
DUPIC
20, 40, 60, 80, 100%
3.5-13^
100%
3%
irfl
3.5.5.3
ZL^ 3.5-14 100% 80, 60, 40, 20, 0%S
- 278 -

KAERI/RR-1999/99
37-g-
37-g-
DUPIC
37% ^ ^
3.5.5.4 3 0 ^
CANDU-6
DUPIC
7mkc| ^
DUPIC
& 6.8
10.2
3.5.6
<§»oK§- Stfe ^ ^ ^ .
37],
51*11
DUPIC CANDU-6
3.5.6.1
- 279 -

KAERI/RR-1999/99
5f S.B. (higher harmonic modes)
CANDU
*\] 7}?]
*iSL?\7)
50%
5, 6, 7, 12, 13, 14, 19, 20,
(3.5-2)^-
front-to-back tilt (%) =P- —
x 100 (3.5-6)
45.4%^
3]
3.5-15ofl
170
44.5%^ 120
] - ^ ^ , DUPIC i - ^
37%
170 u}E}^r:}.
6l*H DUPIC 9J Sfe
. DUPIC
, DUPIC
- 280 -
KAERI/RR-1999/99
3.5.6.2
(damping factor) (threshold power)
fe DUPIC Hla.*]-7]
4
7>. ^-^- t[^f (Damping Factor)
(3.5-7)
(phase)
(3.5-8)
±= q (3.5-7)
- 281 -

KAERI/RR-1999/99
45% _ L 7 6 7
X10"2
37% ^J 79% . ^ , DUPIC
DUPIC
a 3.5-i8oH^
(Threshold Power)
# - 4 #
DUPIC
20% ^
10%
3.5-19
DUPIC
DUPIC
DUPIC
. DUPIC
cf
4
Uj-i}
- 282 -

KAERI/RR-1999/99
form factor# «]3.*H
j£ 3.5-20<Hl
fonn factor^
CANDU-6
>€ DUPIC
4 4 ^.H 3.5-21, 3.5-22
3.5.7
DUPIC
CANDU-6
! •§•
^- DUPIC
01 cf.
- DUPIC
poison-out 4
shim
60%
DUPIC
- 283 -

KAERI/RR-1999/99
, DUPIC i i ^ ^ ^lfe -f-^7} 37^-
. DUPIC
DUPIC ^ ^ ] j # ^
DUPIC fl
- 284 -

KAERI/RR-1999/99
Table 3.5-1
Reactivity Worth and Power Tilt vs. ZCU Level for DUPIC Core
• Average
Zone
Controller
Level
(%)
25
50
75
100
Reactivity
Worth
(mk)
1.626
3.222
4.657
5.761
Number of tfeO filled LP* divided by total number
of LP in ZCU compartment
Centre
Rod
Upper
1.875/7.5
3.750/7.5
5.625/7.5
7.500/7.5
Centre
Rod
Middle
1.75/7
3.50/7
5.25/7
7.00/7
Centre
Rod
Lower
1.75/7
3.50/7
5.25/7
7.00/7
Side
Rod
Upper
2.125/8.5
4.250/8.5
6.375/8.5
8.500/8.5
Side
Rod
Lower
2/8
4/8
6/8
8/8
Power Tilt
(top-to-
bottom)
1.00442
1.01121
0.96301
0.90049
*LP = Lattice Pitch
- 285 -

KAERI/RR-1999/99
Table 3.5-2
Reactivity Worth and Power Tilt vs. ZCU Level for Natural Uranium Core
Average
Zone
Controller
Level
(%)
25
50
75
100
Reactivity
Worth
(ink)
1.836
3.647
5.245
6.499
Number of H2O filled LP* divided by total number
of LP in ZCU compartment
Centre
Rod
Upper
1.875/7.5
3.750/7.5
5.625/7.5
7.500/7.5
Centre
Rod
Middle
1.75/7
3.50/7
5.25/7
7.00/7
Centre
Rod
Lower
1.75/7
3.50/7
5.25/7
7.00/7
Side
Rod
Upper
2.125/8.5
4.250/8.5
6.375/8.5
8.500/8.5
Side
Rod
Lower
2/8
4/8
6/8
8/8
Power Tilt
(top-to-
bottom)
1.00244
1.01566
0.98008
0.92736
*LP = Lattice Pitch
- 286 -

KAERI/RR-1999/99
Table 3.5-3
Comparison of Form Factor vs. ZCU Level
Average Zone
Controller
Level (%)
0
25
50
75
100
DUPIC Core
Radial Form
Factor
0.8173
0.8342
0.8385
0.8343
0.8006
Overall Form
Factor
0.5955
0.6004
0.6000
0.6039
0.5990
37-element NU Core
Radial Form
Factor
0.8022
0.8190
0.8242
0.8251
0.7996
Overall Form
Factor
0.5673
0.5702
0.5638
0.5491
0.5252
- 287 -

KAERI/RR-1999/99
Table 3.5-4
Power Perturbation Coefficients in DUPIC Core
*
1
2
3
4
5
6
7
8
9
10
11
12
13
14
Regional power % change per 1 mk perturbation of ZCU
1
41.06
7.20
9.09
2.38
-6.37
-7.15
-11.41
3.90
-3.81
-3.22
-7.28
-11.39
-11.53
-13.78
2
12.80
45.60
-5.67
3.25
9.04
-10.20
-6.25
-1.82
5.19
-10.72
-6.85
-2.95
-13.78
-10.60
3
9.66
-6.79
36.41
4.63
-9.15
9.04
-7.11
-3.99
-11.23
2.66
-7.24
-13.69
-3.84
-11.16
4
5.58
4.22
4.48
22.13
4.19
5.63
4.17
-6.94
-7.24
-7.37
-6.32
-7.53
-7.22
-7.19
5
-4.74
14.38
-8.45
6.47
38.47
-4.36
15.12
-9.74
-1.96
-12.88
-6.57
3.56
-10.38
-1.95
6
-7.20
-11.11
8.81
2.55
-6.18
41.22
7.28
-11.11
-13.80
-3.04
-7.11
-11.29
4.61
-3.57
7
-10.53
-6.23
-5.91
3.35
9.53
12.76
45.74
-13.06
-10.62
-10.78
-6.84
-2.98
-2.01
5.16
8
4.48
-3.73
-3.12
-6.90
-10.79
-11.37
-14.63
40.31
6.83
9.18
2.71
-6.64
-7.34
-10.80
9
-2.00
5.23
-10.26
-6.63
-3.09
-13.48
-11.12
12.45
44.31
-6.20
3.51
9.97
-10.75
-6.13
10
-3.86
-11.59
2.37
-6.91
-13.01
-3.96
-11.89
8.83
-6.93
37.83
4.86
-9.87
9.78
-6.68
11
-7.21
-7.49
-7.11
-6.07
-7.29
-7.13
-7.58
5.52
3.87
4.64
22.66
4.29
5.58
3.95
12
-10.28
-2.07
-12.22
-6.28
3.14
-10.07
-1.92
-4.27
14.44
-9.01
6.72
40.27
-4.90
13.91
13
-11.47
-14.22
-3.18
-6.95
-10.85
4.20
-3.92
-7.04
-11.01
9.68
2.69
-6.82
41.66
6.83
14
-13.72
-10.98
-10.32
-6.55
-2.95
-1.81
5.57
-10.03
-6.17
-6.02
3.56
9.59
12.95
44.64
* Perturbed zone number
- 288 -

KAERI/RR-1999/99
Table 3.5-5
Thermal Flux Perturbation Coefficients in DUPIC Core
*
1
2
3
4
5
6
7
8
9
10
11
12
13
14
Detector flux level % change per 1 mk perturbation of ZCU
1
69.17
8.61
11.43
6.01
-5.51
-5.75
-10.19
-1.24
-6.31
-5,94
-9.07
-12.37
-12.32
-14.24
2
15.54
69.17
-4.23
7.12
10.86
-8.94
-4.9
-4.8
-0.58
-11.62
-8.77
-5.97
-14.23
-11.62
3
11.02
-6.11
63.15
7.59
-8.47
10.47
-6.38
-6.45
-12.24
-1.84
-9.17
-14.51
-6.36
-12.15
4
7.17
3.69
9.33
39.96
4.12
7.15
3.67
-8.57
-9.42
-8.51
-8.84
-9.92
-8.86
-9.33
5
-3.72
15.75
-7.14
10.1
64.09
-3.37
16.43
-10.84
-5.04
-13.59
-8.69
-1.36
-11.53
-5
6
-5.73
-9.93
11.29
6.3
-4.92
69.91
8.69
-11.88
-14.24
-5.83
-8.96
-12.27
-0.83
-6.12
7
-9.29
-4.95
-4.47
7.21
11.23
15.51
68.42
-13.49
-11.6
-11.67
-8.74
-5.91
-4.99
-0.47
8
-0.93
-6.44
-5.82
-8.65
-11.77
-12.19
-15.17
68.6
8.12
11.75
6.61
-5.38
-5.9
-9.7
9
-4.98
-0.56
-11.12
-8.41
-5.89
-13.98
-12.21
15.17
66.57
-4.71
7.53
11.74
-9.51
-4.93
10
-6.38
-12.65
-1.97
-8.79
-13.87
-6.43
-12.99
10.24
-6.23
65.3
7.97
-9.22
11.13
-6.08
11
-8.86
-9.74
-8.22
-8.53
-9.6
-8.79
-9.89
7.01
3.33
9.68
40.82
4.17
7.18
3.36
12
-11.45
-5.24
-12.91
-8.31
-1.59
-11.24
-5.14
-3.33
15.64
-7.65
10.51
66.93
-3.9
15.18
13
-12.29
-14.72
-5.79
-8.68
-11.82
-1.04
-6.54
-5.68
-9.92
12.11
6.5
-5.56
70.18
8.12
14
-14.21
-12.04
-11.18
-8.38
-5.86
-4.84
-0.39
-8.82
-4.92
-4.49
7.63
11.46
15.74
67.75
* Perturbed zone number
- 289 -
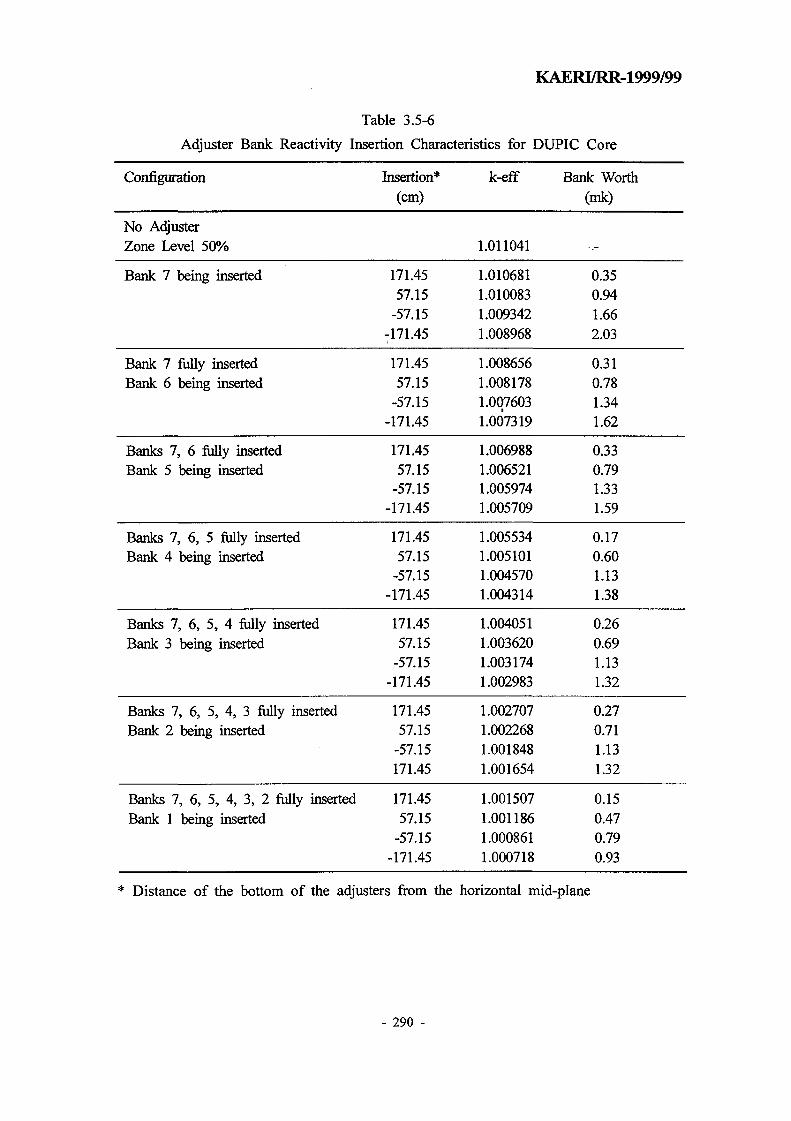
KAERI/RR-1999/99
Table 3.5-6
Adjuster Bank Reactivity Insertion Characteristics for DUPIC Core
Configuration
No AdjusterZone Level 50%
Bank 7 being inserted
Bank 7 fully insertedBank 6 being inserted
Banks 7, 6 fully insertedBank 5 being inserted
Banks 7, 6, 5 fully insertedBank 4 being inserted
Banks 1, 6, 5, 4 fully insertedBank 3 being inserted
Banks 7, 6, 5, 4, 3 fully insertedBank 2 being inserted
Banks 7, 6, 5, 4, 3, 2 fully insertedBank 1 being inserted
Insertion*(cm)
171.4557.15
-57.15-171.45
171.4557.15
-57.15-171.45
171.4557.15
-57.15-171.45
171.4557.15
-57.15-171.45
171.4557.15
-57.15-171.45
171.4557.15
-57.15171.45
171.4557.15
-57.15-171.45
k-eff
1.011041
1.0106811.0100831.0093421.008968
1.0086561.0081781.0076031.007319
1.0069881.0065211.0059741.005709
1.0055341.0051011.0045701.004314
1.0040511.0036201.0031741.002983
1.0027071.0022681.0018481.001654
1.0015071.0011861.0008611.000718
Bank Worth(mk)
0.350.941.662.03
0.310.781.341.62
0.330.791.331.59
0.170.601.131.38
0.260.691.131.32
0.270.711.131.32
0.150.470.790.93
* Distance of the bottom of the adjusters from the horizontal mid-plane
- 290 -

KAERI/RR-1999/99
Table 3.5-7
Adjuster Bank Reactivity Insertion Characteristics for Natural Uranium Core
Configuration
No AdjusterZone Level 50%
Bank 7 being inserted
Bank 7 fully insertedBank 6 being inserted
Banks 7, 6 fully insertedBanks 5 being inserted
Banks 7, 6, 5 fully insertedBank 4 being inserted
Banks 7, 6, 5, 4 fully insertedBank 3 being inserted
Banks 7, 6, 5, 4, 3 fully insertedBank 2 being inserted
Banks 7, 6, 5, 4, 3, 2 fully insertedBank 1 being inserted
Insertion*(cm)
171.4557.15
-57.15-171.45
171.4557.15
-57.15-171.45
171.4557.15
-57.15-171.45
171.4557.15
-57.15-171.45
171.4557.15
-57.15-171.45
171.4557.15
-57.15-171.45
171.4557.15
-57.15-171.45
k-eff
1.01815
1.017681.016691.015311.01457
1.014191.013461.012521.01202
1.011621.010901.009991.00951
1.009271.008611.007631.00707
1.006721.006071.005311.00492
1.004551.003911.003151.00278
1.002571.002081.001491.00118
Bank Worth(mk)
-
0.451.402.743.46
0.381.082.002.48
0.391.101.992.46
0.230.881.852.40
0.340.981.732.12
0.371.001.752.12
0.210.701.291.60
* Distance of the bottom of the adjusters from the horizontal mid-plane
- 291 -
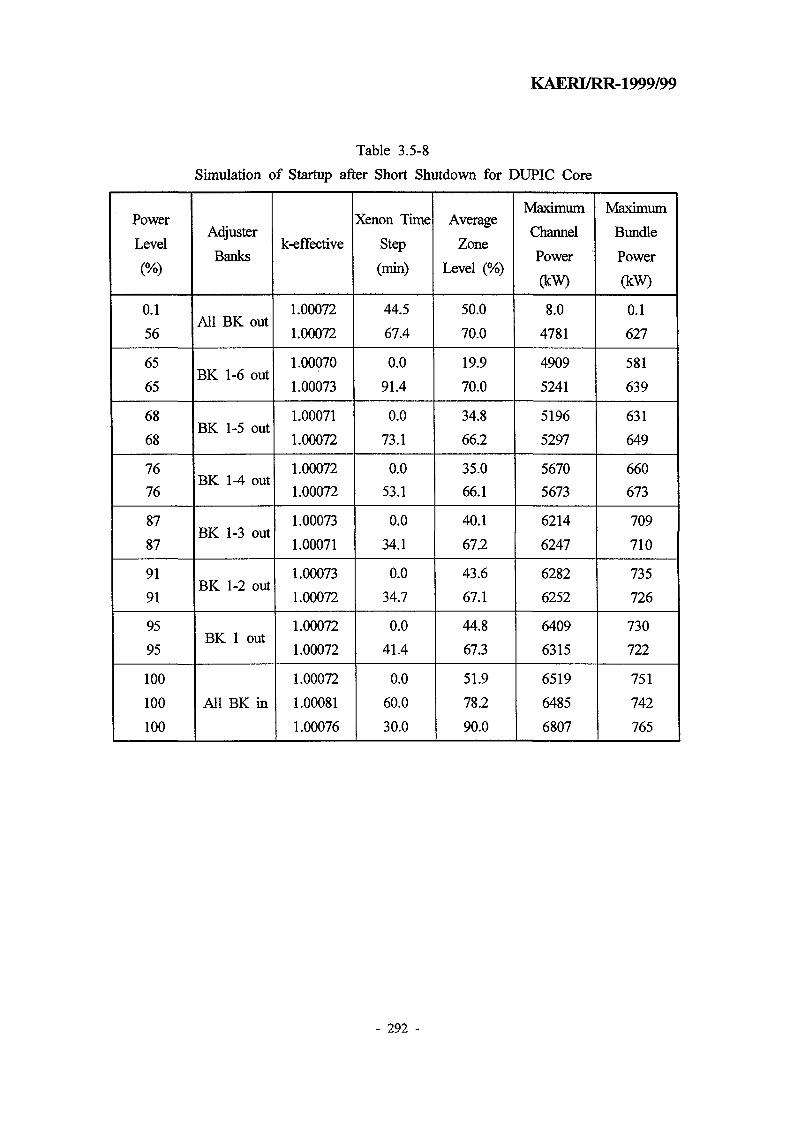
KAERI/RR-1999/99
Table 3.5-8
Simulation of Startup after Short Shutdown for DUPIC Core
Power
Level
(%)
0.1
56
65
65
68
68
76
76
87
87
91
91
95
95
100
100
100
Adjuster
Banks
All BK out
BK 1-6 out
BK 1-5 out
BK 1-4 out
BK 1-3 out
BK 1-2 out
BK 1 out
All BK in
k-effective
1.00072
1.00072
1.00070
1.00073
1.00071
1.00072
1.00072
1.00072
1.00073
1.00071
1.00073
1.00072
1.00072
1.00072
1.00072
1.00081
1.00076
Xenon Time
Step
(min)
44.5
67.4
0.0
91.4
0.0
73.1
0.0
53.1
0.0
34.1
0.0
34.7
0.0
41.4
0.0
60.0
30.0
Average
Zone
Level (%)
50.0
70.0
19.9
70.0
34.8
66.2
35.0
66.1
40.1
67.2
43.6
67.1
44.8
67.3
51.9
78.2
90.0
Maximum
Channel
Power
(kW)
8.0
4781
4909
5241
5196
5297
5670
5673
6214
6247
6282
6252
6409
6315
6519
6485
6807
Maximum
Bundle
Power
(kW)
0.1
627
581
639
631
649
660
673
709
710
735
726
730
722
751
742
765
- 292 -

KAERI/RR-1999/99
Table 3.5-9
Simulation of Startup after Short Shutdown for Natural Uranium Core
Power
Level
0.1
56
65
65
ON
O
N00
00
76
76
87
87
91
91
95
95
100
100
100
100
Adjuster
Banks
All BK out
BK 1-6 out
BK 1-5 out
BK 1-4 out
BK 1-3 out
BK 1-2 out
BK 1 out
All BK in
k-effective
1.00118
1.00118
1.00117
1.00119
1.00115
1.00120
1.00116
1.00117
1.00120
1.00120
1.00118
1.00118
1.00118
1.00119
1.00120
1.00119
1.00119
1.00119
Xenon Time
Step
(min)
36.1
8.2
0.0
32.6
0.0
30.2
0.0
28.8
0.0
26.0
0.0
30.2
0.0
47.6
0.0
90.0
90.0
90.0
Average
Zone
Level (%)
50.0
62.9
9.0
69.4
24.0
66.3
23.7
65.1
26.2
66.2
32.8
66.7
34.2
66.8
43.1
75.3
78.9
76.5
Maximum
Channel
Power
(kW)
0.9
4845
5176
5546
5371
5625
6130
6082
6534
6643
6567
6559
6633
6498
6679
6538
6549
6563
Maximum
Bundle
Power
(kW)
0.1
698
663
764
713
783
796
836
853
896
856
873
825
823
822
829
831
821
- 293 -

KAERI/RR-1999/99
Table 3.5-10
Simulation of Startup after Poison-out Shutdown for DUPIC Core
Power
Level
0.1
0.1
0.1
0.1
56
65
65
68
68
76
76
87
87
91
91
95
95
Adjuster
Banks
All BK in
All BK out
BK 7 in
BK 6,7 in
BK 5-7 in
BK 4-7 in
BK 3-7 in
BK 2-7 in
k-effective
0.95316
0.96611
0.98726
1.00072
1.00072
1.00072
1.00073
1.00072
1.00072
1.00071
1.00071
1.00071
1.00071
1.00072
1.00072
1.00073
1.00072
Xenon Time
Step
(min)
540.0
540.0
540.0
125.4
4.2
0.0
7.7
0.0
6.4
0.0
6.1
0.0
5.0
0.0
5.0
0.0
5.2
Average
Zone
Level (%)
50.0
50.0
50.0
50.0
69.9
34.7
69.9
42.0
68.4
42.9
68.3
47.2
68.0
47.7
68.2
47.8
69.4
Maximum
Channel
Power
(kW)
6
6
6
4
4296
4623
4755
4778
4865
5274
5302
5835
5883
5990
5976
6222
6159
Maximum
Bundle
Power
(kW)
0.7
0.7
0.7
0.5
529
521
545
548
562
581
588
653
651
683
673
693
690
- 294 -

KAERI/RR-1999/99
Table 3.5-11
Simulation of Startup after Poison-out Shutdown for Natural Uranium Core
Power
Level
0.1
0.1
0.1
0.1
56
65
65
ON
O
N00
00
16
16
87
87
91
91
95
95
Adjuster
Banks
All BK in
All BK out
BK 7 in
BK 6,7 in
BK 5-7 in
BK 4-7 in
BK 3-7 in
BK 2-7 in
k-effective
0.91359
0.93595
0.96968
1.00119
1.00119
1.00118
1.00119
1.00118
1.00119
1.00119
1.00117
1.00118
1.00118
1.00117
1.00117
1.00118
1.00117
Xenon Time
Step
(min)
600.0
600.0
600.0
382.5
1.9
0.0
5.6
0.0
4.5
0.0
4.4
0.0
4.1
0.0
4.0
0.0
4.3
Average
Zone
Level (%)
50.0
50.0
50.0
50.0
69.6
22.9
70.8
33.9
68.8
34.5
67.8
37.9
68.1
40.2
67.9
40.1
68.1
Maximum
Channel
Power
(kW)
6
6
6
8
4637
4848
5076
5019
5160
5541
5599
6090
6184
6183
6223
6367
6342
Maximum
Bundle
Power
(kW)
0.7
0.7
0.7
1
689
589
643
620
651
679
710
713
751
748
760
732
745
- 295 -

KAERI/RR-1999/99
Table 3.5-12
Simulation of Adjuster Shim Operation for DUPIC Core
Power
Level
(%)
100
94
94
94
87
87
87
82
82
82
79
79
79
68
68
68
61
61
52
52
Adjuster
Banks
All BK in
BK 1 out
BK 1,2 out
BK 1-3 out
BK 1-4 out
BK 1-5 out
BK 1-6 out
All BK out
k-effective
1.00263
1.00264
1.00265
1.00376
1.00376
1.00376
1.00536
1.00535
1.00535
1.00692
1.00692
1.00693
1.00834
1.00833
1.00833
1.01054
1.01053
1.01261
1.01262
1.01525
Xenon Time
Step
(hrs)
steady state
0.0
4.0
steady state
0.0
4.0
steady state
0.0
4.0
steady state
0.0
4.0
steady state
0.0
4.0
steady state
0.0
steady state
0.0
steady state
Average
Zone
Level (%)
20.1
34.2
20.8
20.2
40.3
24.1
20.0
40.7
29.2
20.2
40.3
34.9
20.8
45.6
14.0
20.0
46.7
19.6
55.4
20.1
Maximum
Channel
Power
(kW)
6495
6224
6198
6180
5840
5830
5794
5653
5649
5606
5645
5669
5614
4961
4895
4854
4551
4443
4048
3924
Maximum
Bundle
Power
(kW)
754
700
697
699
683
684
679
644
646
642
634
641
631
577
576
561
520
504
492
467
- 296 -

KAERI/RR-1999/99
Table 3.5-13
Simulation of Adjuster Shim Operation for Natural Uranium Core
Power
Level
(%)
100
94
94
94
87
87
87
82
82
82
79
79
79
68
68
68
61
61
52
52
Adjuster
Banks
All BKin
BK 1 out
BK 1,2 out
BK 1-3 out
BK 1-4 out
BK 1-5 out
BK 1-6 out
All RK" r>ntA l l J3IS. OUI
k-effective
1.00328
1.00327
1.00328
1.00498
1.00497
1.00497
1.00721
1.00723
1.00721
1.00950
1.00952
1.00951
1.01199
1.01202
1.01204
1.01484
1.01482
1.01760
1.01762
1.02108
Xenon Time
Step
(hrs)
steady state
0.0
4.0
steady state
0.0
4.0
steady state
0.0
4.0
steady state
0.0
4.0
steady state
0.0
4.0
steady state
0.0
steady state
0.0
steady state
Average
Zone
Level (%)
21.0
42.4
29.3
20.8
49.5
33.9
21.2
50.3
40.1
20.5
53.4
50.3
18.9
54.8
20.3
17.7
57.6
15.9
76.3
20.8
Maximum
Channel
Power
(kW)
6594
6386
6377
6334
6018
6027
5979
5907
5919
5822
5980
6037
5919
5277
5205
5135
4874
4719
4506
4309
Maximum
Bundle
Power
(kW)
787
766
761
753
756
763
746
735
744
708
793
814
769
702
688
677
651
619
662
619
- 297 -

KAERI/RR-1999/99
Table 3.5-14
Simulation of Stepback to 60% Full Power for DUPIC Core
Adjuster
Bank
Position
All BK in
BK 1 out
BK 1,2 out
BK 1-3 out
BK 1-4 out
BK 1-3 out
BK 1,2 out
BK 1 out
All BK in
k-effective
1.00072
1.00072
1.00072
1.00071
1.00071
1.00072
1.00072
1.00072
1.00072
1.00073
1.00072
1.00073
1.00072
1.00072
1.00072
1.00073
Xenon Time
Step
(min)
22.0
0.0
12.3
0.0
21.3
0.0
27.9
0.0
600.0
0.0
79.3
0.0
227.9
0.0
316.9
0.0
Average Zone
Level
(%)
20.0
34.0
20.0
40.0
19.6
39.8
19.7
39.9
67.0
42.8
67.7
46.1
68.1
47.8
69.6
54.9
Maximum
Channel
Power
(kW)
3884
3963
3953
4016
3987
4122
4103
4295
4364
4196
4179
4044
3997
3979
3924
3847
Maximum
Bundle
Power
(kW)
451
446
452
468
467
469
470
483
506
All
All
All
458
449
446
454
- 298 -

KAERI/RR-1999/99
Table 3.5-15
Simulation of Stepback to 60% Full Power for Natural Uranium Core
Adjuster Bank
Position
All BKin
BK 1 out
BK 1,2 out
BK 1-3 out
BK 1-4 out
BK 1-3 out
BK 1,2 out
BK 1 out
All BK in
k-effective
1.00118
1.00117
1.00118
1.00118
1.00118
1.00118
1.00121
1.00119
1.00118
1.00118
1.00118
1.00117
1.00118
1.00119
1.00118
1.00117
Xenon Time
Step
(min)
12.9
0.0
11.0
0.0
19.1
0.0
29.6
0.0
360.0
0.0
216.0
0.0
325.8
0.0
523.2
0.0
Average Zone
Level
(%)
20.1
40.9
19.6
47.9
19.3
47.8
19.0
51.4
71.9
32.3
64.8
33.6
68.9
38.8
68.5
46.6
Maximum
Channel
Power
(kW)
3942
4064
4031
4136
4122
4312
4303
4572
4706
4429
4399
4184
4129
4059
4036
3926
Maximum
Bundle
Power
(kW)
467
484
475
516
512
533
522
601
650
567
566
527
521
485
493
475
- 299 -

KAERI/RR-1999/99
Table 3.5-16
Comparison of SOR Static Reactivity Worth
Case
Reference
(All ADJs in)
28 SORs
Inserted
26 SORs
Inserted
DUPIC Core
keff
1.000720
0.933067
0.961706
Radial
Form
Factor
0.8392
0.6593
0.2369
Overall
Form
Factor
0.6004
0.3426
0.0758
Worth
(mk)
-72.5
-40.5
Natural Uranium Core
keff
1.001014
0.920887
0.947409
Radial
Form
Factor
0.8219
0.6614
0.2729
Overall
Form
Factor
0.5579
0.5055
0.0966
Worth
(mk)
-86.9
-56.5
- 300 -

KAERI/RR-1999/99
Table 3.5-17
Comparison of SOR Insertion Characteristics
Position of
SOR
Outside
Reactor
+ 9 LP *
+ 5 LP
+ 1 LP
- 5 LP
- 7 LP
- 9 LP
DUPIC Core
keff
1.000720
1.000446
0.998254
0.994759
0.976688
0.956873
0.933079
Radial
Form
Factor
0.839
0.724
0.552
0.410
0.228
0.205
0.659
Overall
Form
Factor
0.600
0.533
0.410
0.294
0.150
0.138
0.342
Worth
(mk)
-0.3
-2.5
-6.0
-24.6
-45.8
-72.4
37-Element Nu Core
keff
1.001014
0.999670
0.996988
0.992792
0.971202
0.948245
0.920877
Radial
Form
Factor
0.822
0.726
0.554
0.412
0.227
0.208
0.661
Overall
Form
Factor
0.558
0.482
0.366
0.267
0.142
0.134
0.505
Worth
(mk)
-1.3
-4.0
-8.3
-30.7
-55.6
-86.9
* +9/-9 LP means that the bottom of the shutoff rod is 10 lattice pitches
above/below the centre line
- 301 -

KAERI/RR-1999/99
Table 3.5-18
Damping Factors for Xenon Oscillation
Oscillation Type
Top-to-Bottom
Side-to-Side
Front-to-Back
DUPIC Core
-1.767X10"2
-1.594X10"2
-2.517 X10"2
Natural Uranium
-3.244 X10"2
-2.635 X10"2
-1.198X10-'
- 302 -

KAERI/RR-1999/99
Table 3.5-19
Damping Factors of DUPIC Fuel Core for Different Power Levels
Power Level (%)
100
80
60
40
20
10
Damping Factor* (h/1)
-1.767X10"2
-2.336 X10"2
-3.085 X10"2
-4.391 X 10"2
-1.212 X10'2
-
* Top-to-bottom oscillation
- 303 -

KAERI/RR-1999/99
Table 3.5-20
Damping Factors of DUPIC Fuel Core for Various Refueling Schemes
Fueling Scheme
2-Bundle Shift
4-Bundle Shift
6-Bundle Shift*
8-Bundle Shift*
Axial Form Facror
0.716
0.695
0.557
0.540
Damping Factor (hr"1)
-1.767X10"2
-4.121 X10"2
-
-
* Actually 6- and 8-bundle shift refueling schemes are not practicable for DUPIC
core.
- 304 -

KAERI/RR-1999/99
— 5
s
DUPIC
3 7 - E l e m e n t NU
20 40 60 80
A v e r a g e Z o n e C o n t r o l l e r L e v e l (%)
1 00
Fig. 3.5-1 Comparison of ZCU Static Reactivity Worth
- 305 -

KAERI/RR-1999/99
6 8Time (hr)
DUPIC Core
Top-To-Bottom
Side-To-Side
Front-To-Back
Natural Uranium-
Core
10 12 14
Fig. 3.5-2 Power Tilts after Refueling Transient
- 306 -

KAERI/RR-1999/99
18
16
14
3T£ 12
co
Ic
10
3 7 - E l e m e n t N a t u r a l U r a n i u m F u e l C o r e ,I n c r e a s e o f X e n o n L o a d 30 M i n u t e sa f t e r s h u t d o w n = 1 3 . 5 1 7 m k
D U P I C c o r e ,I n c r e a s e o f X e n o n L o a d 30 M i n u t e sa f t e r s h u t d o w n = 6 . 8 0 3 m k
9 12 15 18 . 21 24 27
Tim e A f t e r S h u t d o w n ( m i n )
30 33 36
Fig. 3.5-3 Comparison of Xenon Load at 30-min after Shutdown
- 307 -

KAERI/RR-1999/99
2 3.0
o 2.0
5 1.5m 10
o.s
—•—37-BementNU
Bank #7 Being Inserted , / #
/ • • • * " "
25
20
1.5
1.0
Q5
0.0
Bank#3 Being Inserted
Bank#4,5,6,7Areadylnserted
.-••. - •
400 300 200 100 -10D -200 -300
3.0
2.S
2.0
1.5
1.0
0.5
Bank #6 Being InsettedBank #7 Already Inserted
400 300 200 100 0 -100 -200 -300400 303 200 100 -100 -200 -300
Bank 05 Being InsertedBank # 6.7 Already Inserted
Distance Relative To Centre Line (cm) 30O 20O 100 0 -10O -200 -300
Distance Relative To Centre Line (cm)
100 -100 -200 -300
Fig. 3.5-4 Comparison of ADJ Bank Insertion Characteristics
- 308 -

KAERI/RR-1999/99
co(1)X
-20
U -40-
Natural Uranium
0 10 20 30 40 50 60 70
-80-
-100-
-120
Time after Shutdown (hrs)
Fig. 3.5-5 Xenon Buildup after Shutdown
- 309 -

-2
E
•5
CO
&
oICO
-8
-10
-12
KAERI/RR-1999/99
DUPICFuel
• Natural Uranium
400 300 200 100 0 -100 -200 -300 -40
Insertion Depth (cm)
Fig. 3.5-6 Static Reactivity Worth of MCA
- 310 -

KAERI/RR-1999/99
u •
-10
-20
mk)
j-ao-os
t>S-50UL
:ic
%*>
-70
-80
-9D
DJRC
37-BenBrtNU
Cfertne
-X••X
\ \1 \\\\\\\V \
\ \
\ \
' \\ \
jne \ x
10 5 0 -5 -1
Position a SORFrom Centre Line (Lattice Pftch)
Fig. 3.5-7 Comparison of Static Reactivity Worth Insertion Characteristics
- 311 -

KAERI/RR-1999/99
N 1.5 -
0.0 0.5 1.0 1.5 2.0
Time (seconds)
3.0 3.5
Fig. 3.5-8 Reactor Power for 20% RIH Break LOCA Shutdown by SDS1
- 312 -

KAERI/RR-1999/99
-1000.0 1.0 1.5 2.0
Time (seconds)
2.5 3.0 3.5
Fig. 3.5-9 Dynamic Reactivity for 20% RIH Break LOCA Shutdown by SDS1
- 313 -

KAERI/RR-1999/99
2.5-
•2 0 -
a. 1.5-
rmal
ized
d
2 0.5-
0.0-
A• fM
./I/ 1• / \7 L
SDS2 RIH 100% BreakNAT-U Trip at 0.3390 s
Inj Starts at 0.9228 s
• DUPIC Trip at 0.3420 sInj Starts at 0.92S8 s
y
•" * • • • • • •
1 | 1 | < | > | • 1 ' 1 ' 1
-0.5 0.0 0.5 1.0 1.5 2.0 2.5
Time After Break (sec)
3.0 3.5
Fig. 3.5-10 Reactor Power for 100% RIH LOCA Shutdown by SDS2
- 314 -

KAERI/RR-1999/99
20
0-
-20-
CO
a:o£CO
-60-
-80-
-100
*********
SDS2RIH100% Break
NAT-U Trip at 0.3390 s
Inj Starts at 0.9228 s
DUPIC Trip at 0.3420 s
Inj Starts at 0.92SS s
-0.5 0.0 0.5 1.0 1.5 2.0 2.5
Time After Break (sec)
3.0 3.5
Fig. 3.5-11 Dynamic Reactivity for 100% RJH LOCA Shutdown by SDS2
- 315 -

KAERI/RR-1999/99
•oCDO
coc0)X
Power Level
Before Shutdown
(DUPIC Core)
100%
80%60%40%
20%
37-Element Natural Uranium Core
Shutdown from 100% Power
10 20 30 40 50 60
Time after Reactor Shutdown (hr)
Fig. 3.5-12 Xenon Load after Reactor Shutdown
- 316 -
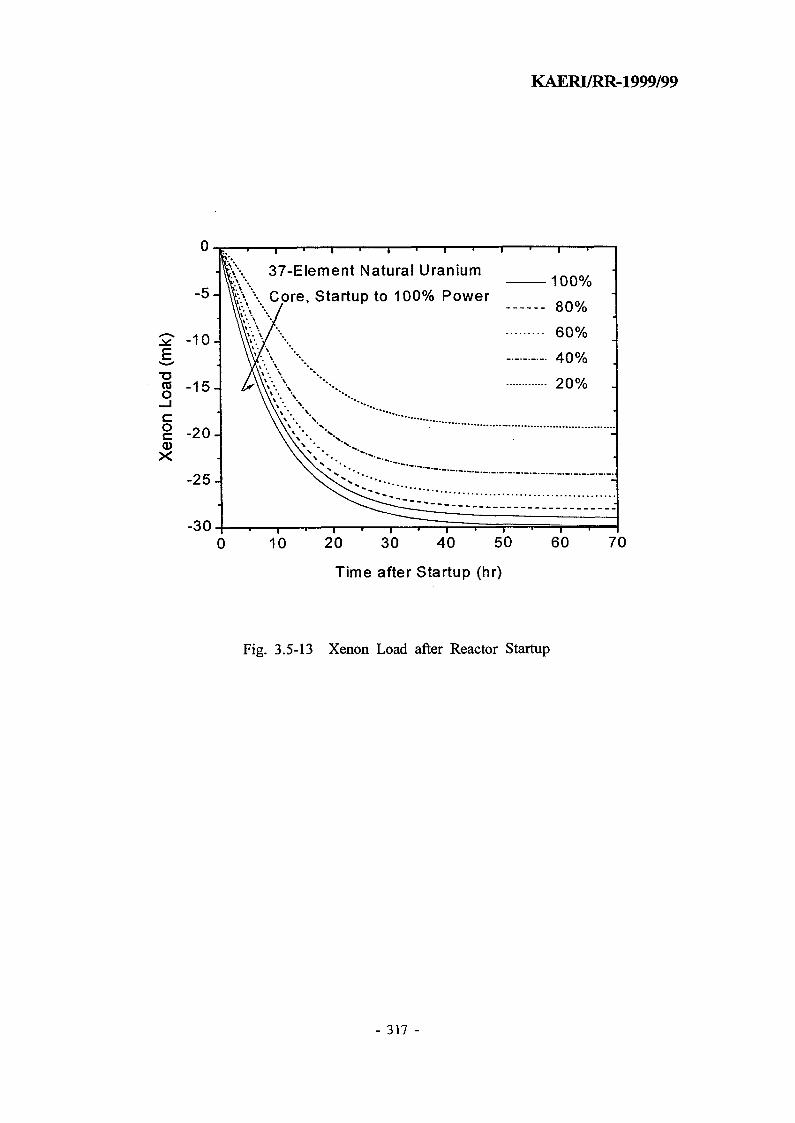
KAERI/RR-1999/99
37-Element Natural Uranium
fe\\ Core, Startup to 100% Power
-300 20 30 40 50
Time after Startup (hr)
100%
80%
60%
40%
20%
Fig. 3.5-13 Xenon Load after Reactor Startup
- 317 -

KAERI/RR-1999/99
0
-20-1
Equilibrium Poisoning at Full
/Power = 28.989 mk
•oroo_icoc<DX
- 80%
- 60%
• 40%
- 20%
- 0%
37-Element Natural Uranium Core, _
Reduce Power Level to 0%
10 20 30 40 50 60
Time after Power Reduction (hr)
70
Fig. 3.5-14 Xenon Load after Power Setback from Full Power
- 318 -

KAERI/RR-1999/99
oP-.
50 100 150Time (hr)
200 250
Fig. 3.5-15 Comparison of Top-to-Bottom Tilt
- 319 -

KAERI/RR-1999/99
50-
0
DUPIC
Natural uranium
50 100 150Time (hr)
200 250
Fig. 3.5-16 Comparison of Side-to-Side Tilt
- 320 -

KAERI/RR-1999/99
oOH
0 50 100 150Time (hr)
200 250
Fig. 3.5-17 Comparison of Front-to-Back Tilt
- 321 -

KAERI/RR-1999/99
50
ilt
(%)
oOH
40-
30-
20-
10.
o.-10.
-20.
-30-
-40
-5050 100 150
Time (hr)
200 250
Fig. 3.5-18 Comparison of Top-to-Bottom Oscillation with Different Power Levels
for DUPIC Core
- 322 -

KAERI/RR-1999/99
1100
O
CO
1000-
900'
800'
700'
600'
500^
400.
300^
200^
100.
o
Fueling direction
0
_. - - V i,
2-bundle shift
4-bundle shift
6-bundle shift
8-bundle shift
4 6 8 10
Axial bundle position
12
Fig. 3.5-19 Axial Power Shape of Central Channel for Various Refueling Schemes
- 323 -

KAERI/RR-1999/99
CD
oOH
50
40-
30-
20-
1.0.
0.
-10-
-20-
-30-
-40
-50
A
\ .1XI
0
• * * •w
50
2-bundle shift
4-bundle shift
• 6-bundIe shift
8-bundle shift
100 150
Time (hr)
200 250
Fig. 3.5-20 Comparison of Front-to-Back Tilt for Various Refueling Schemesof DUPIC Core
- 324 -

KAERI/RR-1999/99
Uncontrolled
ZCU controlled
40 60
Time (hr)
80 100
Fig. 3.5-21 ZCU Controllability of Top-to-Bottom Oscillation of DUPIC Core
- 325 -

KAERI/RR-1999/99
50
40-
30^
20.
-10.
-20^
-3<
-40
-500 20
Uncontrolled
• ZCU controlled
40 60
Time (hr)
80 100
Fig. 3.5-22 ZCU Controllability of Side-to-Side Oscillation of DUPIC Core
- 326 -

KAERI/RR-1999/99
50
40-
30-
20-
10.
0
-10-
-20-
-30.
-40.
-500
• Uncontrolled
• ZCU controlled
20 40 60Time (hr)
80 100
Fig. 3.5-23 ZCU Controllability of Front-to-Back Oscillation of DUPIC Core
- 327 -

KAERI/RR-1999/99
3.6
CANDU
3. \
ROP) H ^
Jfl*fl
. ROP
K CANDU
it^l(Regional Overpower Protection;
27fl7r
ROP
. CANDU ROP
CANDU
ROP
DUPIC ^: ROP
fg. DUPIC
-fe channel-random J£-fe- common-random
- 43-g-
DUPIC . 2327fl -gTfl 7]
- 328 -

KAERI/RR-1999/99
3.6.1 ROP
3.6.1.1 M.
ripple
5]7] . ROP
(TSP)
TSP
Do
I"CPRL
jofl
jp7> ^
100% #^^1^-1 TJl^-7] 3L7]
k, ripple qofl cflt> 71) -71 j p 5 |
k, ripple q«Hl *%# 711^7] J5]
ripple q g # ^
k, ripple qo||
-. <±, o]
711
(3.6-1)
(3.6-2)
3.6.1.2 ROP
4 ROP Tfl^f^ 20~507H^ icvjj 711^-715. , 4
fe ' t ^ ^ S . , SDS2 ROP
, SDSI ROP
- 329 -
KAERI/RR-1999/99
271151
3.6.2 ROP
ROP A^L-%: *1*B RFSP [Ref. 7]
^ NUCIRC [Ref. 22] 3H7J- A ^ ^ u f . i i l - s |
ROVER-F [Ref. 23]
3.6.2.1
ROP 7ll# ^TllcH) Af^-sj 23271)^
. o] 7«
3.6.2.2
DUPIC^ S , DUPIC
91 orifice7f ^
Bfl*l£M 517] nB^-^1, ^B^ -fr^ ^:S7f DUPIC
DUPIC
AECLS] Xc-Lb ^ ^ ) A ] # Af-g-^f^uf. ©1 ^ 1 ^ ^ : 37-^-
- 330 -

KAERI/RR-1999/99
37-g-
3.6.2.3 711 -7]
(lead cabled
3.6.2.4 Ripple
^ rippM
ROP 7}]471TT rippleo]
. NUCIRC
fe INTREP7 3 J = . #
ROVER-F
CANDU
ripple"^ ^g^t>t:f. ROP
100%
rippled 600 FPD
3.6.2.5
(Detector-random error):
- 331 -

KAERI/RR-1999/99
(Channel-random error):
icff
(Common-random error):
o] J2.*).i=,
(Systematic error):
3.6-H1
(root-sum-square)
3.6.3 S *
I7l|5J
DUPIC
M: tcfii]- reform
>. off
3.6.3.1
2327H ^7^1 71
98%
DUPIC
25711
J}, DUPIC
< > 1 ^ ^ < g, CANDU-6 Q*
3.6-2^ ^ B
- 332 -

KAERI/RR-1999/99
3.6.3.2 1711 711^71 ^ £*J
. DUPIC
n SDS1
SDS2 7^1^-7]6flA^ E^} ^ ^ ^ 7 1 - ijcfl 11%
3.6.3.3 REFORM
Reform |>L> ; 7 l § # ^ ^ S # H H 1 ^ ROP
reform 7^*>.^*fe ^3.^-ti 23<Hl ^ W
DUPIC i^^<Hl t iN reform .7^]A1:# ^ * ^ M ROP
9ic}. Reform 7 ^ ^3f, S^j ^ ^ * ] f e 125.7%S
- 333 -

KAERI/RR-1999/99
Table 3.6-1
Estimated ROP Errors and Uncertainties for DUPIC Core (90% Confidence)
Source of Errors
1. Detector-Related ErrorsTrip SetpointBuffer AmplifierDynamic Compensation
2. Flux-Shape ErrorsSimulation ErrorChange due to BoilingLead-Cable ContributionsOff-Nominal Core
3. CCP ErrorsCHF Correlation ErrorsIncomplete InstrumentationNUCIRC Pressure Loss TermUncertainty In HTS Boundary ConditionsChange in Ref. HTS Boundary
ConditionsHTS variationsChannel Age CorrectionCCP ChangeNormal Operating Flux TiltDifferent Fuel TypeAllowance for PT Creep
4. Calibration ErrorsCP/CPPF CalculationThermal Power CalculationCPPF Drift ErrorCalibration Drift Error
Total
Estimated Magnitude (%)
DetectorRandom
± 0.18± 0.10± 0.70
+ 1.94
± 0.20
± 1.60
± 2.60
ChannelRandom
± 1.09
+ 0.89
± 0.16± 0.11
+ 0.93
+ 1.97
CommonRandom
+ 0.14± 0.10
± 1.08
± 0.10± 0.80
± 1.70
± 0.83± 2.32
± 0.15
± 1.57± 1.70± 0.80
+ 4.18
BiasError
~0
+ 0.10- 0.20- 0.20
0.66-0.20-2.20
3.18
-0.20
-LOO
0.20
+0.14
- 334 -

KAERI/RR-1999/99
Table 3.6-2
Trip Confidence for DUPIC Fuel Core with ROP Setpoint of 125% (25 worst cases)
49
42
112
44
39
108
46
51
114
123
115
110
126
121
129
122
120
38
50
128
130
53
60
45
127
Required
Case
D12C80
D05C80
MCAN1H
D07C80
D02C80
MCAC1H
D09C80
D14C80
MCAN2H
ZTSESF
MCAN2F
MCAC2H
ZTT045
ZT1ABT
ZTT315
ZTSFSE
ZT1ATB
D01C80
D13C80
ZTT225
ZT2A01
D02N50
D09N50
DO8C8O
ZTT135
ROP Setpoint
CPRL
1.287278
1.287262
1.172954
1.287740
1.293773
1.290789
1.285568
1.296551
1.102006
1.255475
1.148860
1.168160
1.265897
1.271510
1.258256
1.257559
1.283709
1.315854
1.318809
1.259769
1.313649
1.337646
1.331552
1.321406
1.267906
for 98% Trip
SDS1
.9984
.9966
.9993
.9982
.9996
.9993
.9968
.9965
.9951
.9976
.9954
.9972
.9992
.9957
.9959
.9974
.9997
.9974
.9977
.9968
.9990
.9995
.9988
.9974
.9990
Confidence =
SDS2
.9749
.9751
.9785
.9859
.9900
.9908
.9918
.9919
.9944
.9952
.9997
.9955
.9957
.9993
.9986
.9962
.9965
.9967
.9968
.9978
.9969
.9972
.9972
.9986
.9975
1.2336
Limiting
Detectors
9E
4D
11D
9F
2E
2E
6D
10E
11D
ID
2E
2E
ID
10F
IF
HE
10F
5F
9F
HE
ID
2E
6D
5E
7F
8H
7J
7H
4H
2G
8J
3H
4G
7H
2G
8J
7H
8J
8H
6H
1G
8H
2H
4H
6G
2G
3J
3H
6G
7G
- 335 -

KAERI/RR-1999/99
Table 3.6-3
Setpoints for Single Detector Failure
SDS1 Detector
Failed Detector
ID2D3D4D5D6D7D8D9D10D11D12D
IE2E3E4E5E6E7E8E9E10E
HE
IF2F3F4F5F6F7F8F9F10F11F
RequiredSetpoint
1.23361.23361.23361.23361.23361.23361.23361.23361.23361.23361.22541.2336
1.21591.23361.23361.23361.23361.23361.23361.23361.23361.23361.2336
1.23361.23361.23361.23361.23361.23361.23361.23361.23361.23361.2336
SDS2 Detector
Failed Detector
1G2G3G4G5G6G7G8G
1H2H3H4H5H6H7H8H
U2J3J4J5J6J7J8J
RequiredSetpoint
1.23361.22261.23341.23321.23361.23361.21001.2202
1.23321.23121.21651.21111.23231.23361.12041.2002
1.23331.23261.22151.16891.23361.23361.19471.1960
- 336 -

KAERI/RR-1999/99
3.7 DUPIC l ^ ^ ^
DUPIC 3J*}3/g£ ^ £ 3 . 3 : ^ # 4*l*k2. 7\& CANDU-6
, DUPIC ^«iS7]- # S 3 CANDU-6
CANDU-6 # # ^ 1 t> £ #
DUPIC «|&S.7]- ^ " ^ ^ CANDU-6 SJ
DUPIC
$7}*}%^}.
3.7.1 7 ] ^
, DUPIC
^ t - y 71)A>
91 £# ^ ^ ^I^Afife fl 91
3.7.1.1
CANDU 4l^Sofl-Hfe- 4 ^ ^ ^r^^l 4
K DUPIC
7H
- 337 -

KAERI/RR-1999/99
DUPIC^ 3.7- ZL^ 3.7-2
44
(fueling zone)ofl
6621 kW
765 M-3, M-5, M-ll
MTHM)
ZL^ 3.7-5^1
371.4 5J 350.7
358.3 MWh/kgHM (= 14929.3 MWd/
(dwell time>gr
D U P I C u - A l ^
4 4 1.6%if 7.5%
3.6%
3.7.1.2
& RFSP 3^$] lt
S c | ^ . D U P I C
>. 30711^
- 338 -

KAERI/RR-1999/99
3J-26\]M JiL-fe ti^ ^ o ] , 6-T-m g 8-cH*
7300 kWif 935
^ DUPIC
W, DUPIC
3.7.1.3 A]^> ^ ^ ^U^^. 3.*} (Time-Dependent Refueling Simulation)
600 # # ^ (FPD) J§-<>}°) ^ H v ^ S^Vl- ^-n 7\& DUPIC
CANDU ^ > S . ^ 5 | ^ ^ A4
., DUPIC «?«1S i ^ ^ ^ ^g^- MCP Rj MBP
^ o . ^ , Jji i ^A]^ ^§5- CPPFfe
xtfl, DUPIC i i ^ ^ : *ff-ofl 47fl£l
*£ DUPIC ii^ofl^fe 27B, &<&$-Bfe Jt^ofl^fe 87flo}7]DUPIC i
# ^ ^ r 7024 kWolnf, ^ § 5 MCP^ 6844 kW<>|i;K 5E$t,
^r 827 kWojnf, JS.A> 7}]^ %-<&£l $^:&-& 804 kWo]r:>.
ripple^ <£-§•
^ D U P I C
3]cl| rippled l.lOo]^ Jg^^l fe 1.065o]t V- ZL^ 3.7-9^1 7 ^
MCP ^ MBP-fe- <di^\ 7} *]]?>*] Jit:]- ^£. ^ 5 . ^
j- %^£\ <*•]%} ^-^ 7]^-g- A J ' S J J ^ ] 4|$]-o^> ^ I^7f ^iltl^l-^l 95%-§-
(administrative limit).5L -^^]*}^t:}. ^U1^ nj ~^}^ i
- 339 -

KAERI/RR-1999/99
4 4 6935 kW J- 888 kW°lt:}. ^ ^ # ^*H, CPPF *
4 4 1.103J- 0.2/0.83. ^smsUrt -
600 FPDS} zfl#*l £ 4
DUPIC ^ \ ^f , 1 ^ ^ W
DUPIC i n ^ ^ ^ ^ CPPF7}
^^f^: % # ^ DUPICDUPIC i-ys} Afl # ^ o l 71^^1^-f-Bl cj
%-i-S DUPIC i t^^i ^-foll c-1 3L7fl v^yjc}. it(-sH, CPPFzcu ^ H S a ^ l ^ $a^ DUPIC
3.7.2 ^^g^r^ «0^ofl 31 «>
7]-g- DUPIC Jn^Sj A^-^ ^ ^ r (performance parameter) #^g
}. CANDU i ^ } Sfl^ 3 .^o] RFSP S H -
^V8-*W r-fi- i ^ ^ A ^^ ^ ^ r (key core
performance parameter) # ^ # % ^ £ # 7 ) 1 ^ } & I ; } . Afl 7}xl
4 ^ r J 71$ DUPIC
cfl V ^ ^ ig^- ^}S. (composition variation data)#
3.7.2.1 CANDU
CANDU
71 $\n ZCU
- 340 -

KAERI/RR-1999/99
zcu H ^ $ }
7}.
CANDU Q} H 1 ^
Z C U
RS] ^4f nl^J-s. (constrained
sensitivity) §fe (a,s)<Hl cU«> i?^| ^ - ^ ^ ^ S - (unconstrained sensitivity) «J ZCU
zcu
RFSP S ^ # -f *H ZCU
<H ZCU
ZCU
(3.7-2)
(3.7-3)
(3.7-4)
147fl ZCU
- 341 -

ZCU
KAERI/RR-1999/99
zcu
(3.7-5)
(3-7-6)
(3.7-7)
ZCU
ZCU ZCU
-^P . -Cf l r ,^ - ) , ; = 1 , 2 , - , 1 4 (3.7-8)
(3.7-9)
zcu
ZCU
- 342 -
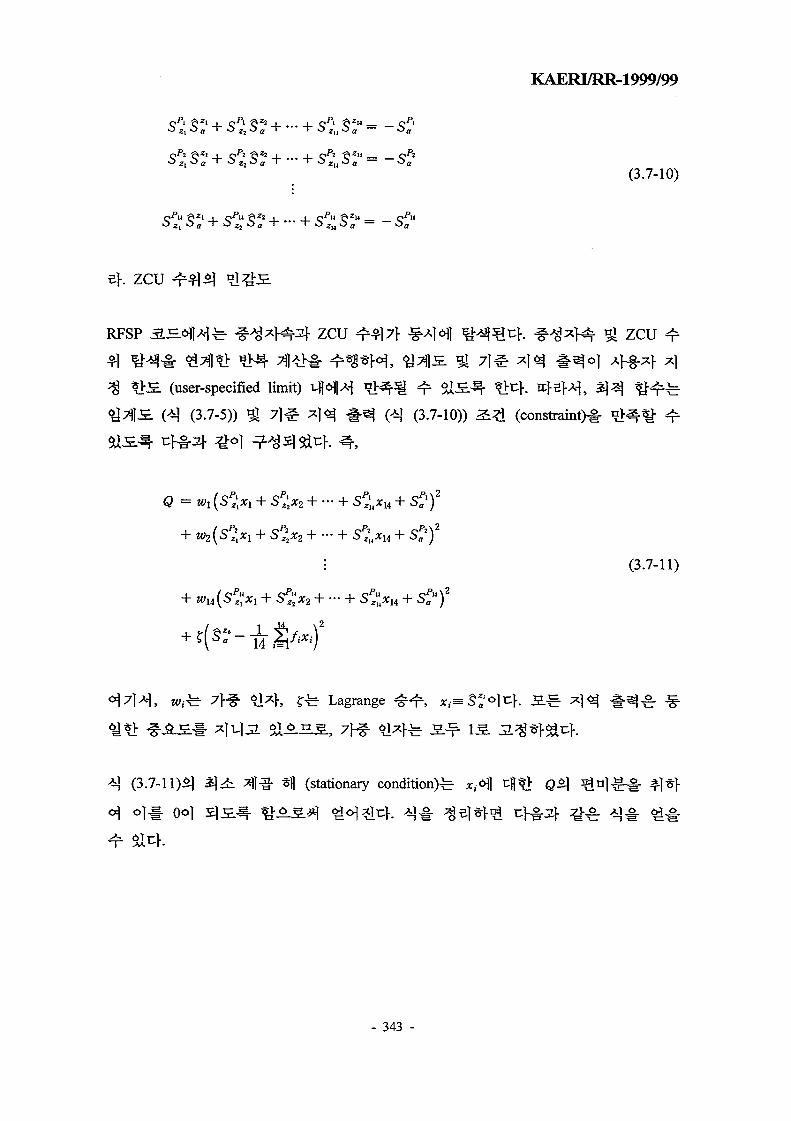
KAERI/RR-1999/99
-I- -I- QPi z" — —' ' > ° zu*~> a —
(3.7-10)
SA4 •$ z l I C^"u §^2 1 1 Q^H ft 14
i, " I TOjjOj T ' "T OZ|]O,,
ef. ZCU
RFSP ZCU
(user-specified limit)
H (3.7-5)) £ 71^
ZCU
(3.7-10)) S # (constraint)^
Q =Wl (SP2[Xl
p")2sp
a")
(3.7-n)
Lagrange
(3.7-11)31
o l # 0o]
(stationary condition)^ *,.ofl t:D*>
- 343 -

KAERI/RR-1999/99
a1NxN = bx
= b2(3.7-12)
n p
wkS2.S2.- (3.7-13)
N (3.7-14)
ZCU fe ^ (3.7-4)3} ^ (3.7-12)#
*, S*,.,
z c u
, 147fl
3.7.2.2
ZCU
. RFSP 3 H f UJ-^-^-S. *> GPT
MCP, MBP,
7f.
- 344 -

KAERI/RR-1999/99
Sa=~a <KFM
ZCU
CANDU ^ J ^ S f e 147H5] ^ I ^ A S i - H ^ H , 4
1"&>7) ^
(linear functional)^.
o]5>
- 345 -
(3.7-15)
, t o > i - Pi<8H,<f>0>c- ^.{SM- A0SF)</>0) (3.7-17)
~~ (3J"18)

KAERI/RR-1999/99
zcu
tf.
ZL^ 3.7-lOofl
RFSP
TIME-AVER g ^<&3.
GENOVA [Ref.
I PERTXS«
(DUPIC
SIMULATE
CANDU
, RFSP 3 =
CALCON SJE:
DUPIC CANDU
MCP,
MBP,
3.7-5 ^
^ RFSP
Sat}. ZIB] vf, MCP ^ MBP7}
MBP7f
3.7-7
- 346 -

KAERI/RR-1999/99
2. ZCU
100, 200, 300, 400, 500, 600 FPD -§• ^
}. JE 3.7-9 9J 3.7-lOoiH ^ f e
MCP, MBP, CPPF.S}
K MCP
3.7.2.3
DUPIC
DUPIC
Sit:}.
V = SJfS'
3.7-9
MCP g| MBP5]
t nH,3.7))
91
(3.7-19)
- 347 -

KAERI/RR-1999/99
7\.
DUPIC ^<&g. 3V$ «15-^S.# %4>*]7]7] # « M 4 1 ^ 4
DUPIC
*> DUPIC
S 3.7-11, 3.7-12, 3.7-
95% >*d^SiI S ^ S * } (2
600 ^ ^ H } ^ JDUPIC n&
M fi 3.7-14, 3.7-15,
f. DUPIC «}^5. »^9i # 1 ^ tfl*H, MCP, MBP, CPPF
1-3, 2.5, 1.2%3. ^
U-235
-& <$ 1.0%
DUPIC tq&S. ^91 #2o\] tfl*> MCP, MBP, CPPFS] # % ^ S . f e 6.6, 11.3, 7.5%o]
n?, DUPIC ^ ^ S . ^*> #3o1] c ^ 1-%-ySfe- ^^> A o ^ ^ # % ^ £ ( S 3.7-13
10.3, 15.0, 9.4%S &7}#-c}. M] 7}*} DUPIC
- 348 -

KAERI/RR-1999/99
3.7.3
3.7}
(agglomerative hierarchical
clustering, AHC [Ref. 29])o]
3.7.3.1
. o] S . 1 ^ A ^ ZL^ 3.7-
(clustering group)
7}.
, 10, 15, 20, 25, 30<>j ^.ei
, RFSP I H f ^ * I S^Hi ^r 5ii^ ^ ^ S %EH^ M r:fl 7 j | ^ ^ 4
357f|
- 349 -

KAERI/RR-1999/99
(strategy)^
- 4^ ^.^g (neutronic property)^-
50% ^ ) s L ZCU g ^ ^
^ ^ S . ^ B U ^ 7 | |^7> 107fl
DUPIC ^<&£- *&*±o\] cR> MCPS MBP, CPPFfe
DUPIC
107H
307}*] *gEU<SJ ^ ^ S # H l ^ ^ S SB^^I 4-§-^7 |5 . ^^*}^lt:f. 4 4 ^ DUPIC
ZL^ 3.7-12, 3.7-13, 3.7-14^
- 350 -

KAERI/RR-1999/99
3.7-176)1 MCP,
MBP, CPPF#
^ MCP#
MCP, MBP,
, DUPIC
average)
4 307fl)
, 4 (group-
, 4
, 44^
^ 1007M £ 4
(group-average) ^ ^ S . ^ - ^ # ^f-§-t! ±M 2.*}
i%, c>«J- # ^ , CPPF51 *W-§. ^A>*>SiJl, DUPIC
ZL^ 3.7-15, 3.7-16, 3.7-17ofl ^KHSd^K OL *}°}^ 95%
3.7-18«Hl 4 7\x\ DUPIC
>. DUPIC ^ ^ 5 . ^ - ^
fe 1.20, 0.89, 1.20%£ 1+E^o.t^, DUPIC
DUPIC ^ 9 l S *&<& #1*)
44
#2
- 351 -
KAERI/RR-1999/99
3.7.3.2 ^ ^
600 ^ # ^ < a (FPD)
-§•<& *Hif- ^ £ S . ^Hv^i HS3.13 (auto-refueling program)
7}
7\. f%<£S. *Vi%& £ 4
£4£4 1^-^ MCP, MBP^r H ^ 3.7-18
fe ] y # <t ^ ol^cf. CPPF^b ZL^ 3.7-20
(0.34%) #7>*fe ^ ^ S .
-i-^-^S.7} S % ^ ^ , MCP, MBP,
o.5O, 0.69, o.8O%5. ofl-a
U-235
DUPIC «J«iS ^ ^ #2
DUPIC ^ ^ S ^91 #13} 7\$\ %-<£*\^\. DUPIC n<&£. ^91 #2*]} cH*M, * ^
^ ^<^S 2 ^ A S 1*1 #%^£7V S^-5]^, MCP, MBP, CPPF5] - i^-^sfe
4 4 0.58, 1.34, 0.73%olc}. DUPIC 1%<&3. *£9± #3<Hl cfl«> MCP, MBP, CPPFS]
1-^-ys.fe- 5 ^ 3 : ^ ^ 5 - ^ ^ - ^ S ^ ^ l - % ^ £ # S # * M 4 4 0.47, 1.45,
0.52%o]c>. a]^- -L ^ } 7 } DUPIC
(reactor regulating system, RRS)^|
- 352 -

KAERI/RR-1999/99
CANDU ^ f 3 # ^ <M § £nfl, ZCU <^-fe
ZCU
^XI ^ S l ^r Sa K ^ S H , CANDU
3.7.4
DUPIC ^ ^ ^ 5 . #*L€ CANDU-6)^.0^xi 7 ] ^ D U P I C
35L4 X l - i ^ ^^*l -55l t :> . TjfXV ^ 3 4 , £]cfl ^ ^ ^ t : ] - ^
CPPF ^ g .
4 7M DUPIC
^ r<>l] tfl*i ^ ^ ^ i ^ y j ^ ^ S <g*oKi-
#0)7)
, MCP, MBP, CPPF^ 1 - ^ S T T 4 4
1.3, 2.5, 1.2%S. Tfl^&c)-. ^ ^ ^ ^ U^ofl^fe aJ:-S-U^r4 cfl*i
- 353 -

KAERI/RR-1999/99
Sfe 307M
DUPIC n<&3. *y- >oU tH^> w ] ^ ^ H
S. S-^-i- ^ f e ^>6a ^BD «a^- 91 307W
>Si^. ^ 1 ^ 1 4 , MCP, MBP, CPPFofl
0.6, 1.5, 0.8% J i t} -Ti) v}Ef^t:}. rc}eM, a l ^ ^ s
r]- tS->c|E>3t, MCP 9J MBP^ ^r^i ^|*>^1*1 7300 kW ^J 935 kWJicl- ^^1 c|
4 1 } K f e 1-R-fe DUPICCANDU ]
, DUPIC
- 354 -

KAERI/RR-1999/99
Table 3.7-1
Characteristics of DUPIC Core vs. Refueling Scheme
Peak Channel
Power (kW)
Peak Bundle
Power (kW)
Form Factor
(Avg./Max.)
Discharge Burnup
(MWhr/Bundle)
Refueling Rate
(Channels/Day)
Inner
Outer
Inner
Outer
Radial
Axial
Whole
Inner
Outer
Whole
Inner
Outer
Whole
2-Bundle
Shift
6621
6621
766
748
0.82
0.72
0.59
6630
6260
6395
1.48
2.57
4.06
4-Bundle
Shift
6627
6627
797
784
0.82
0.70
0.57
6853
6250
6372
0.74
1.29
2.03
6-Bundle
Shift
6671
6644
880
900
0.81
0.62
0.50
6656
6251
6328
0.51
0.85
1.36
8-Bundle
Shift
6632
6632
820
833
0.82
0.66
0.54
6421
6175
6266
0.38
0.65
1.03
8-Bundle
(Nat. U)
6729
6732
821
827
0.81
0.68
0.55
3537
3188
3313
0.70
1.25
1.95
- 355 -

KAERI/RR-1999/99
Table 3.7-2
Summary of 30 Instantaneous Calculations
Peak Channel
Power (kW)
Peak Bundle
Power (kW)
Channel Power
Peaking Factor
Radial Form Factor
Max.
Avg.
Min.
Max.
Avg.
Min.
Max.
Avg.
Min.
Max.
Avg.
Min.
2-Bundle
Shift
6699
6629
6580
783
771
763
1.129
1.110
1.088
0.824
0.818
0.810
4-Bundle
Shift
7232
7044
6911
906
875
858
1.148
1.122
1.104
0.785
0.770
0.750
6-Bundle
Shift
8157
7766
7447
1147
1078
1029
1.277
1.207
1.169
0.728
0.699
0.665
8-Bundle
Shift
9054
8374
7769
1200
1107
1024
1.425
1.303
1.234
0.698
0.649
0.599
8-Bundle
(Nat. U)
7135
6875
6704
894
872
840
1.127
1.093
1.080
0.809
0.789
0.760
- 356 -

KAERI/RR-1999/99
Table 3.7-3
Comparison of Refueling Simulation for 600-FPD
Maximum channel power (kW)
Maximum bundle power (kW)
Channel power peaking factor
Refueling rate (Channels/day)
DUPIC reference
6844
804
1.063
4.05
Natural Uranium
6853
852
1.063
1.99
- 357 -

KAER17RR-1999/99
Table 3.7-4
Comparison of Probability to Exceed Administrative Limits
Administrative limits
Channel power
Bundle power
CPPF
ZCU level
6935 kW
888 kW
1.10
0.2 / 0.8
DUPIC reference
0.0*
0.0
0.17
0.12
Natural Uranium
0.33
0.0
0.0
0.15
* Percent
- 358 -

KAERI/RR-1999/99
Table 3.7-5
Constrained Sensitivity to Thermal Absorption Cross Section
Response
(Location)
MCP (0-17)
MBP (O-IO- 3)*
CPPF (M- 4)
Sensitivity
method
-0.054
-0.876
-0.148
Direct
calculation
-0.054
-0.812
-0.147
Error
(%)
0.0
7.9
0.7
* The MBP bundle is located at third bundle position out of 12 bundles in channel O-l 0.
- 359 -

KAERI/RR-1999/99
Table 3.7-6
Constrained Sensitivity to Neutron Production Cross Section
Response
MCP
MBP
CPPF
Sensitivity
method
0.027
0.664
0.119
Direct
calculation
0.028
0.729
0.121
Error
(%)
-3.6
-8.9
-1.7
- 360 -

KAERI/RR-1999/99
Table 3.7-7
Comparison of Sensitivity to Thermal Absorption Cross Section
Response
MCP
MBP
CPPF
Constrained
sensitivity
-0.054
-0.876
-0.148
Unconstrained
sensitivity
-0.186
-0.994
-0.260
Ratio
0.29
0.88
0.57
- 361 -

KAERI/RR-1999/99
Table 3.7-8
Comparison of Sensitivity to Neutron Production Cross Section
Response
MCP
MBP
CPPF
Constrained
sensitivity
0.027
0.664
0.119
Unconstrained
sensitivity
0.160
0.792
0.236
Ratio
0.17
0.84
0.50
- 362 -

KAERI/RR-1999/99
Table 3.7-9
Sensitivity Coefficient to Thermal Absorption Cross Section for Selected Burnup
FPD
100
200
300
400
500
600
Average
MCP (Channel)
-0.103 (P- 8)
-0.110 (Q-14)
-0.085 (Q-13)
-0.075 (S-11)
-0.107 (P- 8)
-0.106 (Q-14)
-0.091
MBP (Bundle)
-0.901 (O- 9-10)
-0.877 (L-14-10)
-0.797 (Q-13- 9)
-0.893 (O-l0- 3)
-0.843 (P- 8- 9)
-0.841 (N-15- 3)
-0.861
CPPF (Channel)
-0.102 (O- 9)
-0.100 (K-15)
-0.134 (N-20)
-0.178 (M-20)
-0.192 (K-20)
-0.089 (M-13)
-0.135
- 363 -

KAERI/RR-1999/99
Table 3.7-10
Sensitivity Coefficient to Neutron Production Cross Section for Selected Burnup
FPD
100
200
300
400
500
600
Average
MCP
0.077
0.083
0.058
0.047
0.080
0.079
0.064
MBP
0.692
0.664
0.568
0.683
0.615
0.632
0.645
CPPF
0.076
0.075
0.104
0.149
0.164
0.064
0.107
- 364 -
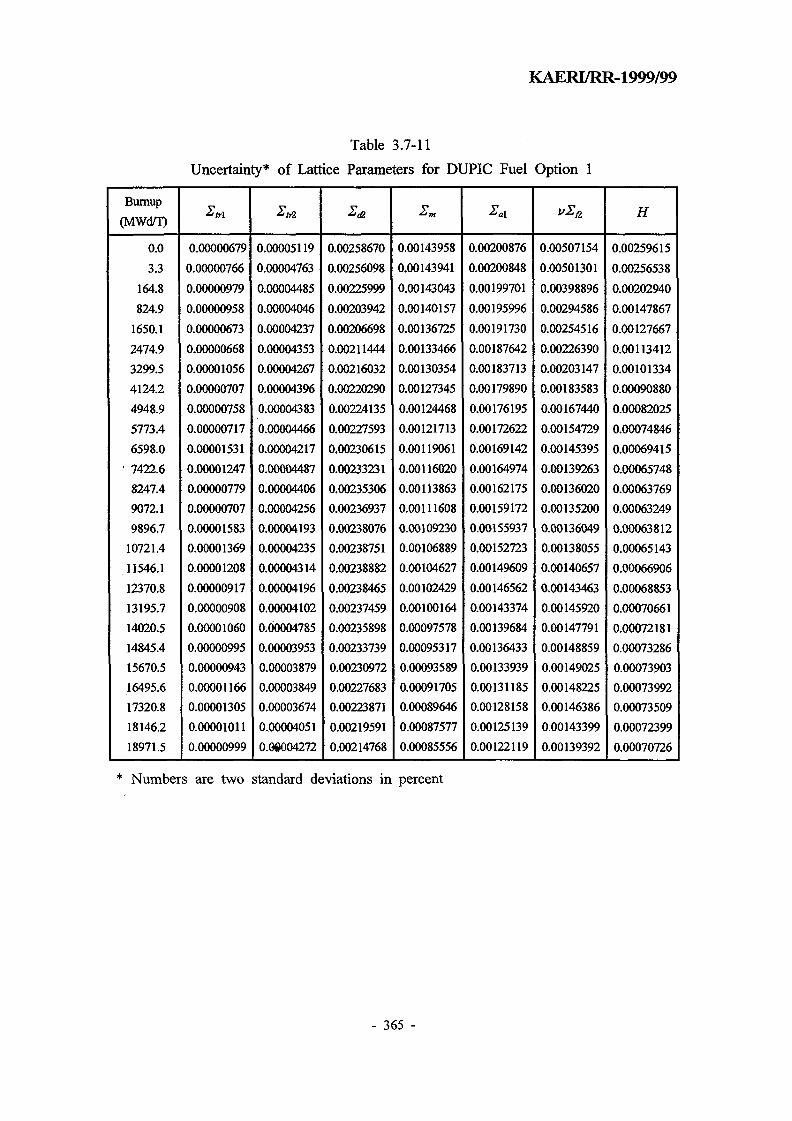
KAERI/RR-1999/99
Table 3.7-11
Uncertainty* of Lattice Parameters for DUPIC Fuel Option 1
Bumup(MWd/T)
0.0
3.3
164.8
824.9
1650.1
2474.9
3299.5
4124.2
4948.9
5773.4
6598.0
• 7422.6
8247.4
9072.1
9896.7
10721.4
11546.1
12370.8
13195.7
14020.5
14845.4
15670.5
16495.6
17320.8
18146.2
18971.5
0.00000679
0.00000766
0.00000979
0.00000958
0.00000673
0.00000668
0.00001056
0.00000707
0.00000758
0.00000717
0.00001531
0.00001247
0.00000779
0.00000707
0.00001583
0.00001369
0.00001208
0.00000917
0.00000908
0.00001060
0.00000995
0.00000943
0.00001166
0.00001305
0.00001011
0.00000999
0.00005119
0.00004763
0.00004485
0.00004046
0.00004237
0.00004353
0.00004267
0.00004396
0.00004383
0.00004466
0.00004217
0.00004487
0.00004406
0.00004256
0.00004193
0.00004235
0.00004314
0.00004196
0.00004102
0.00004785
0.00003953
0.00003879
0.00003849
0.00003674
0.00004051
0.0*004272
0.00258670
0.00256098
0.00225999
0.00203942
0.00206698
0.00211444
0.00216032
0.00220290
0.00224135
0.00227593
0.00230615
0.00233231
0.00235306
0.00236937
0.00238076
0.00238751
0.00238882
0.00238465
0.00237459
0.00235898
0.00233739
0.00230972
0.00227683
0.00223871
0.00219591
0.00214768
0.00143958
0.00143941
0.00143043
0.00140157
0.00136725
0.00133466
0.00130354
0.00127345
0.00124468
0.00121713
0.00119061
0.00116020
0.00113863
0.00111608
0.00109230
0.00106889
0.00104627
0.00102429
0.00100164
0.00097578
0.00095317
0.00093589
0.00091705
0.00089646
0.00087577
0.00085556
2A
0.00200876
0.00200848
0.00199701
0.00195996
0.00191730
0.00187642
0.00183713
0.00179890
0.00176195
0.00172622
0.00169142
0.00164974
0.00162175
0.00159172
0.00155937
0.00152723
0.00149609
0.00146562
0.00143374
0.00139684
0.00136433
0.00133939
0.00131185
0.00128158
0.00125139
0.00122119
0.00507154
0.00501301
0.00398896
0.00294586
0.00254516
0.00226390
0.00203147
0.00183583
0.00167440
0.00154729
0.00145395
0.00139263
0.00136020
0.00135200
0.00136049
0.00138055
0.00140657
0.00143463
0.00145920
0.00147791
0.00148859
0.00149025
0.00148225
0.00146386
0.00143399
0.00139392
H
0.00259615
0.00256538
0.00202940
0.00147867
0.00127667
0.00113412
0.00101334
0.00090880
0.00082025
0.00074846
0.00069415
0.00065748
0.00063769
0.00063249
0.00063812
0.00065143
0.00066906
0.00068853
0.00070661
0.00072181
0.00073286
0.00073903
0.00073992
0.00073509
0.00072399
0.00070726
* Numbers are two standard deviations in percent
- 365 -

KAERI/RR-1999/99
Table 3.7-12
Uncertainty* of Lattice Parameters for DUPIC Fuel Option 2
Bumup
(MWd/T)
0.0
3.3
164.8
824.9
1649.9
2474.6
3299.1
4123.6
4948.1
5772.7
6597.2
7421.8
8246.3
9070.8
9895.3
10719.9
11544.6
12369.3
13194.2
14018.9
14843.8
15668.9
16493.9
17319.1
18144.3
18969.7
2*
0.00003806
0.00003884
0.00003777
0.00003751
0.00003685
0.00003755
0.00003876
0.00003861
0.00003699
0.00003696
0.00003756
0.00003772
0.00003794
0.00003776
0.00003779
0.00003735
0.00003922
0.00003809
0.00003831
0.00003818
0.00003742
0.00003774
0.00003761
0.00003896
0.00003841
0.00003720
0.00013875
0.00013862
0.00014493
0.00013812
0.00014079
0.00014225
0.00014003
0.00014191
0.00014191
0.00014231
0.00014542
0.00014445
0.00014249
0.00013998
0.00014176
0.00014030
0.00013911
0.00013652
0.00013521
0.00013824
0.00013048
0.00012721
0.00012300
0.00012701
0.00012182
0.00011301
0.00679272
0.00676275
0.00682074
0.00675141
0.00681108
0.00689571
0.00697653
0.00704864
0.00711061
0.00716177
0.00720072
0.00722843
0.00724242
0.00724202
0.00722789
0.00719916
0.00715618
0.00709660
0.00702133
0.00692952
0.00682127
0.00669885
0.00656021
0.00640784
0.00624191
0.00606305
2m
0.00182791
0.00182760
0.00182083
0.00179715
0.00176798
0.00173947
0.00171169
0.00168479
0.00165785
0.00163047
0.00160306
0.00157545
0.00154541
0.00151356
0.00149460
0.00147279
0.00144763
0.00142225
0.00139693
0.00137157
0.00134694
0.00132157
0.00129582
0.00126923
0.00124302
0.00121424
2A
0.00283908
0.00283861
0.00283000
0.00279524
0.00275282
0.00271083
0.00266889
0.00262767
0.00258599
0.00254340
0.00249964
0.00245552
0.00240661
0.00235331
0.00232140
0.00228448
0.00224144
0.00219790
0.00215337
0.00210887
0.00206471
0.00201942
0.00197327
0.00192561
0.00187849
0.00182718
v2&
0.01395604
0.01396206
0.01415304
0.01528809
0.01568692
0.01590409
0.01606448
0.01618558
0.01626885
0.01631574
0.01632412
0.01629386
0.01622167
0.01610667
0.01595098
0.01575748
0.01552080
0.01523948
0.01491684
0.01455290
0.01415196
0.01371606
0.01324431
0.01274177
0.01221178
0.01165914
H
0.00714449
0.00714751
0.00724964
0.00785575
0.00808488
0.00821811
0.00832062
0.00840166
0.00846192
0.00850210
0.00852090
0.00851841
0.00849274
0.00844354
0.00837188
0.00827895
0.00816226
0.00802105
0.00785706
0.00767040
0.00746328
0.00723693
0.00699089
0.00672805
0.00645009
0.00615968
* Numbers are two standard deviations in percent
- 366 -

KAERI/RR-1999/99
Table 3.7-13
Uncertainty* of Lattice Parameters for DUPIC Fuel Option 3
Bumup(MWd/T)
0.0
3.3
164.7
824.7
1649.6
2474.2
3298.7
4123.1
4947.4
5771.8
6596.2
7420.7
8245.1
9069.6
9894.1
10718.7
11543.3
12368.0
13192.8
14017.7
14842.6
15667.6
16492.8
17318.1
18143.5
18969.0
0.00001058
0.00001094
0.00001028
0.00001064
0.00001122
0.00001039
0.00001112
0.00001242
0.00001527
0.00001766
0.00001269
0.00001305
0.00001353
0.00001777
0.00001419
0.00001401
0.00001563
0.00001314
0.00001230
0.00001372
0.00001352
0.00001340
0.00001267
0.00001290
0.00001325
0.00001480
0.00022133
0.00022053
0.00022419
0.00022212
0.00022102
0.00022111
0.00022107
0.00022063
0.00021897
0.00021711
0.00021619
0.00021429
0.00021345
0.00021072
0.00020806
0.00020401
0.00020248
0.00019702
0.00019356
0.00018865
0.00018369
0.00017786
0.00017525
0.00016615
0.00016346
0.00015481
0.01132726
0.01128695
0.01145883
0.01132418
0.01136224
0.01142915
0.01148567
0.01152658
0.01155094
0.01155800
0.01154771
0.01151860
0.01147060
0.01140246
0.01131459
0.01120533
0.01107398
0.01091996
0.01074326
0.01054490
0.01032456
0.01008321
0.00982277
0.00954473
0.00925041
0.00894294
0.00282375
0.00282373
0.00281403
0.00277740
0.00273161
0.00268642
0.00264171
0.00259705
0.00255269
0.00250782
0.00246091
0.00241622
0.00237515
0.00236265
0.00229674
0.00225380
0.00221088
0.00216839
0.00212577
0.00208243
0.00203825
0.00199432
0.00195071
0.00190729
0.00186505
0.00182376
2*
0.00440943
0.00440941
0.00439729
0.00434295
0.00427539
0.00420812
0.00414062
0.00407239
0.00400391
0.00393399
0.00385977
0.00378835
0.00372236
0.00367771
0.00359461
0.00352361
0.00345230
0.00338116
0.00330913
0.00323581
0.00316091
0.00308610
0.00301153
0.00293713
0.00286447
0.00279338
v2&
0.02199285
0.02198165
0.02214853
0.02372677
0.02413316
0.02426507
0.02430310
0.02427881
0.02419921
0.02406655
0.02388249
0.02364641
0.02336024
0.02303976
0.02263770
0.02219852
0.02170649
0.02116256
0.02057013
0.01993284
0.01925030
0.01852584
0.01776616
0.01697475
0.01615573
0.01531550
H
0.01070746
0.01070272
0.01079170
0.01163009
0.01189261
0.01201544
0.01208955
0.01213024
0.01214040
0.01212068
0.01207156
0.01199249
0.01188431
0.01175417
0.01158010
0.01138267
0.01115465
0.01089666
0.01061049
0.01029822
0.00995985
0.00959731
0.00921427
0.00881278
0.00839521
0.00796511
* Numbers are two standard deviations in percent
- 367 -

KAERI/RR-1999/99
Table 3.7-14
Uncertainty of Performance Parameter for DUPIC Fuel Option 1 (%)
FPD
1
100
200
300
400
500
600
Average
MCP
2.3
1.0
1.0
1.3
1.8
1.0
1.1
1.3
MBP
2.3
2.2
2.0
3.0
2.2
2.6
2.8
2.5
CPPF
1.6
0.7
0.7
1.8
1.6
1.4
0.3
1.2
- 368 -

KAERI/RR-1999/99
Table 3.7-15
Uncertainty of Performance Parameter for DUPIC Fuel Option 2 (%)
FPD
1
100
200
300
400
500
600
Average
MCP
7.3
7.5
5.9
6.7
8.3
5.2
5.4-
6.6
MBP
9.5
11.9
9.8
10.7
11.6
15.4
10.1
11.3
CPPF
9.5
14.3
2.9
8.4
8.3
5.2
4.0
7.5
- 369 -

KAERI/RR-1999/99
Table 3.7-16
Uncertainty of Performance Parameter for DUPIC Fuel Option 3 (%)
FPD
1
100
200
300
400
500
600
Average
MCP
11.6
9.3
7.9
8.0
9.4
13.8
11.9
10.3
MBP
14.7
13.2
14.5
13.1
14.5
13.4
21.6
15.0
CPPF
13.9
3.8
9.2
12.4
3.4
10.5
12.5
9.4
- 370 -

KAER1/RR-1999/99
Table 3.7-17
Sensitivity* of Clustering Group
Performance
Parameter
Maximum Channel
Power (kW)
Maximum Bundle
Power (kW)
Channel Power
Peaking Factor
Clustering Group
1
10
15
20
25
30
1
10
15
20
25
30
1
10
15
20
25
30
DUPIC Fuel Option
Option 1
6885
6843
6849
6844
6843
6849
796
805
804
805
805
805
1.051
1.055
1.054
1.056
1.054
1.054
Option 2
6831
6835
6833
6835
6831
6834
796
810
810
809
809
810
1.052
1.052
1.052
1.052
1.052
1.052
.. Option 3
6811
6818
6806
6810
6822
6813
809
823
819
817
822
818
1.043
1.043
1.044
1.045
1.044
1.043
* With Spatial and Bulk Control
- 371 -

KAERI/RR-1999/99
Table 3.7-18
Uncertainty due to Group-average Fuel Type
Performance Parameter
Channel power
Bundle power
Channel power peaking factor
Maximum
Average
Maximum
Average
Maximum
Average
DUPIC Fuel Option
Option 1
1.20*
0.49
0.89
0.57
1.20
0.46
Option 2
1.18
0.40
1.49
0.59
1.17
0.37
Option 3
0.77
0.34
1.11
0.57
0.76
0.33
* Percent
- 372 -

KAERI/RR-1999/99
Table 3.7-19
Comparison of Performance Parameters by Refueling Simulation
DUPIC
Fuel
Option 1
Option 2
Option 3
Performance Parameter
Maximum channel power (kW)
Maximum bundle power (kW)
Channel power peaking factor
Maximum channel power (kW)
Maximum bundle power (kW)
Channel power peaking factor
Maximum channel power (kW)
Maximum bundle power (kW)
Channel power peaking factor
DUPIC Core Model
Single Fuel
Type
6844
804
1.0625
6831
800
1.0627
6746
794
1.0620
30 Fuel Types
6843
805
1.0661
6843
806
1.0665
6755
801
1.0640
Difference
(%)
0.01
0.12
0.34
0.18
0.75
0.36
0.13
0.88
0.19
- 373 -

KAERI/RR-1999/99
2-Bundle Shift4-Bundle Shift6-Bundle Shift8-Bundle Shift
Fig. 3.7-1 Comparison of Axial Power of Channel L-3
- 374 -

KAERI/RR-1999/99
7000
6500
6000
*• 5500
o% 5000c
I
° 4500
4000
3500
2-Bundle Shift4-Bundle Shift6-Bundle Shift8-Bundle Shift
6 8 10 12 14 16 18 20 22
Column Position
Fig. 3.7-2 Comparison of Horizontal Channel Power for Row M
- 375 -

KAERI/RR-1999/99
7000
6500
6000
§ 5500
i_
| 5000Q."«3§ 4500CO
6
4000
3500
3000
2-Bundle Shift4-Bundle Shift6-Bundle Shift8-Bundle Shift
10 12 14
Row Position
16 18 20 22
Fig. 3.7-3 Comparison of Vertical Channel Power for Column 11
- 376 -

KAERI/RR-1999/99
- Channel L-3Channel L-11
5 6 7 8
Bundle Position
10 11 12
Fig. 3.7-4 Axial Power Shape for 2-Bundle Shift Core
- 377 -

KAERI/RR-1999/99
10 11 12 13 14 15 16 17 18 19 • 20 21 22
A
B
C
D
E
F
G
H
J
K
L
M
N
O
P
QR
S
T
U
V
W
3415
3608
3753
3760
3622
3459
3694
4127
4414
4686
4844
4874
4758
4536
4254
3818
3360
4001
4483
4941
5287
5557
5725
5781
5696
5492
5135
4644
4111
3431
3455
4071
4693
5171
5559
5849
6082
6268
6357
6320
6167
5836
5380
4815
4159
J3506
|3319
4042
4701
5213
5527
5791
5971
6115
6361
6491
6525
6480
6157
5777
5311
4766
4144
3395
2996
3836
4645
5241
5657
5866
6026
6045
6127
6343
6475
6547
6570
6440
6179
5842
5411
4840
4002
3091
3485
4377
5147
5658
5973
6064
6152
6180
6242
6358
6463
6536
6584
6567
6444
6322
6024
5457
4632
3662
3932
4779
5485
5906
6125
6160
6215
6222
6261
6332
6412
6490
6563
6621
6589
6579
6400
5902
5119
4183
3283
4158
5026
5668
5993
6025
6105
6165
6193
6220
6263
6329
6410
6492
6550
6559
6549
6582
6162
5433
4462
[3485
3350
4302
5129
5713
5984
5979
6067
6135
6156
6155
6165
6219
6317
6436
6519
6548
6554
6621
6249
5573
4649
3591
3418
4330
5082
5606
5862
5887
6051
6131
6130
6072
6019
6060
6190
6401
6523
6556
6510
6498
6140
5518
4705
3687
3417
4330
5081
5605
5860
5886
6050
6129
6129
6070
6018
6059
6188
6400
6522
6555
6509
6496
6139
5517
4705
3687
3348
4300
5126
5710
5980
5975
6063
6130
6151
6151
6161
6215
6313
6432
6515
6544
6550
6617
6246
5571
4647
3590
3280
4154
5021
5662
5987
6018
6097
6156
6185
6211
6255
6321
6403
6486
6544
6553
6543
6577
6158
5429
4460
3483
3927
4772
5478
5897
6114
6149
6203
6210
6249
6321
6402
6480
6555
6613
6581
Us726394
5896
5115
4180
1
3480
4370
5137
5647
5959
6049
6136
6164
6227
6344
6450
6525
6574
6558
6435
6314
6017
5452
4627
3658
2990
3827
4635
5228
5642
5848
6007
6025
6108
6325
6460
6534
6557
6428
6168
5832
5403
4833
3997
3088
3310
4031
4686
5195
5508
5770
5948
6093
6341
6472
6510
6464
6143
5764
5301
4757
4137
3389
3443
4055
4674
5150
5536
5824
6057
6244
6335
6300
6149
5819
5365
4803
4149
3499
|
3344
3981
4461
4917
5262
5530
5700
5757
5673
5472
5116
4628
4097
3421
3671
4103
4389
4660
4818
4849
4735
4516
4234
3801
3390
3582
3728
3736
3600
3438
Fig 3.7-5 Channel Power Map of Reference DUPIC Core
- 378 -

KAERI/RR-1999/99
7500
7000 -
to
6 6500 -
6000300
Full Power Day
500 600
Fig. 3.7-6 Maximum Channel Power for 600-FPD Simulation
- 379 -

KAERI/RR-1999/99
950 -
900 -
Q.
m
s0-
850 -
800
750100 200 300 400
Full Power Day
500 600
Fig. 3.7-7 Maximum Bundle Power for 600-FPD Simulation
- 380 -

KAERI/RR-1999/99
1.0
0.8
5> 0.6
iij2
8 0.4
0.2
0.0
! ;'
^ ^ ^ W ^ ^ ^
- Average Level- Highest/Lowest Level
100 200 300 400
Full Power Day
500 600
Fig. 3.7-8 Zone Controller Level for 600-FPD Simulation
- 381 -

KAERI/RR-1999/99
1.15
oo2.O)c(0a>a.
oa.
1.10 -
•53 1.05 |-
1.00100 200 300
Full Power Day
400 600
Fig. 3.7-9 Channel Power Peaking Factor for 600-FPD Simulation
- 382 -

RFSP code
TIME-AVER:Time-average calculation
INSTANTAN:Instantaneous calculation
SIMULATE:Refueling simulation
GENOVA code
ADJOINT:Adjoint calculation
PERTXS:Unconstrained sensitivity
Processing code
CALCON:Constrained sensitivityUncertainty estimation
KAERI/RR-1999/99
Covariance data
Fig. 3.7-10 Flow Diagram of Sensitivity Calculation
- 383 -

KAERI/RR-1999/99
10 11
|.S74 .855 .095
12 13 14 15 16
,797 .321,5551
17 18 19 - 20 21 22
BCDEF
.947 .187
.350 .587
.508j.666 .908.068 .311.463 .705.868 .110
197 .716 .961597 .121 .361000 .518 .755397 .918 .161
.242 .479
.637 .879
.042 .279
.437 .676
.208 .726
.608 .132Oil .529.408 .929
800 .324 .558 .840 .079
.500
.900
.300
.687,811 .334 .5681.850 .100
.971 .253
.371 .647
.766 .053
.171 .447
GH
.297
.692
.205
.605
.008
.405
.724 .968
.129 .368.250 .487
.645 .887.526 .763 .050 .287
.926 .168
.332 .566.445
237 .753 .997,634 .158 .395,040 .553
.276 .516
.674 .916.224 .740.621 .142
.795.684 .434 .955 .195
.837 .358 .595
.076 .318
.474 .713
.876 .118
.026 .540
.421 .940
.984 .263
.382 .658
.776 .063
.503
.904
.305
.218 .734
.616 .137
979 .258,376 .653
.021 .534 .771 .058 .300
.497
.897
.182 .458
.582 .863.700.105
.416 .934 .176 .453,576 .858
.695.016.413.816.097 .847 .087 .824 .345 .818 .340 .100
MNOPQ
.495
.895
.295
.221
.618
.024
.418
.821
.737 .982
.140 .379
.537 .774
.937 .179
.261
.655
.061
.455 .697
.500
.900
.303
.226 .742 .987
.624 .145 .384
.029 .542 .779
.424 .942 .184
.266 .505
.661 .905
.066 .308
.461 .703
.234 .750
.632 .155
.037 .550
.432 .953
.995 .274
.392 .671
.792 .074
.192 .471
.513
.913
.316
.711
.203 .721.126
.966 .247
.366 .642.524 .761 .047
.403 .924 .166 .442
.603
.005
.342 .579 .861 .103826 .347 .584 .866 .108 834 .355 .592 .874 .116 .805 .329 .563 .845
.484
.884
.284
.682
.084
.216
.613
.018
RSTUV
271 .511.211 .729J974 .255 .492 ,200 .718 .963 |.245
611 .134 .374013 .532 .768,411 .932 .174.813 .337 .571
.650 .892
.055 .292
.450 .700
.853 .092
,482.882.282.679
803 .326 .560 .842 .082
,600 .124.003 .521.400 .921
.363 .640
.758 .045
.163 .440
W ^•958 .240 .476 .213 .732 .976 I
Fig. 3.7-11 Age Distribution of Instantaneous Core
- 384 -

KAERI/RR-1999/99
DUPIC Fuel Option 1
1.13 1.18
Fig. 3.7-12 Distribution k^ for 30 Fuel Types (Option 1)
- 385 -

KAERI/RR-1999/99
oO
<5XI
E
3 U
40
30
20
10
g
* J * 1 "
DUPIC Fuel Option 2
n
n
r
flmll0.00020 0.00021
i • i •
fin
(11(1 [ f l n0.00022 0.00023 0.00024 0.00
U235 Number Density
Fig. 3.7-13 235U Content Distribution for 30 Fuel Types (Option 2)
- 386 -

KAERI/RR-1999/99
DUPIC Fuel Option 3
0.00018 0.00019 0.00020 0.00021
U235 Number Density
0.00022
235'Fig. 3.7-14 U Content Distribution for 30 Fuel Types (Option 3)
- 387 -

KAERI/RR-1999/99
7 8 9 10 11 12 13 14 15 16 17 18 19 20 21 22
.77
.83 .871.10 .891.20 .92.81 .77.65 .69.61 .63.57 .63.60 .60.62 .64.81 .691.18 .78.78 .67.54 .58.44 .48.39 .46
37) .2634 .3039 .2737 .30
26 .2223 .2222 .1514 .13
59 .4856 .5261 .4965 .5587 .58
18 .4216 .3120 .1522 .2028 .2835 .4541 .8030 .64
.42 .25
.38 .30
.43 .29
.41 .33
.46 .32
.43 .37
.43 .3336] .31
.51 .47
.56 .51
.57 .56
24 .3021 .2716 .2619 .2042 .2634 .22.18 .21.19 .20.27 .26.46 .30.78 .40.68 .29
.38
.33
.33
.28
.30
.2630.27.29.24
.45
.44
.39
.40
.36
.40
.38
.42
.35
.30
.60
.50
.49
.44
.47
.47
.57
.62
.52
.37
.70
.62
.54
.53
.52
.60
.751.12.69.49
.31 .36
.28 .35
.85
.79
.76
.68
.67
.62
.64
.62
.66
.66
.65
.56
.5346
.72
.70
.66
.65
.62
.64
.63
.65
.61
.59
.68
.65
.65
.62
.63
.61
Fig. 3.7-15 Channel Power Uncertainty due to Group-Average Fuel Property (Option 1)
- 388 -

KAERI/RR-1999/99
9 10 11 12 13 14 15 16 17 18 19 20 21 22
ARCDEFGHJKLMNOPQRSTuVW
.84
.89
.88
.88
.85
.85
.80
.84
.85
.87
.87
.86
.86
.82
.84
.80
|.69.73.77.82.83.93.87.88.82.81.84.78.79.75
1I
r.64.69.72.79.78.83.83.85.82.80.81.79.75.74.74R01L
11
.52.60
.63
.67
.68
.74
.76
.78
.82
.83
.80
.76
.76
.70
.70
.787477
—]
47.52.54.58.59.64.68.73.80.77.75.75.70.71.65.67.69737673
AT>.48.49.54.54.60.69.69.71.73.69.67.65.64.62.62.6766r>73
139
.43
.48
.53
.53|
.55
.58
.61
.61
.61
.61
.58
.56
.55
.55
.59|
.59647074
1
.3239.41.47.49.55.52.54.53.50.51.49.49.46.48.46.49.57616669.72
.3535
.3842.47.51.52.48.46.41.43.39.41.37.39.39.44.53586469.69
.2730.36.39.45.47.48.46.37.36.29.31.31.31.30.35.41.50596365.68
.3030.36.40.44.47.44.46.40.32.33.27.28.26.30.31.37.46556364.66
.2938
.38
.42
.44
.47
.46
.44
.38
.35
.34
.31
.29
.28
.28
.30
.36
.465?6165.67
35|43
.45
.46
.4750|.52.47.45.38.37.35.31.31.34.36.39|.4554556167|
43.49.46.49.53.51.55.51.48.47.41.38.36.33.44.44.48515560
5?
.53
.52
.56
.55
.56
.57
.53
.52
.52
.46
.46
.44
.41
.43
.47
.46535758
56.57.57.60.60.59.61.57.56.56.51.50.50.44.43.47.46535759
~M\.63.62.62.62.62.62.60.59.57.56.53.51.48.49.525559|
.67|
.67
.64
.65
.66
.65
.64
.62
.58
.57
.59
.54
.57
.55
.53
55f
.67
.70
.67
.67
.67
.67
.66
.65
.61
.59
.57
.59
.55
.52
.69
.68
.69
.71
.68
.67
.64
.63
.62
.60
.67
.69
.70
.65
.64
.65
Fig. 3.7-16 Bundle Power (Position 6) Uncertainty due to
Group-Average Fuel Property (Option 1)
- 389 -

KAERI/RR-1999/99
ABCDEFGHJKLMNOPQRSTUVw
8 9 10 11 12 13 14 15 16 17 18 19 20 21 22
.16 .24.35 .29 .23 .19 .21 .19 .25 .31 .45 .55
.58 .48 .29 .28 .21 .25 .24 .33 .37 .44 .69 .92
.91 .52 .36| .27 .27 .23 .28 .29 ,37| .51 .69 1.08.62 .511 .50 .36 .32 .23 .23 .25 .25 .39 .51 .591 .72 .73
.66 .54 .54
.64 .61.72 .72 .58.78 .69 .65.71 .73 .61.76 .62 .66
.70 .96
.49 .37 .32 .24 .17 .18 .26 .32 .44 .55.66 .67 .65.56 .46 .40 .27 .21 .15 .20 .19 .30 .46 .43 .48.57 .45 .38 .25 .21 .42 .43 .24 .26 .46 .41 .55.55 .52 .33 .30 .19 .32 .36 .23 .26 .34 .44 .46.62 .53 .40 .30 .15 .15 .21 .21 .27 .42 .49 .55.68 .52 .46 .30 .22 .22 .20 .22 .30 .40 .61 .76.89 .55 .42 .29 .35 .28 .30 .28 .32 .47 .63 1.14
.71 1.03 .85.69 .57
.58 .48 .32 .31 .43 .48 .33 .34 .39 .49
.43 .37 .39 .40 .75 .75 .40 .28 .28 .33
.59 .56
.58 .58 .64
.52 .63 .58
.65 .66 .59
.84 .63 .611.20 .80
.69 .74 .67
.44 .53.56 .42 .37| .28 .30 .67 .67 .30 .27| .21 .36 .37
.47 .42
Fig. 3.7-17 Channel Power Peaking Factor Uncertainty due to
Group-Average Fuel Property (Option 1)
- 390 -

KAERI/RR-1999/99
7500
7000
License limit
6500
6000
• Homogeneous Case• Heterogeneous Case
100 200 300 400
Full Power Day
500 600
Fig. 3.7-18 Heterogeneity Effect on MCP during 600-FPD Simulation
- 391 -

KAERI/RR-1999/99
950 -
900
I850
• a
800
750
License limit
• Homogeneous Case• Heterogeneous Case
100 200 300 400
Full Power Day
500 600
Fig. 3.7-19 Heterogeneity Effect on MBP during 600-FPD Simulation
- 392 -

KAERI/RR-1999/99
1.15
1.00
• Homogeneous Case• Heterogeneous Case
100 200 300 400
Full Power Day
500 600
Fig. 3.7-20 Heterogeneity Effect on CPPF during 600-FPD Simulation
- 393 -

KAERI/RR-1999/99
3.8
DUPIC
5.
CANDU
ROP H
.. SEU/DU S ^
DUPIC
. Doppler
. DUPIC
DUPIC
71 51*11
I, ROP S
5 .
DUPIC
7>
DUPIC , DUPIC
- 394 -

KAERI/RR-1999/99
DUPIC
CANDU-6 ^ > ? ^ 4 ^ i ^ ^] f } DUPIC
- 395 -

KAERI/RR-1999/99
3.9 ^H^Urrti
1. J.S. LEE et al., "Reaserch and Development Program of KAERI for DUPIC (Direct Use
of Spent PWR Fuel in CANDU Reactors)," Proc. Int. Conf. and Technology Exhibition on
Future Nuclear System: Emerging Fuel Cycles and Waste Disposal Options, GLOBALf93,
Seattle, USA, 1993.
2. H.B. CHOI, B.W. RHEE, and U.S. PARK, "Physics Study on Direct Use of Spent PWR
Fuel in CANDU (DUPIC)," Nucl. Sci. Eng.: 126, pp.80-93, May 1997.
3. H.B. CHOI, J.W. CHOI, and M.S. YANG, "Composition Adjustment on Direct Use of Spent
Pressurized Water Reactor Fuel in CANDU," Nucl. Sci. Eng.: 131, pp.62-77, Jan. 1999.
4. "Design Manual: CANDU 6 Generating Station Physics Design Manual," 86-03310-DM-000
Rev. 1, Atomic Energy of Canada Limited, 1995.
5. E.S.Y. TIN and P.C. LOKEN, "POWDERPUFS-V Physics Manual," TDAI-31 Part 1, Atomic
Energy of Canada Limited, 1979.
6. A.R. DASTUR et al., "MULTICELL User's Manual," TDAI-208, Atomic Energy of Canada
Limited, 1979.
7. D.A. JENKINS and B. ROUBEN, "Reactor Fuelling Simulation Program - RFSP: User's
Manual for Microcomputer Version," TTR-321, Atomic Energy of Canada Limited, 1993.
8. J.V. DONNELLY, "WIMS-CRNL: A User's Manual for the Chalk River Version of WIMS,"
AECL-8955, Atomic Energy of Canada Limited, 1986.
9. H. CHOW and M.H.M. ROSHD, "SHETAN - A Three-Dimensional Integral Transport Code
for Reactor Analysis," AECL-6787, Atomic Energy of Canada Limited , 1980.
10. H.B. CHOI, "A fast-running fuel management program for a CANDU reactor," Annals of
- 396 -

KAERI/RR-1999/99
Nuclear Energy, 27, pp.1-10, 1999.
11. M. EDEMUS and B.H. FORSSEN, "CASMO-3 A Fuel Assembly Burnup Program User's
Manual Version 4.4," STUDSVIK/NFA-89/3, Studsvik of America, Inc., 1989.
12. A.G. CROFF, "A User's Manual for the ORIGEN2 Computer Code," ORNL/TM-7175, Oak
Ridge National Laboratory, 1980.
13. H.B. CHOI and G.H. ROH, "A Sensitivity Study on DUPIC Fuel Composition,"
KAERI/TR-942/97, Korea Atomic Energy Research Institute, 1998.
14. The Economics of the Nuclear Fuel Cycle, Organization for Economic Cooperation and
Development, Nuclear Energy Agency, 1993.
15. J.W. CHOI, W.I. KO, J.S. LEE, M.S. YANG, and H.S. PARK, "Cost Assessment of a
Commercial Scale DUPIC Fuel Fabrication," Proc. the 6th Int. Conf. on Radioactive Waste
Management and Environmental Remediation, Singapore, Oct. 12 - 16 1997.
16. H.S. PARK et al., "The Construction of an Interim Spent Fuel Storage Facility," KAERI-
NEMAC/PR-35/94, Korea Atomic Energy Research Institute, 1994.
17. P.J. PERSIANI et al., "Fuel Reprocessing Data Validation Using the Isotope Correlation
Technique," Proc. Int. Conf. on the Physics of Reactors: Operation, Design and Computation,
Marseille, France, 1990.
18. N. ENSSLIM et al., "Analysis of Initial In-Plant Active Neutron Multiplicity Measurements,"
LA-UR-93-2631, Los Alamos National Laboratory, 1993.
19. Y.D. HARKER et al., "Precise Measurement of Fuel Content of Irradiated and Nonirradiated
Materials," 25th Annual Meeting of Institute of Nuclear Materials Management, 1984.
20. W.R. CORCORAN et al., "Damping of xenon oscillation in the Main Yankee reactor," Proc.
- 397 -

KAERI/RR-1999/99
American Nuclear Society 6th biannual conference on reactor operating experience, Myrtle
Beach, South Carolina, 1973.
21. F.A.R LARATTA, G.K.J. GOMES and CM. BAILEY, "Design and Assessment of the
Replacement ROPT Systems for Wolsong-1," TTR-289, Part 1(W1), Atomic Energy of
Canada Limited, 1995.
22. M.R. SOULARD, "NUCIRC Code Validation," TTR-301, Atomic Energy of Canada Limited,
1991.
23. J. PITRE, "ROVER-F Manual," TTR-605, Rev.l, Atomic Energy of Canada Limited, 1999.
24. E. GREENSPAN, "Sensitivity Functions for Uncertainty Analysis," J. LEWINS and M.
BECKER, Eds., Advances in Nuclear Science and Technology, Vol.14, Plenum Press, New
York, 1982.
25. J.J. DUDERSTADT and L.J. HAMILTON, Nuclear Reactor Analysis, John Wiley & Sons,
Inc., New York, 1976.
26. D.H. KIM, J.K. KIM, and H.B. CHOI, "A Generalized Perturbation Theory Program for
CANDU Core Analysis," Annals of Nuclear Energy, 2000.
27. C.R. WEISBIN, "Sensitivity and Uncertainty Analysis," J. LEWINS and M. BECKER, Eds.,
Advances in Nuclear Science and Technology, Vol.14, Plenum Press, New York, 1982.
28. G. WILLERMOZ, G. BRUNA, R. CASTELLI, and P. BETHOUX, "Studies on the Sensitivity
of PWR Core Parameters to Fuel Manufacturing Uncertainties via Statistical and Perturbation
Methods," 1994 Topical Meeting on Advances in Reactor Physics, Knoxville, 1994.
29. G.N. LANCE and W.T. WILLIAMS, "A General Theory of Classification Sorting Strategies
1. Hierarchical System," The Computer Journal, 9, pp.373-380, 1966.
- 398 -
KAERI/RR-1999/99
. DUPIC
- 399 -

KAERI/RR-1999/99
4. DUPIC
^ 7 ] (DUPIC)
CANDU ^^•S.^-M ° ^
.1'2 ZLBfth DUPIC
$17} nfl-grofl, DUPIC
^ ^ ] 1 ^ ] CANDU
71 4^r<Hl CANDU J&^>S.ofl DUPIC
CANDU
CANDU
D U P I C CANDU
o]
o]
7]
7} CANDU
ZLBiP.^, DUPIC
- ^ S . CANDU ^[^}
(discrete ordinates) ^ ^ ^ f Point Kernel
^ 7]^ 4^1 *VAnj DUPIC 4.1
fe, 7}
CANDU
- 401 -

KAERI/RR-1999/99
4.3*1 ofl/fe CANDU
- 402 -
DUPIC «¥<d.S.7} ^ -^£1 CANDU
1, DUPIC

KAERI/RR-1999/99
4.1 3L& ^ ^ }
^ Boltzmann
Boltzmann *!•§• * H * K r 3 f e
*B TP- 7>*1 yov^, -2T 4 ^ : ^ ^ (Discrete Ordinates Method)
Carlo)
CANDU5} ^ ^ 7f«y- # ^
EXTERMINATOR [Ref. 9] i f MAC-RAD [Ref. 10]# 4
ANISN [Ref. 11], DOT4.2 [Ref. 12]5f QAD-CG [Ref. 13]
4.1.1
fe ^ 4 CANDU
H«J ANISN SJE^r
^ H Boltzmann ^ £ ^ ^ ^ ^ ^^^)1 >«>f§-^>. ANISN
i« r jS^o ] *fliS*f7fl 7)1^>5]^ ^ # ^ f - ^ ^ ^ l (Deep Penetration
Problem)# *fl^*>7l JH*H ^V§-^>. CANDU
CANDU ^ ^ S . ^H^H^^lfe ^ l ^ A S . DLC-37D B M - M S]I4oflA-| AJA>^ 3 8
5- n1-^^! * f4S .# Af§-t>t>. DLC-37D e ro|_ti5]ej^ Experimental Power Reactor
(EPR) 2} q-fr^S. 2*&4\
ENDF/B-IV# ^ 7 ] 5 . 7H^*fSElc>.1S ^ . ^^K DLC-37D e>ola.
, 2. &$£$}5L $X^ ^^*i l ^11^1 a l ^ ^ ^ ^ - f Sfe Sife DUPIC
CANDU &
- 403 -

KAERI/RR-1999/99
BUGLE96 s>o| tL^e]! -
(LWR)
^ 51 o.n}, ENDF/B-VI [Ref.
3 f e *¥*KS°Jn}. BUGLE96
(Infinite dilute) ^ 9 3
(Self-shielded) 4downcomer
47$ ^ j - 20$
(BWR)
10571)
MCNP-4B 2 = f e
SJE-olc]-.18 MCNP-4B
cross-section)
>. NCNP-4B
MCPLIB1-,
(pointwise
«g^t;K MCNP-4B#
fe RMCCS $• ENDF60#
fe TMCCS1- -Si
DORT 3.^*1
4
GIP
, ^ i
^ ^ ^ * r S # ^^bcf. ANISN
fe GIP 3.^$] activity tabled]
ANSI/ANS-6.1.1-1977 [Ref.
(flux-to-dose conversion factor)# tH
BUGLE96., 4
- 404 -

KAERI/RR-1999/99
4.1.2 M q %\
, CANDU
ANISN 7f*M- ^ * f c 2 . ^ E U ^ S
3.717}
-^r ^B>H.el<>f ^ -a .AlS (calandria side tube
sheet), ^^rvfl^j B>4i7ot- ^- (carbon steel balls in light water) 9 |
# ^ . A ) ^ (refueling machine side tube sheet)^. ^Qr.}. 0} ^M.
^ 1600 cm^| ^ ? > ^ 1 ^ 137 cm
4.1.2.1
, CANDU ^ f ^ r
V l 2 0 CANDU
, CANDU Q
(time-average core)
7716 3} 6847
7228 MWdMTUoju]-.21
7]-. ANISN
CANDU ^ 1 ]
| l , BUGLE96 ^ ^ ^ } S # >)-§-*l 1^>^ ANISN
4-8-^ ^ - ^ 1 - ^ ^ ^^f^ n ^ £ ^ S 4.2-lofl
^r WIMS-AECL 3.^. ^ J i ^ ] ^ # ^ g ^ ^ ^ i -#Efl (3500
- 405 -

KAERI/RR-1999/99
3.
BUGLE96 * ^ £ 3 * r ^ l #^$a^l &^r £ 7r*l ^ # <*, l33Cs,150Dy, 166Er, 155Gd, 165Ho, 127I, 83Kr, I39La, 143Nd, 105Pd, I47Pm, 103Rh, 147Sm, 99Tc £131Xe g-ofl cU*1Hfe BUGLE96
<H, BUGLE96
. ^ -^m, CANDU ^
(L-ll, L-12, M-ll ^ M-12H
^ . \ c ^ # d o H ^ ^ ^5\Q i ^ ^ H5L±r 7.797X
10" fissions/cm3sec ^ ^ 723.125 kWth/bundle
<g*ot . n]^lx;f. d t ^ ^ x f (coarse mesh)
(spatial discretization),
(angular discretization), y ] ^ ^ ^ 4-ITEJ-^S. (order of anisotropy treatment),
(quadrature set) ^-o]] nj-ef x}o}7\ ^ ^ ^l^K CANDU #^>*fs|]
ANISN 7114H ^f§-5]^ * a ^ § ^ ^^g^-i- Al^^7l ^1*H, Bfl^^ ^ ,
§ ANISN
- 406 -

KAERI/RR-1999/99
\. MCNP-4B
ANISN
MCNP-4B 3 £
71
MCNP-4B nfl,
MCNP-4B
MCNP-4B
( v )
, MCNP-4B 3.
N0NU7f 5a
NONU
NONU
-i- #0)7]
1 7 ] ^ (variance reduction technique)^ A]~g-*}Sit:>.23 -f-^*> ^1^CH]A]^ A«
#t:-| n^^ T l l ^ l ^ i . 6>B||*V7] ^ * H , 4 ^ 1 ^ " ^ (particle splitting)
Russian roulette 3f ^ - ^ 7fl^|^ ^ ^ [ ^ ^ (population control method)#
71
10.0%
s. (PWT)l-MCNP-4B
*H # 20,000,0007])^
MCNP-4B
- 407 -

KAERI/RR-1999/99
- * S , ANISN
0.05%<Hl
MCNP-4B3.HS} S # Tally Tally (F4)# o]
Z) = f DFi<f>(E)dE (4.1-1)
.-fe ANSI/ANS-6.1.1-1977<HlA-|
Tally 9>£.
Tally ^}^6l F 6
MCNP-4B
5Nd, ' V
i 124 «?<tofl nflt> *?*fc§.# S.^}3. $lJL, ENDF/B-VI
fe ENDF60 ^ ^ > ^ ^ 4 ^ ^ # ^ S . 4-§-^>^t:|-. "15] 14, ENDF60
^ ^ : ^ ^ ^ , 83Kr, !01Ru, 103Rh, 10SPd, 108Pd, 113Cd, 13IXe, I43Nd,
, 148Nd, 149Sm, 151Sm, l52Sm, 154En, 155Eu, ^ 242mAm^ ENDF/B-V
fe RMCCS
^8: Thinning ENDF/B-VI, ENDF60#
Release 2 #
t a } ^ 139La, 160Dy, 161Dy, I62Dy, 163Dy, 164Dy, 166Er, 167Er, I31I, 144Nd, 146Nd, I50Nd,
238Np, 148mPm, 15!Pm, 148Sm, 153Sm,
Fission Product)^
!33Xe
TMCCS
. ( P s e u d o
-fe- MCPLIB02
>. ANISN ^ MCNP
], ANISN ^ MCNP-4B
- 408 -

KAERI/RR-1999/99
$L5L, BUGLE96#
ANISN 7 ] ] ^ -§^*h ^ U # -&*&#£• MCNP-4B T l l ^ ^ H]J2.*H 4
4 31.9%, 7.09% g 13.4% ^7)1 uj-Bf^r]-. #<g MCNP-4B Tfl^KgafSj X ^ S * M -
-f, #*} 91 ^ ^ i^ l -^ l cB*]: 7>^- ^ ^ r *>o|fe 4 4 1.2% g 2.7%o]
, CANDU € ^ S ^ l ^ ^ l ^ l f - 4 ><Hl BUGLE96
ANISN 3.^.%
e>. ANISN ^ MCNP
MCNP
ANISN
MCNP-4B ^ 2 } i f H]J2.^; ttfl, ANISN^ ^ 2 f e ^^>He]o> ^a.A]S<Hl^fe ^ 8%
CANDU ^J^>5.^ 1*> ^3Efl^l^i) « i ^ ^ # ^l^ofl BUGLE96
ANISN 3 - = #
4.1.2.2 DUPIC i^-y 7j|-il
DUPIC ^ ^ [ ^ ^ S^^gr WIMS-AECL S H 5 ] ^ ^ 7 ) ] ^ ^ ^^^J-Efl (7400
MWd/MTU)<HM ^-^f^cl-. ^ ^ « i >i3a}
ANISN2} MCNP
DUPIC ^ ^ S 7 } ^ ^ ^ CANDU
^ 4.437X10" fissions/cm3sec ^ f e 553.5 kWth/bundle<>l cf.
MCNP-4B 3 H S . ^-*> ^ ^ l - ^ a 2.4<H] Hl^j-^uj-. BUGLE96
ANISN S^<^1 *|?> # ^ 4 , %*} 9J ^ ^lBoll-^4 4 35.4%, 10.9% *i 13.4% ^711 ^}E>^t:}. MCNP-4B
4.0% if- 2.5%
- 409 -

KAERI/RR-1999/99
MCNP-4B
10% ^ ^ | I ^
, BUGLE96
MCNP-4BSf
- 410 -

KAERI/RR-1999/99
Table 4.1-1
Atomic Densities of Materials Used in CANDU Primary Shield Calculation
No.
1
2
3
4
5
6
Region ID
Stainless Steel304L
( p =7.9g/cm3)
Carbon SteelBall/H2O
(60/40 region)
Ordinary Concrete(,o=3.36g/cm3)
Moderator(p=1.09g/cm3)
Water
Air
Element
CSiCr
HC0
HC0
Mg
HD
H
0
Atomic Density(atoms/b-cm)
1.387E-041.271E-031.734E-02
2.674E-027.794E-041.337E-02
9.583E-031.143E-024.531E-026.018E-03
1.839E-46.599E-2
6.639E-2
5.018E-5
Element
MnFeNi
SiMnFe
AlSiCaFe
O
O
Atomic Density(atoms/b-cm)
1.732E-035.812E-028.107E-03
2.525E-045.010E-045.002E-02
1.534E-041.783E-037.498E-031.112E-04
3.309E-2
3.346E-2
- 411 -

KAERI/RR-1999/99
Table 4.1-2
Reference Number of Meshes and Dimensions Used in End Shield ANISN
Calculation
Region
1
2
3
4
5
6
Total
Region ID
Core
Calandria Side TubeSheet
Carbon Steel Ball &Water
Fuelling Machine SideTube Sheet
Concrete Wall (I)
Concrete Wall (II)
Number ofMeshes
90
10
90
15
20
50
275
Thickness(cm)
297.18
5.08
78.74
7.62
30.48
82.52
Radial Distance fromCore Center (cm)
297.18
302.26
381.00
388.62
419.10
525.62
- 412 -

KAERI/RR-1999/99
Table 4.1-3
Comparison of Dose Rate through End Shield between ANISN and MCNP-4B
Code
ANISN
MCNP-4B
Cross SectionLibrary
BUGLE96
ENDF60(ENDF/B-VI)
Dose Rates (/iSv/hr)
neutron
1.2624
1.8543(1 ±0.0889)
gamma
55.7034
59.8872(1 ±0.0583)
total
56.9658
65.7415(1± 0.1063)
- 413 -

KAERI/RR-1999/99
Table 4.1-4
Comparison of Dose Rate through End Shield for DUPIC Fuel Core
Code
ANISN
MCNP-4B
Cross SectionLibrary
BUGLE96
ENDF60(ENDF/B-V1)
Dose Rates (^Sv/hr)
neutron
1.6026
2.4811(1 ±0.0914)
gamma
66.4504
73.8065(1 ±0.0602)
total
66.0530
76.2826(1 + 0.1094)
- 414 -
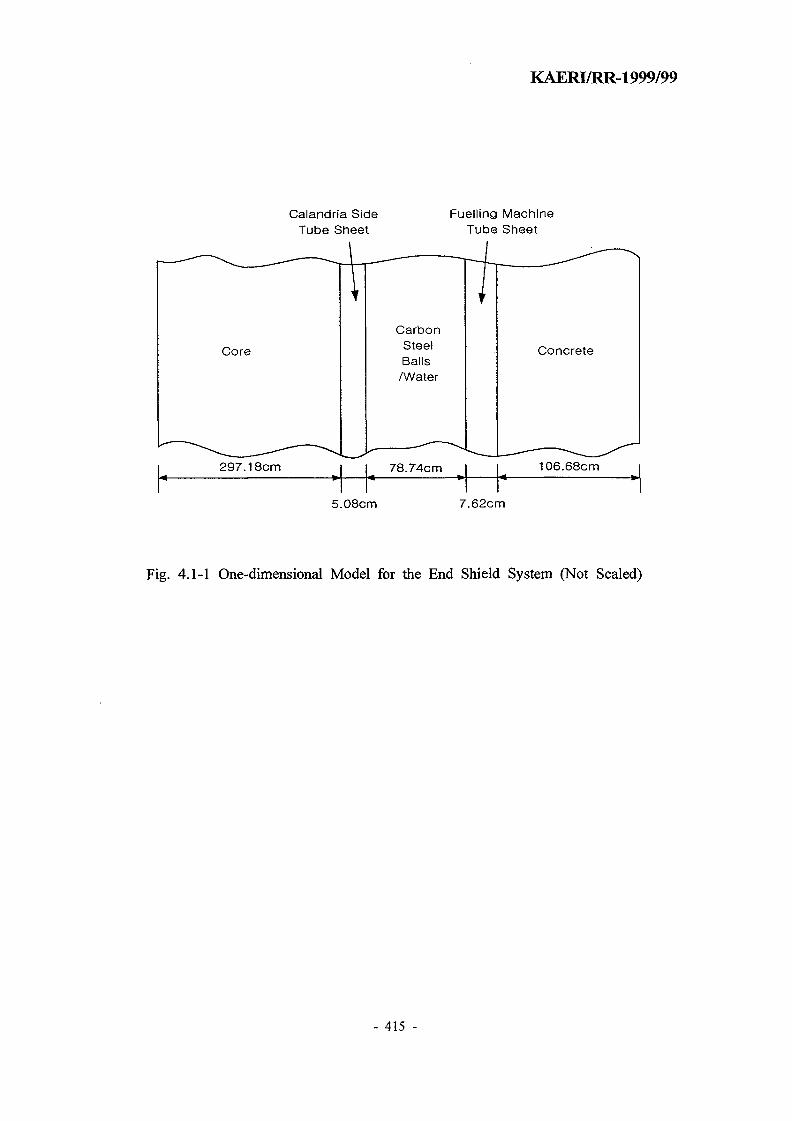
KAERI/RR-1999/99
Calandria SideTube Sheet
Fuelling MachineTube Sheet
Core
297.18cm
CarbonSteelBalls
/Water
78.74cm
Concrete
106.68cm
5.08cm 7.62cm
Fig. 4.1-1 One-dimensional Model for the End Shield System (Not Scaled)
- 415 -

KAER1/RR-1999/99
1 2 3 4 5 6 7 8 9 10 11 12 13 14 15 16 17 18 19 20 21 22
A
B
C
D
E
F
G
H
J
K
L
M
N
O
P
Q
R
S
T
U
V
W /
//
//
f
Inner/Outer Core Boundary
Fig. 4.1-2 Core Channel Map for CANDU-6 Reactor
- 416 -

Dose Rate Distribution
i
no3ari;
Io
CD
nustar
T I
33oore
Cen
CD
I
8"

KAERI/RR-1999/99
10"°"
300 310 320 330 340 350 360
Distance From Core Center (cm)
370 380
Fig. 4.1-4 Comparison of Heat Deposition Rate through End Shield
for Natural Uranium Core
- 418 -

do'
ynIICD
a•SoenSiOS
sm
cOno3
Heat Deposition Rate (mW/cm;
ga
T1
Ioo3
> S1 oCO Z
DO
Fueling Machine Side Tube Sheet..i i i i i

KAERI/RR-1999/99
4.2 CANDU
Mli)
ii)
iii)
iv) ZL
61 cf. CANDU
2*}
4.2.1 CANDU
f. ZI^} 4.2-
^-7} ^71
CANDU
^ t : } . CANDU DUPIC
DUPIC
al7l nfl^ofl, DUPIC
4.2.1.1
5.07 cm .a.A]^, 78.74 cm
^ . ^ ) ^ 91.44 cm o]u>.
i ^ 304LS ^>#<H %
- 420 -

KAERI/RR-1999/99
4.2.1.2
160 cm
122 cm H , 7.6 cm
4.2.1.3
>3. 532 cm
(reactivity mechanism deck)
122 cm -^
:>. CANDU
4.2.1.4
122 cm
220 cm 122 cm
44
4.2.2
&JL,
30 mSv
Atomic Energy Control Act^]
602.(2)
50
-. CANDU4.2-lofl
- 421 -

KAERI/RR-1999/99
4.2.3 DUPIC
, DUPIC
. DUPIC
CANDU
CANDU
CANDU €
DUPIC
ANISN
4.2.3.1
DUPIC
^ ^ 1 RFSP [Ref. 26]#
ANISN
xQcxl03[W/kW]x3.1xlQ10 [fissions/W • sec]
»
= 5.797 x 10¹¹ [ fissions/cm3 • sec].
(MW)
(kW),
h^ (MW)
(cm) °]3.
(cm)
^ 4
- 422 -

KAERI/RR-1999/99
SL ^ S ^ M Tfl^^cf. ^ - f e B ? ^ DUPICWIMS-AECL 7ff-&©3.-fB| <£$X3., ^ «|<2Sofl
t>. ^ - f s H ? ^ DUPIC ^<£3.ofl tR> ^ ^ ti<M-5fe #A3*HNr 4 42.66632]- 2.7094 o]v\. ^ < £
4.2.3.2
> # ^ - S ^ ANISN 2.H
4 ^ ^ 5 ] 3.71-fe- 4.1.2^^
]-. 4 7H£| 7>^ ^ ^^(^1 cfl*> ^-^*o> # ^ ^ S ^ H ^ 4.2-4ofl
^I ^ ^ l ^ ^ § ^ ^ ^ i ^ ^ € ^ ^ B f e ±^3}- DUPIC
4 4 5.797X10" and 4.437 xlO11 fissions/cm3 sec o|t:f.
, DUPIC
^ ^ l lH, DUPIC
, DUPIC Jt-yil ^-f, ^*J - t^^r 4
DUPIC
DUPIC in^]*] #^^]-3S|l^]l- ^-*> # ^ ^ 1 " ^ : 3.i& 4.2-561)
^ : S 4.2-26H ^SdL^>. S 4.2-2^1^
(cosine-shape) ±3. a o v # ^ ^ *^ R$ ^ [ ^ ^ i ^ (disc
- 423 -

KAERI/RR-1999/99
source) o]z\ 7\ii\ (flux) £ t ^ s f £0}
(314 cm)
l (1600 cm)
= 0.0193 ol
4.2-2^ n]
(water region) o] ^ 7 ] rcfl ofl
4.2.3.3
4.2-3ofl
^ £ ^ S 2.iofl
DUPIC
DUPIC
DUPIC 7
DUPIC
A
DUPIC
^ H ^ 4.2-82} JE 4.2-2ofl
length correction factor) -if
factor)#
(finite
(non-uniform source correction
- 424 -

KAERI/RR-1999/99
? B l DUPIC
(0.9958)^- £cK € ^4.2-2^
25/iSv/hr# ^ S i J l , o]o]] tf|Sj]Af^ CANDU
CANDU ^4x]-S<H| ^ ^ ^ DUPIC
4.2.3.4
ANISN
fe o]# ^ ^ ^ f e ^ ^ S-^A^ ^*<Hxl ^ ^ ^ w^s . ^6\7]7\
DUPIC
DUPIC Jn^Sj ^ ^ W * # ^ ^ 3 E f e ZL^ 4.2-9ofl £A]^f^t;].. o]
ZLQ 4.2-10c>fl
fe 0.9534olJL, ^ ^ - f e
DUPIC ii^ofl cBtl H ] ^ ^ ^ ^ i ^ ^ l ^ f e 4 4 0.6805 } 0.7644o]r:f.
- 425 -

KAERI/RR-1999/99
4.2.3.5 *F
44 9
4.2-llofl
DUPIC
0.9944olt:f. *J<£-f5^ ii^^J- DUPIC
fe 4 4 0.8653^} 0.8637 °]&i:}. 5 . 3.2^1 A-] j t
DUPIC
4.2.4
] c||tb ^ * f # (heat load) # ^<g«fee(| ^A*fcK 4.2.1^^]^ <&&# Hf f
1, DUPIC ^ ^ S 7 f ^ -^s l CANDU
6l-g"*H DUPIC
4.2.4.1
4. 4 7H 5]^4 *1| *1 4 ^ o #^
DUPIC ii^oil cflsH 4 4
- 426 -

KAERI/RR-1999/99
5.797X10" £} 4.437X10" fissions/cm3
, DUPIC i ^ M cfl > %• <g-§Ml- ^S-fe ^ - ^ H i ? ii^oKI «1*B ^ 17%
(form factor)# # # * M 4
^ f DUPIC ii^ofl cHtt ^Efl^l^fe 4 4 0.711 2f 0.862
. ANISN 3 . H S m
Total Nuclear Energy Deposition (MW)
= [Neutron Heating (mW/cm2) + Gamma Heating (mW/cm2)]
x [Area of two end shields (2 x 380 channels x 28.5752 cm2/channels)]
X [Radial form factor at core end (0.711 for Natural Uranium and 0.862 for DUPIC)]
x[10"9 MW/mW].
44.2-6^1 ^o]x\ 6iu}. 0} S S - J f e ] , DUPIC
11%, 29% 9J 31%
(2158.5 MWth) 3} H]J2.*>^, DUPIC it^©fl &<>H ^^>^N1^1] 4
4.2.4.2
ANISN 3 . ^ ^ ^^*}$Elr:K ©]
- 427 -

KAERI/RR-1999/99
., DUPIC
# i ^ ^ ? fe ^ ! 35%
± DUPIC i i ^^ l tBt> ^BH^^fe 4 4 0.635 ^ 0.794 o|u|-.
ANISN 3.B.S. n*ys± 2r&*W 4 * ^ 4
Total Nuclear Energy Deposition (MW)
= [Neutron Heating (mW/cm) + Gamma Heating (mW/cm)]
x[Core Length (594.36cm)]
X [Axial form factor at core end (0.635 for Natural Uranium and 0.794 for DUPIC)]
x [10'9 MW/mW].
, DUPIC i i^£) ^ -^^M 7i] <Hl ^ - ^ 5 ) ^ #<>llM*fe ^«?l
. ^ 1 ^ 4^}. H5iS.S, o] ^2}S.-?-Bl, ^^|j 7}%-^-9l CANDU
DUPIC «}^S7i- J- SlSEl-i- ^-f, ^ ^ - f e f e ii-y^]- a]ja*H
4.2.5
2]- DUPIC
DUPIC
, DUPIC
- 428 -

- 429 -
KAERI/RR-1999/99
, DUPIC
CANDU &*}£.*]} DUPIC
4.2-62f 4.2-7
, DUPIC

KAERI/RR-1999/99
Table 4.2-1
Summary of CANDU Primary Shield Thickness and Design Criteria
Shield System
End Shield
Side Shield
Top Shield
Bottom Shield
Composition and Thickness
- the calandria side tube sheet 5.08cm thick- the carbon steel balls and light water region 78.74cm thick- the fueling machine side tube sheet 7.62cm thick- the concrete containment wall 137cm thick
- vault water 122cm thick- vault concrete 122cm thick- air gap 7.6cm thick- reactor building cross-wall concrete 160cm thick
- the vault water 532cm thick- the reactivity mechanism deck 122cm thick
- the vault water 220cm thick- the vault concrete 122cm thick- the concrete ceiling 122cm thick above room Rl-012
Design Criteria(In Operation)
< 6//Sv/hr
< 25 ju Sv/hr
< 250// Sv/hr
< 25//Sv/hr
- 430 -

KAERI/RR-1999/99
Table 4.2-2
Comparison of Dose Rates through Primary Shields
(Unit : ^Sv/hr)
End Shield
Side Shield
Top Shield
Bottom Shield
Core Type
Natural Uranium
DUPIC
Natural Uranium
DUPIC
Natural Uranium
DUPIC
Natural Uranium
DUPIC
Neutron
1.2624
1.6026
4.183E-9
4.076E-9
2.523 8E-20
2.3731E-20
2.128E-12
2.2719E-12
Gamma
55.7034
66.4504
79.1951
57.0177
26.8640
18.6702
49.9925
39.3647
Total
56.9658
68.0530
79.1951
57.0177
26.8640
18.6702
49.9925
39.3647
Calibrated*
1.0801
1.3134
69.0740
51.8177
18.2810
13.6050
43.4485
34.1528
*The attenuation factor is considered for the end shield which the finite length
correction factor and the non-uniform source correction factor are considered
for the side, the top the bottom shield system.
- 431 -

KAERI/RR-1999/99
Table 4.2-3
Number of Meshes and Dimensions for side shield Calculation
Region
1
2
3
4
5
6
7
Total
Region ID
Core
Reflector
Calandria Wall
Vault Water
Liner
Concrete I
Concrete II
Number ofMeshes
110
36
5
80
5
40
80
356
Thickness(cm)
314.30
65.46
2.858
121.92
0.635
121.92
160.02
Radial Distance fromCore Center (cm)
314.30
379.76
382.62
504.54
505.17
627.09
787.11
- 432 -

KAERI/RR-1999/99
Table 4.2-4
Number of Meshes and Dimensions for Top Shield Calculation
Region
1
2
3
4
5
6
7
8
9
10
11
12
13
Total
Region ID
Core
Reflector
Calandria Wall
Vault Water(l)
Vault Water(2)
Vault Water(3)
Vault Water(4)
Air Gap
Steel Lower Deck Plate
Ordinary Concrete
Steel Upper Deck Plate
Air Gap
Steel Tread Plates
Number ofMeshes
110
35
5
160
200
200
140
2
5
27
5
2
10
901
Thickness(cm)
314.30
65.46
2.86
121.92
152.54
152.54
104.81
30.48
2.54
71.12
2.54
35.56
10.16
Radial Distance fromCore Center (cm)
314.30
379.76
382.62
5.4.54
657.08
809.62
914.43
949.91
947.45
1018.57
1021.11
1056.67
1066.83
- 433 -

KAERI/RR-1999/99
Table 4.2-5
Number of Meshes and Dimensions for Bottom Shield Calculation
Region
1
2
3
4
5
6
7
8
Total
Region ID
Core
Reflector
Calandria Wall
Vault Water
Vault Water
Liner
Concrete I
Concrete II
Number ofMeshes
110
36
5
80
65
3
40
40
379
Thickness(cm)
314.30
65.46
2.858
121.92
97.79
0.635
121.92
121.92
Radial Distance fromCore Center (cm)
314.30
379.76
382.62
504.54
602.33
602.97
748.89
846.81
- 434 -

KAERI/RR-1999/99
Table 4.2-6
Total Heating in Two End Shield Components during Reactor Operation
Component
Calandria SideTube Sheet
Carbon Steel Ball/Water Region
Fuelling MachineTube Sheet
Natural Uranium
Heat Rates (mW/cm2)
Neutron
1.74E+1
1.07E+2
2.35E-5
Gamma
2.76E+3
1.96E+3
9.06E-3
Total
2.79E+3
2.07E+3
9.08E-3
Total(MW)
1.23E+0
9.14E-1
4.01E-6
DUPIC
Heat Rates (mW/cm2)
Neutron
3.46E+1
1.36E+2
2.98E-5
Gamma
2.57E+3
2.25E+3
1.09E-2
Total
2.60E+3
2.38E+3
1.09E-2
Total(MW)
1.39E+0
1.28E+0
5.85E-6
- 435 -

KAERI/RR-1999/99
Table 4.2-7
Total Heating in Side Shield Components during Reactor Operation
Component
Reflector
Calandria Shell
Vault Water
Steel Liner
Concrete
Natural Uranium
Heat Rates (mW/cm2)
Neutron
1.71E+6
4.19E+2
2.42E+2
1.80E-6
1.01E-4
Gamma
1.03E+7
2.83E+6
1.48E+6
5.32E+3
3.12E+4
Total
1.20E+7
2.83E+6
1.48E+6
5.32E+3
3.12E+4
Total(MW)
4.52E+0
1.07E+0
5.60E-1
2.01E-3
1.18E-2
DUPIC
Heat Rates (mW/cm2)
Neutron
1.67E+6
3.04E+2
2.24E+2
1.75E-6
9.86E-5
Gamma
8.50E+6
2.06E+6
1.08E+6
3.85E+3
2.25E+4
Total
1.06E+7
2.06E+6
1.08E+6
3.85E+3
2.25E+4
Total(MW)
4.80E+0
9.71E-1
5.09E-1
1.82E-3
1.06E-2
- 436 -

KAERI/RR-1999/99
Bottom Shield i
InaccessibleArea DuringOperation
Accessible Area Dunng Operation
\ D;O Reflector(65.48cm)
Fig. 4.2-1 CANDU Primary Shield System (Not Scaled, Unit : cm)
- 437 -

0.40
KAERI/RR-1999/99
10- 10" 10'Energy, (MeV)
Fig. 4.2-2 Fission Neutron Spectrum for both Natural Uranium and DUPIC Fuel
- 438 -

KAERI/RR-1999/99
otoCOCM
to
VSide ShieldSource Term
Top ShieldSource Term
End ShieldSource Term
4
297.18 cm
^ • Z
Bottom ShieldSource Term
Fig. 4.2-3 Coordinates Used for Source Term Generation
- 439 -

KAERI/RR-1999/99
800
700-
600-
1.3?-ac
m
500-
400-
300-
200-
1003 4
Plane Number
Fig. 4.2-4 Axial Power Distribution for End Shield Calculation
(Average over Channels L-ll, L-12, M-ll and M-12)
- 440 -

Dose Rate (uSv/hr)o o o o o o o o o o o o o
(TO
4^
o
II
Ien
O
f
I(0
I
(Jl
013a.
Q>ter
oarb
oCO
Ball
V\
Calandria Side Tube Sheet
Fueling Machine
Co,
QCO
SO
I5'3a>2-sall
Ij/
/
/
f
•a:l'n'f
'/!'/'/ill
11IS
, . i , ,
/
3 / y3 Z#\/f
/
/
X / S i d e Tube Sheeta I
I
,j j j j j ,
DcO
/
y
zc3c33
I
imij
/
-
-
-
_
_

KAERI/RR-1999/99
500-
400 -
5 300oQ.
I 200-m
100-
-
•
-
1 1 1
i I
Natural UraniumDUPIC
1
1
-
_
-
1 2 3 4 5 6 7 8
Plane Number
9 10 11 12
Fig. 4.2-6 Bundle Power Distribution on Core Side
(Average over Channels L-l, L-22, M-l and M-22)
- 442 -

KAERI/RR-1999/99
800-
750 -
7 0 0 -
=-• 650 -
ower
« 6 0 ° -c
m 5 5 0 -
500-
4 5 0 -
1 1 1 1 1 1 1 1 1 1
i__^_r-r~J -
; ;-
-- •
DUPIC
-
-
11 10 9 8 7 6 5 4 3 2 1
Channel Column Number
Fig. 4.2-7 Radial Power Distribution for Side Shield Calculation
- 443 -

KAERI/RR-1999/99
350 400 450 500 550 600 650 700 750
Distance from Core Center (cm)
Fig. 4.2-8 Comparison of Dose Rates through Side Shield
- 444 -

KAERI/RR-1999/99
800-
750-
700-
i 650-
| 600 -a>
§ 550-1m
500-
4 5 0 -
400
_ l I I I I I
-Natural Uranium-DUPIC
K Ji I
H G F E D
Channel Row Number
Fig. 4.2-9 Radial Power Distribution for Top Shield Calculation
- 445 -

KAERI/RR-1999/99
350 400 450 500 550 600 650 700 750 800 850 900 950 1000 1050
Distance from Core Center (cm)
Fig. 4.2-10 Comparison of Dose Rates through Top Shield
- 446 -

KAERI/RR-1999/99
850
800-
750-
700-
650-
o0- 600-
I 550-f500-
450-
400
- Natural Uranium• DUPIC
i i i i i r iM N O P Q R S T
Channel Row Number
U V W
Fig. 4.2-11 Radial Power Distribution for Bottom Shield Calculation
- 447 -

KAERI/RR-1999/99
10'1
10°
I ' I ' 1
• Natural Uranium• DUPIC
350 400 450 500 550 600 650 700 750 800
Distance from Core Center (cm)
Fig. 4.2-12 Comparison of Dose Rates through Bottom Shield
- 448 -

Heat Deposition Rate (mW/cm3)
ostaneeF
rom
Co
3o(DZJ
&
D
300
CO
o ~
S3-O
8-o
340
w8"
•COO) -o
S3-o
8 -o
/'
Y,,,\
S?8-o32?eel
Balland
Watei
/
/
i
Calandria Side Tube Sheet
/'
//
/ '
/
//
//
/
/
DCTJO
Fueling Machine Side Tube Sheet
i i i , ,
/*
-
zc5LC
ss3C3
*

KAERI/RR-1999/99
- Natural Uranium-DUPIC
350 400 450 500 550 600 650 700 750
Distance from Core Center (cm)
Fig. 4.2-14 Comparison of Heat Deposition Rates through Side Shield
during Full Power Operation
- 450 -

KAERI/RR-1999/99
4.3 &} i i l fl> ^Ki §%*
CANDU Qx}S.*\] DUPIC
$1*11
(pressure tube)2} # ^ o ] ^ - (end fitting joint)^ 7}Q * } ^ •§• (groove),
elo} -f-^^1 (subshells)^l- % ^ ^ (annular plates) -M-o|Sj
CANDU ^J^Sofl DUPIC
7| £|3rH DPA (Displacement per Atom; *3:
CANDU ^ H ^
\. o] <&*Wl^ ^ ^ H B l o > ^ * | } (mainshell)
1 1-&1 Pfi^^1 (embedment ring)# ^ . ^ ^ f e
(steel slab shieldHr.}. o] Jf ^ l a f l ^ ^ - 3 . s l S ^ ^ £ 7 > 65.6OC-S.t:l-
K ^-S]J5LS., CANDU 414S&11 DUPIC
DPA
ANISNi)-
4.3.1
- 451 -
KAERI/RR-1999/99
(electronic excitation)* «*lJ>zl ^ $i°M,
(cascade)fe «J:3:(recoil)
1 ^ ^ , DPA
DPA = (4.3-1)
0.8©l
31
NJOY97.95 [Ref.
Cr, Fe
^ 25
40
DPA
ENDF/B-VI
ife
H ^ 4.3-2
4.3.1.1
5.08 cm Jf-n*) *±&2=LT!\O}
78.74 cm - ^
^ 6.8
7.62 cm
>. 4
28.58 cm
sat}, -L
- 452 -
KAERI/RR-1999/99
ield plug
assemblies)^.
^ 4.3-KHl
3 8 0 7 ^
4
MCNP-4B
28.575
^ 3 | - DUPIC
4.3-33|- 4.
WIMS-AECL
.8200, .9185 ^J 1.126254JL, DUPIC
.7869,
.5399, .7792, .9387 ^
4.2.3.1
4.3-l3f 4.3-2ofl 4 4
30% DUPIC
nfl,23%
- 453 -

KAERI/RR-1999/99
4.3.1.2 ^ e > ^
CANDU (shell) 7} $X
304LS , 2.86 cm
337.82
379.73
plate)^
(sub-shell)4 ^ - ^ ^ 1 (main-shell)^. 9"
(annular
1.9
CANDU ^^>S.fe 3 8 0 7 ^ , 4(on-power)
MCNP
1/8
. MCNP-4B
(repeated structure) #*}$. vj|5]
71 g :
4DUPIC
o)
- 454 -

KAERI/RR-1999/99
4 ^<$.£. -S-^ # « j £ WIMS-AECL
3.*\zM*\2\ DPA
S 4.3-3 ] ^M$X^\. ^ - f sHi r i i ^ 4 nlJl*H, DUPIC
DUPIC ^ ^ ^ # ^ ^ fll^
DPA #7>eo># ^ . ^ ^ ttfl, DUPIC «J«lS7l- CANDU
4.3.2
65.6°CS.
- ^ 20 mW/cm2
4.3.2.1
- 455 -

KAERI/RR-1999/99
%• <i%Kg- ANISN 3 H
ZL J 4.2-14^
exp (4.3-2)
H H 4.2-14o)|
ft ^ ^ r 0.0582 Af 0.0578
DUPIC
DUPIC
. ^^-, ^ ^ i - f e f e ^ DUPIC
9.9524 mW/cm2 i{- 7.2552 mW/cm2o|
20
s^ 44
^ 2O.o°c^
54°C ol:n, # S 49"
3.7] 4^<>1| (
* f e A B] (x
627.09 cm),
- 456 -

-PL
KAERI/RR-1999/99
]• (4.3-3)
(57.51), ?2fe
(20.0TC), L ^ : •g-S. 3 . B | H ^ ^ J (281.94 cm), *fe
(17.31 mW/cm°C), ZLe l i <?ofe # ^
. (4.3-4)
DUPIC « | ^ S i l<Hl tflSfl 4 4 23.42 cm^ 19.25 cm^tf. o) nfl, ^ -S
JH^ ^ H ^ S ^ r ^ ^ - f Bfe^- DUPIC ^ ^ 5 . i^^^l tflsfl 4 4 55.51
53.82°C^14. aeiJE^., ^^-fefe^l- DUPIC
7} t
4.3.2.2
fe 122 cm M | I ^ ^ M^ $-ISli-K # ^ ^ ^ ^ J f *l*)*g (support ring)^
S . f e 122 cmJB.i;> ^ ^
(end-wallH 1 ^
<H1A-| i f e H}ir 4 ° 1 , 15 cm ^ | 5 ] ^l^Bo1 *rsfl»]; (support
ring shielding slab)i|- 4 7^^ ^ 1 $ ^}^]^V (curtain shielding slab; ^-V\] 5 cm)©] _SL
- 457 -

KAERI/RR-1999/99
DORT#
BUGLE96 J ^
44
DUPIC
3500 MWd/MTU, DUPIC: 7400 MWd/MTU)<Hl>H WIMS-AECL S H f o)-g- r}<*}
4 ^ * g ^ ^ < i ^35. ^ 5 ^ ZL^ 4.2-45f 4.2-7^1
DUPIC
^ ^ ^ ^ ^ 1 ^ : € ^ f f e f DUPIC0.1011 mW/cm33} 0.1215 mW/cm3^]c>. 4.4.1^<HH -S-^l
^ DUPIC «)<^^ i^^<^] cB*H - g ^ - t 1.0 mW/cm3^l AoV-§-^fe ^ ^ ^ r 4 4
17.1842 mW/cm2^ 17.3109 mW/cm2<>lv\. tc}sH, ^ Aofl-H^ < i ^ ^ : 4 4 1-7376
mW/cm2 5J 2.1030 mW/cm2o|t:>. ^ ^ - f Bffe- Jt^l-^ <i^-^l «1*H DUPIC
20 2
(65.
^ DUPIC
- 458 -

KAERI/RR-1999/99
Table 4.3-1
DPA at Innermost Groove of Pressure Tube to End-Fitting Rolled Joint
during 30 Years Reactor Operation
Natural uranium fuel
DUPIC fuel
DPA
0.40238 (1 ±0.0069)
0.52460 (1 ±0.0147)
Comparison oftolerable time
-
I 23.3%
- 459 -

KAERI/RR-1999/99
Table 4.3-2
DPA at Weld between Heavy Steel Plates used to Construct Calandria Side Tube
Sheets during 30 Years Reactor Operation
Natural uranium fuel
DUPIC fuel
DPA
1.16235 (1 ±0.0047)
1.50077 (1 ±0.0119)
Comparison oftolerable time
-
| 22.5%
- 460 -

KAERI/RR-1999/99
Table 4.3-3
DPA at Corner of Calandria Sub-shells and Annular Plates
during 30 Years Reactor Operation
Natural uranium fuel
DUPIC fuel
DPA
0.05298 (1 ±0.0711)
0.05807 (1 ±0.0664)
Comparison oftolerable time
-
i 8.8%
- 461 -

KAERI/RR-1999/99
Annuls Gas DPA Calculating PoinTLattice Tube *- Calandria side Tube sheet
.-Sleeve Insert Annulus Gas
Coolant End Fitting
Coolant
lugFuelAdaptor Fuel Bundle
Pressure Tube
Fig. 4.3-1 Fuel Channel System
- 462 -

KAERI/RR-1999/99
. r •. _
. • CALANOFUA VAULT ENO WALL : •
SUPPORT SHELL
V
o
REACTIVITYMECHANISMTHIMBLE
ENOSHIELDSHELl
WELDS OUTSIDE OF CALANOHIATUBESHEET ARE NOT INCLUDEDIN THE CALANORIA VESSEL BOUNDARY
SLEEVE INSERT -
SUPPORT•S PLATE
ns=2,, CALAN0R1A ANNULAR p-.ATE V
DPA CalculatingPoint
LAI I ICE TUBE
^FUELLING MACHINE SIDE TUBESHEET
END SHIELD
CALANDRIACALANORIA SIOETUBESHEET
.PRESSURE TUBE
I L JCALANORUTUBE
LEGEND:CALANORIA VESSEL PRESSURE BOUWJARYBALANCE OF ENDSHIELD. ISTRUCTJRALSUPPORT AND SHIELDING ATTACHMENT)
Fig. 4.3-2 Calandria Shell
- 463 -

KAERI/RR-1999/99
Fuel Elements
D2O Primary Coolant
Pressure Tube
Gas Annulus
Xalandria Tube
Moderator
Fig. 4.3-3 Configuration of Natural Uranium Fuel Lattice
- 464 -

KAERI/RR-1999/99
Fuel Elements
D2O Primary Coolant
Pressure Tube
Gas Annulus
Calandria Tube
Moderator
Fig. 4.3-4 Configuration of DUPIC Fuel Lattice
- 465 -

KAERI/RR-1999/99
LEAD AND STAINLESSSTEEL WOOL RADIATIONSHIELDING
RING SHIELDINGSLAB
HEAVYWATERCALANORIA
Fig. 4.3-5 End Thermal Shielding
- 466 -

KAERI/RR-1999/99
4.4
DUPIC
DUPIC
CANDU
DUPIC
^ S i d W M S j DUPIC
DUPIC ^<&g. ^ - ^ 91 ^HHf DUPIC
^ DUPIC
fe DUPIC
DUPIC
ZL
DUPIC
. DUPIC
^ CANDU
DUPIC
. ZLSm DUPIC
DUPIC
DUPIC
}, DUPIC
DUPIC
el*];
^ DUPIC
DUPIC
91fe CANDU DUPIC
- 467 -

KAERI/RR-1999/99
4.4.3^ <Hl4^r CANDU
4.4.1 DUPUC
DUPIC « | ^ S S £ 3 1 3 ^ CANDU-6 Q6a%^S- ^ ^ W . £ W<HM*r DUPIC
DUPIC ajel&Sl ^ W ^l^S^l cfl«j{ ^AU*| - a ^ ^ c } . ^ ^^-fe 43^-
37-g- ^^^.u]-y i# 5:^:^5. -HgSl&i:}. 43-g-
, 37^-
4.4.1.1
35
WOBI #^*ll ^17>33 4-§-5|5d^K ^^r^- 4-g-^f *|^S-S.-f-B| CANDU
4.4-
DUPIC
, DUPIC
C A N D U 4 » ^ f l ^ ^ f ] 1 ^ 4 ^
DUPIC
WOBI Tfl-ihg: CANDU ^^>Sofl ^ ^ ^ DUPIC
- 468 -

KAERI/RR-1999/99
fe 15 MWd/kgHMS}
4.4.1.2 DUPIC
fe WOBI
i f ^ o | 220.4 cm*|
gr 3.5
3 0.4025 cm
, 35 MWd/kg ^ 1 ^ A f s j ^ t : } . PWR
I v f o } ^ ^ . s 4.4-2*1]
0.28 , 37 «J«iS-g- 0.28 mgo]u}-.
10%-b
]-. CANDU-6 ^ ^ ] ^ 1 ^
1 tio^ ^ ^ f S ^ i - i - :g7l7fg- (RBVS; SI
7 1 ^ ȣ R-109if R-110# ^ -SM 680 m3/hS., service port room^i
R-115# ^f-*l| 340 595 m3/h
4.4-2^]
(committed effective dose equivalent) £• H50
4.4-2ofl 1, o|
- 469 -

KAERI/RR-1999/99
R-201^ J E ^ J L ^ ^ : ^ 1 ^ ^ ^ . 5 - 5 . <H]^"5lo1- ^ 7 1 ^ A - ) DUPIC
., DUPIC
f. R B V S # ^
j ^ 3 5 . S a ^ . - < H 7 H f e ^ ^ ^ r ^ ^ ^ l R-2102} 7 ^ ] ^ ^ ] ^ (stairwells)
R-102 # j j l l f ^ ^ l
}. DUPIC
DUPIC
- DUPIC m&
, QAD-CGGP [Ref. 36]
, WOBI
5g-f, 30 cm (1 foot) I M * ! ^ ^ - ^ 5.5 m (ig feet)
5.5 m <i<H^l ^-^1 ^ l ^ ^ d ^ l - ^ : 43 cm (17")^| -g-SBlH ^ o ] i 4 12.7 cm
22
>. DUPIC
4.4-16]] Ji&t]-. ^ ] # *M ^$a# ^4", DUPIC AJ
3.2 ^Sv/h O|JL, ^ - f s f e ^ f § ^ -^QS. t\^S>\ &<%*} ^ ^ 1 - ^ 1.32 //Sv/h
- 470 -

KAERI/RR-1999/99
^ : DUPIC &
DUPIC
4.4.1.3 DUPIC
c M & 1.3
DUPIC A}^~f «}<>iS^?-B^ - § ^ ^ -*1%*#^: 163.6
fe^>^, DUPIC ^ f g - ^ ^ < ^ ^ ^ ^ % * # ^ ^ ^ ^ - S f e ^ - C f Afl71 oH
( a ^ 4.4-1
4.4.2 DUPIC
l ^ f ^ g 1 1 i g H DUPIC
K DUPIC ^«^S.7> ° > # < H 1 ^ ^ >
\dz #<>}&£}. a e j u } , DUPIC
ofl CANDU ^ #
DUPIC
(IAEA)^ Safety Series
No.6 [Ref. 37]if n ]^ - ^*H^-*fl£]*l5] (USNRC)^ 10CFR71 [Ref.
I ^ § ^ 2 mSv/hr <>1*H3. 2 m
^ : 0.1 mSv/hr 6}*f^ ^»,
4.4.2.1 DUPIC
, 4 7B 1 i%<&3. v}»^ 7
- 471 -

KAERI/RR-1999/99
^ Sa-fe KSC-4i+ KSC-77V
S H DUPIC
, o]
3.0^ CANDU
DUPIC
DUPIC ^ < ^ 5 . ^ ;g-f, JL
•> ^1 °flM^l (0.01-0.575 MeV)
(0.85-2.75MeV) ^ f > i ^ ^ ^ ^
(> 3.5 MeV) ^ } ^ i ^ e .
^.^^ <$ 40-50% VJ-^-'^,
DUPIC
CANDU >
CANDU -?
7.06 mo]
KSC-4#
^ <$ 2.2 molt;},
CANDU
DUPIC
CANDU
4.85 41-42
DUPIC
ZL ^4S.A-1, DUPIC
DUPIC
DUPIC
DUPIC
DUPIC 120
^ S 2 7fi5]
$1
15 cm
- 472 -

KAERI/RR-1999/99
10 cm
4.4.2.2
DUPIC
0RIGEN2
DUPIC 35000 MWd/tHM5]
L, DUPIC fe CANDU
DUPIC
Afl7]7]-
K 0RIGEN2
10
15000
DUPIC
MWd/tHM^l
MWd/tHM£)
4000 MWd/tHM
DUPIC
(over-burned) DUPIC
fe CANDU 3J*fc§.oM 7500
CANDU ^J^fSofl-H 19000
DUPIC
^ DUPIC
0, 10, 20, 30, 40 £ 50
7K
238U
- 473 -

KAERI/RR-1999/99
<£ m^<£T$ 2 - 3 7 ^242Cm, 244Cm, 238Pu5f ^ ^ . ^ - e f e ^ 4 : ^ ( f f , n)
ORIGEN2
ZL ^3}fe 7 l ^ ^ *i£-feHr *h%-^ « )^5 . , DUPIC
DUPIC ^ ^ § ^ «}^Sof] cH*|| 4 4 S 4.4-4, 4.4-5 ^ 4.4-6^| ^<>f^ 5ir:>. o]
ORIGEN2
Watt
/ ( £ ) = Cexp(-^-)sinh\T6£5 (4.4-1)
, a$ b^ 252Cf<Hl t|(*l| 4 4 1.025 MeV # 2.926
o] Q& Los Alamos National Laboratory Group T-2£] Madland<H]
n ^ 4.4-3^ 252Cf ^ y i ^ ^ < i ^ ^ # i ^ ^ T ^ , o| ^
^r 51^ BUGLE ^ # £ 4 ^}S^5 | 47$
- 474 -

KAERI/RR-1999/99
^ # S ] i r ^ 7 } 90%
ORIGEN2 4^A^.-f-B
, DUPIC A>^f ^ ^ ^ uj JL^ i t DUPIC
4.4-7, 4.4-8
4.4.2.3
DUPIC
-o| 2 mSv/hr
-§-71 ^^<H1^ 2 m 1<H^1 ^ |^]<H1A^ -a^l-ol 0.1 mSv/hr o|8fo|c
ANISN 7^1^1# ^ t g ^ & c } , ^ssJI l -^^: ^ > ^ l f ^I«> 15 cm
^ M « ^ * M ^ H ^ ^ SJmo]] 10 cm
611\. t t l-sH, ANISN ) ^ : ^
^ 4 4 15, 15 92 I O ^ S . *}&JL, 4 ^^<H1^^ ^^f^ 3 7 1 ^ -c}. *M 78
44
(7200 MWd/tHM), DUPIC ^ < £ 5 . ti^#^^J£ (15000
MWd/tHM) ^ :2.<*[dt DUPIC «J« iS tioV#^4:S (19000 MWd/tHM)ofl
- 475 -

KAERI/RR-1999/99
BUGLE96 ?OHx}g. > ^ ^ # ° l -§ -*H ANISN Tfl^M- -M§*}$ic} . oj-g- * $ £ . § . t:}-
WIMS-AECL
, BUGLE96ofl
, 133Cs, I60Dy, 166Er, 155Gd, 165Ho, 127I, 83Kr,
139La, 143Nd, 105Pd, 147Pm, 103Rh, 147Sm, 99Tc, 131Xe ^*\] V-M BUGLE96
BUGLE96 «?^>S. ^ ^ ^ ^ o]-§-*}<H ^ 1 ^ ] ^ ^ - ^^ t r>7] ^ ^ M , 0RIGEN2 71]
BUGLE965]
K 0RIGEN2 7 ^ 1 ^ ^ . ^ ^ ^
BUGLE963J 475: ^^3- ^9^*>5i t :> . ^ A ^ f ^ ^ * | ^-f, ORIGEN2
205"
, ANISN
, DUPIC
4i DUPIC 1 fll 1^ ^
4.4-10^1 L-j
. (Ref. 28 ^ B
(4.4-2)
- 476 -
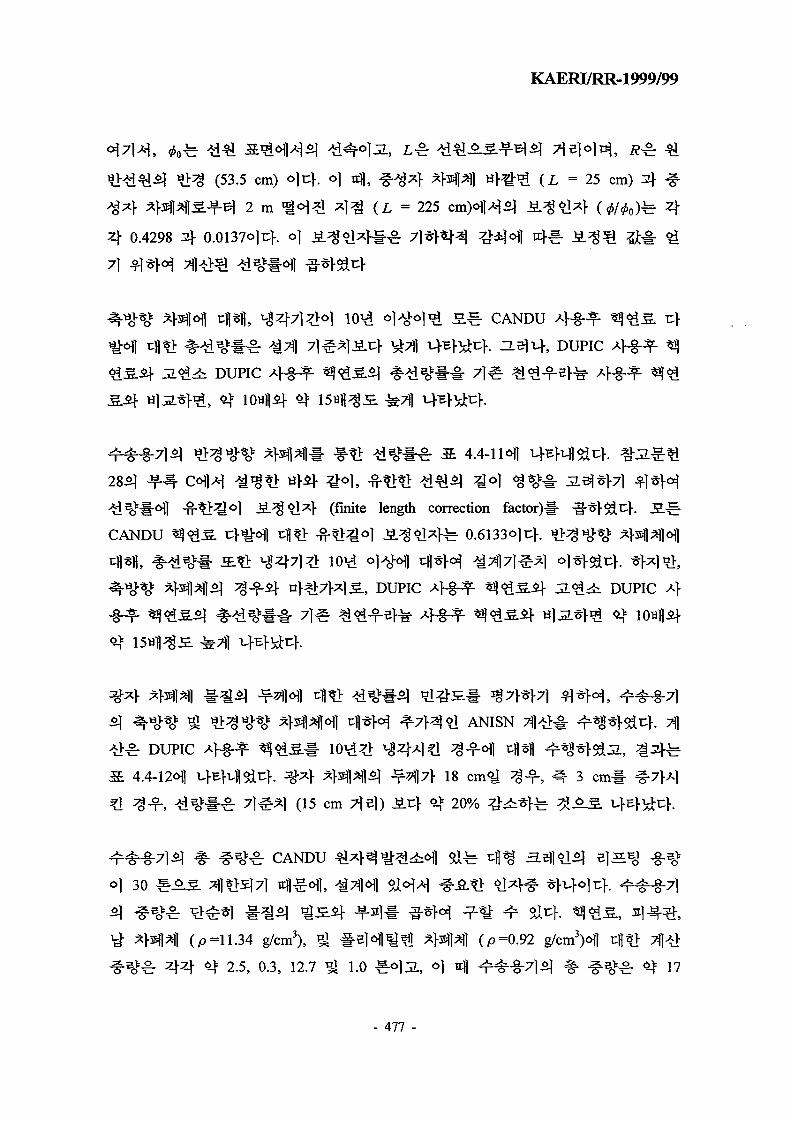
KAERI/RR-1999/99
0.4298
(53.5 cm) ojuj.. o] xcfl,
jL^ 2 m <i<H*} *|;g ( L = 225
. o]
( L = 25 cm) 2} -£•
Hr 4
DUPIC
CANDU
. 3 . ^ , DUPIC
2851
CANDU
4.4-11 ofl
(finite length correction factor)#
0.6133o]t:>.
71 §
, DUPIC DUPIC
> ^ DUPIC
4.4-12©«
tl (15 cm
ANISN 711
18 cm
Jit:> ^ 20%
^ 3 cmf-
30
^ CANDU
(p =11.34 g/cm3), g
^ 4 4 ^ 2.5, 0.3, 12.7 £ 1.0 §-©13.,
(p=0.92 g/cm3)cHl
^ ^ 1 7
- 477 -

KAERI/RR-1999/99
20
3 cm
4.4.3 CANDU
DUPIC
CANDU
4.4.3.1
DUPIC
MCNP-4B
43-g- DUPIC
, DUPIC
CANDU
CANDU
37-g-
S.1!^. «.*]- 6 4 4 4 (infinite hexagonal lattice),
(one core-load of the fuel bundles), ^ 4 ^ - ^ - £ #
bundles stacked criss-crossed against each layer) ^
(fuel bundles in the transport module) ^]^\. S.-&
4 7>4 CANDU «|«iS. t r i h ^-, ^ t - ^ ^ S Ao^
43-g- DUPIC
(infinite
7}. -*> 64 4 4
CANDU
H keff , 44
- 478 -

KAERI/RR-1999/99
S. Jfnjofl cH^ ^ ^ 1 1 -f-sj^l H]^ . 37-g- S ^ CANDU ^ ^ S '^}^3\- 43-g-
DUPIC t ^ ^ S c f ^ ] t^m 4 4 0.732f 0.78o]cK «^^] T j ] ^ ^<&
30
31 Cftij:, ^ o ] 31
B]«H Itn} ^^^^1 S ^ ^ ^ i 7}^H15] 10 cm
Jf*> 6 4
51 ?>^ol o.8
CANDU «J«!S c>y^Jf 43-g- DUPIC
o) sxg£. JZ.Q 64
2.4
- 479 -

KAERI/RR-1999/99
2.4
4X1251 fe 48711-S] ^ E f l t N ^ ^
CANDU
10 cm
a e l J L 1.2 g/cm3^
0.5 g/crn3*] ^
4 7M
^ 0.5, 1.0
4.4.3.2
CANDU
H»J MCNP-4B#
KCODE
. 4 ^
. MCNP 3 E
(inactive) VA 4-8-3 (active)
, MCNP 5LEl-b
(estimator)^ ^ ^
CANDU
37-g- (0 MWd/t)
(7200 MWd/t) ^
#i (14800
- 480 -

KAERI/RR-1999/99
MWd/t) ^EflSl 43-g- DUPIC
^ WIMS-AECL
r- 4 CANDU
MCNP
MCNP
DUPIC
ENDF/B-VI Release
NJOY
97.62OJJL, NJOY
DUPIC
MCNP-4B fl f
Afg-*>5jlc>. NJOY 3 H 5 ]
(fractional tolerance)^ 0.001#
300
WIMS-AECL
<I ^ A ^ # (pseudo fission product; PFP)S. T4E}\5C>. WIMS-AECL
MCNP-4B S-H#£ l *H<&5. 2L*i<>\} mi ^ ^ -fr*l*l-7l ^ * M , MCNP
S. ^>^^«H1 cH*> PFP 4 ^ - f e RMCCS *%*}£. ^>^^<H] S % ^ jg^ . ^ ^ -
(average fission product) * r S # °l-§-*H ^^I^f^^f. o]ttfl, MCNP *
4.4.3.3
CANDU
MCNP-4B
, 4 TflAKg;
- 481 -

KAERI/RR-1999/99
7}. ^ - « 6 4
471
500
1000 7H^ # ^ * h 50
MCNP
^ 4.4-4, 4.4-5
64
^K 471
ke//
37-g-
, 43^- DUPIC
H)7f 1.081 l«y
14 mk7f
43-g- DUPIC
, DUPIC
6 4
^ 3000
MCNP
100 7fl51
CANDU
4.4- CANDU
0-8
i t 4.4-14oj| § ^-ffoil 0.8
- 482 -

CANDU
o]
O)
KAERI/RR-1999/99
Jio]*] -, DUPIC
o]
o]v.\. MCNP
1000
2000
4 4 0.1 mm if 0.24 mm
100 7 ^ a ] % ^
2fe S 4.4-15011
CANDU
CANDU
3000
71
. MCNP
100 , 500
}fe 4 4 S 4.4-162f 4.4-
DUPIC J
0.5, 1.0 ^ 0.5 g/cm39l 37-g-
43-g- DUPIC
0.5 g/cm
ZLBll4, DUPIC 1.0 0.5
- 483 -

KAERI/RR-1999/99
1.0 g/cm3
^ ^ ^ g l Htt ^ ^ ^ 1 CANDU
CANDU ^ | |
- 484 -
1.2 g/cm3*]- ^ o ] 1.0 g/cm3

KAERI/RR-1999/99
Table 4.4-1
Percentage of Volatile and Semi-Volatile Fission Products Removed
Element
I
Br
Kr
Xe
Cs
Rb
% Removed
99
99
99
99
90
90
- 485 -

KAERI/RR-1999/99
Table 4.4-2
Actinides Activity and Annual Doses from Airborne Contamination
from Fresh DUPIC Fuel
Isotopes
U232U234U235U236U238
Np237Pu238Pu239Pu240Pu241Pu242Am241
Am242mAm243Cm242Cm243Cm244Cm245Cm246Cm247
Total
After 10-year decay
Inventrory
(g*g)
5.26E-071.20E-029.28E+004.42E+009.39E+024.02E-011.29E-015.79E+002.41E+008.51E-015.16E-015.58E-018.45E-041.09E-012.21E-062.87E-042.26E-021.11E-031.41E-042.29E-06
9.64E+02
Activity(Curies)
1.16E-057.47E-052.01E-052.86E-043.16E-042.83E-042.21E+003.59E-015.48E-018.80E+012.04E-031.92E+008.86E-038.82E-032.19E-027.31E-031.48E-021.83E+001.90E-044.32E-05
9.49E+01
SurfaceContami-
nation(g/m2)
1.15E-132.63E-092.03E-069.68E-072.06E-048.79E-082.83E-081.27E-065.29E-071.86E-071.13E-071.22E-071.85E-102.40E-084.83E-136.29E-114.96E-092.42E-103.08E-115.01E-13
2.11E-04
AirborneActivity(Ci/m3)
3.86E-152.49E-146.67E-159.51E-141.05E-139.42E-147.35E-101.19E-101.82E-102.93E-086.79E-136.37E-102.95E-122.93E-127.27E-122.43E-124.94E-126.10E-106.32E-141.44E-14
3.16E-08
H50Effective
WholeBody Dose
(Sv)
1.44E-051.90E-054.74E-066.93E-057.09E-052.01E-041.57E+002.76E-014.21E-011.20E+001.69E-031.47E+00O.OOE+006.77E-036.33E-044.10E-036.14E-031.52E+001.57E-04O.OOE+00
6.47E+00
D50LungDose(Sv)
123E-041.59E-043.91E-055.74E-045.97E-04O.OOE+00O.OOE+00O.OOE+00O.OOE+00O.OOE+00O.OOE+00O.OOE+00O.OOE+00O.OOE+00O.OOE+00O.OOE+00O.OOE+00O.OOE+00O.OOE+00O.OOE+00
1.49E-03
D50 ...BoneDose(Sv)
3.91E-064.28E-061.07E-061.55E-051.59E-051.84E-052.61E+014.88E+007.45E+002.18E+012.77E-022.60E+01O.OOE+001.20E-015.81E-036.91E-021.05E-012.60E+012.69E-03O.OOE+00
1.13E+02
D50LLINTDose(Sv)
O.OOE+002.16E-085.69E-097.94E-088.21E-08O.OOE+00O.OOE+00O.OOE+00O.OOE+00O.OOE+00O.OOE+00O.OOE+00O.OOE+00O.OOE+00O.OOE+00O.OOE+00O.OOE+00O.OOE+00O.OOE+00O.OOE+00
1.89E-07
- 486 -

KAERI/RR-1999/99
Table 4.4-3
Annual Gamma Dose Rates from Fresh DUPIC Bundle
Distance
Contact
1 foot away
18 feet away
Dose Rate
(mSv/a)
2.96EX104
2.70EX103
9.61
- 487 -

KAERI/RR-1999/99
Table 4.4-4
Neutron Sources from Spent Natural Uranium Fuel According to Cooling Time
(Unit: Neutrons/sec.MTHM)
( a , n) Neutron Source
Cooling Time
PU238PU239PU240AM241CM242CM244
SUB-TOTAL
0 YR
5.116E+041.225E+051.805E+056.772E+032.063E+061.425E+04
2.439E+06
10 YR
5.574E+041.265E+051.8O3E+O52.711E+051.055E+029.729E+03
6.445E+05
20YR
5.151E+041.264E+051.801E+054.302E+051.004E+026.635E+03
7.960E+05
30 YR
4.760E+041.264E+051.800E+055.243E+059.595E+014.525E+03
8.838E+05
40 YR
4.399E+041.264E+051.798E+055.784E+059.167E+013.086E+03
9.326E+05
50 YR
4.065E+041.263E+051.796E+056.077E+058.758E+012.105E+03
9.573E+05
Spontaneous Fission Neutron Source
Cooling Time
U238PU238PU240PU242CM242CM244CM246
SUB-TOTAL
TOTAL
0 YR
1.250E+048.343E+039.516E+058.956E+041.001E+071.716E+061.895E+03
1.279E+07
1.523E+07
10 YR
1.250E+049.090E+039.506E+058.957E+045.119E+021.171E+061.892E+03
2.236E+06
2.881E+06
20 YR
1.250E+048.400E+039.496E+058.956E+044.873E+027.989E+051.889E+03
1.862E+06
2.658E+06
30 YR
1.250E+047.763E+039.486E+058.956E+044.656E+025.448E+051.886E+03
1.606E+06
2.490E+06
40 YR
1.250E+047.174E+039.477E+058.956E+044.448E+023.716E+051.884E+03
1.431E+06
2.364E+06
50 YR
1.250E+046.630E+039.467E+058.956E+044.250E+022.534E+051.881E+03
1.311E+06
2.268E+06
- 488 -

KAERI/RR-1999/99
Table 4.4-5
Neutron Sources from Nominal Spent DUPIC Fuel According to Cooling Time
(Unit: Neutrons/sec.MTHM)
{a, n) Neutron Source
Cooling Time
PU238PU239PU240AM241AM243CM242CM243CM244
SUB-TOTAL
0 YR
2.947E+071.577E+054.502E+054.252E+064.830E+044.916E+092.273E+068.574E+06
4.961E+09
10 YR
4.378E+071.606E+054.547E+055.124E+064.828E+047.542E+041.782E+065.848E+06
5.728E+07
20YR
4.046E+071.608E+054.576E+055.623E+064.823E+047.120E+041.398E+063.988E+06
5.221E+07
30 YR
3.739E+071.610E+054.595E+055.892E+064.819E+046.802E+041.096E+062.720E+06
4.784E+07
40 YR
3.455E+071.611E+054.606E+056.020E+064.814E+046.499E+048.593E+051.855E+06
4.403E+07
50 YR
3.193E+071.612E+054.612E+056.061E+064.810E+046.209E+046.738E+051.265E+06
4.067E+07
Spontaneous Fission Neutron Source
Cooling Time
PU238PU240PU242CM242CM244CM246
SUB-TOTAL
TOTAL
0 YR
4.806E+062.373E+062.506E+062.385E+101.032E+096.836E+06
2.490E+10
2.986E+10
10 YR
7.139E+062.397E+062.507E+063.660E+057.041E+086.826E+06
7.235E+08
7.808E+08
20 YR
6.598E+062.412E+062.507E+063.455E+054.802E+086.816E+06
4.989E+08
5.511E+08
30 YR
6.097E+062.422E+062.507E+063.301E+053.275E+086.807E+06
3.457E+08
3.935E+08
40 YR
5.635E+062.428E+062.507E+063.153E+052.233E+086.797E+06
2.411E+08
2.851E+08
50 YR
5.207E+062.431E+062.508E+063.013E+051.523E+086.787E+06
1.696E+08
2.103E+08
- 489 -

KAERI/RR-1999/99
Table 4.4-6
Neutron Sources from Over-Burned Spent DUPIC Fuel According to Cooling Time
(Unit: Neutrons/sec.MTHM)
{a, n) Neutron Source
Cooling Time
PU238PU239PU240AM241AM243CM242CM243CM244
SUB-TOTAL
0 YR
2.979E+071.612E+054.921E+052.302E+065.958E+043.651E+091.999E+061.336E+07
3.699E+09
10 YR
3.981E+071.643E+054.994E+053.215E+065.956E+044.141E+041.567E+069.116E+06
5.448E+07
20YR
3.679E+071.645E+055.042E+053.751E+065.951E+043.893E+041.229E+066.217E+06
4.876E+07
30 YR
3.399E+071.647E+055.073E+054.054E+065.945E+043.719E+049.637E+054.240E+06
4.403E+07
40 YR
3.141E+071.648E+055.093E+054.214E+065.939E+043.553E+047.557E+052.891E+06
4.005E+07
50 YR
2.903E+071.648E+055.104E+054.285E+065.934E+043.395E+045.925E+051.972E+06
3.666E+07
Spontaneous Fission Neutron Source
Cooling Time
PU238PU240PU242CM242CM244CM246
SUB-TOTAL
TOTAL
0 YR
4.858E+062.594E+062.860E+061.772E+101.609E+091.293E+07
1.935E+10
2.305E+10
10 YR
6.492E+062.633E+062.860E+062.009E+051.098E+091.292E+07
1.123E+09
1.177E+09
20 YR
5.999E+062.658E+062.860E+061.889E+057.485E+081.290E+07
7.732E+08
8.220E+08
30 YR
5.544E+062.674E+062.860E+061.805E+055.105E+081.288E+07
5.347E+08
5.787E+08
40 YR
5.123E+062.685E+062.860E+061.724E+053.481E+081.286E+07
3.719E+08
4.120E+08
50 YR
4.734E+062.691E+062.860E+061.647E+052.374E+081.284E+07
2.608E+08
2.975E+08
- 490 -

KAERI/RR-1999/99
Table 4.4-7
Total Gamma Source Spectrum for Conventional Spent Natural Uranium Fuel
(Unit: Photons/sec.MTHM)
AverageEnergy(MeV)
1.00E-022.50E-023.75E-025.75E-028.50E-021.25E-012.25E-013.75E-015.75E-018.50E-011.25E+001.75E+002.25E+002.75E+003.50E+005.00E+007.00E+009.50E+00
TOTAL
0 YR
2.481E+184.235E+173.744E+173.590E+177.028E+176.172E+177.862E+174.277E+176.561E+176.899E+173.785E+171.441E+177.106E+163.064E+161.521E+166.494E+155.914E+131.315E+1O
8.162E+18
10 YR
4.319E+149.520E+131.102E+148.505E+134.973E+134.109E+134.136E+132.103E+137.510E+143.641E+132.240E+134.713E+113.061E+101.691E+092.188E+081.127E+051.291E+041.480E+03
1.686E+15
Cooling Time
20 YR
3.268E+146.678E+138.069E+136.705E+133.631E+132.729E+133.035E+131.295E+135.644E+I47.721E+128.217E+122.150E+113.118E+073.679E+064.504E+059.656E+041.104E+041.263E+03
1.229E+15
30 YR
2.579E+145.208E+136.247E+135.506E+132.815E+I31.983E+132.355E+139.908E+124.464E+143.807E+123.508E+121.134E+117.754E+061J79E+062.015E+058.550E+049.751E+031.115E+03
9.628E+14
40 YR
2.045E+144.109E+134.891E+134.561E+132.206E+131.493E+131.842E+137.767E+123.541E+142.227E+121.645E+126.443E+104.642E+061.611E+061.837E+057.791E+048.871E+031.013E+03
7.613E+14
50 YR
1.627E+143.250E+133.848E+133.807E+131.735E+131.147E+131.445E+136.111E+122.809E+141.419E+128.475E+113.962E+103.309E+061.468E+061.715E+057.270E+048.266E+039.439E+02
6.043E+14
- 491 -

KAERI/RR-1999/99
Table 4.4-8
Total Gamma Source Spectrum for Nominal Spent DUPIC Fuel
(Unit: Photons/sec.MTHM)
AverageEnergy(MeV)
1.00E-022.50E-023.75E-025.75E-028.50E-021.25E-012.25E-013.75E-015.75E-018.5OE-O11.25E+001.75E+002.25E+002.75E+003.50E+005.00E+007.00E+009.50E+00
TOTAL
0 YR
2.265E+184.191E+173.653E+173.567E+175.559E+175.042E+176.973E+174.210E+176.646E+176.874E+173.791E+171.463E+177.165E+162.982E+161.440E+165.976E+155.558E+131.234E+10
7.584E+18
10 YR
1.173E+151.746E+142.522E+142.276E+141.135E+141.570E+149.987E+133.778E+131.774E+153.499E+141.250E+143.235E+125.049E+103.770E+095.262E+083.196E+073.681E+064.225E+05
4.487E+15
Cooling
20 YR
9.170E+141.199E+141.668E+141.891E+147.421E+138.849E+136.982E+132.277E+131.115E+155.383E+134.838E+131.445E+121.436E+082.590E+085.220E+072.209E+072.543E+062.919E+05
2.866E+15
I Time
30 YR
7.603E+149.401E+131.224E+141.672E+145.559E+135.638E+135.259E+131.718E+138.715E+142.197E+132.152E+136.742E+117.836E+072.204E+083.598E+071.536E+071.767E+062.027E+05
2.241E+15
40 YR
6.395E+147.497E+139.319E+131.505E+144.331E+133.891E+134.051E+131.338E+136.900E+141.097E+139.842E+123.237E+115.483E+071.920E+082.522E+071.076E+071.236E+061.417E+05
1.805E+15
50 YR
5.435E+146.023E+137.232E+131.371E+143.425E+132.841E+133.163E+131.052E+135.471E+145.990E+124.616E+121.624E+113.915E+071.689E+081.786E+077.610E+068.735E+051.001E+05
1.476E+15
- 492 -

KAERI/RR-1999/99
Table 4.4-9
Total Gamma Source Spectrum for Over-burned Spent DUPIC Fuel
(Unit: Photons/secMTHM)
AverageEnergy(MeV)
1.00E-022.50E-023.75E-025.75E-028.50E-021.25E-012.25E-013.75E-015.75E-018.50E-011.25E+001.75E+002.25E+002.75E+003.50E+005.00E+007.00E+009.50E+00
TOTAL
0 YR
2.298E+184.219E+173.691E+173.587E+175.865E+175.257E+177.098E+174.265E+176.716E+176.861E+173.738E+171.454E+177.004E+162.902E+161.353E+165.313E+155.091E+131.155E+1O
7.690E+18
10 YR
1.314E+152.112E+143.014E+142.321E+141.318E+141.689E+141.137E+144.610E+132.242E+154.068E+141.324E+143.337E+125.792E+104.680E+096.662E+084.946E+075.700E+066.546E+05
5.303E+15
Cooling Time
20 YR
1.013E+151.444E+142.030E+141.857E+148.762E+139.670E+137.990E+132.770E+131.424E+155.756E+135.002E+131.491E+122.068E+083.892E+088.035E+073.410E+073.928E+064.511E+05
3.371E+15
30 YR
8.280E+141.126E+141.508E+141.593E+146.612E+136.259E+136.053E+132.095E+131.114E+152.329E+132.221E+137.011E+111.175E+083.312E+085.529E+072.362E+072.720E+063.123E+05
2.622E+15
40 YR
6.860E+148.925E+131.155E+141.391E+145.165E+134.373E+134.682E+131.637E+138.832E+141.191E+131.020E+133.409E+118.179E+072.880E+083.856E+071.647E+071.895E+062.175E+05
2.094E+15
50 YR
5.741E+147.115E+138.994E+131.231E+144.090E+133.219E+133.667E+131.290E+137.003E+146.734E+124.823E+121.740E+115.794E+072.528E+082.714E+071.158E+071.332E+061.529E+05
1.693E+15
- 493 -

KAERI/RR-1999/99
Table 4.4-10
Dose Rates through Cask Axial Shield
Neutron
Gamma
Total
CoolingTime
0 YR10 YR20 YR30 YR40 YR50 YR
0 YR10 YR20 YR30 YR40 YR50 YR
0 YR10 YR20 YR30 YR40 YR50 YR
Cask surface(Criterion: 2.0 mSv/hr)
NAT37
3.040E-045.750E-055.306E-054.969E-054.718E-054.528E-05
6.465E+032.761E-021.029E-024.772E-032.482E-031.463E-03
6.465E+032.766E-021.034E-024.822E-032.529E-031.508E-03
DUP15
7.062E-011.847E-021.303E-029.308E-036.744E-034.973E-03
7.977E+032.969E-011.491E-018.650E-025.383E-023.561E-02
7.977E+033.154E-011.621E-019.581E-026.057E-024.059E-02
DUP19
5.452E-012.785E-021.944E-021.369E-029.744E-037.036E-03
7.737E+033.608E-011.878E-011.123E-017.142E-024.768E-02
7.737E+033.887E-012.073E-011.260E-018.116E-025.471E-02
2 m apart from surface(Criterion: 0.1 mSv/hr)
NAT37
9.017E-061.706E-061.574E-061.474E-061.399E-061.343E-06
2.029E+028.617E-043.211E-041.489E-047.739E-054.560E-05
2.029E+028.634E-043.227E-041.503E-047.879E-054.694E-05
DUP15
2.093E-025.472E-043.863E-042.758E-041.999E-041.474E-04
2.504E+029.229E-034.625E-032.680E-031.666E-031.101E-03
2.504E+029.776E-035.012E-032.956E-031.865E-031.248E-03
DUP19
1.616E-028.253E-045.761E-044.056E-042.887E-042.085E-04
2.428E+021.120E-025.821E-033.477E-032.208E-031.473E-03
2.428E+021.203E-026.397E-033.883E-032.497E-031.681E-03
Note) NAT37 : Conventional spent natural uranium fuel (7200 MWd/tHM)
DUP15 : Nominal spent DUPIC fuel (15000 MWd/tHM)
DUP19 : Over-burned spent DUPIC fuel (19000 MWd/tHM)
- 494 -
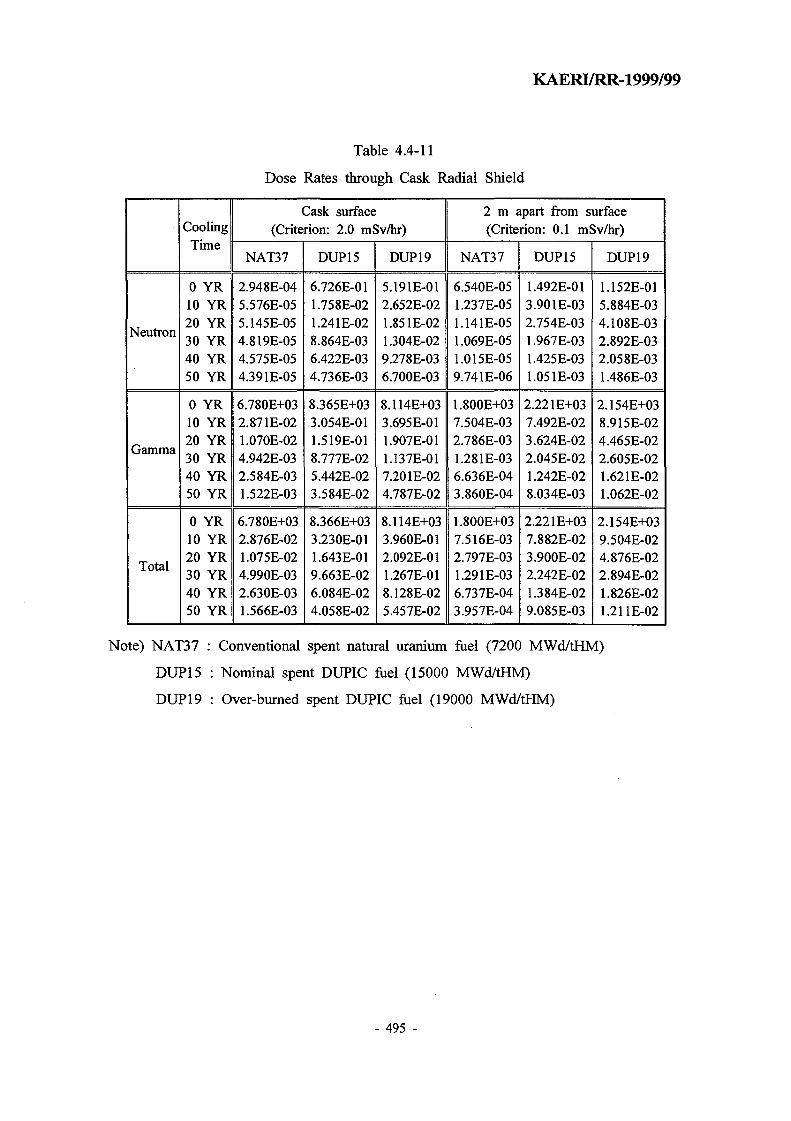
KAERI/RR-1999/99
Table 4.4-11
Dose Rates through Cask Radial Shield
Neutron
Gamma
Total
CoolingTime
0 YR10 YR20 YR30 YR40 YR50 YR
0 YR10 YR20 YR30 YR40 YR50 YR
0 YR10 YR20 YR30 YR40 YR50 YR
Cask surface(Criterion: 2.0 mSv/hr)
NAT37
2.948E-045.576E-055.145E-054.819E-054.575E-054.391E-05
6.780E+032.871E-021.070E-024.942E-032.584E-031.522E-03
6.780E+032.876E-021.075E-024.990E-032.630E-031.566E-03
DUP15
6.726E-011.758E-021.241E-028.864E-036.422E-034.736E-03
8.365E+033.054E-011.519E-018.777E-025.442E-023.584E-02
8.366E+033.230E-011.643E-019.663E-026.084E-024.058E-02
DUP19
5.191E-012.652E-021.851E-021.304E-029.278E-036.700E-03
8.114E+033.695E-011.907E-011.137E-017.201E-024.787E-02
8.114E+033.960E-012.092E-011.267E-018.128E-025.457E-02
2 m apart from surface(Criterion: 0.1 mSv/hr)
NAT37
6.540E-051.237E-051.141E-051.069E-051.0I5E-059.741E-06
1.800E+037.504E-032.786E-031.281E-036.636E-043.860E-04
1.800E+037.516E-032.797E-031.291E-036.737E-043.957E-04
DUP15
1.492E-013.901E-032.754E-031.967E-031.425E-031.051E-03
2.221E+037.492E-023.624E-022.045E-021.242E-028.034E-03
2.221E+037.882E-023.900E-022.242E-021.384E-029.085E-03
DUP19
1.152E-015.884E-034.108E-032.892E-032.058E-031.486E-03
2.154E+038.915E-024.465E-022.605E-021.621E-021.062E-02
2.154E+039.504E-024.876E-022.894E-021.826E-021.211E-02
Note) NAT37 : Conventional spent natural uranium fuel (7200 MWd/tHM)
DUP15 : Nominal spent DUPIC fuel (15000 MWd/tHM)
DUP19 : Over-burned spent DUPIC fuel (19000 MWd/tHM)
- 495 -

KAERI/RR-1999/99
Table 4.4-12
Dose Rates through Cask Radial Shield Depending on Gamma Shield Thickness
Gammashield
thickness
16 cm17 cm18 cm20 cm
Cask surface(Criterion: 2.0 mSv/hr)
Neutron
1.681E-021.606E-021.538E-021.410E-02
Gamma
2.000E-011.461E-011.176E-019.257E-02
Total
2.168E-011.621E-011.330E-011.067E-01
2 m apart from surface(Criterion: 0.1 mSv/hr)
Neutron
3.760E-033.625E-033.500E-033.261E-03
Gamma
4.795E-023.416E-022.696E-022.088E-02
Total
5.171E-023.778E-023.046E-022.414E-02
- 496 -

KAERI/RR-1999/99
Table 4.4-13
of One Core-Load of Fuel Bundles in Contact with Each Other
Natural uraniumdischarged fuel bundle
DUPIC freshfuel bundle
DUPIC dischargedfuel bundle
H2O reflector(10 cm thickness)
0.78704 ±0.00059
0.88253 ±0.00072
0.69738 ±0.00056
Against concretecorner
0.78578 ±0.00062
0.88370 ±0.00063
0.69824 ±0.00060
- 497 -

KAERI/RR-1999/99
Table 4.4-14
keff of One Core-Load of Fuel Bundles in 0.4 mm Separation
(Moderator-to-Volume Ratio = 1.0811)
Natural uraniumdischarged fuel bundle
DUPIC freshfuel bundle
DUPIC dischargedfuel bundle
H2O reflector(10 cm thickness)
0.80515 ±0.00062
0.93746 ±0.00065
0.73370 ±0.00059
Against concretecorner
0.80557 ±0.00058
0.93942 ±0.00066
0.73450 ±0.00063
- 498 -

KAERI/RR-1999/99
Table 4.4-15
keff for Fuel Bundles Infinitely Stacked Criss-Crossed
Natural uraniumdischarged fuel bundle
DUPIC freshfuel bundle
DUPIC dischargedfuel bundle
Bundle-to-bundle and layer-to-layerseparation
1.0 mm
0.80651 ±0.00053
0.93897 ±0.00057
0.73592 ±0.00048
2.4 mm
0.80268 ±0.00051
0.94879 ±0.00054
0.74019 ±0.00050
- 499 -

KAERI/RR-1999/99
Table 4.4-16
keff for Fuel Bundles in Single Transport Module
Natural uraniumdischarged fuel bundle
DUPIC freshfuel bundle
DUPIC dischargedfuel bundle
Light water density
0.5 g/cm3
0.63624 ±0.00060
0.75900 ±0.00066
0.60487 ±0.00055
1.0 g/cm3
0.62829 ±0.00055
0.79165 ±0.00067
0.59191 ±0.00059
1.2 g/cm3
0.60169 ±0.00056
0.76919±0.00071
0.58257 ±0.00054
- 500 -

KAERI/RR-1999/99
Table 4.4-17
keff for Fuel Bundles in Infinite Transport Module
Natural uraniumdischarged fuel bundle
DUPIC freshfuel bundle
DUPIC dischargedfuel bundle
Light water density
0.5 g/cm3
0.77181 ±0.00058
0.92368 ±0.00067
0.72080 ±0.00058
1.0 g/cm3
0.66095 ±0.00057
0.83406 ±0.00067
0.63583 ±0.00054
1.2 g/cm3
0.62245 ±0.00055
0.79673 ±0.00065
0.60388 ±0.00055
- 501 -

KAERI/RR-1999/99
1.00E+08
1.00E+07
1.00E+06
1.00E+05
- —— . — - — . - —
-—. - «
• —
mm—
.
— —
— —
Spent PWR
Spent DUPIC
-— " Nat. Uranium
— • —
t
100 1000
Days
10000
Fig. 4.4-1 a-n and Fission Neutrons from Fuel Bundle after 10-Year Decay
- 502 -

KAERI/RR-1999/99
Seal weld
56 cm
Base plate
Lift shaftCover
Cylindrical wall
Steel grid Fuel bundle
Diameter 107 cm
Fig. 4.4-2 Spent DUPIC Fuel Storage Basket
- 503 -

KAERI/RR-1999/99
>
0.30
0.25-
0.20-
0 . 1 5 -
0.10-
0.05-
0.00
10"° 10-5 10 10'3 10'2
Emergy (MeV)
10° 101
252yFig. 4.4-3 Spontaneous Fission Spectrum of Cf
- 504 -

KAERI/RR-1999/99
1.00
•PHp=0.5g/cm
1.0 1.2 1.4 1.6
Moderator-to-Fuel-Volume Ratio
1.8 2.0
Fig. 4.4-4 keff of Infinite Hexagonal Lattice of 37-Element Standard Natural Uranium
Fuel Bundle at Discharge Burnup State
- 505 -
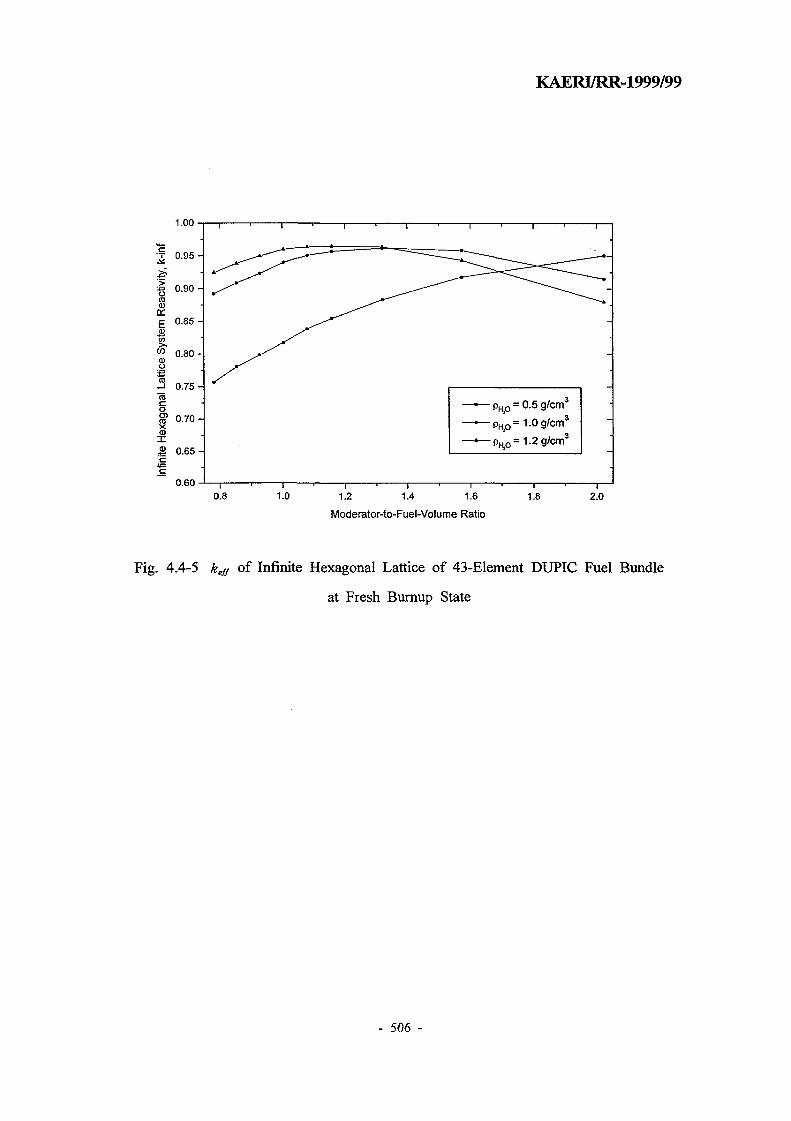
KAERI/RR-1999/99
1.00-
2 °-95
0.65-
0.600.8
—*~~ PKO = ° - 5 9'cm
PHp=1.2g/cm3
1.0 1.2 1.4 1.6
Moderator-to-Fuel-Volume Ratio
1.8 2.0
Fig. 4.4-5 kgff of Infinite Hexagonal Lattice of 43-Element DUPIC Fuel Bundle
at Fresh Burnup State
- 506 -

KAERI/RR-1999/99
1.00
0.600.8 1.0 1.2 1.4 1.6
Moderator-to-Fuel-Volume Ratio
1.8 2.0
Fig. 4.4-6 £e// of Infinite Hexagonal Lattice of 43-Element DUPIC Fuel Bundle
at Discharge Burnup State
- 507 -

KAERI/RR-1999/99
4.5
CANDU
DUPIC
^ DUPIC
DUPIC
71-
DUPIC
CANDU DUPIC
Vl DUPIC
DPA
30%
30
D P A ^ j - ^ . b> 1 0o / o
DUPIC CANDU
DUPIC
DUPIC
DUPIC
}, DUPIC
41 *M, CANDU
- 508 -

KAERI/RR-1999/99
, DUPIC & DUPIC
ANISN 3 E f
CANDU
^ CANDU
, DUPIC
MCNP-4B
CANDU
(0.95)
-, DUPIC
14 mk
CANDU
- 509 -

KAERI/RR-1999/99
4.6 REFERENCES
1. H.B. CHOI et al., "Physics Study on Direct Use of Spent PWR Fuel in CANDU (DUPIC),"
Nucl. Sci. Eng., 126, 80, 1997.
2. J.S. LEE et al., "Research and Development Program of KAERI for DUPIC (Direct Use
of Spent PWR Fuel in CANDU Reactors)," Int. Conf. and Tech. Exhibition on Future Nuclear
System: Emerging Fuel Cycles and Waste Disposal Options, GLOBAL'93, Seattle, USA,
1993.
3. H.B. CHOI et al., "Comparison of Refueling Schemes for DUPIC Core," 4th International
Conference on CANDU Fuel, Pembroke, Canada, Oct. 1-4, 1995.
4. K.Y. KIM et al., "Shielding Design Manual, Part 1 - Reactor Building," 86-03320-DM-001,
Rev. 1, Korea Atomic Energy Research Institute and Atomic Energy of Canada Limited,
1995.
5. K.Y. KIM et al., "Radiation Heating Report," 86-03320-AR-004, Rev. 2, Korea Atomic
Energy Research Institute and Atomic Energy of Canada Limited, 1995.
6. K.Y. KIM et al., "Improvement of Top Shield Analysis Technology for CANDU 6 Reactor,"
KAERLTR-738/96, Korea Atomic Energy Research Institute, 1996.
7. J.J. DUDERSTADT and W.R MARTINE, Transport Theory, Chapter 1, John Wiley and
Sons, New York, 1979.
8. N.M. SCHAEFFER, ed., Reactor Shielding for Nuclear Engineers, Chapters 4 and 7, USAEC,
1973.
9. T.B. FOWLER, "EXTERMINATOR-2: A Fortran-IV Code for Solving Multigroup Diffusion
Equations in Two Dimensions," ORNL-4078, Oak Ridge National Laboratory, 1967.
- 510 -

KAERI/RR-1999/99
10. U. CANALI et al., "MAC-RAD, A Reactor Shielding Code," Euratom, EUR 2152.e, European
Atomic Energy Community, 1964.
11. W.W. ENGLE Jr., "A Users Manual for ANISN - A One Dimensional Discrete Ordinates
Transport Code for Neutron and Gamma Ray Shielding Calculation," RSIC-CCC-307, Oak
Ridge National Laboratory, 1979.
12. W.A. RHOADES et al., "DOT IV - Two-Dimensional Discrete Ordinates Radiation Transport
Code System, Version 4.2," RSIC-CCC-320, Oak Ridge National Laboratory, 1979.
13. Bechtel Power Corporation, "QAD-CG, Combinatorial Geometry Version of QAD-P5A, A
Point Kernel Code for Neutron and Gamma Ray Shielding Calculations," RSIC-CCC-307,
Oak Ridge National Laboratory, 1979.
14. W.A. RHOADES and R.L. CHILDS, "The DORT Two-Dimensional Discrete Ordinates
Transport Code," Nucl. Sci. Eng., 99, 1, 1988.
15. W.E. FORD, "Coupled 100 Neutrons-21 Gamma Ray Group, Pg Cross Section Library for
EPR," ORNL/TM-5249, Oak Ridge National Laboratory, 1976.
16. "ENDF/B-IV Summary Documentation," BNL-NCS-17541 (ENDF-201) 2nd Edition,
Brookhaven National Laboratory, 1975.
17. "BUGLE-96, Coupled 47 Neutron, 20 Gamma-Ray Group Cross Section Library Derived
from ENDF/B-VI for LWR Shielding and Pressure Vessel Dosimetry Applications,"
RSIC-DLC-185, Oak Ridge National Laboratory, July 1996.
18. P.F. ROSE ed., "ENDF/B-VI Summary Documentation," BNL-NCS-17541 (ENDF-201), 4th
Edition, Brookhaven National Laboratory, 1991.
19. J.F. BRIESMEISTER ed., "MCNP - A General Monte Carlo N-Particle Transport Code,
Version 4B," LA-12625-M, Los Alamos National Laboratory, 1997.
- 511 -

KAERI/RR-1999/99
20. ANS Working Group 6.1.1, "Neutron and Gamma-Ray Flux-to-dose Rate Factors," ANSI/
ANS-6.1.1-1977, American Nuclear Society, 1977.
21. "Design Manual : CANDU 6 Generating Station Physics Design Manual," 86-03310-D000,
Rev. 1, Atomic Energy of Canada Limited, 1995.
22. KEPCO, "Final Safety Analysis Report : Wolsong NPP Units No. 2/3/4 Chapter 4," 1995.
23. J.V. DONNELLY, "WIMS-CRNL, A User's Manual for the Chalk River Version of WIMS,"
AECL-8955, Atomic Energy of Canada Limited, 1986.
24. T.E. BOOTH, "A Sample Problem for Variance Reduction in MCNP," LA- 10363-MS, Los
Alamos National Laboratory, 1985.
25. R.C. LITTLE, "High-Temperature MCNP Cross Sections," X-6-IR-87-505, Los Alamos
National Laboratory, 1987.
26. KEPCO, "Final Safety Analysis Report : Wolsong NPP Units No. 2/3/4 Chapter 12," 1995.
27. D.A. JENKINS and B. ROUBEN, "Reactor Fuelling Simulation Program - RFSP : User's
Manual for Microcomputer Version," TTR-321, Atomic Energy of Canada Limited, 1993.
28. G.H. ROH and H.B. CHOI, "Assessment of CANDU Primary Shield System for DUPIC
Fuel," KAERI/TR-1056/98, Korea Atomic Energy Research Institute, 1998.
29. J.D. KIM et. al., "Calculation and Comparative Analysis of Fe-56 DPA Cross Sections
Processed from Evaluated Nuclear Data Libraries," Proceedings of the Korean Nuclear Society
Autumn Meeting, Seoul, Korea, 1998.
30. L.R. GREENWOOD and R.K. SMITHER, "Displacement Damage Calculations with ENDF/
B-V," Proceeding of the Advisory Group Meeting on Nuclear Data Radiation Damage
- 512 -

KAERI/RR-1999/99
Assessment and Reactor Safety Aspect, IAEA, Vienna, Austria, 1981.
31. R.E. MACFARLANE and D.W. MUIR, "The NJOY Data Processing System Version 91,"
LA-12740-M, Los Alamos National Laboratory, 1994.
32. M.M. EL-WAKIL, Nuclear Heat Transport, Chapter 6, International Textbook Company,
1971.
33.1.C. GAULD, "WOBI-An Integrated 2-Dimensional WIMS-AECL and ORIGENS Burmip
Analysis Code System", RC-1808, Atomic Energy of Canada Limited, 1997.
34.1.E. OLDAKER, "Core Fuel for a CANDU 6 Reactor - 37-Element Bundles", AECL Technical
Specification TS-XX-37000-6, 1989.
35. J.R. JOHNSON and D.W. DUNFORD, "Dose Conversion Factors for Intakes of Selected
Radionuclides by Infants and Adults", AECL-7919, Atomic Energy of Canada Limited, 1983.
36. K.A. LITWIN, I.C. GAULD and G.R. PENNER, "Improvements to the Point Kernel Code
QAD-CGGP: A Code Validation and User's Manual", AECL Report RC-1214, Atomic Energy
of Canada Limited, 1994.
37. IAEA, "IAEA Safety Series No.6, Transport Regulations," 1985.
38. National Archives and Records Administration, "Packaging and Transportation of Radiative
Materials, Code of Federal Regulations, Title 10, Part 71," USNRC, 1992.
39. H.Y. GANG et. al., "KSC-4 Shipping Cask Safety Analysis Report," KAERI/TR-137/89,
Korea Atomic Energy Research Institute, 1989.
40. J.H. YOON and J.R. CHOI, "Shielding Analysis for KSC-7 Spent Fuel Shipping Cask,"
KAERI-NEMAC/TR-03/93, Atomic Energy Research Institute, 1993.
- 513 -

KAERI/RR-1999/99
41. KEPCO, "Preliminary Safety Analysis Report for Wolsong Unit 3 & 4," Chapter 9, 1992.
42. K.S. CHUN et. al., "Safety Analysis for the Storage Capacity Expansion of the Existing
Spent Fuel Bay at KNU#3," KAERI/RR-596/87, Korea Atomic Energy Research Institute,
1987.
43. E.A. ENGHOLM, "Shielding Aspects of LWR Spent-Fuel Shipping Cask," Proceeding of
Third International Symposium on Packaging and Transportation of Radioactive Materials,
CONF-710801, 1971.
44. K.T. TSANG et. al., "Storage of Natural-Uranium Fuel Bundles in Light Water : Reactivity
Estimates," Fifth International Conference on Simulation Methods in Nuclear Engineering,
Montreal, Canada, 1996.
- 514 -

KAERI/RR-1999/99
DUPIC n&
- 515 -
KAERI/RR-1999/99
5. DUPIC
DUPIC s^ ! ) iM o
^ * M NUCIRC 3.S.1- 43-*>&i;}.. NUCIRC S H f e
NUCIRC ^
DUPIC
CANDU ^^}S.<Hl DUPIC ^J ^
CANDU # \ (&$ ))H ^
fe DUPIC ^^5.0^) cfl*H
NUCIRC s ^ . # <>l-8-*M DUPIC
. H ^ 4 DUPIC 91
DUPIC «foiSofl 3j-g-*> ^2fo]cf. ixj-eH DUPIC
$]-5}o] ASSERT-PV
DUPIC 91
DUPIC «?«iS.7l- ^ g - ^ ^ S i } H ^ ^ ^ ^ - ^ ^ 1 ^ 3.7)} t\M
- 517 -

KAERI/RR-1999/99
5.1 < i ^ iH i
^r CANDU-6
5.1.1 CANDU-6
DUPIC « J ^ S # ^ ^ « > CANDU
^ CANDU-6
1) ^cfl^-g- ^ ^ ^ ^ K r ^H^-H-^l 23.9 kg/s^ HH 718 kPa
2) ^tflpi-g- ^ ^ - H - 3 o ^ 27.4
3)
5.1.2
NUCIRC S ^ ^ f e
O.lpsi
- 518 -
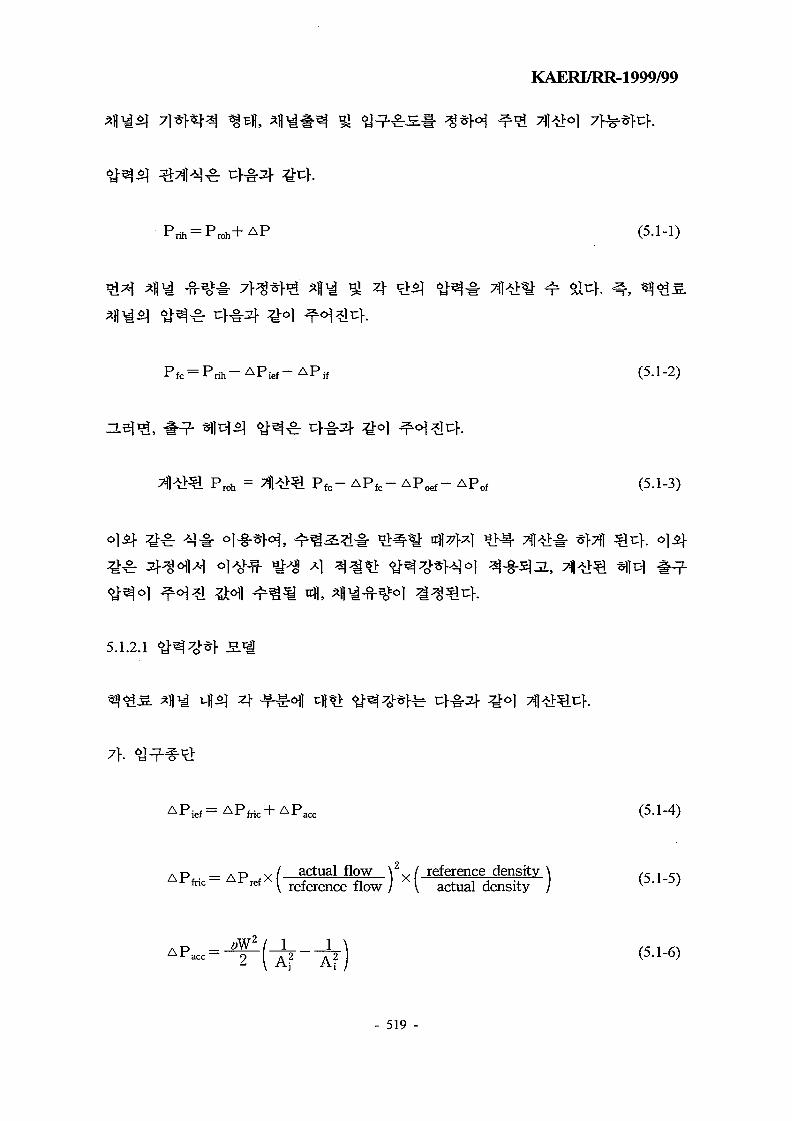
KAERI/RR-1999/99
5.1.2.1
A P ^ A P W/ actual flow \2 / reference density \r f r i c ref I reference flow j \ l d i t )
W/ actual flow \ / reference density \ref I reference flow j \ actual density )
2 (Af
- 519 -
(5-1-1)
(5.1-2)
Proh = ^1^>€ P f c - A P f c - A P ^ - APof (5.1-3)
AP i e f =AP W c +AP a c c (5.1-4)

5.1.2.2
KAERI/RR-1999/99
— AP elevation (5-1-7)
A P = AP -m+ APorifice+ APventuri+ APorifice+ APventuri+ APnozzle (5.1-9)
7]
NUCIRC
Hi -H i + 1 =1707xP c x[ f (Xi ) - f (X i + 1) (5.1-10)
Pc, x 9i f fe #^ ,
- 520 -

KAERI/RR-1999/99
44
= 100.0 h s a t ) (5.1-11)
(5-1-12)
— « 2 v /JP ^ / actual flow \2 .-^CM><^PrefX( r e f e r e n c e f l o w ) >
reference density \actualdensity )
4M = (1- ar0
(5.1-14)
fe 44
5.1.2.3
NUCIRC
n.% 5.1-20]] . 4
- 521 -

= A4PAsGA6
! = 0.8589, A2 = 0.21967
4 = 0.18396, A5 = 0.62492,
= -0.59870,
6 = -0.44954
5.1.3
5.1.3.1
= 1.0
= 0.06
= 1.0
= 1.0
- 522 -
KAERI/RR-1999/99
o]n) fe Xc-Lb
(5.1-16)
Xc, P, G, Lb,
X c - L b CANDU
(5.1-16W

KAER17RR-1999/99
15 S.
0.13
15 S.
= 0.0003 in
5.1.3.2
= 53.05
190,000 lbm/hr
= 12.3 psi
= 46.71
190,000 lbm/hr
= 0.06 ft2
12
19.5 ft
0.037865 ft2
0.2499 ft
0.00002 in
12
19.5 ft
0.03889 ft2
0.2459 ft
0.00002 in
5.1.3.3
511.8 °F
590.0 "F
- 523 -

= 194.7 psi
5] 7]
KAERI/RR-1999/99
100%
ttfl
- 524 -

KAERI/RR-1999/99
Inlet Feeder
AP
Fuel Channel
Outlet Feeder
Inlet End Fitting Outlet End Fitting
Fig. 5.1-1 Slave Channel Analysis Model in NUCIRC Code
- 525 -

KAERI/RR-1999/99
PathB
P'roh=Prih-(APfa+AP&+AP_,+APJ
Path A is used for the initial evaluation
And Path B is used thereafter.
Fig. 5.1-2 CCP Calculation Scheme in NUCIRC
- 526 -

KAERI/RR-1999/99
2'-0
0.7715'
4.2.1a
Fig. 5.1-3 Geometry of Inlet Feeder to Channel N19
- 527 -

KAERI/RR-1999/99
Inlet HEDGrayloc GEN
GEN
GEN
GEN
GEN
GEN
GEN
50 GEN
GEN55 GEN
GEN
GEN
75 GEN
80 GEN
INLET ENDj
reeder
5
7
9
11
13
14
15
16
1719
20
21
23
24
-0.468
-0.1979
-3.9479
-1.4063
0.0
0.0
0.0
0.0
0.00.0
0.0
0.00.0
0.0
N19,0.293
0.0
0.0
1.4063
4.3021
4.0
4.0
4.0
2.00.0
0.0
0.0
8.7978
SOUTH,0.0
0.5417
0.0
0.0
0.0
0.0
0.0
0.0
0.0-2.3125
-4.2292
-5.02.3689
0.2598
INLET,0.25
0.25
1.25
1.25
1.25
1.25
0.7715
11
CASE12^ -
2
2
2
2
2-*—
K—
33
3
33
3•
1
, HOT, FULL
Bend/Elbow
—Straight Pipe Only
—Existence of Reducer
Material IndexI t ^^ fM k ^ t £4 f^^r M B1 few T^^ ^ B 1 fet^Xi
ivauius oi K^ urvature7 f*n«m*fl inciteMa ^U"UI UUIdlC
V fn-nrriin»tp\. \^r\J Ul UlllalC
X Co-ordinate
Fig. 5.1-4 Feeder Geometry Input of NUCIRC
- 528 -

KAERI/RR-1999/99
5.2 < i ^ n^ ^
5.2.1 ^3} nj fe^
CANDU ^^^<^1 && ^«&S ^ DUPIC *|*iS4l W * H 100% #
5.2.1.1
: DUPIC
DUPIC ^ ^ S ^ | ^ o ^ # ^ ^
5.2-3< l SKHi^r «>Af ^ o | Lll
Lll l
, DUPIC
DUPIC t^*} «>^»y- #^^:Sfe S ^ Jc^sf -^-4*1 ^ ^ 5 . <g^ 61 cf.#^^r DUPIC
, DUPIC
5.2.1.2
NUCIRC
^-eo># 7j]A>iy- ^ ait:]-. H ^ 5.2-4
DUPIC ^ f r ^ ^
- 529 -

KAERI/RR-1999/99
DUPIC ^r 4 4 8214 kg/s^- 8300
kg/s o)c}
-§-^1*1 27.4 kg/s#
23.9 kg/s^ -fr^S a
DUPIC
Stic}.. DUPIC
718 kPa
8689
NUCIRC S S .
5.2.1.3
DUPIC ZL^ 5.2-621- 5.2-
l, DUPIC^f
DUPIC
DUPIC
£• 5.2.2
5.2.1.4
DUPIC
1.5025. H07
. 006 ^fl^^l . ©] ^ J f f e
- 530 -

KAERI/RR-1999/99
1.12
5.2.1.5
4
DUPIC 5.2- DUPIC
5.2-104
. NUCIRC 3J=ir
5.2.2
5.2.2.1
/ s 5.2-I [Ref.
NUCIRC a.
DUPIC
- 531 -

KAERI/RR-1999/99
a)
b)
c)
NUCIRC
JL7] ^-c}. ZLBlJL b) 91 c) % ^ NUCIRC 3 S 5 f ^ ^
, DUPIC
ASSERT-PV 3 H [Ref. 12]
B, DUPIC2]-
ZLQ 5.2-12-fB]
5.2.2.2 «fcg
ASSERT-PV
DUPIC
DUPICNUCIRC vDUPIC A ^ R
- 532 -

KAERI/RR-1999/99
DUPIC
DUPIC
ASSERT-PV
ASSERT
5.2-25}
5.2-3011
1.0
S 5.2-3^
DUPIC
. o] DUPIC
CCP _ A CCP , A FRDUPIC — A NU + A DUPIC
EAEUPIC = 0.93%
- 533 -

KAERI/RR-1999/99
Table 5.2-1
Result of Sensitivity Analysis [Ref. 7]
Parameter
Reference CCP
IF Entrance K
Inlet Feeder K
Inlet Feeder (f.L)
Inlet Feeder (ID)
Orifice (K)
IEF DeltaP
Fuel Bundles K
Fuel Bundle CFL/D
OEF DeltaP
Outlet Feeder (K)
Outlet Feeder (f.L)
Outlet Feeder (ID)
Two-Phase Multiplier (Fuel)
Two-PhaseMultiplier (OEF)
Two-Phase Multiplier (OF)
CHF Correlation
Inlet Temperature
H A Peader-to-Header
C » & A P H-to-Hombined T
Cin&AP H-to-Hombined T
Outlet Pressure
CCP (MW)
9.03
9.03
9.024
9.007
9.021
9.030
9.022
9.011
9.009
8.993
9.002
8.997
9.010
8.975
9.011
8.975
8.889
8.871
8.898
8.852
8.852
8.968
SENSITIVITY
0.
-0.0006 MW/%
-0.0046 MW/%
-0.0218 MW/%
-0.000 MW/%
-0.0008 MW/%
-0.0098 MW/%
-0.0108 MW/%
-0.0037 MW/%
-0.0028 MW/%
-0.0065 MW/%
-0.0496 MW/%
-0.0158 MW/%
-0.0038 MW/%
-0.0110 MW/%
-0.0325 MW/%
-0.0797 MW/%
-0.0033 MW/oC
-0.0623 MW/KPa
-0.0111 MW/kPa
-0.0006 MW/kPa
- 534 -

KAERI/RR-1999/99
Table 5.2-2
Selected Fuel Channels for Radial Correction Factor Calculation
Channel Flow (kg/s)
DUPIC
24.23 (H07)
26.73 (LOS)
25.20 (P08)
11.63 (A14)
24.33 (N04)
Standard
24.94 (O06)
27.20 (L05)
26.80 (M05)
11.71 (A09)
24.63 (N04)
Fuel Channel Conditions
Minimum CPR channel
Maximum channel flow
Maximum channel power
Maximum channel exit quality
Maximum fuel element temperature*
- 535 -

KAERI/RR-1999/99
Table 5.2-3
Radial Correction Factor
Fuel Channel
A09
A14
H07
L05
M05
N04
O06
P08
Channel Flow (kg/s)
11.71
11.63
24.23
26.97
26.80
24.48
24.94
25.20
Critical Channel Power (kw)
CCPNU
6950
6920
11220
12200
12140
11310
11500
11310
CCPDUPIC
6790
6750
11150
12190
12120
11250
11410
11250
Mean Value
Standard Deviation
Radial
Correction
Factor (FR)
0.9770
0.9754
0.9938
0.9992
0.9984
0.9947
0.9922
0.9947
0.9907
0.009236
(0.93%)
- 536 -

KAERI/RR-1999/99
ABCDEFGHJKLMNOP0RsTUVW
ABCDEFGHJKLMNOPQRSTUVw
1
31993412
3506
3535
33593220
123384
427650775552
58695814
6001
5974
6001
58335808
5729
58705944
6082
5992
5969
5870
5603
4987
4285
3308
2
3534
3911
4217
4420
4596
4559
4477
4209
3965
3501
133281
42845071
5708
59275965
5945
6041
595159775870
59435914
60466004
6053
5939
6037
5644
5082
4193
3245
3
3207
3867
4288
4762
5024
5310
5388
5468
5309
5150
4749
4323
3772
3159
143232
40955008
55975983
5933
6039
5994
6049595960255966
6063
6018
6100
5993
6004
5945
5623
4907
4059
3110
4
3321
3966
4524
5024
5326
5636
5768
5968
5954
5948
5718
5450
4959
4471
3813
3223
15
3894
47065455
58146072
6013
61106000
606060076105
6052
61396087
6091
59775854
5340
4671
3764
5
3202
3962
4562
5102
5340
5631
5725
5885
6008
6149
6070
6059
5684
5373
48794408
37833103
16
3405
43375054
5606
5840
5968
59666017
596160916067
6155
6078
6106
5896
5815
5467
4996
41893320
6
2888
3771
4533
5162
5505
5749
5824
5879
5850
6070
6076
61606074
5999
5678
5404
4944
4452
36352802
17
2928
3749
458751185564
5690
5881
5809591059936136
6080
61315924
5723
5336
4976
4393
3651
2760
7
3425
4285
5094
5544
5897
5902
6036
5953
6036
6027
6146
6092
6158
6047
3973
5769
5536
4963
42433305
18
3248
39364614
5054
5393
55695777
581560626073
6121
5982
5729
5304
4911
4348
3798
3054
8
3847
4741
5394
5868
6007
6080
6042
6072
5993
6084
6038
6131
6075
6166
6031
6049
5807
540546403812
19
33663934
4570
49695374
5570581758936002
5871
57625377
4994
4410
3831
3171
93193
4124
4953
5647
5919
5997
5971
6064
5981
6033
5956
6042
5996
6095
6034
6069
5945
6014
55784964
4033
3149
20
3241
3825
4324
4706
50655244
54295397
5346
50794780
4265
3794
3111
103306
4239
5115
5648
5985
5899
6012
5972
6021
59085942
5874
5988
5978
6079
5987
6010
5981
57055040
4237
3223
21
3488
3941
41674451
45354588
44154231
3907
3521
113351
4315
5027
5606
5809
5878
5934
6043
5932
5903
5739
5799
5801
6017
6011
60635904
5932
55505036
4248
3339
22
321933663524
3483
3372
3168
Fig. 5.2-1 Channel Power Distribution of DUPIC Core (kW)
- 537 -

KAERI/RR-1999/99
ABCDEFGHJKLMNOP
QRSTUV
w
ABCDEFGHJKLMNOPQRSTUVW
1
332535303657364034763269
123389435451265656590359536078608959935865575057325808597560696030588356975240454636892641
2
3617
40644365462947644763461143484002
3516
133316431951725762601059906032604159975932588158775919598460075963587858025335459236352549
3
33043962
4464492152585510565056695538528348724332
37383024
14321241625061571360156034606760716035599959845992601960486045.5979587857725262446934642396
4
3412
40694700
5179555558276035618762356147593655415022
439836902955
15
39084801572259356135616861636089606560796105613161596174606459135622503941993199
5
32804054
47265241
5543
578859486083629763836358622558295373
4835422235352701
16
34534384517156815988608461216076608361496203622762276163596057015298465637812761
6
295238484682
52885700
5890
60206040610462816368638163186074573053044789414232572266
17
29343823464952485653583959655984604762246313632862686028568952694760411932402255
7
34704407520057156027
6126
616661226130619562486269626762015995
57315324467837972772
18
325340184682518854845723588060146228631762956165577553264796419035112684
8
39224820554559626165
6201
61986124610061146139616461906204609159385644505742133209
19
3375402246425112548257505956610861586074586954794968435536562930
9321941725075573060346055
6091
609560606025600860176042607060675999
589757885276448034712400
20
32543901439448435176542555665586546052134807427636912990
10332043255181577260216003
6045605560125947589658915933599760205975589058125344459836402525
21
3543398442834543467846814534427639363455
113391435651295659590759576083
609459975870575557385813598060736034
588757005243454936902642
22
324334453572356034033201
Fig. 5.2-2 Channel Power Distribution of Standard Core (kW)
- 538 -

KAERI/RR-1999/99
0.20
0.15
CD
O
g> 0.10
CD
on
0.05
0.004 5 6 7 8 9
Bundle Position
10 11 12
Fig. 5.2-3 Axial Power Distribution of DUPIC and Standard Fuel for Channel Lll
at 100% F.P. Normal Operating Condition
- 539 -

KAERI/RR-1999/99
ABCDEFGHJ
KLMN0P
QRSTUV
w
ABCDEFGHJKLMN0P
QRSTUVW
1
12.7213.5914.0913.9713.9612.94
1213.1517.7821.8524.6325.9924.7924.4124.2924.0524.1923.9024.3023.6623.4723.9524.4024.5325.8823.7321.4116.2412.78
2
14.2516.3916.2517.2920.4920.3618.2517.1116.1714.07
1313.2217.6821.6424.3925.9325.3825.3424.8125.2624.9124.9424.6724.9124.6524.9925.0224.8825.8623.8221.3516.4212.56
3
13.4016.0117.3719.8521.2821.8322.4522.1621.5420.4819.9118.9216.2812.34
1411.6317.9320.3623.9125.3725.0025.0425.3425.2725.3625.1026.3125.1525.2125.0125.1524.8625.0822.8520.1315.3811.91
4
12.9415.5818.6020.9423.1024.0524.5225.0824.9724.3323.4722.5723.5019.0416.0413.25
15
16.9219.4623.2224.1725.1525.1925.3825.8725.7526.0725.6425.8225.2525.4124.8925.1523.7422.1219.3515.23
5
13.0915.8018.7621.4523.0824.1225.5126.0826.7326.3126.3624.8224.2724.1022.4118.2615.2111.94
16
13.3616.8420.2922.6424.0824.1024.4525.3325.5925.4925.4625.1725.0124.3823.9423.5622.1719.4916.6112.75
6
11.8014.1217.2220.6022.8924.1224.7125.3425.4625.6925.8325.2624.6724.5923.4823.0720.4917.8613.8910.79
17
11.7614.1517.1320.7122.7424.2624.5525.4825.3225.8925.6825.4724.5024.7923.3623.2020.4217.9613.8610.84
7
13.3316.9220.1822.8223.9224.2924.2325.5025.4025.6525.2625.3524.7824.5623.7323.6922.0319.5616.5312.78
18
13.0215.8618.6521.5522.9624.2525.4426.1526.6526.5026.2125.0324.1624.1522.3918.3415.1812.00
8
16.9819.3823.3624.0125.3424.9925.5925.6825.9425.8725.8225.6225.4325.2025.0524.9723.8721.9919.4015.17
19
12.8815.6418.5021.0722.9924.1924.4025.2524.8324.5323.3422.7223.4719.1216.0113.31
911.6717.8920.5023.7925.5624.8125.2525.1325.4625.1625.2826.1825.3425.0125.2024.9525.0124.9222.9520.0215.4311.87
20
13.3716.0817.3119.9621.2021.9722.3522.3321.4420.6319.8518.9816.2612.38
1013.1917.7621.5424.5425.7725.5725.1525.0225.0725.0924.7524.8524.7124.8524.7825.1924.7125.9823.6921.4316.3412.59
21
14.3116.3416.3217.2320.5220.3418.3617.0716.2414.05
1113.2017.7121.9524.5526.0624.6224.6024.0724.2424.0124.0924.1323.8523.2724.1624.2024.6925.7923.8421.3316.3012.75
22
12.6913.6714.0614.0413.9412.98
Fig. 5.2-4 Channel Flow Rate of DUPIC Core (kg/s)
- 540 -

KAERI/RR-1999/99
ABCDEFGHJKLMNOP
0RSTUVW
ABCDEFGHJKLMN0P
QRSTUV
w
1
12.6513.5114.0313.9813.9412.98
1213.2417.9222.2625.1326.6825.2625.0624.8024.8524.8224.7524.9524.4924.0924.7925.0725.4526.6024.5221.9316.9913.09
2
14.2616.3616.2917.2520.6920.5018.3317.1416.3214.16
1313.2717.8921.9325.0226.5826.1925.9825.6825.9525.8025.6525.5725.6425.5925.7625.9925.7026.7524.6021.9917.0312.95
3
13.4116.0517.3519.9621.3421.9922.5022.3521.5920.6920.1019.1716.4512.53
1411.7218.0820.7024.3526.2025.5825.8726.0126.1626.0726.0026.9926.0925.9525.9725.9425.8325.9423.7520.7616.0412.25
4
12.9215.5818.6021.0823.2824.3924.7525.4925.1624.6923.6622.9923.9019.4016.2913.50
15
17.0919.6123.6924.6325.9225.6926.2026.5326.6126.7426.5226.5026.0926.0725.7826.0024.7722.8519.8615.63
5
13.0715.8118.8021.7023.3024.5325.9826.6627.2026.8026.6825.3224.7024.5922.7818.6915.5512.32
16
13.3817.0020.4423.1424.4824.6424.8826.0826.1826.2526.0225.9225.5125.1024.5224.4422.9320.2917.1713.19
6
11.8014.1517.2720.8123.1124.5725.0725.8725.8026.1726.1325.6824.9425.2624.0023.6921.0318.4614.4411.10
17
11.8214.1817.3120.8923.2024.6725.1825.9625.9026.2926.2525.8025.0525.3524.0623.7121.0518.4614.4511.10
7
13.3616.9720.3723.0624.3924.5524.7726.0026.0926.1725.9425.8325.4325.0224.4524.3922.9020.2717.1613.18
18
13.1115.8818.8721.7923.4024.6426.0526.7227.3126.9426.8125.4624.7924.6122.7918.7015.5612.33
8
17.0819.5823.6524.5725.8525.6126.1226.4826.5726.7026.4626.4426.0326.0225.7325.9824.7522.8419.8615.63
19
12.9715.6618.7021.2323.4024.5324.9025.6525.3424.8623.8123.1023.9119.4316.3013.50
911.7118.0820.6724.3126.1625.5425.8225.9626.1226.0325.9626.9826.0525.9125.9325.9225.8125.9423.7420.7616.0412.25
20
13.4516.1317.4620.1021.4822.1522.6722.5221.7520.8220.1719.2116.4812.55
1013.2617.8921.9225.0026.5726.1725.9525.6525.9325.7825.6325 .5625.6225.5725.7425.9725.6926.7424.6021.9917.0312.95
21
14.3616.4816.3817.3620.7720.6018.4517.2416.3914.22
1113.2417.9222.2625.1326.6825.2525.0524.7924.8424.8124.7424.9524.4824.0824.7925.0625.4426.6024.5221.9316.9913.09
22
12.7513.6514.1314.0614.0113.04
Fig. 5.2-5 Channel Flow of Standard Core (kg/s)
- 541 -

KAERI/RR-1999/99
ABCDEFGHJKLMN0PQRSTUVW
ABCDEFGHJKLMNOP
QRSTUVW
1
5702
5929
6322
6333
6206
6045
12
5909
7408
8355
8909
9292
9123
9251
9144
9215
9164
9038
9142
9113
9070
9167
9193
9217
9375
8948
8355
7025
6012
2
6286
6882
7121
7346
7854
7794
7476
7181
7005
6354
135862
7399
8295
8956
9140
9207
9172
9179
9295
9302
9241
9275
92479280
9247
9329
9223
9464
8949
8373
7015
5765
3
6095
6771
7270
7856
82428416
8577
8583
8416
8188
8135
7595
6971
5791
14
5543
7342
7941
8842
9119
9118
9191
9175
9355
9297
9398
9477
9362
9309
9316
9252
9258
9227
8884
8077
6780
5614
4
5845
6657
7538
8017
8660
88939072
9277
9151
9085
8861
8667
8685
7797
68505976
15
7091
7790
8762
8913
9182
9145
9222
9353
9388
9478
9475
9473
9374
9328
9264
9215
8998
8579
7984
6675
5
5789
6703
7624
8316
8650
8909
92029312
9463
9432
9376
9195
8956
8954
8550
76276668
5579
16
5944
7321
8006
8650
8955
9034
9038
9309
9294
94619410
9348
9263
9205
9051
8964
8664
7992
7087
5850
6
5436
6322
7369
8183
8674
8953
9011
92479233
9358
94369324
9187
91608970
8788
8165745761765154
17
5444
6295
7390
8163
8692
8931
9029
9228
9254
9334
94619300
9210
9142
8988
8770
8178
7444
6201
5148
7
5970
7302
8025
8637
8980
9010
9064
9284
9323
94279441
9318
9291
91809072
8942
8673
797371065833
18
5794
6678
7642
8301
8669
8888
9218
9297
9485
9411
9397
9174
8973
8934
8562
7615
6691
5577
8
7073
7816
8749
8938
9159
9173
9194
9385
9352
9512
9436
9511
9343
9356
92399236
8975
858979636693
19
5852
6632
7558
8005
8670
8874
90919255
9171
90658874
8660
8700
7778
6872
5973
95534
7365
7924
8858
9098
9145
9162
9208
9319
9339
93609514
9324
9345
9284
9279
9233
92478867809267575624
20
6104
6747
7290
7835
8257
8402
8596
8568
84298174
8152
7581
6992
5786
105873
7382
8310
8936
9160
9182
9202
9145
93359265
9278
92389284
9243
92809300
92479446
8967835970335754
21
6278
6905
7098
7367
7836
7813
7458
7203
6985
6365
115898
7426
8346
8923
9274
9149
9220
9180
9177
9201
9005
91819077
9108
9133
9222
9194
93928931836770036020
22
5714
5913
6345
6312
62306041
Fig. 5.2-6 Critical Channel Power in DUPIC Core
- 542 -

KAERI/RR-1999/99
ABCDEFGHJKLMN0PQRSTUVW
ABCDEFGHJKLMNOP
QRSTUV
w
1
54635684
6071
6062
5972
5772
125669
7188
8175
8793
9190
9019
9100
9016
90569048
8887
9026
89588935
8996
9064
9069
9282
8801
8182
6805
5830
2
6034
6637
6866
7113
7645
7599
7235
6957
6734
6101
135648
7153
8129
8803
9040
9082
9065
9031
9191
91589129
9125
9137
9125
9129
9184
9099
9344
8805
8201
6814
5609
3
5829
6518
7035
7635
8054
8233
8404
8392
8233
7976
7925
7351
6730
5528
145295
7150
7741
8700
8982
9005
9050
9066
9213
91949251
9385
9214
9195
9169
9132
9109
9098
8710
7893
6582
5474
4
5581
6422
7310
7823
8494
8733
8930
9123
9011
8915
8697
8485
85207544
6635
5723
15
6830
7608
8572
8778
9043
9029
9083
9255
92569382
93359370
9227
9207
9113
9090
8830
8402
7791
6466
5
5538
6478
7398
8133
8489
8769
9103
9206
9368
9304
9268
9045
8831
8759
8337
7344
64665351
16
5736
7051
7826
8464
8824
8875
8916
9182
9194
9326
9302
9202
9139
9048
8904
8801
8480
7791
6861
5664
6
5110
6092
7133
7995
8512
8816
8902
9136
9131
9226
9323
9177
9058
9023
88398614
7978
72175989
4966
17
5200
6091
7133
7994
8516
8815
8903
9135
9135
92269322
9178
9057
9024
8837
8617
7977
7216
5989
4967
7
5736
7051
7828
8463
8825
8873
8917
9179
9192
9327
9298
9203
9138
9050
89028804
8476
7792
68605664
18
5539
6477
7401
8134
8492
8768
9104
92079369
9305
9267
9045
8829
8764
8336
7344
6465
5352
8
6831
7606
8570
8779
9041
9030
9083
9256
9256
9382
9336
9370
9228
9 206
9114
9088
8830
8401
7791
6466
19
5582
6419
7316
7821
8495
8736
8931
91239011
8916
8697
8486
8519
7548
6633
5724
95295
7150
7741
8700
8982
9006
9048
9066
92139194
9252
9384
92159194
9170
9131
9110
9097
87107889
6583
5474
20
5830
6517
7037
7639
8055
82328408
83968234
7976
7925
7357
6727
5533
105648
7153
8130
8803
9041
9082
9067
9030
9191
9157
9131
9128
9136
9126
9127
9186
90989344
88058202
6813
5609
21
6033
6641
6866
71157647
7603
7238
6956
6739
6092
115668
7188
8175
8793
9188
9021
9099
9017
9056
9048
8887
9025
8958
8933
89979062
9072
9281
88058182
6805
5830
22
5469
56876077
6067
5973
5775
Fig. 5.2-7 Critical Channel Power in Standard Core
- 543 -

KAERI/RR-1999/99
A
BC
DEF
G
HJKLMNOP
QRS
T
U
V
w
ABCDEFGHJKLMNOPQR
sTUVW
1
1.783 11.737 11.804 11.792 11.847 11.877 1
1
1
121.7451.7321.6461.6041.5831.5691.5411.5311.5361.5711.5571.5961.5531.5261.5071.5341.5441.5961.5961.6761.6391.819
2
.779
.760
.688
.662
.709
.709
.670
.705
.767
.799
131.7871.7271.6361.5691.5421.5431.5431.5191.5621.5571.5751.5611.5641.5351.5401.5411.5531.5681.5861.6481.6731.777
3
1.9001.7511.6951.6501.6401.5851.5921.5701.5841.5901.7131.7411.8311.833
14.714.794.585.580
1.5241.5371.5221.5301.5461.5611.5601.5881.5441.5471.5271.5441.5421.5521.5801.6471.6711.806
4
1.7601.6781.6661.5961.6261.5781.5731.5541.5371.5271.5501.5901.7361.7271.7971.853
15
1.8051.6411.591.533.511.521.509.559.549.577.552
1.5661.5271.5321.5211.5421.5371.6061.7091.774
5
1.8081.6911.6711.6301.6201.5821.6071.5831.5751.5341.5451.5171.5761.6521.7371.7301.7631.799
16
1.7281.6721.5701.5431.5331.5141.5151.5471.5591.5531.5511.5191.5241.5071.5351.5411.5841.6001.6911.762
6
1.8811.6761.6261.5851.5761.5571.5471.5731.5781.5421.5531.5131.5121.5271.5801.6261.6521.6751.6981.839
17
1.8591.6791.6111.5951.5631.5701.4351.5891.5661.5571.5421.5291.5021.5431.5711.6441.6431.6951.6981.864
7
1.726 11.688 11.561 11.558 11.523 11.527 11.502 11.560 11.545 11.565 ]1.536 ]1.529 11.508 ]1.518 11.5191.5501.5671.6071.6741.765
18
1.7851.696 11.656 11.643 11.607 ]1.595 11.596 11.598 11.5651.550 11.5351.5341.5671.6701.7281.7511.7621.826
8]
.822 1
.633 ]
.607 1
.523 1
.524 1
.508 1
.522
.545 1
.561
.564
.563
.551
.538
.517
.5321.5271.5451.5891.7151.756
19
.738
.685 1
.654 1
.611 1
.613 1
.593 1
.563 1
.571 1
.528 1
.544
.540
.6101.7261.7481.7951.883
9.733.787.600.569.537.525
1.534.518.558.548.572.574
1.5551.5331.5381.5291.5531.5371.5901.6301.6761.787
20
.883
.764
.686 1
.665 1
.630 1
.602 1
.583 1
.587 1
.577 1
.609 1
.706 1
.761 1
.827
.859
10.777.741.624.583.530.557.531
1.5311.550L.569L.5621.5721.5511.5461.5261.5531.5381.5791.5721.6581.6601.786
21
.801
.752
.703
.656
.728
.703
.690
.702
.789
.792
11
1.7601.7201.6601.5921.5961.5571.5541.5181.5471.5591.5691.5821.5651.5131.5181.5211.5571.5831.6091.6611.6501.804
22
1.7751.7571.8011.8131.8471.905
Fig. 5.2-8 Critical Power Ratio in DUPIC Core
- 544 -

KAERI/RR-1999/99
ABCDEFGHJKLMN0P0RSTUVW
ABCDEFGHJKLMNOPQRSTUVw
1
1.6501.6171.6661.6721.7241.772
12.679.658.602.561
1.563.521.503.486
1.517.549.552
1.581.548.501
1.4881.5081.5481.6361.6871.8071.852'216
2
1.675 11.640 11.578 11.542 11.611 11.602 11.575 11.606 11.688 11.724 1
11
13.709.663.578.534.510.522.509.501.539.550.559.559.550.531.525
1.5461.5541.617.656.793.881
2.209
3
.771
.653
.581
.559
.538
.500
.493
.486
.492
.515
.633
.687
.791
.835
141.6561.7241.5351.5291.4991.4991.4981.5001.5321.5381.5521.5731.5371.5261.5221.5331.5561.5831.6611.7731.9072.293
4
11.643 11.584 11.562 11.516 11.535 11.504 11.485 11.480 11.451 11.456 11.471 11.537 11.688 11.706 11.806 11.944 1
15
1.7371.5751.5441.4851.4801.4701.4801.5261.5321.5491.5351.5341.5041.4981.5081.5431.5771.6741.8622.029 :
5
1.694 1.604 1.571.558 1.538 1.521.537.520.494.463.463.459 ].521.621.714.745.836.990
16
1.6521.6001.5051.4961.4791.4651.4631.5171.5171.5221.5051.4841.4741.4741.5001.5501.6071.6791.8222.058 :
6
.768
.589
.529
.517
.500
.503
.485
.518
.502
.475
.470
.4441.440.492
1.549.631
1.6731.7481.8452.201 '
17
1.780.599
1.5401.529.512
1.516.499
1.5331.516.488.483.456.451
1.5031.5591.6421.6831.759
7
1.6451.5911.4971.4861.4701.4541.4521.5051.5051.5111.4941.4741.4641.4651.4911.5421.5981.6721.8152.050 :
18
.708
.619 11.586 11.574 1.555 I.538 1.554 1.537 ].510 ].479 1.478 1.473
1.5351.6361.7281.7601.848
1.855 2.0032.211
8
1.7311.5691.5371.4781.4721.4621.4711.5171.5231.5411.5271.5261.4971.4901.5021.5371.5711.6671.8562.023
19
.661
.602 1
.582 1
.536 1
.556 1
.525 1
.505 1
.500 1
.469 1
.474 1
.488 1
.555 1
.705 1
.723 1
.822 1
.961
91.6521.7201.5311.5241.4951.4931.4921.4931.5261.5321.5461.5661.5311.5201.5171.5281.5511.5781.6571.7681.9032.289
20
.799
.677
.608
.583
.562
.523
.516
.508
.513
.536
.655
.711
.813
.856
10.707.660.575.531
1.5071.5191.5061.4981.5351.5461.5551.5561.5461.5281.5221.5431.5511.6141.6541.7911.8782.207
21
1.7091.6731.6101.5721.6411.6311.6031.6331.7181.754
111.678.657.601.560.562
1.5201.5021.4851.5161.548.550
1.5791.5471.5001.4871.5071.5471.6351.6861.8061.8512.215
22
1.6921.6571.7071.7101.7621.812
Fig. 5.2-9 Critical Power Ratio in Standard Core
- 545 -

KAERI/RR-1999/99
ABCDEFGHJKLMNOP0RSTUVW
ABCDEFGHJKLMNOPQRSTUVW
1
1.541.401.481.81.781.58
122.10.83.06-.57-.52.161.091.061.35.68.71.221.191.611.60.95.77-.56.20-.032.432.30
2
1.39.59
2.351.95-.78-.84.981.101.111.72
131.38.94.22.13-.38.12.07.75.20.53.16.60.31.92.49.65.39.02.26.391.752.10
3
.81
.801.24.55.28.81.601.141.131.51.64-.13.28
2.05
143.91-.171.02.16.19.32.58.19.49.13.58-.54.59.40.79.34.61.251.10.86
2.502.41
4
2.021.79.89.47-.14.09.20.48.43.91.85.70
-1.60.49.45.91
15
.251.07.50.62.62.39.50-.11.13-.18.40.12.76.46.86.271.02.64.791.18
5
1.061.51.91.44-.11.03-.70-.64-.65.03-.25.86.06-.55-.96.761.362.21
16
2.142.481.531.18.771.14.81.34-.05.52.45.87.751.341.021.051.091.881.512.27
6
1.192.922.591.49.63.43.16-.08-.28.21.20.811.00.85.78.10.701.292.272.22
17
1.542.742.961.22.96.12.46-.40.00-.17.50.391.33.451.03-.23.89.91
2.411.83
7
2.302.141.80.821.09.761.22.02.33.20.85.531.181.001.46.791.471.671.882.13
18
1.441.321.24.17.16-.28-.47-.92-.42-.32.01.45.30-.83-.82.411.471.78
8
-.031.30.19.93.28.75.14.25-.21.19.06.51.41.87.54.64.76.99.611.52
19
2.411.551.18.15.11-.23.46.12.69.501.11.32
-1.45.16.57.51
93.56.00.67.42-.14.67.22.56.14.51.22-.20.24.80.44.73.30.60.851.192.302.75
20
1.07.511.48.23.51.45.84.731.351.09.82-.44.421.65
101.58.66.47-.17-.10-.21.42.37.57.17.54.24.70.55.90.31.76-.24.57.16
2.061.91
21
1.05.79
2.012.16-1.07-.69.601.25.731.88
111.821.07-.20-.32-.77.49.721.46.961.06.34.58.80
2.041.181.35.43-.30-.07.23
2.172.55
22
1.721.021.621.43.881.18
Fig. 5.2-10 Channel Exit Quality of DUPIC Core
- 546 -

KAERI/RR-1999/99
ABCDEFGHJKLMNOP0RSTUV
w
ABCDEFGHJKLMNOP0RSTUVW
1
2.482.222.452.441.501.83
122.001.06-.06-.54-.84.31.891.09.74.36-.07-.20.371.25.92.61-.14
-1.57-1.61-2.15-1.35-2.46
2
1.86 :1.39 13.073.01-.26-.121.511.751.141.71
131.54.91.38-.11-.52-.31-.06.16-.09-.20-.26-.22-.15.07-.01-.28-.35-1.29-1.34
3
.41
.24> . l l.11.151.441.54.741.971.861.00-.30-.05.87
143.60.01.93.26-.23.27.12.00-.13-.19-.14-.86-.16.01-.03-.23-.45-.88-.85
-2.01 -1.46-1.67 -1.39-3.01 -3.05
4
2.642.341.67.95.55.51.95.931.231.321.48.71
-1.62-.11-.43-1.06
15
.171.34.40.71,31.56.13-.24-.40-.37-.16-.05.26.30.16-.48-.49
-1.01-1.67-2.32
5
1.571.981.60.78.45.27-.26-.37-.04.45.451.06.26-.87-1.37-.47-.36-1.08
16
2.412.541.881.071.001.131.03.05-.02.21.52.59.891.01.82.03-.11-.23
-1.06-1.90
6
1.643.333.261.811.17.59.56.10.32.57.941.231.64.63.59-.69-.35-.68-.59
-2.35
17
1.483.143.051.58.93.35.31-.14.07.31.69.981.38.41.40-.83-.48-.79-.69
-2.44
7
2.542.682.051.251.191.351.26.25.18.40.72.781.081.19.99.16.01-.13-.98
-1.83
18
1.351.721.34.51.17-.02-.52-.63-.31.16.17.77.02
-1.05-1.53-.62-.50-1.20
8
.251.45.51.84.45.72.29-.10-.26-.23-.02.08.39.43.29-.38-.40-.94-1.60-2.26
19
2.332.001.31.57.20.15.58.56.85.951.13.41
-1.83-.32-.62-1.22
93.67.061.01.34-.15.36.22.11-.03-.09-.04-.78-.06.11.06-.14-.37-.82-.80
-1.42-1.35-3.01
20
1.04.841.66.68.71.991.091.301.541.47.66-.58-.32.61
101.57.94.43-.06-.48-.26.00.22-.03-.14-.20-.16-.09.13.05-.23-.30
-1.26-1.31-1.99-1.65-2.98
21
1.31.87
2.542.47-.67-.521.041.30.731.28
112.021.07-.05-.52-.83.33.911.12.77.38-.05-.18.391.27.94.63-.12
-1.56-1.60-2.14-1.34-2.45
22
1.791.531.821.85.971.32
Fig. 5.2-11 Channel Exit Quality of Standard Core
- 547 -
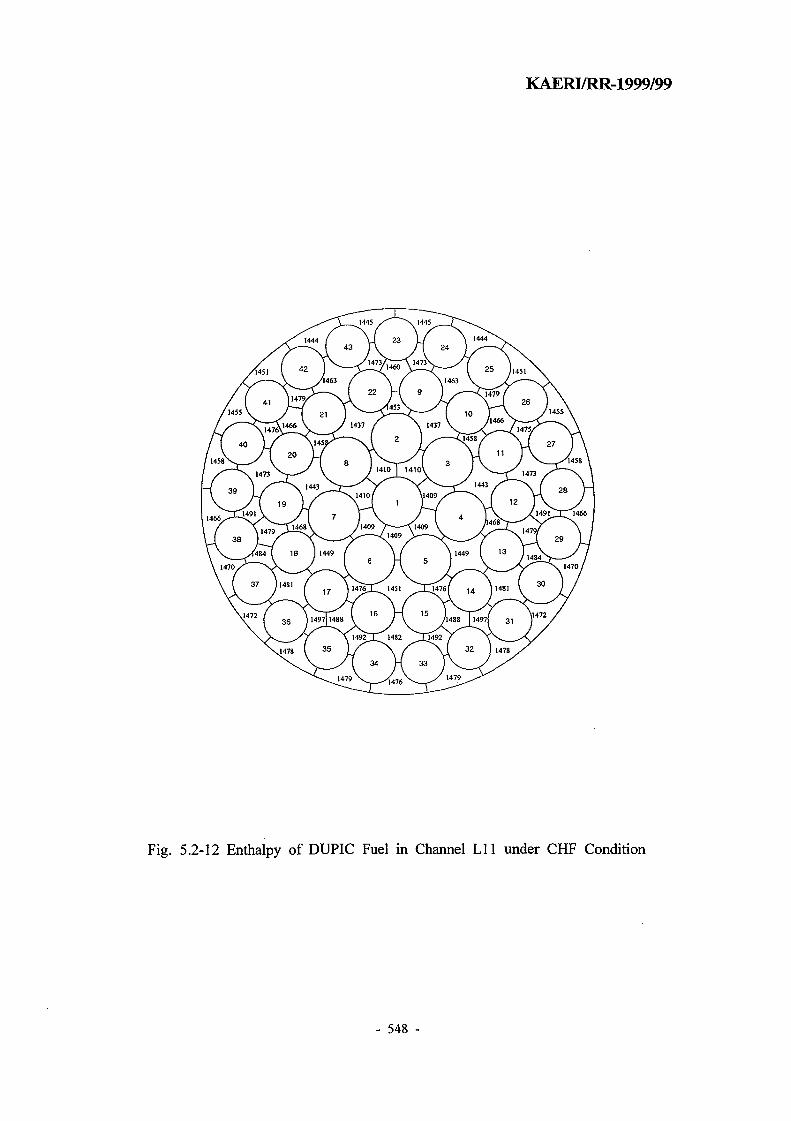
KAERI/RR-1999/99
Fig. 5.2-12 Enthalpy of DUPIC Fuel in Channel Lll under CHF Condition
- 548 -

KAERI/RR-1999/99
Fig. 5.2-13 Enthalpy of Standard Fuel in Channel Lll under CHF Condition
- 549 -

KAERI/RR-1999/99
Fig. 5.2-14 Void Distribution of DUPIC Fuel in Channel Lll under CHF Condition
- 550 -

KAERI/RR-1999/99
Fig. 5.2-15 Void Distribution of Standard Fuel in Channel Lll under CHF Condition
- 551 -

KAERI/RR-1999/99
Fig. 5.2-16 CHFR of DUPIC Fuel in Channel Lll under CHF Condition
- 552 -

KAERI/RR-1999/99
Fig. 5.2-17 CHFR of Standard Fuel in Channel Lll under CHF Condition
- 553 -
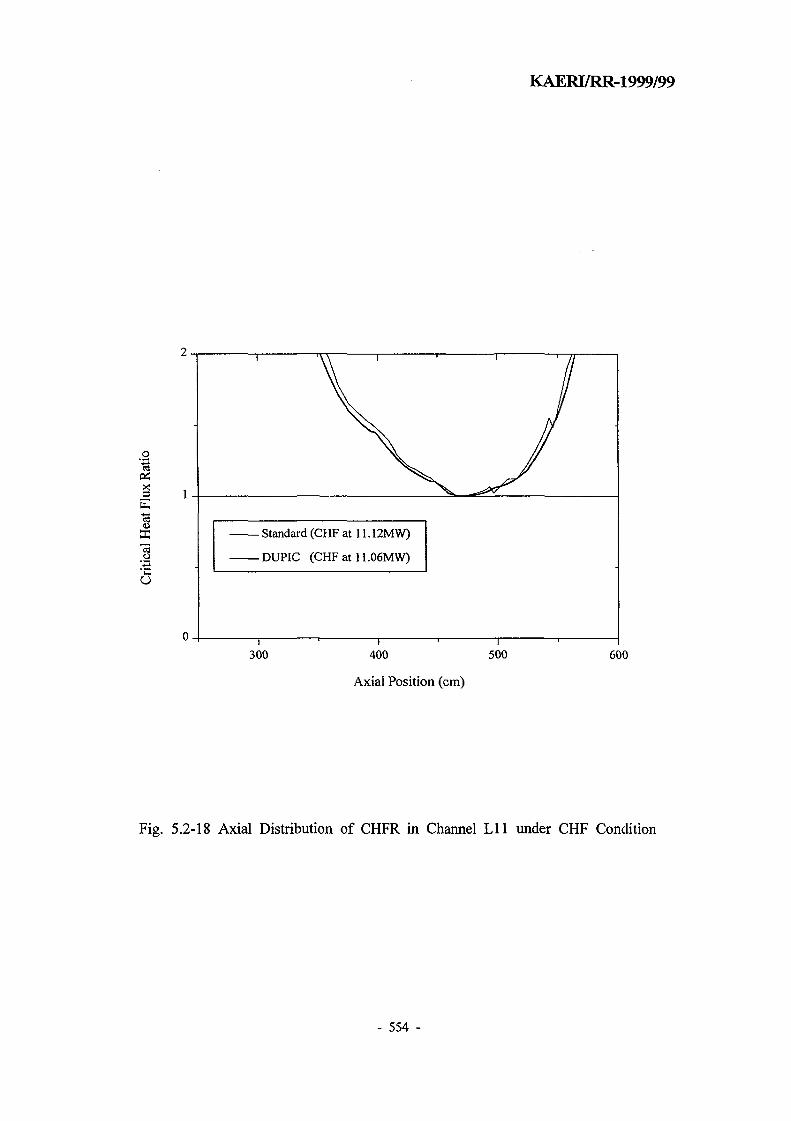
1
KAERI/RR-1999/99
- Standard (CHF at 11.12MW)
- DUPIC (CHF at 11.06MW)
i
300i
400 500 600
Axial Position (cm)
Fig. 5.2-18 Axial Distribution of CHFR in Channel Lll under CHF Condition
- 554 -

KAERI/RR-1999/99
5.3
5.3.1 NUCIRC
5.3-1 [Ref.
U+A
(5.3-1)
(5.3-2)
a ^ 5.3-2 [Ref.
H ^ 5.3-3
[Ref. 7M
L, JE
- 555 -

a(p,G)Lb
b(p,G,DH)+Lb
I
(5.3-5)1-
(n/m)Lbr [(GAhfg)/(mPH)
KAERI/RR-1999/99
(5.3-6)51 ^ i f e ^ (5.1-16H ^o]^ l NUCIRC
^- CANDU
5.3.2 ASSERT 3 . ^
7 = n(G,p)-m(G,p)xc (5.3-4)
River) ^ ^ ^ ^ Ul ^ ^ I f e CANDU ^
^ ^ ^ ^ ^ r CANDU
fe 2L£SL$. 13.9 Mpa^ ^ ^ ^ 17.0 ] ^
- 556 -

KAERI/RR-1999/99
, 6
I*}, ZL
. ©1
5.3-7cHl [Ref. 17]
ASSERT
ASSERT SL^
, ASSERT S H f e
CANDU
ofl^-*>jL
5.3-4^
. ^ . ^ 5.3-6ofl j£
. ASSERT 3 . ^ o]
- 557 -

< IS
8
KAERI/RR-1999/99
o
o
o
SYMBOL
VoAD••
AXIAL HEAT FLUX SHAPE
12 11 UNIFORM
6 ft UNIFORM
6 ft COSINE
12 ft COSINE
12 tt OUTLET PEAK
12 U INLET PEAK
A
A
V
V
V
••
•• a
a
0.18 0.22< X (i) >. LOCAL QUALITY
Fig. 5.3-1 Heat Flux Versus Quality at Location of BT, Freon-114 Annulus Data,
Dl=0.563 in., D2=0.875 in. and 12 ft Heated Length [Ref. 15]
- 558 -

KAERI/RR-1999/99
t 0.20
O
BEST FIT LINE
SYMBOL
Vo•A•
TD
FREON ANNULUS DATA3/106 - 0.540 lb/h-»t2
AXIAL HEAT FLUX SHAPE
12 ll UNIFORM
6 ft UNIFORM
12 It COSINE
6 It COSINE
12 M OUTLET PEAK
12 fi INLET PEAK
6 It HALF COSINE
(SHIRALKAFf. 19721
CRITICAL BOILING LENGTH, LB Ht>
Fig. 5.3-2 Critical Quality Versus Boiling Length, Freon-114 Annulus Data [Ref. 14]
- 559 -

KAERI/RR-1999/99
50
X , 0
SYMBOL
o•V
A
MAXIMUM/MINIMUMHEAT FLUX RATIO
1
1.91
2.99
4.7
AXIAL HEAT FLUX SHAPE
UNIFORM
EXPONENTIAL DECREASE
EXPONENTIAL DECREASE
SYMMETRICAL CHOPPED COSINE
2.0 2.5
CRITICAL BOILING LENGTH (ml
Fig. 5.3-3 Critical Quality versus Boiling Length Data, 12.6 mm Round Tube 3.66 m
Heated Length [Ref. 16]
- 560 -
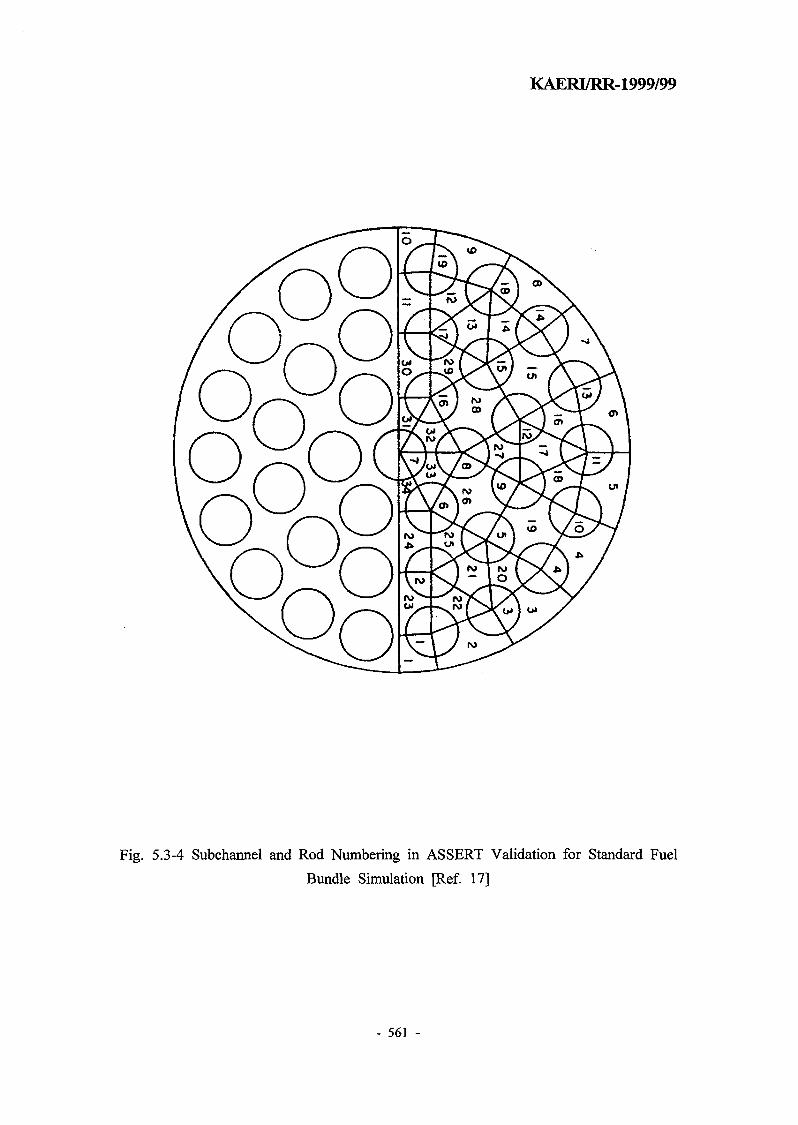
KAERI/RR-1999/99
Fig. 5.3-4 Subchannel and Rod Numbering in ASSERT Validation for Standard Fuel
Bundle Simulation [Ref. 17]
- 561 -

KAERI/RR-1999/99
BUNDLE AVERAGE- - SUBCHANNEL 1
SUBCHANNEL 10
0.0 3.0
AXIAL POSITION m6.0
Fig. 5.3-5 Pressure Drop and Void Profiles Simulated by ASSERT Code [Ref. 17]
- 562 -
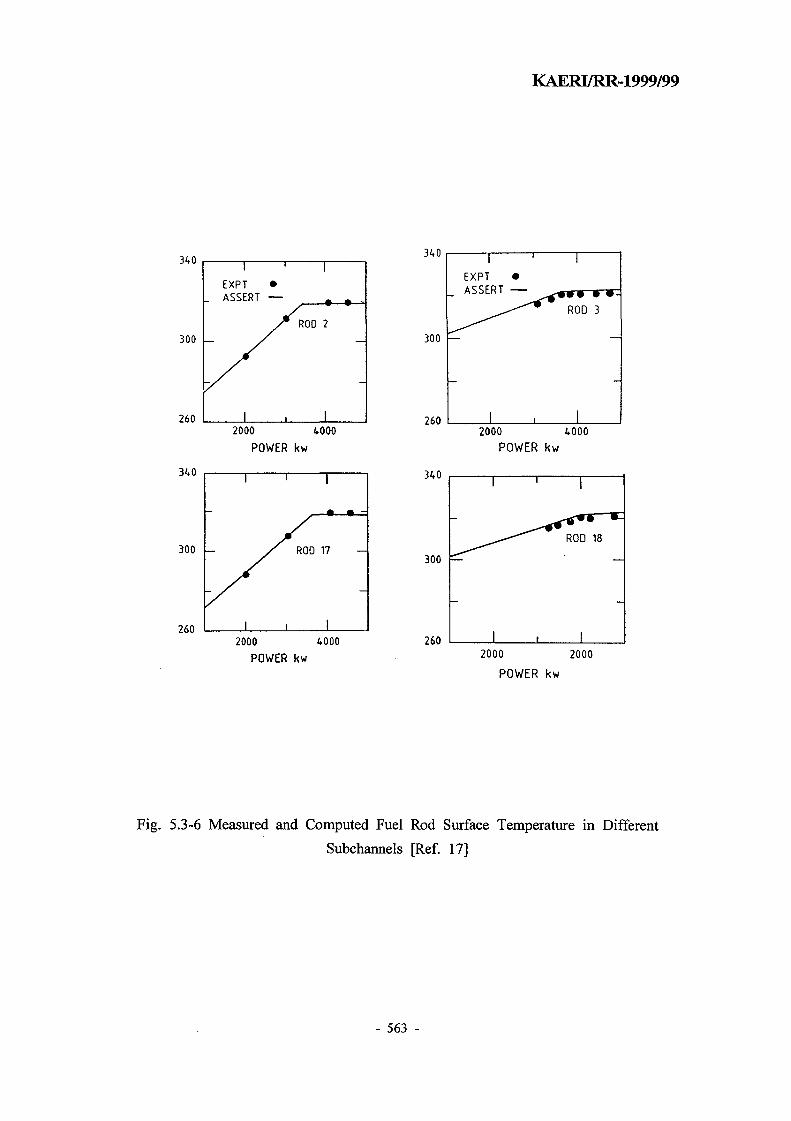
KAERI/RR-1999/99
300
760
1 '
EXPT •_ ASSERT —
1 /
1
/ROD
1
2
12000 4000
POWER kw
340
300 -
2602000 4000
POWER kw
260
340
2000 4000
POWER kw
300
260
1
1
1 1
<**ROO
|
18
—
2000 2000
POWER kw
Fig. 5.3-6 Measured and Computed Fuel Rod Surface Temperature in Different
Subchannels [Ref. 17]
- 563 -

KAERI/RR-1999/99
1200
E
oLLJ
Q
a.300 -
300 600 900 1200
EXPERIMENTAL HEAT FLUX KW m"2
Fig. 5.3-7 Measured and Computed CHF for Standard Fuel Bundle Experiments
[Ref. 17]
- 564 -

KAERI/RR-1999/99
5.4
DUPIC
DUPIC
. NUCIRGSJE^J
, DUPIC
DUPIC
DUPIC
DUPIC
7)S.
, NUCIRC 3 H
^r 0.9907
0.93%
DUPIC 9| 3E
^ , DUPIC
DUPIC
DUPIC
- 565 -

KAERI/RR-1999/99
1. H. CHOI, B.W. RHEE and H. PARK, "Physics Study on Direct Use of Spent Pressurized
Water Reactor Fuel in CANDU (DUPIC)," Nucl. Sci. Eng., Vol. 126, 1997.
2. C.J. JEONG, J.W. PARK, and J. PITRE, "Preliminary ROP Assessment for CANDU-6 with
DUPIC Fuel," Korea Nuclear Society Conference, 1999.
3. M.F. LIGHTSTONE, "NUCIRC-MOD 1.505 Users Manual," TTR-516, Atomic Energy Canada
Limited, 1993.
4. M. SOULARD, "NUPREP505 Users Manual," AECL Draft, 1994.
5. G.D. HARVEL, "NUCIRC: Part I and II," NUCIRC Training Material at KEPCO, 1999.
6. G.H. RHO, H. CHOI and J.W. PARK, "Sensitivity Analysis on Various Parameters for Lattice
Analysis of DUPIC Fuel with WIMS-AECL Code," Proceedings of the Korean Nuclear Society
Autumn Meeting, Taegu, Korea, 1997.
7. L.C. CHOO, "Critical Channel Power Analysis: Wolsong NPP," AECL 86-03500-AR-021,
1994.
8. G.D. HARVEL, "Wolsong 3, 4, PHT System Flow Verification Procedure," AECL Technical
Document 86-33100-610-001, 1998.
9. G.D. HARVEL, 1998, "Wolsong 3 PHT Flow Verification: Disposition for 100.0% F.P. with
Fuel Commissioning Flows," AECL Memo 86-33100-640-003, 1998.
10. J.W. PARK, "A Subchannel Analysis of the DUPIC Fuel Bundle in CANDU Reactor," Annals
of Nuclear Energy, Vol. 26, No. 1, 1998.
11. J.W. PARK and G.M. CHAE, "ASSERT-PV Simulation of Two-Phase Flow in Horizontal
- 566 -

KAERMRR-1999/99
and Vertical Channels," Canadian Nuclear Society '99, 1999.
12. E.K. ZARIFFEH, G.M. WADDINGTON, N. HAMMOUDA, L.N. CARLUCCI, V.C.
FRISIMA, J.C. KITELEY, D.S. ROWE, and P. PFEIFFER, "ASSERT-PV V2R8 Users
Manual," FFC-FCT-133, COG-97-460, Atomic Energy Canada Limited, 1998.
13. CM. BAILEY and G.K.J. GOMES, "ROPT Error Analysis for Wolsong-1," TTR-289 Part
3, Atomic Energy Canada Limited, 1995.
14. R.T. LAHEY, Jr. and F.J. MOODY, "The Thermal-Hydraulics of A Boiling Water Reactor,"
American Nuclear Society Monograph, 1993.
15. A. TAPUCU, A. TEYSSEDOU, P. TYE and N. TROCHE, "The Effect of Turbulent Mixing
Models on the Prediction of Subchannel Codes," Nuclear Engineeing & Design, Vol. 149,
1994.
16. R.K.F. KEEYS, J.C. RALPH and D.N. ROBERTS, "Post Burnout Heat Transfer in High
Pressure Steam-Water Mixtures in a Tube with Cosine Heat Flux Distribution," AERE-R6411,
AERE, UK, 1971.
17. M.B. CARVER, J.C. KITELEY, R.Q.N. ZHOU, S.V. JUNOP and D.S. ROWE, "Validation
of the ASSERT Subchannel Code: Prediction of Critical Heat Flux in Standard and Nonstandard
CANDU Bundle Geometries," Nuclear Technology, Vol. 112, 1995.
- 567 -

KAERI/RR-1999/99
- 568 -

KAERI/RR-1999/99
6 S-. DUPIC
- 569 -

KAERI/RR-1999/99
6. DUPIC
CANDU Qx}S.°\} *}&¥• 3 ^S«J <££.-§ *J3 *1l4-g-*fe DUPIC
(U.
-f-Sfl DUPIC
c}. D. # J L # ^ DUPIC ^ < a ^ l - 4 2 t ^r Stl
OREOX [Ref. 2]
OREOX 7}^o\]
^.iH, DUPIC ^ ^ S ^ 7 ] ^ ^ S f 7 } ^ ^ # ^SB DUPIC
DUPIC ^ ^ S ^ ^ ^ <a^"7} ^tgSJjL Stic}.3-4
OECD/NEA(1993) [Ref. 5]7}
W , DUPIC
uj-g-o] -^^*}7|| Qv\. ^ «14 DUPIC
DUPICDUPIC
H l § & 4 ^ } } ^ DUPIC
DUPIC ^ ^ ^ ^ 4
6.2 ^loflA-|^ DUPIC
o.i^, DUPIC
- 571 -

KAERI/RR-1999/99
6.1 DUPIC %& ]
DUPIC ^<£S.^7l =gaJM3£: DUPIC q& ^ ^ ]
^fl^^S.A-1 DUPIC
DUPIC
^ DUPIC ^ ^ ] ) § 4 p g f l f g i ^ ^ r ^ fl^i]M ^ l £ ^ 1 ^ ] ] # ^ H^ l DUPIC
DUPIC ^ l ^ ^ l ^1^1 7||^^7^1 ^ r ^ ^ r 1992^1 Idaho National Engineering Laboratory
AIROX ^.3-A^l 7 5-7l$>of ^*J*|-^l^r. AIROX
DUPIC
Oak Ridge National Laboratory (ORNL)^]
DUPIC ^ < ^ S . ^ H l - g - g : ^ 400 MTHE ^ f S ^ ^ ) ^ ^ ) ) fl^
7]
^ 4 JJL
aela DUPIC
fe ZL 6.1-
- 572 -

KAERI/RR-1999/99
6.1.1 DUPIC #
D U P I C M ) ^ ^ ) g 4 g } § ^ $}}] fl|, ^ f ]
l ! 4 #4 S H & ^ } j | ] AIROX
D U P I C 4
71^011 cH«U A I R O X
6.1.1.1
CANDU
DUPIC
>: DUPIC A|>£ -§-5o^ v£ Af^-^ ^ ^ S . ^ < ^ 5 . 400 MTHEo]t;>
2. ^ u | oj-g-^-: X\^i$] ^ - S # J L ^ * M , ^ «
3.4. -gn] ^ ^ ] : DUPIC
CANDU S f ^ S S . ^ ^ * f e S.& ^ a l # ^ J l ^l^f. CANDU
, DUPIC A l ^ S
. DUPIC A ] ^ ^ - DUPIC ^ ^ 5 . ^>^61] ^^.«> S . ^ -fi- 1 Al>^ . DUPIC A ] ^ ^ -
- 573 -

KAERI/RR-1999/99
2.
3. 7«^ iJ |<H (I&C): A]A^^
1. 4-g-^ ^ ^ S ^-^-r DUPIC X\^6]}
^ t > lOVi o | # u|2]-^ S f 17X17
2. DUPIC ^ < £ S ^^1-i-: ^ 1 ^ ^ ij-f- ^ ^ # ^ CANDU ^J^S-g- 43-g-
^ > ^ ° 1 ^ . DUPIC ^ ^ S . t:>«^ -gTd 4 6 o ^ ^3L^ 4 4 S 6.1-12}
3. ^ ^ S S ^ : 7 |§ ^^r«i^ # ^ ^ ^ r 1-60
7HJ*>t*. 1.60
S. 35 MWdTigUofl
4. n^:<i
- 574 -

KAERI/RR-1999/99
> > | > 100 MTHE)
6. DUPIC ^ ^ 5 . * i # : ^HV^g^ ^ 1 ^ ^ ^ : *l4i?> DUPIC
# ^-§-*}S^- ^ ^ 5 ] ^ o > t>t>. (50MTHE)
7. 3^)711- * | # : DUPIC A
7].
f. DUPIC
: DUPIC ) ^ f ^ ] ^
ANS 8 ^ | e ) Z : ^
> * U , ^ 4 : 27}*]$)
A]>b^£ ANS 8.3-21
2. 4 ^
3. ^ H | *}afl: ^ ^ 4 ^ o f l ^ 5 i aoVA}^ § ^ 7 } 0.5 mrem/hr
DUPIC
(NRTA) A ] ^
3.Q 6.1-3^]
DUPIC # ^ 4 3 # l ( )^ , D U P I C
- 575 -

KAERI/RR-1999/99
6.1.1.2 DUPIC
DUPIC ^<$.M. :gjg,o. A ] ^ S J tifl^l-t ^ ^ 3 1 ^ -£j&.# W c f . DUPIC
OREOX ^-^^r DUPIC ^ ^ 5 . 4 ^ ^ ^ -S-^^f 3-711-
7}. DUPIC
1.
0.07 MT/MTHES.
0.29 MT/MTHES.
3.71 sj
4.
. DUPIC
£n> -
- 576 -

KAERI/RR-1999/99
3.
>. DUPIC
2.
3.
CANDU
. DUPIC
^r S 6.1-2ofl
6.1.2 DUPIC
6.1.2.1
DUPIC
- ( ^ , 400 MTHE/yr
DUPIC 400 MTHE/yro]t:|-.
1 o> 30%5] A } ^ ^ 7 l ^ * W o j ^ ^ . o)
- 570 MTHE/yr (^- 400/0.7=571)^1
. # 600
- 577 -

KAERI/RR-1999/99
^ £3.7] <>]
-g-^o] 4 4 150 MTHE/yr l 47H5| ^ ^ ? > ^ g Bj- T
4 4 27fl}. 0} 27113] J B ^ ^ T ^-^SLS. 4 4
sat;]-. 4 ?mds] 2711 s>oi^
batch 3.71
>^. _ 3 5 0 kgHE %£.°M (#7> ^ ^ - S U235 2
3.7]«] «1*I 200 kgHE# batch 3.71 S
200kgHE# batch 3.7] S.
.^ &C\ ^ ^ « > batch
3.71-i- ^L3l F<H, batch 3 7 ] f # D| ^-^*f<^ 160kgHE (^, batch?> 3.7]
20% <H^-s s]-§-)Bl- 7H8^>i;K o] batch
3.7]
80 kgHE£] batch
batch 3.711- ^ - ^ ^ f e o ] ^ - ^ ^ ^ ^ ^ - %^oU]^7] ^^A-]x:].. (^, ^
batch
, 80 kgHE)^] ^ ^ ^ r « 7700
t^ (^, 10.4 g/cm3 ^^^11 ig£), ^]^^r
cm3) ^ £ 7 } f 7 m c } . # ^ JL#5loM J1^<>1 (S. 6.1-3
, 10.4 g/cm3 ^^^11 ig£), ^]^^r ^^ ^ ^ r Tj^I ^o]] 32% (-10,200
460 kgHEolnf. O|B|^> batch
^ batch 7f ^ o ] £ <^^ 7fl (^, 460/80,
- 578 -

KAERI/RR-1999/99
6.1.2.2
DUPIC A ] ^ ^ 471)51
DUPIC
9i
4.7 g/cm3
7]).
, -40013 , :5
(~500°C,
600°C,
batch
- 579 -

KAERI/RR-1999/99
ZL
ofl
n>.
, DUPIC
43-g- f s . ^ , DUPIC
- 580 -

KAERI/RR-1999/99
6.1.2.3 X\Jg 7fl.fi.
DUPIC - ^7 , ] 7 |
DUPIC
fe ZL^] 6.1-6<H1 ^Bj-uf 61c}. o) A ] ^ ^ c f l ^ 0.4 km
30
5 mrem/yr
23
7H
ufl- 9.75 m,
85 m, ^ o ] 7 > 20 mojt}-. o|
829
- 581 -

KAERI/RR-1999/99
DUPIC
batchJL
DUPIC $ 4 ^ #^ ^ ^ §* ^ltl ^4^ l DUPIC
4 W S J ^t^o]i4 ^o>^ ^<H1^ 1.6m ^ S ^ ^-^o] ^tlSlojoTT-f. ^-fc. 1.6 m£j $°]^ 7}$. -f- •%•% Bf T 4
6.1.3
DUPIC ^ ^ 5 . 4 3 - «l-§^- 6 . 1 . 1 ^ ^ ^ ^ ^ t l A^oH tcl-Bf DUPIC
6.1.3.1 Hj-g- 3g7|-
71 ^ ^
DUPIC l g
^ - ^ ^ INEL
Rockwell International^! 5l*l| ^ 7 ^ H f S l ^ M 4-§"tb «!-§•
- 582 -

KAERI/RR-1999/99
(Richardson's Construction Estimating Standards)^ n | o | ^ ^|^H]-§-^f^. (Mean's
Facilities Cost Data)7} ©l-g-SjSfcr- <yjf #a|ofl t f l s j j ^ ORNL^A-] *flA|# H]-g-
: 2020-2059 (40id)
l^>: 2015-2019
7]-g- i d S : 1995
: 5%
^ S 6.1-4ofl
3007|| ^5L£|
530
: ^>fl (14%), ^^IM^^^]- ^ ^ ^B] (10%), ^I«l7f (20%), ^ #
(3%), 4^-^f ^-^ (2%), "y^H1- 91 ^ ^ ^ ^ (6%), 1 ^ ^ 3*1- (20%),
-& 413
25%Z}JL 7f^^rf^, 400 MTHE/yr ^-2. A } ^ * | ^ ^ | ^[^u]-g-^- 1179
- 583 -

KAERI/RR-1999/99
1 *]• 90000 $/yr, <a*]i-H 50000 $/yr, 7]&*\ 50000 $/yr, ^ ^ ^ V 3700
$/yr, ZLBJJL Af?-^J 25000 $/yr#
10% ^ £ . 5 . 7}^«:t;>. ^ ^ r « O U^ ^ 7 H - ^ ^-e]5f n]%- ^7\M: 10
m3, -S-B]S|. * > * 1 ^ ^ 7]-i- 41 m3, <!& ^ < £ S ^-2L^ 65 m3, 7)B|- s j | 7 l# 764
>. 400 MTHE/yr<Hl cflsfl Jg7>S ^^|] <£# ^r^/-fr^»]-§-& 140
6.1.3.2
( 6 J - 2 )
N P B ^ ^ ^ 7 > 5 } o|^.(net present benefit)©)^, Q . ^
- 584 -

KAERI/RR-1999/99
to, 7 1 ^ Aj>g -§-50>ofl power factor ^ ^ . *?-§-*H
7}. 7 1 ^ J£i£
DUPIC *]-gSj *}el -§-3oNr 400 MTHE/yroJc}. o ^ CANDU Q*}S. 77\6\]
r l# S.^. LCC-fe S 6.1-8< 1
2015^^1 2059\l Tft!:6!! *1^5l ^i^» ^
! LCGb 7115
^ NPV# 5L#*KH #±3£\
^ 1188 M$o]r:}. LCC5| NPV7} ^ ^ 5 ] ^ LUCS. 7\]*h?} <$• Stic}
5.^5] LUCfe 558 $/kgHE^ ^1^5)^^}. 7]-g- DUPIC
6.1-9011
DUPIC ^711 2}J§oH *Xo)*\, DUPIC
l 150% ^^1<^1 cjjsfl ^7}t}^3. ZL %3}^ S. 6.1-103} ~L
6.1-
- 585 -

KAERI/RR-1999/99
500 MTHE5. ^ S W * 1 £ ^I^Hl-g^: 4 4 17% «£ 28%
}HS. DUPIC
DUPIC ^ ^ S ^^^gr DUPIC
4MM DUPIC
50 $/kgU5. 7>^*>n^, o\%-£: OECD/NEA
SEU (3.5 wt%) 7 } 3 £ 940
50 $/kgU, 8 $/kgU, ZLE] L 110 $/SWUB>JL
(SEU) ^-^r ^ ^ - f e f e <^# 7ff-i>*ic>. ZL t[£-, SEU
- SEUu>
6.1-11311- 6.1-12ofl ^ ^ - f e f e j } SEU<1 ^* i n]4s . ^ ^ ^2 f# 4 4. a 6.1-1 H I t}E}v* y}^- 4°L DUPIC «j«is 4 3
4 ^ : ^ 7 f # 7 ^ ^ } . ^91-fSfe# 50%
583 S/kgVS. A^r 4.5% ^ * } &Dfl-f
- 586 -

6.1.4
KAERI/RR-1999/99
10% M^ Hl-S-°1 5 5 8 ^ 652 $/kgUS 17%
DUPIC
DUPIC
7)fif
DUPIC
o] ^ ^ . # ^ . * H 400 MTHE/yr -g-
S.5. (558 $/kgHM) ^Tll
-. o]
K DUPIC
- 587 -

KAERI/RR-1999/99
Table 6.1-1
Characteristics of DUPIC Fuel Bundle
Physical geometry
Bundle diameter
Number of large pins
Number of small pins
Length
Heavy metal weight per bundle
Bundle weight
Number of pellets in a large pin
Number of pellets in a small pin
Pellet density
Pellet surface finish
102.5 mm max
8
35
49.53 mm
17.64 kg
23.6 kg
30
36
10.4 (0.15) g/cm3
0.8-1.6 micron RA
- 588 -

KAERI/RR-1999/99
Table 6.1-2
Nominal Level of Recycle Stream for DUPIC Process
Reference fuel material flow
Fuel material loss
- In fuel decladding process step
- In dust form (e.g., trapped in HEPA filters and
non repairable equipment)
Recycle streams
- Rejected pellets before sintering
- Rejected pellets after sintering
- Rejected pellets after grinding/finishing
- Net rejected fuel pin after welding
- Initial rejected fuel pin
- Repairable fuel pins
- Net rejected fuel bundle after welding
- Initial rejected fuel bundle
- Repairable fuel bundle
Total recycled fuel material to oxidation/reduction process
1 MTHE of processed
spent PWR fuel
1 wt%
Negligible
0.5 wt%
5.0 wt%
5.4 wt%
1.0 wt%
3.0 wt%
2.0 wt%
0.1 wt%
1.0 wt%
0.9 wt%
12.0 wt%
- 589 -

KAERI/RR-1999/99
Table 6.1-3
Material Flow in Main Process Building
Net DUPIC facility throughput
Design throughput at 70% plant availability
Number of parallel process lines
Design throughput per process line
Daily process rate (i.e., 150/365)
PWR spent fuel disassembly rate (0.41/0.44)
PWR fuel rod decladding rate (264)
Fuel oxidation/reduction process rate (w/o recycle stream)
Fuel oxidation/reduction process rate with recycle stream
Larger pellet production rate (w/o recycle stream)
Larger pellet production rate with recycle stream
Smaller pellet production rate (w/o recycle stream)
Smaller pellet production rate with recycle stream
Larger fuel pin production rate (w/o recycle stream)
Larger fuel pin production rate with recycle stream
Smaller fuel pin production rate (w/o recycle stream)
Smaller fuel pin production rate with recycle stream
CANDU DUPIC bundle production rate
400 MTHE/year
600 MTHE/year
4
150 MTHE/year
0.41 MTHE/day/line
1 fuel assembly/day/line
264 fuel rods/day/line
410 kgHE/day/line
460 kgHE/day/line
4,830 pellets/day/line
5,410 pellets/day/line (+12%)
28,980 pellets/day/line
32,460 pellets/day/line (+12%)
161 pins/day/line
163 pins/day/line (+1.1%)
805 pins/day/line
814 pins/day/line (+1.1%)
23 bundles/day/line
- 590 -

KAERI/RR-1999/99
Table 6.1-4
Estimated DUPIC Direct Capital Cost
Element
Site Preparation
Process System
Main Process BuildingHealth Physics Facility
Safeguards and SecurityUtilitiesFire Department
Simulation and TrainingAdministration Facilities
Specialty Gases BuildingWarehouseOff-Site FacilitiesTotal Direct Cost
Estimate ($)
11,406,000
297,682,000
185,172,000
6,640,0007,343,000
10,971,0001,550,000
360,0001,360,0001,534,000
525,0005,476,000
530,019,000
- 591 -

KAERI/RR-1999/99
Table 6.1-5
Estimated Annual DUPIC Labor Cost
Department/Division
General manager staff (total)Staff
Administration (total)Manager/StaffLegalHuman resourcesProcurementComptrollerComputer/Information sciencePublic relations
Safety and health (total)Manager/StaffIndustrial safetyRadiation safetyMedicalEmergency preparednessAnalytical laboratoryData processing/Records
Safeguards and security (total)Manager/StaffNuclear material safeguards & accountabilitySecurity
Environmental & waste management (total)Manager/StaffEnvironmental/Waste management & complianceWaste Operations
Engineering and quality assurance (total)Manager/StaffNuclear safety engineeringProcess mechanical engineeringElectrical/Instrumentation engineeringConstruction engineeringQuality engineering
Compliance/Standards (total)Manager/Staff
Operations (total)Manager/StaffProcess/Utility operationsOperational maintenance
DUPIC Staff Total
Staff
556525141310156
934
20176
20206623194054216368641718197
211515113126734
493
Labor($)
255 •
115199547550399765315
1891015813275937915215
152952375
1158021675
165865915965365859
611
49833001615
Total($)255
2890
4359
1479
2592
4134
611
5413
21733
- 592 -

KAERI/RR-1999/99
Table 6.1-6
Estimated Annual DUPIC Non-Labor Cost
Category
Materials
Equipment
replacementUtilities
RadwasteDisposalNon-Labor
Total
Gross($)
20,235
21,200
9,150
67,800
118,385
Specific Item
Dysprosium pins
DUPIC fuel assembly componentsProcess gasesAnalytical suppliesMaterials for waste treatment
Kr-85 cylindersVitrified waste canistersGreater-than-Class-C containersLow level waste containersLiquid argon/NitrogenFilters (HEPA, charcoal, liquid)
Health physics contamination suppliesPersonnel protective equipment
Electricity
Fuel oilTransportation fuel and lubricants
Spare partsChemicalsMiscellaneousJanitorial suppliesMiscellaneous (e.g., Office supplies)
Cost($)
800
18,0007550
200150150400607520075
21,200
6,000
25075
2,500755012575
67,800
Cost Basis
1 pin per bundle/21,500 bundles per year
21,500 CANDU bundles.per yearScale up from AIROX 200MTHEScale up from AIROX 200MTHE
264 Cylinders per year41.2 MT glass/24 cubic meters per year60 cubic meters per year756 cubic meters per yearScale up from AIROX 200MTHEScale up from AIROX 200MTHEScale up from AIROX 200MTHEScale up from AIROX 200MTHE
1/10 of total cost for process equipment
46 million kWh per year
Scale up from AIROX 200MTHEScale up from AIROX 200MTHE1/10 of total cost for utility equipmentScale up from AIROX 200MTHEScale up from AIROX 200MTHEScale up from AIROX 200MTHEScale up from AIROX 200MTHE
Scale up from AIROX disposal cost
- 593 -

KAERI/RR-1999/99
Table 6.1-7
Inputs for Life Cycle and Unit Cost Estimation
Content
Capital Cost
Operation & Maintenance
Cost (annual basis)
Decommissioning Cost
(annual basis)
Sub-content
Direct cost
Site preparation
Process systems
Main processing building
Site support facilities
Indirect cost
Contingency
TotalStaff
Utilities
MaterialsEquipment replacementRadwaste disposal
TotalDecommissioning cost
Cost(k$)
530,019
11,406
297,682
185,172
35,759
413,416
235,859
1,179,29421,733
9,150
20,23521,20067,800
140,1188,282
- 594 -
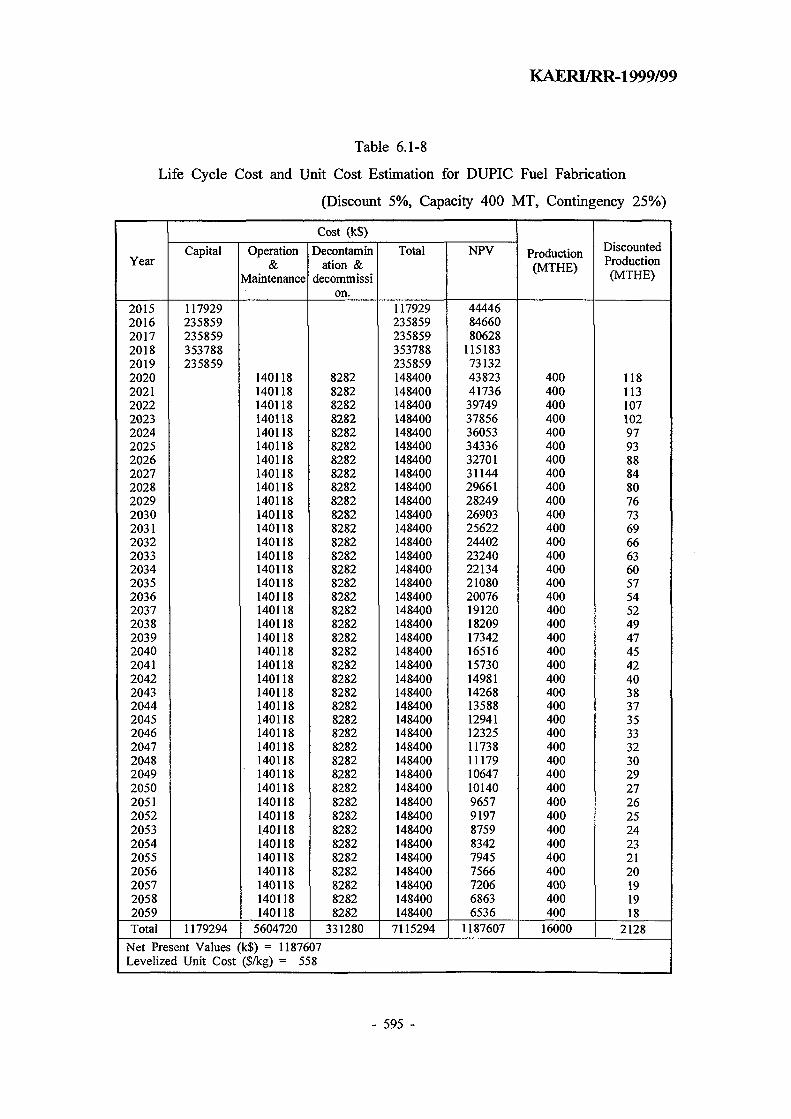
KAERI/RR-1999/99
Table 6.1-8
Life Cycle Cost and Unit Cost Estimation for DUPIC Fuel Fabrication
(Discount 5%, Capacity 400 MT, Contingency 25%)
1
Year
201520162017201820192020202120222023202420252026202720282029203020312032203320342035203620372038203920402041204220432044204520462047204820492050205120522053205420552056205720582059Total
Cost (k$)
Capital
117929235859235859353788235859
1179294
Net Present Values (Levelized Unit Cost
Operation&
Maintenance
1401181401181401181401181401181401181401181401181401181401181401181401181401181401181401181401181401181401181401181401181401181401181401181401181401181401181401181401181401181401181401181401181401181401181401181401181401181401181401181401185604720
Decontamination &
decommission.
8282828282828282828282828282828282828282828282828282828282828282828282828282828282828282828282828282828282828282828282828282828282828282828282828282828282828282
331280
;k$) = 1187607($/kg) = 558
Total
1179292358592358593537882358591484001484001484001484001484001484001484001484001484001484001484001484001484001484001484001484001484001484001484001484001484001484001484001484001484001484001484001484001484001484001484001484001484001484001484001484001484001484001484001484007115294
NPV
4444684660806281151837313243823417363974937856360533433632701311442966128249269032562224402232402213421080200761912018209173421651615730149811426813588129411232511738111791064710140965791978759834279457566720668636536
1187607
Production(MTHE)
40040040040040040040040040040040040040040040040040040040040040040040040040040040040040040040040040040040040040040040040016000
DiscountedProduction(MTHE)
118113107102979388848076736966636057545249474542403837353332302927262524232120191918
2128
- 595 -

KAERI/RR-1999/99
Table 6.1-9
Estimated Costs for DUPIC Fuel Fabrication Plant of 400 MTHE/yr Capacity
(Reference Case)
Item
Capital Life Cycle Cost Direct Costs
Indirect Costs
Contingency
Operation and Maintenance Staff
Costs (annual basis) Utilities
Materials
Equipment Replacement
Process Waste Disposal
Decontamination and Decommissioning Life Cycle
Cost40-years Life Cycle Cost (M$) in Net Present Value
Levelized Unit Cost ($/kgHE)
NPV (M$)
179
140
80
117
48
106
112
362
44
1,188
Fraction of
Levelized Unit Cost
33.6 %
62.7 %
3.7 %
558
- 596 -

KAERI/RR-1999/99
Table 6.1-10
Sensitivity Analysis on Cost Parameters
Items
Discount Rate (%)
Contingency (%)
Production (MTHE)
Sensitivity Variable
2.503.755.006.257.5012.5018.7525.0031.2537.50200300400500600
Unit Cost ($/kg HE)
494524558596637537548558568579686606558535501
- 597 -

KAERI/RR-1999/99
Table 6.1-11
Sensitivity Analysis for Adding Natural Uranium
Natural uranium
fraction (wt%)5101520253035404550
Annual natural
uranium feed (MTU)20406080100120140160180200
Annual natural
uranium cost (k$)10002000300040005000600070008000900010000
Fabrication cost
($/kgHM)561563566568571573576578581583
- 598 -

KAERI/RR-1999/99
Table 6.1-12
Sensitivity Analysis for Adding Slightly Enriched Uranium
SEU fraction
(wt%)12345678910
Annual SEU feed(MTU)481216202428323640
Annual SEU cost
(k$)376075201128015040188002256026320300803384037600
Fabrication cost
($/kgHM)567577586596605614624633643652
- 599 -

Anchor Facility
Material/Labor Cost
Levelized UnitCost Model
Facility Performance &Process Requirements
Facility Design
Process FlowEquipmentHot Cell LayoutBuildingAuxiliary SystemsOthers
Evaluation of Capital Costs
and Operating Costs
Life Cycle Cost& Unit Cost Analysis
KAERI/RR-1999/99
Reference Process Model
Other Reference
Financial Factors- discount rate- contingency
Construction Scenario
Refinement Calculation of DUPIC FuelFabrication Cost and Its Sensitivity Analysis
Fig. 6.1-1 Schematic Process for DUPIC Facility Cost Evaluation
- 600 -

KAERI/RR-1999/99
1 Zircaloy Bearing Pads
2 Zircaloy Fuel Sheath
3 Zircaloy End Support Plate
4 Fuel Pellets
Fig. 6.1-2 Configuration of DUPIC Fuel Bundle
- 601 -

KAERI/RR-1999/99
INPUT- NDA (Spent PWR assembly)- Shipper/Receiver difference
Item Handling
Assembly/Rod - No material-uncounted-for (MUF)
MBA-1
FabricationProcess
NDA
Bulk Handling- MUF- Waste (hulls, scrap, etc.): NDA- Physical inventory test at each key
measurement point by weight- Operator/IAEA sharing accounting
data (NDA, DA, weight)
MBA-2 -
DUPIC Bundles
Item Handling
OUTPUT (NDA)MBA-3 -1
Fig. 6.1-3 Accounting Methodology in DUPIC
- 602 -

KAERI/RR-1999/99
Spent PWR Fuel
Decladding
Oxidation/Reduction
PWR Rods
Cut to size
Structural waste
;iVolatile waste
Volatile/Semi-volatilewaste
Pelletization
SinteringV ^ ^ ^ A
/ k
Parts
! «£
DUPIC rod DUPIC Bundle
Fig. 6.1-4 Pictorial Illustration of DUPIC Process
- 603 -

KAERI/RR-1999/99
PWR Spent fuel
(1)
StructuralHardware
Disassembly
Solid waste
Fuel fragmentsand off-gas
(7)
Off-gas waste
(8)
Oxidation/ReductionProcess
Volatile/Semi-volatile wastes
10.9wt%offuel material
Powder
Pellet Forming/Sintering
(9)
Volatile/Semi-volatile wastes
(10)
INew non-fuel
component
(4) Pellets
(6)Fuel Pin/Bundle
Fabrication
l.lwt%offuel material
New DUPIC fuelBundles
(5)
Fig. 6.1-5 DUPIC Process Mass Balance Schematic
- 604 -

KAERI/RR-1999/99
Isolation Zone Secondary alarm statioi
Central alarm station — P j
/ IWarehouse Fire
House
Hypothetical SiteBound
AdministrationBuilding
EOC/VisitorsCenter •
— — — • " • " ^ ™**» • ^ ^ ^ • • ^ • • ^ • • • • • • • • • • • • • • • _ ^ ^ ^ ^ ^ ^ ^ w w « v ^ « V i ^ • ^ • • •» ^ . ^ ^ • • _J
Fig. 6.1-6 DUPIC Facility Area Plot
- 605 -

KAERI/RR-1999/99
Cold shop
Mock-upwork area
Rail carair lock
Waste productstorage
PWRspent fuelstoragevault
Elevator/stairs
Material.—.transterlhatch
#1 Rail cartruck bay
Rail carair lock
#2 Rail cartruck bay
Office New DUPICfuel storage
Cold truck bayNou-fuel component
storageElevator/
stairs
Process monitoring and operating access gallery (around canyon)
# 1 Process line
ft 2 Process line# 1 Process cell (canyon)
Process monitoring and operating access gallery
# 3 Process line
# 4 Process line2 Process celt (canyon)
New DUPICfuel transferhatch | ~ j
#1 Canyoncontrol room
Computerandsupportequipment
Securityoffice
Process materialanalytical lab.
Elevatorstairs
Healthphysics
laboratoryand office
DUPICbundle
inspection
Stairs
T9m
64m
Fig. 6.1-7 Main Process Building Floor Plot
- 606 -
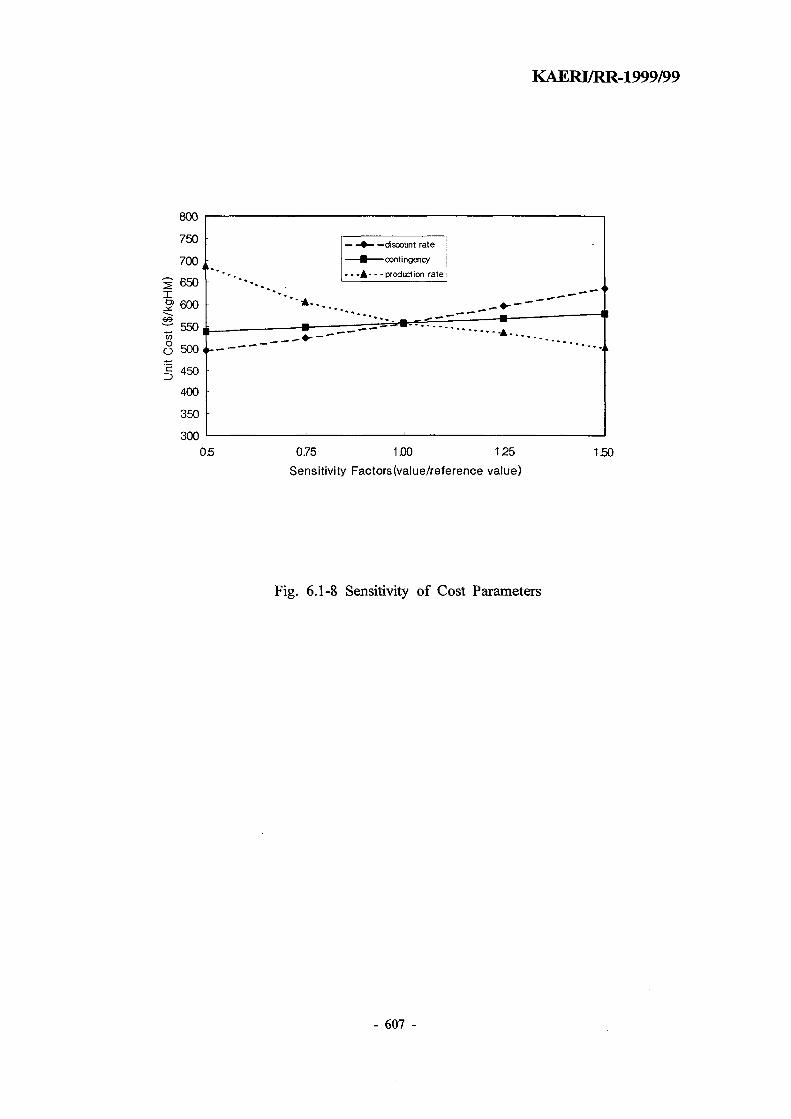
KAERI/RR-1999/99
800
750
700 i
9 650
|? 600
r 550CO
O 500
| 450
400
350
300
discount rate i
contingency !
. production rate !
* • • - .
05 075 1 J O O 125
Sensitivity Factors (value/reference value)
150
Fig. 6.1-8 Sensitivity of Cost Parameters
- 607 -

KAERI/RR-1999/99
6.2 DUPIC ^
DUPIC (Direct Use of PWR fuel In CANDU Reactors)
^ DUPIC
3. 41^-^ ^ € 7l7]£) ^ ^ ^ ? l t H ° l ^ r - r £ 1 ^ DUPIC
DUPIC
J ° S DUPIC ^ ^ 5 . ^ 5]% 3L7l^ 7 | $ - § ^ 5 . ^ ^ « ^ ^ ^ f ^n>. HB^tf- DUPIC
-b o |o | 71] ^ t t l » | ^ o | o]s.<>|^o> sVcf. ^ DUPIC
DUPIC 9 r }\
A]
, 2, 3
DUPIC
DUPIC
DUPIC ^<&.3.*) ^ ^ r ^ - ^ ^ S . 6l^> 4 ^ - 2 ^ 1 *M-§-3oM- ^^^f^ ^ T f l ^ ^ A]
- 608 -
KAERI/RR-1999/99
6.2.1
(discharge
(reception
n i g 6.2-24)-
A]
^-§1)
6.2-3^ - L ^ 6.2-4±r
6.2-5
. ZL^ 6.2-6^
6.2-7^
IAEA -g-
-§-
6.2.2 DUPIC
DUPIC
- 609 -

KAERtfRR-1999/99
1'12 -r-
. DUPIC
DUPIC
DUPIC t\
A.
B.
DUPIC
DUPIC
DUPIC
6.2.2.1
DUPIC
7)
-LB]J1 DUPIC
7}. a«g 6.2-1
DUPIC
DUPIC
}. o]
DUPIC
- 610 -

KAERI/RR-1999/99
DUPIC
o| ^ A } ^ ^ ^ 5 . a .^7] S ]H^ 3.717}
A-2) (ZL^ 6.2-1
o] «OVA1^ ^^--g-71 vfl^ A j g S ^-^^-^oil ^ ^ ^ ^ # ^ * 1 * H , DUPIC
s ^ 1 ^ - A] iH8*Rf ^.<g# j q ^ s # o ] ^ ^oic}.. o) ^*jofl^ ^>^i ^ ^
DUPIC «¥&5.fe 4^-8-71 ^5 ] 5J- iS # 7 ^ ^ 7B-g^t:>. ZLBlJl DUPIC
. o)
DUPIC
- 611 -

KAERI/RR-1999/99
6.2.2.2 (ZL^J 6.2-1
DUPIC
DUPIC
DUPIC
DUPIC
DUPIC
DUPIC
Qv.}. n
(ZL^ 6.2-1
DUPIC
*> DUPIC
- 612 -

KAERI/RR-1999/99
B-2) ( a H 6.2-1
DUPIC ^ # ^ t i l 1 o^, DUPIC
^ DUPIC
n e l i DUPIC
717151
ZLelJL ^1 DUPIC ^ ^ ^ . - ^ ^ I ^ S . ^ ^ - i - ^*B ^ : ^ ^ # 3 ^-§-71
^ ^ 4 J r K 1^^ f 6.2-2^44^1 ^ s ^ i cflt> Hia
6.2.3
DUPIC } d l ^ g f e g f f # ^
$ ^ ^ - f efe ^ ^ s . # a ^ ^ # ^ ^ -t! DUPIC
. DUPIC n £ ) ^ ^ ^ > i ^ ^
DUPIC «J«i§.5l ^g-f ^ 5 . ^ 6.2.2
- 613 -

KAERI/RR-1999/99
DUPIC i #
DUPIC
3.^7)7} 87i^ ^ ^ U H M - ^-g-^ ^ sa>nj ^ l ] - . DUPIC
1-77H
AI D U P I C
., 4 «I^S*H^6H -f- ^ ^r^-^- ^ ^ 5 . 3.^:71 S. Al~g c DUPIC77fl ^ ^ ^ ^ f e f J2.^*>3., H ^ 47B *fl^^
X\
# ^ ^ 4 . ZL5|uf DUPICins. #^1-7)) 5]<H ^^) i - l l ^^^^ 1/23. # ^ ^ c K
n}7fl(closure plug)^ iij^is)(snout plug)^ vfl -«g«> <%X\ 1/23.
^r Slfe 3 ^ ^1 DUPIC «^oiS.5f 4
DUPIC ^91^-7} $^£)^] * l ^ yo^°14. nfsH A<Bf4
*\ DUPIC ^ ^ S ^ I ^ f e 2, 4, 6, 8 tHHi} . ^.5]^- °H1
- 614 -

KAERI/RR-1999/99
JE. 6.
2, 4, 6, 8
S.oflA-1 A] DUPIC
7H
DUPIC
6.2-3
DUPIC
6.2.3.1 DUPIC
7H ^
^r
Tc- PdcdQ0UtT+ h~ - Tamb) = (C dMd+ (6.2-1)
Q
Md
Mm
Qtn
Q.01U
dT
dz
T
Tc
1 amb
Pd
Cd
il71 £
D2O
D2O
D2O
5o* (kg)
%* (kg)
(m3/sec)
(irtVsec,
(°C/sec)
(=
(kg/m3)
(J/kg°C=W.sec/kg°C)
- 615 -
KAERI/RR-1999/99
cm : i$7\*l til«i (J/kg°C)
Am : n W ^ l S]Jf #2\ (m2)
(W/m2oC)
3) yJS; % ^
C=
Q(r)o)r.\.
A + q - B • T= C~^ (6.2-2)
c^7\M A, B ^ C ^
^+gU+ggr0)e"cr
r = ^ (6.2-3)
- 616 -

KAERI/RR-1999/99
(6.2-4)6\]*\ T><r,-=ro)=To ^ <?',< r ,= r0) = ?
, H ^ 6.2-82} 6.2-9^
- a 6.2-4^
DUPIC
DUPIC ^ ^ ^ §
ZL^] 6.2-10, 6.2-11, ZLZ]3. 6 .2-12^
. H o]
=L% 6.2-10^:
fe S 6.2-451
54.2°C
(130°F) ^ W
51.6TC (125'F)
6.2-4
57.8°C (136°F)
57.2°C (135°F) K ^ . ^ 6.2-12^
3. 70 °C (158T)
- 617 -

KAERI/RR-1999/99
0°C (140°F)
5.5. ^<^.3.S!) £2^7}
baU screw ^ - g - ^ 1 ] ^ ^ 7 1 ] ^ ^ ^ £ 7 } 150°C (30
0°F), ^ 7 ^ ^ ^ - 9J BflolS H e f o l H . ^ ^ T f l ^ ^ ^;S.7> 65°C (150'F), ZLZ]3L 7}
21°C (70°F)<>li:K
65 °C
DUPIC } £ b H^ ^ flI ^ » 11
« ? i ^ * } ^ ^ ^ l l ^ ^ * ^ ^ - f a f l S , ^-U 6.2-
65 °C (150-F)
7 1 ^ O)AOVO1
6.2.3.2
- 618 -

KAERI/RR-1999/99
(6.2-3)^
2)
3)
4)
80% # ^ £ #
38°C (100T)
80% # ^ ^ ^ i
49 °C (120T)
38°C (100T)
^ ^4 -g-
49°C (120°F)
38°C (100T)
2) ^ J ^ > ^ # 80%
80%#
49°C (120T)
3) A]
4 MW5] <g
^r 0.2 MWo|c>.
- 619 -

KAERI/RR-1999/99
^f ls 4DUPIC
7]7} <
27fl
DUPIC
2711*1
DUPIC
43,0087flJif
43008/8=5376
98X24X16=37,6325.
^ safe
71
. 6\
112X24X16=
DUPIC
DUPIC
6.2.3.3
- 620 -

KAERI/RR-1999/99
(6.2-4)# tf ^§^ ^ $& £ %} £ # 3 |§
-§•
nrCYT — nrQT-\- n, ,— k ,,A «— ^ ^ - — h * A / T— T C\^o\v-* c f-^x^-i i *dfuel /cwalir^-wall ^i^ flwater**-$nrf\ -* -1 amb/
** (6.2-5)
^ B | * M ^T (6.2-4)iif -
" == PcQTc-\ ~J~ Tenv^ hwater™-surfTami,
B= PCQ+ "^^ Wa Tenv-
C= CwaterMwater+ C/ue!M/uei
- 621 -

KAERI/RR-1999/99
Q
T
Tc
T
* env
1 amb
dx
P
Cwaler
Cfuel
hsurf
%* (m3/sec)
(= TCOTS,°C)
(°C)
20 m
(2TCS.
(20 m)
(J/kg°C=W.sec/kg°C)
(J/kg°C)
(0.061 W/m°C)
= 1.32(zJT/L)025)
20 m
ZLBli L ^ 12 m>§- A
^ S 6.2-6ofl
1.32 W/m2 °C
DUPIC
-8
A
- 622 -

KAERI/RR-1999/99
80% ^ 100%S.
^ 80%
100%
31.6°C
6.2-7011
JL3|*}3. <i*f# ^71512 MW
2.5MWS,
6.2-8
6.2-8^: tc]-H.
- 623 -

KAERI/RR-1999/99
46.2-16^
ZL^ 6.2-174 6.2-18^ 12
ZL^| 6.2-194 6.2-20^
. -L*U 6.2-214 6.2-22^
6.2-9
. 80% 71
o] ^ ^ ^ .
^-§-71^0]
36.
. ttj-BM o)
MW, Hl^^-BH 4
sell on
- ^ ^ > J I (80% 3.4 MWS
^ 4 4 ^^r^ 2.5 MWS
3.25
4.2 MW5.
^ 6-7 MW<H] o l ^
61
4
5 MWS
- 624 -

KAERI/RR-1999/99
S 6.2-1
JOS. ^oHNNH, -g-^«i# 7l^j$.S xH'-S ^ 4 - ^ ^ ^ : 2 MW^Al 2.5
4 Mw^]^ 5
6.2.4 DUPIC «|*[jg.Sl ^ ^ ^^>S. ^-g- H]-§-
DUPIC
AH 4-§-f « ? ^ ^ 3E^.# -f-*H «?-^3. ^1 DUPIC
^ DUPIC f ^ j
ZL^J 6.2-23
DUPIC ^ & ^ ^ § 1 ^ % ^ $
J £2,7]
6.2.4.1 ^ i ^ ^ H 1 - ^ « 1 ^ DUPIC
DUPIC
- 625 -

KAERI/RR-1999/99
DUPIC
DUPIC
6.2.4.2
7)
D U P I C
6.2.4.3
DUPIC 71
6.2-8 CHIA-1 6.2-12ofl 50°C
. 6.2.3
6.2.4.4 DUPIC
DUPIC
i fDUPIC
. o] ^B}^
- 626 -
KAERI/RR-1999/99
6.2.4.5
M f *1 DUPIC
-§•
o)
6.2.4.6
W . Jt 6.2-ll^r ^ ^
2, 3 ^ 45171^ ^ ^ ^ 3.^71 ( ^ ^ 13L71 - ^^ ) ^ ^ ^ 7 f l - f -#^ 30^ 7 ] ^ ^
2]S.X]^(fatigue usage factor)o]c>. SL6\) uj-E]-^ ^ ^ 6J-^ ^7j]^-#eH] cfl
magazine rotor, B-ram, latch-ram,
C-ram, ^-^^ 3tf, #<$ 7]*\ £ 4 # ^ « - ^
^ l DUPIC
, DUPIC
-S-i-
- 627 -
6.2.5.1
KAERI/RR-1999/99
6.2.5
6 . 2 . 4 ^ ^ s f i - H } % ^ S »i&^ i - H I ^ DUPIC
CANDU-6
S . * > ^ 3BE 6.2-125}
7}7] ^
2000^1
3,750,000 U$7>
6.2.5.2
(NPV)
(6-2"7)
(6-2"8)
- 628 -

KAERI/RR-1999/99
(6-2-9)
5%S.
4 DUPIC ^
1 4 I S ^ tl| 5]= 15,000
DUPIC «|elS.6fl tfl^^n}. 4|^.al-§-^- >t>^*fSir;>. S 6.2-132]- 6.2-14
DUPIC «J« iS^ 41^-Hl-g-^ t B S ^ ^ . 5 . 5.12 $/kgHMo]r]-.
6.2.6
DUPIC
DUPIC
DUPIC ^ < £ 5 . # QxtS-O)} ^ - ^ ^ ^ $XT\) ^ C > . DUPIC
DUPIC
- 629 -

KAERI/RR-1999/99
DUPIC ^ ^ 5 . JS-tajofl tflsfl*] 5.0-5.3 $/kgHMS.
DUPIC
- 630 -

KAERI/RR-1999/99
Table 6.2-1
Comparison of DUPIC Fuel Loading Path (Front Loading)
MI -§-
3.2)tt*7|
2 4 ^ 1
2. ^<g.3. ^
4*S# *
1 Mo^ g 7?
2 'S|64 JJ..2.
3 4 J-8-71
2. DUPIC ^
3 . DUPIC *!§
•8-<>l*l-s.
^ 2. A-1
[7] 21 S # ol-g-
g;7l 21SM1 4 ^ * 1
l-f1 U54 Si ^^f #*11-11 §"71 ^ S f ^ l
^7l S l^ .^^ T 1 - ^ ^
4 ^ - § - 7 l i-H<H] l
*7 l ^*W«1 Hi*i<Hl DUPIC ^ ^ 5 . # ^-g-^
wtt r"rf r 3 ^ l ^ L " ? f l ' ^ ^ TT "ft")-"?!
5. o l * (^5
4 tf*7l i1.4 -§-71
/ig3^1 4<
2. 4^--g-7li
4. ^^"-§-7li
1-4^i
3.^^s^a.'
1.4 -712.4^-8-71
1 -f 4 :?
S. A)
i-fl<Hl DUPIC t^<^
a# *f7i*m ^-11 *7 l ^gS]-^-*
-11 tl<&£. ^ ^
4^-8-71 UHIA-
Lfl 4 ^ A\ 4
ufl^l M ^
vfl-f- * 7 l ^ 5 f
Mis *H*
- o l *.3. 7fl*y-
-a*i
^ «
^8-71
a] Hl-g-
- 631 -

KAERI/RR-1999/99
Table 6.2-2
Comparison of DUPIC Fuel Loading Path (Reverse Loading)
B)
S.B-1 B-2
Ml -8- DUPIC DUPIC
5.DUPIC DUPIC
DUPIC
2. uovo v # ^ S A f DUPIC
^ 7 1
4-S-)
6.2-1
- 632 -

KAERI/RR-1999/99
Table 6.2-3
Time History for Defiieling of 8 Bundles per Channel
1
2
3
4
5
6
7
8
9
10
11
12
13
14
15
16
4 <3 Ml *
NfFP to Reactor face
*Mn}7fl Efl7]*H *H\ S S T } 1 * ^ e ] 7 l ^ g ]3 i*H 27fl «?^SC>^ fflTl^^S. o)^.
^ «14 27B ajgscl-i}- 4 7 1 ^ ^ 5 . oi^.
-¥• ^ H 27fl ^ ^ s c m 4T1^<H) ^ H ^ S4 tt*B 27H «?«is4^: 47i?i-5.s ol-i-4 ^^B 27fl ^<gSt;}«J: nH>| ofl ^$#5.Ml ^ ^ 27B <^S.t:l-tiJ: DU71^1^.5. o ] ^
Ml ^^H 2711 ^ < ^ S t : m n | 7 l ^ ^ ^ ^ ^ S
^} lo>7Jl RJ W 4 7 f ) # ^JL *B^^-H ^rS]^<aS-2.%7l Af-g-^^S 5 ^ ol^-gr}^ .4J-
^7115] «^0iSt:>^ I S f # * H yoV#3:^- O]^•¥•711 «|^sn>^- s i t #*>^ iM-ss o]^.
0
207
445
479
624
649
751
820
916
943
1883
2532
2744
2987
3197
3395
120
139
576
596
207
238
34
145
25
102
69
96
27
940
649
212
243
210
198
- 633 -

KAERI/RR-1999/99
Table 6.2-4
Time History for Defueling of 4 Bundles in 2 Channels (2 Bundles per Channel)
I
2
3
4
5
6
7
8
9
10
11
12
13
14
15
NFP to Reactor face
^ 4 ^ 27H « ) ^ s . t ; ^ nil7]£.£3. ©l-i-
^«i4 *m 27H ^ ^ s t m ^Tj oi] ^ H ^ S -
-¥• ^*H *M 2711 «!|«iSr:>^ n | 7 i £ ^ . S . o)-§.
¥ ^ f l ^fl1^ 27B *J&g.t*1* nflTl cH} ^ J g - ^ S
A>3 n>7H ^J #^>nl-7ll- ^JL AB^ofl-H ^ e l
0
207
445
479
1419
1558
2134
2730
2937
3082
3107
4047
4696
4908
5151
43 #
120
139
576
596
207
238
34
940
139
576
596
207
145
25
940
649
212
243
- 634 -

KAER1/RR-1999/99
Table 6.2-5
Parameters for Calculation of D2O Temperature in Fueling Machine
*1171*! ^ f " r ^ (Md)
fflTi^ ifl^- *>Sfl<*] ^ (Mm)
* M # -fr^/-B-# -fV£ (Q=Qin=Qou.)
^ «]<! (crf)
"flTi*! « 1 ^ (CjB)
^ ^ wlf1 (^)
^-°a^^r ^ £ (Tc)
A>^-^<a^. #<a ?a pfl7> l ^ £ (To)
ft3210
6159
0.00068 (=0.68ysec)
4232 at 40°C heavy water
4188 at 40 °C light water
460
1100 at 40 °C
307-317 (=35-45 °C)
307-317 (=35-45°C)
# ^
kg
kg
m3/sec
J/kg°C
J/kg°C
Kg/m3
°K
°K
- 635 -

KAERI/RR-1999/99
Table 6.2-6
Parameters for Calculation of D2O Temperature in Storage Bay
2047 m2,040,859 kg
682 m679,954 kg
(Q) 0.152 (=152 Vsec) m /sec
(Q) 0.0758 (=75.8 Vsec) m /sec
4188 at 30 °C light water J/kg°C
997 at 30 °C kg/m3
0.061 W/m°C
1.32 W/m2°C
719.27 m235.8 m523.15 m105.14 m460 J/kg°C
(Tc) 299 (=27 °C) °K
(To) 322 (=50°C) °K
- 636 -

KAERI/RR-1999/99
Table 6.2-7
Storage Bay Temperature and Heat Load due to Spent Fuel Decay Heat
Al#°l^(yr)1
2
3
4
5
6
7
8
9
10
11
12
13
14
15
16
17
18
19
20
21
22
23
24
25
26
27
28
29
30
31
80% 3 # £*I*1 -s .JE (C)
28.8
29.2
29.5
29.6
29.7
29.8
29.9
30.0
30.1
30.2
30.3
30.4
30.5
30.5
30.6
30.7
30.8
30.8
30.9
31.0
31.0
31.1
31.2
31.2
31.3
31.3
31.4
31.5
31.5
31.6
31.6
^HM*! (kW)1163
1456
1605
1697
1773
1837
1898
1956
2013
2066
2120
2170
2221
2269
2317
2363
2410
2454
2499
2541
2584
2625
2667
2706
2746
2784
2823
2860
2897
2933
2969
100% # £#
^#2: £ £ (°C)29.2
29.8
30.1
30.3
30.4
30.6
30.7
30.8
30.9
31.0
31.1
31.2
31.3
31.4
31.5
31.6
31.7
31.8
31.9
32.0
32.0
32.1
32.2
32.3
32.4
32.4
32.5
32.6
32.7
32.7
32.8
# :5-^ <! (kW)
1447
1814
2000
2116
2209
2289
2367
2439
2510
2577
2643
2706
2770
2830
2890
2948
3006
3062
3117
3171
3224
3275
3327
3377
3426
3474
3522
3568
3615
3660
3705
- 637 -

KAERI/RR-1999/99
Table 6.2-8
Heat Load in Storage Bay due to Instantaneous Discharge of Full and Half Core
flflt- $•^ 4*12: (day)
0
5
10
15
20
25
30
35
40
45
60
75
90
105
^ ^ (Full Core)
130
6.72
5.03
4.22
3.72
3.36
3.08
2.85
2.66
2.51
2.2
2.0
1.86
1.8
1- <l*l-ir (MW)
^ i c 9 (Half Core)
64.8
3.36
2.52
2.11
1.86
1.68
1.54
1.43
1.33
1.25
1.1
1.0
0.93
0.9
- 638 -

KAERI/RR-1999/99
Table 6.2-9
Storage Bay Temperature and Decay Heat of Spent Fuel due to Core Discharge
3 U d *
^ V^]^1^Ji|^
313.-&S-
31*
37
6630
4200
38
7150
3250
80% ^
5°C
(kW)
(kW)
3°C
(kW)
(kW)
36.2 °C
5830
3400
37.
6350
2500
(kW)
(kW)
o°c(kW)
(kW)
100% ^
31W
38.6°C
7350 (kW)
4800 (kW)
39.4 °C
7900 (kW)
3850 (kW)
37.0 °C
6350
3800
37.
6900
2850
(kW)
(kW)
8°C
(kW)
(kW)
- 639 -

KAERI/RR-1999/99
Table 6.2-10
Time to Reach 49 °C due to Malfunction of Storage Bay Cooling System
Time (hour)
After 31 year
80% power
7
100% power
5.3
After 12 year
80% power
10.3
100% power
7.9
- 640 -

KAERI/RR-1999/99
Table 6.2-11
Fatigue Usage Factor for Fueling
Component
Snout Assembly
Snout EmergencyLock Assembly
Magazine
SeparatorAssembly
Gland Plate
CoolantConnector
Ram HousingAssembly
Ball Screw SealAssembly
Gearbox, MainShaft and TapeDrive
Center SupportCenter Support Seal Holder RingLock RingScrew GearClamping BarrelWedge SegmentCenter Support BoltEmergency Lock-CoverCapscrews Holding the EmergencyLock-CoverLock Assembly Mounting CapscrewsMain HousingEnd Cover FlangeRam EndBracketsTechlok ClampGearbox HousingEnd CoverClamp StudCylinder BlockCylinder HeadCap ScrewPistonsGland PlateGland Plate BoltsFlange & HubBoltsMagazine Housing ExtensionRam HousingRear Forging10" Techlok Clamp10" Techlok Clamp StudHousingAssembly BoltsRetainerSeal SleeveRetaining NutGearbox and Tape DriveMain ShaftBolts
Snout Assembly Cavity Outlet Fitting
Machine
Fatigue UsageFactor
0.9910.00.1
0.090.60.30.60.06
0.4
0.40.90.10.30.150.40.000.860.840.060.060.210.060.021
0.40.370.870.5
0.70.050.30.2
0.5
0.70.72.30.040.140.060.7
0.34
ReplacementInterval
N/A3 yearN/AN/AN/AN/AN/AN/A
N/A
N/AN/AN/AN/AN/AN/AN/AN/AN/A
N/A
N/AN/AN/AN/AN/AN/AN/A
N/A
N/AN/AN/A
N/AN/A
N/AN/A
13 yearsN/AN/AN/A
N/AN/A
- 641 -
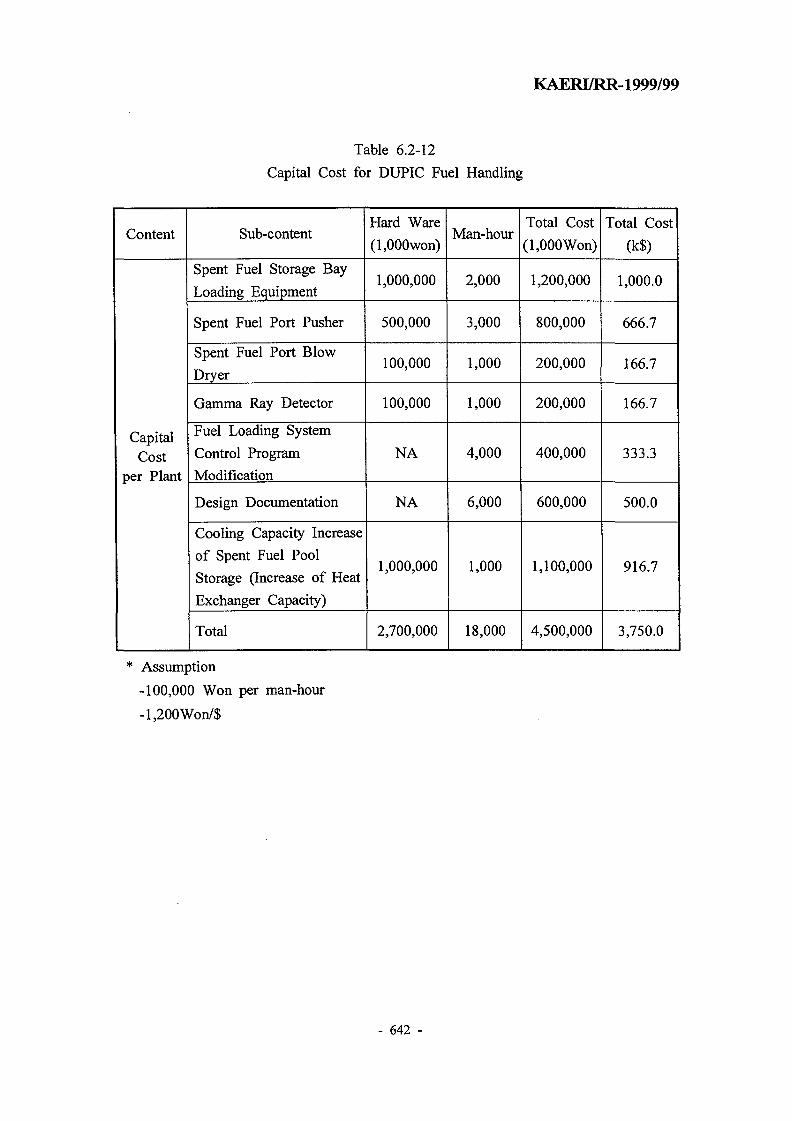
KAERI/RR-1999/99
Table 6.2-12
Capital Cost for DUPIC Fuel Handling
Content
CapitalCost
per Plant
Sub-content
Spent Fuel Storage Bay
Loading Equipment
Spent Fuel Port Pusher
Spent Fuel Port Blow
Dryer
Gamma Ray Detector
Fuel Loading System
Control Program
Modification
Design Documentation
Cooling Capacity Increase
of Spent Fuel Pool
Storage (Increase of Heat
Exchanger Capacity)
Total
Hard Ware
(l,000won)
1,000,000
500,000
100,000
100,000
NA
NA
1,000,000
2,700,000
Man-hour
2,000
3,000
1,000
1,000
4,000
6,000
1,000
18,000
Total Cost
(l,000Won)
1,200,000
800,000
200,000
200,000
400,000
600,000
1,100,000
4,500,000
Total Cost
(k$)
1,000.0
666.7
166.7
166.7
333.3
500.0
916.7
3,750.0
* Assumption
-100,000 Won per man-hour
-l,200Won/$
- 642 -

KAERI/RR-1999/99
Table 6.2-13
Unit Cost and Economic Parameters of DUPIC Fuel Handling
Content
Capital Cost per Plant
Burnup of DUPIC Fuel
(MWd/MTU)Annual Feed of
DUPIC fuel (MTHM)
Economic Parameters
Sub-content
Spent Fuel Storage Bay Loading Equipment
Sent Fuel Port Pusher
Spent Fuel Port Blow Dryer
Gamma Ray Detector
Fuel Loading System Control Program
Modification
Design Documentation
Cooling Capacity Increase of Spent Fuel
Pool Storage
Total
14,900
47.592
discount rate(%)
basis year
Levelized Unit Cost ($/kg)
Cost (k$)
1,000.0
666.7
166.7
166.7
333.3
500.0
916.7
3,750.0
5.00
2000
5.12571
*Exchange rate assumption : 1200 Won/US$
- 643 -

KAERI/RR-1999/99
Table 6.2-14
Life Cycle Cost and Unit Cost of DUPIC Fuel Handling
Year
2020202120222023202420252026202720282029203020312032203320342035203620372038203920402041204220432044204520462047204820492050Total
Capital Cost
(US$)
3,750,000
Net Present
Value (US$)
1,413,336
1,413,335.56
Annual Feed of
DUPIC Fuel (kg)
47,59247,59247,59247,59247,59247,59247,59247,59247,59247,59247,59247,59247,59247,59247,59247,59247,59247,59247,59247,59247,59247,59247,59247,59247,59247,59247,59247,59247,59247,592
Net Present Value
of Feed (kg)
17,08316,26915,49514,75714,05413,38512,74712,14011,56211,01210,4879,9889,5129,0598,6288,2177,8267,4537,0986,7606,4386,1325,8405,5625,2975,0454,8044,5764,3584,150
275,734.49
Levelized Unit Cost ($/kg) = 5.12571
- 644 -

KAERI/RR-1999/99
Hot Cell (Root A21
SPENT FUEL DISCHARGE B A Y - J ~L
Storage Boy Transfer Station (Root B2)
SPENT FUEL STORAGE BAY
Transfer Station (Root B l l
DEFECTED FUEL BAY
CANNEDDEFECTED FUEL
STORAGE TRAYS
Fig. 6.2-1 CANDU-6 Refueling Sequence
- 645 -

KAERI/RR-1999/99
Fig. 6.2-2 Current CANDU-6 Fuel Transfer Path
- 646 -

KAERI/RR-1999/99
JL REACTOR2. FUELUNO MACHINE BRIDGES3. FUEUJNO MACHINE CARRIAGES4. FUELUNO MACHINE HEADS5. FUELLING MACHINE CATENARIES6. SHIELDING DOORS7. CATENARY SYSTEMSS. FUEUJNS MACHINE MAINTENANCE LOCK TRACK9. FUELUNS MACHINE MAINTENANCE LOCK
10. NEW FUEL TRANSFER MECHANISMS1 1 . SPENT FUEL DISCHARGE BAY12. SPENT FUEL DISCHARGE PORTS13 . CALIBRATION PORTS14. ANCILLARY PORTS15. REHEARSAL FACILITY16. SPENT FUEL LADLE DRIVES17. DEFECTED FUEL CANNING EQUIPMENTS18. SPENT FUEL TRANSFER CONVEYOR19. SPENT FUEL RECEPTION BAY2 a RECEPTION BAY EQUIPMENT2 1 . DEFECTED FUEL STORAGE BAY22. DEFECTED FUEL STORAGE BAY EQUIPMENT23. SPENT FUEL STORAGE BAY24. STORAGE BAY MANBRIDGE26. STORAGE TRAY SUPPORTS26. SEMIAUTOMATIC SPENT FUEL HANDUNG SYSTEM27. NEW FUEL STORAGE ROOM23. FUEUING MACHINE HEAD TRANSPORT CART29. EQUIPMENT AIRLOCK30. FUEL HANDLING SYSTEM CONTROL CONSOLE
Fig. 6.2-3 CANDU-6 Fuel Handling System
- 647 -

KAERI/RR-1999/99
1 END FITTING2 BALL VALVES3 ELEVAVNG LADLE HOISTS4 ELEVAVNG LADLE DRIVE (IN NEW FUEL ROOM)5 ELEVAVNG LADLE6 MAIN ELEVATOR RAILS7 GUIDE RAILS8 FUEL POSITIONING ASSEMBLIES9 LOWER RAIL SUPPORT
10 AUXILIARIES11 SPRAY HEADERS12 REMOVABLE PLATFORMS13 FUEL TRANSFER EQUIPMENT14 DEFECTED FUEL CANNING EQUIPMENT15 SAFEGUARD MONITORS
Fig. 6.2-4 Spent Fuel Discharge Elevator
- 648 -
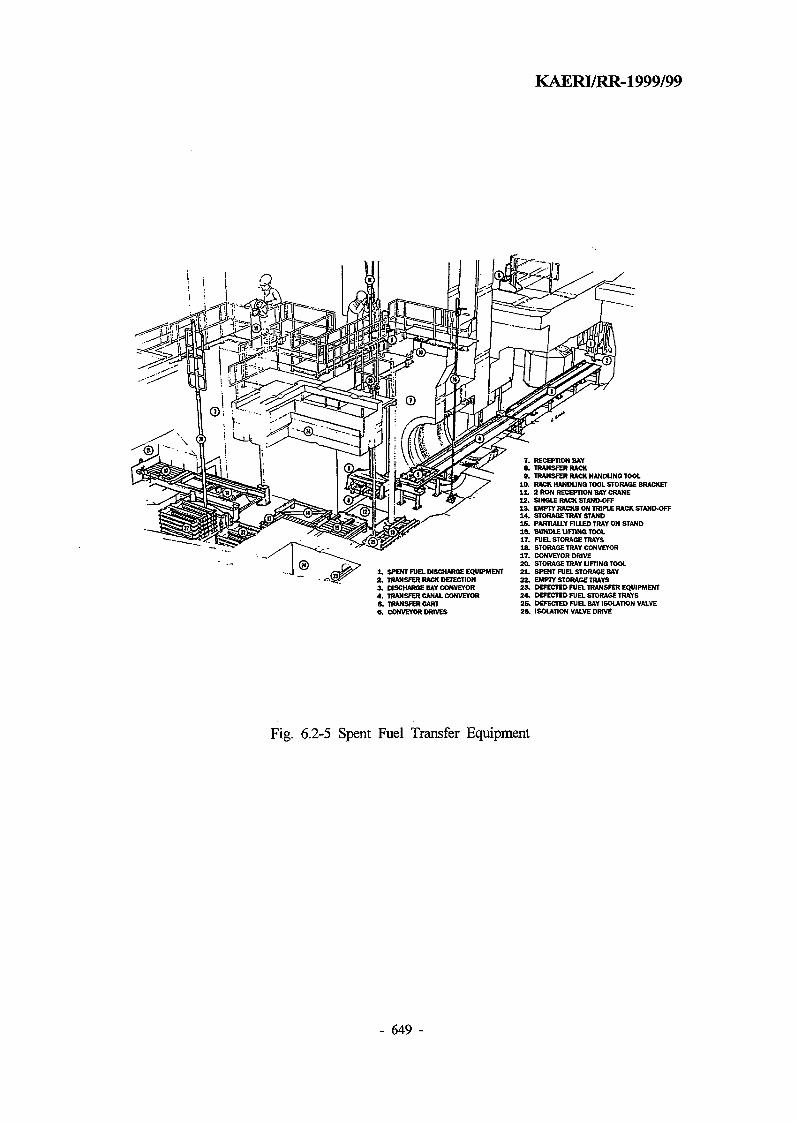
KAERl/RR-1999/99
SPENT FUEL DISCHARGE EQUIPMENTTRANSFER RACK DETECTIONDISCHARGE BAY CONVEYORTRANSFER CANAL CONVEYORTRANSFER CARTCONVEYOR DRIVES
T. RECEPTION BAY8. TRANSFER RACK9. TRANSFER RACK HANDUNO TOOL
10. RACK HANDUNd TOOL STORAGE BRACKET11. 2 RON RECEPTION BAY CRANE12. SINGLE RACK STAND-OFF13. EMPTY RACKS ON TRIPLE RACK STANDOFF14. STORAGE TRAY STAND15. PARTIALLY FILLED TRAY ON STANDI S . BUNDLE LIFTING TOOL17. FUEL STORAGE TRAYS18. STORAGE TRAY CONVEYORI T . CONVEYOR DRIVE20. STORAGE TRAY UFHNQ TOOL2 1 . SPENT FUEL STORAGE BAY22. EMPTY STORAGE IRAYS23. DEFECTED FUEL TRANSFER EQUIPMENT24. DEFECTED FUEL STORAGE TRAYS25. DEFECTED FUEL BAY ISOLATION VALVE28. ISOLATION VALVE DRIVE
Fig. 6.2-5 Spent Fuel Transfer Equipment
- 649 -

KAERI/RR-1999/99
MAIN STORAGE BAY FLOOR -
DETAIL "A1
CAP SEAL
Fig. 6.2-6 Spent Fuel Storage Tray
- 650 -

KAERI/RR-1999/99
FUEL TRANSFERFLASK
SHIELDED BASKETDRYING AND
WELDING STATION
BASKET ATDRYING POSITION
WELDING TORCH
TV CAMERA
WELDING TORCHLOADING SHAFT
SPENT FUEL BAY IRRADIATEDFUEL BAY WALL
T" FUEL TILT TABLE
UNDERWATERWORK TABLE
Fig. 6.2-7 Spent Fuel Shielded Basket Drying and Welding Station
- 651 -

KAERI/RR-1999/99
Fig. 6.2-8 Short-Term Spent DUPIC Fuel Decay Heat per Bundle
- 652 -

KAERI/RR-1999/99
X
10,000
1,000
100
10
1
—»*•• ••
H s1
\
» -
**<
h
0.0001 0.001 0.01 0.1 1
Time (Year)
10 100
Fig. 6.2-9 Long-Term Spent DUPIC Fuel Decay Heat per Bundle
- 653 -

KAERI/RR-1999/99
<L>
I
80
75
70
65
60
55
50
45
40
4 bundle shift (2 bundle per channel) refueling
I
:
;I
*
r
r i i i
* < . /
i i i i
^
0 10 20
L_
30 40 50
Time (min)
60 70 80
Fig. 6.2-10 Magazine Temperature from 4-Bundle Shift (2 Bundles per Channel) Refueling
- 654 -

KAERI/RR-1999/99
p
n.
I
80
75
70
65
60
55
50
45
40
8 bundle shift (2 bundle per channel) refueling
•
rfwmJ
u
1
1
N
20 40 60 80 100Time (min)
120 140 160 180
Fig. 6.2-11 Magazine Temperature from 8-Bundle Shift (2 Bundles per Channel) Refueling
- 655 -

KAERI/RR-1999/99
80
75
704)
H
pei
Tem
65
6055
50
45
40
8 bundle shift refueling per channel
i /-
//
/
, , ,\
10 20 30Time (min)
40 50
Fig. 6.2-12 Magazine Temperature from 8-Bundle Shift Refueling per Channel
- 656 -

KAERI/RR-1999/99
- 80% reactor power operation • 100% reactor power operation
Fig. 6.2-13 Storage Bay Temperature from Spent Fuel Decay Heat
- 657 -

KAERI/RR-1999/99
. 80% reactor power operation . 100% reactor powe operationr
4000
3500
: 3000
, | j 2500
! 1 2000
; S? 1500to
• a IOOO
: 500
i
i—""
( = •
10 15 20
Time (year)
25 30 35 :
Fig. 6.2-14 Storage Bay Heat Load from Spent Fuel Decay Heat
- 658 -
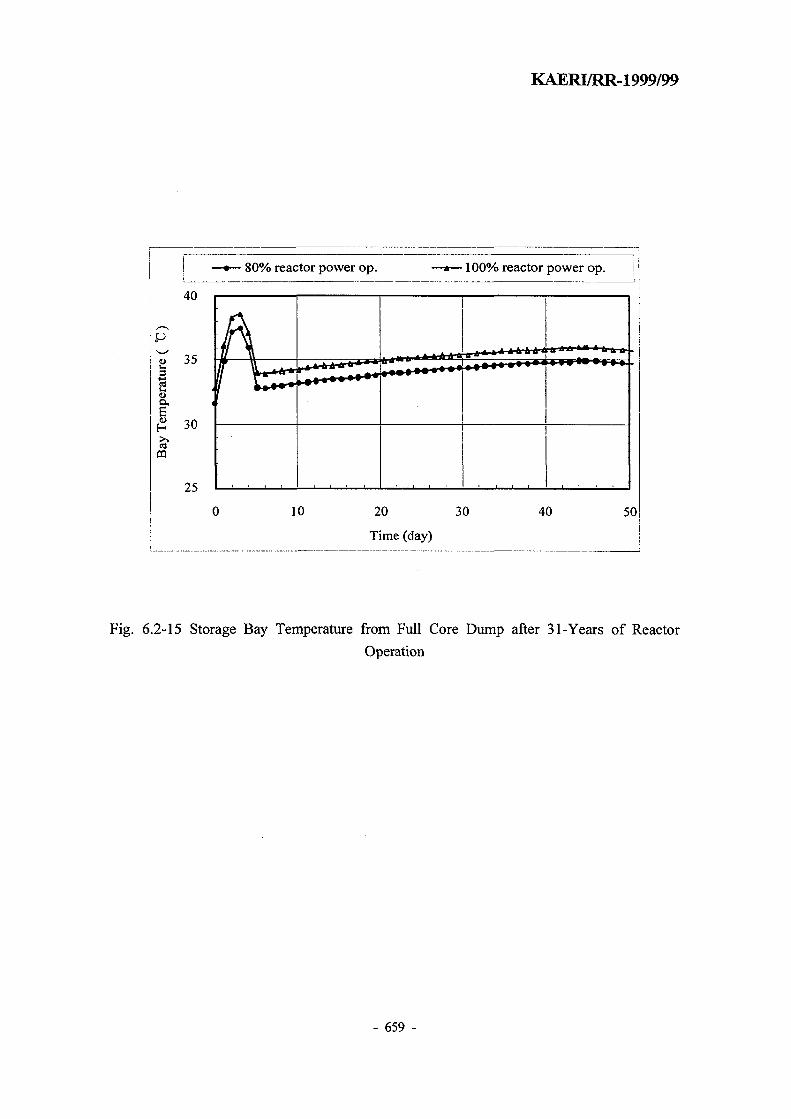
KAERI/RR-1999/99
80% reactor power op. 100% reactor power op.
25
10 20 30
Time (day)
Fig. 6.2-15 Storage Bay Temperature from Full Core Dump after 31-Years of Reactor
Operation
- 659 -

KAERI/RR-1999/99
I -9000 |
7son
•^ 6000
| | 4500 t
j 1* 3000 (
j 1500
1 oi (
- 80% reactor power op.
D 10
—*— 100%
RF~ ~. —. *
20 30
Time (day)
reactor power op.
40 50
Fig. 6.2-16 Storage Bay Heat Load from Full Core Dump after 31-Years of ReactorOperation
- 660 -

KAERWRR-1999/99
• 80% reactor power op. 100% reactor power op.
40
8OS
g
35
30
ca
25
10 20 30 40 50
Time (day)
Fig. 6.2-17 Storage Bay Temperature from Full Core Dump after 12-Years of Reactor
Operation
- 661 -

KAERI/RR-1999/99
• 80% reactor power op.
9000 r
7500
6000
4500
3000
1500
0
10
• 100% reactor power op.
Ar.Vd xzzszzz
20 30
Time (day)
40 50
Fig. 6.2-18 Storage Bay Heat Load from Full Core Dump after 12-Years of ReactorOperation
- 662 -

KAERI/RR-1999/99
100% reactor power op.80% reactor power op.
10 15Time (day)
20 25
Fig. 6.2-19 Storage Bay Temperature from Half Core Dump after 31-Years of Reactor
Operation
- 663 -

KAERI/RR-1999/99
Hea
t (K
Dec
! t
9000
7500
6000
4500
3000 '
1500
0
— 80% reactor power op.
I 1
3 5 10
—
15
Time (day)
100% reactor
• - * • * t. t
>->-« t i
20
power op. j
|
•
25 30
Fig. 6.2-20 Storage Bay Heat Load from Half Core Dump after 31-Years of ReactorOperation
- 664 -

40
£ 353
4 - *
8.
30
25
KAERI/RR-1999/99
• 80% reactor power op. 100% reactor power op.
N-*-*-T-^V . . — _ •
* ^ a A *•» » ^ i •
10 15 20
Time (day)
25 30
Fig. 6.2-21 Storage Bay Temperature from Half Core Dump after 12-Years of Reactor
Operation
- 665 -

KAERI/RR-1999/99
• 80% reactor power op.
(KW
)H
eati
;cay
Q
9000
7500
6000
4500
3000
1500
0
100% reactor power op.
Ar \....
•+-+-* ft a-.
10 15 20
Time (day)
25 30
i
Fig. 6.2-22 Storage Bay Heat Load from Half Core Dump after 12-Years of ReactorOperation
- 666 -

KAERI/RR-1999/99
Fig. 6.2-23 DUPIC Fuel Transfer Path
- 667 -

KAERI/RR-1999/99
6.3 ] § f %& ^ $ l
CANDU ^
7H^*H 1990V1 5^1 DUPIC
- DUPIC ^ £ 5 . ^ 7 ] ^ ^ 3 . 4-§-^ *|&g.l- CANDU
CANDU
(once-through cycle 2.^- direct disposal option) H] J2.tr}-©}
DUPIC ^ ^ 5 . ^ 7 ] fl ^ ^ ^ ]
^•*1| DUPIC 7 ]^o
DUPIC ^ ^ S ^ 7 ] ^ ,S.i;> 7^1^^ ^ ^ # ^ ^ ^ $ 1 4 . DUPIC
, DUPIC ^ ^ S ^ 7 ) «]-§-
DUPIC. ZL*tl 6.3-l gr *l^:aI-§- ^7} 2HJ# i i^^u]- . ^*1|3, Af§-
9i DUPIC
AECLo] i l j l ^ "The Disposal of Canada's Nuclear Fuel Waste: Engineering for a
Disposal Facility" [Ref. 16]^- £
- 668 -
KAERI/RR-1999/99
6.3.1
6.3.1.1
- 669 -

KAERI/RR-1999/99
#t*1|(buflfer), nf^fl(backfill), ZL
^71
6.3.1.2
DUPIC
room-and-pillar
r 7H^o|c>. room-and-pillarfe ^1^« | -^ nH^Lflofl *>i4 ^ ^ - n. o|
^ roora-and-pillar
- 670 -

KAERI/RR-1999/99
7}.
CANDU fe ~10,100,0007fl CANDU
-191,000 Mg
cf. a
4
57H
1000 m
fe zj-
- 671 -
KAERI/RR-1999/99
6.3.2.
OECD/NEA
[Ref. 18]fe
"The Cost of High Level Waste Disposal in Geological Repositories"
H]
CANDU
fe 6.3.2.2^1 7}
4 6.3.2.3^2}- 6.3.2.4^<>\]
6.3.2.1
6.3-
6.3-
JE. 6.3-
- 672 -

KAERI/RR-1999/99
71-
71-g- \dH-i- i^m^cf. o| Hj-g-^ 1991 L*
S.€: a}-§-^ ^^1 ^ 1 ^
NEA A}^-^-^ i | * H ^*BStK ^* | |S ^ 7 f e 1991 id
M 7
1991 id 7^
OECD/NEA
6.3-15]
- 673 -

KAERI/RR-1999/99
3.71
, CANDU ^QS-S!] ^ # « a ^ £ f e nfl-f- ^7]
6.3.2.2
DUPIC 4 - § - ^ ^<£^.£| ^ ^ a | ^ - o | , ^^-Si!} CANDU
' Slit:}.
A
D U P I C
7}.
CANDU ^«g^-e fe DUPIC ZLZ\JL ^^S. *}&%- ^ « ^ S . ^ 37>
}. ol^«> «Jo4S5j y J # ^ ^ £ ^ ^ ^ - ^ - e f e DUPIC, l ie]
JZ. ^ g ^ ^ ^^S.<H1 tU*H 4 4 8, 56, ZLelJL 35 MWdTcgHEojt:}. DUPIC
S^l HM-^^Efe ^ ^ r S i } CANDU ^4^-<Hl^^ ^ ^ S . Q±S. ^I
DUPIC ^ ^ S ^ l 7f^«> ilcfl ^#«g4iSfe CANDU ^^>^ofl>H 21 MWd/kgHES.
6.3-lofl ^<H^1 « ^ e o ^ ^ ^ 1 1 - J 1 ^ * H , ^ ^ ^ 5000
- 674 -

KAERI/RR-1999/99
2000 TWh^- 10900 TWh# til-g-^M- 4\Q *£ • *}th$i-£..S. A]~g-
CANDU #*}3.c% tfl*fl>*| «iJL
1 £ 5330 TWhofl cfl*> DUPIC
13320 MTHE (=5330X10756000/24/0.3)0)4.
CANDU ^ ^ - f e f e A]~g-^ ^ ^ ^ 6 f l c|*> 7 ] ^ ^^r-g-7]^ 7 2 7 ^
(1362.7 kgU)# ^-§-*fe ^M¥ -S-7]olcl-. 10\i^> ^ 4 ^ 4 - § - ^ ^ ^ 5 . 727H^: -337W oju]-. ^ ^^ .of l^^ . DUPIC
DUPIC
-8-7]if -8-*}*M-. OECD/NEA ^ ^ - ^ ] 1 8 ^ * } ^ , ^7 l 2000 TWh#
-7840 MgHMo]3.5 o|^^h ^ 4 ^ ^ ^ ^ ^ -5300
^ ^ € ^ > . 4 5 W , 4 -§"71^ Af-g-^ « | o iS -1,480 kgHM
, o] -g-7]^ 40Td?I: U I 4 € A]-§-^ t ^ ^ ^ S *U^^[ 4 , -1050
6.3.2.3
DUPIC
^<$.£. ^ ^ ^ ^r£^lt>^r OECD/NEA ^J IA^] 1 8 ^7]*}^ 85°C
- 675 -
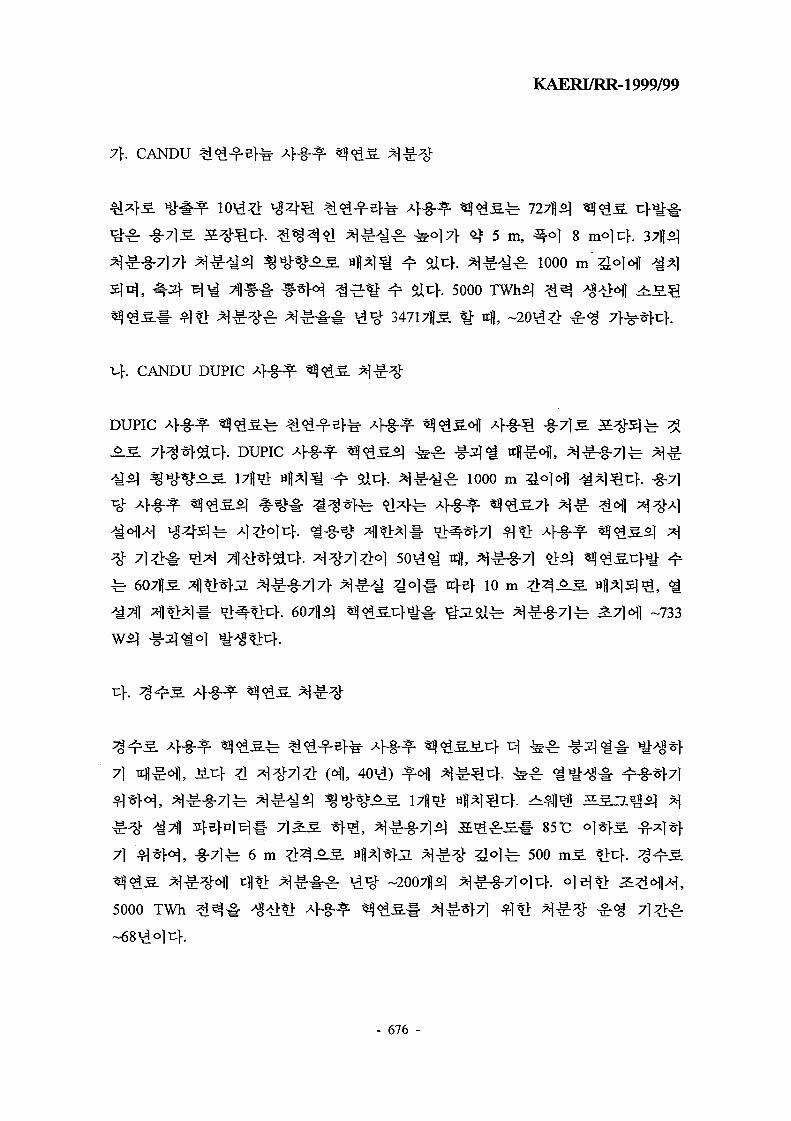
KAERI/RR-1999/99
7}. CANDU
*J 5 m, ^ o ] 8
^ ^ y ^ : 1000 m
5000 TWhS]
. CANDU DUPIC
DUPIC 4 S ^
>. DUPIC 4 g ^ ^ ^ ^ ^ ^
flll ^ } ^ ^ r ^ ^ r 1000 m
10 m 1& fll^^ S l H -733
7)
85°C o
71 ^ * H , -8-71^- 6 m ^ A S MH I JL ^^r^J- 3<>lfe 500 m l
5000 TWh
-68^014.
- 676 -

KAERI/RR-1999/99
S 6.3-3ofl
c}. 7 ^ ] DX, DY HelJL HX ("L^ 6.3-3)
}. 7] el DX, DY, T£
7]e]
t fecf. S 6.3-3^ ^ 7 1 ^ e o > 5000
71 el DX, DY, a
£ S 6.3-4ofl ^A]SlSd4. DUPIC
CANDU * U 1 - ^ | &7] ^^^S] ^°1^K ^ " i " # ^ , 5330 TWh
CANDU ^VS<HJ-H^ ^71-^^^= 2000
3330 TWh£| ^olc>. ^[7l ^ ^ 1 % ^ 13330 TWhif 29070
CANDU *J*fc3.oflA-1^1 ^ 7 l ^ ^ ^ ^ S r 4 4 5000Jf 10900
CANDU
zj-
3^Stic}.
^1*}7l fl*B, 3E 6.3-4O11
H «l.fi-# ^ ^ # 4 ^ t > ^ 1 ^ 7 l # ^ H v ^ 4 # T4B}H«C|-. S 6.3-3
6.3-4OJ1
6.3.2.4
OECD/NEAfe
OECD/NEAfe
- 677 -

KAERI/RR-1999/99
CANDU *i<£-f e f e DUPIC
, OECD/NEA<HI
. 3. 6.3-
-8-71
6.3.3
CANDU ^i^-f-efe, DUPIC
6.3.3.1
6.3.3.1 ^-tfl
12716
MWe)7} ^ r ^ ^«Hl $a^, 57l(#-§-3o> 5000 MWe)7> ^ ^ #o1] SdcK 1999^
45484 MWeofl ^Qv.}. o ) ^ ^ 28%7} ^
7\.
2030 ^M Q
-.21 2016^
- 678 -
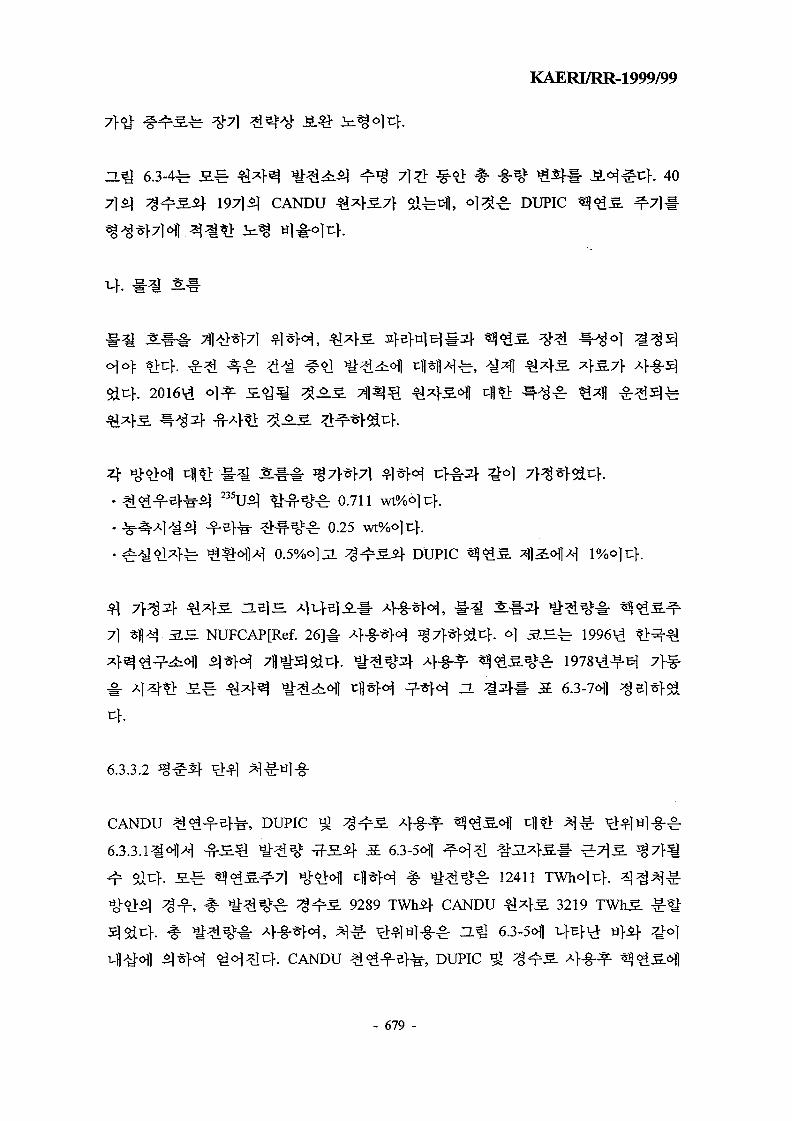
KAERI/RR-1999/99
ZL^ 6.3-4^ £ § Qx}^ iHldfcSj ^ 7]Q ^-<£ %• -§-*£ £ 3 f # J i o ^ t : } . 40
7] £| 3-^SSj- 1971 £j CANDU ^^j-^7} $X^*\], < > 1 ^ DUPIC
f. 2016^
^ 0.711
^ 0.25 wt%]
DUPIC
7] * ^ . a E NUFCAP[Ref. 26]# Aj-g-^o^ sg7>*>Sit:K o| SJE.^ 1996^
6.3.3.2
CANDU *I<2-feB=f, DUPIC %6.3.3.1 aloM - ^ - S ^ ti^3ov ^ - J S . ^ S 6.3-5^1
JE.-E- ^ ^ 5 . ^ 7 ] »J-6>ofl cfl*foj ^ #^e o >^ 12411
-, # w i ? i % ^ ^ ^ S 9289 TWhi f CANDU ^1^>S 3219 TWh^.
. CANDU ^i^-?-efe DUPIC
- 679 -
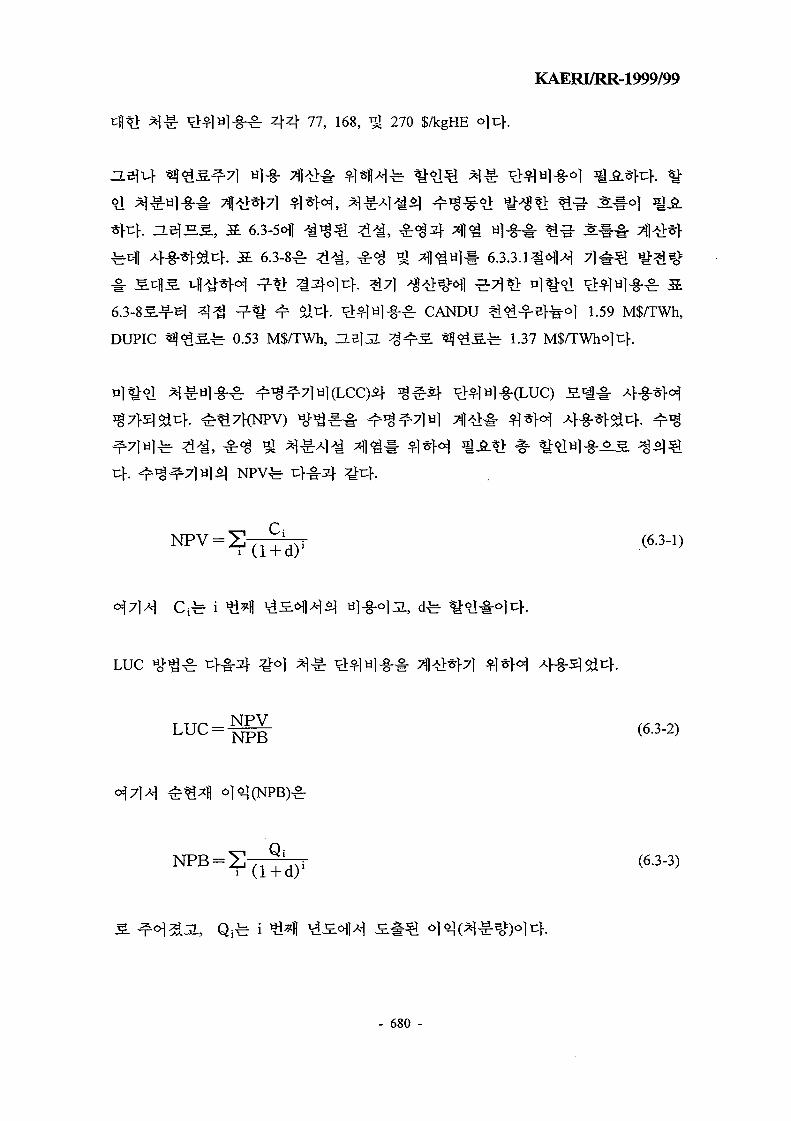
KAERI/RR-1999/99
4 4 77, 168, 9| 270 $/kgHE o|t>.
6.3-8^ &£, ^^g ^ ^ H l * 6 . 3 . 3 . 1 ^ ^ ^ 7
^>^ti|-§-^r CANDU € ^ - T - ^ } ^ - O | 1.59 M$/TWh,
DUPIC ^ " £ 5 . ^ 0.53 M$/TWh, H5]^L ^^S. ^ ^ S ^ 1.37 M$/TWho] v\.
LUC ^ ^ ^
- 680 -
L U C = N P B ( 6 3 " 2 )
( 6-3 '3 )

KAERI/RR-1999/99
(2020-2046)
10\d (2010-2019)
Si ^ ^ l t h A ^ ^ o ] ^ £ 5 } Jf 2Td (2047-2048)
: 2020
5%
S. 6.3-9, 6.3-10 Rj 6.3-11^- ^-g- JL#3f g|A-| ^*> 7>^^-S . 71]^:^ CANDU
-, DUPIC ZLels. ?g^S. A]~§-^ ^^S.^1 tnt> a ^ l - g s j.3-12fe 37W Al-g-^ ^ ^ ^ EHofl tflsfl ^^^7lHl-g-^ NPV
g CANDU
118 $/kgHM, DUPIC «(q4S 220 $/kgHM, ZLB]3.
403$/kgHM ©jr;]-.
6.3.4
DUPIC
CANDU ^ ^ - f e f e o l 1.59 M$/TWh, DUPIC « J « 1 S ^ 0.53 M$/TWh, IL
1.37 M$/TWh<>lt:f. DUPIC
^ - ^ , CANDU
CANDU
DUPIC ZLB13. %^S. Aj-g^f ^^S«H1 cfl^M 4 4 H8, 220, IielJL 403
DUPIC
fe DUPIC
- 681 -

KAERI/RR-1999/99
Table 6.3-1
Cost Estimates for Packaging and Geological Disposal of Spent Fuel [Ref. 18]
Spent Fuel (tU)
Corresponding Electricity generation(TWh)
Volume of waste (mj)
Packaging
Characteristicsof repository
Estimated cost
Normalizedcost
Inclusion of packing cost
Container (thickness)
Depth (m)
Host rock
Volume of excavatedrock (Mm3)
Operating period (year)
Sealing material
In national currency unit(base year)
In billion of U$ of July1991
Cost per unit electricitygeneration (M$/TWh)
Cost per unit weight ofwaste (k$/tU)
Canada
191000
10900
99000
Yes
Titanium (6.3 mm)
1,000
Crystalline rock
7.2
41
Bentonite/sand
9,500 M C$ (1990)
8.7
0.80
46
Sweden
7840
2000
12900
Yes
Copper (10 cm)
500
Crystalline rock
0.8
27
Bentonite/sand
20.2 b SKr (1990)
3.2
1.6
410
- 682 -

KAERI/RR-1999/99
Table 6.3-2
Comparison of Disposal Containers
Overall length (mm)
Overall diameter (mm)
Thickness (mm)
Capacity (no. of fuel assemblies)
Spent Fuel Type
CANDU-NU
2246
645
6.3
72
CANDU-DUPIC
2246
645
6.3
72
. PWR
4500
800
100
4
- 683 -

KAERI/RR-1999/99
Table 6.3-3
Summary of Repository Data for 5000 TWh Electricity Production
Cooling time of spent fuel
Container capacity (max. no. of assemblies)
Actual no. of fuel assemblies per container
Actual amount of fuel per container (kgHM)
Initial container heat output (W)
No. of containers across the room width
Borehole spacing across the room width (m)
Pitch distance along the room length (m)
Center-to-center room spacing (m)
Room width (m)
Room length (m)
Max. container outer-surface temperature (C)
CANDU
-NU
10
72
72
1363
337
3
2.1
3.1
30
8
230
89
CANDU
-DUPIC
50
72
60
1095
733
1
-
10
16
4
230
89
PWR
40
4
4
-1480
-1050
1
-
6
25
4
250
<85
- 684 -

KAERI/RR-1999/99
Table 6.3-4
Summary of Repository Operation Data
Spent fuel repository
(TWh)
Amount of spent fuel
(Mg HE)
Number of containers
Disposal rate
(containers/year)
Years of operation
Sub-surface plan area
(km2)
CANDU-NU
(Ti container)
2000
33330
24460
3471
8
0.8
5000
83330
61150
3471
18
2.1
10900
181660
133300
3471
39
4.2
CANDU-DUPIC
(Ti container)
5330
13220
12100
3471
4
2.0
13330
33060
30200
3471
9
5.1
29070
72070
65800
3471
19
10.2
PWR
(Cu container)
2000
7840
5300
196
27
1.4
5000
19610
13250
196
68
3.5
10900
42750
28890
196
147
7.6
- 685 -

KAERI/RR-1999/99
Table 6.3-5
Breakdown of Disposal Costs (1991 U$ million)
Spent fuel
repository (TWh)
Construction
OperationDirect
Indirect
Decommissioning
CANDU-NU
(Ti container)
2000
1380
1265
345
920
5000
1610
2990
920
1265
10900
2070
6900
2070
1725
CANDU-DUPIC
(Ti container)
5330
1380
1380
230
920
13330
1725
3450
460
1265
29070
2300
7475
1035
1725
PWR
(Cu container)
2000
1955
1265
345
690
5000
2415
3105
805
1380
10900
2875
6670
1725
3450
- 686 -

KAERI/RR-1999/99
Table 6.3-6
Nuclear System Scenario up to 2030
Year
19781979198019811982198319841985198619871988198919901991199219931994199519961997199819992000200120022003200420052006200720082009201020112012201320142015201620172018201920202021202220232024202520262027202820292030
Nuclear Power Plant
Name
Kortfl
Kori#2/Wolsong#l
Kori#3Kori#4Yongkwang#2
Yongkwani>#2Uljin#lUljin#2
Yongkwang#3Yongkwang#4
Wolsung#2Uljin#3/Wolsong#3Uljin#4/Wolsong#4
Yongkwang#S,#6
Uljin#5Uljin#6
NPP"#1,#2NPP#3NPP#4
NPP#5/KNGR°#INPP#6/KNGR#2
KNGR#3KNGR#4
CANDU#1,#2KNGRS5,#6/CANDU#3
CANDU#4,#5KNGR#7,#8
KNGR#9/CANDU#6,#7CANDU#8,#9
KNGR#10/CANDU#10KNGR#U/CANDU#11
KNGR#12CANDUS12
KNGR#13,#14CANDIK13
KNGR#15,S16KNGR*17/CANDU#I4KNGR#23/CANDU#I5
Generating Capacity (MWe)New
PWR587
650
9501,900
950950950
1,0001,000
1,0001,000
2,000
1,0001,000
2,0001,0001,0002,3002,300
1,3001,300
2,600
2,6001,300
1,3001,3001,300
2,600
2,6001,3001,300
PHWR
679
700700700
1,400700
1,400
1,4001,400
700700
1,400
700
700700
DecommissionPWR
587
650
9501,900
950950950
1,0001,000
1,0001,000
PHWR
679
700700700
Installed Capacity (MWe)
PWR587587587587587
1,2371,2372,1874,0875,0375,9876,9376,9376,9376,9376,9376,9377,9378,9378,9379,937
10,93710,93710,93712,93712,93713,93714,93714,93716,93717,35018,35020,65022,95022,95023,60024,90023,95022,05023,70022,75024,40025,70025,70027,00028,30029,60028,60030,20030,20031,80032,10033,400
PHWR
679679679679679679679679679679679679679679
1,3792,0792,7792,7792,7792,7792,7792,7792,7792,7792,7792,7792,7792,7792,7792,7792,1002,1002,1003,5004,2005,6005,6007,0008,4009,1009,8009,800
11,20011,20011,20010,50010,50011,200
Total587587587587587
1,9161,9162,8664,7665,7166.6667,6167,6167,6167,6167,6167.6168,6169,616
10,31612,01613,71913,71613,71615,71615,71616,71617,71617,71619,71620,12921,12923,42925,72925,72925,70027,00026,05025,55027,90028,35030,00032,70034,10036,10038,10039,40039,80041,40041,40042,30042,60044,600
Power Generation (MWyr)
PWT205364393329 '434636888
1,1272,5823,7133,8724,6825,4625,8115,8275,9315,5506,3507,1507.1507,9508,7508,7508.750
10,35010,35011,15011,95011,95013,55013,88014,68016,52018,36018,36018.88019,92019,16017.64018.96018.20019,52020,56020,56021,60022.64023.68022,88024,16024.16025,44025,68026,720
PHWR0000
0316455638543631536618584618581672577577577
1,1721,7672,3622,3622,3622,3622,3622,3622,3622,3622,3622,3622,3622,3622,3622,3622,3621,7851,7851,7852,9753,5704,7604.7605,9507,1407,7358,3308,3309,5209,5209,5208,9258,9259,520
Total205364393329434952
1,3431,7663,1254,3444,4085,3006,0456,4296,4086,6036,1276,9277,7278,3229,717
11,11211,11211,11212,71212,71213,51214,31214,31215,91216,24217,04218,88220,72220,72220,66521,70520,94521,61522,53022,96024,28026,51027,70029,33530,97032,01032.40033,68033,68034,36534,60536,240
*The nuclear system form the year 2016 is based on the following assumptions:-Electricity capacity reserve ratio is 20% from the year 2016.-Average Increase rate of maximum electricity demand is 2%/year-Nuclear share of electricity capacity is 37% up to the year 2020. 40% up to the year 2030.-Plant load factor is 80% for CANDU.-Plant life-time is 30 year for all types.*NPP means the type of Korean Standard Nuclear Power Plant (Uljin#3,#4)°KNGR means the Korean Next Generation Reactor being developed
- 687 -

KAERI/RR-1999/99
Table 6.3-7
Results of Material Flow and Electricity Generation for Fuel Cycle Options
Items
DUPIC
Cycle
Direct
Disposal
PWR Interim Storage (ton)
CANDU/DUPIC Interim Storage (ton)
DUPIC Facility (ton)
Disposal Capacity
(ton)
Cumulated Electricity
Generation (TWh)
PWR
CANDU
DUPIC
PWR
CANDU
Total
PWR Interim Storage (ton)
CANDU Interim Storage (ton)
Disposal Capacity
(ton)
Cumulated Electricity
Generation (TWh)
PWR
CANDU
PWR
CANDU
Total
Total treated amount
23,230
31,700
21,188
7,930
10,512
21,188
9,289
3,129
12,411
29,118
42,094
29,118
42,094
9,289
3,129
12,411
- 688 -

KAERI/RR-1999/99
Table 6.3-8
Cost Break-Down for Disposal Facility (1991 U$ million)
Spent fuel repository
(TWh)Spent fuel repository
(MTHM)
Construction
Operation
Direct
Indirect
Total
Decommissioning
Total Cost
CANDU-NU
(Ti container)
3129
53671
1467
1914
561
2475
1050
4992
CANDU-DUPIC
(Ti container)
12411
36861
1685
3212
434
3646
1225
6556
PWR
(Cu container)
9289
36861
2749
5697
1474
7171
2885
12805
- 689 -

KAERI/RR-1999/99
Table 6.3-9
Discounted Disposal Costs for CANDU-NU Spent Fuel
Year
201020112012201320142015201620172018201920202021202220232024202520262027202820292030203120322033203420352036203720382039204020412042204320442045204620472048Total
Cost (k$)
Capital
146700.00146700.00146700.00146700.00146700.00146700.00146700.00146700.00146700.00146700.00
1467000.00
O&M
90296.3090296.3090296.3090296.3090296.3090296.3090296.3090296.3090296.3090296.3090296.3090296.3090296.3090296.3090296.3090296.3090296.3090296.3090296.3090296.3090296.3090296.3090296.3090296.3090296.3090296.3090296.30
2438000.00
Decom.
525000.00525000.001050000.00
Total
146700.00146700.00146700.00146700.00146700.00146700.00146700.00146700.00146700.00146700.0090296.3090296.3090296.3090296.3090296.3090296.3090296.3090296.3090296.3090296.3090296.3090296.3090296.3090296.3090296.3090296.3090296.3090296.3090296.3090296.3090296.3090296.3090296.3090296.3090296.3090296.3090296.30525000.00525000.004955000.00
Total NPV
58054.17155289.68752656.84550149.37647761.31145486.96243320.91741258.01639293.34837422.23721937.15320892.52719897.64418950.13818047.75017188.33316369.84115590.32514847.92914140.88413467.50912826.19912215.42811633.74111079.75310552.14610049.6639571.1079115.3408681.2768267.8827874.1747499.2137142.1086802.0076478.1026169.62134163.20132536.382874680.25
Production(MTHM)
1987.811987.811987.811987.811987.811987.811987.811987.811987.811987.811987.811987.811987.811987.811987.811987.811987.811987.811987.811987.811987.811987.811987.811987.811987.811987.811987.81
53671.00
DiscountedProduction(MTHM)
482.93459.94438.03417.18397.31378.39360.37343.21326.87311.30296.48282.36268.91256.11243.91232.30221.24210.70200.67191.11182.01173.34165.09157.23149.74142.61135.82
7425.17
Net Present Values (k$) = 874680.2
Levelized Unit Cost ($/kg) = 117.799
- 690 -

KAERI/RR-1999/99
Table 6.3-10
Discounted Disposal Costs for CANDU-DUPIC Spent Fuel
Year
201020112012201320142015201620172018201920202021202220232024202520262027202820292030203120322033203420352036203720382039204020412042204320442045204620472048Total
Cost (k$)
Capital
168500.00168500.00168500.00168500.00168500.00168500.00168500.00168500.00168500.00168500.00
1685000.00
O&M
135037.04135037.04135037.04135037.04135037.04135037.04135037.04135037.04135037.04135037.04135037.04135037.04135037.04135037.04135037.04135037.04135037.04135037.04135037.04135037.04135037.04135037.04135037.04135037.04135037.04135037.04135037.04
3646000.00
Decom.
612500.00612500.001225000.00
Total
168500.00168500.00168500.00168500.00168500.00168500.00168500.00168500.00168500.00168500.00135037.04135037.04135037.04135037.04135037.04135037.04135037.04135037.04135037.04135037.04135037.04135037.04135037.04135037.04135037.04135037.04135037.04135037.04135037.04135037.04135037.04135037.04135037.04135037.04135037.04135037.04135037.04612500.00612500.006556000.00
Total NPV
66681.17263505.87860481.78857601.70354858.76552246.44349758.51747389.06445132.44242983.27832806.75131244.52529756.69128339.70526990.19625704.94824480.90323315.14622204.90121147.52420140.49919181.42818268.02717398.12116569.63915780.60815029.15114313.47713631.88312982.74612364.52011775.73311214.98410680.93710172.3219687.9259226.59539857.06837959.1121122865.11
Production(MTHM)
1365.221365.221365.221365.221365.221365.221365.221365.221365.221365.221365.221365.221365.221365.221365.221365.221365.221365.221365.221365.221365.221365.221365.221365.221365.221365.221365.22
36861.00
DiscountedProduction(MTHM)
331.68315.88300.84286.51272.87259.88247.50235.72224.49213.80203.62193.92184.69175.89167.52159.54151.94144.71137.82131.26125.01119.05113.38107.98102.8497.9493.28
5099.58
Net Present Values (k$) = 1122865.1
Levelized Unit Cost ($/kg) = 220.188
- 691 -

KAERI/RR-1999/99
Table 6.3-11
Discounted Disposal Costs for PWR Spent Fuel
Year
201020112012201320142015201620172018201920202021202220232024202520262027202820292030203120322033203420352036203720382039204020412042204320442045204620472048Total
Cost (k$)
Capital
274900.00274900.00274900.00274900.00274900.00274900.00274900.00274900.00274900.00274900.00
2749000.00
O&M
265555.56265555.56265555.56265555.56265555.56265555.56265555.56265555.56265555.56265555.56265555.56265555.56265555.56265555.56265555.56265555.56265555.56265555.56265555.56265555.56265555.56265555.56265555.56265555.56265555.56265555.56265555.56
7170000.00
Decom.
1442500.001442500.002885000.00
Total
274900.00274900.00274900.00274900.00274900.00274900.00274900.00274900.00274900.00274900.00265555.56265555.56265555.56265555.56265555.56265555.56265555.56265555.56265555.56265555.56265555.56265555.56265555.56265555.56265555.56265555.56265555.56265555.56265555.56265555.56265555.56265555.56265555.56265555.56265555.56265555.56265555.561442500.001442500.0012804000.00
Total N P V
108787.265103606.91998673.25693974.53089499.55285237.66981178.73277313.07873631.50370125.24164515.74561443.56758517.68355731.12653077.26350549.77548142.64245850.13643666.79641587.42539607.07137721.02035924.78134214.07732584.83531033.17729555.40628148.00626807.62525531.07124315.30623157.43422054.69921004.47520004.26219051.67818144.45693867.46289397.5832057234.33
Production
(MTHM)
1365.221365.221365.221365.221365.221365.221365.221365.221365.221365.221365.221365.221365.221365.221365.221365.221365.221365.221365.221365.221365.221365.221365.221365.221365.221365.221365.22
36861.00
Discounted
Production
(MTHM)
331.68315.88300.84286.51272.87259.88247.50235.72224.49213.80203.62193.92184.69175.89167.52159.54151.94144.71137.82131.26125.01119.05113.38107.98102.8497.9493.28
5099.58
Net Present Values (k$) = 2057234.3
Levelized Unit Cost ($/kg) = 403.413
- 692 -

KAERI/RR-1999/99
Table 6.3-12
Disposal Unit Costs for Three Different Spent Fuels
Construction cost total (M$)
Annual operation and maintenance(M$)
Decommissioning total (M$)
Life cycle cost in net presentvalue (M$)
Waste production in net presentvalue (MTHM)
Levelized unit cost ($/kgHM)
CANDU-NU(Ti container)
1467
90
1050
875
7425
118
CANDU-DUPIC(Ti container)
1685
135
1225
1123
5100
220
PWR(Cu container)
2749
266
2885
2057
5100
403
- 693 -

KAERI/RR-1999/99
Literature Survey on HLW
Disposal Facility
Reference Selection for HLW
Disposal Cost Estimation
Analysis of Disposal Capacity
in Korea
Future Nuclear Grid Analysis
ICumulated Electricity
Generation
ISpent Fuel Arising
Unit Cost Estimation of HLW
Disposal for Spent CANDU
and DUPIC fuels
Fig. 6.3-1 Procedure of HLW Disposal Cost Estimation
- 694 -

KAERI/RR-1999/99
EIS 4-1.03
Fig. 6.3-2 Spent Fuel Disposal Facility Perspective [Ref. 16]
- 695 -

KAERI/RR-1999/99
TitaniumContainer
Fig. 6.3-3 Waste Emplacement Geometry for an Underground Facility [Ref. 20]
- 696 -

KAERI/RR-1999/99
50,000
45,000
40,000
a, 35,000
| 30,000
.-£• 25,000
g. 20,000
O 15,000
10,000
5,000
0
/
J
total of
• total
40
of
• i
Units\'i , -
• iI Jn^
IDPWR"\ IBPHWR
A
1978 1988 1998 2008 20182028 2038
Year2048 2058 2068 2078
Fig. 6.3-4 Installed Capacity of Nuclear Power Plants
- 697 -

KAERI/RR-1999/99
PWR (9,289 TWh, 270$/kgHE)
CANDU-DUPIC(12,41 lTWh, 168$/kgHE)
CANDU-NU(3,129 TWh, 77$/kgHE)
0 5000 10000 15000 20000 25000 30000Electricity Generation (TWh)
Fig. 6.3-5 Disposal Unit Costs for Spent CANDU-NU, CANDU-DUPIC and PWRFuels [Ref. 20]
- 698 -
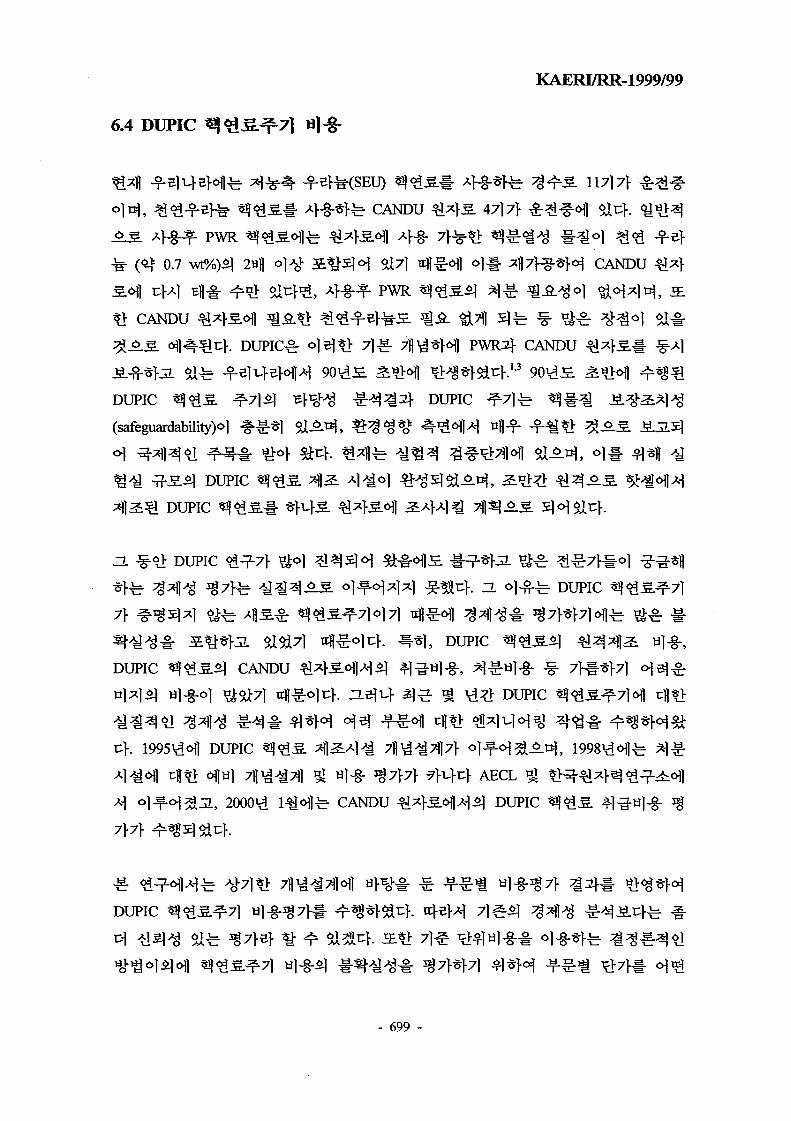
KAERI/RR-1999/99
6.4 DUPIC ^ I M ] §
CANDU &*}$. 47)7}
PWR ^<as<Hlfe €*}3.ofl 4-g- 7|-^t> a ^ - S # * H £<2 -f e>0.7 wt%)^ 2Bl| O]^1- S ^ 5 ] ^ 5Ll7l 4^:^] °11- ^7Fg-*H CANDU ^ ^ }
CANDU ^^}S^I ^^.*> ^ g - f s t e S . ^ A ^711 5]fe ^ ^ ^ ^ ^ )
. DUPIC r o|^«> 7 ] ^ 7||^§H1 PWR f CANDU
DUPIC « } ^ 5 . ^7}S] B>^Jg ^ - ^ ^ ^ DUPIC ^ 7 | ^
(safeguardability)<>l
^ ^ ^ fS^I DUPIC
DUPIC
ZL ^ - 9 } D U P I C ^ ^ > # ] ^ 1 H ^ l 1 ? > ? J ^
l ^ ^ l % & ] ^ . D U P I C
|, DUPIC
DUPIC « ? ^ ^ ^ CANDU ^I -Sof l -H^ ^ « l - § - , ^
} 4 DUPIC
DUPIC ^ ^ ] fl^l}
|{ al-g- ^7j-7f 9}x}r\ AECL ^
1 ^ CANDU ^ * } ^ H ^ 1 DUPIC
DUPIC ^ ^^ife 3§7>e> ^ ^ a l ^ f . jEta 7 ] ^ i=>4l«]-§-#
- 699 -

KAERI/RR-1999/99
DUPIC
6.4.1 7 ^ ^<&3.
DUPIC «)o4S^7]6fl^ 4 - g - ^ PWR ^<&£.±r 3*1 ^ 7 > ^ # 7^^ CANDU
DUPIC ^ 9 1 S . # ?>#^ol : ?>i;>. o] #AT
DUPIC ^ ^ ^ o l l f e S
%&&$ l ^ ] % ^ l ^c>. o | ^ A^A>^ DUPIC
P W R ^ £ ] ^ J ^ 1 fH
DUPIC
SEU
DU# *Q[2&%«Qi*\ %7}tfe 7^o\t\. ojel*]; 7 f l ^ # 7 ^ 2 ^ ^ DUPIC
CANDU
I: SEU v± DU#j l O i-~ -r rrf27
2: SEU 5J DU#
3: A > ^ f PWR ! i # ? & ^ ] 1 ^ ^ ^
S 6.4-H
- 700 -

KAERI/RR-1999/99
6.4.1.1
PWR
blending
r DUPIC
PWR
wt% DU# °l-g-*HS U235 9J Pu239
%±3. ^}]dt\. o] ^ - f ofl 7 ] § DUPIC
0.45 wt%# Tg$^ ^ Sa^.^ 4
SEU
^ ^ 3.5 wt% SEU |- 0.25
DUPIC ^ ^ S . # «># ^ $X^
S ^ ^ U235 1.0 wt% % Pu239
96%#
6.4.1.2 2)
DUPIC
. DUPIC
PWR
PWR 7HJ-
>?Kg.£(targpt reactivity)!-
^ . DUPIC
^ . f e 100%
DU 1.1 wt%S.
35]
SEU ^-^r DU
PWR
S E U 2.3 wt%
6.4.1.3 3)
PWR DUPIC
- 701 -

DUPIC
1.57 wt°/o©lt}.
DUPIC
KAERI/RR-1999/99
6.4.2 DUPIC
OECD/NEA
6.4-2 1 t^Lfl Sit}. DUPIC DUPIC
6.4.2.1 DUPIC
DUPIC
DUPIC
DUPIC
5%,
558
4 4 619
40()S.
SEU ^ DU
580 $/kgHES.
6.4.2.2 DUPIC
DUPIC CANDU
- 702 -

KAERI/RR-1999/99
3* g ^ l S d l f DUPIC
C A N D U | i l }]
^7} ^-H] til-g-i)- - i ^ H l - g ^ JS.J^ JL3|*> CANDU
3,750,000 $ (2000\1
DUPIC ^<?1S.^-
5.0 $/kgHM< ]A-| 5.3
6.4.2.3
CANDU 9J DUPIC ^i^S. ^MQ til-g-^l OECD/NEA<M|
CANDU ^ ^ 5 . ^ ^ H ' - W l - S ^ " ^7|-*f31, ^ i^ 1 # £ * } # wl-8-ofl 7}
DUPIC
^ CANDU
g- 35
ZLBl L CANDU Al^g-^ « } ^ S ^^Hj -g .^ . OECD/NEA 2LJL*H \}S\ $X^ 13
$/kgHM#
DUPIC ^ ^ ^ . 5 ] -g-2|<i%^ Af-g-^ CANDU
conditioning plant7>
DUPIC ^^5.^1 ^ ^ H v «l-g^ CANDU
170
6.4.2.4 4-8-^*1 g £
PWR !%<$.£., 4 - g - ^ CANDU « } ^ S ^ 4 - g - ^ DUPIC
] ^}u}t:f AECL611 16
- 703 -

KAERI/RR-1999/99
PWR «?«1S, 4-S-^1 CAM)U ^ ^ 5 . ^J A f § ^ D u p i c
403 $/kgHE, 118 $/kgHE £ 220 32
6.4.3
one-batch ^ ^ J S . ^ ^ ^ ^ 5 . ^ 7 ] H]-g-
M f 1 DUPIC ^«^5.^7] ^ - ^ # JL^*><H 7 ] ^ PWR
CANDU ^ 4 ^ # ^d^*>31 7 1 ^ ^J^S51 < i ^ # , o
6.4.3.1 ^<?!S.^7l H]-g-
^ ^ : OECD/NEAoflA-1
71
F.{t)
to : ?U
- 704 -

KAERI/RR-1999/99
L :
T, : ^ 7 ] #5) 3qcfl?)t
T2 :
«]-§- (Levelized fuel cycle cost, LFCQ
LFCC = (6.4-2)
uf.
7}7\
(non-parametric distribution)<>] A]~§.*>sit;>. o |
=
mode
- 705 -

KAERI/RR-1999/99
SD=
( 6 4 . 5 )
(6.4-6)
a 6.4-3^ £
s>BWN ft (
^ OECD/NEA
$/kgU, ZLeU
mode ft)o] ^
. ^ - ^ 6.4-2
130 $/kgU ^ ^
80 $/kgU, mode ^ HO
6.4.3.2 7] 71
DUPIC
MOX
^71
o)n) DUPIC
PWR
PWR
DUPIC
CANDU
DUPIC
DUPIC
CANDU & DUPIC
lead time^f lag ti
leadAag ti
. DUPIC
AR (At
AR
- 706 -

KAERI/RR-1999/99
^ ^§§^I 950 MWe^- PWRJf 713
CANDU ^ * > S # ?}%*}&&. o) #
6.4.3.3 ^<£S^7 l Hj-g-
S. 6.4-Hfe fcafl ^ - ^ ^ ^ S . ^ 5 g € 71$ DUPIC
CANDU-6 ^>Sof l> | ^ DUPIC
fe. DUPIC
14,900 MWd/MTHM, ^^1 27} 14,500 MWd/MTHM,
15,400
6.4-5<>flfe 71$ PWRJf CANDU - ^ ^ ^ . ^ A ^ # ^ ^ 1 # # ^Bf^fl ^olcl-. PWR
]$J»S. tj-^KHSi ».nf, CANDU^ ^ - f 17H
a. 6.4-6^ DUPIC «?«!S^7loflAl CANDU
I7fl i c ^ #5O>^. 7l^ojg. *}#£. xt))^ ^ ^ ^ ^ 7 1 ^ -g -^ # ^ *
. DUPIC 7l$*K!jS.n}-i;} ^4iS7f ^?V*| C>s.7] 4 ^ ^ PWR
# : 0.711 wt%.
Tail assay: 0.25 wt%.
(Loss factors)
(conversion) : 0.5%
PWR ^ DUPIC *%<$.£. *\]£. : 1%
- 707 -

KAERI/RR-1999/99
- CANDU : 0.5%
S. 6.4-
CANDU
ratio)
DUPIC
£>t;r.
PWR
(PWR-to-CANDU reactor
6.4-7, 6.4-8
, DUPIC
4 4 >
DUPIC
DUPIC ^ CANDU
^ PWR
DUPIC
, 2
o]
o l ^ DUPIC
CANDU
mills/kWh,
DUPIC ^ « ^ ^ . *#«# HIA-}*] DUPIC
- 5.19 mills^Whl- }LO]JL ^-C}. DUPIC
^131 al-i-g- <£ r 5 1 ^ . tiJ:^<Hl, DUPIC
DUPIC ^7 lHJ -§ -£ 5.25 mffls/kWh,
5.42
,£- 5.24
6.4-lOg: S 6.4-7, 6.4-8
0.24 mills/kWh,
. DUPIC
0.1 mills/kWh,
0.01 mills/kWhl-
^ S . ^ DUPIC
DUPIC # l
SEU
71
- 708 -

KAERI/RR-1999/99
Latin Hypercube
tfl*1H, DUPIC
mills/kWh, HB|JL
mills/kWhS.
5.39 mills/kWh,
5.30 mills/kWh,
0.09
DUPIC
# 10,000*1
5.55 mills/kWh,
5.26 mills/kWh,
] ^ 0.29
0.35
0.37
0.34 mills/kWh, Zi
0.37 mills^WhS
\f DUPIC
S 6.4-
percentile
75th percentile ^ - ^ 95th
percentile O]
6.4-4, 6.4-5 £ 6.4-6^r 4
6.4-7, 6.4-8 9i 6.4-9^
positively skewed *fc2.20%
positive skewness $17]
6.4-10, 6.4-11 g 6.4-12^ ^
^ r ^ ^ r Spearman Rank Correlation ao ^ ° | 3 4
3.nDUPIC fe CANDU ^ ^ - f c ^
, DUPIC
DUPIC
- 709 -

KAERI/RR-1999/99
6.4-15<Hl
o]
39$2}- DUPIC
fe ^ 6.4-13, 6.4-14 £
3.5 wt% ^ - f f i f e 0>
^ - f fife(U3O8)^ 978$
, DUPIC ^71*1 ^ - f 3.5 wt% -^Hr-sH? <$
SEU % DU7> ^ j t * > L | CANDU
4 4 20% 51 23%*j
2 51 3*11 cH«> DUPIC
%SLS. 4 4 4^1"^} ( S 6.4-12
DUPIC
15,000
DUPIC
DUPIC
65%
P W R
CANDU
DUPIC
6.4.4
~b DUPIC
MOX
n] DUPIC
l ^ 7 1 (thermal recycling)^ «J
DUPIC
- 710 -

KAERI/RR-1999/99
DUPIC t!}<£5. *\}2. ^ - ^ # ^ 1 SEU ^ DU#
, DUPIC
PWR
DUPIC
o> ^ ^ O.
- DUPIC
- 711 -
# 3 DUPIC
3f DUPIC
23% ^§£ ^ ^ % ^ ^1-5.^, Afg-^ ^ ^ ^ . i t ^ ^ S *f 65%

KAERI/RR-1999/99
Table 6.4-1
Characteristics of Reference DUPIC Fuel
Fissile content
(wt%)
Fuel composition
(%)
23>U239Pu24!Pu
Spent PWR fuel
SEU (3.5 wt%)
DU (0.25 wt%)
NU (0.71 wt%)
Spent PWR fuel utilization (%)
Discharge.burnup in CANDU (MWd/T)
Annual Fuel requirement (MTU)
DUPIC Fuel Model
Option 1
1.00
0.45
0.04
82.7
6.5
10.8
0.0
96
14900
47.6
Option 2
0.97
0.53
0.05
96.6
2.3
1.1
0.0
100
14500
48.9
Option 3
0.98
0.54
0.05
100.0
0.0
0.0
0.0
80
15400
46.0
- 712 -

KAERI/RR-1999/99
Table 6.4-2
Input Values for Fuel Cycle Components
Component
Uranium ($/lbU3O8)
- PWR
- CANDUConversion ($/kgU)
- PWR
- CANDU
Enrichment ($/SWU)
Modification of CANDU
Reactor for DUPIC ($/kgHM)
Fabrication ($/kgHM)
- PWR
- CANDU
- DUPIC
Transportation ($/kgHM)
- DUPICTransportation/Storage ($/kgHM)
- PWR
- CANDU
- DUPICDisposal ($/kgHM)
- PWR
- CANDU
- DUPIC
Loss Rate
(%)
0.5
0.5
1
1
1
Lead/Lag
(months)
-24
-17
-18
-13
-12
-12
-6
-10
-10
120
120
120
120
360
360
360
Unit Cost
19.2
19.2
8
8
110
Option 1: 4.183
Option 2: 4.007
Option 3: 4.287
275
65
Option 1: 619
Option 2: 580
Option 3: 558
50
230
48
170
403
118
220
- 713 -

KAERI/RR-1999/99
Table 6.4-3
Distribution Parameters of Input Values for Uncertainty analysis
Component
Uranium ($/lbU3O8)
- PWR
- CANDU
Conversion ($/kgU)
- PWR
- CANDU
Enrichment ($/SWU)
Modification of CANDU
Reactor for DUPIC
($/kgHM)
Fabrication ($/kgHM)
- PWR
- CANDU
- DUPIC
Transportation ($/kgHM)
- DUPIC
Transportation/Storage ($/kgHM)
- PWR
- CANDU
- DUPIC
Disposal ($/kgHM)
- PWR
- CANDU
- DUPIC
Distribution
Triangular
Triangular
Triangular
Triangular
Triangular
Triangular
Triangular
Triangular
Minimum
15
15
6
6
80
Option 1: 3.76
Option 2: 3.61
Option 3: 3.85
200
47
Option 1: 450
Option 2: 422
Option 3: 406
13
60
13
44
92
27
50
Most likely
value
(Mode)
19.2
19.2
8
8
110
4.183
4.007
4.287
275
65
619
580
406
50
230
48
170
403
118
220
Maximum
35
35
11
11
130
7.11
6.81
7.27
350
83
788
738
710
63
290
61
214
443
130
242
- 714 -

KAERI/RR-1999/99
Table 6.4-4
Characteristics of Reference Reactors and Fuels for Once-through and DUPIC Fuel Cycles
Item
Reactor
- Electric power (MWe)
- Thermal power (MWth)
- Specific power (MW/tonU)
- Load factor
- Cycle length (Full Power Day)
- No. of fuel assemblies or bundles per core
- No. of batches for PWR
- Loading per core (MTU)
- Annual fuel requirement (MTU)
Fuel
- Initial enrichment
- No. of fuel rods per assembly
- Discharge burnup (MWd/kgHM)
- Reference cooling time for refabrication of
spent PWR fuel into DUPIC fuel (year)
Characteristic Value
PWR
950
2,775
40.2
0.8
290
157
3
69.1
23.15
3.5%
264
35
10
CANDU
713
2,159
25.5
0.9
4,560
80.3
94.5
Nat. U
37
7.5
CANDU
-DUPIC
713
2,159
25.5
0.9
4,560
80.3
Table 6.4-1
Table 6.4-1
43
Table 6.4-1
- 715 -

KAERI/RR-1999/99
Table 6.4-5
Material Flow of Once-through Fuel Cycle based on One-Batch Equilibrium Model
Uranium purchase (lb U3O8)
Conversion (MTU)
Enrichment (TSWU)
Fabrication (MTU)
Reactor condition
Electricity power (MWe)
Thermal efficiency (%)
Specific power (MW/MTU)
Burnup (MWd/MTU)
Transportation (MTHM)
Interim storage (MTHM)
Disposal (MTHM)
PWR
428461
168.80
111.90
23.26
950
34.23
40.2
35000
23.03
23.03
23.03
CANDU
223748
86.06
85.63
713
33.03
25.5
7900
84.79
84.79
84.79
MTU: Metric Ton Uranium
TSWU: Ton Separative Work Unit
MTHM: Metric Ton Heavy Metal
- 716 -

KAERI/RR-1999/99
Table 6.4-6
Material Flow of Once-through Fuel Cycle based on One CANDU Reactor
Uranium purchase (lb UjOg)
Conversion (MTU)
Enrichment (TSWU)
Fabrication (MTU)
PWR core (MTU)
Transportation (MTHM)
Fabrication (MTHM)
Spent PWR fuel (%)
SEU (%)
DU (%)
Natural U (%)Transportation (MTHM)CANDU reactor
Electric power (MWe)
Thermal efficiency (%)
Specific power (MW/MTU)
Burnup (MWd/MTU)
Transportation (MTHM)
Interim storage (MTHM)
Disposal (MTHM)
Equilibrium core ratio
DUPIC Fuel Option
Option 1
1,317,551
560.78
344.11
71.53
70.82
70.82
85.63
82.7
6.5
10.8
0.084.79
713
33.03
25.5
14900
84.79
84.79
84.79
1.688
Option 2
1,539,002
591.96
401.95
83.55
82.27
82.2785.63
96.6
2.3
1.1
0.084.79
713
33.03
25.5
14500
84.79
84.79
84.79
2.037
Option 3
1,593,170
612.79
416.10
86.49
85.63
85.63
85.63
100
84.79
713
33.03
25.5
15400
84.79
84.79
84.79
1.989
MTU: Metric Ton Uranium
TSWU: Ton Separative Work Unit
MTHM: Metric Ton Heavy Metal
SF: Spent PWR Fuel
NU: Natural Uranium
SEU: Slight Enriched Uranium (3.5 wt%)
DU: Depleted Uranium
Equilibrium core ratio = CANDU annual requirement/ PWR annual Requirement
- 717 -

KAERI/RR-1999/99
Table 6.4-7
Levelized Costs (mills/kWh) of Once-through and DUPIC Fuel Cycle for Option 1
(Deterministic Method)
Components
P
W
R
C
A
N
D
U
Uranium (U3O8)
Conversion
Enrichment
Fabrication
Transportation
Trans. & Storage
Disposal
Uranium (U3O8)
Conversion
Fabrication
Transportation
Plant Modification*
Transportation & Storage
Disposal
Total
Once-through
PWR
1.170
0.183
1.667
0.846
-
0.363
0.239
CANDU
-
-
-
-
-
-
-
0.191
0.030
0.241
-
-
0.162
0.092
5.185
DUPIC
1.170
0.183
1.667
0.846
0.079
-
-
-
-
1.133
0.076
0.016
0.173
0.085
5.427
*Fuel handling equipment for DUPIC fuel loading and heat exchanger for pool storage capacity
increase etc. are included in the cost.
- 718 -

KAERI/RR-1999/99
Table 6.4-8
Levelized Costs (mills/kWh) of Once-through and DUPIC Fuel Cycle for Option 2
(Deterministic Method)
Components
P
WR
C
AN
D
U
Uranium (U3O8)
Conversion
Enrichment
Fabrication
Transportation
Trans. & Storage
Disposal
Uranium (U3O8)
Conversion
FabricationTransportation
Plant Modification
Transportation & Storage
Disposal
Total
Once-through
PWR
1.211
0.189
1.726
0.875-
0.375
0.248
CANDU
-
-
--
-
-
-
0.165
0.026
0.208-
0.140
0.080
5.244
.DUPIC
1.2110.189
1.726
0.875
0.082-
-
-
-
0.941
0.078
0.013
0.154
0.075
5.345
- 719 -

KAERI/RR-1999/99
Table 6.4-9
Levelized Costs (mills/kWh) of Once-through and DUPIC Fuel Cycle for Option 3
(Deterministic Method)
Components
P
W
R
C
A
N
D
U
Uranium (U3O8)
Conversion
Enrichment
Fabrication
Transportation
Trans. & Storage
Disposal
Uranium (U3O8)
Conversion
Fabrication
Transportation
Plant Modification
Transportation & Storage
Disposal
Total
Once-through
PWR
1.206
0.189
1.719
0.872
-
0.374
0.247
CANDU
-
-
-
-
-
-
-
0.168
0.027
0.212
-
-
0.143
0.081
5.237
DUPIC
1.206
0.189
1.719
0.872
0.081-
-
-
-
0.871
0.0780.014
0.1470.072
5.249
- 720 -

KAERI/RR-1999/99
Table 6.4-10
Summaiy of Levelized Fuel Cycle Costs by Deterministic Method (mills/kWh)
Direct fuel cycle
(Once-through)
DUPIC fuel cycle
DUPIC Fuel Option
Option 1
5.185
5.427
Option 2
5.244
5.345
Option 3
5.24
5.25
- 721 -

KAERI/RR-1999/99
Table 6.4-11
Results of Monte Carlo Simulation for Uncertainty Analysis of Fuel Cycle Cost
(Statistical Parameters and Percentile)
Items
Minimum (mills/kWh)
Maximum (mills/kWh)
Mean (mills/kWh)
Std. Dev. (mills/kWh)
Variance
Skewness
Kurtosis
Mode (mills/kWh)
Percentile
(mills/kWh)
5%
10%
15%
20%
25%
30%
35%
40%
45%
50%
55%
60%
65%
70%
75%
80%
85%
90%
95%
Option 1
DUPIC
4.3198
6.9141
5.5514
0.3467
0.1202
0.1724
2.7371
5.0690
5.0067
5.1119
5.1917
5.2522
5.3014
5.3518
5.4008
5.4460
5.4896
5.5381
5.5786
5.6263
5.6765
5.7306
5.7844
5.8567
5.9290
6.0195
6.1480
Direct
4.2069
6.5050
5.2603
0.3719
0.1383
0.2140
2.6887
4.9032
4.6777
4.7920
4.8722
4.9385
4.9940
5.0474
5.0960
5.1444
5.1897
5.2353
5.2844
5.3362
5.3909
5.4493
5.5138
5.5881
5.6728
5.7658
5.9018
Option 2
DUPIC
4.3561
6.7810
5.4804
0.3535
0.1250
0.2099
2.7292
4.8000
4.9327
5.0362
5.1051
5.1672
5.2253
5.2757
5.3244
5.3673
5.4160
5.4638
5.5139
5.5598
5.6095
5.6625
5.7165
5.7847
5.8624
5.9581
6.0954
Direct
4.1628
6.5760
5.3235
0.3780
0.1429
0.2276
2.6632
4.8681
4.7344
4.8485
4.9268
4.9921
5.0491
5.1014
5.1512
5.2017
5.2526
5.3004
5.3508
5.4024
5.4583
5.5167
5.5780
5.6495
5.7422
5.8427
5.9793
Option 3
DUPIG
4.2203
6.6311
5.3882
0.3446
0.1187
0.2076
2.7164
4.9146
4.8578
4.9558
5.0243
5.0848
5.1404
5.1904
5.2342
5.2790
5.3245
5.3724
5.4176
5.4613
5.5082
5.5615
5.6229
5.6841
5.7624
5.8586
5.9842
Direct
4.2287
6.5708
5.3042
0.3737
0.1396
0.2508
2.6791
4.5244
4.7271
4.8390
4.9138
4.9768
5.0330
5.0894
5.1369
5.1826
5.2277
5.2790
5.3290
5.3782
5.4298
5.4877
5.5564
5.6359
5.7246
5.8227
5.9482
- 722 -

KAERI/RR-1999/99
Table 6.4-12
Summary of Environmental Benefit of DUPIC Fuel Cycle
Natural Uranium Saving
Rate (%)
Disposal Waste (HLW)
Reduction Rate (%)
DUPIC Fuel Option
Option 1
19.7
64.5
Option 2
20.4
65.5
Option 3
22.7
67.2
- 723 -

KAERI/RR-1999/99
references
unit costs datafor components
engineeringevaluation
model selectionfor fuel cycles
selection of referencenuclear power plant
material flow analyses
levelized unit cost
sensitivity anduncertainty analysis
• electrical power• capacity factor• power efficiencj
product enrichmenttails contentloss factor
discount ratelead/lag time
Fig. 6.4-1 Procedure of Cost Analysis of DUPIC Fuel Cycle
- 724 -

KAERI/RR-1999/99
!
15 19.2$/kgU3O8
35
Fig. 6.4-2 Triangular Distribution Function of Natural Uranium
(Minimum = 1 5 , Mode = 19.2 and Maximum = 35 $/kg)
- 725 -

KAERI/RR-1999/99
Uraniu
>
m Ore
(-24)*
f
Conversion
>
Enricl
>
(-18)
f
unent
(-17)
f
Conversion
(-12)
f
PWR FuelFabrication
>(-6)
Uranium Ore
\(-24)
f
Conversion
>
(-18)
f
Enrichment
(-13)>
(
CANDU FuelFabrication
t
(^ PWR J)
SpenA R S
SpenAFR!
>
tFueltorage
(+120)
t
tFuelStorage
(-12)
f
PWR FuelFabrication
(-6)
f
(-10) /• Nf PWR J)
f ;
CCANDU J
(+360)
f
Spent FuelDisposal
t
Spent FuelAR Storage
>(+120)
f
Spent FuelAFR Storage
•
Once-through
Spent FuelAR Storage
(+120)
(+360)t
Spent FuelDisposal
Fuel Cycle
* Lead/Lag Time(months)
DUPIC FuelFabrication
->(" CANDU J )
i
Spent FuelAR Storage
>(+120)
i
Spent FuelAFR Storage
(+360)
i
Spent FuelDisposal
DUPIC Fuel Cycle
Fig. 6.4-3 Components and Time Frame of Once-through and DUPIC Fuel Cycle
- 726 -

KAERI/RR-1999/99
mills/kwh
Lebelized Unit Cost(mills/kwh) for DUPIC option in Option 1
0.14
rn ill s/kwh
Lebelized Unit Cost(mills/kwh) for Once-through option in Option 1
Fig. 6.4-4 Histogram of Fuel Cycle Cost for DUPIC Fuel Option 1
- 727 -

KAERI/RR-1999/99
0.12
tora
ooo*
oc0)3a£
0.10
0.08
0.06
0.04
0.00
0.10
0.08
g 0.06CD33cra>
0.02
mills/kwh
Lebelized Unit Cost(mills/kwh) for DUPIC option in Option 2
£ tP «? «? A # O s T? ^ t? 6 A ^ <S <? ? § &t . - ^ • fc- t . - !»• v <o- <o- <r>- <r>- < r <v «>• *>• %•• «>• 6 ' e>- fe-
mills/kwh
Lebelized Unit Cost(mills/kwh) for Once-through option in Option 2
Fig. 6.4-5 Histogram of Fuel Cycle Cost for DUPIC Fuel Option 2
- 728 -

KAERI/RR-1999/99
0.16
0.14
mills/kwh
Lebelized Unit Cost(mills/kwh) for Once-through option in Option 3
mills/kwh
Lebelized Unit Cost(mills/kwh) for DUPIC option in Option 3
Fig. 6.4-6 Histogram of Fuel Cycle Cost for DUPIC Fuel Option 3
- 729 -

KAERI/RR-1999/99
0.16
0.12
~ o.ioooo
0.08
O0.06
0.02
DUPIC Option
minimum : 4.3198 mills/kwh
maximum : 6.9141 mills/kwh
mean :5.5514 mills/kwh
std deviation : 0.3467 mills/kwh
variance : 0.1202
skewness : 0.1724
kurtosis : 2.7371
mode : 5.069 mills/kwh
Option 1
\\\
^ V
\ \
\ \
\ \
\ \
Once-through Option
minimum : 4.2069 mills/kwh
maximum : 6.5050 mills/kwh
mean : 5.2603 mills/kwh
std deviation : 0.3719 mills/kwhvariance : 0.1383
skewness : 0.214O
kurtosis : 2.6887
mode : 4.9032 mills/kwh
4 .5 5.5
mills/kwh
7.5 8.5
Fig. 6.4-7 Comparison of Probabilistic Density Function of Fuel Cycle Cost for Option I
- 730 -

KAERI/RR-1999/99
0.14
0.12
ooo
oca2
0.08
0.06
0.04
0.02
0.00
Option 2
DUPIC Optionminimum : 4.3561 mills/kwhmaximum : 6.7810 mills/kwhmean : 5.4804 mills/kwhstd deviation : 0.3535 mills/kwhvariance : 0.1250skewness : 0.2099kurtosis : 2.7292mode : 4.800 mills/kwh
\
•a '
\
\
Once-through Option
minimum : 4.1628 mills/kwh
maximum : 6.5760 mills/kwh
mean : 5.3235 mills/kwh
std deviation : 0.3780 mills/kwh
variance : 0.1429
skewness : 0.2276
kurtosis : 2.6632modee : 4.8681 mills/kwh
\ \
3.5 4.5 5.5
mills/kwh
6.5
Fig. 6.4-8 Comparison of Probabilistic Density Function of Fuel Cycle Cost for Option 2
- 731 -

KAERI/RR-1999/99
0.16
0.14
CD
0.02
0.00
CO
oooo
CD
0.
0.
0.
0
12
10
08
06
DUPIC Option
minimum : 4.2203 mills/kwh
maximum : 6.6311 mills/kwh
mean : 5.3862 mills/kwhstd deviation : 0.3446 mills/kwh
variance : 0.1187
skewness : 0.2O76
kurtosis : 2.7164mode : 4.9146 mills/kwh
Option 3
i
\
\
\ \
\ \
U
\ \
Once-through Option
minimum : 4.2287 mills/kwh
maximum : 6.5708 mills/kwh
mean : 5.3042 mills/kwhstd deviation : 0.3737 mills/kwhvariance ". 0.1396skewness : O.25O8kurtosis : 2.6791
mode : 4.5244 mills/kwh
5.S
mills/kwh
6.5
Fig. 6.4-9 Comparison of Probabilistic Density Function of Fuel Cycle Cost for Option 3
- 732 -

KAERI/RR-1999/99
Plant Modification
DUPIC Disposal
PWR Conversion
DUPIC Transport
DUPIC Interim storage
PWR Fab.
DUPIC Fab. Cosl
Enrichment
Uranium(U3O8)
0.00 0.30 0.40 0.S0
Rank Correlation Coefficient
DUPIC Fuel Cycle
CANDU Conversion
CANDU Disposal
0.20 0.30 0.40 0.50 0.60
Rank Correlation Coefticient
Once-through Cycle
0.70 0.80
Fig. 6.4-10 Sensitivity of Fuel Cycle Component for Option 1
- 733 -

KAERI/RR-1999/99
Plant Modification
DUPIC Disposal
PWR Conversion
DUPIC Interim storage
0.00 0.10 0.20 0.30 0.40 0.50 0.60
Rank. Correlation Coefficient
DUPIC Fuel Cycle
CANDU Conversion
CANDU Disposal
CANDU Fab.
PWR Conversion
CANDU Interim Stor.
PWR Disposal
PWR Interim Storaoe
PWR Fab.
Enrichment
Uranium(U3O8)
0.30 0.40 0.50 0.60
Rank Correlation Coelficient
Once-through Cycle
o.7o o.ao
Fig. 6.4-11 Sensitivity of Fuel Cycle Component for Option 2
- 734 -

KAERI/RR-1999/99
Plant Modification
DUPIC Disposal
PWR Conversion
DUPIC Interim storage
DUPIC Transport
PWR Fab.
DUPIC Fab. Cost
Enrichment
Uranium (U3O8) mmmmmmmmmmmmm0.30 0.40 0.50
Rank Correlation Coefficient
DUPIC Fue! Cycle
CANDU Conversion
CANDU Disposal
PWR Conversion
CANDU Fab.
CANDU Interim Stor.
PWR Disposal
PWR interim Storage
PWR Fab.
Enrichment
Uranium (U3O8)
m t
:•
§) !;
i0.10 0.20 0.30 0.40 0.50 0.60
Rank Correlation Coefficient
Once-through Cycle
0.70 0.80
Fig. 6.4-12 Sensitivity of Fuel Cycle Component for Option 3
- 735 -

KAERI/RR-1999/99
Uranium(U3O8)(728.31 klb)
Uranium(U3O8)(249.51 klb)
PWR(39.36 MTU)
CANDU(94.55 MTU)
Disposal(39.36 MTHM)
Disposal(94.55 MTHM)
(Once-Through Fuel Cycle)
Uranium(U3OS)(728.31 klb)
Uranium(U3O8)(57.24 k Ib)
PWR(39.36 MTU)
K SEU:6.5% .DU:10.8%
r
CANDU(47.59 MTU)
Disposal(47.59 MTHM)
Equilibrium core ratio = 1.70Uranium saving rate of DUPIC fuel cycle : 19.7%Disposal reduction rate of DUPIC fuel cycle : 64.5%
(DUPIC Fuel Cycle)
Fig. 6.4-13 Natural Uranium Saving and Spent Fuel Reduction for DUPIC Fuel Option 1
(based on annual requirement of one CANDU reactor)
- 736 -

KAERI/RR-1999/99
Uranium(U3O8)(874.19klb)
Uraniutn(U3O8)(249.51 klb)
PWR(47.24 MTU)
CANDU(94.55 MTU)
Disposal(47.24 MTHM)
Disposal(94.55 MTHM)
(Once-Through Fuel Cycle)
Uranium(U3O8)(874.19 klb)
Uranium(U3O8) 1 ^SEU(20.81 k lb) | DU:1
PWR(47.24 MTU)
2.3% w. 1 %
r
CANDU(48.90 MTU)
Disposal(48.90 MTHM)
Equilibrium core ratio = 2.04Uranium saving rate of DUPIC fuel cycle : 20.04%Disposal reduction rate of DUPIC fuel cycle : 65.5%
(DUPIC Fuel Cycle)
Fig. 6.4-14 Natural Uranium Saving and Spent Fuel Reduction for DUPIC Fuel Option 2
(based on annual requirement of one CANDU reactor)
- 737 -

KAERI/RR-1999/99
Uranium(U3O8)(852.07 k Ib)
Uranium(U3O8)(249.51 klb)
W
PWR(46.05 MTU)
CANDU(94.55 MTU)
Disposal(46.05 MTHM)
Disposal(94.55 MTHM)
(Once-Through Fuel Cycle)
Uranium(U3O8)(852.07 k tb)
Uranium(U3O8)(Oklb)
^ S E UDU:
PWR(46.05 MTU)
0% w
r
CANDU(46.05 MTU)
Disposal(46.05 MTHM)
Equilibrium core ratio = 1.99Uranium saving rate of DUPIC fuel cycle: 22.7%Disposal reduction rate of DUPIC fuel cycle : 67.2%
(DUPIC Fuel Cycle)
Fig. 6.4-15 Natural Uranium Saving and Spent Fuel Reduction for DUPIC Fuel Option 3
(based on annual requirement of one CANDU reactor)
- 738 -

KAERI/RR-1999/99
6.5 ^ J L ^ r t S
1. J.S. LEE et al., "Research and Development Program of KAERI for DUPIC (Direct Use
of Spent PWR Fuel in CANDU Reactors)," Proceedings of International Conference and
Technology Exhibition on Future Nuclear System: Emerging Fuel Cycles and Waste Disposal
Options, GLOBAL'93, Seattle, 1993.
2. MS. YANG et al. "Conceptual Study on the DUPIC Fuel Manufacturing Technology,"
Proceedings of International Conference and Technology Exhibition on Future Nuclear System:
Emerging Fuel Cycles and Waste Disposal Options, GLOBAL'93, Seattle, 1993.
3. H.B. CHOI, B.W. RHEE, H.S. PARK, "Physics Study on Direct Use of Spent PWR Fuel
in CANDU (DUPIC)," Nucl. Sci. Eng.: 126, pp.80-93, 1997.
4. C.J. JEONG and H.B. CHOI, "Compatibility Analysis on Reactivity Devices for Direct Use
of Spent Pressurized Water Reactor Fuel in CANDU Reactors (DUPIC)," Nucl. Sci. Eng.:
134, pp. 1-16, 2000.
5. The Economics of the Nuclear Fuel Cycle, Organization for Economic Cooperation and
Development/Nuclear Energy Agency, 1993.
6. H.S. PARK, "A Study on the Direct Use of Spent PWR Fuel in CANDU (Phase 1 Feasibility
Study)," KAERI/RR-1244/92, Korea Atomic Energy Research Institute, pp.151-181, 1993.
7. T.R. THOMAS, "AIROX Nuclear Recycling and Waste Management," Proceedings of
International Conference and Technology Exhibition on Future Nuclear System: Emerging
Fuel Cycles and Waste Disposal Options, GLOBAL'93, Seattle, 1993.
8. Y.G. LEE, H.R. CHA, J.S. HONG, H.O. MENLOVE and P.M. RINARD, "Development
of DUPIC Safeguards Neutron Counter," Proceedings of the Institute of Nuclear Materials
Management, 38th Annual Meeting, Pheonix, 1997.
- 739 -

KAERI/RR-1999/99
9. J.T. THOMAS, "Nuclear Safety Guide, TID-7016 (Rev. 2)," NUREG/CR-0095, Oak Ridge
National Laboratory, 1978.
10. H.B. CHOI, J.W. CHOI, M.S. YANG, "Composition Adjustment on Direct Use of Spent
Pressurized Water Reactor Fuel in CANDU," Nucl. Sci. Eng.: 131, pp.62-77, 1999.
11. R.K. NAKAGAWA, " New DUPIC Fuel Loading System Feasibility Study," DUPIC-
AC-RT-01, Atomic Energy of Canada Limited, May 1992.
12. R. BOYD and D.J. KOIVISTO, "An Assessment of Fuel Handling Systems for DUPIC
Fuel in CANDU 6," DUPIC-AE-030, Atomic Energy of Canada Limited, August 1998.
13. AECL document, "Design Manual - Fuelling Machine D2O Control System," 86-35230-
DM-001, Rev.l, Atomic Energy of Canada Limited, 1999.
14. AECL document, "Design Requirement - Spent Fuel Bay Cooling and Purification System,"
86-34410-DR-001, Rev.2, Atomic Energy of Canada Limited, 1997
15. J.Y LEE, A. BALDOR, "Design Manual: Spent Fuel Storage Wolsong NPP 234," 86-35360-
DM-001, Rev.l, Atomic Energy of Canada Limited, 1996.
16. G.R. SIMMONS and P. BAUMGARTNER, "The Disposal of Canadas Nuclear Fuel Waste:
Engineering for a Disposal Facility," AECL-10715, Atomic Energy of Canada Limited, 1994.
17. C.S. KANG et al., "Survey and Analysis of the Domestic Technology Level for the Concept
Development of High Level Waste Disposal," KAERI/CM-231/98, Korea Atomic Energy
Research Institute, 1998.
18. The Cost of High Level Waste Disposal in Geological Repositories An Analysis of Factors
Affecting Cost Estimate, Organization for Economic Cooperation and Development/Nuclear
Energy Agency, 1993.
- 740 -

KAERI/RR-1999/99
19. R.J. ELLIS, "Sensitivity of the DUPIC CANDU-Stage Burnup to PWR Model
Representations," DUPIC-AE-004, Atomic Energy of Canada Limited, 1996.
20. Y. ATES and P. BAUMGARTNER, "Preliminary Disposal Cost Comparison of Spent PWR,
CANDU-NU and CANDU-DUPIC Fuels," RC-1879, DUPIC-AE-025, Atomic Energy of
Canada Limited, 1997.
21. The Fourth Long-term Supply and Demand Plan of Nuclear Energy (1998-2015), MOCIE
Notice No. 1998-93, Korean Ministry of Commerce, Industry and Energy, 1998.
22. Y.K. YOON, "A Study on the Formulation of Long-term Nuclear Energy Policy Direction
for Korea," Korean Nuclear Society, Korea Ministry of Science and Technology, 1994.
23. S.H. CHANG, "A Study on the Establishment of Comprehensive Promotion Plan for
Utilization, Research and Development of Nuclear Energy," Korean Nuclear Society, Korea
Ministry of Science and Technology, 1994.
24. "Radioactive Waste Management Plan in Korea," the 249th AEC, Korean Atomic Energy
Commission, 1998.
25. K.Y. LEE, Y.D. WHANG, J. LEE and Y.I. KIM, "Establishment of the Phase II NSSS
Development Plan for the Next Generation Reactor," KAERI/TR-592/95, Korea Atomic
Energy Research Institute, 1995.
26. K.D. SONG, M.K. LEE, K.H. MOON, S.S. KIM and B.R. LEE, "Economic Evaluation
of Nuclear Fuel Cycle in Korea," KAERI/RR-1687/96, Korea Atomic Energy Research
Institute, 1996.
27. H. CHOI, W.I. KO, and M.S. YANG, "Reactivity Control Method for Direct Use of Spent
Pressurized Water Reactor Fuel in CANDU Reactors (DUPIC)," Nitcl. Sci. Eng., June, 2000.
28. W.I. KO, J.W. CHOI, H.B. CHOI, J.S. LEE, and J.H. WHANG, "Development of the
- 741 -

KAERI/RR-1999/99
Combination Method for Minimizing Composition Variability of DUPIC Fuel Feedstock,"
Proceedings of Korean Nuclear Society Autumn Meeting, Seoul (1998).
29. J.W. CHOI, W.I. KO, J.S. LEE, M.S. YANG, and H.S. PARK, "Cost Assessment of a
Commercial Scale DUPIC Fuel Fabrication," Proceedings of the 6th International Conference
on Radioactive Waste Management and Environmental Remediation, Singapore (1997).
30. B.G. NA and I. NAMGUNG, "Assessment of Wolsong NPP Fuel Handling System for DUPIC
Fuel," KAERI/CM-347/99, Korea Atomic Energy Research Institute (2000).
31. H.S. PARK, S.W. PARK and W.I. KO, "The Construction of an Interim Spent Fuel Storage
Facility," KAERI-NEMAC/PR-35/94, Korea Atomic Energy Research Institute (1994).
32. W.I. KO, H. CHOI, and M.S. YANG, "Cost Evaluation for Disposal of Spent DUPIC Fuel,"
KAERI/TR-1440/99, Korea Atomic Energy Research Institute (1999).
33. W.I. KO, J.W. CHOI, C.H. KANG, J.S. LEE, and K.J. LEE, "Nuclear Fuel Cycle Cost
Analysis Using a Probabilistic Simulation Technique," Annals of Nuclear Energy, Vol. 25,
pp.771-789 (1998).
34. W.I. KO, J.W. CHOI, J.S. LEE, H.S. PARK and K.J. LEE, "Uncertainty Analysis in DUPIC
Fuel Cycle Cost Using A Probabilistic Simulation Method," Nuclear Technology, Vol. 127,
pp. 123-140 (1999).
35. D. VOSE, Quantitative Risk Analysis: A Guide Monte Carlo Simulation Modeling, pp.165-168,
John Wiley and Sons, Inc., New York (1996).
36. M. EVANS, N. HASTINGS and B. PEACOCK, Statistical Distribution (2nd Edition),
pp.31-37, John Wiley and Sons, Inc., New York (1993).
- 742 -
KAERI/RR-1999/99
- 743 -

KAERI/RR-1999/99
fe DUPIC «j<££.;M 314s. ^ ^ ^ ^ 91 DUPIC *|«ig.sj ;§
DUPIC 3 #1
DUPIC
. DUPIC
DUPIC } ^
>. DUPIC
DUPIC
7H
DUPIC
fe DUPIC
- 745 -
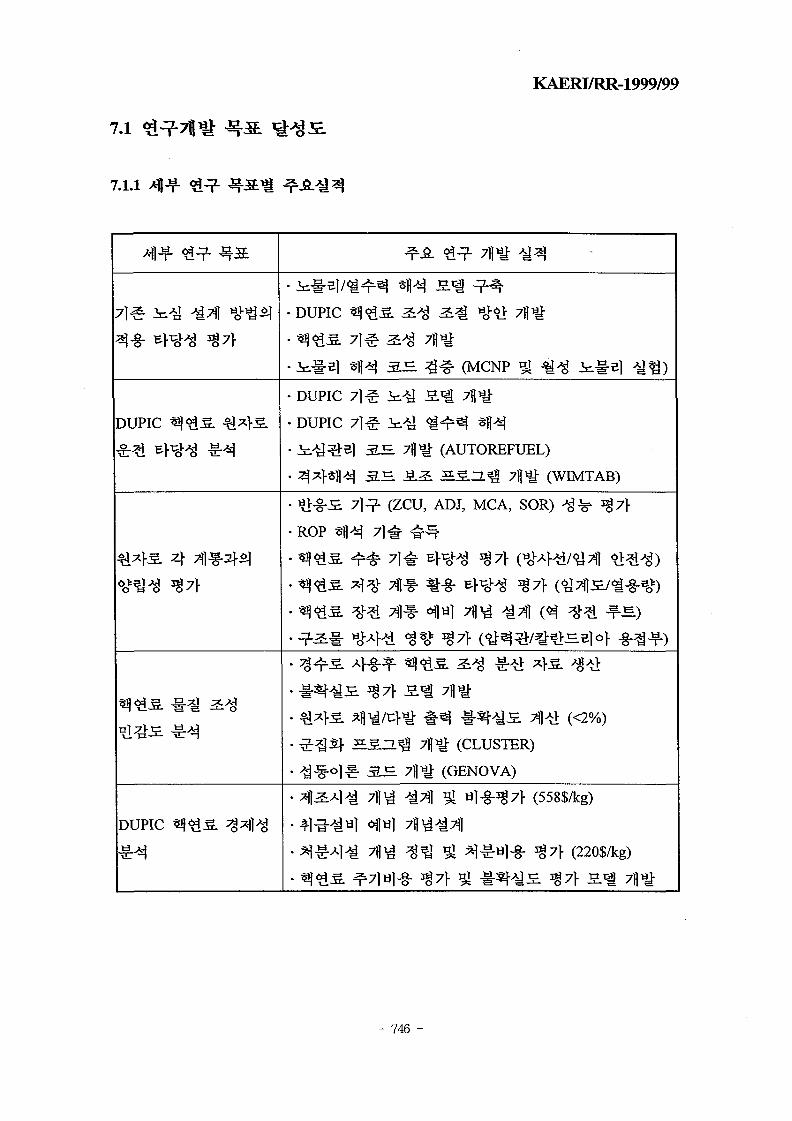
KAERI/RR-1999/99
7.1
7.1.1
AI]J=L <^^2. ^ . ^
DUPIC ^ ^ 1 5 . TI^I-S-
DUPIC ^ < g S ^^11^
• DUPIC
. M ( 4 ^
* ' > T " S ' B |
• DUPIC
• DUPIC
• SV-S-S:
•ROP *
7 ] ^ . ^ . ^ 7
7|.g. i->y <:
71^- (ZCU,
H 71^ ^
- c* yfi - f| 5
^ 7fl^ ^ 7 j
«1 ^«1 711^
^ 7fl^ ^ ^
- W 7B «
3 ^ (MCNP gj ^ ^ Jbc#5l - y ^ )
• (AUTOREFUEL)
. £ S . Z ^ 7H^ (WIMTAB)
ADJ, MCA, SOR) ^ ^ s§7l-
HI 1 7i |^ ^7^1 ( ^ ^-^. Jf-S)
l^t (CLUSTER)
t (GENOVA)
1 91 ul-§-^7l- (558$/kg)
! i i ^^"Wl-§- 3§7V (220$/kg)
- 746 -

KAERI/RR-1999/99
7.1.2 fl S ^ ^ ^ 1
7.1.2.1 7)^- i ^ *4X] ^ S ] ^-g-
DUPIC
^ DUPIC
WIMS
7.1.2.2 DUPIC
7.1.2.3
^r DUPIC
DUPIC ii^ofl-HS. ^>b*W ^°1- DUPIC
3 . Sa^l-. ZL5ii4 DUPIC Jn^6U^
Bt> Sfl^ ly-oVo] ^.^-sjt:!-. DUPIC
^ , DUPIC
- 747 -
o} ^ ^
37)7}

KAERI/RR-1999/99
7.12A
DUPIC
DUPIC
7.1.2.5 DUPIC
OECD/NEA
DUPIC
DUPIC
fe DUPIC
DUPIC
3.B.S.
- 748 -

KAERI/RR-1999/99
7.1.3
7.1.3.1
i*rvi£
(1997)
3
7
5
(1998)
8
5
**\
2
8
(1999)
8
2
7
10 19
14
**\
9
23
7.1.3.2 SCI
1. D.H. Kim, J.K. Kim, and H.B. Choi, "A Generalized Perturbation Theory Program for CANDU
Core Analysis", Annals of Nuclear Energy, June 2000.
2. C.J. Jeong and H.B. Choi, "Instability of Xenon Spatial Oscillation in a CANDU-6 Reactor
with DUPIC Fuel", Annals of Nuclear Energy, May 2000.
3. H.B. Choi, W.I. Ko and M.S. Yang, "Reactivity Control Method for Direct Use of Pressurized
Water Reactor Fuel in CANDU Reactors (DUPIC)", Nucl. Sci. Eng., June 2000.
4. Hyung-Seok Lee, Won Sik Yang, Man Gyun Na and Hangbok Choi, A Pin Power
Reconstruction Method for CANDU Reactor Cores Based on Coarse-Mesh Finite Difference
Calculations, Nuclear Technology: 130, pp. 1-8, April 2000.
5. C.J. Jeong and H.B. Choi, "Compatibility Analysis on Existing Reactivity Devices in CANDU
6 Reactors for DUPIC Fuel Cycle", Nucl. Sci. Eng.: 134, pp.265-280, March 2000.
6. Chang Joon Jeong and Hangbok Choi, "Xenon transient analysis for direct use of spent
pressurized water reactor fuel in CANDU reactors (DUPIC)", Annals of Nuclear Energy, Vol.27,
pp.269-278, Dec. 1999.
7. Hangbok Choi, "A fast-running fuel management program for a CANDU reactor", Annals
of Nuclear Energy, Vol.27, pp.1-10, Sept. 1999.
- 749 -

KAERI/RR-1999/99
8. H.B. Choi, J. W. Choi, M.S. Yang, "Composition Adjustment on Direct Use of Spent Pressurized
Water Reactor Fuel in CANDU", Nitcl. Sci. Eng.: 131, pp.62-77, Jan. 1999.
9. Jee-Won Park, "A subchannel analysis of DUPIC fuel bundles for the CANDU reactor", Annals
of Nuclear Energy, Vol. 26, pp.29-46, Jan. 1999.
7.1.3.3
1. Dongwhan Park, Hangbok Choi and Changjoon Jeong, "Assessment of CANDU Physics
Analysis Tools Using Measurement Data of Wolsong Nuclear Power Plant 2, The 2000 ANS
International Topical Meeting on Advances in Reactor Physics and Mathematics and Computation
into the Next Millennium, PHYSOR2000, Pittsburgh, May 7-11, 2000.
2. D.H. Kim, J.K. Kim, and H.B. Choi, "A Sensitivity Method for CANDU Core Analysis,
The 2000 ANS International Topical Meeting on Advances in Reactor Physics and Mathematics
and Computation into the Next Millennium, PHYSOR2000, Pittsburgh, May 7-11, 2000.
3. Hangbok Choi and Jee-Won Park, "Power Coefficient Calculation of a CANDU Reactor",
Sixth International Conference on CANDU Fuel, Niagara Falls, Sept. 26-30, 1999.
4. C.J. Jeong and H.B. Choi, "Analysis of Xenon Spatial Oscillation in a CANDU-6 Reactor
with DUPIC Fuel", Sixth International Conference on CANDU Fuel, Niagara Falls, Sept. 26-30,
1999.
5. Gyuhong Roh and Hangbok Choi, "Benchmark Calculations for CANDU Fuel Bundles", Proc.
Mathematics and Computation, Reactor Physics and Environmental Analysis in Nuclear
Applications, Madrid, Sept. 26-31, 1999.
6. Hangbok Choi and Jee-Won Park, "Comparison of Reactivity Feedback due to Power Level
Change of a CANDU Reactor", Proc. Mathematics and Computation, Reactor Physics and
Environmental Analysis in Nuclear Applications, Madrid, Sept. 26-31, 1999.
7. Hangbok Choi, Won Ik Ko, Myung S. Yang, "Comparison of DUPIC Fuel Composition
Heterogeneity Control Methods", Proc. International Conference on Future Nuclear System:
GLOBALr99, Jackson Hole, Aug. 29 - Sept. 3, 1999.
8. Chang-Joon Jeong and Hangbok Choi, "Xenon Characteristics of Spent PWR Fuel in a
CANDU-6 Reactor", Tran. Am. Nucl. Soc, Vol.80, Boston, June 6-10, 1999.
9. C.J. Jeong and H.B. Choi, "Assessment of Reactivity Devices for a CANDU 6 Reactor with
spent PWR Fuel", Tran. Am Nucl. Soc, Vol.80, Boston, June 6-10, 1999.
- 750 -

KAERI/RR-1999/99
10. J.-W. Park, K.M. Chae, and H. Choi, "ASSERT-PV Simulations of Two-Phase Flow in
Horizontal and Vertical Subchannels", 20th Annual Conference of the Canadian Nuclear Society,
Montreal, May 30 - June 2, 1999.
11. Hangbok Choi, Jongwon Choi, Won II Ko, Jae Sol Lee, "Preliminary Study on Sensitivity
of DUPIC Fuel Cycle Cost to Fuel Composition", Int. Conf. on the Physics of Nuclear Science
and Technology, Long Island, New York, Oct. 5-8, 1998.
12. G.H. Roh and H.B. Choi, "Assessment of DUPIC Physics Calculation by MCNP", Int. Conf.
on the Physics of Nuclear Science and Technology, Long Island, New York, Oct. 5-8, 1998.
13. Jee-Won Park, Hangbok Choi, "The Effect of Channel Flow Reduction on Thermal
Performance of DUPIC Fuel Bundle Strings in the CANDU Reactor", Int. Conf. on the Physics
of Nuclear Science and Technology, Long Island, New York, Oct. 5-8, 1998.
14. Gyuhong Roh and Hangbok Choi, "One-Dimensional Analysis of CANDU Primary Shield
for DUPIC Fuel", Int. Conf. on the Physics of Nuclear Science and Technology, Long Island,
New York, Oct. 5-8, 1998.
15. Do Heon Kim, Jong Kyung Kim, Hangbok Choi, Gyuhong Roh, Won Sik Yang, "Development
of a Generalized Perturbation Program for a CANDU Reactor", Int. Conf. on the Physics of
Nuclear Science and Technology, Long Island, New York, Oct. 5-8, 1998.
16. Jee-Won Park and Hangbok Choi, "An Analysis of Void Fraction Propagation in Two-Phase
Flow Through Multiple Flow Channels", Proc. of 33rd Intersociety Energy Conversion Eng.
Conf., IECEC98, Colorado Springs, Colorado, Aug. 2-6, 1998.
17. Hangbok Choi and Jee-Won Park, "Nuclear Characteristics of Spent Pressurized Water Reactor
Fuel in a Heavy Water Reactor", Proc. of the 6th Int. Conf. on Nucl. Eng., ICONE-6, San
Diego, California, May 10-14, 1998.
18. Jee-Won Park and Hangbok Choi, "Thermal Behaviors of Proposed DUPIC Fuel Bundle
in the CANDU Reactor", Proc. of the 6th Int. Conf. on Nucl. Eng., ICONE-6, San Diego,
California, May 10-14, 1998.
19. Pritam D. Krishnani, Hangbok Choi, Chang J. Jeong, "Method of Calculating the Effect
of Heterogeneous Fuel Composition on a Fuel Bundle Power Ramp", Tran. Am. Nucl. Soc,
Vol.77, Albuquerque, Nov. 16-20, 1997.
20. H.B. Choi, G.H. Roh, J.W. Park, "CANDU Core Analysis with Spent PWR Fuel of Fixed
235U and 239Pu Content", Tran Am. Nucl Soc, Vol.77, Albuquerque, Nov. 16-20, 1997.
21. Hangbok Choi, Gyu H. Roh, Ho H. Lee, "Sensitivity Study on DUPIC Fuel Composition",
- 751 -

KAERI/RR-1999/99
Int. Conf. on Future Nuclear Systems: GLOBAL'97, Yokohama, Japan, Oct. 5-10, 1997.
22. Hangbok Choi, Gyu H. Roh, Chang J. Jeong, Bo W. Rhee, Jong W. Choi, C.R. Boss,
"Preliminary Assessment on Compatibility of DUPIC Fuel with CANDU-6", Int. Conf. on Future
Nuclear Systems: GLOBAL'97, Yokohama, Japan, Oct. 5-10, 1997.
23. Jee-Won Park and Hangbok Choi, "Assessment of Average Thermal-Hydraulic Governing
Equations Used in PWR/PHWR System Design and Safety Analysis", Eighth Int. Topical Meeting
on Nuclear Reactor Thermal-Hydraulics: NURETH-8, Kyoto, Japan, Sept. 30 - Oct. 4, 1997.
7.1.3.4
1. Dongwhan Park and Hangbok Choi, Assessment of WIMS-AECL using Physics Measurement
of Wolsong-2 Reactor, Proc. of the Korean Nuclear Society Autumn Meeting, Seoul, Korea,
Oct. 29-30, 1999.
2. Do Heon Kim, Jong Kyung Kim and Hangbok Choi, GPT Estimation of Unconstrained
Sensitivity Coefficients for CANDU Core Analysis, Proc. of the Korean Nuclear Society Autumn
Meeting, Seoul, Korea, Oct. 29-30, 1999.
3. Hyug-Seok Lee, Won Sik Yang, Man Gyun Na, and Hangbok Choi, A Pin Power
Reconstruction Method for CANDU Reactor Cores, Proc. of the Korean Nuclear Society Autumn
Meeting, Seoul, Korea, Oct. 29-30, 1999.
4. G.H. Roh and H.B. Choi, "Reactivity Coefficient Calculation of CANDU Fuel Lattices by
MCNP", Proc. of the Korean Nuclear Society Spring Meeting, Pohang, Korea, May 28-29, 1999.
5. H.B. Choi and W.I. Ko, "Reactivity Control Option for DUPIC Fuel by Natural Uranium",
Proc. of the Korean Nuclear Society Spring Meeting, Pohang, Korea, May 28-29, 1999.
6. Hangbok Choi, "Power Coefficient Calculation of a CANDU Reactor", Proc. of the Korean
Nuclear Society Spring Meeting, Pohang, Korea, May 28-29, 1999.
7. Chang-Joon Jeong and Hangbok Choi, "Damping Analysis of Xenon Oscillation in CANDU-6
Reactor with DUPIC Fuel", Proc. of the Korean Nuclear Society Spring Meeting, Pohang, Korea,
May 28-29, 1999.
8. Chang-Joon Jeong, Jee-Won Park and J. Pitre, "Preliminary ROP Assessment for CANDU-6
with DUPIC Fuel", Proc. of the Korean Nuclear Society Spring Meeting, Pohang, Korea, May
28-29, 1999.
9. C.J. Jeong and Hangbok Choi, "Xenon Load Analysis for CANDU-6 with DUPIC Fuel",
752 -

KAERI/RR-1999/99
Proc. of the Korean Nuclear Society Autumn Meeting, Seoul, Korea, Oct. 30-31 1998.
10. C.J. Jeong and Hangbok Choi, "Assessment of Reactivity Devices for CANDU-6 with DUPIC
Fuel", Proc. of the Korean Nuclear Society Autumn Meeting, Seoul, Korea, Oct. 30-31 1998.
11. Do H. Kim, Jong K. Kim, Hangbok Choi, Gyuhong Roh, Won Sik Yang, "Estimation of
CANDU Reactor Zone Controller Level by Generalized Perturbation Method", Proc. of the Korean
Nuclear Society Autumn Meeting, Seoul, Korea, Oct. 30-31 1998.
12. Do H. Kim, Jong K. Kim, Hangbok Choi, Gyuhong Roh, Won Sik Yang, "A Generalized
Perturbation Program for CANDU Reactor", Proc. of the Korean Nuclear Society Spring Meeting,
Suwon, Korea, May 29, 1998.
13. Hangbok Choi, Gyuhong Roh, "A Sensitivity Study on Neutronics Performances of DUPIC
Fuel", Proc. of the Korean Nuclear Society Spring Meeting, Suwon, Korea, May 29, 1998.
14. Jee-Won Park, Hangbok Choi, Bo W. Rhee, "Enthalpy and Void Distributions in Subchannels
of PHWR Fuel Bundles", Proc. of the Korean Nuclear Society Spring Meeting, Suwon, Korea,
May 29, 1998.
15. Gyuhong Roh, Hangbok Choi, "Benchmark Calculation of CANDU End Shielding System",
Proc. of the Korean Nuclear Society Spring Meeting, Suwon, Korea, May 29, 1998.
16. Hangbok Choi, "MCNP Basic Features", * H ^ * H M 1 * 1 - S l 1998*d *\] 165] ^7fl«]-
^ U S ] , tfl*l, April 1998.
17. Jee-Won Park, Gyu-hong Roh, Hangbok Choi, "Inconsistency in the Average Hydraulic
Models Used in Nuclear Reactor Design and Safety Analysis", Proc. of the Korean Nuclear
Society Autumn Meeting, Taegu, Korea, Oct. 1997.
18. Gyuhong Roh, Hangbok Choi, Jee-Won Park, "Sensitivity Analysis on Various Parameters
for Lattice Analysis of DUPIC Fuel with WIMS-AECL Code", Proc. of the Korean Nuclear
Society Autumn Meeting, Taegu, Korea, Oct. 1997.
19. Do H. Kim, Jong K. Kim, Hangbok Choi, Gyuhong Roh, In H. Jeong, "Fission Product
Inventory Calculation with CASMO-ORIGEN-Coupled Program", Proc. of the Korean Nuclear
Society Autumn Meeting, Taegu, Korea, Oct 1997.
7.1.3.5
1. Won II Ko, Hangbok Choi and Myung Seung Yang, Cost Evaluation for Disposal of Spent
DUPIC Fuel, KAERI/TR-1440/99, Dec. 1999.
- 753

KAERI/RR-1999/99
2. Gyuhong Roh and Hangbok Choi, "Assessment of Neutron Transport Codes for Application
to CANDU Fuel Lattice Calculation", KAERI/TR-1377/99, August 1999.
3. Won HKo, Hangbok Choi and Myung S. Yang, "Cost Evaluation of a Commercial-Scale
DUPIC Fuel Fabrication Facility (Part III) - Appendix", KAERI/TR-1374/99, August 1999.
4. Won II Ko, Hangbok Choi and Myung S. Yang, "Cost Evaluation of a Commercial-Scale
DUPIC Fuel Fabrication Facility (Part II) - Preliminary Conceptual Design", KAERI/TR-1373/99,
August 1999.
5. Won II Ko, Hangbok Choi and Myung S. Yang, "Cost Evaluation of a Commercial-Scale
DUPIC Fuel Fabrication Facility (Part I) - Summary", KAERI/TR-1372/99, August 1999.
6. Hangbok Choi, "Composition Heterogeneity Analysis for DUPIC Fuel (I) - Statistical Analysis",
KAERI/TR-1371/99, August 1999.
7. Hangbok Choi and Won II Ko, "Comparison of DUPIC Fuel Composition Heterogeneity
Control Method", KAERI/TR-1370/99, August 1999.
8. Hangbok Choi, Gyuhong Ron, and Do H. Kim, "DUPIC Fuel Cycle Economics Assessment
(II)", KAERI/AR-537/99, April 1999.
9. Hangbok Choi, Gyuhong Ron, and Do H. Kim, "DUPIC Fuel Cycle Economics Assessment
(I)", KAERI/AR-535/99, April 1999.
10. Hangbok Choi, "Power Coefficient Calculation of a CANDU Reactor", KAERI/TR-1246/99,
March 1999.
11. G.H. Roh and H.B. Choi, "MCNP Tutorials and Samples", KAERI/TR-1219/99, Feb. 1999.
12. Chang-Joon Jeong and Hangbok Choi, "Assessment of CANDU-6 Reactivity Devices for
DUPIC Fuel", KAERI/TR-1160/98, November 1998.
13. Chang-Joon Jeong and Hangbok Choi, "Xenon Load Analysis for CANDU 6 with DUPIC
Fuel", KAERI/TR-1132/98, September 1998.
14. Jee-Won Park and Hangbok Choi, "A Development of Two-Fluid Multifield Model for Low
Quality Boiling Transition Simulations", KAERI/TR-1127/98, September 1998.
15. Hangbok Choi, "A Method to Calculate the Effect of Heterogeneous Composition on Bundle
Power", KAERLTR-1126/98, September 1998.
16. Hangbok Choi, "Nuclear Data Uncertainty Analysis on a Minor Actinide Burner for
Transmuting Spent Fuel", KAERI/TR-1112/98, August 1998.
17. Hangbok Choi, "Neutronics Design Study on a Minor Actinide Burner for Transmuting Spent
Fuel", KAERI/TR-1111/98, August 1998.
754 -

KAERI/RR-1999/99
18. Gyuhong Roh and Hangbok Choi, "Assessment of CANDU Primary Shield System for DUPIC
Fuel", KAERI/TR-1056/98, May 1998.
19. Hangbok Choi, Gyuhong Roh, "A Sensitivity Study on DUPIC Fuel Composition",
KAERI/TR-942/97, Jan. 1998.
20. Jee-Won Park, "An Assessment of Thermal Behavior of the DUPIC Fuel Bundle by
Subchannel Analysis", KAERI/TR-938/97, Dec. 1997.
21. Jee-Won Park, Gyuhong Roh, "A Review of Critical Heat Flux Prediction Technique and
Its Application in CANDU Reactor", KAERI/AR-473/97, Sept. 1997.
7.1.3.6 HS-2.
1. ^S - t i , £ } % ^ , CALCON, 99-01-12-6348,
1999.12.31.
2. ^S- tL ^ % ^ , GENOVA, 99-01-12-6349,
1999.12.31.
3. a ) % ^ , WIMTAB, 98-01-12-4011, tH^^SS.ZL 'gJ iL^ lS ' ] , 1998.8.1.
4. 3 ^ - 4 , NINEM, 98-01-12-4010, S H ^ ^ B J H S U ' S J i ^ , 1998.8.1.
5. ^ 1 % ^ , CONEX, 98-01-12-4009, *H-£-*fBlHSll3i.&3LSl, 1998.8.1.
6. ^1 % ^ , VOPT, 98-01-12-4008, *>^ |#BiHS^H3.eJLS| , 1998.8.1.
7. Jfc^gP, ^ % ^ , ANSGEN, 98-01-12-4007, S H ^ ^ S S H ' g J i S L S I , 1998.8.1.
8. i ] % ^ , FIXCOM, 97-01-12-6355, ^^ -Sf lHHSH^JLSLi l , 1997.12.24.
9. i | ^ 4 , WIMPRO, 97-01-12-6354, t>^-^-^-B]HSll^AaLSI, 1997.12.24.
10. 5 ] % ^ , Jn-3^F, WIMKIN, 97-01-12-5226,
1997.11.7.
11. ^ % ^ , ii^rHF, CLUSTER, 97-01-12-5225,
1997.11.7.
12. 5 ] % ^ , AUTOREFUEL, 97-01-12-4685, ^ ^ - ^ ^ ^ = ^ 1 1 ^ ^ 1 3 : 5 1 , 1997.10.16.
13. o l^^- , ^ ^ S - , Q*^, RSTORE, 97-01-12-4684, * > ^ - ^ ^ B l S S . - L ^ J E L ^ ,
1997.10.16.
14. 3 1 ^ 4 , ic^~^, COCUP, 97-01-12-4683, SH*g-^s tS -L 'g . e jL3 | , 1997.10.16.
- 755 -

KAERI/RR-1999/99
7.2
7.2.1
7.2.1.1
DUPIC ROP
DUPIC
7.2.1.2
DUPIC
7.2.1.3
DUPIC
DUPIC
71
DUPIC
- 756

KAERI/RR-1999/99
DUPIC
7.2.2
7.2.2.1 ? gfl o
7f. WIMS-AECLS]
Temperature Coefficient; FTC)^
3.71)
WIMS-AECL£J
3.5 wt% o
fe DUPIC
CANDU
7]
3 &
-. ° H ^^ 3 &
- 757 -

KAERI/RR-1999/99
. DUPIC
Phase-B
CANDU
7.2.2.2
7}. DUPIC
DUPIC
DUPIC
. DUPIC
H*I PPV H»J WIMS-AECL S ^
WIMS-AECL S H
719-
3.71 ^7||5lSdi;l-. DUPIC
3.7]
ofl . DUPIC
- 758

KAERI/RR-1999/99
7HJ-
(Minimum
acceptable performance specification; MAPS)
«]*B ife DUPIC
>. ROP
DUPIC , DUPIC
mapping
On-line
mapping
mapping ^S-fe- t||*l( . Flux
DUPIC
uf. nj-eM, D U P i C i ^ A i ^
- 759 -

KAERI/RR-1999/99
CANDU-6 4l }S.ofl>H DUPIC *}&§.# *£^}7] $M g 7fl£| DUPIC
7.2.2.3
7] nfl^-^, #*}3, 7>^>e] -f^:^ 4^«> ^A^f ^ ^ ^ S # -»g-i>*fe «o^
o]
DUPIC ? 4tcd^ofl, DUPIC
DUPIC
fe DUPICDUPIC
- 760 -

KAERI/RR-1999/99
CANDU
7.2.2.4
DUPIC CANDU
ASSERT-PV 3 H
7.2.2.5
DUPIC
7}. DUPIC
DUPIC
-, DUPIC
>, HelJL DUPIC ^71
fe- DUPIC
(15,000 MWd^TTHM <
L 5lfe DUPIC
- 761 -

KAERI/RR-1999/99
, DUPIC
o]
20%
DUPIC
DUPIC
20%
- 762 -

KAERI/RR-1999/99
7.23
7.2.3.1
DUPIC
DUPIC
DUPIC
DUPIC
DUPIC
DUPIC
DUPIC
DUPIC
DUPIC
DUPIC
DUPIC
- 763 -

KAERI/RR-1999/99
7.2.3.2
-7- $
*fl 14 to(00.4.-01.3.)
*fl 2 4 \ JE
(01.4.-02.3)
i ^ 6>^A^ (6QO/O)
(40%)
i ^ <>M^(60%)
*!*l7}7}Vg
•g-3 (40%)
S-T-Tim- q-g- £ ^ ^
• DUPIC ^^S.51 ^ 4 ^ *MA£N nl^fe
- SDS2 ^^^ ^6«ui ^ s ^ - ^ ^
- 4:a.*H (LOCA <y l AlUeli)
•DUPIC ^^^.51 i:4]^^l 7l#7llt
- i^Tiii- $# ^i^^s ^-^
• ^ l ^ a ^ DUPIC ^o|S.!- ;g ^g-71 # 4 ^ ;
- «}<2S i ^ o ^ J : 711 »j:
•DUPIC ^ < ^ S -g-g-SH- *\# 7]^}^^
- DUPIC ^ ^ ^ - ^ #x}3. 6O
V^^
- DUPIC ^<&S.o) ^-g-5f# ^lt>
•DUPIC « } ^ ^ ^ 4 K 3 . ^l^^-Hl n]*]^.
- 14 ?fl# A>3. sfl>J4
- 2 4 7|^- A}JI Sfl^
• DUPIC ^<g^£ | in^^Tll 7l^-7i|^
- ^a^^ ^ ^ ¥9i 9-. 5 ] ^ ^ A ^ D U P I C ^ 0 4 ^ ^ - ^ :§-3"7]^- 7B«i
- i ^ ^ . 4 JSL . ^71-
•DUPIC ^<&£. <&H\7\ 7 f ^ g 3§7l-
- ^^1 ^*17} §^J^ 2f^
- ^ ^ ti«i7> £.£ 4^"
- 764 -

KAERI/RR-1999/99
7 . 2 . 3 . 3 ^ 1 ^
51 DUPIC
. ^ ^ 3/4
-f- ^ £ S . S^o] DUPIC2]-
DUPIC
KOPECK
KOPECK ufl-f- o^^i# 3.3^*H ^T'-W] 6-t 1 .5^^# y f l ^ J L <^^- 7 ] ^ ^ 2
K 2*}
. DUPIC
DUPIC<H1
- 765 -

KAERI/ER-1999/99
7.2.3.4
10311(97.7-00.3)
•a
a
n\311
II311
3ii m
m 311
mI=I
311
—1
311
t_rn—I
2a a
\ as
- 766 -

INIS
KAERI/RR-1999/99
- DUPIC
(TR,
A]
2000. 3.
311 766 p. 3. 9XM 0 ), &-§-( ) 26 Cm.
^ f l ( ),o
^7](DUPIC fuel cycle) 7 l ^ ^ DUPIC «q<Sfi.^ 7 ] ^
DUPICDUPIC
, DUPICDUPIC
. DUPIC, DUPIC
^ DUPIC
CANDU DUPIC
S. CANDU, DUPIC,

BIBLIOGRAPHIC INFORMATION SHEETPerforming Org.
Report No.Sponsoring Org.
Report No.Standard Report No. INIS Subject Code
KAERI/RR-1999/99
Title/Subtitle | A Study on Direct Use of Spent PWR Fuel in CANDU Reactors
- DUPIC Fuel Compatibility Assessment
Project Managerand Department
Hangbok Choi (Nuclear Fuel Design Technology Development Team)
Researcher andDepartment
G.H. Rho, J.W. Park, C.J. Jeong, B.W. Rhee, S.S. Kim, W.I. Ko,W.K. Kim, J.W. Choi, J.S. Lee, K.H. Byun, J.J. Park, H.S. Kim, Y.O. Lee,K.J. Ahn, H.M. Lee, K.W. Moon, K.K. Bae, D.H. Kim, K.M. Chae,J.K. Kim, D.W. Park
PublicationPlace
Taejon Publisher KAERIPublication
Date2000. 3.
Page 766 p. 111. & Tab. Yes ( V ), No ( ) Size 26 Cm.
Note Nuclear Research and Development Program of MOST
ClassifiedOpen ( ), Restricted ( ),
Class Document, Internal Use Only ( V )Report Type Research Report
Sponsoring Org. Contract No.
Abstract (15-20 Lines)
The purpose of this study is to assess the compatibility of DUPIC (Direct Use of Spent PWR Fuelin CANDU Reactors) fuel with the current CANDU 6 reactor, which is one of the technology beingdeveloped to utilize the spent PWR fuel in CANDU reactors. The Phase I study of this projectincludes the feasibility analysis on applicability of the current core design method, the feasibilityanalysis on operation of the DUPIC fuel core, the compatibility analysis on individual reactor system,the sensitivity analysis on the fuel composition, and the economic analysis on DUPIC fuel cycle.The results of the validation calculations have confirmed that the current core analysis system isacceptable for the feasibility study of the DUPIC fuel compatibility analysis. The results of coresimulations have shown that both natural uranium and DUPIC fuel cores are almost the same from_the viewpoint of the operational performance. For individual reactor system including reactivitydevices, the functional requirements of each system are satisfied in general. However, because ofthe pronounced power flattening in the DUPIC core, the radiation damage on the critical componentsincreases, which should be investigated more in the future. The DUPIC fuel composition heterogeneitydoes not to impose any serious effect on the reactor operation if the fuel composition is adjusted.The economics analysis has been performed through conceptual design studies on the DUPIC fuelfabrication, fuel handling in a plant, and spent fuel disposal, which has shown that the DUPIC fuelcycle is comparable to the once-trough fuel cycle considering uncertainties associated with unit costsof the fuel cycle components. The results of Phase I study have shown that it is feasible to usethe DUPIC fuel in CANDU reactors without major changes in hardware. However further studiesare required to confirm the safety of the reactor under accident condition.
Subject Keywords
(About 10 words)
CANDU, DUPIC, Compatibility, Economics, Heterogeneity,
Uncertainty, Validation, Thermal-hydraulics, Radiation, Refueling


![Ok wk11 เทคนิคการแก้ปัญหาและตัดสินใจ [Compatibility Mode]](https://static.fdokumen.com/doc/165x107/63363f9e379741109e00f98f/ok-wk11-.jpg)
![Dr T Malakoutian.ppt [Compatibility Mode]](https://static.fdokumen.com/doc/165x107/63364bfed2b7284203084459/dr-t-malakoutianppt-compatibility-mode.jpg)


![Stephen Briggs [Compatibility Mode]](https://static.fdokumen.com/doc/165x107/6324c3005c2c3bbfa802dd10/stephen-briggs-compatibility-mode.jpg)


