Dr. Jeffrey A. Graves - Investor Relations
42
INVESTOR PRESENTATION | NOVEMBER 2017 Dr. Jeffrey A. Graves President and Chief Executive Officer
-
Upload
khangminh22 -
Category
Documents
-
view
3 -
download
0
Transcript of Dr. Jeffrey A. Graves - Investor Relations

INVESTOR PRESENTATION | NOVEMBER 2017
Dr. Jeffrey A. Graves President and Chief Executive Officer

Forward-looking statements
Statements in this presentation and in our comments that are not historical or current facts are
“forward-looking statements” as defined in the Private Securities Litigation Reform Act of 1995.
They reflect management’s current expectations or beliefs. We caution that future results could
differ materially from those in this presentation depending on many risk factors, some beyond
our control, including, but not limited to, those presented in the Company’s most recent SEC
Form 10-K and 10-Q reports. The Company disclaims any obligation to revise forward-looking
statements made today based on future information.
This presentation may also include reference to financial measures that are not calculated in
accordance with Generally Accepted Accounting Principles (GAAP). These measures may be
used to compare the operating performance of the Company over time. They should not be
considered in isolation or as a substitute for GAAP measures.
Page 2

Company snapshot
» Leading global supplier of high-performance
test and measurement systems and sensors
» Two business segments: Test and Sensors
» Test and Sensors businesses help
researchers, engineers and manufacturers
improve their product performance and reduce
time to market
» Celebrating over 50 years of serving our
customers
Page 3
Mission To be the leader in creating innovative
test and measurement solutions to
enable our customers’ success
Vision Through innovation and customer
service, create value to drive growth $788M $120M
2017 Revenue by Business
Sensors
Test64% 36%
2017 Adjusted EBITDA by Business
Sensors
Test52% 48%
1See reconciliation to nearest GAAP measure on page 41

MTS Systems customer value creation and
competitive advantages
» Test & Measurement solutions that
bring value to our customers’
products through:
– Enhanced precision
– Improved reliability
– Greater sustainability
– Superior safety
– Rapid delivery to market
» Differentiated technology and
application engineering expertise
» Deep long-term customer
relationships
» Industry-leading geographic
coverage spanning six continents
Page 4

Strong global footprint to support geographically diverse
customer base
Page 5
25% 35% 40% Asia
China = 22% of global
Europe Americas
Manufacturing Facilities
Sales & Service Affiliates
Business Partners
BP Coverage
GEOGRAPHIC COVERAGE
* Reported fiscal year 2017 revenue
BASED ON TOTAL REVENUE* OF $788M

MTS Segments and
Market Sectors

MTS operates under two segments and serves eight
distinct market sectors
» Test Segment - provides highly engineered testing systems
and services fueled by our customers’ spending on research
and new product development
– Sectors:
» Ground Vehicles ~48% of Test business
» Materials ~22% of Test business
» Structures ~12% of Test business
» Service ~18% of Test business
» Sensors Segment – provides high performance sensors
used for acceleration, position, vibration, motion, pressure
and force measurement, partially fueled by customers’
spending on research and new product development and
partially by industrial capacity utilization
– Sectors:
» Position ~37% of Sensors business
» Test ~35% of Sensors business
» Industrial ~19% of business
» Systems ~9% of Sensors business
Page 7
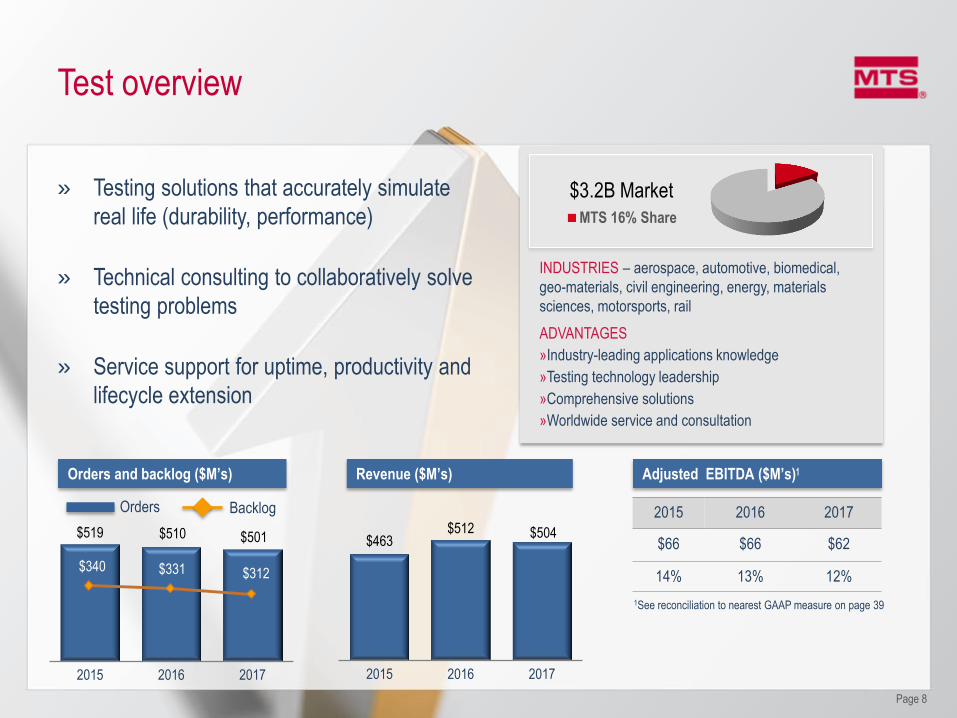
Test overview
» Testing solutions that accurately simulate
real life (durability, performance)
» Technical consulting to collaboratively solve
testing problems
» Service support for uptime, productivity and
lifecycle extension
Page 8
INDUSTRIES – aerospace, automotive, biomedical,
geo-materials, civil engineering, energy, materials
sciences, motorsports, rail
ADVANTAGES
»Industry-leading applications knowledge
»Testing technology leadership
»Comprehensive solutions
»Worldwide service and consultation
2015 2016 2017
$66 $66 $62
14% 13% 12%
1See reconciliation to nearest GAAP measure on page 39
Revenue ($M’s)
$463 $512 $504
2015 2016 2017
Adjusted EBITDA ($M’s)Orders and backlog ($M’s)
$519 $510 $501
2015 2016 2017
$340 $331 $312
Orders Backlog
MTS 16% Share
$3.2B Market

$101
$138
$284
2015 2016 2017
Sensors overview
» Global leader in sensing technologies and
solutions that enable automation, precision
and safety
» Enable better products at lower cost in
safer environments
» Controls consulting to optimize application
performance
Page 9
INDUSTRIES – automotive, aerospace & defense,
industrial automation, fluid power, fuel transmission and
storage, mobile hydraulic equipment
ADVANTAGES
»Total customer satisfaction
» Leading technology offerings and unrivaled application
expertise
»Worldwide support and consultation
*Market size is based on an estimate of the current addressable market
MTS 9% Share
2015 2016 2017
$23 $30 $58
23% 22% 20%
Revenue ($M’s)
Adjusted EBITDA ($M’s)
$3.2B* Market
See reconciliation to nearest GAAP measure on page 40

Industry Overview

Outlook for R&D spending remains positive given the
critical importance of product innovation for MTS’ customers
Page 11
Source: PwC Strategy&, 2015 Global Innovation 1000, 2015 & 2016
$409 $447
$501 $538
$508 $560
$614 $638 $647 $680 $680
2006 2007 2008 2009 2010 2011 2012 2013 2014 2015 2016
R&D Spending
Total Global Innovation 1000 R&D Spending ($ bln)
+66% 10-year CAGR = 5.2%
» Strong global R&D spending growth of 5.2% annually since 2006
» Although Y/Y spending was flat in 2016, recent trend includes five years of consistent growth from
2010-2015, increasing 6.0% annually.
» R&D growth in Asia has outpaced growth in North America and Europe, becoming the number one
region for corporate R&D spending

27%
46%
27%
2020
Load / torque sensor
Pressure sensor
Position sensor
28%
45%
27%
2015
Load / torque sensor
Pressure sensor
Position sensor
Global sensors market is large and growing –
MTS is well positioned
Page 12
Addressable Global Sensors Market
$27.8bn $40.6bn 7.9% CAGR
Source: BBC Research, Global Markets and Technologies for Sensors, 2014

Why we are excited
about our future

Create a sustainable, technology-
leading “Test and Measurement”
solutions provider
Achieve critical mass for sustainable
value creation
Cultivate attractive revenue growth and
cost synergy opportunities
Generate strong free cash flow
Grow through service
Combine complementary businesses
Leverage global footprint
Acquisition of PCB Group
Page 14
Strategic rationale
» PCB is a manufacturer of piezoelectric
sensors and components used for
motion, pressure, force and vibration
measurement
» PCB’s products include
accelerometers, microphones,
calibration systems, pressure sensors,
load and torque sensors, force
sensors, single- and multi-channel
telemetry, ground fault detection and
smart sensing solutions
PCB Overview
» Acquired PCB Group, Inc.
– Transaction creates a technology-leading “Test and Measurement” solutions provider
– The combined company will serve a global customer base ranging from leading OEMs in automotive,
aerospace, infrastructure and industrial products to universities and research laboratories

Realize growth within rapidly expanding sensors market –
strong forecasted growth over the next 5 years
» Broad sensor product offering with
leading technical capabilities – Motion,
position, pressure, force, load & torque,
acoustic
» Sensors that facilitate
– Continuing trend for increased
automation and precision to drive
productivity improvements
– Enhance testing of products and
decrease downtime
– Meet expanding safety regulations
– Increase reliability and data
gathering to drive better decision
making
Page 15
Microphone calibrator | Gas turbine monitoring
Acoustic Noise testing | Mobile equipment position

Opportunities to expand Test Service offerings – from increased
uptime and productivity to comprehensive testing expertise
Page 16
Full service contracts build long-term customer engagement
» Responsive proactive support
» Differentiated technical
solutions
» Global best practices
delivered locally
Consulting
Intelligent Lab Productivity
Baseline Maintenance
Customer
MTS Repair Center
MTS Inventory Pool
Advance Exchange provided to customer
Core return
Core worked on
and put in pool
Reduce customer
time-to-market
Proactive
maintenance
Health
management
Bill
ions
-1
1
3
5
1994 2004 2014 2021
MTS Installed Base is Growing
$4.5B
$72 $77 $79
$135
$0
$40
$80
$120
$160
2013 2014 2015 2021
Rev
enue
Test
Rev
enue
30%
20%
10%
0
15.1%
16.9% 17.1%
20%
$79 $86 $90
$135
$0
$40
$80
$120
$160
2015 2016 2017 2021
Rev
enue
Tes
t Rev
enue
30%
20%
10%
0%
17% 17% 18%
20%

Environmental and energy conservation are driving growth in
ground vehicle and advanced materials testing
Page 17
CAFE standard for compact cars increases to 60 mpg by
2025, full-size car efficiency will also increases to 45 mpg.
Compact Midsize Full-size
Source: Car and Driver, November 21, 2014
Tire performance and durability as well as aero dynamic testing and
advanced composite materials are critical to meeting new fuel
efficiency standards.

Financial Information

Technology leadership positions MTS for long-term
sustainable organic growth
Page 19
Sensors Business Test Services &
Ground Vehicles Other Test Markets
Test
Services
3%
Share
Growth
Market
Growth 5%
Share
Growth
Market
Growth 3%
Share
Growth
Market
Growth 7%
5% – 7% long-term organic growth target
» Expanding Services offerings
and revenue in Test
» Capitalizing on ground vehicles
growth fueled by increasing
CAFE standards
» Capture rapid expansion of
sensors markets
» Global macro trends present
significant sustainable growth
opportunities
» Engineering expertise and
technology-rich products and
systems are key differentiators

Opportunities to expand margins and other
financial measures
Page 20
MTS
Adjusted
EBITDA*
15%
Other financial goals » ~ 15% ROIC* in 4 years from revenue growth, improved profitability and reduced leverage
» $60M+ annual free cash flow *
» Productivity
improvement
through Lean &
other initiatives
Test Services
Revenue
Growth
Sensors
Revenue
Growth
Test
Operational
Efficiencies
3-4% pts
Improved product mix Efficiency gains
* Denotes non-GAAP financial measures

$ 3.00
$ 1.70 $ 1.31
$2.05 -$2.30
2015 2016 2017 2018
$100
$68 $72 $85+
2015 2016 2017 Annually
$564 $650
$788
$780 -$820
2015 2016 2017 2018
Broad Sensors portfolio aligned with emerging market
trends will spur revenue and adjusted EBITDA growth
» 2018 revenue guidance includes strong
Sensors growth and flat Test revenue growth
» 2018 earnings include:
- Increase from non-recurring 2017
expenses of ~ $25 million, $0.91 EPS, for
acquisition inventory step-up, China
investigation, acquisition integration, and
restructuring expenses
- Restructuring expense of $0.04-$0.11 EPS
related actions taken to increase
manufacturing efficiencies and reduce
costs
- Projected tax rates of 21% - 25%.
Page 21
* FY16 includes $1.02 acquisition-related and restructuring
costs. FY17 includes $.91 for China investigation,
acquisition-related and restructuring expenses
RETURN ON INVESTED CAPITAL (ROIC) 3
Guidance
Range
EARNINGS PER SHARE*
REVENUE
$18 $21
$18
2015 2016 2017
CAPITAL EXPENDITURES OPERATING CASH FLOW
3.3% 3.2% 2.3%
% of revenue
Capital
Expenditures
16%
9% 7%
15%
2015 2016 2017 2021
$88 $96
$120
$120 -$140
2015 2016 2017 2018
ADJUSTED EBITDA 1 Guidance
Range Guidance
Range
1 See reconciliation to nearest GAAP measure on page 41 2 See reconciliation to nearest GAAP measure on page 42 3 Denotes non-GAAP financial measure

Fiscal year 2017 Financial Results
» Revenue growth of 21%. Full year contribution from the PCB acquisition generated 20%
growth, strong organic Sensors demand contributed 2% and Test declined 1%
» Diluted EPS of $1.31 includes $0.91 negative impact from China investigation costs,
restructuring and expenses related to PCB acquisition. Fiscal 2017 also includes full year of
interest expense and amortization expense attributed to acquisition.
» EPS benefit in fiscal 2017 from discrete tax benefits related to prior years and increase in
mix of higher margin Sensors revenue. Share count increased 2.958 million shares
» Adjusted EBITDA increase includes 12 month contribution from PCB compared to 3 months
Page 22
$96
$120
2016 2017
ADJUSTED EBITDA (M’s)REVENUE (M’s) GAAP: DILUTED EPS
25%
$1.70
$1.31
2016 2017
(23%)
1See reconciliation to nearest GAAP measure on page 41
$650
$788
2016 2017
21%

Capital allocation priorities
» Focus on debt repayment and reducing leverage rapidly, long-term leverage target
2.0x – 2.5x
» Invest in Sensors and Test for growth
– Focus capital on high returning organic growth opportunities
– Disciplined approach to executing on natural bolt-on acquisition opportunities
to augment strong organic growth once leverage has reached acceptable
levels
» Revolving credit facility will be primarily used to provide liquidity and support
organic growth strategy
– $120M available under the revolving credit facility
» Maintain long-standing historical dividend payout
– Targeted payout currently yields ~2.5%
– 40 consecutive years of dividend payments
» Share buyback program has been placed on hold until leverage is reduced
Page 23

Summary
» Reasons to invest in MTS
OPPORTUNITIES FOR GROWTH
- Capture expanding sensors market growth
- Realizing Test service opportunity driven by expanding base of installed products
- Capitalizing on ground vehicle market and advanced material testing growth
- Global macro trends present significant sustainable growth opportunities
WE HAVE WHAT IT TAKES TO BE SUCCESSFUL
- Global scale with approximately 40% of revenue from Asia
- Engineering expertise, technology-rich products and
systems, and goal of total customer satisfaction are key differentiators
- Deep, long-term customer relationships
» We are confident about our future
Page 24

Appendix

Financial history
Page 26
2015 2016 2017
Financial Results
Revenue $564 $650 $788
Adjusted EBITDA1 $88 $96 $120
Net Income $45 $44 $43
EPS $3.00 $2.72 $2.22
Cash from Operations $100 $68 $72
Financial Position
Cash & cash equivalents $52 $85 $109
Debt $21 $485 $474
Debt/Equity 8% 120% 111%
ROIC* 15% 9% 7%
Average Diluted Share Count 15.1 16.2 19.1
($Ms except per share data)
1Represents non-GAAP measure. See reconciliation to nearest GAAP measure on page 41
EBIT x (1-tax rate) + after-tax interest income divided by average debt + equity
Excludes acquisition-related and restructuring activities of $16.5M, $1.02 earnings per share and 3 percentage point impact on return on invested capital
Excludes China investigation, acquisition inventory fair value adjustment, restructuring costs and acquisition integration of $17.5M, $0.91 earnings per share and 2
percentage point impact on return on invested capital
*
**
***
**
**
** ***
***
***

Strategic rationale for PCB acquisition
Combining MTS with PCB creates a more valuable company for employees, customers and shareholders
Creates a sustainable,
technology-leading “Test
and Measurement” solution
provider
Excellent margins / profitability with upside from strong focus on operational excellence
Significant future organic growth potential with natural bolt-on acquisition opportunities
Provide products to the Test business that are currently sourced elsewhere
Strengthens Test Service position in calibration and builds a strong service footprint, especially in the US
Critical mass for
sustainable value creation
Global footprint, diverse markets/customers, broad product portfolio
Significantly broadens the Company’s sensors offering and adds piezoelectric as a major new core technology
Strengthens the sales channels for Sensors
Embrace the PCB culture of competitive differentiation through product innovation and exceptional customer service
Add revenue and margin through PCB sales to MTS Test and Sensors customers
Expand into adjacent
markets
Sensors would expand into pressure, acoustic, force, strain and vibration sensors
MTS Testing products can be sold into PCB customer base
Calibration is a large growth opportunity for existing PCB customers
Strong free cash flow profile Strong cash generation with minimal capex requirements
More predictable cash flow performance
Minimal capex requirements
and opportunity for facility
integration
Capacity for MTS to leverage PCB’s vertically integrated machine shop in order to lower cost of critical parts
Nearby PCB and MTS manufacturing facilities consolidation opportunity
MTS Sensors & PCB supply chain expect to realize significant cost reduction
Growth through service Service calibration is a large growth opportunity for the PCB customer base
Shared focus on total customer satisfaction
Complementary businesses Common cultures across both business units (innovative, technology-leading, engineer-to-engineer sales process)
Significant revenue and cost synergies when operated under one corporate structure
Page 27

» MTS customer leverage: » PCB can leverage MTS customers – MTS has
significant customer base in Aero and Transportation
» Europe, Asia and emerging
leverage:
» MTS has strong market position in Europe, Japan,
China and Korea. PCB currently has limited presence
in these markets.
» Cross selling of products:
» MTS Sensors sold through PCB channels
» PCB branded sensors sold through MTS channels
(Sensors and Test)
» Modal shop calibration
business: » Calibration market expansion with investments made
» Cost synergies:
» Illustrative SG&A efficiencies across both businesses
» Gross margin and manufacturing synergies based on
sourcing savings
The PCB Acquisition is expected to generate attractive revenue
growth opportunities, cost synergies and value for MTS
Page 28
Revenue: expect to cultivate growth opportunities
Cost: expect to generate $5 to $7 million of annual net cost synergies in the first 3 to 4 years after merger

Test – Ground Vehicles (~48% of Test Business)
Component, sub-system and full-vehicle
testing solutions for everything from
motorcycles and passenger cars to
heavy-duty trucks and rail vehicles
Page 29
PRODUCT MARKET GROWTH: 4%
APPLICATIONS – Measurement and simulation solutions
to assess durability, vehicle dynamics and aerodynamics
of full vehicles, sub-systems and components
COMPETITORS – AB Dynamics, DIA, Horiba, Instron
(ITW), MAHA AIP, Moog, Saginomia
» Validate Component Durability
» Test & Measure Vehicle Response
» Vehicle Dynamics
» Optimize Critical Design Parameters
MTS Ground Vehicles Market
$0.9B Market
MTS 26% Share

Test – Materials (~22% of Test Business)
Testing solutions for materials science,
aerospace, biomedical, and geomechanical
industries
Page 30
APPLICATIONS – Characterization of material properties
and behavior across a broad range of environments and
loading conditions in support of materials research and
development for product design
COMPETITORS – Instron (ITW), Zwick, Shimadzu,
Tinius Olsen
*Market size is based on an estimate of the Premium Materials
Test Market
PRODUCT MARKET GROWTH: 3%
» Properties for new additive manufactured materials
» Material characterization in severe environments
» Lightweight engineered material characterization
» Biomedical material testing
» Characterize basic material properties
» Perform material manufacturing quality testing
MTS Materials Market
$0.9B* Market
MTS 12% Share

Test – Structures (~12% of Test Business)
Testing solutions for a wide range of large
structures
Page 31
» Civil engineering
» Wind power
» Wave generators
» Seismic simulation
» Fixed-wing aircraft
» Helicopters
» Engines
» Space structures
» Blast Systems
APPLICATIONS – Static & fatigue testing of structures
such as aircraft, oil & gas piping, wind turbines, buildings,
bridges and associated components & subsystems
COMPETITORS – Instron (ITW), Moog, Renk, Servotest,
Shore Western, Walter & Bai
» Validate Design Strength
» Test Large Structures
» Conduct Complex Tests & Measurements
» Validate Component Durability PRODUCT MARKET GROWTH: 3%
MTS Structures Market
$0.3B Market
MTS 21% Share

» Training
» Repair
» Calibration
» Consulting
Test – Service (~18% of Test Business)
Delivering productivity, reliability, connectivity and
performance of test labs
» Aftermarket customer support, including software
maintenance and calibration, delivered in
proactive customer service level agreements,
as well as maintenance and repairs
Page 32
MARKET GROWTH: 3%
APPLICATIONS – Routine maintenance, calibration, condition
monitoring, operator training, systems optimization, hydraulic
fluid health management and technical support
COMPETITORS – Regional and local low-level technical
maintenance and repair companies, engineering consulting
firms, calibrations companies and do-it-yourself customers
$1.1B Market
MTS 8% Share
MTS Service

Sensors – Position (~37% of Sensors Business)
» Reliable and rugged sensors improve
machine uptime, reduce maintenance
costs, and enhance safety
» Precise, accurate measurement improves
manufactured product quality
Page 33
APPLICATIONS – Fluid power, metal working, plastics &
rubber processing, renewable energy, food & beverage
plants, printing, wood factory automation, drive technology,
mobile equipment for construction, and agriculture and
mining
COMPETITORS – Balluff, Santest, Kangyu, TR Electronic,
Heidenhain, Turk, Hydac, ASM
* Market size is based on an estimate of the current addressable market for all
linear position sensors
» Customer Industry: Lumber Mills
» MTS Sensors: R-Series
» MTS sensor integrated into a hydraulic actuator offers
the precise linear feedback needed by the saw
motion controller.
PRODUCT MARKET GROWTH: 4%
MTS 9% Share
$1.2B* Market
Precise Linear Feedback
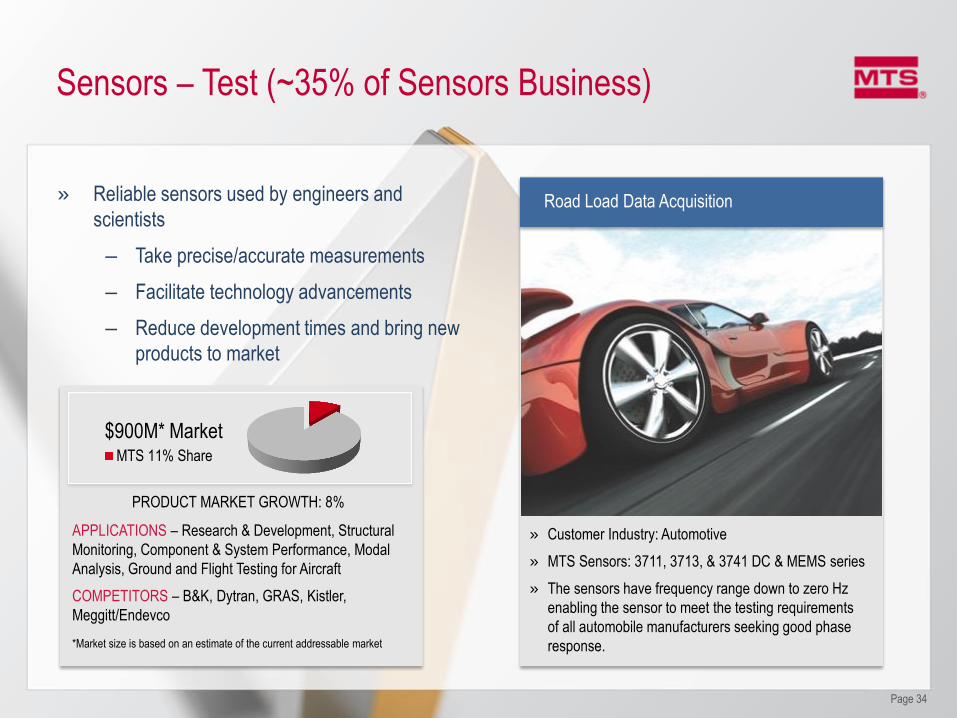
Sensors – Test (~35% of Sensors Business)
» Reliable sensors used by engineers and
scientists
– Take precise/accurate measurements
– Facilitate technology advancements
– Reduce development times and bring new
products to market
Page 34
PRODUCT MARKET GROWTH: 8%
APPLICATIONS – Research & Development, Structural
Monitoring, Component & System Performance, Modal
Analysis, Ground and Flight Testing for Aircraft
COMPETITORS – B&K, Dytran, GRAS, Kistler,
Meggitt/Endevco
*Market size is based on an estimate of the current addressable market
MTS 11% Share
$900M* Market
» Customer Industry: Automotive
» MTS Sensors: 3711, 3713, & 3741 DC & MEMS series
» The sensors have frequency range down to zero Hz
enabling the sensor to meet the testing requirements
of all automobile manufacturers seeking good phase
response.
Road Load Data Acquisition

Sensors – Industrial (~19% of Sensors Business)
» Rugged industrial vibration monitoring
instrumentation and intrinsically safe sensors and
signal conditioners
– Survive in harsh environments, reduce
downtime, increase production efficiencies,
and protect critical industrial machinery
– Detect dynamic pressure pulsations and
vibration and accurately identify potential
failures
Page 35
APPLICATIONS – Monitoring & Assessment for Gas and
Wind Turbines, Oil & Gas Wells & Pipelines, Nuclear
Power Instrumentation, Vibration Monitoring for Motors,
Pumps, Paper Machines, Machine Tools, Steel Rollers
COMPETITORS – Meggitt/Wilcoxon, Meggitt/Vibro-Meter,
Meggitt/Endevco, CTC, Hansford, Murphy
*Market size is based on an estimate of the current addressable market
MTS 12% Share
$450M* Market
» Customer Industry: Predictive Maintenance
» MTS Sensors: 603 & 607 series
» Monitor vibration levels on the motor bearings
looking for increases in those vibration levels which
can be indicative of a potential defect. If left
unattended, could result in a catastrophic failure.
PRODUCT MARKET GROWTH: 4%
Mover Conveyor System

Sensors – Systems (~9% of Sensors Business)
» Dynamic test, measurement, metrology and
sensing systems as well as rental and calibration
services used by engineers worldwide
» Used to test, model, and modify the dynamic
behavior of structures and processes
» Noise and vibration monitoring instrumentation
Page 36
APPLICATIONS – Vibration/Pressure/Force Sensor
Calibration, Modal Analysis, Experimental Sound &
Vibration Testing, End of Line Product Testing
COMPETITORS – B&K, Kistler, LDS, MB Dynamics,
Meggitt/Endevco, Spektra, Tira, Unholtz Dickie,
*Market size is based on an estimate of the current addressable market
MTS 5% Share
$500* Market
» Customer Industry: Aerospace
» MTS Sensors: 2100E11 & 2060E Modal Shakers
» Measure modal frequencies, damping and mode
shapes to assess the structural dynamic
characteristics of the aircraft to validate vibration
and flight control models.
PRODUCT MARKET GROWTH: 11%
Ground Vehicle Test (GVT)
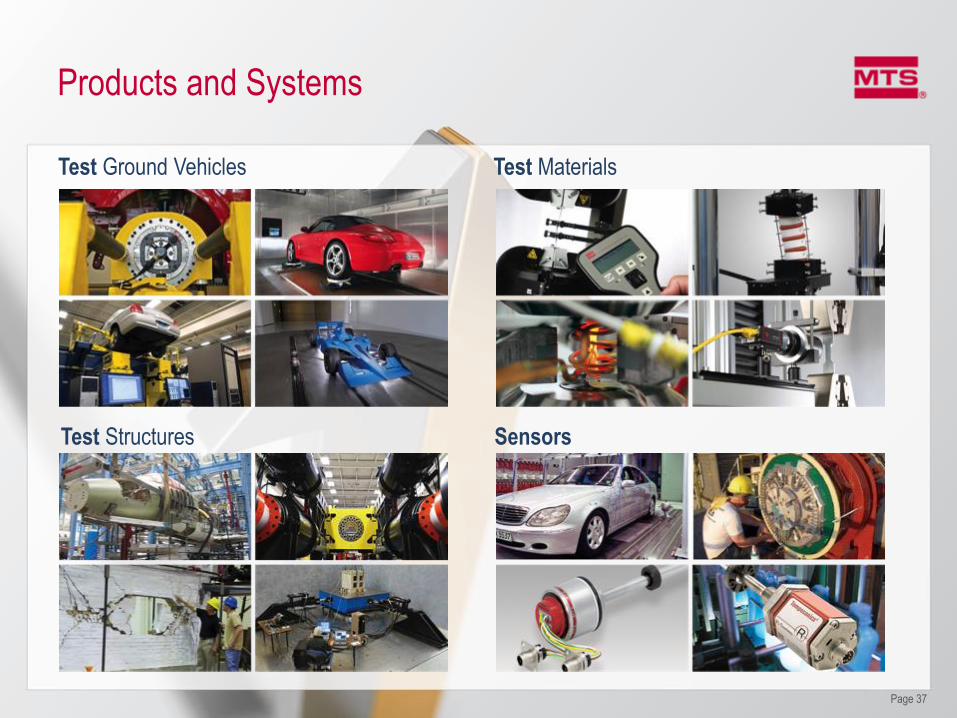
Products and Systems
Page 37
Test Ground Vehicles Test Materials
Test Structures Sensors

Adjusted EBITDA reconciliation – Total MTS
Page 38
Fiscal Year
($’s in millions) 2015 2016 2017
Income from operations $62 $42 $55
Depreciation and amortization 21 24 35
Other income/(expense), net (2) - (1)
Stock-based compensation 7 7 6
Acquisition-related expenses2 - 10 -
Acquisition integration expenses3 - 3 4
Acquisition inventory step-up - 8 8
China investigation expenses - - 9
Restructuring expenses4 - 2 4
Adjusted EBITDA 1 $88 $96 $120
Adjusted EBITDA Reconciliation
1 Denotes non-GAAP financial measure. 2 Acquisition-related expenses were adjusted to exclude stock-based compensation forfeitures that were
included in the stock-based compensation line. 3 Acquisition integration expenses were adjusted to exclude interest expense that is included in the interest
(income) expense, net line. 4 Restructuring expenses were adjusted to exclude stock-based compensation forfeitures that were included in
the stock-based compensation line.

Adjusted EBITDA reconciliation – Test segment
Page 39
Fiscal Year
($’s in millions) 2015 2016 2017
Income from operations $43 $41 $29
Depreciation and amortization 18 17 17
Other income/(expense), net (2) - (1)
Stock-based compensation 7 7 5
China Investigation Expenses - - 9
Restructuring charges - 1 3
Adjusted EBITDA 1 $66 $66 $62
Adjusted EBITDA reconciliation
1 Denotes non-GAAP financial measure.

Adjusted EBITDA reconciliation – Sensors segment
Page 40
Fiscal Year
($’s in millions) 2015 2016 2017
Income from operations $19 $1 $26
Depreciation and amortization 3 7 18
Other income/(expense), net - - -
Stock-based compensation 1 - 1
Acquisition-related expenses2 - 10 -
Acquisition integration expenses3 - 3 4
Acquisition inventory step-up - 8 8
Restructuring expenses4 - 1 1
Adjusted EBITDA 1 $23 $30 $58
Adjusted EBITDA Reconciliation
1 Denotes non-GAAP financial measure. 2 Acquisition-related expenses were adjusted to exclude stock-based compensation forfeitures that were
included in the stock-based compensation line. 3 Acquisition integration expenses were adjusted to exclude interest expense that is included in the interest
(income) expense, net line. 4 Restructuring expenses were adjusted to exclude stock-based compensation forfeitures that were included in
the stock-based compensation line.

Adjusted EBITDA reconciliation – Total MTS
Page 41
Fiscal Year
($’s in millions) 2015 2016 2017
Net income 45 28 25
Provision for income taxes 14 6 (2)
Interest (income) expense, net 1 8 31
Depreciation and amortization 21 24 35
EBITDA1 81 66 89
Stock-based compensation 7 7 6
Acquisition-related expenses2 - 10 -
Acquisition integration expenses3 - 3 4
Acquisition inventory step-up - 8 8
China investigation expenses - - 9
Restructuring expenses4 - 2 4
Adjusted EBITDA1 $88 $96 $120
Adjusted EBITDA Reconciliation
1 Denotes non-GAAP financial measure. 2 Acquisition-related expenses were adjusted to exclude stock-based compensation forfeitures that were included
in the stock-based compensation line. 3 Acquisition integration expenses were adjusted to exclude interest expense that is included in the interest
(income) expense, net line. 4 Restructuring expenses were adjusted to exclude stock-based compensation forfeitures that were included in
the stock-based compensation line.

FY18 Guidance: Total MTS Adjusted EBITDA
reconciliation
Page 42
12 Months Ended September 29, 2018
($’s in millions) Low High
Net income 40 44
Provision for income taxes 10 15
Interest (income) expense, net 26 29
Depreciation and amortization 36 38
EBITDA1 112 126
Stock-based compensation and non-recurring expenses2 8 14
Adjusted EBITDA 1 $120 $140
Adjusted EBITDA Reconciliation
1 Denotes non-GAAP financial measure. 2 Includes pre-tax forecast expenses for stock-based compensation and restructuring.