Download PDF - Journal of Agriculture Research and ...
180
-
Upload
khangminh22 -
Category
Documents
-
view
0 -
download
0
Transcript of Download PDF - Journal of Agriculture Research and ...


Effect of NPK Briquette on Wheat Yield, Nutrient Uptake and Nutrient Use Efficiency -Kirtiman Singh and N. B. More 005
Soil Physical Properties Under Long Term Use of Organics in Conjunction with ChemicalFertilizers in a Sorghum-Wheat Cropping Sequence in Inceptisol - D. V. Mali, V. K. Kharche, S. D. Jadhao, P. W. Deshmukh, B. V. Saoji and P. V. Mohod 012
Response of Wheat to Gypsum and Organic Amendments at different ESP levels in Mulacommand area of Ahmednagar District, Maharashtra - K. D. Kale and A. L. Pharande 018
Soil Test Based Targeted Yield Approach for Balance Fertilization of Maize in Inceptisol -A. D. Kadlag, S. D. Kale, S. M. Todmal and A. L. Pharande 024
ISSR Marker Based Characterization of Major Vegetable Crop Varieties - D. N. Damse, M. N. Bhalekar, P. L. Kulwal, A. S. Jadhav, S. G. Bhalekar, D. B. Kshirsagar 030
Standardization of Media Composition for Pot grown Miniature Rose - S. B. Jadhav, S. M. Katwate, B. G. Pawar and D. S. Kakade 037
Effects of Nutrient Chemicals and Growth Regulators on Post Harvest Vegetative Growth and Flowering in Alphonso Mango (Mangifera Indica L.) - K. R. Patil and M. M. Burondkar 040
Effect of Plant Growth Regulators and Nutrients on Growth and Yield of Green Top Onion(Vegetable purpose) - S. G. Bhalekar, S. U.Chalak and K. K. Bhangre 044
Transgressive Segregation in Mungbean (Vigna radiata (L.) Wilczek) - S. M. Karkute, V. S. Girase and A. J. Patil 048
Effect of Fumigation and Different Packaging Material on Storage of Paddy (Oryza sativaL.) Seed - A. K. Shinde, V. Y. Bharambe, U. V. Mahadkar and S. B. Bhoye 052
Response of Different Linseed Varieties Under Extended Sowing Dates - J. V. Adagale, P. U. Raundal, T. S. Bhondave, S. S. Bhondave and V. B. Pohare 058
Comparative Performance of Okra (Abelmoschus esculentum L.) Under Protected and Open Field Condition - B. B. Gadge, A. D. Tumbare , U. S. Surve and S. N. Mundhe 063
Bioefficacy of Newer Insecticides against Helicoverpa armigera Hubner in Pigeonpea -A. P. Chavan, S. K. Patil, S. R. Kulkarni and S. B. Latke 068
Elite Sources of Resistance to Safflower Aphid (Uroleucon compositae T.) under Dry LandCondition - V. B. Akashe, D. V. Indi, S. K. Shinde and V. M. Amrutsagar 073
CONTENTS
Volume 41 Number 1 January 2016
Journal of Agriculture Research and Technology
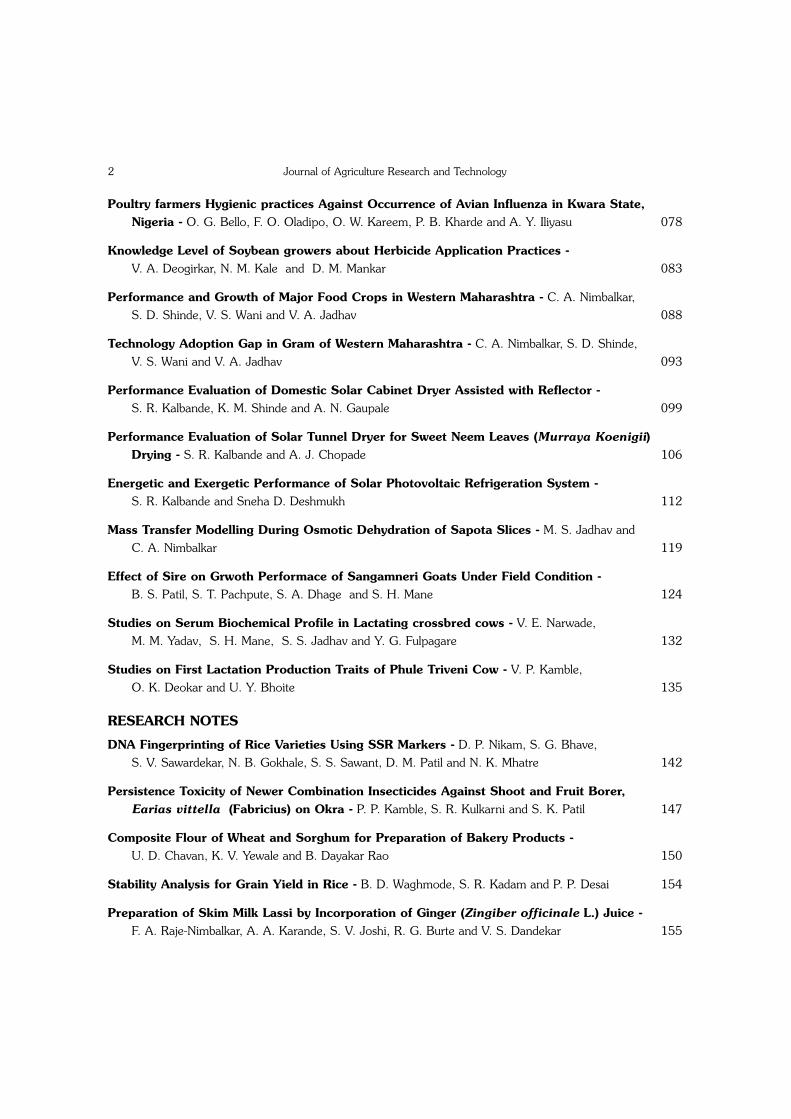
Poultry farmers Hygienic practices Against Occurrence of Avian Influenza in Kwara State,Nigeria - O. G. Bello, F. O. Oladipo, O. W. Kareem, P. B. Kharde and A. Y. Iliyasu 078
Knowledge Level of Soybean growers about Herbicide Application Practices -V. A. Deogirkar, N. M. Kale and D. M. Mankar 083
Performance and Growth of Major Food Crops in Western Maharashtra - C. A. Nimbalkar, S. D. Shinde, V. S. Wani and V. A. Jadhav 088
Technology Adoption Gap in Gram of Western Maharashtra - C. A. Nimbalkar, S. D. Shinde, V. S. Wani and V. A. Jadhav 093
Performance Evaluation of Domestic Solar Cabinet Dryer Assisted with Reflector -S. R. Kalbande, K. M. Shinde and A. N. Gaupale 099
Performance Evaluation of Solar Tunnel Dryer for Sweet Neem Leaves (Murraya Koenigii)Drying - S. R. Kalbande and A. J. Chopade 106
Energetic and Exergetic Performance of Solar Photovoltaic Refrigeration System -S. R. Kalbande and Sneha D. Deshmukh 112
Mass Transfer Modelling During Osmotic Dehydration of Sapota Slices - M. S. Jadhav and C. A. Nimbalkar 119
Effect of Sire on Grwoth Performace of Sangamneri Goats Under Field Condition -B. S. Patil, S. T. Pachpute, S. A. Dhage and S. H. Mane 124
Studies on Serum Biochemical Profile in Lactating crossbred cows - V. E. Narwade, M. M. Yadav, S. H. Mane, S. S. Jadhav and Y. G. Fulpagare 132
Studies on First Lactation Production Traits of Phule Triveni Cow - V. P. Kamble, O. K. Deokar and U. Y. Bhoite 135
RESEARCH NOTES
DNA Fingerprinting of Rice Varieties Using SSR Markers - D. P. Nikam, S. G. Bhave, S. V. Sawardekar, N. B. Gokhale, S. S. Sawant, D. M. Patil and N. K. Mhatre 142
Persistence Toxicity of Newer Combination Insecticides Against Shoot and Fruit Borer, Earias vittella (Fabricius) on Okra - P. P. Kamble, S. R. Kulkarni and S. K. Patil 147
Composite Flour of Wheat and Sorghum for Preparation of Bakery Products -U. D. Chavan, K. V. Yewale and B. Dayakar Rao 150
Stability Analysis for Grain Yield in Rice - B. D. Waghmode, S. R. Kadam and P. P. Desai 154
Preparation of Skim Milk Lassi by Incorporation of Ginger (Zingiber officinale L.) Juice -F. A. Raje-Nimbalkar, A. A. Karande, S. V. Joshi, R. G. Burte and V. S. Dandekar 155
Journal of Agriculture Research and Technology2

Effect of EM Solution on Growth and Yield of Groundnut - M. H. Shete, C. R. Kshirsagar and T. K. Narute 158
Identification of Pigeon pea Genotypes Suitable for Growing on Rice Bunds - P. B. Bankar, A. K. Shinde, S. G. Mahadik, V. Y. Bharambe, S. G. Bhave and U. V. Mahadkar 161
In-Vitro Propagation of Ginger (Zingiber officinale Rosc.) by using BAP and IAA -Ashwin B. Kshirsagar and V. C. Dhakane 165
Performance of post emergence herbicide in Soybean + Pigeonpea Intercropping -A. S. Jadhav 168
Population dynamics of Woolly aphid, Ceratovacuna lanigera Zehntner on AdsaliSugarcane in Western Maharashtra - S. M.Galande, B. A.Bade and S. B. Kharbade 170
Journal of Agriculture Research and Technology 3
______________

Journal of Agriculture Research and Technology4

J. Agric. Res. Technol., 41 (1) : 005-011 (2016)
Effect of NPK Briquette on Wheat Yield, Nutrient Uptake andNutrient Use Efficiency
Kirtiman Singh1 and N. B. More2
Division of Soil Science and Agril. Chemistry, College of Agriculture, Pune - 411 005 (India)(Received : 10-07-2013)
AbstractA field experiment was conducted to study the use of NPK briquette for wheat in rabi season at College
of Agriculture, Pune during 2010-11.Significant improvement in yield, NPK uptake by wheat, fertilizer useefficiency and available NPK content in soil at harvest found due to application of briquette form of NPKfertilizer over non-briquette form. The 100 per cent recommended dose of NPK fertilizer applied throughbriquette recorded significantly highest yield, NPK uptake and available NPK at harvest over all othertreatments. The 75 per cent recommended dose of NPK through briquette was as good as 100 per centrecommended dose of NPK through non-briquette in respect of grain and straw yield of wheat crop whichindicated the saving of 25 per cent NPK fertilizer by use of briquette. The N and P use efficiency was highestin case of application of 100 per cent recommended dose of NPK through briquette followed by 75 per centrecommended dose through briquette. The average per cent increase in nitrogen use efficiency, phosphorususe efficiency and potassium use efficiency increased due to briquette form of NPK fertilizer over non-briquette form were 49.61, 49.49 and 36.52, respectively. The results revealed that there was improvementin yield, maintenance of nutrient status in soil during crop growth, nutrient uptake by plant and fertilizer useefficiency due to the use of briquette form of NPK fertilizer over non-briquette form. Results also indicatedsaving of 25 per cent recommended dose of NPK for wheat crop.
Key words : Briquette, efficiency, nutrient uptake, soil status, yield and wheat
Wheat is the second most important cerealcrop in India next to rice in respect of area andproduction. In India, area under wheatcropping in 2013-14 was 29.07 millionhectares with the annual production of 86.87million tonnes with average productivity of2989 kg ha-1. In Maharashtra wheat occupied1.31million hectare and annual production was2.30 million tonnes with average productivityof 1761 kg ha-1 (Anonymous, 2014).
Fertilizers are very important and costlyinput in crop management and having aneffective contribution in crop production whenall other production factors are in reasonablebalance. Over the past 100 years, the yield ofcrops in the highly developed agriculturalsystem shown more than 60 per cent increase
due to use of mineral fertilizers. Number ofinvestigations have shown that there is definiteand nearly constant requirement of NPK forproduction of every quintal of grain of highyielding varieties of crop (Ramamoorthy andVelayutham, 1978).
But, increasing fertilizer prices coupled withtheir low use efficiency increases cost ofproduction. Use of high amount of chemicalfertilizers for higher yield leads to pollution ofsoil and water is also a big constraint of modernagriculture. According to Balligar and Bennet(1986) the efficiency of applied N is about 50per cent or less for P 10 per cent or less and forK it is 60 per cent. The use efficiency of NPKfertilizer is low particularly of N and P becauseof various reasons like volatilization, surfacerunoff, leaching losses, ammonia fixation,denitrification and phosphorus fixation, the1. Post graduate student and 2. Assisatnt Professor.

similar case exist for K-fixation. This situationleads to higher application of NPK than theactual needed by the crop and involving extraexpenses.
Among the nitrogenous fertilizers, urea isextensively used. But, there is heavy loss ofurea after application. Tiwari and Shrivastawa(1987) reported 80-81 per cent loss of ureathrough leaching, volatilization anddenitrification under varying soil and climaticconditions. Hence, N being costly input,maximizing it's efficiency by minimizing thelosses such as volatilization in the form of NH3,denitrification, run off and leaching should beprimary goal of all concerned.
To minimize nutrient losses and increase theuse efficiency of fertilizer, the placement offertilizer or spot application of fertilizer, use ofslow release fertilizer and nitrification inhibitorsare recommended. The use of urea supergranules, urea briquette and urea DAP briquetteare another development in this direction andused for transplanted rice crop under anaerobiccondition and found beneficial (Daftardar andSavant, 1995). Urea briquette placed at 3-4 cmdepth for lowland rice was found better thansurface application (Singh et al., 1989). Theapplication of USG, Urea briquette and NPbriquettes placed mechanically or by hand deepplacement achieved the higher nitrogen useefficiency in transplanted rice (Daftardar andSawant, 1995, Bulbule et al., 1995).
Only about 25-30 per cent of appliedphosphate is available to the crops remainingpart is converted in to insoluble forms (Gaur,1990). In order to improve the utilization of Pfertilizers by crop it seems to be essential toagronomic management that reduce the soilsurface and time of contact between the soilparticles and fertilizer (Morel et al., 1989). Inthis regard the application of urea-DAPbriquette showed promising results for rice
(Savant et al., 1993 and Daftardar and Savant,1995).
The above products were however used forfew crops grown under aerobic condition likesugarcane (More, 1998), tomato (Kadam andSahane, 2002), cabbage, brinjal etc showedeffective benefit. Whereas, NPK briquettes havenot tested for wheat crop under aerobic.Therefore, the present investigation was carriedout to study the use of NPK briquette on wheatyield, use efficiency, uptake and residual fertilitystatus in soil.
Materials and methods
The present investigation was undertakenduring the year 2010- 2011 for wheat(Triticum aestivum) cv. Tapowan in rabiseason at College of Agriculture, Pune. Theexperiment was laid out in randomized blockdesign with seven treatments and fourreplications. The fertilizer dose of N, P2O5, andK2O was applied at the rate of 120:60:40 kgha-1. The treatment were T1. Absolute control,T2.100% recommended dose of NPK throughNon Briquette (Urea, DAP and MOP) by linemethod of application, T3. 100%recommended dose of NPK through Non -Briquette (Urea, DAP and MOP) by spotapplication, T4. 75% recommended dose ofNPK through Non Briquette (Urea, DAP andMOP) by line method of application, T5. 75%recommended dose of NPK through Non-Briquette (Urea, DAP and MOP) by spotapplication, T6. 100% recommended dose ofNPK through Briquette by spot application andT7. 75% recommended dose of NPK throughBriquette by spot application. The plot size was4.5 x 3.6 m-2. The seeds were sown in rowsseparated by a distance of 22.5 cm after sowingirrigation on 27.11.2011 and briquette andnon briquette fertilizers were applied.
Non-briquette form of fertilizer : Thenon briquette form of fertilizers viz.,
Singh and More6

commercial grade urea (46% N), DiammoniumPhosphate (18% N and 46% P2O5) andMuriate of Potash (60% K2O) were applied forT2 and T4 by line and for T3 and T5 by spotapplication methods. In line method, non-briquette form of fertilizers were placed at 5 cmbelow the seed. For this 50 per cent N, 100 percent P and K each were applied at the time ofsowing and remaining 50 per cent N was givenat 30 days after sowing. In spot method, non-briquette form of fertilizer were applied at 7 cmdeep in between two rows of wheat (11.25 cmapart from two lines of wheat) at sowing bycrow bar.
Briquette form of fertilizer : The NPKfertilizer briquette containing N : P2O5 : K2O inthe proportion of 2:1:0.66 (same as therecommended dose of fertilizers of 120:60:40for wheat crop) were prepared mechanically bymixing only commercial grade of Urea,Diammonium Phosphate and Muriate of Potashwith the help of briquetter using high pressure.The briquette was applied on area basis at fieldcapacity moisture conditions (pre sowingirrigation) at 7.0 cm deep by crowbar methodin between two rows of wheat (11.25 cm apartfrom two lines of wheat) at sowing as per treat-ments. The 2.6 g of NPK briquette was appliedfor two different levels of 100 per cent and 75
per cent of recommended dose of fertilizers byspot application method. For the treatment of100 per cent recommended dose of fertilizersone briquette was applied at a distance of 28cm between two spots and for the 75 per centrecommended dose of fertilizer the distancebetween two spot was 36 cm. The completedose of NPK through briquette was given atsowing as per treatment mentioned above.
Soil samples at initial composite andtreatment wise after harvest of crop werecollected and used for determination ofavailable N, P and K with other chemicalproperties using standered procedures. Soilsamples were analyzed for pH and EC in 1:2.5soil suspension ratio, organic carbon wasestimated as per Nelson and Somer (1982),available N by alkaline permanganate method(Subbiah and Asija, 1956), available P asmethod Olsel et al. (1954) and available Kdetermined by flame photometrically asdescribed by Knudson et al. (1982). Plantsamples were analysed for total nutrient uptakeas per method given by Parkinson and Allen(1975). The data obtained on chemicalproperties of soil, uptake of nutrient by plantand yield of wheat were analyzed statistically byusing procedures laid down by Panse andSukhatme (1995).
Journal of Agriculture Research and Technology 7
Table 1. Effect of levels and methods of application of briquette and non-briquette forms of NPK fertilizer on grain and strawyield (q ha-1) of wheat
Treatment Yield (q ha-1)–––––––––––––––––––––––––Grain Straw
T1 - Control (No NPK) 11.83 13.41T2 - 100% NPK RD through non-briquette by line method 35.60 45.41T3 - 100% NPK RD through non-briquette by spot application 38.33 50.09T4 - 75% NPK RD through non-briquette by line method 30.88 41.9T5 - 75% NPK RD non-briquette by spot application 32.20 44.87T6 - 100% NPK RD through briquette by spot application 45.53 69.27T7 - 75% NPK RD through briquette by spot application 39.40 52.53SE± 0.79 2.30CD at 5% 2.357 7.09

Results and discussion
Yield : The application of 100 per centNPK RD through briquette form recordedsignificantly highest grain (45.53 q ha -1) andstraw (69.27 q ha-1) yields and foundsignificantly superior over all other treatments(Table 1). While, NPK fertilizer applied throughbriquette at the rate of 75 per cent NPK RD(T7) and through non-briquette at the rate of100 per cent NPK RD by spot application (T3)were statistically equal and significantly higherthan other treatments in respect of grain andstraw yields. The results indicated the saving ofNPK fertilizers to the tune of 25 per centrecommended dose of NPK for wheat crop.There was better survival of plants in briquettetreated plots, might be because of better andlonger period of availability of N, P and K dueto 7 cm deep placement NPK briquette in soil.Kadam et al., (1991) and Nasir Ahmed et al.,(1992) observed that the deep placement ofnitrogenous fertilizers (10 cm) significantlyincreased yield of sugarcane over line methodof application of N fertilizers. Similar type ofobservations were also noticed in case of NPKbriquette application for sugarcane crop byMore (1998) and More and Shinde (2004).
Nutrient uptake : The application of 100per cent NPK RD through briquette recorded
significantly higher uptake of NPK and it wassuperior over all other treatments (Table 2). The75 per cent NPK RD through briquette and100 per cent NPK RD through non-briquetteby spot application are statistically equal andsignificantly higher than other treatments incase of N uptake, while in case of P and Kuptake T2, T3 and T7 are statistically equal andat par with each other. In general application offertilizer through briquette recorded significantlyhigher uptake of NPK by wheat crop. Thismight be due to better availability of NPKnutrient in soil for longer period of time. More(1998) and Kadam et al., (1991) obtainedhigher uptake of NPK by sugarcane due to useof NPK briquette and urea super granulesrespectively placed in 10 cm deep in soil. Wengand Chang (1991) and Weng et al. (1991) alsoreported that deep placement of N fertilizer (10cm) proved significantly superior to line methodof application of prilled urea in respect ofuptake of nitrogen by sugarcane under aerobiccondition.
Nutrient status in soil : The applicationof 100 per cent NPK RD through briquetterecorded significantly higher available N(147.39 kg ha-1) in soil at harvest (Table 3).However, it was on par with 75%recommended dose of NPK through Briquette
Singh and More8
Table 2. Effect of levels and methods of application of briquette and non-briquette forms of NPK fertilizer on uptake of N,P and K by wheat
Treatment Uptake of nutrient (kg ha-1)––––––––––––––––––––––––––––––––––––––––––N P K
T1 - Control (No NPK) 23.76 5.94 28.88T2 - 100% NPK RD through non-briquette by line method 88.60 24.20 104.57T3 - 100% NPK RD through non-briquette by spot application 94.60 26.32 110.68T4 - 75% NPK RD through non-briquette by line method 71.20 18.34 88.91T5 - 75% NPK RD through non-briquette by spot application 74.27 21.10 90.74T6 - 100% NPK RD through briquette by spot application 124.05 34.29 139.18T7 - 75% NPK RD through briquette by spot application 97.68 26.65 114.60SE± 2.75 1.26 3.89CD at 5% 8.47 3.87 11.99

by spot application (144.25 kg ha-1), 100%recommended dose of NPK through Non -Briquette (Urea, DAP and MOP) by spotapplication (142.69 kg ha-1), 75%recommended dose of NPK through Non-Briquette (Urea, DAP and MOP) by spotapplication (141.13 kg ha-1) and 100%recommended dose of NPK through NonBriquette (Urea, DAP and MOP) by line methodof application (141.13 kg ha-1). In case ofavailable P and K, application of 100 per centNPK RD through briquette recordedsignificantly higher available P (12.99 kg ha-1)and K (521.35 kg ha-1) than all treatments. Theapplication of 75 per cent NPK RD throughbriquette recorded second highest available P
(12.05 kg ha-1) and it was on par with 100%recommended dose of NPK through Non -Briquette (Urea, DAP and MOP) by spotapplication (11.65 kg ha-1). The 75 per centNPK RD through briquette (484.48 kg ha-1)and 100 per cent NPK RD through non-briquette by spot method (484.75 kg ha-1)recorded approximately equal concentration ofavailable K in soil at harvest.
The application of 100 per cent RD NPKthrough briquette maintained higher status ofavailable NPK in soil at harvest only bybriquette treatment might be due to deepplacement of NPK briquette fertilizer and alsodue to release of NPK from briquette form of
Journal of Agriculture Research and Technology 9
Table 3. Effect of levels and methods of application of briquette and non-briquette forms of NPK fertilizer on available N, Pand K at harvest
Treatment Available N Available P Available K –––––––––––––––––––––––––––––––––––––––––––––
(kg ha-1)
T1 - Control (No NPK) 131.71 10.84 428.40T2 - 100% NPK RD through non-briquette by line method 141.13 11.43 476.75T3 - 100% NPK RD through non-briquette by spot application 142.69 11.65 484.75T4 - 75% NPK RD through non-briquette Line method 136.41 10.65 469.15T5 - 75% NPK RD non-briquette by spot application 141.13 10.93 473.70T6 - 100% NPK RD through briquette by spot application 147.39 12.99 521.35T7 - 75% NPK RD through briquette by spot application 144.25 12.05 484.48SE± 2.52 0.18 5.84CD at 5% 7.49 0.544 17.355
Table 4. Effect of levels and methods of application of briquette and non-briquette forms of NPK fertilizer on fertilizer useefficiency
Treatment N use P use K useefficiency efficiency efficiency(%) (%) (%)
T1 - Control (No NPK) - - -T2 - 100% NPK RD through non-briquette by line method 54.03 30.43 189.22T3 - 100% NPK RD through non-briquette by spot application 59.03 33.97 204.50T4 - 75% NPK RD through non-briquette by line method 52.71 27.56 200.10T5 - 75% NPK RD through non-briquette by spot application 56.12 33.69 232.87T6 - 100% NPK RD through briquette by spot application 83.58 47.25 275.75T7 - 75% NPK RD through briquette by spot application 82.13 46.02 285.73

fertilizer.This could be attributed due to betteravailability of NPK nutrients in soil for longerperiod of time by use of briquette. Similarobservations were reported by Talekar andDongale (1993) and Deshmukh and Tiwari(1996) by use USG for rice crop in case ofavailable N and More and Shinde (2002) by useof NPK briquette for sugarcane in available N,P and K content in soil at harvest.
Fertilizer use efficiency : The nitrogenuse efficiency (NUE) was found highest(83.58%) with use of 100 per cent NPK RDthrough briquette followed by 75 per cent NPKRD through briquette (82.13%) and 100 percent NPK RD through non-briquette by spotmethod of application (59.03%) (Table 4). The100 per cent NPK RD through briquette byspot application recorded highest (47.25%)phosphorus use efficiency (PUE) followed by75% NPK RD through briquette by spotapplication (46.02%). However, in case ofpotassium use efficiency 75% NPK RD throughbriquette by spot application showed highestuse efficiency (285.73%) followed by 100%NPK RD through briquette by spot application.
Results indicated that, the use efficiency ofNPK briquette was recorded higher than thenon-briquette form of fertilizer's either appliedby line method or spot method of application.In general the application of fertilizer throughbriquette recorded significantly higher uptake ofN,P and K by wheat crop. This might be due tobetter availability of NPK nutrients in soil forlonger period of time in growth stages of wheatcrop. Further, increased phosphorus useefficiency through NPK briquette is might bedue to deep placement of briquette (7 cm ) inroot zone area of wheat crop as thephosphorus is less mobile as compared tonitrogen and potassium. Similar type ofobservations were also recorded by More et al.,(2004) in case of application of NPK briquettefor sugarcane crop. Whereas, Thomasan et
al., (2000) reported the higher nitrogen useefficiency due to incorporation of differentsources of nitrogen fertilizer at pre sowing forwheat crop.
The application of fertilizer throughbriquette @ 100 per cent recommended doseof NPK for pre sowing irrigated wheat (7 cmdeep) within two rows at 28 to 36 cm distancebetween two spots found beneficial inincreasing yield with maintaining soil fertility.
ReferencesAnonymous. 2014. Agricultural Statistics at a glance.
Directorates of Economics and Statistics, Departmentof Agriculture and Cooperation , Govt. of India, NewDelhi.
Balligar, V. C. and Bennet, O. L. 1986. Outlook onfertilizer use efficiency in the tropics. Fert. Res., 10(1):83-96.
Bulbule, A. V., Bangal, D. B. and Savant, N. K. 1995. Anefficient NP fertilizer management technique forrainfed transplanted rice in Ghat Zone, Maharashtra.Fert. News., 40(4): 47-51.
Daftardar, S. V. and Savant, N. K. 1995. Evaluation ofenvironmental friendly fertilizer management forrainfed Low land rice on tribal farmer's field in India.Paper presented at IRRC, 13-17 Feb., 1995. LosBanos, Laguna , Philippines.
Deshmukh and S. C. and Tiwari, S. C. 1996. Efficiency ofslow release nitrogen fertilizer in rice on partiallyreclaimed sodic Vertisols. Indian J. Agron., 41(4):586-590.
*Gaur, A. C. 1990. In. Phosphate SolubilizingMicroorganisms Biofertilizers, Omega Sci. PublishersNew Delhi.
Kadam, R. H., Patil, M. P. and Patil, J. D. 1991. Effect offorms and levels of urea on yield and uptake bysugarcane. J. Maharashtra Agric. Univ. , 16(2) : 242-244.
Kadam, J. R. and J. S. Sahane . 2002. Quality parametersand growth characters of tomato as influenced byNPK fertilizer briquette and irrigation methods.J.Maharashtra Agri. Univ., 27(2): 124-126.
Kundsen, D., Peterson, G. A. and Pratt, P. F. 1982.Lithium sodium and potassium. In "Methods of SoilAnalysis" Part-2, Chemical and microbiologicalProperties. Page, A.L. (Ed.) II. Edition, Am. Soc. ofAgron. Inc. and Soil Sci. Soc. of America, Inc.,Madison, Wisconsin, USA, 225-245.
Singh and More10

More, N. B. 1998. Use of NPK briquettes for sugarcane.PhD thesis submitted to MPKV, Rahuri.
More, N. B. and Shinde, B. N. 2002. Effect of NPKbriquette on availability and uptake of nutrients bysugarcane. J. Maharashtra agric Univ., 27(2) : 121-123.
More N. B., Pharande, A. L. and Bhoi, P. G. 2004. Effectof NPK fertilizer briquette on yield and quality ofsugarcane in swell-shrink soil of Maharashtra. Indian J.Sugarcane Technology 19(1 and 2) : 27-34.
Morel, J. L., Foreau, J. C., Beruft, M. A. and Gukert, A.1989. Phosphate fixing of soil : A surey, using theisotopic exchange technique or soils from northEastern Franc, fert.Res., 19(2): 103-111.
Nasir Ahmed, S., Chinnaswami, K. N. and Kumaraswami,K. 1992. Efficiency of modified form of urea andmethods of application on the yield and quality ofsugarcane. Indian Sug., XLII(4): 227-229.
Nelson, D. W. and Sommers, L. E. 1982. Total carbon andorganic matter. In "Methods of Soil Analysis", Part-II.Chemical and microbiological properties. Page, A.L.(Ed), II Edition. American Soc. of Agron. Inc.and SoilSci. of American Inc., Madison, Wisconsin, USA, 559-577.
Olsen, S. R., Coles, C. V. Watanabe, F. S. and Dean, L. N.1954. Estimation of available phosphorus in soil byextraction with sodium carbonate. USDA circular:939.
Panse, V. G. and Sukhatme, P. V. 1995. Statisticalmethods for Agricultural Workers. ICAR, Publ., NewDelhi. 4th Edn. pp. 145-165.
Parkinson, J. A. and Allen, S. E. 1975. A wet oxidationprocedure suitable for the determination of nitrogenand mineral nutrients in biological material. Commun.Soil Sci. Pl. Anal., 6: 1-11.
Ramamurthy, B. and Velayutham, M. 1978. Nitrogen,
phosphorus and potassium in soil-chemistry forms andavailability. In : Soil Fertility Theory and Practice Ed.J. S. Kanwar, I.C.A.R., New Delhi.
Savant, N. K., Talashilkar, S. C., Dalvi, A. S. and Dhane,S. S. 1993. Transplanted rice yield as influenced bydeep-placed urea briquettes fortified with diammoniaphosphate on lateritic soil of Kokan. Paper presentedin International Seminar on Managing Red andLateritic Soils for Sustainable Agriculture (ISMARS),Sept. 24-28, 1993. Banglore India.
Singh, S., Prasad, R. and Sharma, S. N. 1989. Growth andyield of rice as affected by spacing, time and depth ofplacement of urea briquettes. Fert. Res., 19(2): 99-101.
Subbiah, B. V. and Asija, G. L. 1956. A rapid procedurefor the estimation of available nitrogen in soil .CurrentSci. 25: 259-260.
Talekar, J. K. and Dongale, J. H. 1993. Comparative studyon fertilizer placement behind plough and surfacebroadcasting for transplanted rice. J. Indian Soc. SoilSci., 41(2): 372-373.
Thomason W. E, Raun, W. R. and Johnson, G. V. 2000.Winter Wheat Fertilizer Nitrogen Use Efficiency inGrain and Forage Production Systems. J. Plant Nutr.23: 1505-1516.
Tiwari, A. K. and Srivastava, S. P. 1987. Efficiency ofdifferent nitrogenous fertilizers on sugarcane crop.Bharatiya Sug., 12(4): 57-59.
Weng, T. H. and Chag, Y. Y. 1991.Effect on various formsof nitrogen fertilizers and application method onsugarcane yield and nitrogen uptake. Report TaiwanSug. Res. Inst. (1991). No. 130: 15-21.
*Weng, T. H., Chang, Y. Y. and Li, S. W. 1991. Effect ofvarious forms of nitrogen fertilizers and applicationmethod on sugarcane yield and nitrogenuptake.Taiwan Sug., 38(6): 22-24.
Journal of Agriculture Research and Technology 11
______________
Improving and maintaining soil quality forenhancing and sustaining agriculturalproduction is of utmost importance for India'sfood and nutritional security. Though India is afood surplus nation at present with more thanabout 240 million tonnes food grain productionper annum, it will require about 4-5 milliontonnes additional food grains each year if thetrend in rising population persists(Annonymous, 2010).The stagnation inproduction and productivity of food grains forthe past few years has become a matter ofconcern and is posing a serious threat to ournational food security. The agricultural scenarioof India has completely changed now due tomodern intensive agriculture. For meeting therequirement of surging population, emphasishas to be given on introduction of right kind ofsequence cropping along with nutrientmanagement in order to get increased
productivity. Long-term fertilizer experimentsusually provide the best practical test ofsustainability of crop management system.
Soil health degradation has emerged as amajor factor responsible for the stagnation inagricultural production. Soil physicalconditions, no doubt are slow to respond fortheir improvement but are essential to maintainthe health of soils. Soil physical properties haveprofound influence on nutrient availabilitywhich is important attributes of soil quality.Most physical properties of soil are largelyinfluenced by management and the change inphysical properties of soil is exhibited onlyunder long-term adoption of managementmeasures. The important physical properties ofsoil viz., bulk density, hydraulic conductivity,water retention, available water capacity andmean weight diameter are generally consideredas soil quality indicators. The basic conceptunderlying the principles of Integrated NutrientManagement (INM) is the maintenance and
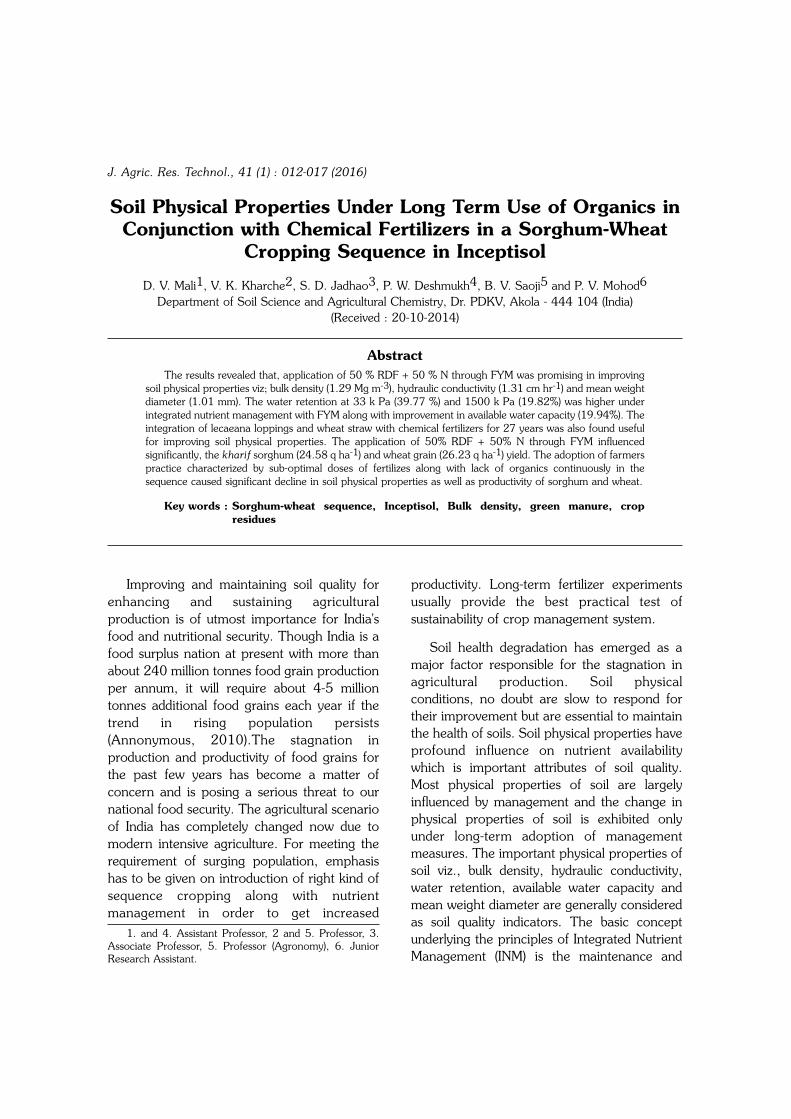
J. Agric. Res. Technol., 41 (1) : 012-017 (2016)
Soil Physical Properties Under Long Term Use of Organics inConjunction with Chemical Fertilizers in a Sorghum-Wheat
Cropping Sequence in Inceptisol
D. V. Mali1, V. K. Kharche2, S. D. Jadhao3, P. W. Deshmukh4, B. V. Saoji5 and P. V. Mohod6
Department of Soil Science and Agricultural Chemistry, Dr. PDKV, Akola - 444 104 (India)(Received : 20-10-2014)
AbstractThe results revealed that, application of 50 % RDF + 50 % N through FYM was promising in improving
soil physical properties viz; bulk density (1.29 Mg m-3), hydraulic conductivity (1.31 cm hr-1) and mean weightdiameter (1.01 mm). The water retention at 33 k Pa (39.77 %) and 1500 k Pa (19.82%) was higher underintegrated nutrient management with FYM along with improvement in available water capacity (19.94%). Theintegration of lecaeana loppings and wheat straw with chemical fertilizers for 27 years was also found usefulfor improving soil physical properties. The application of 50% RDF + 50% N through FYM influencedsignificantly, the kharif sorghum (24.58 q ha-1) and wheat grain (26.23 q ha-1) yield. The adoption of farmerspractice characterized by sub-optimal doses of fertilizes along with lack of organics continuously in thesequence caused significant decline in soil physical properties as well as productivity of sorghum and wheat.
Key words : Sorghum-wheat sequence, Inceptisol, Bulk density, green manure, cropresidues
1. and 4. Assistant Professor, 2 and 5. Professor, 3.Associate Professor, 5. Professor (Agronomy), 6. JuniorResearch Assistant.

possibly improvement of soil fertility forsustaining crop productivity on long-term basis.This may be achieved through combined use ofall possible sources of nutrients and theirscientific management for optimum growth,yield and quality of different crops and croppingsystems. Against an annual depletion of 28-30million tonnes of nutrients from soil, thereplenishment through fertilizers is only 20million tonnes, leaving a net annual deficit of 8-10 million tonnes, which keeps accumulatingyear after year depleting the soil fertility(Anonymous, 2007). It is high time that dueattention is paid to solve the problem ofnutrient mining simultaneously whilemaintaining physical health of soil. In this viewthe present investigation was carried out tostudy the effect of long term use of organics incombination with chemical fertilizers tosorghum-wheat cropping sequence on soilphysical properties and productivity of sorghumunder Inceptisols representing dominant soilgroups of Central India.
Materials and Methods
A permanent long-term field experiment onsorghum-wheat cropping sequence wasinitiated during 1984-85 at Research Farm,AICRP on Integrated Farming SystemResearch, Dr. Panjabrao Deshmukh KrishiVidyapeeth, Akola. The present investigationwas carried out to study the long-term effect ofvarious options of integrated nutrientmanagement on soil physical properties andproductivity under sorghum-wheat croppingsequence after 27th cycle.
The study area is a part of semi arid agroeco-regions with swell-shrinks soils. The annualrainfall is 720 mm and average maximumtemperature is around 33.5°C. The soilmoisture regime is ustic. The soil of theexperimental field is clayey montmorillonitic,hyperthermic family of Vertic Haplustept
(Masala series). The experiment comprised oftwelve treatments replicated four times in RBD.The treatment comprised of combinations oforganics like FYM, wheat straw and leucaenaloppings along with chemical fertilizers,unfertilized control and farmers practice. Thesoil physical properties were assessed usingstandard procedures. For mean weightdiameter analysis, 8 mm size aggregates wereretained on the sieve and used. Bulk densitywas determined by clod coating technique asdescribed by Blake and Hartge (1986). Waterretention of soil was determined by pressureplate membrane apparatus method asdescribed by Klute (1986). Hydraulicconductivity of soil was determined by constanthead method as described by Klute and Dirksen(1986). Mean weight diameter of soil wasdetermined by Yoder's apparatus method as perKemper and Rosenau (1986). The nutrientapplied through various organics based onnutrient content is given below.
Results and Discussion
The physical properties although changevery gradually, the long term use of organicsshowed profound influence on them.
Bulk density : The lowest bulk density(1.29 Mg m-3) has been recorded underintegrated nutrient management (INM) using
Journal of Agriculture Research and Technology 13
Orga- Treat- Quantity Quantity of nutrientsnics ments (tones applied through
ha-1) organics (kg ha-1)––––––––––––––––––––––––N P K
FYM T6 9.52 59.97 23.8 70.45T7 4.76 29.98 11.9 35.22
Wheat T8 10.71 6.00 4.28 11.03straw T9 5.36 3.00 2.14 5.52
Lecaeana T10 9.23 310 17.54 148lopping T11 4.62 155 8.76 74.0

FYM, while it was highest in control (1.65 Mgm-3) (Table 1). The significant reduction in bulkdensity under farm yard manure (FYM), wheatstraw (WS) and Leucaena loppings (LL) can beattributed to the long-term use of theseorganics for a prolonged period of 27 years.However, the bulk density was higher underonly chemical fertilizers (T2 to T5). The day today declining use of FYM and only chemicalfertilizer in present day agriculture hasdeteriorated the physical properties of soilswhich become apparent from the presentresults obtained at fixed experimentation oflong term study. The bulk density showed12.40 per cent decrease due to conjoint use ofchemical fertilizers and FYM than that of onlychemical fertilizer (T5). The reduction in bulkdensity may be attributed to better aggregation,increased porosity and improvement in soilstructure caused due to increase in soil organicmatter under the treatments of integrated use ofchemical fertilizers and organic manures. Selviet al. (2005) under a long-term experiment
reported that bulk density was significantlyreduced due to the continuous application ofbalanced fertilizers along with organics (INM)than in the unfertilized plots.
Hati et al. (2007) studied the long-termimpact of fertilizers and manure application onbulk density in Vertisol after 28 crop cycles atJabalpur and reported that the application ofbalanced fertilizers in combination with organicmanure reduced the bulk density significantly.
Hydraulic conductivity : The hydraulicconductivity varied from 0.57 cm hr-1 (control)to 1.31 cm hr-1 (Table 1 and Fig. 1). Thehydraulic conductivity showed considerableimprovement under INM comprising of FYM,wheat straw and green manuring as comparedto chemical fertilizers. The significantly highesthydraulic conductivity was recorded underconjunctive use of NPK through chemicalfertilizers with 50 per cent N through FYM. Theonly chemical fertilizers also recorded increasein hydraulic conductivity over control. However,
Mali et al.14
Table 1. Soil physical properties as influenced by long-term effect of INM under sorghum-wheat cropping sequence (2010-11) (27th cycle)
Treat- Sorghum Whreat Bulk Hydraulic Mean Water tetention (%)ment density connduc- weight –––––––––––––––––––––
(Mg m-3) tivity diameter 33 1500 AWC(cm hr-1) (mm) kPa kPa
T1 Control Control 1.65 0.57 0.57 32.38 16.06 16.32T2 50% RDF 50% RDF 1.44 0.75 0.67 33.93 17.12 16.81T3 50% RDF 100% RDF 1.43 0.84 0.71 35.07 17.72 17.35T4 75% RDF 75% RDF 1.41 0.87 0.74 35.84 17.93 17.91T5 100% RDF 100% RDF 1.45 0.93 0.80 37.01 18.54 18.47T6 50% RDF + 50% N - FYM 100% RDF 1.29 1.31 1.01 39.77 19.82 19.94T7 75% RDF + 25% N - FYM 75% RDF 1.33 1.07 0.87 38.35 19.38 18.97T8 50% RDF + 50% N - WS 100% RDF 1.31 1.11 0.93 39.21 19.59 19.61T9 75% RDF + 25% N - WS 75% RDF 1.34 1.05 0.85 38.26 19.19 19.06T10 50% RDF + 50% N - LL 100% RDF 1.33 1.06 0.92 38.97 19.74 19.23T11 75% RDF + 25% N - LL 75% RDF 1.35 1.04 0.84 37.95 19.21 18.75T12 Farmers practice Farmers 1.45 0.70 0.65 33.63 16.73 16.89
(50 :25:00 NPK) practiceSE (m) ± 0.02 0.03 0.02 0.16 0.13 0.17CD at 5% 0.05 0.07 0.07 0.48 0.39 0.49

the magnitude of increase was more due toorganics. The hydraulic conductivity underintegrated nutrient management improved(1.31 cm hr-1) as compared to use of onlychemical fertilizers (0.93 cm hr-1) and farmerspractice (0.70 cm hr-1) indicating role oforganics in improving other physical propertieslike bulk density, water retention and MWD.Improvement in hydraulic conductivity of blacksoils due to continuous addition of organics incombination with inorganic as compared toinorganics alone was reported by Nambiar and
Ghosh (1984) and Bellaki and Badanur (1997).
Mean weight diameter : The meanweight diameter is an important indicator of soilaggregates and soil quality. It was significantlyhighest (1.01 mm) with the application of 50%NPK + 50% N through FYM, which is superiorto all the remaining treatments (Table 1 andFig. 2). The mean weight diameter of soil variedfrom 0.57 mm to 1.01 mm under varioustreatments and showed significant variation.The lowest mean weight diameter (0.57 mm)was observed under control followed by thetreatments of only chemical fertilizer (0.71 to0.73 mm). The mean weight diameter showed57.8 per cent increase due to integrated use ofchemical fertilizers with FYM over control. Theincrease in mean weight diameter at FYMapplied plots could mainly be due to the resultof basal application of FYM, which significantlyimproved the soil aggregation (Prasad andSingh, 1980; Selvi et al., 2005 and Hati et al.,
Journal of Agriculture Research and Technology 15
Fig. 1 Hydraulic conductivity as influenced bylong term manuring and fertilizerapplication
Table 2. Long-term effect of various treatments on productivity and soil chemical properties under sorghum-wheat sequence(2010-11) (27th cycle)
Treat- Sorghum Wheat Yield (q ha-1)ment –––––––––––––––––––––––––––––––––––––––––––––––––
Sorghum Wheat––––––––––––––––––––––––– ––––––––––––––––––––––––Initial (2010-11) Initial (2010-11)(1984-85) (27th cycle) (1984-85) (27th cycle)
T1 Control Control 8.91 2.55 2.17 4.58T2 50% RDF 50% RDF 24.85 19.67 6.64 13.28T3 50% RDF 100% RDF 30.18 20.66 7.93 19.18T4 75% RDF 75% RDF 26.27 21.99 6.32 17.79T5 100% RDF 100% RDF 29.82 26.50 7.46 23.26T6 50% RDF + 50% N - FYM 100% RDF 30.74 24.58 7.28 26.23T7 75% RDF + 25% N - FYM 75% RDF 25.92 23.76 6.53 21.03T8 50% RDF + 50% N - WS 100% RDF 26.27 21.64 7.46 21.47T9 75% RDF + 25% N - WS 75% RDF 23.79 22.81 7.92 20.12T10 50% RDF + 50% N - LL 100% RDF 26.45 23.75 5.34 22.06T11 75% RDF + 25% N - LL 75% RDF 17.4 24.38 7.31 20.30T12 Farmers practice (50 :25:00 NPK) Farmers practice 23.79 18.74 7.61 11.90SE (m) ± - 0.84 - 1.08CD at 5 % - 2.42 - 3.10CV (%) - 11.05 - 9.87

2007). This may be ascribed to theimprovement in physical condition of soil andto the increased organic carbon content whichmight be responsible for stabilization ofaggregates and hence higher mean weightdiameter with the application of FYM andinorganic fertilizers. Dinel et al.1991, reportedthat increase in MWD may be associated withincrease in organic matter content which isknown to improve soil structure. The addedorganics could supply additional fresh organicresidues (water soluble and hydrolysablesubstrates) and carbon to the soil resulting inthe production of microbial polysaccharidesthat increase aggregate cohesion, which couldexplain the progressive increase in aggregatestability to mechanical breakdown. Thestructure especially in clayey, smectitic soils isconsiderably hard and many times moderate tocoarse in the form of large hard clods. Thecontinuous application of only chemicalfertilizers did not show much improvement inthe MWD in the long run indicating animmense need of organics to improve such animportant soil physical property which isreflected in the treatments of INM.
Water retention : The water retention at33 kPa and 1500 kPa varied significantly andhighest water retention at 33 kPa (39.77 percent) and at 1500 kPa (19.82 per cent) wasrecorded with the application of 50% NPK +50% N through FYM followed by NPK + wheatstraw and NPK + green manuring - Leucaenaloppings (Table 1). Continuous cropping over aperiod of 27 years without manures andfertilizers caused significant decline in the waterretention (32.38 per cent at 33 kPa and 16.06per cent at 1500 kPa).
Integrated use of chemical fertilizers withorganics recorded 9.28 to 9.71 per centincrease in water retention at 33 kPa and 9.31to 9.97 per cent increase in water retention at1500 kPa over use of only chemical fertilizers.
Thus, it was observed that the meanavailable soil moisture content was significantlyenhanced (19.26 per cent) due to integrateduse of FYM (T6, T7), wheat straw (T8, T9), andgreen manure (T10, T11) along with chemicalfertilizers as compared to only chemicalfertilizers (17.64 per cent). Bhattacharyya et al.(2004) reported that, increased soil availablemoisture might be attributed to increasedorganic matter status of soil and improved soilstructure.
Productivity of sorghum and wheat :The application of 50% N through FYM alongwith 50% RDF was found superior among allthe INM treatments, the yield was recorded tothe extent of 24.58 and 26.23 q ha-1 forsorghum and wheat, respectively. However,inclusion of organics was found beneficial in
Mali et al.16
Fig. 2 Mean weight diameter as influenced bylong term manuring and fertilizerapplication
Fig. 3 Available water capacity as influencedby long term manuring and fertilizerapplication under sorghum-wheatcropping sequence

increasing the yield of both the crops. Thehigher yield of sorghum under only chemicalfertilizers in comparison with integratednutrient management during some years maybe due to the use of FYM, wheat straw andgreen manure during kharif season which mighthave helped more subsequently in rabi seasonresulting into higher yields of wheat underintegrated nutrient management as comparedto only chemical fertilizers.
It can be concluded that long termintegrated nutrient management with FYM,green manuring with leucaena loppings andcrop residues recycling with wheat straw isuseful for improving physical properties likebulk density, MWD and AWC of swell-shrinksoils under continuous cropping. Continuoususe of only chemical fertilizers without organicsresulted deterioration of soil physicalproperties.
ReferencesAnonymous, 2007. Research review committee report of
the Dept. of Soil Science and Agril. Chemistry, Dr.PDKV., Akola: 9-10.
Anonymous., 2010, Monthly Review of the IndianEconomy (CMIE), Economic Intelligence Service.August, 2010:43-45.
Bellaki, M. A. and Badanur, V. P. 1997. Long-term effectof integrated nutrient management on properties ofVertisol under dryland agriculture. J. Indian Soc. Soil.Sci. 45(3): 438-442.
Bhattacharyya Rajan, Ved Prakash; Kundu S., Srivastva, A.K. and Gupta, H. S. 2004. Effect of long-termmanuring on soil organic carbon, bulk density andwater retention characteristics under soybean - wheatcropping sequence in north-western Himalayas. J.Indian Soc. Soil Sci. 52(3): 238-242.
Blake, G. R. and Hartge, K. H. 1986. Bulk density. In:Methods of Soil Analysis, Part-I, Klute, A. (Ed.).American Society of Agronomy Inc. and Soil ScienceSociety of America Inc. Madison, Wisconsin, USA,pp. 371-373.
Dinel, H., Mathur, S. P. and Levesque, M. 1991.Improvement of physical properties of degradedshallow organic soils by admixing organic overlays andmineral sublayers, Canadian J. of Soil Sci. 71: 101-117.
Hati Kuntal M, Anand Swarup, Dwivedi, A. K., Misra, A.K. and Bandyopadhyay K. K. 2007. Changes in soilphysical properties and organic carbon status at thetopsoil horizon of a Vertisol of Central India after 28years of continuous cropping, fertilization andmanuring. Agric. Ecosyst. Environ. 119(1-2): 127-134.
Kemper, W. D. and Rosenau, R. C. 1986. Aggregatestability and size distribution. In A. Klute (Ed.) Methodsof Soil Analysis Part-I. 2nd ed. ASA and SSA,Madison, Wisconsin. pp. 425-442.
Klute, A. 1986. Water retention. Laboratory Methods. In AKlute (Ed.) Methods of Soil Analysis Part-I. 2nd ed.Agron. Monograph 9. Madison, Wisconsin. pp. 635-662.
Klute, A. and Dirksen, C. 1986. Hydraulic conductivity anddiffusivity, laboratory methods. In Methods of SoilAnalysis Part-I. Ed. Klute, A. Agron. Monogrpah 9,Madison, Wisconsin. pp. 716-719.
Nambiar, K. K. M. and Ghosh, A. B. 1984. Highlights ofresearch of long-term fertilizer experiments in India.LTFE Res. Bulletin 1. Indian Council of AgriculturalResearch, New Delhi. pp. 94-100.
Prasad, B. and Singh, A. P. 1980. Changes in soilproperties with long-term use of fertilizers, lime andfarmyard manure. J. Indian Soc. Soil Sci. 28: 465-468.
Selvi, D., Santhy, P. and Dhakshinamoorthy, M. 2005.Effect of inorganics alone and in combination withfarmyard manure on physical properties andproductivity of Vertic Haplustepts under long-termfertilization. J. Indian Soc. Soil Sci. 53(3): 302-307.
Journal of Agriculture Research and Technology 17
______________

Soil salinity/sodicity is one of the mostserious forms of soil quality degradationaffecting approximately 10 per cent of the totalland surface of the world. The problem occursin varying intensities in more than 120countries and is more prominently witnessed inthe arid and semi-arid areas (Yadav, 1993). Insemi-arid and arid regions, irrigation inducedproblems of water- logging, secondarysalinization and sodification goes hand in hand.These problems pose a great threat to thesustainable agricultural productivity. Nearly 10-12 per cent area of shrink-swell soils underdifferent command areas in Maharashtra isinfluenced by secondary salinization andsodication (Varade et al. 1985). Presence ofsodic soil is a serious problem in arid and semi-arid areas. In India 9.55 m ha of soils reportedto be salt affected out of which 4.05 m ha ofsoils are adversely affected by sodicity (Kanwar,1994) of which 0.42 m ha occurs inMaharashtra (Challa et al., 1995).
Excess exchangeable sodium along withhigh pH and poor physico-chemical propertieslead to decrease in organic carbon and availablenitrogen (Kumar et al., 1995) and adverselyaffect the uptake of phosphorus (Khanna et al,1983). Application of gypsum has frequentlyrecommended to mitigate the adverse effect ofsodic soils on crop growth (Singh et al., 2005).Adequate information is not available on thegrowth of wheat and yield reduction in the soilshaving different ESP levels with application ofgypsum and organic amendments in the semi-arid climate. Hence, present investigation wasundertaken to generate data to manage the saltaffected soils efficiently having different ESPlevels and its influence on wheat productivity onfarmer's field.
Materials and Methods
The study area is a part of Mula commandarea in Rahuri Tehsil of Ahmednagar district ofMaharashtra state. The area comprises ofKendal Bk, Kendal Kd and Chandkapur villages
J. Agric. Res. Technol., 41 (1) : 018-023 (2016)
Response of Wheat to Gypsum and Organic Amendments atdifferent ESP levels in Mula command area of Ahmednagar
District, Maharashtra
K. D. Kale1 and A. L. Pharande2
Dept. of Soil Science and Agricultural Chemistry, Mahatma Phule Krishi Vidyapeeth, Rahuri - 413 722 (India)(Received : 02-05-2015)
AbstractThe experiment to study the response of wheat to gypsum and organic amendments at different ESP
levels was carried out at farmer's field in Mula command area. The results indicated that the Gypsum @ 50%GR + 10 ton ha-1 Bio- methionated spent wash press mud cake (SWPMC) recorded significantly higher plantheight, length of panicle, grain and straw yield. As regards ESP levels, treatment (T1) ESP level < 5.0 recordedsignificantly maximum plant height, number of tillers plant-1 and length of panicle, grain and straw yield thanrest of the treatments. The highest per cent reduction in grain and straw yield of wheat was recorded in thetreatment of ESP level 20-25 per cent over 5.0 ESP level. The results indicated that application of gypsumand SWPMC improved the chemical properties of soil which helped in increasing yield of wheat as comparedto control (RDF).
Key words : Wheat grain and straw yield, ESP levels, gypsum, organic amendments.
1. Assistant Professor and 2. Head.

in Rahuri tehsil. The study area is locatedbetween 19°51' to 19°54' N latitude and 74°21' to 74° 25' E longitude covers total area of688.53 ha. Its elevation is 502 m above meansea level and is situated about 15 km east toRahuri town on both sides of distributory No.2of Mula right bank canal. The soils of study areaare slight to severely salt affected, nearly leveledto very gentle slopping midlands of low lyingarea of lower and upper pedimont plains (basinshape topography). The slope gradient of studyarea ranged between 1 to 3 per cent and due toland leveling the natural drains found to bedevastated. The climate of study area is semi-arid tropical and characterized by hot summer(March to May) and general dryness in othermonths except in rainy months (June toSeptember). The average rainfall of study areais 535.4 mm with ustic soil moisture andhyperthermic soil temperature regimes.
The standard methodology of detailed soilsurvey was followed. The Survey of India (SOI)topographical sheets in 1:50,000 scale (47I/11) was used to collect topographicinformation. The toposheets were used forlocation of sample areas, ground truth sites andplanning for traverse routes in the field andcultural details. A cadestral map of the areagiven in the scale of 1:8000 was used as a basemap for delineating boundaries and number ofsoil sample spots of scale 1:250 m was used.In each class one representative pedon was dug
out and examined morphologically (Soil SurveyStaff, 2006). Nine representative typifyingpedons were selected for this study. Horizonwise soil samples were collected, processed andanalysed for chemical properties by usingstandard procedures (Page et al., 1982).Among the saline and sodic soil units thedegree of degradation was categorized(Richards 1968) based on pHs, ECe and ESP ofthe saturation extracts of the soils and theextent of the degradation in each class wasassessed by making further classes in eachcategory. The experiment was conducted atfive farmer's field in the command area. Basedon the degree of degradation the fieldexperiment on farmers' field having variableESP was conducted during 2007-08. The soilunits having ESP in the groups of < 5, 5 to 10,10-15, 15 to 20 and 20 to 25 were selected.The initial soil properties of the fieldexperimental are as given in table 1.
The treatments consists of T1 : Control(RDF) ; T2 : Gypsum 50% GR + 10 t ha-1 FYMand T3 : Gypsum 50% GR + 10 t ha-1 SWPMC
Journal of Agriculture Research and Technology 19
Table 1. Details of initial soil properties
Taxonomic classification and location pHs ECe O.C. Ex-Na ESP GR(dS m-1) (%) (cmol (%) (T ha-1)
(p+) kg-1)
Typic Haplustepts Chandkapur , Survey No. 279 8.20 6.49 0.71 2.64 4.38 7.00Vertic Haplustepts Kendal Bk, Survey No. 40/2 8.30 7.76 0.63 4.77 9.64 10.0Vertic Haplustepts Kendal Bk, Survey No. 17 8.30 7.40 0.58 6.51 13.39 21.00Sodic Haplusterts Kendal Kd, Survey No. 238 8.50 5.64 0.48 8.68 18.08 25.00Sodic Calciusterts Kendal Kd, Survey No. 234 8.85 0.85 0.43 12.28 24.11 28.00
Table 2. Nutrient content of FYM and SWPMC
Element Organic manures–––––––––––––––––––––––FYM SWPMC
N (%) 0.60 1.30P (%) 0.30 0.75K(%) 0.85 2.00

(GR- Gypsum requirement). The experimentwas laid out in split plot design with 5 ESPlevels in main plot and three treatments in subplot with three replications. The fieldexperiments were carried out on farmers fieldat Kendal Bk, Kendal Kd and Chandkapur,tehsil Rahuri, Dist. Ahmednagar. The field wasploughed upto 30 cm depth by tractor and allpreparatory tillage operations were carried out.The beds of size 5.0 m length and 4.1 m widthwere prepared. Gypsum @ 50 per cent of GRand 10 t ha-1 of SWPMC and FYM werethoroughly mixed in the surface soil 15 daysprior to sowing of the wheat crop, then the fieldwas irrigated once to replace the Na+ on claycomplex and leach the salts present in the soilby gypsum. The nutrient content of Farm YardManure (FYM) and Spent Wash Press MudCake (SWPMC) is given in table 2.
The good quality wheat seed (Triticumaestivum L.) of variety Trimbak was used @125 kg ha-1. Half dose of N (60 kg N ha-1),full dose of P2O5 (60 kg ha-1) and full dose ofK2O (40 kg ha-1) were applied through urea,single super phosphate and muriate of potashas per the RDF (120 : 60: 40, N:P:K) to all thetreatments. After 30 days of sowing remainingdose of 60 kg N ha-1 was applied through urea.Dimethioate 35 per cent EC (1.5 ml L-1) wassprayed to control Jassids. During the period ofcrop growth, the biometric observations viz.,plant height, number of tillers plant-1 andpanicle length was recorded. The crop washarvested from 9/3/2007 to 14/03/2007 andthe grain and straw yields were recorded.
Results and Discussion
Wheat yield based on degree of soildegradation
Growth contributing characters : Thegrowth contributing characters like plantheight, number of tillers plant-1 and length ofpanicle of wheat at harvest were significantly
Kale and Pharande20
Table 3. Effect of soil amendments in conjunction withorganics on growth contributing characters ofwheat at different levels of ESP on farmers field
ESP T1 T2 T3 Meanlevels
Plant height (cm)
< 5 94.8 96.0 98.3 96.4
5-10 71.0 76.2 80.0 75.8 (21.40)
10-15 70.0 72.0 74.6 72.2 (25.10)
15-20 52.3 62.0 73.7 62.7 (34.96)
20-25 52.2 58.7 59.3 56.7 (41.21)
Mean 68.0 73.0 77.18 -
S.E.± CD at 5 %
L 0.96 3.13
T 0.66 1.95
L x T 1.48 4.35
T x L 1.54 4.64
Number of tillers plant-1
< 5 8.0 8.7 9.0 8.57
5-10 7.6 8.0 8.33 7.97 (7.0)
10-15 7.00 7.4 7.7 7.37 (14.0)
15-20 6.00 6.7 7.0 6.57 (23.2)
20-25 5.33 6.00 6.33 5.87 (31.5)
Mean 6.78 7.36 7.66 -
S.E.± CD at 5 %
L 0.27 0.89
T 0.26 N.S.
L x T 0.59 N.S.
T x L 0.56 N.S.
Length of panicle (cm)
< 5 7.33 7.67 8.33 7.77
5-10 6.33 6.67 7.33 6.77 (12.87)
10-15 5.67 6.33 7.00 6.33 (18.53)
15-20 5.33 5.67 5.67 5.57 (28.31)
20-25 5.00 5.33 5.33 5.20 (33.08)
Mean 5.92 6.34 6.72 -
S.E.± CD at 5 %
L 0.37 1.22
T 0.15 0.43
L x T 0.33 N.S.
T x L 0.46 N.S.
Where, T1 - RDF, T2 - 50% GR + FYM, T3 - 50% GR +SWPMC. (Figures in parenthesis indicate per cent reduction over <5.0 ESP level)

influenced by different ESP levels and soilamendment treatments and organics (Table 3).The treatment of ESP level < 5.0 per centrecorded significantly highest plant height (96.4cm), number of tillers per plant (8.57) andlength of panicle (7.77 cm) than the rest of thetreatments. The highest per cent reduction inthe plant height (41.21 %), number of tillersplant-1 (31.50 %) and length of panicle(33.08%) was recorded in the treatment of ESPlevel of 20-25 per cent as compared with ESPlevels of < 5.0 per cent.
The soil amendment treatment of gypsum @
50% of GR and SWPMC @ 10 t ha-1 recordedsignificantly higher plant height and length ofpanicle than the Gypsum @ 50% GR and FYM10 t ha-1 and RDF treatments. The plantheight, number of tillers plant-1 and length ofpanicle as influenced by ESP levels showedfollowing decreasing trend; ESP <5.0 %) < ESP(5-10%) < ESP (10-15%) < ESP (15-20%) <ESP (20-25%).
The increase in plant height, number oftillers plant-1 and length of panicle due toamendments (gypsum) and organics likeSWPMC and FYM might be due to the
Journal of Agriculture Research and Technology 21
Table 4. Grain and straw yield of wheat at different levels of ESP on farm field
ESP levels T1 T2 T3 Mean
Grain yield (q ha-1)
< 5 34.25 36.33 38.42 36.33
5-10 31.57 (7.82) 33.05 (9.03) 33.95 (11.63) 32.85 (9.58)
10-15 23.23 (32.17) 25.91 (28.63) 27.10 (29.46) 25.41 (30.05)
15-20 20.25 (40.88) 22.63 (37.71) 22.93 (40.32) 21.93 (39.64)
20-25 17.27 (49.58) 18.76 (48.36) 19.93 (48.12) 18.65 (48.66)
Mean 25.31 27.34 28.47 -
S.E.± CD at 5 %
L 0.51 1.65
T 0.56 1.65
L x T 1.25 N.S.
T x L 1.14 N.S.
Straw yield (q ha-1)
< 5 60.15 62.86 64.32 62.43
5-10 54.79 (8.91) 57.47(8.53) 59.86(6.93) 57.37(8.10)
10-15 43.78(27.22) 46.75(25.59) 48.24(25.00) 46.25(25.92)
15-20 35.14(41.58) 37.52(40.28) 39.90(37.97) 37.52(39.90)
20-25 31.86(47.03) 33.80(46.20) 34.84(45.83) 33.50(46.34)
Mean 45.14 47.67 49.33 -
S.E.± CD at 5 %
L 1.04 3.40
T 0.68 2.00
L x T 1.52 N.S.
T x L 1.62 N.S.
Where, T1 - RDF, T2 - 50% GR + FYM, T3 - 50% GR + SWPMC (Figures in parenthesis indicate per cent reduction over < 5.0 ESP level )

improvement in soil physical as well aschemical properties which in turn help in theavailability of nutrients for plant growth. Similarresults of increase in height of wheat cropunder gypsum treatment on sodic soil werereported by Swarup (1993).
Interaction effect : The number of tillersplant-1 and length of panicle was not influencedsignificantly due to interaction effect betweenESP levels and soil amendments. However, theinteraction effect between ESP levels anddifferent soil amendments on plant height wassignificant.
Grain and straw yield : The grain andstraw yield of wheat at different ESP levels weresignificantly influenced by soil amendment andorganic treatments (Table 4). The treatment ofESP level < 5.0 per cent recorded significantlyhighest grain (36.33 q ha-1) and straw yield(62.43 q ha-1) than rest of the treatments. Thehighest per cent reduction in grain (48.66%)and straw yield (46.34%) of wheat wasrecorded in the treatment of ESP level 20-25per cent over the ESP level < 5.0 per cent.
The grain and straw yield as influenced bysoil amendments and organic treatments weresignificantly higher in treatment of 50 per centGR and SWPMC over rest of the treatments.More (1994) reported similar results of highestyield of rice and wheat by FYM + Pressmud @20 t ha-1 treatment in sodic vertisols. Theapplication of gypsum alongwith SWPMChelped to increase the grain and straw yield by21.32 and 17.28 per cent as compared toRDF. This indicates that to restore the fertilityof sodic soils and to increase the grain andstraw yield of wheat it is necessary to apply thegypsum and SWPMC @ 10 t ha-1. The strongameliorative effect of gypsum as an amendmentunder sodic soils was reported by Singh et al.(2009) and Verma and Abrol (1980).
The increase in the grain and straw yield ofwheat due to application of gypsum andSWPMC might be attributed to the supply ofcalcium by gypsum, which has helped inreclamation of soil by replacing sodium on theexchange complex of soil and solubilization ofnative calcium carbonate due to organic acidsproduced during the decomposition of organicmatter present in SWPMC which also helped inreclamation process. This might have resultedinto better aggregation leading to improvementin the physical properties of soil like structure,bulk density, porosity, hydraulic conductivityand ultimately good drainage resulting intoimprovement in better air and waterrelationship. The increase in yield is due toreclamation by the use of amendments whichhelps in reducing the salt stress and improvingthe nutrient availability for better plant growth.
Interaction effect : The interaction effectbetween ESP levels and different soilamendments on grain and straw yield of wheatwas non significant.
It can be concluded that the application ofgypsum and spent wash press mud cake forwheat has increased the yield overrecommended dose of fertilizer. The per centyield reduction in grain and straw yield washigher in the treatment of ESP 20-25 per centas compared to 5 per cent ESP level. Theamendments helped in reclamation processwhich might have resulted into betterimprovement in the properties of soil for bettercrop growth.
References Challa, O., Vadivelu, S. and Sehgal, J. 1995. Soils of
Maharashtra for optimizing land use. NBSSpublication No. 546, NBSS & LUP, Nagpur, India,pp. 25-49.
Kanwar, J. S. 1994. Management of soil and waterresources for sustainable agriculture and environment.Diamond Jubilee Symp. "Management of Land andWater Resources for Sustainable Agriculture and
Kale and Pharande22

Environment". Indian Society of Soil Science pp. 1-10.
Khanna, S. S., Gupta, A. P. and Tomar, N. K. 1983.Efficiency of residual phosphatic fertilizers at variouslevels of sodicity for rice. Indian J. of Agric. Sci.53,143.
Kumar, A., Sharma, D. K. and Sharma, H. C. 1995. Waterand nitrogen needs of wheat (Triticum aestivum) insodic soil. Indian J. of Agric. Sci., 65, 323-327.
More, S. D. 1994. Effect of farm waste and organicmanures on soil properties, nutrient availability andyield of rice-wheat grown on sodic Vertisol. J. of theIndian Soc. Soil Sci. 42(2): 253-256.
Page, A. L., Miller, R. H. and Keeney, D. R. 1982.Methods of Soil Analysis. part 1 and 2. Chemical andMicrobiological properties. Second Edition, AgronomyMonograph 9. ASA and SSSA, Madison, Wisconsin,USA.
Richard, L. A. 1968. Diagnosis and Improvement of Salineand Alkali soils. United State Salinity Laboratory Staff.Agril. Handbook No. 60, Oxford and IBH Publ. Co.Calcutta. pp. 1-56.
Singh Bikram, Singh Satyavir, Singh Jagder, Kumar Anil,Singh Sultan and Tikkoo Abha. 2009. Response ofIndian Mustard (Brassica juncea L.) to nitrogen and
phosphorus with and without gypsum in sodic soilsirrigated with sodic water. J. of the Indian Soc. SoilSci. 57(2) : 178-182.
Singh, S., Dhankar, O. P. and Tikkoo, A. 2005.Importance of gypsum in crop production under sodicwater use in light textured soils of Haryana. J. of theIndian Soc. Soil Sci. 53: 249-253.
Soil Survey Staff. 2006. Key to soil texonomy. 10thEdition. United States Department of Agriculture.Natural Resource Conservation Services. WashingtonD.C. 1-35.
Swarup Anand, 1993. Integrated nutrient supply andmanagement system for sustained crop production inalkali soils. Fert. News. 38(9): 27-34.
Verma, K. S. and Abrol, I. P. 1980. Effect of gypsum andpyrites on yield and chemical composition of rice andwheat grown in highly sodic soil. Indian J. of Agric.Sci. 50(12): 935-942.
Varade, S.B., Palaskar, M.S. and More, S.D. 1985.Characteristics and reclamation of salt affectedVertisols in canal commands. J. of the Maharashtraagric. Univ. 10:115-120.
Yadav. J.S.P. 1993. Salt affected soils and theirmanagement with special reference to Uttar Pradesh.J. of the Indian Soc. Soil Sci. 41 : 623-629.
Journal of Agriculture Research and Technology 23
______________

In India the area under maize was 8.10million hectare with production andproductivity of 21.06 million tonnes and 2510kg ha-1. In Maharashtra area under maize was0.67 million hectare with production andproductivity of 1.79 million tonnes and 2664kg ha-1 (Anonymous, 2012). Maharashtraranks fourth in terms of production of maize inthe country.
Balanced fertilization is a must for realizinghigher use efficiency and economy of fertilizeruse (Velayutham and Reddy, 1990). Soil testbased fertilizer recommendation plays a vitalrole in ensuring balanced nutrition to crops andfertilizer schedules should therefore be based onthe magnitude of crop response to appliednutrients at different soil fertility levels. Theadvantage with targeted yield fertilizerrecommendations based on soil test can be
taken with high profitability both for high andlow levels of fertilizer investment. Soil testbased fertilizer applications as per STCRprescription equations is one of the efficientapproaches for balanced use of costly fertilizerinputs. Keeping this in view, the research workwas undertaken to develop fertilizerprescription equation based on soil test valueand yield target for precise recommendation offertilizers to maize.
Material and Methods
Soil test crop response studies on maize wasconducted during kharif 2009-10 on VerticHaplustepts at STCR Farm, Mahatma PhuleKrishi Viyapeeth, Rahuri, Ahmednagar districtof Maharashtra. The farm is geographicallylocated at 22°11' N latitude and 80°09' Elongitude at an altitude of 519 m above MSL.The texture of soil was clayey with low inKMNO4-N (205.75 kg ha-1), medium in 0.5 MNaHCO3-P (33.72 kg ha-1) and very high in
J. Agric. Res. Technol., 41 (1) : 024-029 (2016)
Soil Test Based Targeted Yield Approach for BalanceFertilization of Maize in Inceptisol
A. D. Kadlag1, S. D. Kale2, S. M. Todmal3 and A. L. Pharande4
AICRP for Investigations on Soil Test Crop Response Correlation, Dept. of Soil Science and Agril. Chemistry,Mahatma Phule Krishi Vidyapeeth, Rahuri - 413 722 (India)
(Received : 02-05-2015)
AbstractField experiment on soil test crop response studies of Maize was conducted during 2009-10 and its
validation experiments were conducted during 2012 -13 to 2014-15 at MPKV, Rahuri. Nutrients requirementof maize were 1.62, 0.92 and 1.94 kg N, P and K per quintal of maize grain produce. Soil contribution intotal NPK uptake of maize was 23.24, 47.49 and 12.07 per cent respectively, while FYM contributes 22.23,20.04 and 14.32 per cent, respectively. The per cent contribution of fertilizer nitrogen, phosphorous andpotassium in absence of FYM was 35.89, 45.01 and 75.22, respectively, which increased to 41.73, 48.08and 92.68 per cent respectively in conjoint use of fertilizer with FYM. The targeted yield fertilizer equationswithout FYM showed 5.67 per cent deviation in actual yield while target was achieved with conjoint use offertilizers and organic manure. Application of fertilizer nutrient as per 70 q ha-1 yield target of maize with 10t FYM ha-1 shows highest yield of 69.51 q ha-1. The total uptake of N, P and K by maize were 112.89,54.17 and 89.94 kg ha-1 respectively in the treatment STCRC target 70 q ha-1 + 10 t ha-1 FYM.
Key words : Maize, nutrient requirement, targeted yield fertilizer equations.
1. Associate Professor, 2. and 3. Senior ResearchAssistant and 4. Head.

N N NH4OAc-K (523.33 kg ha-1). The soil wasslightly alkaline in reaction.
The inductive cum fertility gradientapproach (Ramamoorthy et al., 1967) wasfollowed for conducting the field experiment.Experimental plot was divided into low,medium and high fertility gradients by theapplying graded doses of fertilizer (00:00:00,120: 60:40 and 240:120:80 kg N: P2O5:K2O ha-1 respectively) and stabilized withgrowing fodder maize crop. After harvest offodder maize FYM blocks (0, 10 and 20 t ha-1)were imposed across the fertility gradient.Twenty one different treatment combinations(N0 P60 K40, N60 P60 K40, N60 P60 K40, N60P30 K20, N60 P30 K40, N120 P60 K40, N120P30 K40, N120 P90 K40, N120 P60 K40, N120P60 K40, N120 P30 K20, N120 P90 K60, N120P60 K0, N120 P0 K40, N180 P60 K40, N180 P90K60, N180 P90 K40, N180 P60 K60, N180 P30K20, N180 P60 K20, N180 P90 K20, N0 P0 K0,N0 P0 K0, N0 P0 K0) of graded level of N (00,60, 120, 180 kg ha-1), P2O5 (00, 30, 60,90 kgha-1) and K2O ( 00, 20, 40, 60 kg ha-1) werelaid out along with three control plots (N00 P00K00). These twenty four treatments wererandomly distributed in such a way that eachfertility gradient block and FYM block include allthe twenty four treatment set. The maize hybridRajarshee was used as a test crop. All therecommended package of practices werefollowed while culativating the crop. Full doseof phosphorous and potassium were applied asbasal dose through single superphosphate andmuriate of potash while nitrogen fertilizers wereapplied in 3 equal splits (at sowing , 30 daysafter sowing and 60 days after sowing) as pertreatment details.
The initial soil samples were collected fromeach plot before application of FYM andfertilizer and analyzed for their KMnO4-N(Subbiah and Asija 1956), Olsen- P (Olsenet al. 1954) and neutral normal NH4OAc -K(Hanway and Heidal, 1952). The FYM used in
the experiment was analyzed for total nitrogenby using H2SO4 and digestion mixture usingmacro - Kjeldhal method while phosphorousand potassium were estimated by tri acidmixture (10:1:4 HNO3: HClO4: H2SO4) at180-200 °C (AOAC, 2005). Grain yield andstover yield were recorded and these sampleswere analyzed for N, P and K content (Piper,1966) and uptake values are computed. Usingthe data of nutrient uptake, grain yield, initialsoil available nutrients and fertilizer dosesapplied, basic parameters, viz., nutrientrequirement (NR), contribution of particularnutrient from soil (CS), contribution of FYM(CFYM) and contribution of fertilizer withoutFYM (Cfa) and with FYM (Cfb) were calculated(Reddy et al., 1964 and Subba Rao andShrivastava 1999). These basic parameterswere used for formulating the fertilizerprescription equations.
The validation of targeted yield equationsdeveloped for maize (grain) were tested byconducting four different follow up trials duringthree consecutive years from 2012-13 to2014-15 on Inceptisol at STCR farm and onefollow up trial at ARS, Kajbe Digraj, MPKV,Rahuri. The experiments were laid out inrandomized block design with three replicationsand eight treatments viz., Control (no fertilizer),GRDF (120: 60: 40 kg ha-1 N: P2O5: K2O +FYM @ 10 t ha-1) , Fertilizer as per soil testvalues, Fertilizers as per STCR target of60 q ha-1 and 70 q ha-1 without FYM and with10 tha-1 FYM, respectively and only FYM@ 20 tha-1. Based on the initial soil tests andthe yield targets aimed, fertilizer N, P205 andK20 doses were applied for STCR treatments.All the recommended package of practiceswere followed. Fertilizers sources and methodof application were same as in main trial. Grainyield and stover yield was recorded for eachplot and analyzed for NPK uptake, economicswas worked out for each treatment.
Journal of Agriculture Research and Technology 25

Results and Discussion
Yield and nutrient uptake : The rangeand mean value of maize grain and stover yieldand total nutrient uptake of treated and controlplot are given in Table 1. The grain yield intreated plots ranged from 24.33 to 55.45q ha-1 with a mean of 45.28 q ha-1. Whereas,in control plot, grain yield ranged from 15.7 to29.0 q ha-1 with a mean of 22.3 q ha-1. Thestover yield in treated plots ranged from 35.82to 67.17 q ha-1 with a mean of 50.53 q ha-1.Whereas, in control plot, stover yield rangedfrom 22.39 to 50.62 q ha-1 with a mean of32.11 q ha-1. Sen Gupta (1966) reported thatapplication of FYM increased dry matter andgrain yield of maize than those fromunmanured plots.
The total nutrient uptake of nitrogen,phosphorous and potassium in treated plotsranged from 49.09 to 126.16, 27.1 to 53.87,and 52.33 to 120.87 kg ha-1 with a mean of87.80, 41.33 and 87.80 kg ha-1, respectively.Whereas, the total nutrient uptake of nitrogen,
phosphorous and potassium in control plot wasranged from 30.24 to 54.77, 14.14 to 30.27,and 31.55 to 79.05 with a mean of 43.63,21.70 and 48.10 kg ha-1, respectively.
The results revealed that nitrogen uptake bymaize was more with higher levels of nitrogenapplication in low fertility status soils. Whereas,lower levels of nitrogen application recordedmore nitrogen uptake in higher fertility statussoils. These results are in accordance with theresults of Bachhav and Sable, 1996. Thecombination of levels of N, P2O5 and K2O inconjunction with FYM were not showed theconsistent relationship with phosphorus uptakeby maize grain. Addition of FYM improves thecation exchange capacity of soil which mayincrease the availability and enhancedpotassium uptake (Krauss and Malik,1995).
The data clearly indicate wide variabilityexisted in yield and total nutrient uptake intreated and control plots, which is prerequisitefor calculating basic parameters and fertilizer
Kadlag et al.26
Table 1. Range and average value of maize grain yield and nutrient uptake in treated and control plot
Parameter Treated plot Control plot–––––––––––––––––––––––––––––– –––––––––––––––––––––––––––––––Range Mean Range Mean
Maize grain yield (q ha-1) 24.33 - 55.45 45.28 15.7 - 29.0 22.3Maize stover yield (q ha-1) 35.82 - 67.17 50.53 22.39 - 50.62 32.11
Total nutrient uptake (kg ha-1)Nitrogen 49.09 - 126.16 87.80 30.24 - 54.77 43.63Phosphorus 27.10 - 53.87 41.33 14.14 - 30.27 21.70Potassium 52.33 - 120.87 87.80 31.55 - 79.05 48.10
Table 2. Nutrient requirement, contribution from soil, fertilizer and FYM for Maize
Parameter N P K
Nutrient requirement (kg q-1) 1.62 0.92 1.94Contribution from soil available nutrients (%) 23.24 47.49 12.07Contribution of fertilizer in absence of FYM (Cfa) (%) 35.89 45.01 75.22Contribution of fertilizer with FYM (Cfb) (%) 41.73 48.08 92.68Contribution of FYM (%) 22.23 20.04 14.32

equations for calibrating fertilizer dose forspecific yield target.
Basic parameters : The amount ofnutrients required to produce one quintal grainyield was observed to be 1.62, 0.92 and 1.94kg N, P and K, respectively. The soilcontribution (Cs) in total uptake of nitrogen,phosphorous and potassium in maize 23.24,47.49 and 12.07 per cent, respectively. TheFYM contributes 22.23, 20.04 and 14.32 percent of total uptake of nitrogen, phosphorousand potassium in maize. The per centcontribution of fertilizer nitrogen, phosphorousand potassium in absence of FYM (Cfa) were35.89, 45.01 and 75.22, respectively whichincreased to 41.73, 48.08 and 92.68 percent respectively due to conjoint use ofchemical fertilizers with FYM (Cfb).
The nutrient contribution from fertilizersource along with FYM was greater than that ofwithout FYM. The application of FYM mighthave played important role in improvingphysico chemical properties and enhance themicrobial population and enzyme activity in soilwhich plays important role in nutrienttransformation and availability of nutrients.These findings are in close conformity withthose reported by Kadam and Sonar (2006).
Fertilizer prescription equations : Thebasic data generated were used to derive thefertilizer prescription equations. The equationsderived for calibration of fertilizer nutrient dosefor specific yield target of maize based upon soiltest values in Inceptislos are as below.
Where, FN, FP2O5 and FK2O are fertilizerN, P2O5 and K2O in kg ha-1, respectively. Tis yield target in q ha-1 from 60-70 q maize
(grain) and SN, SP and SK are soil available N,P and K in kg ha-1 , FYM is farm yard manurein t ha-1
Multiple Regression Equation forfertilizer treated plot
Y = -54.3017 + 0.04521 FN + 0.000122FN2 - 0.1374 FP - 0.00146 FP2 + 0.09379FK - 0.001978 FK2 + 1.42155 N - 0.005231SN2 - 1.03282 SP - 0.02433 SP2 - 0.1035 SK+ 5.060 SK2 + 0.01312 SN.SP + 0.00020SN.SK + 0.00085 SP.SK - 0.000963 FN.FP -0.001438 FN.FK + 0.004866 FP.FK (R2 =0.7656*)
The R2 values indicated the degree ofvariation in yield that can be accounted for by
Journal of Agriculture Research and Technology 27
Fertilizer equations Fertilizer equations without FYM with FYM (t ha-1)
FN= 4.51 x T - 0.65 x SN FN=3.88 x T - O.56 x SN - 3.19 x FYM
FP2O5=1.93 x T - 1.05 x SP FP2O5=1.91 x T - 0.99 x SP - 1.46 x FYM
FK2O=2.57 x T - 0.16x SK FK2O=2.09 x T - 0.13 x SK - 1.08 x FYM
Table 3. Fertilizer dose (kg ha-1) based upon soil test valueand yield target of Maize
Soil test Yield target Yield target value 60 q ha-1 70 q ha-1
(kg ha-1) ––––––––––––––––––– –––––––––––––––––––Fertilizer Fertilizer Fertilizer Fertilizerwithout with without withFYM 10 t ha-1 FYM 10 t ha-1
FYM FYM
Nitrogen125 189 131 234 170150 173 117 218 156175 157 103 202 142200 141 89 186 128225 124 75 169 114
Phosphorous14 101 86 120 10517 98 83 117 10220 95 80 114 9923 92 77 111 9626 89 74 108 93
Potassium300 106 76 132 97350 98 69 124 90400 90 63 116 84450 82 56 108 77500 74 50 100 71
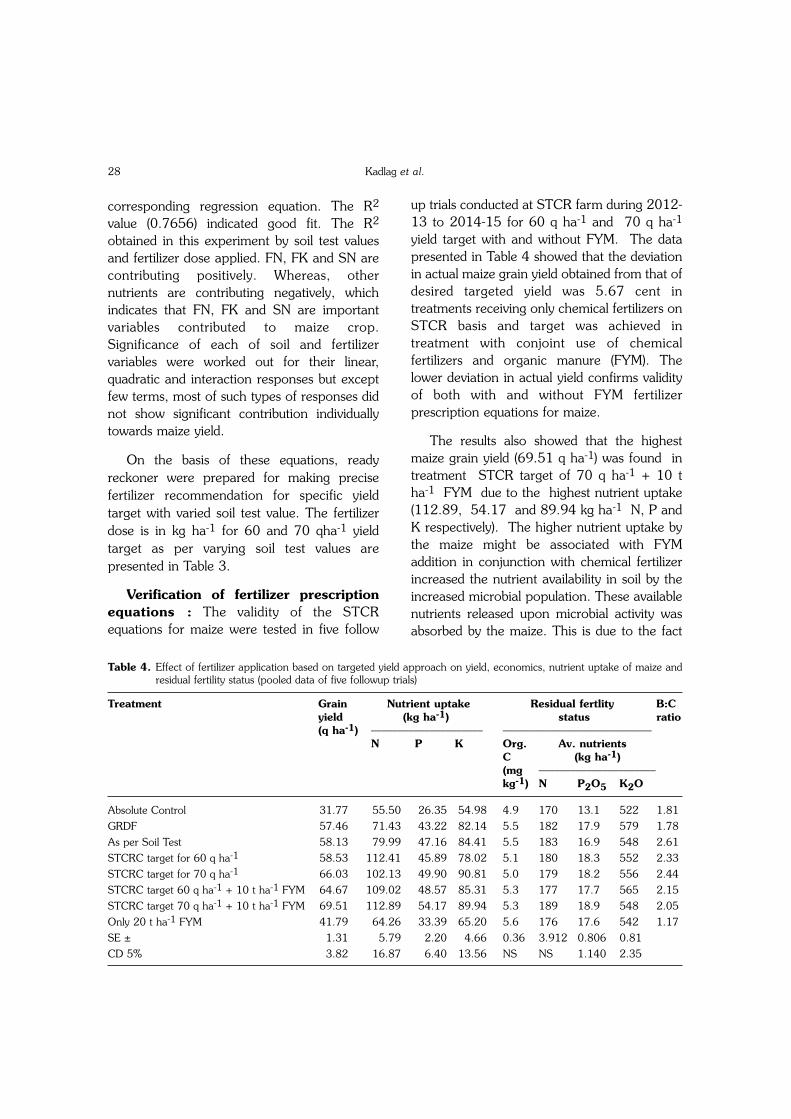
corresponding regression equation. The R2
value (0.7656) indicated good fit. The R2
obtained in this experiment by soil test valuesand fertilizer dose applied. FN, FK and SN arecontributing positively. Whereas, othernutrients are contributing negatively, whichindicates that FN, FK and SN are importantvariables contributed to maize crop.Significance of each of soil and fertilizervariables were worked out for their linear,quadratic and interaction responses but exceptfew terms, most of such types of responses didnot show significant contribution individuallytowards maize yield.
On the basis of these equations, readyreckoner were prepared for making precisefertilizer recommendation for specific yieldtarget with varied soil test value. The fertilizerdose is in kg ha-1 for 60 and 70 qha-1 yieldtarget as per varying soil test values arepresented in Table 3.
Verification of fertilizer prescriptionequations : The validity of the STCRequations for maize were tested in five follow
up trials conducted at STCR farm during 2012-13 to 2014-15 for 60 q ha-1 and 70 q ha-1
yield target with and without FYM. The datapresented in Table 4 showed that the deviationin actual maize grain yield obtained from that ofdesired targeted yield was 5.67 cent intreatments receiving only chemical fertilizers onSTCR basis and target was achieved intreatment with conjoint use of chemicalfertilizers and organic manure (FYM). Thelower deviation in actual yield confirms validityof both with and without FYM fertilizerprescription equations for maize.
The results also showed that the highestmaize grain yield (69.51 q ha-1) was found intreatment STCR target of 70 q ha-1 + 10 tha-1 FYM due to the highest nutrient uptake(112.89, 54.17 and 89.94 kg ha-1 N, P andK respectively). The higher nutrient uptake bythe maize might be associated with FYMaddition in conjunction with chemical fertilizerincreased the nutrient availability in soil by theincreased microbial population. These availablenutrients released upon microbial activity wasabsorbed by the maize. This is due to the fact
Kadlag et al.28
Table 4. Effect of fertilizer application based on targeted yield approach on yield, economics, nutrient uptake of maize andresidual fertility status (pooled data of five followup trials)
Treatment Grain Nutrient uptake Residual fertlity B:Cyield (kg ha-1) status ratio(q ha-1) ––––––––––––––––––––– ––––––––––––––––––––––––––––
N P K Org. Av. nutrientsC (kg ha-1) (mg ––––––––––––––––––––––kg-1) N P2O5 K2O
Absolute Control 31.77 55.50 26.35 54.98 4.9 170 13.1 522 1.81GRDF 57.46 71.43 43.22 82.14 5.5 182 17.9 579 1.78As per Soil Test 58.13 79.99 47.16 84.41 5.5 183 16.9 548 2.61STCRC target for 60 q ha-1 58.53 112.41 45.89 78.02 5.1 180 18.3 552 2.33STCRC target for 70 q ha-1 66.03 102.13 49.90 90.81 5.0 179 18.2 556 2.44STCRC target 60 q ha-1 + 10 t ha-1 FYM 64.67 109.02 48.57 85.31 5.3 177 17.7 565 2.15STCRC target 70 q ha-1 + 10 t ha-1 FYM 69.51 112.89 54.17 89.94 5.3 189 18.9 548 2.05Only 20 t ha-1 FYM 41.79 64.26 33.39 65.20 5.6 176 17.6 542 1.17SE ± 1.31 5.79 2.20 4.66 0.36 3.912 0.806 0.81CD 5% 3.82 16.87 6.40 13.56 NS NS 1.140 2.35

that fertilizer recommendation of yield targetapproach was based upon actual soil test valuesand it avoids sub or super optimal use offertilizer. Mann et al. (1978) observed thatapplication of FYM alone or in combinationwith micronutrients significantly increased thegrain and stover yield of maize as comparedwith control.
available nitrogen, phosphorus andpotassium was found to improved in fertilizertreatment as per STCR yield target 60 and 70q ha-1 + 10 t ha-1 FYM. (177, 17.7, 565 kgha-1 and 189, 18.9, 548 kg ha-1 available N, P,K respectively). The highest organic carboncontent was observed in the treatment with useonly 20 t of FYM. This might be due to buildingof organic matter status due to use of FYM(Biswas and Khosla, 1971). Thus, the IPNSbased on yield target approach providesscientific basis for balance fertilization andmaintaining residual soil fertility status.
Nutrient requirement of maize (grain) were1.62, 0.92 and 1.94 kg N, P and K per quintalof grain produce. The targeted yield fertilizerequations developed for maize (grain) showed5.67 per cent variation than the actual yield.Application of fertilizer nutrient as per70 q ha-1 yield target along with 10 t FYMha-1 recorded the highest maize grain yield.
ReferencesAnonymous. 2012. Pocket Handbook of Agriculture
statistics 2013, Government of India, Ministry ofAgriculture, Department of Agriculture and Co-operation, Directorate of Economics and Statistics,New Delhi, pp. 78.
AOAC. 2005. Official Methods of Analysis of theAssociation of Analytical Chemists (12th Edn.)Washington D. C.
Bachhav, P. R. and Sable, R. N. 1996. Effect of differentsources of nitrogen on growth parameters, yield andquality of soybean. J. Maharashtra agric. Univ. 21(2):
244-247.
Biswas, T. D. and Khosla, B. K. 1971. Building up oforganic matter status of soil and it's relation to the soilphysical properties. Int. Sym. Soil Fert. Eval. Proc; 1;pp. 831-842.
Hanway, J. J. and Heidal, H. 1952. Soil analysis methodsused in Iowa State College of Soil Testing Laboratory.Iowa State College of Agriculture Bulletin, 57:1-31.
Kadam, B. S. and Sonar, K. R. 2006. Targeted yieldapproach for assessing the fertilizer requirements ofonion in vertisols. J. Indian Soc. Soil Sci. 54:513-15.
Krauss, A. and Malik, D. M 1995. The effects of Kapplication to genetically different soil series on Kstatus of soils and plants and yield in Punjab-Pakistan.NFDC Tech. Bull. pp.1-43.
Mann, M. S., Takkar, P. N., Bansal, R. N. and Randhawa,N. S. 1978. Micronutrients status of soil and yield ofmaize and wheat as influenced by micronutrients andFYM application. J. Indian. Soc. Soil Sci. 26(2): 208-214.
Olsen, S. R., Cole, C. V., Watanable, F. S. and Dean, L.1954. Estimation of available phosphorous in soil byextraction with sodium bicarbonate. USDA Circular939:1-39.
Piper, C. S. 1966. Soil and Plant Analysis, HansPublication, Bombay.
Ramamoorthy, B., Narasimhan, R. L. and Dinesh, R. S.1967. Fertilizer application for specific yield target ofSonara 64. Indian Fmg, 17:43
Reddy, K. C. K., Valayutham, M. and Maruti Shanker, G.R. 1964. Extension Bulletin of All India Co ordinatedSoil Test crop Response Correlation Project, CRIDA,Hyderabad.
Sen Gupta, M. 1966. Cumulative effect of inorganicfertilizers, organic manure and their combinations onthe yield and chemical composition of calcareous soil.J. agric. Sci. 36:105-110.
Subba Rao, A. and Srivastava, S. 1999. An overview offertilizer recommendations based on STCR fertilizeradjustment (targeted yield) equations. Fertilizer News,44 :83.
Subbiah, B. V. and Asija, G. L. 1956. A rapid procedurefor determination of available nitrogen in soils. Curr.Sci. 25: 229-32.
Velayutham, M. and Reddy, K. 1990. Soil Fertility andFertiliser Use. IV; IFFCO, New Delhi.
Journal of Agriculture Research and Technology 29
______________

Vegetables form major sources of vitamins,minerals, proteins and food fiber in human diet.India is second largest vegetable producer in theworld next to China (Anonymous, 2013). Majorvegetable crops cultivated in the countryincludes potato, chilli, brinjal, tomato, onion,okra, peas, cauliflower, cabbage, french bean,bottle gourd, ridge gourd, sponge gourd, bittergourd, cucumber, parwal (snake gourd). Owingto the high yielding varieties/hybrids, there hasbeen a revolution in the production ofvegetables in the country. The productivity ofvegetable crops in India is 17.6 MT ha-1, whichis very less than several countries such as Spain,USA, Italy, Iran, Egypt etc. (Anonymous,2013). Low productivity in India is mainly dueto various biotic and abiotic stresses but can beenhanced through the adoption of improvedvarieties/hybrids coupled with improvedproduction and protection technologies.
The knowledge of genetic diversity amongcommercial vegetable genotypes will potentially
aid vegetable breeding strategies and facilitateutilization of promising germplasm. Geneticdiversity can be evaluated with morphologicalcharacteristics, seed proteins, isozymes andDNA markers. To have a reliable estimate ofgenetic diversity and genetic relationships,molecular markers are efficient tools (Wu andTanksley 1993). DNA marker basedcharacterization has become an important toolfor cultivar identification in plant breeding andgermplasm management. Fingerprintingtechnique of DNA is also a very useful tool forprotection of plant breeders' rights. Similarly,genetically modified crops are also tested byDNA fingerprinting technique to identifytransferred genes. Under the Protection ofPlant Varieties and Farmers' Rights Act (PPV &FRA, 2001) of Government of India, DNAfingerprinting has been made an additionalmandatory requirement for the release of newcrop varieties by the Central Varietal ReleaseCommittee (Shivakumar et al. 2014).Therefore it becomes necessary to characterizethe variety/hybrid using DNA based markersbefore it is released.
J. Agric. Res. Technol., 41 (1) : 030-036 (2016)
ISSR Marker Based Characterization of Major VegetableCrop Varieties
D. N. Damse1, M. N. Bhalekar2, P. L. Kulwal3, A. S. Jadhav4, S. G. Bhalekar5, D. B. Kshirsagar6
AICRP on Vegetable Crops, Mahatma Phule Krishi Vidyapeeth, Rahuri - 413 722 (India)(Received : 17-12-2014)
AbstractIn this study, 46 varieties including some promising germplasm belonging to 14 different vegetable crops
(brinjal, chilli, Tomato, onion, dolichos bean, cucumber, pea, French bean, bitter gourd, bottle gourd, spongegourd, ridge gourd, snake gourd and broccoli) were characterized using inter simple sequence repeat (ISSR)markers. For this purpose, first a common protocol for isolation of DNA from these vegetable crops wasoptimized and later it was used for molecular characterization using ISSR markers. The ISSR markers usedin this study showed greater degree of polymorphism as compared to the SSR markers used suggesting theirusefulness for identification and in making distinction between the different varieties of the vegetable cropsused in the present study.
Key words : Vegetable crops; DNA isolation; ISSR; characterization.
1. , 2., 3., 5. Asso. Professor, 4. Professor and 6.Asstt. Professor.
Among all DNA based markers,microsatellite or SSR (simple sequence repeat)and ISSR (inter simple sequence repeat) are themarkers of choice. While SSR is a robust andreliable technique, it has a limitation of crossspecies transferability, so that one markerderived from a particular species or crop mightnot always be suitable for another species orcrop. On the contrary, ISSR is a simple and aquick technique and uses primer designed fromdinucleotide or trinucleotide simple repeats,shows stability and reproducibility, richpolymorphism and reliability (Ziekiewicz et al.1994; Gupta et al. 1994). As it shows muchlarger numbers of fragments per primer and isrelatively cheaper, it has been widely used forDNA fingerprinting, population genetics andphylogenetic studies in field crops, fruit treesand herbs (Zhou et al. 2007). Moreover, ISSRhas been described as a powerful technique todetect similarities at species levels (Ghariani etal. 2003).
Over the years, university has releasedseveral varieties of vegetable crops and it isnecessary that all these varieties should beappropriately characterized. Although, severalprotocols for isolation of DNA as well as forISSR analysis are available in each of thedifferent vegetable crops, there may not be acommon standard protocol for all thesevegetables. Hence, objective of this study wasfirst to optimize common DNA isolationprotocol for ISSR analysis and second tocharacterize the vegetable varieties/ hybridsreleased by the university using molecularmarkers.
Materials and Methods
Vegetable crops and varieties used :Experimental material consisted of 46 varietiesand germplasm lines belonging to 14 differentvegetable crops (Brinjal, Chilli, Tomato, Onion,Dolichos bean, Cucumber, Pea, French bean,Bitter gourd, Bottle gourd, Sponge Gourd,
Ridge gourd, Snake gourd and Broccoli)supplied by All India Coordinated ResearchProject on Vegetable Crops, Mahatma PhuleAgricultural University, Rahuri, India. In case ofvegetable crops where only one variety ofuniversity was available, another varietyreleased by other institute was used forcomparison, except in case of snake gourd andbroccoli (Table 1).
DNA isolation : Seeds were sterilized with0.1 percent HgCl2 to avoid contamination andsubsequently washed with sterile water and thengerminated on germination papers at 37°C for7 days. Germinated 1.2 to 2 g shoot portionwas used for DNA extraction. The plantgenomic DNA was extracted by using modifiedCTAB method as described by Saghai-Maroofet al. (1984) and Lodhi and Reisch (1995) withsome modifications. For getting high qualityDNA of all vegetables samples, concentrationsof reagents in CTAB method tried were as,EDTA-15 mM, 20 mM, 25 mM; Tris-HCl (pH8.0)- 80 mM, 100 mM, 130 mM; NaCl-1.4 M,1.6 M, 1.8 M; CTAB-2 %; β-mercaptoethanol-0.1%, 0.2%, 0.3 percent. Using these differentcombinations 2 per cent extraction buffer wasprepared. Plant tissues frozen in liquid nitrogenwere ground to fine powder. To the powderedtissue, 2 ml of extraction buffer was added andmixed well by gentle inversion and incubated at65°C for 30 min in a water bath. The mixturewas then mixed with equal volume of freshlyprepared Chloroform: Isoamyl alcohol (24:1)and centrifuged at 10,000 rpm for 10 minutesat 4°C and supernatant was collected into afresh tube. To the collected supernatant, 0.7volume of chilled isopropanol was added;mixed well and DNA was allowed to precipitateat 20°C for an hour. The DNA was pelleted bycentrifugation at 10,000 rpm for 10 min.Collected pellet was washed with 70 percentalcohol and dissolved in optimum quantity ofTE buffer. RNase A treatment was given at therate 2 µl / 200 µl of DNA and incubated at
Journal of Agriculture Research and Technology 31

Damse et al.32
Table 1. List of vegetable crop varieties/germplasm used for characterization along with ISSR primers used and theirannealing temperature
Crop Varieties/Hybrids ISSR primers used for Annealingcharacterization temperature (°C)
Brinjal i) Poona Selection UBC 808, UBC 815, 55ii) Ruchira UBC 823iii) Krishnaiv) Manjari gotav) Phule Haritvi) Phule Arjunvii) RHRB- 53 (P1)viii) RHRB- 35 (P2)ix) Vaishalix) Pragati
Chilli i) Phule Mukta UBC 807, UBC 808 55ii) Phule Jyoti UBC 815, UBC 823
Bottle gourd i) Samrat UBC 807 55ii) Pusa Samrudhi* UBC 809 58
Bitter Gourd i) Hirkani UBC 807, UBC 825 55ii) Phule Green Gold UBC 808, UBC 854 iii) Phule Ujwala
Sponge Gourd i) Phule Prajakta UBC 808 55ii) Pusa Chickni* UBC 809 58
Ridge gourd i) Phule Sucheta UBC 809 58ii) Pusa Nasdar*
Snake gourd i) Phule Vaibhav UBC 809 58Cucumber i) Phule Shubhangi UBC 807 55
ii) Phule HimangiDolichos bean i) Phule Gauri UBC 807 55
ii) Phule Ashwini UBC 809 58iii) Phule Suruchiiv) Konkan Bhushan*
Pea i) Phule Priya UBC 807 55ii) Arkel* UBC 890 58
Onion i) Phule Samarth UBC 815 55ii) N-53iii) Baswant-780iv) BRBO-1011v) BRBO-1001vi) N-2-4-1vii) Phule Safedviii) Phule Suvarna
Tomato i) Dhanashree UBC 815, UBC 823 55ii) Bhagyashreeiii) Phule Rajaiv) M-1-2v) 85-1
French Bean i) Phule Suyash UBC 809 58ii) Phule Surekha
Broccoli i) Ganesh Broccoli UBC 807, UBC 808 55UBC 809 58
* National check /variety released by institute other than MPKV, Rahuri.

37°C for an hour. After incubation, 1/10volume of 3 M sodium acetate (pH 5.2) andequal volume of phenol: chloroform (1:1) wasadded and mixed gently; centrifuged at 10,000rpm for 10 minutes and collected the aqueousphase. This was repeated till no white interfacewas seen. DNA was precipitated by adding 2volumes of chilled absolute ethanol and kept itat -20°C for 1 hour and pelleted at 10,000 rpmfor 10 minutes at 4°C. Pellet was washed with70 per cent ethanol to remove extra salts anddried. Minimum volume of TE (10:1) was usedto dissolve DNA at room temperature. Thisquality DNA was stored at -20°C. DNAconcentration was estimated by loading onagarose gel (0.8 per cent) with knownconcentration of λ DNA.
ISSR analysis : For ISSR analysis reactionmixture was optimized by trying varyingconcentrations of PCR reagents as 10X PCRbuffer B 1X, dNTP mix 0.2 mM, 0.15 mM, 0.1mM; MgCl2 1mM, 1.25mM, 1.5mM; Taqpolymerase 0.33U, 0.5U, 0.8U; primer 20picomoles, 40 picomoles, 60 picomoles;template DNA 50ng, 75ng, 100ng, made finalvolume of 20 µL by adding sterile distilledwater. Total 24 ISSR primers (UBC 807, 808,809, 811, 822, 824, 825, 827, 834, 835,840, 841, 842, 849, 853, 854, 855, 856,857, 886, 888, 889, 890, and UBC 892) werescreened. Amplification was carried out withinitial denaturation step at 94°C for 3 minfollowed by 35 cycles of 94°C for 30 seconds,50-60°C (primer specific) for 45 sec, 72°C for2 min and final elongation step of 72°C for 5min. Here, only annealing temperature wasvaried from 50-60°C. The amplified productswere analyzed on 1.5 per cent agarose gel at100 V for 3 hours and detected by staining withethidium bromide. UV trans- illuminated gelswere photographed. Molecular weights of thebands were estimated using 1 kb DNA ladder asstandard.
Results and Discussion
Quantity and purity of extracted genomicDNA plays crucial role for analysis of moleculardiversity and for optimization of differentparameters for PCR (Weeden et al., 1992;Staub et al., 1996). Among differentconcentrations of extraction buffer tried, EDTA-20 mM, Tris-HCl (pH 8.0)- 100 mM, NaCl-1.4M, CTAB- 2%; β-mercaptoethanol- 0.2%significantly influenced yield and quality ofgenomic DNA belonging to these vegetables.This standardized protocol yielded good qualitygenomic DNA and values ranged from 100-200 ng/µL which were estimated by loading onagarose gel (0.8 per cent). As cucurbitaceousvegetables viz., bottle gourd, sponge gourd,bitter gourd, cucumber showed phenolicexudation, the chloroform: isoamyl alcohol(24:1) treatment step was repeated. Similarly,polysaccharides have been the most commonlyreported problem in DNA extraction fromcucumber and melon (Baudracco, 1995; Fanget al. 1992). Use of β-mercaptoethanol 0.2%minimized this problem. Major problem inrecovering good quality DNA was phenols andpolyphenols and its co-precipitation with DNA.To overcome this problem we have optimizedthe contents of homogenization buffer andvolume of buffer. Use of one gram poly vinylpyrrolidone (PVP) per gram leaf tissues forcucurbitaceous (bottle gourd, sponge gourd,bitter gourd, cucumber etc.) and solanaceousvegetables (tomato, brinjal and chilli) helped inthe removal of phenolics and other impurities.Addition of PVP along with CTAB may bind topolyphenolic compounds by forming a complexwith hydrogen bonds and may help in removalof impurities to some extent (Sane et al. 2012).For most of the vegetables we used tenderleaves, as DNA yield depend upon number ofnuclei per unit area or weight of plant sample,which are always more in growing organs suchas leaves, shoots, roots and meristems thanresting structures like rhizomes, corms, bulbs
Journal of Agriculture Research and Technology 33

and seeds. Narayanan, (2006) reported 2.33-3.33 times better yield and quality of genomicDNA from fresh leaves than seeds of Tectonagrandis L.f. Addition of RNase A andincubation at 37°C for an hour ensuredcomplete removal of RNA contaminantsobserved in most of the vegetables. The finalDNA pellet was colourless and completelydissolved in TE buffer, which indicated theabsence of any other contaminants.
For ISSR analysis, concentrations of DNAas well as that of primer and the annealingtemperature are critical parameters forobtaining reproducible banding pattern. We gotbest results from third set of combinations ofPCR reagents which consists of 10X PCRbuffer B 1X which was common to all the threesets of reaction mixtures because, primarypurpose of this component is to provide anoptimal pH and monovalent salt environmentfor the final reaction volume. Another
component was dNTP mix which wasoptimized at 0.1 mM concentration, whilemagnesium chloride (MgCl2) was optimized atthe concentration of 1.5 mM. Taq polymerasewas taken at the rate 0.8U; when it was takenin low concentration there was insufficientamplification product. Similar findings werereported by (Saiki, 1989). There was noamplification at 20 pm primer concentration inbottle gourd, sponge gourd and weak bandswere observed at 40pm concentration in chilli,ridge gourd and French bean. Thus it wasoptimized at 60 pm concentration for allvegetables.
Out of 24 ISSR primers screened, 09primers (UBC 807, UBC 808, UBC 809, UBC811, UBC 815, UBC 823, UBC 825, UBC886 and UBC 890) showed amplification formost of the vegetable crops (Fig. 1). Detail cropwise primer used and annealing temperature isdepicted in Table 1. Template DNA was
Damse et al.34

optimized at 100ng concentration because lowconcentration was unable to amplify in somevegetable crops. Among different temperaturestried, annealing temperature at 55°C and 58°Cshowed clear, visible bands (depending on
primer). Annealing temperature (Ta) isprimer specific (Bornet and Branchard, 2001)and depends on GC content of the primer usedand usually ranges from 45-65°C (Reddy,2002).
Journal of Agriculture Research and Technology 35
Fig. 1. Agarose gel images showing characterization of the different varieties of vegetable cropsusing different ISSR markers. Polymorphic bands are shown by arrow, while M is the DNAladder.
a) Bitter gourd varieties characterized with markers UBC 807, UBC 808, UBC 825 and UBC854; b) Brinjal and Chilli varieties characterized with marker UBC 815; c) Brinjal varietiescharacterized with markers UBC 808 and UBC 823; d) Tomato varieties characterized with markerUBC 815; e) Ridge gourd and Snake gourd varieties characterized with marker UBC 809; f) Spongegourd and Cucumber varieties characterized with marker UBC 808; g) Dolichos bean, Pea andBroccoli varieties characterized with marker UBC 807; h) Onion varieties characterized with markerUBC 815; i) Bottle gourd varieties characterized with marker UBC 809; j) French bean varietiescharacterized with marker UBC 809

One or more than one polymorphic ISSRmarkers used in the present study coulddistinguish the vegetable varieties of respectivecrop from each other (Fig. 1). This is veryimportant in any characterization programme.Only in case of sponge gourd, the amplifiedprimers could not distinguish between the twovarieties used and there is a need of usingadditional markers for distinguishing the twovarieties. Of the different ISSR primers used,ISSR 807 and 809 were found more useful asthey could distinguish between the varieties inseven different vegetable crops (Table 1).
We also used SSR markers forcharacterizing varieties of brinjal, chilli, onion,tomato, cucumber, pea, dolichos bean butmajority of them showed monomorphicbanding pattern on agarose gel; while for thesame varieties/hybrids ISSR markers used inthe present study were found to exhibitpolymorphism. Hence, it may be concludedfrom this study that, ISSR markers used in thisstudy can be effectively used forcharacterization of vegetable crops, particularlywhen large numbers of SSR markers are notavailable in these crops.
ReferencesAnonymous. 2013. www.nhb.gov.in; Indian Horticulture
database-2013 NHB, Ministry of Agriculture, Govt. ofIndia, New Delhi. pp. 250.
Baudracco-Arnas, S. 1995. A simple and inexpensivemethod for DNA extraction from Cucumis melo L.Cucurbit Genet. Coop. Rep. 18:50-51.
Bornet, B. and Branchard, M. 2001. Nonanchoredintersimple sequence repeat (ISSR) markers:reproducible and specific tools for genomefingerprinting. Plant Mol. Biol. Rep. 19:209-215.
Fang, G., Hammar, S. and Grumet. G. 1992. A quick andinexpensive method for removing polysaccharidesfrom plant genomic DNA. Biotechniques 13:52-56.
Ghariani, S., Trifi-Farah, N. and Chakroun, M. 2003.Genetic diversity in Tunisian perennial ryegrassrevealed by ISSR markers. Genet. Resou. Crop Evol.50: 809-815.
Gupta, M. Y., Chyi, S. J., Romero-Severson, J., Owen, J.L. 1994. Amplification of DNA markers from
evolutionarily diverse genomes using single primers ofsimple sequence repeat. Theor. Appl. Genet. 89:998-1006.
Lodhi, M. A. and Reisch, B. I. 1995. Nuclear DNA contentof Vitis species, cultivars and other genera of theVitaceae. Theor. Appl. Genet. 90:11-16.
Narayanan, C., Dubey, S., Arif Wali, S., Shukla, N.,Kumar, R., Mandal, A.K. and Ansari, S. A. 2006.Optimization of DNA extraction for ISSR studies inTectona grandis L.f. - an important forest tree species.African J. Biotech. 5: 1220-1223.
Reddy, M. P., Sarla, N. and Siddiq, E. A. 2002. Inter simplesequence repeat (ISSR) polymorphism and itsapplication in plant breeding. Euphytica 128:9-17.
Saghai-Maroof, M. A., Soliman, K. M., Jorgensen, R. A.and Allard, R. W. 1984. Ribosomal spacer lengthpolymorphism in barley; Mendelian inheritance,chromosomal location and population dynamics. Proc.Natl Acad Sci. USA 81: 8014-8019.
Saiki, R. K. 1989. The design and optimization of thePCR. In: PCR Technology: Principles andApplications for DNA Amplification (H.A. Erlich, ed.)Stockton Press, New York. pp. 7-16.
Sane, A., Abdul Kareem, V. K., Rajshekharan, P. E. andVasantha Kumar, T. 2012. Optimization of DNAisolation and PCR protocol for ISSR analysis ofNothapodytes nimmoniana: A threatened Anti -cancerous Medicinal Plant, Asian J. Biotech. 4: 100-107.
Shivakumar, M., Gireesh, C. and Ramesh, S. V. 2014.DNA Finger Printing - A tool for identification ofcultivars, Pop. Kheti, 2(2):160-162
Staub, J. J., Bacher, J. and Poeter, K. 1996. Sources ofpotential errors in the application of random amplifiedpolymorphic DNAs in cucumber. Hort. Sci. 31:262-266.
Weeden, N. F., Timmerman, M., Hermmat, M., Kneen,B.E. and Lodhi, M.A. 1992. Applications of RAPDtechnology to plant breeding, Symposium Proceeding,Minneapolis. pp. 12-17.
Wu, K.S. and Tanksley, S.D. 1993. Abundance,polymorphism and genetic mapping of microsatellitesin rice. Mol. Gen. Genet. 241: 225-235.
Zhou, Y. Q., Gao, W. J. and Duan, H. Y. 2007.Assessment of genetic diversity of Rehmanniaglutinosa Libosch based on ISSR markers. Geneticâ siBiologie Moleculara VIII: 141-149.
Ziekiewicz, E., Rafalski, A. and Labuda, D. 1994. Genomefingerprinting by simple sequence repeat (SSR)anchored polymerase chain reaction amplification. 20:176-183.
Damse et al.36
______________

Miniature roses are true roses, bred to staysmall in size. Most miniature roses also havesmaller flowers than standard rose bushes, butthey come in a variety of types and colors.Despite their small size, miniature roses areextremely hardy. In fact, they are more winterhardy than most tea roses. Miniatures also tendto be repeat profuse bloomers. Miniature rosesare perfection on a small scale. They grow wellindoors or out and are useful colorful plantingsin areas where space is limited. Many varietiesof miniature also emulate the classic high-centered hybrid tea flower shape and can befound as single, semi-double, double or inclustered form. Miniature roses are great incontainers, make lovely borders and are perfectfor those with a small yard or balcony.Although miniature roses do quite well incontainers having suitable growing media andoften sold as houseplants. Considering this, anexperiment on standardization of growingmedia composition for pot grown miniature
rose was undertaken to find out the suitablemedia to improving growth, quality and yield offlower.
Material and Methods
The present investigation was carried out inthe field of All India Co-ordinateted ResearchProject on Floriculture, NARP; Ganeshkhind,Pune to standardize growing mediacomposition for pink colour miniature rose.The experiment was conducted in open fieldduring the year 2011 to 2013 with seventreatment involving different soil and soillessmedia compotions replicated thrice incompletely randomized design. Budded plantof miniature roses were planted in plastic potsof 22.5cm diameter were filled with growingmedia as per the treatments viz., T1- Soil +FYM @1:1, T2 - Soil + FYM + leaf mould@1:1:1, T3 - Soil + Vermicompost @1:1, T4 -Soil + Cocopeat + FYM @1:1:1, T5 - Soil +Cocopeat + leaf mould @1:1:1, T6 - Perlite +Cocopeat + FYM @1:1:1 and T7 - Soil +Vermicompost + FYM @1:1:1. Theobservations were recorded on different growth
J. Agric. Res. Technol., 41 (1) : 037-040 (2016)
Standardization of Media Composition for Pot grownMiniature Rose
S. B. Jadhav1, S. M. Katwate2, B. G. Pawar3 and D. S. Kakade4
All India Coordinated Research Project on Floriculture, National Agriculture Research Project (PZ)Ganeshkhind, Pune - 411 007 (India)
(Received : 17-12-2014)
AbstractThe seven potting compositions were studied in completely randomized design with three replications to
standardize growing media composition for growing of pink colour miniature rose. Results indicated that thecombinations of growing media significantly influenced the vegetative growth and quality flower productionof miniature rose. The overall superior performance was recorded in Soil + Cocopeat + FYM @1:1:1 mediain respect of plant height (34.04 cm), number of branches per plant (5.63), flower diameter (2.40cm), flowerbud length (0.57cm), and stem length (21.12 cm).The growing media consisting Perlite + Cocopeat + FYM@1:1:1 exhibited the minimum days (19.18) for flower emergence.
Key words :
1. and 3. Asstt. Floriculturist, 2. Geneticist, 4. Jr.Pathologist.

and flowering characters of miniature rose. Atthe end of experiment the data was pooled.
Results and Discussion
The study revealed that the growing mediaplayed a significant role in the vegetativegrowth as well as flowering quality of miniaturerose. The pooled data regarding the differentgrowth characters of pink colour miniature roseas influenced by growing media are presentedin Table 1. Among the different sevencombinations of growing media studied, Soil +Cocopeat + FYM @1:1:1 (T4) recorded thesignificantly maximum plant height (34.04cm),plant spread at East x West (26.21cm) andNorth x South (31.53cm) and number ofbranches plant-1 (5.63). This might beattributed the good physico- chemicalproperties viz., higher porosity, neutral PH ,minimum EC value and porosity of this mediaencourages root aeration and availability ofnutrients particularly minor elements (Bunt,1976). Thus, this might have helped in initialvigour and better metabolic activities especiallywith the production of branches per plant.These results are similar to the findings ofDhananjaya and Sulladmath (2003) inanthurium and Gupta et al. (2004) in gerbera.
Soil + Cocopeat + FYM @1:1:1 (T4) mediaproduced the plant with vigorous growth is thatthey might have taken a maximum time forflower emergence (24.89days) as compared toother media used in experimentation andminimum days (18.19) to flower emergencewas recorded in Perlite + Cocopeat + FYM@1:1:1 (T6). Minimum plant height (28.04 cm),plant spread East x West (21.37 cm) and Northx South (23.00 cm) and number branchesplant-1 (3.83) were observed in treatmentPerlite + Cocopeat + FYM @1:1:1 (T6).
The flower quality parameters viz., flowerdiameter, flower bud length and stem lengthwere found significantly superior in T4 viz., Soil
Jadhav et al.38
Tabl
e 1.
Effe
ct o
f di
ffere
nt m
edia
com
posi
tion
on v
eget
ativ
e gr
owth
of
pot
grow
n m
inia
ture
ros
e
Trea
t-Pla
nt h
eigh
t (c
m)
Pla
nt s
pre
ad (
E x
W)
cm)
Pla
nt s
pre
ad (
N x
S)
cmN
o. o
f br
anch
es p
lant
-1D
ays
to f
low
erin
gm
eant
––––
––––
––––
––––
––––
––––
–––
––––
––––
––––
––––
––––
––––
––––
––––
––––
––––
––––
––––
––––
––––
––––
––––
––––
––––
––––
––––
––––
––––
––––
––––
––––
–1
0-
11
-1
2-
Poo
-1
0-
11
-1
2-
Poo
-1
0-
11
-1
2-
Poo
-1
0-
11
-1
2-
Poo
-1
0-
11
-1
2-
Poo
-1
11
21
3le
d1
11
21
3le
d1
11
21
3le
d1
11
21
3le
d1
11
21
3le
d
T1
31.8
029
.90
30.6
830
.79
25.6
023
.40
24.6
024
.53
27.8
029
.03
26.7
027
.84
4.50
4.80
4.27
4.52
13.7
716
.80
28.5
019
.69
T2
33.7
030
.53
32.2
532
.16
23.8
021
.83
22.5
022
.71
30.4
028
.00
27.8
028
.73
5.00
5.40
4.70
5.03
16.5
718
.50
30.7
021
.92
T3
32.5
028
.70
31.6
330
.94
24.5
022
.50
21.8
022
.93
29.6
027
.40
25.5
027
.50
4.80
4.70
3.50
4.33
14.0
018
.33
32.4
021
.58
T4
35.2
732
.40
34.4
634
.04
27.8
024
.70
26.1
326
.21
33.5
031
.50
29.6
031
.53
5.50
6.00
5.40
5.63
19.7
022
.40
32.5
724
.89
T5
30.8
028
.80
30.9
030
.17
24.8
020
.80
23.5
023
.03
28.7
024
.70
26.0
026
.47
4.00
4.20
3.80
4.00
15.7
318
.40
33.6
022
.58
T6
28.9
026
.73
28.5
028
.04
21.5
022
.00
20.6
021
.37
23.3
023
.00
22.7
023
.00
3.80
3.70
4.00
3.83
10.5
714
.50
29.5
018
.19
T7
31.0
029
.40
31.6
030
.67
25.2
023
.93
22.0
023
.71
30.5
028
.60
24.5
027
.87
5.00
4.80
3.90
4.57
12.5
315
.60
27.8
018
.64
S E±
0.51
0.68
0.81
0.30
0.29
0.33
0.59
0.56
0.28
1.38
0.52
0.72
0.10
0.13
0.33
0.18
0.49
1.21
0.31
0.73
C D
1.
582.
202.
430.
920.
901.
001.
771.
740.
864.
231.
562.
240.
320.
381.
020.
571.
523.
690.
942.
29at
5%

+ Cocopeat + FYM @1:1:1 (T4). The datapresented in Table 2, revealed that significantlysuperior quality flower were produced in Soil +Cocopeat + FYM @1:1:1 (T4) mediacomposition. The maximum flower diameter(2.40 cm), flower bud length (0.57 cm) andstem length (21.12 cm) were also found in Soil+ Cocopeat + FYM @1:1:1 (T4) treatment. Theincrease in flower diameter, flower bud lengthand stem length might be due to the cumulativeeffect of all growth parameters observedthroughout the growing period. The increase ingrowth and quality parameters of the flowers ingrowing media resulted by higher porosity andadequate nutrient availability in the Soil.Nitrogen greatly influenced plant growth andphotosynthetic activity and increases thenumber, size and length of vegetative as well asreproductive organs as reported by Enggels andMarschner (1995). It was observed thatmaximum quality flower production wasobtained in treatment Soil + Cocopeat + FYM@1:1:1 (T4) media composition. It may be dueto the physico-chemiacal properties ofcocopeat and FYM. FYM contain most of thenutrients in the available form and has largeparticular surface area that provides manymicrosites for microbial activities and for strong
retention of nutrients. Similar results werereported by Panj et al. (2011) in gerbera withcocopeat + FYM + Rice husk.
Significantly maximum number of flowerplant-1 seasons-1 (67.27) was exhibited withSoil + Cocopeat + FYM @1:1:1 (T4) mediawhich were at par (62.68) with Soil + FYM +Leaf mould @1:1:1 (T2) media composition.The increase in the yield can be attributed touse of cocopeat with combination of soil andFYM in the media which provide good physico-chemical properties, which exerts substantialeffect on growth of plant. The variation inflowers plant-1 season-1 and treatment may beattributed to environmental and physico-chemical properties of the media, respectively.The highest flower yield was recorded byBarreto and Jagtap (2006) when cocopeatcombined with either compost orVermicompost (1:1, v/v). The lowest floweryield (31.59) was obtained in Perlite +Cocopeat + FYM@1:1:1 treatment.
The potting media comprising Soil +Cocopeat + FYM@1:1:1 (T4) was found to beideal for better growth and quality flowerproduction of miniature rose.
Journal of Agriculture Research and Technology 39
Table 2. Effect of different media composition on quality and yield of pot grown miniature rose
Treat- Flower dia. Flower bud length Stem length No. of flower plant-1meant (cm) (cm) (cm) season-1
–––––––––––––––––––––– –––––––––––––––––––––– ––––––––––––––––––––––––– ––––––––––––––––––––––––––10- 11- 12- Poo- 10- 11- 12- Poo- 10- 11- 12- Poo- 10- 11- 12- Poo-11 12 13 led 11 12 13 led 11 12 13 led 11 12 13 led
T1 1.90 1.50 1.60 1.67 0.25 0.30 0.28 0.28 19.80 17.50 19.03 18.78 55.20 58.40 50.70 54.77T2 2.30 2.00 1.80 2.03 0.35 0.37 0.32 0.35 20.00 16.70 17.50 18.07 64.80 66.83 56.40 62.68T3 1.80 1.70 1.50 1.67 0.45 0.48 0.40 0.44 17.40 15.60 16.40 16.47 56.70 58.77 54.90 56.79T4 2.50 2.00 2.70 2.40 0.58 0.60 0.54 0.57 20.77 21.80 20.80 21.12 69.50 71.50 60.80 67.27T5 2.30 1.80 2.00 2.03 0.28 0.29 0.30 0.29 16.17 14.00 15.70 15.29 60.30 62.40 53.20 58.63T6 1.60 1.00 1.30 1.30 0.18 0.20 0.20 0.19 18.30 16.50 17.60 17.47 29.37 31.80 33.60 31.59T7 1.80 1.60 1.50 1.63 0.27 0.28 0.22 0.26 20.50 18.70 18.40 19.20 49.90 52.70 46.50 49.70S E± 0.06 0.06 0.12 0.10 0.01 0.01 0.01 0.01 0.58 0.28 0.46 0.44 2.60 0.36 0.20 1.50C D 0.19 0.18 0.37 0.31 0.02 0.02 0.03 0.04 1.81 0.86 1.38 1.38 8.11 1.11 0.60 4.67at 5%

ReferencesBarreto, M. S. and Jagtap, K. B. 2006. Assessment of
subtracts for economical production of gerbera(Gerbera jamesonii Bolus ex Hooker F.) flower underprotective cultivation. Journal of OrnamentalHorticulture, 9(2): 136-138.
Bunt, A. C. 1976. Modern potting compost. In GeorgeAllen and Unwin Ltd. p. 277.
Dhananjaya, M. V. and Sulladmath, V. V. 2003.Assessment of suitable media among tissue culturederived plant of Anthurium andreanum cv. SingaporeHybrid, Journal of Ornamental Horticulture, 6(4):310-315.
Enggels, C. and Marschner, H. 1995. Plant uptake andutilization of nitrogen, In P.E. Bacon (ed) NitrogenFertilization in the environment. New York: MarcelDekker, pp. 41-81.
Gupta, Y. C., Dein, L. Q., Dhiman, S. R. and Jain, R.2004. Standardization of growing media underprotected environment for gerbera in mid hill ofHimachal Pradesh, Journal of OrnamentalHorticulture, 7(1): 99-102.
Panj, F. G., Sunila Kumari and Parmar, P. B. 2011.Effectof growing media on growth, yield and quality ofgerbera (Gerbera jamesonii Bolus ex Hooker F.) underprotected condition, Journal of OrnamentalHorticulture, 14(3 and 4): 34-39.
Jadhav et al.40
J. Agric. Res. Technol., 41 (1) : 040-043 (2016)
Effects of Nutrient Chemicals and Growth Regulators on PostHarvest Vegetative Growth and Flowering in Alphonso Mango
(Mangifera Indica L.)
K. R. Patil1 and M. M. Burondkar2
Department of Agril. Botany, Mahatma Phule Krishi Vidyapeeth, Rahuri - 413 722 (India)(Received : 10-03-2015)
AbstractAll the treatments significantly influenced the, duration and percentage of post harvest vegetative growth
and flowering along with yield. Among the treatments Potassium nitrate (3%) was found to have significanteffect on early induction and higher percentage of vegetative growth in both the types of shoots (Old: 87.67%and New: 55.67%) over control (65% and 40.33%) followed by 2% Ammonium nitrate (76.67%) and 2%urea (77%). Regarding the induction of flowering, both the sources of nitrogen i.e. Thiourea (0.5%) andpotassium nitrate (3%) resulted in significantly higher flowering percentage (77.17% and 67.5%) over rest ofthe treatments, whereas KNO3 induces early flowering (j19.87 days) over control. Fruit yield was found to besignificantly and positively correlated with number of fruits retained per panicle at peanut stage. Among thetreatments, (3%) had retained significantly higher number of fruits per panicle (4.20) over control.
Key words : Growth regulators, vegetative growth, flowering, mango.
______________
Mango (Mangifera indica L.), the oldest andchoicest fruit among the world. India securestopmost position in area (2.2 m ha.) andproduction (13.79 m MT). Maharashtra is oneof the largest mango producing states and theKonkan is the largest mango growing belt ofstate, famous for the Alphonso variety which
has export quality potential due to itsmarketable qualities like pleasant aroma, typicalsugar-acid blend, and tasty pulp. Inspite ofthese it is not preferred by mango growers dueto its poorest yielding capacity (2.5-3 tones ha-1) compared to Indian productivity (6-7 tonesha-1). Physiological disorder like alternatebearing habit is the most acceptable reason for1. Ph.D. Scholar and 2. Professor.

its low yield potential. This is occurred because,after harvest of previous crop plants largelyremains dormant up to October-November andthen turned into major vegetative flush, due tothis late vegetative flush in current season plantescape flowering in current season (Sen andMallik 1941, Naik and Rao 1942). It is need todevelop the strategies to induce early vegetativeflush after harvesting of previous season. Someof the chemicals like Paclobutrazole, Hydrogencyanamide (Dormex) shown promising resultsby various scientists.
The present study was carried to study effectof foliar application of nutrient chemicals andgrowth regulators on induction of post harvestvegetative growth and find out suitabletreatment for vegetative flush in relation toinduction of early and profuse flowering inAlphonso mango.
Material and Methods
Experiment was conducted during themango cropping season of 2008 on 34 yearsold Alphonso mango trees, expected to haveoff year in current season. Eight treatmentscomprising four nutrient chemicals (T1 - 2%Urea, T2 - 2% Thiourea, T3 - 3% Potassiumnitrate, T4 - 2% Ammonium nitrate), threegrowth regulators (T5 - 50 ppm GA3, T6 - 2%hydrogen cyanamide and T7 - 3000 ppmEthrel) with control. 100 panicles each of fruitbearing and non fruit bearing panicles ofprevious season were selected and taggedbefore first spray to record the observations i.e.days required for induction of vegetative growthand flowering initiation, percentage ofvegetative growth and flowering, total numbersof fruits panicle-1 and plant-1. Observationswere taken at four different stages of growth
Journal of Agriculture Research and Technology 41
Table 1. Influence of Nutrient Chemicals and Growth Regulators vegetative growth and flowering behavior on old and newshoots of Alphonso mango
Treat- Days required Days required Vegetative Days required Total ments for bud for complete growth for flowering flowering
breaking shoot exertion observed (%) initiation percentage–––––––––––––––– ––––––––––––––– –––––––––––––––––– ––––––––––––––––– ––––––––––––––––––Old New Old New Old New Old New Old New
T1 85.00 88.67 12.73 12.11 75.6 53.00 91.67 100.00 45.70 49.00(60.50) (46.72) (42.24) (44.34)
T2 104.00 112.67 15.33 15.38 66.6 42.00 103.33 95.33 85.00 69.33(54.76) (40.38) (67.49) (56.69)
T3 83.33 87.33 14.22 14.16 87.6 55.67 88.67 87.33 67.00 68.00(69.54) (48.25) (55.56) (56.01)
T4 98.00 103.33 13.35 13.38 76.67 52.33 103.67 110.67 46.33 53.33(61.68) (46.34) (42.16) (46.92)
T5 95.00 95.33 16.22 16.33 72.00 45.33 95.33 88.67 24.00 23.00(58.19) (42.32) (28.77) (28.40)
T6 90.67 97.33 14.17 13.61 70.33 46.00 102.33 103.67 57.33 52.00(57.08) (42.69) (49.32) (46.11)
T7 106.33 103.33 16.88 16.33 65.33 39.33 100.33 110.67 32.00 34.00(53.98) (38.81) (33.15) (34.37)
T8 106.33 113.67 16.28 16.33 65.00 40.33 110.67 113.67 48.33 58.67(53.85) (39.39) (44.04) (50.03)
Mean 98.49 102.10 15.20 15.23 70.31 45.05 101.90 103.05 42.64 41.97(57.32) (42.12) (40.48) (39.94)
S. E.m 4.481 4.211 0.60 0.64 2.785 1.764 4.725 4.783 7.104 7.229C.D. 13.08 12.29 1.74 1.86 8.130 5.150 13.793 13.961 20.745 21.101

i.e. before bud break stage and bud break stage,flowering initiation, fruit initiation stage and atharvest state. The data were statisticallyanalyzed in randomized block design with theereplications by the methods given by Panse andSukhatme (1967) for interpretation ofresults.
Results and Discussion
The experimental findings of differentnutrient chemicals and growth regulators on theperformance of post harvest growth arepresented (Table 1).
Effects on vegetative growth attribute:The results were analyzed on two groups ofshoots i.e. old shoots and new shoots.Irrespective of the treatments the old shootshows positive effects on all attributes viz. lessertimes required for bud break (98.49 day over102.02 days) and production of morevegetative flush percentage (70.31) over thegroup of new shoots (45.05). It means that,stored assimilates and hormones possess theimportant role on vegetative growth of nextseason. The results influenced by differenttreatments of chemicals indicated theacceleration of vegetative growth. KNO3 @ 3%treatment requires lowest number of days(85.33 days) for bud breaking. Foliar urea,ammonium nitrate and hydrogen cyanamidesignificantly took fewer days (12.42, 13.36,13.89 days) for completed exertion of paniclecompared to control.
The percent vegetative flush observed onold shoots was significantly more (70.31%)than new shoots (45.05%). The appliedtreatment of foliar KNO3 (3%) recordedmaximum percentage of vegetative growth inboth the types of shoots (87.67% and 55.67%respectively) followed by foliar urea (77%) andatomonium nitrate (76.67%) compared tocontrol (65% and 40.33%). The higherpercentage of vegetative growth observed onold shoots were the results of higher levels of
gibberellins like compounds remained from lastyear. Similar results of GA3 synthesis in mangowere reported by Burondkar et al. (1991),Rajput et al. (1992) and Shinde et al. (2002).
Effects on flowering attribute : Theflowering percentage observed on selectedplants varies with different factors like maturityof vegetative shoots, variety, crop load andhormonal regulation. In present investigation,among the two types of shoots, old shootsflowers earlier (101.9 days) than new shoots(103.05 days). The aggregate mean of twoshoots stated that KNO3 registered lowestnumber of days for flowering (88 days) followedby foliar application of GA3 (92 days) thancontrol (112.17 days). The data regardingflowering percent observed amongst the 8treatments, foliar Thiourea (77.17%) andKNO3 (67.5%) recorded maximum floweringpercentage over control (53.50%).
Among the two types a shoots i.e. old andnew shoots KNO3 exhibited early (19.87 to
Patil and Burondkar42

23.17 days) and profuse flowering (19% and11.52% more) than control. The better resultsof flowering also given by Thiourea (11.38 daysearly and 15.42% more flowering) over control.Nitrates present in the chemicals helps toinduce the positive effect on length of floweringpanicle and number of secondary branches perpanicle in ON year reported by Sanyal et al.(1996) and Oosthyuse (1997).
Effects on yield contributingattributes: The present study indicates thepromising results by different nutrient chemicaltreatments on flowering pattern andencouragement of fruit set on old and newshoots. The number of fruits retained perpanicle was found to be significantly higher in 3per cent KNO3 (4.20) over control. In spite ofthis, there was significant increase in yield interms of number of fruits tree-1 induced byfoliar urea (158.83 old shoot and 140.83 newshoots) and GA3 (154.50 old shoots and136.17 new shoots) over control (114.00). theKNOs also found to have significantly higherfruit weight (41.71) over followed by 2 per centfoliar urea (39.71) compared to control(34.33). It is clear that, fruit set is primarilydependent on the amount of hermaphroditeflowers produced per panicle KNO3 showsbeneficial effects due to presence of nitrogenwhich is one of the essential nutrient requiredfor growth and fruit retention. The positive roleof KNO3 i.e. in fruit set and increasing finalyield was mentioned by Sergent et al. (1996),Ataide and Jose (2000) and Oosthuyse(1997).
The study revealed that nutrients (KNO3,NH4(NO3)2) as a foliar spray are more effectivein induction of post harvest early and profusevegetative growth as well as flowering. While,
growth regulators (GA3, Dormex) hastenvegetative growth and significantly increase thefruit setting and final yield. 2 per cent foliarapplication of potassium nitrate significantlyincreases induction of vegetative growth,percent flowering over all other treatments.
ReferencesAtaide, E. M. and Jose, A. R. S. 2000. Effect of different
interval of potassium nitrate spraying on flowering andproduction of mango trees Cv. Tommy Atkins. ActaHorticulturae., 509: 581-586.
Burondkar, M. M. and Gungate, R. T. 1991. Control ofvegetative growth and induction of regular and earlycropping in 'Alphonso' mango with Paclobutrozol.Acta Horticulturae, 341: 206-215.
Oosthuyse, S. A. 1997. Effect of KNO3 spray to floweringmango trees on fruit retention, fruit size, tree yield andfruit quality. Acta Horticulturae, pp. 359-365.
Panse, V. G. and Sukhatme, P. V. 1967. Statisticalmethods for Agricultural Workers, ICAR, New Delhi.
Rajput, C. B. S., Singh, J. J. and Singh, S. P. 1992. Effectof urea, GA3 and BA on vegetative growth and yieldattributed in mango (Mangifera indica L.). IVthInternational Mango Symposium, Florida, USA, pp.45.
Shinde, A. K., Dalvi, M., Godse, S., Patil, B. and Pujari K.2002. Evaluation of chemical and growth regulatoryfor post harvest treatment of fruits in Alphonsomango. VIIth international mango symposium, Recife,Brazil, pp. 77.
Sanyal, D., Biswas, B. and Mitra, S. K. 1996. Studies onirregular bearing of mango (Mangifera indica L.) I.effect of chemicals. South Indian Hort, 44(1 and 2): 1-4.
Sen, P. K. and Mallick, P. C. 1941. The time ofdifferentiation of flower bud of the mango. Indian J. ofAgric. Sci., 11(74).: pp.
Sergent, E., Ferrari, D. and Leal, F. 1996. Effect ofpotassium nitrate and Paclobutrazol on floweringinduction and yield of mango (Mangifera indica L.)Cv. Haden. Proceedings of Abstract book VIth
international mango symposium, Pattaya city,Thailand, pp.
Journal of Agriculture Research and Technology 43
______________
Onion (Allium cepa L) is a bulb vegetable,cultivated in almost all the countries of theworld and consumed across the globe. Onionsare often chopped and used as an ingredient invarious healthy warm dishes. Onions are said tobe have therapeutic, antibacterial andantifungal beneficial properties. Generallymature onion bulbs are more often eaten, theyalso eaten at immature stage. The young onionplants harvested before bulbing and used as awhole scallions. In India onions are cultivatedon 12.03 lakh ha area with production of194.01 lakh MT and productivity of 16.10MT ha-1. Maharashtra is said to be Onion bagsof India having lion's share of 38 per cent ofthe country's total production. Which iscultivated on 4.68 lakh ha area withproduction of 58.64 lakh MT and productivityof 12.50 MT ha-1. After meeting hugedomestic demand, it is a important commodityamong the exported horticulture produce.During the year 2013-14, 9.53 lakh MT freshonions have been exported from whichRs.229.33 crore of foreign exchange earned.
This contributes about 21.10 per cent of totalhorticulture produce export earnings.(Anonymous, 2014).
In green top onion to get maximumeconomic benefits in traditional onioncultivation, most efficient use of fertilizers is prerequisite. Macro and micronutrients can beapplied through foliar sprays (Jeyabal et al.1998). All the essential elements can be takenby the plants through foliage, but only in smallquantities at a time. Foliar application of growthregulators and micronutrients is not a substitutefor soil application but it is an effectiveadditional means of supplying sudden increaseddemands of nutrients. In foliar application,nutrients are supplied directly to where they arerequired. It is also effective when the bulbgrowth is restricted due to pest and diseaseattack, it serves effective for quick recovery ofthe crop. In green top onion, fertilizers areapplied in addition to foliar application ofnutrients and growth regulators, whichincreases significantly the yield level andbiomass of vegetables. With these view thepresent investigation was carried out to study
J. Agric. Res. Technol., 41 (1) : 044-047 (2016)
Effect of Plant Growth Regulators and Nutrients on Growthand Yield of Green Top Onion (Vegetable purpose)
S. G. Bhalekar1, S. U.Chalak2 and K. K. Bhangre3
Department of Horticulture, College of Agriculture, Pune - 411 005 (India).(Received : 02-05-2015)
AbstractA field investigation entitled "Effect of plant growth regulators and nutrients on growth and yield of green
top onion (vegetable purpose)" was carried out at Onion Storage Scheme, MPKV, Rahuri during Kharif andLate Kharif seasons of 2011 and 2012. The results revealed that, in green top onion two sprays of 19:19:19water soluble fertilizer @ 0.5 per cent at 30 and 45 days after transplanting along with basal dose of fertilizerFYM 10 t ha-1 and 50:50:50 NPK kg ha-1 recorded significantly the maximum plant height (72.13 cm), plantweight (53.80 g) and green top yield (35.17 t ha-1) with highest B:C ratio 2.11.
Key words : Green top onion, foliar application, nutrients, plant growth regulators.
1. Associate Professor of Horticulture, 2. SeniorResearch Assistant and 3. Junior Research Assistant.
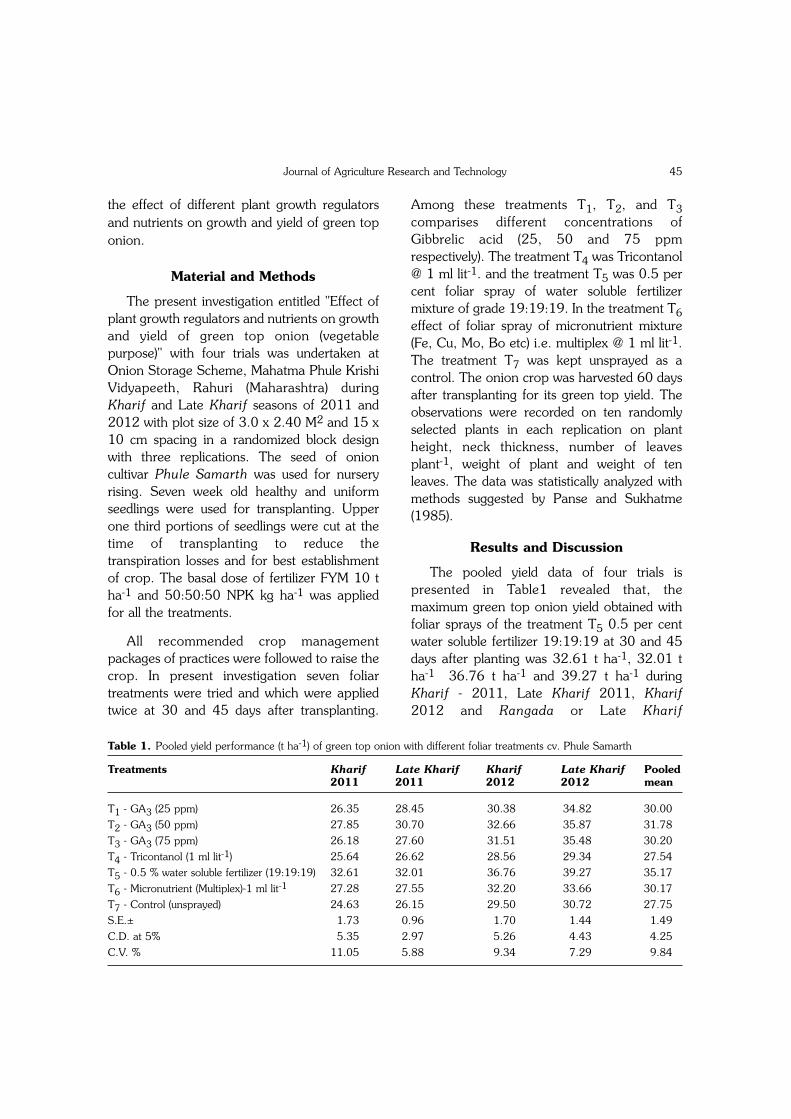
the effect of different plant growth regulatorsand nutrients on growth and yield of green toponion.
Material and Methods
The present investigation entitled "Effect ofplant growth regulators and nutrients on growthand yield of green top onion (vegetablepurpose)" with four trials was undertaken atOnion Storage Scheme, Mahatma Phule KrishiVidyapeeth, Rahuri (Maharashtra) duringKharif and Late Kharif seasons of 2011 and2012 with plot size of 3.0 x 2.40 M2 and 15 x10 cm spacing in a randomized block designwith three replications. The seed of onioncultivar Phule Samarth was used for nurseryrising. Seven week old healthy and uniformseedlings were used for transplanting. Upperone third portions of seedlings were cut at thetime of transplanting to reduce thetranspiration losses and for best establishmentof crop. The basal dose of fertilizer FYM 10 tha-1 and 50:50:50 NPK kg ha-1 was appliedfor all the treatments.
All recommended crop managementpackages of practices were followed to raise thecrop. In present investigation seven foliartreatments were tried and which were appliedtwice at 30 and 45 days after transplanting.
Among these treatments T1, T2, and T3comparises different concentrations ofGibbrelic acid (25, 50 and 75 ppmrespectively). The treatment T4 was Tricontanol@ 1 ml lit-1. and the treatment T5 was 0.5 percent foliar spray of water soluble fertilizermixture of grade 19:19:19. In the treatment T6effect of foliar spray of micronutrient mixture(Fe, Cu, Mo, Bo etc) i.e. multiplex @ 1 ml lit-1.The treatment T7 was kept unsprayed as acontrol. The onion crop was harvested 60 daysafter transplanting for its green top yield. Theobservations were recorded on ten randomlyselected plants in each replication on plantheight, neck thickness, number of leavesplant-1, weight of plant and weight of tenleaves. The data was statistically analyzed withmethods suggested by Panse and Sukhatme(1985).
Results and Discussion
The pooled yield data of four trials ispresented in Table1 revealed that, themaximum green top onion yield obtained withfoliar sprays of the treatment T5 0.5 per centwater soluble fertilizer 19:19:19 at 30 and 45days after planting was 32.61 t ha-1, 32.01 tha-1 36.76 t ha-1 and 39.27 t ha-1 duringKharif - 2011, Late Kharif 2011, Kharif2012 and Rangada or Late Kharif
Journal of Agriculture Research and Technology 45
Table 1. Pooled yield performance (t ha-1) of green top onion with different foliar treatments cv. Phule Samarth
Treatments Kharif Late Kharif Kharif Late Kharif Pooled2011 2011 2012 2012 mean
T1 - GA3 (25 ppm) 26.35 28.45 30.38 34.82 30.00T2 - GA3 (50 ppm) 27.85 30.70 32.66 35.87 31.78T3 - GA3 (75 ppm) 26.18 27.60 31.51 35.48 30.20T4 - Tricontanol (1 ml lit-1) 25.64 26.62 28.56 29.34 27.54T5 - 0.5 % water soluble fertilizer (19:19:19) 32.61 32.01 36.76 39.27 35.17T6 - Micronutrient (Multiplex)-1 ml lit-1 27.28 27.55 32.20 33.66 30.17T7 - Control (unsprayed) 24.63 26.15 29.50 30.72 27.75S.E.± 1.73 0.96 1.70 1.44 1.49C.D. at 5% 5.35 2.97 5.26 4.43 4.25C.V. % 11.05 5.88 9.34 7.29 9.84

2012 respectively.
The overall pooled data showed the sametrend. The treatment T5 (0.5% water solublefertilizer 19:19:19) foliar spray at 30 and 45days after translanting recorded significantly
maximum green top yield (35.17 t ha-1), plantheight (72.13 cm), neck thickness (1.14 cm),average plant weight (53.80 g) and ten leavesweight (58.30 g). The control (unsprayed)treatment recorded lowest yield (27.75 t ha-1),plant height (57.10 cm) neck thickness (0.93
Bhalekar et al.46
Table 2. Pooled ancillary observations of green top onion cv. Phule Samarth with different foliar treatments (2011-12)
Treatments Plant Neck No. of Av. wt. Wt. of Remarksheight thick- leaves of plant ten (cm) ness plant-1 (g) leaves
(cm) (g)
T1 - GA3 (25 ppm) 60.12 0.94 9.80 50.20 35.50 Green leaves, soft , good quality
T2 - GA3 (50 ppm) 70.47 1.03 10.80 52.84 44.10 Green leaves, soft , good quality
T3 - GA3 (75 ppm) 63.58 0.96 9.90 50.40 36.40 Green leaves, soft , good quality
T4 - Tricontanol (1 ml lit-1) 58.38 0.91 9.60 44.92 32.09 Green leaves, soft , good quality
T5 - 0.5% water soluble fertilizer (19:19:19) 72.13 1.14 10.80 53.80 58.30 Dark green leaves, shining, attractive, soft , excellent quality.
T6 - Micronutrient (Multiplex)-1 ml lit-1 64.29 1.02 10.01 50.29 38.40 Green leaves, soft , good quality
T7 - Control (unsprayed) 57.10 0.93 9.60 44.98 32.40 Green leaves, soft , good quality
S.E.± 0.79 0.03 0.40 2.20 0.43C.D. at 5% 2.42 0.11 N.S. 6.79 1.33C.V. % 2.136 6.10 - 7.69 1.33
Table 3. Economics of different foliar treatments in green top onion cv. Phule Samarth
Treatments Av. Total Gross Net B:Cyield expenditure monetary monetary ratio(T ha-1) (Rs. ha-1) returns returns
(Rs. ha-1) (Rs. ha-1)
T1 - GA3 (25 ppm) 30.00 83552 1,50,000.00 66,448.00 1.80T2 - GA3 (50 ppm) 31.78 84752 1,58,896.00 74,144.00 1.88T3 - GA3 (75 ppm) 30.20 85952 1,50,975.00 65,023.00 1.76T4 - Tricontanol (1 ml lit-1) 27.54 82592 1,37,704.00 55,112.00 1.67T5 - 0.5% water soluble fertilizer (19:19:19) 35.17 83352 1,75,829.00 92,477.00 2.11T6 - Micronutrient (Multiplex)-1 ml lit-1 30.17 83272 1,50,867.00 67,595.00 1.81T7 - Control (unsprayed) 27.75 81624 1,38,767.00 57,143.00 1.70S.E.± 1.49 - 2,511.83 2,512.00 0.028C.D. at 5 % 4.25 - 7,463.00 7,463.00 0.085
(Rate of Sale Rs. 500 q-1)
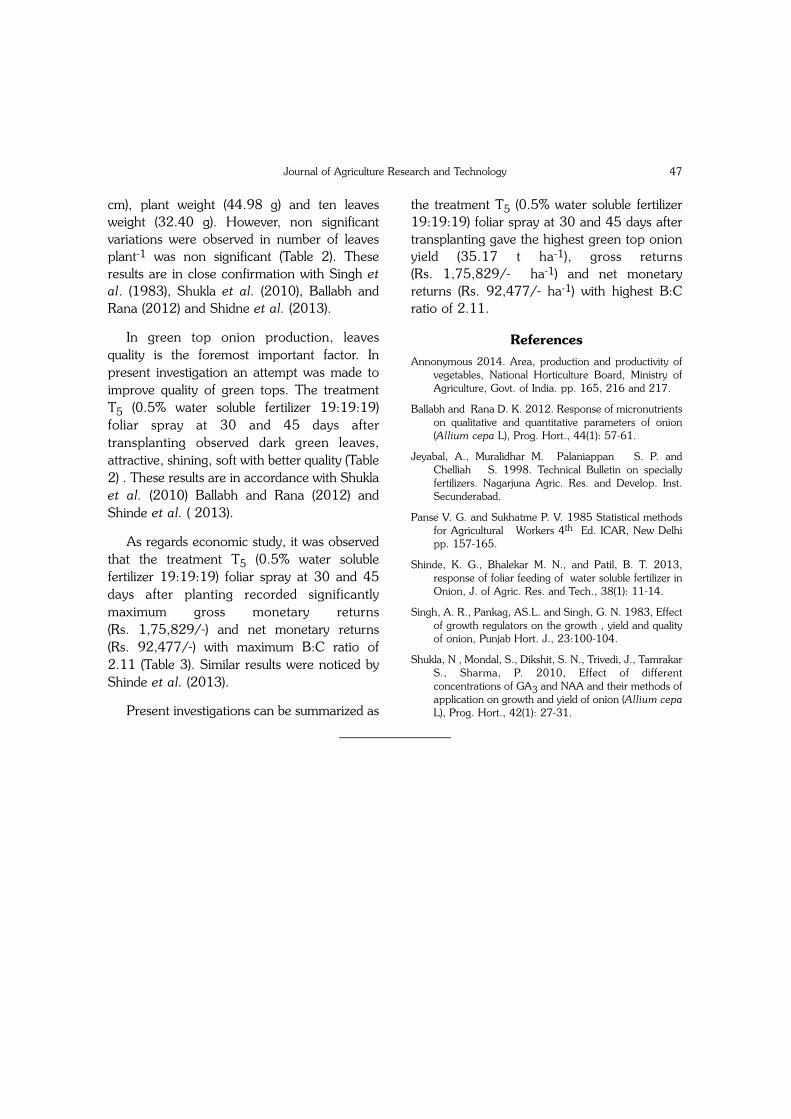
cm), plant weight (44.98 g) and ten leavesweight (32.40 g). However, non significantvariations were observed in number of leavesplant-1 was non significant (Table 2). Theseresults are in close confirmation with Singh etal. (1983), Shukla et al. (2010), Ballabh andRana (2012) and Shidne et al. (2013).
In green top onion production, leavesquality is the foremost important factor. Inpresent investigation an attempt was made toimprove quality of green tops. The treatmentT5 (0.5% water soluble fertilizer 19:19:19)foliar spray at 30 and 45 days aftertransplanting observed dark green leaves,attractive, shining, soft with better quality (Table2) . These results are in accordance with Shuklaet al. (2010) Ballabh and Rana (2012) andShinde et al. ( 2013).
As regards economic study, it was observedthat the treatment T5 (0.5% water solublefertilizer 19:19:19) foliar spray at 30 and 45days after planting recorded significantlymaximum gross monetary returns(Rs. 1,75,829/-) and net monetary returns(Rs. 92,477/-) with maximum B:C ratio of2.11 (Table 3). Similar results were noticed byShinde et al. (2013).
Present investigations can be summarized as
the treatment T5 (0.5% water soluble fertilizer19:19:19) foliar spray at 30 and 45 days aftertransplanting gave the highest green top onionyield (35.17 t ha-1), gross returns(Rs. 1,75,829/- ha-1) and net monetaryreturns (Rs. 92,477/- ha-1) with highest B:Cratio of 2.11.
ReferencesAnnonymous 2014. Area, production and productivity of
vegetables, National Horticulture Board, Ministry ofAgriculture, Govt. of India. pp. 165, 216 and 217.
Ballabh and Rana D. K. 2012. Response of micronutrientson qualitative and quantitative parameters of onion(Allium cepa L), Prog. Hort., 44(1): 57-61.
Jeyabal, A., Muralidhar M. Palaniappan S. P. andChelliah S. 1998. Technical Bulletin on speciallyfertilizers. Nagarjuna Agric. Res. and Develop. Inst.Secunderabad.
Panse V. G. and Sukhatme P. V. 1985 Statistical methodsfor Agricultural Workers 4th Ed. ICAR, New Delhipp. 157-165.
Shinde, K. G., Bhalekar M. N., and Patil, B. T. 2013,response of foliar feeding of water soluble fertilizer inOnion, J. of Agric. Res. and Tech., 38(1): 11-14.
Singh, A. R., Pankag, AS.L. and Singh, G. N. 1983, Effectof growth regulators on the growth , yield and qualityof onion, Punjab Hort. J., 23:100-104.
Shukla, N , Mondal, S., Dikshit, S. N., Trivedi, J., TamrakarS., Sharma, P. 2010, Effect of differentconcentrations of GA3 and NAA and their methods ofapplication on growth and yield of onion (Allium cepaL), Prog. Hort., 42(1): 27-31.
Journal of Agriculture Research and Technology 47
______________

Mungbean (Vigna radiata (L.) Wilczek) isone of the short duration, major pulse cropsupplementing the cereal-based diet of the poorin Asia today. It is one of the most importantlegumes and widely cultivated in differentseason in India. High in protein content andeasy to digest, mungbean consumed incombination with cereals can significantlyincrease the quality of protein in a meal. Theproductivity of mungbean is less as comparedto other pulse crops due to various reason likebiotic and abiotic stresses and adaptation ofpoor agronomic practices. There is urgent needto increase the production and productivity forfood and nutritional security. Farmers are inwant of variety which is having large seed size,long pod, powdery mildew resistant, welladopted and short duration. Among the yieldcontributing parameters seed weight has beenvery important trait not only for increasing seedyield but also for better milling quality.
Materials and Methods
The six diverse parents were used foreffecting three direct crosses of mungbeanduring Kharif-2011 and F1 generations wereraised during summer-2012 for getting F2 seedfor raising F2 generation at Botany section,College of Agriculture, Dhule. The parents, F1and F2 generations of three crosses were usedfor conducting an experiment in RandomizedBlock Design with three replications, duringKharif-2012. The observations were recordedon randomly selected 5 plants in parents andF1s and 40 in F2 generations in eachreplication on number of clusters plant-1,number of pods plant-1, pod length, number ofseeds pod-1, 100-seed weight and seed yieldplant-1. The data collected on individualcharacter were subjected to the statisticalanalysis as per the procedure given by Panseand Sukhatme (1995). The transgressivesegregants were estimated by calculatingnormal deviation (N. D.) value as per theformula given below.
J. Agric. Res. Technol., 41 (1) : 048-051 (2016)
Transgressive Segregation in Mungbean (Vigna radiata (L.)Wilczek)
S. M. Karkute1, V. S. Girase2 and A. J. Patil3
Botany Section, College of Agriculture, Dhule - 424 004 (India)(Received : 02-05-2015)
AbstractThe highest percentage of transgressive were observed for clusters plant-1 (16.6%) in cross AKM 9910
x BPMR-145, followed by number of pods plant-1 (16.6%) and seed yield plant-1 (15.0%) in cross BM-2005-1 x NVL-605. In general, in all the three the highest proportion of transgressive segregants were recordedfor number of pods plant-1 (46) followed by seed yield plant-1 (43), number of clusters plant-1 (41), pod length(40), number of seeds pod-1 (36) and 100-seed weight (28). The dependency of grain yield on thesecharacters and production of individual segregants and simultaneous transgressants of seed yield incombination with 3 or 4 characters indicated the feasibility of funneling such ideotype in mungbean. If thesesegregants hold true in further generations, will be of high value in fixing characters, hence their furthergenerations are under evaluation.
Key words : Transgressive segregation, mungbean
1. M. Sc. (Agri.) Student, 2. Assistant Professor and3. Professor.

P–(+) + 1.96 x σ P–(+) - X–
N.D.value = ––––––––––––––––––––––––σ
Where, P–(+) = Mean of increasing parent,σ P–(+) = Standard deviation of increasingparent, X– = Mean of segregating generationand σ = Standard deviation of respectivesegregating generation.
The segregants showing deviation beyondthe normal deviation value would be thetransgressive segregants.
Results and Discussion
Transgressive segregation is considered as
an important tool for the plant breeder to bringabout crop improvement. In certain cases, dueto segregation and recombination,transgressive segregants are produced in F2 orlatter segregating generations by accumulationof favourable genes from the parents involvedin hybridization. Generally diverse parentshaving better combining ability are more likelyto give transgressive segregants.
Transgressive segregants in desirabledirection were observed for all the sixcharacters in F2 generation of all the threecrosses. The highest percentage oftransgressive segregants were observed fornumber of clusters per plant (16.6%) followed
Journal of Agriculture Research and Technology 49
Table 1. Threshold value (TV), Normal deviation value (ND), Frequency, Percentage and range in the values of transgressivesegregants for six characters in three crosses of Mungbean
Characters N. D. T. V. Transgressive segregation inF2 generation
––––––––––––––––––––––––––––––––––––––––––Frequency T. S. Range inof T. S. % values
of T. S.
Cross I: AKM 9910 x BPMR 145No. of clusters plant-1 0.91 07.03 20 16.60 08.00-09.00No. of pods plant-1 1.17 29.74 15 12.50 31.00-36.00Pod length (cm) 1.57 10.15 12 10.00 10.16-11.20No. of seeds pod-1 1.16 14.24 11 09.16 15.00-17.00100-seed weight (g) 1.48 05.61 14 11.66 05.89-06.53Seed yield plant-1 (g) 1.57 11.74 11 9.16 11.77-13.97
Cross II: BM-2005-1 x NUL-605No. of clusters plant-1 2.13 07.40 09 07.50 07.50-08.00No. of pods plant-1 1.31 27.42 11 09.16 28.00-31.00Pod length (cm) 1.32 112.02 13 10.80 12.09-12.89No. of seeds pod-1 1.44 14.74 15 12.50 14.95-15.15100-seed weight (g) 1.42 04.95 06 5.00 04.97-05.65Seed yield plant-1 (g) 1.15 11.94 14 11.66 12.05-14.82
Cross III: Vaibhav x NavalNo. of clusters plant-1 1.84 07.66 11 09.16 08.00-09.00No. of pods plant-1 0.89 25.38 20 16.66 26.00-29.00Pod length (cm) 1.51 11.69 16 13.30 11.70-12.70No. of seeds pod-1 1.21 14.51 10 08.33 14.60-15.60100-seed weight (g) 1.69 5.19 08 15.00 05.22-05.98Seed yield plant-1 (g) 1.09 11.03 18 15.00 11.22-13.88

by number of pods plant-1 (12.5%) in cross I,while in cross II, they were highest for numberof seeds pod-1 (12.5%) followed by seed yieldplant-1 (11.66%). In cross III, the highestproportion of transgressive segregants wererecorded for number of pods plant-1 (16.66%)followed by seed yield plant-1 (15.0%), (Table1).
In general, the highest proportion oftransgressive segregants were recorded fornumber of pods plant-1 (46) followed by seed
yield plant-1 (43), number of clusters plant-1
(41), pod length (40), number of seeds pod-1
(36) and 100-seed weight (28), in total threecrosses. Kant and Singh (1998) observed thetransgressive segregants for plant height,branches plant-1 and 100-seed weight in lentil.Dole and Reddy (2011) and Sabale and Girase(2014) observed the transgressive segregantsfor plant height, number of clusters plant-1,number of pods plant-1, number of seedspod-1, 100-seed weight and seed yield plant-1
in mungbean.
Karkute et al.50
Table 2. Performance of rare and important transgressive segregants
Generation Plant No. of No. of Pod No. of Seed Seed Percentage ofno. clusters pods length seeds weight yield increase over
plant-1 plant-1 (cm) pod-1 (g) (g) increasing parent
F2 71 9.00 36.0 11.20 12.00 6.34 13.9 61.3AKM-9910 5.60 26.0 8.77 11.36 3.66 8.66BPMR-145 4.30 22.0 9.12 12.66 4.63 7.64F2 88 5.00 31.0 12.40 15.15 4.14 14.82 69.8BM-2005-1 5.66 16.6 8.98 12.33 4.05 7.75NUL 605 4.00 21.3 10.66 13.33 4.62 8.73F2 07 5.26 25.0 12.20 5.98 5.98 13.88 76.6Vaibhav 5.26 18.3 8.10 3.37 3.37 7.74Naval 4.36 19.6 10.18 4.44 4.44 7.86
Table 3. Percentage of simultaneous transgressive segregants
Cross Percentage of Characters for which transgressants was simultaneousno. simultaneous
transgessants
1 1.66 Seed yield plant-1, number of pods plant-1, pod length and number of seeds pod-1
2 2.503 2.503 0.83 Seed yield plant-1, number of pods plant-1, number of seeds pod-1 and 100-seed weight1 2.50 Seed yield plant-1, number of cluster plant-1 and pod length2 2.503 2.501 1.66 Seed yield plant-1, pod length and 100-seed weight2 0.833 0.831 1.66 Yield plant-1, number of clusters plant-1 and 100-seed weight2 0.833 0.83

It is also interesting to note here that theconcept of transgrssive segregation has beeneffective for extending the intensity of characterexpression. The recovery of character wasgreater in cross I for clustes plant-1 (9 clusters),pods plant-1 (36 pods), seeds pod-1 (17 seeds)and 100-seed weight (6.53 g). The highestexpression of seed yield plant-1 (14.82 g) andpod length (12.40 cm) were found in cross II(Table 2). The seed size and seed weight are theimportant traits contributes greatly in totalproduction of mungbean. Hence, researchworkers must consider both the traits forimprovement by different breeding approaches.On the basis of performance of transgressivesegregants, it is concluded that, when thedesired intensity of a character is not availablein the parents, the concept of transgressivesegregation can be successfully used to extendthe limit of character expression. The mostpromising transgressive segregants No.71 ofcross I, No.88 of cross II and No.7 of cross III,produced 61.3 , 69.8 and 76.6 per cent moreseed yield plant-1, respectively than theirrespective increasing parents. Dhole and Reddy(2011) and Sabale and Girase (2014) alsoobserved the transgressive segregants for allthese trait in mungbean.
In most of the transgressive segregants, ineach of the three crosses, better parent yieldwas transgressed simultaneously withtransgression of one or several othercharacters. Simultaneous transgression of seedyield plant-1 in association with number of podsplant-1, pod length and number of seeds pod-1
were observed to the extent of 1.66, 2.50 and2.50 per cent in cross I, II and III, respectively(Table 3). In second case, the transgression ofseed yield plant-1 in association with number of
clusters plant-1 and pod length to the extent of2.50 per cent consistently in all the threecrosses. In third case, transgression of seedyield plant-1 in association with number of podsplant-1, pod length and number of seeds pod-1
were observed to the extent of 1.66, 2.50 and2.50 per cent in cross I, II and III, respectively.It is concluded that either seed yield isdependent on these characters or there may belinkage drag among themselves, so that genescontrolling these characters move together.Girase and Deshmukh (2002) also observed thesimultaneous transgressive segregation for seedyield and its attributes in chickpea.
These transgressive segregants needs to beevaluated further for consistency in theirperformance. If they hold true in furthergenerations, will be of high value in fixingcharacters, hence their further generations areunder evaluation. If they found promising maybe identified for release as a varieties or used infurther breeding programme for amalgamationof genetic constellations in a hybrid derivative
References
Dhole, V. J. and Reddy, K. S. 2011. Genetic analysis andtransgressive segregation for seed weight and seedyield in F2 populations of Mungbean. Electronic J.Plant Breed., 2(3): 384-391.
Girase, V. S. and Deshmukh, R. B. 2002. Transgressivesegregation of grain yield and its components inChickpea. J. Maharashtra agric. Univ., 27(1): 15-18.
Kant, L. and Singh, D. P. 1998. Transgressive Segregationof yield and yield components in Lentil. Indian J.Genet., 58: 343-347
Panse, V. G. and Sukhatme, P. V. 1995. Statistical methodfor Agricultural workers. ICAR, New Delhi.
Sabale, V. B. and Girase, V. S. 2014. Transgressivesegregation and correlation analysis in Mungbean.M.Sc. (Agri.) thesis submitted to MPKV, Rahuri.
Journal of Agriculture Research and Technology 51
______________

Rice (Oryza sativa) is a major staple food forhigher percentage of the world's populationparticularly in Asia, where more than 90 percent of rice is grown. The Asia-pacific regionproduces and consumes more than 90 percentof the total world's rice. Therefore rice is notonly a staple food of the region but also a wayof life. In India rice occupies an area of 43.75million hectares with production of 85.30million tonnes. India has largest area under ricecrop in the worlds (Anonymous, 2009) .InMaharashtra, rice ranks third in respect ofacreage among important cereal crops. Thetotal area occupied by this crop is about 15.50lakhs hectares, with annual production of28.55 lakhs tonnes. In konkan region ofMaharashtra rice is grown on an area of 4.10lakhs hectares with production 10.25 lakhstonnes (Anonymous, 2008).
Storage of seeds till the next sowing season
is an essential segment of seed industry. Theseed deterioration begins immediately afterphysiological maturity and is reflected in termsof loss in viability and vigour. The viability andvigour largely depends on the genotypes,production, location, mechanical injury to theseed, initial seed quality, seed treatment,packaging material and storage conditions(Verma et al., 1993).About 80 percent of thecertified seeds produced in India require storagefor one planting (6-7 months) and 20 percentof the seed is carried over for subsequentsowing (Bal, 1976). Out of several factorsaffecting the seeds in storage, seed moisture,relative humidity and storage temperature arethe most important (Agrawal,1976). Saibabu etal., 1983) reported that viability of paddy seedwas maintained for longer periods when storedwith initial seed moisture of 11 percent inmoisture proof containers like polyethylenebags (600 gauge) and metal containers, underambient conditions. Storage studies in hybrid
J. Agric. Res. Technol., 41 (1) : 052-058 (2016)
Effect of Fumigation and Different Packaging Material onStorage of Paddy (Oryza sativa L.) Seed
A. K. Shinde1, V. Y. Bharambe2, U. V. Mahadkar3 and S. B. Bhoye4
Dr. Balasaheb Sawant Konkan Krishi Vidyapeeth, Dapoli - 415 712 (India)(Received : 10-07-2015)
AbstractExperiment was conducted to study the effect of fumigation and packaging material on storage of paddy
seed. The processed seed was dryed to 10 per cent moisture fumigated with Aluminium phosphide 56 percent and packed in different packaging material. The results revealed that there was a significant differencein seed germination of paddy seed stored at 11, 13 and 15 months of storage due to packaging material. At15 months of storage the fumigated seed of paddy stored in polylined HDPE (bag) showed significantly highergermination (87.02%) and field emergence (82.0%) over control and rest of the treatments. The seedfumigated with insecticide and stored in PLHDPE bag showed higher seed germination, field emergence,speed of germination, vigor index, lower electrical conductivity, pest incidence and moisture level. On basisof pooled data of the study revealed that the paddy seed fumigated with Aluminium phosphide (56%) andpacked in polylined HDPE bag is promising for storage of paddy seed.
Key words : Paddy seed, fumigation, storage material.
1. Dy. Director of Research (Seed), 2. Senior ResearchFellow, 3. Director of Research and 4. M.Sc. Student.

rice and their parental lines revealed thatpolythene bag proved better in maintainingviability and vigour as compared to cloth bags(Yogalakshmi, 1995). Sharma et al., 1998revealed that the polylined gunny bags provedbetter container both for laboratory as well asbulk storage in seed godowns which maintainviability for longer period through minimumvariation in seed moisture during storage.
In Konkan region of Maharashtra the paddyseeds remain viable only for 9 to 10 months.Therefore, the objective of this experimentationwas to study the effect of packaging materialand fumigation on storage of paddy seed.
Material and Methods
Experiment was conducted at Seed TestingLaboratory, Dr. Balasaheb Sawant KonkanKrishi Vidyapeeth, Dapoli to study the effect ofpackaging material and fumigation on storageof paddy seed. The seed of rice varietyRatnagiri-4 was used for this study. Theexperiment was carried out during 2012-13,
2013-14 and 2014-15 by using previousKharif season seed. The processed seeds wasdried up to 10 per cent moisture and fumigatedwith Aluminium phosphide 56 per cent. Onegm Aluminium phosphide 56 per cent sachetwas used for 100 kg paddy seed lot fumigatedat 48 hrs. time interval. The seed lot withoutfumigation was kept for comparison. The seedwas bagged (10 kg) in various packagingmaterial. There were 6 treatments and 12treatments combinations.
The experiment was conducted in FactorialComplete Randomised Design with fourreplications. The seed bags were kept on racksin Seed Testing Laboratory at ambientcondition. The germination test was carried outby between paper method at monthly intervaland seed moisture was determined by hot airoven method (ISTA, 1999). The incidence ofrice moth and weevil was recorded. The datawas subjected to statistical analysis inaccordance with the procedure (Snedecor andCochran, 1994).
Journal of Agriculture Research and Technology 53
Table 1. Pooled analysis of effect of different packaging materials on seed germination (%) of paddy
Treatment Initial October December Febreaury(11 months (13 months (15 monthsof storage) of storage) of storage)
T1F1 - Polylined bag 92.77 (74.41)* 89.89 (70.73) 87.23 (69.07) 76.42 (60.95)T1F2 - Polylined bag 93.28 (74.99) 85.42 (68.14) 75.70 (63.22) 65.92 (54.29)T2F1 - Gunny bag 92.26 (73.86) 88.45 (70.15) 62.02 (51.95) 53.67 (47.10)T2F2 - Gunny bag 91.28 (72.83) 83.69 (66.18) 51.02 (45.58) 43.08 (41.02)T3F1 - HDPE bag 92.92 (74.59) 89.42 (71.05) 61.10 (51.42) 53.25 (46.86)T3F2 - HDPE bag 93.51 (75.24) 87.84 (69.60) 52.68 (46.53) 52.75 (46.58)T4F1 - Polylined gunny bag 93.59 (75.33) 89.83 (71.46) 81.92 (64.83) 78.02 (62.04)T4F2 - Polylined gunny bag 93.59 (75.36) 87.83 (69.61) 74.01 (59.35) 68.67 (55.96)T5F1 - Polylined HDPE bag 93.58 (75.35) 89.22 (70.84) 88.36 (70.06) 87.02 (68.88)T5F2 - Polylined HDPE bag 93.38 (75.13) 88.50 (70.20) 79.21 (62.87) 76.50 (61.01)T6F1 - Control (Cotton bag) 93.50 (75.26) 72.67 (58.48) 40.61 (39.59) 22.00 (27.97)T6F2 - Control (Cotton bag) 93.42 (75.15) 68.02 (58.59) 31.50 (34.14) 18.67 (25.60)Mean 93.09 (74.79) 85.00 (67.92) 65.78 (54.89) 58.00 (49.86)SE ± 0.38 0.38 0.22 0.21CD @1% NS 1.47 0.85 0.81
* Figures in parenthesis are arc sine transformed.

Results and Discussion
There was no significant difference in seedgermination at initial stage due to packagingmaterial. There was significant difference inseed germination of paddy seed stored at 11,13 and 15 month of storage due to packagingmaterial during last 3 years and pooled mean
(Table 1). It was observed that the seedgermination percentage decreased withadvancement of storage period irrespective ofpackaging material and fumigation. At 11 MOST1F1 (Polylined bag) showed significantly higherseed germination (89.89%) which was at parwith T5F1, T5F2, T4F1, T4F2, T3F1, T3F2 and
Shinde et al.54
Table 2. Effect of different packaging materials on field emergence (%) of paddy seed
Treatment Initial October December Febreaury(11 months (13 months (15 monthsof storage) of storage) of storage)
T1F1 - Polylined bag 90.10 84.40 82.00 71.10T1F2 - Polylined bag 90.20 82.70 74.70 60.40T2F1 - Gunny bag 91.00 83.70 58.10 48.60T2F2 - Gunny bag 90.50 83.10 46.90 38.10T3F1 - HDPE bag 90.90 84.20 56.60 48.20T3F2 - HDPE bag 90.50 82.50 48.30 42.30T4F1 - Polylined gunny bag 91.10 85.20 75.90 72.50T4F2 - Polylined gunny bag 91.50 84.10 70.00 62.30T5F1 - Polylined HDPE bag 92.00 86.80 83.30 82.00T5F2 - Polylined HDPE bag 91.30 85.00 75.20 71.00T6F1 - Control (Cotton bag) 91.50 66.60 34.50 17.30T6F2 - Control (Cotton bag) 90.90 60.70 25.10 13.60SE ± 1.10 0.43 0.35 1.72CD @1% NS 1.62 1.40 6.40
Table 3. Effect of different packaging materials on electrical conductivity (mmhos/cm) of paddy seed
Treatment Initial October December Febreaury(11 months (13 months (15 monthsof storage) of storage) of storage)
T1F1 - Polylined bag 120.10 191.50 208.30 229.90T1F2 - Polylined bag 122.80 211.00 222.60 240.30T2F1 - Gunny bag 121.90 215.10 229.00 253.40T2F2 - Gunny bag 124.00 220.90 242.90 270.80T3F1 - HDPE bag 124.80 213.60 230.50 255.00T3F2 - HDPE bag 127.00 221.90 248.70 272.70T4F1 - Polylined gunny bag 123.70 178.00 209.80 222.80T4F2 - Polylined gunny bag 126.10 189.50 220.10 241.50T5F1 - Polylined HDPE bag 125.00 161.80 194.20 211.10T5F2 - Polylined HDPE bag 126.80 179.20 212.40 230.30T6F1 - Control (Cotton bag) 122.90 231.10 235.50 261.80T6F2 - Control (Cotton bag) 124.00 241.30 252.00 284.40SE ± 1.21 3.40 3.30 4.80CD @1% NS 12.80 13.10 17.50

T2F1 over control i.e. cotton bag (68.02%) andother treatments. At 13 MOS T5F1 (PLHDPEbag seed fumigated) showed significantly higherseed germination (88.36%) which was at parwith T1F1 (87.23%) over other treatments andcontrol i.e. cotton bag (31.50%). At 15 MOST5F1 (PLHDPE and seed fumigated) showed
significantly higher seed germination (87.02%)over control (18.67%) and other treatments.From 3 years pooled data revealed that theseed fumigated with Aluminium phosphide56% and packed in polylined HDPE bag ispromising treatment for storage of paddy seed.Saibabu (1983) recorded viability of paddy
Journal of Agriculture Research and Technology 55
Table 4. Effect of different packaging materials on speed of germination of paddy seed
Treatment Initial October December Febreaury(11 months (13 months (15 monthsof storage) of storage) of storage)
T1F1 - Polylined bag 30.00 25.30 22.60 19.70T1F2 - Polylined bag 29.60 22.60 21.30 17.50T2F1 - Gunny bag 29.10 20.00 18.70 16.80T2F2 - Gunny bag 29.00 18.70 17.10 15.00T3F1 - HDPE bag 28.50 19.80 17.90 17.10T3F2 - HDPE bag 28.30 18.90 16.40 15.70T4F1 - Polylined gunny bag 27.80 27.80 24.30 20.00T4F2 - Polylined gunny bag 27.50 25.00 21.40 17.30T5F1 - Polylined HDPE bag 31.10 28.20 26.60 22.30T5F2 - Polylined HDPE bag 31.90 25.60 23.00 18.10T6F1 - Control (Cotton bag) 29.60 20.60 17.10 12.00T6F2 - Control (Cotton bag) 30.00 18.30 15.50 10.70SE ± 1.80 0.78 0.82 0.65CD @1% NS 2.65 3.00 2.00
Table 5. Effect of different packaging materials on vigour index of paddy seed
Treatment Initial October December Febreaury(11 months (13 months (15 monthsof storage) of storage) of storage)
T1F1 - Polylined bag 1910.00 1749.00 1103.00 913.00T1F2 - Polylined bag 1905.00 1634.00 1056.00 807.00T2F1 - Gunny bag 1850.00 1445.00 927.00 719.00T2F2 - Gunny bag 1871.00 1320.00 890.00 615.00T3F1 - HDPE bag 1974.00 1471.00 959.00 748.00T3F2 - HDPE bag 1970.00 1352.00 911.00 701.00T4F1 - Polylined gunny bag 1985.00 1751.00 1453.00 1185.00T4F2 - Polylined gunny bag 1997.00 1686.00 1307.00 1009.00T5F1 - Polylined HDPE bag 2004.00 1885.00 1624.00 1403.00T5F2 - Polylined HDPE bag 1996.00 1755.00 1395.00 1125.00T6F1 - Control (Cotton bag) 2010.00 1250.00 873.00 650.00T6F2 - Control (Cotton bag) 1991.00 1103.00 725.00 521.00SE ± 41.70 38.60 55.10 57.90CD @1% NS 112.90 150.90 182.00

seeds for longer periods with initial seed moist-ure of 11 percent and packed in moisture proofcontainers like polyethylene bags (600 gauge).
There was no significant difference in fieldemergence of paddy seeds at initial stage due topackaging material (Table 2). At 11 MOS T5F1
Shinde et al.56
Table 6. Effect of different packaging materials on pest incidence (%) of paddy seed
Treat- Initial July- Aug- Sept- Oct- Nov- Dec- Jan- Feb-ments (Nov. 2014 2014 2014 2014 2014 2014 2015 2015
2013) (8 mon- 9 mon- 10 mon- 11 mon- 12 mon- 13 mon- 14 mon- 15 mon-ths of ths of ths of ths of ths of ths of ths of ths ofstorage) storage) storage) storage) storage) storage) storage) storage)
T1F1 00 00 00 1.00 1.00 5.00 6.00 7.00 8.00T1F2 00 00 1.00 1.00 3.00 6.00 7.00 7.00 9.00T2F1 00 00 00 1.00 1.00 10.00 11.00 12.00 12.00T2F2 00 1.00 1.00 3.00 4.00 13.00 14.00 16.00 19.00T3F1 00 00 00 1.00 1.00 20.00 21.00 23.00 24.00T3F2 00 1.00 2.00 2.00 2.00 5.00 11.00 13.00 15.00T4F1 00 00 00 1.00 1.00 12.00 15.00 16.00 20.00T4F2 00 1.00 2.00 3.00 4.0 5.00 5.00 7.00 7.00T5F1 00 00 1.00 1.00 1.00 3.00 3.00 4.00 4.00T5F2 00 1.00 2.00 3.00 4.00 5.00 5.00 6.00 6.00T6F1 00 00 00 1.00 2.00 18.00 20.00 22.00 22.00T6F2 00 1.00 2.00 4.00 5.00 20.00 22.00 24.00 25.00SE ± 00.00 0.15 0.39 0.46 0.78 1.06 0.57 0.78 0.82CD @ 1% 00.00 NS NS NS NS 4.08 2.20 3.01 3.17
T1F1 - Polylined bag, T1F2 - Polylined bag, T2F1 - Gunny bag, T2F2 - Gunny bag, T3F1 - HDPE bag, T3F2 - HDPE bag,T4F1 - Polylined gunny bag, T4F2 - Polylined gunny bag, T5F1 - Polylined HDPE bag, T5F2 - Polylined HDPE bag, T6F1 -Control (Cotton bag), T6F2 - Control (Cotton bag)
Table 7. Effect of different packaging materials on seed moisture content (%) of paddy seed
Treatment Initial October December Febreaury(Nov. (11 months (13 months (15 months2013) of storage) of storage) of storage)
T1F1 - Polylined bag 10.20 11.20 11.20 11.90T1F2 - Polylined bag 10.10 11.30 12.00 12.20T2F1 - Gunny bag 10.00 12.50 13.50 14.30T2F2 - Gunny bag 10.00 12.70 13.50 14.00T3F1 - HDPE bag 10.10 12.90 13.50 13.90T3F2 - HDPE bag 10.30 13.00 13.80 14.00T4F1 - Polylined gunny bag 10.20 11.80 12.00 12.40T4F2 - Polylined gunny bag 10.30 12.00 12.20 12.50T5F1 - Polylined HDPE bag 10.20 11.90 12.10 12.30T5F2 - Polylined HDPE bag 10.00 12.10 12.30 12.50T6F1 - Control (Cotton bag) 10.10 13.50 14.20 14.30T6F2 - Control (Cotton bag) 10.10 14.00 14.30 14.50SE ± 0.64 0.45 0.38 0.44CD @ 1% NS NS NS NS

(seed fumigated & PLHDPE bag) significantlyhigher field emergence (86.80%) which was atpar with T4F1 (PL Gunny bag-seed fumigated)(85.2%) over control (60.70%) and othertreatments. At 13 MOS T5F1 showedsignificantly higher field emergence (83.30%)which was at par with T1F1-PLHDPE bag-seedfumigated (82.0%) over control (25.10%). At15 MOS T5F1 showed significantly higher fieldemergence (82.0%) over control (13.60%) andother treatments. Similar results were alsorecorded by Sharma and Swaran Lata (2006)that seed stored in HDPE bags showed higherfield emergence during storage.
Electrical conductivity of paddy seed wasfound to be increased with advancement ofstorage period irrespective of packagingmaterial (Table 3). Lower electrical conductivitywas noticed in T5F1 (seed fumigated andpacked in PLHDPE bag) than other treatmentsand control. Chandran and Rajgopal (2002)recorded the lower EC in tria-aluminium foilpouches.
Significantly higher speed of germinationwas observed in T5F1 (PLHDPE bag-seedfumigated) at 11, 13 and 15 month of storage(Table 4). Similar trend was recorded byBasavegouda and Nanjareddy (2008) andreported that speed of germination decreasedwith increased the storage duration mainly dueto decreased germination percentage.
Vigour index decreased with advancementof storage period. Significantly higher vigourindex was observed in T5F1 (PLHDPE-seedfumigated) at 11, 13 and 15 MOS over controland other treatments (Table 5). The results ofthe study is closely agreement with Nautiyal etal. (2001). He reported that vigour index ofseedling decreased with increased in storageperiod.
There was less incidence of pests in T5F1
(Seed fumigated-PLHDPE bag) than othertreatments. In control (cotton bag) there wasmore pest incidence in seed stored at 12, 13,14, 15 (Table 6). Similar trend was recorded byRasheed et al. (2004) and reported thatincreased in storage period there was increasedin pest incidence in control than othertreatments.
There was no significant difference in seedmoisture content due to various packagingmaterial (Table 7). Higher seed moisturecontent was recorded in control (cotton bag).Bera et al. (2008) also recorded that the paddyseeds stored at 11 percent moisture contentcan safely be stored up to one year undermodified atmosphere conditions.
Based on present study it can be concludedthat the paddy seed should be stored inpolylined HDPE bag after fumigation withAluminium phosphide (56%) which canmaintain seed germination above seed standardupto 15 month of storage. Thus, this seed canbe used for Kharif as well as Rabi season.
ReferencesAgrawal, P. K. 1976. Identification of suitable seed storage
places in India on the basis of temperature and relativehumidity. Seed Res., 7: 120-127.
Anonymous. 2008. Economic survey of Maharashtra,Department of Economics and Statistics. Governmentof Maharashtra, Mumbai.
Anonymous. 2009. http://www.fao.org.com
Bal, S. S. 1976. Magnitude and types of seed storageneeds in India, Seed Res., 4: 1-5.
Basavegouda and Nanjareddy. Y. A. 2008. Storage of rabior summer groundnut with desiccant to prolong seedviability and seedling vigour. Karnataka J. Agric. Sci., 21(3): 353-356.
Bera, A., Singh S. N., Ashok Gaur and Srivastava, C.2008. Effect of modified atmosphere storage on seedquality parameters of paddy. Seed Res., 36(1): 56-63.
Chandran, K. and Rajgopal, K. 2002. Influence ofpackaging media on the storability of groundnut(Arachis hypogea L.) germplasm. PGR new letter.130: 62-64.
Journal of Agriculture Research and Technology 57

International Seed Testing Association.1999. InternationalRules for Seed Testing. Seed Sci. Technol. (27): 340.
Nautiyal, P. C. 2001. Drying and storage of groundnut forthe maintenance of seed viability. National workshopon groundnut seed technology. Feb, 6-7, PP. 164-167.
Rasheed, S., Dawar, S. and Shaukat, S. S. 2004. Seedmycoflora of groundnut. Pak. J. Bot 36(1): 199-202.
Saibabu, K. G. R. S., Hussaini, S. H., Murlimohan, B. andReddy, P. R. 1983. Effect of moisture and containeron the storability of paddy seeds under ambientconditions of Hyderabad. Seed Res., 11: 71-73.
Sharma, J. K. and Swaran Lata 2006. Soyabean seedpackaging for the maintenance of seed quality. Ind. J.Agric. Sci. 2(1): 6-8.
Sharma, S. N., Goyal, K. C., Gupta, I. J., Gupta, H.C.,Kakralya, B. L., Sharma, S. K., Mehta, S. M. andRathore, A. K. S. 1998 Packaging material andSoybean seed quality during storage. Seed Res., 26(1):89-91.
Snedecor, G. M. and Cochran. W. B. 1986. StatisticalMethods, 6th Edn, oxford and IBH publishing Co.,Calcutta.
Verma, O. P., Singh, P. V. and Singh, K. 1993. Effect ofstorage condition on germination of Indian Mustard(Brassica juncea L.) Seed Res., 21(2): 117-118.
Yogalakshmi, J., Ponnuswamy, A. S. and Karivaratharaju,T. V. 1995 : Seed storage potential of rice hybrid(CORH-1) and parental lines, Madras Agric. J., 83:729-732.
Shinde et al.58
J. Agric. Res. Technol., 41 (1) : 058-063 (2016)
Response of Different Linseed Varieties Under ExtendedSowing Dates
J. V. Adagale1, P. U. Raundal2, T. S. Bhondave3, S. S. Bhondave4 and V. B. Pohare5
Agronomy Section, College of Agriculture, Pune - 411 005 (India)(Received : 10-07-2015)
AbstractAn experiment on effects of extended sowing dates on different linseed varieties was conducted. The
sowing date of 45MW (2nd week of November) was found superior for growth, yield attributes and yield oflinseed. The linseed variety PKVNL-260 was found, better under extended sowing dates with regards togrowth, yield attributes and yield (18.12 q ha-1). Economically, PKVNL-260 linseed variety in 45MW (2nd
week of November) sowing date obtained higher gross (79728 Ra. ha-1), net monetary returns (36026 Rs.ha-1) and B:C ratio (1.82).
Key words : Linseed, extended sowing dates, linseed varieties.
______________
Linseed (Linum usitatissimum L.) is one ofthe oldest, conventional and important rabioilseed crop of India. It is sixth largest oilseedcrop in the World and is one of the oldestcultivated plants. It is herbaceous annual plant,which attains the height of 30-120 cmdepending up on the type of cultivar. It is an
industrial crop cultivated for its seeds, fibres andoil purpose. All parts of the plant haveextensive and varied uses. The oil content ofseed varies from 32 to 46 per cent and has anindustrial value, it is also used as proteinaceousfeed for livestock.
Linseed oil possesses a very healthy fattyacid profile, particularly, Omega-3 (Alpha
1., 4., 5. M.Sc. (Agri.) students, 2. and 3. AssociateProfessor.

Linolenic Acid), the richest source only inlinseed (58%), ALPHA provides beneficialeffects in numerous clinical conditions such ascardiovascular disease, inflammatory disorders,immune function and cancer etc.
An impact of changed climate on cropproduction is expected for various latitude limitsfor all the crop seasons and the linseed crop ismost affected during winter season. Linseedcrop require cool climate and moderatetemperature (not exceeds above 32°C).Increase in temperature affects flowering andresults low yield. Amongst various agronomicpractices, the time of sowing plays animportant role in influencing the quality andyield of linseed. Normal sowing have longergrowth period which consequently provide anopportunity to accumulate more biomass ascompared to late sowing hence manifested inhigher seed and biological yield (Dixit et al.1992).
Material and Methods
An experiment on effects of extendedsowing dates on different linseed varieties wasconducted at, Agronomy Farm, College ofAgriculture, Pune during the year of 2012-2013 in rabi season. The soil of experimentalfield was clay loam in texture, normal inreaction (pH 7.8) with low available nitrogen(178.48 kg ha-1), high available phosphorous(19.34 kg ha-1) and high available potassium(475.00 kg ha-1).
The experiment was laid out in split plotdesign with four sowing times and threevarieties replicated thrice. The treatments wereof four sowing dates viz., S1 : 44 MW (1st weekof November), S2 : 45 MW (2nd week ofNovember), S3 : 46 MW (3rd week ofNovember), S4 : 47 MW (4th week ofNovember) and three varieties viz., V1 :PKVNL-260, V2 : NL-97, V3 : Padmini.Linseed crop was sown as per sowing
treatment 1st sowing on 1st November, 2nd
sowing on 8th November, 3rd sowing on 16th
November and 4th sowing on 23rd November2012. The gross plot size was 3.60 m x 2.40m and net plot size 2.40 m x 1.80 m.
Results and Discussion
The sowing of linseed on 45 MW recordedsignificantly higher plant height and spreadwhich was at par with 44 MW and significantlysuperior over rest of sowing date (Table 1).These results indicate that sowing of the linseedin 45 MW was most suitable for plant heightand spread. This might be associated with thelinseed sown in 45 MW was exposed to lowtemperature, more dew formation, highercoldness and resulted in higher plant height andspread. The results are in the conformity withthose of Abdul EL-Dayem et al. (1998) andNaik and Satapathy (2000). The mean numberof branches plant-1 were found to be nonsignificant for the sowing dates.
The 45 MW accumulated significantly moredry matter plant-1 over rest of the sowing dates.The vegetative growth and dry matterproduction were less in extended sowing dates.This was mainly due to rise in temperaturewhich forced to late sown linseed to matureearlier and this enforced maturity resulted inshorting of growing period. This decreasedgrowth period might have reduced dry matterproduction with late sowing. These resultsconfirm the findings of Dudhade et al. (1994),Ciriciofolo and Bonciarelli (1994), Singh et al.(2003) and Singh et al. (2002).
The highest plant height, spread andnumber of branches of linseed was observed inPKVNL-260 which was significantly superiorover rest of the linseed varieties. Significantlylower growth attributes were recorded in thevariety Padmini. The increased in these yieldattributes in linseed is genetically governed
Journal of Agriculture Research and Technology 59
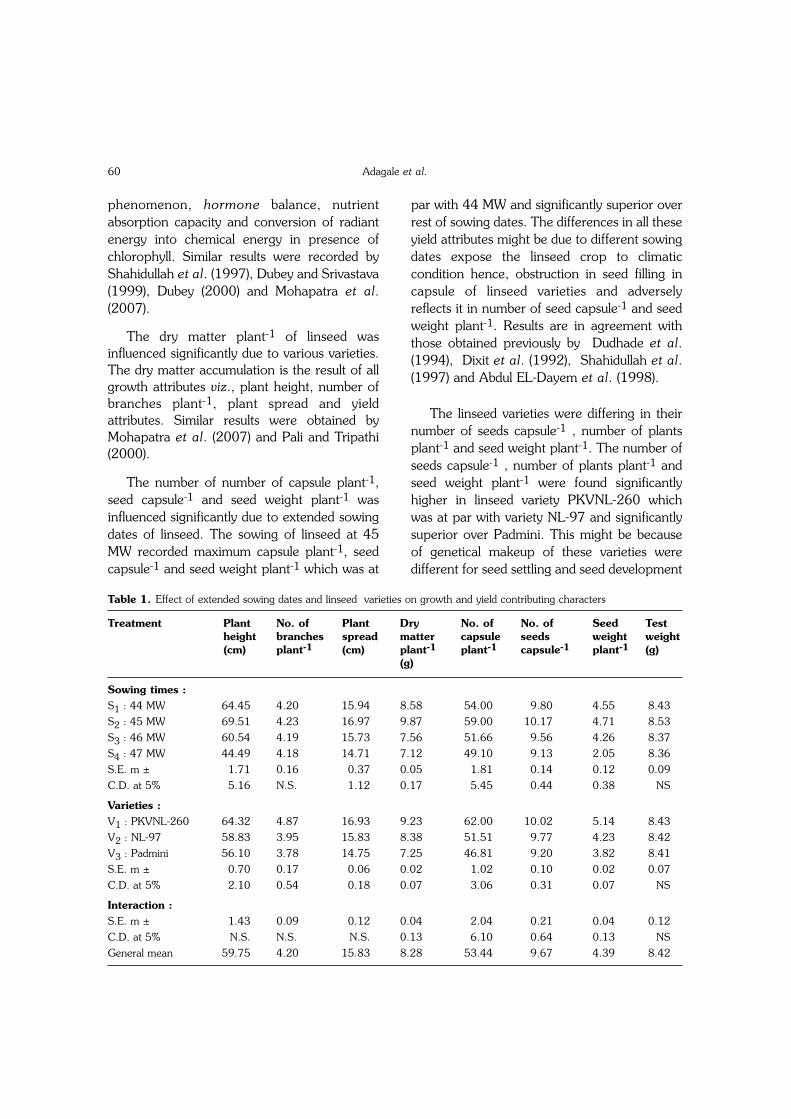
phenomenon, hormone balance, nutrientabsorption capacity and conversion of radiantenergy into chemical energy in presence ofchlorophyll. Similar results were recorded byShahidullah et al. (1997), Dubey and Srivastava(1999), Dubey (2000) and Mohapatra et al.(2007).
The dry matter plant-1 of linseed wasinfluenced significantly due to various varieties.The dry matter accumulation is the result of allgrowth attributes viz., plant height, number ofbranches plant-1, plant spread and yieldattributes. Similar results were obtained byMohapatra et al. (2007) and Pali and Tripathi(2000).
The number of number of capsule plant-1,seed capsule-1 and seed weight plant-1 wasinfluenced significantly due to extended sowingdates of linseed. The sowing of linseed at 45MW recorded maximum capsule plant-1, seedcapsule-1 and seed weight plant-1 which was at
par with 44 MW and significantly superior overrest of sowing dates. The differences in all theseyield attributes might be due to different sowingdates expose the linseed crop to climaticcondition hence, obstruction in seed filling incapsule of linseed varieties and adverselyreflects it in number of seed capsule-1 and seedweight plant-1. Results are in agreement withthose obtained previously by Dudhade et al.(1994), Dixit et al. (1992), Shahidullah et al.(1997) and Abdul EL-Dayem et al. (1998).
The linseed varieties were differing in theirnumber of seeds capsule-1 , number of plantsplant-1 and seed weight plant-1. The number ofseeds capsule-1 , number of plants plant-1 andseed weight plant-1 were found significantlyhigher in linseed variety PKVNL-260 whichwas at par with variety NL-97 and significantlysuperior over Padmini. This might be becauseof genetical makeup of these varieties weredifferent for seed settling and seed development
Adagale et al.60
Table 1. Effect of extended sowing dates and linseed varieties on growth and yield contributing characters
Treatment Plant No. of Plant Dry No. of No. of Seed Testheight branches spread matter capsule seeds weight weight(cm) plant-1 (cm) plant-1 plant-1 capsule-1 plant-1 (g)
(g)
Sowing times :S1 : 44 MW 64.45 4.20 15.94 8.58 54.00 9.80 4.55 8.43S2 : 45 MW 69.51 4.23 16.97 9.87 59.00 10.17 4.71 8.53S3 : 46 MW 60.54 4.19 15.73 7.56 51.66 9.56 4.26 8.37S4 : 47 MW 44.49 4.18 14.71 7.12 49.10 9.13 2.05 8.36S.E. m ± 1.71 0.16 0.37 0.05 1.81 0.14 0.12 0.09C.D. at 5% 5.16 N.S. 1.12 0.17 5.45 0.44 0.38 NS
Varieties :V1 : PKVNL-260 64.32 4.87 16.93 9.23 62.00 10.02 5.14 8.43V2 : NL-97 58.83 3.95 15.83 8.38 51.51 9.77 4.23 8.42V3 : Padmini 56.10 3.78 14.75 7.25 46.81 9.20 3.82 8.41S.E. m ± 0.70 0.17 0.06 0.02 1.02 0.10 0.02 0.07C.D. at 5% 2.10 0.54 0.18 0.07 3.06 0.31 0.07 NS
Interaction :S.E. m ± 1.43 0.09 0.12 0.04 2.04 0.21 0.04 0.12C.D. at 5% N.S. N.S. N.S. 0.13 6.10 0.64 0.13 NSGeneral mean 59.75 4.20 15.83 8.28 53.44 9.67 4.39 8.42

in capsule. The mean test weight (g) were foundto be non significant for the varieties. Similarresults were reported by Pali and Tripathi(2000) and El-Refaey et al. (2008).
The seed yield was maximum (18.43 q ha-1)at 45 MW which was significantly superior overthe rest of sowing dates (Table 2). Sowing date45 MW was favorable to high seed productionbecause the post anthesis period coincide withthe relatively low temperature. However, latesowing 46 and 47 MW were unfavorable toseed yield since low temperature during earlysowing might have adversely affected the initialvigour. The results are in conformity with thefindings by Kalita et al. (1999) and Shahidullahet al. (1997).
The straw yield was maximum (29.76 qha-1) at 45 MW which was significantly superiorover rest of sowing dates. The second bestsowing date was 44 MW which producedsignificantly more straw yield (28.68q ha-1)
over 46 and 47 MW. Seed yield is directlyrelated to growth and yield attributes. All yieldattributes were higher in 45 MW sowing. Thereduction in straw yield was due to reducedgrowth in terms of plant height, number ofbranches plant-1and dry matter accumulation.In the late sowing 46 and 47 MW the periodbetween anthesis and leaf senescence wascurtailed by the onset of relatively highertemperature. Similar results were obtained byChaudhary et al. (1991) and Ciriciofolo andBonciarelli (1994).
The seed yield of linseed was influencedsignificantly due to linseed varieties. The seedand straw yields were significantly higher inPKVNL-260 (18.12 q ha-1 and 28.69 q ha-1
respectively) and significantly superior over restof linseed varieties. The variety Padminirecorded significantly lower seed and strawyields. The differences in seed and straw yieldsin linseed varieties might be due to inherent
Journal of Agriculture Research and Technology 61
Table 2. Effect of extended sowing dates and linseed varieties on yield, quality and economics
Treatment Seed Straw Oil Oil Gross Cost of Net B:Cyield yield content yield monetory cultivation monetory ratio(q ha-1) (q ha-1) in seed (kg ha-1) returns (Rs. ha-1) returns
(%) (Rs. ha-1) (Rs. ha-1)
Sowing times :S1 : 44 MW 17.21 28.68 38.22 657.77 75724 43758 31966 1.73 S2 : 45 MW 18.43 29.76 37.88 698.13 81092 43758 37334 1.85 S3 : 46 MW 15.10 24.62 37.77 570.33 66440 43647 22793 1.52 S4 : 47 MW 14.86 23.72 37.33 554.72 65384 43647 21737 1.50 S.E. m ± 0.12 0.16 0.04 5.61 243.12 148.34 C.D. at 5% 0.37 0.48 N.S. 16.80 729.37 445.05
Varieties :V1 : PKVNL-260 18.12 28.69 38.08 690.00 79728 43702 36026 1.82 V2 : NL-97 16.04 26.20 37.75 605.51 70576 43702 26874 1.61 V3 : Padmini 15.04 25.20 37.58 565.20 66176 43702 22474 1.51 S.E. m ± 0.02 0.12 0.06 5.30 285.34 145.12 C.D. at 5% 0.07 0.38 N.S. 15.50 856.01 435.38
Interaction :S.E. m ± 0.05 0.24 0.12 10.61 571.68 290.26 C.D. at 5% 0.16 0.74 N.S. N.S. N.S. N.S.General mean 16.39 26.69 37.80 620.14 72160 43702 28458 1.50

genetical potential of linseed varieties andsource single relationship. These results are inconformity with findings by Chaudhari et al.(1991) and Shahidullaha et al. (1997).
The sowing of linseed in differentmeteorological weeks did not influenced the oilcontent in seed. The linseed sown on 45 MWrecorded statistically significant oil yield overrest of the sowing dates. The 45 MW sowingproduced higher seed yield resulted in higher oilyield.
The varieties PKVNL-260, NL-97 andPadmini were statistically non significant for oilcontent in seed. The oil content in seed isgenetic character of genotype. The linseedvariety PKVNL-260 recorded statisticallysignificant oil yield over the varieties NL-97 andPadmini as it has higher seed yield. Similarresults were reported by Shahidullaha et al.(1997).
The gross (81,092 Rs. ha-1) and netmonetary returns (37,334 Rs. ha-1 ) and B:Cratio (1.85) were significantly influenced byextended sowing dates. The sowing of linseedin 45 MW recorded significantly higher grossand net monetary returns and B:C ratio thanrest of sowing dates. 45MW sowing treatmentgave higher yield which ultimately increasedgross, net monetary returns and B:C ratio. Thismight be due to delayed sowing causedsignificant reduction in seed and straw yieldwhich reflects decreased in gross and netmonetary returns and B:C ratio.
The gross (79728 Rs. ha-1) and netmonetary returns (36026 Rs. ha-1) and B:Cratio (1.82) were significantly influenced bylinseed varieties. The significantly higher grossand net monetary returns and B:C ratio wasobserved in linseed variety PKVNL-260. Thisvariety gave higher yield which ultimately
increased the gross and net monetary returnsand B:C ratio.
Thus, it can be concluded that the sowingdate of 45MW (2nd week of November) wasfound superior for growth, yield attributes andyield of linseed. The linseed variety the PKVNL-260 sown on 45MW (2nd week of November)was suitable for extended sowing dates withregards to growth, yield attributes, yield andeconomics.
ReferencesAbd El-Dayem, M. A., Shams, S. A. A. and AbdoKaied, H.
M. H. 1998. Effect of plantimg dates and seedingrates on yield and its components of flax (Linumusitatissimum L.) grown under newly reclaimed land.Annals. Agric. Sci. Moshtohar. 40(2): 741-749.
Chaudhary, S. K., Gougulwar, N. M. and Singh, A. K.1991. Effect of nitrogen and sulphur on seed yield andoil content of 'Varuna' mustard (Brassica juncea).Indian.J.Agron. 37(4): 839-84.
Ciriciofolo, E. and Bonciarelli, C. 1994. Linseed in Umbriaautumn and spring sowing.Informatore. Agrario.52(45): 39-43.
Dubey, R. N. and Srivastava, A. N. 1999.Three newlinseed varieties. Indian farming 24(5): 3-5.
Dubey, M. P. 2000. Response of late-planted linseed(Linum usitatissimum L.) varieties to nitrogen levelsunder rainfed conditions. Indian.J.Agron. 46(3): 547-551.
Dixit, J. P., Chourasia, S. K., Pillani, P. V. A. and Khan,R. A. 1992. Assesment of flexibility of sowing timeof linseed (Linum usitatissimum L.) varieties underdouble-cropping system in Tawa Command. Indian. J.Agron. 39(1): 105-109.
El-Refaey, R. A., El-Seidy, E. H. and El-Deeb, I. A. E.2008. Effect of sowing dates under differentenvironmental conditions on yield and qualitycharacters of some flax genotypes. Alexandria J.Agric. Res. 55(2): 33-41.
Dudhade, D. D., Gare, B. N., Khade, K. K. andRamshe, D. G. 1994. Effect of sowing date ongrowth, yield attributes and yield of Indian mustard(Brassica juncea). Indian. J. Agron. 41(3): 445-447.
Kalita, H., Bora, P. C., and Debnath, M. C. 1999. Effect ofsowing date and tillage on soil properties, nutrientuptake and yield of linseed (Linum usitatissimum L.)grown in winter rice (Oryaza sativa). Indian. J. Agron.
Adagale et al.62

50(1): 70-72.
Mohapatra, S. C., Bishoyi, B. S. and Patra, H. K. 2007.Effect of sowing dates and varieties on production oflinseed (Linum usitatissimum L.). EnviornmentEcology. 27(1A): 436-438.
Naik, B. S. and Satapathy, P. C. 2000.Selection strategyfor improvement of seed yield in late sownlinseed.Res.on.Crops. 3(3): 599-605.
Pali, G. P and Tripathi, R. S. 2000. Performance of linseed(Linum usitatissimum L.) cultivars under varyingsowing and fertilizer management in rainfedcondition. Indian. J. Agron. 45(4): 771-775.
Shahidullah, M., Islam, U., Karim, M. A. and Mondol, R. K.1997. Performance of four linseed varieties atdifferent dates of sowing. Bangaladesh. J. Sci. andIndustrial Res. 32(2): 186-190.
Singh, T., Singh, V. K., Singh, Y. and Singh, M. K. 2002.Effect of sowing dates, seed rates and sulphur levels ongrowth, yield, quality and moisture use of rainfedlinseed.Enviroment and ecology. 25(4): 978-982.
Singh, T., Dahiya, K. S. and Sidhu, M. S. 2003. Effect ofgenotype, seedling age and row spacing onperformance of transplanted African mustard(Brassica juncea) under late sown conditions. Indian J.Agron. 51(3): 221-224.
Journal of Agriculture Research and Technology 63
J. Agric. Res. Technol., 41 (1) : 063-067 (2016)
Comparative Performance of Okra (Abelmoschusesculentum L.) Under Protected and Open Field Condition
B. B. Gadge1, A. D. Tumbare2, U. S. Surve3 and S. N. Mundhe4
Department of Agronomy, Mahatma Phule Krishi Vidyapeeth, Rahuri - 413 722 (India)(Received : 31-07-2015)
AbstractThe red coloured shadenet with 50 per cent shading intensity found more suitable to obtain significantly
maximum growth, yield attributes and fruit yield of okra (20.03 q unit-1 of shadenet) followed by green +white colour (19.50 q unit-1 of shadenet). The open field condition recorded significantly minimum growth,yield attributes and fruit yield of okra (11.41 q unit-1 of 756 m2) as compared to different coloured shadenets.The genotype Phule Utkarsha was found significantly superior over Mahyco-64 in respect of growth, yieldattributes and fruit yield of okra (17.40 q unit-1 of shadenet). The red coloured shadenet registeredsignificantly maximum absorbed photosynthetically active radiations and at par with green + white and greencoloured shadenets at all crop growth stages.
Key words : Okra, Coloured shadenet, fruit yield.
______________
Okra (Abelmoschus esculentum L.) alsoknown as "lady finger" belongs to theMalvaceae family leading first in world and it isgrown through out the country in almost allstates. Okra crop mostly cultivated in summerand kharif season in open field condition.Looking to the productivity of okra under openfield condition, there is need to improve
productivity of okra to meet out the growingdemand of population. Green house the latestword in Indian agriculture is one such means,where the plant are grown under controlled orpartially controlled environment resulting inhigher yields than that is possible under openconditions (Navale et al. 2003). Photoselectiveshade-netting is an emerging approach inprotected cultivation. Shading nets are used inagriculture to protect crops from either
1.

excessive solar radiation (i.e. shading), orenvironmental hazards (e.g. hail, strong winds,sand storms) or flying pests (birds, fruit-bats,insects). The available netting products areeither woven or knitted or embossed. They mayvary in their texture, design, mechanicalproperties and durability. Different colourednets represent a new agro-technologicalconcept, which aims at combining the physicalprotection, together with differential filtration ofthe solar radiation for specifically promotingdesired physiological responses that are lightregulated. At present the green shadenethouses were used for growing of vegetables toimprove quality of produce, however in theworldwide different coloured shadenets areused to enhance the productivity and quality ofvegetables. Hence, the efforts has been madeto increase the productivity and quality of okraunder different coloured shadenet houses.
Materials and Methods
An experiment was conducted at MahatmaPhule Krishi Vidyapeeth, Rahuri duringsummer season of 2014. The soil used inshadenet house was red sandy clay in textureand well drained. The EC and PH of theexperimental site was 0.32 dS m-1 and 7.10,respectively. Available N, P and K wereobserved as 159.85 , 18.79 and 433.55 kgha-1, respectively. The shadenet house was flattop type having the height of 3.25 m. Theshadenet house had an area of 2800 m2 (70 mx 40 m), out of which 756 m2 (36 m x 21 m)was used for conduct of this experiment. Fourbeds of 18.0 m x 1.2 m size were prepared ineach coloured shadenet (18.0 m x 6.0 m).Thetwo drip line were arranged on each bed alongthe crop row and drippers were placed to eachplant at the spacing of 45 cm. The shadenethouse was provided foggers to protect the cropfrom excessive heat and to control thehumidity.
The experiment consisted of six coloured
shadenets including open field and twogenotypes viz., Phule Utkarsha and Mahyco-64. These treatments were replicated threetimes in factorial randomized block design. Thenet plot size was 3.0 m x 3.0 m with 30 cm x15 cm spacing between the rows and plants. Abasal recommended dose of 100 : 50 50 kgNPK ha-1 was applied through urea, singlesuper phosphate and potash. The farmyardmanure @ 2 kg meter-2 was applied at 15 daysbefore preparation of Broad Bed Furrows inshadenet house. Raised beds of 45 cm inheight, 18 m in length and 1.20 m in widthwere prepared along the shadenet house withwalking space of 30 cm between the beds. Inshadenet house irrigation was applied at everyalternate day based on pan evaporation datastarting from sowing up to last picking whereasin open field irrigation was applied at every 75mm CPE with 7.5 cm depth.
Results and Discussion
Growth parameters : It could be seenfrom the Table 1. among the colouredshadenets, the red coloured shadenet exhibitedsignificantly higher growth attributes viz., plantheight (206.90 cm), length of internode (14.86cm) and dry matter plant-1 (63.26 g) and at parwith green + white coloured shadenet inrespect of plant height and dry matter plant-1
while green + white and green colouredshadenets in respect of length of internode.Significantly higher stem girth (69.1 mm) wasobserved under black coloured shadenet andwhich was at par with white and blue colouredshadenets. This might be due to the shadingeffect of red coloured shadenet that could beoffering better microclimate development inrespect of air temperature, relative humidityand light intensity which leads to increase ingrowth characters. The crop grown on openfield registered significantly minimum growthattributes viz., plant height (95.12 cm), stemgirth (64.2 mm), length of internode (12.87
Gadge et al.64

cm) and dry matter plant-1 (28.81 g) than alltypes of coloured shadenets, because of lowrelative humidity and high temperature leads toheat stress and reduces length of internode,plant height and ultimately dry matter plant-1.These result are in confirmity with Mercodo etal. (1997), Shamir et al. (2001), Shahak et al.(2009) and Yan Qinyan et al. (2011) .
Among the genotypes, Mahyco-64 recordedsignificantly higher plant height (190.47 cm)and length of internode (14.61 cm), howeversignificantly higher stem girth (69.2 mm) anddry matter plant-1 (58.41 g) was recorded byPhule Utkarsha. This might be due to Mahyco-64 genotype suitably adjusting the soil andmicroclimatic conditions of shadenet house andits faster growing habit compared to PhuleUtkarsha.
Yield : Among the coloured shadenets, thered coloured shadenet exhibited significantlyhigher yield attributes viz., number of fruitsplant-1 (52.83), fruit length (13.92 cm), fruitgirth (5.21 cm) and fruit weight plant-1 (1104g) and at par with green + white colouredshadenet in respect of number of fruits plant-1
and fruit weight plant-1 while, at par with green+ white, green and blue coloured shadenets inrespect of fruit length, however, fruit girth wasat par with green and blue coloured shadenets(Table 1). This might be due to the red andgreen + white colour have more reflection andscattering of light resulting in to higherabsorption of photosynthetically activeradiations, photosynthesis and dry matteraccumulation ultimately increases the yieldattributes of okra plants. The crop grown onopen field condition registered significantly
Journal of Agriculture Research and Technology 65
Table 1. Growth parameters of okra as influenced by different treatments
Treatments Growth parameters Yield attributes Fruit %–––––––––––––––––––––––––––––––– ––––––––––––––––––––––––––––––– yield increasePlant Stem Length Dry No. of Fruit Fruit Fruit unit-1 of overheight girth of inter- matter fruits length girth weight shade- open(cm) (mm) nodes (g plant-1 (cm) (cm) (g net-756 field
(cm) plant-1) plant-1) m2 (kg)
Coloured shadenets - 50% shading intensity (C)C1 - White 199.58 69.0 13.69 60.83 48.00 13.17 5.10 1000.00 1814 58.94C2 - Blue 202.65 68.9 13.80 61.13 46.00 13.27 5.12 0925.00 1678 47.02C3 - Green+White 206.70 66.7 14.84 63.18 50.67 13.51 5.09 1075.00 1950 70.86C4 - Green 205.57 67.5 14.82 62.73 48.83 13.76 5.14 1041.00 1890 65.56C5 - Red 206.90 66.0 14.86 63.26 52.83 13.92 5.21 1104.00 2003 75.49C6 - Black 197.52 69.1 13.47 60.55 46.33 13.62 5.01 0854.00 1549 35.76C7 - Open field 95.12 64.2 12.87 28.81 33.33 12.61 4.57 0629.00 1141 -S.E.m (±) 0.18 0.12 0.06 0.13 0.75 0.22 0.03 13.499 9.0 -CD at 5 % 0.54 0.36 0.17 0.40 2.18 0.66 0.09 39.240 27.0 -
Okra Genotypes (G)G1 - Phule Utkarsha 185.97 69.2 13.49 58.41 50.10 13.91 5.16 963.68 1740 4.68G2 - Mahyco-64 190.47 65.4 14.61 56.02 43.05 12.90 4.91 930.04 1695 -SEm ( ±) 0.09 0.10 0.03 0.07 0.40 0.12 0.04 7.215 10.1 -CD at 5 % 0.28 0.30 0.09 0.21 1.16 0.36 0.12 20.975 29.6 -
Interaction (C x G)S.E.m (±) 0.26 0.1 0.08 0.19 1.06 0.32 0.11 19.09 9.50 -CD at 5 % 0.76 NS 0.24 NS NS NS NS NS NS -General mean 187.72 67.3 14.05 57.23 46.57 13.41 5.03 946.86 1718 -

minimum yield attributes viz., number of fruitsplant-1 (33.33), fruit length (12.61 cm), fruitgirth (4.57 cm) and fruit weight plant-1 (629 g)than all types of coloured shadenets. This mightbe due to high temperature photosynthatespartitioning and distribution for the final sinkwere reduced resulting in poor quality andlower yield attributes in okra. Similar resultswere reported by Shahak et al. (2009) andMedany et al. (2009).
The red coloured shadenet exhibitedsignificantly higher fruit yield (20.03 q unit-1 ofshadenet) and at par with green + white, greenand white coloured shadenets. The fruit yieldobtained under red coloured shadenet was75.49 per cent higher than open fieldcondition. The fruit yield obtained underdifferent coloured shadenets was significantlymore than open field condition except blue
coloured shadenet. This was attributed to thefact that, red colour might have scattered morelight resulted into availability of more diffusedradiation causing higher absorbtion of PARresulting in more photosynthetic rate. The cropgrown under open field condition registeredsignificantly lower fruit yield (1141 kg unit-1 ofshadenet). This might be due to higher lightintensity causes heat stress leads to dropping offlowers resulted in reduction in number of fruitsplant-1. Secondly, it also increased soiltemperature which affects the moisture andnutrient availability to crop reflected indecreasing growth and yield attributes of cropas well as reduced the number of fruit pickings.Similar result were reported by Zoran et al.(2011) and Rajasekar et al. (2013).
Among the genotypes, Phule Utkarsharecorded significantly higher yield attributes
Gadge et al.66
Table 2. Periodical absorbed photosynthetically active radiation in okra as influenced by different treatments
Treatment Absorbed photosynthetically active radiation (µmol m-2s-1)–––––––––––––––––––––––––––––––––––––––––––––––––––––––––––––––––––––––––––30 DAS 45 DAS 60 DAS 75 DAS At least
picking
Coloured shadenets - 50% shading intensity (C)C1 - White 254.33 356.00 463.83 411.50 377.17C2 - Blue 349.50 451.83 557.33 517.83 485.50C3 - Green+White 457.17 557.17 665.67 625.17 588.00C4 - Green 455.83 557.00 663.00 619.33 585.50C5 - Red 464.83 566.67 671.00 625.33 591.17C6 - Black 232.33 334.67 441.00 397.50 368.17C7 - Open field 647.00 749.50 857.83 807.83 780.33S.E.m (±) 3.31 3.55 2.84 2.79 2.53CD at 5 % 9.64 10.32 8.27 8.12 7.36
Okra Genotypes (G)G1 - Phule Utkarsha 412.57 514.19 623.10 579.05 545.81G2 - Mahyco-64 404.86 506.62 611.10 565.10 533.00S.E.m (±) 1.8 1.90 1.52 1.49 1.35CD at 5 % 5.2 5.52 4.42 4.34 3.94
Interaction (C x G)S.E.m (±) 4.1 4.35 3.48 3.42 3.10CD at 5% NS NS NS NS NSGeneral mean 408.71 510.40 617.10 572.07 539.40

viz., number of fruits plant-1 (50.10), fruitlength (13.91 cm), fruit girth (5.16 cm) and fruitweight plant-1 (963.68 g) over the Mahyco-64genotype. This might be due to Phule Utkarshagenotype recorded higher photosynthetic rateand it suitably adjusting microclimaticenvironment of shadenet house which help toincrease the growth and yield attributes of crop.
The genotype, Phule Utkarsha recordedsignificantly higher fruit yield (1740 kg unit-1 ofshadenet) over the Mahyco-64 genotype. Thefruit yield of Phule Utkarsha genotype was 4.68per cent higher over the Mahyco-64 genotype.This might be due all the growth and yieldattributes were significantly higher in PhuleUtkarsha which reflected on fruit yield of okra.
Absorbed Photosynthetically ActiveRadiation (APAR) : Among the colouredshadenets, the red coloured shadenet registeredsignificantly higher absorbed photosyntheticallyactive radiation and at par with green + whiteand green coloured shadenet at all crop growthstages (Table 2). This might be due to completetransmission of light to the absorbing surface ofokra, it has more selectivity for light fluxrequired for photosynthesis. The open fieldcondition recorded highest absorbedphotosynthetically active radiation at all cropgrowth stages as compared to shading effect ofdifferent shadenet colour because of high lightintensity increases APAR value. These resultare in confirmity with the finding of Sica andPicuno (2008) and Arthurs et al. (2013).
Among the genotypes, significantly higherabsorbed photosynthetically active radiationwas observed in Phule Utkarsha genotype at allgrowth stages as compared to Mahyco-64genotype. This might be due to the more cropcanopy in Phule Utkarsha genotype comparedto Mahyco-64 genotype which intercepts
maximum photosynthetic active radiation.
References
Arthurs, S. P., Stamps, R. H., Giglia, F. F. 2013.Environmental modification inside photoselectiveshadehouses. Hort. Sci. 48(8): 975-979.
Medany, A. M., Hassanein, M. K. and Farag, A. A.2009.Effect of black and white nets as alternativecover in sweet pepper production under green housein Egypt. Acta Hort. 807: 121-126.
Mercodo, J. A., Redi, M. S., Valpuesta,V. and Quesada, M.A. 1997. Metabolic changes and sustainability tochilling stress in capsicum annuum plants grown at suboptimal temperature. Australian J. Plant Physio. 24(6):759-767.
Navale, A. V., Nandagude, S. B., Pawar, A. G., Ghodake,H. M. and Bhosale, A. D. 2003. Comparative study ofskirting and top covering effect in low costgreenhouse. Proc. of Natl. seminar on "Potential andprospect for protective cultivation" organized by theIndian Institute of Engineers, Ahmednagar duringDecember, 12-13, 2003. pp. 97.
Rajasekar, M., Arumugam, T., Ramesh, S. 2013.Influence of weather and growing environment onvegetable growth and yield. J. Horti. 5(10): 160-167.
Shahak, Y., Ratner, K., Zur, N., Offir, Y., Matan, E.,Yehezkel, H., Messsika, Y, Posalski, I. and Ben-Yakir,D. 2009. Photoselective netting: An emergingapproach in protected agriculture. Acta Hort. 807:79-84.
Shamir, O. M., Gussakovsky, E. E., Shpiegel, E., Nissim, L.A., Ratner, K., Ovadia, R., Giller, Y. E. and Shashak,Y. 2001. Coloured shadenet can improve the yieldand quality of green decorated branches ofPittosporum variegatum. J. Hort. Sci. and Biotech.76: 353-361.
Sica, S. and Picuno, P. 2008. Spectro radiometricalcharacterization of plastic nets for protectedcultivation. Acta Hort. 801: 245-252.
Yan Qinyan, Song Shiwei and Dong Fei. 2011. Effect ofcolour shading net on the growth and photosyntheticcharacteristics of flowering Chinese cabbage. J. ofHuazhang Agril. Uni. 30(1): 44-48.
Zoran, I., Lidija M., Mihal, D. and Nikolaos, K. 2011. Theeffect of colour shade nets on the greenhouse climateand pepper yield. Proc. 46th Croatian and 6thIntl.Symp.on Agriculture. Opatija, Croatia. pp. 529-532.
Journal of Agriculture Research and Technology 67
______________

Pigeonpea (Cajanus cajan (L.) Millsp.)commonly known as Redgram, Tur, Arhar etc.,is an erect and short-lived perennial shrublegume. India accounts for about 75 per cent ofworld production. Economically it is the secondmost important pulse crop after chickpea inIndia accounting for about 20 per cent of totalpulse production. India annually produces about2.0 - 2.5 million tones. Most of the pests attackthe crop at reproductive stage causing directlosses. It is particularly difficult to estimatelosses caused by pests as the crop has a goodability to compensate for defoliation up to 50per cent even if it occurs in the podding stage.Like other pulses, pigeonpea is susceptible to alarge number of diseases and insect pests which
cause heavy losses. H. armigera beingpolyphagous pest has become a key pest in thepulse growing regions during the kharif as wellas rabi season. With the introduction oftransgenic cotton, incidence of Helicoverpahad gone down for a few years, but now it isagain staging a comeback. In medium and lateduration varieties, Maruca vitrata, Helicoverpaarmigera, Melanagromyza obtusa andExelastis atomosa, Lampides boeticus are thedominant pests. A number of insecticides havebeen found reported to be effective forcontrolling H. armigera on pigeonpea (Ujagir,2000). Exploring new insecticides with lesserresidues and lower environmental threat hasbecome imperative. In recent years, newercompounds with novel modes of action arebeing evolved to check infestation by this insectpest. The present study is aimed at evaluating
J. Agric. Res. Technol., 41 (1) : 068-072 (2016)
Bioefficacy of Newer Insecticides against Helicoverpaarmigera Hubner in Pigeonpea
A. P. Chavan1, S. K. Patil2, S. R. Kulkarni3 and S. B. Latke4
Department of Entomology, Mahatma Phule Krishi Vidyapeeth, Rahuri - 413 722 (India)(Received : 20-10-2014)
AbstractA field experiment was conducted to determine the efficacy of newer insecticides against Helicoverpa
armigera (Hubner) infesting pigeonpea at Pulses Improvement Project, Mahatma Phule Krishi Vidyapeeth,Rahuri-413 722 during Kharif season of 2011-12, 2012-13 and 2013-14. The pooled results revealed thatall the insecticidal treatment recorded less survival larval population at 7 days after spray and pod damage wasranged in 0.33 to 1.3 larvae/5plants and 4.94 to 12.69 per cent, respectively as against 2.7 larvae/5plantsand 18.93 per cent in untreated control. However, Flubendiamide 20 WDG @ 60 g a.i. ha-1 was found themost effective in reducing the H. armigera larval population and pod damage of pigeonpea followed byRynaxypyr 18.5 SC @ 30 g a.i. ha-1 and Emamectin benzoate 5 SG @ 11 g a.i. ha-1. The highest yield (2590kg ha-1) and maximum net income (Rs. 46056 ha-1) was recorded in the treatment of Flubendiamide 20WDG @ 50 g a. i. ha-1 followed by Rynaxypyr 18.5 SC @ 30 g a.i. ha-1 (2327 kg ha-1 and Rs.36239ha-1) and Emamectin benzoate 5 SG @ 11 g a.i. ha-1 (2239 kg ha-1 and Rs.35745 ha-1). The decreasingorder of incremental cost benefit ratio (ICBR) in pigeonpea of different insecticides recorded was Quinalphos25 EC @ 250 g a.i. ha-1 (1:8.80) > Flubendiamide 20 WDG @ 50 g a.i. ha-1 (1:6.28) > Emamectin benzoate5 SG @ 11 g a.i. ha-1 (1:5.19) > Indoxacarb 14.5 SC @ 60 g a.i. ha-1 (1:3.76) > Rynaxypyr 18.5 SC @30 g a.i. ha-1 (1:3.69) > Spinosad 45 SC @ 73 g a.i. ha-1 (1:13.37).
Key words : Pigeonpea, Helicoverpa armigera, cost benefit ratio and insecticides.
1., 2. and 4. Assistant Professor and 3. AssociateProfessor.
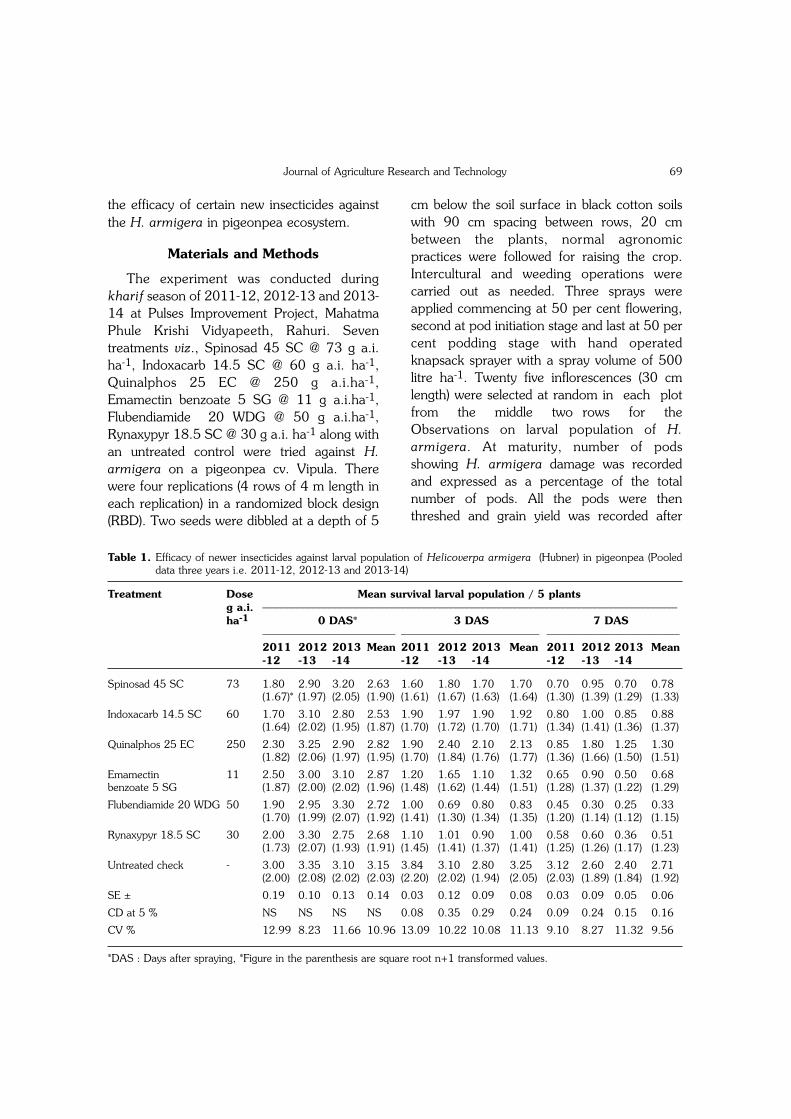
the efficacy of certain new insecticides againstthe H. armigera in pigeonpea ecosystem.
Materials and Methods
The experiment was conducted duringkharif season of 2011-12, 2012-13 and 2013-14 at Pulses Improvement Project, MahatmaPhule Krishi Vidyapeeth, Rahuri. Seventreatments viz., Spinosad 45 SC @ 73 g a.i.ha-1, Indoxacarb 14.5 SC @ 60 g a.i. ha-1,Quinalphos 25 EC @ 250 g a.i.ha-1,Emamectin benzoate 5 SG @ 11 g a.i.ha-1,Flubendiamide 20 WDG @ 50 g a.i.ha-1,Rynaxypyr 18.5 SC @ 30 g a.i. ha-1 along withan untreated control were tried against H.armigera on a pigeonpea cv. Vipula. Therewere four replications (4 rows of 4 m length ineach replication) in a randomized block design(RBD). Two seeds were dibbled at a depth of 5
cm below the soil surface in black cotton soilswith 90 cm spacing between rows, 20 cmbetween the plants, normal agronomicpractices were followed for raising the crop.Intercultural and weeding operations werecarried out as needed. Three sprays wereapplied commencing at 50 per cent flowering,second at pod initiation stage and last at 50 percent podding stage with hand operatedknapsack sprayer with a spray volume of 500litre ha-1. Twenty five inflorescences (30 cmlength) were selected at random in each plotfrom the middle two rows for theObservations on larval population of H.armigera. At maturity, number of podsshowing H. armigera damage was recordedand expressed as a percentage of the totalnumber of pods. All the pods were thenthreshed and grain yield was recorded after
Journal of Agriculture Research and Technology 69
Table 1. Efficacy of newer insecticides against larval population of Helicoverpa armigera (Hubner) in pigeonpea (Pooleddata three years i.e. 2011-12, 2012-13 and 2013-14)
Treatment Dose Mean survival larval population / 5 plantsg a.i. ––––––––––––––––––––––––––––––––––––––––––––––––––––––––––––––––––––––––––––––ha-1 0 DAS* 3 DAS 7 DAS
––––––––––––––––––––––––– –––––––––––––––––––––––––– –––––––––––––––––––––––––2011 2012 2013 Mean 2011 2012 2013 Mean 2011 2012 2013 Mean-12 -13 -14 -12 -13 -14 -12 -13 -14
Spinosad 45 SC 73 1.80 2.90 3.20 2.63 1.60 1.80 1.70 1.70 0.70 0.95 0.70 0.78(1.67)* (1.97) (2.05) (1.90) (1.61) (1.67) (1.63) (1.64) (1.30) (1.39) (1.29) (1.33)
Indoxacarb 14.5 SC 60 1.70 3.10 2.80 2.53 1.90 1.97 1.90 1.92 0.80 1.00 0.85 0.88(1.64) (2.02) (1.95) (1.87) (1.70) (1.72) (1.70) (1.71) (1.34) (1.41) (1.36) (1.37)
Quinalphos 25 EC 250 2.30 3.25 2.90 2.82 1.90 2.40 2.10 2.13 0.85 1.80 1.25 1.30(1.82) (2.06) (1.97) (1.95) (1.70) (1.84) (1.76) (1.77) (1.36) (1.66) (1.50) (1.51)
Emamectin 11 2.50 3.00 3.10 2.87 1.20 1.65 1.10 1.32 0.65 0.90 0.50 0.68benzoate 5 SG (1.87) (2.00) (2.02) (1.96) (1.48) (1.62) (1.44) (1.51) (1.28) (1.37) (1.22) (1.29)
Flubendiamide 20 WDG 50 1.90 2.95 3.30 2.72 1.00 0.69 0.80 0.83 0.45 0.30 0.25 0.33(1.70) (1.99) (2.07) (1.92) (1.41) (1.30) (1.34) (1.35) (1.20) (1.14) (1.12) (1.15)
Rynaxypyr 18.5 SC 30 2.00 3.30 2.75 2.68 1.10 1.01 0.90 1.00 0.58 0.60 0.36 0.51(1.73) (2.07) (1.93) (1.91) (1.45) (1.41) (1.37) (1.41) (1.25) (1.26) (1.17) (1.23)
Untreated check - 3.00 3.35 3.10 3.15 3.84 3.10 2.80 3.25 3.12 2.60 2.40 2.71(2.00) (2.08) (2.02) (2.03) (2.20) (2.02) (1.94) (2.05) (2.03) (1.89) (1.84) (1.92)
SE ± 0.19 0.10 0.13 0.14 0.03 0.12 0.09 0.08 0.03 0.09 0.05 0.06
CD at 5 % NS NS NS NS 0.08 0.35 0.29 0.24 0.09 0.24 0.15 0.16
CV % 12.99 8.23 11.66 10.96 13.09 10.22 10.08 11.13 9.10 8.27 11.32 9.56
*DAS : Days after spraying, *Figure in the parenthesis are square root n+1 transformed values.

discarding the damaged grains. The monetaryreturns and incremental cost-benefit ratios ofthe treatments were also worked out forselecting economical treatments against thepest.
Results and Discussion
Larval incidence : Pooled results of threeyears (2011-12, 2012-13 and 2013-14) dataare presented in Table 1. The larval count of H.armigera before spraying was non-significant.The results on surviving larval population of H.armigera indicated that the differences in larvalpopulation at 3 and 7 days after spraying (DAS)were found to be significant during the presentinvestigation. All the insecticide treatmentswere recorded significantly lower larvalpopulation than untreated control. At 3 DAS,the lowest mean larval population of H.armigera (0.83 larva/5 plants) was noticed inthe treatment with Flubendiamide 20 WDG @
50 g a.i. ha-1 and it was significantly lower thanthe other treatments except Rynaxypyr 18.5SC @ 30 g a.i. ha-1 and Emamectin benzoate 5SG @ 11 g a.i. ha-1. These treatments wererecorded 1.00 and 1.32 larvae/5 plants of H.armigera, respectively. Similar results were alsonoticed at 7 days after spray treatments.Flubendiamide 20 WDG @ 50 g a.i. ha-1
showed significantly lesser number of H.armigera (0.33 larva/5 plants). However, itwas at par with Rynaxypyr 18.5 SC @ 30 g a.i.ha-1 and Emamectin benzoate 5 SG @ 11 ga.i. ha-1 which recorded 0.51 and 0.68 larva/5 plants, respectively.
Pod damage : The results of three yearsdata of 2011-12, 2012-13 and 2013-14 inrespect to pod damage caused by H. armigeraare presented in Table 2. The treatment ofFlubendiamide 20 WDG @ 50 g a.i. ha-1
recorded significantly lower mean per cent poddamage (4.94). However, it was at par with
Chavan et al.70
Table 2. Efficacy of newer insecticides against Helicoverpa armigera (Hubner) pod damage and grain yield of pigeonpea(Pooled data of three years i.e. 2011-12, 2012-13 and 2013-14)
Treatments Dose Pod damage (%) Grain yied (kg ha-1)g a.i. –––––––––––––––––––––––––––––––––––– –––––––––––––––––––––––––––––––––––––ha-1 2011-12 2012-13 2013-14 Mean 2011-12 2012-13 2013-14 Mean
Spinosad 45 SC 73 11.00 8.58 7.10 8.89 2683 1610 1960 2084(19.37)* (16.95) (15.43) (17.25)
Indoxacarb 14.5 SC 60 13.00 10.65 8.40 10.68 2502 1450 1890 1947(21.13) (18.95) (16.79) (18.96)
Quinalphos 25 EC 250 16.10 11.47 10.50 12.69 2386 1200 1710 1765(23.58) (19.73) (18.88) (20.73)
Emamectin benzoate 5 SG 11 10.30 7.31 5.60 7.74 2733 1750 2235 2239(18.72) (15.66) (13.61) (16.00)
Flubendiamide 20 WDG 50 5.75 5.17 3.90 4.94 3008 2129 2410 2515(13.88) (13.05) (11.19) (12.71)
Rynaxypyr 18.5 SC 30 7.10 6.01 4.75 5.95 2772 1910 2300 2327(15.45) (14.12) (12.48) (14.02)
Untreated check - 19.75 16.99 20.05 18.93 1450 950 1040 1146(26.35) (24.27) (26.58) (25.73)
SE ± 1.10 0.89 1.12 1.04 149.83 134.00 125.16 136.32
CD at 5 % 5.01 2.74 3.46 3.74 326.00 350.00 385.69 353.90
CV % 13.25 8.75 11.85 11.28 17.13 14.05 11.20 14.13
* Figure in the parenthesis are arc sin transformed values.

Rynaxypyr 18.5 SC @ 30 g a.i. ha-1 andEmamectin benzoate 5 SG @ 11 g a.i. ha-1
which were recorded 5.95 and 7.74 per centpod damage, respectively. Rest of thetreatments were significantly reduced the poddamage in the ranged of 8.89 to 12.69 percent caused by H. armigera as againstuntreated control (18.93). The descendingorder of pod damage was Flubendiamide >Rynaxypyr > Emamectin benzoate > Spinosad> Indoxacarb > Quinalphos > untreatedcontrol.
Grain yield : The pooled results of grainyield presented in Table 3 revealed that all theinsecticide treatments recorded significantlyhigher grain yield than untreated control. Thesignificantly higher (2515 kg ha-1) grain yieldwas obtained from the treatment ofFlubendiamide 20 WDG @ 50 g a.i. ha-1 and itwas at par with Rynaxypyr 18.5 SC @ 30 g a.i.ha-1 (2327 kg ha-1) and Emamectin benzoate 5SG @ 11 g a.i. ha-1 (2239 kg ha-1).
Economics : From the Table 3, it revealedthat maximum net income (Rs.46056/ha)received from the treatment of Flubendiamide
20 WDG @ 50 g a.i. ha-1 followed byRynaxypyr 18.5 SC @ 30 g a.i. ha-1 (Rs.36239ha-1) and Emamectin benzoate 5 SG @ 11 ga.i. ha -1 (Rs.35745 ha-1) over untreatedcontrol. Irrespective of net profit, highest ICBR(1:8.80) was obtained in the treatmentQuinalphos 25 EC @ 250 g a.i. ha-1 followedby Flubendiamide 20 WDG @ 50 g a.i. ha-1
(1:6.28), Emamectin benzoate 5 SG @ 11 g a.i.ha-1 (1:5.19), Indoxacarb 14.5 SC @ 60 g a.i.ha-1 (1:3.76), Rynaxypyr 18.5 SC @ 30 g a.i.ha-1 (1:3.69) and Spinosad 45 SC @ 73 g a.i.ha-1 (1:3.37) with maximum monetary returnsover untreated control.
Satpute and Barkhade (2012) studied thedifferent doses of Rynaxypyr 18.5 SC againstthe pod borer complex (H. armigera, M.obtusa and E. atmosa) of pigeonpea. Itrevealed that the significant differences amongthe treatments and the higher doses ofRynaxypyr 18.5 SC (30 and 40 g a.i. ha-1)were found most effective in reducing the poddamage as well as the pest population.Irrespective of larval population of thetreatments, the conventional insecticides were
Journal of Agriculture Research and Technology 71
Table 3. Economics of different insecticides used in pigeonpea for the control of Helicoverpa armigera (Pooled data of threeyears i.e. 2011-12, 2012-13 and 2013-14)
Treatments Dose Pooled Increase Net Cost of insecticide Net ICBRg a.i. yield in yield monetary and spraying incomeha-1 (kg ha-1) over control returns charges (Rs. ha-1)
(kg ha-1) (Rs. ha-1) (Rs. ha-1)
Spinosad 45 SC 73 2084 938 36582 8365 27217 1:3.37
Indoxacarb 14.5 SC 60 1947 801 31239 6558 24681 1:3.76
Quinalphos 25 EC 250 1765 609 24141 2463 21678 1:8.80
Emamectin benzoate 5 SG 11 2239 1093 42627 6882 35745 1:5.19
Flubendiamide 20 WDG 50 2515 1369 53391 7335 46056 1:6.28
Rynaxypyr 18.5 SC 30 2327 1181 46059 9820 36230 1:3.69
Untreated check - 1146 - - - - -
Rates:
1. Spinosad : Rs. 14,866/- L-1 2. Indoxacarb : Rs. 4,380/- L-1 3. Quinalphos : Rs. 441/- L-1
4. Emamectin benzoate: Rs. 8,700/- kg-1 5. Flubendiamide : Rs. 8,260/- kg-1 6. Rynaxypyr : Rs. 14,466/- L-1
7. Cost of grains : Rs. 3,900 /- quintal-1 8. Cost of spraying : Rs. 1140/- for three sprays

found at par with the higher doses ofRynaxypyr 18.5 SC (30 and 40 g a.i. ha-1).
The results of the present finding is inagreement with Wadaskar et al. (2013) whoreported that mean reduction of H. armigeralarval population at 7 and 14 days after spray,highest yield, monetary returns and incrementalcost benefit ratio rendered flubendiamide as acost effective alternative for pod borermanagement in pigeonpea. They also reportedthat other treatments viz., indoxacarb,emamectin benzoate and spinosad wereeconomic feasibility and may recommend aspotent alternatives in management of podborer complex of pigeonpea.
Sreekanth et al. (2014) reported thatHelicoverpa larval population and pod damageper plant was lowest in plots treated withChlorantraniliprole 18.5 SC, Flubendiamide480 SC and Spinosad 45 SC as againstuntreated control plot. Highest grain yield wasin Chlorantraniliprole 18.5 SC followed by
Flubendiamide 480 SC and Spinosad 45 SC.The cost effectiveness of Chlorantraniliproleand Flubendiamide was also high and veryfavorable with incremental cost-benefit ratios of1:4.64 and 1:4.50 respectively, followed byIndoxacarb (1:3.67), Emamectin benzoate(1:3.13) and Spinosad (1:2.97). These resultsare in line with the present findings.
ReferenceSatpute, N. S. and Barkhade, U. P. 2012. Evaluation of
Rynaxypyr 20 SC against Pigeonpea pod borercomplex. J. of Food Legumes 25 (2):162-163
Sreekanth, M., Lakshmi, M. S. M. and Koteswar Rao, Y.2014. Bioefficacy and economics of certain newinsecticides against gram pod borer, Helicoverpaarmigera (Hubner) infesting pigeonpea (Cajanuscajan L.) Inter. J. Pl. Ani. And Envio. Sci. 4(1): 11-15
Ujagir, R. 2000. Field efficacy of insecticides against podborer complex in early pigeonpea (Cajanus cajan (L.)Millsp. at Pantnagar, North India. Annals of PlantProtection Sciences 71: 19-25
Wadaskar, R. M., Bhalkare, S. K. and Patil, A. N. 2013.Field efficacy of newer insecticide against pod borercomplex of Pigeonpea. J. of Food Legumes, 26 (1-2):62-66.
Chavan et al.72
______________

India is a major safflower (Carthamustinctorius L.) growing country in the world withan area of 1.84 lakh ha, production of 1.09lakh tones and productivity of 591 kg ha-1
(Anonymous, 2014a). Maharashtra statecontributes nearly 57 per cent (1.05 lakh ha)and 53 per cent (0.58 lakh tones) to the totalarea and production of the country,respectively. However, the productivity ofsafflower in Maharashtra state and also in thecountry are comparatively low (552 and 591 kgha-1), respectively. The low productivity insafflower is attributed to inadequate follow up ofimproved technology and careless managementof insect-pests and diseases.
One of the important reasons for lowproductivity is that the crop is affected by anumber of insect-pests and diseases causingsubstantial losses in yield (Singh et al., 1999).Among various pests, safflower aphid
(Uroleucon compositae Theobald) is the mostdestructive infesting the crop from elongationstage up to flowering period (Akashe et al.,1999). Aphid (U. compositae) causes 52.14 to92.77 per cent losses in safflower yield(Anonymous, 2014b). Several insecticides havebeen recommended for its management(Neharkar et al., 2003; Akashe et al., 2008;Sharma et al., 2009 and Bisen et al., 2012).Farmers mainly depended upon chemicalinsecticides only. The major limitations ofchemical insecticides are hazards to humanbeings, animals and the ecosystem besides theirhigh cost. This has necessitated looking forsome alternate eco-friendly and effectivemanagement strategies. The evolution of highyielding safflower varieties with resistance/tolerance to aphid would be the safest andcheapest method for aphid control. Thepresent exercise was, therefore, made toreassess and identify aphid resistant/tolerantsources for their exploitation in breeding
J. Agric. Res. Technol., 41 (1) : 073-077 (2016)
Elite Sources of Resistance to Safflower Aphid (Uroleuconcompositae T.) under Dry Land Condition
V. B. Akashe1, D. V. Indi2, S. K. Shinde3 and V. M. Amrutsagar4
All India Co-ordinated Research Project on Safflower,Zonal Agricultural Research Station, Solapur- 413 002 (India)
(Received : 10-07-2015)
AbstractForty eight genotypes of safflower, which were already identified as promising against aphid (Uroleucon
compositae T.), were reassessed for their reaction to aphid under late sown field condition during rabi 2013-14 at the All India Coordinated Research Project on Safflower, Zonal Agricultural Research Station, Solapur-413 002, Maharashtra, India. Out of these, 14 entries viz., GMU-174, GMU-1087, GMU-1628, GMU-1811, GMU-2020, GMU-2066, GMU-2130, GMU-2775, GMU-3256, GMU-5097, GMU-5130, GMU-5136, GMU-5142 and SF-10-4 secured tolerant grade (i.e. 1.5 to 2.0 foliage drying grade (FDG)) whereas24 entries were found moderately tolerant (i.e. 2.5 to 3.0 FDG) on the basis of aphid population, FDG andseed yield at harvest. The National check, A-1 was categorized as moderately tolerant (FDG 3.0) whereas thesusceptible check, CO-1 was rated as highly susceptible (FDG 5.0). The genotypes with high degree oftolerance to aphids may be used in breeding programme to evolve high yielding varieties with in-built aphidtolerance.
Key words : Elite sources, safflower, aphid resistance.
1. Jr. Entomologist, 2. Jr. Pl. Pathologist, 3. Breederand 4. Associate Director of Research.

programme. The genotypic response ofsafflower to aphid has been studied by earlierworkers also (Akashe et al., 1996 and 1997;Mane et al., 2012 and Rathod et al., 2012)and some genotypes were reported relativelyresistant.
Material and Methods
Location/study area : The field experi-ment was conducted during rabi 2013-14 at AllIndia Coordinated Research Project onSafflower, Zonal Agricultural Research Station,Solapur, Maharashtra, India under untreatedlate sown condition (1st week of November).Forty eight entries (Table 2) which were alreadyidentified promising were grown in anaugmented randomized block design with tworeplications. Susceptible check (CO-1) andtolerant/national check (A-1) were used forcomparison and both the checks were sownafter every 10th row of test entries and CO-1was also grown all around the tier of the testmaterial as an infester. Each accession wasplanted in a single row of 2 m length with inter-row and intra-row spacing of 45 cm and 20cm, respectively. Forty eight safflowergenotypes which were observed consistentlytolerant to aphid at different locations werecollected and tested.
Observations and seed yield : The data
on actual aphid count on 5 cm apical twig perplant on five randomly selected plants in a rowwere recorded at peak aphid incidence i.e. onemonth after the first incidence. The per centaphid population in each entry was comparedto standard check considering aphid number onA-1 as 100 per cent. The observations onextent of premature foliage drying (1 to 5grades) due to aphid infestation were recordedby visual score method one month after thepeak incidence (Table 1). The seed yield perplant (g) was recorded at harvest.
The data on two parameters viz., aphidcount and FDG of entries was subjected to thestatistical analysis.
Results and Discussion
The data presented in Table 2 revealedsignificant differences among various genotypesin respect of aphid population (No. of aphidson 5 cm apical twig per plant) and foliagedrying grades as well. All the entries exceptGMU-7187 recorded significantly lower aphidpopulation than the susceptible check (CO-1).GMU-7187 was at par with CO-1 in respect ofaphid population. Among the 48 genotypes,24 viz., GMU-174, GMU-178, GMU-1087,GMU-1562, GMU-1628, GMU-1630, GMU-1811, GMU-2020, GMU-2066, GMU-2130,GMU-2775, GMU-3256, GMU-3944, GMU-
Akashe et al.74
Table 1. Foliage drying grades and categorization of safflower entries due to aphid
Foliage drying Category of Per cent foliage Visible symptomsgrade/ scale the entry drying range
1 Highly Tolerant (HT) 0 to 20 % Healthy plants with normal capitula, seed yield equal to protected plants.
2 Tolerant (T) 21 to 40 % Healthy plants but yellowing and drying of leaves on main stem and branches, normal capitula.
3 Moderately Tolerant (MT) 41 to 60 % Drying of 50 % leaves on tender shoots of the plant, small to medium capitula with low seed setting.
4 Susceptible (S) 61 to 80 % Drying of leaves and tender shoots, withering of branches, stunted growth, less number of capitula with very poor seed setting.
5 Highly Susceptible (HS) Above 80 % Death of plant before maturity and no seed yield.
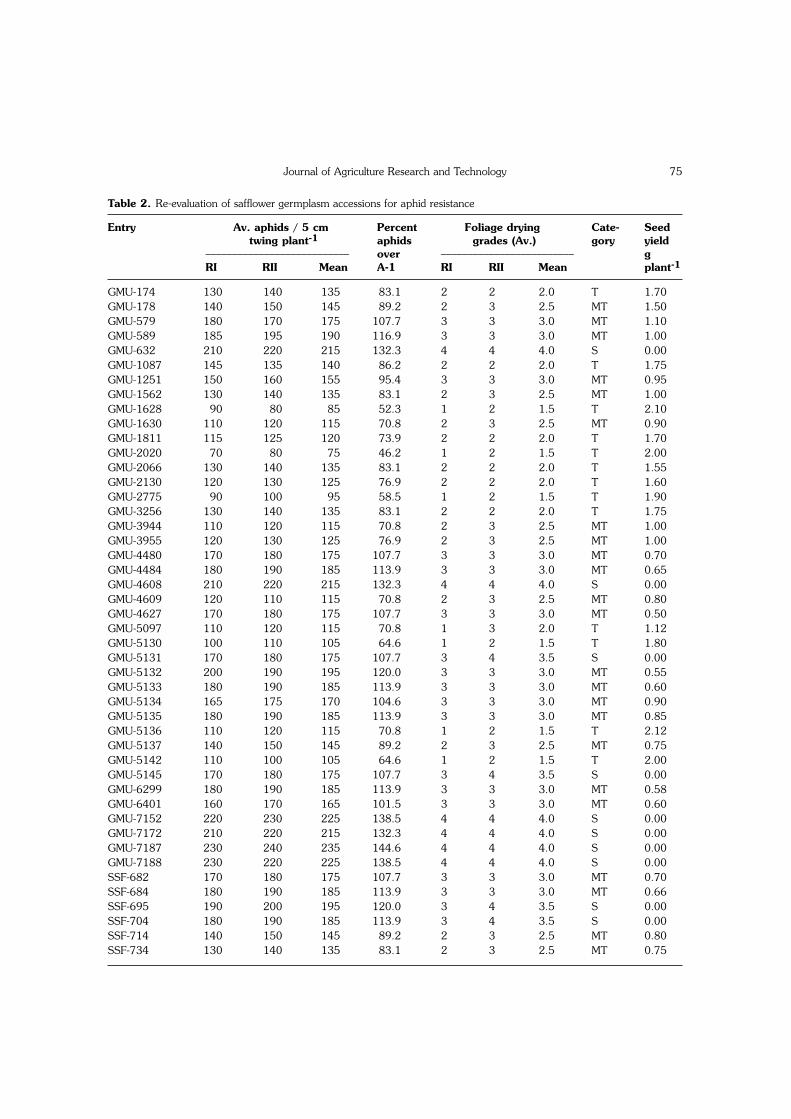
Journal of Agriculture Research and Technology 75
Table 2. Re-evaluation of safflower germplasm accessions for aphid resistance
Entry Av. aphids / 5 cm Percent Foliage drying Cate- Seedtwing plant-1 aphids grades (Av.) gory yield
––––––––––––––––––––––––––– over ––––––––––––––––––––––––– g RI RII Mean A-1 RI RII Mean plant-1
GMU-174 130 140 135 83.1 2 2 2.0 T 1.70GMU-178 140 150 145 89.2 2 3 2.5 MT 1.50GMU-579 180 170 175 107.7 3 3 3.0 MT 1.10GMU-589 185 195 190 116.9 3 3 3.0 MT 1.00GMU-632 210 220 215 132.3 4 4 4.0 S 0.00GMU-1087 145 135 140 86.2 2 2 2.0 T 1.75GMU-1251 150 160 155 95.4 3 3 3.0 MT 0.95GMU-1562 130 140 135 83.1 2 3 2.5 MT 1.00GMU-1628 90 80 85 52.3 1 2 1.5 T 2.10GMU-1630 110 120 115 70.8 2 3 2.5 MT 0.90GMU-1811 115 125 120 73.9 2 2 2.0 T 1.70GMU-2020 70 80 75 46.2 1 2 1.5 T 2.00GMU-2066 130 140 135 83.1 2 2 2.0 T 1.55GMU-2130 120 130 125 76.9 2 2 2.0 T 1.60GMU-2775 90 100 95 58.5 1 2 1.5 T 1.90GMU-3256 130 140 135 83.1 2 2 2.0 T 1.75GMU-3944 110 120 115 70.8 2 3 2.5 MT 1.00GMU-3955 120 130 125 76.9 2 3 2.5 MT 1.00GMU-4480 170 180 175 107.7 3 3 3.0 MT 0.70GMU-4484 180 190 185 113.9 3 3 3.0 MT 0.65GMU-4608 210 220 215 132.3 4 4 4.0 S 0.00GMU-4609 120 110 115 70.8 2 3 2.5 MT 0.80GMU-4627 170 180 175 107.7 3 3 3.0 MT 0.50GMU-5097 110 120 115 70.8 1 3 2.0 T 1.12GMU-5130 100 110 105 64.6 1 2 1.5 T 1.80GMU-5131 170 180 175 107.7 3 4 3.5 S 0.00GMU-5132 200 190 195 120.0 3 3 3.0 MT 0.55GMU-5133 180 190 185 113.9 3 3 3.0 MT 0.60GMU-5134 165 175 170 104.6 3 3 3.0 MT 0.90GMU-5135 180 190 185 113.9 3 3 3.0 MT 0.85GMU-5136 110 120 115 70.8 1 2 1.5 T 2.12GMU-5137 140 150 145 89.2 2 3 2.5 MT 0.75GMU-5142 110 100 105 64.6 1 2 1.5 T 2.00GMU-5145 170 180 175 107.7 3 4 3.5 S 0.00GMU-6299 180 190 185 113.9 3 3 3.0 MT 0.58GMU-6401 160 170 165 101.5 3 3 3.0 MT 0.60GMU-7152 220 230 225 138.5 4 4 4.0 S 0.00GMU-7172 210 220 215 132.3 4 4 4.0 S 0.00GMU-7187 230 240 235 144.6 4 4 4.0 S 0.00GMU-7188 230 220 225 138.5 4 4 4.0 S 0.00SSF-682 170 180 175 107.7 3 3 3.0 MT 0.70SSF-684 180 190 185 113.9 3 3 3.0 MT 0.66SSF-695 190 200 195 120.0 3 4 3.5 S 0.00SSF-704 180 190 185 113.9 3 4 3.5 S 0.00SSF-714 140 150 145 89.2 2 3 2.5 MT 0.80SSF-734 130 140 135 83.1 2 3 2.5 MT 0.75

3955, GMU-4609, GMU-5097, GMU-5130,GMU-5136, GMU-5137, GMU-5142, SSF-714, SSF-734, SSF-807 and SF-10-4registered statistically lower aphid populationthan the national check A-1. The lowest aphidpopulation (< 100) was harbored by GMU-2020 (75) followed by GMU-1628 (85), GMU-2775 (95) and SF-10-4 (95). The maximum percent decline in aphid population over tolerantcheck A-1 (100.0) i.e. 46.2, 52.3, 58.5 and58.5 was recorded by GMU-2020, GMU-1628, GMU-2775 and SF-10-4, respectively(Table 2).
Foliage Drying Grades (FDG) : The dataon FDG presented in Table 2 indicated thatnone of the entries showed highly tolerantreaction to aphids. However, 14 entries viz.,GMU-174, GMU-1087, GMU-1628, GMU-1811, GMU-2020, GMU-2066, GMU-2130,GMU-2775, GMU-3256, GMU-5097, GMU-5130, GMU-5136, GMU-5142 and SF-10-4secured tolerant reaction (1.5-2.0 FDG) againstaphid. Twenty four entries viz., GMU-178,GMU-579, GMU-589, GMU-1251, GMU-1562, GMU-1630, GMU-3944, GMU-3955,GMU-4480, GMU-4484, GMU-4609, GMU-4627, GMU-5132, GMU-5133, GMU-5134,GMU-5135, GMU-5137, GMU-6299, GMU-6401, SSF-682, SSF-684, SSF-714, SSF-734and SSF-807 were rated as moderately tolerant
(2.5-3.0 FDG) to aphid. The national check (A-1) was categorized as moderately tolerant (3.0FDG) whereas, the susceptible check (CO-1)was highly susceptible (5.0 FDG) to aphid.
As regards the seed yield, 15 entries yieldedmore than or equal to the tolerant check A-1(Table 2). The maximum seed yield of 2.20 gplant-1 was recorded from SF-10-4 as against1.12 g per plant in A-1. It was followed byGMU-5136 (2.12 g per plant), GMU-1628(2.10 g per plant) and GMU-5142 (2 g plant-1).The susceptible check (CO-1) and the entriesobserved in the susceptible FDG produced noseed yield under untreated late sown fieldcondition.
Similar results were reported by Akashe etal. (1996 and 1997), Mane et al. (2012) andRathod et al. (2012) who evaluated thegermplasm accessions and identified somesafflower genotypes as resistant against aphid.The results are in conformity with Akashe et al.(1996) in respect of GMU-174, GMU-178,GMU-1630, GMU-5130, GMU-5133, GMU-5135 and GMU-5142 and Akashe et al.(1997) in respect of GMU-3955, GMU-4480and GMU-4484. The present findings inrespect of SSF-682, SSF-695 and SSF-714 arein conformity with the results of Mane et al.(2012) and those of GMU-589, SSF-682, SSF-
Akashe et al.76
SSF-807 130 140 135 83.1 2 3 2.5 MT 0.60SF-10-4 100 90 95 58.5 1 2 1.5 T 2.20A-1 (NC) 160 165 162.5 100.0 3 3 3.0 MT 1.12CO-1(SC) 250 240 245 150.8 5 5 5.0 HS 0.00S. E. ± - 3.87 - - - 0.27 - -C. D. 5 % - - 11.01 - - - 0.77 - -C. V. % - - 3.49 - - - 13.95 - -
T = Tolerant, MT = Moderately Tolerant, S = Susceptible, HS = Highly Susceptible.
Table 2. Conted.
Entry Av. aphids / 5 cm Percent Foliage drying Cate- Seedtwing plant-1 aphids grades (Av.) gory yield
––––––––––––––––––––––––––– over ––––––––––––––––––––––––– g RI RII Mean A-1 RI RII Mean plant-1

714 and SSF-734 are in agreement with theresults of Rathod et al. (2012). Akashe et al.(2014) reported the safflower genotype, GMU-4854 as tolerant to aphid (Uroleuconcompositae), Alternaria leaf spot (Alternariacarthami) and wilt (Fusarium oxysporum f.sp. carthami), whereas the genotype GMU-4547 was moderately tolerant and tolerantagainst aphid and Alternaria leaf spot,respectively.
From the above study, it could be concludedthat out of 48 genotypes, 14 viz., GMU-174,GMU-1087, GMU-1628, GMU-1811, GMU-2020, GMU-2066, GMU-2130, GMU-2775,GMU-3256, GMU-5097, GMU-5130, GMU-5136, GMU-5142 and SF-10-4 exhibitedtolerance against safflower aphids, whereas 24entries viz., GMU-178, GMU-579, GMU-589,GMU-1251, GMU-1562, GMU-1630, GMU-3944, GMU-3955, GMU-4480, GMU-4484,GMU-4609, GMU-4627, GMU-5132, GMU-5133, GMU-5134, GMU-5135, GMU-5137,GMU-6299, GMU-6401, SSF-682, SSF-684,SSF-714, SSF-734 and SSF-807 were foundmoderately tolerant on the basis of aphidpopulation, FDG and seed yield. The Nationalcheck (A-1) was categorized as moderatelytolerant (3.0 FDG) whereas, the susceptiblecheck (CO-1) was rated as highly susceptible(5.0 FDG) to aphid.
Acknowledgement
Authors express their gratitude to theProject Director, DOR, Hyderabad (ICAR), forproviding funds to carry out this investigation.The authors sincerely acknowledge thesuggestions, encouragement and technicalsupport provided by Dr. K. Anjani, Ex-PI andDr. N. Mukta, PI, Safflower, DOR, Hyderabadduring the period of investigation.
ReferencesAnonymous, 2014a. State-wise area, production and
productivity of safflower in India (2012-13). ProjectDirector's Report-2013-14 (ICAR), DOR, Hyderabad,pp. 13.
Anonymous, 2014b. Per cent yield loss due to aphidinfestation in safflower. Annual progress report-2013-14 (ICAR), DOR, Hyderabad, pp. 128.
Akashe, V. B., Ghadge, S. M., Gud, M. A. and Deshpande,A. N. 2008. Efficacy of newer insecticides againstsafflower aphids, U. compositae Theob. J. OilseedsRes., 25(1): 118-119.
Akashe, V. B., Koli, B. D., Mehtre, S.P. and Veer, D. M.1996. Reassessment of the aphid tolerant safflowerentries. J. Maharashtra agric. Univ., 21(2): 313-315.
Akashe, V. B., Makar, P. V., Hegde, D. M. and Mehtre, S.P.1997. Identification of resistant sources to saffloweraphid. J. of Oilseeds Res., 14(2): 284-287.
Akashe, V. B., Murumkar, D. R., Gud, M. A. and S. K.Shinde. 2014. "Evaluation of safflower genotypes formultiple resistance to insect pests and diseases."BIOINFOLET, 11 (3 B): 892-896.
Akashe, V. B., Pisal, A. A., Mhetre, S. P. and Sawant, P.H. 1999. Insect pest scenario of safflower in thedrought prone areas of Maharashtra (India). Sesameand Safflower Newsl., 14:103-108.
Bisen, U. K., Sharma, A. K. and Mishra, P. K. 2012. Fieldevaluation of some newer molecules and botanicalsagainst safflower aphids (Uroleucon compositaeTheob.). J. Oilseeds Res. (Special issue), 29: 367-368.
Mane, P. N., Rathod, P. K., Balode, K. L. Deshmukh, S. N.and Sarap, P. A. 2012. Relative tolerance of certainsafflower genotypes to aphids, Uroleucon compositaeTheob. J. Oilseeds Res. (Special issue), 29: 398-400.
Neharkar, P. S., Suryawansi, D. S., Zanwar, P. R. andSuryawansi, P. D. 2003. Effect of insecticides onaphid and plant characters of safflower. J.Maharashtra agric. Univ., 28(1): 60-61, pp. 21.
Rathod, P. K., Mane, P. N., Balode, K. L. Deshmukh, S. N.and Sarap, P. A. 2012. Evaluation of promising andelite entries for their reaction to safflower aphid,Uroleucon compositae Theob. in Vidarbha. J.Oilseeds Res. (Special issue), 29: 400-402.
Sharma, A. K., Nayak, M., Shrivastava, A. K., Gupta, M.P. and Pathak, R. K. 2009. Evaluation of some newerinsecticides against safflower aphid, U. carthami HRL.J. Oilseeds Res. (Special issue), 26: 429-431.
Singh, V., Prasad, Y. G. and Lakshminarayana, M. 1999.Insect pests of safflower and their management. In:IPM System in Agriculture, Vol. 5 - Oilseeds (Eds. R.K. Padhyay, K. G., Mukherjee and R. L. Rajak). AdityaBooks Pvt. Ltd., New Delhi, India, pp. 552.
Journal of Agriculture Research and Technology 77
______________

Chicken production is the main type ofpoultry farming, although other speciesdocumented include turkeys, ducks, guineafowls, pigeons, geese and ostriches (Terenceand Clovice, 2009).The rationale for thepromotion of poultry production is predicatedon the fact that it can be rapidly expanded toreplace red meat in countries like Nigeria, withhigh growth rates, it improves humannutrition, generates regular income for womenand other disadvantaged groups, supplies input(e.g. manure) for crop production and isgenerally accepted by a majority of thepopulation.
According to NAERLS/PCU 2005, basedon provisional partial census of livestockpopulation in 22 states (out of 36 statesconstituting the Federal Republic of Nigeria andthe Federal Capital Territory), Nigeria has anestimated poultry population for both local and
improved breeds of about 122.9 million,compared with 48.8 million, 53.6 million and60.8 million for cattle, sheep and goat,respectively. The prevailing situation wasworsened in 2006 by the reported outbreak ofthe Highly Pathogenic Avian Influenza (HPAI)sub type H5N1, in some states of thefederation. Obayelu (2007) reported that theavian-flu outbreak led many poultry farmersinto psychological breakdown due to lossesincurred and it also affected animal proteinintake of a large sector of Nigerian population.Akpabio et al., 2007 asserted, that in someareas of the country like Akwa Ibom Statewhere the viral outbreak was not observed, asimilar morbid scare of poultry productsoccurred and this caused a lull in the productionand marketing of poultry products (especiallyegg and broiler meat). Poultry products (poultryCluster in some cases), constitute the majorsources of protein for many households, as amajor source of income and employment of
J. Agric. Res. Technol., 41 (1) : 078-082 (2016)
Poultry farmers Hygienic practices Against Occurrence ofAvian Influenza in Kwara State, Nigeria
O. G. Bello1, F. O. Oladipo2, O. W. Kareem3, P. B. Kharde4 and A. Y. Iliyasu5
Department of Agricultural Economics & Extension, Federal University,Dutse, P.M.B. 7156, Jigawa State, Nigeria
(Received : 11-02-2015)
AbstractThe study investigated the farmers' attitudes and hygienic practices employed by the poultry farmers
against the occurrence of Avian Influenza epidemic in Kwara State. Random sampling technique was used toselect 121 respondents from the population of 160 poultry farmers in the Poultry Association of Nigeria(PAN), Kwara State branch. A well structured questionnaire was used to elicit information from therespondents. The result revealed that poultry farmers were aware of personal hygiene to prevent the outbreakof avian influenza. The most commonly used management system was deep litter and they were more intobroilers and layers production respectively. The respondents' most preferred source of information on avianinfluenza was farmers group and they were very highly prepared to take all necessary hygiene attitude andpractices to prevent and control the occurrence and spread of avian influenza virus. Karl Pearson coefficientcorrelation indicated a positive and significant relationship with farmers' educational status and years ofpoultry experience.
Key words: Poultry farmers, hygienic practices, avian influenza.
1. Assistant Lecturer, 2. Senior Lecturer, 3. Ph.D.Scholar, 4. Associate Professor and 5. Senior Lecturer.

labour, the poultry industry plays a significantrole in the socio-economic life of Nigerians, inwhich the growth of the industry in recent timeshas witnessed a serious setback largely becauseof notifiable disease outbreak, particularly theAvian influenza.
In view of global spread and possible risk ofhuman infection especially by H5N1 strain ofthe virus, the threat of bird flu pandemic is oneof the major public health issues facing theinternational community (Bawa et al., 2010).To control AI, knowledge, attitudes, andpractices (KAP) concerning AI play importantroles. A KAP survey conducted in affected arealike Vietnam found that only half of participantswashed their hands every time after handlingpoultry, while around one-fourth never changedtheir clothes (Academy for EducationalDevelopment, 2006). In addition, a majority ofhouseholds lacked knowledge of aviansymptoms. A survey study of KAP conducted inCambodia concluded that participants had highlevels of anxiety concerning AI symptoms(Academy for Educational Development,2005). However, they were uncertain of therisk factors. These behaviours will definitely beconcerned for the infection and outbreak of thedisease in the future. Consequently, UNICEFadopted a program of interventions in Vietnam,Cambodia, and Lao PDR that focuses on hand-washing campaigns, the development ofsources of AI information, and other media toimprove the AI prevention practices of thesepopulations (Tavorn et al., 2007). However,little study has been undertaken in Thailand andAfrica on knowledge, attitudes, and practices ofAI. A KAP survey in 2004 in Nakhon PhanomProvince, Thailand, found that about 98% ofthe study population received informationabout AI from the mass media, especiallythrough television programs. The studyindicated that, among people who live incontaminated areas in Thailand, 68.5 per cent
did not know the symptoms or characteristics ofthe disease.
Although studies in several countriesindicate some level of awareness about HPAI,practices and attitudes for preventing andcontrolling HPAI disease spread and outbreakshave not changed (Fielding et al. 2005, Matonet al. 2007, DiGiuseppe et al. 2008, Leslie etal. 2008). Therefore, there is a need to assessknowledge attitudes, and practices of people inrisk areas to use the information obtained forfurther prevention of the disease (Tavorn et al.,2007). The campaign to eradicate and orprevent the future occurrence of bird flu inNigeria can only be achieved if all stakeholdersin the poultry industry are involved orsensitized. Adequate knowledge of thesymptoms at the grass root level is required tofacilitate the adoption of preventive measuresto avoid future occurrence as this will alsoprovide an entry point for agricultural extensionwork and services to function effectively.Understanding people's knowledge, attitudes,practices, and perceptions (KAPP) about andtoward risk is an important step in determiningwhich cost-effective measure to adopt. It also isimportant in assessing poor people's willingnessto adopt cost-effective prevention and controlmeasures for reducing the risk of highlypathogenic avian influenza (HPAI).
Materials and Methods
The study was carried out in Kwara Statewhich is the North Central part of Nigeria andit lies in the middle belt region. The people areengaged in farming and poultry production(Kwara Diary, 2011). Agriculturally, the state isdivided into 4 ADP Zones: A, B, C and D. Thepopulation of the study was one hundred andsixty (160) poultry farmers who were registeredmembers of the Poultry Farmers Association ofNigeria (PAN), Kwara State Chapter. A randomsampling technique was used to select one
Journal of Agriculture Research and Technology 79

hundred and twenty one (121) active poultryfarmers across the four AgriculturalDevelopment Project (ADP) administrativezones in the state. A well-structuredquestionnaire was used to elicit informationfrom the respondents and the results obtainedwere analysed using simple descriptive statisticssuch as mean, frequency counts, percentages,and standard deviation. Pearson correlationanalysis was used to test for the relationshipbetween selected socio-economiccharacteristics of poultry farmers and theirattitude and hygienic practices.
Results and Discussion
Source of Information on Avian Influenza:Table 1 showed the respondents sources ofinformation about avian influenza. The mostpreferred and effective source of informationare Farmers' group, Radio and Television(100%, 99.2% and 99.1% respectively).
Poultry farmers' attitude and hygienicpractices towards measures to controlavian influenza (Table 2) : It is observedthat the opinion of the respondents are notvaried as the practices were highly used by allthe farmers as measures to control the spreadof avian influenza and also hygiene attitude ofthe farmer towards the control was not varied,meaning that the farmers are not varied in theiropinion with respect to the fact that avianinfluenza is a threat to farmers, their familiesand neighbors. On the other hand they arevaried on the fact that it is good to breed birdsat home, the removal of cages from home toprevent AI occurrence and effect on humanhealth. On prevention and control measuresadopted, farmers were not varied in theiropinion but highly use all the conditions toprevent and control AI except use of protectivemasks which showed very highly un-used levelamong the farmers.
Relationship between selected socio-
economic characteristics of poultry farmers andtheir attitude and hygienic practices: It isobserved that all the selected socio economiccharacteristics (educational status, poultry
Bello et al.80
Table 1. Sources of Information on AI (Preferred)
Source No Not Mostpreferred preferred
School 12 41.7 58.3
Community 133 15.2 84.8
Radio 119 0.8 99.2
Television 117 0.9 99.1
Farmers group 121 - 100.0
Health personnel 20 5 95.0
Veterinary personnel 86 1.2 98.8
Source: Field Survey, 2014.
Table 2. Poultry farmer's attitude and practice towardsmeasures to control avian influenza
Hygiene Practice Mean S.D
Cleaning of cages for transport 1.26 0.67
Washing of hands after handling birds 1.18 0.71
Washing of hand after sneezing 1.42 0.95
Washing of hands after toileting 1.16 0.58
Washing of hands after slaughtering 1.24 0.72
Disinfection of shore before entering 1.20 0.68
Washing for cooking poultry 1.47 0.93
Hygiene Attitude
AI is a threat to farmers 1.17 0.56
AI is threat to family and neighbor 1.23 0.66
Good to breed birds at home 1.60 1.11
AI is preventable 1.37 0.93
Protect equipment (wash hand and 1.18 0.58protection equipment with soap and water)
Remove of cage from home to 1.50 1.12prevent AI
Preventive/Control/ Measure
Use of protective mask 1.06 0.99
Use of protective gloves 1.63 0.63
Use of outer garment 1.82 0.44
Use of boot covers 1.78 0.41
Use of soap & water after handling 1.91 0.31
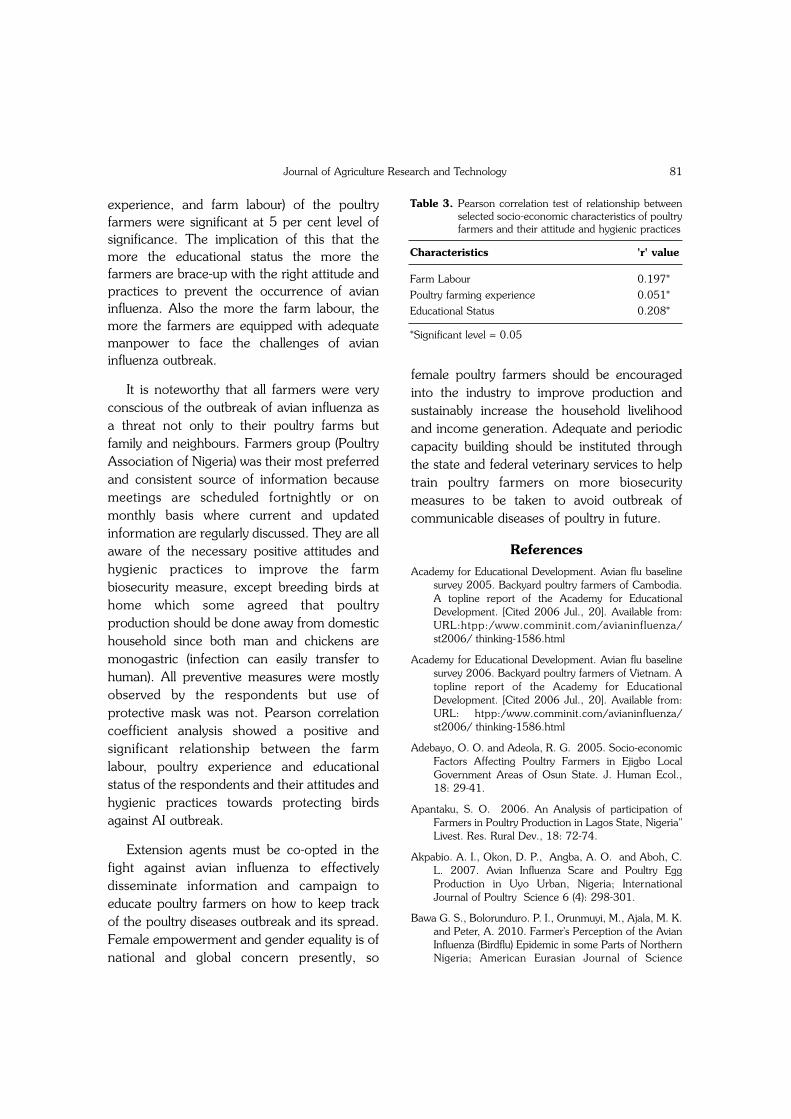
experience, and farm labour) of the poultryfarmers were significant at 5 per cent level ofsignificance. The implication of this that themore the educational status the more thefarmers are brace-up with the right attitude andpractices to prevent the occurrence of avianinfluenza. Also the more the farm labour, themore the farmers are equipped with adequatemanpower to face the challenges of avianinfluenza outbreak.
It is noteworthy that all farmers were veryconscious of the outbreak of avian influenza asa threat not only to their poultry farms butfamily and neighbours. Farmers group (PoultryAssociation of Nigeria) was their most preferredand consistent source of information becausemeetings are scheduled fortnightly or onmonthly basis where current and updatedinformation are regularly discussed. They are allaware of the necessary positive attitudes andhygienic practices to improve the farmbiosecurity measure, except breeding birds athome which some agreed that poultryproduction should be done away from domestichousehold since both man and chickens aremonogastric (infection can easily transfer tohuman). All preventive measures were mostlyobserved by the respondents but use ofprotective mask was not. Pearson correlationcoefficient analysis showed a positive andsignificant relationship between the farmlabour, poultry experience and educationalstatus of the respondents and their attitudes andhygienic practices towards protecting birdsagainst AI outbreak.
Extension agents must be co-opted in thefight against avian influenza to effectivelydisseminate information and campaign toeducate poultry farmers on how to keep trackof the poultry diseases outbreak and its spread.Female empowerment and gender equality is ofnational and global concern presently, so
female poultry farmers should be encouragedinto the industry to improve production andsustainably increase the household livelihoodand income generation. Adequate and periodiccapacity building should be instituted throughthe state and federal veterinary services to helptrain poultry farmers on more biosecuritymeasures to be taken to avoid outbreak ofcommunicable diseases of poultry in future.
ReferencesAcademy for Educational Development. Avian flu baseline
survey 2005. Backyard poultry farmers of Cambodia.A topline report of the Academy for EducationalDevelopment. [Cited 2006 Jul., 20]. Available from:URL:htpp:/www.comminit.com/avianinfluenza/st2006/ thinking-1586.html
Academy for Educational Development. Avian flu baselinesurvey 2006. Backyard poultry farmers of Vietnam. Atopline report of the Academy for EducationalDevelopment. [Cited 2006 Jul., 20]. Available from:URL: htpp:/www.comminit.com/avianinfluenza/st2006/ thinking-1586.html
Adebayo, O. O. and Adeola, R. G. 2005. Socio-economicFactors Affecting Poultry Farmers in Ejigbo LocalGovernment Areas of Osun State. J. Human Ecol.,18: 29-41.
Apantaku, S. O. 2006. An Analysis of participation ofFarmers in Poultry Production in Lagos State, Nigeria"Livest. Res. Rural Dev., 18: 72-74.
Akpabio. A. I., Okon, D. P., Angba, A. O. and Aboh, C.L. 2007. Avian Influenza Scare and Poultry EggProduction in Uyo Urban, Nigeria; InternationalJournal of Poultry Science 6 (4): 298-301.
Bawa G. S., Bolorunduro. P. I., Orunmuyi, M., Ajala, M. K.and Peter, A. 2010. Farmer's Perception of the AvianInfluenza (Birdflu) Epidemic in some Parts of NorthernNigeria; American Eurasian Journal of Science
Journal of Agriculture Research and Technology 81
Table 3. Pearson correlation test of relationship betweenselected socio-economic characteristics of poultryfarmers and their attitude and hygienic practices
Characteristics 'r' value
Farm Labour 0.197*Poultry farming experience 0.051*Educational Status 0.208*
*Significant level = 0.05

Research 5(3): 170-175.
Di Giuseppe, G., Abbate, R., Albano, L., Marinelli, P., andAngelillo, I.F. 2008. A survey of knowledge, attitudes,and practices towards avian influenza in an adultpopulation of Italy. BMC Infectious Diseases 8: 36.http://www.biomedcentral.com/1471- 2334/8/36.
Ekunwa, P. A., Soniregun, O. O., and Oyedeji, J. O.2006. Economics of small scale deep litter system ofegg production in Oredo L.G.A of Edo State, NigeriaInt. J. Poult. Sci., 1: 81-83.
Fielding, R. W., Lam, W. T., Ho, E. Y. Y., Lam, T. H.,Hedley, A. J. and Leung, G. M. 2005. Avian influenzarisk perception, Hong Kong. Emerging InfectiousDiseases 11 (5): 677-682.
Food and Agricultural Organization (FAO). 2006.EMPRESWATCH http://www.aphis. usda. gov/vs/ceah/cei/taf/iw_2006_files/foreign/hpainigeria021006.htm (Accessed 8th/01/07). from: URL:http://www.comminit.com/strategicthinking/st200/thinking1587.html
Leslie T., Billaud, J., Mofleh, J., Mustafa, L. and Yingst, S.2008. Knowledge, attitudes, and practices regardingavian influenza (H5N1), Afghanistan. EmergingInfectious Diseases 14(9): 1459-1461.
Maton, T., Butraporn, P., Kaewkangwal, J. and Fungladda,W. 2007. Avian influenza protection knowledge,awareness, and behaviors in a high-risk population inSuphan Buri province, Thailand. Southeast Asian
Journal of Tropical Medicine and Public Health 38(3):560-568.
NAERLS/PCU, 2005. Field Situation Assessment of 2005Wet Season Agricultural Production in Nigeria. Reportof a study conducted by National AgriculturalExtension and Research Liasion Service, Zaria andProject Coordinating Unit, Abuja, pp. 104.
Obayelu, A. E. 2007. Socio-economic Analysis of theImpact of Avian Influenza Epidemic on HouseholdsPoultry Consumption and Poultry Industry in Nigeria.Empirical Investigation of Kwara State. LivestockResearch for Rural Development 19 (1). Retrieved08/01/2007 from http://www.cipav. org.co/Irrd/Irrd19/1/03.
RIM. 1992. Nigerian Livestock Resources: NationalSynthesis Resources Investment and ManagementLTD, Jardin House, ST Helier, Jersey, UK. Vol,11.
Tavorn, M., Piyarat, B., Jaranit, K., and Wijitr, F. 2007.Avian Influenza Protection Knowledge, Awareness andBehaviour in a High-risk Population in Suphan BuriProvince, Thailand. Southeast Asian Journal ofTropical Medicine and Public Health 38(3):.
Terence, O. A., and Clovice, K. 2009. A Review of thecurrent poultry disease control strategies insmallholder poultry production systems and localpoultry population in Uganda: Department veterinarypublic health and preventive medicine, MakereUniversity. Food and Agriculture Organisation of theUnited Nation (FAO), Rome.
Bello et al.82
______________

Pearl of oil called as "soya". Soybean(Glycine max L. merill) became the miraclecrop of the 21st century.On the global scale, itis tops on the list of oil seed crops. It isintroduced as an oilseed crops in India toincrease edible oil resources in the country dueto its high yield potential. Madhya Pradesh isthe first and Maharashtra is second largestsoybean producing States in India. MadhyaPradesh produced 70 per cent andMaharashtra produced 18 per cent of countriessoybean production. Vidarbha becomes themain region of soybean production inMaharashtra. Cotton was main crop of thisregion in kharif season but from last five yearsfarmers prefer soybean crop because of lessinput with high output and requires lessagronomical practices as compared to cottoncrop.
To improve the agricultural production someform of improved technology is necessary. Theplant protection is an important and vital aspectof agricultural crop production. Weed is theserious problem in soybean production, day byday productivity of soybean crop is reducedbecause of weed infestation. Manual weedcontrol is difficult and costly because ofunavailability of labours and high cost of labour.To overcome these problem chemical weedcontrol by using herbicides is necessary. Theimportance of herbicides for improving cropproductivity is not only in situation wherelabour is scarce and expensive but also wherelabour is plentiful and cheap as well as relativelyless effective. Keeping these facts in mind thestudy was under taken with specific objective, tostudy the personal, socio-economic, situational,communicational and psychologicalcharacteristics of soybean growers, knowledgeof farmers about the use of herbicides in
J. Agric. Res. Technol., 41 (1) : 083-087 (2016)
Knowledge Level of Soybean growers about HerbicideApplication Practices
V. A. Deogirkar1, N. M. Kale2 and D. M. Mankar3
Department of Extension Education, PGI, Dr. Panjabrao Deshmukh Krishi Vidyapeeth, Akola - 444 104 (India)
(Received : 21-05-2015)
AbstractSoybean is the most important pulse crop in vidarbha region. Vidarbha becomes the main region of
soybean production in Maharashtra. Therefore, the study was undertaken to assess the knowledge level ofsoybean growers about herbicide application practices.The study was conducted in Akola district ofMaharashtra State. With the help of exploratory research design, data was collected from 120 soybeangrowing farmers and analyzed with the help of suitable statistical methods. Findings revealed that, more thanhalf (53.33%) of soybean growers was having medium level of knowledge about herbicide applicationpractices, followed by high level (40.84%) of knowledge and remaining 5.83 per cent soybean growersbelonged to low level of knowledge. It was also found that majority of soybean growers have no knowledgeabout important herbicide application practices like calibration of spray pump (97.50%), quantity of water tobe used for spraying of herbicide (80.84%) and recommended dose of herbicide. Hence, it is recommendedthat the State Department of Agriculture should organize regular trainings/workshops, demonstrations andprepare printed material on use of herbicides before sowing season in consultation with SAU scientists. Sothat soybean growers will get technical knowledge for effective use of herbicides.
Key words : Knowledge, soybean growers, herbicide application practices.
1. Ex. M.Sc. (Agri.) student. 2. Associate Professor and3. Professor & Head .
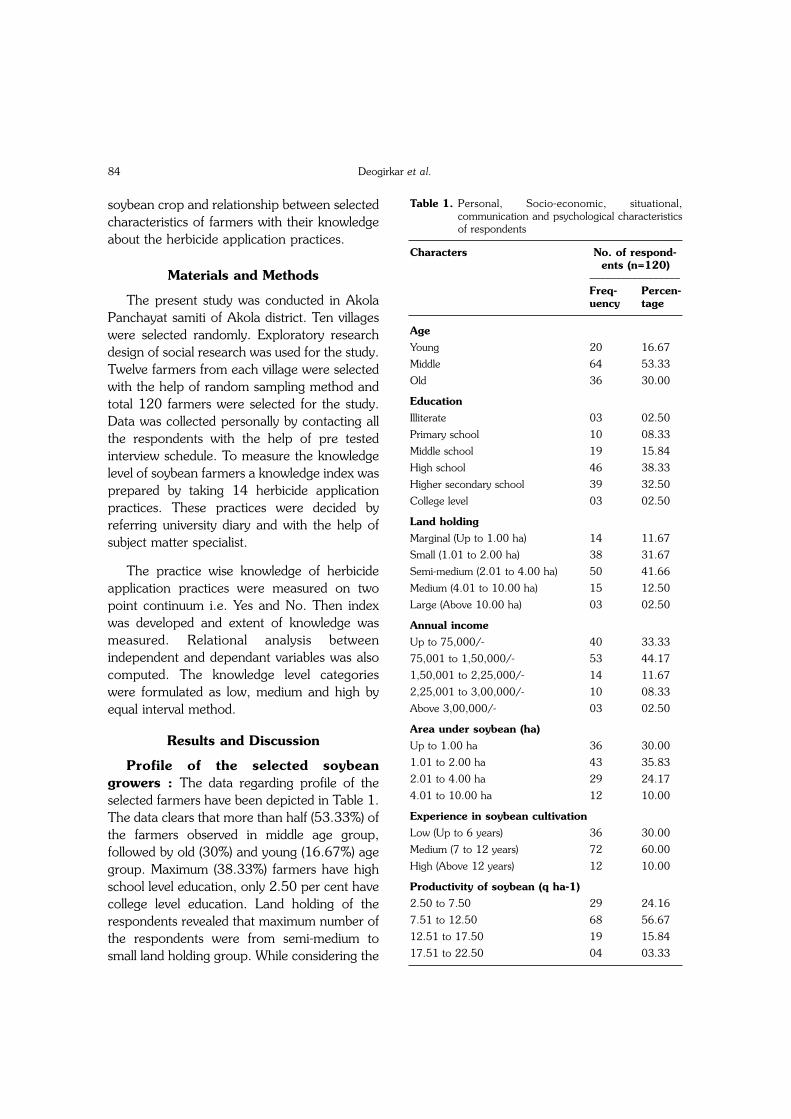
soybean crop and relationship between selectedcharacteristics of farmers with their knowledgeabout the herbicide application practices.
Materials and Methods
The present study was conducted in AkolaPanchayat samiti of Akola district. Ten villageswere selected randomly. Exploratory researchdesign of social research was used for the study.Twelve farmers from each village were selectedwith the help of random sampling method andtotal 120 farmers were selected for the study.Data was collected personally by contacting allthe respondents with the help of pre testedinterview schedule. To measure the knowledgelevel of soybean farmers a knowledge index wasprepared by taking 14 herbicide applicationpractices. These practices were decided byreferring university diary and with the help ofsubject matter specialist.
The practice wise knowledge of herbicideapplication practices were measured on twopoint continuum i.e. Yes and No. Then indexwas developed and extent of knowledge wasmeasured. Relational analysis betweenindependent and dependant variables was alsocomputed. The knowledge level categorieswere formulated as low, medium and high byequal interval method.
Results and Discussion
Profile of the selected soybeangrowers : The data regarding profile of theselected farmers have been depicted in Table 1.The data clears that more than half (53.33%) ofthe farmers observed in middle age group,followed by old (30%) and young (16.67%) agegroup. Maximum (38.33%) farmers have highschool level education, only 2.50 per cent havecollege level education. Land holding of therespondents revealed that maximum number ofthe respondents were from semi-medium tosmall land holding group. While considering the
Deogirkar et al.84
Table 1. Personal, Socio-economic, situational,communication and psychological characteristicsof respondents
Characters No. of respond-ents (n=120)
–––––––––––––––––Freq- Percen-uency tage
AgeYoung 20 16.67
Middle 64 53.33
Old 36 30.00
EducationIlliterate 03 02.50
Primary school 10 08.33
Middle school 19 15.84
High school 46 38.33
Higher secondary school 39 32.50
College level 03 02.50
Land holdingMarginal (Up to 1.00 ha) 14 11.67
Small (1.01 to 2.00 ha) 38 31.67
Semi-medium (2.01 to 4.00 ha) 50 41.66
Medium (4.01 to 10.00 ha) 15 12.50
Large (Above 10.00 ha) 03 02.50
Annual incomeUp to 75,000/- 40 33.33
75,001 to 1,50,000/- 53 44.17
1,50,001 to 2,25,000/- 14 11.67
2,25,001 to 3,00,000/- 10 08.33
Above 3,00,000/- 03 02.50
Area under soybean (ha)Up to 1.00 ha 36 30.00
1.01 to 2.00 ha 43 35.83
2.01 to 4.00 ha 29 24.17
4.01 to 10.00 ha 12 10.00
Experience in soybean cultivationLow (Up to 6 years) 36 30.00
Medium (7 to 12 years) 72 60.00
High (Above 12 years) 12 10.00
Productivity of soybean (q ha-1)2.50 to 7.50 29 24.16
7.51 to 12.50 68 56.67
12.51 to 17.50 19 15.84
17.51 to 22.50 04 03.33

annual income of the soybean growers dataclears that 44.17 per cent of the farmers haveannual income in the range of Rs. 75,001 to1,50,000/-. Majority of the farmers have areaunder soybean crop in the range of 0.40 to 2ha. Maximum number of selected farmers have7 to 12 years experience in soybean cultivation.More than half (56.67%) of the farmers get thesoybean productivity in the range of 7.51 to12.50 quintals per hectare. Social participationwas not observed amongst 42.50 per centfarmers. Medium level of extension contact(71.66%) and economic motivation (60.83%)level was noted with the selected farmers.
Knowledge about herbicideapplication : A data in Table.2 revealed thatas regards to practice wise knowledge, majorityof (98.33%) soybean farmers have knowledgeabout clean water to be used for spraying ofherbicide followed by sufficient moisture isrequired in soil at the time of herbicideapplication (96.66%), name of recommendedherbicides used for soybean (95.84%),knowledge about to avoid spraying during highspeed and cloudy weather (94.16%),knowledge regarding name of any one post-emergence herbicide used for soybean(95.84%) and inter-cultural operation shouldnot be take for 5-10 days after herbicideapplication (93.33%), appropriate time ofapplication of post-emergence herbicides(90.83%), flat fan or flood jet type of nozzleshould be used (70.83%), power spray neverused (62.50%) and 45.00 per cent of thesoybean growers have knowledge aboutrecommended dose of herbicides.
It is also apparent from the data thatmajority of soybean farmers had no knowledgeabout various herbicide application practiceslike calibration of spray pump (97.50%)followed by name of any one pre-emergenceherbicide for soybean (92.50%), time ofapplication of pre-emergence herbicides
(87.50%) and 500 liter water per hectareshould be used for spraying herbicides(80.84%).
Overall knowledge level of soybean farmersabout selected 14 herbicide applicationpractices was computed and respondents weredistributed into three categories by equalinterval method in Table 3.
The data in Table 3 revealed that, more thanhalf (53.33%) of the respondents possessedmedium level of knowledge about selectedherbicide application practices in soybean crop.While, about 40.84 per cent respondentspossessed high level of knowledge andremaining 5.83 per cent farmers noted in lowlevel of knowledge. Similar finding wereobserved by Jadhav (2008) and Kale et al.(2014).
Correlation analysis : Regarding the corelational data from Table 4 revealed thatamong 10 variables six variables viz.,
Journal of Agriculture Research and Technology 85
Social participationNo participation 51 42.50Office bearer of formal organization 04 03.33Member of formal organization 12 10.00Office bearer of informal organization 08 06.67Member of informal organization 45 37.50
Extension contactLow (Up to 7) 20 16.67Medium (8 to 12) 86 71.66High (Above) 14 11.67
Economic motivationLow (Up to 20.86) 28 23.34Medium (20.87 to 27.16) 73 60.83High (Above 27.16) 19 15.83
Table 1. Contd.
Characters No. of respond-ents (n=120)
–––––––––––––––––Freq- Percen-uency tage

education, land holding, annual income,experience in soybean cultivation, extensioncontact and economic motivation were found tobe positively and highly significant correlationwith their knowledge at 0.01 level ofprobability. The reason behind this is all thesevariables directly influences the knowledge ofthe farmers. Only the variable i.e. area undersoybean crop were found to have positive andsignificant correlation with their knowledge at0.05 level of probability. While, age wasnegatively correlated with knowledge level at0.01 level of probability. The variableproductivity and social participation did notshow any significant relationship withknowledge. The findings confirm with findingsof Shinde (2000), Jadhav (2008), Ashish kumar(2012), Mohite (2013) and Dhenge (2013).
Based on the study it can be concluded that,53.33 per cent soybean growers belonged tomiddle age group and 38.33 per cent of therespondents were educated up to high school.Maximum number (41.66%) of respondentsbelonged to semi-medium category of land
holding and 44.17 per cent respondents hadannual income between 75,000 to 1,50,000/-. The 35.83 per cent respondents had put put1.01 to 2.00 ha area under soybean and 60.00per cent respondents had medium experienceabout soybean cultivation. Majority (56.67%) ofrespondents had 7.51 to 12.50 q ha-1
productivity and about 42.50 per centrespondents had no participation in any socialorganization. Majority of respondents belongedto medium category of extension contact andeconomic motivation. More than half (53.33%)of soybean growers had medium level ofknowledge about herbicides application
Deogirkar et al.86
Table 2. Distribution of the soybean farmers according to their knowledge of herbicide application practices
Herbicide application practices Respondents (n=120)–––––––––––––––––––––––––––Yes No
Name of any recommended herbicides used for soybean crop 115(95.84) 05 (04.16)Recommended dose of any herbicide used for soybean crop 54 (45.00) 66 (55.00)Appropriate time of application of pre-emergence herbicides for soybean 15(12.50) 105 (87.50)Name of any one pre- emergence herbicides used for soybean 09 (07.50) 111 (92.50)Appropriate time of application of post-emergence herbicides 10 (90.83) 11 (09.17)Name of any one post-emergence herbicide used for soybean 112 (93.33) 08 (06.67)It is necessary to have sufficient moisture in soil 116 (96.66) 04 (03.34)Avoid herbicide spraying during high speed wind and cloudy weather 113(94.16) 07(05.84)Power spray is never used for spraying 75 (62.50) 45 (37.50)Calibration of spray pump (10 x10 m =100 sqm : 5 lit for 1 ha: 500 lit.) 03 (02.50) 117 (97.50)Muddy water is never used for spraying herbicide 118 (98.33) 02 (01.67)Flat fan or flood jet type of nozzle should be used 85 (70.83) 35 (29.17)Quantity of water used for spraying ( 500 L/ha) 23 (19.16) 97 (80.84)Not to take any inter-cultural operation up to 5-10 days after herbicide application 112 (93.33) 08 (06.67)
Figures in parenthesis indicate percentage
Table 3. Distribution of the respondents according to theiroverall knowledge level of herbicide applicationpractices
Category Respondents (n=120)––––––––––––––––––––––––––Frequency Percentage
Low (Up to 33.33) 7 5.83Medium (33.34 to 66.66) 64 53.33High (Above 66.66) 49 40.84Total 120 100.00

practices followed by high level (40.84%)category of knowledge. But, it was also foundthat majority of soybean growers have noknowledge about some important herbicideapplication practices like calibration of spraypump (97.50%), quantity of water to be usedfor spraying of herbicide (80.84%) andrecommended dose of herbicide. Hence, it isrecommended that the State Department ofAgriculture should organize regulartrainings/workshops, demonstrations and hasto prepare printed material on use of herbicidesbefore sowing season with the help of SAUscientists specially on calibration of spraypump, quantity and quality of water used,recommended dose of herbicides, etc so thatsoybean cultivators will get technical knowledge
for effective use of herbicides.
Correlation analysis indicated that theeducation, land holding, annual income,experience in soybean cultivation, extensioncontact and economic motivation of farmersshowed positive significant relationship withknowledge level of farmers. That means amongall independent variables education, landholding, annual income, area under soybean,experience in soybean cultivation, extensioncontact and economic motivation were theimportant variables for influencing theknowledge of soybean farmers about herbicidesapplication practices.
References Ashish Kumar. 2012. Adoption behavior of farmers about
recommended technologies of soybean. M.Sc. thesis(Unpub.), Dr. PDKV, Akola.
Dhenge, S. A. 2013. Knowledge and adoption ofintegrated pest management by paddy growers.M.Sc.(Agri.) thesis (Unpub.), Dr. PDKV, Akola.
Jadhav, S. M. 2008. Technological gap in soybeancultivation.M.Sc. (Agri.) thesis (Unpub.), Dr. PDKV,Akola.
Kale, N. M., D. M. Mankar. J. P. Deshmukh and P. P.Wankhade . 2014. Adoption of herbicide applicationpractices by soybean and cotton farmers in vidarbha.Research Review Committee Project, Dr. PDKV,Akola. 18 March, 2014.
Mohite, V. S. 2013. Adoption of biofertilizer by soybeangrowers in Western Vidarbha. M.Sc. (Agri.) thesis(Unpub.), Dr. PDKV, Akola.
Shinde, J. S. 2000. Knowledge and adoption of weedicidesin soybean by the farmers. M.Sc. (Agri.) thesis(Unpub.), Dr. PDKV, Akola.
Journal of Agriculture Research and Technology 87
Table 4. Relationship between socio-economiccharacteristic of soybean farmers and theirknowledge about herbicide application practices
Characteristics Correlation coefficient (r)
Age -0.5341**Education 0.6530**Land holding 0.2738**Annual income 0.3092**Area under soybean 0.2386*Experience in soybean cultivation 0.2981**Productivity 0.0263Social participation 0.0645Extension contact 0.4506**Economic motivation 0.4770**
** Significant at 0.01% level of probability, * Significant at0.05 % level of probability
______________

Various studies revealed the produciblecapacity of all cultivated crops in theMaharashtra as well as the whole country. Theproductivity levels of different crops in differentsoils and climatic conditions have beenexploited with the help of available technologyto the considerable extent (producible capacity).Many estimates, predictions and forecastingsare being made by the research workers everyyear to alarm the people, Government andpolicy makers about the productivity of eachcrop and agriculture as a whole. Now, people,farmers, research workers and the Governmentare bound to think over the severity ofproduction problem in consideration ofincreasing population of living beings. Hence,the development of production technology iscontinued and will continue.
The general behavior of different food crops
in the different regions (agro-climaticconditions) is very fluctuating due to climaticconditions as a result the growth rates variesfrom crop to crop and region to regiondepending upon situations. Therefore, thedifferent types of studies pertaining to growthprocess have been done following the linear,exponential, power functions, etc., which havebeen followed by the different research workers(Arunachalam and Balkrishna, 2012; Dhekale,2009; Borthakur and Bhattacharya, 1998;Joshi and Saxena, 2002; Kumar andRosegrant, 1994, Kumar, 1997; Patel et al.,1986 and many others). Out of all, somemethodologies are suitable while others are not.This is the reason that the method suitable tothe food crops in the Northern part of thecountry to a particular crop is not exactlyfollowing in the Southern region because of thevariability of the climatic conditions. So is thecase with the present selected food crops forthe study as a whole. Experimental analysis of
J. Agric. Res. Technol., 41 (1) : 088-092 (2016)
Performance and Growth of Major Food Crops in WesternMaharashtra
C. A. Nimbalkar1, S. D. Shinde2, V. S. Wani3 and V. A. Jadhav4
Mahatma Phule Krishi Vidyapeeth, Rahuri - 413 722 (India)(Received : 02-05-2015)
AbstractThe general behavior of different food crops in the different regions (agro-climatic conditions) is very
fluctuating due to climatic conditions as a result the growth rates varies from crop to crop and region toregion. Logistic model was used to explain the growth process of the selected food crops. Growth rates ofoverall productivity of Western Maharashtra in cereals, the bajara crop was found highest 0.196 kg-1 ha-1
yr-1 followed by rabi jowar 0.101 kg-1 ha-1 yr-1 and lowest for wheat crop 0.053 kg-1 ha-1 yr-1. In Pulses,the growth rates of productivity were highest in mung crop 0.167 kg-1 ha-1 yr-1 then for gram 0.032 kg-1
ha-1 yr-1 and it was negative or decreasing trend for the tur -0.035 kg-1 ha-1 yr-1 in Western Maharashtra.In Sangali district the growth rate of productivity of wheat was more 0.105 kg-1 ha-1 yr-1, for rabi jowarKolhapur has highest growth rate 0.403 kg-1 ha-1 yr-1 and for bajra Ahmednagar district has higher growthrate 0.196 kg-1 ha-1 yr-1 than others. Highest growth rates for gram, mung and tur were found in Sangali0.228 kg-1 ha-1 yr-1, Dhule and Pune districts 0.383 and 0.157 kg-1 ha-1 yr-1.
Key words : Productivity, growth rate, cereals, pulses, logistic model, WesternMaharashtra.
1. Asso. Professor, 2. Sr. Res. Assistant, 3. AssistantProfessor and 4. Professor and Head, SRTMU, Nanded.
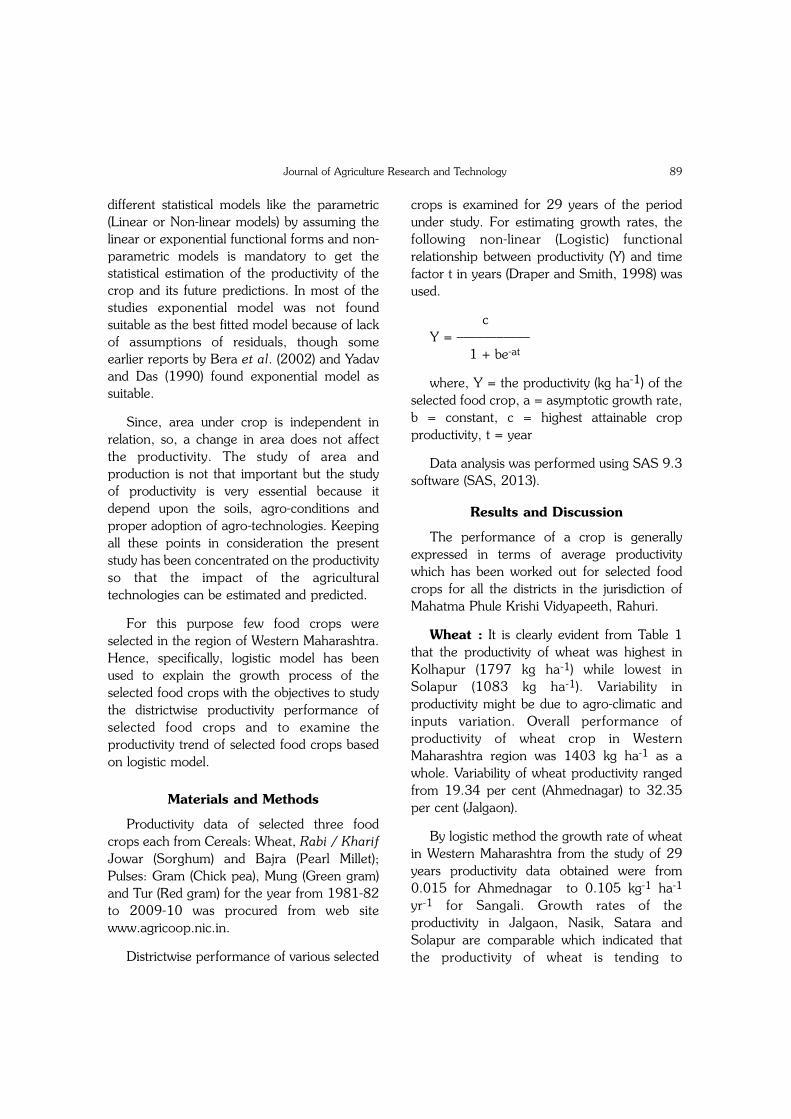
different statistical models like the parametric(Linear or Non-linear models) by assuming thelinear or exponential functional forms and non-parametric models is mandatory to get thestatistical estimation of the productivity of thecrop and its future predictions. In most of thestudies exponential model was not foundsuitable as the best fitted model because of lackof assumptions of residuals, though someearlier reports by Bera et al. (2002) and Yadavand Das (1990) found exponential model assuitable.
Since, area under crop is independent inrelation, so, a change in area does not affectthe productivity. The study of area andproduction is not that important but the studyof productivity is very essential because itdepend upon the soils, agro-conditions andproper adoption of agro-technologies. Keepingall these points in consideration the presentstudy has been concentrated on the productivityso that the impact of the agriculturaltechnologies can be estimated and predicted.
For this purpose few food crops wereselected in the region of Western Maharashtra.Hence, specifically, logistic model has beenused to explain the growth process of theselected food crops with the objectives to studythe districtwise productivity performance ofselected food crops and to examine theproductivity trend of selected food crops basedon logistic model.
Materials and Methods
Productivity data of selected three foodcrops each from Cereals: Wheat, Rabi / KharifJowar (Sorghum) and Bajra (Pearl Millet);Pulses: Gram (Chick pea), Mung (Green gram)and Tur (Red gram) for the year from 1981-82to 2009-10 was procured from web sitewww.agricoop.nic.in.
Districtwise performance of various selected
crops is examined for 29 years of the periodunder study. For estimating growth rates, thefollowing non-linear (Logistic) functionalrelationship between productivity (Y) and timefactor t in years (Draper and Smith, 1998) wasused.
cY = –––––––––––
1 + be-at
where, Y = the productivity (kg ha-1) of theselected food crop, a = asymptotic growth rate,b = constant, c = highest attainable cropproductivity, t = year
Data analysis was performed using SAS 9.3software (SAS, 2013).
Results and Discussion
The performance of a crop is generallyexpressed in terms of average productivitywhich has been worked out for selected foodcrops for all the districts in the jurisdiction ofMahatma Phule Krishi Vidyapeeth, Rahuri.
Wheat : It is clearly evident from Table 1that the productivity of wheat was highest inKolhapur (1797 kg ha-1) while lowest inSolapur (1083 kg ha-1). Variability inproductivity might be due to agro-climatic andinputs variation. Overall performance ofproductivity of wheat crop in WesternMaharashtra region was 1403 kg ha-1 as awhole. Variability of wheat productivity rangedfrom 19.34 per cent (Ahmednagar) to 32.35per cent (Jalgaon).
By logistic method the growth rate of wheatin Western Maharashtra from the study of 29years productivity data obtained were from0.015 for Ahmednagar to 0.105 kg-1 ha-1
yr-1 for Sangali. Growth rates of theproductivity in Jalgaon, Nasik, Satara andSolapur are comparable which indicated thatthe productivity of wheat is tending to
Journal of Agriculture Research and Technology 89

consistency in these districts. Overallproductivity growth rate of WesternMaharashtra was 0.053 kg-1 ha-1 yr-1 (Table 2).
Rabi jowar : Average performance of theproductivity of rabi jowar crop was foundminimum (422 kg ha-1) in Ahmednagar districtwhile maximum (1216 kg ha-1) in Jalgaondistrict (Table 1). No doubt, the performance ofrabi jowar varied due to different agro-conditions. Overall performance of productivityof rabi jowar crop in Western Maharashtraregion was 716 kg ha-1 as a whole. Variabilityof rabi jowar productivity was ranged from23.52 per cent (Jalgaon) to 35.70 per cent(Kolhapur).
Similarly, the growth rates of rabi jowarwere found minimum in Pune (0.011 kg-1 ha-1
yr-1) whereas the highest was in Kolapur (0.403kg-1 ha-1 yr-1) indicating the suitability of soil inKolapur district. The comparable districts inrespect of growth rates are Sangali, Satara andSolapur with 0.167, 0.231 and 0.217 kg-1
ha-1 yr-1, respectively. Overall productivitygrowth rate of Western Maharashtra was 0.101
kg-1 ha-1 yr-1 (Table2).
Bajra : Lowest yield of bajra was obtainedin Sangali (310 kg ha-1) while the highest inJalgaon (905 kg ha-1). Average performance ofthe productivity of bajra crop in WesternMaharashtra region was 558 kg ha-1 as a whole(Table 1a). The variability of bajra productivitywas ranged from 27.55 per cent (Pune) to53.64 per cent (Kolhapur).
Growth rates of bajra were varied from0.130 in Solapur to 0.278 kg-1 ha-1 yr-1 inAhmednagar district. Again, it is evident thatthere was suitable condition for bajra crop inAhmednagar district. The comparable growthrates of bajra were obtained in Jalgaon, Nasik,Sangali and Satara with productivity rangingfrom 0.248 to 0.264 kg-1 ha-1 yr-1. In case ofregion as whole of Western Maharashtra 0.196kg-1 ha-1 yr-1 growth rate was observed forbajra productivity (Table 2).
Gram : Since, gram is a specific type ofcrop, the yield had been obtained lowest inSolapur (412 kg ha-1) and the highest in
Nimbalkar et al.90
Table 1. Productivity performance of selected cereals and Pulse crops in the districts of Western Maharashtra
Crop Cereals Pulses––––––––––––––––––––––––––––––––––––––––––––––– ––––––––––––––––––––––––––––––––––––––––––––––
Wheat Rabi jowar Bajra Gram Mung Tur–––––––––––––– –––––––––––––– –––––––––––––– ––––––––––––––– –––––––––––––– –––––––––––––Mean C. V. Mean C. V. Mean C. V. Mean C. V. Mean C. V. Mean C. V.(kg (%) (kg (%) (kg (%) (kg (%) (kg (%) (kg (%)ha-1) ha-1) ha-1) ha-1) ha-1) ha-1)
DistrictAhmednagar 1365 19.34 422 32.79 497 44.23 549 23.06 379 45.47 467 34.01Dhule 1296 29.75 903 35.27 779 31.73 615 28.29 570 41.78 564 34.43Jalgaon 1574 32.35 1216 23.52 905 27.79 740 28.43 490 23.95 685 23.39Kolhapur 1797 20.86 1147 35.70 347 53.64 697 19.08 441 33.36 509 42.19Nasik 1233 27.17 533 29.35 633 41.62 533 22.47 585 37.18 640 25.52Pune 1370 23.54 489 25.60 620 27.55 585 28.43 534 22.74 431 42.28Sangali 1377 25.49 499 30.08 310 47.03 593 33.91 414 45.41 501 40.46Satara 1535 22.56 805 32.89 458 43.86 564 23.60 496 35.11 510 41.73Solapur 1083 23.68 427 35.57 379 30.88 412 49.26 407 51.20 315 38.48Western 1403 22.29 716 23.12 558 28.54 588 22.16 482 19.93 514 23.30Maharashtra
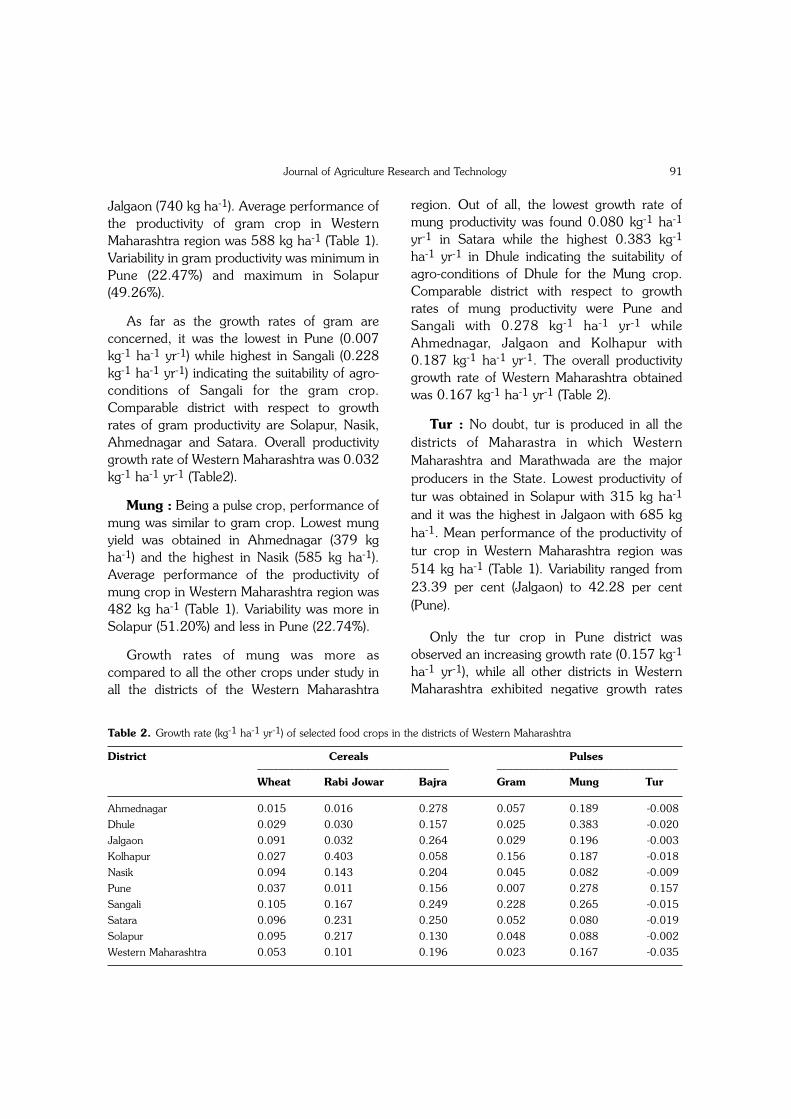
Jalgaon (740 kg ha-1). Average performance ofthe productivity of gram crop in WesternMaharashtra region was 588 kg ha-1 (Table 1).Variability in gram productivity was minimum inPune (22.47%) and maximum in Solapur(49.26%).
As far as the growth rates of gram areconcerned, it was the lowest in Pune (0.007kg-1 ha-1 yr-1) while highest in Sangali (0.228kg-1 ha-1 yr-1) indicating the suitability of agro-conditions of Sangali for the gram crop.Comparable district with respect to growthrates of gram productivity are Solapur, Nasik,Ahmednagar and Satara. Overall productivitygrowth rate of Western Maharashtra was 0.032kg-1 ha-1 yr-1 (Table2).
Mung : Being a pulse crop, performance ofmung was similar to gram crop. Lowest mungyield was obtained in Ahmednagar (379 kgha-1) and the highest in Nasik (585 kg ha-1).Average performance of the productivity ofmung crop in Western Maharashtra region was482 kg ha-1 (Table 1). Variability was more inSolapur (51.20%) and less in Pune (22.74%).
Growth rates of mung was more ascompared to all the other crops under study inall the districts of the Western Maharashtra
region. Out of all, the lowest growth rate ofmung productivity was found 0.080 kg-1 ha-1
yr-1 in Satara while the highest 0.383 kg-1
ha-1 yr-1 in Dhule indicating the suitability ofagro-conditions of Dhule for the Mung crop.Comparable district with respect to growthrates of mung productivity were Pune andSangali with 0.278 kg-1 ha-1 yr-1 whileAhmednagar, Jalgaon and Kolhapur with0.187 kg-1 ha-1 yr-1. The overall productivitygrowth rate of Western Maharashtra obtainedwas 0.167 kg-1 ha-1 yr-1 (Table 2).
Tur : No doubt, tur is produced in all thedistricts of Maharastra in which WesternMaharashtra and Marathwada are the majorproducers in the State. Lowest productivity oftur was obtained in Solapur with 315 kg ha-1
and it was the highest in Jalgaon with 685 kgha-1. Mean performance of the productivity oftur crop in Western Maharashtra region was514 kg ha-1 (Table 1). Variability ranged from23.39 per cent (Jalgaon) to 42.28 per cent(Pune).
Only the tur crop in Pune district wasobserved an increasing growth rate (0.157 kg-1
ha-1 yr-1), while all other districts in WesternMaharashtra exhibited negative growth rates
Journal of Agriculture Research and Technology 91
Table 2. Growth rate (kg-1 ha-1 yr-1) of selected food crops in the districts of Western Maharashtra
District Cereals Pulses–––––––––––––––––––––––––––––––––––– ––––––––––––––––––––––––––––––––––Wheat Rabi Jowar Bajra Gram Mung Tur
Ahmednagar 0.015 0.016 0.278 0.057 0.189 -0.008Dhule 0.029 0.030 0.157 0.025 0.383 -0.020Jalgaon 0.091 0.032 0.264 0.029 0.196 -0.003Kolhapur 0.027 0.403 0.058 0.156 0.187 -0.018Nasik 0.094 0.143 0.204 0.045 0.082 -0.009Pune 0.037 0.011 0.156 0.007 0.278 0.157Sangali 0.105 0.167 0.249 0.228 0.265 -0.015Satara 0.096 0.231 0.250 0.052 0.080 -0.019Solapur 0.095 0.217 0.130 0.048 0.088 -0.002Western Maharashtra 0.053 0.101 0.196 0.023 0.167 -0.035

tending to -0.002 kg-1 ha-1 yr-1. Decreasinggrowth rates in all the districts in the regionexcept Pune indicated that the productiontechnology of tur had not been utilizedefficiently. Hence, there is scope to increase theproductivity by introducing advancedtechnologies and proper extension work.Overall productivity growth rate of WesternMaharashtra was also exhibited decreasingtrend of - 0.035 kg-1 ha-1 yr-1 (Table 2).
The negative growth rates in respect of turcrop in all the districts in the region exceptPune indicated the production technology of turnot been utilized efficiently. Hence, there isneed to strengthen the extension activities forthis crop.
ReferencesArunachalam, Rajarathinam and Balakrishnan Vinoth.
2012. Statistical modelling for wheat (Triticumaestivum) crop production. International Journal ofStatistics and Applications, 2(4): 40-46
Bera, M. K., Chakravarty, K., Shahjahan Md. and Nandi,S. 2002. Area, production and productivity of rice inmajor rice growing districts of West Bengal during
nineteen eighties. Economics Affairs, 47(2): 108-114.
Borthakur, S. and Bhattacharya, B. K. 1998. Trendanalysis of area, production and productivity of potatoin Assam: 1951-1993. Economic Affairs, 43: 221-226.
Dhekale B. S. 2009. Application of parametric and non-parametric regression models for area, production andproductivity trends of major crops in Gujarat. M.Sc.Thesis, Anand Agricultural University, Anand, Gujarat.
Draper, N. R. and Smith, H. 1998. Applied RegressionAnalysis. 3rd Edn., John Wiley and Sons, New York,USA
Joshi, P. K. and Saxena, R. 2002. A profile of pulsesproduction in India. Facts, trends and opportunities.Ind. J. Agric. Econ., 57: 326-339.
Kumar, P. 1997. Food security: Supply and demandperspective. Indian Farming, 12: 4-9.
Kumar, P. and Rosegrant, M. W. 1994. Productivity andsources of growth for rice in India. Econ. PoliticalWeekly, 29: 183-188.
Patel, R. H., Patel, G. N. and Patel, J. B. 1986. Trends andvariability in area, production and productivity ofTobacco in India. Ind Tobacco J., 18: 3-5.
SAS. 2013. Statistical Analysis System Software 9.3(TS1M0). SAS Institute Inc., Cary, NC, USA.
Yadav, C. P. and Das, L. C. 1990. Growth trend of rice inAssam. Economic Affairs, 35,(1) : 15-21.
Nimbalkar et al.92
______________

The general notion is that the farmers arenot fully exploiting the available technologiesand thereby a wide gap between the potentialproduction and actual production. Ouragricultural production is very low as comparedto developed countries. This situation can bechanged with the adoption of improvedtechnology, which plays a vital role inincreasing agricultural production. Use of highyielding varieties, fertilizers, plant protectionmeasures, post-harvest technology can help toenhance the agricultural production.
The success of Agricultural and RuralDevelopment strategy depends on planning, itsimplementation and development. Transfer oftechnology is a very complex task which ismultidisciplinary approach. The total impact ofall components of the new agriculturalproduction technologies taken together wouldbe reflected in the level of yield obtained.
Transfer of technology from lab to land hasbrought economic benefit to farmers.
The strategy for increased agriculturalproduction adopted by the State Governmentplays major emphasis on intensive farmingwhich necessitates use of large quantities ofnew inputs with sufficient technical knowhow ofthe modern technology with a view to achievinghigher level of production.
Adoption of recommended technologies toget optimum level of output, farmers has toface many constraints and these constraintsmay reduce the potential production of cropsand affect total agricultural productivity. Theuse of new agricultural technology varies widelyfrom farmer to farmer in the same village also.Hence, under these conditions total impact ofall the components of the new agriculturaltechnology taken together would be reflected inthe level of yield obtained.
The pulse crops are important to provide
J. Agric. Res. Technol., 41 (1) : 093-098 (2016)
Technology Adoption Gap in Gram of Western Maharashtra
C. A. Nimbalkar1, S. D. Shinde2, V. S. Wani3 and V. A. Jadhav4
Department of Statistics, Post Graduate Institute, Mahatma Phule Krishi Vidyapeeth, Rahuri - 413 722 (India)(Received : 20-07-2015)
AbstractThe preparatory tillage, sowing time, spacing, seed rate, fertilizer doses of N, P and K, inter culturing and
irrigation are major contributors in gram production of which preparatory tillage, manure, sowing distance,phosphorous application, inter culturing and irrigation have explained 87.27 per cent contribution in gramproductivity. Out of 70 gram cultivators 29, 41 and 0 per cent were categorized in low, medium and highadoption group, respectively. The recommended technologies properly adopted by low and medium adoptiongroups were sowing time, spacing and seed rate for the gram production. The major recommendedtechnologies including land-use, preparatory tillage (1 ploughing and 2 harrowing), application of manure,sowing distance (30 x 10 cm), application of phosphorus (50 kg ha-1), inter culturing (1 hoeing and 1weeding) and irrigation influenced the gram output. These technologies be widely popularized among thefarmers to enhance the gram production.
Key words : Gram, technology adoption indices, Principal Component Analysis.
1. Asso. Prof. 2. S.R.A., 3. Asstt. Prof. and 4.Professor and Head, Dept. of Statistics, SRTMU, Nanded.

high value food, nutritional security andalleviate malnutrition for poor masses. Pulsesplay a vital role in improving soil health andconserve natural resources which are essentialfor sustainable agriculture. Gram is a major rabipulse crop of the India occupying 8.2 million haarea with the production of 7.3 million tonneshaving productivity of 895 kg ha-1. InMaharashtra, the total production of gram is1.30 million tonnes from an area of 1.42million ha with average yield of 914 kg ha-1
(Anonymous, 2013).
The technological development has takenplace in different crops according to theirsituational requirement. These techniques havebeen essential somewhere partially or fullydepending upon the adoption of differenttechniques for individual crop or as a whole.So, the impact of techniques adopted could bequantified in terms of increase in production.To identify the importance of technique(s)adopted, several kinds of indices weredeveloped by different scientists forquantification of contribution of differenttechniques in various crops for differentpurposes. Therefore, in the present caseamong all the techniques and indices, theprinciple component analysis (PCA) was utilizedto index the importance of the technique(s).Keeping this in view, the method of PCA wasused to develop indices for technology adoptionto know the impact in case of the gram cropproduction with the objectives to studytechnologies adopted by the farmers in gramcrop production, to develop adoption index forgram production and to measure thecontribution of each components of technologyin gram production.
Singh and Chahal (2009), Balai et al.(2013), Samui et al. (2000), Jayramanne et al.(2002) and Purushottam et al. (2009)conducted study on technology adoption inwheat, vegetables, groundnut, pulses and tea,respectively adopting different methodologies.
Materials and Methods
Secondary data was procured from theAgricultural Research Officer, Scheme forStrengthening of Research in AgriculturalEconomics, Mahatma Phule Krishi Vidyapeeth,Rahuri (India) during the year 2012-13.
Recommended technology : The termrecommended technology refers to thecultivation practices recommended by theUniversity for gram. The recommendedtechnologies developed by the Mahatma PhuleKrishi Vidyapeeth (MPKV), Rahuri for gramcrop were used for the present study(Anonymous, 2015). Technologies developedby State Agricultural Universities' (SAU) forcultivation of gram crop were recorded byconsulting the Pulse Breeder, MPKV, Rahuriand MPKV, Krishidarshani (diary).
Adoption of technology refers to actualpractices adopted by the farmers for cultivationof particular crops. The University hasundertaken various research programs fordifferent crops and made variousrecommendations about technologies. For thepresent study land use, preparatory tillage,manure, variety, sowing time, spacing, seedrate, seed treatment, fertilizer doses (N, P andK), inter-culturing, irrigation and cropprotection were studied.
Actual level of adoption for each item oftechnology was identified. Using the SAU'srecommended technologies, efficiency of eachtechnology was calculated. All efficiency scoreswere scaled down to 0 to 1 and all the groupsof farmers were classified as zero adoption,greater than zero to 0.5, 0.5 to 0.8 and 0.8 to1. The efficiency of each technology wascalculated with the help of following formula.
Adoption effici- Practices actually adoptedencyof particular = ––––––––––––––––––––––––practices Practices recommended
Nimbalkar et al.94

Development of composite index
A) Development of index by PrincipalComponent Analysis
The main objectives of the principalcomponent analysis are to refer the dimensionof a complex multiplicative problem. It is notuncommon, if the variations in variables, someof which are closely correlated with oneanother. In this situation the multiple regressionanalysis often fails to provide clear andmeaningful analysis. The coefficient ofindependent variables become unreliable andsometimes carries wrong signs in this situation.Since these become distorted by the inclusionof other independent variable with which theseshow a high degree of association. Thecomponent analysis on the other hand, takesthe correlation matrix into account andproduces components which are uncorrelatedwith one another, to bypass the problem ofmulticolinearity.
Secondly, the component analysis producescomponents in descending order of theirimportance that is the first component explainsthe maximum amount of variation and the lastcomponent minimum. It is further found thatfirst 5 or 6 components variables account for asizeable amount of variation (about 75 %). It istherefore, possible to represent all variables interms of eigen components.
The efficiency of any choice of 'k' linearfunctions depends on the extent to which the 'k'linear functions enable us to reconstruct the 'p'original variables. One method ofreconstructing the variables 'Ui' is bydetermining its best linear predictor on thebasis of 'k' linear functions, which case theefficiency of prediction, may be measured bythe residual variance 'λi
2' . An overall measureof the predictive efficiency is Σλi
2. The bestchoice of the linear functions, for which Σλi
2 is
minimum, is the first k principle components ofU (Kleinburm and Kupper, 1978).
B) Development of composite index oftechnology
The components of technologyrecommended by the University for differentcrops in terms of adoption scores (X1, ..... ,Xn)were utilized for developing composite index oftechnology adopted. A composite index is asingle numerical value representing the netadoption of all components of technologieswhose values lies between 0 and 1. Theprinciple component analysis (PCA) approachwas used for developing composite index. PCAbased on correlated components was a matrixbetween kth component of technology compu-ted. A set of k components explaining 100 percent of total variation of all components ofrecommended technologies was considered forcorrelation matrix where row representsvariables and columns represents eigen vectorsfrom which weight (Wi) coefficients ofcomponents of technology determined as,
MiWi = ––––––––––
Σ Mi
Where, Wi = Weight or coefficient ofcomponent of technology, Mi = Maximumelement in ith row, ΣMi = Sum of maximumelement in ith row
The required linear function for derivingcomposite index is,
Si = W1X1 + W2X2 +.... + WnXn
Where, Si = composite index score, Xi's =
adoption scores for individual component oftechnology.
This provides adoption index (of allcomponents of technologies) for eachcultivator. The composite index obtained in theprocess lie between 0 and 1.
Journal of Agriculture Research and Technology 95

The composite score of farmers wasclassified as low (40-60%) medium (60-80%)and high level (above 80%) level of adoption.
Contribution of each components oftechnology
To measure the contribution of eachcomponent of technologies in the yield gap, thedata collected from 70 gram cultivators wasused along with the adoption level oftechnologies and the yield gap was estimated inrelation to the recommended yield. Somefarmers had not adopted all the technologiestherefore the farmers were deleted fromcontribution analysis considering the size offarmers.
The yield gap is considered as a function oflevel of adoption and the contribution of eachtechnology in yield gap will be worked out byfitting linear regression between the level ofadoption of each technologies and yield gap.
[Xij - Xj]Zij = ––––––––––
Sj
where,
Σin[Xij - Xj]2
Sj2 = ––––––––––––,
n
ΣinXij
X– j = ––––––––––––,n
i = 1, 2, 3, ..... n and j = 1, 2, 3, ..... k, Zijdenotes the matrix of standardized indicators.
Yield gap between standard and actual yieldby the farmer is regressed on standardized valueof indicators and best fit was obtained.Contribution of each indicator in yield gap wasstudied to conclude yield gap and technologicaladoption gap.
Nimbalkar et al.96
Table 1. Distribution of selected cultivators according tocomposite index
Low adoption level Medium adoption level–––––––––––––––––––––––– –––––––––––––––––––––––Farmer Composite Farmer CompositeNo. index No. index
2 0.472 1 0.630
3 0.447 8 0.631
4 0.472 9 0.623
5 0.590 10 0.789
6 0.378 11 0.677
7 0.464 12 0.663
13 0.592 15 0.685
14 0.591 17 0.611
16 0.560 18 0.702
19 0.571 20 0.621
21 0.533 22 0.602
23 0.564 26 0.635
24 0.467 27 0.695
25 0.548 29 0.602
28 0.540 34 0.622
30 0.484 36 0.681
31 0.503 37 0.723
32 0.559 38 0.756
33 0.319 39 0.701
35 0.419 40 0.704
44 0.525 41 0.700
46 0.571 42 0.798
47 0.583 43 0.663
48 0.587 45 0.663
49 0.413 52 0.682
50 0.556 53 0.611
51 0.558 55 0.613
54 0.413 56 0.761
70 0.421 57 0.659
58 0.653
59 0.710
60 0.638
61 0.704
62 0.750
63 0.637
64 0.797
65 0.666
66 0.738
67 0.774
68 0.757
69 0.606

Results and Discussion
Using the method of Principle ComponentAnalysis, the composite indices for individualfarmers were worked out. All the farmers understudy were grouped according to compositeindex ranging from 0.00 to 0.60 in low, 0.60to 0.80 in medium and above 0.80 in hightechnology adoption groups. It is evident fromTable 1 that the 29 farmers were categorizedunder low technology adoption group and 41farmers categorized in medium technologyadoption group. Surprisingly, there was nofarmer coming under high technology adoptiongroup. The composite index of individualfarmer showed the adoption of recommendedtechnologies in the gram cultivation.
The composite Index of adoption : Thetotal 70 cultivators have been classifiedaccording their adoption level as low, mediumand high adopters.
Technology adopted by gramcultivators : The average of individualtechnology adopted by group of farmers hasbeen presented in Table 2 indicated that thelevel of adoption is near about equivalent forpreparatory tillage (0.62 and 0.66), sowingdistance (0.76 and 0.83) and application offertilizer K (0.31 and 0.34) in low and mediumgroup, respectively. It is also noticed that theland use, seed treatment, application of N, cropprotection indices was less in low adoptiongroup as compared to medium adoption groupand application of manure was negligible inboth the groups of gram cultivators.
The yield harvested by the selectedcultivators ranged from 10.53 to 12.74 q ha-1.Wide yield gap was observed in low adoption(12.47 q ha-1) than the medium adoption group(10.26 q ha-1) which indicates the benefit oftechnology adoption resulted in reduction ofyield gap. The non-adoption practices at itsrecommended level has reduced yield below
51.22 per cent than the potential yield.
Contribution of technologies in yieldgap : The abstract of contribution of gramcultivation technologies for the yield gap (Table2) revealed that the inter-culturing (42.64%),irrigation (12.80%), preparatory tillage(11.91%), application of P fertilizer (9.47%)and application of manure (6.08%) were themajor contributors to the gram production,whereas, sowing distance (4.38%), seedtreatment (3.46%), crop-protection (2.92%)and land-use (2.17%), had also played acontributory role in yield gap in the gramproduction. Vidya Sagar (1978) reportedsimilar type of results.
Based on present study it can be concludedthat there was better adoption of technologiesviz., sowing time, sowing distance, seed rate,fertilizer doses of N and P and irrigation inchickpea production. The recommendedtechnologies sowing distance and seed rate
Journal of Agriculture Research and Technology 97
Table 2. Technology adopted by gram cultivators andcontribution of technologies in yield
Technology Level of adoption Contri-–––––––––––––––––––––––––– butionLow Med- High Ove- (%)
ium rall
Land use 0.48 0.76 - 0.64 2.17Preparatory tillage 0.62 0.66 - 0.64 11.91Manure 0.02 0.05 - 0.04 6.08Variety use 0.62 0.81 - 0.73 0.02Sowing time 0.66 0.88 - 0.79 0.43Sowing distance 0.76 0.83 - 0.80 4.38Seed rate 0.90 1.00 - 1.00 0.25Seed treatment 0.28 0.42 - 0.36 3.46N 0.52 0.86 - 0.72 2.72P 0.65 1.00 - 0.86 9.47K 0.31 0.34 - 0.33 0.77Inter-culturing 0.54 0.695 - 0.63 42.64Irrigations 0.71 0.98 - 0.87 12.80Crop protection 0.41 0.68 - 0.57 2.92Seed yield 10.53 12.74 - 11.82Yield gap 12.47 10.26 - 11.18

were properly adopted by low group andvariety use, sowing time, sowing distance,sowing rate, application of N and P fertilizersand irrigation were properly adopted bymedium group. Application of manure and K,inter culturing and crop protection technologieswere not properly adopted by the gramcultivators, resulted in yield gap. Out of these14 technologies, nine technologies viz.,preparatory tillage, manure, sowing distance, Papplication, inter culturing and irrigation haveexplained 87.27 per cent contribution in gramproductivity, hence more attention in properadoption in these technologies be paid toenhance the gram production.
The major recommended technologiesincluding land-use, preparatory tillage (1ploughing and 2 harrowing), application ofmanure, sowing distance (30 x 10 cm),application of phosphorus (50 kg ha-1), interculturing (1 hoeing and 1 weeding) andirrigation influenced the gram output. Thesetechnologies be widely popularised among thefarmers to enhance the gram production inWestern Maharashtra.
ReferencesAnonymous. 2013 Districtwise General Statistical
Information of Agricultural Department. Part II-
Epitome of Agriculture in Maharashtra.Commissionorate of Agriculture, Government ofMaharashtra.
Anonymous. 2015. Krishidarshani. Mahatma Phule KrishiVidyapeeth, Rahuri. pp. 65-68.
Balai C. M., Jalwania R., Verma L. N., Bairwa R. K. andRegar P.C. 2013. Economic Impact of front linedemonstrations on vegetables in tribal belt ofRajasthan; Current Agriculture Research Journal. 1(2):69-77.
Jayamanne, V. S., Wijeratne Mahindra and Wijayaratna,C.M. 2002. Adoption of new technology in smallholding tea sector in the low country of Sri Lanka.Journal of Agriculture and rural Development in theTropics and subtropics; 103 (2): 15-131.
Kleinbaurm, D. G. and Kupper L. L. 1978. AppliedRegression analysis and other multivariable Methods.Duxbury Press, N. S. Massachusetts.
Purushottam S. K., Singh S. K., Chaudhary R. G., RajeshKumar and Praharaj C. S. 2012. Assessment oftechnological inputs for major pulses in Bundelkhandregion; Journal of Food Legumes; 25(1) : 61-65.
Samui, S. K., Maitra, S., Roy, D. K., Mondal, A. K. andSaha, D. 2000. Evaluation on front line demonstrationon groundnut (Arachis hypogea L). Journal of IndianSociety of Coastal Agriculture Research; 18:180-183.
Singh, Mandeep and Chahal, S. S. 2009. A study onextent of adoption of various technologies in wheatcultivation in Punjab. Agricultural Economics ResearchReview. 22: 349 - 354.
Vidya Sagar. 1978. Contribution of IndividualTechnological Factors in Agricultural Growth - A casestudy of Rajasthan; Economic and Political WeeklyJune 24-30. 25: A 63-67.
Nimbalkar et al.98
______________

In recent years increased attention has beenfocused on utilization of healthy foods. Freshbeetroots were exposed to spoilage due to theirhigh moisture content. One of the preservationmethods ensuring microbial safety of biologicalproducts was drying, (Mathlouthi, 2001). Thebeetroot (Beta vulgaris) being an alkaline foodwith pH from 7.5 to 8.0. has been claimed forits health benefits, in particular for its diseasefighting antioxidant potential, significantamount of vitamin C and vitamins B1, B2,niacin, B6, whilst the leaves are an excellentsource of vitamin A (Singh et al., 2013).
Drying is a difficult operation because itbrings about undesirable changes in quality.The extent of changes in quality depends on thecare taken in preparing the material beforedrying and on the drying process used (Sablani2006). Dried foods keep well because themoisture content is low so that spoilage
organisms cannot grow. It also creates a hardouter-layer, helping to stop micro-organismsfrom entering the food. Drying is one of theoldest methods of preserving high moisturefoods (Chauhan and Srivastava 2009).
Open sun drying (OSD) which was the mostcommon method of crop drying,. despiteseveral disadvantages, it was widely practicedbecause it was a simple way of drying. Croptemperature, temperature around the crop,solar temperature, and rate of moistureevaporation are the important parameters inOSD. In India, sun drying is the mostcommonly used and traditional method to drythe agricultural produce like grains, fruits andvegetables. In sun drying, the crop is spread ina thin layer on the ground and exposed directlyto the sun. This form of drying has manydrawbacks such as degradation by windblown,debris, rain, insect infestation, human andanimal interference will result in contaminationof the product. Drying rate also affected due to
J. Agric. Res. Technol., 41 (1) : 099-105 (2016)
Performance Evaluation of Domestic Solar Cabinet DryerAssisted with Reflector
S. R. Kalbande1, K. M. Shinde2 and A. N. Gaupale3
Department of Unconventional Energy sources and Electrical Engineering,Dr. PanjabraoDeshmukhKrishiVidyapeeth, Akola - 444 104 (India)
(Received : 02-05-2015)
AbstractCabinet solar dryer integrated with stainless steel reflector system is developed and its performance for
drying of beetroot slices was evaluated. A cabinet solar dryer integrated with stainless steel reflector systemwas developed and evaluated. The size of the cabinet dryer was 1.5 x 1.0 x 1.25 m. Average temperature indrying chamber, solar intensity, ambient temperature were recorded as 54°C (25-59°C), 761.7 W m-2 and29°C (15-31°C), respectively. The temperature in the drying chamber was approximately double thanambient. Drying time for 6.5 kg beetroot slices of 2.5 to 3 mm thicknessfor reducing moisture content of10.76 per cent to 4.71 per cent (db) was found to be 10 h in the solar dryer equipped with reflectors whereas it was 15 h in the open sun drying. The temperature in the dryer varied between 30 to 60°C at ambienttemperature range of 15 to 32°C during test run Beetroot. Thermal efficiency of the solar dryer with reflectorwas found to be 36 per cent.
Key words : Beetroot, sensory evaluation, solarcabinet drying, SPV panel.
1.

intermittent sunshine, wind and wetting by rain,(Sodha et al. 1985).
Use of stainless steel reflector for theimprovement of performance of solar dryer hasbeen proposed by several investigators.However, this enhanced efficiency isaccompanied by substantial increase in pressureloss, which results in higher running cost of thesystem. So, the solar energy collection systemshould be optimized in such a way that it willgive energy with minimum cost. In the presentstudy, domestic solar cabinet dryer withstainless steel reflector was used to increase thedrying rate with economical way. Such systemwill be useful for drying agricultural produceduring the period of less sunshine hours.Dryingplays an important role to preserve theagricultural products for long duration and it isthe process of heat and mass transfer duringthe removal of moisture from the products(Sharma et al. 1995).
Material and method
The experimentation was carried out at theDepartment of Unconventional Energy Sourcesand Electrical Engineering, Dr. PDKV, Akola.The selection of material was based on itsavailability in nearer market at low cost. Theselected material should be easily maintainedand repair on local basis. The material shouldhave the great structural and mechanicalproperty to increase the strength and durabilityof gadget. The physical and chemicalproperties of the materials are strong enough towithstand heat, vibration, humid air, fatigue andstress without failure during operation.
Solar dryer design considerations:
1. Capacity of dryer.
2. The amount of moisture to be removedfrom the given quantity of beetrootslices.
3. The daily sunshine hours.
4. The quantity of air needed for drying.
5. Daily solar radiation to determine energyreceived by the dryer per day.
6. Wind speed for the calculation of air ventdimensions.
Design details of a modified domesticcabinet solar dryer integrated withstainless steel reflector : A modifieddomestic cabinet solar dryer integrated withstainless steel reflector having capacity of 6.5kg/batch was designed and fabricated. Thecapacity was based on size and types of productto be dry. The cabinet was fabricated intrapezoidal shape by using L-angle havingbottom frame. Top, middle and bottom slidingtrays were fixed in the cabinet at a verticaldistance of 15 cm fixed on L angle of 2.54 cmx 3 mm thickness size. The cabinet havingbottom frame size (150 x 100 cm) and top (150x 20 cm). Top (150 x 50 cm) middle (150 x 75cm) and bottom (150 x 90 cm) sliding trayswere fixed in the cabinet. The tray wasfabricated in wire mesh and M.S. flat. The airvents were provided at the bottom of both sidesand front and back. The cabinet was coveredwith ultra violet stabilized polyethylene film of200 micron thickness. On the top twochimneys with exhaust fans were provided toremove hot moist air. The chimney (40 cmheight and 15 cm dia.) were fabricated by usingM.S. sheet. Main part is the reflector ofstainless steel fabricated and hanging atdistance by using two rods on the back sides ofthe cabinet at center of L-angle. The provisionwas made to change the angle so as to track thesun. To remove moist hot air inside the dryer,11mm diameter 12V DC fans were installedinside the chimney. The fan was fitted insidethe top of chimney by using clamps. It wasdriven by using solar panel of 10 W, 12V which
Kalbande et al.100

were connected with 12V 7A battery and 12Vcharge controller. The schematic view of thedryer with stainless steel reflector is shown inFig.1
Mechanism of dryer with stainlesssteel reflector : In order to receive maximumsolar radiation inside the cabinet dryer aStainless steel reflector sheet was provided atthe adjacent side of the dryer. During day
hours, solar energy transmitted throughpolyethylene sheet in the solar dryer and insidetemperature of dryer increased due togreenhouse effect. The solar radiation wasentered from the UV stabilized polyethylenefilm and side reflector was provided to radiatethe direct solar radiations in the cabinet andthus increased the cabinet temperature. Theheat accumulated in the cabinet was used forremoving the moisture from the product. Thedraught was created due to removal of hot andmoist air from the chimney and the fresh airentered into the cabinet through the airwindows provided at the bottom of the dryer.To avoid the heat loss from the bottom side of
Journal of Agriculture Research and Technology 101
Chimney
Mainframe
Trays
Airvent
Reflector
Trackingadjustment
Door
Fig. 1. View of domestic cabinet solar dryerintegrated with reflector
SUN
Direct solarradiation reflected rays
Moist air
Air Air
Fig. 2. Mechanism of drying by domestic solarcabinet dryer
Table 1. Design detail of solar cabinet dryer
Details of solar cabinet dryer Dimensions
Total area of dryer 150 cm x 100 cm x 65cmTotal perforation area (0.90+0.90+0.30) = 2.1 m2Absorber plate Iron metal sheet with painted black coated with thermocoal sheetL-angle 1.0 inchThickness of polyethylene sheet 200µHeight of stand 20 cmVentilation hole dimension at inlet (0.5 x 0.5 mm ) wire meshHeight and Diameter of chimney (both) 40cm and 15 cmSize of the drying trays, (three in number) Bottom(150 x 100 cm),
Middle(150 x 75cm),Top(150 x 50cm)
Size of the stainless steel reflector sheet 150 x 60 cmDistance between two trays 15 cmSPV panel used 10WBattery used 12V, 7ACharge controller 12V

the cabinet the thermocol sheet was used andsandwiched between GI sheet which acted as aheat insulating material. Mechanism of dryerassisted with reflector is shown in Fig.2
Detail of experimental set up : Adomestic cabinet solar dryer integrated withstainless steel reflector (6.5 kg batch-1 capacity)was developed and installed at Department ofUnconventional Energy Sources and Elec.Engg. Dr. PDKV, Akola. It consisted of cabinet,drying trays, UV stabilised PE sheet as acladding material, stainless steel reflector andtwo chimneys with exhaust fans which canoperated by using SPV panel. The dryer wasoriented to east-west to maximize the solarradiation incident on the dryer. In order toevaluate the performance of the domesticcabinet dryer integrated with stainless steelreflector, the beetroot slices were tested in thesystem.
Performance evaluation of domesticsolar dryer : Performance of the system wasevaluated at no load and full load condition bydrying beetroot slices. Under no loadconditions, air temperatures inside the cabinetdryer across different trays were recorded atdefinite intervals of time during a typical sunnyday. In full load testing 6.5 kg fresh beetrootslices was spread in the drying trays uniformlyand loaded in the cabinet dryer for drying in themonth of December.The product drying time,drying temperature in the cabinet dryer, solarintensity, moisture content of the productduring drying, ambient temperature, relativehumidity and product weight were measuredduring the experimentation. The increase oftemperature due to use of stainless steelreflector during the day was measured.Temperature was measured using pre-calibrateddigital thermometers with recordes. Relativehumidity of the ambient air was measured byusing hygrometer and then drying efficiency ofthe solar dryer was estimated.
Determination of moisture content :The quantity of moisture present in a materialwas determined on wet basis and expressed aspercentage. The initial (Mt) and final mass (Md)of the samples were recorded with the help ofelectronic balance. The procedure wasrepeated for every one hour interval till the endof drying of beetroot slices.
Mt - MdMC, (%) = –––––––––– x 100 .........(1)
Mt
Determination of moisture ratio : TheMoisture ratio of the sample was computed byfollowing formula,
M - MeMR = –––––––––– ........ (2)
M0 - Me
Where, M = Moisture content (db), per cent,Me = EMC, (db), per cent, M0 = IMC, (db), percent.
Determination of drying rate (DR) :The drying rate of the sample during dryingperiod was determined as follows,
ΔWDR = –––––– .......... (3)
Δt
Where, ΔW = Weight loss in one h interval(gm 100-1 gm bdm min.), Δt = Difference intime reading (h).
Drying Efficiency (%) : Drying efficiencyis defined as the ratio of the energy required toevaporate the moisture inside the product tothe energy supplied to the dryer. Total heat inthis case of solar dryer is the available solarradiation upon the collector surface supplied tothe dryer. The system drying efficiency is
Kalbande et al.102

calculated from
W x Lvηdryer = –––––––––––––––– ......... (4)
t x Ac x IT
Where,
W = moisture evaporated, kg, Lv = Latentheat of vaporization of water, MJkg-1, T =Time, sec., Ac = Collector area, m2, IT = Totalsolar radiation, MJm-2.
Results and discussion
Testing of solar cabinet dryer no loadand without reflector : Performance of thecabinet solar drying system was evaluated at noload condition.Maximum temperature at thetop tray of solar dryer was found to be 58°C,middle tray 54.4°C and bottom tray 51°C withcorresponding ambient temperature, Rh, solarinsolation and wind velocity of 30°C, 28 percent, 769 W m-2 and 2.2 m s-1, respectively.
Testing of solar cabinet dryer at noload and with reflector : Performance of thecabinet solar drying system was evaluated at noload condition with stainless steel reflector.Maximum temperature at the top tray of solardryer was found to be 59°C, middle tray 54°Cand bottom tray 49.5°C with corresponding
ambient temperature, Rh, solar insolation andwind velocity of 27°C, 28 per cent, 694 Wm-2 and 1.6 m s-1 respectively.
Evaluation of the dryer for dryingBeetroot slices : The solar dryer was testedfor drying of beetroot slices of averagethickness of 2.5 to 3 mm. The weight loss ofbeetroot slices taken from top tray, middle tray,bottom tray and open sun drying.Thetemperature in the solar dryer was 35 to64°C.The ambient temperature and relativehumidity during the experiment were 21 to32.75°C and 10 to 28 per cent, respectively.The solar intensity during day was 104.4 to728.8 W m-2. Drying time for drying ofbeetroot slices from initial moisture content of10.76 per cent (db) to 4.71 per cent (db) at toptray was found to be 7 h. Drying time for dryingof beetroot from initial moisture content of10.07 per cent (db) to 4.8 per cent (db) atmiddle tray was found to be 10 h. Drying timefor drying beetroot from initial moisture contentof 10.07 per cent (db) to 4.8 per cent (db) atbottom tray was found to be 10h in the solardryer as compared to 15 h in the open sundrying. Drying efficiency of the drying systemwas estimated to be about 36 per cent. As inFluidized bed drying (FBD) process, the dryingcompleted mostly in falling rate period (Khanna
Journal of Agriculture Research and Technology 103
Fig. 3. Variation in temperature, relativehumidity and solar intensity with timein the solar cabinet dryer at no loadwithout stainless steel reflector sheet.
Fig. 4. Variation in temperature, relativehumidity and solar intensity with timein the solar cabinet dryer at no loadwith stainless steel reflector sheet

2009).
Sensory evaluation of beetrootpowder : A powder of dried beetroot wasprepared for sensory evaluation. The dataobtained on sensory evaluation was statisticallyanalyzed using ANOVA in CRD format and theresults were depicted as in Table 3. The sensoryevaluation were performed for variousorganoleptic characteristics viz., colour, flavor,texture and overall acceptability of the beetrootpowder obtain by different way i.e. from toptray, middle tray, bottom tray of dryer and opensun drying. Sensory evaluation revealed thatbeetroot dried in solar cabinet dryer maintainedgood quality colour, flavor and texture.
Economics of domestic solar cabinetdryer for drying of Beetroot slices : Theeconomic feasibility of the domestic solarcabinet dryer for the drying of above sample
was calculated by considering the initialinvestment of the dryer, average repair andmaintenance cost, cost of raw material andselling price of the material after drying. Basedon the study net present worth, Benefit costratio, payback period and average parameterwere calculated for economics analysis ofdifferent samples depicted in Table 4. It isrevealed that in investment is economicallyviable as benefit cost ratio is more than 1 andNPW is positive.
The cabinet dryer integrated with stainlesssteel reflector system was developed and foundsuitable for beetroot slicesdrying.During noload test, the maximum temperature in the
Kalbande et al.104
Table 2. Moisture loss from beetroot slices during testingprocess
Time Top Middle Bottom Opentray tray tray sun
drying
0 100 100 100 150
60 78 81.2 79.1 130.3
120 58.3 64.8 62.8 110
180 42 50 50.3 89.1
240 23.8 36.9 36.4 72
300 15.4 24.4 24.4 59.4
360 13.3 17.1 17.4 51.2
420 13 13.7 14.9 43.9
480 13.4 14.2 42.3
540 11.8 13.5 37.58
600 11.5 13.1 29.6
660 21.5
720 19.5
780 18.65
840 17.75
900 17.45
Table 3. Mean score of sensory characteristics forbeetroot powder
Charac- Beetroot powderteristis –––––––––––––––––––––––––––––––––––––––
Cabinet dryer Open sun C.D.at assisted with drying 5%reflector
Colour 7.93 5.7 0.504
Flavour 8.13 6.3 0.731
Texture 7.96 5.9 0.706
OA 7.96 6.0 0.576
Table 4. Economic analysis of domestic solar cabinetdryer for following products sample drying
Description Amount
Initial investment (Rs) 10000
Annual use of no. of batches 80 (6.5 Kg)
Cost of raw material (Rs Yr-1) @40 kg = 20800
Cost of labour or drying 00.00
Operation and maintenance cost 200
Total dried product 64 g
Cost of finished product @375 kg-1 = 24000
Economic indicators
Net present worth, Rs 425167.57
Benefit cost ratio 1.05
Payback period 5 month

solar dryer was found to be (58°C) 31.6 to58°C during day time in the month ofDecember,2014 corresponding to the averageambient temperature of 29.5°C (19-29.5°C)and solar intensity 82.4 to 684.8 W m-2.Drying time required for drying of 6.5 kgbeetroot slices for reducing moisture content of10.76 per cent to 4.71 per cent (db) was foundto be 7 h. in the cabinet solar dryer equipped,where as it took 15 h. in the open sun drying.The temperature in the dryer varied between35-64.5°C corresponding to the ambienttemperature of 21-32.75°C during experimen-tation. Thermal efficiency of the solar dryerwith reflector system was found to be 36%.Thecolourof the solar dried beetroot slices wasobserved to be reddish as compared to theopen sun dried beetroot slices.The sensoryevaluation of beetroot powder suggested overallacceptability in colour, taste and flavour.
ReferencesChauhan A. K. S. & Srivastava A. K. 2009.Optimizing
Drying Conditions for Vacuum-Assisted MicrowaveDrying of Green Peas (Pisumsativum L.).DryingTechnology, 27(6), 761-769.
Khana M. Ali (2009). Microwave Assisted Fluidized BedDrying of Beetroot. Dept. of Post HarvestEngg.&Tech., A.M.U., Aligarh, India
Mathlouthi M (2001). Water content, water activity, waterstructure and the stability of foodstuffs. Food Control12, 409-417.
Sablani S.S. 2006. Drying of fruits and vegetables:Retention of nutritional/functional quality. DryingTechnology, 24 (2), 123-135.
Sharma, V.K, A. Colangelo and G. Spagna(1995).Experimental investigation of different solardryers suitable for fruit and vegetable drying.Energy. 6:413 - 424
Singh B. And Hathan B. (2013). Optimization ofOsmotically Dehydrated Beetroot candy usingresponse surface methodology. Dept. of Food Tech.Panniwalamota, Sirsa, IJFANS, 2320-7876
Sodha, M.S., Dang, A., Bansal, P. K., and Sharma
Journal of Agriculture Research and Technology 105
______________

Sweet Neem (Murraya koenigii) a treewhich produce an aromatic leaves used inIndian cooking. The sweet Neem tree is atropical to sub-tropical tree in family Rutaceaewhich is native to India and Sri-lanka. Its leavesare used in many dishes in India andneighboring country, often used in curries, theleaves are generally called by curry leaves alsocalled Curry Leaves tree in Indian language.Generally these leaves are fried along choppedonion in first stage of preparation. The leavesof Murraya koenigii are also used as an herb inauryvedic medicine they are believe to possessanit-diabatic property. Medicinal value of leavesreported as anti-bacterial, phyto constituentssuch as glycozoline, xanatoxin, volatile oil etc.The leaves are also used as anti-dysenteric,extremely cures eruptions, anti-omitting tonicand stomach ache purpose. The effect onleaves on blood glucose, plasma, insulin level isinduced. Fresh curryleaves has chlorophyll,terrenes and anti-oxidants which may alsocontributes in hypo glycemic effect andincreased insulin secretion. In their fresh form
they have a short shelf life and do not keep wellin refrigerator. They are also available in driedform but their aroma is inferior because ofopen sun drying.
Fruits such as, mango and pineapple areproduced in large quantities and the incomesderived from these products are normallyminimal due to inadequate conservation andstorage facilities and lacking marketingstructures hence to preserve such a usefulproducts drying is proposed (Bala et al. 1999).Rathore et al. 2012 evaluated the performanceof solar tunnel dryer for grape drying.Ayyappanand Mayilsamy (2010) studied a naturalconvection type solar tunnel drier integratedwith sensible heat storage material developed totest its performance for copra drying. Sharmaet al. (1995) reported solar drying of tomatoes,chillies and mushrooms.
Materials and methods
The experimentation was carried out onsolar tunnel dryer installed at RamkrushanaAgro. Vegetables and Fruit Products, Kodoli,
J. Agric. Res. Technol., 41 (1) : 106-112 (2016)
Performance Evaluation of Solar Tunnel Dryer for SweetNeem Leaves (Murraya Koenigii) Drying
S. R. Kalbande1 and A. J. Chopade2
Dept. of UCES, Dr. Panjabrao Deshmukh Krishi Vidyapeeth, Akola - 444 104 (India)(Received : 02-05-2015)
AbstractSolar tunnel dryer (STD) of 3x6x2 m design installed at the Ramkrushna Agro vegetables and Food
Products, Kodoli Tal-Phanhalla, Dist-Kolahapur, was used for experimental studies. Performance of thesystem was evaluated at no load and full load test by drying the Sweet Neem leaves. The experimentedconducted in the October month. At no load test, the average temperature and relative humidity duringdaytime in the STD was 50.67°C and 15.77 per cent and in OSD was 32.16 °C and 36.22 per cent,respectively. In full load test average temperature and relative humidity during daytime in STD was 47.58° Cand 19.70 per cent and in OSD was 32.32°C and 33.41 per cent in the said peroid.
Key words : Sweet neem, open sun drying,relative humidity, drying rate
1. Head and 2. M. Tech (RES).

Tal-Panhalla, Dist- Kolhapur which is Installedby Dept. of UCES & EE, Dr. P.D.K.V.,Akola.Fresh products were chosen for theexperimentation. Fresh sweet Neem were usedfor the experiment. The drying experiment wasconducted at no load and full load condition ofthe solar tunnel dryer. The discolored, damagedand diseased Sweet Neem leaves were sorted.After sorting of Sweet Neem leaves wereseparated or cut from the stalks manually. Forthe experimentation only leaves of Sweet Neemwas used. The technical specifications of solartunnel dryer are as follows
Drying Method
Open sun drying : Sun drying was doneby spreading the samples in OSD in thin layers.The experiment was conducted in postMonsoon (October 2014). The initial weightand moisture content of the samples wererecorded. The samples were weighted at aninterval of 30 minutes and correspondingtemperature, relative humidity and solarradiation were recorded.
Performance evaluation of solartunnel dryer : Garg et al., 2000 studied the
performance under natural circulation as wellas under forced circulation mode of solar tunneldryer.The volume flow rate and the rise in theinlet air temperature have been optimized fornatural circulation mode with respect to thedesign parameters, viz., length and radius. Theperformance of the solar tunnel dryer wasevaluated for drying of sweet Neem leaves. Theperformance of the system was evaluated byconducting no load and full load test.
No load testing of solar tunnel dryer :The variation of temperature and relativehumidity with solar radiation had been studied.The solar tunnel dryer with correspondingambient parameter were recorded to evaluatethe solar tunnel dryer without product duringpost monsoon season. The test was conductedbetween 9.00 to 17.00 h.
Full load testing of solar tunnel dryer:In full load test the leaves of 20 kg sweet Neem,were spread over the perforated plastics tray.The experiment was conducted in postMonsoon season (October 2014). The initialweight of the samples was recorded. Thesamples were weighed regularly at an interval of30 minutes and simultaneously thetemperature, relative humidity, solar radiationand wind velocity inside of solar tunnel dryerwas measured. Drying was conducted between9.00 to 17.00 h daily.
Study of drying characteristics : Thedrying mechanism depends on simultaneousheat and mass transfer phenomenon andfactors dominating each process determinedthe drying behaviour of the product. The dryingrates were computed from the experimentaldata and drying characteristics curves i.e.moisture ratio (db) vs. time, drying rate vs. timeand moisture content (db) vs. time wereplotted.
Determination of moisture content :Initial moisture content of sample was
Journal of Agriculture Research and Technology 107
Table 1. Technical specifications of solar tunnel dryer
Particulars Specifications
Aperture area, m2 24.25Width of dryer, m 3.00Length of dryer, m 6.00Drying tray area, m2 2.5 (1.6 m x 1.6 m)Number of trays 05 on each trolleyNumber of trolleys 2 Nos., (1.67 x 3.12 x 1.2 m)Height of tunnel, m 2.0Plastic cover, UV stabilized 200 µmChimney 2 Nos., Ø 0.15 m, H =0.75mFresh air vent area, m2 0.05Exhaust Fan, single phase, 1Nos, Brushless AC40 Wp, 1400 rpmDoor 1.80 m x 0.75 m

determined by the hot air oven drying method(Ranganna, 1986). Samples were weighedusing electronic weighing balance of least count0.01g. The samples of sweet neem were placedin hot air oven at 70 ± 0.50 C for 12.00 h.Following formulae were used.
(W1 - W2)M.C. (db)% = –––––––––––––– ..........(1)
(W2)
Where, W1 = Weight of sample beforedrying, (g), W2 = Weight of bone dried sample,(g)
Determination of moisture ratio : Themoisture ratio of the produce was computed byfollowing formula (Chakravert A)
(M - Me)Moisture Ratio (M.R.)=–––––––––– ........(2)
(M0 - Me)
Where, M = Moisture content (db), per cent,Me= EMC, (db), per cent, M0= IMC, (db), percent
Determination of drying rate : Thedrying rate of sample during drying period wasdetermined as follows (Chakraverty A).
ΔWDrying rate (DR) = ––––––– ...........(3)
Δt
Where, ΔW = Weight loss in one h interval(gm 100-1gm bdm min.), Δt = Difference intime reading (h)
Drying efficiency (η) : The dryingefficiency of solar tunnel dryer is the ratio ofheat gained to the heat input. The heat inputwas calculated by considering total solarradiation incident in aperture area of solartunnel drier during total drying hours in day.
(M - λ)η, (%) = –––––––––––––––– ........... (4)
(IAC x A x t)
Where, M = Mass of water evaporated, kg, λ = Latent heat of vaporization, MJ kg-1, IAC =Total solar radiation, MJ m-2, A = Collectorarea m2, t = time, sec.
Result and discussion
Results and their discussion are reportedwith respect to drying and drying characteristicsof Sweet Neem using different drying methods.The effect of drying in solar tunnel dryer andopen sun drying on quality parameters of thissample was studied and discussed.
Testing of solar tunnel dryer
No load testing of solar tunnel dryer :Fig.1 showed the highest temperature insidethe solar tunnel dryer with respect to timeachieved its peak value at 13:00 h. was foundto be 62ºC with corresponding ambienttemperature, relative humidity and solarradiation of 34.7ºC, 27percent and 950W/m², respectively. It was observed that themaximum temperature inside the solar tunneldryer was found to be 62ºC followed by top(62ºC) and bottom (61ºC) tray at 13:00 h. Theminimum temperature inside the dryer found tobe 36.5ºC at 9:00 h.
Fig. 2 Showed that during the monsoon
Kalbande and Chopade108
Fig 1. Average temperature variation duringno load test in STD (Day-1)

season, the maximum peak temperature insidethe solar tunnel dryer with respect to timeachieved its peak value at 13:00 h. was foundto be 61.9ºC with corresponding ambienttemperature, relative humidity and solarradiation of 35.3ºC, 32 per cent and 960 Wm-2 resp. It was observed that the maximumtemperature inside the solar tunnel dryer wasfound to be 61.9ºC followed by top (60ºC) andbottom (58.9ºC) tray at 13:00 h. The minimumtemperature inside the dryer found to be 36ºCat 9:00 hr.
A minimum relative humidity inside the solartunnel dryer was found to be 10 per cent andits peak value at 13:00 h and maximum relativehumidity inside the tunnel dryer was found tobe38 per cent and it was achieved at 9:00 h.
It was revealed From Fig 4 that minimumrelative humidity inside the solar tunnel dryer
was found to be 10 per cent and its peak valueat 12:00 h and maximum relative humidityinside the tunnel dryer was found to be 36 percent and it was achieved at 9:00 h.
Full load testing of solar tunnel dryer:The variation of temperature and relativehumidity inside the solar tunnel dryer withrespect to ambient conditions and solarintensity during full load testing is presented inFig. 5 and 6 respectively.
Fig.5 revealed that the maximumtemperature inside the solar tunnel dryerachieved its peak value 59ºC at 14:00 h of theday-1 corresponding to top 58.1ºC andbottom58.5ºC with corresponding ambienttemperature 36.1 ºC and relative humidity 26per cent and solar radiation 900 W/m²,respectively. The minimum temperature34.6ºC was achieved at 9:00 withcorresponding top 34.6ºC and bottom 35.4ºCwith corresponding ambient temperature 24.6with ambient relative humidity 52 per cent andsolar radiation 380 W m-2. Thus thetemperature inside the solar tunnel dryer variedfrom 34.6ºC to 59 ºC.
Fig.6 showed that the maximumtemperature inside the solar tunnel dryerachieved its peak value 58ºC at 13:00 h of theday-2 corresponding to top 56ºC and bottom56ºC with corresponding ambient temperature
Journal of Agriculture Research and Technology 109
Fig 2. Average temperature variation duringno load test in STD (Day-2)
Fig 3. Relative Humidity variation during noload test in STD (Day-1)
Fig 4. Relative Humidity variation during noload test in STD (Day-2)

36ºC and relative humidity 30 per cent andsolar radiation 940 W/m² respectively. Theminimum temperature 37.5ºC was achieved at9:00 with corresponding top 37.6ºC andbottom 37.5ºC with corresponding ambienttemperature 30.2°C with ambient relativehumidity 49 per cent and solar radiation 490W/m². Thus the temperature inside the solartunnel dryer varied from 37.5ºC to 58ºC.
Fig. 7 revealed that the minimum relativehumidity inside the solar tunnel dryer achievedits peak value 15 per cent at 14:00 hr of theday corresponding to the ambient temperature36.1ºC, ambient relative humidity 31 per centwith solar radiation 780W/m². The maximumrelative humidity inside the solar tunnel dryerwas found to be 38 per cent at 9:00 of the daywith corresponding ambient temperature24.6ºC, ambient relative humidity 52 per centand solar radiation 380W m-2.
Fig. 8 showed that the minimum relative
humidity inside the solar tunnel dryer achievedits peak value 19 per cent at 13:00 h of the daycorresponding to the ambient temperature36ºC, ambient relative humidity 30per centwith solar radiation 940 W/m². The maximumrelative humidity inside the solar tunnel dryerwas found to be 34 per cent at 9:00 h of theday with corresponding ambient temperature30.2ºC, ambient relative humidity 49 per centand solar radiation 490 W/m².
Drying characteristics of sweet Neemleaves in open sun drying and solartunnel dryer : The drying characteristics ofSweet Neem leaves, basil leaves and Sproutedmoth beans samples in natural convection solardryer were studied and compared with opensun drying. The different drying characteristicsin terms of moisture content per cent (db)drying rate (g 100-1 g b.dm. min) and moistureratio were studied.
Kalbande and Chopade110
Fig 5. Average temperature variation duringfull load test in STD (Day-1)
Fig 6. Average temperature variation duringfull load test in STD (Day-2)
Fig 7. Relative humidity variation during fullload test in STD (Day-1)
Fig 8. Relative humidity variation during fullload test in STD (Day-2)

Drying of sweet Neem leaves in STDand OSD : Fig.9 and Fig.10 revealed that thedrying rate varied from 1.44 to 0.006944 and0.88888 to 0.003968 gm 100-1 gm bdm minfor drying of sweet Neem in solar tunnel dryerand open sun drying, respectively. The averagedrying rate was found to be 0.065657 and0.02381 gm 100-1 gm bdm min correspondingto average moisture ratio of 0.350877 and0.387655 for STD and OSD, respectively.
Fig.11 and Fig. 12revealed that the averagemoisture content per cent (db) of sweet Neemleaves inside and outside sample "IN" and "ON"reduced from 400 to 20 per cent and 21.66per cent from (db) in 12.5 h and 14 h in solartunnel dryer and open sun drying, respectively.Similarly It was observed that the maximummoisture removal had taken place from 400 to76.66 per cent and 400 to 148per cent (db) in8 h during first day of drying.
Based on present study it can be concludedthat at no load test, the average temperatureand relative humidity during daytime in the STD
was 50.67°C and 15.77 per cent and in OSDwas 32.16°C and 36.22 per cent, respectively.In full load test avg. temperature and relativehumidity during daytime in STD was 47.58° Cand 19.70per cent in OSD was 32.32°C and33.41 per cent in the month of October.Moisture content of given samples was reducedexponentially with drying time. Falling ratedrying period was found in Sweet Neem leavesfound to be increased with increase in dryingtemperature.Solar tunnel drying took 12.5h tobring down the moisture content of SweetNeem from 400 to 20.66 per cent (db) as 14 hunder open sun drying.The overall dryingefficiency of Sweet Neem leaves was found tobe 31.73 per cent.
ReferencesAssefa, Ayyappan S. and Mayilsamy, K. 2010. Solar
Tunnel Drier with Thermal Storage For Drying ofCopra, Proceedings of the 37th National and 4th
International Conference on Fluid Mechanics and FluidPower December 16-18, IIT Madras, Chennai, India.
Bala B. K., Hussain M. D. and Mondol M. R. A. 1999.Experimental Investigation of Solar Tunnel Drier for
Journal of Agriculture Research and Technology 111
Fig 9. Variation of moisture ratio and dryingrate of sweet Neem leaves in STD.
Fig 10.Variation of moisture ratio and dryingrate of sweet Neem leaves in OSD.
Fig 11.Variation of moisture Content of sweetNeem leaves in STD.
Fig 12.Variation of moisture Content of sweetNeem leaves in OSD
Drying of Pineapple.Journal of the Institution ofEngineers, Bangladesh, Agricultural EngineeringDivision, 26(4): 37-44.
Chakraverty A. Post-harvest technology of cereals, pulsesand oil Seed. (New Dehli, Oxford and IBH Pub. Co.Pvt. Ltd., 1988. pp. 33-39)
Garg, H. P. and Kumar, R. 2000. Studies on SemiCylindrical solar tunnel dryer.J. Renewable Energy.20: 115-131.
Ranganna, S. Handbook of analysis of quality control forfruits and vegetable product (Chapter 1: 1-5., 1986)
Rathore, N. S., Panwar, N. L. and Asnani, B. 2012.Performance evaluation of solar tunnel dryer for grapedrying.Int. Journal. Renew. Energy. Tech. 3(1): 1-10
Sharma, V. K, Colangelo, A. and Spagna, G. 1995.Experimental Investigation of Different Solar DriersSuitable for Fruits and Vegetable Drying. RenewableEnergy, 6(4): 413-424.
Kalbande and Chopade112
J. Agric. Res. Technol., 41 (1) : 112-118 (2016)
Energetic and Exergetic Performance of Solar PhotovoltaicRefrigeration System
S. R. Kalbande1 and Sneha D. Deshmukh2
Dr. Panjabrao Deshmukh Krishi Vidyapeeth, Akola - 444 104 (India)(Received : 02-05-2015)
AbstractSolar refrigeration is thought of as one of the best alternatives to overcome the problem arises due to
electricity crises and it may be accomplished by using one of the refrigeration systems like vapor compression,absorption or thermoelectric refrigeration system. Introducing solar refrigerators into the cold chain ensuresthat solar refrigerators can provide a more sustainable vaccine cold chain.The solar photovoltaic (PV) systemgenerates both electrical and thermal energy from solar radiation. Therefore an energy and exergy analysisof the system was carried out. Energy analysis was concerned only with the quantity of energy use andefficiency of energy processes. Exergy is the maximum work potential which can be obtained from energy.The experimental data were used for the calculation of the energy and exergy efficiencies of the PV systems.The average photovoltaic efficiency was found to be 9.93 and 9.74 per cent for no load and full loadconditions while exergy efficiency was 13.02 and 13.11 per cent, respectively for March month. Photovoltaicefficiency and exergy efficiency were 8.5 and 12.18 for April month at no load condition and 8.36 and 12.18per cent at full load condition respectively. Photovoltaic efficiency and exergy efficiency were 8.46 and 11.41for May month at no load condition and 8.2 and 11.11 per cent at full load condition respectively. Hence itis concluded that there was no impact of load on the performance of photovoltaic panel. It was observed thatthe PV module temperature had a great effect on the exergy efficiency, could be improved by maintainingmodule temperature close to ambient and that could be achieved by removing the heat from PV modulesurface. It was concluded that the exergy losses increased with increasing module temperature.
Key words : Exergy efficiency, photovoltaic efficiency, solar photovoltaic, thermoelectricrefrigerator, vapor compression refrigeration.
______________
Due to the growing concern and awarenessof environmental issues among the scientific
community, power generation from renewableenergy sources, particularly solar energy hasbecome significantly important from the lastfew decades. The energy efficiency of a solarpanel, is the ratio of the power output to the
1. Head and Associate Professor, All India Co-ordinated Research Project on Renewable Energy Sourcesand 2. Ph.D. RES scholar.

energy originally delivered to the solar paneland conventionally is used to measure solar PVefficiency. Energy analysis is based primarily onthe first law of thermodynamics, as comparedwith exergy analysis which is based on thesecond law. Energy analysis is concerned onlywith the quantity of energy use and efficiency ofenergy processes. Energy analysis thus ignoresreductions of energy potential, which could beused productively in other physical and/orchemical process. Energy analysis can providesound management guidance in thoseapplications in which usage effectivenessdepends solely on energy quantities.
Exergy analysis is used to find out theenergy utilization efficiency of an energyconversion system. Exergy analysis yields usefulresults because it deals with irreversibilityminimization or maximum exergy delivery.
The exergy analysis has been increasinglyapplied over the last several decades largelybecause of its advantages over energy analysis.To perform energy and exergy analyses of thesolar PV, the quantities of input and output ofenergy and exergy must be evaluated.
Some researchers conducted experimentson the performance analysis of photovoltaicdriven vapour compressor refrigeration system.Kattakayam et al. (1996) studied the electricalcharacteristics of a 100W AC operateddomestic refrigerator using R-12 powered by afield of SPV panels, a battery bank and aninverter. Charters et al. (2003) suggested its usein developing countries for essential purposessuch as vaccine serum storage at medical clinicsin remote regions. Eltawil and Samuel (2007)stated that refrigerated storage, was believed tobe best method for storing the fruits andvegetables in fresh form, which were notavailable in rural or remote locations where gridelectricity was almost not available. Fatehmullaet al. (2011) designed and developed low
power refrigeration system using PV modules,2 modules each of 36 solar cells. Yilanciet al.(2011) studied the energy analysis of arefrigerator, powered by a photovoltaics toobtain efficient operation conditions based onexperimental data. Sobamowo et al. (2012)designed and developed photovoltaic-powereddc vapour compression refrigeration system fordeveloping countries such as Nigeria andshowed its applicability to different climaticregions in Africa and could be used forperishable food storage, improvement in thehealth services and living conditions in remoteand rural areas which were unable to accesselectricity from the grid.
Materials and Methods
In this experimental study, the comparativeenergetic and exegetics analysis of solarphotovoltaic (SPV) modules was carried out fora March, April and May month under thedifferent climatic conditions.
Experimental system : A SPVrefrigeration system consisted of DC vaporcompression refrigerator of 25 litre capacity.Considering the power requirement of itscontinuous operation, two 80 W SPV panelswere used to convert solar energy into electricalenergy. The panels were arranged in parallel.The purpose of this arrangement was to havesufficient potential difference across the 12 Vbattery for properly charging of battery. Thepanels were kept on fixed masonry structure at35° (tilt angle) from horizontal, facing southdirection. A battery was used so that it couldgive high starting current required to start themotor of compressor. It consisted of one 12 V- 150 Ah sealed lead acid batteries connected inparallel. Panel were connected to the batteryvia charge controller which avoided the batteryfrom getting deep discharge. Battery suppliedDC current to refrigerator as it operated on DCcurrent.
Journal of Agriculture Research and Technology 113

Energy efficiency of the solar panel
Photovoltaic efficiency : The efficiencyof the solar panels, defined as the ratio of theelectrical power produced to the incidentradiation. Photovoltaic efficiency of solar panelwas determined at no load and full loadcondition by using following formula.
Pmaxηpv = –––––––––– .........(1)
S x Apv
Where, ηpv = Efficiency of photovoltaicsystem, Pmax = Maximum power fromphotovoltaic system (W) S = Solar irradiance (Wm-2), Apv = Area of the photovoltaic system(m2)
Exergy analysis : Exergy is defined as themaximum amount of work that can be done bya system.
Photovoltaic exergy : The energy of a PVmodule depends on two major components--electrical and thermal.
Exout = VmIm - (1 - T0/Tcell) [hc x Apv (Tcell -T0) ..........(2)
Where, Vm = Maximum Voltage ofphotovoltaic system, Im = Maximum current ofphotovoltaic panel, hc = convective heattransfer coefficient from the photovoltaic cell toambient, Apv = area of the photovoltaicsurface, Tcell - cell temperature, T0 = ambienttemperature.
The convective heat transfer coefficientfrom the photovoltaic cell to ambient can becalculated by using correlation
hc = 5.7 + 3.8 x v ........(3)
Where, v = Wind velocity (m)
The cell temperature can be determined by
the following relationship:
Tcell = 0.943Ta + 0.028 Irradiance - 1.528Windspeed + 4.3 .........(4)
Exergy input of the photovoltaic system,which is the exergy of solar energy, can becalculated approximately as below
EXin = EXsolar = Apv x S x [1 - 4/3 (T0 /TSUN) + 1/3 (T0 / TSUN)4] ..........(5)
Where, TSUN = Temperature of the Suntaken as 5760 °K
Exergy efficiency of the photovoltaic systemis defined as the ratio of total output exergy(recovered) to total input exergy (supplied). Itcan be expressed as
EXoutψPV = –––––––––– ...........(6)
EXin
Result and discussion
Performance evaluation of photo-voltaic system at no load : Theperformance of the photovoltaic system wasevaluated in terms of photovoltaic energy andexergy efficiencies during no load testing. Solarintensity was measured hourly and the opencircuit voltage and short circuit current weremeasured during the off cycle of therefrigeration system. The hourly variation ofconversion efficiency (ηmod) is illustrated infigures 1 and 2 for March month. It wasobserved from figure that the efficiency wasrelatively higher during the early and late hoursof the day as compared to midday which wasdue to thermal effects. It was found that, theconversion efficiency is inversely proportionalto the module temperature. The photovoltaicefficiency was found in the range of 7.48 to10.14%.The average efficiency of thephotovoltaic system was observed to be 8.46%
Kalbande and Deshmukh114

for May month. The average photovoltaicefficiency was 9.93 and 8.5% for March andApril months, respectively.
At maximum solar radiation, differencebetween exergy in and exergy out was found tobe more. The exergy in was maximum due tomore temperature which was due to more solarradiation (Eltawil and Samul, 2007). IncreasedPV array temperature determine the sensibledecrease of this efficiency. In order to havemaximum exergy efficiency, PV arraytemperature should be kept near the ambienttemperature or in other words, PV arraytemperature should be controlled. Exergyefficiency was found to be 8.26 per cent at13.00 h due to increase in cell temperature (56.11°C) with maximum solar intensity of911.90 W m-2. Exergy efficiency wasdetermined to be 19.15 per cent at 17.00 hdue to less cell temperature (35.9°C). Averageexergy efficiency was found to be 11.41 percent. Average exergy efficiency for March andApril month were 13.02 and 12.18 per cent,respectively.
Table 1, 2 and 3 indicated the variation ofsolar radiation, photovoltaic efficiency andexergy efficiency with time at no loadconditions for March, April and May monthrespectively.
Performance evaluation ofphotovoltaic system at full load : It wasobserved that photovoltaic efficiency found(8.24%) highest in early morning and 10.02per cent in afternoon at 17.00 h withcorresponding solar radiation of 627.00 and424.80W m-2, respectively. Thus it wasaffected by solar radiation and moduletemperature. The average photovoltaicefficiency was found to be 8.2 per cent for Maymonth. The average photovoltaic efficiency forMarch and April month were 9.74 and 8.36per cent, respectively.
The performance of photovoltaic systemwas evaluated at full load condition by adoptingthe same procedure as adopted in no loadcondition. From figures it was observed that theexergy-in of sun was maximum of about1258.22 W indicated the great potential of sunto emit power and it increased with increase insolar radiation. It was analyzed and shown inthe figure that the photovoltaic exergy-outfound 99.58 W found below the maximumpower extracted from the photovoltaic systemdue to the high cell temperature produced heatenergy and this heat energy being lost by thesystem (Yilanci et al., 2011). The exergyefficiency was found to be 18.31 per cent atcell temperature 37.74°C at solar radiation of424.80 W m-2. At 13.00h the exergyefficiency found minimum (7.9%) at celltemperature of 56.97°C and solar radiation
Journal of Agriculture Research and Technology 115
Fig. 1. Variation of photovoltaic efficiency withrespect to solar radiation and tempera-ture for March month at no load
Fig. 2. Variation of Exergy efficiency withrespect to solar radiation and tempera-ture for March month at no load

Kalbande and Deshmukh116
Table 1. Variation of solar radiation, photovoltaic efficiency and exergy efficiency with time at no load for March month
Time Solar Power Photovoltaic Tcell Exergy Exergy Exergy(h) radiation output efficiency (°K) out in efficiency
(W m-2) (w) (%) (W m-2) (W m-2) (%)
9:00 527.00 78.75 10.38 304.19 106.21 705.78 15.0510:00 687.26 93.85 9.48 309.90 105.29 919.93 11.4511:00 748.18 96.80 8.98 313.68 104.56 1000.97 10.4512:00 800.00 105.75 9.18 316.60 103.87 1070.06 9.7113:00 836.00 106.26 8.82 317.35 103.18 1118.20 9.2314:00 752.00 100.93 9.32 314.58 104.53 1005.87 10.3915:00 622.00 94.89 10.59 309.72 105.81 832.38 12.7116:00 496.16 77.42 10.84 304.70 106.25 664.14 16.0017:00 356.12 60.36 11.77 307.57 105.53 475.71 22.18Average 9.93 13.02
Table 2. Variation of solar radiation, photovoltaic efficiency and exergy efficiency with time at no load for April month
Time Solar Power Photovoltaic Tcell Exergy Exergy Exergy(h) radiation output efficiency (°K) out in efficiency
(W m-2) (w) (%) (W m-2) (W m-2) (%)
9:00 600.02 75.90 8.78 310.78 108.45 802.58 13.5110:00 696.00 81.79 8.16 314.37 107.71 930.71 11.5711:00 836.00 99.88 8.30 319.42 105.71 1117.54 9.4612:00 882.00 108.72 8.56 322.87 105.20 1178.55 8.9313:00 892.00 105.56 8.22 323.84 104.96 1191.65 8.8114:00 800.00 85.12 7.39 320.30 106.48 1069.01 9.9615:00 676.00 83.97 8.63 316.04 107.93 903.54 11.9416:00 535.00 70.78 9.19 310.54 108.71 715.26 15.2017:00 400.00 53.76 9.33 305.97 108.38 534.90 20.26Average 8.5 12.18
Table 3. Variation of solar radiation, photovoltaic efficiency and exergy efficiency with time at no load for May month
Time Solar Power Photovoltaic Tcell Exergy Exergy Exergy(h) radiation output efficiency (°K) out in efficiency
(W m-2) (w) (%) (W m-2) (W m-2) (%)
9:00 624.40 75.48 8.39 314.45 103.97 834.57 12.4610:00 736.10 90.32 8.32 317.92 102.98 983.62 10.4711:00 856.90 94.90 7.69 324.48 101.22 1144.17 8.8512:00 906.50 101.20 7.57 328.74 100.25 1236.50 8.1113:00 911.90 104.36 7.95 329.11 100.47 1216.72 8.2614:00 827.60 89.14 7.48 326.03 101.95 1104.49 9.2315:00 688.50 88.02 8.88 320.95 103.56 919.10 11.2716:00 525.00 71.89 9.51 315.60 104.35 701.01 14.8917:00 406.50 59.34 10.14 308.98 104.02 543.19 19.15Average 8.46 11.41

943 W m-2 for may month. The avgerageexergy efficiency was found to be 13.02, 12.18and 11.11 per cent for March, April and Maymonth, respectively.
From figure 4 it was observed that theexergy of the radiation incident on the inclinedplane, i.e., the maximum electrical powerobtainable from the radiation, and the powersupplied by the photovoltaic modules. Thefigure showed the influence of the batterycharge controller on the efficiency of thephotovoltaic modules.
Table 4, 5 and 6 indicated variation of solar
radiation, photovoltaic efficiency and exergyefficiency with time at full load condition for theMarch, April and May Month.
Performance of photovoltaic system at noload and full load condition were carried out toassess its technical viability. This study indicatedthe necessity and usefulness of energetic andexergetic techniques to evaluate theperformance of the SPV refrigerator.The studyindicated that the full load condition does notaffect the PV system. The photovoltaic andexergy efficiency was found less due to themodule temperature hence exergy weredestroyed highly in PV.
Journal of Agriculture Research and Technology 117
Fig. 3. Variation of photovoltaic efficiency withrespect to solar radiation and tempera-ture for March month at full load
Fig. 4. Variation of Exergy efficiency withrespect to solar radiation and tempera-ture for March month at full load
Table 4. Variation of solar radiation, photovoltaic efficiency and exergy efficiency with time at full load for March month
Time Solar Power Photovoltaic Tcell Exergy Exergy Exergy(h) radiation output efficiency (°K) out in efficiency
(W m-2) (w) (%) (W m-2) (W m-2) (%)
9:00 532.00 79.19 10.34 303.72 105.36 712.48 14.7910:00 622.14 87.75 9.79 308.66 104.95 832.74 12.6011:00 692.00 92.20 9.25 312.59 104.36 925.80 11.2712:00 786.12 102.40 9.05 315.90 103.15 1051.49 9.8113:00 832.08 105.38 8.79 318.37 102.51 1112.71 9.2114:00 700.00 92.89 9.22 314.11 104.35 936.07 11.1515:00 636.00 89.25 9.75 311.00 104.85 850.92 12.3216:00 492.03 72.14 10.18 306.25 105.38 658.37 16.0117:00 376.00 61.31 11.32 301.83 105.03 503.31 20.87Average 9.74 13.02

References
Charters, W. W. S. and Oo, Y. L. 2003. Solar vaccinestorage units for remote areas.International Journal ofRefrigeration, Vol. 10, 301-30.
Eltawil and Samuel, D. V. K. 2007. Vapour compressioncooling system powered by solar PV array for potatostorage. Agricultural Engineering International , TheCIGR E Journal. Manuscript EE 06003, Vol. IX.
Eltawil, M. A. and Samuel, D. V. K. 2007. Performanceand economic evaluation of solar photovoltaicpowered cooling system for potato storage.Agricultural Engineering International the CIGR EJournal. Manuscript EE 07 008, Vol. IX.
Fatehmulla A., Al-sharmmani and Al-Bassam (2011).Design of energy efficient low power PVrefrigerator..http://ipac.kacst. edu.sa/eDoc/2011/
193687_1.pdf
Kattakayam, T. A., Srinivasan K. 1996. Thermalperformance characterization of a photovoltaic drivendomestic refrigerator. Int. J. Refrig. 2000; 23 : 190-196.
Sobamowo M. G., Ogunmola, B. Y., Ismail, S. O. andOgundeko, I. A. 2012. Design and Development of aPhotovoltaic-Powered DC Vapour CompressionRefrigerator with an Incorporated Solar TrackingSystem. Int. Jr. of Mechanical Computational andManufacturing Research, Vol.1.
Yilanci A., Cetin, E. and Ozturk, H. K. 2011.Experimental Performance Evaluation of a PV-Powered Refrigeration System.Electronics andElectrical Engineering. - Kaunas: Technologija, 8(114),7-10.
Kalbande and Deshmukh118
Table 5. Variation of solar radiation, photovoltaic efficiency and exergy efficiency with time at full load for April month
Time Solar Power Photovoltaic Tcell Exergy Exergy Exergy(h) radiation output efficiency (°K) out in efficiency
(W m-2) (w) (%) (W m-2) (W m-2) (%)
9:00 622.00 72.36 8.08 311.88 109.24 831.78 13.1310:00 700.00 82.67 8.20 315.39 108.54 935.83 11.6011:00 845.00 88.90 7.31 321.68 106.62 1129.11 9.4412:00 868.00 109.57 8.77 323.11 106.13 1159.51 9.1513:00 880.00 104.10 8.21 323.60 106.04 1175.58 9.0214:00 836.23 92.89 7.71 321.50 106.69 1117.28 9.5515:00 722.25 89.00 8.56 317.18 108.32 965.36 11.2216:00 543.80 71.37 9.11 311.98 109.51 726.91 15.0717:00 412.10 55.46 9.35 306.73 109.38 551.07 19.85Average 8.36 12.18
Table 6. Variation of solar radiation, photovoltaic efficiency and exergy efficiency with time at full load for May month
Time Solar Power Photovoltaic Tcell Exergy Exergy Exergy(h) radiation output efficiency (°K) out in efficiency
(W m-2) (w) (%) (W m-2) (W m-2) (%)
9:00 627.00 74.38 8.24 312.96 103.74 838.25 12.3810:00 737.90 87.24 8.21 321.14 102.76 985.28 10.4311:00 856.90 92.96 7.53 327.56 101.19 1143.34 8.8512:00 880.70 101.89 8.03 327.96 100.65 1175.08 8.5713:00 943.00 104.10 7.67 329.97 99.58 1258.22 7.9114:00 856.90 92.89 7.53 326.33 101.04 1143.61 8.8415:00 736.10 89.00 8.40 322.33 102.82 982.63 10.4616:00 543.80 65.02 8.30 315.17 104.05 726.30 14.3317:00 424.80 61.31 10.02 310.74 103.92 567.50 18.31Average 8.2 11.11
______________

Osmotic dehydration is one of the mostnovel methods used to remove water partiallyupto 50 per cent from materials such as fruitsand vegetables by immersing in aqueoussolutions of sugar or salt. It has potentialadvantages of less heat damage, goodblanching effect, less enzymatic browning,better retention of flavour, texture and energysaving because no phase change occur(Ponting et al. 1996). The kinetics ofdewatering and mass transfer properties duringosmotic dehydration process have beeninvestigated for banana (Pokahrkar and Prasad,1997), apple (Videv et al., 1990), pineapple(Parjoko et al., 1996) and onion (Sutar andGupta, 2007).
Sapota is an important tropical fruit andmainly valued for its sweet and delicious taste.It has high sugar content (20 %), in addition to
it vitamin A, B1, B2 and C (Ramchandra,2006). It is highly perishable in nature and itsloss can be minimized to some extent if the fruitis processed and stored. Therefore, the study ofmass transfer modelling during osmoticdehydration of sapota slices (Cv. Kallipatti)prior to drying was undertaken with anobjectives to evaluate the effect of osmoticdehydration process parameters on water lossand sugar gain as well as to develop suitablemathematical models for water loss and sugargain.
Materials and Methods
Investigation was conducted at theDepartment of Agricultural ProcessEngineering, Dr. Annasaheb Shinde College ofAgricultural Engineering, Mahatma Phule KrishiVidyapeeth, Rahuri during the year 2012-13.The firm, ripened sapota fruits were obtainedfrom an University Farm of Mahatma Phule
J. Agric. Res. Technol., 41 (1) : 119-124 (2016)
Mass Transfer Modelling During Osmotic Dehydration ofSapota Slices
M. S. Jadhav1 and C. A. Nimbalkar2
Department of Agricultural Process Engineering, Dr. Annasaheb Shinde College of Agricultural Engineeringand Post Graduate Institute, Mahatma Phule Krishi Vidyapeeth, Rahuri - 413 722 (India).
(Received : 02.05.2015)
AbstractThe sapota slices (Cv. Kalipatti) of 3 mm thickness were first osmotically dehydrated to find out the effect
of sugar concentrations (50, 60 and 70°B), solution temperatures (30, 40 and 50°C), fruit to solution ratio1:4 (w/v) for 14 hr osmosis time on water loss and sugar gain. Then slices were air dried in tray dryer at 70°Ctemperature to safe moisture level of 16 per cent (w.b.). Low temperature-low concentration (30°C-50°B)gave a low water loss of 35.02 per cent; high temperature-high concentration conditions (50°C-70°B) gavea higher water loss 48.81 per cent. In case of sugar gain also low temperature-low concentration (30°C-50°B)gave a low sugar gain 11.96 per cent and high temperature-high concentration conditions (50°C- 70°B) gavea higher sugar gain 13.75 per cent, after 14 hr of osmosis. It was found that the water loss and sugar gain,increased with increase of solution concentration and temperature. Among the various models tried, thelogarithmic model was found to be the best fit for water loss and solid gain. The developed models could beused in food industry for design and control processes and also models could be used to predict mass transferdata within the experimental limits.
Key words : Modelling, water loss, solid gain, sapota
1. and 2. Associate Professor.

Krishi Vidyapeeth, Rahuri. Fruits were washed,peeled and cut into 3 mm slices with stainlesssteel knife. The sapota slices (approx. 25 g)were dipped in glass beaker (250 ml)maintaining 1 : 4 (w/v) slices to sugar syrupratio and sugar concentrations of 50, 60 and70°B were used. The beakers were kept atdesired temperatures (30, 40 and 50°C) inconstant temperature recirculating water bath(Make Classic Mumbai), then for every 30 minupto 2 hr, then at an interval of 1 hr upto 6 hrand afterwards at every 2 hr upto 14 hr oneglass beaker was removed from water bath andsapota slices were immediately rinsed withwater and placed on tissue paper for 5 min toremove surface moisture. Slices were weighedand dried in vacuum oven at 70°C temperatureand maintaining vacuum of 85-100 mm Hg toconstant weight to determine moisture content(Ranganna, 2000). The experiments werereplicated thrice. The flow chart of theprocedure is as depicted in Fig. 1.
Water loss (WL) and solid gain (SG) werecalculated using following mass balanceequations (Lenart and Flink, 1984).
Water loss can be defined as net loss ofwater from the sapota slices at any time onintial weight basis.
Wi.Xi - Wθ.XθWL = ––––––––––––––––––––––– x 100
Wi
The soil gain is the net uptake of sugar bysapota slices on intial weight basis.
Wθ(1-Xθ) - Wi(1-Xi)SG = ––––––––––––––––––––––– x 100
Wi
where, WL = Water loss (g per 100 g massof sample), SG = Sugar gain (g per 100 g massof sample), Wθ = Mass of slices after time θ, g,Wi = Initial mass of slices, g, Xθ = Water
content as a fraction of mass of slices at time θ,and Xi = Water content as a fraction of initialmass of slices, fraction
Results and Discussion
Osmotic dehydration of sapota slices :Average initial moisture content of sapota slicesrecorded was 79.23 % (w.b.). Data of waterloss and sugar gain as influenced by varioussugar concentrations and temperatures ispresented in Table 1 and 2, respectively.
When sugar syrup temperature wasincreased from 30 to 40°C for 70°B syrupconcentration, water loss increased from 40.74to 44.66 per cent after 14 hr of osmoticdehydration causing approximately 3.92 percent point increase, however further increase insyrup temperature to 50°C, the water loss was48.81 per cent showing 4.15 per cent pointincrease (Table 1). Similarly for 60°B syrupconcentration, the water loss was increasedfrom 38.16 to 42.78 per cent when syrup
Jadhav and Nimbalkar120
Mature ripened sapota fruits
Washing
Peeling
Cutting into slices of 3 mm thickness
Osmotic dehydration of slices in 50, 60 and700B sugar solution at 1 : 4 ratio at 30, 40
and 50°C
Tray drying at 70°C after 14 hr osmosis at 1m sec-1 air velocity to16 % w.b. final moisture
content.
Packaging and storage
Fig. 1. Process flow chart for osmoticdehydration of sapota slices
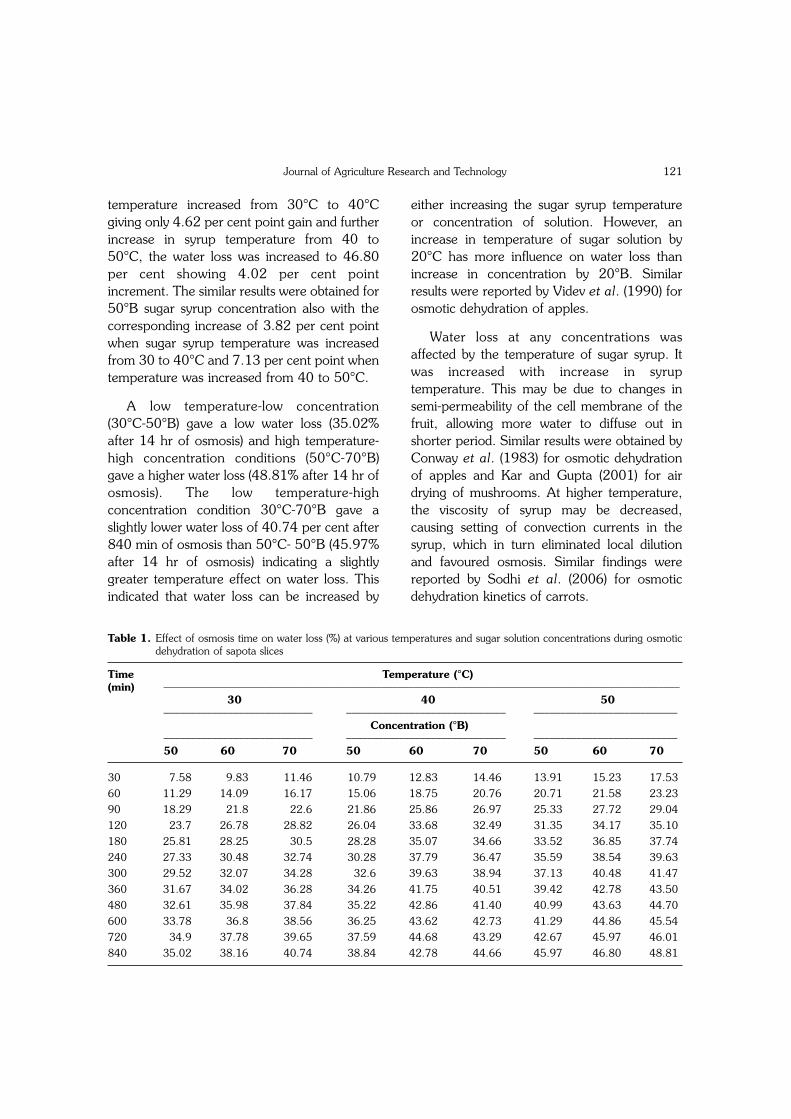
temperature increased from 30°C to 40°Cgiving only 4.62 per cent point gain and furtherincrease in syrup temperature from 40 to50°C, the water loss was increased to 46.80per cent showing 4.02 per cent pointincrement. The similar results were obtained for50°B sugar syrup concentration also with thecorresponding increase of 3.82 per cent pointwhen sugar syrup temperature was increasedfrom 30 to 40°C and 7.13 per cent point whentemperature was increased from 40 to 50°C.
A low temperature-low concentration(30°C-50°B) gave a low water loss (35.02%after 14 hr of osmosis) and high temperature-high concentration conditions (50°C-70°B)gave a higher water loss (48.81% after 14 hr ofosmosis). The low temperature-highconcentration condition 30°C-70°B gave aslightly lower water loss of 40.74 per cent after840 min of osmosis than 50°C- 50°B (45.97%after 14 hr of osmosis) indicating a slightlygreater temperature effect on water loss. Thisindicated that water loss can be increased by
either increasing the sugar syrup temperatureor concentration of solution. However, anincrease in temperature of sugar solution by20°C has more influence on water loss thanincrease in concentration by 20°B. Similarresults were reported by Videv et al. (1990) forosmotic dehydration of apples.
Water loss at any concentrations wasaffected by the temperature of sugar syrup. Itwas increased with increase in syruptemperature. This may be due to changes insemi-permeability of the cell membrane of thefruit, allowing more water to diffuse out inshorter period. Similar results were obtained byConway et al. (1983) for osmotic dehydrationof apples and Kar and Gupta (2001) for airdrying of mushrooms. At higher temperature,the viscosity of syrup may be decreased,causing setting of convection currents in thesyrup, which in turn eliminated local dilutionand favoured osmosis. Similar findings werereported by Sodhi et al. (2006) for osmoticdehydration kinetics of carrots.
Journal of Agriculture Research and Technology 121
Table 1. Effect of osmosis time on water loss (%) at various temperatures and sugar solution concentrations during osmoticdehydration of sapota slices
Time Temperature (°C)(min) –––––––––––––––––––––––––––––––––––––––––––––––––––––––––––––––––––––––––––––––––––––––––––––––––
30 40 50–––––––––––––––––––––––––––– –––––––––––––––––––––––––––––– –––––––––––––––––––––––––––
Concentration (°B)–––––––––––––––––––––––––––– –––––––––––––––––––––––––––––– –––––––––––––––––––––––––––50 60 70 50 60 70 50 60 70
30 7.58 9.83 11.46 10.79 12.83 14.46 13.91 15.23 17.5360 11.29 14.09 16.17 15.06 18.75 20.76 20.71 21.58 23.2390 18.29 21.8 22.6 21.86 25.86 26.97 25.33 27.72 29.04120 23.7 26.78 28.82 26.04 33.68 32.49 31.35 34.17 35.10180 25.81 28.25 30.5 28.28 35.07 34.66 33.52 36.85 37.74240 27.33 30.48 32.74 30.28 37.79 36.47 35.59 38.54 39.63300 29.52 32.07 34.28 32.6 39.63 38.94 37.13 40.48 41.47360 31.67 34.02 36.28 34.26 41.75 40.51 39.42 42.78 43.50480 32.61 35.98 37.84 35.22 42.86 41.40 40.99 43.63 44.70600 33.78 36.8 38.56 36.25 43.62 42.73 41.29 44.86 45.54720 34.9 37.78 39.65 37.59 44.68 43.29 42.67 45.97 46.01840 35.02 38.16 40.74 38.84 42.78 44.66 45.97 46.80 48.81

When sugar syrup temperature is increasedfrom 30 to 40°C for 70°B sugar syrupconcentration, sugar gain increased from12.13 to 12.55 per cent causing approxi-mately 0.42 per cent point increase after 14 hrof osmosis, however, further increase in syruptemperature to 50°C, the sugar gain was 13.57per cent showing 1.02 per cent increment inthe same period of osmosis (Table 2). Similarly,for 60°B syrup concentration, the sugar gainincreased from 12.03 to 12.27 per cent whensyrup temperature increased from 30 to 40°Cgiving only 0.24 per cent point gain and furtherincrease in syrup temperature from 40 to50°C, the sugar gain was increased to 12.77per cent showing 0.5 per cent point increment.The similar results were obtained for 50°Bsugar syrup concentration also with thecorresponding increase of 0.28 point whensugar syrup temperature was increased from 30to 40°C and 0.34 per cent point whentemperature was increased from 40 to 50°C.
A low temperature-low concentration
(30°C-50°B), a low sugar gain (11.96 % after14 hr of osmosis) was observed and at hightemperature-high concentration conditions(50°C-70°B) a higher sugar gain of 13.57 percent after 14 hr of osmosis was noticed. Thelow temperature-high concentration condition30°C-70°B gave a slightly lower sugar gain of12.13 per cent after 840 min of osmosis than50°C-50°B (12.58% after 14 hr of osmosis)indicating a slightly greater temperature effecton sugar gain. This indicates that sugar gaincan be increased by either increasing the sugarsyrup temperature or concentration of solution.However, an increase in temperature of sugarsolution by 20°C has more influence on sugargain than increase in concentration by 20°B.Similar results were obtained by Videv et al.(1990) for osmotic dehydration of apples.
Modelling and validation of water lossand sugar gain : The linear, quadratic andlogarithmic models were developed byregression analysis by plotting the per centwater loss as well as sugar gain against the time
Jadhav and Nimbalkar122
Table 2. Effect of osmosis time on sugar gain (%) at various temperatures and sugar solution concentrations during osmoticdehydration of sapota slices
Time Temperature (°C)(min) –––––––––––––––––––––––––––––––––––––––––––––––––––––––––––––––––––––––––––––––––––––––––––––––––
30 40 50–––––––––––––––––––––––––––– –––––––––––––––––––––––––––––– –––––––––––––––––––––––––––
Concentration (°B)–––––––––––––––––––––––––––– –––––––––––––––––––––––––––––– –––––––––––––––––––––––––––50 60 70 50 60 70 50 60 70
30 2.77 2.88 3.00 2.99 3.11 3.87 3.87 4.93 5.4960 3.58 3.35 3.33 4.2 3.75 3.98 4.34 6.38 7.2090 4.36 3.57 3.62 5.3 4.89 4.63 4.98 6.92 7.57120 4.91 4.96 4.95 6.00 6.73 6.05 5.90 7.55 8.13180 6.77 6.33 6.89 7.01 7.26 6.91 7.49 9.00 9.49240 7.63 7.76 7.17 8.00 8.62 7.48 8.89 9.46 9.87300 8.58 9.22 9.01 8.37 9.88 8.09 9.10 10.83 10.81360 9.26 10.22 9.57 9.88 10.47 9.43 10.15 11.21 11.16480 10.11 10.75 10.33 10.71 11.18 10.58 10.8 11.59 11.57600 11.33 11.41 11.28 11.83 11.68 11.54 11.46 11.79 11.80720 11.63 12.05 11.84 11.97 12.07 11.9 12.2 12.08 12.02840 11.96 12.03 12.13 12.24 12.27 12.55 12.58 12.77 13.57
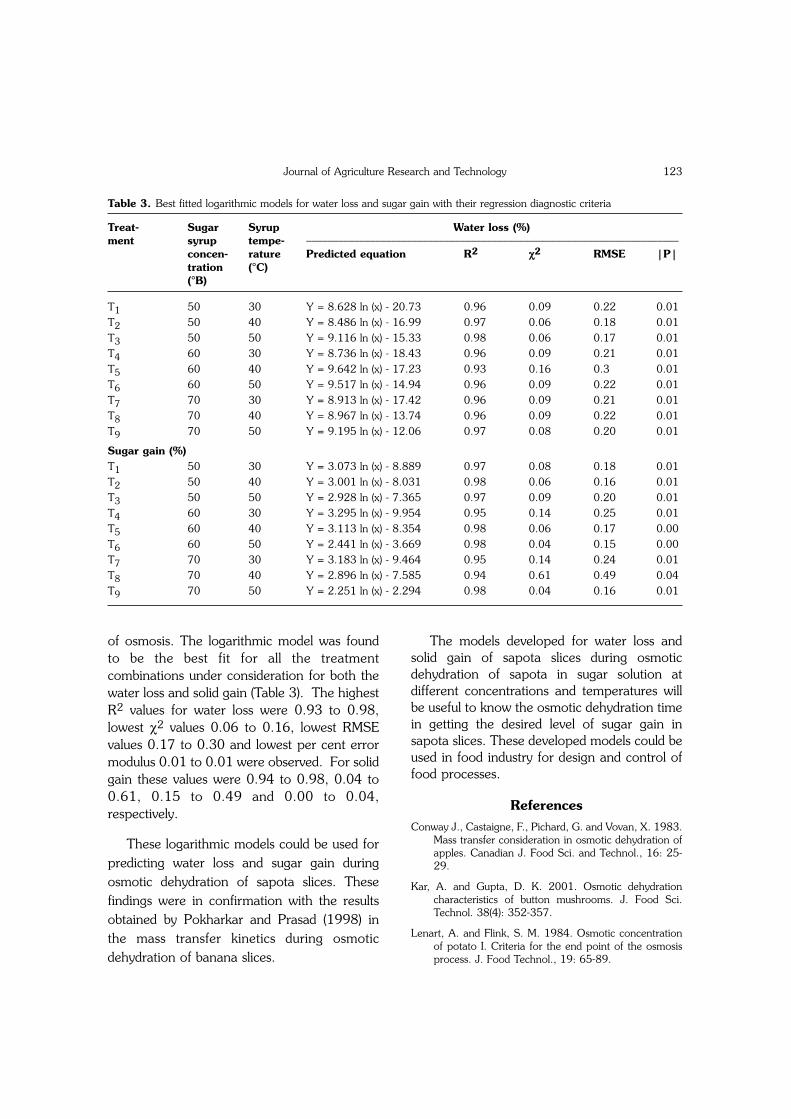
of osmosis. The logarithmic model was foundto be the best fit for all the treatmentcombinations under consideration for both thewater loss and solid gain (Table 3). The highestR2 values for water loss were 0.93 to 0.98,lowest χ2 values 0.06 to 0.16, lowest RMSEvalues 0.17 to 0.30 and lowest per cent errormodulus 0.01 to 0.01 were observed. For solidgain these values were 0.94 to 0.98, 0.04 to0.61, 0.15 to 0.49 and 0.00 to 0.04,respectively.
These logarithmic models could be used forpredicting water loss and sugar gain duringosmotic dehydration of sapota slices. Thesefindings were in confirmation with the resultsobtained by Pokharkar and Prasad (1998) inthe mass transfer kinetics during osmoticdehydration of banana slices.
The models developed for water loss andsolid gain of sapota slices during osmoticdehydration of sapota in sugar solution atdifferent concentrations and temperatures willbe useful to know the osmotic dehydration timein getting the desired level of sugar gain insapota slices. These developed models could beused in food industry for design and control offood processes.
ReferencesConway J., Castaigne, F., Pichard, G. and Vovan, X. 1983.
Mass transfer consideration in osmotic dehydration ofapples. Canadian J. Food Sci. and Technol., 16: 25-29.
Kar, A. and Gupta, D. K. 2001. Osmotic dehydrationcharacteristics of button mushrooms. J. Food Sci.Technol. 38(4): 352-357.
Lenart, A. and Flink, S. M. 1984. Osmotic concentrationof potato I. Criteria for the end point of the osmosisprocess. J. Food Technol., 19: 65-89.
Journal of Agriculture Research and Technology 123
Table 3. Best fitted logarithmic models for water loss and sugar gain with their regression diagnostic criteria
Treat- Sugar Syrup Water loss (%)ment syrup tempe- ––––––––––––––––––––––––––––––––––––––––––––––––––––––––––––––––––––––
concen- rature Predicted equation R2 χ2 RMSE |P|tration (°C)(°B)
T1 50 30 Y = 8.628 ln (x) - 20.73 0.96 0.09 0.22 0.01T2 50 40 Y = 8.486 ln (x) - 16.99 0.97 0.06 0.18 0.01T3 50 50 Y = 9.116 ln (x) - 15.33 0.98 0.06 0.17 0.01T4 60 30 Y = 8.736 ln (x) - 18.43 0.96 0.09 0.21 0.01T5 60 40 Y = 9.642 ln (x) - 17.23 0.93 0.16 0.3 0.01T6 60 50 Y = 9.517 ln (x) - 14.94 0.96 0.09 0.22 0.01T7 70 30 Y = 8.913 ln (x) - 17.42 0.96 0.09 0.21 0.01T8 70 40 Y = 8.967 ln (x) - 13.74 0.96 0.09 0.22 0.01T9 70 50 Y = 9.195 ln (x) - 12.06 0.97 0.08 0.20 0.01
Sugar gain (%)T1 50 30 Y = 3.073 ln (x) - 8.889 0.97 0.08 0.18 0.01T2 50 40 Y = 3.001 ln (x) - 8.031 0.98 0.06 0.16 0.01T3 50 50 Y = 2.928 ln (x) - 7.365 0.97 0.09 0.20 0.01T4 60 30 Y = 3.295 ln (x) - 9.954 0.95 0.14 0.25 0.01T5 60 40 Y = 3.113 ln (x) - 8.354 0.98 0.06 0.17 0.00T6 60 50 Y = 2.441 ln (x) - 3.669 0.98 0.04 0.15 0.00T7 70 30 Y = 3.183 ln (x) - 9.464 0.95 0.14 0.24 0.01T8 70 40 Y = 2.896 ln (x) - 7.585 0.94 0.61 0.49 0.04T9 70 50 Y = 2.251 ln (x) - 2.294 0.98 0.04 0.16 0.01

Parjoko, M., Rahman, S., Buckle, K. A. and Perera, C.1996. Osmotic dehydration kinetics of pineapplewedges using palm sugar. Int. J. Food Sci. Technol.,29: 452-459.
Pokharkar, S. M. and Prasad, S. 1997. A model forosmotic concentration of banana slices. J. Food Sci.Technol., 34(3): 230-232.
Pokharkar, S. M. and Prasad, S. 1998. Mass transferduring osmotic dehydration of banana slices. J. FoodSci. Technol., 30 (4): 336-38.
Ponting, J. D., Watters, G. G., Forrey, R. R., Jackson R.and Stanley, W.L. 1996. Osmatic dehydration offruits. Food Technology., 20: 125-128.
Ramchandra, V. A. 2006. Production and marketing ofsapota in Northern Karnataka-an economics analysis.
M.Sc. (Argi.) thesis, University of AgriculturalSciences, Dharwad.
Ranganna. S. 2000. Handbook of analysis and qualitycontrol for fruits and vegetable products, Tata McGrawHill Publishing Co. Ltd., New Delhi.
Sodhi, N. S., Singh, N. and Komal. 2006. Osmoticdehydration kinetics of carrots. J. Food Sci. Technol.,43(4): 374-376.
Sutar, P. P. and Gupta, D. K. 2007. Mathematicalmodeling of mass transfer in osmotic dehydration ofonion slices. J. Food Eng., 78(1): 90-97.
Videv, K., Tanchev, T., Sharma, R. C. and Joshi, V. K.1990. Effect of sugar syrup concentration andtemperature on the rate of osmotic dehydration ofapples. J. Food Sci. Technol., 27(5): 307-308.
Jadhav and Nimbalkar124
J. Agric. Res. Technol., 41 (1) : 124-132 (2016)
Effect of Sire on Grwoth Performace of Sangamneri GoatsUnder Field Condition
B. S. Patil1, S. T. Pachpute2, S. A. Dhage3 and S. H. Mane4
Department of Animal Husbandry and Dairy science, Mahatma Phule Krishi Vidyapeeth, Rahuri - 413 722 (India)
(Received : 31-12-2014)
AbstractThe field data pertaining to body weights and body measurements at 1,3,6,9 and 12 months of age of
Sangamneri goats was collected for the year 2004-2007 from the breeding tract and was analyzed by leastsquare technique. Least squares means for body weight, Chest girth, Body length and wither height of kidsof Sangamneri goats at 1, 3, 6, 9 and 12 months of age were 5.09±0.03, 9.18±0.05, 14.05±0.12,19.10±0.26 and 22.38±0.36 kg, 39.18±0.12, 48.18±0.13, 55.51±0.22, 61.05 ±0.39 and 65.52±0.53cm, 35.24±0.10, 42.55±0.10, 48.99±0.21, 55.16±0.37 and 57.82±0.47 cm, 40.27±0.12, 48.59±0.12,55.71±0.26, 62.34±0.45 and 65.67±0.50 cm, respectively. Effect due to sire was highly significant(P<0.01) for body weight and body measurements at 1, 3, 6, 9 and 12 months of age. The phenotypiccorrelation among body weight and body measurements was positive and highly significant. Regressioncoefficient was positive and highly significant for body weight and body measurements except in case ofwither height at 9 and 12 months of age. The regression equation could be effectively used for prediction ofbody weight from body measurements.
Key words : Sangamneri goat, sire, growth.
______________
Goat is an important species of livestock inIndian rural economy, especially in the arid and
semiarid regions. The goats with its multipleutility combined with its docile, intelligent,frugal and hardy nature coupled with highdisease resistance, perhaps contributed much
1. M.Sc.(Agri.) student, 2. Associate Professor, 3. and4. Assistant Professor.

to its earliest domestication. On the basis ofarcheological evidence, it is believed that goatwas the earliest ruminant and probably the firstanimal after dog to be domesticated by man. Itis small sized ruminant economicallymaintained for meat, milk, fiber, skin, gut andmanure production. Goats have ability to getquickly acclimatized under diversified agroclimatic conditions, unfastidious type inchoosing of available forage, high fertility, shortgeneration interval and practically no religiousrestriction for goats and its products amongpeople.
Economically goat is suited for landlesslaborers, marginal farmers, village artisans andpeople who are below the poverty line by itslow cost maintenance, short term returns oncapital with low risk capital investment andthus, they have been described as 'Poor man'scow' all over the world. Goats mostly rearedunder extensive and semi-extensive system ofmanagement. But due to rapid decrease innatural pastures, it is essential to assess thegrowth rate of kids under feed lot conditions.
Prediction of body weight from bodymeasurements has not been studied inspite ofits importance under field conditions whereweighing facilities are not available. The kidsreared under semi-intensive feeding system hadlower growth rate as compared to kids rearedunder stall feeding. Body measurements areindicative of body size and weight and as suchthe live body weight and carcass weight can bepredicted from body measurements. Thisinformation is much valuable in field conditionwhere weighing facilities are not available. Thedifferent body measurements viz., body length,chest girth and wither height are mostimportant for prediction of body weight.
There are number of factors which are likelyto affect the growth. The knowledge of suchfactors is essential in planning suitable
managemental practices to overcome thedetrimental, environmental effects to someextent.
Materials and Methods
The present study was undertaken in thebreeding tract of Sangamneri goats under fieldcondition through All India coordinatedresearch project on goats (Sangamneri fieldunits) MPKV, Rahuri (M.S.) during the year2004-2007.
The necessary data regarding breeding ofdoes, monthly body weights and bodymeasurements were recorded for the animalswhich were generated through breeding buckssupplied to the goat farmers through AICRP ongoats. The goats were maintained on grazingland, harvested field and hillocks for about 6-8hrs a day. Jowar kadabi, groundnut leaves, fedbhusa of different pulses and dry grasses togoats. The green fodder viz., Lucerne andmaize was also fed to the animals as peravailability. Top feeds viz., Acacia spp. Ber,shevari, Neem were fed during summer andscarcity period.
The data was analysed by least squareanalysis method suggested by Harvey (1990)and the data was corrected for significant effectof non genetic factors as per methodssuggested by, Gacula et al. (1968). Thecorrected data was used for estimation of sireeffect, correlation and regression analysis.
The sire effect was estimated by using themathematical model,
Yij = µ + Si + eij
Where, µ = Population mean, Si = Effect ofith sire (i = 1 to n), eij = random error associatedwith NID about (0, σ2 e )
In order to find out relationship of bodymeasurements and body weights, the
Journal of Agriculture Research and Technology 125

Karl Pearsons coefficient of correlation wasworked out. The body weights at different ageswere predicted from body measurements bymultiple regressions.
Results and Discussion
Growth is first indicator of the futurepotential of goat. Evaluation of growth wouldhelp to determine genetic potential of goatsunder field condition for their furtherimprovement.
Body weight and body measurementsat 1 month of age : The least squares meansfor body weight and measurement at the age ofone month are presented in Table 1. Theoverall mean for body weight at one month ofage was obtained as 5.09±0.03 kg andrespective mean for chest girth, body lengthand wither height were 39.18±0.12,35.24±0.10 and 40.27±0.12 cm .
Effect of sire : Differences associated withsire for 1 month of body weight and bodymeasurement were highly significant (Table1).The least squares means for body weightranged from 4.30±0.11 (sire No.11) to5.52±0.62 kg (sire No21). The least squaresmeans for chest girth ranged from 35.78±0.03(sire No.6) to 41.31±.51 cm (sire No.4). In caseof body length it was ranged from 34.34±0.30(sire No.18) to 36.84±0.35 cm (sire No.8).However wither height was ranged from37.78±0.39 (sire No.12) to 41.03±0.43 (sireNo.8). Higher values were reported byAnonymous (2006) for 1 month of bodyweight.
Body weight and body measurementsat 3 months of age : The least squaresmeans for body weight and body measurementsat the 3 months are presented in Table1.Overall mean of body weight at 3 months ofage was obtained as 9.18 ± 0.05 kg andrespective mean for chest girth, body length
and wither height were 48.18 ± 0.013, 42.55± 0.10, and 48.59 ± 0.12 cm, respectively(Table 1). Similar values were reported by Royet al. (2003) in Jamunapari, Rana andGodara (1991) in Beetal, Mittal (1993) inBarbari and Ganesh Kumar et al. (2005) inTellicherry goats.
Effect of sire : Three months body weightand body measurements were significantly(P<0.01) affected by sire (Table 1). The leastsquares means for body weight ranged from7.85 ± 0.26 (sire no.11) to 9.88 ± 0.15 kg(sire no.1). The least squares means for chestgirth ranged from 44.11 ± 0.67 (sire No.11) to51.00 ± 0.38 cm (sire No.1). In case of bodylength the range for measurements was 39.54± 0.40 (sire No. 6) to 44.83 ± 0.73 cm (sireNo. 5). Values for wither height were rangedfrom 44.95 ± 0.67 (sire No.11) to 51.00 ±0.84 cm (sire No.5). Anonymous (2006)studied sire wise growth performance andreported similar values for body weight at 3months of age. However, significant effect ofsire was reported by Anonymous (2007).
Body weight and body measurementsat 6 months of age : The least squaresmeans for body weight and body measurementsat the age of 6 months are presented in Table2. Overall mean body weight at 6 months ofage was 14.05 ± 0.12 kg. The least squaresmeans for chest girth, body length and witherheight were 55.51 ± 0.22, 48.99 ± 0.21, and55.71 ± 0.26 cm respectively. Similar bodyweights were reported by Rai et al. (2004) inMarwari goats (14.94 ±0.21) and Anonymous(1999) in Osmanabadi goats (14.16 ± 0.01),Comparatively higher body weighs at 6 monthsof age were reported by Pander et al. (1989) inBeetal (15.30 ± 0.60), Rai et al. (2003) inJakhrana (16.47 ± 0.49kg) and Tomar et al.(2004) in Sirohi (15.33 ± 0.50kg). Whereas,lower body weights in Black Bengal goats werereported by Malik et al. (1993), Husain et al.
Patil et al.126
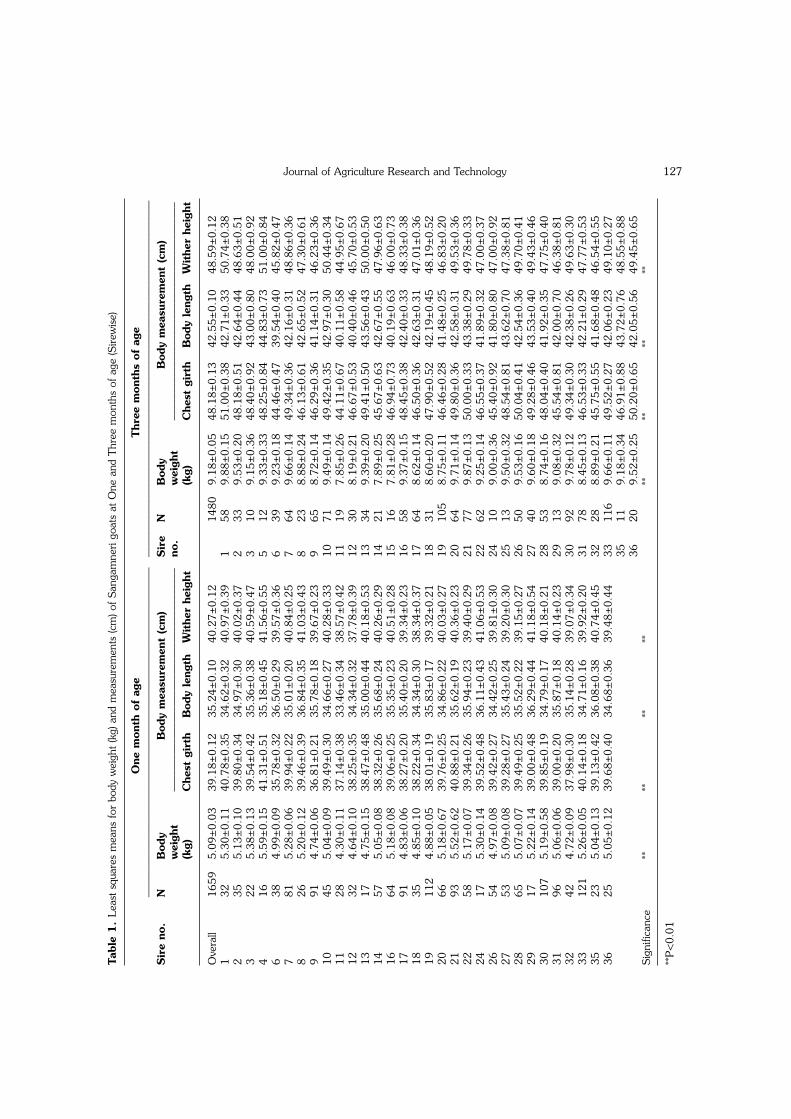
Journal of Agriculture Research and Technology 127
Tabl
e 1.
Leas
t sq
uare
s m
eans
for
bod
y w
eigh
t (k
g) a
nd m
easu
rem
ents
(cm
) of
Sang
amne
ri go
ats
at O
ne a
nd T
hree
mon
ths
of a
ge (S
irew
ise)
One
mon
th o
f ag
eThr
ee m
onth
s of
age
––––
––––
––––
––––
––––
––––
––––
––––
––––
––––
––––
––––
––––
––––
––––
––––
––––
––––
––––
––––
––––
––––
––––
––––
––––
––––
––––
––––
––––
––––
––––
––––
–Sir
e no
.N
Bod
yB
ody
mea
sure
men
t (c
m)
Sir
eN
Bod
yB
ody
mea
sure
men
t (c
m)
wei
ght
––––
––––
––––
––––
––––
––––
––––
––––
––––
––––
––no
.w
eigh
t––
––––
––––
––––
––––
––––
––––
––––
––––
––––
–––
(kg)
Che
st g
irth
Bod
y le
ngth
Withe
r he
ight
(kg)
Che
st g
irth
Bod
y le
ngth
Withe
r he
ight
Ove
rall
1659
5.09
±0.
0339
.18±
0.12
35.2
4±0.
1040
.27±
0.12
1480
9.18
±0.
0548
.18±
0.13
42.5
5±0.
1048
.59±
0.12
132
5.30
±0.
1140
.78±
0.35
34.6
2±0.
3240
.97±
0.39
158
9.88
±0.
1551
.00±
0.38
42.7
1±0.
3350
.74±
0.38
235
5.13
±0.
1039
.80±
0.34
34.9
7±0.
3040
.02±
0.37
233
9.53
±0.
2048
.18±
0.51
42.6
4±0.
4448
.63±
0.51
322
5.38
±0.
1339
.54±
0.42
35.3
6±0.
3840
.59±
0.47
310
9.15
±0.
3648
.40±
0.92
43.0
0±0.
8048
.00±
0.92
416
5.59
±0.
1541
.31±
0.51
35.1
8±0.
4541
.56±
0.55
512
9.33
±0.
3348
.25±
0.84
44.8
3±0.
7351
.00±
0.84
638
4.99
±0.
0935
.78±
0.32
36.5
0±0.
2939
.57±
0.36
639
9.23
±0.
1844
.46±
0.47
39.5
4±0.
4045
.82±
0.47
781
5.28
±0.
0639
.94±
0.22
35.0
1±0.
2040
.84±
0.25
764
9.66
±0.
1449
.34±
0.36
42.1
6±0.
3148
.86±
0.36
826
5.20
±0.
1239
.46±
0.39
36.8
4±0.
3541
.03±
0.43
823
8.88
±0.
2446
.13±
0.61
42.6
5±0.
5247
.30±
0.61
991
4.74
±0.
0636
.81±
0.21
35.7
8±0.
1839
.67±
0.23
965
8.72
±0.
1446
.29±
0.36
41.1
4±0.
3146
.23±
0.36
1045
5.04
±0.
0939
.49±
0.30
34.6
6±0.
2740
.28±
0.33
1071
9.49
±0.
1449
.42±
0.35
42.9
7±0.
3050
.44±
0.34
1128
4.30
±0.
1137
.14±
0.38
33.4
6±0.
3438
.57±
0.42
1119
7.85
±0.
2644
.11±
0.67
40.1
1±0.
5844
.95±
0.67
1232
4.64
±0.
1038
.25±
0.35
34.3
4±0.
3237
.78±
0.39
1230
8.19
±0.
2146
.67±
0.53
40.4
0±0.
4645
.70±
0.53
1317
4.75
±0.
1538
.47±
0.48
35.0
0±0.
4440
.18±
0.53
1334
9.39
±0.
2049
.41±
0.50
43.5
6±0.
4350
.00±
0.50
1457
5.05
±0.
0838
.32±
0.26
35.6
8±0.
2440
.26±
0.29
1421
7.89
±0.
2545
.67±
0.63
42.6
7±0.
5547
.96±
0.63
1664
5.18
±0.
0839
.06±
0.25
35.3
5±0.
2340
.51±
0.28
1516
7.81
±0.
2846
.94±
0.73
40.1
9±0.
6346
.00±
0.73
1791
4.83
±0.
0638
.27±
0.20
35.4
0±0.
2039
.34±
0.23
1658
9.37
±0.
1548
.45±
0.38
42.4
0±0.
3348
.33±
0.38
1835
4.85
±0.
1038
.22±
0.34
34.3
4±0.
3038
.34±
0.37
1764
8.62
±0.
1446
.50±
0.36
42.6
3±0.
3147
.01±
0.36
1911
24.
88±
0.05
38.0
1±0.
1935
.83±
0.17
39.3
2±0.
2118
318.
60±
0.20
47.9
0±0.
5242
.19±
0.45
48.1
9±0.
5220
665.
18±
0.67
39.7
6±0.
2534
.86±
0.22
40.0
3±0.
2719
105
8.75
±0.
1146
.46±
0.28
41.4
8±0.
2546
.83±
0.20
2193
5.52
±0.
6240
.88±
0.21
35.6
2±0.
1940
.36±
0.23
2064
9.71
±0.
1449
.80±
0.36
42.5
8±0.
3149
.53±
0.36
2258
5.17
±0.
0739
.34±
0.26
35.9
4±0.
2339
.40±
0.29
2177
9.87
±0.
1350
.00±
0.33
43.3
8±0.
2949
.78±
0.33
2417
5.30
±0.
1439
.52±
0.48
36.1
1±0.
4341
.06±
0.53
2262
9.25
±0.
1446
.55±
0.37
41.8
9±0.
3247
.00±
0.37
2654
4.97
±0.
0839
.42±
0.27
34.4
2±0.
2539
.81±
0.30
2410
9.00
±0.
3645
.40±
0.92
41.8
0±0.
8047
.00±
0.92
2753
5.09
±0.
0839
.28±
0.27
35.4
3±0.
2439
.20±
0.30
2513
9.50
±0.
3248
.54±
0.81
43.6
2±0.
7047
.38±
0.81
2865
5.07
±0.
0739
.49±
0.25
35.5
2±0.
2239
.15±
0.27
2650
9.53
±0.
1650
.04±
0.41
42.5
4±0.
3649
.70±
0.41
2917
5.22
±0.
1439
.00±
0.48
36.2
9±0.
4441
.18±
0.54
2740
9.60
±0.
1849
.28±
0.46
43.5
3±0.
4049
.43±
0.46
3010
75.
19±
0.58
39.8
5±0.
1934
.79±
0.17
40.1
8±0.
2128
538.
74±
0.16
48.0
4±0.
4041
.92±
0.35
47.7
5±0.
4031
965.
06±
0.06
39.0
0±0.
2035
.87±
0.18
40.1
4±0.
2329
139.
08±
0.32
45.5
4±0.
8142
.00±
0.70
46.3
8±0.
8132
424.
72±
0.09
37.9
8±0.
3035
.14±
0.28
39.0
7±0.
3430
929.
78±
0.12
49.3
4±0.
3042
.38±
0.26
49.6
3±0.
3033
121
5.26
±0.
0540
.14±
0.18
34.7
1±0.
1639
.92±
0.20
3178
8.45
±0.
1346
.53±
0.33
42.2
1±0.
2947
.77±
0.53
3523
5.04
±0.
1339
.13±
0.42
36.0
8±0.
3840
.74±
0.45
3228
8.89
±0.
2145
.75±
0.55
41.6
8±0.
4846
.54±
0.55
3625
5.05
±0.
1239
.68±
0.40
34.6
8±0.
3639
.48±
0.44
3311
69.
66±
0.11
49.5
2±0.
2742
.06±
0.23
49.1
0±0.
2735
119.
18±
0.34
46.9
1±0.
8843
.72±
0.76
48.5
5±0.
8836
209.
52±
0.25
50.2
0±0.
6542
.05±
0.56
49.4
5±0.
65Si
gnifi
canc
e**
****
****
****
**
**P
<0.
01

Patil et al.128
Tabl
e 2.
Leas
t sq
uare
s m
eans
for
bod
y w
eigh
t (k
g) a
nd m
easu
rem
ents
(cm
) of
Sang
amne
ri go
ats
at S
ix a
nd N
ine
mon
ths
of a
ge (S
irew
ise)
Six
mon
ths
of a
geN
ine
mon
ths
of a
ge––
––––
––––
––––
––––
––––
––––
––––
––––
––––
––––
––––
––––
––––
––––
––––
––––
––––
––––
––––
––––
––––
––––
––––
––––
––––
––––
––––
––––
––––
––––
––––
––Sir
e no
.N
Bod
yB
ody
mea
sure
men
t (c
m)
Sir
eN
Bod
yB
ody
mea
sure
men
t (c
m)
wei
ght
––––
––––
––––
––––
––––
––––
––––
––––
––––
––––
––no
.w
eigh
t––
––––
––––
––––
––––
––––
––––
––––
––––
––––
–––
(kg)
Che
st g
irth
Bod
y le
ngth
Withe
r he
ight
(kg)
CC
hest
gir
thB
ody
leng
thW
ithe
r he
ight
Ove
rall
362
14.0
5±0.
1255
.51±
0.22
48.9
9±0.
2155
.71±
0.26
223
19.1
0±0.
2661
.05±
0.39
55.1
6±0.
3762
.34±
0.45
122
14.5
4±0.
3257
.14±
0.62
48.0
0±0.
5857
.50±
0.72
115
19.5
2±0.
4863
.33±
0.75
53.0
0±0.
7563
.27±
0.83
621
14.1
9±0.
3354
.38±
0.64
49.0
0±0.
5954
.33±
0.73
620
16.8
4±0.
4258
.35±
0.65
51.7
5±0.
6560
.85±
0.71
926
13.1
3±0.
3052
.62±
0.57
47.1
5±0.
5354
.96±
0.66
922
17.4
3±0.
4060
.61±
0.62
53.4
5±0.
6264
.05±
0.68
1013
13.6
4±0.
4256
.00±
0.81
47.3
0±0.
7555
.23±
0.93
1011
17.3
9±0.
5760
.55±
0.88
51.9
1±0.
8760
.45±
0.96
1110
11.4
3±0.
4852
.00±
0.92
45.4
0±0.
8652
.90±
1.06
1110
17.2
6±0.
5958
.70±
0.92
53.1
0±0.
9160
.20±
1.01
1217
13.6
6±0.
3755
.35±
0.71
48.2
9±0.
6654
.65±
0.81
1313
19.0
6±0.
5262
.15±
0.81
53.6
2±0.
8062
.54±
0.89
1414
13.5
6±0.
4153
.86±
0.78
49.3
6±0.
7355
.57±
0.90
1410
17.2
1±0.
5958
.00±
0.92
53.0
0±0.
9261
.70±
1.01
1613
14.0
3±0.
4254
.15±
0.81
48.1
5±0.
7556
.38±
0.93
1610
19.0
5±0.
5959
.80±
0.92
53.2
0±0.
9262
.00±
1.01
1759
13.2
7±0.
2053
.69±
0.38
48.3
2±0.
3553
.31±
0.44
1713
17.3
8±0.
5258
.31±
0.81
53.6
9±0.
8058
.69±
0.89
1815
14.0
3±0.
3956
.13±
0.75
49.4
7±0.
7656
.33±
0.87
1816
18.3
0±0.
4760
.19±
0.73
53.6
9±0.
7260
.94±
0.80
1924
13.5
5±0.
3155
.33±
0.60
48.5
8±0.
5655
.79±
0.69
1920
18.7
3±0.
4261
.55±
0.65
53.8
0±0.
6562
.25±
0.96
2010
13.8
1±0.
4856
.90±
0.92
46.9
0±0.
8656
.70±
1.06
2011
18.5
0±0.
5761
.73±
0.88
51.7
3±0.
9161
.81±
0.96
2115
14.7
6±0.
3956
.53±
0.75
49.2
0±0.
7055
.20±
0.87
2110
19.7
0±0.
5961
.30±
0.92
54.4
0±0.
9261
.10±
1.01
2210
14.1
8±0.
4854
.80±
0.92
50.8
0±0.
8654
.80±
1.06
3116
17.8
4±0.
4759
.56±
0.72
53.3
1±0.
7262
.38±
0.80
2510
13.2
2±0.
4854
.60±
0.92
47.9
0±0.
8657
.90±
1.06
3211
17.7
8±0.
5759
.64±
0.88
52.3
6±0.
8761
.73±
0.96
2610
14.4
8±0.
4856
.60±
0.92
48.9
0±0.
8656
.60±
1.06
3315
19.9
1±0.
4861
.60±
0.73
54.5
3±0.
7561
.53±
0.83
2910
14.1
2±0.
4855
.40±
0.92
48.6
0±0.
8656
.20±
1.06
3010
14.5
8±0.
4858
.90±
0.92
50.2
0±0.
8658
.20±
1.06
3121
13.9
9±0.
3353
.76±
0.64
49.6
2±0.
5955
.10±
0.73
3210
13.7
1±0.
4854
.40±
0.92
49.4
0±0.
8655
.90±
1.06
3322
14.7
7±0.
3256
.86±
0.62
48.9
0±0.
5856
.00±
0.72
Sign
ifica
nce
****
****
****
****
*P<
0.01

(1997), Singh et al. (2000) and Singh et al.(2002) .
Effect of sire : Effect of sire on bodyweight and body measurements at 6 months ofage was highly significant (P<0.01) (Table 2).The least squares means for body weight wereranged from 11.43±0.48 (sire no. 11) to14.47±0.32 kg (sire no. 33). The range forchest girth was observed to be 52.00±0.92 to58.90±0.92 cm. Body length was ranged from45.40±0.86 to 50.80±0.86 cm. However, incase of wither height the range was nearlysimilar to that of chest girth i.e. 52.90±0.06 to58.20±1.06 cm.
Anonymous (2006) reported lower valuesfor body weight at 6 months of age inSangamneri kids.
Body weight and body measurementsat 9 months of age : The least squaresmeans for body weight and body measurements
at the age of 9 months are presented in Table2. Overall mean body weight at 9 months ofage was 19.10±0.26 kg. The least squaresmeans for chest girth, body length and witherheight were 61.05±0.39, 55.16±0.37 and62.34±0.45 cm, respectively. Whereas similarvalues were reported by Rai et al. (2004) inMarwari (19.98±0.22 kg) and Tyagi et al.(1992) in Jakhrana (18.7±0.39 kg).Comparatively higher body weights at 9months of age were reported by Rai et al.(2003) in Jakhrana (23.27±0.69 kg) andSwami et al. (2006) in Sirohi (20.15±0.44 kg).On the contrary lower body weights at 9months than the present results were reportedby Nahardeka et al. (2001) in Assam Local (AL)(9.4±0.3 kg), Singh and Singh (1998) inJamunapari (11.97±0.00 kg) and Singh andSingh (2000) in Black Bengal (11.50±0.32 kg).
Effect of sire : The body weight and bodymeasurements of kids at 9 months age were
Journal of Agriculture Research and Technology 129
Table 3. Least squares means for body weight (kg) and body measurements (cm) of Sangamneri goats at twelve months ofage (Sirewise)
Sire N Body Body measurement (cm)no. weight ––––––––––––––––––––––––––––––––––––––––––––––––––––––––
(kg) Chest girth Body length Wither height
Overall 182 22.38±0.36 65.52±0.53 57.82±0.47 65.67±0.501 12 23.34±0.57 67.83±0.90 55.08±0.76 64.58±0.906 17 20.08±0.48 64.12±0.76 57.59±0.64 64.88±0.759 16 22.00±0.50 65.19±0.78 57.00±0.66 64.37±0.7710 11 21.45±0.59 65.27±0.94 55.82±0.80 63.81±0.9311 12 22.11±0.60 62.17±0.90 57.33±0.76 64.16±0.8913 10 22.30±0.62 63.90±0.99 58.50±0.84 64.30±0.9714 10 21.00±0.62 62.80±0.99 54.50±0.84 66.40±0.9716 10 22.46±0.62 64.50±0.99 57.40±0.84 64.80±0.9717 11 21.77±0.59 63.09±0.94 59.09±0.80 63.90±0.9318 11 21.42±0.59 63.45±0.94 57.00±0.80 63.63±0.9319 14 21.55±0.53 64.07±0.84 56.29±0.71 66.07±0.8220 10 21.53±0.62 66.60±0.99 54.60±0.84 66.00±0.9728 11 22.55±0.59 66.36±0.94 55.73±0.80 65.55±0.9332 14 21.16±0.53 63.78±0.84 58.57±0.71 66.57±0.8233 13 24.18±0.55 66.40±0.87 57.46±0.73 63.76±0.85Significance ** ** ** NS
**P<0.01, NS- Non significant

significantly affected by sire except body length(Table 2). The least squares means for bodyweight ranged from 16.84±0.42 (sire No. 6) to19.91±0.48 kg (sire No. 33). The least squaresmeans for chest girth ranged from 58.00±0.92to 63.33±0.75 cm. In case of body length therange was 51.73±0.9 (Sire No. 20) to54.53±0.75 cm (Sire No. 33). Values forwither height were ranged from 58.69±0.89(Sire No. 17) to 64.05±0.68 cm (Sire No. 9).Anonymous (2006) studied sire wise growthperformance and reported similar values forbody weight at 9 months of age. However,significant effect of sire was reported byAnonymous (2007).
Body weight and body measurementsat 12 months of age : The least squaresmeans for body weight and body measurementsat the age of 12 months are presented in Table3.The overall mean for body weight at 12months of age was 22.38±0.36 kg. The leastsquares means for chest girth, body length andwither height were 65.52±0.53, 57.82±0.47
and 65.67±0.50 cm, respectively.
Effect of sire : The body weight and bodymeasurements of goats of 12 months age weresignificantly affected by sire except witherheight (Table 3). The least squares means forbody weight ranged from 20.08±0.48 (SireNo. 6) to 24.18±0.55 kg (Sire No. 33). In caseof chest girth the range was 62.17±0.90 (SireNo. 11) to 67.83±0.90 cm (Sire No. 1). Theleast squares means for body length rangedfrom 54.50±0.84 to 59.09±0.80 cm. Valuesfor wither height were ranged from63.63±0.93 (Sire No.18) to 66.57±0.82 cm(Sire No. 32). The results revealed that sire hadsignificantly influenced body weight and bodymeasurements. Body weight is more economictrait so efforts should be made to use orpreserve the semen of these breeding bucks forimprovement in body weight under fieldcondition. Anonymous (2006) reported lowervalues for 12 months body weight ofSangamneri goat.
Correlation : Correlation among bodyweights and body measurements ofSangamneri kids under field condition arepresented in Table 4. The correlationcoefficients presented in the table revealed thatbody weight and body measurements werepositively and highly significantly (P<0.01)correlated at all the stages of age studied.Highest magnitude of correlation for chest girthand body weight was observed at 1 months of
Patil et al.130
Table 4. Correlation of body weights and bodymeasurements at various ages for Sangamnerigoat
Weight at 1 M 3 M 6 M 9 M 12 M
Chest girth 0.92** 0.89** 0.78** 0.79** 0.62**Body length 0.72** 0.78** 0.69** 0.63** 0.42**Wither height 0.73** 0.78** 0.66** 0.53** 0.24**
** = P<0.01
Table 5. Multiple regression of body weight (kg) on body measurements (cm) in Sangamneri goats at different ages
Independent Dependent traitstraits –––––––––––––––––––––––––––––––––––––––––––––––––––––––––––––––––––––––––––––––––––––
1 Month 3 Month 6 Month 9 Month 12 Month
a -6.391 -7.350 -11.711 -18.692 -13.112Body length b1 0.095** 0.112** 0.204** 0.238** 0.261**Chest girth b2 0.181** 0.219** 0.273** 0.424** 0.401**Wither height b3 0.026** 0.027** 0.011** -0.022** -0.089**
R2 (%) 0.743 0.660 0.687 0.710 0.505
** = P<0.01

age (0.92). The highest correlation coefficientwas observed at 3 months age for body length(0.78) and wither height (0.78). Generally thecorrelation coefficients gradually declined asage of the animal increased. Positive and highlysignificant correlation between bodymeasurements and body weights indicated thegreater scope for early selection based onhigher values of body measurement forobtaining higher body weights at desiredage.The present results agreed with Siddiqui etal. (1981) in Osmanabadi goat breeds.
Prediction of body weight from bodymeasurements : The multiple regressioncoefficients of body weights on different bodymeasurements at various ages were estimatedand presented in Table 5 .
It was observed from results that regressioncoefficient was positive and highly significantexcept wither height at 9 and 12 months ofage. The R2 values obtained for 1, 3, 6, 9 and12 months of age were 0.743, 0.660, 0.687,0.710 and 0.505 per cent, respectively. Theregression equations obtained for predictingbody weight from body measurements at 1, 3,6, 9 and 12 months of age were as follows
Y1 = -6.391 + 0.095X1 + 0.181X2 + 0.026X3
Y2 = -7.350 + 0.112X1 + 0.219X2 + 0.027X3
Y3 = -11.711 + 0.204X1 + 0.273X2 + 0.011X3
Y4 = -18.692 + 0.238X1 + 0.424X2 - 0.022X3
Y5 = -13.112 + 0.261X1 + 0.461X2 - 0.089X3
Where, Y1 = Body weight at 1 months age, Y2= Body weight at 3 months age, Y3 = Bodyweight at 6 months age, Y4 = Body weight at9 months age, Y5 = Body weight at 12 monthsage, X1 = Body length, X2 = Chest girth, X3 =Wither height
Acknowledgement
The authors are thankful to the ICAR
authorities for providing necessary facilities forcarrying out the research work.
ReferencesAnonymous. 1992. Research Review Report of Animal
Science and Dairy Science, Mahatma Phule KrishiVidyapeeth, Rahuri .
Anonymous. 1999. Final Report of Network Porject ofSurvey of Osmanabadi Goats, Submitted by MahatmaPhule Krishi Vidyapeeth, Rahuri to NBAGR, Karnal.
Anonymous. 2006. Annual Report of AICRP onSangamneri Goats, Dept. of Animal Science and DairyScience, MPKV, Rahuri (M.S.).
Anonymous. 2007. Annual Report of AICRP onSangamneri Goats, Dept. of Animal Science and DairyScience, MPKV, Rahuri (M.S.).
Gacula, M. C. (Jr.), Gaunt, S. N. and Demon, R. A. (Jr.)1968. Genetic and environmetal parameters of milkconstituents for five breeds. 1. Effect of herd, year,season and age of cow. J.Dairy Sci. 51(3): 428-437.
Ganesh Kumar, K., Triuvenkadan, A.K. and Karunanitni,K. 2005. Factors affecting growth traits in Tellicherrykids in different season. Indian J. Small Ruminants.11(1): 88-91.
Harvey, W. R. 1990. Users guide for LSMLW PC-1Version. Mixed model least squares and maximumlikelihood programme, Iowa State University, USA.
Husain, S. S., Horst, P. and Islam, A. B. M. M. 1997.Growth performance of Black Bengal goats indifferent regions of Bangladesh. AJAS 10(5): 491-494.
Malik, C. P., Kanaujia, A. S. and Narula, H. K. 1993.Studies on growth in Black Bengal goats. Indain J.Anim. Res. 21(1): 5-9.
Mittal, J. P. 1993. Performacne of Barbari under aridenvironment. Indian J. Anim. Sci. 63(11): 1187-1190.
Nahardeka, N., Das, D., Roy, T. C., Goswami, R. N., Das,G. G., Gogoi, P. K. and Das, B. 2001. Studies onbody weights of Assam Local goats and their crosseswith Beetal. Indian Vet. J. 78: 811-814.
Pander, B. L., Kanaujia, A. S. and Yadav, B. S. 1989.Growth performance and prediction of body weightfrom body measurements in Beetal and Black Bengalkids and their crosses maintained under feed lotcondition. Indain J. Anim. Prod. Mgmt. 5(4): 162-166.
Rai, B., Singh, M. K. and Khan, B. U. 2003. Geneticanalysis of growth traits in Jakhrana goats. Indian Vet.Med. J. 27: 248-250.
Journal of Agriculture Research and Technology 131

Rai, B., Singh, M. K., Khan, B. U. and Yadav, M. C. 2004.Factors affecting growth traits in Marwari goats. IndianJ. Anim. Sci. 74(5): 543-546.
Rana, Z. S. and Godara Pradeep. 1991. A note on growthperformance of Beetal and its crossbred syntheticgroup of goat. Indian J.Anim. Prod. Mgmt. 7(3): 161.
Roy, R., Rout, P. K. and Pant, K. P. 2003. Influence ofvarious interactions on performance of Jamunaparigoats. Indian J. Anim. Sci. 75(5): 300-304.
Siddiqui, M. F., Bonde, H. S., Rotte, S. G. and Deshpande,K. S. 1981. Studies on some growth attributes ofOsmanabadi goat kids J. Agric. Sci. 97(3): 747-749.
Singh, D. K. and Singh, N. S. 2000. Gentic analysis of preand post weaning growth traits of Black Bengali Kids.Indian Vet. Med. J. 24: 275-278.
Singh, D. K., Singh, N. S. and Singh, L. B. 2000. Non-geentic factors affecting growth of Beetal hlafbredkids. Indian J. Anim. Sci. 70(11): 1165-1166.
Singh, N. K. and Singh, D. K. 1998. Growth rate of BlackBengal and its crosses with Beetal under villagecondition. Indain J.Anim. Sci. 68(9): 988-990.
Singh, S., Rana, Z. S. and Dalal, D. S. 2002. Genetic andnon-genetic factors affecting growth performance ingoats. Indain J. Anim. Res. 36: 12-16.
Swami, P. D., Barhat, N. K., Murdia, C. K., Joshi, R. K.and Chaudhari, V. K. 2006. Factors affecting bodyweights in Sirohi goats and its crosses with Beetal.Indian J.Anim. Sci. 76(5): 419-421.
Tomar, A. K., Kumar Arun and Mehta, B. S. 2004. Studyon early growth traits and correlations among them inSirohi kids. Indian J. Small Ruminants. 10(1): 11-14.
Tyagi, S., Goel, A. K., Sood, S. B. and Agarwal, K. P.1992. Fatctors affecting pre-weaning and postweaning growth in Jakhrana goats. Indian J. Anim.Sci. 62(10): 999-1001.
Patil et al.132
J. Agric. Res. Technol., 41 (1) : 132-134 (2016)
Studies on Serum Biochemical Profile in LactatingCrossbred Cows
V. E. Narwade1, M. M. Yadav2, S. H. Mane3, S. S. Jadhav4 and Y. G. Fulpagare5
Research Cum Development Project on Cattle, Mahatma Phule Krishi Vidyapeeth, Rahuri - 413 722 (India)(Received : 31-01-2015)
AbstractEighteen Crossbred cows in early, mid and late lactation with a drop in milk production were screened
for serum biochemical profile, using Miura Serum Analyzer. In late lactating cows the serum parameters likeAlbumin (3.48 ± 0.58 g dl-1), Creatinine (1.03 ± 0.15 mg dl-1) Triglyceride (19.43 ± 1.37 mg dl-1), Uric acid(2.60 ± 0.50 mg dl-1) and total proteins (7.55 ± 0.95 g dl-1) are observed on higher side as compared to midand early lactating cows, while that of cholesterol (142.08 ± 3.45 mg dl-1) and Glucose (64.30 ± 2.91 mgdl-1) decreased in late lactating cows as compared to early and mid lactating cows. Overall serum biochemicalconstituents in early and mid lactation showed lower trend as compared to late lactation. The overall loweredmeans of serum biochemical constituents in early and mid stages of lactation might be due to large amountwithdrawal by the mammary gland for the synthesis of milk constituents.
Key words : Glucose, total proteins, cholesterol, albumin, creatinine, triglyceride, uric acid.
______________
Serum biochemical profile have been usedwidely to identify problem and to indicate
dietary causes of diseases or low production(Lee et al. 1978.). The serum biochemicalprofile is considered important in evaluating thehealth status of animals. The estimates of
1.

biochemical constituents are the prerequisitesto diagnose several pathophysiological andmetabolic disorders in cattle (Mc Dowell, 1992,Chaffe, 1976). The present study wasundertaken to study some of the serumbiochemical alterations according to stages oflactation in crossbred cows.
Materials and Methods
Eighteen Crossbred cows maintained atResearch Cum Development Project on Cattle,Mahatma Phule Krishi Vidyapeeth, Rahuri(Maharashtra) with a history of drop in milkproduction were selected for the study. Detailedclinical examination of cows in various stages oflactation was performed. These cows weredivided into three groups with six animals eachin their early lactation, mid lactation and latelactation.
Serum samples were collected in a sterilevial for biochemical analysis. All the serumbiochemical parameters were estimated usingMiura Serum Analyzer. The statistical analysiswas done by applying completely RandomizedDesign.
Results and Dicussion
Serum biochemistry : Serum biochemicalalterations according to stages of lactations aredepicted in table.
Albumin : The serum Albumin values differsignificantly (P<0.05) amongst mid and late
lactation groups in crossbred cows. The meanalbumin value in early lactating and midlactating stage (3.2 ± 0.36 g dl-1) and (3.11±0.35 g dl-1) was significantly lower as comparedto the late lactating stage (3.48 ± 0.58 g dl-1).
Total protein : During early and mid stageof lactation, the serum total protein values(7.20 ± 0.62 g d1-1) and (7.19 ± 0.63 g dl-1)were slightly decreased than the late lactatingstage (7.55 ± 0.95 g d1-1). Higher serum totalprotein concentration might have beenassociated with infectious processes i.e.Mastitis, Metritis or have had improved becauseof dietary intake of concentrates. Hagwane etal. (2009) recorded higher concentration oftotal protein than those have been recorded inpresent investigation. Total Protein contentsusually used as appraisal of nutritive status of ananimal reflecting feed intake and metabolism.
Cholesterol : The descending trend in theserum cholesterol concentration in late lactatingcows as compared to early lactating cows wasobserved. These findings are in consistencewith the findings of Nath, et al. (2005).However, Rowlands, et al. (1990) reportedminimum serum cholesterol concentrationfollowing calving and got build up as thelactation progresses.
Creatinine and uric acid : TheCreatinine values differ significantly (P<0.05)amongst different lactating stages of cows.
Journal of Agriculture Research and Technology 133
Table 1. Serum biochemical parameters according to stages of lactation
Group Albumin Total Chole- Creat- Uric Serum Trigly-(g dl-1) protein sterol inine acid glucose ceride
(g dl-1) (mg dl-1) (mg dl-1) (mg dl-1) (mg dl-1) (mg dl-1)
Early lactation 3.20±0.36 7.20±0.62 170.73±3.51 0.75±0.07 2.37±0.39 73.59±3.25 16.73±1.03Mid lactation 3.11±0.35 7.19±0.63 161.32±3.60 0.87±0.08 2.28±0.35 71.15±3.10 16.48±1.01Late Lactation 3.48±0.58 7.55±0.95 142.08±3.45 1.03±0.15 2.60±0.50 64.30±2.91 19.43±1.37F - value 0.39 S 0.34 NS 3.49 NS 0.11 S 0.42 NS 2.99 NS 1.15 NS
S- Significant at 5% level (P<0.05), NS- Non Significant

The mean serum creatinine value in earlylactating cows (0.75 ± 0.07 mg dl-1) wassignificantly lowered as compared to latelactating cows (1.03 ± 0.15 mg dl-1). Thisincreased creatinine level could be either due toincreased deamination or increased proteinintake (Oliva et al., 1991, Mulei and Daniel,1989). Serum uric acid (2.60 ± 0.5 mg dl-1)trend were on higher side in late lactating stageof cows.
Serum glucose and triglyceride : Theserum glucose level is regarded as one of theindicators of energy status in ruminants. Thehigher mean serum glucose values wereobserved in early lactating cows (73.59 ± 3.25mg dl-1) and descending trend thereafter in midand late lactating stages of cows (71.15 ± 3.10mg dl-1) and 64.30± 2.91 mg dl-1) was noticed.The lowered means of serum glucoseconcentrations in mid and late lactation stagesmay be due large amount of serum glucosewithdrawal by the mammary gland for thesynthesis of milk lactose (Schultz, 1968).However, serum triglyceride (19.43±1.37 mgdl-1) levels were on higher side in late lactatingstages of cows.
Acknowledgment
Author's are thankful to UniversityAuthorities for providing necessary facility forconducting present study.
References Hagawane. et al. 2009. Hematological and Serum
biochemical profile in lactating Buffaloes in andaround Prabhani City. Veterinary world Vol. 2(12):467-469
Lee, A. J. et al. 1978. Serum Metabolic Profile: Their Useand Relation to Nutritional Status of Dairy Cows, J.Dairy Sci. 61: 1652-1670
McDowell, L. R. 1992. Minerals in animal and humannutrition. Academic Press, Inc San Diego, California.
Nath, H. C. et al. 2005. Serum cholesterol and protein inpre, peri and postpartum cows. Indian Vet. J. 82:519-521.
Oliva, G., Tranquillo, A. and Persechino, A. 1991. Serumchemistry of primiparous and pluriparous buffalocows in late pregnancy and at the start of lactation.Acta Medica Veterinaria 35(2): 207-217
Rowland, G. L., et al. 1980. Changes in albumin, globulin,glucose and cholesterol concentration in a serum ofdairy cows in a late pregnancy and early lactation. J.of Agri. Sci. (Cambridge) 94: 517-527
Scultz. L. H. 1968. Ketosis in dairy cow. J. Dairy Sci., 51:1133-1140.
Snedecor, G. W. and Cochran, W. G. 1994. Statisticalmethods 8th edn. Affiliated East West Press.
Narwade et al.134
______________
In India breeding programme goal of dairyanimal for dairy organization / rural herds is toimprove the milk production and productivity ofdairy animals in particular through maximumexploitation of genetic resources. Theeconomics of dairy industries is based onproductivity of animals which is governed byseveral genetic and non-genetic factors. Thereis a scanty literature on performance of PhuleTriveni synthetic crossbred cattle. Therefore,present investigation was undertaken.
Materials and Methods
The present investigation was undertakenby utilizing the data maintained at RCDP on
Cattle, M.P.K.V., Rahuri. The data for a periodof 34 years (1975 to 2008) were collected andclassified according to generation, period ofcalving viz., P1 (1997-1982), P2 (1983-1988),P3 (1989-1994), P4 (1995-2000) and P5(2001-2008). The data were further dividedinto three season of calving viz., S1 (June -September), S2 (October- January) and S3(February - May). The data were grouped intothree groups according to peak milk yield viz.,Y1 (< 12.0 kg), Y2 (12-14 kg) and Y3 (> 14.0kg) and analyzed by least squares analysismethod (Harvey, 1990). Whenever the effectswere significant the differences between meanswere tested for significance by Duncun'sMultiple Range Test (DMRT) as modified byKrammer (1957). Genetic and phenotypiccorrelation among traits and heritability of traitswas estimated.
J. Agric. Res. Technol., 41 (1) : 135-141 (2016)
Studies on First Lactation Production Traits of Phule TriveniCow*
V. P. Kamble1, O. K. Deokar2 and U. Y. Bhoite3
Department of Animal Husbandry and Dairy Science, Mahatma Phule Krishi Vidyapeeth, Rahuri - 413 722 (India)
(Received : 31-07-2015)
AbstractThe present investigation was undertaken by utilizing the data of Phule Triveni cows maintained at RCDP
on Cattle, M.P.K.V., Rahuri for a period of 34 years (1975 to 2008). The overall least squares mean recordedfor first lactation milk yield (FLMY), first lactation length (FLL), First dry period (FDP) and milk yield day-1 offirst calving (MY/FCI) was 2835.05 ± 57.47 kg, 344.16 ± 4.89 days, 114.74 ± 7.54 days and 6.50 ± 0.14kg, respectively. The analysis of variance revealed that period of calving significantly (P<0.01) affected theFLMY. FDP and MY/FCI and non-significantly FLL. The season of calving had significant (P<0.01) effect onFLL while, non-significant effect on FLMY, FDP and MY/FCI. The peak milk yield had significant (P0.01)effect on FLMY and MY/FCI and non-significant effect on FLL and FDP. The generation had non-significanteffect on all traits. In Phule Triveni cows the genetic correlation of FLMY with FLL and FDP was negative andsignificant (-0.114 and -0.559, respectively). The genetic correlation of FLMY with MY/FCI (0.962) waspositive and significant while, the genetic correlation of FLL with FDP (-0.728) and MY/FCI (-0.142) and FDPwith MY/FCI (-0.593) was negative and signillcant. The phenotypic correlation of FLMY with FLL, FDP andMY/FCI was 0.234, -0.017 and 0.339. respectively. The phenotypic correlation between FDP and MY/FCIwas negative and significant (-0.253). In Phule Triveni cows the heritability of FLMY, FLL, FDP and MY/FCIwas 0.233, 0.138, 0.187 and 0.480, respectively.
Key words : First lactation, production traits, Phule Triveni.
*Part of M.Sc.(Agri.) thesis submitted to MPKV, Rahuri.l. M.Sc.(Agri.) Student, 2. Asstt. Professor and 3.
Professor.

Results ad Discussion
First lactation milk yield : The overallmean first lactation milk yield of Phule Trivenicows recorded at the farm was 2835.05 ±57.47 kg (Table 2). The analysis of variancerevealed that the period of calving significantly(P<0.01) affected the first lactation milk yield inPhule Triveni cows (Table 1). Similar significantresults were reported by Mandakmale and Kale(1990) in Gir triple crosses, Mudgal et al.(1990) and Singh and Tomar (1991) in exoticcrossbred cows and Murclia and Tripathi (1992)in IFG cows. However, the non significantresults were supported by Kurulkar et al.(2003) in Gaolao crossbreds. The DMRTindicated that, first lactation milk yield (kg) ofcows calved during period P2 (3096.76 ±70.43 kg) and P1 (2927.45±58.74) was at parwith each other and were significantly highest(P<0.01) followed by milk yield of cows calvedduring period P4 (2784.66 ± 110.81 kg), P5(2709.67 ± 236.92) and P3 (2656.692 ±76.41) and were at par with each other.
The analysis of variance (Table 1) indicatednon-significant effect of season of calving onfirst lactation milk yield. The non-significantresults were confirmed by Singh and Tomar(1991) in Karanfries crossbred cows, Varade etal. (2002) in Jersey crossbred cows andKurulkar et al. (2003) in Gaolao crossbredcows. However, significant effect of season of
calving on FLMY was confirmed by Bhutia andPandey (1988), Bhoite (1996) in JFGcrossbreds and Nanvati and Khan (1997) in Gircrossbred. The highest FLMY was observed incows calved during season S1 (2881.26 ±79.81) followed by S2 (2816.41 ± 71.03) andS3 (2807.47 ± 78.56 kg).
The analysis of variance revealed that peakmilk yield significantly (P=0.01) affected thefirst lactation milk yield in Phule Triveni cows(Table 1). The first lactation milk yield of cowsin peak milk yield Y3 (3359.89 ± 77.70 kg)was significantly highest than cows of Y2(2827.09 ± 81.17 kg) and Y1 (2318.15 ±74.91 kg) peak milk yield groups, which alsodiffered significantly from each other.
The analysis of variance revealed thatgeneration had non-significant effect on firstlactation milk yield (Table 1). The overall firstlactation milk yield as affected by generationwas 2829.28 ± 47.27 days in Phule Trivenicows (Table 3). The overall FLMY forgenerations were in agreement with resultsreported by Kale (1984) in J x G crosses,Taneja and Bhat (1986) in FG crossbreds. Onthe contrary significant effect on FLMY wasreported by Panda and Sandhu (1983) inhalfbred of Haryana and Deshi Bangal cowscrossed with Friesian and Jersey Sire, Kale(1984) in FG crosses and Nayak and Raheja(1996) in halfbred of Friesian x Haryana.
Kamble et al.136
Table 1. Analysis of variance Productive traits of first lactation in Phule Triveni cows
Source of variation d.f. FLMY FLL FDP MY/FCI–––––––––––––––––––––––––––––––––––––––––––––––––––––––––––––––––––––MSS MSS MSS MSS
Period of calving 4 2040089.208** 4757.441 29796.521** 26.813**Season of calving 2 179365.608 10062.252* 205.626 3.818Peak milk yield 2 281082231.015** 720.204 11937.773 135.198**Error 346 442409.074 3206.995 7578.038 2.827Generation 6 141445.310 4685.930 4174.097 0.683Error 348 437427.797 3107.772 7459.101 2.799
** P0.01 * P0.05

The variation might be due to heterosis infirst generation which was not retained infurther generations. Secondly the selectionpressure applied for generating the forwardgeneration is also the one contributing factorfor the performances of animals at par witheach other.
First lactation length : The overall meanfirst lactation length of Phule Triveni cowsrecorded at the farm was 344.16 ± 4.89 days(Table 2). Similar range of lactation length wasreported by Kulkarni (1985) in FJG group,Jadhav et al. (1992) in FS, Mohalkar (1995) inPhule Triveni, Bhoite et al. (1999) in Phuletriveni and JFG, Kamble (2003) in Phule triveniand Zol (2007) in Phule Triveni. However,longer lactation length than presentinvestigation was reported by Kamble (2003) inBFG (352.7 days).
The analysis of variance indicated non-significant effect of period of calving on firstlactation length (Table 1). The non-significant
findings were in agreement with D'alal et al.(1991) in Jersey halfbreds and HF withHaryana, Thakur and Singh (2001) and Varadeel al. (2002) in JT crossbreds. Whereas, Bhoite(1996) in FG, JG and Phule Triveni crosses,Kamble (2003) in Gir crossbreds and Jadhav(2009) in HF x Gir halfbreds reportedsignificant findings.
The analysis of variance revealed thatseason of calving significantly (P<0.05) affectedthe first lactation length in Phule Triveni cows(Table 1). Similar results were reported byVarade et al. (2002) in JT crossbred cows andDeokar and Ulmek (2001) in Jersey cattle.While, the contradictory results were reportedby Khade (2001) and Kamble (2003) in Gircrossbred cattle. The first lactation length ofcows calved in season 83 (352.89 ± 6.68 days)was the highest and was followed by S, (344.94± 6.79 days) and S2 (334.66 ± 6.04 days).Significantly lowest first lactation length wasobserved in season S2. The first lactation lengthobserved in season S2 significantly differed
Journal of Agriculture Research and Technology 137
Table 2. Least squares means of Productive traits of first lactation in Phule Triveni cows
Effect n FLMY FLL FDP MY/FCI–––––––––––––––––––––––––––––––––––––––––––––––––––––––––––––––––––––––––––––Mean±S.E. Mean±S.E. Mean±S.E. Mean±S.E.
µ 355 2835.05 ± 57.47 344.16 ± 4.89 1I4.74 ± 7.54 6.50 ± 0.14
Period of calvingP1 135 2927.45a ± 58.74 339.54 ± 5.00 99.89b ± 7.82 6.92h ± O.I4P2 93 3096.76a ± 70.43 346.45 ± 5.99 73.18c ± 9.48 7.57a ± 0.17P3 81 2656.69b ± 76.41 358.07 ± 6.50 103.29b ± 10.09 6.06c ± 0.19P4 38 2784.66ab ± 110.81 349.80 ± 9.43 115.38ab ± 14.51 6.39bc ± 0.28P5 8 2709.67ab ± 236.92 326.96 ± 20.17 181.98a ± 31.01 5.55c ± 0.59
Season of calvingS1 109 288I.26 ± 79.81 344.94ah ± 6.79 114.38 ± 10.52 6.63 ± 0.20S2 131 28 16.41 ± 7 1.03 334.66b ± 6.04 116.21 ± 9.38 6.58 ± 0.18S3 115 2807.47 ± 78.56 352.89a ± 6.68 113.64 ± 10.36 6.29 ± 0.19
Peak milk yieldY1 115 2318.15c ± 74.91 341.07 ± 6.37 117.30 ± 9.90 5.32c ± 0.18Y2 109 2827.09h ± 81.l7 345.87 ± 6.9I 103.22 ± 10.75 6.56h ± 0.20Y3 131 3359.89a ± 77.70 345.55 ± 6.6I 123.71 ± 10.23 7.61a ± 0.19
Means with different superscripts differ significantly from each other

from S3. The first lactation length observed inseason S1 was at par with S2 and S3.
The analysis of variance indicated non-significant effect of peak milk yield on firstlactation length (Table 1). The highest firstlactation length was observed in cows of Y2(345. 87 ± 6.91 days) peak milk yield followedby Y3 (345.55 ± 6.61 days) and Y1 (341.07 ±6.37 days) peak milk yield.
The analysis of variance noticed thatgeneration had non-significant effect on firstlactation length in Phule Triveni cows (Table 1).The overall mean first lactation length asaffected by generation was 345.01 ± 3.98 days(Table 3). On the contrary significant effect ofgeneration on FLL was shewed by Kanawade(1997) in Friesian x Gir, Nagare and Patel(1997) and Khade (2001) in Gir crossbreds.
First dry period : The overall mean firstdry period of Phule Triveni cows recorded atthe farm was 114.74 ± 7.54 days (Table 2).The overall dry period (days) observed inpresent study resembled with Dalai et al. (1991)reported in FH (91.18 ± 3.76), JH (992.66 ±5.23), Bhoite (1996) in JFG (78.01 ± 3.55),Kanawade (1997) in FG (86.24 ± 3.56) and JG(84.67 ± 4.40), Khade (2001) in HG and JHGcrossbred cows (73.44 ± 5.63) and Kamble(2003) in HG (81.41 ± 3.77) halfbreds.
The analysis of variance revealed that periodof calving significantly (P<0.01) affected thefirst dry period in Phule Triveni cows (Table 1).Significant effect of period of calving on dryperiod was consonance with Dalai el al. (1991)in Haryana halfbreds, Sachota and Gill (1992)in Friesian x Sahiwal, Bhoite (1996) in JG, FGand inter.se of Phule Triveni, Khade (2001) inGir halfbreds, Varade et al. (2002) inTharparkar three breed crosses and Jadhav(2009) in HF x Gir halfbreds. However, Kamble(2003) reported non-significant in FG, PhuleTriveni JFG and BFG crossbreds. The first dryperiod (days) of Phule Triveni cows in P2 periodof calving (73.18 ± 9.48 days) was significantlylower than all others. The highest first dryperiod was recorded in P5 (181.98 ± 31.01days) which were performed at par with P4,followed by P3 (103.29 ± 10.09 days) and P1(99.89 ± 7.82 days) which were performed atpar with each other.
The analysis of variance indicated non-significant effect of season of calving on first dryperiod (Table 1). These non-significant findingswere in accordance with Navale (1991) in Gircrossbreds, Nagare and Patel (1997) in Gircrossbreds, Zol (2007) in Phule Triveni andKamble (2003) in HG halfbreds. Whilesignificant findings were reported by Reddy et
Kamble et al.138
Table 3. Least squares means of Productive traits in Phule Triveni cows as affected by generation
Effect n FLMY FLL FDP MY/FCI–––––––––––––––––––––––––––––––––––––––––––––––––––––––––––––––––––––––––––––Mean±S.E. Mean±S.E. Mean±S.E. Mean±S.E.
µ 355 2829.28 ± 47.27 345.01 ± 3.98 115.28 ± 6.19 6.48 ± 0.I2
GenerationG1 88 2892.68 ± 183.47 332.54 ± 5.94 H9.44 ± 9.3I 6.48 ± 0.17G2 84 2877.68 ± 72.16 352.56 ± 6.08 109.74 ± 9.65 6.51 ± 0.18G3 70 2887.00 ± 79.05 345.76 ± 6.66 108.95 ± 10.63 6.67 ± 0.20G4 46 2792.60 ± 97.51 347.44 ± 8.22 113.50 ± 12.73 6.37 ± 0.24G5 43 2835.47 ± 100.86 343.02 ± 8.50 122.85 ± 13.17 6.42 ± 0.25G6 13 2778.20 ± 70.50 366.44 ± 15.46 141.92 ± 23.95 6.26 ± 0.46G7 11 274 1.36 ± 199.41 327.32 ± 16.80 90.55 ± 26.04 6.62 ± 0.50

al. (1987) in Ongole triple crosses and Jadhav(2009) in HF x Gir halfbreds.
The analysis of variance indicated non-significant effect of peak milk yield on first dryperiod in Phule Triveni cows (Table 1). Thehighest first dry period observed in cows of Y3(123.71 ± 10.23 days) while the lowest in Y2(103.22 ± 10.75 days) peak milk yield group.
The analysis of variance revealed thatgeneration had non-significant effect on firstdry period in Phule Triveni cow (Table 1). Theoverall mean dry period as affected bygeneration was 115.28 ± 6.19 in Phule Trivenicows (Table 3). These results agreed with thefindings of Bhoite (1996) and Kanawade(1997) in Gir crossbred cows. However,significant results were reported by Khade(2001) in halfbred and triple crosses.
Milk yield per day of first calvinginterval : The overall mean milk yield per dayof first calving interval of Phule Triveni cowsrecorded at the farm was 6.50 ± 0.14 kg (Table2). The overall mean of milk yield day-1 ofcalving interval was in agreement with resultsreported by Bhatnagar et al. (1986) inKaranswiss, Parmar et al. (1986) in RS andPatel and Trivedi (1989) in JK.
The analysis of variance revealed that periodof calving significantly (P<0.01) affected themilk yield per day of first calving interval inPhule Triveni cows (Table 1). Similar significantresults were reported by Butte and Deshpande(1987) in Friesian x Sahiwal halfbreds andJadhav et al. (1992) in crossbred cows. Themilk yield per day of first calving interval (kg) ofPhule Triveni cows calved during period P2(7.57 ±0.17 kg) was significantly higher thanrecorded in P1 (6.92 ±0.14 kg), P4 (6.39 ±0.28 kg), P3 (6.06 ±0.19 kg) and P5 (5.55 ±0.5 kg). P1 and P4 were at par with each other.Also P3, P4 and P5 were at par with each other.
The analysis of variance indicated non-significant effect of season of calving on milkyield per day of first calving interval (Table 1).Similar non-significant results were reported byButte and Deshpande (1987) in HF x Sahiwalhalfbred cows. However, significant results werereported by Bhatnagar et al. (1987) inKaranfries, Singh et al. (1988) in Jersey xSahiwal and Jadhav et al. (1992) in Gir crosses.
The analysis of variance (Table 1) revealedthat peak milk yield significantly (P<0.01)affected the milk yield per day of first calvinginterval in Phule Triveni cows. The milk yieldper day of first calving interval of cows havingpeak milk yield Y3 (7.61 ±0.19 kg) wassignificantly (P<0.01) highest over Y2 (6.56 ±0.20 kg) and Y, (5.32 ±0.18 kg).
The overall mean for MY/FCI as affected bygenerations was 6.48 ± 0.012 kg (Table 3) andwas non-significantly affected by generation.
Genetic phenotypic correlation andheritability : In Phule Triveni cows the geneticcorrelation of FLMY with FLL and FDP wasnegative and significant (-0.114 and -0.559,respectively). The genetic correlation of FLMYwith MY/FCI (0.962) was positive andsignificant while, the genetic correlation of FLLwith FDP (-0.728) and MY/FCI (-0.142) andFDP with MY/FCI (-0.593) was also negativeand significant. The phenotypic correlation ofFLMY with FLL, FDP and MY/FCI was 0.234,-0.017 and 0.339. respectively. The positivelynon-significant phenotypic correlation of FLLwith FDP (0.001) was observed. Thephenotypic correlation between FDP andMY/FCI was negative and significant (-0.253).In Phule Triveni cows the heritability of FLMY,FLL, FDP and MY/FCI was 0.233, 0.138,0.187 and 0.480, respectively.
ReferencesBhatnagar, C. C., Agarwal, S. B., Singh, B. and Singh, K.
Journal of Agriculture Research and Technology 139

1986. The effect of non-genetic factors on productionperformance characteristics of crossbred cows. IndianJ. Dairy Sci. 39(3): 261-268.
Bhoite, U. Y. 1996. Comparative performance ofeconomic traits of haltbreds, triple crosses of Gir andtheir interbred cows. Ph.D. thesis submitted, M.P.K.V.,Rahuri.
Bhoite, U. Y., Bhoite, S. U. and Ulmek, B. R. 1999.Genetic and non-genetic factors influencing milkproduction traits in triple cross interbred cows. IndianVet. J. 69(4): 258-259.
Bhutia, S. T. and Pandey, R. S. 1988. Genetic and non-genetic factors affecting milk production and lactationlength of crossbred cows. Asian J. Dairy Res. 7(1): 1-6.
Butte, S. V. and Deshpande, K. S. 1987. A note onproduction efficiency traits in Friesian x Sahiwalcrossbreds. Indian, J. Dairy Sci. 40(1): 144-146.
Dalai, D. S., Arora, K. C. and Rathi, S. S. 1991. Evaluationof performance traits in halfbred cattle. Indian J. DairySci. 44(2): 401-405.
Deokar, D. K. and Ulmek, B. R. 2001. Studies on lactationlength in Jersey cattle. J. Mahrashtra Agric. Univ.26(1): 104-106.
Harvey, W. R. 1990. Least squares analysis of data withunequal subclass number. APSH4, U.S.D.A.
Jadhav, K. L., Tripathi, V. N. and Kale, M. M. 1992.Performance of crossbred cows for production andreproduction traits in different production level groups.Indian J. Daiiy Sci. 45(11): 620-622.
Jadhav, V. A. 2009. Generationwise breeding efficiency ofHF x Gir. M.Sc. (Agri.) thesis submitted to MPKV,Rahuri.
Kale, K. M. 1984. Growth, reproduction and productionperformance of Gir cows and its exotic crosses. Ph.D.thesis submitted, MPKV, Rahuri.
Kamble, S. S. 2003. Effect of different types of calving onreproduction and productive performance ofcrossbred cattle. M.Sc. (Agri.) thesis submitted, MPKV,Rahuri.
Kanwade, V. R. 1997. Comparative study on breedingefficiency of halfbreds and its interbred of Gir cattle.M.Sc. (Agri.) thesis submitted, MPKV, Rahuri.
Khade, P. B. 2001. Studies on herd structure of HolsteinFriesian crosses in relation with productionperformance at R.C.D.P. on cattle. M.Sc. (Agri.)thesis submitted to MPKV, Rahuri.
Krammer, C. Y. 1957. Extension of multiple range test togroup related adjusted mean. Biometrics 13:20.
Kulkarni, S. R. 1985. Studies on reproduction andproductive performance of FJG, BFG and JFG triplecrosses. M.Sc. (Agri.) thesis submitted to MPKV,Rahuri.
Kurulkar, S. V., AM, S. Z. and Charjan, P. V. 2003.Performance of Gaoloo crossbred in vidharbhaclimatic conditions. Indian Vet. J. 80(2): 186-187.
Mandakmale, S. D. and Kale, K. M. 1990. Factorsaffecting milk production performance of Gir halfbredsand their second generation crosses with exotic dairybreeds. Indian J. Anim. Sci. 60(6): 730-731.
Mohalkar, P. A. 1995. To study the effect of growth onsome economic, reproduction and productive traits ofFJG triple crosses and its inbred (1FJG). M.Sc.(Agri.)thesis submitted to MPKV, Rahuri.
Mudgal, K. C., Taylor, C. M. and Singh, A. 1990. Factorsaffecting milk yield in crossbred cattle. Indian Vet. J.67(2): 182-184.
Murdia, C. K. and Tripathi, V. N. 1992. Effect of farm,period, season and parity on performance traits ofJersey cattle. Indian, J. Anim. Sci. 62(2): 144-146.
Nagare, W. K. and Patel, A. M. 1997. The comparativeperformance of Gir crossbreds under Maharashtraconditions. Indian J. Anim. Prod. Mgnt. 13(2): 87-92.
Nanavati, S. and Khan, F. H. 1997. Studies on lactationyield of Gir cattle. Indain J. Dairy Sci. 50(3): 217-219.
Navale, P. B. 1991. Comparative performance ofreproductive and productive economic traits of triplecrosses of Gir cattle and their interbreds M.Sc. (Agri.)thesis submitted to MPKV, Rahuri.
Nayak, S. K. and Raheja, K. L. 1996. Performance ofhalfbreds and three breed crosses of Hariana withexotic dairy breeds. Indian J.Anim. Sci. 66(2): 154-158.
Panda, P. B. and Sandhu, D. P. 1983. Some genetic andnon-genetic factors affecting milk production incrossbreds of Holstein and Jersey with Hariana andDeshi Bengal cows. Indian Vet. J. 60(2): 99-106.
Parmar, O. S., Jain, A. K. and Gill, G. S. 1986. Evaluationof two breed and three breed crossbred cows withreference to economic traits and production efficiency.Indian J. Dairy Sci. 39(3): 210-214.
Patel, J. M. and Trivedi, M. M. 1989. Reproduction profileof Jersey x Kankrej Fl halfbreds. Indian J. Anim. Sci.59(6): 733-735.
Reddy, K., Rao, L. S., Sivaiah, K., Rao, V. H. and Murthy,A. S. 1987. Effect of season of calving on theproductive performance of first lactating Ongolecrossbreds. Indian J. Dairy. Sci. 40(2): 357-359.
Kamble et al.140

Sachota, R. S. and Gill, G. S. 1992. Performance ofvarious genetic groups of cows for reproductiveefficiency traits. Livestock Advisor. 17(10): 25-28.
Singh, K. P., Sharma, O. P. and Choudhary, R. P. 1988.Effect of non-genetic factors on reproductive traits inFl crossbred cows. Indian J. Anim. Res. 22(2): 103-106.
Singh, R. and Tomar, S. S. 1991. Factors affecting theservice period and its association with other traits inKaran Fries cattle. Indian J. Dahy Sci. 44(1): 6-8.
Taneja, V. K. and Bhat, P. N. 1986. Milk and beefproduction in tropical environment. Proc. 3rd WId.
Cong. Genetic Appl. Livestock Prod. Nabrasaka.Lincoln. USA.9: 73-91.
Thakur, Y. P. and Singh, B. P. 2001. Performance ofJersey x Sindhi crossbreds. Indian Vet. J. 78(1): 62-63.
Varade, P. K., Khire, D. W., Ali, S. Z. and Kuralkar, S. V.2002. Effect of genetic and non-genetic factors onproductive and reproductive traits in Jersey crossbredcows. Indian J. Anim. Prod. Mgmt. 18(12): 38-40.
Zol, S. R. 2007. Generation wise breeding efficiency inPhule Triveni at organized farm. M.Sc. (Agri.) thesissubmitted to MPKV, Rahuri.
Journal of Agriculture Research and Technology 141
______________

Rice is highly diversified crop andassessment of genetic diversity is essential forfurther maintenance of varieties and pre-breeding programme. The only legalrecognized traditional method in our countryfor cultivar protection is grow out test (GOT),which includes only the morphologicalcharacteristics of a variety. Such method hasbeen highly successful and efficient, but aconcerted effort of plant breeding programmetends to produce new varieties. Themorphological traits may not be sufficient fordiscrimination and identification of all extantand new promising varieties, ensuring moreprecise technique. The currently available DNAmarkers, microsatellites are considered to bethe markers of choice for varietal identificationbecause of their co-dominant segregation andtheir ability to detect large number of discretealleles repeatedly, accurately and efficiently(Olufowote et al., 1997). To avoid thecommercial exploitation of varieties by othersi.e. to protect the varieties, DNA fingerprintingis essential. The molecular characterization andfingerprinting of these released varieties usingmicrosatellite markers were lacking which willprovide sufficient knowledge on diversityamong them at molecular level. Keeping this inview the present study of fingerprinting of 23rice varieties was under taken for those havebeen extensively cultivated in Konkan region ofMaharashtra and other parts of India throughSSR markers.
In the present investigation nucleus seed of23 rice varieties released by Dr. B. S. K. K. V.Dapoli which were available at the researchfarm of the Department of Agril. Botany,
College of Agriculture, Dapoli were used. Thedetails of these varieties are presented in Table1. All the 23 rice varieties were grown in thegreenhouse. The leaf samples were collectedfrom 15 days old seedlings for DNA isolation.The genomic DNA was isolated from the youngnewly flushing leaves by following the protocolof Doyle and Doyle (1990) i.e. rapid methodwith the slight modifications of buffercomposition and concentration (Data notshown).
PCR amplification reactions wereperformed with SSR primers in an Eppendorf,Master Cycler Gradient. A total of 35 SSRprimers were subsequently used for PCRamplification (Table 2). PCR reaction wasperformed in 20 µl reaction mixture consisting3U Taq DNA (0.5 µl), 10x Taq assay buffer with2.5 mM MgCl2 (2.5 µl), 10 mM dNTPs (1 µl),25 mM MgCl2 (0.5µl), 25 picomoles SSRprimer (1 µl) and 25 ng of template DNA (1 µl).The amplification profile for SSR consisted ofinitial denaturation at 94°C for 5 min, followedby 30 cycles comprising of a denaturation stepat 94°C for 45 sec. each primer has showndifferent annealing temperature for 30 sec andan extension step at 72°C for 20 sec. Thecycling program was terminated by a finalextension step at 72°C for 7 min.
The amplified products in SSR reactionwere separated by electrophoresis in 1.5 percent agarose gel containing ethidium bromidein 1x TAE Buffer (pH 8.0) and separation wascarried out by applying constant voltage of 80volts for 1 hour. The gels were photographedunder UV light (Uvi-Tech, Fire reader,Cambridge, England).
RESEARCH NOTESJ. Agric. Res. Technol., 41 (1) : 142-147 (2016)
DNA Fingerprinting of Rice Varieties Using SSR Markers

Based on the banding pattern obtained thepolymorphism percentage was calculated withdifferent primers. The amplified products foreach primer were scored as 1 for presence ofthe band and 0 for the absence of the band tocreate a binary data matrix. Pair-wise similaritymatrices were generated by Jaccard'scoefficient of similarity by using MVSP-AMultivariate Statistical Package_5785 (Version3.1). The cluster analysis was performed fromthe distance matrix using Jaccard's similaritycoefficients.
The SSR markers having 25 nm OD werediluted at a concentration of 5 pm µl-1 andemployed for standardization of annealingtemperature. The Tm value of reverse andforward primers were taken into considerationand programme was set accordingly. The dataobtained is presented in Table 3. Each primerhas shown different annealing temperature (Fig.1). The lowest annealing temperature wasobserved in primer RM-315 and pTA-248(52°C) whereas, maximum annealingtemperature was observed in primer RM- 181(69.9°C). The purity and yield of the reactionproducts depend on several parameters, one of
which is the annealing temperature (Ta). Atboth sub- and super-optimal Ta values, non-specific products may be formed and the yieldof products is reduced (Rychlik et al., 1990).
The polymorphism percentage for individualprimer was calculated by the ratio of number ofpolymorphic bands obtained over the totalnumber of bands produced across the 23 ricegenotypes. A total of 35 SSR primer pairsdistributed across the genome were used formolecular analysis of 23 rice varieties. Thegenomic DNA of 23 rice genotypes weresuccessfully amplified with thirty fivemicrosatellite primer pairs (Fig. 2 and Fig. 3).All 35 microsatellite markers were found to bepolymorphic. The level of polymorphismdetermined by the PIC values was quite low andvaried from 0.24 to 0.78 with an average of0.58 per locus. The PIC values observed in ourstudy were comparable to previous estimates ofmicrosatellite marker analysis in rice (Singh,2011, Rahman et al., 2011 and Zhi-zhou etal., 2012). The PIC value was higher thanearlier observations but equal to previouslyreported by Singh (2011), who observed anaverage PIC value of 0.82 for the elite
Journal of Agriculture Research and Technology 143
Fig. 1. Gel photograph of standardized annealing temperature of SSR Marker RM-19 and RM-122

thermosensitive genic male sterile (TGMS) linesdeveloped at three different researchinstitutions of India. The overall average size ofamplified products ranged from 121.86 bp to217.14 bp (Table 4). A total of 184 alleles wereobtained using 35 SSR primer pairs with anaverage of 5.26 alleles per primer. The number
of alleles amplified for each primer pair rangedfrom 2 to 8. The markers RM-343, RM-112and RM-224 generated maximum number ofalleles (8), while the primer RM-315 and RM-223 produced minimum number of alleles (2).The number of alleles observed in the presentstudy corresponds well to some earlier reports
Nikam et al.144
Fig. 2. Gel photograph of SSR primer RM-276.
Fig. 3. Gel photograph of SSR primer RM-335.

(Chakravarthi et al., 2006 and Rahman et al.,2011). Our results were also comparable to 2.2- 5.5 alleles per locus for various classes ofmicrosatellites reported by Chakravarthi et al.,(2006), who used similar set of primers. Thenumber of alleles detected in the present studywas significantly higher than the averagenumber of alleles in aromatic rice of India andBangladesh (Singh, 2011, Rahman et al.,2011 and Kibria et al., 2009).The availabilityof alternative pairs of primers that amplify thesame locus enhances opportunities to select themost favourable combination of allele and PCRconditions for efficient multiplexing of SSRmarkers in an automated system.
The genetic distance was computedconsidering all the genotypes from the pooleddata and the dendrogram was constructed. Theoverall range of the similarity among 23genotypes was found to be very wide rangingfrom 0.016 (Ratnagiri-4 and Karjat-184) to0.578 (Ratnagiri-4 and Ratnagiri-5) whichindicates there was high variability among therice genotypes under study (Data not shown).
Resolution factor (Rf) values ranged from0.574 with RM 318 to 0.763 in SSR primerRM-85 with an average resolution factor (Rf)value of 0.675. The minimum resolution factor(Rf) value is 0.574 of primer RM-318 whilemaximum resolution factor (Rf) value is 0.763of primer RM-85 (Table 4).
UPGMA cluster analysis was performedusing Jaccard's similarity coefficient matricescalculated from SSR markers to generate adendrogram for 23 rice varieties. A pairwisesimilarity index (SI) was calculated and theUPGMA based dendrogram of 23 rice varietiesgenerated with Multivariate Statistical Package(MVSP) is presented in Fig. 4. It was observedthat, there are two major clusters (Table 5). Thefirst major cluster consists of two sub clusters.The rice variety Ratnagiri-3 formed the
Journal of Agriculture Research and Technology 145
Table 1. Molecular polymorphism, PIC values, RF valuesand size of loci revealed by SSR primers in ricegenotypes
Primer Range No. % PIV RFof ampli- of poly-fication alle- mor-(bp) les phism
RM-19 178-276 7 100 0.73 0.637
RM-122 160-190 7 100 0.65 0.667
RM-22 154-254 7 100 0.68 0.739
RM-335 100-300 7 100 0.72 0.583
RM-280 130-166 4 100 0.71 0.623
RM-310 65-108 4 100 0.45 0.640
RM-130 15-93 5 100 0.59 0.690
RM-318 90-170 7 100 0.78 0.574
RM-277 86-175 5 100 0.45 0.641
RM-276 62-143 6 100 0.78 0.628
RM-343 70-166 8 100 0.78 0.591
RM-60 135-165 4 100 0.48 0.755
RM-85 65-100 5 100 0.57 0.763
RM-112 65-149 8 100 0.65 0.752
RM-283 110-194 7 100 0.73 0.685
RM-338 116-184 6 100 0.70 0.657
RM-154 125-161 5 100 0.70 0.657
RM-272 57-154 7 100 0.70 0.657
RM-303 166-300 7 100 0.70 0.694
RM-332 37-162 4 100 0.61 0.602
RM-181 90-330 7 100 0.70 0.715
RM-224 94-245 8 100 0.65 0.716
RM-178 80-181 7 100 0.65 0.644
RM-206 63-166 7 100 0.74 0.716
RM-223 150-300 2 100 0.24 0.696
RM-3412 180-220 4 100 0.27 0.644
RM-248 102-110 3 100 0.45 0.697
RM-8094 110-209 3 100 0.50 0.609
pTA-248 600-700 3 100 0.48 0.660
RM-315 110-500 2 100 0.23 0.641
RM-5926 150-220 4 100 0.38 0.727
RM-218 120-200 5 100 0.57 0.647
RM-201 90-209 3 100 0.35 0.663
RM-493 220-250 3 100 0.38 0.756
RM-225 120-150 3 100 0.55 0.661
Total 184 100
Average 121.86- 5.26 100 0.58 0.675217.14

independent first sub cluster. Second sub clusterconsists of six varieties viz., Ratnagiri-1,Ratnagiri-2, Karjat-184, Karjat-7, Karjat-6, andKarjat-8. The second major cluster consisted oftwo sub cluster, first sub cluster consisted elevenrice varieties and second sub cluster includedfive rice varieties. Similar studies were made bydifferent authors using SSR markers (Panaud etal., 1996). The results obtained should also beuseful in the development of breeding programsas they provide a valuable tool for the preciseidentification of rice genotypes.
Total of 35 SSR primers were polymorphicand generated 184 alleles with an average of
5.26 alleles per primer. The number of allelesfor each SSR primer ranged from 2 to 8. Thepolymorphic information content (PIC) valuesof each primer ranged from 0.23 to 0.78 withan average of 0.58. The UPGMA grouped 23rice varieties into two main clusters which werefurther divided into two sub-clusters. The firstmajor cluster consisted seven rice varieties and16 varieties formed a second major cluster.Most of the closely related cultivars wereidentified with the fingerprinting based on thepolymorphic SSR primer pairs. These resultscould be useful for resolving the problem thatarises in seed certification programme as wellas the determination of genetic diversity of the
Nikam et al.146
Table 2. Clustering pattern of 23 rice varieties
Ckuster No. of Name of varietiesvarieties
I IA 1 Ratnagiri-3
IB 6 Ratnagiri-1, Ratnagiri-2, Karjat-184, Karjat-7, Karjat-6, Karjat-8
II IIA 11 Ratnagiri-4, Ratnagiri-5, Ratnagiri-24, Ratnagiri-73, Ratnagiri-711, Palghar-1, Palghar-2, Panvel-1, Panvel-2, Panvel-3, Phondaghat
IIB 5 Karjat-1, Karjat-2, Karjat-3, Karjat-4, Karjat-5
Fig. 4. Dendrogram constructed using Jaccard's Similarity Coefficient.

rice varieties very quickly. Similarly, it willprotect the varieties from commercialexploitation by others because of its uniquenessin amplification pattern.
D. P. NikamS. G. BhaveS. V. SawardekarN. B. GokhaleS. S. SawantD. M. PatilN. K. Mhatre
Plant Biotechnology Centre, College of Agriculture, Dr. Balasaheb Sawant Konkan KrishiVidyapeeth, Dapoli - 415 712 (India)September 9, 2014
References
Chakravarthi, B. K. and Naravaneni, R. 2006. SSR markerbased DNA fingerprinting and diversity study in rice(Oryza sativa L). African J. Biotech., 5(9): 684-688.
Doyle, J. J. and Doyle, J. L. 1990. Isolation of plantDNA from fresh tissue. Focus, 12: 13-15.
Kibria, K. 2009. Molecular marker based genetic diversityanalysis in aromatic rice genotypes using SSR andRAPD markers. Int. J. Sustain. Crop Prod., 4(1): 23-34.
Olufowote, J. O., Chen, Y. Xu, X., Park, W. D., Beachell,H. M., Dilday, R. H., Goto, M. and McCouch, S. R.1997. Comparative evaluation of within cultivarvariation of rice using microsatellite and RFLPmarkers. Genome, 40: 370-378.
Panaud, O., Chen, X. and Mc Couch, 1996. Developmentof microsatellite markers and characterization ofSimple Sequence Length Polymorphism (SSLP) in rice(Oryza sativa L.). Mol. Gen. Genet., 252: 597-607.
Rampant, O. F., Bruschi G, Abbruscato, P., Cavigiolo, S,Picco A. M., Borgo, L, Lupotto E and Piffanelli P.2011. Assessment of genetic diversity in Italian ricegermplasm related to agronomic traits and blastresistance (Magnaporthe oryzae). Mol Breeding, 27:233-246.
Rahman, M. M. 2011. Comparison among clustering inmultivariate analysis of rice using morphological traits,physiological traits and simple sequence repeatmarkers. American-Eurasian J. Agric. and Environ.Sci., 11 (6): 876-882.
Rychlik, W., Spencer, W. J. and Rhoads, R. E. 1990.Optimization of the annealing temperature for DNAamplification in vitro. Nucleic Acids Res. 1990 Nov.11;18 (21)
Singh, V. K. 2011. Determination of genetic relationshipsamong elite thermosensitive genic male sterile lines(TGMS) of rice (Oryza sativa L.) employingmorphological and simple sequence repeats (SSR)markers. Journal of Genetics, 90(1): 11-19.
Zhi-zhou, H. E. 2012. Genetic diversity of tropical hybridrice germplasm measured by molecular markers. RiceScience, 19(2): 21-28.
Journal of Agriculture Research and Technology 147
J. Agric. Res. Technol., 41 (1) : 147-149 (2016)
Persistence Toxicity of Newer Combination InsecticidesAgainst Shoot and Fruit Borer, Earias vittella (Fabricius) on
Okra
______________
Okra [Abelmoschus esculentus (L.)Monech] is one of the important vegetablecrops grown all over India and various tropicaland subtropical parts of the world. India ranksfirst in consumption and availability of okra. It isa source of vitamins, minerals and othernutritive ingredients. One of major constraintsfor the low productivity of okra in India, this is
the susceptibility of this crop to attack of pests'viz., insects, mite, bacteria and viruses. Thiscrop is infested by many insect pests like Eariasvittella, Earias insulana, Bemisia tabaci,Helicoverpa armigera, Thrips tabaci,Amrasca bigutulla bigutulla, Syleptaderogata and Dysdercus koiengii (Patel et al.,1970). The mixture producing greater

insecticidal action than the sum of theirindividual component is said to be synergisticand could be useful for insect control atpremium. The present study was carried out toinvestigate the persistence toxicity status ofsome ready mix insecticide formulations in okrafruit at the time of harvest.
The crop was raised at the research farm ofDepartment of Agricultural Entomology,Mahatma Phule Krishi Vidyapeeth, Rahuriduring kharif, 2013. Total eight treatmentsincluding control (unsprayed) were replicatedthrice in randomized block design. Mahycohybrid-10 variety was sown at a spacing of 30cm x 10 cm with a gross plot size of 3.0 x 2.7m2. Three foliar sprays of insecticides weregiven at an interval of 10 days starting from 50per cent flowering stage with the help ofknapsack sprayer by using spray fluid of 500litres ha-1. The persistent toxicity of differentinsecticides were studied against first instarlarvae of okra shoot and fruit borer, E. vittellaunder laboratory conditions by releasing them
on the sprayed tender fruits of okra. Themethod for mass breeding of the pest used byRattan Lal and Dhall (1965) was followed toensure continuous supply of desired stage oflarvae.
The treated fruits were plucked fromdifferent sprayed plots at 1, 3, 5 and 7 daysafter spray, separately in the labeled polythenebags and brought to laboratory. The treatedfruits were kept in glass containers, whichprepared separately for each treatment. Tenpre-starved first instars larvae were releasedwith the help of moist camel hair brush in glasscontainer on treated fruits and covered withmuslin cloth. Each treatment was replicatedfour times and untreated okra fruits served ascontrol. Mortality counts were taken after 24hours. Moribund insects were counted as dead.Mortality was corrected by Abbott's (1925)formula. The persistent or residual toxicity wasdetermined as per the method elaborated byPradhan and Venkatraman (1962). The product(PT) of average residual toxicity (T) and the
Table 1. Persistent toxicity of newer combination insecticides to Earias vittella on okra
Treatment Dose Corrected mortality (%) P T PT ORT PT50 RP ORPlitre-1 ––––––––––––––––––––––––––––––– (days)
1 DAS 3 DAS 5 DAS 7 DAS
Chlorpyriphos 50 EC + 2.0 ml 90.00* 76.67 65.56 47.78 7 70.00 490.00 3 7.74 1.45 3Cypermethrin 5 EC
Profenophos 40 EC + 2.0 ml 91.74 74.44 66.67 47.48 7 70.16 491.12 2 7.91 1.48 2Cypermethrin 4 EC
Deltamethrin 1 EC + 2.0 ml 90.80 74.44 61.11 44.44 7 67.50 472.50 4 6.89 1.29 4Triazophos 35 EC
Acephate 50 WP + 2.0 g 78.89 57.78 52.22 45.56 7 58.61 410.27 7 5.33 1.00 7Imidacloprid 1.8 WP
Acephate 25 EC + 2.0 ml 80.00 71.11 48.89 44.44 7 61.11 427.77 6 5.71 1.07 6Fenvalerate 3 EC
Cypermethrin 3 EC + 2.0 ml 82.22 71.11 53.33 43.33 7 62.50 437.50 5 5.95 1.12 5Quinalphos 20 EC
Indoxacarb 14.5 SC + 0.8 ml 95.56 82.22 68.89 58.89 7 76.39 534.72 1 9.98 1.80 1Acetamiprid 7.7 SC
* Mean of four replicationsDAS : Days after spraying PT50 : Persistent toxicity P : Period of observation in dayT : Average percentage mortality ORT : Order of relative toxicity RP : Relative persistenceORP : Order of relative persistence
Kamble et al.148
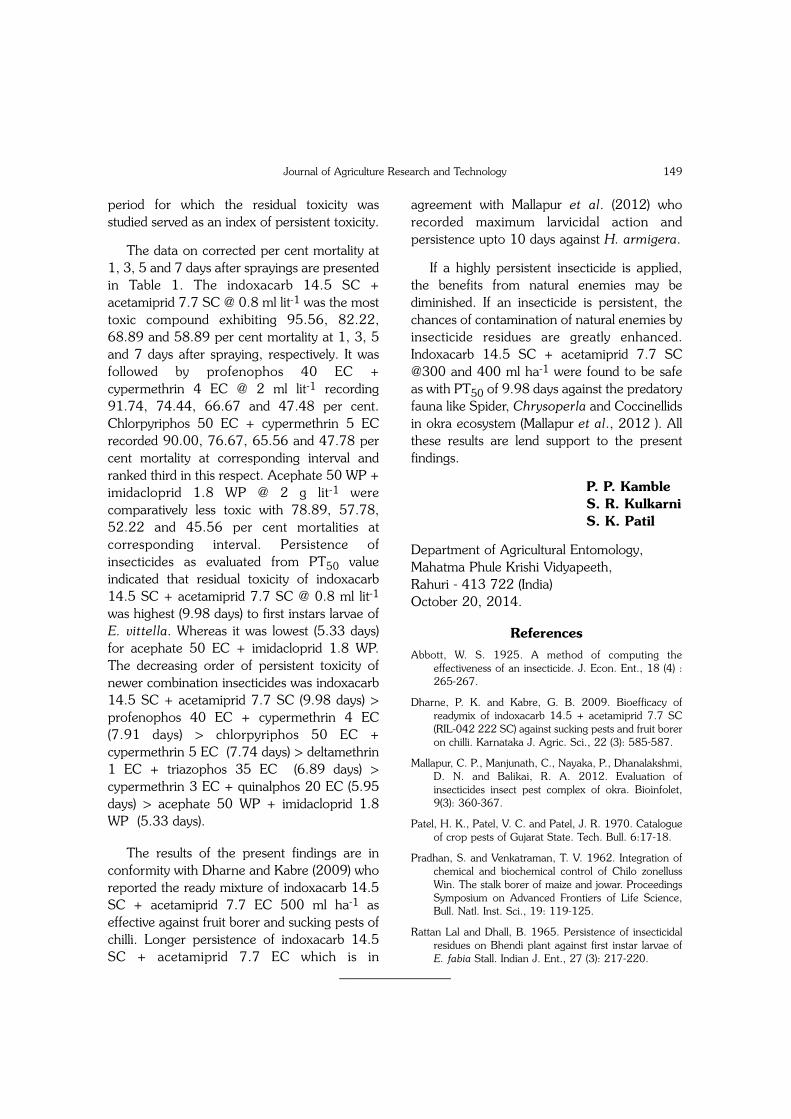
period for which the residual toxicity wasstudied served as an index of persistent toxicity.
The data on corrected per cent mortality at1, 3, 5 and 7 days after sprayings are presentedin Table 1. The indoxacarb 14.5 SC +acetamiprid 7.7 SC @ 0.8 ml lit-1 was the mosttoxic compound exhibiting 95.56, 82.22,68.89 and 58.89 per cent mortality at 1, 3, 5and 7 days after spraying, respectively. It wasfollowed by profenophos 40 EC +cypermethrin 4 EC @ 2 ml lit-1 recording91.74, 74.44, 66.67 and 47.48 per cent.Chlorpyriphos 50 EC + cypermethrin 5 ECrecorded 90.00, 76.67, 65.56 and 47.78 percent mortality at corresponding interval andranked third in this respect. Acephate 50 WP +imidacloprid 1.8 WP @ 2 g lit-1 werecomparatively less toxic with 78.89, 57.78,52.22 and 45.56 per cent mortalities atcorresponding interval. Persistence ofinsecticides as evaluated from PT50 valueindicated that residual toxicity of indoxacarb14.5 SC + acetamiprid 7.7 SC @ 0.8 ml lit-1
was highest (9.98 days) to first instars larvae ofE. vittella. Whereas it was lowest (5.33 days)for acephate 50 EC + imidacloprid 1.8 WP.The decreasing order of persistent toxicity ofnewer combination insecticides was indoxacarb14.5 SC + acetamiprid 7.7 SC (9.98 days) >profenophos 40 EC + cypermethrin 4 EC(7.91 days) > chlorpyriphos 50 EC +cypermethrin 5 EC (7.74 days) > deltamethrin1 EC + triazophos 35 EC (6.89 days) >cypermethrin 3 EC + quinalphos 20 EC (5.95days) > acephate 50 WP + imidacloprid 1.8WP (5.33 days).
The results of the present findings are inconformity with Dharne and Kabre (2009) whoreported the ready mixture of indoxacarb 14.5SC + acetamiprid 7.7 EC 500 ml ha-1 aseffective against fruit borer and sucking pests ofchilli. Longer persistence of indoxacarb 14.5SC + acetamiprid 7.7 EC which is in
agreement with Mallapur et al. (2012) whorecorded maximum larvicidal action andpersistence upto 10 days against H. armigera.
If a highly persistent insecticide is applied,the benefits from natural enemies may bediminished. If an insecticide is persistent, thechances of contamination of natural enemies byinsecticide residues are greatly enhanced.Indoxacarb 14.5 SC + acetamiprid 7.7 SC@300 and 400 ml ha-1 were found to be safeas with PT50 of 9.98 days against the predatoryfauna like Spider, Chrysoperla and Coccinellidsin okra ecosystem (Mallapur et al., 2012 ). Allthese results are lend support to the presentfindings.
P. P. KambleS. R. KulkarniS. K. Patil
Department of Agricultural Entomology, Mahatma Phule Krishi Vidyapeeth, Rahuri - 413 722 (India)October 20, 2014.
ReferencesAbbott, W. S. 1925. A method of computing the
effectiveness of an insecticide. J. Econ. Ent., 18 (4) :265-267.
Dharne, P. K. and Kabre, G. B. 2009. Bioefficacy ofreadymix of indoxacarb 14.5 + acetamiprid 7.7 SC(RIL-042 222 SC) against sucking pests and fruit boreron chilli. Karnataka J. Agric. Sci., 22 (3): 585-587.
Mallapur, C. P., Manjunath, C., Nayaka, P., Dhanalakshmi,D. N. and Balikai, R. A. 2012. Evaluation ofinsecticides insect pest complex of okra. Bioinfolet,9(3): 360-367.
Patel, H. K., Patel, V. C. and Patel, J. R. 1970. Catalogueof crop pests of Gujarat State. Tech. Bull. 6:17-18.
Pradhan, S. and Venkatraman, T. V. 1962. Integration ofchemical and biochemical control of Chilo zonellussWin. The stalk borer of maize and jowar. ProceedingsSymposium on Advanced Frontiers of Life Science,Bull. Natl. Inst. Sci., 19: 119-125.
Rattan Lal and Dhall, B. 1965. Persistence of insecticidalresidues on Bhendi plant against first instar larvae ofE. fabia Stall. Indian J. Ent., 27 (3): 217-220.
______________
Journal of Agriculture Research and Technology 149

Bakery industry in India is considered as oneof the major industries in food processing.Bakery products are gaining popularity asprocessed foods because of their availability,ready to eat convenience and reasonably goodshelf life. Wheat based baked products likebread, cookies, and cakes are popular amongthe baked products. Cookies hold an importantposition in snack foods due to varieties in taste,crispiness and digestibility. At present cookiesand biscuits are prepared from white flourwhich is of poor nutritional quality and low infiber content. Now a day interest in dietary fiberhas arisen, fiber rich food acquiring popularity.Millets, sorghum, and pulses are traditionallythe staple grains for household consumption(Dayakar Rao et al., 2007). In rural areas ofcentral Maharashtra, per capita consumption ofsorghum is around 60 kg per annumaccounting for almost half (48%) of per capitaconsumption of all cereals (Parthasarathy Raoet al., 2010). Worldwide about 700 millionpeople are nourished by sorghum, since itconstitutes a source of calories, protein andminerals. Sorghum is a major cereal in thesemi-arid regions of the world where it is animportant food and feed crop. It is a gluten-freecereal, which bears significance in the presentday scenario where the occurrence of CeliacDisease (CD), an immunological response togluten intolerance is on the rise. Grain sorghumcontains phenolic compounds like flavonoids(Shahidi and Naczk, 1995). The starch insorghum is digested slowly than other cereals(Klopfenstein and Hoseney, 1995) and hence itcould be beneficial to diabetics (Toomey, 1988).Sorghum is consumed in various forms aroundthe world like baked bread, porridge, tortillas,couscous, gruel, steam-cooked products,alcoholic and non-alcoholic beverages and so
on. Sorghum flour is becoming increasinglycommon in gluten-free baked goods, mostlybecause it has similar nutritional properties towheat, is light in colour and bland in flavour(Lovis, 2003). In addition to composite breads,several researchers have reported on theproduction of gluten-free bread from sorghumand much of this work is reviewed by Taylorand Dewar (2001). USA is the largest producerof sorghum in the world followed by India with7.15 million tons during 2007 and almostentire production of sorghum (95%) in thecountry (GOI, 2007, www.fao.org). There isenough potential in this crop to be utilized as araw material for bakery products and other foodindustries. Hence, the present research project"Composite Flour of Wheat and Sorghum forPreparation of Bakery Products" wasundertaken.
Sorghum grains of Phule Vasudha (variety)and SPH-1620 (hybrid) were obtained from theSorghum Improvement Project MPKV, Rahuri.Maida, vanaspati ghee, sugar, milk, yeast andother ingredients were purchased from the localmarket. The sorghum grains were cleaned toremove all extraneous material and ground toflour. Whole sorghum flour was used forpreparation of bakery products. Maida was
J. Agric. Res. Technol., 41 (1) : 150-154 (2016)
Composite Flour of Wheat and Sorghum for Preparation ofBakery Products
Table 1. Proximate composition of Maida and sorghumflour*
Pariculars Maida Phule SPH-vasudha 1620
Crude protein (%) 11.80 11.39 9.35Ash (%) 0.76 4.85 4.14Total sugar (%) 1.5 2.73 2.43Soluble protein (%) 1.01 0.99 0.78Crude fiber (%) 0.64 3.28 2.92
*Results are mean of five replications.

replaced with 0, 10, 20, 30, 40 and 50% byPhule Vasudha as well as SPH-1620. Thiscomposite flour was utilized in the preparationof bread and cookies. All other ingredients werekept constant in all composite flours.Composite flour of maida and sorghum usedfor preparation of cookies according to thestandard method of A.A.C.C. (1975) and themethods of Kent (1984) were followed in thebread making procedures. The bread andcookies were used to analyze for crude protein,crude fiber, total sugars, soluble protein and ashcontents using standard procedure ofA.O.A.C., (1990). These products wereevaluated by semi-trained judges for differentsensory attributes such as colour andappearance, texture, flavour and taste using 1to 9 point hedonic scale (Amerine et al., 1965).The mean for five judges was considered forevaluating the quality and statistical analysis wasdone as per the procedure given by Panse andSukhatme (1967).
The proximate composition of maida, PhuleVasudha and SPH-1620 was estimated. It isclear from the result that ash content and crudefiber content of Maida was lower than
sorghum. This might be due to use of superfineMaida. Crude protein (11.80%) and solubleprotein (1.01%) content were at higher level inMaida while ash, total soluble sugars and crudefiber content were higher in Phule Vasudha andSPH-1620 genotypes than maida (Table 1).Except crude protein all other nutrients contentin SPH-1620 were comparable with that ofPhule Vasudha. From the results it wasobserved that the incorporation of sorghumflour with maida improves the nutritional qualityof composite bread especially in terms of crudefiber, total sugars and ash content (Table 2).Phule Vasudhas' flour addition to maida forpreparation of bread showed better results incase of all treatments than SPH-1620s' flouraddition to maida. Statistical observationsshowed significant results for all nutritionalquality parameters except soluble protein.
The control sample was found to containhighest crude protein (10.37%) whereas lowestresults were observed for treatment T5(10.21%) in case of P. Vasudha and fortreatment T5 (8.90%) in case of SPH-1620.Decrease in crude protein content with increasein sorghum flour was due to lower protein
Table 2. Effect of different levels of sorghum flour on nutritional and sensory quality of bread
Treat- Nutritional quality Sensory qualityment ––––––––––––––––––––––––––––––––––––––––––––– ––––––––––––––––––––––––––––––––––––––––––––––––
Crude Ash Crude Total Soluble Colour Flavour Taste Crust/ Overallprotein (%) fibre sugar protein crumb accepta-(%) (%) (%) (%) texture bility
T0 10.37 0.90 0.51 4.80 1.06 8.60 8.80 8.40 8.60 8.63T1 10.21 1.45 0.83 4.96 1.02 8.00 7.60 8.30 8.40 8.13T2 10.04 2.01 1.16 5.13 0.98 7.30 7.20 8.10 8.00 7.85T3 9.88 2.54 1.48 5.29 0.94 3.70 3.90 4.60 3.90 4.30T4 9.72 3.08 1.84 5.45 0.90 2.70 2.40 3.70 3.50 3.08T5 9.56 3.61 2.14 5.62 0.86 2.10 2.00 2.90 2.00 2.30SE (m) ± 0.023 0.036 0.024 0.022 0.030 0.15 0.13 0.20 0.16 0.10CD at 5% 0.066 0.104 0.069 0.065 0.087 0.43 0.38 0.57 0.45 0.29
Whereas, T0=100% Maida+0% sorghum flour; T1=90% Maida+10% sorghum flour; T2=80% Maida+20% sorghum flour;T3=70% Maida+30% sorghum flour; T4=60% Maida+40% sorghum flour; T5=50% Maida+50% sorghum flour, Results aremean of three replications.
Journal of Agriculture Research and Technology 151

content in sorghum flour as compared tomaida. Similar effect has been reported by Eddyet al. (2007) for Maida/cassava compositebread. This finding was also agreed with Mongiet al. (2011) who reported that the substitutionof Maida with cocoyam flour decreased crudeprotein content of bread. The breads wereprepared using sorghum flour at different levelsranging from 0 to 50 per cent with maida.From sensory evaluation of composite bread itwas observed that addition of Phule Vasudhaflour for preparation of composite breadshowed higher sensory score values for colour,flavour, taste, crumb and crust texture andoverall acceptability than addition of SPH-1620flour in the maida for bread preparation (Table2). It can be conclude that addition of PhuleVasudhas' flour for preparation of compositebread is better than SPH-1620s' flour. Overallacceptability is the total reflection of the scoresobtained for colour, texture, flavour, and tasteof the bread. There was decrease in all theseparameters with the addition of sorghum flourin the composite bread. The overallacceptability parameter also scored minimum athighest level of addition of sorghum flour in thecomposite bread. Breads baked with 10 and20% sorghum flour were not significantlydifferent in overall acceptability from the
control. Bankar et al. (1986), based on theirresults, suggested that bread containing up to20 per cent sorghum flour could be baked withacceptable sensory quality. Composite breadproduced from composite flours at the ratios90:10, 80:20 and 70:30 Maida: sorghum wasfound to yield acceptable bread quality (Taha,2000).
It was observed that flour of Phule Vasudhaaddition to maida for preparation of cookiesshowed better results in case of all treatmentsthan flour of SPH-1620 addition to maida. Itmay be due to Phule Vasudha have superiornutritional quality than SPH-1620 (Table 3).The control sample was found to containhighest crude protein (5.59%) whereas lowestreadings were observed for treatment T5(5.39%) in case of P.Vasudha and for treatmentT5 (4.10%) in case of SPH-1620. Decrease incrude protein content with increase in sorghumflour was due to lower protein content insorghum flour as compared to Maida (Gupta etal., 2011 and Adebowale et al., 2012). Thecontrol sample was found to contain lowestcrude fiber content (0.19%) whereas highestreadings were observed for treatment T5(1.96%) in case of P.Vasudha and for treatmentT5 (1.68%) in case of SPH-1620. Increase in
Table 3. Effect of different levels of sorghum flour on nutritional and sensory quality of cookies
Treat- Nutritional quality Sensory qualityment ––––––––––––––––––––––––––––––––––––––––––––– ––––––––––––––––––––––––––––––––––––––––––––––––
Crude Ash Crude Total Soluble Colour Flavour Taste Texture Overallprotein (%) fibre sugar protein accepta-(%) (%) (%) (%) bility
T0 5.59 0.40 0.19 22.09 0.71 8.80 8.80 8.80 8.60 8.75T1 5.43 0.85 0.52 22.25 0.67 8.20 8.10 8.50 8.20 8.25T2 5.26 1.30 0.85 22.40 0.62 8.10 7.80 8.10 7.80 7.95T3 5.08 1.75 1.17 22.56 0.58 6.90 7.50 7.60 7.40 7.35T4 4.91 2.21 1.51 22.70 0.54 4.00 4.30 4.10 3.60 4.00T5 4.75 2.67 1.82 22.87 0.52 3.10 3.20 2.90 2.80 3.00SE (m) ± 0.029 0.025 0.019 0.017 0.010 0.14 0.17 0.15 0.16 0.10CD at 5% 0.085 0.073 0.055 0.049 0.028 0.39 0.48 0.43 0.44 0.30
*Foot notes as per Table no 2.
Chavan et al.152

crude fiber content with increase in sorghumflour was due to higher crude fiber content insorghum flour as compared to maida (Chavanand Patil, 2010 and Chavan et al., 2009).
Cookies prepared with 10, 20 and 30 percent sorghum flour were not significantlydifferent in overall acceptability from thecontrol (Table 3). Cookies prepared from 40and 50 per cent sorghum flour showed lowscore for overall acceptability. Sanaa et al.(2006) reported that the substitution of maidawith 30 per cent of barley, rye, millet orsorghum whole grain meal had no significanteffects on the quality (i.e. cookie height anddiameter) of cookie products. Gupta et al.(2011) reported that the cookies containing 30per cent barley seed flour was found to be mostacceptable by the panelists. The resultsobtained are in general agreement with thoseresults from the literature.
Sorghum flour addition into breadformulation had considerable effects onphysicochemical and sensory properties ofbread. It may be concluded from the presentstudy that sorghum flour can be successfullyincorporated in refined wheat flour bread up toa level of 20 per cent to yield bread ofenhanced nutritional quality with acceptablesensory attributes. But in case of cookies it wasfound that cookies of good nutritional andsensory qualities could be produced using 30per cent level of sorghum flour substitution inmaida without affecting the cookies qualityadversely and at the same time reduce theeconomic and domestic load on maida usage.
U. D. ChavanK. V. YewaleB. Dayakar Rao
Department of Food Science and Technology,Mahatma Phule Krishi Vidyapeeth, Rahuri - 413 722 (India)December 5, 2014
ReferencesA.A.C.C. 1975. American Association of Cereal Chemists,
1975. Approved A.A.C.C. Method. pp. 1-4.
A.O.A.C. 1990. Official methods of analysis, 15th Ed.Association of Official Analytical Chemists.Washington DC, USA.
Adebowale, A. A., Adegoke, M. T., Sanni, S. A.,Adegunwa, M. and Fetuga, G. O. 2012. Functionalproperties and biscuit making potential of sorghum-wheat flour composite. Amer. J. Food Technology7(6): 372-379.
Amerine, M. A., Pangborn, R. M. and Rossler, E. B. 1965.Principles of sensory evaluation of foods. Acad. Press,New York. pp. 350-376.
Bankar, J. R., Chavan, J. K. and Kadam, S. S. 1986.Effects of incorporation of sorghum flour in wheatmaida on physical and sensory properties of bread,buns, cookies and biscuits. J. Maharashtra Agric. Univ.11(2): 216-218.
Chavan, U. D., Patil, J. V. and Shinde, M. S. 2009.Nutritional and roti quality of sorghum genotypes.Indonesian J. of Agric. Sci. 10: 80-87.
Chavan, U. D. and Patil, J. V. 2010. Grain SorghumProcessing. IBDC, Publishers, Lucknow, India. pp.440.
Dayakar Rao, B., Seetharama, N., Elangovan, M., Vilas, A.and Ratnavathi, C. 2007. Changing scenario of milletscultivation in India. Souvenir, Farm Fest-2007, 23-25th Feb. at Uppalam, Puducheri.
Eddy, N. O., Udofia, P. G. and Eyo, D. 2007. Sensoryevaluation of wheat/cassava composite bread andeffect of label information on acceptance andpreference. African J. of Biotech., 6(20): 2415-2418.
GOI, 2007. Agriculture statistics at a glance. Directorate ofEconomics and Statistics, New Delhi.
Gupta, M., Singh, A. B. and Ghannam, N. A. 2011. Effectof barley flour and freeze-thaw cycles on texturalnutritional and functional properties of cookies. Foodand Bioproducts Processing. 89: 520-527.
Kent, N. L. 1984. Technology of cereals: An Introductionfor students of Food Science and Agriculture. Thirdedition. Pergamon Press, Oxford. 8(2): 67-78
Klopfenstein, C. F. and Hoseney, R. C. 1995. Nutritionalproperties of sorghum and millets. Dendy, D. A. V125 St Paul, Minn.: American Association of CerealChemistry.
Lovis, L. J. 2003. Alternatives to wheat flour in bakedgoods. Cereal Foods World. 48: 61-63.
Mongi, R. J., Ndabikunze, B. K., Chove, B., Mamiro, P.,
Journal of Agriculture Research and Technology 153

Ruhembe, C. and Ntwenya, J. 2011. Proximatecomposition, bread characteristics and sensoryevaluation of cocoyam-wheat composite breads.African Journal of Food, Agriculture, Nutrition andDevelopment. 11(7): 5586-5600.
Panse, V. S. and Sukhatme, P. V. 1967. Statisticalmethods for agricultural workers, ICAR, New Delhi.pp. 70-72.
Parthasarathy Rao, P., Basavaraj, G., Ahmad, W. andBhagavatula, S. 2010. An analysis of availability andutilization of sorghum grain in India. Journal SATAgricultural Research. 8: 1-8.
Sanaa R., El-Sayed, M. and Abdel, A. 2006. Pastingproperties of starch and protein in selected cereals andquality of their food products. Food Chemistry. 95:
9-18.
Shahidi, F and Naczk, M. 1995. Phenolics in cereals andlegumes Lancaster, Pea: Technomic Publishing Co.pp. 9-52.
Taha, A. O. M. 2000. The role of sorghum flour starches(Amylose and amylopectin) in composite bread quality.M.Sc. thesis, University of Khartoum, Sudan.
Taylor, J. R. N. and Dewar, J. 2001. Developments insorghum food technologies. In: Taylor, S. ed.Advances in Food and Nutrition Research. San Diego,CA: Academic Press. 43: 217-264.
Toomey, G. 1988. Sorghum as substitute. Food enterprisesfor Indian woman. Int. Develop. Res. Centre Reports17(3): 20-21.
J. Agric. Res. Technol., 41 (1) : 154-155 (2016)
Stability Analysis for Grain Yield in Rice
______________
Rice (Oryza sativa E.) is the most importantfood crop of developing world and the staplefood of more than 60 per cent of Indianpopulations. Varietal adaptability toenvironmental fluctuation is important forstabilization of crop production over the years.An information on genotype x environment (Gx E) interaction and yield stability analysis leadsto be an important in measuring varietalstability and suitability for cultivation acrossseasons and ecological zones. Some model likeFinlay and Wilkinson (1963), Eberhart andRussell (1966), Perkins and Jinks (1968) andFreeman and Perkins (1971) have been usedfor assessing the stability performance of cropvarieties. Therefore the present investigationwas carried out to assess the performance ofrice varieties for grain yield over the season inKonkan region (coastal) of Maharashtra state byusing Eberhart and Russell Model.
Six rice varieties viz., Ratnagiri 73,Ratnagiri 24, Ratnagiri 1, Ratnagiri 3.
Ratnagiri 711 & Ratnagiri 2 were evaluated forgrain yield during kharif 2009 to 2013 for fiveyears at Agricultural Research Station,Shirgaon, Ratnagiri (MS). All these varietieswere developed by Dr. B. S. Konkan KrishiVidyapeeth, Dapoli (MS) and recommended forcommercial cultivation in Maharashtra State.The seeds were sown in raised beds and 25days old seedlings were transplanted in mainfield under puddled condition. For eachvarieties 2-3 seedlings hill-1 were planted at 20x 15 cm spacing with plot size of 10 R (Guntha)in randomized block design (RBD) with fourreplications. Recommended package ofpractices were followed to raise healthy plant.Observations were recorded plot-1 basis forgrain yield. Stability parameters were estimatedfollowing Eberhart and Russell (1966) model.
Analysis of variance revealed that thevarieties and environment showed highlysignificant differences for grain yield suggestingpresence of variability among the varieties and
Chavan et al.154

environment. The linear component ofenvironment was highly significant for grainyield, indicating influence of environment onvarieties for expression of grain yield. Thesignificant variance due to pooled deviation wasobserved for grain yield indicated large portionof G x E accorded by non linear component.
The estimation of stability parameters forgrain yield in rice varieties are depicted in Table1. Among the six varieties, Ratngiri 3 exhibitedhigh mean, regression coefficient near to oneand non significant deviation from regressionindicating stability of Ratnagiri 3 over allenvironmental condition (mean, 39.396 q, bi-1.198 and S2di- (-0.088)). The varietyRatnagiri 1 exhibited high mean, regression
value more than one and non-significantdeviation from regression. Flence this genotypeis suitable for favorable environment and thereis reduction in yield unfavorable environment.From present study, it is concluded that varietyRatnagiri 3 was stable in performance for grainyield while as Ratngiri 1 was suitable forfavorable environment.
B. D. WaghmodeS. R. KadamP. P. Desai
Agricultural Research Station,Shirgaon - 415 629 (India)December 17, 2014.
ReferencesEberhart, S. A. and Russell, W. A. 1966. Stability
parameters for comparing varieties. Crop Sci 6: 26-40.
Finlay. W. and Wilkinson, G. W. 1963. The analysis ofadaptation in a plant breeding prog J. Agric Res., 14:742-754.
Freeman, G. H. and Perkins, J. M. 1971. Environmentaland genotype-environmental components ofvariability. VII. Relations between genotypes grown-indifferent environments and measures of theseenvironments. Heredity, 27: 15-33.
Perkins, J. M. and Jinks, J. L. 1968. Non-linearinteractions for multiple inbred lines. Heredity, 23:525-535.
Table 1. Stability parameters for grain yield in rice
Variety Grain yield (q ha-1)–––––––––––––––––––––––––––––––––Mean bi S2di
Ratnagiri - 73 29.931 0.353 1.291Ratnagiri - 24 32.282 0.912 -0.952*Ratnagiri - 1 38.847 1.567 0.274Ratnagiri - 3 39.396 1.198 -0.088Ratnagiri - 711 33.552 1.047 0.704*Ratnagiri - 2 38.954 0.924 -0.554*
* Significance at 5% level
J. Agric. Res. Technol., 41 (1) : 155-158 (2016)
Preparation of Skim Milk Lassi by Incorporation of Ginger(Zingiber officinale L.) Juice
______________
Lassi is an ancient thirst quenchingrefreshing beverage. In Maharashtra generallylassi is prepared from buffalo milk curd whichgives creamy appearance with pleasant mildacidic sweet taste and rich aroma. Milk fat iscomposed of higher concentration of saturated
fat and cholesterol which is a matter concernfor caloric conscious people. Hence, preparinglassi from buffalo skim milk will help in greatlyrestricting the caloric intake. Skim milk lassimay affect the rich taste and pleasant flavor,however addition of natural herbal flavor may
Journal of Agriculture Research and Technology 155

suppress the problem.
Ginger, being a major spice, is havingflavouring and medicinal value in food. Freshginger has been used for cold induced diseases,asthma, nausea, cough, heart palpitation,swelling and rheumatism. The project aimed atdeveloping simple technology for preparationof skim milk lassi by incorporation of ginger(Zingiber officinale L) juice was conducted.
Fresh buffalo milk was procured from theDairy unit of the College of Agriculture, Dapolifor the preparation of lassi. Lassi was preparedas per procedure suggested by Sharma (2006)with slight modifications. The ginger juice wasprepared and analysed in the laboratory.Ginger juice contained 12.43 per cent totalsolids, 1.2 per cent fat, 1.5 per cent proteinand 0.19 per cent acidity (Table 1). Ginger juicewas added as a flavouring agent as per different
treatments. The prepared lassi from differenttreatments was served to a panel of an averageten judges for sensory evaluation.
The treatments were plain lassi as a control(T0), ginger juice @ 1.5, 3.0, 4.5 and 6.0 percent of lassi as T1, T2, T3 and T4, respectively.The fat content of lassi was estimated usingstandard gerber method as per IS:1224 (Part -I, 1977). The protein was determined byestimating per cent nitrogen by Micro-Kjeldhalmethod as recommended in IS : 1479 (Part - II,1961). The per cent nitrogen was multiplied by6.38 to find out the protein percentage in lassi.The total solids content was determined byGravimetric method as per IS : 1479 (Part - II,1961). The titratable acidity of lassi expressedas per cent lactic acid was determinedaccording to IS : 1479 (Part - I, 1960). The ashcontent of lassi was determined by theprocedures given in IS : 1479 (Part - II, 1961).The sensory attributes of the product such ascolour and general appearance, body andtexture (consistency) and flavour were studiedby the house of panel of an average ten judgesusing nine point hedonic scale as per IS : 6273(Part - II, 1971).
It was revealed that the total solids contentof lassi showed gradual increase with the
Table 1. Chemical quality of skim milk and ginger juice (%)
Constituent Skim milk Ginger juice Curd
Total solids 9.31 12.43 9.42Fat 0.55 1.2 0.52Protein 3.53 1.5 3.51Ash 0.81 - 0.78Acidity 0.15 0.19 0.78
Table 2. Chemical and sensory quality of skim milk ginger lassi (%) and cost of production
Treat- Chemical quality Sensory quality Cost of productionment –––––––––––––––––––––––––––––––––––––– –––––––––––––––––––––––––––––––––––––– –––––––––––––––––––
Total Fat Prot- Ash Titra- General Body & Flavour Overall Cost Costsolids ein table appea- texture accept- 100-1 kg-1
acidity rance (consis- ability g (Rs.) (Rs.)tency)
T0 18.19 0.49 3.49 0.80 0.83 7.75 7.36 6.36 7.30 3.40 34.08T1 18.39 0.52 3.46 0.79 0.81 7.71 7.48 7.23 7.45 3.48 34.84T2 18.49 0.52 3.43 0.78 0.79 7.77 7.62 7.53 7.63 3.56 35.60T3 18.63 0.53 3.39 0.77 0.79 7.73 7.51 7.12 7.43 3.63 36.35T4 18.72 0.54 3.37 0.77 0.77 7.62 7.50 7.06 7.38 3.71 37.11SE± 0.010 0.005 0.010 0.005 0.007 - - - - - -CD at 0.029 0.013 0.028 0.016 0.022 - - - - - -0.01%
Raje-Nimbalkar et al.156

increase in the level of ginger juice (Table 2).This simultaneous increased from T0 to T4may be due to higher amount of total solidscontent in ginger juice. The lowest total solidscontent was noticed at T0 (18.19 per cent)while highest total solids content was observedat T4 (18.72%) i.e. lassi prepared with 6.0 percent ginger juice. The incorporation of gingerjuice increased the fat content of lassi. Theincreasing trend of fat content can be attributedto the higher amount of fat in ginger juice thanthat of skim milk. The lowest fat content incontrol may be due the fact that no ginger juicewas added in lassi. Addition of ginger juice hadsignificantly affected the protein content oflassi. Increase in the level of ginger juiceshowed gradual decrease in protein content oflassi. This decrease can be attributed to verylow protein content of ginger juice (1.5 percent). The highest protein content wasobserved at treatment T0 (control) i.e. 3.49 percent whereas lowest value was at treatment T4(6.0% ginger juice) i.e. 3.37 per cent. Additionof ginger juice had significantly affected the ashcontent of lassi. It was observed thatincorporation of ginger juice decreases the ashcontent of lassi. Lowest ash content in lassi(0.77%) was observed equally at T3 and T4 i.e.4.5 and 6.0 per cent level of ginger juice andthe highest (0.80%) at control (T0) treatment.The acidity of lassi showed declining trend withan increase in the level of ginger juice i.e. 0.83,0.81, 0.79, 0.79 and 0.77 per cent fortreatment T0, T1, T2, T3 and T4, respectively.It was observed that incorporation of gingerjuice decreases the acidity of lassi which may bedue to low acidity of ginger juice (0.19%) ascompared to curd (0.78%).
From the sensory scores it was observedthat the score for colour and appearance wasincreased upto treatment T2 thereafter scoredeclined simultaneously (Table 3). The highestscore (7.77) was obtained by the treatment T2
i.e. lassi incorporated with 3.0 per cent gingerjuice. Very negligible differences were observedin between all the treatments. The data showedthat the lassi prepared with 3.0 per cent level ofginger juice recorded the highest score forconsistency (body and texture) (7.62). Thelowest score was observed at treatment T0(control) i.e. lassi without addition of gingerjuice. Lassi prepared with 3.0 per cent gingerjuice possessed highest score for flavour (7.53)as it was liked much by the judges which maybe due to its sweet and typical acceptableginger flavour. Overall acceptability scoresindicated that lassi incorporated with 3.0 percent ginger juice is superior over rest oftreatments. However, ginger juice at the rate of1.5 per cent can produce good quality lassi.Higher level of ginger juice (4.5 and 6.0 percent) showed reduction in acceptability scoresfor lassi.
The cost of lassi production was worked outby considering the prevailing retail costs ofingredients only and other cost remainedconstant for all treatments for which notaccounted for cost estimation (Table 4). Thehighest cost (Rs. 37.11 kg-1) was recorded incase of lassi prepared with 6.0 per cent gingrjuice (T4) whereas lowest cost (Rs. 34.08 kg-1)recorded for lassi prepared without ginger juice(T0). It was observed that cost of the lassi wasincreased with the increase in the level of gingerjuice. The production cost of most acceptablelevel (T2) was Rs. 35.60 kg-1.
It may be concluded from the results thatginger juice could successfully be utilized forlassi preparation. Addition of ginger juice inlassi improved the sensory quality of theproduct. Besides typical flavour it also addsmedicinal properties to the product. Suchflavouring did not appreciably affect thecomposition of lassi. The most acceptablequality lassi can be prepared by using 3.0 percent ginger juice.
Journal of Agriculture Research and Technology 157

F. A. Raje-NimbalkarA. A. KarandeS. V. JoshiR. G. BurteV. S. Dandekar
Dr. Balasaheb Sawant Konkan KrishiVidyapeethDapoli - 415 712 (India)December 31, 2014.
ReferencesIS : 1224, Part - I (1977). Determenation of fay by Gerber
method (Revised). Indian Standard Institution, ManakBhavan, New Delhi, India
IS : 1479, Part - I (1960). Methods of test for dairy industrychemical analysis of milk. Indian Standard Institution,Manak Bhavan, New Delhi, India
IS : 1479, Part - II (1961). Methods of test for dairy industrychemical analysis of milk. Indian Standard Institution,Manak Bhavan, New Delhi, India
IS : 6273, Part _ II (1971). Guide for sensory evaluation offoods methods and evaluation cards. Indian StandardInstitution, Manak Bhavan, New Delhi, India
Sharma Ramakant. 2006. Production, processing qualityof milk products. First edition. International BookDistributing Co. Luck now (UP).
J. Agric. Res. Technol., 41 (1) : 158-161 (2016)
Effect of EM Solution on Growth and Yield of Groundnut
______________
Groundnut is an important oil seed crop aswell as food crop. It is necessary to reduce thedependency on external inorganic inputs toensure quality and food safety of groundnut tohumans. Misuse and excessive use of chemicalfertilizers and pesticides have often adverselyaffected the environment and created issues likefood safety, food quality, human and animalhealth etc. Microbial inoculants are thesustainable natural resources which help toincrease yield and quality of crops, withoutlarge scale investment of capital and labour(Pham, 2004). Effective microorganisms (EM) isa mixture of beneficial microorganism, which isused as a microbial inoculants in cropproduction. The basic purpose of EM is therestoration of healthy ecosystem in both soiland water by using four major genera ofmicroorganisms such as lactic acid bacteria,photosynthetic bacteria, yeast andactinomycetes. The photosynthetic bacteria eg.Rhodopseudomonas comprise of a group ofindependent, self supporting microbes. These
bacteria synthesis useful substances fromsecretions of roots, organic matter and/orharmful gases, by using sunlight and the heat ofsoil as source of energy. The useful substancesdeveloped by these microbes promote growthand development of plants. Lactic acid bacteriaeg Lactobacillus bulgaricus produce lactic acidfrom sugars and other carbohydrates which aredeveloped by photosynthetic bacteria andyeasts. These bacteria also producebacteriocins that are ribisomally synthesized,cationic, hydrophobic peptides with bactericidalaction against many food spoilage andpathogenic bacteria (Bibek et al., 2001). Yeastssynthesize antimicrobial and other usefulsubstances like vitamins required for plantgrowth from amino acids and sugars secretedby photosynthetic bacteria, organic matter andplant roots. Actionmycete is a most widelydistributed group of microorganisms in natureand the antibiotics produced by Streptomycesspp. degrade fungal cell wall inhibits it'sdevelopment and maintain healthy ecosystem
Raje-Nimbalkar et al.158

(Errakhi et al. 2007). Different species ofeffective microorganisms (photosynthetic andlactic acid bacteria, yeast and actionmycete) aremutually compatible with one another and cancoexist in liquid culture. In order to providenutrients to the crops and maintain the soilhealthy, effective microorganisms have beenrecommended by many scientists (Higa andParr 1994).
Laboratory study was carried out in the atBiological Nitrogen Fixation Scheme, Collegeof Agriculture, Pune and field trial wereconducted at National Agriculture ResearchProject, Ganeshkhind, Pune during 2010 to2012 on summer groundnut. Consortia of purecultures of yeast (Saccharomyces cervisiae),lactic acid bacterium (Lactobacillusbulgaricus), Streptomyces and photosyntheticbacterium (Rhodococcus spp.) were used asEM solution. Commercial EM culture in liquidform was obtained from the Nirdhar Trust,Eden Court, Pune-5.
For compatibility study between fourisolates, the sterilized petriplates were pouredaseptically with nutrient agar medium. Aftersolidification of medium pure culture of
Streptomyces was transferred with the help ofinoculating needle by putting one spot at adistance of 2 cm from the centre of thepetriplate, whereas the pure culture ofSaccharomyces cervisiae was placed on sameplate by keeping 2 cm distance fromStreptomyces. Similar procedure was followedfor compatibility of all isolates with each other.These plates were incubatated at 28°Ctemperature for 4 days and observations wererecorded on the area covered by the respectiveisolates.
The field experiment was laid out inRandomized Block Design with fourreplications and five treatments viz., T1(Control), T2 (100% RDF), T3 (Rhizobium +75% RDN), T4 (Rhizobium + Phule EM +75% RDN ) and T5 (Rhizobium + CommercialEM + 75% RDN) The summer groundnutvariety, SB-X1 was used. EM solution @ 10 mlkg-1 of seed and Carrier based inoculants ofRhizobium and PSB @ 25 g kg-1 of seed wereused for seed treatment at the time of sowing.The well decomposed farm yard manure @ 5MT and recommended dose of chemicalfertilizers for groundnut 25:50:00 NPK kg ha-1
were applied. The observations on number of
Table 1. Effect of EM solution on growth and yield parameters and monetary returns of groundnut (Pooled mean, Summer2010 to Summer 2012)
Treat- No. of No. of Dry Pod Dry Gross Cost of Net B:Cments nodules pods module yield matter monetary cultiva- profit ratio
plant-1 plant-1 wt. plant-1 q ha-1 wt. plant-1 returns tion Rs. ha-1
(g) (g) (Rs. ha-1) (Rs. ha-1)
T1 157.08 34.00 175.00 20.95 31.47 58368 28082 30285 2.01
T2 176.91 43.91 232.75 29.03 35.81 80796 30039 50757 2.63
T3 160.66 43.16 210.5 28.56 34.78 79390 29560 49830 2.70
T4 175.33 49.66 234.5 32.11 37.05 89762 29923 59838 3.13
T5 164.58 41.75 229.58 31.98 36.99 88951 29923 59027 3.09
SE 4.89 1.21 6.11 0.79 0.39 2241 - 2241 0.10
CD at 5% 14.51 3.58 18.12 2.35 1.18 6640 - 6640 0.30
CV 5.86 5.69 5.65 5.56 2.26 5.64 - 8.97 7.64
T1 - Control, T2 - 100% RDF, T3 - Rhizobium + 75% RDN, T4 - Rhizobium + Phule EM + 75% RDN, T5 - Rhizobium +Commercial EM + 75% RDN
Journal of Agriculture Research and Technology 159

nodules plant-1, dry nodule wt. plant-1, numberof pods plant-1, dry matter weight plant-1 andpod yield ha-1 were recorded.
The data presented in Table 1 reveled that,treatment T4 recorded significantly increasednumber of nodules plant-1 (175.33) overcontrol (157.08) and found at par with othertreatments. Similar results were recorded byIqbal and Jilani (2000) in groundnut crop thatthe application of EM enhanced the Rhizobiumactivity thereby increasing number of effectivenodules and nitrogen content in plants andstrengthened the seed inoculation benefits.Significantly higher number of pods plant-1
(49.66) were obtained in the T4 and foundsignificantly superior over rest of thetreatments. Maximum dry weight of nodule(234.5 mg plant-1) was observed in T4 andfound at par with other treatments whereastreatment T1 recorded 175 g dry nodule weightplant-1. Bajwa and Javaid (2002) found that EMapplication in maize crop enhanced the growthof plant during reproductive stage than thevegetative stage. Significantly higher pod yield(32.11 q ha-1) was obtained in treatment T4,followed by T5, both were at par and superiorover T2 and T3, which recorded pod yield of29.03 and 28.56 q ha-1, respectively and wereat par, whereas, lowest pod yield (20.95 q ha-1)was recorded in control (T5). The similar resultsof EM application on pod yield were recordedby Yousaf et al. (2000) in groundnut.Treatment T4 recorded significantly highest drymatter weight plant-1 (37.05 g) over othertreatments, followed by T5. Javaid et al. (2000)reported that in green gram root dry biomasswas enhanced by EM application in greenmanure amended soils. Results of theeconomics of the treatments revealed highernet profit of Rs. 59,838/- ha-1 was obtainedwith T4, followed by T5 of Rs. 59027/- andboth were at par, with B:C ratio of 3.13 and3.09, respectively (Table 2). The soil microbial
population in different treatments differedsignificantly from each other at 50 per centflowering stage. The soil bacterial populationranged from 11.5 105 cfu g-1 soil to 32 105cfu g-1 soil. The soil actinomycetes populationranged from 6.5 104 cfu g-1 soil to 21.5 104cfu g-1 soil, while the soil fungi number rangedfrom 7 103 cfu g-1 soil to 26 103 cfu g-1 soil.Mean soil microbial population was increased inall treatments and found maximum in T4 whileit was minimum in T2. Overall results exhibitedthat there was 3 folds increase in soil microbialpopulation due to use of effectivemicroorganisms, over the control (Table 3).Higa and Parr (1994) reported that themicroflora of soil can be controlled through theapplication of mixed cultures of selectedbeneficial and effective microorganism.
It can be concluded that the application ofPhule EM (Yeast, Lactic acid bacteria,Photosynthetic bacteria Rhodopseudomonasand Streptomyces spp.) and Rhizobium as seedtreatment in combination with 75 per cent ofrecommended dose of chemical fertilizersshowed better effect on growth and health ofgroundnut crop as well as on microbial activityin soil.
Table 2. Effect of EM on soil microbial population at 50%flowering stage of crop (cfu g-1 soil)
Treatments Soil microbial population––––––––––––––––––––––––––––––––Bacteria Actinomy- Fungi(105) cetes (104) (103)
T1 17.0 8.0 9.0 T2 11.5 6.5 7.0T3 22.0 10.0 10.0T4 32.5 21.5 26.0T5 28.5 19.5 22.0Initial cfu count 8.0 3.0 5.0
T1 - Control, T2 - 100% RDF, T3 - Rhizobium + 75%RDN, T4 - Rhizobium + Phule EM + 75% RDN, T5 -Rhizobium + Commercial EM + 75% RDN
Shete et al.160

M. H. SheteC. R. KshirsagarT. K. Narute
Biological Nitrogen Fixation Scheme, College of Agriculture, Pune - 411 005 (India)January 31, 2015.
ReferencesBajwa, R. and Javaid, A. 2002. Effect of soil sterilization,
organic amendments and EM application on growth,yield and VA mycorrhizal colonization in maize,Pakistan J. Phytopath. 14(1): 62-67.
Bibek, R., Miller K. W. and Jain, M. K. 2001. Bacteriocinsof lactic acid bacteria: Current perspectives. Indian J.Microbiol. 41: 01-21.
Errakhi, R., Bouteau F., Lebrihi A.and Barakate, M. 2007.Evidences of biological control capacities ofStreptomyces spp. Against Sclerotium rolfsiiresponsible for damping off disease in sugar beet (Beta
vulgaris L.). World J. Microbiol and Biotech. 23(11):1503-1509.
Higa, T. and Parr, F.J. 1994. Beneficial and effectivemicroorganisms for a sustainable agriculture andenvironment. International Farming Research Centre.Techno. Trends (Phillipines) 9(4):1-5.
Iqbal, M.S. and Jilani, G. 2000. Improvement in biologicalnitrogen fixation and yield of groundnut by theapplication of effective microorganisms. Pakistan J.Biol. Sci. 3 (2) : 320-322.
Javaid, A., Bajwa, R., Siddqi, I. and Bashir, U. 2000. EMand VAM technology in Pakistan VIII : Nodulation,yield and VAM colonization in Vigna mungo (L.) insoils with different histories of EM application.International J. Agric. and Biol. 1560-8530/2000/02-1-2-1-5.
Pham, D.T. 2004. FNCA Biofertilizer Newsletter. JapanAtomic Industrial Forum, Inc. 4: 1-8.
Yousaf, Z., Jilani, G. Qureshi R. A. and Awan, A. G. 2000.Effect of EM on groundnut growth. Pakistan J. Biol.Sci. 3(11): 1803-1804.
J. Agric. Res. Technol., 41 (1) : 161-164 (2016)
Identification of Pigeon pea Genotypes Suitable for Growingon Rice Bunds
______________
Pulses are the major source of dietaryprotein in vegetarian diet in our country.Besides being a rich source of protein, theymaintain soil fertility through biological nitrogenfixation in soil and thus play a vital role infurther in sustainable agriculture (Kannaiyan,1999). In Konkan region of Maharashtrapigeon pea is grown mainly on rice bunds. Thiscrop is sown during kharif in month of June-July after transplanting of rice. This cropmatures in the month of November-December.Crop is also grown in rice fallows after harvestof rice on residual moisture during the month ofOctober and matures in the month of February-March. The farmers are cultivating any pigeonpea variety as per availability of seed andtherefore yield is less. It is necessary to identify
the suitable pigeon pea variety for growing onrice bunds. In Konkan region of Maharashtrarice is grown on about 4.2 lakh hectare area.The rice bunds have more residual moisturethan the field. The growing of pigeon pea onrice bund increase the total cropped area andthis crop grows very well and produces a goodyield.
A field experiment entitled "Studies onphysiological analysis of pigeon pea (Cajanuscajan (L) Millsp.) genotypes growing on ricebunds" was conducted during kharif season ofyear 2013-14, at the experimental field ofDepartment of Agricultural Botany andAgronomy, College of Agriculture, Dapoli.
Journal of Agriculture Research and Technology 161

The experiment was laid out in RBD with 3replications. Fifteen genotypes viz., AKTE-11-1, BSMR-853, Vipula-1, T-Vishakha, BDN-711, Phule Rajeshwari, PKV-Tara, ICPL-87119, AKT-8811, UPAS-120, TAT-10,BDN-708, BSMR-736, Konkan Tur-1 andICPL-87 of pigeon pea were planted (15 dayold seedling) on rice bund in the month of June2013. Total 33 plants of each genotype wereplanted on 10 m bund length at 30 cm distancein each plant. Recommended dose of fertilizer25:50 N:P kg ha-1 was given at the timeplanting. Two weedings were given at 20 daysinterval. Four irrigations were provided at postmonsoon season at 15 days interval. Plantprotection measures were carried out as perrecommendations. The observations on growthand yield were recorded and data was subjectedto statistical analysis as per Panse andSukhatme (1985).
The significantly higher plant height wasrecorded by V1 (AKTE-11-1) which was at parwith V14 (Konkan Tur), V5 (P. Rajeshwari) andV9 over other genotypes (Table 1). Number ofbranches plant-1 were maximum in V14 whichwas at par with V13, V12, V10, V9, V8, V7, V6and V3 over other treatments. The leaf areaplant-1 was significantly higher in V1 (AKTE11-1) which was at par with V6 and V14 overother genotypes. The days to physiologicalmaturity were maximum in V1 which was at parwith V7, V8, V12, V13 over other genotypes.The leaf area index was maximum in V1 whichwas at par with V2, V6 and V14 over othergenotypes.
The data on mean number of seeds pod-1,pods plant-1, mean pod length, mean pod dryweight (g), 100 seed weight (g), seed yieldplant-1 (g), biological yield, harvest index are
Table 1. Growth parameters of pigeon pea genotypes grown on rice bunds
Genotype At harvest––––––––––––––––––––––––––––––––––––––––––––––––––––––––––––––––––––––––––––––––Plant Bran- Leaf area Days to Leaf area Total dryheight ches (dm2) physio- index matter(cm) plant-1 plant-1 logical (LAI) (g plant-1)
maturity
V1 - (AKTE-11-1) 263.20 15.22 31.53 179.83 1.0510 151.27V2 - (BSMR-853) 247.33 15.72 28.97 169.00 0.9658 140.62V3 - (VIPULA-1) 251.20 16.33 27.89 145.16 0.9298 136.99V4 - (T-VISHAKHA) 235.33 14.17 21.89 134.67 0.7297 108.54V5 - (BDN-711) 232.77 14.83 26.24 136.83 0.8748 112.60V6 - (P.RAJESHWARI) 259.03 16.61 29.47 173.44 0.9822 143.48V7 - (PKV-TARA) 242.00 16.72 27.79 175.77 0.9264 139.51V8 - (ICPL-87119) 249.67 17.06 26.20 179.73 0.8733 143.66V9 - (AKT-8811) 253.17 16.44 23.58 170.53 0.7860 144.86V10 - (UPAS-120) 229.57 16.17 19.76 130.02 0.6588 109.11V11 - (TAT-10) 243.53 15.28 24.95 129.47 0.8318 106.89V12 - (BDN-708) 250.67 16.61 25.07 176.55 0.8358 134.22V13 - (BSMR-736) 241.10 16.94 28.09 178.50 0.9362 140.38V14 - (KONKAN TUR) 261.13 17.17 29.94 164.69 0.9981 146.59V15 - (ICPL-87) 227.83 15.17 19.49 128.84 0.6498 100.97Mean 245.84 16.03 26.06 158.20 0.8686 130.65SE ± 3.80 0.27 0.77 1.88 0.0255 0.92CD at 5% 11.02 0.80 2.22 5.45 0.0744 2.67
Bankar et al.162

presented Table 2. The data revealed that,genotypic differences were significant for allyield and yield contributing parameters. Themean number of seeds pod-1 were 3.67. Thegenotype BDN 711 (V5) recorded significantlythe highest mean number of seeds pod-1 (4.40)which was at par with genotypesV2, V4, V8,V10, V15 and V14 over other genotypes. Thegenotype V9 AKT-8811 recorded lowest meannumber of seeds pod-1 (3.07). The genotypeV10 UPAS-120 recorded significantly highestnumber of pods per plant (230.33) which wasat par with V9, V1, V11, V3, V14, V12, V5 andV2 over other genotypes. The genotype V15 -ICPL-87 recorded lowest number of pods plant-1. The mean pod length was 5.48 cm. Thegenotype V5 - BDN-711 recorded highest podlength and was at par with genotypes V14, V5,V7, V4, V3, V2, V11, V8 and V6. The genotypeV10 - UPAS-120 recorded lowest pod length.The mean pod dry weight plant-1 was 73.64 g.The genotype V5 - BDN-711 recorded the
highest pod dry weight plant-1 and was at parwith genotypes V14, V11, V2 and V15 overother genotypes. The genotype V7 - PKV-TARA recorded the lowest pod dry weightplant-1. The hundred seed weight (g) was 9.27.The genotype V1 AKTE-11-1 recordedsignificantly highest mean 100 seed weightwhich was at par with genotypes V3, V14, V13,V2, V5, V6, V8, V9, V10 and V7 over othergenotypes. The genotype V15 ICPL-87recorded the lowest 100 seed weight. Themean seed yield plant-1 was 43.24 g. Thegenotype V1 AKTE-11-1 recorded significantlyhighest seed yield which was at par withgenotypes V14 Konkan Tur over othergenotypes. The genotype V15 ICPL-87recorded lowest mean seed yield weight plant-1.
The biological yield, seed yield and harvestindex was 204.29 g. 43.24 g and 21.10 percent, respectively. Genotype V1 (AKTE 11-1)recorded significantly higher biological yield
Table 2. Mean seed yield per plant and yield attributes of different pigeon pea genotypes grown on rice bund
Genotype No. of No. of Pod Pod dry 100 Seed Biological Harvestseeds pods length weight seed yield yield indexplant plant-1 (cm) plant-1 weight plant-1 plant-1 (%)
(g) (g) (g) (g)
V1 - (AKTE-11-1) 3.13 214.33 5.20 75.69 9.83 51.61 226.96 22.75V2 - (BSMR-853) 3.80 204.33 5.60 79.52 9.50 46.10 220.15 20.94V3 - (VIPULA-1) 3.27 212.67 5.10 69.08 9.83 45.75 206.07 22.20V4 - (T-VISHAKHA) 4.00 197.33 5.67 75.64 8.83 36.94 184.18 20.06V5 - (BDN-711) 4.40 206.00 6.07 83.89 9.50 38.50 196.49 19.59V6 - (P.RAJESHWARI) 3.40 175.67 5.53 65.33 9.50 45.12 208.82 21.60V7 - (PKV-TARA) 3.27 174.00 5.70 61.74 9.00 42.35 201.25 21.06V8 - (ICPL-87119) 3.80 196.67 5.53 68.11 9.50 45.71 211.77 21.59V9 - (AKT-8811) 3.07 217.33 5.03 73.83 9.50 48.74 218.69 22.29V10 - (UPAS-120) 4.00 230.33 4.80 78.23 9.17 38.09 187.33 20.34V11 - (TAT-10) 3.60 213.00 5.23 80.33 8.83 36.94 187.23 19.73V12 - (BDN-708) 3.40 206.67 5.53 64.95 8.50 44.29 199.16 22.24V13 - (BSMR-736) 4.00 195.00 5.67 68.37 9.50 44.45 208.75 21.30V14 - (KONKAN TUR) 3.87 221.67 5.87 80.38 9.67 50.64 226.97 22.31V15 - (ICPL-87) 4.00 162.67 5.73 79.50 8.33 33.38 180.47 18.49Mean 3.67 201.84 5.48 73.64 9.27 43.24 204.29 21.10SE ± 0.27 6.81 0.20 1.61 0.30 0.76 1.98 0.42CD at 5% 0.79 19.74 0.58 4.67 0.86 2.21 5.74 1.22
Journal of Agriculture Research and Technology 163
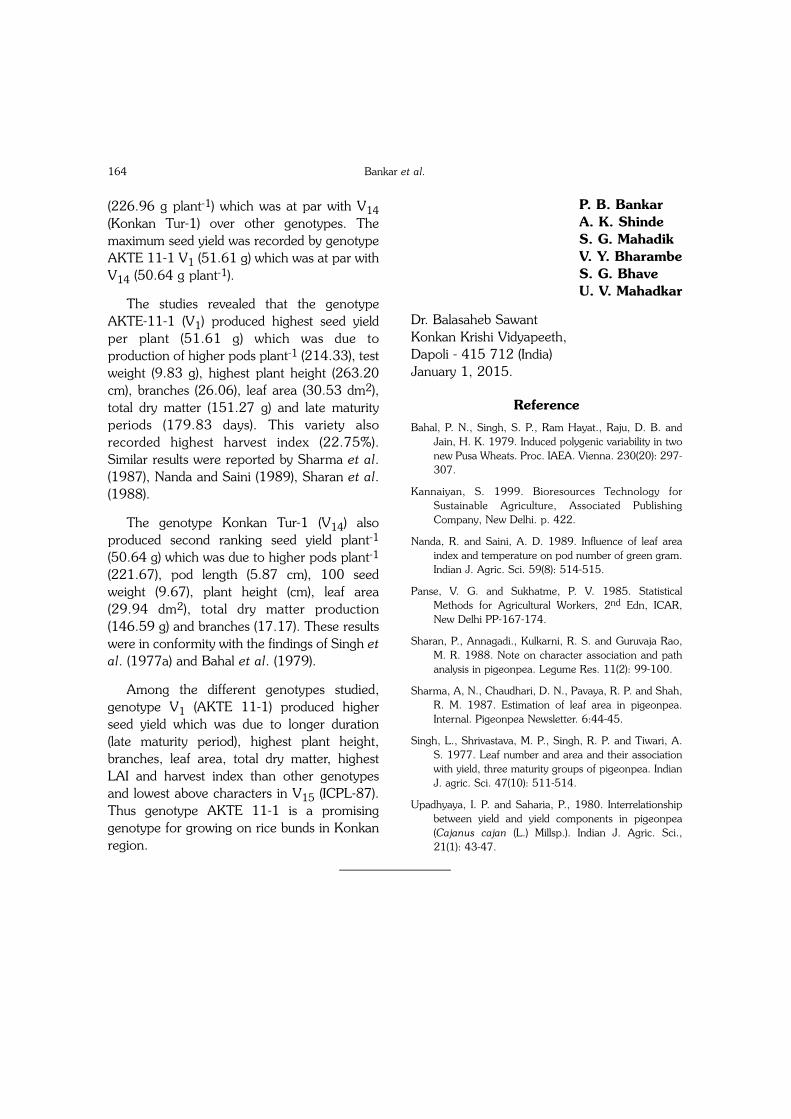
(226.96 g plant-1) which was at par with V14(Konkan Tur-1) over other genotypes. Themaximum seed yield was recorded by genotypeAKTE 11-1 V1 (51.61 g) which was at par withV14 (50.64 g plant-1).
The studies revealed that the genotypeAKTE-11-1 (V1) produced highest seed yieldper plant (51.61 g) which was due toproduction of higher pods plant-1 (214.33), testweight (9.83 g), highest plant height (263.20cm), branches (26.06), leaf area (30.53 dm2),total dry matter (151.27 g) and late maturityperiods (179.83 days). This variety alsorecorded highest harvest index (22.75%).Similar results were reported by Sharma et al.(1987), Nanda and Saini (1989), Sharan et al.(1988).
The genotype Konkan Tur-1 (V14) alsoproduced second ranking seed yield plant-1
(50.64 g) which was due to higher pods plant-1
(221.67), pod length (5.87 cm), 100 seedweight (9.67), plant height (cm), leaf area(29.94 dm2), total dry matter production(146.59 g) and branches (17.17). These resultswere in conformity with the findings of Singh etal. (1977a) and Bahal et al. (1979).
Among the different genotypes studied,genotype V1 (AKTE 11-1) produced higherseed yield which was due to longer duration(late maturity period), highest plant height,branches, leaf area, total dry matter, highestLAI and harvest index than other genotypesand lowest above characters in V15 (ICPL-87).Thus genotype AKTE 11-1 is a promisinggenotype for growing on rice bunds in Konkanregion.
P. B. Bankar A. K. Shinde S. G. Mahadik V. Y. Bharambe S. G. Bhave U. V. Mahadkar
Dr. Balasaheb Sawant Konkan Krishi Vidyapeeth,Dapoli - 415 712 (India)January 1, 2015.
Reference
Bahal, P. N., Singh, S. P., Ram Hayat., Raju, D. B. andJain, H. K. 1979. Induced polygenic variability in twonew Pusa Wheats. Proc. IAEA. Vienna. 230(20): 297-307.
Kannaiyan, S. 1999. Bioresources Technology forSustainable Agriculture, Associated PublishingCompany, New Delhi. p. 422.
Nanda, R. and Saini, A. D. 1989. Influence of leaf areaindex and temperature on pod number of green gram.Indian J. Agric. Sci. 59(8): 514-515.
Panse, V. G. and Sukhatme, P. V. 1985. StatisticalMethods for Agricultural Workers, 2nd Edn, ICAR,New Delhi PP-167-174.
Sharan, P., Annagadi., Kulkarni, R. S. and Guruvaja Rao,M. R. 1988. Note on character association and pathanalysis in pigeonpea. Legume Res. 11(2): 99-100.
Sharma, A, N., Chaudhari, D. N., Pavaya, R. P. and Shah,R. M. 1987. Estimation of leaf area in pigeonpea.Internal. Pigeonpea Newsletter. 6:44-45.
Singh, L., Shrivastava, M. P., Singh, R. P. and Tiwari, A.S. 1977. Leaf number and area and their associationwith yield, three maturity groups of pigeonpea. IndianJ. agric. Sci. 47(10): 511-514.
Upadhyaya, I. P. and Saharia, P., 1980. Interrelationshipbetween yield and yield components in pigeonpea(Cajanus cajan (L.) Millsp.). Indian J. Agric. Sci.,21(1): 43-47.
______________
Bankar et al.164

The rhizome bud of ginger var. Mahima(IISR Calicut) was cultured in-vitro propagationto know optimum concentration of BAP andIAA. The response of BAP (0.00, 1.5, 2.5,3.5 and 4.5 mg L-1) and IAA (1 mg L-1) werestudied. The minimum days for shoot initiation(8.75), highest number of shoots (4.25) andmaximum number of leaves (8.25) wasobserved and maximum shoot elongation (5.53cm) was obtained at concentration of BAP (3.5mg L-1) with IAA (1 mg L-1). In this context,efficient protocol was developed by in-vitrotechnique to yield multiple number of shootsand regeneration.
India is called as the 'Spice Bowl of theWorld' for production of variety of spices withsuperior quality. Ginger is an important spicecrop grown in India. It is herbaceousrhizomatous perennial plant belonging to thefamily Zingiberaceae, under the natural orderScitamineae. According to the Bureau of IndianStandards (BIS), 63 spices are grown in India.India is the leading country in the world forproduction, consumption and export ofspices.The total production of ginger in theworld is 1683.00 thousand tons with the totalacreage of 310.43 thousand ha. China, India,Nepal and Thailand are the major producers ofginger in the world, having production of396.60 thousand tons, 385.33 thousand tons,210.79 thousand tons and 172.68 thousandtons respectively (Anonymous, 2010).
In Maharashtra ginger production area isabout 1308 ha and production is 1245 tonnesyear 20010-11. In Aurangabad gingerproduction area is about 5330 ha andproduction is 106604 tonnes year 2011 in fiveyear (Anonymous, 2013). Planting of ginger
isdone on the onset of monsoon inMaharashtra and Northern India.
Some of the prominent indigenous cultivarsare Maran, Kuruppampadi, Ernad, Wynad,Himachal and Nadia. Exotic cultivars such asRio-de-Janeiro have also become very popularamong these cultivators. Some improvedvarieties of ginger viz., Suprabha, Suruchi,Surai, Himgiri, Varada, Mahima, Rejatha,Karthika and Athira. Especially Mahima (IISRCalicut) is the best variety for cultivation,qualities of variety Mahima yield 22.2 t ha-1,Maturity 200 days, crude fiber 4.0 per cent andessential oil 2.36 per cent etc. The method ofpropagation of ginger is vegetative propagationthrough underground rhizome. But, this is slowprocess. Rhizome has dormancy period andonly sprouted during the monsoon, 5 to 6plants can be obtained from one single rhizomein a year. Rapid method of multiplication isneeded especially for newly developed highyielding varieties, which are available in smallquantities. Tissue culture tool is best toovercome the problem of dormancy and toproduce diseases free propagates on a largescale. Micro-propagation provides a rapid,reliable system for the production of largenumbers of genetically uniform plantlets.
Combination of cytokinin and auxin exhibita quantitative relationship in the regulation ofmorphogenesis, organ formation (Skoog andmiller 1957). The MS medium supplementedwith BAP and IAA as treatments were used toinvestigate their synergetic effect on rhizomenodal explants of ginger.
Explants and surface sterilization : Therhizome bud of ginger was collected fromcollege instructional farm. The rhizome bud of
J. Agric. Res. Technol., 41 (1) : 165-168 (2016)
In-Vitro Propagation of Ginger (Zingiber officinale Rosc.) byusing BAP and IAA

ginger (Zingiber officinale Rosc.) Var. Mahima(IISR Calicut) was cut in to 0.5 cm (Sathyagowriet al. 2011) length segment and wash withrunning tap water to remove dirt. Thenexplants were washed with householddetergent (Labolin) for 5 min followed byrepeated rinsing with distilled water for 5 min.After that explants were transferred to laminarair flow for surface-disinfect using 70 per centethanol for 10-20 sec. and further sterilizedwith 5.25 per cent Sodium Hypochlorite(NaOCl) solution containing two drops ofTween-20 for 20 minutes and wash withsterilized double distilled water for 5 times. Theexplants were trimmed to 0.5 cm long piecesbefore transfer to the establishment medium.
Establishment and proliferation : MSmedium (Murashige and Skoog 1962) wascommonly used for all the experiments,containing 0.8 per cent agar (w/v) and 3 percent sucrose (w/v) and various concentration ofBAP (1.5, 2.5, 3.5 and 4.5 mg L-1) and IAA(1 mg L-1). The stock solution mixed in requiredproportion along with sucrose. The volumewere made by adding distilled water then checkthe pH 5.6-5.8, finally added agar and anti-fungal supplement (Hi-media) (v/v) to properlymix the media. The required material andmedia were autoclaved at 121ºC for 20 min.The plant growth regulators, Amino acids andvitamins may get destroyed during autoclaving,such chemicals are, therefore, sterilized by
filtration through using syringe- driven filtermembrane 0.22 µm porosity.
After sterilization of explants were trimmed(0.5cm) and inoculated on MS media;supplemented with different combination ofBAP at variable concentration with IAA. Thecut ends of explants were kept in such a way soas to have maximum contact with the medium.After aseptic transfers, the explants and tissueshave to be incubated at specific temperature,the most desirable being 25± 2ºC temperatureswith 16 hrs photoperiod.
Data was recorded on explants at weeklyintervals, for number of days required forinitiation of shoot as mean number of days,number of shoots produced explants-1,elongation of shoots and number of leavesproliferated. The data obtained on variousobservations were analyzed by completelyrandomized design (CRD) (Panse and Sukhatme1967).
Number of days required for shootinitiation : Data on days to shoot initiation inZingiber officinale Rosc. as influenced bydifferent concentrations of BAP are presentedin Table 1.
The minimum number of days required forinitiation of shoots as MS+1.0 IAA (16.50)without BAP while MS + BAP (3.5 mg L-1) +IAA (1.0 mg L-1) required less number of days
Table 1. Effect of variable concentration of BAP and constant IAA on in vitro gegeneration of ginger
Treatment No. of days required No. of shoots/ No. of leaves Shoot (mg L-1) for shoot initiation (DAI) explant shoot-1 height (cm)
T0 - MS + 1.0 IAA Control 16.50 1.22 2.50 2.43T1 - MS + BAP(1.5) + IAA(1.0) 11.75 2.00 6.75 2.98T2 - MS + BAP(2.5) + IAA(1.0) 9.50 3.80 8.00 3.73T3 - MS + BAP(3.5) + IAA(1.0) 8.75 4.25 8.25 5.48T4 - MS + BAP(4.5) + IAA(1.0) 12.25 1.75 6.80 5.53Mean 11.75 2.62 6.46 4.03SE ± 0.413 0.329 0.50 0.20CD at 1% 1.70 1.359 2.10 0.83
Kshirsagar and Dhakane166

for initiation of shoot as compared to rest of theBAP concentration, followed by BAP 2.5 mgL-1 and BAP 1.5 mg L-1. The presence ofcytokinin in the medium leads to the promotionof bud differentiation development and shootinitiation. Similar result was reported byWickson and Thimann (1958) and Skoog andMiller (1967) who reported that the cell divisionor cell differentiation was also associated withauxin and cytokinin. Hirimburegama andGamage (1995) found that cytokinin to beessential for axillary bud break.
Number of shoots explant-1 : The dataon number of shoots explants-1 was presentedin Table 1.
The media combination with BAP 2.5 mgL-1 and 3.5 mg L-1 were at par and significantlyrecorded maximum number of shoot inZingiber officinale Rosc. as compared to rest ofthe BAP concentrations and control.Concentration 1.5 mg L-1 recorded 2.00shoots per explants 4.5 mg L-1 recorded 1.75shoots explants-1 and control recorded 1.25shoots explants-1 were at par with each other.Cytokinins are used in plant cell culture atappropriate concentration that may stimulateaxillary and adventitious shoot proliferation.Similar findings were reported by Nkere et al.(2009).
Number of leaves proliferation pershoot 28 DAI : The data presented in Table1 recorded the mean number of leavesexplant-1 of ginger (8.25). The number ofleaves proliferated in ginger were influenceddue to different concentration of BAP and IAA.
Concentration of BAP 3.5 mg L-1 withconstant IAA recorded maximum number ofleaves (8.25) per explant and found superiorover control. Concentrations of BAP 1.5, 2.5,3.5 and 4.5 mg L-1 with constant IAA were atpar and all significantly superior over control.
It might be due to combination effect ofcytokinin in medium leads to the leafexpansion, resulting solely from cellenlargement in Zingiber officinaleRosc.Cytokinins are involved in regulation ofvarious processes of plant appears important innutrient signals and morphogenic responses.
Shoot elongation (cm) : Data on shootelongation (cm) of main shoot as influenced byvarious treatments of BAP concentration aregiven in Table 1.
The effect of different concentration of BAPon height of shoot per explants was foundsignificant. The concentrations of BAP 3.5 mgL-1 and 4.5 mg L-1 were at par with each otherand found significantly superior over rest of theother treatments, followed by BAP 2.5 andBAP 1.5 mg L-1. The control i.e. without BAPrecorded minimum elongation of shoots.Hence it is concluded that the combinationeffect of cytokinin used in media promotes thegrowth of shoots and regulates cell division.Similar results were reported by Mok (1994)and Abbas et al. (2011). Combination ofcytokinin and auxin exhibit a quantitativerelationship in the regulation of morphogenesisand organ formation. Ratio of auxin andcytokinin in the medium low cytokinin/auxinratios favored root formation, while highcytokinin/auxin ratios promoted bud (shoot)formation.
Based on present study it is concluded thatthe MS + BAP (3.5 mg L-1) + IAA 1.0 mg L-1
recorded maximum number of shoots, numberof leaves, shoot length, and minimum dayrequired for shoot initiation compared tocontrol.
Ashwin B. KshirsagarV. C. Dhakane
Deptt. of Plant Biotechnology, MGM, College of Agricultural Biotechnology,
Journal of Agriculture Research and Technology 167

Aurangabad - 431 003 (India)January 31, 2015.
ReferencesAbbas, M. S., Taha, H. S., EI-Shbrawi, H. M. and Gaber,
E. I. 2011. In vitro propagation of ginger. J. ofGenetic Engineering and Biotech. (9):165-172.
Anonymous. 2010. Annual report, National HorticultureBoard, India.
Anonymous. 2013. Aurangabad Dist. Report- 1st MidtermReview.
Hirimburegama, K.and Gamage, N. 1995. Propagation ofBambusa vulgaris through nodal bud culture. Journalof Horti. Sci. 70(3): 469-475.
Mok, M. C. 1994. Cytokinin chemistry, activity andfunction. 155-160, CRC Press, Bocaraton, Florida.
Murashige, T., Skoog F. 1962. A revised medium for rapidgrowth and bioassays with tobacco tissue cultures.Plant Physiol.15: 473-497.
Nkere, C. K, Mbanaso, E. N. 2010. Optimizingconcentrations of growth regulators for in-vitro gingerpropagation. J. Agrobio. Nigeria. 27(2): 61-65.
Panse, V. G. and Sukhatme, P.V. 1967. Statistical methodfor agricultural worker. ICAR New Delhi. 2nd Edn.
Sathyagowri, S., Thiamini, H. 2011. In vitro plantregeneration of ginger with emphasis initial cultureestablishment. J. Med Arom. Plants. 3: 195-202.
Skoog's and Miller.1957. Cell division and organdifferentiation. Advances in plant Hormone research.Indian Scenario by Malik, C.104.
Skoog, F. and Miller, C. C., 1967, Chemical regulation ofgrowth and organ formation in plant tissue cultivatedin-vitro. In: Biological Action of Growth Substances,11th Symposium Society of Experimental Biology,11: 118-131.
Wickson, M. E. and Thimmann, K. V., 1958. Theantagonism of auxin and kinetin in apical dominance.Physiologia Plantarum, 11: 62-74.
J. Agric. Res. Technol., 41 (1) : 168-170 (2016)
Performance of post emergence herbicide in Soybean +Pigeonpea Intercropping
______________
Among various constraints in cropproduction weed control is important one, butgenerally neglected by many farmers. Due toweeds the crop yield loss is 20 to 77 percent(Kucheria et al. 2001). Timely weed manage-ment is an important factor to increase the cropproductivity. The degree of loss depends uponintensity and kind of infesting weed. Manualweeding during critical growth stages issometimes not possible due to uncertainweather, soil condition and labour problems.
Inter cropping suppress the growth of weedsup to 25 per cent (Shobney et al. 1989). It isvery essential to find out alternative to manuallabour for weed control, which has more weedcontrol efficiency. At present many promisingand selective herbicide are available, which can
control weeds effectively when are used as postemergence application.
The intercropping of Soybean + Pigeon peahas been recommended by VNMKV, Parbhaniand adopted on large scale by farmers. A verylimited work on weed management in Soybean+ Pigeon pea intercropping has been done asan application of herbicide. The adequateinformation regarding use of pre emergenceherbicide is available but due to weathercondition or situation not suitable for pre-emergence application, the post emergence isthe best option for using weedicide in thisintercropping.
A field experiment was carried out duringkharif 2012 at experimental farm of Weed
Kshiesagar and Dhakane168
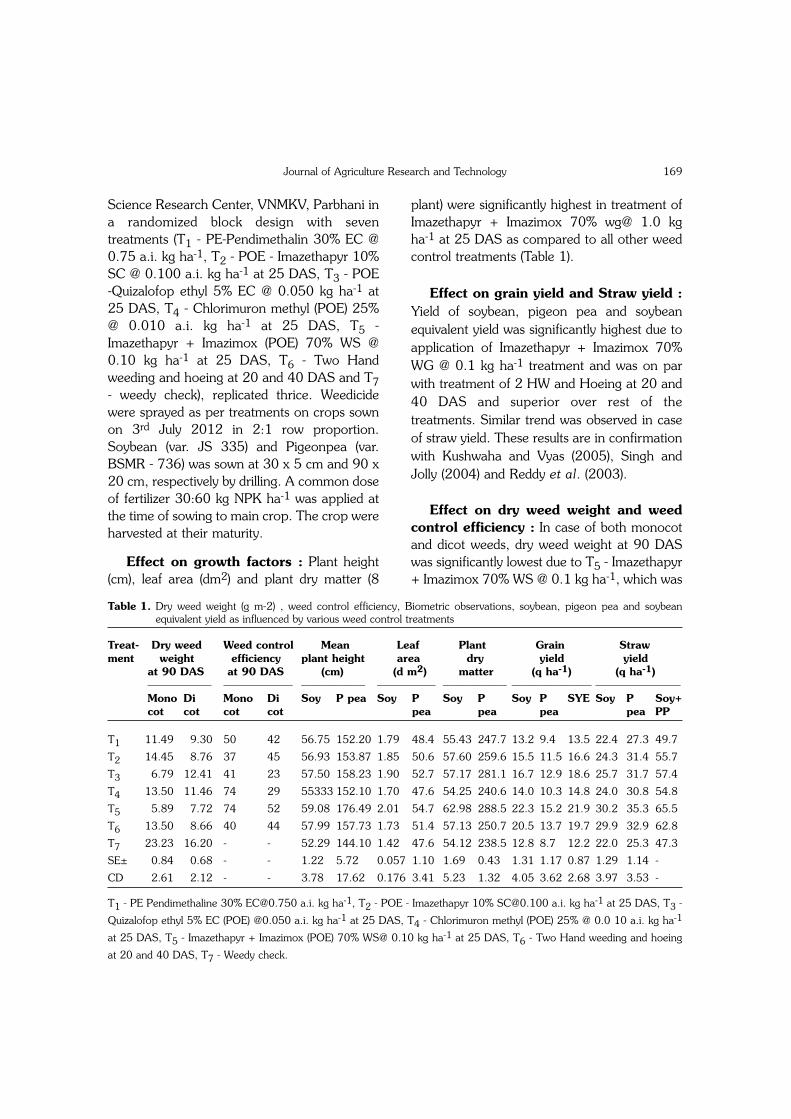
Science Research Center, VNMKV, Parbhani ina randomized block design with seventreatments (T1 - PE-Pendimethalin 30% EC @0.75 a.i. kg ha-1, T2 - POE - Imazethapyr 10%SC @ 0.100 a.i. kg ha-1 at 25 DAS, T3 - POE-Quizalofop ethyl 5% EC @ 0.050 kg ha-1 at25 DAS, T4 - Chlorimuron methyl (POE) 25%@ 0.010 a.i. kg ha-1 at 25 DAS, T5 -Imazethapyr + Imazimox (POE) 70% WS @0.10 kg ha-1 at 25 DAS, T6 - Two Handweeding and hoeing at 20 and 40 DAS and T7- weedy check), replicated thrice. Weedicidewere sprayed as per treatments on crops sownon 3rd July 2012 in 2:1 row proportion.Soybean (var. JS 335) and Pigeonpea (var.BSMR - 736) was sown at 30 x 5 cm and 90 x20 cm, respectively by drilling. A common doseof fertilizer 30:60 kg NPK ha-1 was applied atthe time of sowing to main crop. The crop wereharvested at their maturity.
Effect on growth factors : Plant height(cm), leaf area (dm2) and plant dry matter (8
plant) were significantly highest in treatment ofImazethapyr + Imazimox 70% wg@ 1.0 kgha-1 at 25 DAS as compared to all other weedcontrol treatments (Table 1).
Effect on grain yield and Straw yield :Yield of soybean, pigeon pea and soybeanequivalent yield was significantly highest due toapplication of Imazethapyr + Imazimox 70%WG @ 0.1 kg ha-1 treatment and was on parwith treatment of 2 HW and Hoeing at 20 and40 DAS and superior over rest of thetreatments. Similar trend was observed in caseof straw yield. These results are in confirmationwith Kushwaha and Vyas (2005), Singh andJolly (2004) and Reddy et al. (2003).
Effect on dry weed weight and weedcontrol efficiency : In case of both monocotand dicot weeds, dry weed weight at 90 DASwas significantly lowest due to T5 - Imazethapyr+ Imazimox 70% WS @ 0.1 kg ha-1, which was
Table 1. Dry weed weight (g m-2) , weed control efficiency, Biometric observations, soybean, pigeon pea and soybeanequivalent yield as influenced by various weed control treatments
Treat- Dry weed Weed control Mean Leaf Plant Grain Strawment weight efficiency plant height area dry yield yield
at 90 DAS at 90 DAS (cm) (d m2) matter (q ha-1) (q ha-1)–––––––––––– ––––––––––––– –––––––––––– ––––––––––– –––––––––––– ––––––––––––––– ––––––––––––––––Mono Di Mono Di Soy P pea Soy P Soy P Soy P SYE Soy P Soy+ cot cot cot cot pea pea pea pea PP
T1 11.49 9.30 50 42 56.75 152.20 1.79 48.4 55.43 247.7 13.2 9.4 13.5 22.4 27.3 49.7
T2 14.45 8.76 37 45 56.93 153.87 1.85 50.6 57.60 259.6 15.5 11.5 16.6 24.3 31.4 55.7
T3 6.79 12.41 41 23 57.50 158.23 1.90 52.7 57.17 281.1 16.7 12.9 18.6 25.7 31.7 57.4
T4 13.50 11.46 74 29 55333 152.10 1.70 47.6 54.25 240.6 14.0 10.3 14.8 24.0 30.8 54.8
T5 5.89 7.72 74 52 59.08 176.49 2.01 54.7 62.98 288.5 22.3 15.2 21.9 30.2 35.3 65.5
T6 13.50 8.66 40 44 57.99 157.73 1.73 51.4 57.13 250.7 20.5 13.7 19.7 29.9 32.9 62.8
T7 23.23 16.20 - - 52.29 144.10 1.42 47.6 54.12 238.5 12.8 8.7 12.2 22.0 25.3 47.3
SE± 0.84 0.68 - - 1.22 5.72 0.057 1.10 1.69 0.43 1.31 1.17 0.87 1.29 1.14 -
CD 2.61 2.12 - - 3.78 17.62 0.176 3.41 5.23 1.32 4.05 3.62 2.68 3.97 3.53 -
T1 - PE Pendimethaline 30% [email protected] a.i. kg ha-1, T2 - POE - Imazethapyr 10% [email protected] a.i. kg ha-1 at 25 DAS, T3 -
Quizalofop ethyl 5% EC (POE) @0.050 a.i. kg ha-1 at 25 DAS, T4 - Chlorimuron methyl (POE) 25% @ 0.0 10 a.i. kg ha-1
at 25 DAS, T5 - Imazethapyr + Imazimox (POE) 70% WS@ 0.10 kg ha-1 at 25 DAS, T6 - Two Hand weeding and hoeing
at 20 and 40 DAS, T7 - Weedy check.
Journal of Agriculture Research and Technology 169

highest in unweeded control treatment (T7).Weed control efficiency of monocot and dicotweeds was significantly highest due T5 ascompared to all other treatments and weedycheck at 90DAS (Table 1). But in case of dicotweeds, lowest weed control efficiency wasobserved in treatment (T3) Quizalofop ethyl 5%EC POE @ 0.050 a.i. kg ha-1 at 25 DAS.
Application of Imazethapyr + Imazimox70% WS @ 0.1 kg ha-1 found to be effective incontrolling weeds in soybean + pigeon peaintercropping and obtaining highest equivalentsyields.
A. S. Jadhav
Cotton Research Centre,VNMKV, Parbhani - 431 401 (India)
March 10, 2015.
References
Kukheria, S. P., Rathi, G. S., Bhalla, C. S. and Mathew, R.2001. Bio-efficacy of post emergence herbicides forweed control in soybean (Glycine max) Indian J. WeedScience. 33(1 and 2): 34-37.
Kushwaha, S. S. and Vyas, M. D. 2005 Herbicidal weedcontrol in soybean (Glycine max) Indian Journal ofAgronomy 50(3): 225-227.
Reddy, P. C., Rajur, B. P., Ramchandra, V. T. andKrishamurty K. 1990. Effects of herbicides andcultural practices on weed control in soybean. MaysoreJ. Agric. Sci. 24(3): 297-301.
Sing, G. and Jolly, R. S. 2004. Effects of herbicides on theweed infestation and grain yield of soybean (Glycinemax) Acta Agronomica Hurgarica 52(20): 199-203.
Shobney, J. S., Sidhu, M. S., Maran, R. S. and Kumar K.1989. Intercropping as a system to manage weeds J.Res. PAU, 26(4): 563:568.
J. Agric. Res. Technol., 41 (1) : 170-174 (2016)
Population dynamics of Woolly aphid, Ceratovacunalanigera Zehntner on Adsali Sugarcane in Western
Maharashtra
______________
Sugarcane woolly aphid (SWA),Ceratovacuna lanigera Zehntner outbreak wasobserved in the sugarcane growing areas ofWestern Maharashtra and some parts ofKarnataka state during 2002 to 2006. Thearea under sugarcane declined and there was21.41 per cent loss in cane weight in Co86032 variety and 2.04 units loss in sugarrecovery of Co 94012 variety (Galande, 2007).Weather parameters play a key role topopulation built up of SWA which fluctuatedduring crop growth period. Saputro et al.(1995) reported the conductive effect of dryweather with high humidity for population buildup of C. lanigera in Indonesia. The increase ofSWA population due to an increase inmaximum or minimum temperatures or bright
sunshine hours were reported from Assam inIndia (Phukan et al., 1977). A decrease inpopulations too has been reported due to anincrease in either rainfall or relative humidity.According to Patil et al. (2004), maximumtemperature of 28.3 to 30.5°C, rainfall of223.4 mm in 46 rainy days, 55 - 87 per centrelative humidity in the morning and cloudydays during June to January favoured thesevere out break of SWA in WesternMaharashtra (India). However, only sporadicincidences were observed during March toMay. Also, several theoretical models havebeen attempted in India by Ganeshaiah et al.(2003) based on simulations usingDIVA-GIS and GARP to predict the pattern ofspread of the SWA. Therefore, present
Jadhav A. S.170

Table 1. Sugarcane woolly aphid population on Adsali Crop and weather parameters during 2004-06 (2nd August 2004 to2nd February 2006)
Met. Av. woolly Temperature (°C) Relative humidity % Rainfallweek aphid –––––––––––––––––––––––– ––––––––––––––––––––––– (mm)
popula- Tmax. Tmin. RH-I RH-II (RF)tion
31 0.00 26.01 21.52 94.42 90.71 14.58
32 0.00 28.07 22.08 93.57 81.42 1.04
33 0.00 28.24 21.08 89.85 75.14 3.34
34 0.00 28.31 21.37 94.28 79.85 0.14
35 0.00 29.06 19.67 92.42 75.00 0.00
36 0.00 30.24 21.28 95.28 79.14 4.54
37 3.15 19.14 20.77 96.28 72.28 0.37
38 4.00 31.07 21.22 97.42 46.71 10.21
39 7.59 30.32 21.44 97.42 80.85 9.01
40 10.38 26.28 18.68 84.57 65.25 5.67
41 15.14 31.18 20.77 96.42 65.57 0.00
42 16.20 26.09 15.03 90.28 40.71 0.00
43 17.00 31.42 14.02 83.28 46.85 0.00
44 20.75 29.08 18.74 93.14 65.71 0.00
45 22.34 29.64 17.03 91.14 69.00 0.31
46 27.21 31.15 21.22 96.14 68.42 0.86
47 29.14 30.64 12.92 97.14 39.00 0.00
48 31.17 28.91 10.07 98.00 43.28 0.00
49 32.00 28.58 9.08 98.85 46.42 0.00
50 31.00 28.64 9.17 98.14 52.71 0.00
51 33.00 30.04 9.55 99.85 51.71 0.00
52 34.87 29.00 11.88 98.71 56.00 0.00
1 37.20 33.92 15.01 95.42 46.14 0.00
2 35.14 29.60 9.20 94.00 34.85 0.00
3 33.10 28.60 7.55 91.71 31.14 0.00
4 31.09 31.20 13.6 94.14 45.85 0.00
5 30.05 25.40 10.22 96.57 57.85 1.47
6 24.48 27.02 13.00 94.14 45.71 0.00
7 24.00 34.01 11.7 90.00 43.14 0.00
8 25.07 31.70 10.68 96.85 55.28 0.00
9 23.11 34.72 16.67 93.00 32.71 0.00
10 19.17 33.37 16.02 91.42 46.57 0.05
11 13.23 34.95 14.14 88.41 46.71 0.00
12 8.01 36.44 16.88 77.42 36.85 0.00
13 5.27 37.14 17.68 77.14 38.57 0.00
14 4.00 37.68 21.44 84.00 55.85 0.00
15 0.00 36.8 19.32 89.71 59.14 0.82
16 0.00 38.42 20.98 80.71 48.14 0.00
17 0.00 30.94 20.95 83.85 46.71 0.15
18 0.00 36.47 20.64 89.71 56.28 0.02
Journal of Agriculture Research and Technology 171

19 0.00 37.44 22.65 87.85 46.71 3.20
20 0.00 39.68 21.44 79.00 35.57 3.20
21 0.00 40.01 24.12 84.42 47.28 3.20
22 0.00 35.34 23.92 89.57 49.57 0.00
23 0.00 38.00 24.35 88.57 51.57 0.00
24 0.00 35.08 23.05 95.85 72.14 6.77
25 0.00 35.52 23.65 91.14 80.42 0.00
26 0.00 28.75 22.94 96.00 88.57 4.38
27 0.00 28.34 22.81 97.14 91.43 4.29
28 0.00 30.12 23.07 94.00 81.57 0.00
29 0.00 32.17 23.27 95.71 62.28 2.00
30 0.00 27.15 22.42 95.28 80.14 7.65
31 0.00 26.56 22.31 96.57 90.86 7.47
32 0.00 27.11 21.46 97.14 84.43 2.21
33 2.01 28.11 21.46 97.29 81.86 1.67
34 2.27 29.00 20.36 97.86 76.57 1.39
35 4.19 31.23 21.51 96.57 64.86 7.01
36 8.10 30.36 22.34 99.43 78.86 155.49
37 8.12 28.31 22.20 98.57 81.14 262.53
38 9.74 28.49 22.17 92.86 74.57 264.04
39 12.00 29.07 20.34 95.86 67.57 270.67
40 17.95 31.13 20.79 97.57 57.14 11.73
41 20.91 32.67 18.69 95.86 46.00 14.87
42 22.04 30.24 21.03 98.57 59.86 30.42
43 22.70 30.79 16.06 96.43 42.29 33.20
44 25.52 30.63 13.71 96.43 37.86 0.00
45 28.10 30.19 11.87 96.43 42.00 0.00
46 29.19 30.40 9.94 96.29 38.57 0.00
47 29.87 30.60 10.47 96.57 45.00 0.00
48 31.04 29.39 13.31 97.29 51.43 0.00
49 32.30 29.41 16.00 94.86 60.71 0.00
50 33.09 28.50 9.00 99.29 51.00 0.00
51 35.20 28.89 8.04 98.14 51.71 0.00
52 35.20 27.86 8.88 99.14 42.00 0.00
1 34.69 27.74 9.27 99.57 47.57 0.00
2 30.82 29.40 11.30 97.71 47.43 0.00
3 28.76 31.97 12.49 98.43 35.86 0.00
4 27.71 28.37 6.56 97.43 31.00 0.00
5 25.24 29.81 8.70 95.71 31.71 0.00
*aphids per 2.5 cm2 leaf area
Table 1. Contd.
Met. Av. woolly Temperature (°C) Relative humidity % Rainfallweek aphid –––––––––––––––––––––––– ––––––––––––––––––––––– (mm)
popula- Tmax. Tmin. RH-I RH-II (RF)tion
Galande et al.172

study was, undertaken to find out theeffect of weather parameters on SWApopulation of C. lanigera on Adsali crop ofsugarcane.
The experiment was conducted on Adsalisugarcane planted at research farm of CentralSugarcane Research Station, Padegaon(Maharashtra) during 2004-06. Planting ofsugarcane setts of Co 86032 variety was doneon 2nd August, 2004 with 120 x 90 cmspacing on an area of 0.10 hectare and thecrop was harvested after 18 months on 2nd
February, 2006. The 60 tonnes of FYM ha-1
as organic source and chemical fertilizerdosages of NPK @ 400 : 170 : 170 kg ha-1
was given as per recommended practices. Theaverage number of aphid population on fiverandomly selected plants at 10 locations wasused for monitoring the level of populationsduring the study. Three leaves from top, middleand bottom of plants were selected and theincidence of woolly aphid on 2.5 cm2 leaf areawas recorded at weekly interval. The weatherdata was recorded daily and weekly averageswere worked out. The population of SWA wascorrelated with weather parameters of thecorresponding week and multiple linearregression equation (prediction model) wasworked out as per the method suggested byPanse and Sukhatme, 1985.
The SWA population and weatherparameters data during the year 2004 to 2006for Adsali sugarcane crop are presented inTable 1. The data revealed two peaks of SWAduring the crop period. In the first peak,population of SWA initiated during 37th MW i.e. six weeks after planting with 3.15 aphids per2.5 cm2 leaf area and gradually increased to amaximum level of 37.20 aphid per 2.5 cm2
leaf area in 1st MW. During this period,maximum and minimum temperatures werebetween 33.92ºC and 15.01ºC, respectively
and RH- I (Morning) and RH- II (evening ) was95.42 per cent and 46.14 per cent,respectively. Thereafter, SWA populationshowed declined trend and reached at zero levelin 15th MW to 32nd MW i.e. from 9th April,2005 to 12th September, 2005. The maximumand minimum temperatures in these weekswere 26.56 to 40.01ºC and 19.32 to24.35ºC, respectively and morning andevening relative humidity ranged from 79.00to 97.14 per cent and 35.57 to 91.43 percent, respectively. Second peak of SWA wasnoticed in 33rd MW with 2.01 aphids per 2.5cm2 leaf area. The population showedincreasing trend and reached at peak level with35.20 aphids per 2.5 cm2 leaf area in 51st and52nd MW. The maximum and minimumtemperatures in these weeks were between27.86 to 28.89°C and 8.04 to 8.88°C,respectively. Morning and evening relativehumidity in these weeks was between 98.14 to99.14 per cent and 42.00 to 51.71 per cent,respectively. At harvesting, 25.24 aphids per2.5 cm2 leaf area were recorded in February,2006.
The correlation of SWA population withweather parameters on Adsali sugarcane cropduring the year 2004-06 was worked out. Itwas observed that maximum and minimumtemperatures showed significant negativecorrelation for woolly aphid population with ' r'values of - 0.247* and - 0. 881** respectively,whereas, morning and evening relativehumidity showed significant positive andnegative correlations with ' r' values of 0.428**and - 0.588** respectively. However, rainfalldid not show significant correlation on woollyaphid population. The multiple linearregression equation (prediction model) betweenwoolly aphid population with minimummeteorological parameters was worked out as:Y = -16.761 - 1.635 Tmin.** + 0.756 MRH.**- 0.189 ERH.** (R2 = 0.83). Where, Y=
Journal of Agriculture Research and Technology 173
Expected woolly aphid incidence, Tmin. =Minimum temperature, RH.-I = Morningrelative humidity, RH.-II. = Evening relativehumidity.
Results obtained in the present study are inagreement with observations reported byCheng et al. (1994), Galande et al. (2003),Lingappa et al. (2003) and Galande et al.(2004). Cheng et al. (1994) reported peakaphid population of SWA between secondfortnight of April and June in Taiwan and hightemperatures caused aphid populations tofluctuate at lower level in summer. Similarly,Galande et al. (2003) reported that duringMarch the infestation declined as compared toprevious months in all districts of Maharashtradue to high temperatures. During summermonths SWA survived on the crop under treeshade, around water channels and river banksas well as in low lying areas where highhumidity and low temperatures prevails(Galande et al., 2004). The incidence of C.lanigera was reported in November byLingappa et al. (2003 ). The incidence of SWAunder field conditions with excess of irrigationon 8 to 10 months old crop was recorded fromMarch to May, 2003. The winged forms weremore during December and January and the C.lanigera population thereafter declined due toincrease in temperature. Similar results areobserved in the present study.
S. M.GalandeB. A.BadeS. B. Kharbade
College of Agriculture, Pune - 411 005 (India)May 2, 2015.
ReferencesCheng, W. Y., Wang, Z. T., Hung, T. H. and J. K. Hung,
1994. Factors and their effect on the occurrence ofsugarcane woolly aphid. Rep. Taiwan Sugar Res. Inst.,145: 1-24.
Galande, S. M. 2007. Bio-ecological studies andmanagement of woolly aphid, Ceratovacuna lanigeraZehntner on sugarcane. Final Technical Report of Ad-hoc Project, Indian Council of Agricultural Research,New Delhi.: 1- 74 pp.
Galande, S. M., Mote, U. N. and Bhoi. P. G. 2003.Sugarcane woolly aphid, Ceratovacuna lanigeraZehntner, a new pest problem of sugarcane inMaharashtra. Seminar of Deccan SugarcaneTechnologist Association, Pune (India) on cost effectivesugarcane production technology for survival of sugarindustry during 2003-2004. DSTA, Pune, 25th April,2003. : 22-30 pp..
Galande, S. M., Mote, U. N., Shelke, S. S., Ankali, S. M.and Bhoi, P. G. 2004. Integrated management ofSugarcane woolly aphid, Ceratovacuna lanigeraZehntner. Proc. of National Seminar on use ofappropriate varieties and management practices forimproving sugar recovery in sugarcane. SugarcaneBreeding Institute, Coimbatore, 19-20th Jan., 2004. :155-161.
Ganeshaiah, K. N., Barve, Narayani., Nilima Nath, K. C.Handrashekara, M. Swamy, R and Shaanke, Uma.2003. Predicting the potential geographicaldistribution of the sugarcane woolly aphid using GARPand DIVA-GIS. Current Science 85 (11): 1526-1528.
Lingappa, S., Kulkarni, K. A., Patil, R. K., Tippanawar, P.S., and Shekarappa, S. 2003. Status of woolly aphid,Ceratovacuna lanigera, Zehntner on Sugarcane inKarnataka. Lead paper presented in the Brainstorming session on sugarcane woolly aphid,M.P.K.V.Rahuri, 10th June, 2003.: 1-10 pp.
Panse , V. G. and Sukhatme, P. V. 1985. Statisticalmethods for Agricultural Workers. : 97-123
Patil, A. S., Shinde. V. D., Magar, S. B., Yadav, R. G. andNerkar, Y. S. 2004. Sugarcane woolly aphid(Ceratovacuna lanigera Zehnt) its history and controlmeasures. Cooperate Sugar. 36(1). P: 37- 48.
Phukan, E., Dutta S. K. and Sharifullah, M. D. 1977.Population build up of sugarcane aphid Ceratovacunalanigera (Zehnt.) in relation to meteorological factors.Cooperative sugar. 19(5): 311-313.
Saputro, S. E., Trijantro, B., and Harhap, R. M. 1995.Fogging with a mixture of Basudin 60 EC andsunshine to control Ceratovacuna lanigera Zehntnerin the Camming sugar manufacturing region. BeritaPusat Panelitian-Perkebunan Gula Indonesia. 12: 23.
______________
Galande et al.174

Journal of Agriculture Research and Technology 175
Katkar R. N.Associate ProfessorDept. of SSAC, Dr. PDKV, Akola 444 104
Pharande A. L.Head, Dept. of SSAC, MPKV, Rahuri 413 722
Hebsur N. S.Professor, Dept. of SSAC, CoA, Dharwad 580 005
Bharad S. G.Asso. Professor, CoH, Dr. PDKV, Akola 444 104
Nagre P. K.Head, Dept. of Horticulture, Dr. PDKV, Akola 444 104
Wagh R. S.Asso. ProfessorDept. of Botany, MPKV, Rahuri 413 722
Kale V. S.Dept. of Horticulture, Dr. PDKV, Akola 444 104
Gawande V. L.Assso. Professor of BotanyCoA, Dr. PDKV, Akola 444 104
Shelar V. R.Seed Research officer, MPKV, Rahuri 413 722
Asewar B. V.Dept. of Agronomy,VNMKV, Parbhani 431 402
Narkhede W. N.Chief Agronomist, AICRP on Integreated FarmingVNMKV, Parbhani 431 402
Narangalkar A. L.Head, Dept. of Entomology,Dr. BSKKV, Dapoli 415 712
Patil V. G.Dept. of Extension EducationCoA, Dr.BSKKV, Dapoli 415 712
Ahire M. C.Professor, CoA, Dhule
Dhekae J. S.Dept. of Agril. EconomicsDr. BSKKV, Dapoli 415 712
Dani V. B.Asso. Professor of StatisticsB.A. College of Agriculture, AAU, Anand
Swami S. B.CAET, Dr. BSKKV, Dapoli 415 712
Khandetod Y. P.CAET, Dr. BSKKV, Dapoli 415 712
Thakor N. J.CAET, Dr.BSKKV, Dapoli 415 712
Jadhav S. E.Senior Scientist, IVRI, Izatnagar, Bareily 243 122
Ulelmale A. H.Asso. Professor, KNP Veterinary College, Shirwal
Lokhande G. K.Asso. Professor, Directorate of Research,VNMKV, Parbhani 431 402
Naik R. M.Head, Dept. of Biochemistry, MPKV, Rahuri 413 722
Undirwade A. L.Head, Dept. of Entomology, Dr. PDKV, Akola 444 104
Malleshi N. G.CFTRI Layout, Mysore 570 026
Toprope V. N.Asso. Professor, CoA, Latur 413 513
Pachpute S. T.Asso. Professor, CoA, Pune
Suryawanshi A. P.Professor, Department of Plant PathologyVNMKV, Parbhani 431 402
Kamble A. B.Asso. Professor of AgronomyDept. of Agronomy, MPKV, Rahuri 413 722
Dr. N. B. GokhaleIncharge, Plant biotechnology CentreDr.BSKKV, Dapoli 415 712
Bodake P. S.Asso. Professor of Agronomy, ZARS, Igatpuri
Kolhe A. V.Asso. ProfessorDepartment of EntomologyDr. PDKV, Akola 444 104
List of Referees for Vol. 41(1)Journal of Agriculture Research and Technology (JART), is grateful to the following referees for their
honorary contribution in evaluating/reviewing the papers submitted for publication in the journal.

Journal of Agriculture Research and Technology176
ARTICLE CERTIFICATEArticle entitled : .......................................................................................................................................................
.......................................................................................................................................................
Title changed to : .......................................................................................................................................................
.......................................................................................................................................................
Authors (names) : .......................................................................................................................................................
It is certified that :
1. The article has been seen by all the authors (signatures given below), who are satisfied with its form and content.
2. The sequence of names of authors in the by-line is as per their relative contribution to this experiment, given due creditto all the scientists who made notable contribution to it.
3. The address of the organization where the research was conducted is given in the by-line (change of author's address isgiven at the footnote).
4. The experiment was carried out during the year.................................. and the article is submitted within 10 years, aftercompletion of the experiment.
5. The article is exclusive for this journal and the results reported here have not been sent (and will not be sent during itsconsideration by this journal) for publication in any other Journal.
6. The article has not been rejected for publication in any other journal/rejected in .............................................................................................................................................................................................................whose commentsare attached (Such a rejection does not disqualify the article for consideration in this journal).
7. It is based/not based on a part/complete M.Sc./Ph.D. thesis of the first author, who submitted the thesis in the year............................ to the ........................................................................................................ (University, place).
8. Correct data and facts are presented in the article.
9. I/We agree to abide by the objective comments of referees and do agree to modify the article into a short note whereever the referee so recommended for publication in the Journal of Agriculture Research and Technology.
10. If published in Journal of Agriculture Research and Technology the copyright of this article would rest with the Editor-in-Chief of the Journal who will have the right to enter into any agreement with any organization in India or abroad engagedin reprography, photocopying, storage and dissemination of information contained in it and neither we nor our legal heirswill have any claims on royalty.
11. I/We promise to pay the annual subscription when the article/note is accepted for publication in the Journal. Signatureof all authors, their names, designations and present correspondence addresses.
Signature with date Name in full and designation Present official address
1. .............................................................................................................................................................................
2. .............................................................................................................................................................................
3. .............................................................................................................................................................................
4. .............................................................................................................................................................................
5. .............................................................................................................................................................................
The above certificate is correct to the best of my knowledge and I have no objection to the publication of the article citedabove in The Journal of Agriculture Research and Technology.
Signature and address of Head of the Section/Department/Institute
ISSN 2230-9705
College of Agriculture, Pune 411005 (India)