
Downer reactor flow measurements using CREC-GS-Optiprobes
11
Downer reactor flow measurements using CREC-GS-Optiprobes Alireza Abbasi a, b , Mohammad Ashraful Islam a , Paul E. Ege b , Hugo I. de Lasa a, ⁎ a Department of Chemical and Biochemical Engineering, The University of Western Ontario, London, ON, Canada b Reactech Process Development Inc., Markham, ON, Canada abstract article info Article history: Received 16 November 2011 Received in revised form 17 January 2012 Accepted 3 February 2012 Available online 16 February 2012 Keywords: Optical sensors Downer units CPFD simulation Cluster particle velocity The present study describes the potential intrusive effects of CREC-GS-Optiprobes on the flow pattern in gas– solid downflow units. Granular flows and their interactions with the CREC-GS-Optiprobes are calculated using a CPFD (Computational Particle Fluid Dynamic) numerical scheme in three dimensions, using particle clusters. Once particles dispersed in the column, the numerical simulations revealed that these particles formed a relatively homogeneous suspension with cluster formation and solids accelerating until reaching a fully-developed regime. CPFD simulations showed that two axially aligned CREC-GS-Optiprobes, when placed in the fully developed flow regime, introduce minimum perturbations in the gas–solid suspension. Therefore this CREC-GS-Optiprobe creates a highly illuminated focal region where hydrodynamic parameters can be measured without significant flow disturbance. Thus, this study supports the application of fiber optic probes; such as in the case of the CREC-GS-Optiprobes, which can provide undisturbed axial particle cluster velocity, axial cluster slip velocities, cluster size and solid fraction measurements at strategically selected lo- cations in the gas–solid downer unit. © 2012 Elsevier B.V. All rights reserved. 1. Introduction In recent years, several research groups have studied multiphase flows in downer reactors [1–8]. Downer reactors display relatively uniform plug-flow behavior of the gas–solid suspension [9]. Due to the low back-mixing and short reaction times, downer reactors can be suitable for improving many industrial chemical processes such as fluid catalytic cracking (FCC), residual oil cracking, biomass and coal pyrolysis [10,11]. Fluid dynamic studies in downflow reactors involve complex hy- drodynamics. In these systems, information about hydrodynamics is still inadequate [12]. Accurate measurement of the operational vari- ables can provide good understanding of the multiphase flow. It is in this respect, of paramount importance, that experimental measure- ments be taken by using probes, such as: a) optical fiber probes [13–15], b) dual-optical density probes [16,17], c) capacitance probes [18] and d) suction probes [19]. These probes however, may alter or interrupt the flow pattern in the reactor with the intrusive effects [20] of these techniques. The technical literature reports noninvasive techniques for multi- phase reactors such as: a) high speed photography [21,22], b) laser doppler velocimetry [23], c) computational automated radioactive particle tracking technique [24] and d) electrical capacitance tomography [25]. Although these techniques do not affect the system flow pattern, they are expensive, not easy to implement, require com- plex result analysis and high speed computations [26] and/or have a relatively transparent optic path [27]. The Chemical Reactor Engineering Center gas–solid fiber optic probe (CREC-GS-Optiprobe) works on the principle of light backscattering. The incorporation of a Gradient Refractive Index Lens (GRIN) in CREC- GS-Optiprobe provides the unique capability of focusing a light beam in a narrow region, with high illumination density at several millimeters distance away from the probe's tip. The design of the fiber optic probe also ensures minimal flow disturbance when compared with other con- ventional fiber optic sensors. There are two types of theoretical models when using the compu- tational fluid dynamics (CFD) approach. These can be applied to study gas and solid flows. They are: a) the Eulerian–Eulerian model and b) the Eulerian–Lagrangian model. The Eulerian–Eulerian model con- siders the solid phase as a continuous medium interacting with the fluid phase. Conservation laws provide a set of equations of a similar structure for the gas and solid phases. These equations are comple- mented with constitutive relations obtained from empirical informa- tion and/or kinetic theory [28]. In particular, such a modeling approach has been successfully applied to simulate multiphase flow phenomena in risers with gas and particles moving upwards concur- rently [8]. The Eulerian–Eulerian model presents some major draw- backs in describing gas–particle, particle–particle and particle–wall interactions at the microscale, in the downer reactors, given the ex- tensive computations needed [8]. As an alternative approach in downer units, flow can be predicted with a computational particle Powder Technology 224 (2012) 1–11 ⁎ Corresponding author. E-mail address: [email protected] (H.I. de Lasa). 0032-5910/$ – see front matter © 2012 Elsevier B.V. All rights reserved. doi:10.1016/j.powtec.2012.02.005 Contents lists available at SciVerse ScienceDirect Powder Technology journal homepage: www.elsevier.com/locate/powtec
-
Upload
independent -
Category
Documents
-
view
0 -
download
0
Transcript of Downer reactor flow measurements using CREC-GS-Optiprobes

Powder Technology 224 (2012) 1–11
Contents lists available at SciVerse ScienceDirect
Powder Technology
j ourna l homepage: www.e lsev ie r .com/ locate /powtec
Downer reactor flow measurements using CREC-GS-Optiprobes
Alireza Abbasi a,b, Mohammad Ashraful Islam a, Paul E. Ege b, Hugo I. de Lasa a,⁎a Department of Chemical and Biochemical Engineering, The University of Western Ontario, London, ON, Canadab Reactech Process Development Inc., Markham, ON, Canada
⁎ Corresponding author.E-mail address: [email protected] (H.I. de Lasa).
0032-5910/$ – see front matter © 2012 Elsevier B.V. Alldoi:10.1016/j.powtec.2012.02.005
a b s t r a c t
a r t i c l e i n f oArticle history:Received 16 November 2011Received in revised form 17 January 2012Accepted 3 February 2012Available online 16 February 2012
Keywords:Optical sensorsDowner unitsCPFD simulationCluster particle velocity
The present study describes the potential intrusive effects of CREC-GS-Optiprobes on the flow pattern in gas–solid downflow units. Granular flows and their interactions with the CREC-GS-Optiprobes are calculatedusing a CPFD (Computational Particle Fluid Dynamic) numerical scheme in three dimensions, using particleclusters. Once particles dispersed in the column, the numerical simulations revealed that these particlesformed a relatively homogeneous suspension with cluster formation and solids accelerating until reachinga fully-developed regime. CPFD simulations showed that two axially aligned CREC-GS-Optiprobes, whenplaced in the fully developed flow regime, introduce minimum perturbations in the gas–solid suspension.Therefore this CREC-GS-Optiprobe creates a highly illuminated focal region where hydrodynamic parameterscan be measured without significant flow disturbance. Thus, this study supports the application of fiber opticprobes; such as in the case of the CREC-GS-Optiprobes, which can provide undisturbed axial particle clustervelocity, axial cluster slip velocities, cluster size and solid fraction measurements at strategically selected lo-cations in the gas–solid downer unit.
© 2012 Elsevier B.V. All rights reserved.
1. Introduction
In recent years, several research groups have studied multiphaseflows in downer reactors [1–8]. Downer reactors display relativelyuniform plug-flow behavior of the gas–solid suspension [9]. Due tothe low back-mixing and short reaction times, downer reactors canbe suitable for improving many industrial chemical processes suchas fluid catalytic cracking (FCC), residual oil cracking, biomass andcoal pyrolysis [10,11].
Fluid dynamic studies in downflow reactors involve complex hy-drodynamics. In these systems, information about hydrodynamics isstill inadequate [12]. Accurate measurement of the operational vari-ables can provide good understanding of the multiphase flow. It isin this respect, of paramount importance, that experimental measure-ments be taken by using probes, such as: a) optical fiber probes[13–15], b) dual-optical density probes [16,17], c) capacitance probes[18] and d) suction probes [19]. These probes however, may alter orinterrupt the flow pattern in the reactor with the intrusive effects[20] of these techniques.
The technical literature reports noninvasive techniques for multi-phase reactors such as: a) high speed photography [21,22], b) laserdoppler velocimetry [23], c) computational automated radioactiveparticle tracking technique [24] and d) electrical capacitance
rights reserved.
tomography [25]. Although these techniques do not affect the systemflow pattern, they are expensive, not easy to implement, require com-plex result analysis and high speed computations [26] and/or have arelatively transparent optic path [27].
The Chemical Reactor Engineering Center gas–solidfiber optic probe(CREC-GS-Optiprobe) works on the principle of light backscattering.The incorporation of a Gradient Refractive Index Lens (GRIN) in CREC-GS-Optiprobe provides the unique capability of focusing a light beamin a narrow region,withhigh illumination density at severalmillimetersdistance away from the probe's tip. The design of the fiber optic probealso ensuresminimal flow disturbancewhen comparedwith other con-ventional fiber optic sensors.
There are two types of theoretical models when using the compu-tational fluid dynamics (CFD) approach. These can be applied to studygas and solid flows. They are: a) the Eulerian–Eulerian model andb) the Eulerian–Lagrangian model. The Eulerian–Eulerian model con-siders the solid phase as a continuous medium interacting with thefluid phase. Conservation laws provide a set of equations of a similarstructure for the gas and solid phases. These equations are comple-mented with constitutive relations obtained from empirical informa-tion and/or kinetic theory [28]. In particular, such a modelingapproach has been successfully applied to simulate multiphase flowphenomena in risers with gas and particles moving upwards concur-rently [8]. The Eulerian–Eulerian model presents some major draw-backs in describing gas–particle, particle–particle and particle–wallinteractions at the microscale, in the downer reactors, given the ex-tensive computations needed [8]. As an alternative approach indowner units, flow can be predicted with a computational particle

2 A. Abbasi et al. / Powder Technology 224 (2012) 1–11
fluid dynamic (CPFD) numerical method [29]. The numerical methodis of the discrete element method (DEM) class. The Eulerian referenceframe allows the modeling of forces using spatial gradients of proper-ties [30]. On the other hand, the dispersed phase is treated by trackinga large number of particles through the calculated flow field [31].DEM methods are limited in applicability, given the complex denseparticle–particle interaction calculations as a result of a large numberof the particles involved. DEM is usually restricted to two-dimensional solutions [30]. Furthermore, DEM considers particle-to-particle forces using a spring–damper model and direct particle con-tact. The CPFD method, on the other hand, does not encounter theselimitations. In Computational Particle Fluid Dynamics (CPFD), eachparticle is considered with three-dimensional force componentsexerted on it. These forces are particle drag, pressure gradient, gravityand particle normal stress gradient. In CPFD, the collision force oneach particle is modeled as a spatial gradient. A numerical particlein the CPFD method is identified as a group of particles sharing chem-ical species, size, and density properties [30]. Thus, the numerical par-ticle is an approximation where properties are considered invariable.
The aim of this work is to study the change in hydrodynamic be-havior of gas–solid down flows when external objects such as fiberoptic probes are introduced in the flow. A 3D visualization has beendeveloped using the CPFD software. Determination of local flow
Fig. 1. Schematic representation of the downer reactor model unit used in the CPFD c
properties and their changes using numerical simulation providesconfirmation of the minimum intrusive effects of the CREC-GS-Optiprobe.
2. Experimental setup
Fig. 1 provides a schematic diagram of a 2-m downer reactor witha 0.02632 m internal diameter used in the CREC laboratories for ex-perimental fluid dynamic studies. A detailed description of the exper-imental unit and experimental procedure can be found in previousstudy of our group [1,5,6,32]. The downer air distributor is configuredwith sixteen 0.5 mm holes distributed evenly around the circumfer-ence of the column and angled downwards 45° with respect to thevertical. These high velocity jets allow the intimate mixing of gasand solid particles [5] in the reactor. This feeder configuration allowsone to assume that there is a uniform solid and gas distribution at thedowner entry, as adopted in the present model. The unit ends in a cy-clone where gas and particles are separated. The downer unit of Fig. 2shows the CREC-GS-Optiprobes and the associated laser beam-optical-data acquisition system as implemented in the CREC laborato-ries. This set up allowed the experimental characterization of the gas–solid flow and the simultaneous measurements of particle clusters
alculations. The location of the 2 axially separated CREC-GS-Optiprobes is shown.

Fig. 2. The experimental set-up showing the general lay out of the downer unit available in CREC laboratories as well as the associated laser beam, optical components, electronicand data acquisition systems.
3A. Abbasi et al. / Powder Technology 224 (2012) 1–11
velocity and solid particle hold-ups in strategically selected locationsin the downer unit [5,6].
The CREC-GS-Optiprobes belong to the category of fiber optic lightbackscattering sensors. A pair of such optical sensors is placed at a setlocation and separation as described in Fig. 3a. Each probe is equippedwith a GRIN lens and a receptor fiber as shown in Fig. 3b. An infraredlaser beam of 830 nmwavelength with a constant light intensity is fo-cused onto the front end of emitter optical fiber. Fig. 3c describes thelaser light that emerges from the back end of emitter optical fiber.This beam is then directed on the GRIN lens. This GRIN lens concen-trates the light and creates a small high intensity irradiated regionat a distance where the probe's intrusion influence on the flowingphases is minimized. Inside this high intensity light region, the lightis reflected by moving particles. The reflected light is then collectedand guided through a receiver optical fiber to a semiconductor photo-detector. The photodetector converts the modulation of light into anelectric potential difference. A high speed data acquisition card re-cords the electric potential difference from two parallel placed probesat a rate of 100,000 data points/s. A schematic diagram of the laserbeam path and focal region located 5.2 mm away from the tip of theprobe is reported in Fig. 3d [5].
In conventional fiber optic probes, high intensity signals resultfrom a high irradiation density volume located close to the tip ofthe probe. It is in this region, where the gas–solid suspension experi-ences stronger intrusion effects. On the other hand, in conventionalfiber optic probes, signal analysis from other unit volumes locatedfar away from the tip of the sensor contributes with poor light
intensity. Thus, the data collected incorporates significant biasedinformation.
The CREC-GS-Optiprobe creates a highly illuminated focal regionat a set distance far away from the probe tip. This is accomplishedusing a GRIN lens and by optimally positioning the view angle ofthe receiver optical fiber (Fig. 3c). These design parameters are select-ed in the CREC-GS-Optiprobe, in order to maximize reception ofreflected light by particles evolving through the highly illuminatedfocal region.
3. CPFD mathematical model and model verification
Using the Computational Particle Fluid Dynamics (CPFD) approachof the present study, the fluid phase is described as a continuum bysolving the Navier–Stokes equations. The momentum balance equa-tions for the fluid phase can be derived from kinetic theory wherethe volume averaged fluid mass and momentum equations are de-fined as follows as [33]:
∂∂t ρf θf� �
þ∇· ρf θf vf� �
¼ 0 ð1Þ
∂∂t ρf θf vf� �
þ∇· ρf θf vf vf� �
¼ −∇P þ∇·θf τf þ ρf θf g−F ð2Þ
where θf is the fluid volume fraction, vf is the fluid velocity, ρf is thefluid density, P is the fluid pressure, τf is the fluid stress tensor, and

Fig. 3. (a): Schematic of the positioning of the 2-axially separated CREC-GS-Optiprobe in the 2.63 cm diameter downer.(b): Frontal view of the 2-axially separated CREC-GS-Optiprobes showing the GRIN lens and the receiver fiber.(c): Axial section of the CREC-GS-Optiprobe showing its various components: a) emitter fiber optic, b) GRIN lens, c) re-ceiver fiber. The focal region formed by the GRIN lens and the acceptance angle for the receiver fiber are also shown.(d): Schematic representation of the two laser convergingbeams forming a focal region with high irradiation density at 5.2 mm in front of the CREC-GS-Optiprobes.
4 A. Abbasi et al. / Powder Technology 224 (2012) 1–11
gis the gravitational acceleration. F represents the momentum ex-change rate per volume between both fluid and particle movingphases.
The particle dispersed phase is treated by tracking a large finitenumber of computational particles through the calculated flow field.In CPFD, a numerical particle accounts for an ensemble of particlesdisplaying the same properties such as chemical composition, size,and density. The numerical particle is an approximation equivalentto the numerical control volume where properties of the fluid areconsidered equal. Furthermore, the particle motion is defined as pro-posed by Snider and Banerjee [33]:
ddt
vp� �
¼ β′ vf−vp� �
−∇Pρp
−∇τpθpρp
þ g ð3Þ
with β′ being the interphase drag coefficient, vp the particle velocity,ρp the particle density, θp the particle volume fraction, and τp the par-ticle normal stress. The particle trajectoryXp, is defined as:
ddt
Xp
� �¼ vp: ð4Þ
All particle properties are mapped to and from the Eulerian grid.The interpolation operator is defined in the three orthogonal direc-tions. For instance, for a particle located at positionXp, whereXp=(xp, yp, zp), the x-directional component of the interpolation op-erator to grid cell “i” is an even function which is independent of the yand z coordinates.
Sxi xp� �
¼ 0 if xi−1≥xp≥xiþ1&Sxi xp� �
¼ 1 if xp ¼ xi ð5Þ
It should be mentioned that the y and z interpolation operatorshave a similar form. Moreover, the particle volume fraction at cell“i” from the mapping of particle volume to the grid is given as:
θpi ¼1Ωi
XNP
k
VpnpSpi ð6Þ
where Ωi is a grid volume, Vp is the particle volume, np is the numberof particles in a numerical particle, and Np is the summation of nu-merical particles.

Table 2FCC particle size distribution.
Cumulative frequency (%) Diameter(m)
0.07 2.66E-050.575 3.01E-052.1 3.42E-055.07 3.88E-059.975 4.40E-0517.055 4.99E-0526.28 5.66E-0537.235 6.42E-0549.19 7.28E-0561.205 8.26E-0572.335 9.37E-0581.8 1.06E-0489.15 1.21E-0494.295 1.37E-0497.48 1.55E-0499.17 1.76E-0499.84 2.00E-04100 2.27E-04
Table 3The input parameters for the simulation.
5A. Abbasi et al. / Powder Technology 224 (2012) 1–11
The interphase drag coefficient is defined as,
β′ ¼ Cd38ρg
ρp
vf−vp��� ���3Vc4π
� �1=3 ð7Þ
with Cd, representing the drag coefficients and being a function of thecluster Reynolds number.
Cd ¼ 24ReK1K2
1þ 0:1118 ReK1K2ð Þ0:6567h i
þ 0:43051þ 3305
ReK1K2
!θ−2:65f K2 ð8Þ
Re ¼2ρf vf−vp��� ���μ f
3Vc
4π
� �1=3ð9Þ
K1 ¼ 31þ 2ffiffiffi
φp
ð10Þ
K2 ¼ 101:8148 − logφð Þ0:5743 ð11Þ
where Vc is the cluster particle volume and ϕ is the sphericity definedas N−1/3 5 with N representing the number of the particles in clusters.
The drag coefficient proposed by Ganser [34] is the one consideredin Eq. (7). The applicability of this type of correlation was suggestedby Chhabra et al. [35] and Islam et al. [5]. This correlation can be ap-plied to a cluster-based drag coefficient and within a restrictedrange of Re (4bReb12) [5]. All Re for the conditions analyzed inthis study, remained in that range.
The particle normal stress as a representative of modeling particlecollisions is derived from the particle volume fraction which is in turncalculated from particles mapped on a computational grid. Harris andCrighton [36] developed the continuum particle stress evaluating τpasfollows:
τp ¼ PsθβP
max θcp−θp; ε 1−θp� �h i ð12Þ
wherePs is a positive constant with pressure units and where θcp is theparticle volume fraction at close packing. Recommended values for βare in the 2≤β≤5 range. [37] and 10−7 for ε parameter [33].
One can notice that the particle stress as defined by Eq. (12) de-pends on the particle concentration, neglecting the influence of bothparticle size and particle velocity. The “anisotropy” of components isaccounted for, once Eq. (12) is used in the context of Eq. (5) yieldingparticle velocity vectors in various directions. This proposed particlenormal stress model has been successfully used to define solid
Table 1Simulation parameter values.
Air Mass flux:(Density 1.184 kg/m3) Cases 1, 2, 3, 4 and 5 : 2.25 kg/m2 s
Case 6: 1.12 kg/m2 sCase 7: 2.19 kg/m2 sCase 8: 2.26 kg/m2 s
FCC particles Mass fluxes:(Density 1722 kg/m3) Case 1: 0.00 kg/m2 s
Case 2: 9.20 kg/m2 sCase 3: 43.7 kg/m2 sCase 4: 62.5 kg/m2 sCase 5: 80.0 kg/m2 sCase 6: 20.39 kg/m2 sCase 7: 25.45 kg/m2 sCase 8: 36.16 kg/m2 s
Temperature 300 KOutlet absolute pressure 0.11170 MPa
velocity vectors while modeling a large number of particles throughflow fields [33]. Solid collisions depend on solid concentrations aswell as on the deviation of solid velocities from an equilibrium solidvelocity value [33].
Air and 84micron FCC particles were fed from the top of the columnvia the feeding section as described in Fig. 1. Table 1 reports the variousinlet air and particle fluxes, temperatures and outlet parameters used inthe simulations of the present study. Solid flows were selected in thesimulation to represent an ample range of possible solidfluxes in down-flow reactor units [5]. Regarding solid particles, a typical FCC particlesize distribution as shown in Table 2, was considered in the simulation.The 14.5.2 release version of Barracuda software was used in thesimulations.
A 2 m downer model with ID=0.02632 m was established in thecomputational domains (Fig. 1). To proceed with the simulations inthe downer reactor, computational domains were established usingthe following mesh: 10×10×561 with these dimensions based on ra-dial and axial dimensions respectively. The adequacy of this grid con-figuration was confirmed using different mesh sizes (e.g. alldimensions being double than in the 10×10×561 grid). Deviationsof calculated gas velocity, particle velocity and solid values weresmaller than 1%.
The input parameters for the simulations are reported in Table 3.Nf represents the particle per unit volume or particle density in the
Time step, Δt 5×10⁻⁴ s
Particle–wall normal restitution coefficient, en 0.95Particle–wall tangential restitution coefficient, et 0.95Coefficient of contact friction, fc 0.1Diffuse bounce, Df 0Dimensionless constant of the solid-phase stress model, β 3Dimensionless constant of the solid-phase stress model, ε 10−8
Pressure constant of the solid-phase stress model, Ps 10 PaSolid volume fraction at closest packing, θcp 0.6Gravitational acceleration, g −9.8 m s−2
Particle feed per average volume, Nf 300Particle/fluid slip ratio, ς 1Maximum volume iterations, Iv 1Volume residual, rv 10−6
Maximum pressure iterations, IP 2000Pressure residual, rP 10−8
Maximum velocity iterations, Iu 50Velocity residual, ru 10−7
Maximum momentum redirection from collision, ξ 40%Total number of clouds, Nc 231,052

Fig. 4. Comparison of the Slip Velocity, Particle Velocity, and Gas Velocity obtained withthe CPFD Model and Experimental Data Using CREC-GS-Optiprobes.
6 A. Abbasi et al. / Powder Technology 224 (2012) 1–11
feed. Ncrepresents the number of clouds. A “cloud” designates a largenumber of particles having the same attributes. The diffuse bouncing,Df, represents the random post-collision normal and tangential“cloud” velocities with the unit wall. This parameter emulates surfaceroughness effects [38]. Collisions of clouds with the walls are calculat-ed using normal, en, and tangential, et, particle restitution coefficients.The values of the restitution coefficients considered are the ones sug-gested by Zhao et al. [8]. The ξ parameter represents an elastic resti-tution factor that limits the velocity of the particles that bounce offof a region at close packing. ς designates an entry parameter whichprovides the particle/fluid slip ratio at the entry cell. β and Ps are con-stants needed for the solid-phase stress model. These parameters areset at β = 3 and Ps = 10 Pa as recommended by [39].
The numerical solution of the linearized governing equations wasperformed in the present study using an iterative method. Iterationscontinue until a selected number of variables satisfy conditions suchsummation of residuals. Iterations are monitored to prevent thatthey surpass a set maximum number. These computational controlvariables are as follows: i) maximum iterations for volume calcula-tions, Iv; ii) residuals for volume, rv; iii) maximum iterations for pres-sure, IP; iv) residuals for pressure, rP; v) maximum iterations forvelocity, Iu; and vi) residuals for velocity, ru.
The Δt incremental time involved in the computations was limitedso that the gasses or/and particles were not transported outside thecalculation cell. Furthermore, and in order to account for the
Fig. 5. Effect of CREC-GS-Optiprobe on the spatial average axial velocity profiles along thefeeding temperature: 300 K.
convection flow effects, a turbulence model with a large eddy simula-tion was adopted using a Quasi-second order upwind scheme. Thisprovided an accurate finite difference approach for the approxima-tion of spatial derivatives [40].
Work in the present study, involved the testing of the adequacy ofnumerical calculations. Computational simulations show that at least1.13 s are required for reaching a stable numerical value consideredto be representative of the solid flow [29]. From that point on, theparticle solid fluxes stay close to the stabilized average value as fol-lows: 9.41 kg/m2 s for Case 2, 43.66 kg/m2 s for Case 3, 62.51 kg/m2 s for Case 4 and 80.03 kg/m2 s for Case 5. All these stabilizedfluxes remain within a standard deviation of ±2%.
As a second step, to validate the numerical calculations, an addi-tional confirmation of result adequacy for both satisfactory particleaxial velocity and solid hold up, was performed. This was done byusing the following overall solid balance across the radius, for a timeof observation of �τ=8.87 s and at 2 m axial length in the downer:
1R2 ∫
�τ0
∫R
0vpz 1−θp� �
2rdr� �
dt≅Fs�τ : ð13Þ
It was also observed that for all cases considered; the calculatedand expected “Fsτ” values (Eq. (13)) deviated by less than 1%. Thiswas considered to be an excellent indicator of data consistency ofthe numerical results obtained.
Furthermore, and as a third step of the numerical model valida-tion, a specific comparison of experimental data and numerical re-sults in downer units was developed as reported in Fig. 4.Experimental data was obtained from the Islam et al. [5] study.These authors used the CREC-GS-Optiprobes described in the previ-ous section of this paper and located it at the central position of thereactor, at 1.50 m downflow from the gas feeding injection section.The CREC-GS-Optiprobe has the ability of measuring simultaneously:a) particle cluster velocity, b) cluster size, c) cluster slip velocity andd) local solid hold up. Given that experimental data was availablefor a significant range of gas–solid fluxes from our own researchgroup; these data were used for comparison with the numerical pre-dictions of the same parameters.
With this end, four characteristic conditions involving clusters of3, 4, 5 and 6 equivalent particle sizes were considered. The proposedcomparison shows that for these four characteristic conditions, thelocal averages of particle cluster velocity, cluster slip velocity andlocal solid hold up are quite close with deviations in the ±10%range. Given the wide range of gas and solid fluxes considered, itwas judged that the reported comparison provides adequate
downer. Simulated condition: 2.25 kg/m2 s air flux and 43.7 kg/m2 s particle flux. The

Fig. 6. Radial velocity profile across the downer in front of the probe. Operating conditions: 2.25 kg/m2 s air flux and Case 2: 9.2 kg/m2 s, Case 3: 43.7 kg/m2 s, Case 4: 62.5 kg/m2 s,Case 5: 80.0 kg/m2 s particle flux. The feeding temperature: 300 K. Note: The radial position of the probe is given at the bottom of each figure.
7A. Abbasi et al. / Powder Technology 224 (2012) 1–11
validation and support to the numerical model proposed in the pre-sent study.
4. Results and discussions
Fig. 5 describes the spatial average axial velocities for both gas andparticles with 2.25 kg/m2 s air flux and 43.7 kg/m2 s particle flux inthe downer with and without probe. The selected feeding tempera-ture was 300 K and the most probable cluster size (N) of 4 equivalentparticles was assigned to this downflow solid suspension [5]. Theobtained results illustrate that the cross-section average fluid gas
Fig. 7. Simulated average pressure profile along the downer at 2.25 kg/m2 s air flux and43.75 kg/m2 s particle flux. The feeding temperature: 300 K.
velocity remained fairly constant along the downer. On the otherhand, the average cross-section axial particle velocity went frombeing smaller than the gas velocity at the injection port level, inevolving and superseding the gas velocity at a column axial positionof 1.87 m or 0.13 m down from the air distributor. This shows thatparticles reach at this level the end of the acceleration zone. This par-ticle flow is expected given the influence of gravity exerted on theparticles of the evolving gas–solid suspension. Towards the end ofthe downer, this velocity difference between phases or so-called slipvelocity stabilizes, becoming for either one particle or particle cluster,its respective terminal velocity [5].
Fig. 8. Simulated average pressure gradient profile along the downer at 2.25 kg/m2 s airflux and 43.7 kg/m2 s particle flux. The feeding temperature: 300 K.

8 A. Abbasi et al. / Powder Technology 224 (2012) 1–11
One can notice, in this respect, that the CREC-GS-Optiprobe even ifdesigned with a focal region placed at 5.2 mm away from the tip ofthe probe, causes the average particle velocity to decrease modestlywhile the gas velocity increases slightly. These effects can be observedalready at 0.1 m and this before the particle reaches the probe. Theseobservations can be justified, given the reduced downer cross-sectionwhen the CREC-GS-Optiprobe is in place. The fluid has to move slightlyfaster to complywith gas phase continuity. Thus, it is apparent that nearthe focal region of the CREC-GS-Optiprobe, themeasured gas and parti-cle velocities change slightly with average axial velocities remainingsomewhat modified, with a variation of less than ±7%. This variationis considered acceptable and provides a validation of the small intrusioneffect of the CREC-GS-Optiprobe on both the average gas and particlevelocities. It is certainly understood that these effects of the CREC-GS-Optiprobe as observed in the present study, even if small will be furtherreduced in their importance when using the CREC-GS-Optiprobes inlarger diameter downers.
Fig. 9. Simulated contour of particle volume fraction at 2.25 kg/m2 s air fl
Fig. 6 provides results of the radial distribution of axial gas andparticle velocities with and without the CREC-GS-Optiprobes inplace. The focal region of the probe is placed at the centerline ofdowner column or 0.0052 m away from the probe tip. Fig. 6 reportsdata for the air flux set at 2.25 kg/m2 s and solid fluxes at a) 9.2 kg/m2 s, b) 43.7 kg/m2 s, c) 62.5 kg/m2 s and d) 80.0 kg/m2 s. At the bot-tom of Fig. 6(c) and (d) the radial location of the CREC-GS-Optiprobeis also shown. One can see that axial velocities at centerline with andwithout the CREC-GS-Optiprobe are essentially identical. Thus, theCREC-GS-Optiprobe does not introduce a measurable flow distur-bance. This result is encouraging due to the fact that most of the con-ventional fiber optic probes collect signals in the near probe headwhich are obviously strongly affected by the probe intrusion.
Figs. 7 and 8 illustrate the axial pressure and gradient profiles. Theproposed computational model yields an axial pressure profile thatdisplays a quick pressure drop in the near downer feeding sectionwhere particles are accelerated. This particle acceleration region is
ux and 43.75 kg/m2 s particle flux. The feeding temperature: 300 K.
9A. Abbasi et al. / Powder Technology 224 (2012) 1–11
followed by a constant particle velocity section where there is asteady pressure increase. This is caused by the net effect of frictionlosses and hydrostatic pressure gains. These results are consistentwith the ones observed by other researchers in the technical litera-ture and provided in this respect, additional value to the model pro-posed [18,41–44]. Thus, on the basis of the above, one can concludethat the fluid dynamic cross-sectional average simulations of the pre-sent computational model are consistent with the expected experi-mental results in downer units [5]. Moreover, one can also noticethat both pressure profiles, for total pressure and for pressure differ-ential, are slightly affected while the CREC-GS-Optiprobe is used.Thus, and as described in Fig. 5 the intrusive effect of the probe causesthe cross-section of the downer to be reduced and the fluid tomove fas-ter in the near CREC-GS-Optiprobe location. This causes the axial pres-sure profile to display a mild pressure change of not more than ±2%in front of the probe. As a result, one can argue that the effect of theprobe on fluid pressure profile is minimum with the expectation thatthis effect will be even smaller for downers of larger diameter.
Fig. 9 reports 3D computational snapshots of downer sections.Snapshot are reported at distances from the downer bottom to0.6 m height These computations were done at 2.25 kg/m2 s air fluxand 43.7 kg/m2 s particle flux. In this figure, the solid void fractionsare represented in 3D plots with the probe being located at 0.5 mfrom the bottom of the downer column. One can notice in Fig. 9solid fraction variations in the range of ±6%.
Furthermore, and of special relevance is that the particle void fractionas shown in Fig. 9 may change with the radial position in the column atvarious levels as recorded by the CREC-GS-Optiprobe. This means that ata given time and axial location, one can appraise velocity changes as fol-lows: a) in the selected focal region of measurement with CREC-GS-Optiprobe: very modest changes from 0.008 to 0.012, b) in far awayand downstream locations from CREC-GS-Optiprobe: more significantvariations from about 0.005 to 0.012.
Thus, both 2D and 3D plots from CFPD modeling become essentialfor identifying local and time-dependent fluid dynamic propertychanges. These phenomena are otherwise missed when using experi-mental cross-sectional average property based downer simulation. Inthis respect, it is possible to confirm that probe intrusion effects are par-ticularly modest in the focal region, as shown in 3D plots.
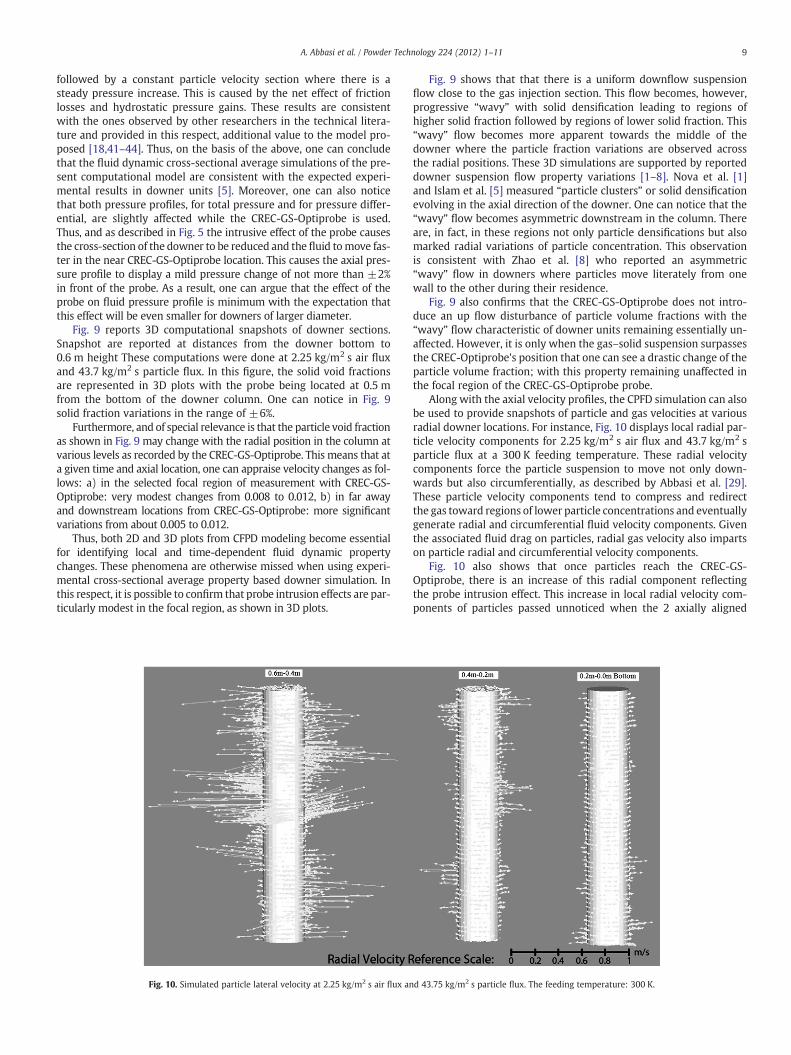
Fig. 10. Simulated particle lateral velocity at 2.25 kg/m2 s air flux an
Fig. 9 shows that that there is a uniform downflow suspensionflow close to the gas injection section. This flow becomes, however,progressive “wavy” with solid densification leading to regions ofhigher solid fraction followed by regions of lower solid fraction. This“wavy” flow becomes more apparent towards the middle of thedowner where the particle fraction variations are observed acrossthe radial positions. These 3D simulations are supported by reporteddowner suspension flow property variations [1–8]. Nova et al. [1]and Islam et al. [5] measured “particle clusters” or solid densificationevolving in the axial direction of the downer. One can notice that the“wavy” flow becomes asymmetric downstream in the column. Thereare, in fact, in these regions not only particle densifications but alsomarked radial variations of particle concentration. This observationis consistent with Zhao et al. [8] who reported an asymmetric“wavy” flow in downers where particles move literately from onewall to the other during their residence.
Fig. 9 also confirms that the CREC-GS-Optiprobe does not intro-duce an up flow disturbance of particle volume fractions with the“wavy” flow characteristic of downer units remaining essentially un-affected. However, it is only when the gas–solid suspension surpassesthe CREC-Optiprobe's position that one can see a drastic change of theparticle volume fraction; with this property remaining unaffected inthe focal region of the CREC-GS-Optiprobe probe.
Along with the axial velocity profiles, the CPFD simulation can alsobe used to provide snapshots of particle and gas velocities at variousradial downer locations. For instance, Fig. 10 displays local radial par-ticle velocity components for 2.25 kg/m2 s air flux and 43.7 kg/m2 sparticle flux at a 300 K feeding temperature. These radial velocitycomponents force the particle suspension to move not only down-wards but also circumferentially, as described by Abbasi et al. [29].These particle velocity components tend to compress and redirectthe gas toward regions of lower particle concentrations and eventuallygenerate radial and circumferential fluid velocity components. Giventhe associated fluid drag on particles, radial gas velocity also impartson particle radial and circumferential velocity components.
Fig. 10 also shows that once particles reach the CREC-GS-Optiprobe, there is an increase of this radial component reflectingthe probe intrusion effect. This increase in local radial velocity com-ponents of particles passed unnoticed when the 2 axially aligned
d 43.75 kg/m2 s particle flux. The feeding temperature: 300 K.

10 A. Abbasi et al. / Powder Technology 224 (2012) 1–11
CREC-GS-Optiprobes are used. As described in Fig. 10, radial particlevelocity remains constrained in most cases to less than 20% of theaxial velocity component. It can be considered in all cases of minorimportance for the evaluation of the overall downflow pattern.
It is important to state that the information coming from the 2 ax-ially aligned CREC-GS-Optiprobes could eventually be complementedusing the same CREC-GS-Optiprobes in a radial alignment with cir-cumferential configurations. The use of radial and circumferentiallyaligned configurations of CREC-GS-Optiprobes may be important ifone would like to focus on the fundamentals of the rotational flowin downers.
In any event, it is considered that for the design of downers and inmost downer applications, the 2-axially aligned CREC-GS-Optiprobeswill provide sufficient fluid dynamic information with minimum in-trusion effects. This is particularly true given the relatively small mag-nitude of the radial particle velocity components versus the axialparticle velocity.
5. Conclusions
The following are the main conclusions of the present study:
1. It is shown that CPFD simulation can help in providing insight intothe intrusive effects of fiber optic sensors in downflow reactors,
2. It is proven that local axial gas and particle velocities, cluster size andparticle volume fraction can be obtained using the focal region of theCREC-Optiprobes with essentially undisturbed measurements.
3. It is demonstrated that the modest variations of axial gas, particlevelocities, particle void fraction and pressure can be further re-duced using CREC-GS-Optiprobes in downers of increaseddiameter.
4. It is proven that the radial velocity and rotational flow as predictedwith CPFD, passed unobserved using two axially aligned CREC-GS-Optiprobes. This drawback can be corrected in the future with a setup of CREC-GS-Optiprobes including radially and circumferentiallyaligned sensors.
5. It is anticipated that two axially aligned CREC-GS-Optiprobes canprovide adequate design data for downer applications given therelatively small magnitude of the radial particle velocitycomponent.
List of symbolsCd drag coefficient, dimensionlessdt partial derivative of time (s)dr partial derivative of radius (m)Df Diffuse bounceen particle–wall normal restitution coefficientet particle–wall tangential restitution coefficientFs solid mass flow (kg/s)fc coefficient of contact frictionF momentum exchange rate per volume between the fluid
and particle phase (N.s/m3)g gravitational acceleration (m/s2)IP maximum pressure iterationsIu maximum velocity iterationsIv maximum volume iterationsK1 function of sphericity, dimensionlessK2 function of sphericity, dimensionlessK3 function of sphericity, dimensionlessnp the number of particles in a numerical particleN the number of the particle in the clusterNf particle feed per average volumeNc total number of cloudsNp total numerical particlesP fluid pressure (N/m2)
Ps positive constant (N/m2)r radius (m)rP pressure residualsru velocity residualsrv volume residualsR radius of the downer (m)Six the interpolation operators in the three orthogonal directions,
dimensionlessVp particle volume (m3)Vc the cluster particle volume (m3)xp x-directional component of the interpolation operatorXp particle trajectory (m)yp y-directional component of the interpolation operatorzp z-directional component of the interpolation operator
Greek lettersβ constant number, dimensionlessβ′ interphase drag coefficient (m/s2)ς particle/fluid slip ratioξ maximum momentum redirection from collisionε constant number, dimensionlessεs solid porosity, dimensionlessφ sphericity, dimensionlessΔt time step (s)ρf fluid density (kg/m3)ρp particle density (kg/m3)θcp particle volume fraction at close packing limit, dimensionlessθf fluid volume fraction, dimensionlessθp particle volume fraction, dimensionlessΩi grid i volumeRe Reynolds number, dimensionlessτp particle normal stress (N/m2)�τ time of observation (s)vf fluid velocity (m/s)vp particle velocity (m/s)vpz particle z velocity (m/s)
Acknowledgments
We would like to thank the Natural and Engineering ResearchCouncil (NSERC) for the financial support provided to this study.Dr. Alireza Abbasi would like to express his gratitude to the MITACSprogram for the PDF-Mitacs granted.
References
[1] S.R. Nova, S. Krol, H.I. de Lasa, Particle velocity and particle clustering in down-flowreactors, Powder Technology 148 (2004) 172–185.
[2] B. Luo, D. Yan, Y.L. Ma, S. Barghi, J. Zhu, Characteristics of gas–solid mass transferin a cocurrent downflow circulating fluidized bed reactor, Chemical EngineeringJournal 132 (2007) 9–15.
[3] X.B. Qi, H. Zhang, J. Zhu, Solids concentration in the fully developed region of circulatingfluidized bed reactor, Powder Technology 183 (2008) 417–425.
[4] S. Vaishali, S. Roy, P.L. Mills, Hydrodynamic simulation of gas–solids down flowreactors, Chemical Engineering Science 63 (2008) 5107–5119.
[5] M.A. Islam, S. Krol, H.I. de Lasa, Slip velocity in downer reactors: drag coefficientand the influence of operational variables, Industrial and Engineering ChemistryResearch 49 (2010) 6735–6744.
[6] M.A. Islam, S. Krol, H.I. de Lasa, Radial distribution of particle clusters in a downerreactor unit, in: S.D. Kim, Y. Kang, J.K. Lee, Y.C. Seo (Eds.), Fluidization XIII: NewParadigm in Fluidization Engineering, Engineering Conferences International,New York, 2010, pp. 399–406, Article # 6-4.
[7] T. Zhao, M. Takei, Discussion of the solids distribution behavior in a downer withnew designed distributor based on concentration images obtained by electricalcapacitance tomography, Powder Technology 198 (2010) 120–130.
[8] Y. Zhao, Y. Ding, C. Wu, Y. Cheng, Numerical simulation of hydrodynamics indowners using a CFD–DEMcoupled approach, Powder Technology 199 (2010) 2–12.
[9] H. Zhang, J.-X. Zhu, M.A. Bergougnou, Hydrodynamics in downflow fluidized beds(1): solids concentration profiles and pressure gradient distributions, ChemicalEngineering Science 54 (1999) 5461–5470.

11A. Abbasi et al. / Powder Technology 224 (2012) 1–11
[10] Y. Cheng, C. Wu, J. Zhu, F. Wei, Y. Jin, Downer reactor: from fundamental study toindustrial application, Powder Technology 183 (2008) 364–384.
[11] J.-X. Zhu, Z.-Q. Yu, Y. Jin, J.R. Grace, A. Issangya, Cocurrent downflow circulatingfluidized bed (downer) reactors — a state of the art review, Canadian Journal ofChemical Engineering 73 (1995) 662–677.
[12] L. Sunun, T. Nattha, V. Terdthai, K. Parinya, DEM modeling and simulation of adown-flow circulating fluidized bed, Chemical Engineering Communications 17(2008) 1328–1344.
[13] D.A. Sobocinski, B.J. Young, H.I. de Lasa, New fiber-optic method for measuringvelocities of strands and solids hold-up in gas–solids downflow reactors, PowderTechnology 83 (1995) 1–11.
[14] H. Zhang, J.-X. Zhu, Hydrodynamics in downflow fluidized beds (2): particle velocityand solids flux profiles, Chemical Engineering Science 55 (2000) 4367–4377.
[15] M.A. Islam, S. Krol, H.I. de Lasa, The CREC-GS-Optiprobes and its focal region; gas–solidflow measurements in down flow reactors, Chemical Engineering Science 66 (2011)1671–1684.
[16] A. Magnusson, R. Rundquist, A.E. Almstedt, F. Johnson, Dual fibre optical probemeasurements of solids volume fraction in a circulating fluidized bed, PowderTechnology 151 (2005) 19–26.
[17] M. Zhang, Z. Qian, H. Yu, F. Wei, The solid flow structure in a circulating fluidizedbed riser/downer of 0.42-m diameter, Powder Technology 129 (2003) 46–52.
[18] K. Tuzla, A.K. Sharma, J.C. Chen, T. Schiewe, K.E.Wirth, O.Molerus, Transient dynamicsof solid concentration in downer fluidized bed, Powder Technology 100 (1998)166–172.
[19] J.S. Ball, J.-X. Zhu, A preliminary study into the local solids fluxes in a downer reactor,Powder Technology 114 (2001) 96–101.
[20] J. Werther, Measurement techniques in fluidized beds, Powder Technology 102(1999) 15–36.
[21] X. Lu, S. Li, L. Du, J. Yao,W. Lin, H. Li, Flow structures in thedowner circulatingfluidizedbed, Chemical Engineering Journal 112 (2005) 23–31.
[22] L. Cadoret, N. Reuge, S. Pannala, M. Syamlal, C. Rossignol, J. Dexpert-Ghys, C.Coufort, B. Caussat, Silicon Chemical Vapor Deposition on macro and submicronpowders in a fluidized bed, Powder Technology 190 (2009) 185–191.
[23] X. Liu, S. Gao, J. Li, Characterizing particle clustering behavior by PDPAmeasurementfor dilute gas–solid flow, Chemical Engineering Journal 108 (2005) 193–202.
[24] S. Bhusarapu, M. Cassanello, M.H. Al-Dahhan, M.P. Dudukovic, S. Trujillo, T.J.O'Hern, Dynamical features of the solid motion in gas–solid riser, InternationalJournal of Multiphase Flow 33 (2007) 164–181.
[25] S. Malcus, G. Chaplin, T. Pugsley, The hydrodynamics of the high-density bottomzone in a CFB riser analyzed by means of electrical capacitance tomography(ECT), Chemical Engineering Science 55 (2000) 4129–4138.
[26] J.-X. Zhu, G.-Z. Li, S.-Z. Qin, F.-Y. Li, H. Zhang, Y.-L. Yang, Direct measurements ofparticle velocities in gas–solids suspension flow using a novel five-fiber opticalprobe, Powder Technology 115 (2001) 184–192.
[27] P. Lehner, K.-E. Wirth, Characterization of the flow pattern in a downer reactor,Chemical Engineering Science 54 (1999) 5471–5483.
[28] L. Huilin, H. Yurong, D. Gidaspow, Hydrodynamic modeling of binary mixture ina gas bubbling fluidized bed using the kinetic theory of granular flow, ChemicalEngineering Science 58 (2003) 1197–1205.
[29] A. Abbasi, M.A. Islam, P.E. Ege, H.I. de Lasa, CPFD Flow Pattern Simulation inDowner Reactors, submitted to AICHE J. (Submission # AIChE 11-13725).
[30] D.M. Snider, Three fundamental granular flow experiments and CPFD predictions,Powder Technology 176 (2007) 36–46.
[31] K. Elsayed, C. Lacor, The effect of vortex finder diameter of cyclone separator perfor-mance and flow filed, in: J.C.F. Pereira, A. Sequeira, J.M.C. Pereira (Eds.), Proceedingsof the V European Conference on Computational Fluid Dynamics ECCOMAS CFD2010, Lisbon, Portugal, 2010.
[32] M.A. Islam, Fluid Dynamic Studies in downer reactors, PhD Dissertation, The Universityof Western Ontario, London, Canada, 2010.
[33] D.M. Snider, S. Banerjee, Heterogeneous gas chemistry in the CPFD Eulerian-Lagrangian numerical scheme (ozone decomposition), Powder Technology 199(2010) 100–106.
[34] G.H. Ganser, A rational approach to drag prediction of spherical and nonsphericalparticles, Powder Technology 77 (1993) 143–152.
[35] R.P. Chhabra, L. Agarwal, N.K. Sinha, Drag on non-spherical particles: an evaluationof available methods, Powder Technology 101 (1999) 288–295.
[36] S.E. Harris, D.G. Crighton, Solitons, solitary waves and voidage disturbances ingas-fluidized beds, Journal of Fluid Mechanics 266 (1994) 243–276.
[37] F.M. Auzerais, R. Jackson, W.B. Russel, The resolution of shocks and the effects ofcompressible sediments in transient settling, Journal of Fluid Mechanics 195(1988) 437–462.
[38] J. Leboreiro, G.G. Joseph, C.M. Hrenya, D.M. Snider, S.S. Banerjee, J.E. Galvin, Theinfluence of binary drag laws on simulations of species segregation in gas-fluidized beds, Powder Technology 184 (2008) 275–290.
[39] D.M. Snider, P.J. O'Rourke,M.J. Andrews, Sedimentflow in inclined vessels calculatedusing a multiphase particle-in-cell model for dense particle flows, InternationalJournal of Multiphase Flow 24 (1998) 1359–1382.
[40] A.A. Amsden, P.J. Orourke, T.D. Butler, KIVA-II: A Computer Program for ChemicallyReactive Flows with Sprays, National Laboratory, Los Alamos, May 1989 Issued.
[41] Z. Wang, D. Bai, Y. Jin, Hydrodynamics of cocurrent downflow circulating fluidizedbed (CDCFB), Powder Technology 70 (1992) 271–275.
[42] P.M. Johnston, H.I. de Lasa, J.-X. Zhu, Axial flow structure in the entrance region ofa downer fluidized bed: effects of the distributor design, Chemical EngineeringScience 54 (1999) 2161–2173.
[43] C. Cao, H. Weinstein, Characterization of down flowing high velocity fluidizedbeds, AICHE Journal 46 (2000) 515–522.
[44] Y. Bolkan, F. Berruti, J.-X. Zhu, B. Milne, Modeling circulating fluidized beddowners, Powder Technology 132 (2003) 85–100.