Double Jeopardy in Contemporary China - Semantic Scholar
22
International Journal of Environmental Research and Public Health Article Double Jeopardy in Contemporary China: Intersecting the Socioeconomic Gradient and Geographic Context on Early Childhood Development Wangyang Li 1 , Minyi Li 2, * , Yongai Jin 3 , Shiqi Wang 2 and Yi Zhang 2 1 School of Sociology, Beijing Normal University, Beijing 100875, China; [email protected] 2 Faculty of Education, Beijing Normal University, Beijing 100875, China; [email protected] (S.W.); [email protected] (Y.Z.) 3 School of Sociology and Population Studies, Renmin University of China, Beijing 100872, China; [email protected] * Correspondence: [email protected] Received: 5 May 2020; Accepted: 3 July 2020; Published: 8 July 2020 Abstract: Family socioeconomic status (SES) differences in early childhood development (ECD) are well documented, as are the neighborhood effects in early development outcomes. However, little is known about whether the SES gradient in ECD outcomes varies across geographic contexts by county-level variables in contemporary China. This study examines the effects of county-level socioeconomic background on inequalities in the developmental outcomes of young Chinese children. Individual-level child development data based on four early development milestones—taking a first step, first sentences, counting 10 objects, fully independent toileting—were combined with family- and county-level socioeconomic data from the China Family Panel Studies (CFPS). Using a hierarchical linear model (HLM) to examine how the broader socioeconomic context plays a role in the attainment of developmental milestones at expected times as young children grow and develop, we have found significant cross-level interaction effects between family SES and county-level variables in relation to developmental milestone attainment. The family SES gradient in the achievement of children’s developmental milestones is steeper for those in the under-developed regions than their counterparts in the more developed regions. Our findings suggest that low-SES children who are living in socioeconomically deprived regions suffer from a double disadvantage in terms of early development outcomes. Further research would be needed to contextualize the observed interactions and better explain the underlying mechanisms. Keywords: early developmental milestones; geographic context; socioeconomic gradient 1. Introduction The early childhood period, particularly from the prenatal to the first 5 years of life, has long been recognized to lay the foundations for a lifetime of well-being. An extensive body of scientific evidence suggests that early adversity and poor development have sustainable consequences on physical and emotional health outcomes later from a life course perspective, such as chronic diseases [1–3], psychiatric disorders [4], and depression [5]. Developmental delays in early childhood have also been shown to hinder brain development and lead to poorer educational attainment and economic performance in adulthood [6–10]. In a thorough review, Richter et al. [11] summarized the benefits of investing in high-quality early childhood education and care in improving health and well-being across the lifespan, particularly for disadvantaged children. Int. J. Environ. Res. Public Health 2020, 17, 4937; doi:10.3390/ijerph17144937 www.mdpi.com/journal/ijerph
-
Upload
khangminh22 -
Category
Documents
-
view
1 -
download
0
Transcript of Double Jeopardy in Contemporary China - Semantic Scholar
International Journal of
Environmental Research
and Public Health
Article
Double Jeopardy in Contemporary China:Intersecting the Socioeconomic Gradient andGeographic Context on EarlyChildhood Development
Wangyang Li 1, Minyi Li 2,* , Yongai Jin 3, Shiqi Wang 2 and Yi Zhang 2
1 School of Sociology, Beijing Normal University, Beijing 100875, China; [email protected] Faculty of Education, Beijing Normal University, Beijing 100875, China; [email protected] (S.W.);
[email protected] (Y.Z.)3 School of Sociology and Population Studies, Renmin University of China, Beijing 100872, China;
[email protected]* Correspondence: [email protected]
Received: 5 May 2020; Accepted: 3 July 2020; Published: 8 July 2020�����������������
Abstract: Family socioeconomic status (SES) differences in early childhood development (ECD)are well documented, as are the neighborhood effects in early development outcomes. However,little is known about whether the SES gradient in ECD outcomes varies across geographic contextsby county-level variables in contemporary China. This study examines the effects of county-levelsocioeconomic background on inequalities in the developmental outcomes of young Chinese children.Individual-level child development data based on four early development milestones—taking afirst step, first sentences, counting 10 objects, fully independent toileting—were combined withfamily- and county-level socioeconomic data from the China Family Panel Studies (CFPS). Using ahierarchical linear model (HLM) to examine how the broader socioeconomic context plays a role in theattainment of developmental milestones at expected times as young children grow and develop, wehave found significant cross-level interaction effects between family SES and county-level variablesin relation to developmental milestone attainment. The family SES gradient in the achievement ofchildren’s developmental milestones is steeper for those in the under-developed regions than theircounterparts in the more developed regions. Our findings suggest that low-SES children who areliving in socioeconomically deprived regions suffer from a double disadvantage in terms of earlydevelopment outcomes. Further research would be needed to contextualize the observed interactionsand better explain the underlying mechanisms.
Keywords: early developmental milestones; geographic context; socioeconomic gradient
1. Introduction
The early childhood period, particularly from the prenatal to the first 5 years of life, has long beenrecognized to lay the foundations for a lifetime of well-being. An extensive body of scientific evidencesuggests that early adversity and poor development have sustainable consequences on physicaland emotional health outcomes later from a life course perspective, such as chronic diseases [1–3],psychiatric disorders [4], and depression [5]. Developmental delays in early childhood have alsobeen shown to hinder brain development and lead to poorer educational attainment and economicperformance in adulthood [6–10]. In a thorough review, Richter et al. [11] summarized the benefitsof investing in high-quality early childhood education and care in improving health and well-beingacross the lifespan, particularly for disadvantaged children.
Int. J. Environ. Res. Public Health 2020, 17, 4937; doi:10.3390/ijerph17144937 www.mdpi.com/journal/ijerph
Int. J. Environ. Res. Public Health 2020, 17, 4937 2 of 22
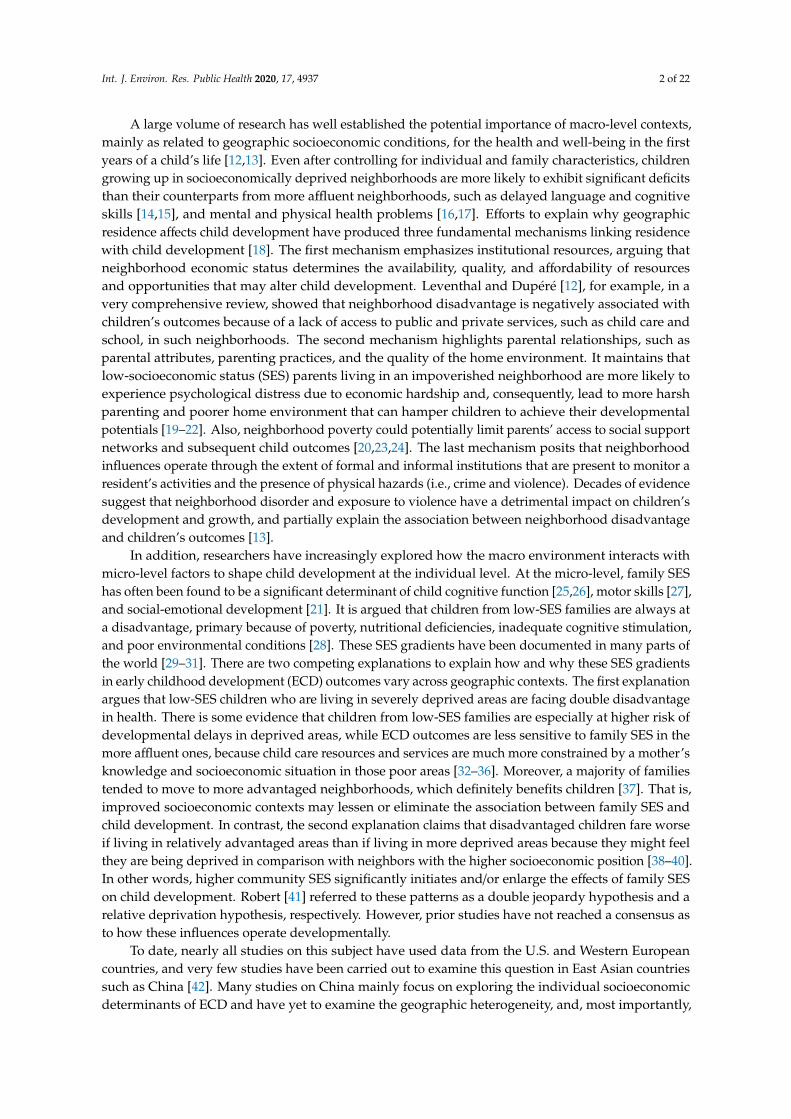
A large volume of research has well established the potential importance of macro-level contexts,mainly as related to geographic socioeconomic conditions, for the health and well-being in the firstyears of a child’s life [12,13]. Even after controlling for individual and family characteristics, childrengrowing up in socioeconomically deprived neighborhoods are more likely to exhibit significant deficitsthan their counterparts from more affluent neighborhoods, such as delayed language and cognitiveskills [14,15], and mental and physical health problems [16,17]. Efforts to explain why geographicresidence affects child development have produced three fundamental mechanisms linking residencewith child development [18]. The first mechanism emphasizes institutional resources, arguing thatneighborhood economic status determines the availability, quality, and affordability of resourcesand opportunities that may alter child development. Leventhal and Dupéré [12], for example, in avery comprehensive review, showed that neighborhood disadvantage is negatively associated withchildren’s outcomes because of a lack of access to public and private services, such as child care andschool, in such neighborhoods. The second mechanism highlights parental relationships, such asparental attributes, parenting practices, and the quality of the home environment. It maintains thatlow-socioeconomic status (SES) parents living in an impoverished neighborhood are more likely toexperience psychological distress due to economic hardship and, consequently, lead to more harshparenting and poorer home environment that can hamper children to achieve their developmentalpotentials [19–22]. Also, neighborhood poverty could potentially limit parents’ access to social supportnetworks and subsequent child outcomes [20,23,24]. The last mechanism posits that neighborhoodinfluences operate through the extent of formal and informal institutions that are present to monitor aresident’s activities and the presence of physical hazards (i.e., crime and violence). Decades of evidencesuggest that neighborhood disorder and exposure to violence have a detrimental impact on children’sdevelopment and growth, and partially explain the association between neighborhood disadvantageand children’s outcomes [13].
In addition, researchers have increasingly explored how the macro environment interacts withmicro-level factors to shape child development at the individual level. At the micro-level, family SEShas often been found to be a significant determinant of child cognitive function [25,26], motor skills [27],and social-emotional development [21]. It is argued that children from low-SES families are always ata disadvantage, primary because of poverty, nutritional deficiencies, inadequate cognitive stimulation,and poor environmental conditions [28]. These SES gradients have been documented in many parts ofthe world [29–31]. There are two competing explanations to explain how and why these SES gradientsin early childhood development (ECD) outcomes vary across geographic contexts. The first explanationargues that low-SES children who are living in severely deprived areas are facing double disadvantagein health. There is some evidence that children from low-SES families are especially at higher risk ofdevelopmental delays in deprived areas, while ECD outcomes are less sensitive to family SES in themore affluent ones, because child care resources and services are much more constrained by a mother’sknowledge and socioeconomic situation in those poor areas [32–36]. Moreover, a majority of familiestended to move to more advantaged neighborhoods, which definitely benefits children [37]. That is,improved socioeconomic contexts may lessen or eliminate the association between family SES andchild development. In contrast, the second explanation claims that disadvantaged children fare worseif living in relatively advantaged areas than if living in more deprived areas because they might feelthey are being deprived in comparison with neighbors with the higher socioeconomic position [38–40].In other words, higher community SES significantly initiates and/or enlarge the effects of family SESon child development. Robert [41] referred to these patterns as a double jeopardy hypothesis and arelative deprivation hypothesis, respectively. However, prior studies have not reached a consensus asto how these influences operate developmentally.
To date, nearly all studies on this subject have used data from the U.S. and Western Europeancountries, and very few studies have been carried out to examine this question in East Asian countriessuch as China [42]. Many studies on China mainly focus on exploring the individual socioeconomicdeterminants of ECD and have yet to examine the geographic heterogeneity, and, most importantly,

Int. J. Environ. Res. Public Health 2020, 17, 4937 3 of 22
the interaction between individual and contextual socioeconomic conditions. The paucity of studies inChina partly results from the absence of data combining information at the individual, family, andcommunity levels. It is these mechanisms that are the focal point of analysis of the contributions ofthis paper.
To revisit this question is particularly important in China because geographic disparities in today’sChina are tremendous. As studies have documented, social and economic inequality in China isheavily driven by structural or institutional factors such as residence and hukou (household registrationsystem), in contrast to the Western societies, where individual and family characteristics have the mostprofound influences [43–45]. In their most recent study, Liu et al. (2020) observed a strong associationbetween where Chinese children live and their cognitive function and high-school enrollment [46].Despite substantial progress over the last decades, developmental delays in infancy remain a noticeableproblem in China, particularly amongst children living in most deprived areas. As estimated, 17million children younger than 5 years were at high risk for developmental delays and extreme povertyin 2010 [47].
In this study, we capitalize on data from the China Family Panel Studies (CFPS), a recently availablenational representative and longitudinal survey dataset, and investigate the effects of geographicsocioeconomic context on inequalities in ECD in contemporary China. We aim to address the followingresearch questions: (1) Do macro-level socioeconomic circumstances are associated with ECD inChina? (2) How do macro-level variations in the socioeconomic context shape the relationship betweenindividual-level socioeconomic position and ECD? This study improves our knowledge about whetherand how inequalities in early childhood health and well-being differ across geographic contexts in EastAsian societies.
2. Materials and Methods
2.1. Sample
This study drew on data from the CFPS, an on-going, nationally representative, and longitudinalsurvey launched in 2010 by the Institute of Social Science Survey (ISSS) at Peking University [48]. Inthe baseline survey conducted in 2010, the CFPS has successfully interviewed 14,960 households in 25provinces, along with 33,600 adults and 8990 children within these households. The individuals in thebaseline survey as well as core new family members residing in the target family have been tracked inthe four waves of follow-up (2012, 2014, 2016, and 2018). In our study, we include information from thefive waves. For those who were interviewed twice or more, we used their most current information.For example, for a child who was interviewed in 2010, 2012, and 2016, we used his/her informationfrom CFPS 2016 rather than that in previous years. A critical feature of the CFPS is that it collectsinformation at the individual, family, and community level, which allows us to link children with theirfamilies and communities to examine our research questions. The adult and child questionnaires areanswered by individual adults and children age 10 or older, while information for children underage 10 is collected by a questionnaire that their guardians, mostly parents, answer. The CFPS wasapproved by the ethics committee of the Peking University (Ref No. IRB00001052-14010).
2.2. Measures
2.2.1. Outcome Variables
As an outcome of health and development status in the early years, we used four developmentalmilestones in infancy, including motor, language, cognitive skills, and self-help. Although childrendo not develop skills on a rigorous timetable, there is a normal range and mean age in which a childmay reach each milestone [49]. The timing of milestone achievement is viewed as an importantindicator of child development [50], because later achievement has been shown to be linked to
Int. J. Environ. Res. Public Health 2020, 17, 4937 4 of 22
cognitive impairment [51–53], behavior problems [54], and psychiatric disorders [55–57] in adolescenceand beyond.
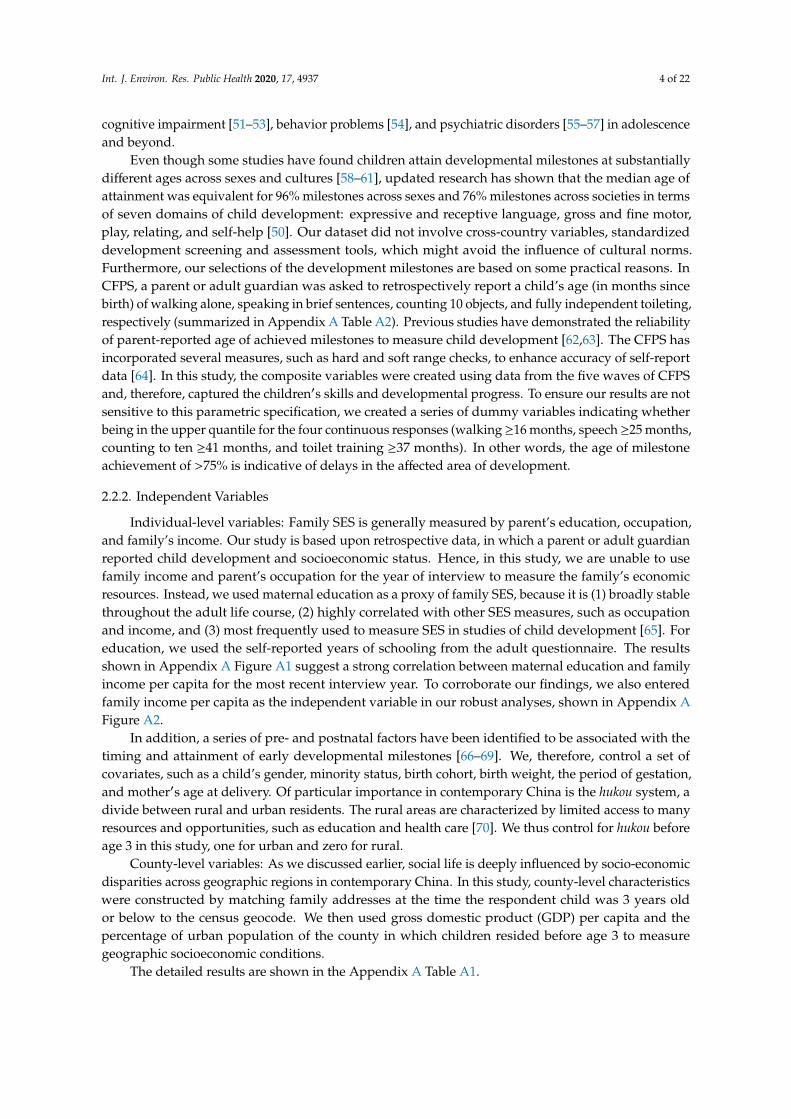
Even though some studies have found children attain developmental milestones at substantiallydifferent ages across sexes and cultures [58–61], updated research has shown that the median age ofattainment was equivalent for 96% milestones across sexes and 76% milestones across societies in termsof seven domains of child development: expressive and receptive language, gross and fine motor,play, relating, and self-help [50]. Our dataset did not involve cross-country variables, standardizeddevelopment screening and assessment tools, which might avoid the influence of cultural norms.Furthermore, our selections of the development milestones are based on some practical reasons. InCFPS, a parent or adult guardian was asked to retrospectively report a child’s age (in months sincebirth) of walking alone, speaking in brief sentences, counting 10 objects, and fully independent toileting,respectively (summarized in Appendix A Table A2). Previous studies have demonstrated the reliabilityof parent-reported age of achieved milestones to measure child development [62,63]. The CFPS hasincorporated several measures, such as hard and soft range checks, to enhance accuracy of self-reportdata [64]. In this study, the composite variables were created using data from the five waves of CFPSand, therefore, captured the children′s skills and developmental progress. To ensure our results are notsensitive to this parametric specification, we created a series of dummy variables indicating whetherbeing in the upper quantile for the four continuous responses (walking≥16 months, speech≥25 months,counting to ten ≥41 months, and toilet training ≥37 months). In other words, the age of milestoneachievement of >75% is indicative of delays in the affected area of development.
2.2.2. Independent Variables
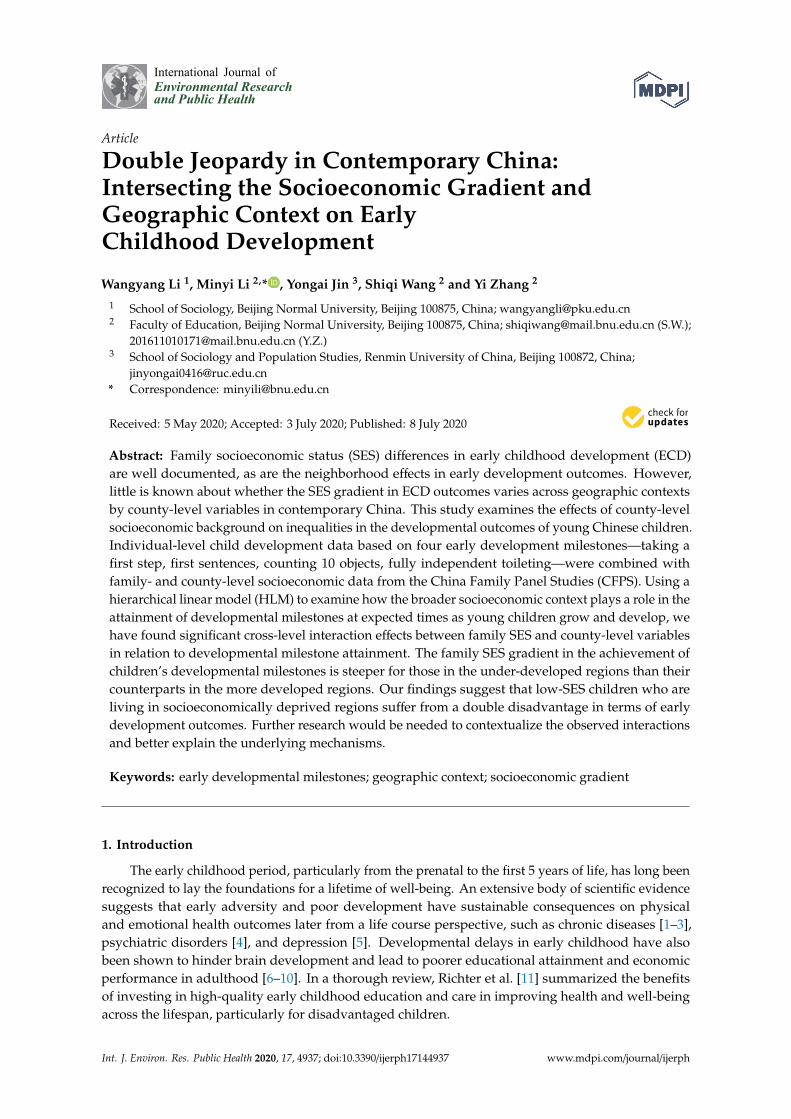
Individual-level variables: Family SES is generally measured by parent’s education, occupation,and family’s income. Our study is based upon retrospective data, in which a parent or adult guardianreported child development and socioeconomic status. Hence, in this study, we are unable to usefamily income and parent’s occupation for the year of interview to measure the family’s economicresources. Instead, we used maternal education as a proxy of family SES, because it is (1) broadly stablethroughout the adult life course, (2) highly correlated with other SES measures, such as occupationand income, and (3) most frequently used to measure SES in studies of child development [65]. Foreducation, we used the self-reported years of schooling from the adult questionnaire. The resultsshown in Appendix A Figure A1 suggest a strong correlation between maternal education and familyincome per capita for the most recent interview year. To corroborate our findings, we also enteredfamily income per capita as the independent variable in our robust analyses, shown in Appendix AFigure A2.
In addition, a series of pre- and postnatal factors have been identified to be associated with thetiming and attainment of early developmental milestones [66–69]. We, therefore, control a set ofcovariates, such as a child’s gender, minority status, birth cohort, birth weight, the period of gestation,and mother′s age at delivery. Of particular importance in contemporary China is the hukou system, adivide between rural and urban residents. The rural areas are characterized by limited access to manyresources and opportunities, such as education and health care [70]. We thus control for hukou beforeage 3 in this study, one for urban and zero for rural.
County-level variables: As we discussed earlier, social life is deeply influenced by socio-economicdisparities across geographic regions in contemporary China. In this study, county-level characteristicswere constructed by matching family addresses at the time the respondent child was 3 years oldor below to the census geocode. We then used gross domestic product (GDP) per capita and thepercentage of urban population of the county in which children resided before age 3 to measuregeographic socioeconomic conditions.
The detailed results are shown in the Appendix A Table A1.
Int. J. Environ. Res. Public Health 2020, 17, 4937 5 of 22
2.3. Statistical Analysis
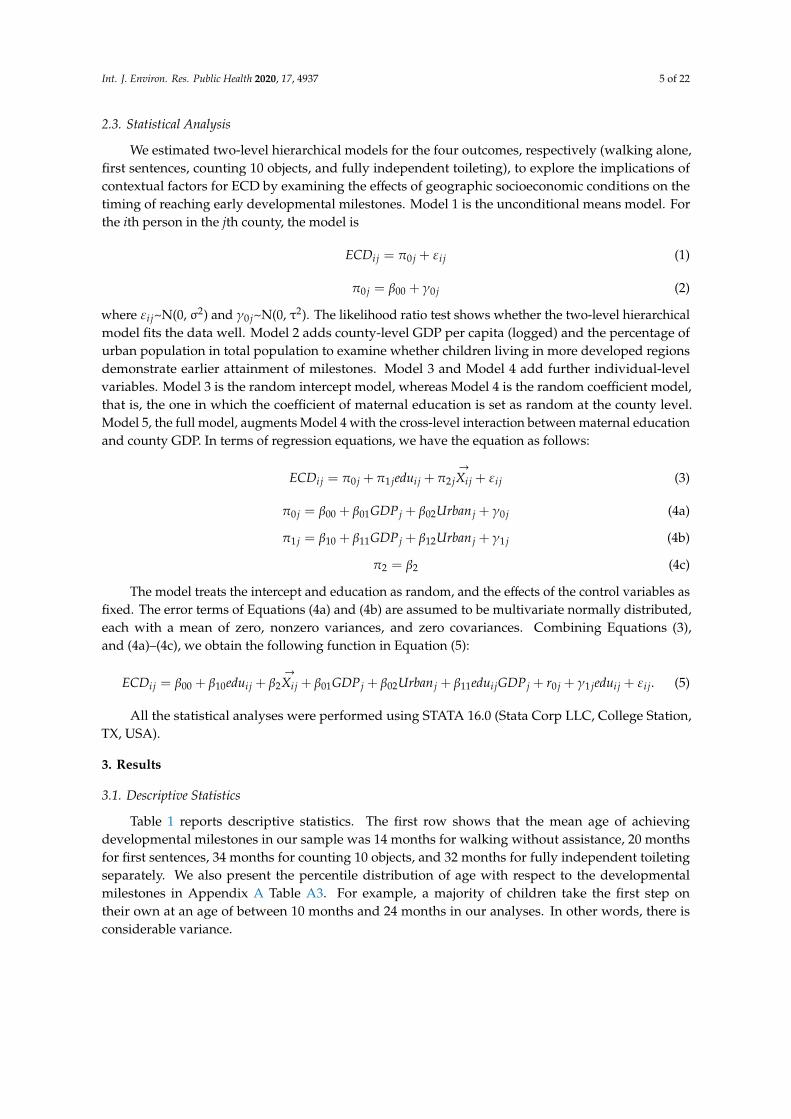
We estimated two-level hierarchical models for the four outcomes, respectively (walking alone,first sentences, counting 10 objects, and fully independent toileting), to explore the implications ofcontextual factors for ECD by examining the effects of geographic socioeconomic conditions on thetiming of reaching early developmental milestones. Model 1 is the unconditional means model. Forthe ith person in the jth county, the model is
ECDi j = π0 j + εi j (1)
π0 j = β00 + γ0 j (2)
where εi j~N(0, σ2) and γ0 j~N(0, τ2). The likelihood ratio test shows whether the two-level hierarchicalmodel fits the data well. Model 2 adds county-level GDP per capita (logged) and the percentage ofurban population in total population to examine whether children living in more developed regionsdemonstrate earlier attainment of milestones. Model 3 and Model 4 add further individual-levelvariables. Model 3 is the random intercept model, whereas Model 4 is the random coefficient model,that is, the one in which the coefficient of maternal education is set as random at the county level.Model 5, the full model, augments Model 4 with the cross-level interaction between maternal educationand county GDP. In terms of regression equations, we have the equation as follows:
ECDi j = π0 j + π1 jedui j + π2 j→
Xi j + εi j (3)
π0 j = β00 + β01GDP j + β02Urban j + γ0 j (4a)
π1 j = β10 + β11GDP j + β12Urban j + γ1 j (4b)
π2 = β2 (4c)
The model treats the intercept and education as random, and the effects of the control variables asfixed. The error terms of Equations (4a) and (4b) are assumed to be multivariate normally distributed,each with a mean of zero, nonzero variances, and zero covariances. Combining Equations (3),and (4a)–(4c), we obtain the following function in Equation (5):
ECDi j = β00 + β10edui j + β2→
Xi j + β01GDP j + β02Urban j + β11edui jGDP j + r0 j + γ1 jedui j + εi j. (5)
All the statistical analyses were performed using STATA 16.0 (Stata Corp LLC, College Station,TX, USA).
3. Results
3.1. Descriptive Statistics
Table 1 reports descriptive statistics. The first row shows that the mean age of achievingdevelopmental milestones in our sample was 14 months for walking without assistance, 20 monthsfor first sentences, 34 months for counting 10 objects, and 32 months for fully independent toiletingseparately. We also present the percentile distribution of age with respect to the developmentalmilestones in Appendix A Table A3. For example, a majority of children take the first step ontheir own at an age of between 10 months and 24 months in our analyses. In other words, there isconsiderable variance.
Int. J. Environ. Res. Public Health 2020, 17, 4937 6 of 22
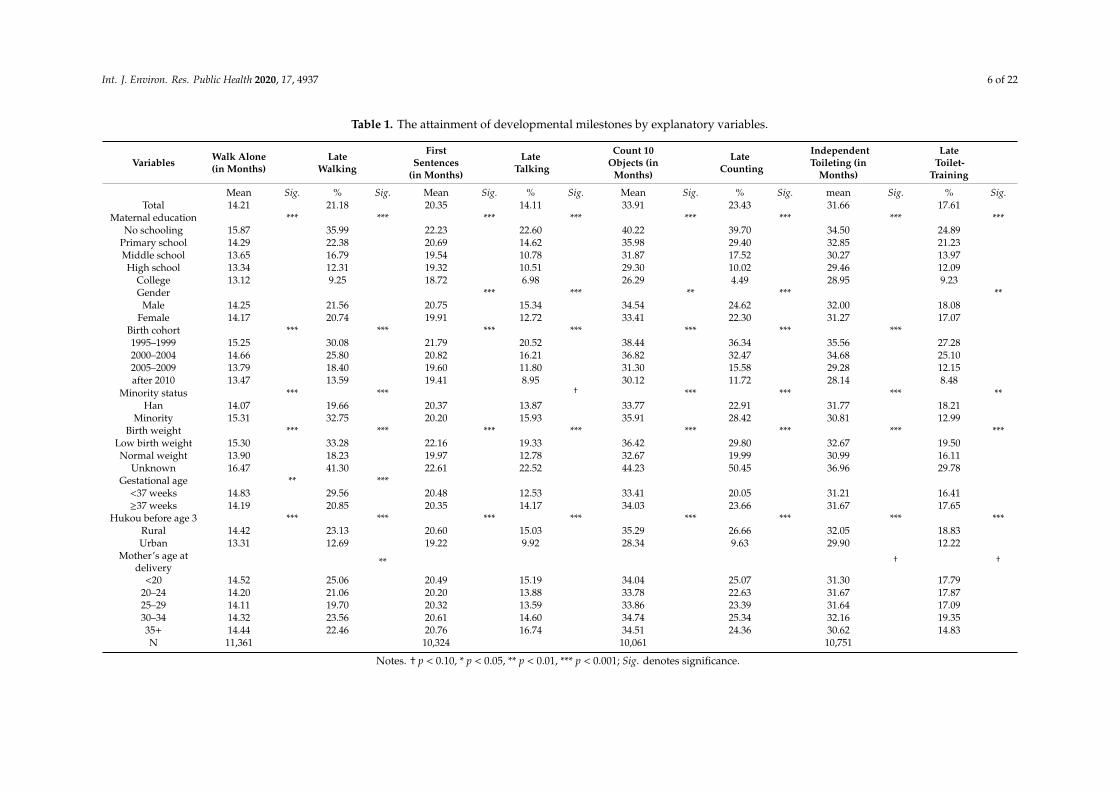
Table 1. The attainment of developmental milestones by explanatory variables.
Variables Walk Alone(in Months)
LateWalking
FirstSentences
(in Months)
LateTalking
Count 10Objects (in
Months)
LateCounting
IndependentToileting (in
Months)
LateToilet-
Training
Mean Sig. % Sig. Mean Sig. % Sig. Mean Sig. % Sig. mean Sig. % Sig.Total 14.21 21.18 20.35 14.11 33.91 23.43 31.66 17.61
Maternal education *** *** *** *** *** *** *** ***No schooling 15.87 35.99 22.23 22.60 40.22 39.70 34.50 24.89
Primary school 14.29 22.38 20.69 14.62 35.98 29.40 32.85 21.23Middle school 13.65 16.79 19.54 10.78 31.87 17.52 30.27 13.97High school 13.34 12.31 19.32 10.51 29.30 10.02 29.46 12.09
College 13.12 9.25 18.72 6.98 26.29 4.49 28.95 9.23Gender *** *** ** *** **
Male 14.25 21.56 20.75 15.34 34.54 24.62 32.00 18.08Female 14.17 20.74 19.91 12.72 33.41 22.30 31.27 17.07
Birth cohort *** *** *** *** *** *** ***1995–1999 15.25 30.08 21.79 20.52 38.44 36.34 35.56 27.282000–2004 14.66 25.80 20.82 16.21 36.82 32.47 34.68 25.102005–2009 13.79 18.40 19.60 11.80 31.30 15.58 29.28 12.15after 2010 13.47 13.59 19.41 8.95 30.12 11.72 28.14 8.48
Minority status *** *** † *** *** *** **Han 14.07 19.66 20.37 13.87 33.77 22.91 31.77 18.21
Minority 15.31 32.75 20.20 15.93 35.91 28.42 30.81 12.99Birth weight *** *** *** *** *** *** *** ***
Low birth weight 15.30 33.28 22.16 19.33 36.42 29.80 32.67 19.50Normal weight 13.90 18.23 19.97 12.78 32.67 19.99 30.99 16.11
Unknown 16.47 41.30 22.61 22.52 44.23 50.45 36.96 29.78Gestational age ** ***
<37 weeks 14.83 29.56 20.48 12.53 33.41 20.05 31.21 16.41≥37 weeks 14.19 20.85 20.35 14.17 34.03 23.66 31.67 17.65
Hukou before age 3 *** *** *** *** *** *** *** ***Rural 14.42 23.13 20.60 15.03 35.29 26.66 32.05 18.83Urban 13.31 12.69 19.22 9.92 28.34 9.63 29.90 12.22
Mother’s age atdelivery ** † †
<20 14.52 25.06 20.49 15.19 34.04 25.07 31.30 17.7920–24 14.20 21.06 20.20 13.88 33.78 22.63 31.67 17.8725–29 14.11 19.70 20.32 13.59 33.86 23.39 31.64 17.0930–34 14.32 23.56 20.61 14.60 34.74 25.34 32.16 19.3535+ 14.44 22.46 20.76 16.74 34.51 24.36 30.62 14.83N 11,361 10,324 10,061 10,751
Notes. † p < 0.10, * p < 0.05, ** p < 0.01, *** p < 0.001; Sig. denotes significance.
Int. J. Environ. Res. Public Health 2020, 17, 4937 7 of 22
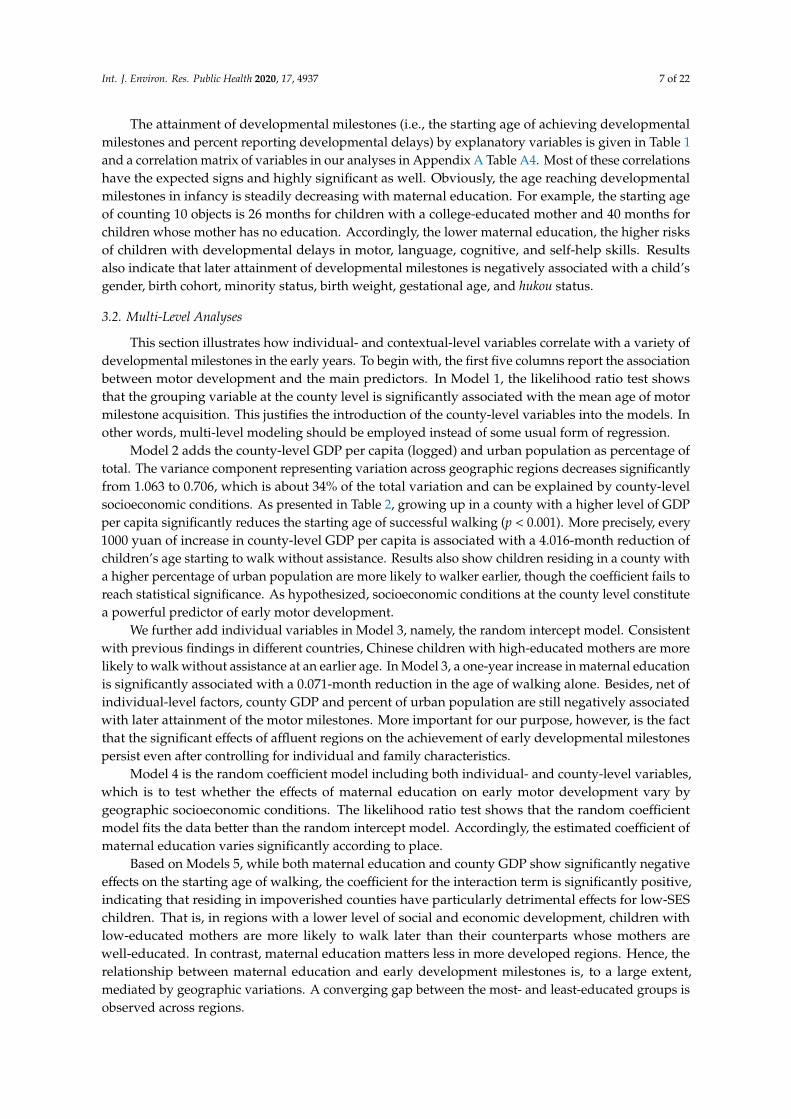
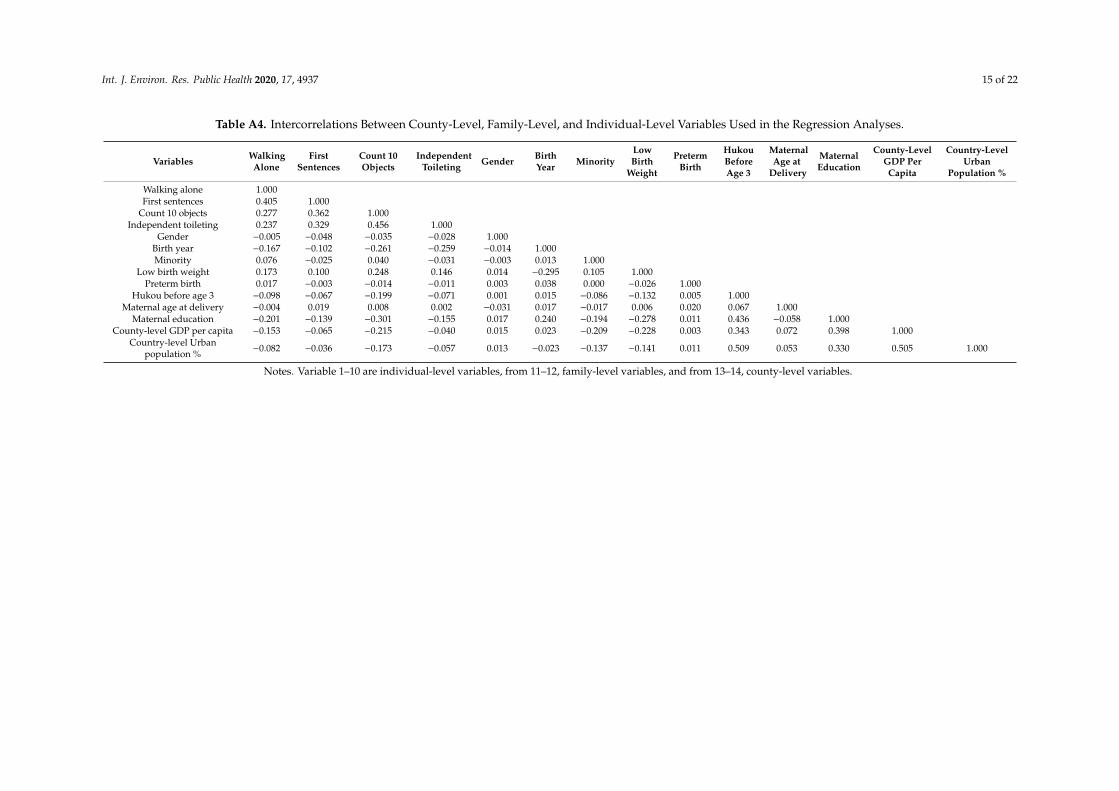
The attainment of developmental milestones (i.e., the starting age of achieving developmentalmilestones and percent reporting developmental delays) by explanatory variables is given in Table 1and a correlation matrix of variables in our analyses in Appendix A Table A4. Most of these correlationshave the expected signs and highly significant as well. Obviously, the age reaching developmentalmilestones in infancy is steadily decreasing with maternal education. For example, the starting ageof counting 10 objects is 26 months for children with a college-educated mother and 40 months forchildren whose mother has no education. Accordingly, the lower maternal education, the higher risksof children with developmental delays in motor, language, cognitive, and self-help skills. Resultsalso indicate that later attainment of developmental milestones is negatively associated with a child’sgender, birth cohort, minority status, birth weight, gestational age, and hukou status.
3.2. Multi-Level Analyses
This section illustrates how individual- and contextual-level variables correlate with a variety ofdevelopmental milestones in the early years. To begin with, the first five columns report the associationbetween motor development and the main predictors. In Model 1, the likelihood ratio test showsthat the grouping variable at the county level is significantly associated with the mean age of motormilestone acquisition. This justifies the introduction of the county-level variables into the models. Inother words, multi-level modeling should be employed instead of some usual form of regression.
Model 2 adds the county-level GDP per capita (logged) and urban population as percentage oftotal. The variance component representing variation across geographic regions decreases significantlyfrom 1.063 to 0.706, which is about 34% of the total variation and can be explained by county-levelsocioeconomic conditions. As presented in Table 2, growing up in a county with a higher level of GDPper capita significantly reduces the starting age of successful walking (p < 0.001). More precisely, every1000 yuan of increase in county-level GDP per capita is associated with a 4.016-month reduction ofchildren’s age starting to walk without assistance. Results also show children residing in a county witha higher percentage of urban population are more likely to walker earlier, though the coefficient fails toreach statistical significance. As hypothesized, socioeconomic conditions at the county level constitutea powerful predictor of early motor development.
We further add individual variables in Model 3, namely, the random intercept model. Consistentwith previous findings in different countries, Chinese children with high-educated mothers are morelikely to walk without assistance at an earlier age. In Model 3, a one-year increase in maternal educationis significantly associated with a 0.071-month reduction in the age of walking alone. Besides, net ofindividual-level factors, county GDP and percent of urban population are still negatively associatedwith later attainment of the motor milestones. More important for our purpose, however, is the factthat the significant effects of affluent regions on the achievement of early developmental milestonespersist even after controlling for individual and family characteristics.
Model 4 is the random coefficient model including both individual- and county-level variables,which is to test whether the effects of maternal education on early motor development vary bygeographic socioeconomic conditions. The likelihood ratio test shows that the random coefficientmodel fits the data better than the random intercept model. Accordingly, the estimated coefficient ofmaternal education varies significantly according to place.
Based on Models 5, while both maternal education and county GDP show significantly negativeeffects on the starting age of walking, the coefficient for the interaction term is significantly positive,indicating that residing in impoverished counties have particularly detrimental effects for low-SESchildren. That is, in regions with a lower level of social and economic development, children withlow-educated mothers are more likely to walk later than their counterparts whose mothers arewell-educated. In contrast, maternal education matters less in more developed regions. Hence, therelationship between maternal education and early development milestones is, to a large extent,mediated by geographic variations. A converging gap between the most- and least-educated groups isobserved across regions.

Int. J. Environ. Res. Public Health 2020, 17, 4937 8 of 22
Table 2. Two-level Logistic Regression Models of Early Developmental Milestones on Individual and County-level Variables.
Walk Alone (in Months) First Sentences (in Months) Count 10 Objects (in Months) Independent Toileting (in Months)
(1) (2) (3) (4) (5) (1) (2) (3) (4) (5) (1) (2) (3) (4) (5) (1) (2) (3) (4) (5)
Individual-level coefficients
Maternaleducation
−0.071 *** −0.062 *** −0.302 ** −0.153 *** −0.144 *** −0.711 ** −0.442 *** −0.404 *** −1.564 *** −0.222 *** −0.206 *** −1.245 ***(0.012) (0.013) (0.115) (0.021) (0.025) (0.228) (0.037) (0.045) (0.415) (0.032) (0.039) (0.362)
Female−0.100 −0.103 −0.105 −0.866 *** −0.871 *** −0.878 *** −1.076 *** −1.087 *** −1.101 *** −0.800 *** −0.790 *** −0.796 ***(0.078) (0.078) (0.078) (0.142) (0.142) (0.142) (0.249) (0.248) (0.248) (0.214) (0.213) (0.213)
Birth Cohort (Ref: 1995–1999)
2000–2004−0.391 *** −0.394 *** −0.400 *** −0.644 ** −0.622 ** −0.634 ** −0.437 −0.426 −0.448 −0.297 −0.282 −0.299
(0.119) (0.119) (0.119) (0.210) (0.210) (0.210) (0.365) (0.364) (0.364) (0.318) (0.318) (0.318)
2005–2009−1.036 *** −1.024 *** −1.029 *** −1.491 *** −1.480 *** −1.490 *** −4.575 *** −4.597 *** −4.617 *** −5.261 *** −5.274 *** −5.292 ***
(0.118) (0.118) (0.118) (0.210) (0.210) (0.210) (0.370) (0.370) (0.370) (0.319) (0.318) (0.318)
After 2010−1.193 *** −1.191 *** −1.196 *** −1.485 *** −1.482 *** −1.491 *** −5.131 *** −5.116 *** −5.139 *** −5.969 *** −5.979 *** −5.994 ***
(0.118) (0.118) (0.118) (0.216) (0.215) (0.215) (0.377) (0.377) (0.377) (0.324) (0.324) (0.324)
Minority 0.473 ** 0.361* 0.359* −0.121 −0.160 −0.167 −0.697 −0.575 −0.608 −0.062 0.052 0.042(0.168) (0.167) (0.167) (0.316) (0.315) (0.315) (0.559) (0.560) (0.559) (0.479) (0.472) (0.471)
Birth Weight (Ref: Normal Weight)Low birth
weight0.769 *** 0.769 *** 0.767 *** 1.640 *** 1.652 *** 1.648 *** 2.103 *** 2.081 *** 2.068 *** 1.540 ** 1.617 ** 1.611 **(0.186) (0.185) (0.185) (0.333) (0.333) (0.333) (0.592) (0.591) (0.591) (0.503) (0.502) (0.502)
Unknown1.309 *** 1.323 *** 1.297 *** 1.255 *** 1.275 *** 1.227 *** 5.683 *** 5.659 *** 5.561 *** 2.499 *** 2.545 *** 2.462 ***(0.149) (0.150) (0.150) (0.263) (0.265) (0.266) (0.465) (0.468) (0.469) (0.405) (0.407) (0.408)
Gestational Age (Ref: ≥37 Weeks)
<37 weeks0.691 ** 0.717 *** 0.713 *** −0.048 0.008 0.006 −0.370 −0.372 −0.374 −0.221 −0.224 −0.231(0.211) (0.210) (0.210) (0.383) (0.382) (0.382) (0.683) (0.682) (0.682) (0.586) (0.585) (0.584)
Urban hukoubefore age 3
−0.296 * −0.296 * −0.315 * −0.334 −0.341 −0.389 −2.484 *** −2.558 *** −2.654 *** −0.565 −0.556 −0.629 †(0.127) (0.127) (0.127) (0.237) (0.236) (0.237) (0.413) (0.413) (0.414) (0.353) (0.352) (0.352)
Maternal Age at Delivery (Ref: <20)
20–240.047 0.055 0.052 −0.263 −0.270 −0.275 0.661 0.592 0.583 0.007 −0.014 −0.020
(0.221) (0.221) (0.221) (0.399) (0.398) (0.398) (0.703) (0.702) (0.702) (0.604) (0.603) (0.603)
25–290.130 0.139 0.129 −0.069 −0.066 −0.085 1.159 1.113 1.081 0.250 0.235 0.205
(0.223) (0.222) (0.222) (0.402) (0.401) (0.401) (0.708) (0.707) (0.707) (0.609) (0.607) (0.607)
30–340.224 0.251 0.245 0.041 0.059 0.050 1.526 * 1.523 * 1.506 * 0.470 0.466 0.451
(0.235) (0.234) (0.234) (0.424) (0.423) (0.423) (0.748) (0.747) (0.746) (0.641) (0.640) (0.639)
35+0.327 0.357 0.358 0.127 0.175 0.183 1.472 † 1.558 † 1.569 † −0.663 −0.608 −0.604
(0.263) (0.262) (0.262) (0.477) (0.476) (0.476) (0.843) (0.843) (0.842) (0.717) (0.716) (0.716)
County-Level Coefficients
Ln (GDP percapita)
−0.581 *** −0.453 *** −0.411 *** −0.469 *** −0.549 ** −0.437 * −0.298 † −0.436 * −2.072 *** −1.594 *** −1.444 *** −1.668 *** −0.402 −0.130 0.109 −0.196(0.088) (0.084) (0.079) (0.084) (0.178) (0.175) (0.165) (0.174) (0.333) (0.310) (0.298) (0.309) (0.281) (0.269) (0.244) (0.266)
Urbanpopulation %
−0.003 −0.001 −0.000 −0.000 −0.005 −0.001 −0.003 −0.002 −0.068 *** −0.047 *** −0.042 *** −0.040 ** −0.028 * −0.026 * −0.025 * −0.023 *(0.004) (0.004) (0.003) (0.003) (0.007) (0.007) (0.007) (0.007) (0.013) (0.013) (0.012) (0.012) (0.011) (0.011) (0.010) (0.010)
Cross-Level Interaction Coefficients
Maternaleducation × Ln(GDP per capita)
0.024 * 0.058 * 0.118 **0.105 **
(0.012) (0.023) (0.042) (0.036)
Constant13.940
*** 19.917 *** 19.054 *** 18.618 *** 19.217 *** 20.120*** 25.796 *** 25.950 *** 24.574 *** 25.982 *** 32.441
*** 55.737 *** 52.607 *** 50.961 *** 53.270 *** 31.364***
36.291*** 36.709 *** 34.247 *** 37.344 ***
(0.088) (0.842) (0.836) (0.781) (0.832) (0.161) (1.703) (1.716) (1.621) (1.713) (0.367) (3.181) (3.043) (2.931) (3.042) (0.253) (2.684) (2.644) (2.406) (2.632)
N 11,361 11,361 11,361 11,361 11,361 10,324 10,324 10,324 10,324 10,324 10,061 10,061 10,061 10,061 10,061 10,751 10,751 10,751 10,751 10,751
Notes. Standard errors in parentheses; † p < 0.10, * p < 0.05, ** p < 0.01, *** p < 0.001.
Int. J. Environ. Res. Public Health 2020, 17, 4937 9 of 22
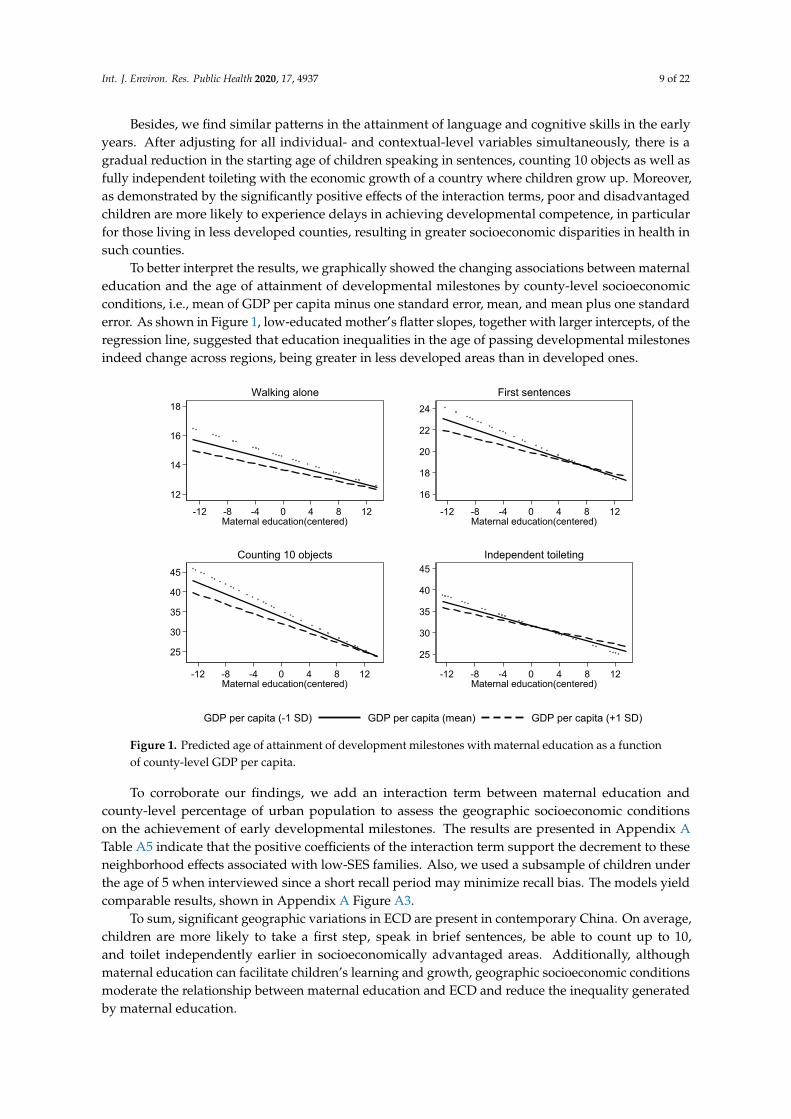
Besides, we find similar patterns in the attainment of language and cognitive skills in the earlyyears. After adjusting for all individual- and contextual-level variables simultaneously, there is agradual reduction in the starting age of children speaking in sentences, counting 10 objects as well asfully independent toileting with the economic growth of a country where children grow up. Moreover,as demonstrated by the significantly positive effects of the interaction terms, poor and disadvantagedchildren are more likely to experience delays in achieving developmental competence, in particularfor those living in less developed counties, resulting in greater socioeconomic disparities in health insuch counties.
To better interpret the results, we graphically showed the changing associations between maternaleducation and the age of attainment of developmental milestones by county-level socioeconomicconditions, i.e., mean of GDP per capita minus one standard error, mean, and mean plus one standarderror. As shown in Figure 1, low-educated mother′s flatter slopes, together with larger intercepts, of theregression line, suggested that education inequalities in the age of passing developmental milestonesindeed change across regions, being greater in less developed areas than in developed ones.
Int. J. Environ. Res. Public Health 2020, 17, 4937 11 of 24
Besides, we find similar patterns in the attainment of language and cognitive skills in the early years. After adjusting for all individual- and contextual-level variables simultaneously, there is a gradual reduction in the starting age of children speaking in sentences, counting 10 objects as well as fully independent toileting with the economic growth of a country where children grow up. Moreover, as demonstrated by the significantly positive effects of the interaction terms, poor and disadvantaged children are more likely to experience delays in achieving developmental competence, in particular for those living in less developed counties, resulting in greater socioeconomic disparities in health in such counties.
To better interpret the results, we graphically showed the changing associations between maternal education and the age of attainment of developmental milestones by county-level socioeconomic conditions, i.e., mean of GDP per capita minus one standard error, mean, and mean plus one standard error. As shown in Figure 1, low-educated mother′s flatter slopes, together with larger intercepts, of the regression line, suggested that education inequalities in the age of passing developmental milestones indeed change across regions, being greater in less developed areas than in developed ones.
Figure 1. Predicted age of attainment of development milestones with maternal education as a function of county-level GDP per capita.
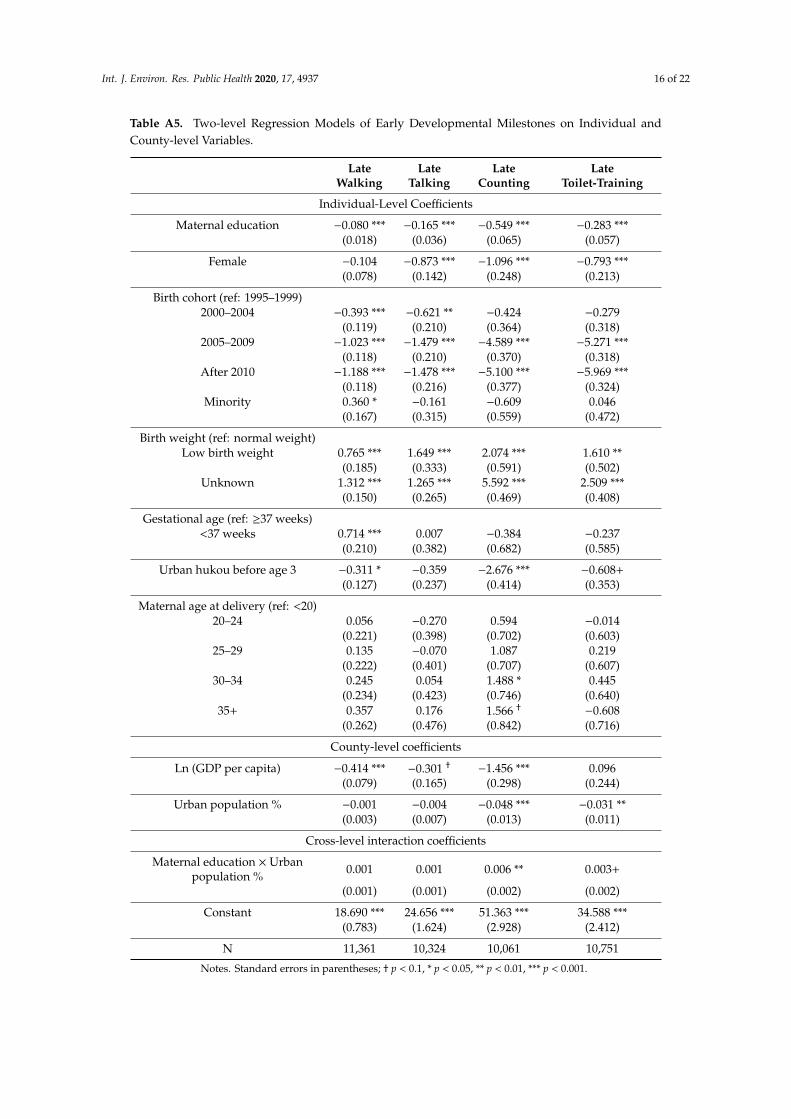
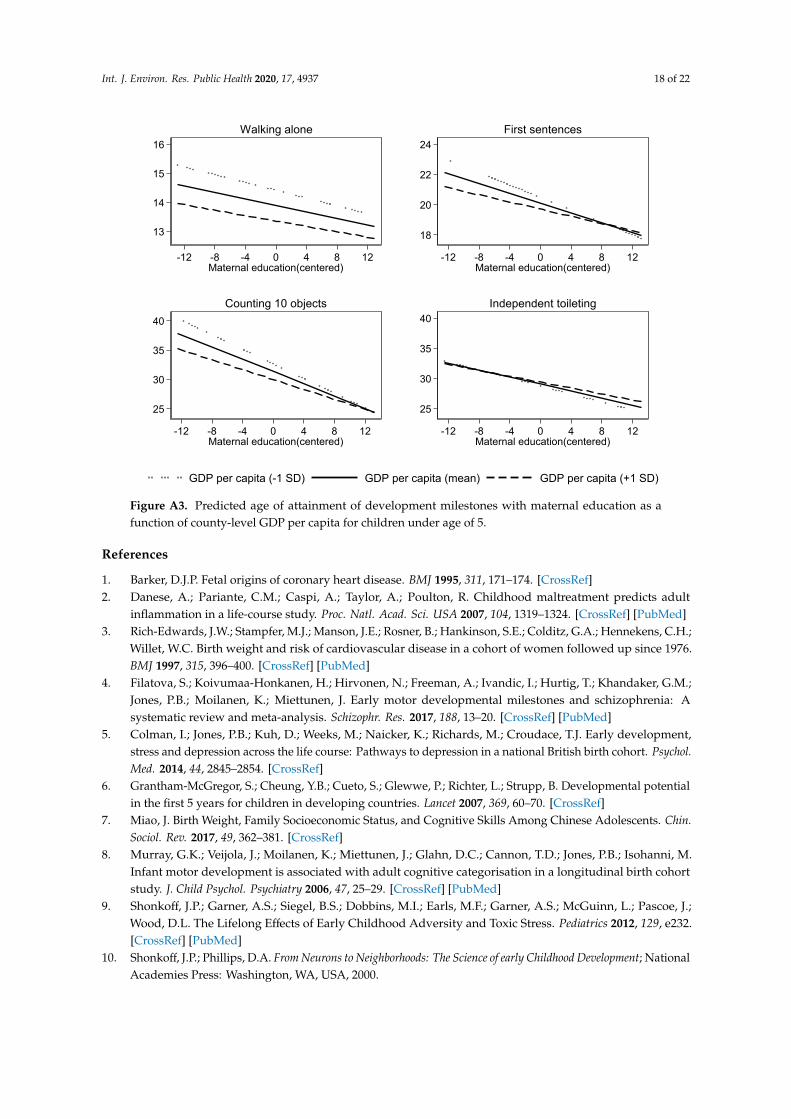
To corroborate our findings, we add an interaction term between maternal education and county-level percentage of urban population to assess the geographic socioeconomic conditions on the achievement of early developmental milestones. The results are presented in Appendix Table A5 indicate that the positive coefficients of the interaction term support the decrement to these neighborhood effects associated with low-SES families. Also, we used a subsample of children under the age of 5 when interviewed since a short recall period may minimize recall bias. The models yield comparable results, shown in Appendix Figure A3.
To sum, significant geographic variations in ECD are present in contemporary China. On average, children are more likely to take a first step, speak in brief sentences, be able to count up to
12
14
16
18
-12 -8 -4 0 4 8 12Maternal education(centered)
Walking alone
16
18
20
22
24
-12 -8 -4 0 4 8 12Maternal education(centered)
First sentences
25
30
35
40
45
-12 -8 -4 0 4 8 12Maternal education(centered)
Counting 10 objects
25
30
35
40
45
-12 -8 -4 0 4 8 12Maternal education(centered)
Independent toileting
GDP per capita (-1 SD) GDP per capita (mean) GDP per capita (+1 SD)
Figure 1. Predicted age of attainment of development milestones with maternal education as a functionof county-level GDP per capita.
To corroborate our findings, we add an interaction term between maternal education andcounty-level percentage of urban population to assess the geographic socioeconomic conditionson the achievement of early developmental milestones. The results are presented in Appendix ATable A5 indicate that the positive coefficients of the interaction term support the decrement to theseneighborhood effects associated with low-SES families. Also, we used a subsample of children underthe age of 5 when interviewed since a short recall period may minimize recall bias. The models yieldcomparable results, shown in Appendix A Figure A3.
To sum, significant geographic variations in ECD are present in contemporary China. On average,children are more likely to take a first step, speak in brief sentences, be able to count up to 10,and toilet independently earlier in socioeconomically advantaged areas. Additionally, althoughmaternal education can facilitate children’s learning and growth, geographic socioeconomic conditionsmoderate the relationship between maternal education and ECD and reduce the inequality generatedby maternal education.
Int. J. Environ. Res. Public Health 2020, 17, 4937 10 of 22
3.3. Sensitivity Analyses
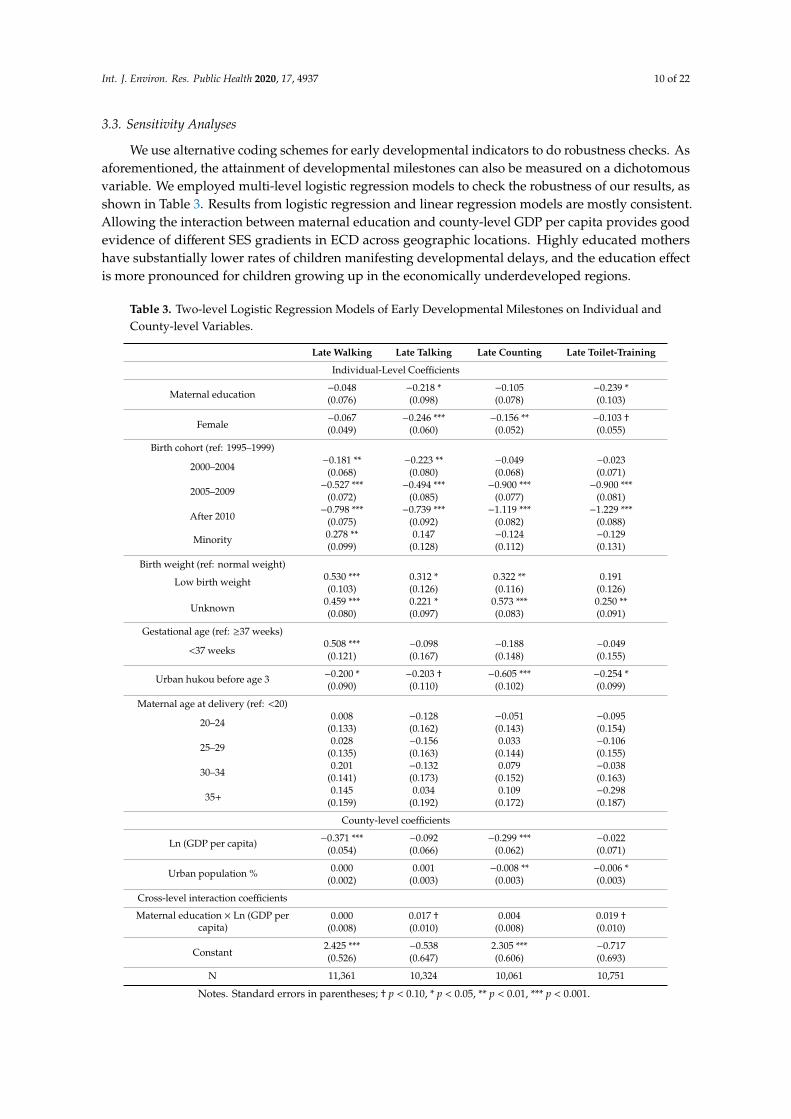
We use alternative coding schemes for early developmental indicators to do robustness checks. Asaforementioned, the attainment of developmental milestones can also be measured on a dichotomousvariable. We employed multi-level logistic regression models to check the robustness of our results, asshown in Table 3. Results from logistic regression and linear regression models are mostly consistent.Allowing the interaction between maternal education and county-level GDP per capita provides goodevidence of different SES gradients in ECD across geographic locations. Highly educated mothershave substantially lower rates of children manifesting developmental delays, and the education effectis more pronounced for children growing up in the economically underdeveloped regions.
Table 3. Two-level Logistic Regression Models of Early Developmental Milestones on Individual andCounty-level Variables.
Late Walking Late Talking Late Counting Late Toilet-Training
Individual-Level Coefficients
Maternal education−0.048 −0.218 * −0.105 −0.239 *(0.076) (0.098) (0.078) (0.103)
Female−0.067 −0.246 *** −0.156 ** −0.103 †(0.049) (0.060) (0.052) (0.055)
Birth cohort (ref: 1995–1999)
2000–2004−0.181 ** −0.223 ** −0.049 −0.023
(0.068) (0.080) (0.068) (0.071)
2005–2009−0.527 *** −0.494 *** −0.900 *** −0.900 ***
(0.072) (0.085) (0.077) (0.081)
After 2010−0.798 *** −0.739 *** −1.119 *** −1.229 ***
(0.075) (0.092) (0.082) (0.088)
Minority 0.278 ** 0.147 −0.124 −0.129(0.099) (0.128) (0.112) (0.131)
Birth weight (ref: normal weight)
Low birth weight 0.530 *** 0.312 * 0.322 ** 0.191(0.103) (0.126) (0.116) (0.126)
Unknown0.459 *** 0.221 * 0.573 *** 0.250 **(0.080) (0.097) (0.083) (0.091)
Gestational age (ref: ≥37 weeks)
<37 weeks0.508 *** −0.098 −0.188 −0.049(0.121) (0.167) (0.148) (0.155)
Urban hukou before age 3 −0.200 * −0.203 † −0.605 *** −0.254 *(0.090) (0.110) (0.102) (0.099)
Maternal age at delivery (ref: <20)
20–240.008 −0.128 −0.051 −0.095
(0.133) (0.162) (0.143) (0.154)
25–290.028 −0.156 0.033 −0.106
(0.135) (0.163) (0.144) (0.155)
30–340.201 −0.132 0.079 −0.038
(0.141) (0.173) (0.152) (0.163)
35+0.145 0.034 0.109 −0.298
(0.159) (0.192) (0.172) (0.187)
County-level coefficients
Ln (GDP per capita) −0.371 *** −0.092 −0.299 *** −0.022(0.054) (0.066) (0.062) (0.071)
Urban population % 0.000 0.001 −0.008 ** −0.006 *(0.002) (0.003) (0.003) (0.003)
Cross-level interaction coefficients
Maternal education × Ln (GDP percapita)
0.000 0.017 † 0.004 0.019 †(0.008) (0.010) (0.008) (0.010)
Constant2.425 *** −0.538 2.305 *** −0.717(0.526) (0.647) (0.606) (0.693)
N 11,361 10,324 10,061 10,751
Notes. Standard errors in parentheses; † p < 0.10, * p < 0.05, ** p < 0.01, *** p < 0.001.
Int. J. Environ. Res. Public Health 2020, 17, 4937 11 of 22
4. Discussion
Recent studies have focused on disparities from early on through macro-micro lens, particularlythe correlation between where people live and their opportunity to quality-and length-of life. Forexample, Chetty and his colleagues [71,72] have found that early experiences and disparities in one’slife, from the quality of health service and preschool teacher to the neighborhood one grew up in, canhave lasting effects. Their studies reveal that neighborhoods affect intergenerational mobility primarilythrough childhood exposure. However, what this issue looks like is still under research in contemporaryChina, especially tackling early childhood. Additionally, there has been little population-based researchinto the timing and attainment of developmental milestones in China. In this study, we used theage of reaching early developmental milestones, i.e., motor development, language and cognitivedevelopment, and self-help skills, as indicators of ECD. Capitalizing on recent data from the CFPS,we employed multi-level models to account for the contextual effects of geographic socioeconomicconditions on the attainment of developmental milestones in the early years.
Our analyses have shown that, in the context of contemporary China, there is a significantassociation with ECD and local socioeconomic conditions. Generally speaking, children in countieswith lower per capita GDP and percentage of urban population in total population experience higherrisks of delays in reaching developmental milestones than those from counties with higher per capitaGDP and percentage of urban population, even after controlling for individual- and family-levelvariables. The finding is consistent with previous studies in other parts of the world [15,73,74].As summarized by the two most comprehensive reviews, living in areas of social disadvantage isassociated with a lack of access to institutional resources, low parenting quality, and poor environmentalconditions, which in turn bear on child development [12,13]. In contemporary China, significantinequality in the geographic distribution of health resources is still evident, despite a more equitableper capita distribution of resources since the new health-care reform in 2009 [75]. Recent statisticsalso reveal increasing health inequality across geographic regions with rapid economic growth [76].For example, in 2018, the health expenditure per capita was ¥ 2275 in Beijing with the highest GDP,roughly two times that in Gansu Province, where the GDP is the lowest [77]. It is suggested that, onaverage, children living in less socioeconomically developed regions are more likely to be exposedto developmental risks such as poverty with limited access to interventions than their counterpartsfrom highly socioeconomically developed ones. Such regional differences place children from moredeveloped regions at a great advantage from early on.
In addition, we find that geographic socioeconomic conditions contribute to attenuate SESgradients in ECD. It is evident that children with more educated mothers in developed counties gainmore development benefits than any other group, and the education effect becomes more pronouncedin counties with the least GDP compared with those highest GDP ones. Thus, our findings support thedouble jeopardy hypothesis that low-SES children suffer a double disadvantage to ECD outcomes dueto the interactive effects of community socioeconomic characteristics and individual socioeconomicposition. An alternative explanation is that people who live in poor areas are limited to access toaffordable health care, particularly those disadvantaged children and their families who need it most.By contrast, in wealthy regions, it provides an opportunity to improve the material circumstances of thefamily and to ensure access to institutional resources and public services, and this benefits children’searly health and growth outcomes and consequently narrow the gaps across socioeconomic levels [78].Hence, differences in socioeconomic resources across geographic regions result in inequalities in earlyhealth development.
As aforementioned, a large volume of studies from western societies has emphasized the roleof contextual effects in early child development. However, limited is known in East Asian countries,especially the mediating role of the macro environment in shaping the relationships between familySES and ECD. In this study, we have demonstrated that double jeopardy and concentrated advantagecoexist in contemporary China, playing at a county-level to promote or mitigate developmentalinequalities from early on. The significant association with geographic socioeconomic contexts and
Int. J. Environ. Res. Public Health 2020, 17, 4937 12 of 22
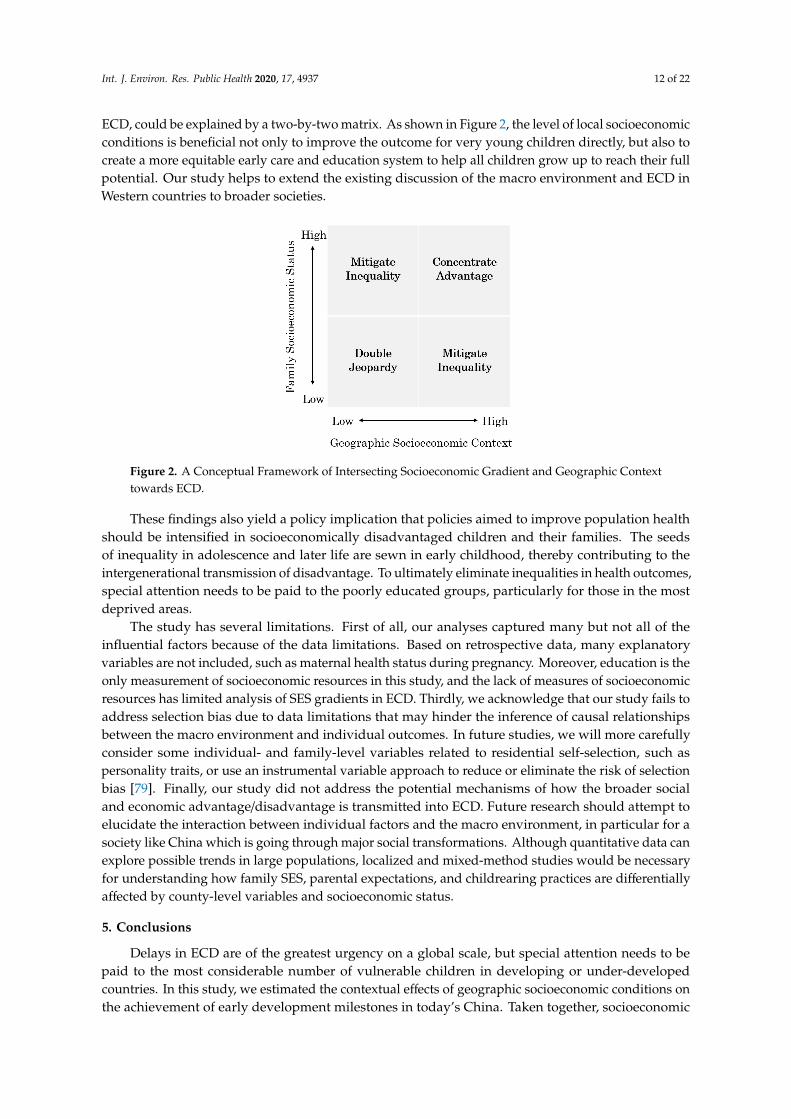
ECD, could be explained by a two-by-two matrix. As shown in Figure 2, the level of local socioeconomicconditions is beneficial not only to improve the outcome for very young children directly, but also tocreate a more equitable early care and education system to help all children grow up to reach their fullpotential. Our study helps to extend the existing discussion of the macro environment and ECD inWestern countries to broader societies.
Int. J. Environ. Res. Public Health 2020, 17, 4937 14 of 24
findings support the double jeopardy hypothesis that low-SES children suffer a double disadvantage to ECD outcomes due to the interactive effects of community socioeconomic characteristics and individual socioeconomic position. An alternative explanation is that people who live in poor areas are limited to access to affordable health care, particularly those disadvantaged children and their families who need it most. By contrast, in wealthy regions, it provides an opportunity to improve the material circumstances of the family and to ensure access to institutional resources and public services, and this benefits children’s early health and growth outcomes and consequently narrow the gaps across socioeconomic levels [78]. Hence, differences in socioeconomic resources across geographic regions result in inequalities in early health development.
As aforementioned, a large volume of studies from western societies has emphasized the role of contextual effects in early child development. However, limited is known in East Asian countries, especially the mediating role of the macro environment in shaping the relationships between family SES and ECD. In this study, we have demonstrated that double jeopardy and concentrated advantage coexist in contemporary China, playing at a county-level to promote or mitigate developmental inequalities from early on. The significant association with geographic socioeconomic contexts and ECD, could be explained by a two-by-two matrix. As shown in Figure 2, the level of local socioeconomic conditions is beneficial not only to improve the outcome for very young children directly, but also to create a more equitable early care and education system to help all children grow up to reach their full potential. Our study helps to extend the existing discussion of the macro environment and ECD in Western countries to broader societies.
Figure 2. A Conceptual Framework of Intersecting Socioeconomic Gradient and Geographic Context towards ECD.
These findings also yield a policy implication that policies aimed to improve population health should be intensified in socioeconomically disadvantaged children and their families. The seeds of inequality in adolescence and later life are sewn in early childhood, thereby contributing to the intergenerational transmission of disadvantage. To ultimately eliminate inequalities in health outcomes, special attention needs to be paid to the poorly educated groups, particularly for those in the most deprived areas.
The study has several limitations. First of all, our analyses captured many but not all of the influential factors because of the data limitations. Based on retrospective data, many explanatory variables are not included, such as maternal health status during pregnancy. Moreover, education is
Figure 2. A Conceptual Framework of Intersecting Socioeconomic Gradient and Geographic Contexttowards ECD.
These findings also yield a policy implication that policies aimed to improve population healthshould be intensified in socioeconomically disadvantaged children and their families. The seedsof inequality in adolescence and later life are sewn in early childhood, thereby contributing to theintergenerational transmission of disadvantage. To ultimately eliminate inequalities in health outcomes,special attention needs to be paid to the poorly educated groups, particularly for those in the mostdeprived areas.
The study has several limitations. First of all, our analyses captured many but not all of theinfluential factors because of the data limitations. Based on retrospective data, many explanatoryvariables are not included, such as maternal health status during pregnancy. Moreover, education is theonly measurement of socioeconomic resources in this study, and the lack of measures of socioeconomicresources has limited analysis of SES gradients in ECD. Thirdly, we acknowledge that our study fails toaddress selection bias due to data limitations that may hinder the inference of causal relationshipsbetween the macro environment and individual outcomes. In future studies, we will more carefullyconsider some individual- and family-level variables related to residential self-selection, such aspersonality traits, or use an instrumental variable approach to reduce or eliminate the risk of selectionbias [79]. Finally, our study did not address the potential mechanisms of how the broader socialand economic advantage/disadvantage is transmitted into ECD. Future research should attempt toelucidate the interaction between individual factors and the macro environment, in particular for asociety like China which is going through major social transformations. Although quantitative data canexplore possible trends in large populations, localized and mixed-method studies would be necessaryfor understanding how family SES, parental expectations, and childrearing practices are differentiallyaffected by county-level variables and socioeconomic status.
5. Conclusions
Delays in ECD are of the greatest urgency on a global scale, but special attention needs to bepaid to the most considerable number of vulnerable children in developing or under-developedcountries. In this study, we estimated the contextual effects of geographic socioeconomic conditions onthe achievement of early development milestones in today’s China. Taken together, socioeconomic

Int. J. Environ. Res. Public Health 2020, 17, 4937 13 of 22
conditions at the macro-level can shape the ECD in a direct or indirect way as local socioeconomicgrowth not only promotes children’s developmental health, but also moderates the relationship betweenindividual socioeconomic position and children’s outcomes. Considering multiple dimensions ofchild development, this study also extends the current research on ECD by revealing the progresstoward healthy child development in a range of domains, such as motor, language, cognition, andself-help. Our findings highlight that consistent efforts need to be made to allocate resources andservices to the worse-off groups. This also suggests that public health efforts to reduce the intersectinginequalities in ECD should be targeted at regions where the need is greatest. Since China’s birthrate hita historic low in 2019, it has worsened a looming demographic crisis and an every child matters policyis therefore highly recommended to start from early on and to strengthen preventative services for themost disadvantaged groups in the deprived counties or neighborhoods.
Author Contributions: Conceptualization, W.L., M.L., and Y.J.; Data curation, W.L., S.W., and Y.Z.; Formalanalysis, W.L., S.W., and Y.Z.; Project administration, W.L.; Software, W.L., S.W., and Y.Z.; Supervision, M.L., andY.J.; Writing—Original draft, W.L.; Writing—Review and editing, W.L., M.L., Y.J., S.W., and Y.Z. All authors haveread and agreed to the published version of the manuscript.
Funding: The research was partially funded by 2019 Comprehensive Discipline Construction Fund of Faculty ofEducation, Beijing Normal University.
Conflicts of Interest: The authors declare no conflict of interest.
Appendix A
Table A1. Summary Statistics for All Predictors.
Variables Frequency Percent
Maternal educationNo schooling 2.25 22.07
Primary school 2870 24.13Middle school 3968 33.36High school 1349 11.34
College 1083 9.10
GenderMale 6322 53.15
Female 5573 46.85
Birth cohort1995–1999 2689 22.612000–2004 2509 21.092005–2009 3033 25.502010–2016 3664 30.80
Minority statusHan 10,490 88.19
Minority 1405 11.81
Birth weightNormal weight 10,154 85.36
Low birth weight 628 5.28Unknown 1113 9.36
Gestational age<37 weeks 11,433 96.12≥37 weeks 462 3.88
Hukou before age 3Rural 9654 81.16Urban 2241 18.84

Int. J. Environ. Res. Public Health 2020, 17, 4937 14 of 22
Table A1. Cont.
Variables Frequency Percent
Maternal age at birth<20 409 3.44
20–24 4400 36.9924–29 4441 37.3430–34 1873 15.7535+ 772 6.49
Survey Year2010 8165 68.642012 1426 11.992014 1262 10.612016 1042 8.76
N 11,895
Notes. The descriptive results are un-weighted.
Table A2. Early Developmental Milestones.
Early Development Milestones Definition
Walking alone
Has the child started to walk by herself/himself?How old (in months) was the child when she/he started walking?
Notes. Walking refers to walking on one’s won without assistance of any otherobjects of external forces. Walking 3–5 steps even counts.
Soft check. Interviewer’s notes. Double check in case the child was able to walkafter 24 months old.
First sentences
Has the child started to speak complete sentences, such as “I want to eat”?How old (in month) was the child when she/he started speaking complete
sentences, such as “I want to eat”?Soft check. Interviewer’s notes. Double check in case the child was able to walk
before 12 months old and after 24 months old.
Counting 10 objects
Can the child count from 1 to 10?How old (in months) was the child when she/he became able to count from 1 to 10?Soft check. Interviewer’s notes. Double check in case the child was able to walk
before 12 months old and after 24 months old.
Independent toileting
When the child urinates, is she/he able to take off the trousers on her/his own?How old (in months) was the child when she/he became able to urinate by
herself/himself?Notes. “Urinate by himself/herself” refers to the child can take off his/her trousers
on his/her own when urinates.Soft check. Interviewer’s notes. Double check in case the child was able to walk
before 12 months old and after 36 months old.
Notes. The Computer-assisted personal interviewing (CAPI) system adopted by the CFPS is capable of performingsoft range checks, making it possible for interviewers to query implausible responses instantly.
Table A3. Distribution of the Starting Age of Achieving Early Developmental Milestones (in months).
Early DevelopmentalMilestones 1% 5% 10% 25% 50% 75% 90% 95% 99% N
Walking alone 9 10 11 12 13 15 18 24 36 11,361First sentences 10 12 12 15 18 24 30 36 48 10,324
Counting 10 objects 12 16 18 24 35 40 49 60 72 10,061Independent toileting 12 15 18 24 30 36 48 50 72 10,751
Int. J. Environ. Res. Public Health 2020, 17, 4937 15 of 22
Table A4. Intercorrelations Between County-Level, Family-Level, and Individual-Level Variables Used in the Regression Analyses.
Variables WalkingAlone
FirstSentences
Count 10Objects
IndependentToileting Gender Birth
Year MinorityLowBirth
Weight
PretermBirth
HukouBeforeAge 3
MaternalAge at
Delivery
MaternalEducation
County-LevelGDP Per
Capita
Country-LevelUrban
Population %
Walking alone 1.000First sentences 0.405 1.000
Count 10 objects 0.277 0.362 1.000Independent toileting 0.237 0.329 0.456 1.000
Gender −0.005 −0.048 −0.035 −0.028 1.000Birth year −0.167 −0.102 −0.261 −0.259 −0.014 1.000Minority 0.076 −0.025 0.040 −0.031 −0.003 0.013 1.000
Low birth weight 0.173 0.100 0.248 0.146 0.014 −0.295 0.105 1.000Preterm birth 0.017 −0.003 −0.014 −0.011 0.003 0.038 0.000 −0.026 1.000
Hukou before age 3 −0.098 −0.067 −0.199 −0.071 0.001 0.015 −0.086 −0.132 0.005 1.000Maternal age at delivery −0.004 0.019 0.008 0.002 −0.031 0.017 −0.017 0.006 0.020 0.067 1.000
Maternal education −0.201 −0.139 −0.301 −0.155 0.017 0.240 −0.194 −0.278 0.011 0.436 −0.058 1.000County-level GDP per capita −0.153 −0.065 −0.215 −0.040 0.015 0.023 −0.209 −0.228 0.003 0.343 0.072 0.398 1.000
Country-level Urbanpopulation % −0.082 −0.036 −0.173 −0.057 0.013 −0.023 −0.137 −0.141 0.011 0.509 0.053 0.330 0.505 1.000
Notes. Variable 1–10 are individual-level variables, from 11–12, family-level variables, and from 13–14, county-level variables.
Int. J. Environ. Res. Public Health 2020, 17, 4937 16 of 22
Table A5. Two-level Regression Models of Early Developmental Milestones on Individual andCounty-level Variables.
LateWalking
LateTalking
LateCounting
LateToilet-Training
Individual-Level Coefficients
Maternal education −0.080 *** −0.165 *** −0.549 *** −0.283 ***(0.018) (0.036) (0.065) (0.057)
Female −0.104 −0.873 *** −1.096 *** −0.793 ***(0.078) (0.142) (0.248) (0.213)
Birth cohort (ref: 1995–1999)2000–2004 −0.393 *** −0.621 ** −0.424 −0.279
(0.119) (0.210) (0.364) (0.318)2005–2009 −1.023 *** −1.479 *** −4.589 *** −5.271 ***
(0.118) (0.210) (0.370) (0.318)After 2010 −1.188 *** −1.478 *** −5.100 *** −5.969 ***
(0.118) (0.216) (0.377) (0.324)Minority 0.360 * −0.161 −0.609 0.046
(0.167) (0.315) (0.559) (0.472)
Birth weight (ref: normal weight)Low birth weight 0.765 *** 1.649 *** 2.074 *** 1.610 **
(0.185) (0.333) (0.591) (0.502)Unknown 1.312 *** 1.265 *** 5.592 *** 2.509 ***
(0.150) (0.265) (0.469) (0.408)
Gestational age (ref: ≥37 weeks)<37 weeks 0.714 *** 0.007 −0.384 −0.237
(0.210) (0.382) (0.682) (0.585)
Urban hukou before age 3 −0.311 * −0.359 −2.676 *** −0.608+(0.127) (0.237) (0.414) (0.353)
Maternal age at delivery (ref: <20)20–24 0.056 −0.270 0.594 −0.014
(0.221) (0.398) (0.702) (0.603)25–29 0.135 −0.070 1.087 0.219
(0.222) (0.401) (0.707) (0.607)30–34 0.245 0.054 1.488 * 0.445
(0.234) (0.423) (0.746) (0.640)35+ 0.357 0.176 1.566 † −0.608
(0.262) (0.476) (0.842) (0.716)
County-level coefficients
Ln (GDP per capita) −0.414 *** −0.301 † −1.456 *** 0.096(0.079) (0.165) (0.298) (0.244)
Urban population % −0.001 −0.004 −0.048 *** −0.031 **(0.003) (0.007) (0.013) (0.011)
Cross-level interaction coefficients
Maternal education × Urbanpopulation % 0.001 0.001 0.006 ** 0.003+
(0.001) (0.001) (0.002) (0.002)
Constant 18.690 *** 24.656 *** 51.363 *** 34.588 ***(0.783) (1.624) (2.928) (2.412)
N 11,361 10,324 10,061 10,751
Notes. Standard errors in parentheses; † p < 0.1, * p < 0.05, ** p < 0.01, *** p < 0.001.

Int. J. Environ. Res. Public Health 2020, 17, 4937 17 of 22Int. J. Environ. Res. Public Health 2020, 17, 4937 20 of 24
Figure A1. Family Income per capital by Maternal Education.
Figure A2. Predicted age of attainment of development milestones with family income as a function of county-level GDP per capita.
050
0010
000
1500
020
000
Fam
ily In
com
e Pe
r Cap
ita (Y
uan)
No schooling Primary school Middle school High school College
12
14
16
18
-8 -4 0 4Ln(Family income per capita)(centered)
Walking alone
18
20
22
24
26
-8 -4 0 4Ln(Family income per capita)(centered)
First sentences
30
35
40
45
-8 -4 0 4Ln(Family income per capita)(centered)
Counting 10 objects
30
35
40
45
-8 -4 0 4Ln(Family income per capita)(centered)
Independent toileting
GDP per capita (-1 SD) GDP per capita (mean) GDP per capita (+1 SD)
Figure A1. Family Income per capital by Maternal Education.
Int. J. Environ. Res. Public Health 2020, 17, 4937 20 of 24
Figure A1. Family Income per capital by Maternal Education.
Figure A2. Predicted age of attainment of development milestones with family income as a function of county-level GDP per capita.
050
0010
000
1500
020
000
Fam
ily In
com
e Pe
r Cap
ita (Y
uan)
No schooling Primary school Middle school High school College
12
14
16
18
-8 -4 0 4Ln(Family income per capita)(centered)
Walking alone
18
20
22
24
26
-8 -4 0 4Ln(Family income per capita)(centered)
First sentences
30
35
40
45
-8 -4 0 4Ln(Family income per capita)(centered)
Counting 10 objects
30
35
40
45
-8 -4 0 4Ln(Family income per capita)(centered)
Independent toileting
GDP per capita (-1 SD) GDP per capita (mean) GDP per capita (+1 SD)
Figure A2. Predicted age of attainment of development milestones with family income as a function ofcounty-level GDP per capita.
Int. J. Environ. Res. Public Health 2020, 17, 4937 18 of 22Int. J. Environ. Res. Public Health 2020, 17, 4937 21 of 24
Figure A3. Predicted age of attainment of development milestones with maternal education as a function of county-level GDP per capita for children under age of 5.
References
1. Barker, D.J.P. Fetal origins of coronary heart disease. BMJ 1995, 311, 171–174. 2. Danese, A.; Pariante, C.M.; Caspi, A.; Taylor, A.; Poulton, R. Childhood maltreatment predicts adult
inflammation in a life-course study. Proc. Natl. Acad. Sci. USA 2007, 104, 1319–1324. 3. Rich-Edwards, J.W.; Stampfer, M.J.; Manson, J.E.; Rosner, B.; Hankinson, S.E.; Colditz, G.A.; Hennekens,
C.H.; Willet, W.C. Birth weight and risk of cardiovascular disease in a cohort of women followed up since 1976. BMJ 1997, 315, 396–400.
4. Filatova, S.; Koivumaa-Honkanen, H.; Hirvonen, N.; Freeman, A.; Ivandic, I.; Hurtig, T.; Khandaker, G.M.; Jones, P.B.; Moilanen, K.; Miettunen, J. Early motor developmental milestones and schizophrenia: A systematic review and meta-analysis. Schizophr. Res. 2017, 188, 13–20.
5. Colman, I.; Jones, P.B.; Kuh, D.; Weeks, M.; Naicker, K.; Richards, M.; Croudace, T.J. Early development, stress and depression across the life course: Pathways to depression in a national British birth cohort. Psychol. Med. 2014, 44, 2845–2854.
6. Grantham-McGregor, S.; Cheung, Y.B.; Cueto, S.; Glewwe, P.; Richter, L.; Strupp, B. Developmental potential in the first 5 years for children in developing countries. Lancet 2007, 369, 60–70.
7. Miao, J. Birth Weight, Family Socioeconomic Status, and Cognitive Skills Among Chinese Adolescents. Chin. Sociol. Rev. 2017, 49, 362–381.
8. Murray, G.K.; Veijola, J.; Moilanen, K.; Miettunen, J.; Glahn, D.C.; Cannon, T.D.; Jones, P.B.; Isohanni, M. Infant motor development is associated with adult cognitive categorisation in a longitudinal birth cohort study. J. Child Psychol. Psychiatry 2006, 47, 25–29.
9. Shonkoff, J.P.; Garner, A.S.; Siegel, B.S.; Dobbins, M.I.; Earls, M.F.; Garner, A.S.; McGuinn, L.; Pascoe, J.; Wood, D.L. The Lifelong Effects of Early Childhood Adversity and Toxic Stress. Pediatrics 2012, 129, e232.
10. Shonkoff, J.P.; Phillips, D.A. From Neurons to Neighborhoods: The Science of early Childhood Development; National Academies Press: Washington, WA, USA, 2000.
11. Richter, L.M.; Daelmans, B.; Lombardi, J.; Heymann, J.; Boo, F.L.; Behrman, J.R.; Lu, C.; Lucas, J.E.; Perez-Escamilla, R.; Dua, T.; et al. Investing in the foundation of sustainable development: Pathways to scale up for early childhood development. Lancet 2017, 389, 103–118.
12. Leventhal, T.; Dupéré, V. Neighborhood Effects on Children’s Development in Experimental and Nonexperimental Research. Annu. Rev. Dev. Psychol. 2019, 1, 149–176.
13. Minh, A.; Muhajarine, N.; Janus, M.; Brownell, M.; Guhn, M. A review of neighborhood effects and early child development: How, where, and for whom, do neighborhoods matter? Health Place 2017, 46, 155–174.
13
14
15
16
-12 -8 -4 0 4 8 12Maternal education(centered)
Walking alone
18
20
22
24
-12 -8 -4 0 4 8 12Maternal education(centered)
First sentences
25
30
35
40
-12 -8 -4 0 4 8 12Maternal education(centered)
Counting 10 objects
25
30
35
40
-12 -8 -4 0 4 8 12Maternal education(centered)
Independent toileting
GDP per capita (-1 SD) GDP per capita (mean) GDP per capita (+1 SD)
Figure A3. Predicted age of attainment of development milestones with maternal education as afunction of county-level GDP per capita for children under age of 5.
References
1. Barker, D.J.P. Fetal origins of coronary heart disease. BMJ 1995, 311, 171–174. [CrossRef]2. Danese, A.; Pariante, C.M.; Caspi, A.; Taylor, A.; Poulton, R. Childhood maltreatment predicts adult
inflammation in a life-course study. Proc. Natl. Acad. Sci. USA 2007, 104, 1319–1324. [CrossRef] [PubMed]3. Rich-Edwards, J.W.; Stampfer, M.J.; Manson, J.E.; Rosner, B.; Hankinson, S.E.; Colditz, G.A.; Hennekens, C.H.;
Willet, W.C. Birth weight and risk of cardiovascular disease in a cohort of women followed up since 1976.BMJ 1997, 315, 396–400. [CrossRef] [PubMed]
4. Filatova, S.; Koivumaa-Honkanen, H.; Hirvonen, N.; Freeman, A.; Ivandic, I.; Hurtig, T.; Khandaker, G.M.;Jones, P.B.; Moilanen, K.; Miettunen, J. Early motor developmental milestones and schizophrenia: Asystematic review and meta-analysis. Schizophr. Res. 2017, 188, 13–20. [CrossRef] [PubMed]
5. Colman, I.; Jones, P.B.; Kuh, D.; Weeks, M.; Naicker, K.; Richards, M.; Croudace, T.J. Early development,stress and depression across the life course: Pathways to depression in a national British birth cohort. Psychol.Med. 2014, 44, 2845–2854. [CrossRef]
6. Grantham-McGregor, S.; Cheung, Y.B.; Cueto, S.; Glewwe, P.; Richter, L.; Strupp, B. Developmental potentialin the first 5 years for children in developing countries. Lancet 2007, 369, 60–70. [CrossRef]
7. Miao, J. Birth Weight, Family Socioeconomic Status, and Cognitive Skills Among Chinese Adolescents. Chin.Sociol. Rev. 2017, 49, 362–381. [CrossRef]
8. Murray, G.K.; Veijola, J.; Moilanen, K.; Miettunen, J.; Glahn, D.C.; Cannon, T.D.; Jones, P.B.; Isohanni, M.Infant motor development is associated with adult cognitive categorisation in a longitudinal birth cohortstudy. J. Child Psychol. Psychiatry 2006, 47, 25–29. [CrossRef] [PubMed]
9. Shonkoff, J.P.; Garner, A.S.; Siegel, B.S.; Dobbins, M.I.; Earls, M.F.; Garner, A.S.; McGuinn, L.; Pascoe, J.;Wood, D.L. The Lifelong Effects of Early Childhood Adversity and Toxic Stress. Pediatrics 2012, 129, e232.[CrossRef] [PubMed]
10. Shonkoff, J.P.; Phillips, D.A. From Neurons to Neighborhoods: The Science of early Childhood Development; NationalAcademies Press: Washington, WA, USA, 2000.

Int. J. Environ. Res. Public Health 2020, 17, 4937 19 of 22
11. Richter, L.M.; Daelmans, B.; Lombardi, J.; Heymann, J.; Boo, F.L.; Behrman, J.R.; Lu, C.; Lucas, J.E.;Perez-Escamilla, R.; Dua, T.; et al. Investing in the foundation of sustainable development: Pathways to scaleup for early childhood development. Lancet 2017, 389, 103–118. [CrossRef]
12. Leventhal, T.; Dupéré, V. Neighborhood Effects on Children’s Development in Experimental andNonexperimental Research. Annu. Rev. Dev. Psychol. 2019, 1, 149–176. [CrossRef]
13. Minh, A.; Muhajarine, N.; Janus, M.; Brownell, M.; Guhn, M. A review of neighborhood effects and earlychild development: How, where, and for whom, do neighborhoods matter? Health Place 2017, 46, 155–174.[CrossRef]
14. Brooks-Gunn, J.; Duncan, G.J.; Klebanov, P.K.; Sealand, N. Do Neighborhoods Influence Child and AdolescentDevelopment? Am. J. Sociol. 1993, 99, 353–395. [CrossRef]
15. McCulloch, A.; Joshi, H.E. Neighbourhood and family influences on the cognitive ability of children in theBritish National Child Development Study. Soc. Sci. Med. 2001, 53, 579–591. [CrossRef]
16. Leventhal, T.; Brooks-Gunn, J. Children and youth in neighborhood contexts. Curr. Dir. Psychol. Sci. 2003,12, 27–31. [CrossRef]
17. Goldfeld, S.; Mathews, T.; Brinkman, S.; Woolcock, G.; Myers, J.; Kershaw, P.; Katz, I.; Tanton, R.; Wiseman, J.The Kids in Communities Study: Measuring Community Level Factors Influencing Children’s Development; Reportfor VicHealth; Murdoch Childrens Research Institute: Melbourne, Australia, 2010.
18. Leventhal, T.; Brooks-Gunn, J. The neighborhoods they live in: The effects of neighborhood residence onchild and adolescent outcomes. Psychol. Bull. 2000, 126, 309–337. [CrossRef]
19. Dupéré, V.; Leventhal, T.; Crosnoe, R.; Dion, E. Understanding the positive role of neighborhoodsocioeconomic advantage in achievement: The contribution of the home, child care, and school environments.Dev. Psychol. 2010, 46, 1227–1244. [CrossRef]
20. Klebanov, P.K.; Brooks-Gunn, J.; Duncan, G.J. Does neighborhood and family poverty affect mothers’parenting, mental health, and social support? J. Marriage Fam. 1994, 56, 441–455. [CrossRef]
21. McLoyd, V.C. The impact of economic hardships of black families and youth: Psychological distress,parenting, socioemotional development. Child Dev. 1990, 61, 311–346. [CrossRef]
22. Shuey, E.A.; Leventhal, T. Neighborhoods and parenting. In Handbook of Parenting, Vol. 2: Biology and Ecologyof Parenting; Bornstein, M.H., Ed.; Taylor & Francis/Psychology Press: New York, NY, USA, 2019; pp. 371–399.
23. Cook, T.D.; Shagle, S.C.; Degirmencioglu, S.M. Capturing social process for testing mediational modelsof neighborhood effects. In Neighborhood Poverty, Vol II: Policy Implications in Studying Neighborhoods;Brooks-Gunn, J., Duncan, G.J., Aber, J.L., Eds.; Sage: New York, NY, USA, 1997; pp. 94–119.
24. Froiland, J.M.; Powell, D.R.; Diamond, K.E. Relations among neighborhood social networks, home literacyenvironments, and children’s expressive vocabulary in suburban at-risk families. Sch. Psychol. Int. 2014, 35,429–444. [CrossRef]
25. Duncan, G.J.; Brooks-Gunn, J.; Klebanov, P.K. Economic deprivation and early childhood development. ChildDev. 1994, 65, 296–318. [CrossRef] [PubMed]
26. Brooks-Gunn, J.; Han, W.-J.; Waldfogel, J. Maternal Employment and Child Cognitive Outcomes in the FirstThree Years of Life: The NICHD Study of Early Child Care. Child Dev. 2002, 73, 1052–1072. [CrossRef][PubMed]
27. Venetsanou, F.; Kambas, A. Environmental Factors Affecting Preschoolers’ Motor Development. Early Child.Educ. J. 2010, 37, 319–327. [CrossRef]
28. Walker, S.P.; Wachs, T.D.; Grantham-McGregor, S.; Black, M.M.; Nelson, C.A.; Huffman, S.L.;Baker-Henningham, H.; Chang, S.M.; Hamadani, J.; Lozoff, B.; et al. Inequality in early childhood:Risk and protective factors for early child development. Lancet 2011, 378, 1325–1338. [CrossRef]
29. Fernald, L.C.; Weber, A.; Galasso, E.; Ratsifandrihamanana, L. Socioeconomic gradients and childdevelopment in a very low income population: Evidence from Madagascar. Dev. Sci. 2011, 14, 832–847.[CrossRef]
30. Fernald, L.C.H.; Kariger, P.; Hidrobo, M.; Gertler, P.J. Socioeconomic gradients in child development in veryyoung children: Evidence from India, Indonesia, Peru, and Senegal. Proc. Natl. Acad. Sci. USA 2012, 109,17273–17280. [CrossRef]
31. Goldman, N.; Kimbro, R.T.; Turra, C.M.; Pebley, A.R. Socioeconomic gradients in health for white andMexican-origin populations. Am. J. Public Health 2006, 96, 2186–2193. [CrossRef]

Int. J. Environ. Res. Public Health 2020, 17, 4937 20 of 22
32. Dargent-Molina, P.; James, S.A.; Strogatz, D.S.; Savitz, D.A. Association between maternal education andinfant diarrhea in different household and community environments of Cebu, Philippines. Soc. Sci. Med.1994, 38, 343–350. [CrossRef]
33. Gordon, R.A.; Savage, C.; Lahey, B.B.; Goodman, S.H.; Jensen, P.S.; Rubio-Stipec, M.; Hoven, C.W. Familyand neighborhood income: Additive and multiplicative associations with youths’ well-being. Soc. Sci. Res.2003, 32, 191–219. [CrossRef]
34. Lima, J.; Caughy, M.; Nettles, S.M.; O’Campo, P.J. Effects of cumulative risk on behavioral and psychologicalwell-being in first grade: Moderation by neighborhood context. Soc. Sci. Med. 2010, 71, 1447–1454. [CrossRef]
35. Sastry, N. Community characteristics, individual and household attributes, and child survival in brazil.Demography 1996, 33, 211–229. [CrossRef] [PubMed]
36. Reed, B.A.; Jean-Pierre, H.; Cyrille, N. The Effects of Maternal Education on Child Nutritional Status Dependon Socio-Environmental Conditions. Int. J. Epidemiol. 1996, 25, 585–592. [CrossRef] [PubMed]
37. Leventhal, T.; Brooks-Gunn, J. Changing neighborhoods and child well-being: Understanding how childrenmay be affected in the coming century. Adv. Life Course Res. 2001, 6, 263–301. [CrossRef]
38. Coulton, C.J.; Korbin, J.E.; Su, M. Neighborhoods and child maltreatment: A multi-level study. Child Abus.Negl. 1999, 23, 1019–1040. [CrossRef]
39. Fotso, J.-C.; Kuate-Defo, B. Socioeconomic inequalities in early childhood malnutrition and morbidity:Modification of the household-level effects by the community SES. Health Place 2005, 11, 205–225. [CrossRef][PubMed]
40. Hasan, M.M.; Uddin, J.; Pulok, M.H.; Zaman, N.; Hajizadeh, M. Socioeconomic Inequalities in ChildMalnutrition in Bangladesh: Do They Differ by Region? Int. J. Environ. Res. Public Health 2020, 17, 1079.[CrossRef]
41. Robert, S.A. Socioeconomic position and health: The Independent Contribution of Community SocioeconomicContext. Annu. Rev. Sociol. 1999, 25, 489–516. [CrossRef]
42. Liu, X.; Sun, Z.; Neiderhiser, J.M.; Uchiyama, M.; Okawa, M. Low birth weight, developmental milestones,and behavioral problems in Chinese children and adolescents. Psychiatry Res. 2001, 101, 115–129. [CrossRef]
43. Lyu, M.; Li, W.; Xie, Y. The influences of family background and structural factors on children’s academicperformances: A cross-country comparative study. Chin. J. Sociol. 2019, 5, 173–192. [CrossRef]
44. Xie, Y.; Hannum, E. Regional Variation in Earnings Inequality in Reform-Era Urban China. Am. J. Sociol.1996, 101, 950–992. [CrossRef]
45. Xie, Y.; Zhou, X. Income inequality in today’s China. Proc. Natl. Acad. Sci. USA 2014, 111, 6928. [CrossRef][PubMed]
46. Liu, A.; Li, W.; Xie, Y. Social inequality in child educational development in China. Chin. J. Sociol. 2020, 6,219–238. [CrossRef]
47. China Children Development Foundation. Report on the State of Children in China; China Development Press:Beijing, China, 2017.
48. Xie, Y.; Hu, J. An Introduction to the China Family Panel Studies (CFPS). Chin. Sociol. Rev. 2014, 47, 3–29.49. Dosman, C.F.; Andrews, D.; Goulden, K.J. Evidence-based milestone ages as a framework for developmental
surveillance. Paediatr. Child Health 2012, 17, 561–568. [CrossRef] [PubMed]50. Ertem, I.O.; Krishnamurthy, V.; Mulaudzi, M.C.; Sguassero, Y.; Balta, H.; Gulumser, O.; Bilik, B.; Srinivasan, R.;
Johnson, B.; Gan, G.; et al. Similarities and differences in child development from birth to age 3 years bysex and across four countries: A cross-sectional, observational study. Lancet Glob. Health 2018, 6, e279–e291.[CrossRef]
51. Flensborg-Madsen, T.; Mortensen, E.L. Developmental milestones during the first three years as precursorsof adult intelligence. Dev. Psychol. 2018, 54, 1434–1444. [CrossRef]
52. Murray, G.K.; Jones, P.B.; Kuh, D.; Richards, M. Infant developmental milestones and subsequent cognitivefunction. Ann. Neurol. 2007, 62, 128–136. [CrossRef]
53. Taanila, A.; Murray, G.K.; Jokelainen, J.; Isohanni, M.; Rantakallio, P. Infant developmental milestones: A31-year follow-up. Dev. Med. Child Neurol. 2005, 47, 581–586. [CrossRef]
54. Johnson, A.; Goddard, O.; Ashurst, H. Is late walking a marker of morbidity? Steering Committee, OxfordRegion Child Development Project. Arch. Dis. Child. 1990, 65, 486–488. [CrossRef]

Int. J. Environ. Res. Public Health 2020, 17, 4937 21 of 22
55. Isohanni, M.; Jones, P.B.; Moilanen, K.; Rantakallio, P.; Veijola, J.; Oja, H.; Koiranen, M.; Jokelainen, J.;Croudace, T.; Järvelin, M.R. Early developmental milestones in adult schizophrenia and other psychoses.A 31-year follow-up of the Northern Finland 1966 Birth Cohort. Schizophr. Res. 2001, 52, 1–19. [CrossRef]
56. Jones, P.; Murray, R.; Jones, P.; Rodgers, B.; Marmot, M. Child developmental risk factors for adultschizophrenia in the British 1946 birth cohort. Lancet 1994, 344, 1398–1402. [CrossRef]
57. Benjamin Neelon, S.E.; Oken, E.; Taveras, E.M.; Rifas-Shiman, S.L.; Gillman, M.W. Age of achievement ofgross motor milestones in infancy and adiposity at age 3 years. Matern. Child Health J. 2012, 16, 1015–1020.[CrossRef] [PubMed]
58. Lansdown, R.G.; Goldstein, H.; Shah, P.M.; Orley, J.H.; Di, G.; Kaul, K.K.; Kumar, V.; Laksanavicharn, U.;Reddy, V. Culturally appropriate measures for monitoring child development at family and communitylevel: A WHO collaborative study. Bull. World Health Organ. 1996, 74, 283–290. [PubMed]
59. Kelly, Y.; Sacker, A.; Schoon, I.; Nazroo, J. Ethnic differences in achievement of developmental milestonesby 9 months of age: The Millennium Cohort Study. Dev. Med. Child Neurol. 2006, 48, 825–830. [CrossRef][PubMed]
60. Adolph, K.E.; Karasik, L.; Tamis-LeMonda, C.S. Motor skill. In Handbook of Cultural Developmental Science;Bernstein, M., Ed.; Taylor & Francis: New York, NY, USA, 2010; pp. 61–88.
61. Eriksson, M.; Marschik, P.B.; Tulviste, T.; Almgren, M.; Pereira, M.P.; Wehberg, S.; Marjanovic-Umek, L.;Gayraud, F.; Kovacevic, M.; Gallego, C. Differences between girls and boys in emerging language skills:Evidence from 10 language communities. Br. J. Dev. Psychol. 2012, 30, 326–343. [CrossRef] [PubMed]
62. Majnemer, A.; Rosenblatt, B. Reliability of parental recall of developmental milestones. Pediatric Neurol. 1994,10, 304–308. [CrossRef]
63. Majewska, R.; Mrozek-Budzyn, D.; Kieltyka, A.; Augustyniak, M. Usefulness of maternal assessment ofchildren development based on reported age of achieved milestones. Przegl. Epidemiol. 2013, 67, 487–490.
64. Xie, Y.; Zhang, X.; Tu, P.; Ren, Q.; Sun, Y.; Lv, P.; Ding, H.; Hu, J.; Wu, Q. China Family Panel Studies User’sManual (3rd edition). 2017. Available online: http://www.isss.pku.edu.cn/cfps/docs/20180928161838082277.pdf (accessed on 5 May 2020).
65. Ensminger, M.E.; Fothergill, K.E.; Bornstein, M.; Bradley, R. A decade of measuring SES: What it tells usand where to go from here. In Socioeconomic Status, Parenting, and Child Development; Bornstein, M.H.,Bradley, R.H., Eds.; Lawrence Erlbaum Associates: Mahwah, NJ, USA, 2003.
66. Bucher, H.; Killer, C.; Ochsner, Y.; Vaihinger, S.; Fauchère, J.-C. Growth, developmental milestones and healthproblems in the first 2 years in very preterm infants compared with term infants: A population-based study.Eur. J. Pediatrics 2002, 161, 151–156. [CrossRef]
67. Flensborg-Madsen, T.; Grønkjær, M.; Mortensen, E.L. Predictors of early life milestones: Results from theCopenhagen Perinatal Cohort. BMC Pediatrics 2019, 19, 420. [CrossRef]
68. Sacker, A.; Quigley, M.A.; Kelly, Y.J. Breastfeeding and Developmental Delay: Findings from the MillenniumCohort Study. Pediatrics 2006, 118, e682. [CrossRef]
69. Reinisch, J.M.; Rosenblum, L.A.; Rubin, D.B.; Schulsinger, M.F. Sex Differences in Developmental MilestonesDuring the First Year of Life. J. Psychol. Hum. Sex. 1991, 4, 19–36. [CrossRef]
70. Wu, X.G.; Treiman, D.J. The Household Registration System and Social Stratification in China 1955–1996.Demography 2004, 41, 363–384. [CrossRef] [PubMed]
71. Chetty, R.; Hendren, N. The Impacts of Neighborhoods on Intergenerational Mobility I: Childhood ExposureEffects. Q. J. Econ. 2018, 133, 1107–1162. [CrossRef]
72. Chetty, R.; Friedman, J.; Rockoff, J. Measuring the Impacts of Teachers: Reply. Am. Econ. Rev. 2017, 107,1685–1717. [CrossRef]
73. Caughy, M.O.B.; O’Campo, P.J. Neighborhood Poverty, Social Capital, and the Cognitive Development ofAfrican American Preschoolers. Am. J. Community Psychol. 2006, 37, 141–154. [CrossRef]
74. Linares, L.O.; Heeren, T.; Bronfman, E.; Zuckerman, B.; Augustyn, M.; Tronick, E. A Mediational Model forthe Impact of Exposure to Community Violence on Early Child Behavior Problems. Child Dev. 2001, 72,639–652. [CrossRef]
75. Li, X.; Lu, J.; Hu, S.; Cheng, K.K.; De Maeseneer, J.; Meng, Q.; Mossialos, E.; Xu, D.R.; Yip, W.; Zhang, H.; et al.The primary health-care system in China. Lancet 2017, 390, 2584–2594. [CrossRef]
76. Fang, P.; Dong, S.; Xiao, J.; Liu, C.; Feng, X.; Wang, Y. Regional inequality in health and its determinants:Evidence from China. Health Policy 2010, 94, 14–25. [CrossRef]

Int. J. Environ. Res. Public Health 2020, 17, 4937 22 of 22
77. National Health Commission of the People’s Republic of China. China Public Health Statistical Yearbook;Peking Union Medical College Press: Beijing, China, 2019.
78. Leventhal, T.; Dupéré, V.; Shuey, E.A. Children in neighborhoods. In Handbook of Child Psychology andDevelopmental Science Volume 4; Lerner, R.M., Ed.; John Wiley & Sons, Inc.: Hoboken, NJ, USA, 2015;pp. 493–531. [CrossRef]
79. Zick, C.D.; Hanson, H.; Fan, J.X.; Smith, K.R.; Kowaleski-Jones, L.; Brown, B.B.; Yamada, L. Re-visitingthe relationship between neighbourhood environment and BMI: An instrumental variables approach tocorrecting for residential selection bias. Int. J. Behav. Nutr. Phys. Act. 2013, 10, 1–10. [CrossRef]
© 2020 by the authors. Licensee MDPI, Basel, Switzerland. This article is an open accessarticle distributed under the terms and conditions of the Creative Commons Attribution(CC BY) license (http://creativecommons.org/licenses/by/4.0/).