Doses to patients in routine X-ray examinations in Malaysia
7
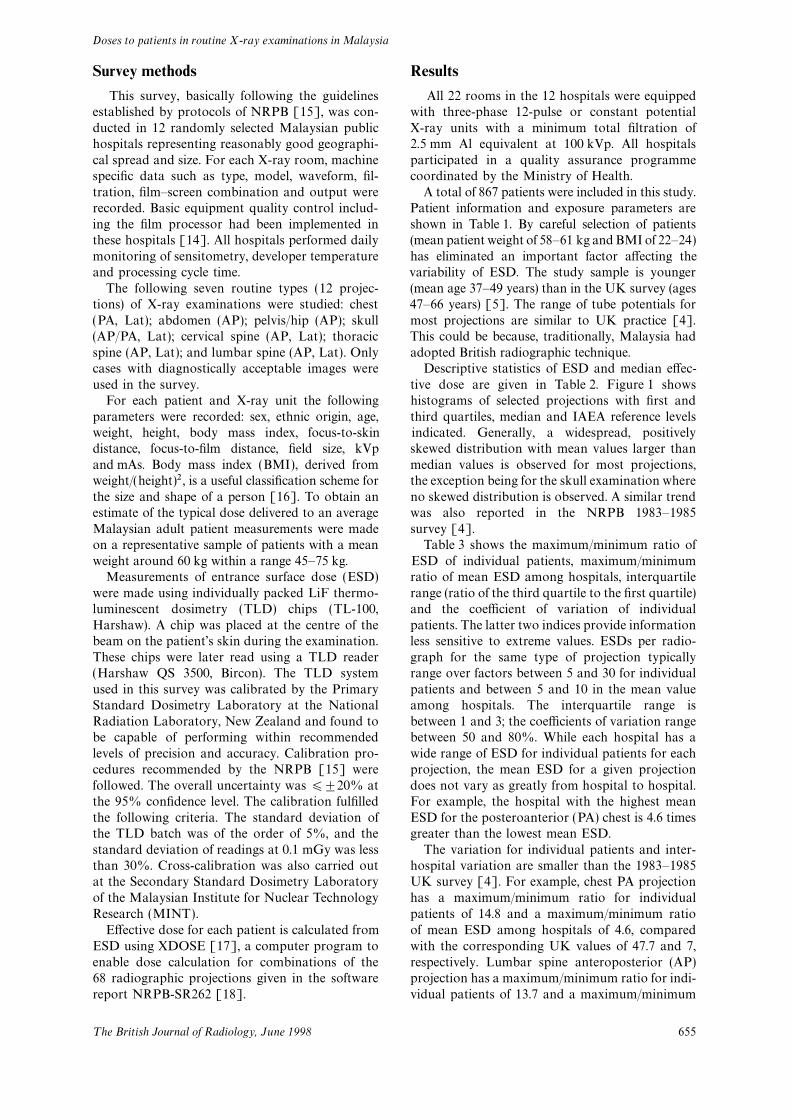
T he British Journal of Radiology, 71 (1998), 654–660 © 1998 The British Institute of Radiology Doses to patients in routine X-ray examinations in Malaysia 1K-H NG, PhD, MIPEM, 1P RASSIAH, MSc, 2H-B WANG, MSc, 2A S HAMBALI, BSc, 2P MUTHUVELLU, MSc and 3H-P LEE, DCR, TDCR 1Department of Radiology, University of Malaya Medical Centre, 59100 Kuala Lumpur, 2Radiation Safety Unit, Engineering Services Division, Ministry of Health, 50590 Kuala Lumpur, and 3Diagnostic Imaging Department, Subang Jaya Medical Centre, Selangor, Malaysia Abstract. A collaborative national survey initiated by the University of Malaya and the Ministry of Health was conducted from 1993 to 1995 to establish baseline patient dose data for seven common types (12 projections) of X-ray examinations in Malaysia. A total of 12 randomly selected public hospitals and 867 patients were included in this survey. The entrance surface doses (ESD) received by the patients were measured using thermoluminescent dosemeters (TLDs) attached to the patient’s skin. Histograms are presented showing wide, positively skewed distributions of measured entrance surface doses for each examination. Mean, median, first and third quartile values of ESD and median effective dose are reported. Survey results are generally comparable with those reported in the UK, USA and by the International Atomic Energy Agency (IAEA). The results also provide information on dose level for a lower weight population (mean weight 60 kg) compared with the international reference dose values based on a 70 kg standard. The findings support the importance of the on-going national quality assurance programme to ensure doses are kept to a level consistent with optimum image quality. The data will also be useful for the formulation of national guidance levels as recommended by the IAEA. Furthermore, this study provides patient dosimetry information on healthcare level II countries. Medical X-rays are by far the largest man-made equitable. This information from Malaysia will provide a useful contribution to knowledge on source of public exposure to ionizing radiation. Worldwide interest in patient dose measurement patient doses in level II countries. A notable feature of this survey is the information on doses from a was stimulated by the 1990 publication of Patient Dose Reduction in Diagnostic Radiology by the UK generally lower patient weight class (approximately 60 kg) compared with the surveys based on National Radiological Protection Board (NRPB) [1]. Several major dose surveys have been standard-sized patients of 70 kg [2–8]. A pilot study using the indirect method (also reported, especially from advanced countries [2–8]. However, in developing countries such known as the semi-empirical method) adopted by Harrison et al [11] was conducted during basic information is still lacking. This survey rep- 1991–1992 to investigate the potential for reducing resents the first organized national dose survey in the radiation dose to patients and to make rec- Malaysia. ommendations on effective methods of patient dose Malaysia is a healthcare level II country accord- reduction. The result obtained has prompted the ing to the UNSCEAR definition based on phys- implementation of a national dose survey project ician densities, (i.e. 1000–3000 persons per in Malaysia [12, 13]. A collaborative national physician). In 1994 there were 2216 persons per survey initiated by the University of Malaya and physician in Malaysia [9]. In level I countries the Ministry of Health has been conducted from there are fewer than 1000 persons per physician. 1993 to 1995 to establish baseline patient dose Level I countries, with 25% of the world popu- data for seven routine types of X-ray examinations. lation, account for some 70% of the diagnostic In 1992, the Ministry of Health extended its quality X-ray examinations [10]. The distribution of medi- assurance programme in radiology ( launched in cal radiation services in the world is far from 1987) from 16 major hospitals to 103 hospitals throughout the country [14]. Though it was con- Received 25 November 1997 and in revised form fined to quality control activities such as tube 3 February 1998, accepted 12 February 1998. potential ( kV), mAs, sensitometry, image quality This work is supported by an IRPA grant (3-121-01) tests and reject analysis, the importance of patient from the Ministry of Science, Technology and the dose monitoring was also recognized as an import- Environment ‘‘Quality Assurance in Radiology: Image Quality Improvement and Patient Dose Reduction’’. ant aspect of the overall programme. T he British Journal of Radiology, June 1998 654
-
Upload
independent -
Category
Documents
-
view
4 -
download
0
Transcript of Doses to patients in routine X-ray examinations in Malaysia
T he British Journal of Radiology, 71 (1998), 654–660 © 1998 The British Institute of Radiology
Doses to patients in routine X-ray examinations inMalaysia
1K-H NG, PhD, MIPEM, 1P RASSIAH, MSc, 2H-B WANG, MSc, 2A S HAMBALI, BSc,2P MUTHUVELLU, MSc and 3H-P LEE, DCR, TDCR
1Department of Radiology, University of Malaya Medical Centre, 59100 Kuala Lumpur, 2Radiation Safety Unit,Engineering Services Division, Ministry of Health, 50590 Kuala Lumpur, and 3Diagnostic Imaging Department,Subang Jaya Medical Centre, Selangor, Malaysia
Abstract. A collaborative national survey initiated by the University of Malaya and the Ministryof Health was conducted from 1993 to 1995 to establish baseline patient dose data for sevencommon types (12 projections) of X-ray examinations in Malaysia. A total of 12 randomly selectedpublic hospitals and 867 patients were included in this survey. The entrance surface doses (ESD)received by the patients were measured using thermoluminescent dosemeters (TLDs) attached tothe patient’s skin. Histograms are presented showing wide, positively skewed distributions ofmeasured entrance surface doses for each examination. Mean, median, first and third quartilevalues of ESD and median effective dose are reported. Survey results are generally comparablewith those reported in the UK, USA and by the International Atomic Energy Agency (IAEA).The results also provide information on dose level for a lower weight population (mean weight60 kg) compared with the international reference dose values based on a 70 kg standard. Thefindings support the importance of the on-going national quality assurance programme to ensuredoses are kept to a level consistent with optimum image quality. The data will also be useful forthe formulation of national guidance levels as recommended by the IAEA. Furthermore, this studyprovides patient dosimetry information on healthcare level II countries.
Medical X-rays are by far the largest man-made equitable. This information from Malaysia willprovide a useful contribution to knowledge onsource of public exposure to ionizing radiation.
Worldwide interest in patient dose measurement patient doses in level II countries. A notable featureof this survey is the information on doses from awas stimulated by the 1990 publication of Patient
Dose Reduction in Diagnostic Radiology by the UK generally lower patient weight class (approximately60 kg) compared with the surveys based onNational Radiological Protection Board (NRPB)
[1]. Several major dose surveys have been standard-sized patients of 70 kg [2–8].A pilot study using the indirect method (alsoreported, especially from advanced countries
[2–8]. However, in developing countries such known as the semi-empirical method) adoptedby Harrison et al [11] was conducted duringbasic information is still lacking. This survey rep-1991–1992 to investigate the potential for reducingresents the first organized national dose survey inthe radiation dose to patients and to make rec-Malaysia.ommendations on effective methods of patient doseMalaysia is a healthcare level II country accord-reduction. The result obtained has prompted theing to the UNSCEAR definition based on phys-implementation of a national dose survey projectician densities, (i.e. 1000–3000 persons perin Malaysia [12, 13]. A collaborative nationalphysician). In 1994 there were 2216 persons persurvey initiated by the University of Malaya andphysician in Malaysia [9]. In level I countriesthe Ministry of Health has been conducted fromthere are fewer than 1000 persons per physician.1993 to 1995 to establish baseline patient doseLevel I countries, with 25% of the world popu-data for seven routine types of X-ray examinations.lation, account for some 70% of the diagnosticIn 1992, the Ministry of Health extended its qualityX-ray examinations [10]. The distribution of medi-assurance programme in radiology ( launched incal radiation services in the world is far from1987) from 16 major hospitals to 103 hospitalsthroughout the country [14]. Though it was con-
Received 25 November 1997 and in revised formfined to quality control activities such as tube3 February 1998, accepted 12 February 1998.potential (kV), mAs, sensitometry, image quality
This work is supported by an IRPA grant (3-121-01)tests and reject analysis, the importance of patientfrom the Ministry of Science, Technology and thedose monitoring was also recognized as an import-Environment ‘‘Quality Assurance in Radiology: Image
Quality Improvement and Patient Dose Reduction’’. ant aspect of the overall programme.
T he British Journal of Radiology, June 1998654
Doses to patients in routine X-ray examinations in Malaysia
Survey methods Results
All 22 rooms in the 12 hospitals were equippedThis survey, basically following the guidelinesestablished by protocols of NRPB [15], was con- with three-phase 12-pulse or constant potential
X-ray units with a minimum total filtration ofducted in 12 randomly selected Malaysian publichospitals representing reasonably good geographi- 2.5 mm Al equivalent at 100 kVp. All hospitals
participated in a quality assurance programmecal spread and size. For each X-ray room, machinespecific data such as type, model, waveform, fil- coordinated by the Ministry of Health.
A total of 867 patients were included in this study.tration, film–screen combination and output wererecorded. Basic equipment quality control includ- Patient information and exposure parameters are
shown in Table 1. By careful selection of patientsing the film processor had been implemented inthese hospitals [14]. All hospitals performed daily (mean patient weight of 58–61 kg and BMI of 22–24)
has eliminated an important factor affecting themonitoring of sensitometry, developer temperatureand processing cycle time. variability of ESD. The study sample is younger
(mean age 37–49 years) than in the UK survey (agesThe following seven routine types (12 projec-tions) of X-ray examinations were studied: chest 47–66 years) [5]. The range of tube potentials for
most projections are similar to UK practice [4].(PA, Lat); abdomen (AP); pelvis/hip (AP); skull(AP/PA, Lat); cervical spine (AP, Lat); thoracic This could be because, traditionally, Malaysia had
adopted British radiographic technique.spine (AP, Lat); and lumbar spine (AP, Lat). Onlycases with diagnostically acceptable images were Descriptive statistics of ESD and median effec-
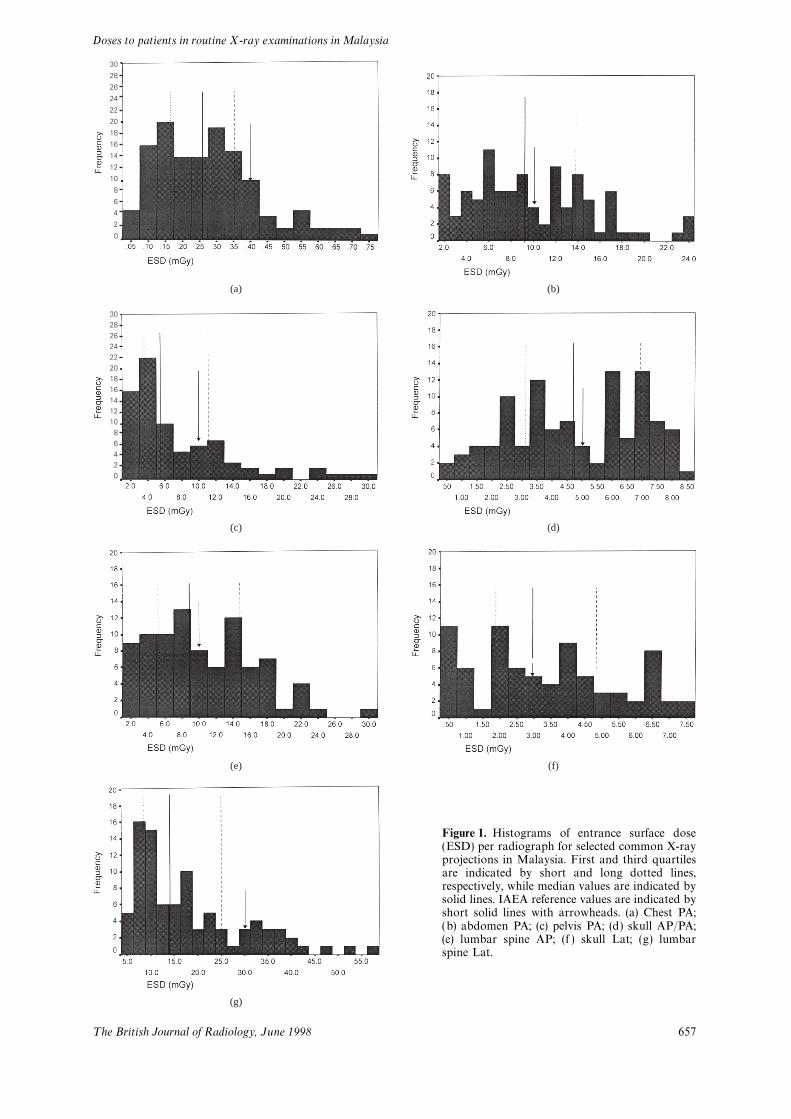
tive dose are given in Table 2. Figure 1 showsused in the survey.For each patient and X-ray unit the following histograms of selected projections with first and
third quartiles, median and IAEA reference levelsparameters were recorded: sex, ethnic origin, age,weight, height, body mass index, focus-to-skin indicated. Generally, a widespread, positively
skewed distribution with mean values larger thandistance, focus-to-film distance, field size, kVpand mAs. Body mass index (BMI), derived from median values is observed for most projections,
the exception being for the skull examination whereweight/(height)2 , is a useful classification scheme forthe size and shape of a person [16]. To obtain an no skewed distribution is observed. A similar trend
was also reported in the NRPB 1983–1985estimate of the typical dose delivered to an averageMalaysian adult patient measurements were made survey [4].
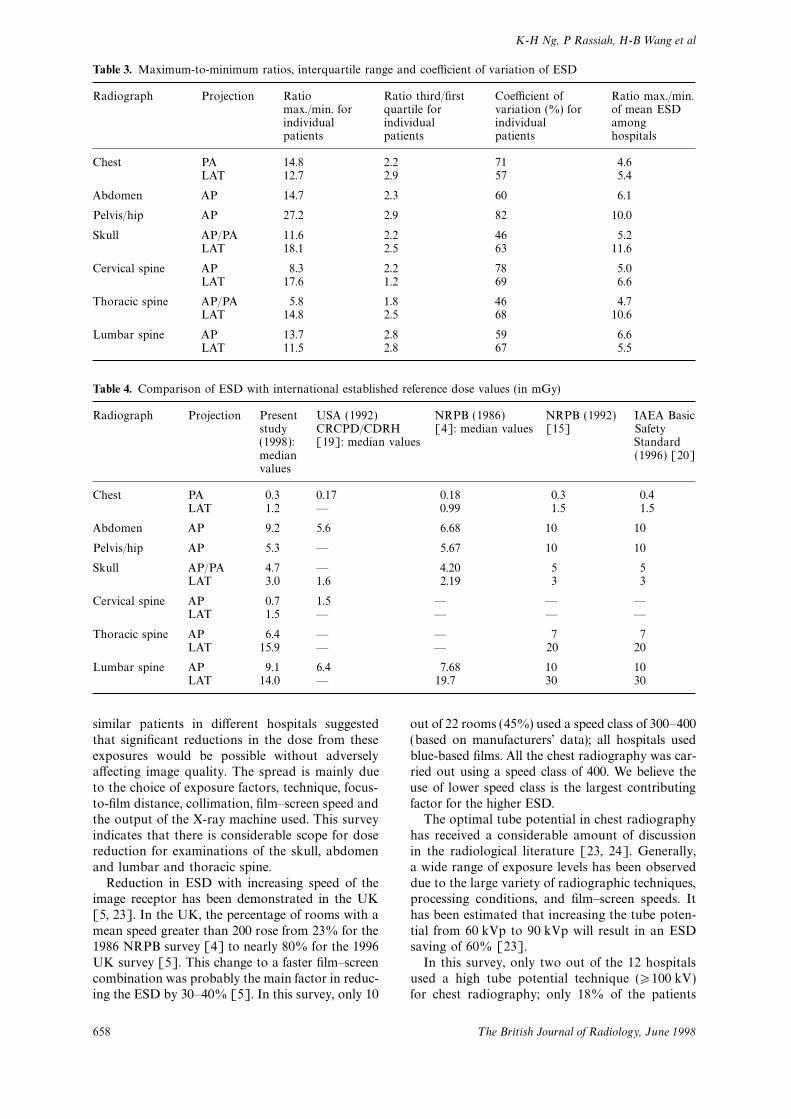
Table 3 shows the maximum/minimum ratio ofon a representative sample of patients with a meanweight around 60 kg within a range 45–75 kg. ESD of individual patients, maximum/minimum
ratio of mean ESD among hospitals, interquartileMeasurements of entrance surface dose (ESD)were made using individually packed LiF thermo- range (ratio of the third quartile to the first quartile)
and the coefficient of variation of individualluminescent dosimetry (TLD) chips (TL-100,Harshaw). A chip was placed at the centre of the patients. The latter two indices provide information
less sensitive to extreme values. ESDs per radio-beam on the patient’s skin during the examination.These chips were later read using a TLD reader graph for the same type of projection typically
range over factors between 5 and 30 for individual(Harshaw QS 3500, Bircon). The TLD systemused in this survey was calibrated by the Primary patients and between 5 and 10 in the mean value
among hospitals. The interquartile range isStandard Dosimetry Laboratory at the NationalRadiation Laboratory, New Zealand and found to between 1 and 3; the coefficients of variation range
between 50 and 80%. While each hospital has abe capable of performing within recommendedlevels of precision and accuracy. Calibration pro- wide range of ESD for individual patients for each
projection, the mean ESD for a given projectioncedures recommended by the NRPB [15] werefollowed. The overall uncertainty was ∏±20% at does not vary as greatly from hospital to hospital.
For example, the hospital with the highest meanthe 95% confidence level. The calibration fulfilledthe following criteria. The standard deviation of ESD for the posteroanterior (PA) chest is 4.6 times
greater than the lowest mean ESD.the TLD batch was of the order of 5%, and thestandard deviation of readings at 0.1 mGy was less The variation for individual patients and inter-
hospital variation are smaller than the 1983–1985than 30%. Cross-calibration was also carried outat the Secondary Standard Dosimetry Laboratory UK survey [4]. For example, chest PA projection
has a maximum/minimum ratio for individualof the Malaysian Institute for Nuclear TechnologyResearch (MINT). patients of 14.8 and a maximum/minimum ratio
of mean ESD among hospitals of 4.6, comparedEffective dose for each patient is calculated fromESD using XDOSE [17], a computer program to with the corresponding UK values of 47.7 and 7,
respectively. Lumbar spine anteroposterior (AP)enable dose calculation for combinations of the68 radiographic projections given in the software projection has a maximum/minimum ratio for indi-
vidual patients of 13.7 and a maximum/minimumreport NRPB-SR262 [18].
T he British Journal of Radiology, June 1998 655
K-H Ng, P Rassiah, H-B Wang et al
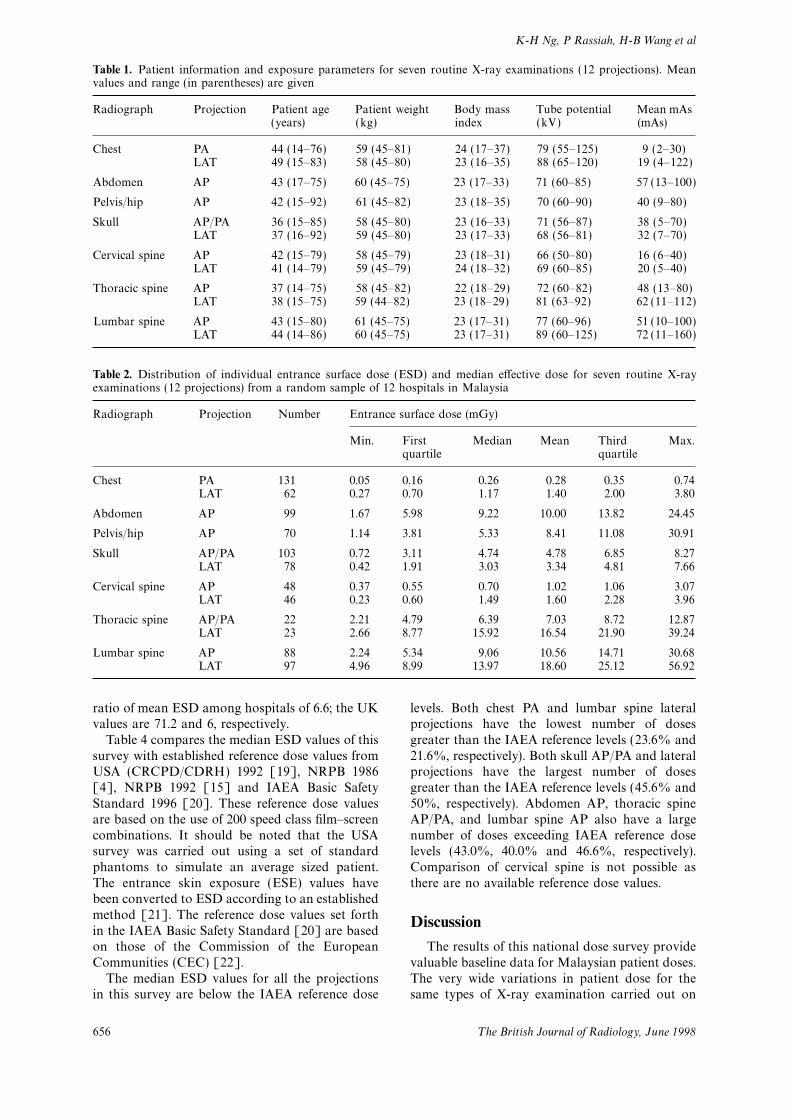
Table 1. Patient information and exposure parameters for seven routine X-ray examinations (12 projections). Meanvalues and range (in parentheses) are given
Radiograph Projection Patient age Patient weight Body mass Tube potential Mean mAs(years) (kg) index (kV) (mAs)
Chest PA 44 (14–76) 59 (45–81) 24 (17–37) 79 (55–125) 9 (2–30)LAT 49 (15–83) 58 (45–80) 23 (16–35) 88 (65–120) 19 (4–122)
Abdomen AP 43 (17–75) 60 (45–75) 23 (17–33) 71 (60–85) 57 (13–100)
Pelvis/hip AP 42 (15–92) 61 (45–82) 23 (18–35) 70 (60–90) 40 (9–80)
Skull AP/PA 36 (15–85) 58 (45–80) 23 (16–33) 71 (56–87) 38 (5–70)LAT 37 (16–92) 59 (45–80) 23 (17–33) 68 (56–81) 32 (7–70)
Cervical spine AP 42 (15–79) 58 (45–79) 23 (18–31) 66 (50–80) 16 (6–40)LAT 41 (14–79) 59 (45–79) 24 (18–32) 69 (60–85) 20 (5–40)
Thoracic spine AP 37 (14–75) 58 (45–82) 22 (18–29) 72 (60–82) 48 (13–80)LAT 38 (15–75) 59 (44–82) 23 (18–29) 81 (63–92) 62 (11–112)
Lumbar spine AP 43 (15–80) 61 (45–75) 23 (17–31) 77 (60–96) 51 (10–100)LAT 44 (14–86) 60 (45–75) 23 (17–31) 89 (60–125) 72 (11–160)
Table 2. Distribution of individual entrance surface dose (ESD) and median effective dose for seven routine X-rayexaminations (12 projections) from a random sample of 12 hospitals in Malaysia
Radiograph Projection Number Entrance surface dose (mGy)
Min. First Median Mean Third Max.quartile quartile
Chest PA 131 0.05 0.16 0.26 0.28 0.35 0.74LAT 62 0.27 0.70 1.17 1.40 2.00 3.80
Abdomen AP 99 1.67 5.98 9.22 10.00 13.82 24.45
Pelvis/hip AP 70 1.14 3.81 5.33 8.41 11.08 30.91
Skull AP/PA 103 0.72 3.11 4.74 4.78 6.85 8.27LAT 78 0.42 1.91 3.03 3.34 4.81 7.66
Cervical spine AP 48 0.37 0.55 0.70 1.02 1.06 3.07LAT 46 0.23 0.60 1.49 1.60 2.28 3.96
Thoracic spine AP/PA 22 2.21 4.79 6.39 7.03 8.72 12.87LAT 23 2.66 8.77 15.92 16.54 21.90 39.24
Lumbar spine AP 88 2.24 5.34 9.06 10.56 14.71 30.68LAT 97 4.96 8.99 13.97 18.60 25.12 56.92
ratio of mean ESD among hospitals of 6.6; the UK levels. Both chest PA and lumbar spine lateralprojections have the lowest number of dosesvalues are 71.2 and 6, respectively.
Table 4 compares the median ESD values of this greater than the IAEA reference levels (23.6% and21.6%, respectively). Both skull AP/PA and lateralsurvey with established reference dose values from
USA (CRCPD/CDRH) 1992 [19], NRPB 1986 projections have the largest number of dosesgreater than the IAEA reference levels (45.6% and[4], NRPB 1992 [15] and IAEA Basic Safety
Standard 1996 [20]. These reference dose values 50%, respectively). Abdomen AP, thoracic spineAP/PA, and lumbar spine AP also have a largeare based on the use of 200 speed class film–screen
combinations. It should be noted that the USA number of doses exceeding IAEA reference doselevels (43.0%, 40.0% and 46.6%, respectively).survey was carried out using a set of standard
phantoms to simulate an average sized patient. Comparison of cervical spine is not possible asthere are no available reference dose values.The entrance skin exposure (ESE) values have
been converted to ESD according to an establishedmethod [21]. The reference dose values set forth
Discussionin the IAEA Basic Safety Standard [20] are basedon those of the Commission of the European The results of this national dose survey provide
valuable baseline data for Malaysian patient doses.Communities (CEC) [22].The median ESD values for all the projections The very wide variations in patient dose for the
same types of X-ray examination carried out onin this survey are below the IAEA reference dose
T he British Journal of Radiology, June 1998656
Doses to patients in routine X-ray examinations in Malaysia
Figure 1. Histograms of entrance surface dose(ESD) per radiograph for selected common X-rayprojections in Malaysia. First and third quartilesare indicated by short and long dotted lines,respectively, while median values are indicated bysolid lines. IAEA reference values are indicated byshort solid lines with arrowheads. (a) Chest PA;(b) abdomen PA; (c) pelvis PA; (d) skull AP/PA;(e) lumbar spine AP; (f ) skull Lat; (g) lumbarspine Lat.
(a) (b)
(c) (d)
(e)
(g)
(f)
3028262422201816141210
86420
30
28
26
24
22
20
18
16
14
12
10
8
6
4
2
0
T he British Journal of Radiology, June 1998 657
K-H Ng, P Rassiah, H-B Wang et al
Table 3. Maximum-to-minimum ratios, interquartile range and coefficient of variation of ESD
Radiograph Projection Ratio Ratio third/first Coefficient of Ratio max./min.max./min. for quartile for variation (%) for of mean ESDindividual individual individual amongpatients patients patients hospitals
Chest PA 14.8 2.2 71 4.6LAT 12.7 2.9 57 5.4
Abdomen AP 14.7 2.3 60 6.1
Pelvis/hip AP 27.2 2.9 82 10.0
Skull AP/PA 11.6 2.2 46 5.2LAT 18.1 2.5 63 11.6
Cervical spine AP 8.3 2.2 78 5.0LAT 17.6 1.2 69 6.6
Thoracic spine AP/PA 5.8 1.8 46 4.7LAT 14.8 2.5 68 10.6
Lumbar spine AP 13.7 2.8 59 6.6LAT 11.5 2.8 67 5.5
Table 4. Comparison of ESD with international established reference dose values (in mGy)
Radiograph Projection Present USA (1992) NRPB (1986) NRPB (1992) IAEA Basicstudy CRCPD/CDRH [4]: median values [15] Safety(1998): [19]: median values Standardmedian (1996) [20]values
Chest PA 0.3 0.17 0.18 0.3 0.4LAT 1.2 — 0.99 1.5 1.5
Abdomen AP 9.2 5.6 6.68 10 10
Pelvis/hip AP 5.3 — 5.67 10 10
Skull AP/PA 4.7 — 4.20 5 5LAT 3.0 1.6 2.19 3 3
Cervical spine AP 0.7 1.5 — — —LAT 1.5 — — — —
Thoracic spine AP 6.4 — — 7 7LAT 15.9 — — 20 20
Lumbar spine AP 9.1 6.4 7.68 10 10LAT 14.0 — 19.7 30 30
similar patients in different hospitals suggested out of 22 rooms (45%) used a speed class of 300–400(based on manufacturers’ data); all hospitals usedthat significant reductions in the dose from these
exposures would be possible without adversely blue-based films. All the chest radiography was car-ried out using a speed class of 400. We believe theaffecting image quality. The spread is mainly due
to the choice of exposure factors, technique, focus- use of lower speed class is the largest contributingfactor for the higher ESD.to-film distance, collimation, film–screen speed and
the output of the X-ray machine used. This survey The optimal tube potential in chest radiographyhas received a considerable amount of discussionindicates that there is considerable scope for dose
reduction for examinations of the skull, abdomen in the radiological literature [23, 24]. Generally,a wide range of exposure levels has been observedand lumbar and thoracic spine.
Reduction in ESD with increasing speed of the due to the large variety of radiographic techniques,processing conditions, and film–screen speeds. Itimage receptor has been demonstrated in the UK
[5, 23]. In the UK, the percentage of rooms with a has been estimated that increasing the tube poten-tial from 60 kVp to 90 kVp will result in an ESDmean speed greater than 200 rose from 23% for the
1986 NRPB survey [4] to nearly 80% for the 1996 saving of 60% [23].In this survey, only two out of the 12 hospitalsUK survey [5]. This change to a faster film–screen
combination was probably the main factor in reduc- used a high tube potential technique (�100 kV)for chest radiography; only 18% of the patientsing the ESD by 30–40% [5]. In this survey, only 10
T he British Journal of Radiology, June 1998658
Doses to patients in routine X-ray examinations in Malaysia
surveyed. In a pilot research programme coordi- encouraged by the Malaysian Radiologicalnated by the IAEA, conducted in seven developing Society’s plan to incorporate this in the nationalcountries, it was reported that only one out of 21 quality assurance programme. Furthermore, theX-ray rooms dedicated to chest radiography used data will be used by the Atomic Energy Licensinga high tube potential technique [7]. This explains Board for the formulation of a national guidancewhy the ESD values measured were higher than dose level for incorporation in the amendmentsthe international reference values which were of the 1988 Malaysia Radiation Protectiondefined for high tube potential techniques. The Regulations (Basic Safety Standard).CEC has recommended a technique of 125 kV[20]. The low tube potential technique will prob-ably be employed for some time to come as radiol-
Acknowledgmentsogists prefer the higher contrast chest radiographs.Martin et al [25] found that increasing tube We would like to acknowledge the co-operationpotentials by 8–13 kV in lumbar and thoracic of both patients and staff at all the radiologyspine examinations resulted in a dose reduction of departments participating in this study. In particu-26–36%. lar, we would like to thank the radiologists and
As pointed out earlier, reference doses are based radiographers from the following hospitals: Aloron a standard-sized 70 kg man defined by ICRP Setar, Kelang, Kota Bahru, Kota Kinabalu, Kuala23 [26]. The 10 kg difference from our study Terengganu, Kuantan, Kuching, Melaka, Pulauwould obviously affect the validity of adopting the Pinang, Seremban, Teluk Intan and the Universityreference doses without modification. As the dose Hospital Kuala Lumpur. We also thank theincreases with weight, one alternative is to adopt trainees of the School of Radiography, Universitythe dose–weight adjustment of about 2% per kg Hospital Kuala Lumpur for their help in carryingas recommended by Hart and Shrimpton [27]. out the pilot study.Thus, the dose levels determined in this survey We thank Tan Sri Dato’ Dr Abu Bakar binwould have to be increased by 20% in order to be Suleiman, Director-General of the Ministry ofcompared directly with the established inter- Health for his permission to publish this papernational references doses. and his support of this work. We gratefully
Reference values described in the IAEA and acknowledge Dr S Sivalingam, ConsultantCEC were determined on the basis of third quartile Radiologist, Hospital Kuala Lumpur for hisof patient dose distributions obtained in European invaluable advice.surveys in recent years. This approach is consistent Technical support for calibration of TLDs pro-with the recommendations given in ICRP vided by Dr John LeHeron, Senior ScientificPublication 60 [28]. It is reasonable to establish Advisor, National Radiation Laboratory, Newa set of reference dose values for the average Zealand and the Malaysian Institute for Nuclearweight found in most Asian countries. This is Technology Research (MINT) is gratefullyalso supported by a European study on dose acknowledged.comparison between groups of patients of varioussize and shape [29].
Effective dose is likely to become the standardReferencesmeasure for comparing risks from various sources
of radiation exposure. The determination of effec- 1. National Radiological Protection Board/Royaltive dose is complex and depends on the Monte College of Radiologists. Patient dose reduction in
diagnostic radiology. In: Documents of the NRPB.Carlo model used and the assumptions made [30].London: HMSO, 1990:1(3).The effective dose calculation is based on the
2. National Council on Radiation Protection andassumption of an average 70 kg patient [17, 18],
Measurements. Exposure of the US population fromwhereas in this study the mean patient weight is diagnostic medical radiation. Bethesda, Maryland,60 kg. Thus the reported effective dose in this USA: NCRP, 1989.
3. Shrimpton PC, Wall BF, Jones DG, Fisher ES,study should be regarded as an indicator only andHillier MC, Kendall GM, et al. Doses to patientscaution is needed for intercomparison with valuesfrom routine diagnostic X-ray examinations inin Europe.England. Br J Radiol 1986;59:749–58.
This national survey has led to an increased 4. Shrimpton PC, Wall BF, Jones DG, Fisher ES,awareness amongst professionals in diagnostic Hillier MC, Kendall GM, et al. A national survey
of doses to patients undergoing a selection of routineradiology in Malaysia of the need for reduction inX-ray examinations in English hospitals, NRPB-patient dose. Since the survey, faster film–screenR200. London: HMSO, 1986.combinations have been introduced in many hospi-
5. Hart D, Hillier MC, Wall BF, Shrimpton PC,tals and greater emphasis on quality assurance Bungay D. Doses to patients from medical X-rayshould improve performance [13, 14]. The practi- examinations in the UK—1995 review, NRPB-R289.
London: HMSO, 1996.cal implementation of this concern has been
T he British Journal of Radiology, June 1998 659

K-H Ng, P Rassiah, H-B Wang et al
6. Heggie JCP. A survey of doses to patients in large 18. Hart D, Jones DG, Wall BF. Normalized organdoses for medical X-ray examinations calculatedpublic hospitals resulting from common plain film
radiographic procedures. Austral Phys Eng Sci Med using Monte Carlo techniques, NRPB-SR262.London: HMSO, 1994.1990;13:71–80.
7. International Atomic Energy Agency/Commission 19. Council of Radiation Control Program Directors/Center for Devices and Radiological Health. Averageof the European Communities. Radiation doses in
diagnostic radiology and methods for dose patient exposure/dose guides 1992, CRCPD Pub92–4. Frankfurt: CRCPD, 1992.reduction, IAEA-TECDOC-796, Brussels: CEC,
1995. 20. International Atomic Energy Agency. InternationalBasic Safety Standards for Protection Against8. Ortiz P, Maccia C, Padovani R, Vano E, Carlsson
GA, Schibilla H. Results of the IAEA–CEC coordi- Ionising Radiation and for the Safety of RadiationSources. Safety series no. 115-1. Vienna: IAEA, 1996.nated research programme on radiation doses in
diagnostic radiology and methods for reduction. 21. Wall BF, Shrimpton PC. Patient dose protocols andtrends in the UK. Radiat Prot Dosim 1995;Radiat Prot Dosim 1995;57:95–9.
9. United Nations Scientific Committee on the Effects 57:359–62.22. EUR16260 EN. European guidelines on quality cri-of Atomic Radiation. 1988 Report to the General
Assembly, with scientific annexes, United Nations teria for diagnostic radiographic images, ECDGXII, 1996.Sales Publication E.88.IX.7. New York: UN, 1988.
10. United Nations Scientific Committee on the Effects 23. Warren-Forward HM, Millar JS. Optimization ofradiographic technique for chest radiography. Brof Atomic Radiation. Sources, effects and risks of
ionizing radiation. Report to the General Assembly, J Radiol 1995;68:1221–9.24. Buttler PF, Conway BJ, Suleiman OH, Kousteniswith annexes. New York: UN, 1993:227.
11. Harrison RM, Clayton CB, Day MJ, Owen JP, York GH, Showalter CK. Chest radiography: A surveyof techniques and exposure levels currently used.MF. A survey of radiation doses to patients in
five common diagnostic examinations. Br J Radiol Radiology 1985;156:533–6.25. Martin CJ, Darragh CL, McKenzie GA, Bayliss AP.1983;56:383–95.
12. Ng KH, Lee HP, Wang HB, Ruzman N, Samuel D. Implementation of a programme for reduction ofradiographic doses and results achieved throughPatient dosimetry at the University Hospital of the
University of Malaya. In: Ng KH, Bradley DA, increases in tube potential. Br J Radiol 1993;66:228–33.editors Proceedings of Radiation and Occupational
Health Symposium, 22–23 November 1993. Kuala 26. International Commission on RadiologicalProtection. Report of the Task Group on ReferenceLumpur: Malaysian Institute of Physics, 1995:58–66.
13. Ng KH. Recent advances in patient dosimetry in Man, ICRP 23. Oxford: Pergamon Press, 1975.27. Hart D, Shrimpton PC. The significance of patientdiagnostic radiology. In: Tajuddin AA, Bradley DA,
editors. Centennial of the X-ray—an account of weight when comparing X-ray room performanceagainst guideline levels of dose. Br J Radioldevelopments in radiological physics and radiology
in Malaya and Malaysia. Kuala Lumpur: Malaysian 1991;64:771–2.28. International Commission on Radiological Pro-Institute of Physics, 1995:49–71.
14. Wang HB, Ng KH. Quality Assurance Programme tection. 1990 Recommendations of the Inter-national Commission on Radiological Protec-in Radiology—the Malaysian experience. Phys Med
Biol 1994; 39a/Part 1:305. tion, ICRP 60. Oxford: Pergamon Press, 1991.29. Lindskoug BA. The Reference Man in diagnostic15. National Radiological Protection Board. National
protocol for patient dose measurements in diagnostic radiology dosimetry. Br J Radiol 1992;65:431–7.30. Hart D, Jones DG, Wall BF. Estimation of effectiveradiology dosimetry. Report of a Working Party of
the Institute of Physical Sciences in Medicine. dose in diagnostic radiology from entrance surfacedose and dose–area product measurements, NRPB-Chilton: NRPB, 1992.
16. Gibson RS. Principles of nutritional assessment. R262. London: HMSO, 1994.New York: Oxford University Press, 1990:178–82.
17. LeHeron JC. XDOSE: A user’s guide. Christchurch;New Zealand: National Radiation Laboratory,Ministry of Health, 1994.
T he British Journal of Radiology, June 1998660