Marine Stock Enhancement Potential in Nursery Habitats of Striped Mullet, Mugil cephalus, in Hawaii

663
Transactions of the American Fisheries Society 130:663–674, 2001q Copyright by the American Fisheries Society 2001
Dorsal Coloration as an Indicator of Different Life HistoryPatterns for Striped Bass within a Single
Watershed of Atlantic Canada
LEE M. PARAMORE1 AND ROGER A. RULIFSON*Department of Biology, and Institute for Coastal and Marine ResourcesEast Carolina University, Greenville, North Carolina 27858-4353, USA
Abstract.—The striped bass Morone saxatilis spawning within a single river system are generallyconsidered to be members of a single population unit. For some rivers in Canada, however, fishershave reported different-colored groups of striped bass in the watershed during the prespawningand spawning seasons, which suggests the existence of population subgroups. We examined this‘‘colormorph’’ phenomenon for a striped bass population in the Shubenacadie watershed of NovaScotia, Canada. Spawning fish had three dorsal coloration patterns: green, which was indicativeof fish from the ocean; black, which was indicative of fish that overwinter in a freshwater headwaterlake; and mottled, which were fish of unknown origin. Body morphology appeared to be similaramong the three groups. Although the age structures of the spawning populations revealed a widerrange of age-classes among greenbacked fish, the growth aspects (e.g., length, weight, and lengthat age) were similar. We estimated that during the prespawning period, one-third of the populationwas actively foraging in the river; stomach contents suggested differences in diet among the morphs.Fatty acid analysis of gonadal material revealed significant differences between the green andblack color types, indicating moderately long (months) separation and differences in feeding (i.e.,ocean-based versus freshwater-based food webs). Otolith microchemistry analysis of strontiumrevealed that dorsal coloration at capture was indicative of long-term habitat separation. Whetherthese two groups are reproductively isolated is unknown.
Throughout its natural range from Canada to theGulf of Mexico, the striped bass Morone saxatilisexhibits a latitudinal difference in life history pat-terns (Setzler et al. 1980). Populations south ofCape Hatteras, North Carolina, are endemic riv-erine species; those north of Cape Hatteras areanadromous, spawning in freshwater or brackishstreams during the spring and spending most oftheir adult lives in the ocean, undergoing extensivecoastal migrations in the process. Juveniles tendto remain in fresh or brackish waters during thefirst year or two of life and then participate incoastal migrations as adults.
As a result of recent population declines, Ca-nadian fisheries management agencies are increas-ing efforts to understand the life history of thestriped bass inhabiting Canadian waters (Peterson1991). However, few comprehensive studies havebeen conducted on specific populations. Recent
* Corresponding author: [email protected] Current address: North Carolina Division of Marine
Fisheries, Post Office Box 539, Wanchese, North Car-olina 27981, USA.
2 Ratio is the number of carbon atoms to the numberof double bonds, and ‘‘n’’ designates the position of thefirst double bond from the methyl end.
Received June 15, 1999; accepted February 1, 2001
monitoring has documented that only two spawn-ing populations remain, one in the Miramichi Riv-er in northeastern New Brunswick (Robichaud-LeBlanc et al. 1996) and the other in the Shubena-cadie River in Nova Scotia (Jessop 1995).
Commercial fishers on both river systems referto two dorsal coloration patterns—black andgreen—as indicators of two different life historypatterns occurring in the population. In the Shu-benacadie watershed (Figure 1), adult striped bassthat overwinter in the freshwaters of ShubenacadieGrand Lake (a large headwater lake) have a dark(black) dorsal coloration, and these fish migratedownstream to the spawning grounds in the spring.The adult fish migrating upstream from the oceanwaters of Cobequid Bay (at the eastern head of theupper Bay of Fundy) during the spring spawningrun have a green dorsal coloration (Rulifson andDadswell 1995). Local fishers refer to these fishas ‘‘blackbacks’’ and ‘‘greenbacks,’’ respectively.The prespawning migration begins in May, andspawning activity usually begins the first week inJune and terminates in late June when adult fish(presumably of both color types) migrate down-stream to feeding grounds in the Bay of Fundy.
The goal of our study was to determine whetherthe blackback2greenback phenomenon reportedby local fishers represents two distinct groups of

664 PARAMORE AND RULIFSON
FIGURE 1.—Map of the Shubenacadie–Stewiacke watershed, Nova Scotia, showing the entrance of the river intoCobequid Bay (the upper Bay of Fundy), the study site at the confluence of the Shubenacadie and Stewiacke rivers,and the Shubenacadie headwaters of Grand Lake near Halifax. Hatch marks indicate the present spawning location.
fish with different life history patterns spawningwithin a single river system. Fish were sampledfrom the commercial harvest and separated on thebasis of visual interpretation of dorsal color type(differences are easily distinguished even to thecasual observer). To find evidence of distinctgroups within the population, the data were ana-lyzed for differences in arrival time on the spawn-ing grounds, sex ratio, age and growth, age struc-ture, diet composition, the fatty acid profiles ofselected tissues, and otolith microchemistry.
Study Site
The Shubenacadie River originates in Shu-benacadie Grand Lake near Halifax, Nova Sco-tia, and meanders 81 km north before emptyinginto the terminus of the Bay of Fundy via Cob-equid Bay and Minas Basin. A main tributary ofthe Shubenacadie River is the Stewiacke River,which enters the Shubenacadie approximately 37km upstream of the mouth. The Shubenacadie–Stewiacke watershed is the largest in Nova Sco-

665STRIPED BASS LIFE HISTORY
tia, comprising nearly 2,800 km2 (Figure 1). Thisriver system has a gentle gradient and thereforethe tidal influence extends upstream approxi-mately 64 km in the Shubenacadie River and 16km in the Stewiacke River (Shubenacadie–Stewiacke River Basin Board 1981). The incom-ing tide arrives as a tidal bore, which is a verysteep wave front that surges up the river andcauses a change from low to high tide in ap-proximately 1 h. Tidal ranges on the Shubena-cadie River can be as much as 4 m on springtides. Lynch (1982) presents a general descrip-tion of tidal bores; a complete description of theShubenacadie tidal bore and associated waterquality is described in a companion study (Rul-ifson and Tull 1999; also see Tull 1997) .
Striped bass in this watershed spawn in the Ste-wiacke River approximately 3–6 km upstream ofthe confluence near the saltwater–freshwater in-terface (Rulifson and Tull 1999). During the study,the local commercial fishery consisted of a fleetof about 20 part-time gill-net fishers targetingAmerican shad Alosa sapidissima and alewife A.pseudoharengus, also known as gaspereau. All fishcaught were marketed through the local fish houselocated at the bank of the river.
Methods
Field examination.—Fishery-dependent data onharvests by gill net were used to ascertain the agefrequency and size distribution of the 1994 Shu-benacadie spawning population. Because a varietyof mesh sizes were used (83–127 mm stretch),sampling bias due to gear selectivity should havebeen minimal. The dorsal coloration of each fishwas noted at the time of delivery to the fish house.Each fish was then measured to the nearest mil-limeter for total length (TL) and fork length (FL)and weighed to the nearest 0.2 kg. Scales for ageanalysis were removed from the left dorsal side ofthe fish between the anterior dorsal fin and thelateral line. Fish sold to the wholesale market werenot processed further. Fish sold locally were pro-cessed by removing gonads, sagittal otoliths, andgastrointestinal tracts. Subsamples of ovaries andlivers were frozen for fatty acid analysis.
Age analysis.—Otoliths and scales were used todetermine the age-class structure of both colortypes. Scales were mounted between two glassslides and read on a microfiche reader at 243 mag-nification. Two or more nonregenerated scaleswere read on three separate occasions for each fish.Scales that failed to have agreement in at least tworeadings were not used in age analyses. Because
all fish were caught in the early spring (the onsetof additional growth), the outer edge of each scalewas counted as the last annulus. Otoliths weremounted on cardboard squares with Crystal Bondthermal plastic, cut dorsoventrally in the trans-verse plane into 1.0-mm sections with a BuehlerIsomet low-speed saw fitted with a 0.006-mm Nor-ton diamond grit wafering blade (Matheson 1981),and polished. Reflected light was used to view oto-liths. As with the scales, multiple readings weremade. Optimas software was used to make lateralmeasurements (to the nearest 0.01 mm) from thefocus of the otolith to each ring (annulus). Ringsthat appeared opaque and continuous were record-ed as an annual ring representing a year of growth.
Gut analysis.—Approximately one-fourth of theharvested population was sampled for food habitanalysis to determine whether diets differed be-tween dorsal color types. Contents were removedfrom the gastrointestinal tract, separated into thelowest possible taxa, counted, and weighed.
Fatty acid analysis.—Frozen ovarian tissue wasanalyzed for differences in fatty acids to providebiochemical evidence for the blackback–greenbackphenomenon on a moderately long (months) timescale. Following Bligh and Dyer (1959), lipids werewet-extracted using a chloroform2methanol2water(2:2:1) solution. Neutral lipids and phospholipidswere separated using a Suppelco LC-Si solid-phaseextraction tube. Neutral lipids were eluted with a 5%solution of methanol in chloroform, and phospho-lipids were eluted with pure methanol. Phospholipidswere separated using thin-layer chromatography(TLC) and a mixture of methyl acetate, isopropanol,chloroform, methanol, and 0.25% KCl as describedby Chu and Ozkizilcik (1995). Phospholipids wereviewed by spraying the TLC plates with 8-anilino-1-naphthalene sulfonate and examining them un-der ultraviolet light. Individual phospholipidswere quantified by measuring the relative amountsof phosphorus. Individual spots were scraped offplates, and phosphorus was determined using Kjel-dahl digestion and colorimetric analysis on an Ori-on Scientific Instruments Corporation autoanaly-zer (EPA 1979). Quantities were measured to thenearest 0.01 mM. Identification and quantificationof individual phospholipids was validated by plac-ing known standards on the TLC plates parallel tothe samples. Lipid fractions were then saponifiedand methylated in order to obtain fatty acid methylesters, as described by Gallagher et al. (1984). Awide-bore capillary column made of boro-silicateglass was used to separate the fatty acids.
Samples were analyzed by a Varian 3740 gas
666 PARAMORE AND RULIFSON
chromatograph equipped with a flame ionizationdetector and an automated integrator recorder(Gallagher et al. 1989, 1991). Identification of in-dividual fatty acids was carried out by comparingthe retention time of the fatty acid to the retentiontime of a known fatty acid methyl ester standard.Also, logarithmic plots of retention times versusthe number of carbon atoms were used to confirmidentification. We then compared the fatty acidprofiles and concentrations of individual fatty ac-ids between black and green dorsal fish. Systat forWindows (Systat, Inc.) software was used for sta-tistical analysis, which consisted of standard anal-ysis of variance (ANOVA) and two-tailed t-testswith Bonferroni correction at a significance levelof P # 0.05.
Otolith microchemistry.—The elemental com-position of otoliths is indicative of the environ-ments that fish experience over time, thereby pro-viding a long-term record of life history (Gunn etal. 1992; Secor et al. 1994). This use of otolithsis based on two premises: (1) that the differencesin water chemistry found in different water bodies(i.e., freshwater versus saltwater) are incorporatedinto the calcareous otolith matrix (Radtke and Sha-fer 1992; Secor et al. 1994) and (2) that otolithsare physiologically static accretions and are at nopoint reabsorbed (Campana and Neilson 1985).
Two methods were used to examine otolith mi-crochemistry for differences in the patterns ofstrontium:calcium (Sr:Ca) ratio between colortypes. The first method was laser ablation induc-tively coupled plasma mass spectrometry (LA-ICPMS). In this technique, a high-powered, pulsedlaser beam 10 mm in diameter is focused onto aparticular section of an otolith. Once activated, thelaser causes the photon energy to be converted intokinetic energy, vaporizing a portion of the otolith.The vaporized portion of the otolith is swept byargon gas into the plasma where it is atomized andionized and subsequently analyzed by a mass spec-trometer (Denoyer et al. 1991; Hall 1992). Targetsample locations were the opaque and translucentzones in a linear transect between the otolith focusand outer edge. Up to 10 samples were taken foreach otolith. Because of the experimental natureof the work and the limited number of samples(five blackbacks and four greenbacks, rangingfrom 7 to 10 years in age), the data for the twocolor types were plotted and compared visually forsimilarities and differences in the patterns of the86Sr:48Ca ratios at corresponding annular and in-terannular locations on each otolith.
The second microchemical analysis was con-
ducted with charged-particle-induced X-ray emis-sion (PIXE), which is particularly well suited forrapid, nondestructive testing of solid samples fora broad range of elements. Because light particlessuch as the electron microprobe produce a rela-tively large bremsstrahlung X-ray background,protons are generally the probe of choice for theirsensitivity in detecting elements with low atomicnumbers, such as phosphorus, calcium, iron, zinc,arsenic, and strontium (Johansson et al. 1995). Inaddition, heavier elements can be readily identifiedusing X rays excited from outer electronic shells(e.g., L X rays). For PIXE analysis, the sample isbombarded by a beam of ‘‘heavy’’ particles, gen-erally protons or alpha particles, and the charac-teristic X rays induced by charged particle exci-tation of the sample atoms are detected by a high-resolution solid-state detector that can resolve Xrays from the different elements in the sample. Theintensity and energy of the detected X rays provideinformation on the type and quantity of atoms pre-sent in the sample.
The PIXE method was used in two different ap-plications to identify microchemical signatureswithin the otolith (long-term life data) and on theexternal surface (days or weeks prior to capture).In the first trial, conducted at the University ofGuelph, one black and one green sectioned otolithwere subjected to a continuous PIXE microbeamstarting at the focus and continuing to the outeredge; this generated a continuous record of Sr con-centration over the life of the fish. In a second trialat East Carolina University, the convex surfacesof whole otoliths from all three color types wereanalyzed using a broad-beam PIXE system so asto summarize the general chemical signature of theouter several microns of the otolith surface (i.e.,the recent record of overwintering habitat).
Results
Prespawning Migration Pattern
In 1994, striped bass arrived in the river systemin large numbers early in the season (early May),probably as a result of a warm spring. Subse-quently, a cold front delayed the potential for anearly spawning and prolonged the period in whichthe adults were subjected to capture by the com-mercial fishery. Commercial catches of stripedbass decreased during the spawning period as fishmoved upstream into the protected spawning areawhere no commercial fishing was allowed.
Striped bass were landed commercially fromMay 5 to June 6, 1994. In all, 191 striped bass
667STRIPED BASS LIFE HISTORY
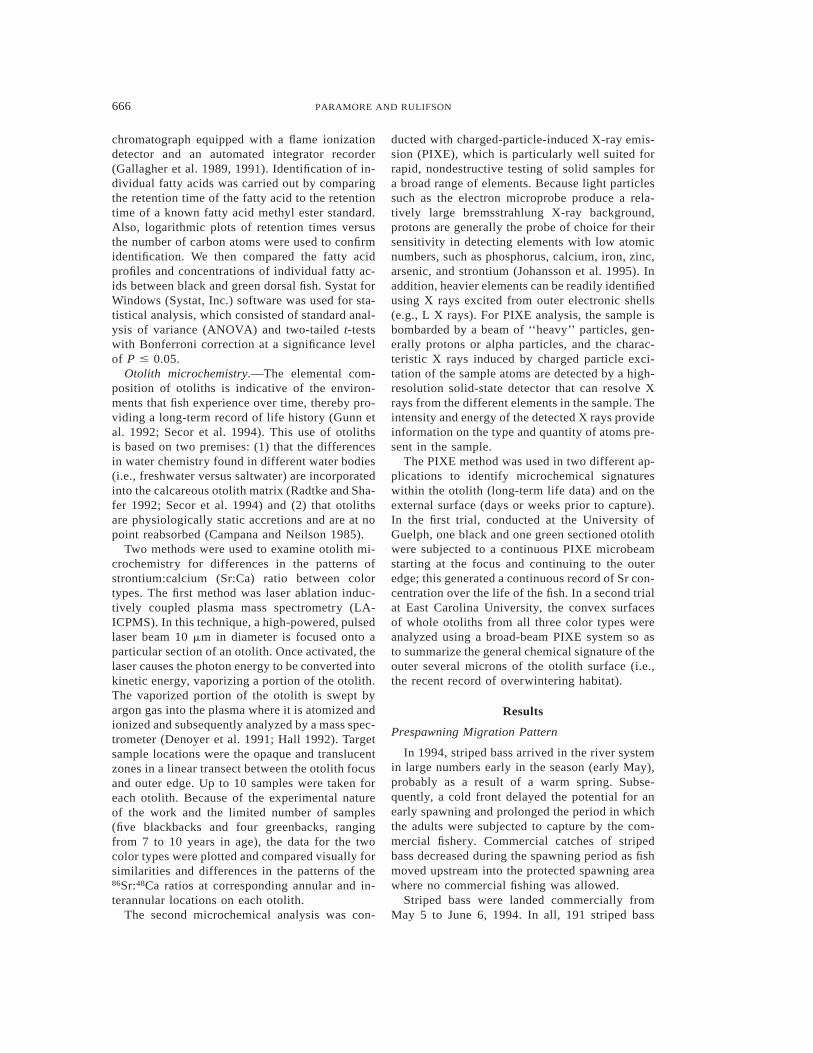
FIGURE 2.—Catch distribution of striped bass in theShubenacadie watershed by sex and dorsal colorationduring early (May 11–24) and late (May 25–June 7)prespawning periods, 1994.
were sampled from commercial gill-net catchesduring this period, representing the largest 1-yeardata set assembled for this small population.Spawning activity was observed from June 2 toJune 20 (Rulifson and Tull 1999). One-half of theharvested fish had black dorsal coloration, and 53(28%) had green dorsal coloration. However, 41fish (21%) had a third and unexpected dorsal col-oration pattern, namely, a mottled appearancecharacterized by alternating patches of green andblack. Mottled fish appeared to be a transitionphase between the black and green color types.
The arrival of striped bass on the spawninggrounds was analyzed by dorsal color type for two14-d periods (Figure 2). The greatest number offish (N 5 146) were caught during the first 14 dof sampling (May 11–24) when commercial fish-ing intensity was highest. During this period,blackback fish made up the largest proportion ofthe sample (54%), followed by greenback (25%)and mottled (21%) fish. During the second period(May 252June 7), only 45 fish were captured, withblackbacks and greenbacks more equally repre-sented in the catches (40% and 38%, respectively)and mottled fish making up 22% of the total.
Throughout both periods the male:female ratiowas greater than 2:1 and the black dorsal colora-tion was more common in both sexes. However,the ratios of color types by sex changed betweencollecting periods. Females changed from a black:green: mottled (BGM) ratio of 63:25:12 in the firstperiod to one of 29:50:21 in the second period.Male fish also showed a shift, but the black dorsalcolor remained dominant and mottled fish in-
creased; the BGM ratio was 53:45:2 in the firstperiod and 45:23:32 in the second period (Figure2).
Age Determination
For fish less than 12 years old, there was goodagreement between the ages determined from oto-liths and scales, but disagreement occurred for fish12 years and older. A total of 189 of the 191 scalesamples were readable, and 115 otoliths were aged.There was a 90% agreement in ages derived byotoliths and scales, and when disagreement oc-curred it was never by more than 1 year. Whenusing otoliths as the standard, 4 of 115 fish (3%)were overaged and 7 (6%) were underaged by us-ing scales.
Age Frequency and Size Distribution
The striped bass landed during the Shubenacadiespring fishery ranged from age 4 (441 mm FL and1.16 kg on average) to age 16 (1,020 mm FL and11.18 kg; Table 1). The dominant year-classeswere ages 4 and 5, which composed 50% and 30%of the overall catch, respectively. Male fish rangedin age from 4 to 15 years and females from 4 to16 years.
Age-classes were not uniformly representedwhen the catch was separated by color and sex(Table 1). Male blackbacks had only three age-classes (ages 4, 5, and 6), whereas male greenbackshad four age-classes (4, 5, 9, and 15) and malemottled fish had five age-classes (4–8). Femaleblackbacks had seven age-classes (4–10), femalegreenbacks had eight age-classes (4–7, 9, 10, 11,and 16), and mottled females had five age-classes(4–7 and 15). Catches of female blackbacks wereprimarily of age-4 (39%) and age-5 (25%) fish.Greenbacks had higher percentages of older fe-males in the overall catch, 18.8% for age-9 fishand 25.0% for age-7 fish. Mottled females weredominated by age 6 (50%). Because the age fre-quency distributions, particularly for the older age-classes, were affected by small sample sizes, theobserved differences between color types shouldbe considered cautiously.
Although the age-class structures were differentamong the three color types, the growth patternsbased on back-calculated FLs were similar, sug-gesting that growth was not a criterion for sepa-rating the groups.
Food Habits
Prey items varied among dorsal color types (Ta-ble 2). During the study, approximately one-fourth

668 PARAMORE AND RULIFSON
TABLE 1.—Mean observed fork lengths (mm) at age for striped bass caught in the drift-net fishery of the Shubena-cadie–Stewiacke River system in the spring of 1994. Numbers in parentheses indicate the percentage age distributionof fish in the samples; empty cells mean that there were no fish in that age-class. Abbreviations are as follows: F 5female, M 5 male, B 5 blackback, G 5 greenback, and M 5 mottled.
Sex Color N
Mean fork length (mm) in age-class
4 5 6 7 8 9 10 11 12 13 14 15 16
F
F
B
G
28
16
440.4(39.3)439(18.8)
553.4(25.0)528.5(12.5)
574.7(10.7)588
(6.3)
687.5(14.3)644.7(25.0)
684(3.6)
800(3.6)
834.3(18.8)
845(3.6)820(6.3)
891(6.3)
1,020(6.3)
F
M
M
M
M
B
G
M
8
60
31
27
463(12.5)444(65.0)436.8(58.1)433.9(48.1)
448(12.5)521.9(33.3)539.7(29.0)508.8(40.7)
621.5(50.0)572
(1.7)
570(3.7)
715(12.5)
670(3.7)
752(3.7)
736.7(9.7)
1,007(12.5)
983(3.2)
TABLE 2.—Stomach contents of striped bass with food items present (14 of 44) collected from the Shubenacadie–Stewiacke River system during the spring spawning run in 1994 by dorsal coloration of fish. Sample sizes (N) were asfollows: blackback fish 5 7, greenback fish 5 3, and mottled fish 5 4.
Food item
Blackback
%occurrence
% meanvolume
Greenback
%occurrence
% meanvolume
Mottled
%occurrence
% meanvolume
Stickleback (Gasterosteidae)Atlantic silverside Menidia menidiaAmerican eel Anguilla rostrataFlounder (Pleuronectidae)Alewife Alosa pseudoharengusBlueback herring Alosa aestivalisCod (Gadidae)Fish parts
28.628.628.60.00.00.0
71.485.7
19.612.53.10.00.00.0
61.92.9
0.00.00.0
33.366.60.0
33.333.3
0.00.00.01.5
91.10.06.21.2
0.00.00.00.0
50.025.075.025.0
0.00.00.00.0
17.651.728.32.4
of the entire catch (44 fish) were sampled and 14(32%) contained food, suggesting that about one-third of the population was actively foraging dur-ing prespawning activity. Three species were ex-clusive to the stomachs of blackback fish: stick-lebacks, Atlantic silversides, and American eels.The stomachs of greenback fish contained two spe-cies, alewives and flounders, which were not rep-resented in the stomachs of blackback fish. Mottledfish were similar to greenbacks, with alosid speciescomprising the majority of the mean volume con-tent for both color types. Postspawning adults werenot examined.
Fatty Acid Analysis
Prior to statistical analysis, the fatty acid contentof sampled fish was compared visually using gaschromatography plots of fatty acid profiles versusretention time. Without any prior knowledge ofdorsal coloration, researchers separated fish intotwo groups based on the visual similarity of the
plots (mottled fish were not tested). Each plot wasthen identified by dorsal color type. All but oneof the fish were successfully separated into theblack and green groups based only on visual iden-tification of their fatty acid profiles. This simpleexercise indicated that fish of the same dorsal col-oration had similar concentrations of the differentfatty acids. Additionally, cluster analysis of thefatty acid data placed the fish into two groups,blackbacks and greenbacks.
The dominant fatty acids in eggs and livers var-ied significantly between blackback and greenbackfemale striped bass. The eggs of four blackbacksand four greenbacks were analyzed for fatty acidcomposition. The dominant fatty acids present inthe phospholipid fraction of the eggs were, in de-creasing order of importance, 22:6, 18:1 n-9/n-7,20:5 n-3, 16:1 n-7, 16:0, and 18:0.2. More than50% of the neutral fraction of the lipids was rep-resented by 18:1 n-9/n-7, 16:1 n-7, and 17:1, inthat order. Fatty acid 17:1 was seen only in the

669STRIPED BASS LIFE HISTORY
TABLE 3.—Mean percent fatty acid content of the phospholipid fraction from striped bass eggs (N 5 8, 4 for eachcoloration) and livers (N 5 6, 3 for each coloration). A one-way analysis of variance was used to test for significantdifferences based on dorsal coloration. Values in parentheses are standard errors of the means; significant differences(P # 0.05) in means are indicated by different letters across rows.
Phospholipidfraction
Eggs
Blackback Greenback
Livers
Blackback Greenback
Saturated Fats14:0
16:0
18:0
0.6 a(0.1)13.0 a(1.1)6.7 a
(0.3)
0.8 a(0.3)13.0 a(0.3)8.0 a
(0.7)
1.4 a(0.6)14.7 a(3.0)11.2 a(2.4)
1.2 a(0.1)14.2 a(1.6)14.2 a(2.4)
Monounsaturated Fats16:1 n-7
18:1 n-9/n-7
20:1 n-9
8.5 a(0.8)17.0 a(3.3)1.2 a
(0.1)
7.9 a(0.7)17.9 a(1.2)1.7 a
(0.1)
11.0 a(3.8)20.7 a(2.8)1.5 a
(0.1)
9.4 a(1.7)22.3 a(2.7)1.9 a
( )Polyunsaturated Fats
18:2 n-6
18:3 n-6/n-3
1.6 a(0.5)0.4 a
(0.1)
1.0 a(0.1)0.1 a
(0.1)
3.1 a(1.0)
1.8 a(1.0)
20:4 n-6
18:4 n-3
20:5 n-3
22:5 n-3
22:6 n-3
6.1 a(1.1)0.5 a
(0.1)10.5 a(0.6)1.7 a
(0.2)25.8 a(1.3)
2.8 b(0.2)0.6 a
(0.2)14.0 b(1.2)1.9 a
(0.1)26.4 a(1.3)
8.0 a(2.3)
5.3 a(0.9)1.2 a
(0.1)18.4 a(2.4)
4.1 b(0.6)
8.2 b(1.3)1.3 a
(0.3)20.1 a(0.4)
neutral fraction, where it made up over 9% of thelipids present. An independent-samples t-test ofthe phospholipid fraction showed that blackbackstriped bass had significantly (P , 0.05) higherlevels of 20:4 n-6 than did greenbacks, whilegreenbacks had significantly higher levels of 20:5 n-3. Analysis of the liver fatty acid content ofthree blackbacks and three greenbacks alsoshowed that the blackbacks had significantly high-er levels of 20:4 n-6 while the greenbacks hadsignificantly higher levels of 20:5 n-3 (Table 3).No other fatty acid in the phospholipid fractiondiffered significantly.
There were no significant differences in the con-centrations of individual phospholipid groupsbased on dorsal coloration. The major phospho-lipid present in the eggs of blackback females wasphosphotydlinositol (49%); other phospholipidsincluded phosphotydlcholine (16%), phosphotyd-lethanolamine (15%), lysolecthin (12%), andsphingmylein (8%).
Otolith Microchemistry
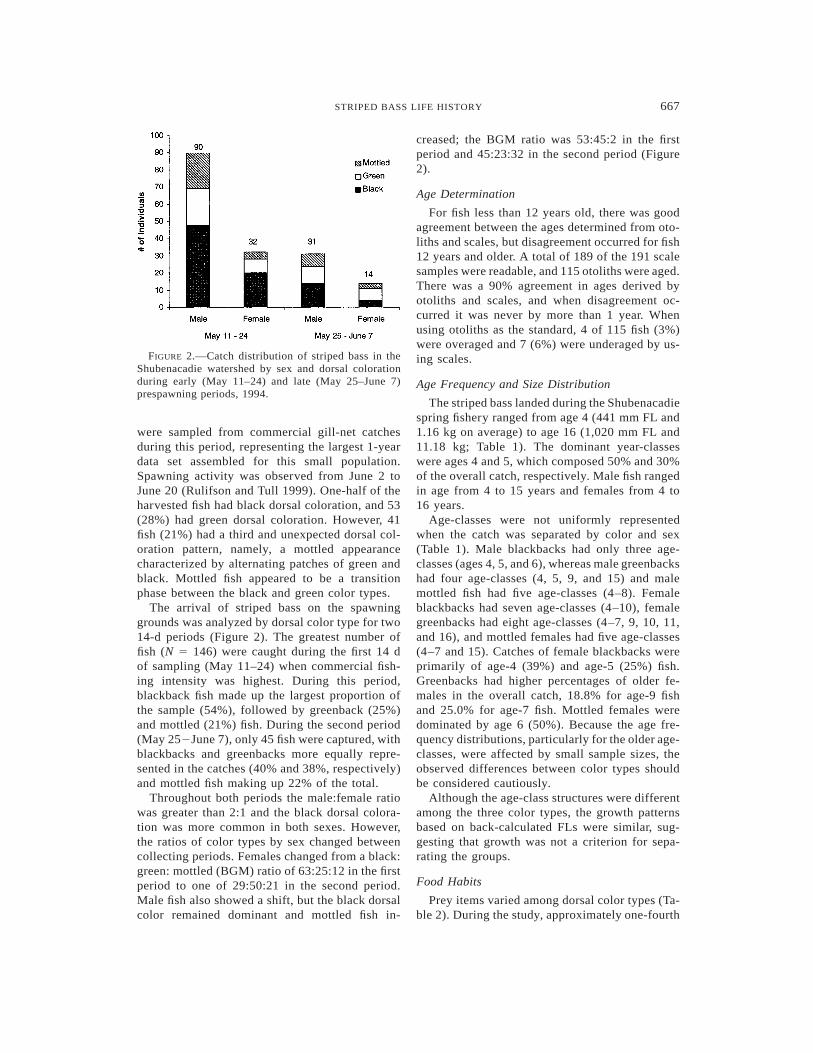
Plots of the 86Sr:48Ca ratios obtained by laserablation versus otolith location (age) showed thatthe patterns of Sr deposition varied between colortypes, therefore indicating long-term separation ofhabitats in this population (Figure 3). While oto-liths show similar 86Sr:48Ca ratios when assayedin the focus and to some extent at age 1, a diver-gence begins thereafter, with greenbacks main-taining a high 86Sr:48Ca ratio relative to black-backs. With the exception of three individuals, allfish exhibited this pattern. One blackback and onegreenback exhibited an intermediate 86Sr:48Ca ra-tio when translucent zones were assayed, and onegreenback apparently switched from a greenbackto a blackback life history pattern at 3.5 years ofage.
The PIXE analysis confirmed these long-termdifferences in habitat between color types, alongwith identifying overwintering locations. ThePIXE microbeam test indicated fluctuating Sr lev-
670 PARAMORE AND RULIFSON
FIGURE 3.—The strontium:calcium (Sr:Ca) ratios ofselected blackback and greenback otoliths determinedby laser ablation. Panel (A) includes opaque and trans-lucent zones (N 5 5), panel (B) only opaque zones (N5 6), and panel (C) only translucent zones (N 5 8).
els in greenbacks associated with anadromous be-havior (Figure 4), while the blackback otoliths ex-hibited a more stable and continuous Sr level in-dicative of long-term freshwater residency (Figure5). The broad-beam PIXE analysis of the convexsurfaces of whole otoliths showed an unexpectedpeak in arsenic in black-colored fish at an X-rayenergy level of approximately 10.5 keV, which wasnot present in fish of green dorsal coloration (Fig-ure 6). Freshwater lakes in Nova Scotia are knownto contain naturally high levels of arsenic (R. Brad-ford, Fisheries and Oceans Canada, personal com-munication), which would be consistent with itsincorporation into the otolith matrices of over-wintering striped bass.
Discussion
One might question whether coloration can beused as a discriminator of population sub-groupssince fish can be observed to change color rapidlyunder stressful conditions. However, we believethat the differences in dorsal coloration patternsobserved in this population represent transient ex-
ternal characteristics that may prevail in individ-uals for months prior to river migration and thenfor days or weeks during the river migration pre-spawning period. Color change in fish species oc-curs in two ways: (1) as a rapid physiological re-sponse caused by rearrangement of the pigmentsin the chromatophore cells and (2) as a slowermorphological change caused by an increase in thenet content of pigment or the number of pigmentcells (Fujii 1969). Both types of color change canoccur simultaneously. Fish kept in darkened tanksfor extended periods typically develop increasesin both the number of melanophores and the mel-anin content of the skin (Odiorne 1957). The pres-ence of the black dorsal coloration type could beexplained by the extended overwintering period inthe darkly stained waters of Shubenacadie GrandLake.
The mottled dorsal coloration pattern was un-expected and probably represents fish that are ac-tively undergoing change in dorsal coloration. Theslower morphological color change process couldexplain the patchy, alternating areas of dark andlight observed on some fish. We speculate that themottled fish were upriver migrants from the oceanbecause their food habits were similar to those ofgreenbacks and their otoliths did not exhibit thearsenic peak characteristic of blackback fish. Howlong this transition period lasts is unknown.
Differences in lipid profiles between the twodorsal color types confirmed long-term habitatseparation prior to capture. Reiser et al. (1963)reported that freshwater and marine fish probablydo not differ basically in their mechanisms fordeposition, synthesis, and interconversion of fattyacids but that there are differences in fatty acidcomposition among groups. Kelly et al. (1958) andStansby (1967) concluded that differences in fattyacid patterns between marine and freshwater fishwere caused by differences in diet. Nettleton(1985) described how the fatty acid content in fishcould be affected by factors such as season, diet,physiological status (i.e., spawning), and geo-graphical habitat. A group of fish experiencing oneset of these factors would produce a particular fattyacid pattern, thus indicating differences in its lifehistory from that of a group experiencing a dif-ferent set of factors. In our study, fish with greendorsal coloration had significantly more 20:5 n-3and less 20:4 n-6 fatty acids than fish with blackdorsal coloration. The fatty acid 20:5 n-3 and otherlong-chained omega-3 fatty acids (e.g., 22:6 n-3)are found in marine phytoplankton and zooplank-ton (Zuier 1985), thus indicating that greenback

671STRIPED BASS LIFE HISTORY
FIGURE 4.—Continuous record of the strontium level in an otolith from a greenback fish (specimen 94160)determined by charged-particle-induced X-ray emission microbeam (photo and plot by J. L. Campbell, Universityof Guelph, and N. M. Halden, University of Manitoba).
fish were consuming a marine-based food web formonths prior to capture. One additional aspect ofthe lipid profiles was noted. The presence of largeamounts of 17:1 in the neutral lipid fraction wasunusual because low levels of 17:1 have been re-ported in cultured (0.6–0.8%) and wild (0.3–0.5%)striped bass (Jahncke et al. 1991). Low levels alsowere reported for several species by Karitarantaand Linko (1984). Other researchers (Eldridge etal. 1983; Chu and Ozkizilcik 1995; Harrell andWoods 1995) have not reported this unusual fattyacid in their studies.
Strontium patterns in the otoliths provided life-time records indicating long-term seasonal habitatseparation of the two dorsal color types after age1. Secor and Rooker (2000) demonstrated patternsof change in the strontium:calcium ratio for youngstriped bass, American shad, and Atlantic sturgeonAcipenser oxyrinchus emigrating from oligohaline
nurseries. Secor et al. (1995) demonstrated a saw-tooth pattern of high and low Sr:Ca ratios with agethat indicated movement between marine and fresh-water habitats for spawning. However, in our study,the plots of the 86Sr:48Ca ratio over time for indi-vidual fish did not produce this sawtooth pattern.Blackback fish did exhibit low 86Sr:48Ca ratios con-sistent with overwintering in the freshwaters ofShubenacadie Grand Lake, while greenback fish ex-hibited high ratios indicating overwintering inocean habitats. Interestingly, the 86Sr:48Ca ratio pat-terns for the spring spawning run and summer pe-riods did not converge to suggest similar habitatoccupancy. Instead, the spring–summer (translu-cent) portions of the otoliths maintained their re-spective high or low 86Sr:48Ca ratios, similar to thatof the overwintering (opaque) regions.
Several different factors may explain this ob-servation. One possibility is continued habitat sep-

672 PARAMORE AND RULIFSON
FIGURE 5.—Continuous record of the strontium level in an otolith from a blackback fish (specimen 94014)determined by charged-particle-induced X-ray emission microbeam (photo and plot by J. L. Campbell, Universityof Guelph, and N. M. Halden, University of Manitoba).
FIGURE 6.—Proton induced X-ray spectra of the outerconvex surface of three striped bass otoliths producedby charged-particle-induced X-ray emission broad-beamanalysis (plot by L. Toburen, East Carolina University).Note the arsenic (As) peak for blackback striped bass atapproximately 10.5 keV, which is not evident for thegreen or mottled color types. The proton energy was 2MeV and the X rays were observed through a 0.5-mmpolyethylene filter to reduce the count rate of low-energyX rays.
aration even during the prespawning period. Whileblackback and greenback fish migrate into thesame areas of the river in the spring to spawn, theymay remain separated because they inhabit dif-ferent salinity regimes. This is quite possible, asthe tidal bore causes salt wedges to form readilyand also provides a low-energy transport mecha-nism by which greenback fish can migrate up-stream. A second possibility is that both colortypes do not spend enough time in similar habitatsto cause a convergence in the corresponding 86Sr:48Ca ratios; fish may be on the spawning groundfor less than 2 weeks before migrating into springand summer feeding grounds. A third possibilityinvolves the mechanics of microchemical analysis;spatial resolution of the laser ablation beam maynot be capable of capturing a sample small enoughand at the precise location required to assay thebrief time window in which the fish are on thespawning grounds. A fourth possibility is that theminimal samples collected by LA-ICPMS were notadequate to show the full life history pattern ofthe fish. Each opaque and translucent zone wasablated only once; multiple ablations in each zonemay have revealed a pattern more fully represen-tative of the fish’s migratory pattern.
Unfortunately, none of these pieces of evi-dence—diet, fatty acids, or otolith microchemis-try—indicate whether these two groups are repro-ductively isolated despite spawning in the same

673STRIPED BASS LIFE HISTORY
region of the river. If both groups interbreed duringspawning, then genetic differences in the progenywould be nonexistent and the morphs would mere-ly represent phenotypic plasticity.
There is evidence to suggest some temporal sep-aration in spawning between the two color types.The ratio of blackback to greenback fish was high-est during the first 2 weeks of the study, whilegreenbacks, particularly females, increased inabundance during the last 2 weeks of sampling.Varying arrival times of striped bass at the spawn-ing ground could be an indication that fish aremigrating in cohorts (with dorsal color a fortuitousbut transient clue), with perhaps a mixing of res-ident or native fish and transients or introgressorsfrom another population. While the color com-position of fish that we landed changed during thestudy, the male:female ratio of 2:1 remained un-changed. This ratio is similar to that found in a1992 study on the same population (Rulifson andDadswell 1995).
Additional studies are needed to more com-pletely understand the multiple life history pat-terns of the Shubenacadie striped bass population.Tagging of striped bass during the spawning runcould provide direct evidence of any differencesin the life histories of blackback and greenbackfish. Tank studies of fish, which would be veryfeasible if this population were selected as brood-stock (Rulifson and Laney 1999), could test theeffects of diet, salinity, and other factors on dorsalcoloration.
The existence of multiple life history patternsin a single river may cause fishery managementagencies to reassess management strategies basedon the generally accepted paradigm of a singlepopulation with one migratory pattern. Furtherstudies may be needed to establish whether thesegroups are genetically distinct and thus require ad-ditional management consideration.
Acknowledgments
We thank the many people who contributed tothis project: R. Meadows, W. H. Stone and family,R. C. Covert, and the commercial fishermen of theStewiacke and Shubenacadie rivers; East CarolinaUniversity (ECU) students K. Tull and W. H. Tar-plee III for field assistance; ECU students R. A.Bass, J. Anglemyer, E. Haire, and K. Antkowiakfor laboratory work; M. Gallagher of ECU for fattyacid analysis; C. S. Manooch III and J. Potts, Na-tional Marine Fisheries Service, Beaufort Labo-ratory, for otolith aging; S. Campana, Bedford In-stitute of Oceanography, for otolith preparation;
Sam Wang, Elemental Research, Inc., North Van-couver, B. C., for LA-ICPMS analysis; J. L. Camp-bell, University of Guelph, and N. M. Halden, Uni-versity of Manitoba, for PIXE microbeam analysis;L. Toburen of ECU for PIXE broadbeam analysis;and C. C. Coutant, R. Peterson, J. Waldman, andan anonymous reviewer for comments that im-proved the manuscript. We also thank B. M. Jessopof the Canadian Department of Fisheries andOceans for his help in obtaining the necessary per-mission to conduct the study. The authors and stu-dents provided funding for this study, with assis-tance from the fishermen and ECU’s Departmentof Biology and Institute for Coastal and MarineResources.
References
Bligh, E. G., and W. J. Dyer. 1959. A rapid method oftotal lipid extraction and purification. CanadianJournal of Biochemistry and Physiology 37:911–917.
Campana, S. E., and J. D. Neilson. 1985. Microstructureof fish otoliths. Canadian Journal of Fisheries andAquatic Sciences 42:1014–1032.
Chu, F. E., and S. Ozkizilcik. 1995. Lipid and fatty acidcomposition of striped bass (Morone saxatilis) lar-vae during development. Comparative Biochemis-try and Physiology. 111B:665–674.
Denoyer, E. R., K. J. Fredeen, and J. W. Hager. 1991.Laser solid sampling for inductively coupled plasmamass spectrometry. Analytical Chemistry 63:445A–457A.
Eldridge, M. B., J. D. Joseph, and K. M. Taberski. 1983.Lipid and fatty acid composition of the endogenousenergy sources of striped bass (Morone saxatilis)eggs. Lipids 18:510–513.
EPA (U.S. Environmental Protection Agency). 1979.Methods for chemical analysis of water and wastes.EPA, EPA-600/4-79-020, Washington, D.C.
Fujii, R. 1969. Chromatophores and pigments. Pages3072344 in W. S. Hoar and D. J. Randall, editors.Fish physiology, volume III. Academic Press, NewYork.
Gallagher, M. L., M. L. Harrell, and R. A. Rulifson.1991. Variation in lipid and fatty acid contents ofAtlantic croakers, striped mullet, and summer floun-der. Transactions of the American Fisheries Society120:614–619.
Gallagher, M. L., E. Kane, and R. Beringer. 1984. Effectof size on composition of the American eel, Anguillarostrata. Comparative Biochemistry and Physiolo-gy 78A:533–536.
Gallagher, M. L., S. H. McLeod, and R. A. Rulifson.1989. Seasonal variations in fatty acids of stripedbass, Morone saxatilis. Journal of the World Aqua-culture Society 20:38–45.
Gunn, J. S., J. R. Harrowfield, C. H. Proctor, and R. E.Thresher. 1992. Electron microprobe analysis offish otoliths: evaluation of techniques for studying

674 PARAMORE AND RULIFSON
age and stock discrimination. Journal of Experi-mental Marine Biology and Ecology 158:1–36.
Hall, G. E. M. 1992. Inductively coupled plasma massspectrometry in geoanalysis. Journal of Geochem-ical Exploration 44:201–249.
Harrell, R. M., and L. C. Woods. 1995. Comparativefatty acid composition of eggs from domesticatedand wild striped bass (Morone saxatilis). Aquacul-ture 133:225–233.
Jahncke, M. L., T. I. J. Smith, and G. T. Seaborn. 1991.Marine forensics program: a biochemical method todistinguish wild from cultured fish. NOAA (Na-tional Oceanic and Atmospheric Administration)Technical Memorandum NMFS-SEFSC-227, Wash-ington, D.C.
Jessop, B. M. 1995. Update on striped bass stock statusin Scotia–Fundy region and proposal for stock man-agement. DFO (Department of Fisheries andOceans) Atlantic Fisheries Research Document95/8.
Johansson, S. A. E., J. L. Campbell, and K. G. Malmqv-ist. 1995. Particle-induced x-ray emission spec-trometry (PIXE). John Wiley and Sons, New York.
Karitaranta, J. K., and R. R. Linko. 1984. Fatty acidsin the roe lipid of common food fishes. ComparativeBiochemistry and Physiology 79B:331–334.
Kelly, P. B., R. Reiser, and D. W. Hood. 1958. The effectof diet on the fatty acid composition of several spe-cies of freshwater fish. Journal of the American OilChemical Society 35:503–505.
Lynch, D. K. 1982. Tidal bores. Scientific American247(4):146–157.
Matheson, R. H. III. 1981. Age, growth, and mortalityof two groupers, Epinephelus drummondhavi (Va-lenciennes), from North Carolina and South Caro-lina. Master’s thesis, North Carolina State Univer-sity, Raleigh.
Nettleton, J. 1985. Seafood nutrition: facts, issues, andmarketing of nutrition in fish and shellfish. OspreyBooks, Huntington, New York.
Odiorne, J. M. 1957. Color changes. Pages 3872401 inM. E. Brown, editor. The physiology of fishes, 2.Academic Press, New York.
Peterson, R. H., editor. 1991. Proceedings of a work-shop on biology and culture of striped bass (Moronesaxatilis). Canadian Technical Report of Fisheriesand Aquatic Sciences 1832.
Radtke, R. L., and D. J. Shafer. 1992. Environmentalsensitivity of fish otolith microchemistry. Austra-lian Journal of Marine and Freshwater Research 43:935–951.
Reiser, R., B. Stevenson, M. Kayama, R. B. R. Choud-
hury, and D. W. Hood. 1963. The influence of di-etary fatty acid and environmental temperature onthe fatty acid composition of teleost fish. Journal ofthe American Oil Chemical Society 40:507–513.
Robichaud-LeBlanc, K. A., S. C. Courtenay, and A.Locke. 1996. Spawning and early life history of anorthern population of striped bass (Morone saxa-tilis): Miramichi River estuary, Gulf of St.Lawrence. Canadian Journal of Zoology 74:1645–1655.
Rulifson, R. A., and M. J. Dadswell. 1995. Life historyand population characteristics of striped bass in At-lantic Canada. Transactions of the American Fish-eries Society 124:477–507.
Rulifson, R. A., and R. W. Laney. 1999. Striped bassstocking programs in the United States: ecologicaland resource management issues. Fisheries andOceans Canada, Canadian Stock Assessment Sec-retariat Research Document 99/007, Ottawa.
Rulifson, R. A., and K. A. Tull. 1999. Striped bassspawning in a tidal bore river: the Shubenacadieestuary, Atlantic Canada. Transactions of the Amer-ican Fisheries Society 128:613–624.
Secor, D. H., and J. R. Rooker. 2000. Is otolith strontiuma useful scalar of life cyles in estuarine fishes? Fish-eries Research 46:359–371.
Secor, D. H., A. Henderson-Arzapalo, and D. M. Piccoli.1995. Can otolith microchemistry chart patterns ofmigration and habitat utilization in anadromousfishes? Journal of Experimental Marine and Bio-logical Ecology 192:15–33.
Secor, D. H., J. M. Dean, and S. E. Campana, editors.1994. Recent developments in fish otolith research.University of South Carolina Press, Columbia.
Setzler, E. M., W. R. Boynton, K. V. Wood, H. H. Zion,L. Lubbers, N. K. Mountford, P. Frere, L. Tucker,and J. A. Mihursky. 1980. Synopsis of biologicaldata on striped bass, Morone saxatilis (Walbaum).NOAA (National Oceanic and Atmospheric Ad-ministration) Technical Report NMFS Circular 433,Washington, D.C.
Shubenacadie-Stewiacke River Basin Board. 1981.Nova Scotia Department of the Environment, FinalReport, Halifax.
Stansby, M. E. 1967. Fatty acid patterns in marine,freshwater, and anadromous fish. Journal of theAmerican Oil Chemists’ Society 44:64.
Tull, K. A. 1997. Spawning activity of striped bass ina tidal bore river: the Shubenacadie-Stewiacke sys-tem, Nova Scotia. Master’s thesis. East CarolinaUniversity, Greenville, North Carolina.
Zuier, R. B. 1985. Dietary fatty acids and their effectson arthritis. Medical Times 329.
Copyright © 2022 FDOKUMEN