Does tree species composition control soil organic carbon pools in Mediterranean mountain forests?
10
Forest Ecology and Management 262 (2011) 1895–1904 Contents lists available at ScienceDirect Forest Ecology and Management journal homepage: www.elsevier.com/locate/foreco Does tree species composition control soil organic carbon pools in Mediterranean mountain forests? Eugenio Díaz-Pinés a,∗ , Agustín Rubio a , Helga Van Miegroet b , Fernando Montes c , Marta Benito d a Department of Silviculture and Pasciculture, Polytechnic University of Madrid, Ciudad Universitaria s/n, E-28040, Madrid, Spain b Department of Wildland Resources, Utah State University, Logan, UT 84322-5230, USA c Departamento de Selvicultura y Gestión Forestal, CIFOR-INIA, E-28040 Madrid, Spain d Department of Soils, Polytechnic University of Madrid, E-28040 Madrid, Spain article info Article history: Received 30 October 2010 Received in revised form 2 February 2011 Accepted 5 February 2011 Available online 8 March 2011 Keywords: Mediterranean mountain Soil organic carbon Soil organic matter size-fractionation Pinus sylvestris Quercus pyrenaica Ecotone abstract We compared soil organic carbon (SOC) stocks and stability under two widely distributed tree species in the Mediterranean region: Scots pine (Pinus sylvestris L.) and Pyrenean oak (Quercus pyrenaica Willd.) at their ecotone. We hypothesised that soils under Scots pine store more SOC and that tree species composition controls the amount and biochemical composition of organic matter inputs, but does not influence physico-chemical stabilization of SOC. At three locations in Central Spain, we assessed SOC stocks in the forest floor and down to 50 cm in the mineral in pure and mixed stands of Pyrenean oak and Scots pine, as well as litterfall inputs over approximately 3 years at two sites. The relative SOC stability in the topsoil (0–10 cm) was determined through size-fractionation (53 m) into mineral-associated and particulate organic matter and through KMnO 4 -reactive C and soil C:N ratio. Scots pine soils stored 95–140 Mg ha −1 of C (forest floor plus 50 cm mineral soil), roughly the double than Pyrenean oak soils (40–80 Mg ha −1 of C), with stocks closely correlated to litterfall rates. Differences were most pronounced in the forest floor and uppermost 10 cm of the mineral soil, but remained evident in the deeper layers. Biochemical indicators of soil organic matter suggested that biochemical recalci- trance of soil organic matter was higher under pine than under oak, contributing as well to a greater SOC storage under pine. Differences in SOC stocks between tree species were mainly due to the particulate organic matter (not associated to mineral particles). Forest conversion from Pyrenean oak to Scots pine may contribute to enhance soil C sequestration, but only in form of mineral-unprotected soil organic matter. © 2011 Elsevier B.V. All rights reserved. 1. Introduction Carbon (C) enters the soil through both litterfall and rhizode- position and leaves the soil mainly as CO 2 via root and microbial respiration. During the latter process, soil organic matter (SOM) undergoes decomposition, resulting in changes in composition and release of products with different degrees of stability in the soil. Thus, the accumulation of C in the soil is strongly influenced by biological factors, such as vegetation (e.g. Binkley and Giardina, 1998; Quideau et al., 2001; Vesterdal et al., 2008) which control the amount, quality and distribution of litter fall and associated microbial communities which decompose these inputs (Ekschmitt et al., 2008); and by abiotic factors, such as site climate, soil type, texture, mineralogy and chemistry (Amelung et al., 1998; Callesen et al., 2003; Homann et al., 2007; Zinn et al., 2007). ∗ Corresponding author. Tel.: +34 913366377; fax: +34 913365556. E-mail address: [email protected] (E. Díaz-Pinés). Many of these factors are strongly interconnected, with vegeta- tion playing a pivotal role in soil processes, including the cycling and storage of C. Global change can affect tree species distribution by altering site temperature, precipitation regime and nitrogen (N) availability (Giardina et al., 2005); for example, drought-induced oak expansion at the expense of Scots pine (Pinus sylvestris L.) has already been observed in the Pyrenees (Galiano et al., 2010). In addition, forest management can also directly alter forest compo- sition. Forest management is now an accepted tool for mitigating increasing atmospheric CO 2 in national greenhouse gas budgets (Vesterdal et al., 2008) as it can optimise C sequestration and its stability (Jandl et al., 2007). Tree species manipulation is partic- ularly relevant for ecotonal zones, where the same location may be occupied by different forest types. Thus, management measures may promote the development of a particular forest type based on its C storage capacity, among other criteria. While quantitative estimates of tree species effects on soil organic C (SOC) stocks remain scarce, even less is known about direct species effect on the stability of SOC. SOC can be stabilised 0378-1127/$ – see front matter © 2011 Elsevier B.V. All rights reserved. doi:10.1016/j.foreco.2011.02.004
-
Upload
independent -
Category
Documents
-
view
4 -
download
0
Transcript of Does tree species composition control soil organic carbon pools in Mediterranean mountain forests?

Dm
Ea
b
c
d
a
ARRAA
KMSSPQE
1
prurTb1tmete
0d
Forest Ecology and Management 262 (2011) 1895–1904
Contents lists available at ScienceDirect
Forest Ecology and Management
journa l homepage: www.e lsev ier .com/ locate / foreco
oes tree species composition control soil organic carbon pools in Mediterraneanountain forests?
ugenio Díaz-Pinésa,∗, Agustín Rubioa, Helga Van Miegroetb, Fernando Montesc, Marta Benitod
Department of Silviculture and Pasciculture, Polytechnic University of Madrid, Ciudad Universitaria s/n, E-28040, Madrid, SpainDepartment of Wildland Resources, Utah State University, Logan, UT 84322-5230, USADepartamento de Selvicultura y Gestión Forestal, CIFOR-INIA, E-28040 Madrid, SpainDepartment of Soils, Polytechnic University of Madrid, E-28040 Madrid, Spain
r t i c l e i n f o
rticle history:eceived 30 October 2010eceived in revised form 2 February 2011ccepted 5 February 2011vailable online 8 March 2011
eywords:editerranean mountain
oil organic carbonoil organic matter size-fractionationinus sylvestrisuercus pyrenaicacotone
a b s t r a c t
We compared soil organic carbon (SOC) stocks and stability under two widely distributed tree speciesin the Mediterranean region: Scots pine (Pinus sylvestris L.) and Pyrenean oak (Quercus pyrenaica Willd.)at their ecotone. We hypothesised that soils under Scots pine store more SOC and that tree speciescomposition controls the amount and biochemical composition of organic matter inputs, but does notinfluence physico-chemical stabilization of SOC. At three locations in Central Spain, we assessed SOCstocks in the forest floor and down to 50 cm in the mineral in pure and mixed stands of Pyrenean oak andScots pine, as well as litterfall inputs over approximately 3 years at two sites. The relative SOC stability inthe topsoil (0–10 cm) was determined through size-fractionation (53 �m) into mineral-associated andparticulate organic matter and through KMnO4-reactive C and soil C:N ratio.
Scots pine soils stored 95–140 Mg ha−1 of C (forest floor plus 50 cm mineral soil), roughly the doublethan Pyrenean oak soils (40–80 Mg ha−1 of C), with stocks closely correlated to litterfall rates. Differenceswere most pronounced in the forest floor and uppermost 10 cm of the mineral soil, but remained evident
in the deeper layers. Biochemical indicators of soil organic matter suggested that biochemical recalci-trance of soil organic matter was higher under pine than under oak, contributing as well to a greater SOCstorage under pine. Differences in SOC stocks between tree species were mainly due to the particulateorganic matter (not associated to mineral particles). Forest conversion from Pyrenean oak to Scots pinemay contribute to enhance soil C sequestration, but only in form of mineral-unprotected soil organicmatter.. Introduction
Carbon (C) enters the soil through both litterfall and rhizode-osition and leaves the soil mainly as CO2 via root and microbialespiration. During the latter process, soil organic matter (SOM)ndergoes decomposition, resulting in changes in composition andelease of products with different degrees of stability in the soil.hus, the accumulation of C in the soil is strongly influenced byiological factors, such as vegetation (e.g. Binkley and Giardina,998; Quideau et al., 2001; Vesterdal et al., 2008) which controlhe amount, quality and distribution of litter fall and associated
icrobial communities which decompose these inputs (Ekschmitt
t al., 2008); and by abiotic factors, such as site climate, soil type,exture, mineralogy and chemistry (Amelung et al., 1998; Callesent al., 2003; Homann et al., 2007; Zinn et al., 2007).∗ Corresponding author. Tel.: +34 913366377; fax: +34 913365556.E-mail address: [email protected] (E. Díaz-Pinés).
378-1127/$ – see front matter © 2011 Elsevier B.V. All rights reserved.oi:10.1016/j.foreco.2011.02.004
© 2011 Elsevier B.V. All rights reserved.
Many of these factors are strongly interconnected, with vegeta-tion playing a pivotal role in soil processes, including the cyclingand storage of C. Global change can affect tree species distributionby altering site temperature, precipitation regime and nitrogen (N)availability (Giardina et al., 2005); for example, drought-inducedoak expansion at the expense of Scots pine (Pinus sylvestris L.) hasalready been observed in the Pyrenees (Galiano et al., 2010). Inaddition, forest management can also directly alter forest compo-sition. Forest management is now an accepted tool for mitigatingincreasing atmospheric CO2 in national greenhouse gas budgets(Vesterdal et al., 2008) as it can optimise C sequestration and itsstability (Jandl et al., 2007). Tree species manipulation is partic-ularly relevant for ecotonal zones, where the same location maybe occupied by different forest types. Thus, management measuresmay promote the development of a particular forest type based on
its C storage capacity, among other criteria.While quantitative estimates of tree species effects on soilorganic C (SOC) stocks remain scarce, even less is known aboutdirect species effect on the stability of SOC. SOC can be stabilised

1 and M
i(crmcpil1
tmo22n(aHsdtsacaml
deombiE2s
ndqsCnwtnscOmdtdpc
2
2
t
896 E. Díaz-Pinés et al. / Forest Ecology
n the soil through biochemical and physico-chemical mechanismsvon Lützow et al., 2007). Intrinsic biochemical differences in SOComposition influence microbial palatability and decompositionates, with less complex, labile SOC decomposing more easily thanore complex, recalcitrant SOC compounds. Inputs of labile SOC
an further accelerate turnover of existing SOC through positiveriming effect (Kuzyakov et al., 2000). This concept of SOC quality,
n terms of biochemical recalcitrance/lability, has been the mainine of study into SOC stability over the last decades (e.g. Kononova,966).
On the other hand, SOC, irrespective of its chemical recalci-rance, may become stabilised through protection within the soil
ineral matrix, either by physical occlusion within aggregatesr chemical adsorption to mineral particles (e.g. Jastrow et al.,007; Marschner et al., 2008; Six et al., 2002; von Lützow et al.,007). Although less widely studied, these stabilisation mecha-isms may be equal if not more important to long-term SOC storageCambardella and Elliot, 1992; Chan, 2001; Gregorich et al., 2006)nd are generally thought to be influenced more by soil properties.owever, inter-relationships between soil type and species compo-
ition (Ladegaard-Pedersen et al., 2005) may obscure the primaryrivers of SOC stability. Oyonarte et al. (2008) for example, notedhat in Mediterranean mountain environments, physico-chemicaloil properties are influenced by lithology, while intrinsic SOC char-cteristics are more plant-dependent. Therefore, it is important toonsider the influence of tree species composition on the stor-ge and stability of SOC at a given site, as it may inform forestanagement towards for practices that increase the quantity and
ong-term stability of the SOC stocks.There currently are multiple SOC fractionation schemes that
iffer in approach, mechanistic underpinnings and complexity ofxecution (von Lützow et al., 2007). Among those disparate meth-ds, physical SOM fractionation into mineral-associated organicatter (MaOM) and particulate organic matter (POM, thought to
e more responsive to soil management) is becoming an increas-ngly popular method to evaluate SOM stability (Cambardella andlliot, 1992; Chan, 2001; Marschner et al., 2008; Skjemstad et al.,006), although it is more widely used in agricultural and pastureystems than in forest soils (Gregorich et al., 2006).
In Central Spain, Scots pine and Pyrenean oak (Quercus pyre-aica Willd.) cover million of hectares, including areas were speciesistributions overlap. The effect of these forest species and conse-uences of tree species distribution shifts on SOC dynamics andtorage are not well known. Such data could prove very useful inaccounting, especially in quantifying SOC stocks changes due to
atural or anthropogenically driven vegetation shifts. Our objectiveas to assess SOC sequestration capacities under two widespread
ree species in Mediterranean ecosystems – Scots pine and Pyre-ean oak – in their ecotonal areas; as well as to estimate thetability of SOC stored under each tree species, using biochemi-al and physico-chemical approaches to characterize SOC stability.ur first working hypothesis was that soils under Scots pine containore SOC than those under Pyrenean oak (based on preliminary
ata). We also hypothesised that tree species composition controlshe inputs and biochemical characteristics of SOC, whereas site con-itions such as parent material and soil control physico-chemicalrotection, and thus stability, of SOC, irrespective of vegetationover.
. Materials and methods
.1. Study site
In the Sistema Central (Central Spain), we looked for represen-ative ecotonal areas between Scots pine forest types and Pyrenean
anagement 262 (2011) 1895–1904
oak forest types (hereafter, pine and oak, respectively). The SistemaCentral hosts Scots pine at the southern and most western edge ofits world distribution range (Ruiz de la Torre, 2006). Pyrenean oak isan endemic marcescent oak from the Iberian Peninsula (EuropeanEnvironmental Agency, 2006), where it is widely distributed acrossits acidic western part. Pyrenean oak has intermediate characteris-tics between ‘more Eurosiberian’ oaks (Quercus robur L. and Quercuspetraea L.) and ‘sclerophyllous Mediterranean’ oaks (Quercus ilexL. and Quercus suber L). Intensive land use over the last centurieshas strongly changed the natural contact areas between both treespecies.
Three locations were used for establishment of the experimen-tal plots: from West to East, Hoyocasero, in the northern foothillsof Gredos range; Valsaín and Rascafría in the northern and middlearea of Guadarrama range, respectively (Fig. 1). Within the ecotonesof Scots pine and Pyrenean oak, we set up three circular plots (25 mdiameter) at each location, for a total of nine plots: three pure Scotspine forest ecosystems; three mixed Scots pine–Pyrenean oak for-est ecosystems; and three pure Pyrenean oak forest ecosystems.Selected site characteristics are summarized in Table 1.
The entire study area is characterized by a Mediterraneanclimate, with about two-months summer drought, and hightemperature fluctuations throughout the year (Table 1). Parentmaterials are granites and gneisses. Soils are Cambisols and Luvi-sols (FAO, 2006). General soil chemical and physical parameters areshown in Table 2.
2.2. Sampling
Seven galvanised steel funnel litterfall-collectors (1 m height,80 cm diameter) per plot were randomly placed in Valsaín (October2005) and Rascafría (March 2006). Litterfall was collected period-ically, and collection stopped in October 2008. Due to logisticalreasons, litterfall was not collected in Hoyocasero.
In early autumn, forest floor and mineral soil were sampled (fivecomposite sampling points per plot). All litter down to the mineralsoil was taken from a square of 20 cm × 20 cm and transported tothe lab shortly after sampling. At each sampling point, the mineralsoil was sampled into five different layers: 0–5, 5–10, 10–20, 20–30and 30–50 cm depth. In addition, soil cores (5 cm height, 5 cm diam-eter) were taken for bulk density estimation (three cores per pointand layer). Stone content was estimated on the field for each layer.
2.3. Laboratory analyses
Litterfall was transported to the lab and dried to constant weightafter each sampling event. Litterfall was manually separated intodifferent fractions: needles, leaves, branches, bark and other parts,according to different species-origin, and C concentrations for eachfraction were determined by means of a Total Organic Carbonanalyser (TOC-5000, Shimadzu Corporation, Kyoto, Japan) equippedwith a solid sample module (SSM-5000, Shimadzu Corporation). Anannual litterfall C rate (Mg ha−1 year−1) was obtained through inte-gration of periodic litterfall values. Based on visual observationsand previous experience, it was assumed that no decompositionoccurred between litter-fall and sampling.
Forest floor and mineral soil samples were air dried and subse-quently sieved (2 mm), homogenised and ground prior to organic Canalysis with a Total Organic Carbon analyser as described above.SOC stocks (Mg ha−1) were calculated based on C concentration,soil bulk density, fine earth content, stone content, and depth ofeach layer, following IPCC recommendations (Aalde et al., 2006).
Total N was obtained by the Kjeldahl method, which converts totalN to NH4+-N followed by determination of NH4+-N in the distillate
by titration (SM 702 Titrino, Metrohm AG, Herisau, Switzerland)(Kandeler, 1995).

E. Díaz-Pinés et al. / Forest Ecology and Management 262 (2011) 1895–1904 1897
f the t
2
tBspwgCbaCeCPdtru
2C
i
TG
PQ
Fig. 1. Location o
.3.1. Particulate and mineral-associated organic carbonTo determine mineral-associated and particulate SOC, we used
he size-fractionation method as per Cambardella and Elliot (1992).riefly, we dispersed 10 g soil subsamples with 30 ml of 5 g l−1
odium polyphosphate –(NaPO3)n– by shaking overnight. The dis-ersed samples were passed through a 53 �m-mesh sieve, rinsingith abundant water. Both fractions were dried overnight at 60 ◦C,
round and analysed for total C content, designated as MaOM-(<53 �m) and POM-C (>53 �m). Likewise, we determined N in
oth fractions (MaOM-N and POM-N). Mass recovery after the sep-ration was more than 99%, and C loss was less than 5% of total(data not shown), with no differential losses across the differ-
nt vegetation types and/or soil depth. To compare the relativecontribution of each fraction to SOC, the ratio of MaOM-C (or
OM-C) to total SOC (Christensen, 2001) was calculated, furtheresignated as MaOM-C:SOC (or POM-C:SOC). Because fractiona-ion is rather time-consuming and labour-intensive, our limitedesources allowed us to perform SOM fractionation on the first twopper layers of the mineral soil only.
.3.2. Potassium permanganate reactive carbon (KMnO4-reactive)
KMnO4-reactive C has been used by several researchers as anndex of labile C because of its sensitivity to management effects
able 1eneral and silvicultural characteristics of the study plots.
Site Plot Elevation(m.a.s.l.)
Mean precip(mm)
Mean temp(◦C)
Hoyocasero Oak 1278 1068 10.2Mixed 1274 1068 10.2Pine 1318 1071 9.9
Rascafría Oak 1265 889 9.7Mixed 1309 920 9.4Pine 1349 948 9.1
Valsaín Oak 1367 855 8.6Mixed 1318 801 8.9Pine 1323 806 8.9
recipitation and temperature based on Sánchez Palomares et al. (1999).p = Quercus pyrenaica; Ps = Pinus sylvestris.
hree study sites.
(Weil et al., 2003). We followed the method developed by Weilet al. (2003) with some modifications: 1–5 g sieved soil samplewas mixed with 20 ml of 0.02 M KMnO4 and 0.10 M CaCl2 andshaken. After 1 h, samples were centrifuged and absorbance at550 nm (Spectrophotometer UV-1203; Shimadzu Corporation) in a0.5 ml dissolution aliquot was used to determine the remainingKMnO4. KMnO4-reactive C was estimated by subtracting remain-ing KMnO4 from initial concentration. The method was applied tothe two upper mineral soil layers only.
2.4. Statistical analyses
Our experiment was a nested block design, with site loca-tion acting as blocks and vegetation as fixed effects. Differencesin forest floor and mineral soil parameters across vegeta-tion types were determined through analyses of variance andsubsequent Tukey honest significant differences post-hoc testswhen the homogeneity of variances was confirmed by Levenetest. When homocedasticity was not achieved, non-parametricMann–Whitney test was performed. Differences in the litterfall
rates between tree species were evaluated through a repeated mea-sures ANOVA. Correlations between litterfall-C rates and SOC stocksin different soil compartments were performed through Pearson’and Spearman’ correlations. Significance level used for all tests wasBasal area, Qp(m2 ha−1)
Basal area, Ps(m2 ha−1)
Trees, Qp(ha−1)
Trees, Psha−1
15.7 0 331 05.0 31.7 255 1680 30.8 0 178
13.3 0 1553 08.6 33.2 810 4020 52.2 0 820
17.2 0 932 04.4 26.2 331 1320 64.3 0 718

1898 E. Díaz-Pinés et al. / Forest Ecology and Management 262 (2011) 1895–1904
Table 2Main physical and chemical parameters of the mineral soil at the different sites. Clay, silt and sand following USDA.
Site Plot Depth(cm)
Bulkdensity(g cm−3)
Clay (g kg−1
fine soil)Silt (g kg−1
fine soil)Sand(g kg−1 finesoil)
Fine(<6 mm)gravels(g kg−1 soil)
Coarse(>6 mm)gravels(g kg−1 soil)
pH(H2O)
pH(KCl)
Conductivity(�S cm−1)
Hoyocasero Oak 0–5 0.94 140 270 590 250 182 6.3 5.1 1205–10 1.14 140 250 610 270 185 5.7 4.5 58
10–20 0.95 90 280 630 196 58 5.7 4.5 5020–30 0.91 60 280 660 210 97 5.7 4.4 3330–50 1.01 60 180 760 209 37 5.8 4.1 20
Mixed 0–5 0.62 160 260 580 210 98 5.9 4.8 1115–10 0.99 160 260 580 284 85 5.8 4.6 76
10–20 0.92 80 360 560 223 32 5.6 4.4 6720–30 0.97 60 370 570 230 30 5.7 4.5 4630–50 1.07 80 310 610 238 15 5.9 4.3 30
Pine 0–5 0.53 120 170 710 215 106 5.4 4.4 895–10 0.93 120 150 730 254 158 5.7 4.5 65
10–20 0.84 50 320 630 180 55 5.8 4.7 7020–30 0.91 50 270 680 212 53 5.9 4.8 5730–50 1.04 60 220 720 213 57 6.1 4.8 37
Rascafría Oak 0–5 0.73 90 130 780 120 458 5.7 4.5 625–10 0.80 150 270 580 140 416 5.4 3.9 39
10–20 0.82 50 350 600 71 350 5.4 4.3 8020–30 0.87 80 300 620 96 367 5.4 4.2 3730–50 1.01 90 310 600 101 370 5.2 4.1 37
Mixed 0–5 0.72 80 140 780 180 177 5.3 4.2 905–10 1.04 120 260 620 208 179 5.5 4.2 64
10–20 0.96 80 320 600 133 181 5.7 4.7 7020–30 0.97 70 330 600 154 166 5.6 4.4 6330–50 1.07 60 300 640 145 164 5.7 4.3 40
Pine 0–5 0.68 60 120 820 127 182 5.4 4.2 705–10 1.18 120 240 640 189 303 5.6 4.3 57
10–20 1.19 90 310 600 180 371 5.3 4.0 5020–30 1.26 120 270 610 185 412 5.2 3.9 4330–50 1.21 100 260 640 170 472 5.5 5.5 60
Valsaín Oak 0–5 1.15 40 430 530 184 190 6.1 5.1 895–10 1.33 40 450 510 175 224 5.9 4.8 64
10–20 1.18 120 270 610 162 174 5.3 3.8 2720–30 1.13 100 280 620 172 158 5.4 3.8 3030–50 1.19 100 260 640 158 249 5.5 3.6 20
Mixed 0–5 0.73 150 270 580 182 58 5.7 4.7 985–10 1.07 120 290 590 189 121 5.6 4.5 60
10–20 0.98 130 270 600 130 170 5.4 4.2 5720–30 1.00 130 280 590 171 143 5.4 4.1 4730–50 1.00 120 250 630 172 167 5.5 4.1 33
Pine 0–5 0.68 100 320 580 155 118 5.2 4.3 945–10 0.99 120 280 590 151 113 5.4 4.2 57
566
˛(
3
3
a62bscssp
10–20 1.00 140 27020–30 1.01 140 26030–50 1.10 100 240
= 0.05. All statistical analyses were performed with Statistica 6.0Statsoft Inc, Tulsa, U.S.A.).
. Results
.1. Main soil parameters
The soils at the study sites were sandy, with a sand contentround 600 g kg−1 fine soil. Content of clay was usually about0–140 g kg−1 fine soil; silt content ranged between 200 and50 g kg−1 (Table 2). No differences in soil texture were foundetween Hoyocasero and Rascafría or between Rascafría and Val-aín, except for the 10–20 cm soil layer which had higher clay
ontent in Valsaín (p = 0.02). Below 10 cm soil depth, there werelight textural differences between the Valsaín and Hoyocaseroite, with slightly higher clay contents at Valsaín (10–20 cm layer,= 0.02; 20–30 cm layer, p = 0.01; 30–50 cm layer, p = 0.04). Fine and90 128 158 5.2 4.0 4300 148 159 5.4 4.0 3760 174 165 5.5 3.9 30
coarse gravels represented a large portion of total soil dry mass, atleast 25% in all cases. At the Rascafría site, soils under oak and pineforest contained more coarse materials, which contributed up to40–45% in these two plots (Table 2).
pH was slightly higher in the uppermost layer of the mineralsoil in the oak plots, as compared to the pine ones (p = 0.04). Therewere no significant differences in pH of the mineral soil below5 cm depth. We did not find important differences in conductiv-ity between sites or between vegetation types within each site(Table 2).
3.2. Soil organic carbon and nitrogen
Carbon concentrations decreased with increasing depth of the
mineral soil (Table 3), and were significantly higher under pinethan under oak only for the first 5 cm of the mineral soil (p < 0.001).Carbon concentrations in the mixed forests always showed inter-mediate values between pine and oak.
E. Díaz-Pinés et al. / Forest Ecology and Management 262 (2011) 1895–1904 1899
Table 3Summary of SOC concentration, soil N concentration and stocks and soil C:N ratio across plots.
Site Depth (cm) SOC concentration (g kg−1
fine soil)Soil N concentration(g kg−1 fine soil)
Soil N stocks (Mg ha−1) Soil C:N ratio
Oak Mixed Pine Oak Mixed Pine Oak Mixed Pine Oak Mixed Pine
Hoyocasero 0–5 55.6 97.8 184.2 3.1 5.3 7.8 0.84 1.11 1.33 18.1 18.3 23.05–10 34.9 64.6 72.1 1.9 3.8 3.5 0.61 1.20 0.96 18.6 16.9 20.6
10–20 29.0 41.3 55.3 2.2 2.8 3.1 1.53 1.90 2.02 14.7 14.9 17.620–30 22.6 28.1 38.9 1.7 2.0 2.4 1.08 1.41 1.59 13.9 14.2 16.130–50 6.7 8.3 14.2 0.8 0.9 1.1 1.15 1.41 1.69 9.0 9.0 12.7
Rascafría 0–5 104.5 105.0 159.5 5.8 4.3 6.4 0.89 0.96 1.48 17.7 23.9 24.25–10 75.6 45.0 35.4 4.5 2.2 2.0 0.88 0.64 0.59 16.6 20.6 17.6
10–20 61.5 42.6 35.3 4.2 2.5 1.9 1.50 1.64 0.96 15.5 17.3 18.020–30 25.6 22.2 22.0 1.5 1.5 1.7 0.40 0.93 0.83 15.5 16.8 13.030–50 10.7 12.5 17.9 0.8 0.9 1.3 0.54 1.21 0.98 14.4 13.1 15.3
Valsaín 0–5 39.3 73.5 127.9 3.0 4.3 5.0 1.08 1.20 1.12 13.1 17.1 24.55–10 17.8 44.2 54.6 1.5 3.3 2.9 0.60 1.21 1.04 11.6 13.5 19.6
10–20 10.5 24.0 24.3 1.3 2.220–30 7.7 19.8 20.7 0.9 2.030–50 3.6 18.0 14.2 0.6 1.7
Table 4Summary of ANOVA and Tukey HSD test results on SOC stocks (Mg ha−1) in thedifferent soil layers.
Soil layer Site effect Vegetation effect
Forest floor R > H = V (p < 0.0001) pine > mixed = oak (p < 0.0001)0–5 cm n.s. (p = 0.61) pine > mixed = oak (p < 0.0001)5–10 cm R = V > H (p = 0.001) pine = mixed > oak (p < 0.0001)10–20 cm H > R > V (p < 0.0001) pine = mixed > oak (p = 0.006)20–30 cm H > R = V (p < 0.0001) pine = mixed > oak (p = 0.0003)30–50 cm n.s. (p = 0.14) pine = mixed > oak (p < 0.0001)
H
tfltm
Ff
0–50 cm H > R > V (p < 0.0001) pine = mixed > oak (p < 0.0001)Forest floor + 0–50 cm H = R > V (p < 0.0001) pine > mixed > oak (p < 0.0001)
: Hoyocasero site; R: Rascafría site; V: Valsaín site.
The amount of C stored in the forest floor was higher under pine
han under oak and mixed plots (Table 4): the increase of forestoor C stocks from oak to pine forests ranged from 5 (Hoyocasero)o 15 Mg ha−1 of C (Rascafría), with mixed stands showing inter-ediate values in all sites that were statistically different from
ig. 2. Soil organic carbon stocks for each site and vegetation type. The following abbrevor Quercus pyrenaica, ‘M’ for mixed forests and ‘P’ for Pinus sylvestris.
2.0 1.00 1.43 1.15 8.7 10.7 12.01.8 0.69 1.12 0.91 8.4 10.2 11.41.3 0.80 1.53 1.17 6.1 10.4 10.6
pine but not from oak forests (Fig. 2, Table 4). Total SOC stocks inthe mineral soil (0–50 cm) ranged between 40 and 75 Mg ha−1 of Cunder oak forests, and between 83 and 130 Mg ha−1 of C under pineforests. Mean SOC stock values of the mixed plots were intermedi-ate, roughly between 80 and 100 Mg ha−1 of C (Fig. 2). Species effecton SOC stocks in the mineral soil was statistically significant to adepth of 50 cm. Overall, SOC stocks in the mineral soil under pinewere greater than those under mixed or oak plots; furthermore,mixed forest plots had higher SOC stocks in the mineral soil thanoak plots (Table 4). At the Rascafría site, SOC stocks in the mixedforest plot were higher than in oak (10 Mg ha−1 of C) and pine plots(20 Mg ha−1 of C) (Fig. 2). Tree species effect on SOC storage wasstatistically significant for each separate sample layer in the min-eral soil as well: in the uppermost 5 cm of the mineral soil, the pine
plots had higher SOC stocks than mixed forest and oak plots, withno significant difference between the two latter (Table 4). For theunderlying mineral soil layers (5–10, 10–20, 20–30 and 30–50 cmdepth), SOC stocks in pine and mixed forest were not significantlyiations have been used: ‘H’ for Hoyocasero, ‘R’ for Rascafría and ‘V’ for Valsaín; ‘Q’

1900 E. Díaz-Pinés et al. / Forest Ecology and Management 262 (2011) 1895–1904
F of thee tands,
ds
cRoi2r(reabbt(mmsbt
tpTnpT5tDfb5pir
ig. 3. Correlation between litterfall rates and forest floor (squares) and upper 5 cmrrors of the mean. Light grey, dark grey and black represent oak, mixed and pine s
ifferent, but both had significantly higher SOC stocks than corre-ponding soil layers under oak (Table 4).
Annual litterfall rates were significantly higher in Rascafría asompared to Valsaín plots (p < 0.001). Litterfall-C fluxes at theascafría site were (mean ± 1 standard deviation) 0.90 ± 0.26 inak, 1.52 ± 0.78 in mixed forest and 1.87 ± 0.24 Mg ha−1 year−1
n pine plots; at Valsaín, values were 1.25 ± 0.37, 2.15 ± 0.67 and.48 ± 0.42 Mg ha−1 year−1 for the oak, pine and mixed forest plots,espectively. Oak forests had the lowest litterfall rates at both sitesp < 0.001), in part reflecting low basal area (Table 1); while litterfallates were not significantly different between mixed and pine for-st (Rascafría, p = 0.33; Valsaín, p = 0.41), despite differences in basalrea among the stands. Thus, observed differences in litterfall ratesetween sites and among vegetation types were not entirely driveny differences in tree basal area. SOC stocks in the forest floor, onhe other hand, were highly correlated with litterfall input ratesR2 = 0.71, p < 0.001, Fig. 3) as was SOC in the uppermost 5 cm in the
ineral soil (R2 = 0.90, p < 0.001, Fig. 3). SOC stocks in the 0–5 cmineral soil layer was also correlated to total basal area, albeit less
trongly (R2 = 0.50, p = 0.02); no significant correlations were foundetween basal area and SOC stocks in underlying soil layers or inhe forest floor.
Soil N concentrations followed similar patterns as C concen-rations, declining with depth and showing higher values underine than under oak in the first 5 cm of the mineral soil (p < 0.001,able 3). For deeper layers in the mineral soil, no statistically sig-ificant differences were found between forest types (5–10 cm,= 0.09; 10–20 cm, p = 0.74; 20–30 cm, p = 0.20; 30–50 cm, p = 0.55).he N stocks in the mineral soil (0–50 cm) ranged from 4.17 to.21 Mg ha−1 of N in the oak plots, from 5.38 to 7.03 Mg ha−1 of N inhe mixed plots and from 4.84 to 7.59 Mg ha−1 of N in the pine plots.ifferences were statistically significant between oak and mixed
orest plots (p = 0.002) and between oak and pine plots (p = 0.02)ut not between mixed and pine plots (p = 0.63). In the uppermost
cm of the mineral soil, N stocks were significantly higher underine than under oak (p = 0.003), but mixed plots were not signif-cantly different from either pine or oak soils (p = 0.10 and 0.30,espectively). In the underlying soil layers, pine and mixed plots
mineral soil (circles) carbon stocks. Vertical and horizontal bars represent standardrespectively.
contained significantly more N than oak plots (Table 3), with nosignificant differences between the former.
3.3. Soil organic matter characterization
Pine soils had higher C concentrations in MaOM and POM frac-tions compared to oak, although the differences were statisticallysignificant only for the layer 0–5 cm. Similar results were observedfor N in the MaOM and POM (Table 5). The C:N ratio of MaOM andPOM followed the same trend as bulk soil: higher values at pinesoils compared to oak soils, irrespective of whether MaOM or POMwere considered (Table 5). Moreover, C:N ratio of POM was alwayshigher than that of MaOM, irrespective of site or vegetation type.
Despite above concentration differences, mean MaOM-C stockvalues in the uppermost 5 cm of the mineral soil were not statisti-cally different between pine and oak (p = 0.09) and ranged from 8.4(Hoyocasero) to 9.1 (Rascafría) Mg ha−1 in the oak plots and from8.9 (Hoyocasero) to 12.3 (Rascafría) Mg ha−1 of C in the pine plots(Table 5). In the 5–10 cm layer, MaOM-C stocks declined somewhatto 5.2–10.1 Mg ha−1 of C in the oak plots, and to 6.3–13.4 Mg ha−1
of C in the pine plots (oak vs. pine, p = 0.02). Mean POM-C stocksin the 0–5 cm layer were 5.4–8.1 Mg ha−1 and 16.6–20.7 Mg ha−1
of C for oak and pine, respectively (oak vs. pine, p < 0.001; oak vs.mixed, p = 0.21; mixed vs. pine, p < 0.001). Corresponding POM-C stocks in the next soil layer (5–10 cm) were 1.4–3.1 Mg ha−1
and 3.3–7.6 Mg ha−1 of C in the oak and pine plots, respectively,with statistically significant differences between oak and pine only(p < 0.01) and not between oak and mixed or pine and mixed(Table 5).
Thus, the difference in SOC stocks in the upper 5 cm between oakand pine was mostly associated with an increased accumulationof POM-C under pine, while MaOM-C values remained relativelystable across vegetation types and sites (10.2 ± 1.6 Mg ha−1 of C).Likewise, SOC stocks declines from the upper to the 5–10 cm layer
(from 15 to 11 Mg ha−1 in the oak plots; from 26 to 16 Mg ha−1 inthe pine plots), were mostly associated with significant declinesin POM-C rather than MaOM-C, which averaged 10.1 ± 3.4 Mg ha−1of C across all plots. This was further reflected in a decline in the

E. Díaz-Pinés et al. / Forest Ecology and M
Tab
le5
Con
cen
trat
ion
ofC
and
N,C
:Nra
tio
and
stoc
ksin
min
eral
-ass
ocia
ted
-org
anic
mat
ter
(MaO
M)
and
par
ticu
late
orga
nic
mat
ter
(PO
M),
KM
nO
4-r
eact
ive
Con
soil
dry
wei
ght
and
SOC
and
POM
basi
s.
Site
Plot
Dep
th(c
m)
MaO
M-C
(gkg
−1fi
ne
soil
)
POM
-C(g
kg−1
fin
eso
il)
MaO
M-N
(gkg
−1fi
ne
soil
)
POM
-N(g
kg−1
fin
eso
il)
C:N
MaO
MC
:NPO
MM
aOM
-C(M
gh
a−1)
POM
-C(M
gh
a−1)
KM
nO
4-C
(gkg
−1fi
ne
soil
)
KM
nO
4-C
:SO
C(g
kg−1
SOC
)K
Mn
O4-
C:P
OM
-C(g
kg−1
POM
-C)
Hoy
ocas
ero
Oak
0–5
30.1
23.3
2.1
1.3
14.0
18.3
8.4
6.0
2.4
44.4
103
5–10
22.9
10.1
1.6
0.4
14.8
25.1
7.1
3.1
1.5
44.8
149
Mix
ed0–
549
.947
.53.
72.
513
.619
.210
.49.
74.
142
.686
5–10
46.9
15.4
3.2
0.8
14.9
20.0
14.7
4.9
2.7
41.3
175
Pin
e0–
551
.810
8.0
3.6
5.4
16.6
19.7
8.9
20.7
4.5
26.8
425–
1047
.623
.02.
81.
017
.123
.513
.06.
32.
940
.912
6
Ras
cafr
íaO
ak0–
553
.949
.13.
32.
316
.621
.99.
18.
13.
937
.879
5–10
51.7
19.9
3.4
1.0
15.6
20.0
10.1
3.8
2.8
38.3
141
Mix
ed0–
541
.059
.92.
42.
117
.529
.29.
612
.33.
030
.750
5–10
30.5
13.7
1.8
0.4
17.1
30.4
9.2
4.2
1.9
41.9
139
Pin
e0–
556
.012
7.1
2.8
4.9
19.6
26.0
12.3
17.5
4.3
29.6
345–
1021
.612
.01.
50.
414
.728
.36.
33.
31.
748
.214
2
Val
saín
Oak
0–5
24.5
15.2
2.2
0.8
11.1
18.6
8.8
5.4
2.1
54.1
138
5–10
13.3
3.6
1.4
0.2
9.6
21.7
5.2
1.4
1.0
54.9
278
Mix
ed0–
544
.335
.53.
21.
314
.128
.112
.39.
83.
142
.287
5–10
32.6
10.7
2.6
0.4
12.5
27.3
11.9
4.0
2.3
52.3
215
Pin
e0–
552
.283
.22.
61.
918
.638
.412
.116
.64.
034
.648
5–10
36.9
21.2
2.1
0.6
17.3
35.6
13.4
7.6
2.5
46.2
118
anagement 262 (2011) 1895–1904 1901
relative contribution POM-C to SOC: from 64% in the upper 5 cm inthe pine plots and 43% in the oak plots (p < 0.01); to 34%, and 27%in the 5–10 cm layer under pine and oak (p < 0.01), respectively.The MaOM-C:SOM-C or POM-C:SOM-C ratios were not significantlyaffected by site (0–5 cm, p = 0.14; 5–10 cm, p = 0.42).
KMnO4-reactive C values ranged between 1.0 and 4.7 g kg−1
fine soil in the first 10 cm of the mineral soil, and were gener-ally higher in the surface (0–5 cm) soil (Table 5). Higher valueswere consistently found in pine soils, with differences statisticallysignificant for the layer 0–5 cm only. However, KMnO4-reactiveC comprises 4–5% (38–54 g kg−1) of total SOC under oak, butonly 3–3.5% (27–35 g kg−1) of total SOC under pine (oak vs. pine,p < 0.01,Table 5). In the 5–10 cm layer, KMnO4-reactive C showeda narrower range both in absolute concentration and relative con-tribution and differences among vegetation types were no longerstatistically significant. In POM-C basis, oak soils had a higher con-tribution of KMnO4-reactive C than pine soils in the 0–5 cm mineralsoil layer: 80–140 under oak soils vs. 34–48 g kg−1 POM-C underpine soil (p < 0.001, Table 5).
Another metric of SOC quality, the soil C:N ratio was significantlyhigher in pine plots than in oak plots for both 0–5 and 5–10 cmlayers (p < 0.01 and p = 0.01, respectively, Table 3). The C:N ratiodecreased with increasing depth for all vegetation types: in theupper 10 cm values ranged between 17 and 24; between 10 and30 cm soil depth, C:N values ranged from 14 to 18 in Hoyocaseroand Rascafría, whereas values were somewhat lower in Valsaín(9–12) (Table 3). C:N ratio for the layer 30–50 cm were significantlyhigher in pine soils than in oak soils (p < 0.01). The decline in C:Nratios with increasing depth was more evident in those sampleswith higher POM-C content in the uppermost 10 cm of the mineralsoil (Table 3, Table 5). The C:N ratio of MaOM and POM followedthe same trend as bulk soil: higher values in pine soils compared tooak soils, irrespective of whether MaOM or POM were considered(p < 0.001, for both C:N ratio in the MaOM and in the POM frac-tion, in 0–5 and 5–10 cm mineral soil layers). Moreover, C:N ratioof POM was always higher than that of MaOM, irrespective of siteor vegetation type.
4. Discussion
In our experimental plots, Scots pine ecosystems store sig-nificantly more C (35–70 Mg ha−1 of C depending on site) thanPyrenean oak in the forest floor and upper 50 cm of the mineralsoil (Fig. 2). Between 50 and 80% of that additional SOC storage inpine soils (25–35 Mg ha−1 of C) is located in the forest floor plus thetop 10 cm of the mineral soil. Mixed forests have intermediate SOCstocks, indicating that under current conditions, these stands reallyrepresent an intermediate or transition condition between oak andpine stands. Under mixed forests, SOC stocks in the mineral soilwere similar to those under pine forests, while forest floor C stocksin mixed plots resembled those in oak plots. This suggests that theexpansion of oak into pine stands, possibly through changes in lit-terfall inputs, may, at first, cause a decrease in forest floor and uppermineral soil (0–5 cm) SOC stocks, while SOC stocks deeper in themineral soil remain relatively stable (Fig. 2, Table 4).
Our estimates of SOC storage fall within the range of earlier SOCestimates for conifer, broadleaves and mixed forests in Mediter-ranean conditions (see Table 6). Variability in estimates among thecited studies and between these studies and our results reflectstypical ecological heterogeneities in Mediterranean environmentsthat can lead to high fluctuations in SOC on the Iberian Peninsula
(de Vries et al., 2003) or even within a particular ecosystem or soilgroup (Rodríguez-Murillo, 2001). The SOC stocks differences of ourthree experimental sites may in part be explained by specific site orclimatic factors: Valsaín had the lowest SOC stock values, whereas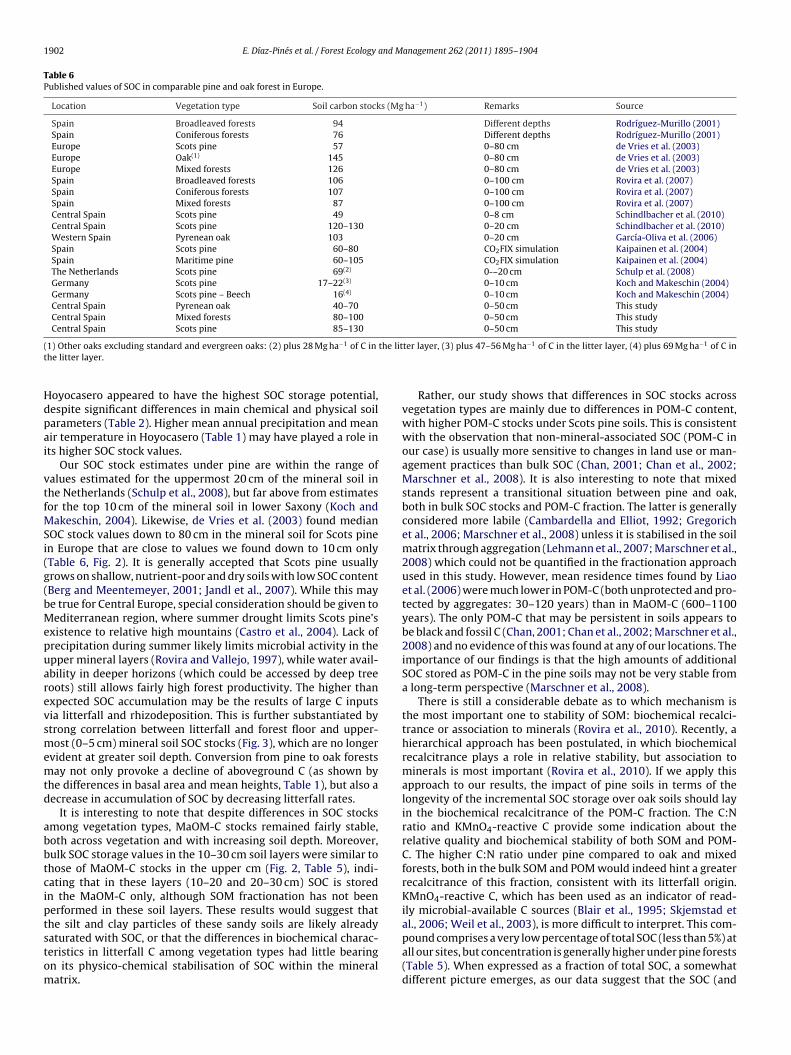
1902 E. Díaz-Pinés et al. / Forest Ecology and Management 262 (2011) 1895–1904
Table 6Published values of SOC in comparable pine and oak forest in Europe.
Location Vegetation type Soil carbon stocks (Mg ha−1) Remarks Source
Spain Broadleaved forests 94 Different depths Rodríguez-Murillo (2001)Spain Coniferous forests 76 Different depths Rodríguez-Murillo (2001)Europe Scots pine 57 0–80 cm de Vries et al. (2003)Europe Oak(1) 145 0–80 cm de Vries et al. (2003)Europe Mixed forests 126 0–80 cm de Vries et al. (2003)Spain Broadleaved forests 106 0–100 cm Rovira et al. (2007)Spain Coniferous forests 107 0–100 cm Rovira et al. (2007)Spain Mixed forests 87 0–100 cm Rovira et al. (2007)Central Spain Scots pine 49 0–8 cm Schindlbacher et al. (2010)Central Spain Scots pine 120–130 0–20 cm Schindlbacher et al. (2010)Western Spain Pyrenean oak 103 0–20 cm García-Oliva et al. (2006)Spain Scots pine 60–80 CO2FIX simulation Kaipainen et al. (2004)Spain Maritime pine 60–105 CO2FIX simulation Kaipainen et al. (2004)The Netherlands Scots pine 69(2) 0-–20 cm Schulp et al. (2008)Germany Scots pine 17–22(3) 0–10 cm Koch and Makeschin (2004)Germany Scots pine – Beech 16(4) 0–10 cm Koch and Makeschin (2004)Central Spain Pyrenean oak 40–70 0–50 cm This studyCentral Spain Mixed forests 80–100 0–50 cm This studyCentral Spain Scots pine 85–130 0–50 cm This study
( the litt
Hdpai
vtfMSi(g(bMepuarevsmemtd
abbtciptstom
1) Other oaks excluding standard and evergreen oaks: (2) plus 28 Mg ha−1 of C inhe litter layer.
oyocasero appeared to have the highest SOC storage potential,espite significant differences in main chemical and physical soilarameters (Table 2). Higher mean annual precipitation and meanir temperature in Hoyocasero (Table 1) may have played a role ints higher SOC stock values.
Our SOC stock estimates under pine are within the range ofalues estimated for the uppermost 20 cm of the mineral soil inhe Netherlands (Schulp et al., 2008), but far above from estimatesor the top 10 cm of the mineral soil in lower Saxony (Koch and
akeschin, 2004). Likewise, de Vries et al. (2003) found medianOC stock values down to 80 cm in the mineral soil for Scots pinen Europe that are close to values we found down to 10 cm onlyTable 6, Fig. 2). It is generally accepted that Scots pine usuallyrows on shallow, nutrient-poor and dry soils with low SOC contentBerg and Meentemeyer, 2001; Jandl et al., 2007). While this maye true for Central Europe, special consideration should be given toediterranean region, where summer drought limits Scots pine’s
xistence to relative high mountains (Castro et al., 2004). Lack ofrecipitation during summer likely limits microbial activity in thepper mineral layers (Rovira and Vallejo, 1997), while water avail-bility in deeper horizons (which could be accessed by deep treeoots) still allows fairly high forest productivity. The higher thanxpected SOC accumulation may be the results of large C inputsia litterfall and rhizodeposition. This is further substantiated bytrong correlation between litterfall and forest floor and upper-ost (0–5 cm) mineral soil SOC stocks (Fig. 3), which are no longer
vident at greater soil depth. Conversion from pine to oak forestsay not only provoke a decline of aboveground C (as shown by
he differences in basal area and mean heights, Table 1), but also aecrease in accumulation of SOC by decreasing litterfall rates.
It is interesting to note that despite differences in SOC stocksmong vegetation types, MaOM-C stocks remained fairly stable,oth across vegetation and with increasing soil depth. Moreover,ulk SOC storage values in the 10–30 cm soil layers were similar tohose of MaOM-C stocks in the upper cm (Fig. 2, Table 5), indi-ating that in these layers (10–20 and 20–30 cm) SOC is storedn the MaOM-C only, although SOM fractionation has not beenerformed in these soil layers. These results would suggest thathe silt and clay particles of these sandy soils are likely already
aturated with SOC, or that the differences in biochemical charac-eristics in litterfall C among vegetation types had little bearingn its physico-chemical stabilisation of SOC within the mineralatrix.ter layer, (3) plus 47–56 Mg ha−1 of C in the litter layer, (4) plus 69 Mg ha−1 of C in
Rather, our study shows that differences in SOC stocks acrossvegetation types are mainly due to differences in POM-C content,with higher POM-C stocks under Scots pine soils. This is consistentwith the observation that non-mineral-associated SOC (POM-C inour case) is usually more sensitive to changes in land use or man-agement practices than bulk SOC (Chan, 2001; Chan et al., 2002;Marschner et al., 2008). It is also interesting to note that mixedstands represent a transitional situation between pine and oak,both in bulk SOC stocks and POM-C fraction. The latter is generallyconsidered more labile (Cambardella and Elliot, 1992; Gregorichet al., 2006; Marschner et al., 2008) unless it is stabilised in the soilmatrix through aggregation (Lehmann et al., 2007; Marschner et al.,2008) which could not be quantified in the fractionation approachused in this study. However, mean residence times found by Liaoet al. (2006) were much lower in POM-C (both unprotected and pro-tected by aggregates: 30–120 years) than in MaOM-C (600–1100years). The only POM-C that may be persistent in soils appears tobe black and fossil C (Chan, 2001; Chan et al., 2002; Marschner et al.,2008) and no evidence of this was found at any of our locations. Theimportance of our findings is that the high amounts of additionalSOC stored as POM-C in the pine soils may not be very stable froma long-term perspective (Marschner et al., 2008).
There is still a considerable debate as to which mechanism isthe most important one to stability of SOM: biochemical recalci-trance or association to minerals (Rovira et al., 2010). Recently, ahierarchical approach has been postulated, in which biochemicalrecalcitrance plays a role in relative stability, but association tominerals is most important (Rovira et al., 2010). If we apply thisapproach to our results, the impact of pine soils in terms of thelongevity of the incremental SOC storage over oak soils should layin the biochemical recalcitrance of the POM-C fraction. The C:Nratio and KMnO4-reactive C provide some indication about therelative quality and biochemical stability of both SOM and POM-C. The higher C:N ratio under pine compared to oak and mixedforests, both in the bulk SOM and POM would indeed hint a greaterrecalcitrance of this fraction, consistent with its litterfall origin.KMnO4-reactive C, which has been used as an indicator of read-ily microbial-available C sources (Blair et al., 1995; Skjemstad etal., 2006; Weil et al., 2003), is more difficult to interpret. This com-
pound comprises a very low percentage of total SOC (less than 5%) atall our sites, but concentration is generally higher under pine forests(Table 5). When expressed as a fraction of total SOC, a somewhatdifferent picture emerges, as our data suggest that the SOC (and
and M
Pr5irbieiw
5
SeSusofdmbabbtdHttcnfdWS
A
rAcgsa
R
A
A
B
B
B
C
E. Díaz-Pinés et al. / Forest Ecology
OM-C in particular) under pine contains considerable less KMnO4-eactive C than either oak or mixed soils, especially in the uppercm (3–5% under pine vs. 8–14% under oak, Table 5), again suggest-
ng greater recalcitrance of POM-C. It should be noted, however, theeliability of KMnO4-reactive C methods as indicators of labile C haseen questioned (Tirol-Padre and Ladha, 2004) as a strong sensitiv-
ty to lignin and lignin-like products has been observed (Skjemstadt al., 2006). Thus, the higher KMnO4-reactive C under pine forests,n dry weight soil basis, may be indicative of lignin compounds,
hich are generally considered less decomposable.
. Conclusions
Scots pine forest ecosystems showed a greater capacity to storeOC than Pyrenean oak in ecotonal Mediterranean mountain areasspecially in the upper soil profile. Mixed forests had intermediateOC stocks, and showed similar SOC stocks in the forest floor andpper 5 cm of the mineral soil compared to oak forests, but SOCtocks in deeper layers in the mineral soil were similar to thosef pine soils, underpinning the transitional state of these mixedorests. The topsoil differences between tree species were mainlyue to differential POM-C accumulation, which is not bound to theineral soil particles and its stability is therefore more influenced
y biochemical recalcitrance, since it is considered more easilyccessible to microorganisms. In general, the amount of SOC sta-ilised through mineral association was not significantly differentetween the Scots pine and Pyrenean oak forests and their transi-ional ecosystems, suggesting that this may be a background valueriven by site conditions such as parent material and soil texture.igher aboveground C inputs were a key mechanisms leading to
he high C sequestration capacity of Scots pine soils, especially inhe topsoil. Forest management favouring Scots pine formationsan mitigate emissions up to 70 Mg ha−1 of C compared to Pyre-ean oak, but the additional storage increase would be in a SOC
orm which will not be likely stored in a long-term perspective,epending on the biochemical recalcitrance of the added POM-C.e found some indications suggesting that the added POM under
cots pine may be less decomposable.
cknowledgements
We like to thank Beatriz Ortiz and Remedios Cubillo for labo-atory support, and everybody who helped in field and lab work.uthors also thank Valsaín and Rascafría managers for the practi-al support. Suggestions from two anonymous reviewers were ofreat help to improve the quality of the initial manuscript. Thistudy was partially funded by the projects AGL2007-64707/FORnd AGL2010-16862 from the Spanish Ministry of Education.
eferences
alde, H., Gonzalez, P., Gytarsky, M., Krug, T., Kurz, W.A., Lasco, R.D., Martino, D.L.,McConkey, B.G., Ogle, S., Paustian, K., Raison, J., Ravindranath, N.H., Schoene, D.,Smith, P., Somogyi, Z., van Amstel, A., Verchot, L., 2006. Generic methodologiesapplicable to multiple land-use categories. In: Eggleston, S., Buendia, L., Miwa,K., Ngara, T., Tanabe, K. (Eds.), 2006 IPCC Guidelines for National Greenhouse GasInventories, Prepared by the National Greenhouse Gas Inventories Programme.Institute for Global Environmental Strategies, Hayama, Japan, pp. 2.1–2.59.
melung, W., Zech, W., Zang, X., Follett, R.F., Tiessen, H., Knox, E., Flach, K.W., 1998.Carbon nitrogen and sulfur pools in particle size fractions as influenced by cli-mate. Soil Sci. Soc. Am. J. 62, 172–181.
erg, B., Meentemeyer, V., 2001. Litter fall in some European coniferous forests asdependent on climate: a synthesis. Can. J. Forest Res. 31, 292–301.
inkley, D., Giardina, C.P., 1998. Why do tree species affect soils?: the warp and thewoof of tree–soil interactions. Biogeochemistry 42, 89–106.
lair, G.J., Lefroy, R.D.B., Lise, L., 1995. Soil carbon fractions based on their degree of
oxidation, and the development of a carbon management index for agriculturalsystems. Aust. J. Agric. Res. 46, 1459–1466.allesen, I., Liski, J., Raulund-Rasmussen, K., Olson, M.T., Tau-Strand, L., Vesterdal,L., Westman, C.J., 2003. Soil carbon stores in Nordic well-drained forest soils –relationships with climate and texture class. Global Change Biol. 9, 358–370.
anagement 262 (2011) 1895–1904 1903
Cambardella, C.A., Elliot, E.T., 1992. Particulate soil organic matter across a grasslandcultivation sequence. Soil Sci. Soc. Am. J. 56, 777–783.
Castro, J., Zamora, R., Hódar, J.A., Gómez, J.M., 2004. Seedling establishment of aboreal tree species (Pinus sylvestris) at its southernmost distribution limit: con-sequences of being in a marginal Mediterranean habitat. J. Ecol. 92, 266–277.
Chan, K.Y., 2001. Soil particulate organic carbon under different land use and man-agement. Soil Use Manage. 17, 217–221.
Chan, K.Y., Heenan, D.P., Oates, A., 2002. Soil carbon fractions and relationships tosoil quality under different tillage and stubble management. Soil Tillage Res. 63,133–139.
Christensen, B.T., 2001. Physical fractionation of soil and structural and functionalcomplexity in organic matter turnover. Eur. J. Soil Sci. 52, 345–353.
de Vries, W., Reinds, G.J., Posch, M., Sanz, M., Krause, G., Calatayud, V., Dupouey, J.,Sterba, H., Gundersen, P., Voogd, J., Vel, E., 2003. Intensive monitoring of forestecosystems in Europe. In: 2003 Technical Report in EC. UN/ECE, Brussels, p. 163.
Ekschmitt, K., Kandeler, E., Poll, C., Brune, A., Buscot, F., Friedrich, M., Gleixner, G.,Hartman, A., Kastner, M., Marhan, S., Miltner, A., Scheu, S., Wolters, V., 2008.Soil-carbon preservation through habitat constraints and biological limitationson decomposer activity. J. Plant Nutr. Soil Sci. 171, 27–35.
European Environmental Agency, 2006. European forest types: categories and typesfor sustainable forest management reporting and policy. In: EEA TechnicalReport. European Environmental Agency, Copenhagen, Denmark, p. 114.
FAO, 2006. World reference base for soil resources 2006, first update 2007. In: WorldSoil Resources Reports No. 103. Food and Agriculture Organization of the UnitedNations, Rome.
Galiano, L., Martínez-Vilalta, J., Lloret, F., 2010. Drought-induced multifactor declineof Scots pine in the Pyrenees and potential vegetation change by the expansionof co-occurring oak species. Ecosystems 13, 978–991.
García-Oliva, F., Hernández, G., Gallardo, J.F., 2006. Comparison of ecosystem C poolsin three forests in Spain and Latin America. Ann. Forest Sci. 63, 519–523.
Giardina, C.P., Coleman, M.D., Hancock, J.E., King, J.S., Lilleskov, E.A., Loya, W.M.,Pregitzer, K., Ryan, M.G., Trettin, C.C., 2005. The response of belowground car-bon allocation in forests to global change. In: Binkley, D., Menyailo, O. (Eds.),Tree Species Effects on Soils: Implications for Global Change. Kluwer AcademicPublishers, Dordrecht.
Gregorich, E.G., Beare, M.H., McKim, U.F., Skjemstad, J.O., 2006. Chemical and bio-logical characteristics of physically uncomplexed organic matter. Soil. Sci. Soc.Am. J. 70, 975–985.
Homann, P.S., Kapchinske, J.S., Boyce, A., 2007. Relations of mineral-soil C and Nto climate and texture: regional differences within the conterminous USA. Bio-geochem 85, 303–316.
Jandl, R., Lindner, M., Vesterdal, L., Bauwens, B., Baritz, R., Hagedorn, F., Johnson,D.W., Minkkinen, K., Byrne, K.A., 2007. How strongly can forest managementinfluence soil carbon sequestration? Geoderma 137, 253–268.
Jastrow, J., Amonette, J., Bailey, V., 2007. Mechanisms controlling soil carbonturnover and their potential application for enhancing carbon sequestration.Climatic Change 80, 5–23.
Kaipainen, T., Liski, J., Pussinen, A., Karjalainen, T., 2004. Managing carbon sinksby changing rotation length in European forests. Environ. Sci. Policy 7,205–219.
Kandeler, E., 1995. Total nitrogen. In: Schinner, R., Öhlinger, R., Kandeler, E., Mar-gesin, R. (Eds.), Methods in Soil Biology. Springer-Verlag, Berlin Heidelberg, NewYork, pp. 403–406.
Koch, J.A., Makeschin, F., 2004. Carbon and nitrogen dynamics in topsoils along forestconversion sequences in the Ore Mountains and the Saxonian lowland, Germany.Eur. J. Forest Res. 123, 189–201.
Kononova, M.M., 1966. Soil organic matter. In: Its nature, its role in soil formationand in soil fertility. Pergamon Press, Oxford.
Kuzyakov, Y., Friedel, J.K., Stahr, K., 2000. Review of mechanisms and quantificationof priming effects. Soil Biol. Biochem. 32, 1485–1498.
Ladegaard-Pedersen, P., Elberling, B., Vesterdal, L., 2005. Soil carbon stocks, miner-alization rates, and CO2 effluxes under 10 tree species on contrasting soil types.Can. J. Forest Res. 35, 1277–1284.
Lehmann, J., Kinyangi, J., Solomon, D., 2007. Organic matter stabilization in soilmicroaggregates: implications from spatial heterogeneity of organic carbon con-tents and carbon forms. Biogeochemistry 85, 45–57.
Liao, J.D., Boutton, T.W., Jastrow, J.D., 2006. Organic matter turnover in soil physicalfractions following woody plant invasion of grassland: evidence from natural13C and 15N. Soil Biol. Biochem. 38, 3197–3210.
Marschner, B., Brodowski, S., Dreves, A., Gleixner, G., Gude, A., Grootes, P.M., Hamer,U., Heim, A., Jandl, G., Ji, R., Kaiser, K., Kalbitz, K., Kramer, C., Leinweber, P., Rethe-meyer, J., Schäffer, A., Schmidt, M.W.I., Schwark, L., Wiesenberg, G.L.B., 2008.How relevant is recalcitrance for the stabilization of organic matter in soils? J.Plant Nutr. Soil Sci. 171, 91–110.
Oyonarte, C., Aranda, V., Durante, P., 2008. Soil surface properties in Mediterraneanmountain ecosystems: effects of environmental factors and implications of man-agement. Forest Ecol. Manage. 254, 156–165.
Quideau, S.A., Chadwick, O.A., Trumbore, S.E., Johnson-Maynard, J.L., Graham, R.C.,Anderson, M.A., 2001. Vegetation control on soil organic matter dynamics. Org.Geochem. 32, 247–252.
Rodríguez-Murillo, J.C., 2001. Organic carbon content under different types of land
use and soil in peninsular Spain. Biol. Fertil. Soils 33, 53–61.Rovira, P., Jorba, M., Romanya, J., 2010. Active and passive organic matter fractionsin Mediterranean forest soils. Biol. Fertil. Soils 46, 355–369.
Rovira, P., Romanyà, J., Rubio, A., Roca, N., Alloza, J.A., Vallejo, R., 2007. Estimacióndel carbono orgánico en los suelos peninsulares espanoles. In: Bravo Oviedo, F.

1 and M
R
R
S
S
S
S
active carbon for soil quality assessment: a simplified method for laboratory and
904 E. Díaz-Pinés et al. / Forest Ecology
(Ed.), El papel de los bosques espanoles en la mitigación del cambio climático.Fundación Gas Natural, Barcelona, pp. 197–222.
ovira, P., Vallejo, V.R., 1997. Organic carbon and nitrogen mineralization underMediterranean climatic conditions: the effects of incubation depth. Soil Biol.Biochem. 29, 1509–1520.
uiz de la Torre, J., 2006. Flora Mayor. In: Organismo Autónomo Parques Nacionales.Dirección General para la Biodiversidad, Madrid.
ánchez Palomares, O., Sánchez Serrano, F., Carretero Carrero, M.P., 1999. Modelosy cartografía de estimaciones climáticas termopluviométricas para la Espanapeninsular. In: Ministerio de Agricultura. Pesca y Alimentación, Madrid.
chindlbacher, A., de Gonzalo, C., Díaz-Pinés, E., Gorría, P., Matthews, B., Inclán, R.,Zechmeister-Boltenstern, S., Rubio, A., Jandl, R., 2010. Temperature sensitivityof forest soil organic matter decomposition along two elevation gradients. J.Geophys. Res. Biogeo. 115, G03018.
chulp, C.J.E., Nabuurs, G.-J., Verburg, P.H., de Waal, R.W., 2008. Effect of tree specieson carbon stocks in forest floor and mineral soil and implications for soil carboninventories. Forest Ecol. Manage. 256, 482–490.
ix, J., Conant, R.T., Paul, E.A., Paustian, K., 2002. Stabilization mechanisms of soilorganic matter: implications for C-saturation of soils. Plant Soil 241, 155–176.
anagement 262 (2011) 1895–1904
Skjemstad, J.O., Swift, R.S., McGowan, J.A., 2006. Comparison of the particulateorganic carbon and permanganate oxidation methods for estimating labile soilorganic carbon. Aust. J. Soil Res. 44, 255–263.
Tirol-Padre, A., Ladha, J.K., 2004. Assessing the reliability of permanganate-oxidizable carbon as an index of soil labile carbon. Soil Sci. Soc. Am. J. 68,969–978.
Vesterdal, L., Schmidt, I.K., Callesen, I., Nilsson, L.O., Gundersen, P., 2008. Carbonand nitrogen in forest floor and mineral soil under six common European treespecies. Forest Ecol. Manage. 255, 35–48.
von Lützow, M., Kögel-Knabner, I., Ekschmitt, K., Flessa, H., Guggenberger, G.,Matzner, E., Marschner, B., 2007. SOM fractionation methods: relevance to func-tional pools and to stabilization mechanisms. Soil Biol. Biochem. 39, 2183–2207.
Weil, R.R., Islam, K.R., Stine, M.A., Gruver, J.B., Samson-Liebig, S.E., 2003. Estimating
field use. Am. J. Altern. Agric. 18, 3–17.Zinn, Y.L., Lal, R., Bigham, J.M., Resck, D.V.S., 2007. Edaphic controls on soil organic
carbon retention in the Brazilian Cerrado: texture and mineralogy. Soil Sci. Soc.Am. J. 71, 1204–1214.