Does Tourism Contribute to Local Livelihoods? A Case Study of Tourism, Poverty and Conservation in...
53
Does Tourism Contribute to Local Livelihoods? A Case Study of Tourism, Poverty and Conservation in the Indian Sundarbans INDRILA GUHA Vidyasagar College for Women, Kolkata, India SANTADAS GHOSH Visva-Bharati, Shantiniketan, India October 2007 South Asian Network for Development and Environmental Economics (SANDEE) Po Box 8975, EPC 1056 Kathmandu, Nepal SANDEE Working Paper No. 26-07
-
Upload
visvabharati -
Category
Documents
-
view
4 -
download
0
Transcript of Does Tourism Contribute to Local Livelihoods? A Case Study of Tourism, Poverty and Conservation in...
SANDEE Working Paper No. 26-07 49
Does Tourism Contribute to Local Livelihoods?A Case Study of Tourism, Poverty and Conservation
in the Indian Sundarbans
INDRILA GUHAVidyasagar College for Women, Kolkata, India
SANTADAS GHOSHVisva-Bharati, Shantiniketan, India
October 2007
South Asian Network for Development and Environmental Economics (SANDEE)Po Box 8975, EPC 1056
Kathmandu, Nepal
SANDEE Working Paper No. 26-07
lmantha
Text Box
This work is used with the permission of South Asian Network for Development and Environmental Economics (SANDEE). © 2007, South Asian Network for Development and Environmental Economics (SANDEE).
50 SANDEE Working Paper No. 26-07
Published by the South Asian Network for Development and Environmental Economics(SANDEE)PO Box 8975, EPC 1056 Kathmandu, Nepal.Telephone: 977-1-552 8761, 552 6391 Fax: 977-1-553 6786
SANDEE research reports are the output of research projects supported by the SouthAsian Network for Development and Environmental Economics. The reports have beenpeer reviewed and edited. A summary of the findings of SANDEE reports are alsoavailable as SANDEE Policy Briefs.
National Library of Nepal Catalogue Service:
Indrila Guha and Santadas Ghosh
Does Tourism Contribute to Local Livelihoods? A Case Study of Tourism, Poverty andConservation in the Indian Sundarbans
(SANDEE Working Papers, ISSN 1893-1891; 2007 - WP 26)
ISBN: 978 - 9937 - 8015 - 2 - 2
Key Words:
1. Per-capita expenditure
2. Livelihood opportunities
3. Local stakeholders
4. Pro-poor tourism
5. Sundarbans
The views expressed in this publication are those of the author and do not necessarilyrepresent those of the South Asian Network for Development and EnvironmentalEconomics or its sponsors unless otherwise stated.
II SANDEE Working Paper No. 26-07
SANDEE Working Paper No. 26-07 51
The South Asian Network for Development andEnvironmental Economics
The South Asian Network for Development and Environmental Economics (SANDEE)is a regional network that brings together analysts from different countries in SouthAsia to address environment-development problems. SANDEE’s activities includeresearch support, training, and information dissemination. SANDEE is supported bycontr ibut ions f rom internat ional donors and i ts members . Please seewww.sandeeonline.org for further information about SANDEE.
SANDEE is financially supported by International Development Research Centre(IDRC), The Ford Foundation, Swedish International Development CooperationAgency (SIDA) and Norwegian Agency for Development Cooperation (NORAD).
Technical EditorPriya Shyamsundar
English EditorCarmen Wickramagamage
Comments should be sent to Indrila Guha, Vidya Sagar College for Women, KolkotaEmail: [email protected], Santadas Ghosh,Visva-Bharati, Shantiniketan,India, Email: [email protected]
SANDEE Working Paper No. 26-07 III
SANDEE Working Paper No. 26-07 53
TABLE OF CONTENTS
1. INTRODUCTION 1
2. PRO POOR TOURISM 2
3. STUDY AREA AND DATA 3
4. METHODOLOGY 5
5. EMPIRICAL RESULTS 7
5.1. PROFILE OF SURVEY HOUSEHOLDS 7
5.2 TWO VILLAGES – SIMILARITIES AND DIFFERENCES 8
5.3 UNDERSTANDING TOURISM-PARTICIPANTS AND THE REST:
DATA FROM THE STUDY VILLAGE 9
5.4 EFFECTS OF TOURISM ON HOUSEHOLD WELFARE – THE
REGRESSION RESULTS 9
5.5 LINK BETWEEN TOURISM AND CONSERVATION: EMPIRICAL
EVIDENCE 11
5.6 TOURISM’S SOCIAL EFFECT: LOCAL PERCEPTIONS AND
CARRYING CAPACITY 12
6. CONCLUSIONS AND POLICY IMPLICATIONS 13
7. ACKNOWLEDGEMENTS 14
REFERENCES 15
APPENDIX – A1: DETAILED PROFILE OF TOURISM PARTICIPANTS 25
APPENDIX – A2: HOUSEHOLD SURVEY QUESTIONNAIRE 27
SANDEE Working Paper No. 26-07 V
54 SANDEE Working Paper No. 26-07
LIST OF TABLES
Table 1 : Distribution of HHs across MPCE class 17
Table 2 : Distribution of sample HHs with a single source of livelihood 17
Table 3 : Village level information from secondary sources 17
Table 4 : Test for equality of mean values across villages 18
Table 5 : Variation in average per capita expenditure across two villages 18
Table 6 : Household characteristics across ‘tourism participants’ and ‘others’ 19
Table 7 : List of variables used in regressions 20
Table 8 : Regression result for expenditure Equations with data from two villages 21
Table 9 : Regression results for expenditures Equations with data from study villages 22
Table 10 : Household characteristics across categories 23
LIST OF FIGURES
Figure 1 : Distribution of landholding in the survey population in two villages 24
Figure 2 : Occupational distribution of working adults according to theirprimary occupation 24
VI SANDEE Working Paper No. 26-07
SANDEE Working Paper No. 26-07 55
Abstract
This study examines the contribution of tourism towards improving the livelihoods of local peoplein a remote island village of the Indian Sundarbans. The Sundarban Tiger Reserve is a majortourism destination and a small number of local people participate in the tourism sector as vendors,boatmen and guides. No village household subsists entirely on tourism-based income since suchjobs are seasonal. A majority of the local service providers operate with very little or no capitalinvestment. Yet households participating in tourism-related activity are better off than those whodo not. Tourism participants spend 19% more on food and 38% more on non-food itemsrelative to other villagers. Earnings from tourism appear to at least partially finance year-longconsumption. Tourism may also have a conservation effect in that the proportion of forest-dependent households is significantly lower among tourism dependent households. There is,however, little evidence of any percolation of tourism-related income to non-participatinghouseholds through intra-village transactions. The study proposes a carefully crafted policy forpromoting nature-based tourism with more room for local participation.
Key Words: per-capita expenditure, livelihood opportunities, local stakeholders, pro-poortourism, Sundarbans
SANDEE Working Paper No. 26-07 VII
SANDEE Working Paper No. 26-07 1
Does Tourism Contribute to Local Livelihoods ? A Case Study ofTourism, Poverty and Conservation in the Indian Sundarbans
Indrila Guha and Santadas Ghosh
1. Introduction
In many parts of the world, tourism has contributed to the dual goal of poverty eradication andconservation. Wildlife areas and National Parks constitute a significant market for tourism basedon natural resources and local culture. These areas are also home to remote villages that sustainthemselves on subsistence agriculture and forest resources. The co-existence of nature withimpoverished communities offers an opportunity for pro-poor tourism. Tourism can supportlivelihood diversification, which is particularly important in remote areas. It is also labour-intensive,can grow with unspecialized labour and has low entry barriers (Holland et al., 2003; Elliott2001) – all advantages in locations that have few assets other than nature.
There is clearly a market for ‘responsible’ tourism that shows concern for the poor(www.propoortourism.org.uk). However, simply bringing tourists to remote areas is not enough.Tourism needs to be organized in ways that enable local people to have better access to touristsso that they can augment their livelihood through employment and small enterprise development(Goodwin 2002; Ashley 2002). Market-driven private commercial enterprises may not ensureadherence to such principles by themselves. As a result, the effectiveness of PPT strategiesdepends enormously on the local conservation authority (Ashley et al., 1999). Good policiesand careful understanding of tourism-needs and the ability of local communities to fulfill theseneeds are important for tourism to be pro-poor.
In this paper we examine the impact of tourism in a remote area of eastern India. The SundarbanTiger Reserve (STR) is part of the largest inter-tidal area in the world that is covered by mangroveforest. It renders important ecological services to a vast region in South Asia. The STR is a packof forest-islands with no human habitation within it — rivers or water channels separate the STRfrom all the surrounding island-villages. The forests and water ways provide livelihood opportunitiesfor the local poor and are also home to the endangered Royal Bengal Tiger, whose man-eatingpropensity is historically high1. The STR is now part of a nation-wide conservation programme,named ‘Project Tiger’ and local people have been restricted from using the reserve over the lastfew decades. This has resulted in conflicts between government-sponsored conservation effortsand the livelihood opportunities of locals. Organized and regulated tourism in the Indian Sundarbansalso started with the inception of ‘Project Tiger’ in the mid-1980s. A Sundarban tour is essentiallya cruise through the water channels within the forest with halts at a handful of watch-towers onriverbanks.
An effective conservation strategy for a forest could turn the local poor from intruders into itskeepers by making them stakeholders in the earning opportunities that conservation provides.STR is a great tourist attraction and has seen a surge in the number of visitors in recent years.Tourism could potentially act as a vehicle for conservation by providing new livelihood
1 MOEF (Govt. of India) http://projecttiger.nic.in/sundarbans.htm; WWF : http://www.wwfindia.org/about_wwf/what_we_do/tiger_wildlife/our_work/tiger_conservation/sunderbans/
2 SANDEE Working Paper No. 26-07
opportunities in the Sundarban’s remote village economies. Thus, it is useful to examine howlocal stakeholders are integrated into the tourism sector and what more can be done to improvetheir lot. This is the main investigation undertaken in this paper. Thus, in the following sections ofthe paper, we try to: i) empirically measure the extent to which tourism augments local livelihoods;and (ii) find out local villagers’ perceptions regarding tourism’s possible positive and negativesocial effects. Based on this, we offer some policy recommendations to strengthen pro-pooropportunities in the Sundarbans.
2. Pro-poor Tourism
The issue of protecting the environment through tourism that augments the livelihood opportunitiesof the local poor has been examined in several policy-oriented studies (Alpizar 2002; Anderson2004; Sills 1998). Specific aspects of the tourism-poverty interaction are dealt with moreelaborately in the Pro-Poor Tourism (PPT) literature. It identifies several reasons why tourismmay be particularly effective in reducing both local poverty and peoples’ forest dependence.The following advantages of tourism as a vehicle for poverty eradication and conservation havebeen identified (Elliott 2001; Ashley et al., 1999, 2002):
o High income-elasticity which therefore offers a relatively rapidly growing market;o More labour intensive than other sectors providing diverse employment opportunities
for people with a wide range of skills, as well as for those unskilled;o Not import-intensive, making it particularly attractive to developing countries/backward
areas;o Higher potential for linkage with local enterprises because customers come to the
destination;o Low entry barriers;o Tourism products can be built on natural resources and existing cultural resources
making them productive assets;o Better infrastructure (water, health, communication), security (law and order), better
information on the outside world for locals;o Contribution to protection of assets such as wildlife and plant diversity due to a wise
tourism policy.
Case studies have found that in spite of the above-mentioned potential, tourism is oftencharacterized by a myopic private sector, limited involvement of local communities and a lack ofmarket access (Spenceley 2001). Also, the impacts of different tourism segments and types oftourism on the local poor are different. It therefore calls for strategies/guidelines for PPT andinterventions of the authorities at the local level (Ashley 2002; Ashley et al., 1999, 2002).
The literature also points out that there could be negative social effects of tourism on the localcommunity in remote rural set-ups in terms of cultural shock from outsiders (Spenceley 2001).However, studies also indicate that in general most effects were perceived positively by the localresidents. A study in Ecuador finds that the encounter with the tourist is mostly seen as a positiveexperience of cultural exchange by the local stakeholders (Wunder 1999, 2000). Attitudes totourism in local communities adjacent to national parks in Indonesia and Zimbabwe have alsoshown significant optimism in response to similar kinds of questions (Goodwin 2002).
SANDEE Working Paper No. 26-07 3
Studies point out that in areas with significant seasonal variation in the number of visitors mostpeople treat tourism-related income as ‘additional’ revenue on top of subsistence farming (Saville2001). Tourism can boost the local arts, culture and traditional medicine while these in turnboost tourism. Such tourism may change local people’s attitudes towards the preservation andconservation of flora and fauna (Kulkarni et al., 2002).
Different segments and types of the tourism can have differing impacts on income generation forthe local residents (Holland et al., 2003). Tourism in the ‘all inclusive’ packages is of the ‘enclaveform’, where those wishing to sell to tourists are often reduced to hawking at the enclave entryand exit points (Goodwin 2002). A study on the Himalayan trails in Nepal which lack roads andtransport facilities shows that backpackers who eat and stay in local hotels generate more moneyto locals than pre-paid organized treks (Saville 2001). A study in Brazil reveals that low-incometourism in a village can generate a sizeable income to local entrepreneurs (Wunder 2003).
In the Indian context, more than one illuminating study is available for the Keoladeo NationalPark, which identifies and estimates the impact of tourists on incomes of different service providers(Chopra 2004; Goodwin 2002; Goodwin et al., 1997). In another study on the Pench NationalPark, a similar identification of local beneficiaries and a quantitative estimation of their annualtourism earnings is made (Kulkarni et al., 2002).
Recent studies have identified the environmental and socio-economic impacts of shrimp farmingin the Indian Sundarbans (Chopra 2006), which is perhaps the most important commercial activityin this area. Studies have also been conducted on the valuation of timber and non-timber forestproducts (Santhakumar et al., 2005). However, the available literature does not offer an empiricalstudy of tourism and/or its impact on the local economy in the Indian Sundarbans.
3. Study Area and Data
The Sundarbans is a continuous mangrove delta region covering both India and Bangladesh.Approximately 1/3rd of its area falls within India. Unfortunately, these forests have been degradedover time and the Bengal tiger is now an endangered species. The economy of the island villagesof Sundarbans is characterized by remoteness, by the absence of electricity and power-drivenindustry, and by the absence of any nearby urban centre to sell local products. Villagers havelittle occupational choice other than agriculture and fishing.
People who directly exploit the forest are mostly the landless poor who live on the riverbanksacross the forest. Members of landless and marginal households in the fringe villages of STRoften venture into the forest to catch fish and crab in the creeks and to collect firewood andhoney with permits for limited periods. The spatial distribution of the population within thesurrounding islands is closely linked with their occupational distribution. Landless and marginalhouseholds, who are often directly dependant on the forest and rivers, are concentrated on theriver-banks bordering the forest. The landed households are mostly placed in the interiors ortowards the mainland.
4 SANDEE Working Paper No. 26-07
Regulation of tourism in the Sundarbans meant that tourists needed mandatory priced permits inorder to enter the forests. While permits are issued from four different places, there is a singleentry point to STR. The village Pakhiralay, overlooking the forest and located at one corner ofa larger inhabited island, hosts the Forest Range Office where all permits need to be producedbefore entering the forest. Consequently, it has become the village receiving visitors to STR.Package tours that originate elsewhere stop at Pakhiralay for permits only. These tourists spendnights on launches (large watercrafts) where food is also cooked and served on board. Suchpackage tours are adopted by approximately 70% of the visitors. There is little scope for localvillagers to trade with such visitors. But tourists in smaller groups also come and stay in Pakhiralayand hire a boat locally for a day-long cruise into the forest. With an increase in demand in thissegment, a number of tourist lodges have come up in the village in the last few years with itsattendant business opportunities. Villagers have spontaneously availed themselves of theseopportunities as owners of tourist lodges/boats, boat drivers, forest guides, cooks, drinkingwater suppliers, and as owners of small shops, telephone booths, etc.
Tourist arrivals in the Sundarbans occur almost entirely during the winter months as the absenceof electricity, adverse climatic conditions and choppy rivers retard tourist arrivals during otherparts of the year. During this peak tourist season, local villagers participate in various activities asservice providers as already mentioned. Extreme seasonal variation in tourist arrival means thereis little opportunity for a village household to depend entirely on tourism as a year-long occupation.All tourist lodges and related business establishments in Pakhiralay, some purely seasonallyoperated, are concentrated along a 500-meter stretch of road on the riverfront.
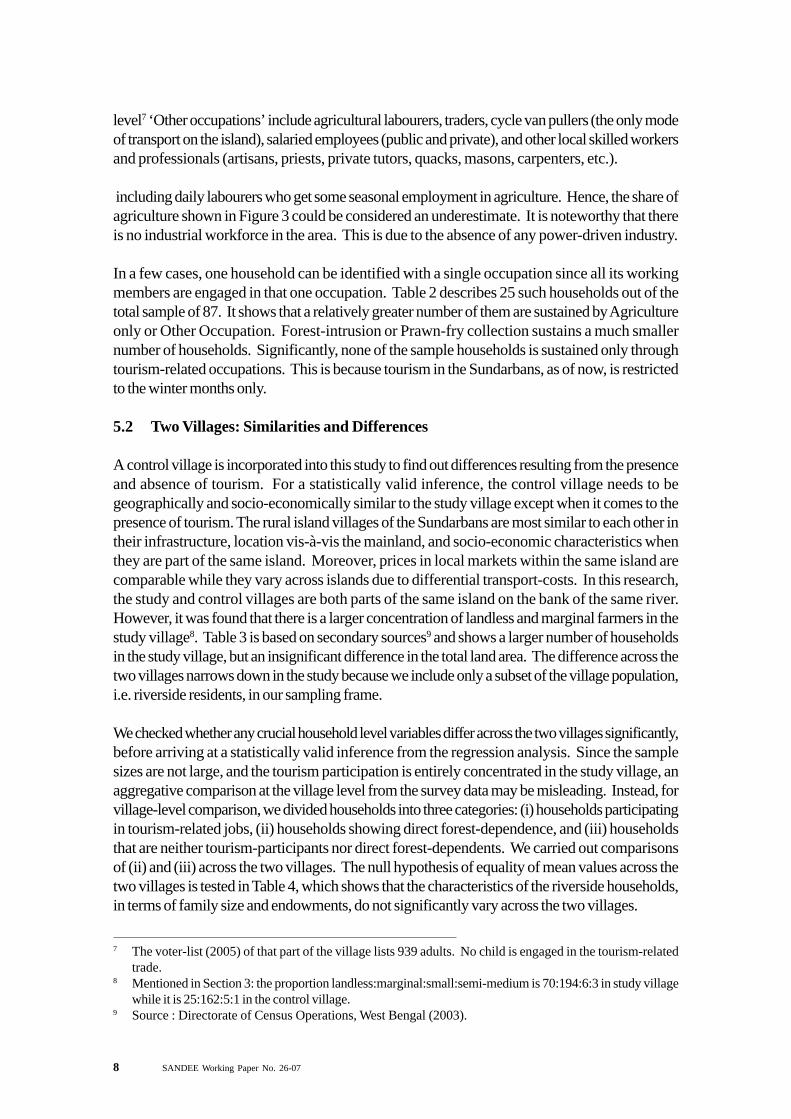
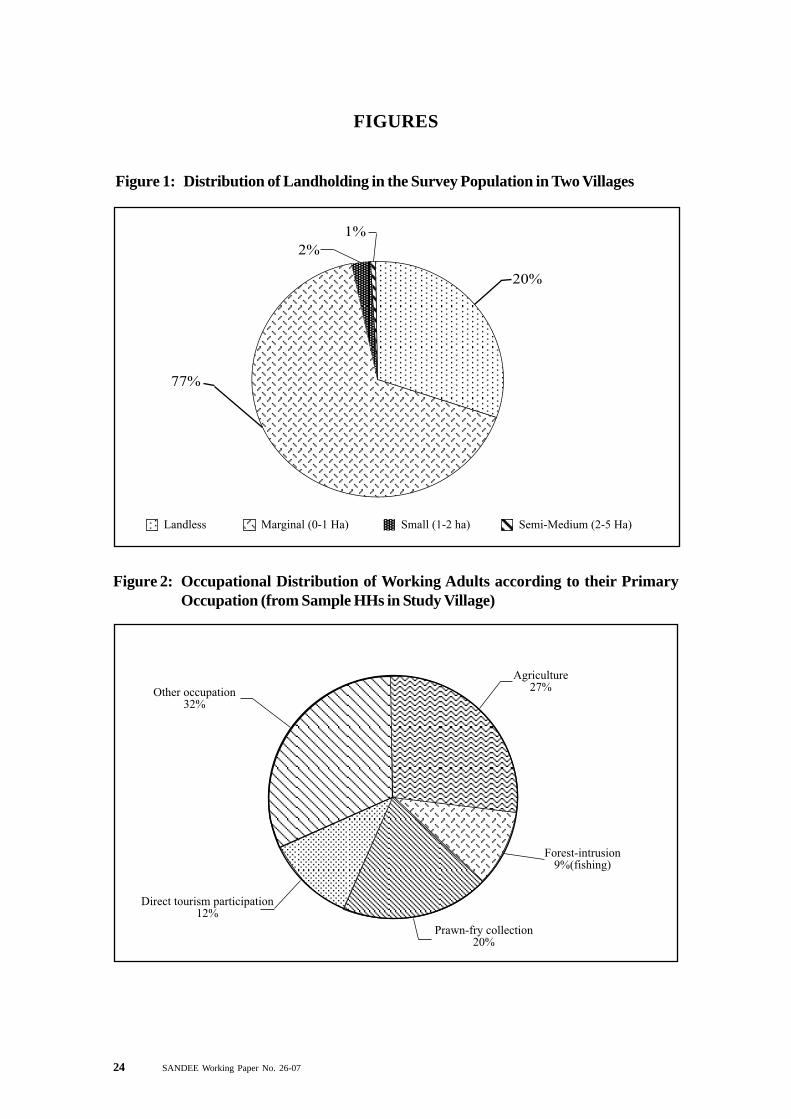
Tourism-participants almost invariably belong to the riverside population. Interestingly, thispopulation also includes the direct forest dependents. Taking into consideration this fact, thefocus of our study is the livelihoods of riverside households in the village of Pakhiralay. In orderto filter out the direct and indirect effects of tourism on livelihood, we also examine the livelihoodsof a similar set of households in a nearby control village with comparable geographical andsocio-economic characteristics. In this study, the ‘study village’ (Pakhiralay) and the ‘controlvillage’ (Dulki) are parts of the same bigger island. Both are placed across the forest and on thebank of the same river, with very similar soil conditions and other socio-economic features. Bothare located in the eastern fringe (forest side) of the island while the nearest wholesale market(Gosaba) is on its western tip. Some of these details are clearly identified in Figure 1.
Together, the market and the two villages form a triangle by their geographical location. Oneimportant feature is that while each of these villages is linked with Gosaba by village roads, thereis no proper road link between them. As a result, there is little economic interaction between thestudy village and the control village. This renders percolation of tourism money from the studyvillage to the control village practically impossible.
In order to estimate the contribution of tourism-income to the livelihood of local households, weundertook a detailed consumption expenditure survey of households in the study and controlvillages. The sample households were selected by stratified random sampling from the study andcontrol villages. The stratification was according to the household’s landholding status. Wegenerated lists of households located within 500 meters from the riverfront for both the villagesalong with their latest landholding status. The sampling frame consisted of 273 households in thestudy village and 193 households in the control village. These riverside households are mostly
SANDEE Working Paper No. 26-07 5
‘landless’ or ‘marginal’2. No ‘medium’ or ‘large’ landholding is found in the selected area. Figure2 shows the landholding distribution among the survey population which is heavily skewed towardslandless and marginal farmers.
From each of the four landholding strata, approximately 18% of the households were selectedthrough equal probability sampling. It resulted in a data size of 87 households (48 in the studyvillage and 39 in the control village)3. Each of the sample households was visited once during theoff season for tourism (August-September, 2005) and again once during the peak season(February-March, 2006). The expenditure data were collected in the two rounds, while othervariables were supposed to be time invariant within a span of less than six months and wasrecorded in the first round alone. The household survey questionnaire was appended with amodule with queries relating to the respondents’ perceptions of the possible social and culturaleffects of tourism in the village. This appended module was intended only for the respondenthouseholds in the study village in the second round (peak season).
4. Methodology
In general, the livelihood opportunities for any household depend on (i) the physical capital in itspossession, (ii) the quality of natural capital it has access to, (iii) the public capital (infrastructure),and (iv) human capital. In the Indian Sundarbans, apart from private capital (mostly cultivableland), the natural capital is the forest and river. Direct conservation efforts are gradually loweringlocals’ access to this capital. Also, unsustainable fishing and forest exploitation is affecting itsquality. The geographical isolation of the region and poor accessibility has resulted in insufficientinfrastructure (public capital). Local private physical capital formation is also crippled by a lackof local surplus.
Tourism can potentially open up new vistas when it comes to livelihood opportunities for acommunity. A portion of additional income from tourism may also be used to finance children’seducation. This enhances the human capital of village households and can create opportunitiesfor new occupations within the region or for migration outside. It may also provide the basis ofinformed decision-making vis-à-vis conservation and sustainable use of natural resources. Thisexemplifies the complex character of social changes activated by the cash inflow from tourism(Wunder 1999, 2000) and calls for a deeper analysis of expenditure patterns of participating vis-à-vis non-participating households. In general, there is the potential for tourism to add value tolocal social and natural capital, making them marketable and productive. The social culture andthe existence value of the forest can turn into marketable productive assets. In this study, weexamine whether this kind of transition is at least beginning to happen.
The first objective of this study is to empirically measure the livelihood-augmenting impact oftourism. Tourism can have a ‘direct’ and ‘indirect’ effect on local households. The direct effectcomes from increases in income as a result of wage or self-employment in the tourism sector.We measure this direct effect by examining the differences in household welfare indicators betweenparticipant and non-participant households in the study village (Pakhiralay).
2 Marginal (0-1 ha); Small (1-2 ha); Semi-medium (2-5 ha); Medium (5-10 ha); Large (> 10ha). (Ministry ofAgriculture, Government of India).
3 The number of sample HHs from the control village is marginally more than 18%, for rounding off numbersin each stratum.
6 SANDEE Working Paper No. 26-07
As already stated, the sample households come from a population which is mostly landless ormarginal. Focus group discussion suggests that these households save very little on an annualbasis. In this set up, the livelihood status of a household is reflected by its monthly per-capita‘expenditure’ in money terms. Thus, our main indicator of household welfare is per-capitaconsumption expenditure. We asked detailed questions about expenditure in the householdsurvey and we obtain an aggregate ‘expenditure’ figure by taking into account consumption ofpurchased and self-produced commodities valued at prevailing market prices. For a deeperinsight into the expenditure pattern of different households, we further classify expenditures as‘food expenses’, ‘non-food expenses’ and ‘expenses on education of children’. While the firsttwo may be regarded as household consumption, the third may be considered as its investmentfor developing human capital. Thus, in total we have four indicators of household welfare and wecheck to see if these indicators are systematically affected by participation in the tourism sector.
The total impact of tourism on local households’ livelihood is likely to be larger than the directeffect as some of the additional expenditure made by participating households can find its way tonon-participating households through intra-village transactions. These secondary local benefitscrucially depend upon the extent to which villagers spend their additional income on productsproduced within the village. Many studies have found significant ‘leakages’ in tourism moneywhich escapes from the local communities. Estimates show that 50% to 90% of tourist spendingusually leaks out of communities closest to the nature attractions (Buchsbaum 2004; Goodwin2002; Holland et al., 2003). Estimating such leakages is difficult, but it seems that a large part oftourism money received by the villagers is spent on consumer durables like radios, solar energycells, bicycles, etc., which are imported from outside the village. In this study, we also studyhousehold data from a non-touristed control village to examine the presence of any significant‘indirect’ or ‘trickle-down’ effect of tourism. If there is a significant difference in welfare indicators,i.e. the four consumption-expenditure variables, between non-participating households in thetouristed village and households in the control village, then we attribute this difference to thetrickle down from tourism.
We undertake two tasks to examine the direct and indirect effects of tourism in the two studyvillages. First we examine mean differences in the four household welfare indicators. However,mean differences do not necessarily tell us whether the welfare difference is because of tourismor because of some other attributes of the households. Thus, in a second step, we isolate theeffect of tourism on household welfare by accounting for other factors that might affect householdconsumption/welfare. This is done through regression analyses. Per capita consumptionexpenditure is regressed on household level variables including landholding as well as dummyvariables for tourism-participation, season, and village. Additionally, expenditures on ‘food’, on‘non-food items’ and ‘per-child monthly monetary expenditure on education’ are also regressedon relevant household level variables. In recognition of the possible contemporaneous correlationin error terms of the three components of expenditure, we estimate these equations as a systemof Seemingly Unrelated Regression Equations (SURE). To check the robustness of the estimates,regressions are run for the pooled data on the two villages as well as on the data from the studyvillage alone.
Human intrusion into the forest takes place primarily in two forms. Firstly, the honey and woodcollectors and the fish and crab catchers intrude into the forest’s interiors regularly. Secondly,villagers venture into prawn-fry collection in the rivers in a very crude fashion causing much
SANDEE Working Paper No. 26-07 7
damage to the delicate ecosystem in the process. Both of these operations are perceived toinvolve real danger due to tigers and crocodiles4. These poor households on the riverside directlydepend on the forest as a last resort for their livelihood. To bring out the implications of tourismfor conservation, we compare households that are engaged in forest exploitation with thoseengaged tourism. The study compares the socio-economic indicators of households classified as‘tourism-participants’, ‘forest-dependants’ and ‘engaged in other economic activities’. If the‘tourism participants’ are very similar to ‘forest dependents’, we can conclude that tourism is analternative livelihood option for forest dependent households.
We also check out whether the seasonal tourism-income is being used by the participatinghouseholds to finance their year-long expenditures. If all the additional tourism income is spentinstantly, poor participating households may fall back on forest in the off-season for livelihood.We visited each sample households twice during a year – coinciding with off and peak seasons oftourism. We check to see if household consumption expenditure is significantly higher during thepeak tourist season. If it isn’t, we conclude that households are spending their tourism incomethroughout the year.
The second objective of this study was to find out the local villagers’ perceptions regardingtourism’s possible positive and negative social impacts. For this purpose, we elicited responseson qualitative aspects of tourism on village life through ‘yes’, ‘no’ and ‘indifferent’ choices. Itwas done in the study village in the peak tourist season (winter) as villagers’ perceptions areexpected to be more focused at this time. Since the sample households were selected randomlywith landholding-based stratification, the aggregate analysis of these responses is expected torepresent the village psyche on tourism. Aggregative descriptive statistics are used in this part ofthe study.
5. Empirical Results
5.1. Profile of Survey Households
The survey data shows that the riverside population in the study area (local households) is indeedworse off compared to their rural counterparts in the State (West Bengal). Distribution ofhouseholds across monthly per-capita expenditure (MPCE) class shows the median value to beRs 500 for rural West Bengal in 2004-20055 while that for the sample households is found to beRs. 433 in 2005-2006 (see Table 1).
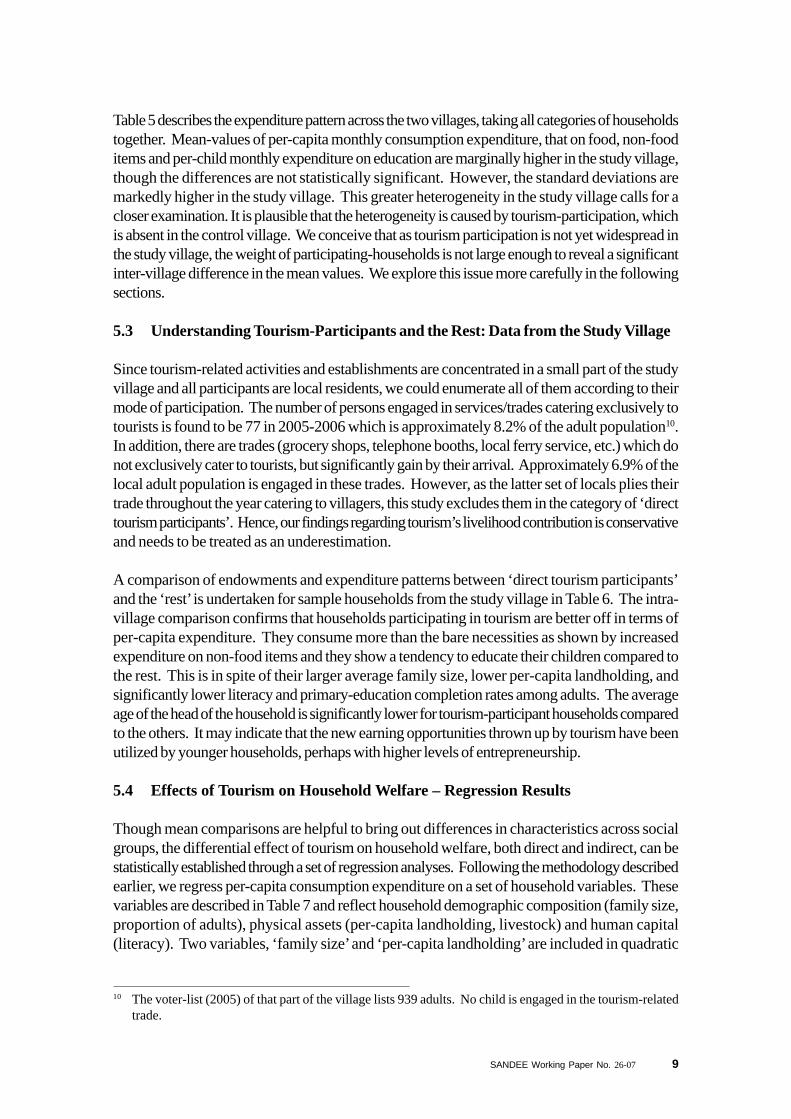
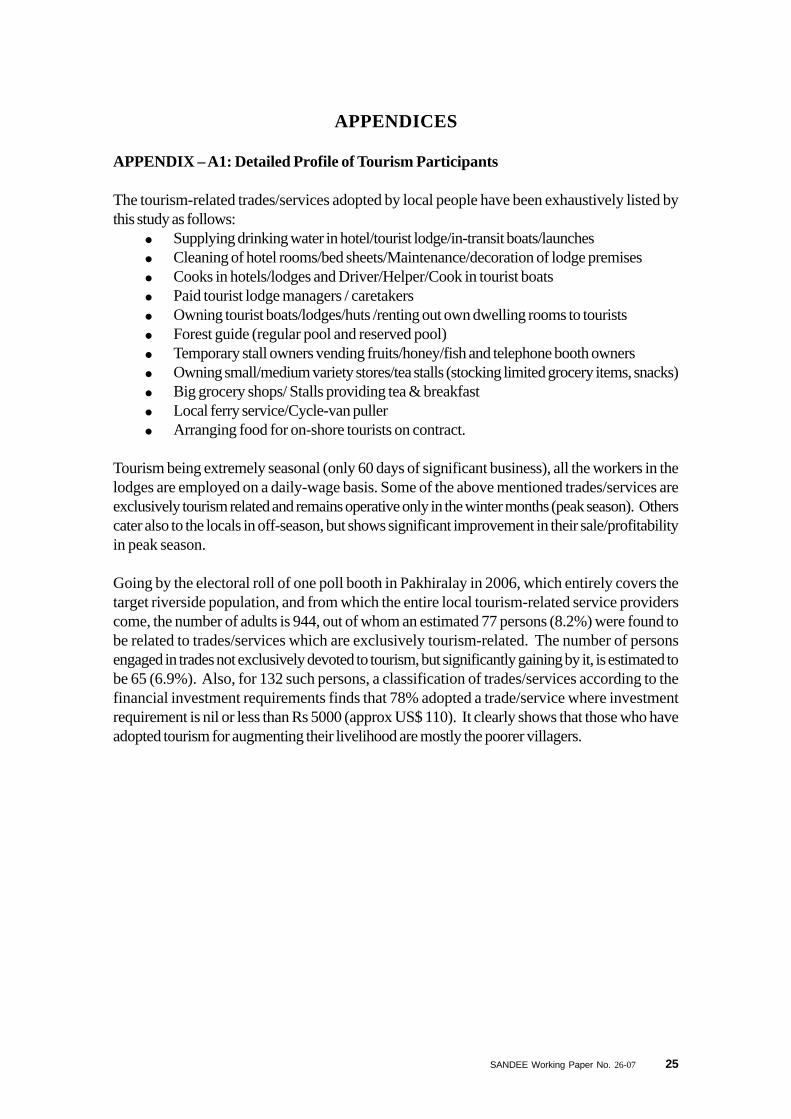
Being mostly landless or marginal, few households depend on agriculture alone. Often differentworking members of one household are engaged in different occupations. The occupationaldistribution, hence, is analyzed at the individual level rather than at the household level. Figure 3gives an idea of the distribution of working adults across occupations in the study village6. Itshows that agriculture is the occupation employing the maximum number of the working populationin the study area. ‘Other occupation’ represents a composite of many occupations at the village
4 Man-animal conflict in Sundarbans: <http://projecttiger.nic.in/sundarbans.htm>5 Level and Pattern of Consumer Expenditure, 2004-05; NSS 61st Round: NSSO; Ministry of Statistics and
Programme Implementation, GoI.<http://mospi.nic.in/mospi_nsso_rept_pubn.htm >( Table 1R).6 Since tourism is an occupation only in the study village, Figure 3 is obtained for the study village only.
8 SANDEE Working Paper No. 26-07
level7 ‘Other occupations’ include agricultural labourers, traders, cycle van pullers (the only modeof transport on the island), salaried employees (public and private), and other local skilled workersand professionals (artisans, priests, private tutors, quacks, masons, carpenters, etc.).
including daily labourers who get some seasonal employment in agriculture. Hence, the share ofagriculture shown in Figure 3 could be considered an underestimate. It is noteworthy that thereis no industrial workforce in the area. This is due to the absence of any power-driven industry.
In a few cases, one household can be identified with a single occupation since all its workingmembers are engaged in that one occupation. Table 2 describes 25 such households out of thetotal sample of 87. It shows that a relatively greater number of them are sustained by Agricultureonly or Other Occupation. Forest-intrusion or Prawn-fry collection sustains a much smallernumber of households. Significantly, none of the sample households is sustained only throughtourism-related occupations. This is because tourism in the Sundarbans, as of now, is restrictedto the winter months only.
5.2 Two Villages: Similarities and Differences
A control village is incorporated into this study to find out differences resulting from the presenceand absence of tourism. For a statistically valid inference, the control village needs to begeographically and socio-economically similar to the study village except when it comes to thepresence of tourism. The rural island villages of the Sundarbans are most similar to each other intheir infrastructure, location vis-à-vis the mainland, and socio-economic characteristics whenthey are part of the same island. Moreover, prices in local markets within the same island arecomparable while they vary across islands due to differential transport-costs. In this research,the study and control villages are both parts of the same island on the bank of the same river.However, it was found that there is a larger concentration of landless and marginal farmers in thestudy village8. Table 3 is based on secondary sources9 and shows a larger number of householdsin the study village, but an insignificant difference in the total land area. The difference across thetwo villages narrows down in the study because we include only a subset of the village population,i.e. riverside residents, in our sampling frame.
We checked whether any crucial household level variables differ across the two villages significantly,before arriving at a statistically valid inference from the regression analysis. Since the samplesizes are not large, and the tourism participation is entirely concentrated in the study village, anaggregative comparison at the village level from the survey data may be misleading. Instead, forvillage-level comparison, we divided households into three categories: (i) households participatingin tourism-related jobs, (ii) households showing direct forest-dependence, and (iii) householdsthat are neither tourism-participants nor direct forest-dependents. We carried out comparisonsof (ii) and (iii) across the two villages. The null hypothesis of equality of mean values across thetwo villages is tested in Table 4, which shows that the characteristics of the riverside households,in terms of family size and endowments, do not significantly vary across the two villages.
7 The voter-list (2005) of that part of the village lists 939 adults. No child is engaged in the tourism-relatedtrade.
8 Mentioned in Section 3: the proportion landless:marginal:small:semi-medium is 70:194:6:3 in study villagewhile it is 25:162:5:1 in the control village.
9 Source : Directorate of Census Operations, West Bengal (2003).
SANDEE Working Paper No. 26-07 9
Table 5 describes the expenditure pattern across the two villages, taking all categories of householdstogether. Mean-values of per-capita monthly consumption expenditure, that on food, non-fooditems and per-child monthly expenditure on education are marginally higher in the study village,though the differences are not statistically significant. However, the standard deviations aremarkedly higher in the study village. This greater heterogeneity in the study village calls for acloser examination. It is plausible that the heterogeneity is caused by tourism-participation, whichis absent in the control village. We conceive that as tourism participation is not yet widespread inthe study village, the weight of participating-households is not large enough to reveal a significantinter-village difference in the mean values. We explore this issue more carefully in the followingsections.
5.3 Understanding Tourism-Participants and the Rest: Data from the Study Village
Since tourism-related activities and establishments are concentrated in a small part of the studyvillage and all participants are local residents, we could enumerate all of them according to theirmode of participation. The number of persons engaged in services/trades catering exclusively totourists is found to be 77 in 2005-2006 which is approximately 8.2% of the adult population10.In addition, there are trades (grocery shops, telephone booths, local ferry service, etc.) which donot exclusively cater to tourists, but significantly gain by their arrival. Approximately 6.9% of thelocal adult population is engaged in these trades. However, as the latter set of locals plies theirtrade throughout the year catering to villagers, this study excludes them in the category of ‘directtourism participants’. Hence, our findings regarding tourism’s livelihood contribution is conservativeand needs to be treated as an underestimation.
A comparison of endowments and expenditure patterns between ‘direct tourism participants’and the ‘rest’ is undertaken for sample households from the study village in Table 6. The intra-village comparison confirms that households participating in tourism are better off in terms ofper-capita expenditure. They consume more than the bare necessities as shown by increasedexpenditure on non-food items and they show a tendency to educate their children compared tothe rest. This is in spite of their larger average family size, lower per-capita landholding, andsignificantly lower literacy and primary-education completion rates among adults. The averageage of the head of the household is significantly lower for tourism-participant households comparedto the others. It may indicate that the new earning opportunities thrown up by tourism have beenutilized by younger households, perhaps with higher levels of entrepreneurship.
5.4 Effects of Tourism on Household Welfare – Regression Results
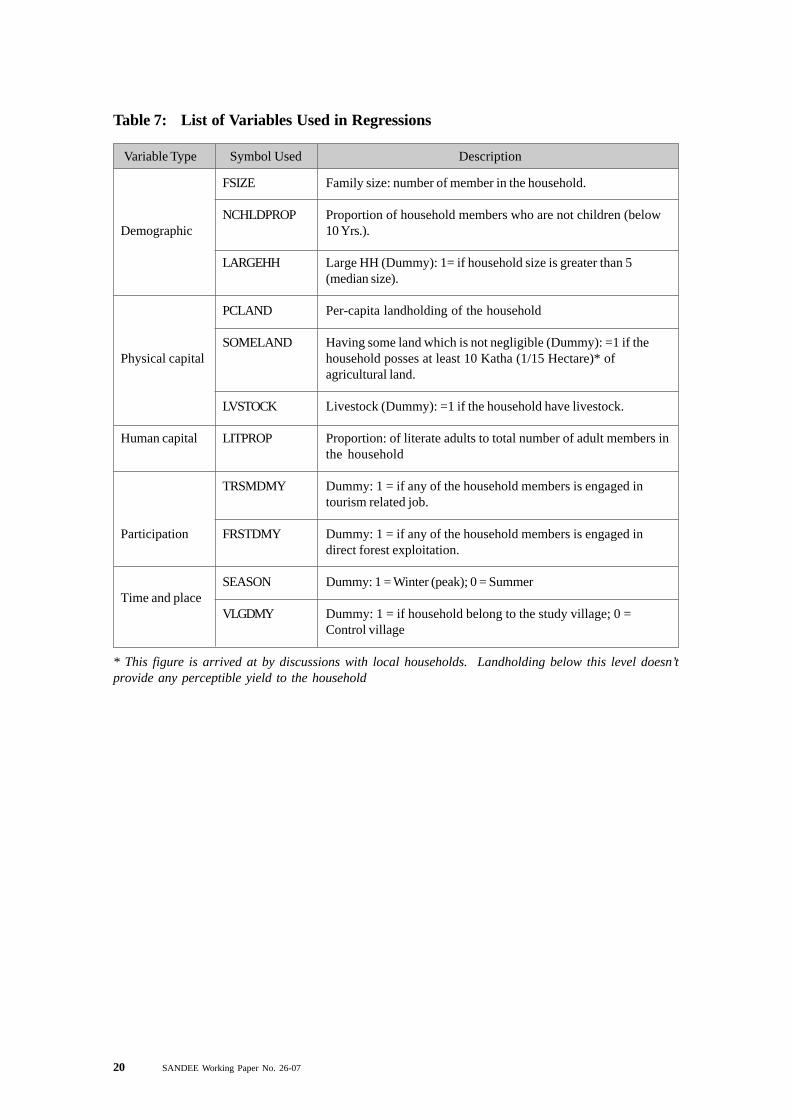
Though mean comparisons are helpful to bring out differences in characteristics across socialgroups, the differential effect of tourism on household welfare, both direct and indirect, can bestatistically established through a set of regression analyses. Following the methodology describedearlier, we regress per-capita consumption expenditure on a set of household variables. Thesevariables are described in Table 7 and reflect household demographic composition (family size,proportion of adults), physical assets (per-capita landholding, livestock) and human capital(literacy). Two variables, ‘family size’ and ‘per-capita landholding’ are included in quadratic
10 The voter-list (2005) of that part of the village lists 939 adults. No child is engaged in the tourism-relatedtrade.
10 SANDEE Working Paper No. 26-07
form. Participation status with respect to tourism and forest-exploitation are represented by twodummy variables. We also have dummy variables for village and season (off and peak for tourism).Participation in agriculture is not separately accommodated as it is reflected by landholding status.
Table 8 shows the results when per-capita monthly monetary expenditure11 (PCE) and its threecomponents are regressed on the household level variables described earlier. Regression forPCE is carried out by OLS with robust standard errors. The equations for the three componentsof expenditure are estimated as a system of Seemingly Unrelated Regression (SUR), takingcognizance of possible correlation of error terms across them.
The signs of the significant explanatory variables are in conformity with their economicinterpretations. Household size (FSIZE) and its square (FSIZESQR) are significant for allexpenditure equations (except expenditure on education), with the former being negative and thelatter positive. This is expected as per-capita expenditures tend to decrease for a larger household,but the rate of decrease should slow down with additional increments in household size. Per-capita expenditure is positively related with the proportion of household members above 10years of age, as they are larger consumers. The regression results confirm this expectation.
Per-capita landholding is significant in quadratic form for the PCE regression and its ‘food’component. Households with some viable amount of land (represented by a dummy for householdswith above 1/15 hectare of land) spend significantly less on per-capita food and non-food items.This is apparently contradictory, but can be explained considering a feature of these villages. Thelanded households are almost entirely marginal and small. Hence, whenever a household possessessome land, it tends to be tied down with the land even if the returns are very small. In contrast,households that are landless or have negligible landholding are more enterprising in seeking outnewer avenues of income and can make themselves better off than their poorly landed counterparts.
The proportion of literate adults in a household shows a significant positive impact on per-capitaexpenditure on non-food items, but a negative effect on expenditure on education. We concludethat a higher literacy rate appears to tilt household’s tastes in favour of non-food items. Moreover,its significant negative impact on per-child expenditure on education may indicate that non-literatesare keener to provide education to their children. However, it is more plausible that for householdswhere adults are not literate, expenditure on children tends to be more even at the primary stagebecause they have to be provided with local private tutors.
The dummy for forest dependents (=1 for households directly depending on forest-exploitationand prawn-fry collection) is not significant for other expenditure equations, but it is found thatsuch households spend significantly less for their children’s education.
It is important to note that the dummy for tourism participation (=1 for participant households) isthe only explanatory variable which is significant across all four equations and holds a positivesign. We also find that among the three components of expenditure, tourism participation statusis most significant in explaining ‘non-food’ expenditure. As non-food items are mostly ‘non-necessities’ in a remote village economy, they are expected to be more income-elastic. Thus, theadditional tourism-money accruing to the participating households is spent proportionately more
11 Includes imputed values for self-produced items
SANDEE Working Paper No. 26-07 11
on non-food items. Based on the estimated coefficients, we calculate that households participatingin tourism spend 19% more on food and 38% more on non-food items. We conclude thattourism significantly augments the livelihood of local participating households.
We find that the dummy indicating ‘village’ (=1 for study village) is not significant for any of theseequations except for expenditure on education. For education, it is only marginally significant (at10%). This shows that non-participating households (in tourism) across villages have little differencein their expenditure pattern. Thus, the ‘indirect’ effect of tourism money in the study village,which may have accrued to the non-participating households through intra-village transactions, isnot statistically significant.
Dummy for season (=1 for winter) is also insignificant across all the four equations. We concludethat the tourism-money, earned almost entirely in the winter months by participating households,are retained to finance their year-long expenditure and not spent instantly in the winter monthsalone.
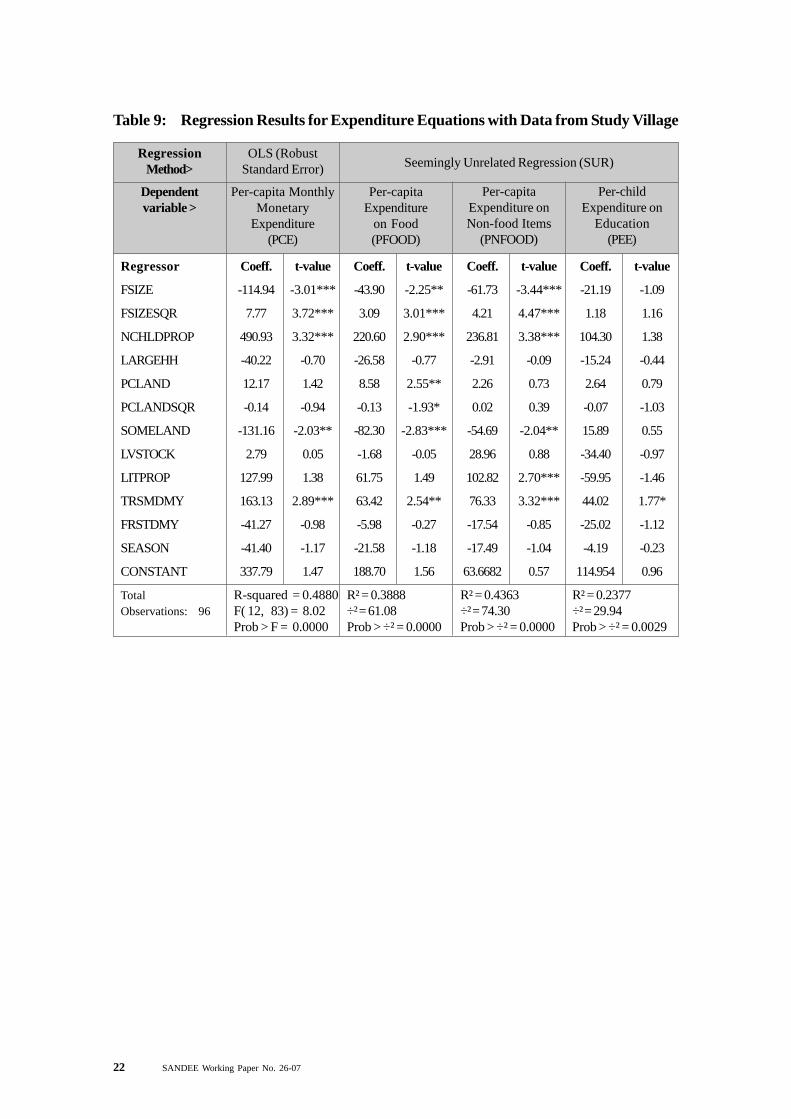
To check the robustness of the regression results, we also estimate the four household equationsusing data from the study village alone (Table 9, where we drop the dummy indicating village).The main results are un-changed.
We can now summarize the major findings of the regression results regarding the overall impactof tourism in the study village. Households entering into tourism-related occupations havesignificantly raised their living standard compared to other non-participating households. Theparticipating households distribute the seasonal inflow of tourism money over their year-longexpenditures. The additional money tourism provides enables the households to consume overand above the bare necessities as revealed by the fact that they have enhanced their expenditureon non-food items proportionately more than on food items. The trickle-down effect of tourismmoney to non-participating households by intra-village transactions is statistically insignificant assuch households show no significant increase in their expenditures by virtue of their location in thestudy village.
5.5 Link between Tourism and Conservation: Empirical Evidence
Tourism in the Indian Sundarbans is yet to develop into a large scale round-the-year businessopportunity for local villagers. Nonetheless, does it act as a vehicle for conservation? We addressthis question by comparing ‘tourism participation’ and ‘forest dependence’ among the studyvillage households.
Table 6 shows that the percentage of households resorting to agriculture among tourism participantsand non-participants is similar. But participating households show a significantly lower directforest-dependence. It could be that tourism has provided the local ‘less-endowed’ householdswith alternative earning opportunities which reduce their forest-dependence. This point becomesmore apparent by looking at the types of business opportunities and their financial requirementsthat tourism has opened up. By a complete enumeration of participants, we find that local peopleare engaged in a variety of service provision to tourists in a small way. Some 78% are engagedin trades/services with nil or a very little capital investment e.g., cook, drinking water supplier,boatman, etc.. A more detailed listing of these services/trades and the number of local peopleengaged in them is provided in Appendix A1.
12 SANDEE Working Paper No. 26-07
Table 6 looks only at tourism participants versus non-participants. For a deeper insight, Table10, categorizes the study village households into: (i) solely engaged in fishing and other forest-intrusive activities; (ii) solely engaged in prawn fry collection; (iii) both of these activities; (iv)tourism participants; and (v) others. Table 10 shows that households resorting to both ‘forestintrusion and prawn-fry collection’ are the poorest, as revealed by their average per-capita monthlyexpenditures and the fact that they have the smallest per-capita landholding. In contrast, householdsthat participate in ‘prawn-fry collection only’ have higher landholding and spend as much as non-forest dependents. However, they have a lower family size indicating a lesser number of workinghands. Prawn-fry collection is found to be mostly undertaken by the women in the household inthe village-side rivers. They possibly cannot move out into other types of income-generatingemployment for the family.
It appears that the forest intruders compensate for their lesser landholding by forest exploitation.However, both in terms of literacy and completing primary education, they are backward.Additionally, their attitude towards the education of their children is also dissimilar to that of theothers as revealed by the lowest per-child expenditure on education among these households.Hence, the overall picture that comes out is indicative of the fact that the forest intruders arelandless poor people who are also somewhat divorced form the educated world.
Turning to tourism-participants, the Table shows that they are the largest per-capita spenders onall items. They have the largest average family size, lesser per-capita landholding compared toprawn-fry collectors and other households, the lowest adult literacy except for purely forest-intruders, and the lowest proportion of adults completing primary education. In spite of theselower endowments, they can be seen as the largest spenders, especially for providing educationto their children. This constitutes evidence of the fact that mostly landless and marginal householdswith low human capital (literacy and education) have availed themselves of the new earningopportunities provided by tourism and have demonstrated a significant attitudinal shift in buildinghuman capital by educating their children.
We see that tourism-participants and forest-dependents come from the same set of lowly endowedpoor households. The mean-comparisons lead us to conclude that tourism-money can lead suchhouseholds out of their forest-dependence and hence can act as a vehicle for conservation.While we draw this broad conclusion, we clearly cannot establish causality with our limited data.
5.6 Tourism’s Social Effect: Local Perceptions and Carrying Capacity
We supplemented the household survey questionnaire by a set of questions for households in thestudy village. Some possible tourism-related social issues was raised and the respondent’sperceptions was elicited with a ‘Yes’, ‘No’ or ‘Indifferent’ options.
The analysis shows that all respondents perceived that the land prices in river-banks (vantagepoints for setting up a tourist lodge) have increased; however, opinion is divided whether it isgood or bad from their personal point of view.
Most of the villagers feel that the spread of tourism has improved transport and telecommunication,road conditions, and ferry services, as well as helped spread the Sundarban’s local culturalheritage and folk art into the outside world. However, most of them are also of the opinion that
SANDEE Working Paper No. 26-07 13
tourism at its present scale does not significantly reduce the forest dependence of locals. Theyalso feel that it has resulted in increased income inequality in the village.
When it came to tourism’s possible adverse effects, something which could be relevant for policypurposes, the majority of the respondents answered positively. According to them, tourism doesnot contribute to problems such as reduction in drinking water, pollution and congestion or increasedcrime. The unequal distribution of tourism-revenue in the study village, and the uneven interactionsof locals with visiting tourists, is however, an issue. Households were divided in their opinion ona number of issues such as the increase in land and agricultural and other product prices as aresult of tourism; the cultural ‘shock’ effects of tourism and the impact of tourism and income in-equalities on their own communitarian lives.
An increase in the number of tourists, without creating additional avenues for locals to participate(and helping them with finance and training) in the trade, may aggravate the existing inequality(economically and perception-wise). This could result in some degree of social tension in thefuture. Any efforts to increase the number of participants in the tourism sector would thereforebe very useful.
It is pertinent to mention in this context that the tourism carrying capacity (TCC) in the Sundarbansis not yet perceived as a constraint by the authorities. This is inferred from the absence ofrestrictions regarding the issue of permits to tourists.
6. Conclusions and Policy Implications
We draw three main conclusions from our examination of the households in the STR. First, onlya small number of households currently participate in tourism. Some 8.2% of villagers in Pakhiralaydirectly participate in the tourism sector. This suggests that there is ample scope for increasinglocal participation through tourism.
Households who do participate in the tourism sector have very little in terms of landholding andliteracy in comparison to other village households. Furthermore, tourism improves the livelihoodstatus of households who participate in this sector. Participant households spend 19% more onfood and 38% more on non-food items per capita relative to similar non-participants. Thus,tourism as a poverty reduction strategy may be particularly useful because it is able to supportand improve the lot of households that have the least human and other forms of capital.
Third, there is very little trickle down from tourism to non-participant households. Thus, whilethe households who work in the sector do gain, the cash they earn does not contribute to anoverall growth of the village economy. Thus, the one way forward to really pull people out ofpoverty is to increase participation in tourism. There simply needs to be more local jobs that arecreated through this sector if a wide range of villagers are to be affected.
Does tourism contribute to conservation in the Sunderbans? A great deal of the degradation inthe Sundarbans is a result of the dependence of locals on these mangrove forests. Tourism maybe pulling some households away from this dependence. There is some suggestion in our studythat this could be happening but we do not have sufficient data to show that there is a causalrelationship between tourism and forest dependence. This will need additional research.
14 SANDEE Working Paper No. 26-07
A clear policy recommendation from our study is that the number of local jobs that result fromtourism needs to grow. Lack of infrastructural facilities, most notably electricity, results in touristarrival being restricted to the winter months only. Also, it encourages visitors to take up all-inclusive package-tours originating in far-off places which provide little scope for locals to enterinto trade with the visitors. With improvements in infrastructure, visitors can grow in number andthe scope for local participation can increase.
A second recommendation is that more publicity and information dissemination is required aboutthe Sundarbans. New vistas should be explored such as nature-based tourism with productslike forest-walks, tree-top houses, etc. These products, now absent, could be developed byprivate entrepreneurs once the authorities come up with a comprehensive tourism developmentpolicy. These mechanisms to increase tourism in quantitative terms will need to take into accountconstraints in the carrying capacity of the forest.
We would like to recognize some data limitations in this study. Tourism-participation may be anendogenous decision on the part of a household, depending on its physical and human capitalendowments. Hence, our regression results could be improved by treating ‘participation’ as anendogenous variable. But we were unable to do this because of the relatively small number ofparticipant households. There is need for more careful research into this and other ‘tourismdevelopment’ aspects of the Sundarbans.
7. Acknowledgements
This paper is the partial outcome of a research project funded by SANDEE and hosted by theGlobal Change Programme, Jadavpur University. We have benefited immensely from the variousBiannual R&T Workshops of SANDEE. We are specially thankful to Enamul Haque, PriyaShyamsundar, Jeffrey Vincent, Kanchan Chopra, Karl_Goran-Maler, M N Murty, GopalKadekodi, Puran Mongia, Subhrendu Pattanayek, E Somanathan, K Gunnard and SMadheswaran for their valuable comments and suggestions at various stages of this study. Wewould like to express our sincere gratitude to Professor Joyashree Roy for helping us locate thisproject in the Global Change Programme, Jadavpur University, and for providing us with allinstitutional support throughout the study period.
SANDEE Working Paper No. 26-07 15
References
Alpizar, R Fransisco (2002), “Essays on Environmental Policy-Making in Developing Countries:Applications to Costa Rica”, Economic Studies #117, Department of Economics, School ofEconomics and Commercial Law, Göteborg University, Sweden.
Anderson, Jessica (2004), “Welfare Environment and Tourism in Developing Countries”,Economic Studies #137, Department of Economics, School of Economics and CommercialLaw, Göteborg University, Sweden.
Ashley, C (2002), Methodology for Pro-Poor Tourism Case Studies, PPT Working PaperNo 10, Overseas Development Institute, http://www.propoortourism.org.uk/10_methodology.pdf
Ashley, C, D Roe and O Bennett (1999), Sustainable Tourism and Poverty EliminationStudy, A Report Submitted to the Department for International Development (DFID, UK),http://www.propoortourism.org.uk/dfid_report.pdf
Ashley, C, D Roe and H Goodwin (2001), Pro-poor Tourism Strategies: Making TourismWork for the Poor: A Review of Experience, Pro-Poor Tourism Report 1, ODI, IIED, CRT,http://www.propoortourism.org.uk/ppt_report.pdf
Ashley, C, H Goodwin and D Roe (2002), The Tourism Industry and Poverty Reduction:A Business Primer, Pro-poor Tourism Briefing No.2, ODI, IIED, ICRT,http://www.propoortourism.org.uk/final%20business%20brief.pdf
Buchsbaum, B D (2004), “Ecotourism and Sustainable Development in Costa Rica,” UnpublishedPaper, http://scholar.lib.vt.edu/theses/available/etd-05052004-171907/unrestricted/EcotourismCostRica.pdf
Chopra, K (2004), “Economic Valuation of Biodiversity: The Case of Keoladeo National Park,”Ed. G Kadekodi, Environmental Economics in Practice: Selected Case Studies from India,Oxford University Press, New Delhi.
Chopra, K, P Kumar and P Kapuria (2006), “Internalizing the Cost of Biodiversity Loss due toAquaculture: A Case Study of the Indian Sundarbans”, Working Paper Series No. E/276/2006,Institute of Economic Growth, University of Delhi Enclave, North Campus http://iegindia.org/workpap_276.pdf
Elliott, J (2001), Wildlife and Poverty Study: Phase One Report, Livestock and Wildlife AdvisoryGroup (LWAG), DFID (UK) http://www.gm-unccd.org/field/Bilaterals/UK/Wildlife.pdf
Goodwin, H (2002), “Local Community Involvement in Tourism around National Parks:Opportunities and Constraints”, Current Issues in Tourism, Vol. 5 no. 3 & 4,http://www.multilingual-matters.net/cit/005/0338/cit0050338.pdf
Goodwin, H, I Kent, K Parker and M Walpole (1997), “Tourism, Conservation & SustainableDevelopment, Volume II, Keoladeo National Park, India”, Final Report to the Department forInternational Development, DFID, UK, http://www.haroldgoodwin.info/resources/vol2.pdf
16 SANDEE Working Paper No. 26-07
Holland, J, M Burian and L Dixey (2003), “Tourism in Poor Rural Areas,” PPT Working PaperNo. 12, ODI, IIED, ICRT http://www.odi.org.uk/RPEG/PPT/WP12.pdf
Kulkarni, A P, V M Vaidya and M Phadanavis (2002), “Economics of Protected Area – A CaseStudy of Pench National Park,” Final Report EERC Working Paper Series, WB-4, MOEF,IGIDR, WORLD BANK,http://coe.mse.ac.in/eercrep/fullrep/wetbio WB_FR_AnjaliKulkarni.pdf
Santhakumar, V, A K E Haque & R Bhattacharya (2005), “An Economic Analysis of Mangrovesin South Asia,” Economic Development in South Asia, Ed. Mohsin Khan, New Delhi: TataMcGrawhill, pp 369–437.
Saville, N M (2001), “Practical Strategies for Pro-Poor Tourism: Case study of Pro-poorTourism and SNV in Humla District, West Nepal,” PPT Working Paper No 3, ODI, IIED,ICRT. http://www.propoortourism.org.uk/nepal_cs.pdf
Sills, Erin O’Donnell (1998), Ecotourism as an Integrated Conservation and DevelopmentStrategy: Econometric Estimation of Demand by International Tourists and Impacts onIndigenous Households on Siberut Islands, Indonesia, Ph. D. Thesis, Department ofEnvironment, Duke University, Chapel Hill, NC, USA.
Spenceley, A (2001), Development of National Responsible Tourism Guidelines andIndicators for South Africa, Report to the Department of Environmental Affairs and Tourismand the DFID, UK, http://www.nri.org/NRET/guidelineslitrep.pdf
Wunder, S (1999), “Promoting Forest Conservation through Ecotourism Income? A Case Studyfrom the Ecuadorian Amazon Region,” Occasional Paper No 21, Center for International ForestryResearch, CIFOR, Indonesia,http://www.cifor.cgiar.org/publications/pdf_files/OccPapers/OP-21.pdf
Wunder, S (2000), “Ecotourism and Economic Incentives - An Empirical Approach,” EcologicalEconomics, 32 (3): 465-479.
Wunder, S (2003), “Native Tourism, Natural Forests and Local Incomes on Ilha Grande, Brazil,”Tourism and Development in Tropical Islands: Political Ecology Perspectives, Ed. SGössling, Cheltenham, UK: Edward Elgar Publishing Ltd, pp. 148-177.
SANDEE Working Paper No. 26-07 17
0 235 17 7
235 270 26 0
270 320 77 7
320 365 85 10
365 410 104 14
410 455 105 11
455 510 105 11
510 580 125 13
580 690 143 7
690 890 110 3
890 1155 49 3
1155 Above 54 1
Total 1000 87
Median** (Rs.) 500 433
Table 1: Distribution of HHs across MPCE Class (NSS 61st Round v Study Sample)
MPCE Class
Lower Boundary(Rs.)
Upper Boundary(Rs.)
Number of HHs(NSS 61st Round)*
(2004-2005)
Number of HHs(Study Sample)
(2005-2006)
*Source: Level and Pattern of Consumer Expenditure, 2004-05; NSS 61st Round: NSSO; Ministry ofStatistics and Programme Implementation, GoI.< http://mospi.nic.in/mospi_nsso_rept_pubn.htm> ( Table 1R)
** Median is calculated as the representative value since the distribution is open-ended.
Occupation Agriculture Forest Prawn-fry Tourism Other Totalintrusion collection participation occupations
No. of HHs 7 3 2 0 13 25
Table 2: Distribution of Sample HHs with a Single Source of Livelihood*
* Out of 87 HHs in the sample (both study and control village)
Study Village Control Village
Area (ha) 479.49 419.39
Number of households 772 566
Population 3871 2710
Sex Ratio (M/F) 1.018 1.016
Table 3: Village Level Information from Secondary Sources*
*Source: Directorate of Census Operations, West Bengal (2003)
TABLES
18 SANDEE Working Paper No. 26-07
Avg. family size Accepted Rejected Accepted
% of literacy among adults Rejected Accepted Accepted
% of adults completing primary Accepted Acceptededucation
Avg. HH landholding (Katha) Accepted Accepted
Avg. per-capita landholding Accepted Accepted(Katha)
Proportion of HHs owning Rejected Accepted Acceptedlivestock
Table 4: Test for Equality of Mean Values across Villages[Null hypothesis: mean values are equal across study and control village]
HH Level Variables
Directly forest-dependent HHs(and not tourism-participants)
HHs neither tourism-participantsnor forest-dependent
Level of Significance Level of Significance
5% 1% 5% 1%
* Katha is the smallest local unit of landholding. 1 Hectare = 149 Katha (approximately).
HH Level Per-Capita Expenditures(Item) Control Village Study VillageMean Mean
(std. dev.) (Rs.) (std. dev.) (Rs.)
Per-capita monthly consumption expenditure (Rs.) 451.31(14.13) 469.55(23.08)
Per-capita monthly expenditure on food (Rs.) 266.69(77.01) 271.22(115.65)
Per-capita monthly expenditure on non- food items (Rs.) 162.86(61.96) 169.14(110.76)
Per-child monthly expenditure on education(Rs.) 40.89(52.39) 62.65(102.80)
Table 5: Variation in Average per capita Expenditure across Two Villages
Sample Size: Control Village: 39 HHs, two rounds; Study Village 48 HHs (two rounds)
SANDEE Working Paper No. 26-07 19
No. of HHs 38 10
Average family size 5.3 6.0
Average age of the Head of the HH 47.5 41.7*
Avg. Per-capita landholding (Katha) 7.9 5.9
% of landless or marginal HHs 66% 80%
% of HHs having livestock 89% 90%
% of literacy among adults 79 68*
% of adults completing primary education 56 31***
% of HHs directly exploiting the forest 55% 30% *(engaged in fishing and/or prawn-fry collection)
% of HHs undertaking some agricultural activity 66% 60%
Per-capita monthly consumption expenditure (Rs.) 443 570*
Per-capita monthly expenditure on Food (Rs.) 262 304
Per-capita monthly expenditure on Non-food(Rs.) 158 210
Per-child monthly expenditure on Education†† (Rs.) 58 108
Table 6: Household Characteristics across ‘Tourism Participants’ and ‘Others’†
HHs not directlyparticipating in tourism
HHs directlyparticipating in tourism
† Table accounts for 48 sample households in the study village†† Only HHs with children in the age group 6-18 years are considered*, **,*** indicates differences are significant at 10%, 5% and 1% level respectively
20 SANDEE Working Paper No. 26-07
Table 7: List of Variables Used in Regressions
Variable Type Symbol Used Description
* This figure is arrived at by discussions with local households. Landholding below this level doesn’tprovide any perceptible yield to the household
Demographic
Physical capital
Human capital
Participation
Time and place
FSIZE
NCHLDPROP
LARGEHH
PCLAND
SOMELAND
LVSTOCK
LITPROP
TRSMDMY
FRSTDMY
SEASON
VLGDMY
Family size: number of member in the household.
Proportion of household members who are not children (below10 Yrs.).
Large HH (Dummy): 1= if household size is greater than 5(median size).
Per-capita landholding of the household
Having some land which is not negligible (Dummy): =1 if thehousehold posses at least 10 Katha (1/15 Hectare)* ofagricultural land.
Livestock (Dummy): =1 if the household have livestock.
Proportion: of literate adults to total number of adult members inthe household
Dummy: 1 = if any of the household members is engaged intourism related job.
Dummy: 1 = if any of the household members is engaged indirect forest exploitation.
Dummy: 1 = Winter (peak); 0 = Summer
Dummy: 1 = if household belong to the study village; 0 =Control village
SANDEE Working Paper No. 26-07 21
Per-childExpenditure on
Education(PEE)
Per-capitaExpenditure onNon-food Items
(PNFOOD)
Per-capitaExpenditure
on Food(PFOOD)
Per-capita MonthlyMonetary
Expenditure(PCE)
Dependentvariable >
Seemingly Unrelated Regression (SUR)Regression
Method>OLS (Robust
Standard Error)
Regressor Coeff. t-value Coeff. t-value Coeff. t-value Coeff. t-value
FSIZE -65.19 -2.87*** -31.87 -2.38** -35.99 -2.93*** -0.46 -0.04
FSIZESQR 5.02 3.34*** 2.33 3.11*** 2.86 4.18*** 0.01 0.02
NCHLDPROP 219.66 2.47** 105.42 2.23** 120.40 2.78*** 0.53 0.01
LARGEHH -89.85 -2.40** -34.62 -1.44 -34.18 -1.56 -29.33 -1.32
PCLAND 12.17 2.45** 8.12 3.54*** 2.38 1.13 3.04 1.43
PCLANDSQR -0.19 -2.15** -0.14 -3.07*** -0.01 -0.24 -0.08 -1.77*
SOMELAND -97.26 -2.13** -58.98 -2.76*** -39.01 -2.00** 8.60 0.44
LVSTOCK -41.79 -0.93 -19.75 -0.70 2.17 0.08 -42.52 -1.62
LITPROP 40.11 0.71 28.42 1.05 50.88 2.06** -68.17 -2.73***
TRSMDMY 133.39 2.45** 50.48 2.27** 60.54 2.97*** 38.00 1.85*
FRSTDMY -19.69 -0.71 -4.57 -0.30 -2.24 -0.16 -28.07 -2.02**
SEASON -34.30 -1.43 -19.39 -1.53 -15.78 -1.36 2.55 0.22
VLGDMY 27.03 0.89 14.07 0.94 5.18 0.38 23.73 1.71*
CONSTANT 473.47 3.42*** 269.79 3.67*** 130.98 1.94* 130.63 1.92*
Total F(13, 160) =7.71 R² = 0.296 R² = 0.3032 R² = 0.1568Observations: 174 Prob > F = 0.0000 ÷² = 73.30 ÷² = 75.72 ÷² = 32.36
R-squared = 0.34364 Prob > ÷² = 0.0000 Prob > ÷² = 0.0000 Prob > ÷² = 0.0021
Table 8: Regression Results for Expenditure Equations with Data from Two Villages
22 SANDEE Working Paper No. 26-07
Per-childExpenditure on
Education(PEE)
Per-capitaExpenditure onNon-food Items
(PNFOOD)
Per-capitaExpenditure
on Food(PFOOD)
Per-capita MonthlyMonetary
Expenditure(PCE)
Dependentvariable >
Seemingly Unrelated Regression (SUR)Regression
Method>OLS (Robust
Standard Error)
Regressor Coeff. t-value Coeff. t-value Coeff. t-value Coeff. t-value
FSIZE -114.94 -3.01*** -43.90 -2.25** -61.73 -3.44*** -21.19 -1.09
FSIZESQR 7.77 3.72*** 3.09 3.01*** 4.21 4.47*** 1.18 1.16
NCHLDPROP 490.93 3.32*** 220.60 2.90*** 236.81 3.38*** 104.30 1.38
LARGEHH -40.22 -0.70 -26.58 -0.77 -2.91 -0.09 -15.24 -0.44
PCLAND 12.17 1.42 8.58 2.55** 2.26 0.73 2.64 0.79
PCLANDSQR -0.14 -0.94 -0.13 -1.93* 0.02 0.39 -0.07 -1.03
SOMELAND -131.16 -2.03** -82.30 -2.83*** -54.69 -2.04** 15.89 0.55
LVSTOCK 2.79 0.05 -1.68 -0.05 28.96 0.88 -34.40 -0.97
LITPROP 127.99 1.38 61.75 1.49 102.82 2.70*** -59.95 -1.46
TRSMDMY 163.13 2.89*** 63.42 2.54** 76.33 3.32*** 44.02 1.77*
FRSTDMY -41.27 -0.98 -5.98 -0.27 -17.54 -0.85 -25.02 -1.12
SEASON -41.40 -1.17 -21.58 -1.18 -17.49 -1.04 -4.19 -0.23
CONSTANT 337.79 1.47 188.70 1.56 63.6682 0.57 114.954 0.96
Total R-squared = 0.4880 R² = 0.3888 R² = 0.4363 R² = 0.2377Observations: 96 F( 12, 83) = 8.02 ÷² = 61.08 ÷² = 74.30 ÷² = 29.94
Prob > F = 0.0000 Prob > ÷² = 0.0000 Prob > ÷² = 0.0000 Prob > ÷² = 0.0029
Table 9: Regression Results for Expenditure Equations with Data from Study Village
SANDEE Working Paper No. 26-07 23
No. of HHs 7 19 4 10 46
Avg. family size 5.7 4 5.25 6 5
% of literacy among adults % 56.2 78.9 81.2 67.7 82
% of adults completing 37.4 51.3 50.0 30.8 66primary education
Avg. per-capita landholding 2.8 9.9 0.6 5.9 8.9(Katha)
% of HHs having livestock 71.4 89.5 100 90 97.8
Per-capita monthly 262 281 190 304 266consumption of food (Rs.)
Per-capita monthly 159 177 106 211 160consumption of non-food items (Rs.)
Per-child monthly expenditure 15 35 53 108 55on education* (Rs.)
Table 10: Household Characteristics across Categories†
Forest Dependent HouseholdsTourism-
participantsOther
HouseholdsForestintruders
Prawn-frycollectors
Both forest andprawn-fry
† One of the 87 HHs is found to be an outlier as a forest intruder and dropped in this Table. It has a muchbigger landholding than other forest dependents. Such cases are rare, but do occur where an erstwhileforest going HH could procure a large amount of land but didn’t yet give up its forest going habit.
* Only HHs with children in the age group 6-18 years are considered
24 SANDEE Working Paper No. 26-07
Figure 1: Distribution of Landholding in the Survey Population in Two Villages
�������� ������� ������� ������ ������� ������������ �������
���
���
����
Figure 2: Occupational Distribution of Working Adults according to their PrimaryOccupation (from Sample HHs in Study Village)
FIGURES
�����������
�������������� � !������
"�#��!$��������������
%������������&�����&��������
'��������&�����(��
SANDEE Working Paper No. 26-07 25
APPENDICES
APPENDIX – A1: Detailed Profile of Tourism Participants
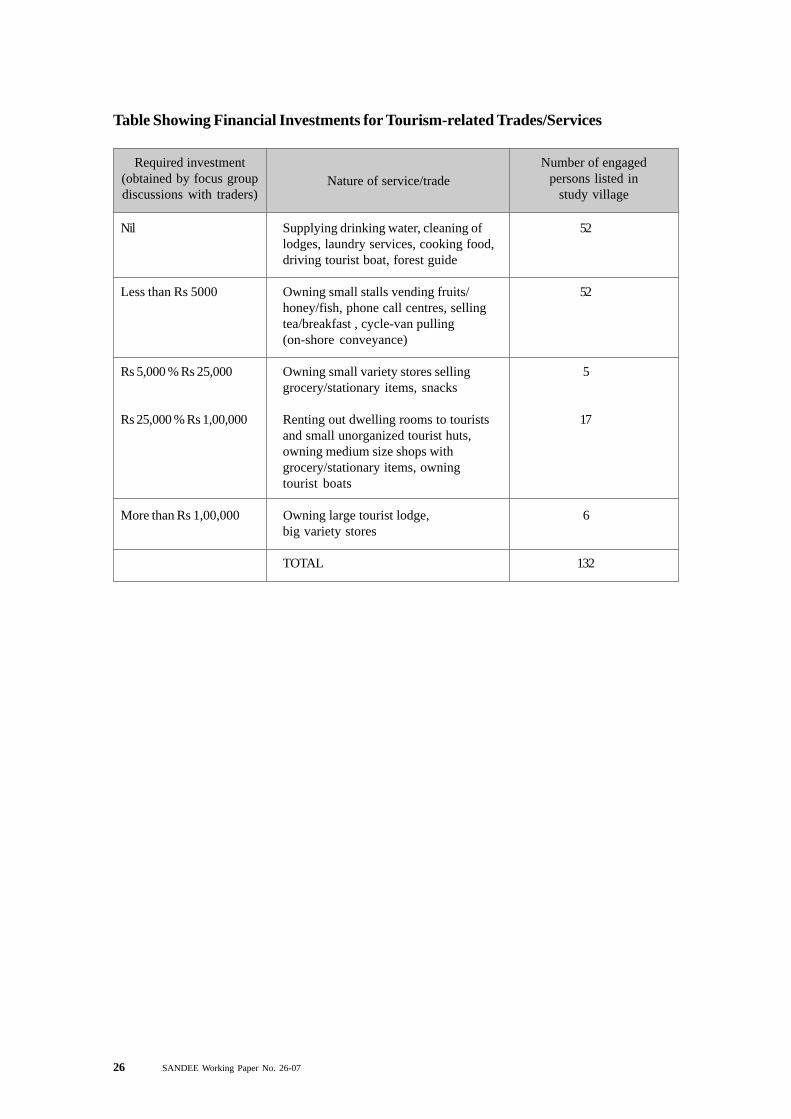
The tourism-related trades/services adopted by local people have been exhaustively listed bythis study as follows:
Supplying drinking water in hotel/tourist lodge/in-transit boats/launchesCleaning of hotel rooms/bed sheets/Maintenance/decoration of lodge premisesCooks in hotels/lodges and Driver/Helper/Cook in tourist boatsPaid tourist lodge managers / caretakersOwning tourist boats/lodges/huts /renting out own dwelling rooms to touristsForest guide (regular pool and reserved pool)Temporary stall owners vending fruits/honey/fish and telephone booth ownersOwning small/medium variety stores/tea stalls (stocking limited grocery items, snacks)Big grocery shops/ Stalls providing tea & breakfastLocal ferry service/Cycle-van pullerArranging food for on-shore tourists on contract.
Tourism being extremely seasonal (only 60 days of significant business), all the workers in thelodges are employed on a daily-wage basis. Some of the above mentioned trades/services areexclusively tourism related and remains operative only in the winter months (peak season). Otherscater also to the locals in off-season, but shows significant improvement in their sale/profitabilityin peak season.
Going by the electoral roll of one poll booth in Pakhiralay in 2006, which entirely covers thetarget riverside population, and from which the entire local tourism-related service providerscome, the number of adults is 944, out of whom an estimated 77 persons (8.2%) were found tobe related to trades/services which are exclusively tourism-related. The number of personsengaged in trades not exclusively devoted to tourism, but significantly gaining by it, is estimated tobe 65 (6.9%). Also, for 132 such persons, a classification of trades/services according to thefinancial investment requirements finds that 78% adopted a trade/service where investmentrequirement is nil or less than Rs 5000 (approx US$ 110). It clearly shows that those who haveadopted tourism for augmenting their livelihood are mostly the poorer villagers.
26 SANDEE Working Paper No. 26-07
Nil Supplying drinking water, cleaning of 52lodges, laundry services, cooking food,driving tourist boat, forest guide
Less than Rs 5000 Owning small stalls vending fruits/ 52honey/fish, phone call centres, sellingtea/breakfast , cycle-van pulling(on-shore conveyance)
Rs 5,000 % Rs 25,000 Owning small variety stores selling 5grocery/stationary items, snacks
Rs 25,000 % Rs 1,00,000 Renting out dwelling rooms to tourists 17and small unorganized tourist huts,owning medium size shops withgrocery/stationary items, owningtourist boats
More than Rs 1,00,000 Owning large tourist lodge, 6big variety stores
TOTAL 132
Required investment(obtained by focus groupdiscussions with traders)
Nature of service/tradeNumber of engaged
persons listed instudy village
Table Showing Financial Investments for Tourism-related Trades/Services
SANDEE Working Paper No. 26-07 27
Information collected by this questionnaire will be used exclusively for the GCP-SANDEE project under JadavpurUniversity during 2005-2006. The confidentiality of the supplied information will be duly maintained
South Asian Network forDevelopment and Environmental Economics
PO Box 8975 EPC – 1056 · Kathmandu · Nepal · Telephone 977-1-552 8761, 552 6391· Fax 977-1-553 6786
THE GCP-SANDEE PROJECT·
2005 - 2006
HOUSEHOLD EXPENDITURE SURVEY
FIRST - ROUND(AUGUST – SEPTEMBER, 2005)
Village ...........……………………… Household No. ………………..
APPENDIX – A2: Household survey questionnaire
28 SANDEE Working Paper No. 26-07
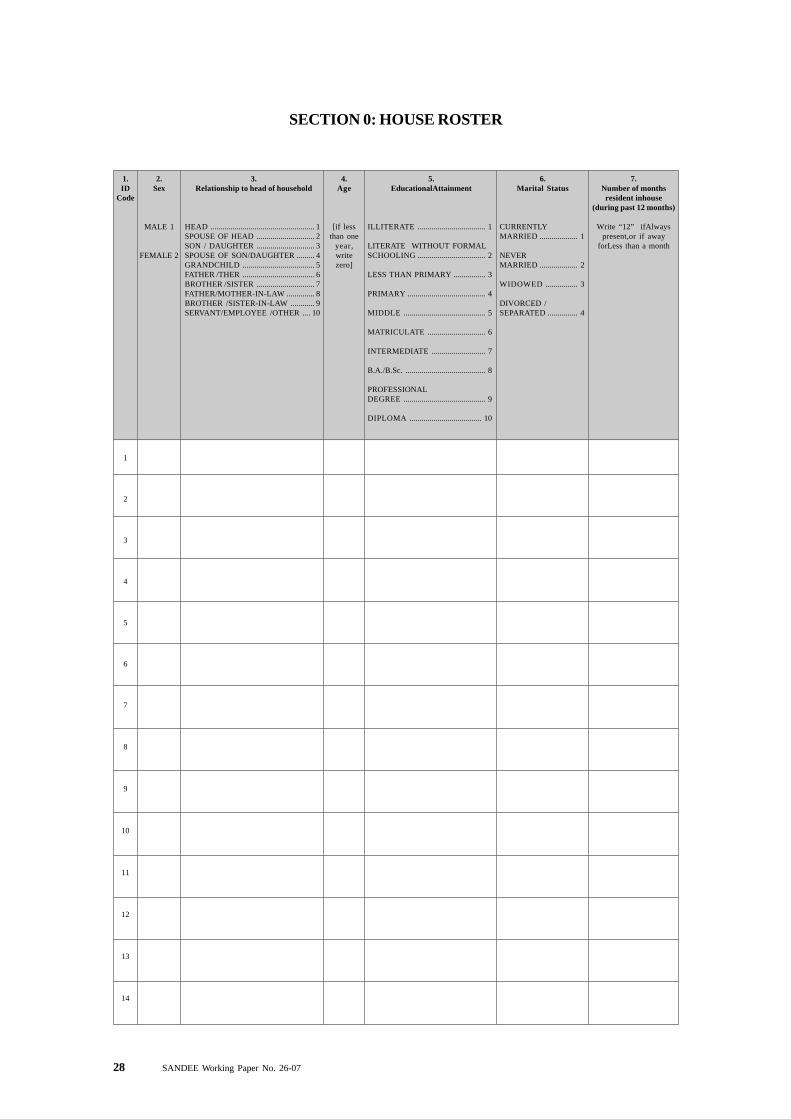
SECTION 0: HOUSE ROSTER
3.Relationship to head of household
HEAD .................................................... 1SPOUSE OF HEAD ............................. 2SON / DAUGHTER ............................. 3SPOUSE OF SON/DAUGHTER ......... 4GRANDCHILD .................................... 5FATHER /THER .................................... 6BROTHER /SISTER ............................. 7FATHER/MOTHER-IN-LAW .............. 8BROTHER /SISTER-IN-LAW ............ 9SERVANT/EMPLOYEE /OTHER .... 10
4.Age
[if lessthan one
year,writezero]
5.EducationalAttainment
ILLITERATE .................................. 1
LITERATE WITHOUT FORMALSCHOOLING .................................. 2
LESS THAN PRIMARY ................ 3
PRIMARY ....................................... 4
MIDDLE ......................................... 5
MATRICULATE ............................. 6
INTERMEDIATE ........................... 7
B.A./B.Sc. ........................................ 8
PROFESSIONALDEGREE ......................................... 9
DIPLOMA .................................... 10
6.Marital Status
CURRENTLYMARRIED ................... 1
NEVERMARRIED ................... 2
WIDOWED ................ 3
DIVORCED /SEPARATED ............... 4
7.Number of months
resident inhouse(during past 12 months)
Write “12” ifAlwayspresent,or if away
forLess than a month
2.Sex
MALE 1
FEMALE 2
1
2
3
4
5
6
7
8
9
10
11
12
13
14
1.ID
Code
SANDEE Working Paper No. 26-07 29
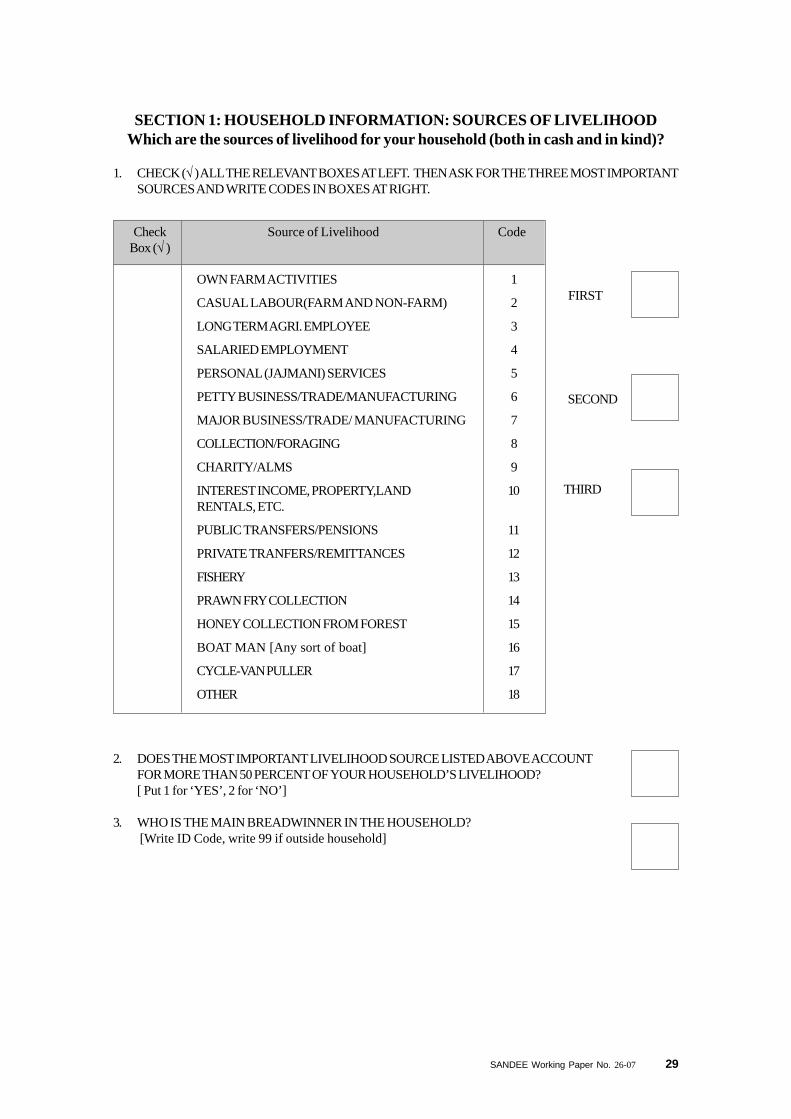
Check Source of Livelihood CodeBox (√ )
OWN FARM ACTIVITIES 1
CASUAL LABOUR(FARM AND NON-FARM) 2
LONG TERM AGRI. EMPLOYEE 3
SALARIED EMPLOYMENT 4
PERSONAL (JAJMANI) SERVICES 5
PETTY BUSINESS/TRADE/MANUFACTURING 6
MAJOR BUSINESS/TRADE/ MANUFACTURING 7
COLLECTION/FORAGING 8
CHARITY/ALMS 9
INTEREST INCOME, PROPERTY,LAND 10RENTALS, ETC.
PUBLIC TRANSFERS/PENSIONS 11
PRIVATE TRANFERS/REMITTANCES 12
FISHERY 13
PRAWN FRY COLLECTION 14
HONEY COLLECTION FROM FOREST 15
BOAT MAN [Any sort of boat] 16
CYCLE-VAN PULLER 17
OTHER 18
FIRST
2. DOES THE MOST IMPORTANT LIVELIHOOD SOURCE LISTED ABOVE ACCOUNTFOR MORE THAN 50 PERCENT OF YOUR HOUSEHOLD’S LIVELIHOOD?[ Put 1 for ‘YES’, 2 for ‘NO’]
3. WHO IS THE MAIN BREADWINNER IN THE HOUSEHOLD? [Write ID Code, write 99 if outside household]
SECTION 1: HOUSEHOLD INFORMATION: SOURCES OF LIVELIHOODWhich are the sources of livelihood for your household (both in cash and in kind)?
1. CHECK (√ ) ALL THE RELEVANT BOXES AT LEFT. THEN ASK FOR THE THREE MOST IMPORTANTSOURCES AND WRITE CODES IN BOXES AT RIGHT.
SECOND
THIRD
30 SANDEE Working Paper No. 26-07
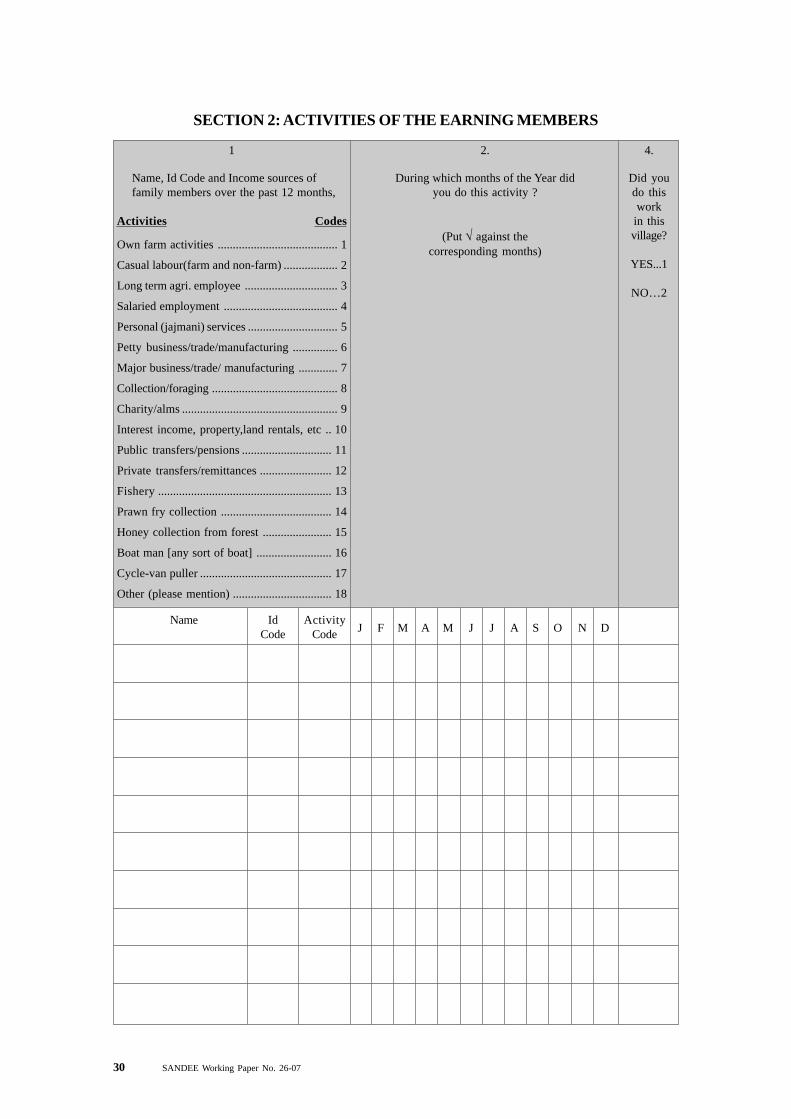
1
Name, Id Code and Income sources offamily members over the past 12 months,
Activities Codes
Own farm activities ........................................ 1
Casual labour(farm and non-farm) .................. 2
Long term agri. employee ............................... 3
Salaried employment ...................................... 4
Personal (jajmani) services .............................. 5
Petty business/trade/manufacturing ............... 6
Major business/trade/ manufacturing ............. 7
Collection/foraging .......................................... 8
Charity/alms .................................................... 9
Interest income, property,land rentals, etc .. 10
Public transfers/pensions .............................. 11
Private transfers/remittances ........................ 12
Fishery .......................................................... 13
Prawn fry collection ..................................... 14
Honey collection from forest ....................... 15
Boat man [any sort of boat] ......................... 16
Cycle-van puller ............................................ 17
Other (please mention) ................................. 18
2.
During which months of the Year didyou do this activity ?
(Put √ against thecorresponding months)
4.
Did youdo thisworkin thisvillage?
YES...1
NO…2
Name IdCode
ActivityCode J F M A M J J A S O N D
SECTION 2: ACTIVITIES OF THE EARNING MEMBERS
SANDEE Working Paper No. 26-07 31
1. Dwelling Unit 1 2. Do you have secure rights on your[Please put √ on appropriate code] homestead land ?
[Please put √ on appropriate code]
OWNED 1 YES, OWNED 1
RENTED 2 YES, PATTA 1
OTHER (please mention) 3 NO 3
NO DWELLING UNIT 4
3. Type of structure 4. Floor type[Please put √ on appropriate code] [Please put √ on appropriate code]
KATCHA / THATCH 1 MUD 1
KATCHA / TILE 2 BRICK 2
SEMI - PUCCA 3 CEMENT/STONE/TILE 3
SECTOR HOUSING SCHEMES 4 OTHER (Please mention) 4
PUCCA 5
5. Number of separate rooms in the household.
SECTION 3: HOUSING
1 DWELLING means the building, or group of buildings, in which the household lives. The dwelling may bea hut, a group of huts, a single house, a group of houses, a villa, an apartment, several one-room apart-ments in a courtyard, or any other type of residential unit. If the household occupies a portion of a house,refer to that portion when answering the questions.
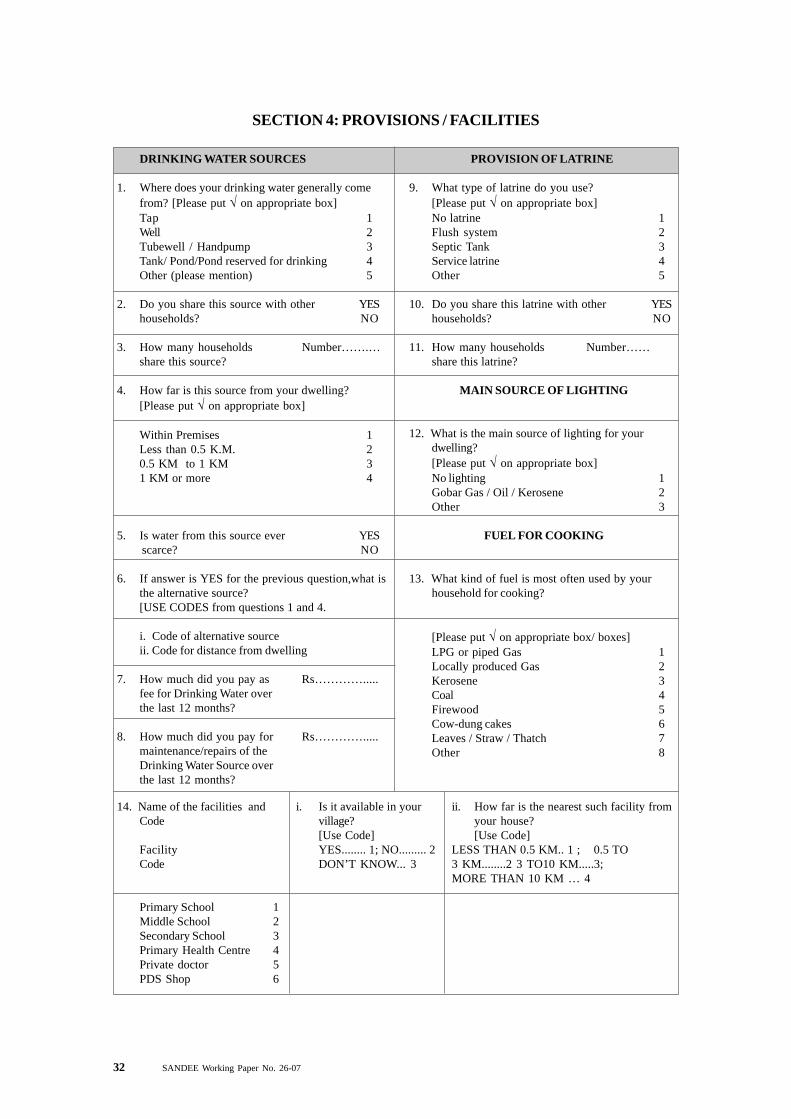
32 SANDEE Working Paper No. 26-07
DRINKING WATER SOURCES
1. Where does your drinking water generally comefrom? [Please put √ on appropriate box]Tap 1Well 2Tubewell / Handpump 3Tank/ Pond/Pond reserved for drinking 4Other (please mention) 5
2. Do you share this source with other YEShouseholds? NO
3. How many households Number…….…share this source?
4. How far is this source from your dwelling?[Please put √ on appropriate box]
Within Premises 1Less than 0.5 K.M. 20.5 KM to 1 KM 31 KM or more 4
5. Is water from this source ever YES scarce? NO
6. If answer is YES for the previous question,what isthe alternative source?[USE CODES from questions 1 and 4.
i. Code of alternative sourceii. Code for distance from dwelling
7. How much did you pay as Rs………….....fee for Drinking Water overthe last 12 months?
8. How much did you pay for Rs………….....maintenance/repairs of theDrinking Water Source overthe last 12 months?
PROVISION OF LATRINE
9. What type of latrine do you use?[Please put √ on appropriate box]No latrine 1Flush system 2Septic Tank 3Service latrine 4Other 5
10. Do you share this latrine with other YEShouseholds? NO
11. How many households Number……share this latrine?
MAIN SOURCE OF LIGHTING
12. What is the main source of lighting for yourdwelling?[Please put √ on appropriate box]No lighting 1Gobar Gas / Oil / Kerosene 2Other 3
FUEL FOR COOKING
13. What kind of fuel is most often used by yourhousehold for cooking?
[Please put √ on appropriate box/ boxes]LPG or piped Gas 1Locally produced Gas 2Kerosene 3Coal 4Firewood 5Cow-dung cakes 6Leaves / Straw / Thatch 7Other 8
SECTION 4: PROVISIONS / FACILITIES
14. Name of the facilities andCode
FacilityCode
Primary School 1Middle School 2Secondary School 3Primary Health Centre 4Private doctor 5PDS Shop 6
i. Is it available in yourvillage?[Use Code]YES........ 1; NO......... 2DON’T KNOW... 3
ii. How far is the nearest such facility fromyour house?[Use Code]
LESS THAN 0.5 KM.. 1 ; 0.5 TO3 KM........2 3 TO10 KM.....3;MORE THAN 10 KM … 4
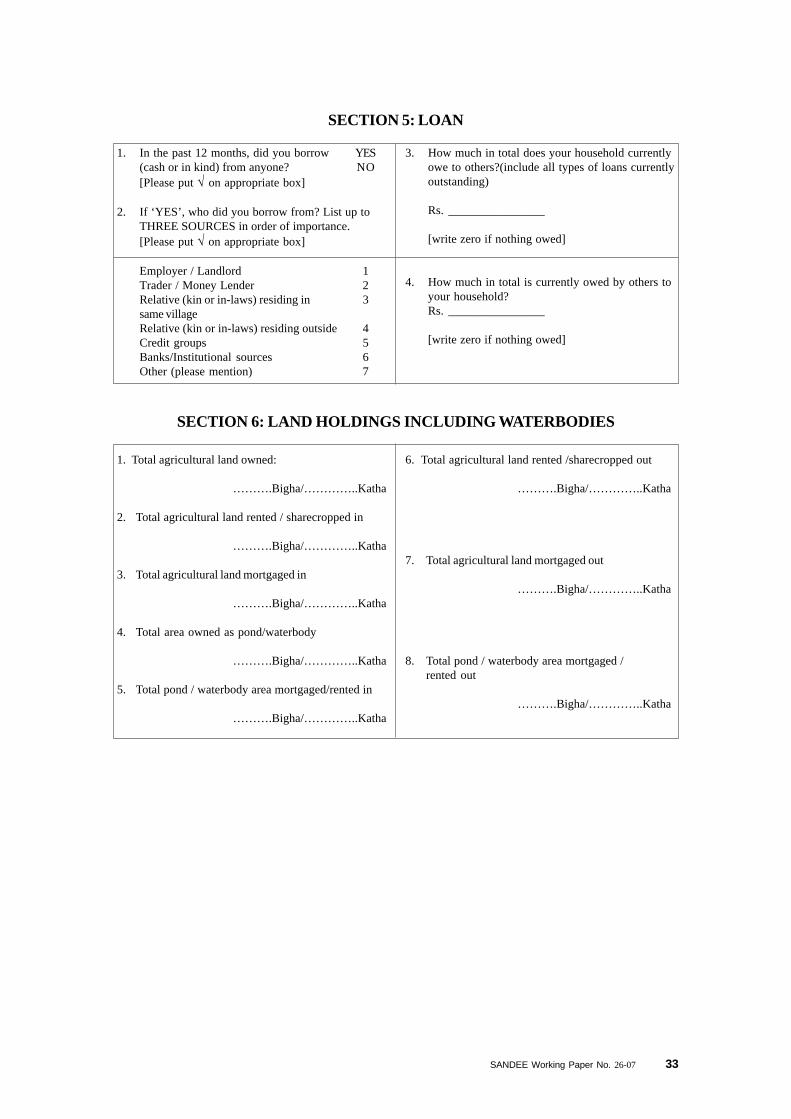
SANDEE Working Paper No. 26-07 33
1. In the past 12 months, did you borrow YES(cash or in kind) from anyone? NO[Please put √ on appropriate box]
2. If ‘YES’, who did you borrow from? List up toTHREE SOURCES in order of importance.[Please put √ on appropriate box]
Employer / Landlord 1Trader / Money Lender 2Relative (kin or in-laws) residing in 3same villageRelative (kin or in-laws) residing outside 4Credit groups 5Banks/Institutional sources 6Other (please mention) 7
3. How much in total does your household currentlyowe to others?(include all types of loans currentlyoutstanding)
Rs. ________________
[write zero if nothing owed]
4. How much in total is currently owed by others toyour household?Rs. ________________
[write zero if nothing owed]
SECTION 5: LOAN
SECTION 6: LAND HOLDINGS INCLUDING WATERBODIES
1. Total agricultural land owned:
……….Bigha/…………..Katha
2. Total agricultural land rented / sharecropped in
……….Bigha/…………..Katha
3. Total agricultural land mortgaged in
……….Bigha/…………..Katha
4. Total area owned as pond/waterbody
……….Bigha/…………..Katha
5. Total pond / waterbody area mortgaged/rented in
……….Bigha/…………..Katha
6. Total agricultural land rented /sharecropped out
……….Bigha/…………..Katha
7. Total agricultural land mortgaged out
……….Bigha/…………..Katha
8. Total pond / waterbody area mortgaged /rented out
……….Bigha/…………..Katha
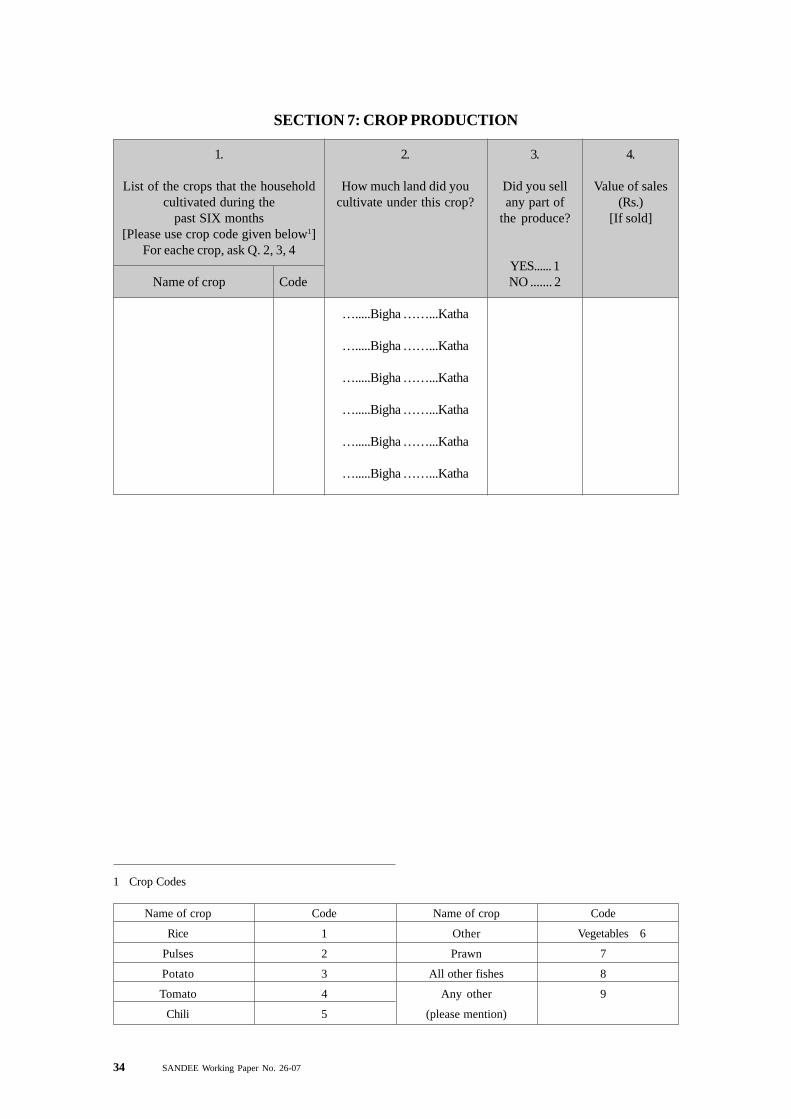
34 SANDEE Working Paper No. 26-07
1.
List of the crops that the householdcultivated during the
past SIX months[Please use crop code given below1]
For eache crop, ask Q. 2, 3, 4
Name of crop Code
2.
How much land did youcultivate under this crop?
….....Bigha ……...Katha
….....Bigha ……...Katha
….....Bigha ……...Katha
….....Bigha ……...Katha
….....Bigha ……...Katha
….....Bigha ……...Katha
3.
Did you sellany part of
the produce?
YES...... 1NO ....... 2
4.
Value of sales(Rs.)
[If sold]
SECTION 7: CROP PRODUCTION
1 Crop Codes
Name of crop Code Name of crop Code
Rice 1 Other Vegetables 6
Pulses 2 Prawn 7
Potato 3 All other fishes 8
Tomato 4 Any other 9
Chili 5 (please mention)
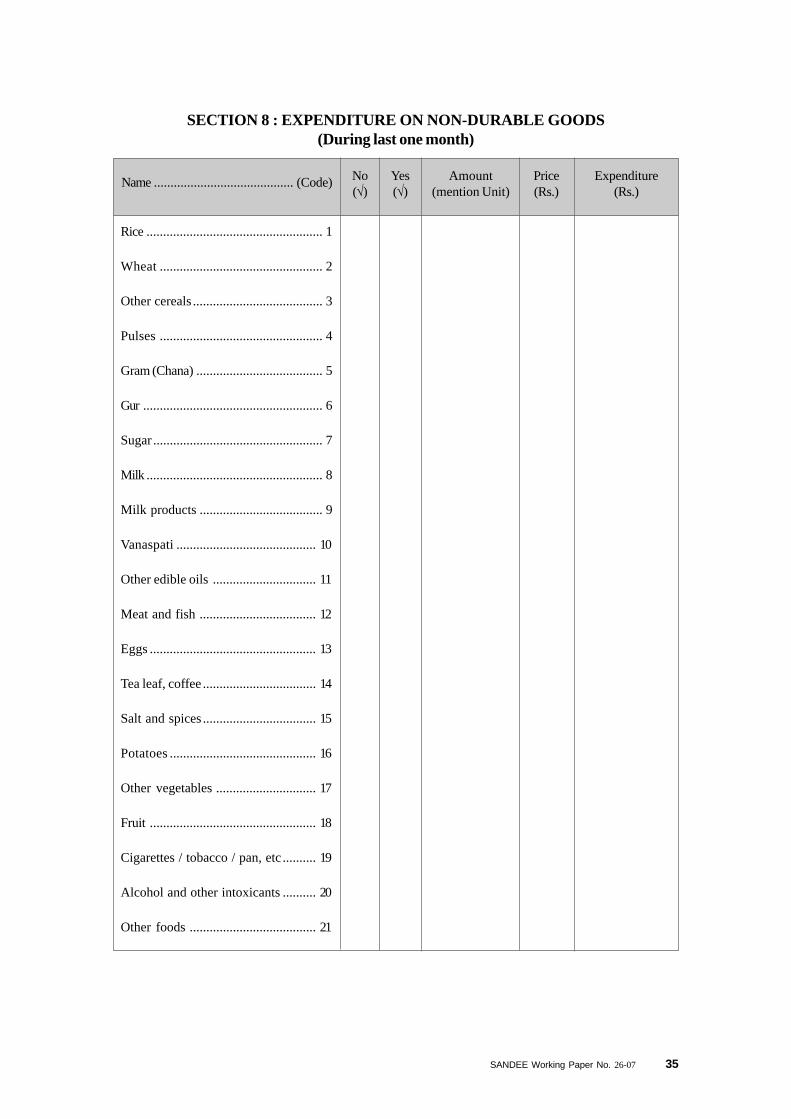
SANDEE Working Paper No. 26-07 35
Rice ..................................................... 1
Wheat ................................................. 2
Other cereals ....................................... 3
Pulses ................................................. 4
Gram (Chana) ...................................... 5
Gur ...................................................... 6
Sugar ................................................... 7
Milk ..................................................... 8
Milk products ..................................... 9
Vanaspati .......................................... 10
Other edible oils ............................... 11
Meat and fish ................................... 12
Eggs .................................................. 13
Tea leaf, coffee .................................. 14
Salt and spices .................................. 15
Potatoes ............................................ 16
Other vegetables .............................. 17
Fruit .................................................. 18
Cigarettes / tobacco / pan, etc .......... 19
Alcohol and other intoxicants .......... 20
Other foods ...................................... 21
Amount(mention Unit)
Expenditure(Rs.)
Name .......................................... (Code) No(√)
Yes(√)
Price(Rs.)
SECTION 8 : EXPENDITURE ON NON-DURABLE GOODS(During last one month)
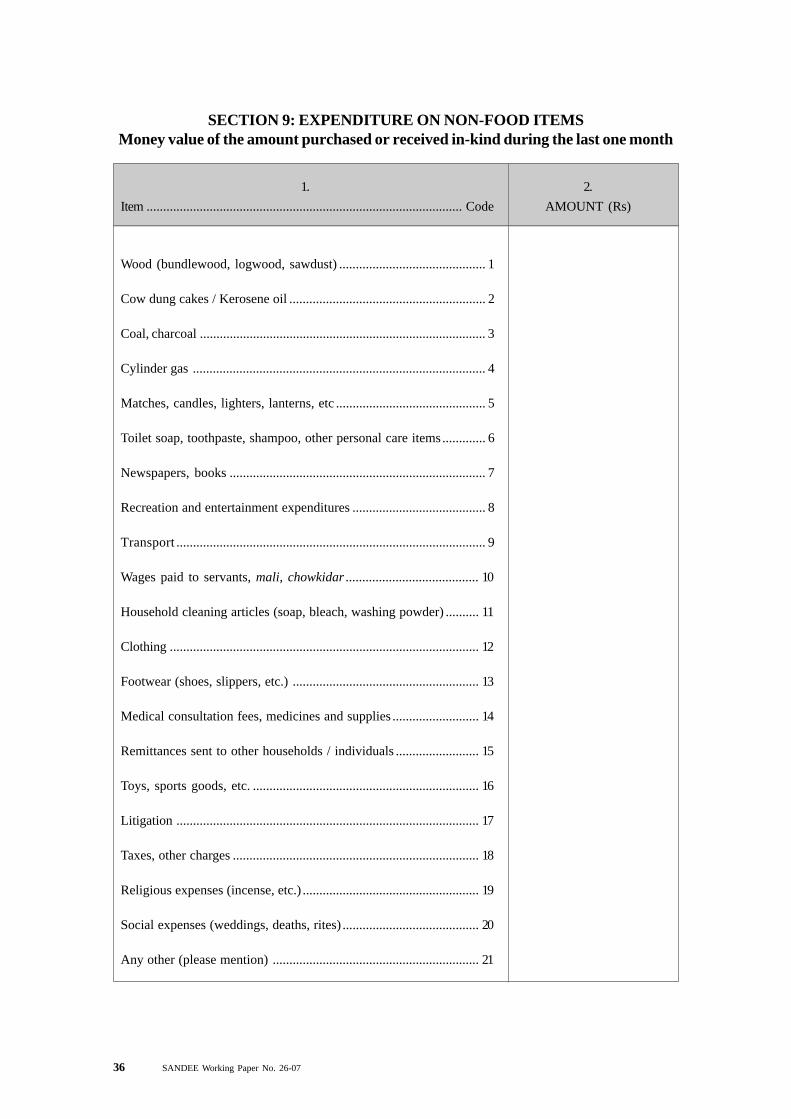
36 SANDEE Working Paper No. 26-07
Wood (bundlewood, logwood, sawdust) ............................................ 1
Cow dung cakes / Kerosene oil ........................................................... 2
Coal, charcoal ...................................................................................... 3
Cylinder gas ........................................................................................ 4
Matches, candles, lighters, lanterns, etc ............................................. 5
Toilet soap, toothpaste, shampoo, other personal care items............. 6
Newspapers, books ............................................................................. 7
Recreation and entertainment expenditures ........................................ 8
Transport ............................................................................................. 9
Wages paid to servants, mali, chowkidar ........................................ 10
Household cleaning articles (soap, bleach, washing powder) .......... 11
Clothing ............................................................................................. 12
Footwear (shoes, slippers, etc.) ........................................................ 13
Medical consultation fees, medicines and supplies .......................... 14
Remittances sent to other households / individuals ......................... 15
Toys, sports goods, etc. .................................................................... 16
Litigation ........................................................................................... 17
Taxes, other charges .......................................................................... 18
Religious expenses (incense, etc.) ..................................................... 19
Social expenses (weddings, deaths, rites) ......................................... 20
Any other (please mention) .............................................................. 21
1. 2.
Item ............................................................................................... Code AMOUNT (Rs)
SECTION 9: EXPENDITURE ON NON-FOOD ITEMSMoney value of the amount purchased or received in-kind during the last one month
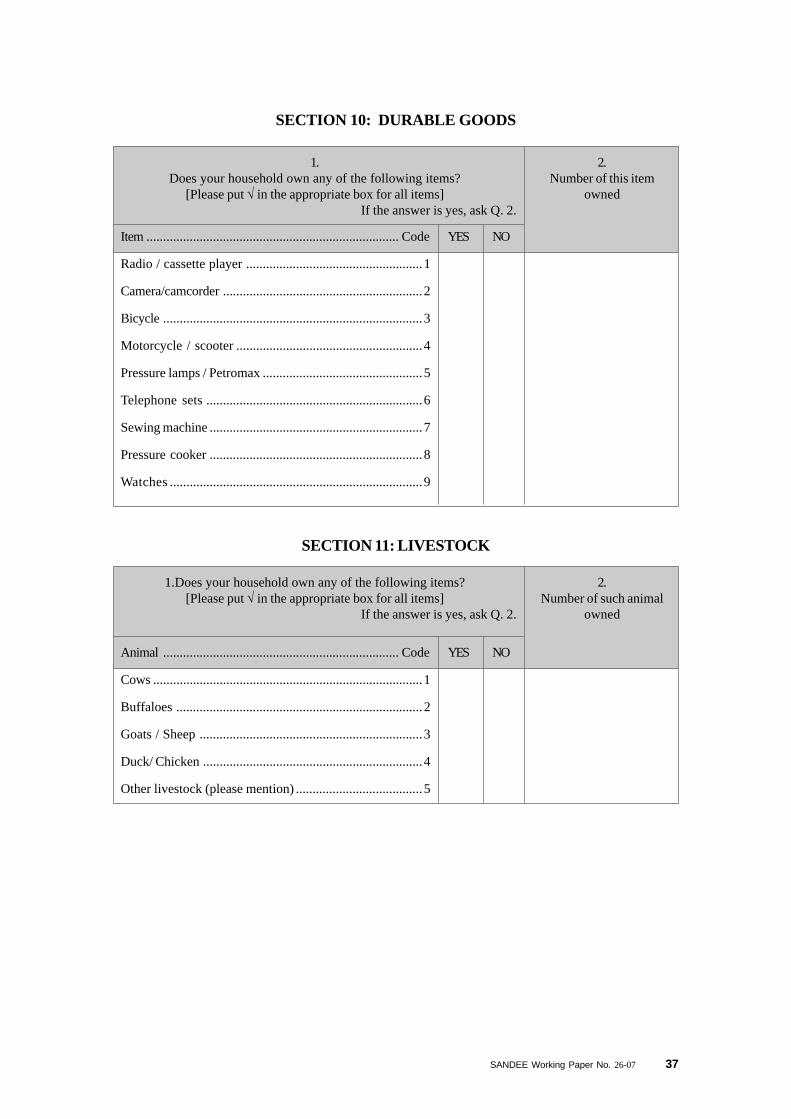
SANDEE Working Paper No. 26-07 37
Item ............................................................................ Code YES NO
Radio / cassette player .....................................................1
Camera/camcorder ............................................................2
Bicycle ..............................................................................3
Motorcycle / scooter ........................................................4
Pressure lamps / Petromax ................................................5
Telephone sets .................................................................6
Sewing machine ................................................................7
Pressure cooker ................................................................8
Watches ............................................................................9
SECTION 10: DURABLE GOODS
1.Does your household own any of the following items?
[Please put √ in the appropriate box for all items]If the answer is yes, ask Q. 2.
2.Number of this item
owned
Animal ....................................................................... Code YES NO
Cows .................................................................................1
Buffaloes ..........................................................................2
Goats / Sheep ...................................................................3
Duck/ Chicken ..................................................................4
Other livestock (please mention) ......................................5
1.Does your household own any of the following items?[Please put √ in the appropriate box for all items]
If the answer is yes, ask Q. 2.
2.Number of such animal
owned
SECTION 11: LIVESTOCK
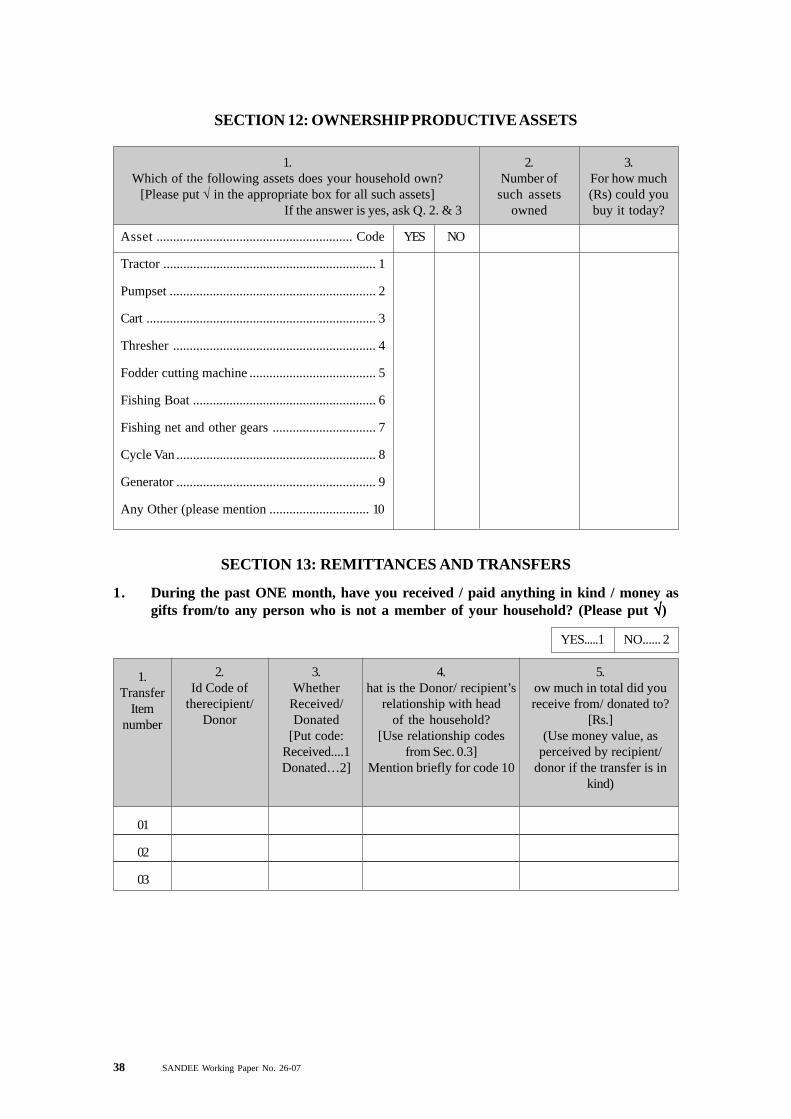
38 SANDEE Working Paper No. 26-07
Asset ........................................................... Code YES NO
Tractor ................................................................ 1
Pumpset .............................................................. 2
Cart ..................................................................... 3
Thresher ............................................................. 4
Fodder cutting machine ...................................... 5
Fishing Boat ....................................................... 6
Fishing net and other gears ............................... 7
Cycle Van ............................................................ 8
Generator ............................................................ 9
Any Other (please mention .............................. 10
SECTION 12: OWNERSHIP PRODUCTIVE ASSETS
1.Which of the following assets does your household own?
[Please put √ in the appropriate box for all such assets]If the answer is yes, ask Q. 2. & 3
2.Number of
such assetsowned
3.For how much(Rs) could youbuy it today?
01
02
03
SECTION 13: REMITTANCES AND TRANSFERS
1. During the past ONE month, have you received / paid anything in kind / money asgifts from/to any person who is not a member of your household? (Please put √√√√√)
YES.....1 NO...... 2
1.Transfer
Itemnumber
2.Id Code of
therecipient/Donor
3.Whether
Received/Donated
[Put code:Received....1Donated…2]
4.hat is the Donor/ recipient’s
relationship with headof the household?
[Use relationship codesfrom Sec. 0.3]
Mention briefly for code 10
5.ow much in total did youreceive from/ donated to?
[Rs.](Use money value, as
perceived by recipient/donor if the transfer is in
kind)
SANDEE Working Paper No. 26-07 39
Information collected by this questionnaire will be used exclusively for the GCP-SANDEE project under JadavpurUniversity during 2005-2006. The confidentiality of the supplied information will be duly maintained
South Asian Network forDevelopment and Environmental Economics
PO Box 8975 EPC – 1056 · Kathmandu · Nepal · Telephone 977-1-552 8761, 552 6391· Fax 977-1-553 6786
THE GCP-SANDEE PROJECT·
2005 - 2006
HOUSEHOLD EXPENDITURE SURVEY
SECOND - ROUND(FEBRUARY - MARCH, 2006)
Village ...........………………… Household No. ………..
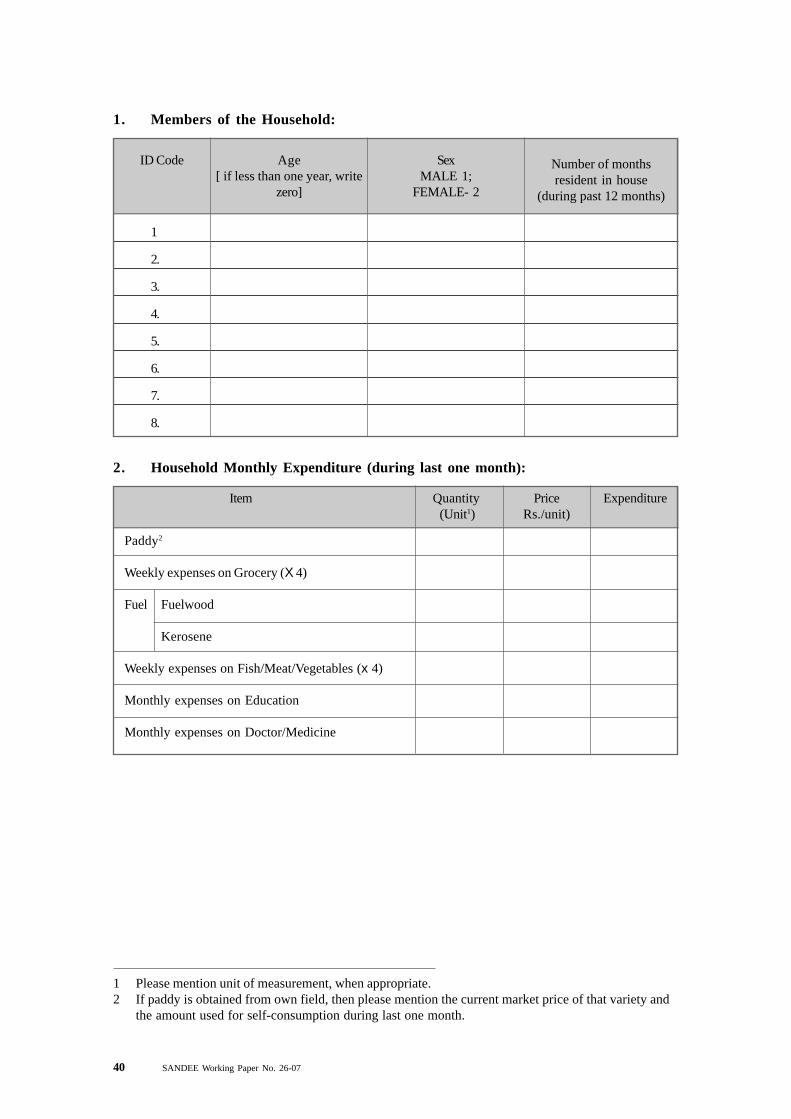
40 SANDEE Working Paper No. 26-07
1
2.
3.
4.
5.
6.
7.
8.
1. Members of the Household:
ID Code Age[ if less than one year, write
zero]
SexMALE 1;
FEMALE- 2
Number of monthsresident in house
(during past 12 months)
Paddy2
Weekly expenses on Grocery (X 4)
Fuel Fuelwood
Kerosene
Weekly expenses on Fish/Meat/Vegetables (x 4)
Monthly expenses on Education
Monthly expenses on Doctor/Medicine
2. Household Monthly Expenditure (during last one month):
Item Quantity Price Expenditure (Unit1) Rs./unit)
1 Please mention unit of measurement, when appropriate.2 If paddy is obtained from own field, then please mention the current market price of that variety and
the amount used for self-consumption during last one month.
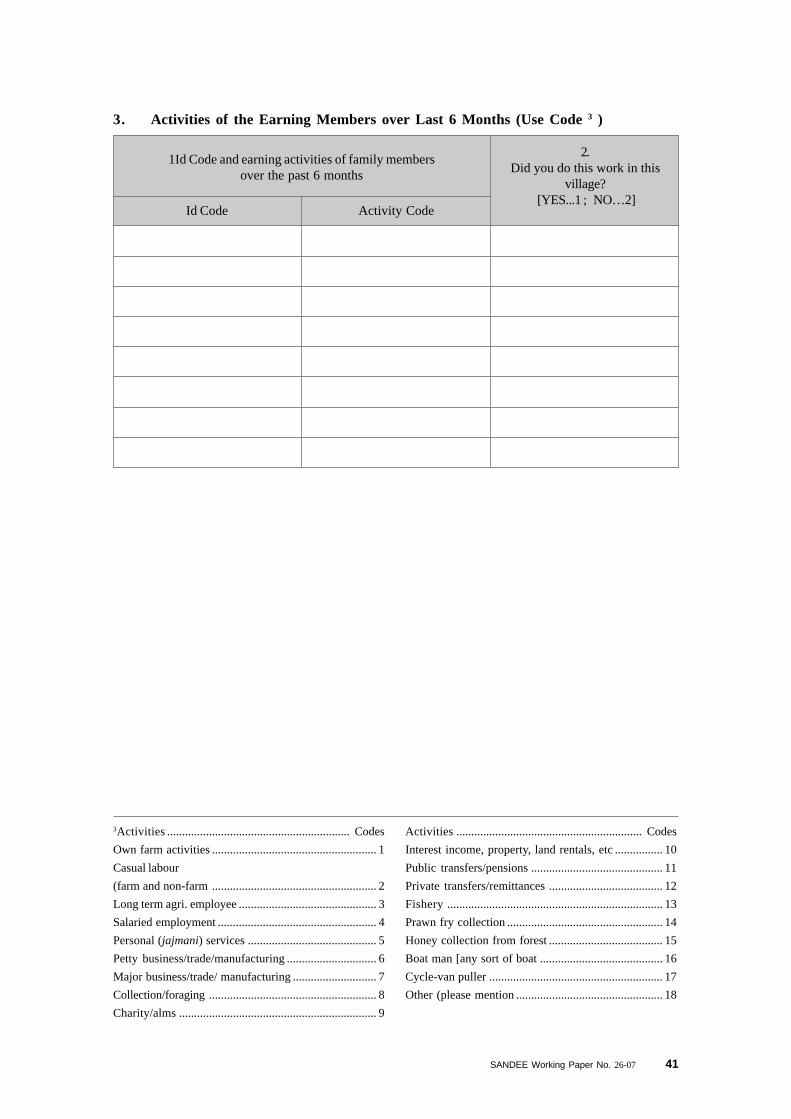
SANDEE Working Paper No. 26-07 41
3. Activities of the Earning Members over Last 6 Months (Use Code 3 )
2.Did you do this work in this
village? [YES...1 ; NO…2]
1Id Code and earning activities of family membersover the past 6 months
Id Code Activity Code
3Activities ............................................................. Codes
Own farm activities ....................................................... 1
Casual labour
(farm and non-farm ....................................................... 2
Long term agri. employee .............................................. 3
Salaried employment ..................................................... 4
Personal (jajmani) services ........................................... 5
Petty business/trade/manufacturing .............................. 6
Major business/trade/ manufacturing ............................ 7
Collection/foraging ........................................................ 8
Charity/alms .................................................................. 9
Activities .............................................................. Codes
Interest income, property, land rentals, etc ................ 10
Public transfers/pensions ............................................ 11
Private transfers/remittances ...................................... 12
Fishery ........................................................................ 13
Prawn fry collection .................................................... 14
Honey collection from forest ...................................... 15
Boat man [any sort of boat ......................................... 16
Cycle-van puller .......................................................... 17
Other (please mention ................................................. 18
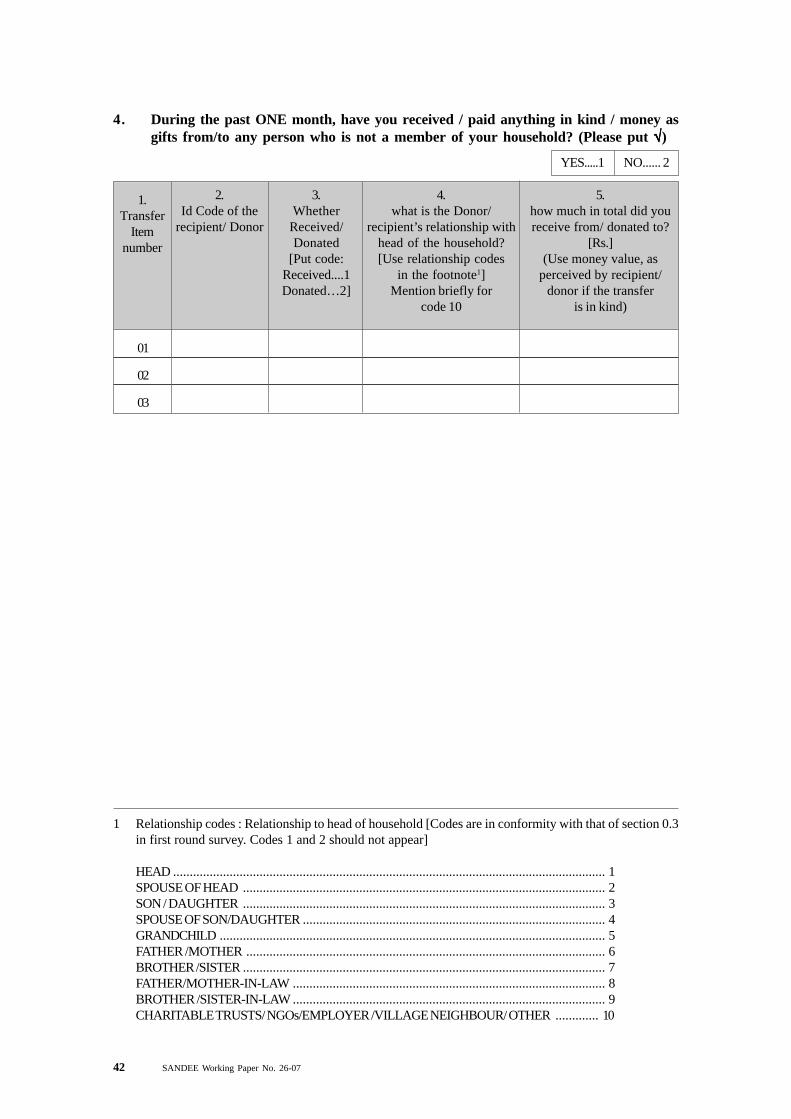
42 SANDEE Working Paper No. 26-07
01
02
03
4. During the past ONE month, have you received / paid anything in kind / money asgifts from/to any person who is not a member of your household? (Please put √√√√√)
YES.....1 NO...... 2
1.Transfer
Itemnumber
2.Id Code of the
recipient/ Donor
3.Whether
Received/Donated
[Put code:Received....1Donated…2]
4.what is the Donor/
recipient’s relationship withhead of the household?[Use relationship codes
in the footnote1]Mention briefly for
code 10
5.how much in total did youreceive from/ donated to?
[Rs.](Use money value, as
perceived by recipient/donor if the transfer
is in kind)
1 Relationship codes : Relationship to head of household [Codes are in conformity with that of section 0.3in first round survey. Codes 1 and 2 should not appear]
HEAD .................................................................................................................................. 1SPOUSE OF HEAD ............................................................................................................. 2SON / DAUGHTER ............................................................................................................. 3SPOUSE OF SON/DAUGHTER ........................................................................................... 4GRANDCHILD .................................................................................................................... 5FATHER /MOTHER ............................................................................................................ 6BROTHER /SISTER ............................................................................................................. 7FATHER/MOTHER-IN-LAW .............................................................................................. 8BROTHER /SISTER-IN-LAW .............................................................................................. 9CHARITABLE TRUSTS/ NGOs/EMPLOYER /VILLAGE NEIGHBOUR/ OTHER ............. 10
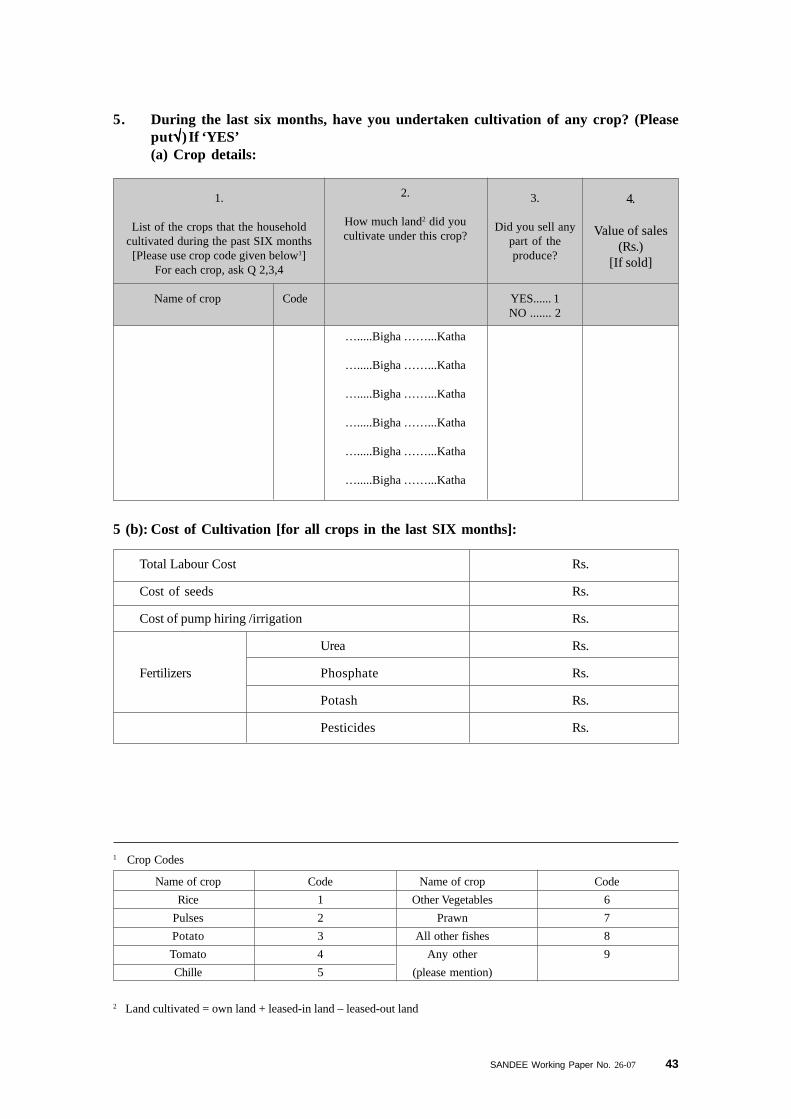
SANDEE Working Paper No. 26-07 43
1 Crop Codes
Name of crop Code Name of crop Code
Rice 1 Other Vegetables 6
Pulses 2 Prawn 7
Potato 3 All other fishes 8
Tomato 4 Any other 9
Chille 5 (please mention)
2 Land cultivated = own land + leased-in land – leased-out land
5. During the last six months, have you undertaken cultivation of any crop? (Pleaseput√√√√√) If ‘YES’(a) Crop details:
1.
List of the crops that the householdcultivated during the past SIX months[Please use crop code given below1]
For each crop, ask Q 2,3,4
Name of crop Code
2.
How much land2 did youcultivate under this crop?
….....Bigha ……...Katha
….....Bigha ……...Katha
….....Bigha ……...Katha
….....Bigha ……...Katha
….....Bigha ……...Katha
….....Bigha ……...Katha
3.
Did you sell anypart of theproduce?
YES...... 1NO ....... 2
4.
Value of sales(Rs.)
[If sold]
Total Labour Cost Rs.
Cost of seeds Rs.
Cost of pump hiring /irrigation Rs.
Urea Rs.
Fertilizers Phosphate Rs.
Potash Rs.
Pesticides Rs.
5 (b): Cost of Cultivation [for all crops in the last SIX months]:
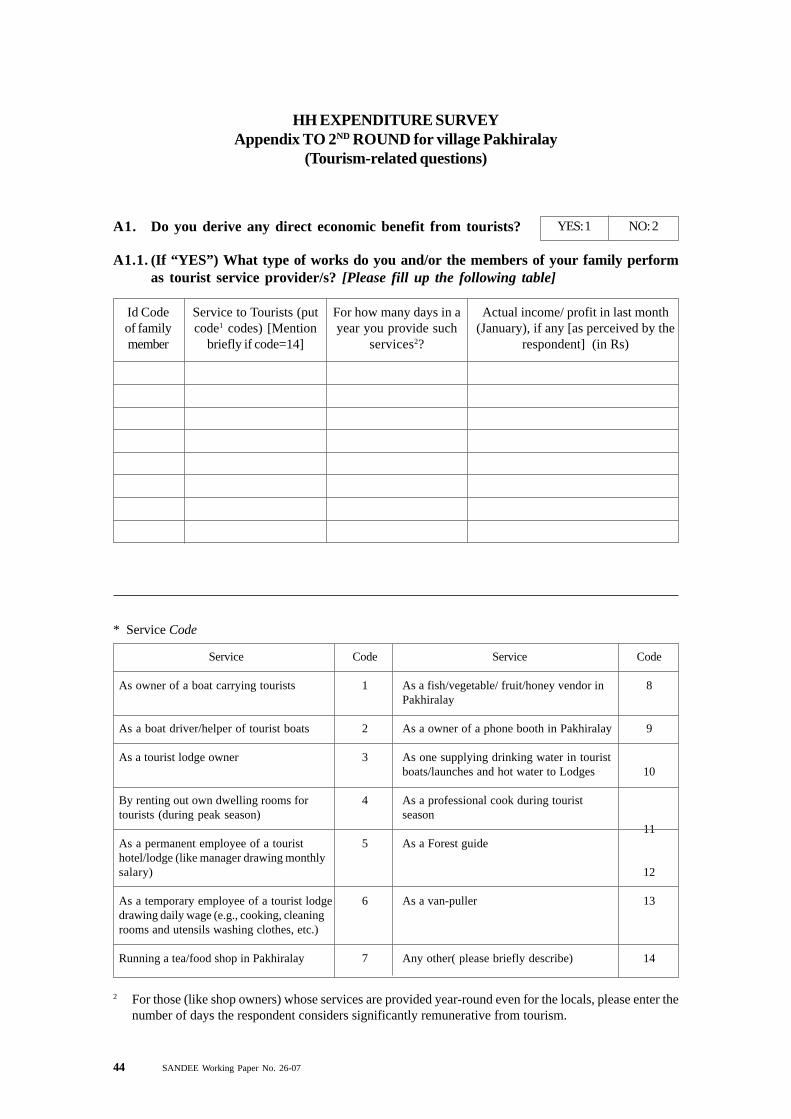
44 SANDEE Working Paper No. 26-07
A1. Do you derive any direct economic benefit from tourists?
A1.1. (If “YES”) What type of works do you and/or the members of your family performas tourist service provider/s? [Please fill up the following table]
HH EXPENDITURE SURVEYAppendix TO 2ND ROUND for village Pakhiralay
(Tourism-related questions)
NO: 2YES: 1
Id Codeof familymember
Service to Tourists (putcode1 codes) [Mention
briefly if code=14]
For how many days in ayear you provide such
services2?
2 For those (like shop owners) whose services are provided year-round even for the locals, please enter thenumber of days the respondent considers significantly remunerative from tourism.
Actual income/ profit in last month(January), if any [as perceived by the
respondent] (in Rs)
Service
As owner of a boat carrying tourists
As a boat driver/helper of tourist boats
As a tourist lodge owner
By renting out own dwelling rooms fortourists (during peak season)
As a permanent employee of a touristhotel/lodge (like manager drawing monthlysalary)
As a temporary employee of a tourist lodgedrawing daily wage (e.g., cooking, cleaningrooms and utensils washing clothes, etc.)
Running a tea/food shop in Pakhiralay
Code
1
2
3
4
5
6
7
Service
As a fish/vegetable/ fruit/honey vendor inPakhiralay
As a owner of a phone booth in Pakhiralay
As one supplying drinking water in touristboats/launches and hot water to Lodges
As a professional cook during touristseason
As a Forest guide
As a van-puller
Any other( please briefly describe)
Code
8
9
10
11
12
13
14
* Service Code
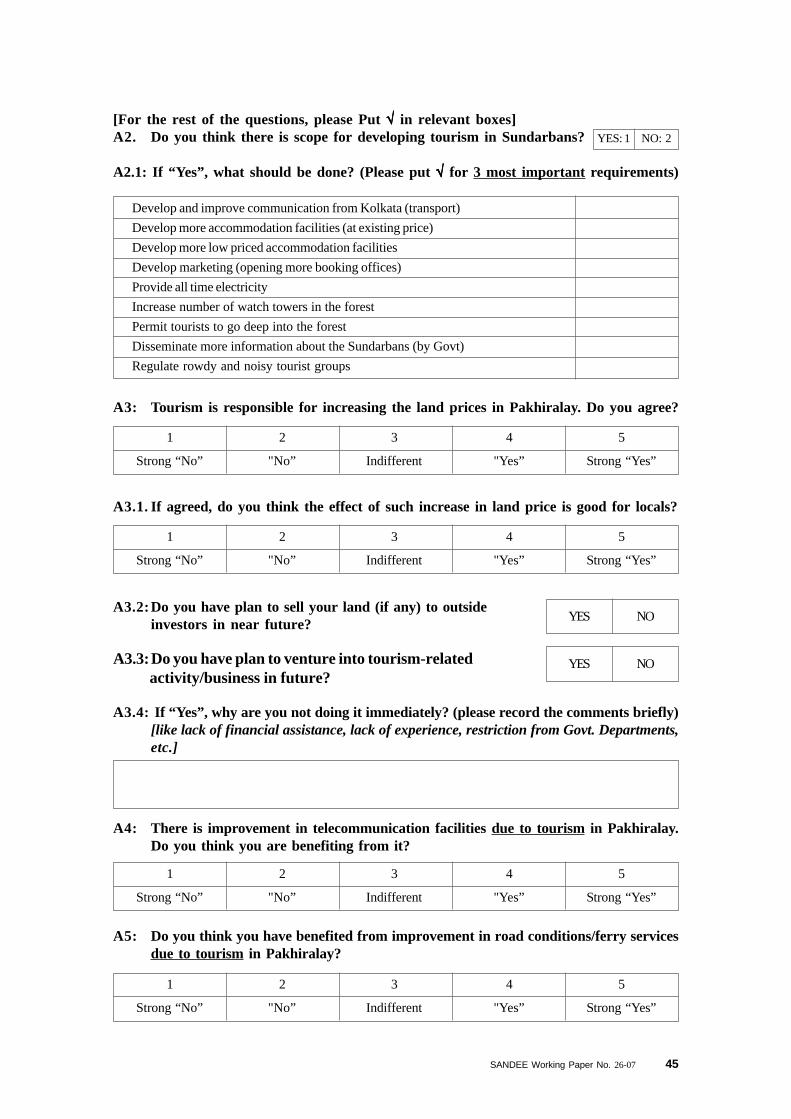
SANDEE Working Paper No. 26-07 45
Develop and improve communication from Kolkata (transport)
Develop more accommodation facilities (at existing price)
Develop more low priced accommodation facilities
Develop marketing (opening more booking offices)
Provide all time electricity
Increase number of watch towers in the forest
Permit tourists to go deep into the forest
Disseminate more information about the Sundarbans (by Govt)
Regulate rowdy and noisy tourist groups
[For the rest of the questions, please Put √ √ √ √ √ in relevant boxes]A2. Do you think there is scope for developing tourism in Sundarbans?
A2.1: If “Yes”, what should be done? (Please put √√√√√ for 3 most important requirements)
A3: Tourism is responsible for increasing the land prices in Pakhiralay. Do you agree?
1 2 3 4 5
Strong “No” "No” Indifferent "Yes” Strong “Yes”
A3.1. If agreed, do you think the effect of such increase in land price is good for locals?
1 2 3 4 5
Strong “No” "No” Indifferent "Yes” Strong “Yes”
A3.2:Do you have plan to sell your land (if any) to outsideinvestors in near future?
A3.3:Do you have plan to venture into tourism-related activity/business in future?
A3.4: If “Yes”, why are you not doing it immediately? (please record the comments briefly)[like lack of financial assistance, lack of experience, restriction from Govt. Departments,etc.]
NOYES
NOYES
A4: There is improvement in telecommunication facilities due to tourism in Pakhiralay.Do you think you are benefiting from it?
1 2 3 4 5
Strong “No” "No” Indifferent "Yes” Strong “Yes”
A5: Do you think you have benefited from improvement in road conditions/ferry servicesdue to tourism in Pakhiralay?
1 2 3 4 5
Strong “No” "No” Indifferent "Yes” Strong “Yes”
NO: 2YES: 1
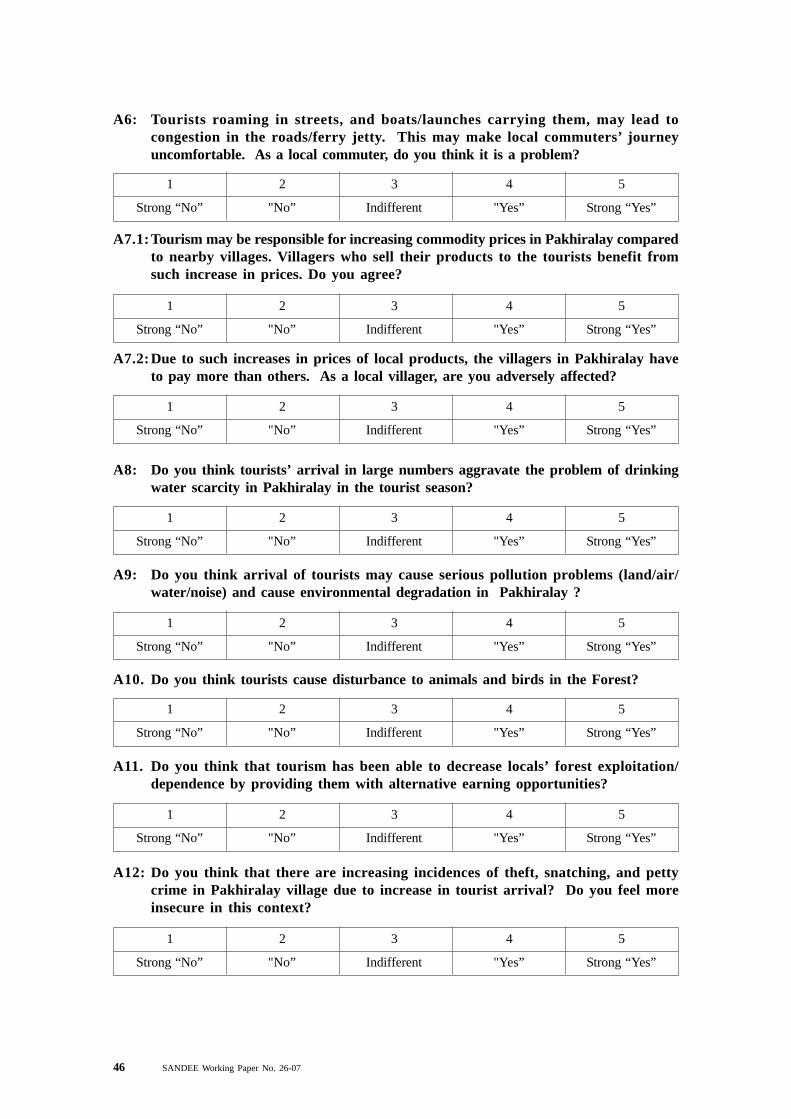
46 SANDEE Working Paper No. 26-07
A6: Tourists roaming in streets, and boats/launches carrying them, may lead tocongestion in the roads/ferry jetty. This may make local commuters’ journeyuncomfortable. As a local commuter, do you think it is a problem?
1 2 3 4 5
Strong “No” "No” Indifferent "Yes” Strong “Yes”
A7.1:Tourism may be responsible for increasing commodity prices in Pakhiralay comparedto nearby villages. Villagers who sell their products to the tourists benefit fromsuch increase in prices. Do you agree?
1 2 3 4 5
Strong “No” "No” Indifferent "Yes” Strong “Yes”
A7.2:Due to such increases in prices of local products, the villagers in Pakhiralay haveto pay more than others. As a local villager, are you adversely affected?
1 2 3 4 5
Strong “No” "No” Indifferent "Yes” Strong “Yes”
A8: Do you think tourists’ arrival in large numbers aggravate the problem of drinkingwater scarcity in Pakhiralay in the tourist season?
1 2 3 4 5
Strong “No” "No” Indifferent "Yes” Strong “Yes”
A9: Do you think arrival of tourists may cause serious pollution problems (land/air/water/noise) and cause environmental degradation in Pakhiralay ?
1 2 3 4 5
Strong “No” "No” Indifferent "Yes” Strong “Yes”
A10. Do you think tourists cause disturbance to animals and birds in the Forest?
1 2 3 4 5
Strong “No” "No” Indifferent "Yes” Strong “Yes”
A11. Do you think that tourism has been able to decrease locals’ forest exploitation/dependence by providing them with alternative earning opportunities?
1 2 3 4 5
Strong “No” "No” Indifferent "Yes” Strong “Yes”
A12: Do you think that there are increasing incidences of theft, snatching, and pettycrime in Pakhiralay village due to increase in tourist arrival? Do you feel moreinsecure in this context?
1 2 3 4 5
Strong “No” "No” Indifferent "Yes” Strong “Yes”
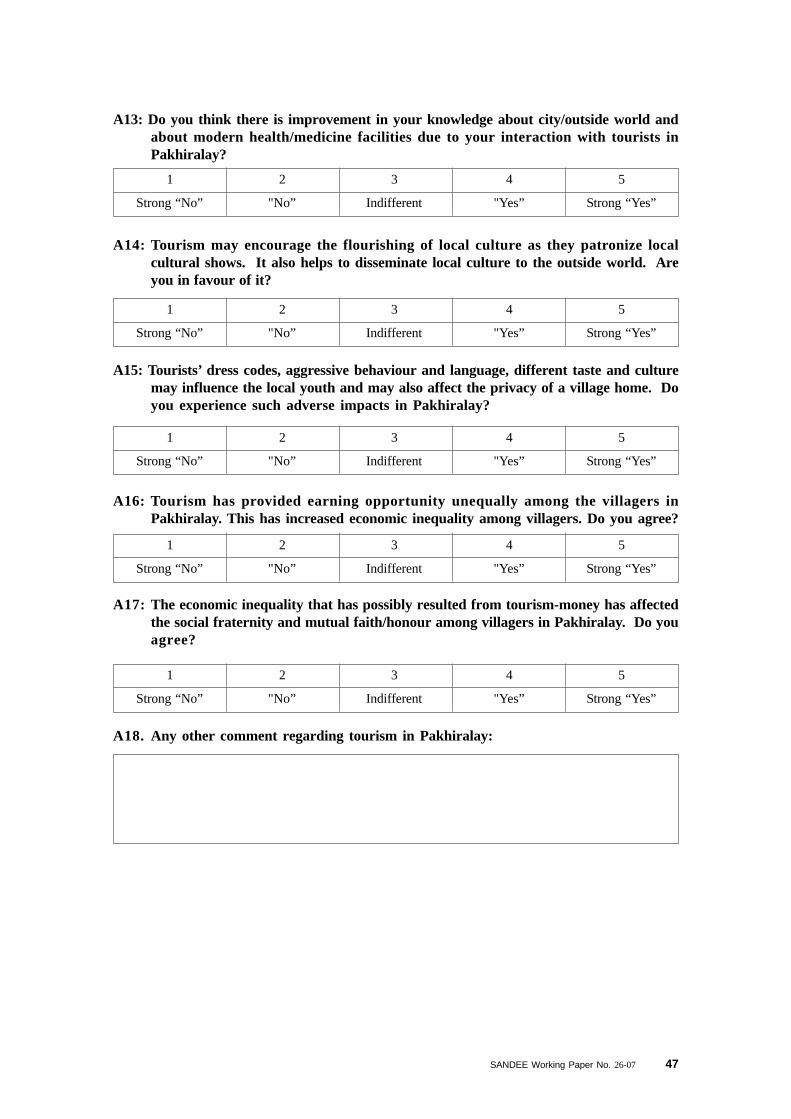
SANDEE Working Paper No. 26-07 47
A13: Do you think there is improvement in your knowledge about city/outside world andabout modern health/medicine facilities due to your interaction with tourists inPakhiralay?
1 2 3 4 5
Strong “No” "No” Indifferent "Yes” Strong “Yes”
A14: Tourism may encourage the flourishing of local culture as they patronize localcultural shows. It also helps to disseminate local culture to the outside world. Areyou in favour of it?
1 2 3 4 5
Strong “No” "No” Indifferent "Yes” Strong “Yes”
A15: Tourists’ dress codes, aggressive behaviour and language, different taste and culturemay influence the local youth and may also affect the privacy of a village home. Doyou experience such adverse impacts in Pakhiralay?
1 2 3 4 5
Strong “No” "No” Indifferent "Yes” Strong “Yes”
A16: Tourism has provided earning opportunity unequally among the villagers inPakhiralay. This has increased economic inequality among villagers. Do you agree?
1 2 3 4 5
Strong “No” "No” Indifferent "Yes” Strong “Yes”
A17: The economic inequality that has possibly resulted from tourism-money has affectedthe social fraternity and mutual faith/honour among villagers in Pakhiralay. Do youagree?
1 2 3 4 5
Strong “No” "No” Indifferent "Yes” Strong “Yes”
A18. Any other comment regarding tourism in Pakhiralay: