Does the hybrid Toyota Prius lead to rebound effects ...
14
ANALYSIS Does the hybrid Toyota Prius lead to rebound effects? Analysis of size and number of cars previously owned by Swiss Prius buyers Peter de Haan * , Michel G. Mueller, Anja Peters Swiss Federal Institute of Technology, Department of Environmental Sciences, HES- NSSI, 8092 Zurich, Switzerland Received 14 May 2005; received in revised form 4 August 2005; accepted 17 August 2005 Available online 5 October 2005 Abstract Hybrid powertrains are considered being a promising technology to decrease fuel consumption of passenger cars. Sales numbers of hybrid cars are expected to rise considerably until 2010. However, the introduction of more efficient products is often accompanied by rebound effects, which counteract the positive effect of increased efficiency. We investigate two kinds of direct rebound effects that could possibly occur when buying hybrid cars: (i) people could tend to switch from small and/or already fuel-efficient cars to the new hybrid car, and (ii) the average vehicle ownership could increase, if the hybrid car is often purchased without disposing of an already owned vehicle. A survey was conducted with all 367 buyers of the Toyota Prius 2 in Switzerland in the first nine months after market entry. Return rate reached 82.6% without sending out reminders. The survey-based approach does not allow us to investigate whether hybrid drivers will in the future drive more (the classical example of the direct rebound effect). Detailed data on the car replaced by the Prius and on the other cars owned by the household were collected. Our analysis shows that average CO2 emissions dropped from 210 g/km for the previously owned vehicles to 104 g for the Prius. Empty vehicle weight (curb weight) increased by 9 kg only, which is below the market trend. A constant population-averaged vehicle ownership still allows for a certain amount of first- time car purchases and for increasing vehicle ownership for individual households, as these additional cars are compensated for by other households disposing of a vehicle. We present a new vehicle ownership model which assesses whether the vehicle transaction behavior of a sample of new car buyers corresponds, on average, to constant or increasing vehicle ownership. It is based on disaggregated data from the Swiss travel behavior micro census. Model results are consistent with market data and data from literature. Model results show that if ca. 20% of car purchases do not replace a vehicle (for a population with an age distribution identical to Prius buyers), this still allows for constant average household vehicle ownership. Only 13.7% of the surveyed Prius buyers did not replace an old car. Hence neither of the two rebound effects investigated could be found though the sample would have been large enough to do so: vehicle size did not increase, nor did average household vehicle ownership. D 2005 Elsevier B.V. All rights reserved. Keywords: Hybrid cars; Direct rebound effect; Survey; Fuel consumption; Vehicle size; Vehicle ownership; Vehicle transaction; Energy- efficiency 0921-8009/$ - see front matter D 2005 Elsevier B.V. All rights reserved. doi:10.1016/j.ecolecon.2005.08.009 * Corresponding author. Tel.: +41 44 632 49 78; fax: +41 44 632 10 29. E-mail address: [email protected] (P. de Haan). Ecological Economics 58 (2006) 592 – 605 www.elsevier.com/locate/ecolecon
-
Upload
khangminh22 -
Category
Documents
-
view
0 -
download
0
Transcript of Does the hybrid Toyota Prius lead to rebound effects ...

www.elsevier.com/locate/ecolecon
Ecological Economics 5
ANALYSIS
Does the hybrid Toyota Prius lead to rebound effects? Analysis of
size and number of cars previously owned by Swiss Prius buyers
Peter de Haan *, Michel G. Mueller, Anja Peters
Swiss Federal Institute of Technology, Department of Environmental Sciences, HES- NSSI, 8092 Zurich, Switzerland
Received 14 May 2005; received in revised form 4 August 2005; accepted 17 August 2005
Available online 5 October 2005
Abstract
Hybrid powertrains are considered being a promising technology to decrease fuel consumption of passenger cars. Sales
numbers of hybrid cars are expected to rise considerably until 2010. However, the introduction of more efficient products is
often accompanied by rebound effects, which counteract the positive effect of increased efficiency. We investigate two kinds of
direct rebound effects that could possibly occur when buying hybrid cars: (i) people could tend to switch from small and/or
already fuel-efficient cars to the new hybrid car, and (ii) the average vehicle ownership could increase, if the hybrid car is often
purchased without disposing of an already owned vehicle. A survey was conducted with all 367 buyers of the Toyota Prius 2 in
Switzerland in the first nine months after market entry.
Return rate reached 82.6%without sending out reminders. The survey-based approach does not allow us to investigate whether
hybrid drivers will in the future drive more (the classical example of the direct rebound effect). Detailed data on the car replaced by
the Prius and on the other cars owned by the household were collected. Our analysis shows that average CO2 emissions dropped
from 210 g/km for the previously owned vehicles to 104 g for the Prius. Empty vehicle weight (curb weight) increased by 9 kg
only, which is below the market trend. A constant population-averaged vehicle ownership still allows for a certain amount of first-
time car purchases and for increasing vehicle ownership for individual households, as these additional cars are compensated for by
other households disposing of a vehicle. We present a new vehicle ownership model which assesses whether the vehicle
transaction behavior of a sample of new car buyers corresponds, on average, to constant or increasing vehicle ownership. It is
based on disaggregated data from the Swiss travel behavior micro census. Model results are consistent with market data and data
from literature. Model results show that if ca. 20% of car purchases do not replace a vehicle (for a population with an age
distribution identical to Prius buyers), this still allows for constant average household vehicle ownership. Only 13.7% of the
surveyed Prius buyers did not replace an old car. Hence neither of the two rebound effects investigated could be found though the
sample would have been large enough to do so: vehicle size did not increase, nor did average household vehicle ownership.
D 2005 Elsevier B.V. All rights reserved.
Keywords: Hybrid cars; Direct rebound effect; Survey; Fuel consumption; Vehicle size; Vehicle ownership; Vehicle transaction; Energy-
efficiency
0921-8009/$ - s
doi:10.1016/j.ec
* Correspondin
E-mail addre
8 (2006) 592–605
ee front matter D 2005 Elsevier B.V. All rights reserved.
olecon.2005.08.009
g author. Tel.: +41 44 632 49 78; fax: +41 44 632 10 29.
ss: [email protected] (P. de Haan).
P. de Haan et al. / Ecological Economics 58 (2006) 592–605 593
1. Introduction
The increasing consumption of primary energy
worldwide is of increasing concern because of the
greenhouse effect of CO2 emissions, and because con-
ventional oil and natural gas supplies are expected to
decline in the not-too distant future (IEA and OECD,
2003). This leads to greater interest in energy-efficient
technologies, as technology still is the most important
source for energy saving (Berkhout et al., 2000; Her-
ring, 2006). The reshaping of existing patterns of
energy consumption strongly affects the transportation
sector, which accounts for 21.8% of total primary
energy consumption worldwide in 2000, and will
account for ca. 34% in 2050 (OECD countries:
28.1% and 40%, respectively) (IEA and OECD,
2003). Road transport is the second-largest sector of
energy consumption, right after energy needed for
HVAC (heating, ventilation, air conditioning).
In the European Union (EU), emissions of green-
house gases from transport (excluding international
aviation and maritime shipping) increased by 19%
between 1990 and 2000, contributing a fifth of total
greenhouse gas emissions in 2000. CO2 is the main
contributor to transport greenhouse emissions (97%)
and road transport is in turn the largest contributor to
these CO2 emissions (92% in 2000). The voluntary
agreements of the car manufacturers with the EU
commission to reduce average CO2 emissions from
new cars help to slow the growth of car transport
emissions in the EU (EEA, 2002), and technological
progress is expected for future decades (MacLean and
Lave, 2003). Still, road transport and domestic avia-
tion are the fastest growing contributors to transport
CO2 emissions with increases of 20% and 29%,
respectively, between 1990 and 2000.
For the near future, hybrid powertrains are con-
sidered being a promising option to decrease fuel
consumption of passenger cars (Bitsche and Gutman,
2004). The few hybrid car models currently avail-
able have increasing sales numbers, and most large
car manufacturers have announced hybrid cars for
the coming years. In 2004, 8 vehicle models utiliz-
ing hybrid-electric powertrains were on the U.S.
market and had sales of 88,000 units (0.52% market
share). JDP-LMC (2005) forecasts that by 2011, 38
models will total to 535,000 sold units and 3% of
U.S. sales.
Hybrid cars are an energy-efficient technology,
however, the introduction of more efficient products
is often accompanied by rebound effects, which
counteract the positive effect of increased efficiency.
The definition, identification and quantification of
rebound effects are areas of ongoing research (Green-
ing et al., 2000; Grepperud and Rasmussen, 2004).
The rebound effect is also called take-back effect or
backfire effect. Its definition varies among research-
ers, but the common denominator is that if a product
or service becomes more efficient (regarding energy
use or the use of some other resource), it will also
become cheaper, which might give rise to increased
demand. Generally, three different rebound effects
might be induced (Berkhout et al., 2000): increased
demand for the same service as it has become cheaper
(direct rebound effect), increased demand for other
services as money (i.e., purchasing power) has
become available (indirect rebound effect; also called
secondary rebound effect), and structural effects on
larger parts of the economy due to changed demand,
production and distribution patterns (macro-scale
rebound effect; also called economy-wide rebound
effect). For example, if the energy efficiency of a
car is increased by technological innovations, 100
km can be driven with less fuel and hence at a
lower cost. This lower cost could have the conse-
quence that people drive more and longer because
mobility has become cheaper. Identification of occur-
rence, and, if present, quantification of rebound
effects are generally not straightforward. Most work
has been done on the effects of the introduction of
energy-saving technologies, e.g., space heating (Haas
and Biermayr, 2000).
Rebound effects induced by costs savings were the
first to be investigated and originate in economics,
especially energy economics. In close analogy, also
time savings and the reduction of socio-psychological
costs of ownership might be regarded as possible
drivers for rebound effects. As example for the latter,
it may well be not the financial but the socio-psycho-
logical cost-of-ownership (due to neighborhood pres-
sure, norms of a peer group, etc.) that prevents people
from buying sport-utility vehicles (SUV). However,
this could change as soon as SUVs with hybrid
powertrain enter the market.
The present paper aims at identifying the occur-
rence, and, if present, at quantifying (direct) rebound
P. de Haan et al. / Ecological Economics 58 (2006) 592–605594
effects accompanying the introduction of hybrid vehi-
cles. Are hybrid cars, which are an energy-efficient
technology, effective as well? We investigate two
kinds of direct rebound effects that could possibly
occur when buying hybrid cars: (i) people could
tend to switch from small and/or already fuel-efficient
cars to the new hybrid car, and (ii) average household
vehicle ownership (HVO) could increase if people
either tended to purchase the hybrid car as additional
household vehicle without disposing of an already
owned vehicle, or because the availability of hybrid
cars could make the decisive difference for a house-
hold to purchase a vehicle for the first time. At present
hybrid cars are more expensive than their conven-
tional counterparts, but have lower fuel costs. Driving
factors for the rebound effects under investigation
could be of both, socio-psychological and economic
origin.
Whereas size and fuel efficiency of previously
owned cars can easily be obtained and analyzed
using survey data, assessment of possible increases
in average HVO is challenging. A constant popula-
tion-averaged HVO still allows for a certain amount
of first-time car purchases and for increasing vehicle
ownership for individual households, as these addi-
tional cars are compensated for by households
decreasing their vehicle ownership (reduction of car
fleet after grown-up children leave parental home, or
by elderly people due to health reasons, etc.). We
present a new vehicle ownership model which
assesses whether the vehicle transaction behavior of
a sample of new car buyers corresponds to a con-
stant or an increasing population-averaged HVO.
The paper is structured as follows. Section 2 pre-
sents research objective and hypotheses. The study
area (purchasers of the second generation Toyota
Prius in Switzerland in the first 9 months after market
entry) and the method chosen (mail-back survey) are
introduced in Section 3. Section 4 presents the results
of the survey, and investigates the presence of the first
rebound effect mentioned above. Section 5 introduces
our household car ownership and car transaction
model, and investigates with its help the presence of
the second rebound effect. Section 6 discusses our
findings in detail, and Section 7 presents our conclud-
ing remarks with regard to rebound effects, the effec-
tiveness of environmental policies promoting hybrid
car ownership, and consequences for future research.
2. Rebound effects and purchase of new cars
2.1. Economic rebound effects
When cars become more fuel-efficient, three levels
of rebound effects can possibly occur: direct, indirect,
and macro-level effects (Berkhout et al., 2000).
Increased fuel efficiency means lower fuel costs and
hence lower costs for transportation services. Accord-
ing to the text book, if the use of a car costs less,
people will use more car services. They prefer the car
to public transport, drive longer trips, or do not bother
to switch off the idling engine when waiting for a train
to cross the road. This is called the direct rebound
effect (e.g. Binswanger, 2001), which is, if present,
always negative.
In addition, the reduced fuel bill increases purchas-
ing power. This leads to more expenditure for other
commodities, among which most also require energy
use, for construction and/or operation. This is called
the indirect rebound effect. It is often not possible to
tell what other commodities show an increase (Hert-
wich, 2005). One solution is to assume an average
linear relationship between energy-intensity and
money, or between energy-intensity and time (Jalas,
2002). The indirect (or secondary) rebound effect may
be either positive or negative, depending on the fact
whether the service which has become cheaper (more
efficient) previously had an above-average or a below-
average energy intensity (i.e., energy need per cost
unit). The third rebound effect could occur on a macro
level. It is also denoted as the economy-wide rebound
effect. The shift of spending patterns of households
and companies by the first-order effects (direct and
indirect rebound effects) leads to a shift of the sales
pattern of the production sector: a structure effect
(Grepperud and Rasmussen, 2004). The structure
effect has consequences for energy demand. The net
effect can be either positive or negative.
The direct rebound effect is computed simply as
the difference between bcalculated savingsQ (applyingthe ceteris paribus assumption, i.e., the amount of
services consumed does not increase) and actual sav-
ings, obtained through e.g. observation. For example,
a direct rebound effect of 20% to 30% is reported in
the case of more energy-efficient space heating (Haas
and Biermayr, 2000). It is more difficult to quantify
the indirect rebound effect. One possibility is the
P. de Haan et al. / Ecological Economics 58 (2006) 592–605 595
approach adopted by Jalas (2002). By means of sta-
tistical regression, a linear relationship between time
and energy-intensity is derived. Any gains in time,
e.g. due to higher travel speed, are (then) assumed to
be invested in other activities with average energy-
intensity per time unit. Using money instead of time,
and reduced costs instead of higher travel speed,
would be straightforward. There is a risk of double-
counting when inconsistent definitions of rebound
effects are compared with each other. For example,
the so-called indirect rebound effect as investigated by
Jalas (2002) in fact is the sum of direct and indirect
rebound as used in this paper, which are based on
Berkhout et al. (2000). The macro-level rebound
effect can hardly be separated from other technologi-
cal trends and long-term changes in the ratio of GDP
to energy-efficiency (Birol and Keppler, 2000; Schip-
per and Grubb, 2000; Schipper et al., 2001). Laitner
(2000) through simulation obtained an estimate of 2–
3%. On the other hand, Brookes (2000) and Saunders
(2000) argue that it is likely that this effect does not
exist. Jaccard and Bataille (2000) also argue that,
because there is only a weak substitution between
capital and energy, macro-scale rebound effects will
also be relatively small.
2.2. Socio-psychological rebound effects
The so-called economic rebound effects presented
in the preceding section are well-known and accepted.
They are caused by reduction of monetary cost per
service (like driving a car for one kilometer), for
example as a result of improved energy-efficiency.
Hertwich (2005) argues that even when price-based
rebound effects are not to be expected, other effects
might occur (with either positive or negative sign). For
the present study, we also regard what we call socio-
psychological rebound effects, which can be present if
the social cost and/or the psychological cost attributed
to the consumption of a given service is reduced. For
example, in some neighborhoods especially in Europe,
owning a SUV with high fuel consumption might be
accompanied by disapproval from neighbors, family
members, or other peers, which might prevent people
from buying such vehicles. With reversed signs, driv-
ing a particularly fuel-efficient vehicle will often go
hand-in-hand with appraisal from (part of) the social
network. On the psychological side, people might have
norms or preferences (benvironmental conscienceQ)which prevent them from owning vehicles with high
fuel consumption.
It would be possible to define, in close analogy to
economic rebound effects, both direct and indirect
socio-psychological rebound effects. Examples of
direct effects would be to drive more frequently and
longer with a more fuel-efficient car, and to purchase a
fuel-efficient car (for example as second car for a
household) where otherwise no car would have been
purchased at all. An indirect effect would mean that
people use up their social bcreditQ they earned by
purchasing a fuel-efficient vehicle by pursuing other
hobbies which are disliked by public opinion or by the
relevant social network (like smoking, wearing fur,
hunting, heli-skiing, etc.). However, we would like to
leave indirect socio-psychological rebound effects for
future research by other scientists. In the present
paper, we concentrate on the investigation of direct
socio-psychological rebound effects only.
It may seem fruitless at first sight to distinguish
between economic and socio-psychological rebound
effects. If somebody buys a new fuel-efficient car and
drives more than before, how to tell whether this is
done out of economic reasoning or because social
sanctioning and/or remorse have decreased? But in
the case of passenger cars with hybrid powertrain, this
distinction does make sense, as hybrid cars are more
expensive (and will remain so in the future, due to all
additional technology needed for hybrid powertrains).
On the long run, hybrid cars, if they prove to be
successful, will have a surplus sales price correspond-
ing to the savings on fuel costs in the first, say, five
years of car ownership. So rationally speaking, there
is no room for economically justified rebound effects,
as costs per vehicle kilometer do not change. They are
only shifted from operation to investment costs. So if
a rebound effect is observed, we argue that its origin is
primarily of socio-psychological nature.
2.3. Research questions
The present study aims at investigating whether
two direct rebound effects are present, and, if so,
can be quantified:
- Direct rebound effect number 1 (DRE1): above-
trend increase in car size;
P. de Haan et al. / Ecological Economics 58 (2006) 592–605596
- Direct rebound effect number 2 (DRE2): increase
in average household car ownership.
Another possibly occurring direct rebound effect,
increased mileage, is not the topic of the present study
as a priori statements of car owners on the amount of
kilometers they will drive are not reliable.
Investigation on the presence of DRE1 is straight-
forward. We adopt empty vehicle weight (curb
weight) as surrogate for bcar sizeQ. Since roughly 20
years, average empty vehicle weight of new car regis-
trations is increasing in Europe (including Switzer-
land) and Northern America. A rebound effect can
only be considered as present if an increase in empty
vehicle weight (defined as the weight of the Toyota
Prius minus the average weight of the previously
owned vehicles which are replaced by the Prius) is
higher than this general trend. The Prius’ hybrid
technology is responsible for some 170 kg of extra
weight. Using empty vehicle weight as a surrogate for
car size or luxury level, these 170 kg should be
deducted. On the other hand, light-weight materials
have been used in the Prius to compensate for these
170 kg. So to be on the save side, we use Prius’ curb
weight bas isQ.We expect that DRE1 will not be observed out of
economic reasons, because sales price for a hybrid
vehicle is higher than for a vehicle with conventional
powertrain. This higher sales price compensates partly
or completely for any fuel reduction. In the U.S., the
Prius sells at USD 3500 more than the Toyota Corolla,
which is not paid back over a vehicle lifetime of
250,000 km at current U.S. gasoline prices (Lave
and MacLean, 2002). In Switzerland, where fuel
prices (EUR 0.9–1.0 per liter) are higher than in
Northern America but lower compared to surrounding
European countries, surplus price is EUR 5000, which
does pay back after ca. 160,000 km, which is the
average vehicle lifetime in Switzerland. However,
due to the reduced socio-psychological costs of car
ownership, a slight increase in car size could be
present and observable.
Investigation of the presence of DRE2 is not
straightforward. Even though it is simple to conclude
for an entire population whether average HVO has
increased or not, this same question is hard to answer
for a sample of new car buyers that answered a mail-
back survey. In any population, young households or
individuals will at some time purchase a vehicle for
the first time. And in correspondence, old households
or individuals will at some point in life discard their
last vehicle. So seen from the viewpoint of an indivi-
dual, there always is a first-time car purchase at first,
followed by several car replacements, and possibly
accompanied with the first-time purchase of a second
car, etc. This means that in order to test for the
presence of DRE2, we first need to know what ratio
of first-time buyers on the one hand, and car replace-
ments on the other hand, is normal for the population
of Switzerland. Then, we can compare the observed
ratio of our Prius sample with this benchmark ratio.
As there is no economic driver for DRE2, we expect
that DRE2 is not present out of economic reasons.
However, with regard to car ownership, the reduced
socio-psychological costs (of car ownership) could
take their full effect here. Possibly the introduction
of the Toyota Prius as the first fully functional hybrid
vehicle leads to surplus purchases.
2.4. On the Toyota Prius
The Prius was first introduced in Japan in 1997,
with a redesign of the batteries by the year 2000. In
2004, the second-generation, reworked Prius entered
the market. Only this year 2004 version of the Prius,
called Prius 2 among experts, is the topic of the
present study. In Switzerland in 2004, the Prius 2
sold at a net base price of 37,000 CHF. This is roughly
7500 CHF more than the price of a comparable
Toyota Corolla, which is sometimes regarded as
being the conventional counterpart to the hybrid
Prius 2. It should be noted, however, that Prius and
Corolla are distinct cars and do not correspond in all
respects. On the automobile market, Prius is rather to
be positioned between Corolla and the next-higher
model, Toyota Avensis. It therefore is hard to tell at
what price a non-hybrid, conventional Prius would
sell.
3. Design of the mail-back survey
We conducted a mail-out mail-back survey in Sep-
tember 2004 with all Swiss buyers of the hybrid
Toyota Prius 2 since its market entry in May 2004.
Questionnaires were not numbered or otherwise iden-
P. de Haan et al. / Ecological Economics 58 (2006) 592–605 597
tifiable, and no reminder letters were sent out. Out of
367 questionnaires, 303 (82.56%) were returned. The
questionnaire consisted of 5 blocks with a total of 33
closed questions and 2 additional open questions of
general scope. Item block A (7 questions) deals with
the car purchased, whether an old vehicle had been
disposed of (and if yes, what kind of car), and which
other vehicles are owned by the household. Block B
consists of 7 questions, plus 1 general open question,
addressing the car choice behavior (brand loyalty,
other persons involved in the purchase decision, pre-
ferences, etc.). Block C with 5 knowledge questions
on the Toyota Prius and its technical characteristics
follows. Block D addresses the mobility behavior (7
questions on season ticket ownership for public trans-
port, parking space availability, and commuting beha-
vior). The remaining 7 questions of block E serve
socio-demographic statistics. The questionnaire closes
with a last open question for any remaining remark.
The complete questionnaire (in German or in French)
may be obtained from the corresponding author upon
request.
Special care was taken of the design of item block
A. In most questionnaires, people are asked to give
brand, model name and sometimes vintage of any
vehicle the household owns. In the present survey,
people where asked to give also engine capacity (in
liters), gear type (automatic or manual), fuel type
(gasoline or diesel), and model year (vintage). These
data allow for a precise identification of any vehicle in
the Swiss data base on vehicle type registrations and
provide us with all technical characteristics including
size, weight, and fuel consumption of the vehicle.
There also is redundancy such that missing data can
often be filled in. For example, fuel type can in most
Table 1
Vehicle transaction statistics
Questionnaires Sent out
Received
Used for this study*
Prius 2 sold Total
As replacement of Prius 1
As replacement of other vehicle
As first vehicle of household (first time buy
As additional vehicle of household
*1 questionnare of commercial buyer with stock of N1000 vehicles and n
analysis.
cases be derived from engine capacity (and the other
way round: imprecise engine capacity can be cor-
rected for using fuel type), automatic gear often has
not been sold for smaller engine sizes, etc.
The data quality of the returned questionnaires was
unusually high and allowed for the precise identifica-
tion of over 97% of all vehicles that were owned by
the households prior to the purchase of the Prius 2.
For the remaining 2.9% of vehicles, we assigned the
most-sold car type for the brand, model and vintage
specified. In the remainder of the present paper, we
will focus on the analysis of the previously owned
vehicles (directly replaced by the Prius) in order to
investigate the presence of DRE1, and on all vehicles
owned by the household, together with socio-demo-
graphic data, to investigate the presence of DRE2.
4. Results
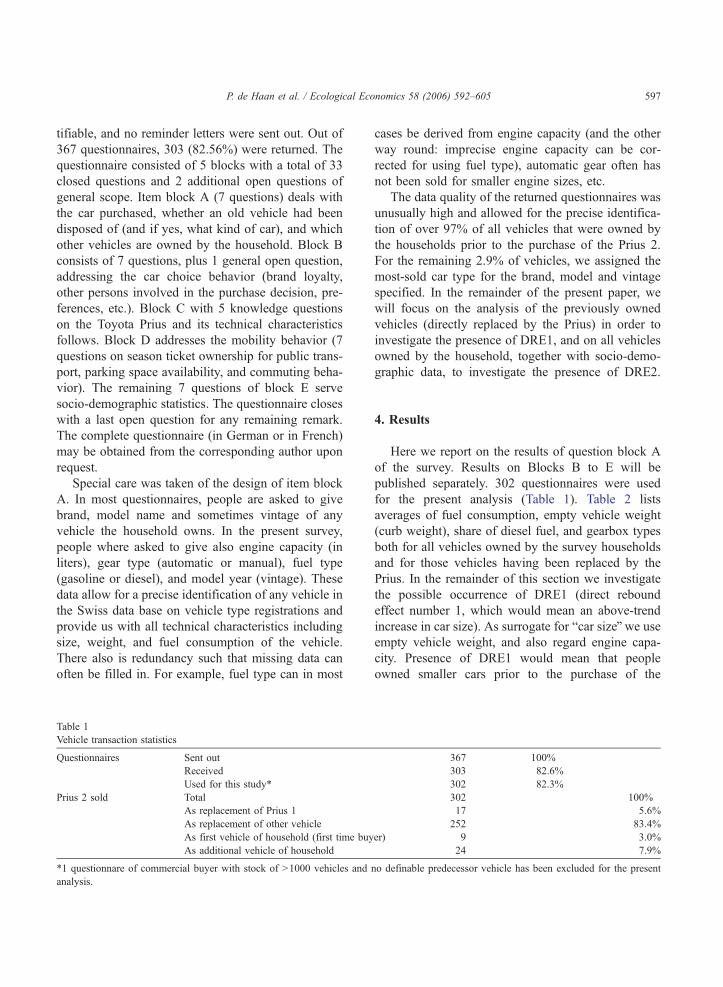
Here we report on the results of question block A
of the survey. Results on Blocks B to E will be
published separately. 302 questionnaires were used
for the present analysis (Table 1). Table 2 lists
averages of fuel consumption, empty vehicle weight
(curb weight), share of diesel fuel, and gearbox types
both for all vehicles owned by the survey households
and for those vehicles having been replaced by the
Prius. In the remainder of this section we investigate
the possible occurrence of DRE1 (direct rebound
effect number 1, which would mean an above-trend
increase in car size). As surrogate for bcar sizeQ we useempty vehicle weight, and also regard engine capa-
city. Presence of DRE1 would mean that people
owned smaller cars prior to the purchase of the
367 100%
303 82.6%
302 82.3%
302 100%
17 5.6%
252 83.4%
er) 9 3.0%
24 7.9%
o definable predecessor vehicle has been excluded for the present
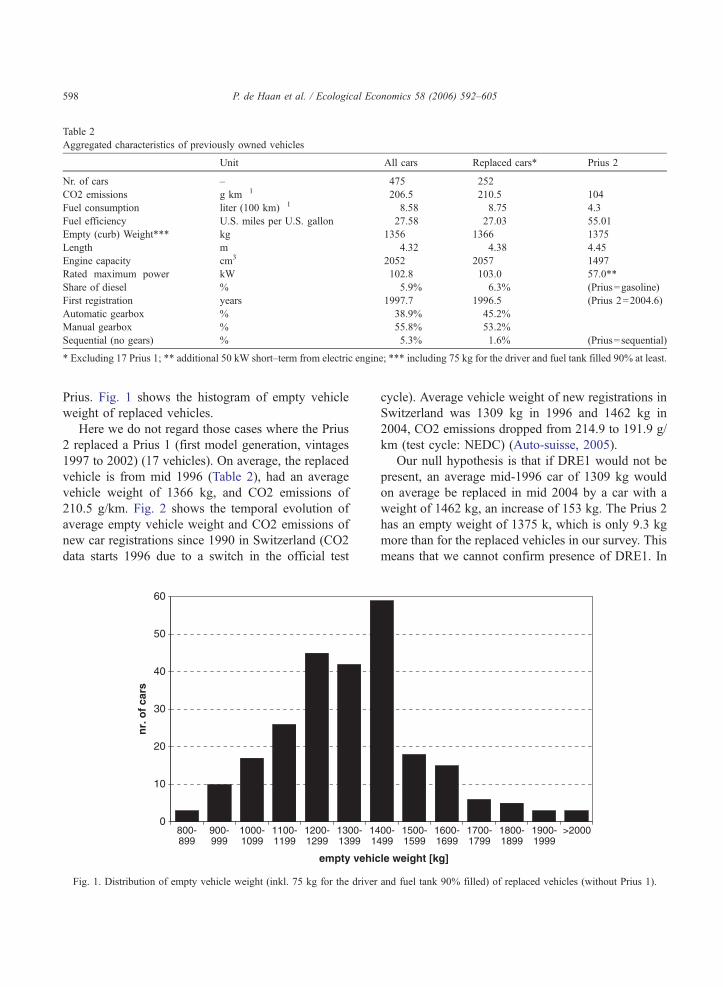
Table 2
Aggregated characteristics of previously owned vehicles
Unit All cars Replaced cars* Prius 2
Nr. of cars – 475 252
CO2 emissions g km�1 206.5 210.5 104
Fuel consumption liter (100 km)�1 8.58 8.75 4.3
Fuel efficiency U.S. miles per U.S. gallon 27.58 27.03 55.01
Empty (curb) Weight*** kg 1356 1366 1375
Length m 4.32 4.38 4.45
Engine capacity cm3 2052 2057 1497
Rated maximum power kW 102.8 103.0 57.0**
Share of diesel % 5.9% 6.3% (Prius=gasoline)
First registration years 1997.7 1996.5 (Prius 2=2004.6)
Automatic gearbox % 38.9% 45.2%
Manual gearbox % 55.8% 53.2%
Sequential (no gears) % 5.3% 1.6% (Prius=sequential)
* Excluding 17 Prius 1; ** additional 50 kW short–term from electric engine; *** including 75 kg for the driver and fuel tank filled 90% at least.
P. de Haan et al. / Ecological Economics 58 (2006) 592–605598
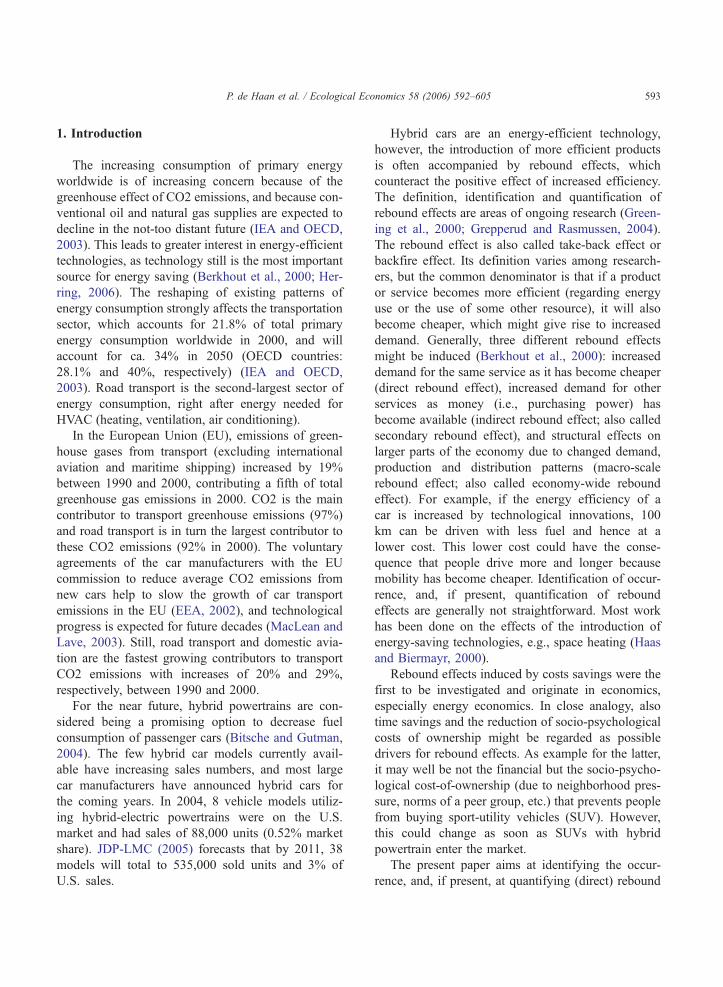
Prius. Fig. 1 shows the histogram of empty vehicle
weight of replaced vehicles.
Here we do not regard those cases where the Prius
2 replaced a Prius 1 (first model generation, vintages
1997 to 2002) (17 vehicles). On average, the replaced
vehicle is from mid 1996 (Table 2), had an average
vehicle weight of 1366 kg, and CO2 emissions of
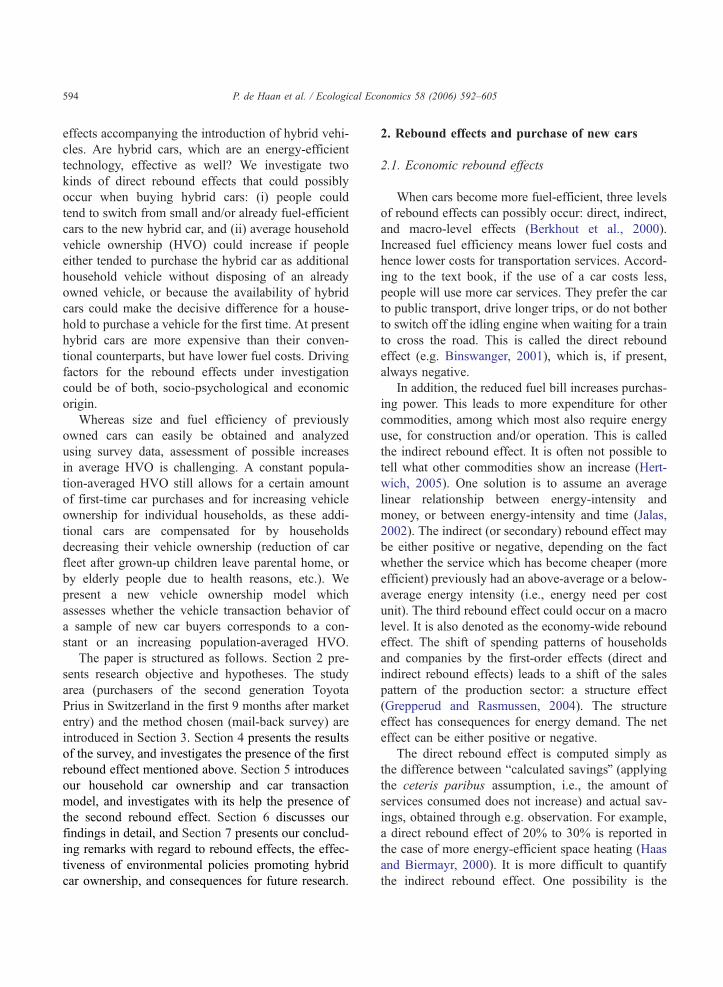
210.5 g/km. Fig. 2 shows the temporal evolution of
average empty vehicle weight and CO2 emissions of
new car registrations since 1990 in Switzerland (CO2
data starts 1996 due to a switch in the official test
0
10
20
30
40
50
60
800-899
900-999
1000-1099
1100-1199
1200-1299
1300-1399
141
empty vehic
nr.
of
cars
Fig. 1. Distribution of empty vehicle weight (inkl. 75 kg for the driver
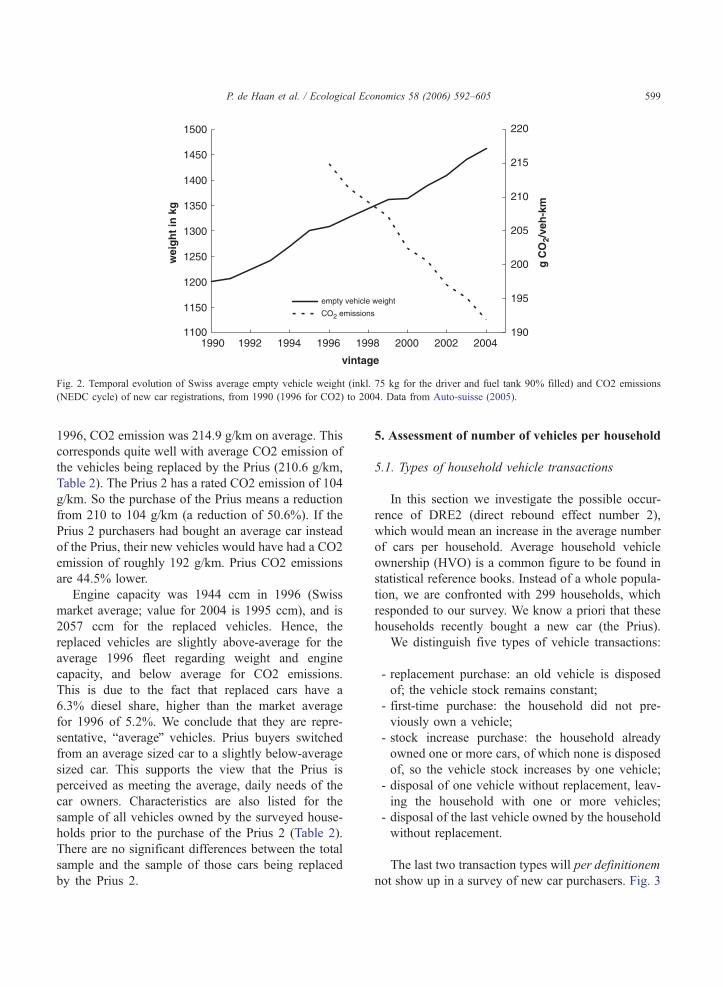
cycle). Average vehicle weight of new registrations in
Switzerland was 1309 kg in 1996 and 1462 kg in
2004, CO2 emissions dropped from 214.9 to 191.9 g/
km (test cycle: NEDC) (Auto-suisse, 2005).
Our null hypothesis is that if DRE1 would not be
present, an average mid-1996 car of 1309 kg would
on average be replaced in mid 2004 by a car with a
weight of 1462 kg, an increase of 153 kg. The Prius 2
has an empty weight of 1375 k, which is only 9.3 kg
more than for the replaced vehicles in our survey. This
means that we cannot confirm presence of DRE1. In
00-499
1500-1599
1600-1699
1700-1799
1800-1899
1900-1999
>2000
le weight [kg]
and fuel tank 90% filled) of replaced vehicles (without Prius 1).
1100
1150
1200
1250
1300
1350
1400
1450
1500
1990 1992 1994 1996 1998 2000 2002 2004
vintage
wei
gh
t in
kg
190
195
200
205
210
215
220
g C
O2/
veh
-km
empty vehicle weight
CO2 emissions
Fig. 2. Temporal evolution of Swiss average empty vehicle weight (inkl. 75 kg for the driver and fuel tank 90% filled) and CO2 emissions
(NEDC cycle) of new car registrations, from 1990 (1996 for CO2) to 2004. Data from Auto-suisse (2005).
P. de Haan et al. / Ecological Economics 58 (2006) 592–605 599
1996, CO2 emission was 214.9 g/km on average. This
corresponds quite well with average CO2 emission of
the vehicles being replaced by the Prius (210.6 g/km,
Table 2). The Prius 2 has a rated CO2 emission of 104
g/km. So the purchase of the Prius means a reduction
from 210 to 104 g/km (a reduction of 50.6%). If the
Prius 2 purchasers had bought an average car instead
of the Prius, their new vehicles would have had a CO2
emission of roughly 192 g/km. Prius CO2 emissions
are 44.5% lower.
Engine capacity was 1944 ccm in 1996 (Swiss
market average; value for 2004 is 1995 ccm), and is
2057 ccm for the replaced vehicles. Hence, the
replaced vehicles are slightly above-average for the
average 1996 fleet regarding weight and engine
capacity, and below average for CO2 emissions.
This is due to the fact that replaced cars have a
6.3% diesel share, higher than the market average
for 1996 of 5.2%. We conclude that they are repre-
sentative, baverageQ vehicles. Prius buyers switched
from an average sized car to a slightly below-average
sized car. This supports the view that the Prius is
perceived as meeting the average, daily needs of the
car owners. Characteristics are also listed for the
sample of all vehicles owned by the surveyed house-
holds prior to the purchase of the Prius 2 (Table 2).
There are no significant differences between the total
sample and the sample of those cars being replaced
by the Prius 2.
5. Assessment of number of vehicles per household
5.1. Types of household vehicle transactions
In this section we investigate the possible occur-
rence of DRE2 (direct rebound effect number 2),
which would mean an increase in the average number
of cars per household. Average household vehicle
ownership (HVO) is a common figure to be found in
statistical reference books. Instead of a whole popula-
tion, we are confronted with 299 households, which
responded to our survey. We know a priori that these
households recently bought a new car (the Prius).
We distinguish five types of vehicle transactions:
- replacement purchase: an old vehicle is disposed
of; the vehicle stock remains constant;
- first-time purchase: the household did not pre-
viously own a vehicle;
- stock increase purchase: the household already
owned one or more cars, of which none is disposed
of, so the vehicle stock increases by one vehicle;
- disposal of one vehicle without replacement, leav-
ing the household with one or more vehicles;
- disposal of the last vehicle owned by the household
without replacement.
The last two transaction types will per definitionem
not show up in a survey of new car purchasers. Fig. 3
veh. 2 Cveh. 1 C C C Cveh. 2 B Cveh. 1 A C C
Household 3 veh. 1Household 2 veh. 1 A C C C
veh. 2 B Cveh. 1 A C C C
Year 0 10 20 30Types of purchase decisions when purchasing a new car:A: first-time buyer B: adding car to household fleet
Household 1
Household 4
Household 5
C: replacing old by new car
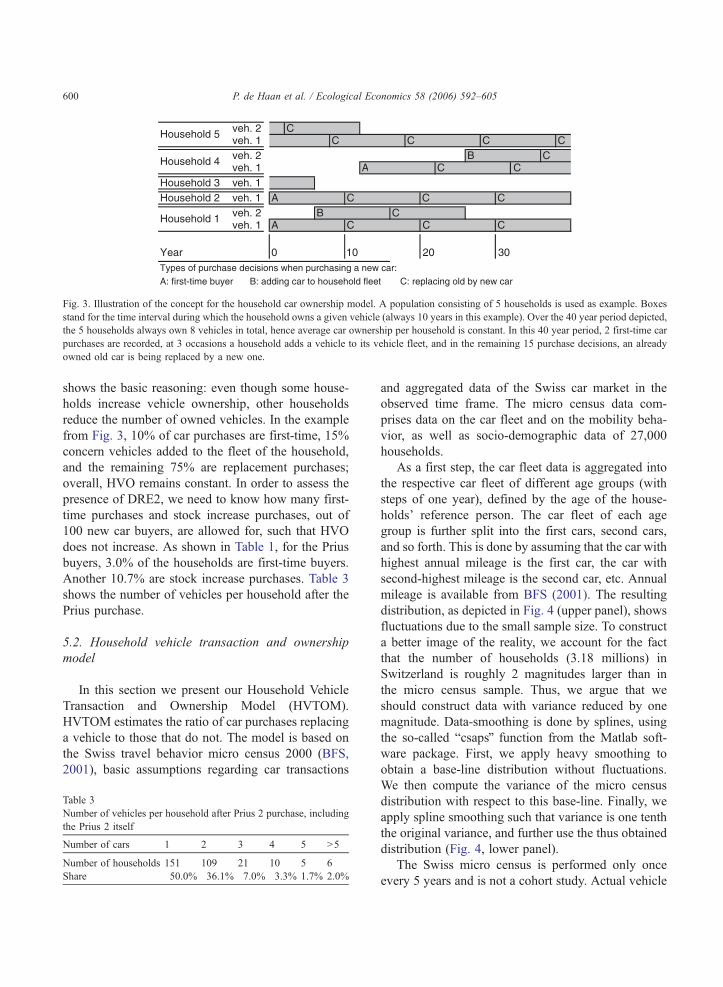
Fig. 3. Illustration of the concept for the household car ownership model. A population consisting of 5 households is used as example. Boxes
stand for the time interval during which the household owns a given vehicle (always 10 years in this example). Over the 40 year period depicted,
the 5 households always own 8 vehicles in total, hence average car ownership per household is constant. In this 40 year period, 2 first-time car
purchases are recorded, at 3 occasions a household adds a vehicle to its vehicle fleet, and in the remaining 15 purchase decisions, an already
owned old car is being replaced by a new one.
P. de Haan et al. / Ecological Economics 58 (2006) 592–605600
shows the basic reasoning: even though some house-
holds increase vehicle ownership, other households
reduce the number of owned vehicles. In the example
from Fig. 3, 10% of car purchases are first-time, 15%
concern vehicles added to the fleet of the household,
and the remaining 75% are replacement purchases;
overall, HVO remains constant. In order to assess the
presence of DRE2, we need to know how many first-
time purchases and stock increase purchases, out of
100 new car buyers, are allowed for, such that HVO
does not increase. As shown in Table 1, for the Prius
buyers, 3.0% of the households are first-time buyers.
Another 10.7% are stock increase purchases. Table 3
shows the number of vehicles per household after the
Prius purchase.
5.2. Household vehicle transaction and ownership
model
In this section we present our Household Vehicle
Transaction and Ownership Model (HVTOM).
HVTOM estimates the ratio of car purchases replacing
a vehicle to those that do not. The model is based on
the Swiss travel behavior micro census 2000 (BFS,
2001), basic assumptions regarding car transactions
Table 3
Number of vehicles per household after Prius 2 purchase, including
the Prius 2 itself
Number of cars 1 2 3 4 5 N5
Number of households 151 109 21 10 5 6
Share 50.0% 36.1% 7.0% 3.3% 1.7% 2.0%
and aggregated data of the Swiss car market in the
observed time frame. The micro census data com-
prises data on the car fleet and on the mobility beha-
vior, as well as socio-demographic data of 27,000
households.
As a first step, the car fleet data is aggregated into
the respective car fleet of different age groups (with
steps of one year), defined by the age of the house-
holds’ reference person. The car fleet of each age
group is further split into the first cars, second cars,
and so forth. This is done by assuming that the car with
highest annual mileage is the first car, the car with
second-highest mileage is the second car, etc. Annual
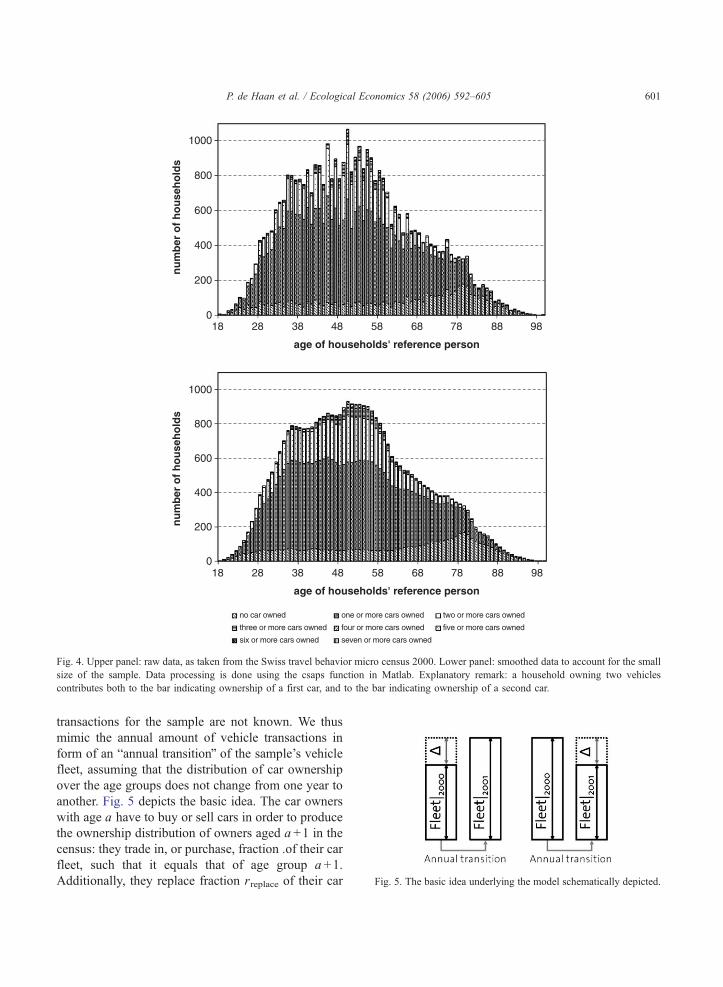
mileage is available from BFS (2001). The resulting
distribution, as depicted in Fig. 4 (upper panel), shows
fluctuations due to the small sample size. To construct
a better image of the reality, we account for the fact
that the number of households (3.18 millions) in
Switzerland is roughly 2 magnitudes larger than in
the micro census sample. Thus, we argue that we
should construct data with variance reduced by one
magnitude. Data-smoothing is done by splines, using
the so-called bcsapsQ function from the Matlab soft-
ware package. First, we apply heavy smoothing to
obtain a base-line distribution without fluctuations.
We then compute the variance of the micro census
distribution with respect to this base-line. Finally, we
apply spline smoothing such that variance is one tenth
the original variance, and further use the thus obtained
distribution (Fig. 4, lower panel).
The Swiss micro census is performed only once
every 5 years and is not a cohort study. Actual vehicle
0
200
400
600
800
1000
18 28 38 48 58 68 78 88 98
age of households' reference person
18 28 38 48 58 68 78 88 98
age of households' reference person
nu
mb
er o
f h
ou
seh
old
s
0
200
400
600
800
1000
nu
mb
er o
f h
ou
seh
old
s
no car owned one or more cars owned two or more cars owned
three or more cars owned four or more cars owned five or more cars owned
six or more cars owned seven or more cars owned
Fig. 4. Upper panel: raw data, as taken from the Swiss travel behavior micro census 2000. Lower panel: smoothed data to account for the small
size of the sample. Data processing is done using the csaps function in Matlab. Explanatory remark: a household owning two vehicles
contributes both to the bar indicating ownership of a first car, and to the bar indicating ownership of a second car.
Fig. 5. The basic idea underlying the model schematically depicted.
P. de Haan et al. / Ecological Economics 58 (2006) 592–605 601
transactions for the sample are not known. We thus
mimic the annual amount of vehicle transactions in
form of an bannual transitionQ of the sample’s vehicle
fleet, assuming that the distribution of car ownership
over the age groups does not change from one year to
another. Fig. 5 depicts the basic idea. The car owners
with age a have to buy or sell cars in order to produce
the ownership distribution of owners aged a +1 in the
census: they trade in, or purchase, fraction .of their car
fleet, such that it equals that of age group a +1.
Additionally, they replace fraction rreplace of their car
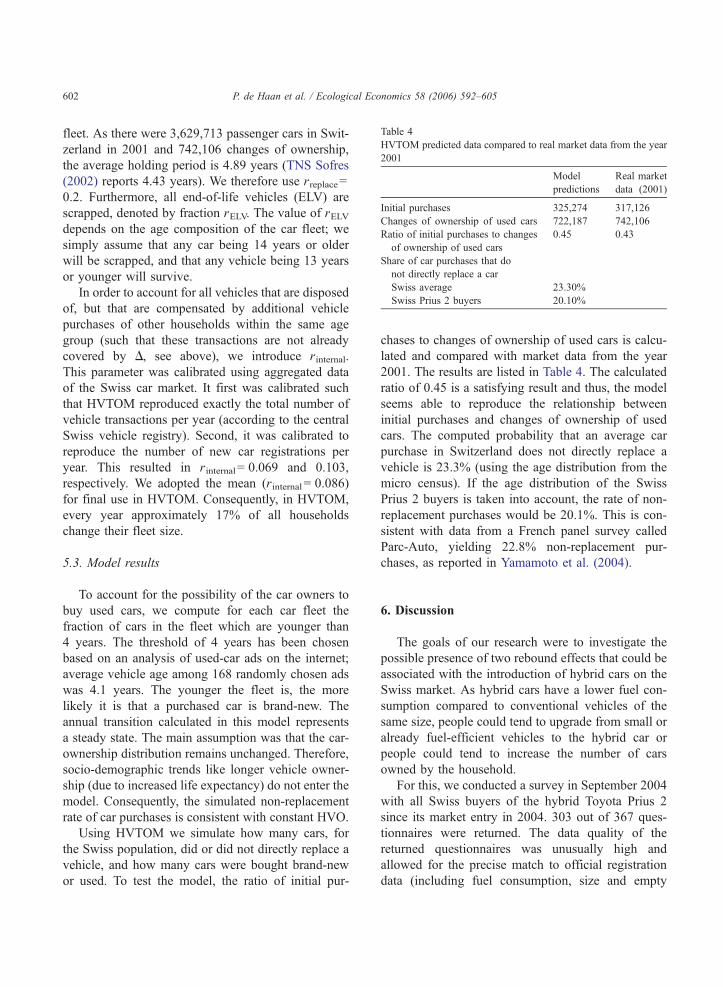
Table 4
HVTOM predicted data compared to real market data from the year
2001
Model
predictions
Real market
data (2001)
Initial purchases 325,274 317,126
Changes of ownership of used cars 722,187 742,106
Ratio of initial purchases to changes
of ownership of used cars
0.45 0.43
Share of car purchases that do
not directly replace a car
Swiss average 23.30%
Swiss Prius 2 buyers 20.10%
P. de Haan et al. / Ecological Economics 58 (2006) 592–605602
fleet. As there were 3,629,713 passenger cars in Swit-
zerland in 2001 and 742,106 changes of ownership,
the average holding period is 4.89 years (TNS Sofres
(2002) reports 4.43 years). We therefore use rreplace=
0.2. Furthermore, all end-of-life vehicles (ELV) are
scrapped, denoted by fraction rELV. The value of rELVdepends on the age composition of the car fleet; we
simply assume that any car being 14 years or older
will be scrapped, and that any vehicle being 13 years
or younger will survive.
In order to account for all vehicles that are disposed
of, but that are compensated by additional vehicle
purchases of other households within the same age
group (such that these transactions are not already
covered by D, see above), we introduce rinternal.
This parameter was calibrated using aggregated data
of the Swiss car market. It first was calibrated such
that HVTOM reproduced exactly the total number of
vehicle transactions per year (according to the central
Swiss vehicle registry). Second, it was calibrated to
reproduce the number of new car registrations per
year. This resulted in rinternal= 0.069 and 0.103,
respectively. We adopted the mean (rinternal= 0.086)
for final use in HVTOM. Consequently, in HVTOM,
every year approximately 17% of all households
change their fleet size.
5.3. Model results
To account for the possibility of the car owners to
buy used cars, we compute for each car fleet the
fraction of cars in the fleet which are younger than
4 years. The threshold of 4 years has been chosen
based on an analysis of used-car ads on the internet;
average vehicle age among 168 randomly chosen ads
was 4.1 years. The younger the fleet is, the more
likely it is that a purchased car is brand-new. The
annual transition calculated in this model represents
a steady state. The main assumption was that the car-
ownership distribution remains unchanged. Therefore,
socio-demographic trends like longer vehicle owner-
ship (due to increased life expectancy) do not enter the
model. Consequently, the simulated non-replacement
rate of car purchases is consistent with constant HVO.
Using HVTOM we simulate how many cars, for
the Swiss population, did or did not directly replace a
vehicle, and how many cars were bought brand-new
or used. To test the model, the ratio of initial pur-
chases to changes of ownership of used cars is calcu-
lated and compared with market data from the year
2001. The results are listed in Table 4. The calculated
ratio of 0.45 is a satisfying result and thus, the model
seems able to reproduce the relationship between
initial purchases and changes of ownership of used
cars. The computed probability that an average car
purchase in Switzerland does not directly replace a
vehicle is 23.3% (using the age distribution from the
micro census). If the age distribution of the Swiss
Prius 2 buyers is taken into account, the rate of non-
replacement purchases would be 20.1%. This is con-
sistent with data from a French panel survey called
Parc-Auto, yielding 22.8% non-replacement pur-
chases, as reported in Yamamoto et al. (2004).
6. Discussion
The goals of our research were to investigate the
possible presence of two rebound effects that could be
associated with the introduction of hybrid cars on the
Swiss market. As hybrid cars have a lower fuel con-
sumption compared to conventional vehicles of the
same size, people could tend to upgrade from small or
already fuel-efficient vehicles to the hybrid car or
people could tend to increase the number of cars
owned by the household.
For this, we conducted a survey in September 2004
with all Swiss buyers of the hybrid Toyota Prius 2
since its market entry in 2004. 303 out of 367 ques-
tionnaires were returned. The data quality of the
returned questionnaires was unusually high and
allowed for the precise match to official registration
data (including fuel consumption, size and empty

P. de Haan et al. / Ecological Economics 58 (2006) 592–605 603
vehicle weight [curb weight]) for almost all vehicles
owned by the surveyed households prior to the pur-
chase of the Prius 2. We thus are able to characterize
with a high level of precision those vehicles that have
been replaced by the Prius 2, allowing for the assess-
ment of the first rebound effect (increase in car size).
In order to analyze the occurrence of the second
rebound effect (possible increase in vehicle owner-
ship), we had to develop a model able to describe the
relationship between first-time car buyers, car repla-
cements, and cases where a new vehicle leads to an
increase in vehicle ownership for the household in
question. This model is based on the Swiss survey on
mobility behavior with over 27,000 households. We
made the important assumption that the Prius 2 may
be considered as being representative, regarding vehi-
cle size and power, for the average Swiss car market.
Our results show that neither of the two rebound
effects could be found. We use empty vehicle weight
as a surrogate for vehicle bsizeQ as perceived by
consumers. Comparing the Prius 2 with those vehicles
it replaced, empty vehicle weight only slightly
increases. Taking into account the general tendency
of increasing vehicle weight and the fact that the
hybrid technology accounts for some 170 kg of
extra weight (which should be neglected if using
weight as a surrogate for bsizeQ), we conclude that
the replacement of 252 vehicles by the Prius 2 has on
average led to a clear decrease in vehicle size, i.e., a
so-called down-sizing could be identified. This could
not be expected a priori, as car size normally increases
during the lifetime of the individual car owner.
With regard to average vehicle ownership, our
HVTOM simulation model gives us the upper limit
for the percentage of non-replacement purchases (i.e.,
the sum of first-time car purchases and for vehicles
added to the household fleet) as 23.3% for the Swiss
population. A value of 20.1% is expected for a con-
sumer group with an age-distribution equal to that of
the Swiss Prius 2 buyers. HVTOM results account for
the used-car market, and are consistent with overall
market statistics and (de)registration figures, and with
other studies from literature. Any population with a
car purchase behavior corresponding to this upper
limit will on the long run not experience an increase
in vehicle ownership. For the buyers of the Prius 2,
the percentage of non-replacement purchases was
13.7%, i.e., clearly below this upper limit. This
means that if the Prius 2 buyers were representative
for the whole Swiss population, vehicle ownership
would in fact decrease.
The above results can partly be explained assuming
that Prius 2 buyers are mostly so-called bearlyadoptersQ to a new product. They are not representa-
tive for the average market (which shows increasing
vehicle weight and increasing vehicle ownership).
Implications of our research are that hybrid cars like
the Prius 2 can be considered not only being efficient
(i.e., fuel-efficient) but also effective (i.e., effective in
lowering annual fuel sales of a population), as the
efficiency gains are not counteracted by rebound
effects. If a government considers promoting the pur-
chase of fuel-efficient vehicles, either with cash
rewards or by introducing tax rebates, hybrid vehicles
are a good target. Such policy measures are generally
targeting bearly adoptersQ, with the aim to enable the
breakthrough of new, more efficient technologies.
Concerning the reliability and validity of our sur-
vey-based results, our survey covered all German and
French speaking buyers of the Prius 2 in Switzerland
(at the time the survey was sent out), of which 82%
responded. Our sample therefore is highly representa-
tive for the entire group. As stated above, the quality
of responses was unusually high, with less then 0.3%
of all questions having missing values, and for 97.1%
of all vehicles owned by the survey households, the
make, model, vintage, type of gear, type of fuel, and
engine capacity where reported such that the vehicle
could be uniquely identified in the official registration
data base.
We leave for future research the investigation of
the third possible rebound effect, increase of vehicle
kilometers driven annually due to the fact that lower
fuel consumption leads to cheaper operation cost.
Binswanger (2001) hypothesizes that this rebound
effect should in fact be present. As discussed in Sec-
tion 2, however, it is expected to be very difficult to
actually confirm the occurrence or non-occurrence of
this rebound effect for any given community of pur-
chasers of a given car.
7. Conclusions and outlook
We showed that purchases of the new hybrid
Toyota Prius 2 exhibited neither of the two direct
P. de Haan et al. / Ecological Economics 58 (2006) 592–605604
rebound effects investigated. On the contrary: vehicle
size slightly decreased, and the low numbers of first-
time buyers and non-replacement vehicles would, if
they were representative for a whole population,
even lead to a decrease in average vehicle owner-
ship. These outcomes are partly due to the fact that
Prius buyers can be considered as bearly adoptersQ.Their behavior is not necessarily representative for
the mass market. Still, our findings strongly support
the view that the Toyota Prius 2 is indeed a product
that effectively combines fuel efficiency and the
satisfaction of consumer needs, and is successful in
replacing daily-use vehicles and becoming the most
used car in a household. Economic points of view,
like the relation between saved fuel and total surplus
cost, have been investigated elsewhere (e.g., Lave
and MacLean, 2002) and are not the topic of the
present paper.
As the hybrid technology causes a cost surplus
compared to vehicles with conventional powertrains
(internal combustion engines), the feasibility of tax
rebates or other means of compensation are currently
in evaluation both in Northern America and in Eur-
ope. Our findings confirm that hybrid vehicles like the
Toyota Prius indeed have a positive effect on total
CO2 emissions from road transport, and that rebound
effects are not yet in sight. Financial support for the
purchase of hybrid vehicles therefore seems to be a
possible and valid environmental policy. Further pro-
gress in fuel-efficiency gains using hybrid powertrains
is to be expected (e.g. Fukuo et al., 2001). In the near
future, new cars equipped with hybrid technology will
come to market in Europe. We intend to conduct
surveys similar to the one presented here for these
other hybrid cars as well. Examples are Honda Civic
IMA and Lexus RX400h. Especially the latter will be
of interest with regard to the postulated existence of
rebound effects due to reduced socio-psychologial
(rather than financial) cost-of-ownership.
Acknowledgements
Thanks go to Toyota Switzerland for financing the
copying and mailing of the questionnaire to the Prius
purchasers and for its translation from German into
French. Toyota Switzerland did not otherwise support
this research.
References
Auto-suisse, 2005. 9. Berichterstattung im Rahmen der Energiever-
ordnung uber die Absenkung des spezifischen Treibstoffnorm-
verbrauchs von Personenwagen 2004. Auto-suisse, association
importeurs suisses d’automobiles, Bern, Switzerland, 7 June
2005.
BFS, 2001. Mobilitat in der Schweiz, Ergebnisse des Mikrozensus
2000 zum Verkehrsverhalten [Mobility in Switzerland, Results
from the 2000 Micro Census on Mobility Behavior]. Swiss
Federal Offices for Spatial Development and for Statistics,
Bern. available in German and French.
Berkhout, P.H.G., Muskens, J.C., Velthuijsen, J.W., 2000. Defining
the rebound effect. Energy Policy 28, 425–432.
Binswanger, M., 2001. Technological progress and sustainable
development: what about the rebound effect? Ecological Eco-
nomics 36, 119–132.
Birol, F., Keppler, J.H., 2000. Prices, technology development and
the rebound effect. Energy Policy 28, 457–469.
Bitsche, O., Gutmann, G., 2004. Systems for hybrid cars. Journal of
Power Sources 127, 8–15.
Brookes, L., 2000. Energy efficiency fallacies revisited. Energy
Policy 28, 355–366.
EEA, 2002. Annual European Community Greenhouse Gas Inven-
tory 1990–2000 and Inventory Report 2002. EEA Technical
Report, vol. 75. European Environment Agency, Copenhagen.
Fukuo, K., Fujimura, A., Saito, M., Tsunoda, K., Takiguchi, S.,
2001. Development of the ultra-low-fuel-consumption hybrid
car—insight. JSAE Review 22, 95–103.
Greening, L.A., Greene, D.L., Difiglio, C., 2000. Energy efficiency
and consumption—the rebound effect—a survey. Energy Policy
28, 389–401.
Grepperud, S., Rasmussen, I., 2004. A general equilibrium assess-
ment of rebound effects. Energy Economics 26, 261–282.
Haas, R., Biermayr, P., 2000. The rebound effect for space heating:
empirical evidence from Austria. Energy Policy 28, 403–410.
Herring, H., 2006. Energy efficiency—a critical review. Energy 31,
10–20.
Hertwich, E.G., 2005. Consumption and the rebound effect. An
industrial ecology perspective. Journal of Industrial Ecology 9,
85–98.
IEA, OECD, 2003. Energy to 2050: scenarios for a sustainable
future. IEA Publications, Paris.
Jaccard, M., Bataille, C., 2000. Estimating future elasticities
of substitution for the rebound debate. Energy Policy 28,
451–455.
Jalas, M., 2002. A time use perspective on the materials intensity of
consumption. Ecological Economics 41, 109–123.
JDP-LMC, 2005. Hybrid-Electric Vehicle Outlook. J.D. Power-
LMC Automotive Forecasting Services, Westlake Village CA,
U.S.A. 3 February.
Laitner, J.A., 2000. Energy efficiency: rebounding to a sound
analytical perspective. Energy Policy 28, 471–475.
Lave, L.B., MacLean, H.L., 2002. An environmental-economic
evaluation of hybrid electric vehicles: Toyota’s Prius vs. its
conventional internal combustion engine Corolla. Transporta-
tion Research. Part D, Transport and Environment 7, 155–162.

P. de Haan et al. / Ecological Economics 58 (2006) 592–605 605
MacLean, H.L., Lave, L.B., 2003. Evaluating automobile fuel/pro-
pulsion system technologies. Progress in Energy and Combus-
tion Science 29, 1–69.
Saunders, H.D., 2000. A view from the macro side: rebound, back-
fire, and Khazzoom-Brookes. Energy Policy 28, 439–449.
Schipper, L., Grubb, M., 2000. On the rebound? Feedback between
energy intensities and energy uses in IEA countries. Energy
Policy 28, 367–388.
Schipper, L., Unander, F., Murtishaw, S., Ting, M., 2001. Indicators
of energy use and carbon emissions: explaining the energy
economy link. Annual Review of Energy and the Environment
26, 49–81.
TNS Sofres, department automobile, 2002. 1991–2001: Dix ans
d’apres vente automobile en France. Unpublished report on
the occasion of the automobile world fair Paris 2002 (in
French only).
Yamamoto, T., Madre, J.-L., Kitamura, R., 2004. An analysis of the
effects of French vehicle inspection program and grant for
scrappage on household vehicle transaction. Transportation
Research-B 38, 905–926.