
Does MPA mean 'Major Problem for Assessments'? Considering the consequences of place-based...
19
Does MPA mean ‘Major Problem for Assessments’? Considering the consequences of place-based management systems John C. Field 1* , Andre ´ E. Punt 2 , Richard D. Methot 3 & Cynthia J. Thomson 1 1 Fisheries Ecology Division, Southwest Fisheries Science Center, NOAA Fisheries, 110 Shaffer Rd., Santa Cruz, CA 95062, USA; 2 School of Aquatic and Fishery Sciences, University of Washington, Seattle, WA 98195-5020, USA; 3 Office of Science and Technology, NOAA Fisheries, 2725 Montlake Blvd. E, Seattle, WA 98112, USA Introduction 285 MPAs, stock assessments and spatial modelling in marine ecosystems 286 The role of fisheries science in management 287 Fishery-dependent information 288 Life-history information 290 Catch demographic data 291 Fishery-independent surveys 291 Spatial variability and movement patterns 293 Structure of assessment models 293 Fisheries management objectives and obligations 296 Abstract Marine protected areas (MPAs) have been increasingly proposed, evaluated and implemented as management tools for achieving both fisheries and conservation objectives in aquatic ecosystems. However, there is a challenge associated with the application of MPAs in marine resource management with respect to the consequences to traditional systems of monitoring and managing fisheries resources. The place-based paradigm of MPAs can complicate the population-based paradigm of most fisheries stock assessments. In this review, we identify the potential complica- tions that could result from both existing and future MPAs to the science and management systems currently in place for meeting conventional fisheries manage- ment objectives. The intent is not to evaluate the effects of implementing MPAs on fisheries yields, or even to consider the extent to which MPAs may achieve conservation oriented objectives, but rather to evaluate the consequences of MPA implementation on the ability to monitor and assess fishery resources consistent with existing methods and legislative mandates. Although examples are drawn primarily from groundfish fisheries on the West Coast of the USA, the lessons are broadly applicable to management systems worldwide, particularly those in which there exists the institutional infrastructure for managing resources based on quantitative assessments of resource status and productivity. Keywords fisheries assessment, fisheries management, fish stock, marine protected area, spatial model *Correspondence: John C. Field, Fisher- ies Ecology Division, Southwest Fisheries Science Center, NOAA Fisheries, 110 Shaffer Rd., Santa Cruz, CA 95062, USA Tel.: +1-831-420- 3907 Fax: +1-831-420- 3977 E-mail: john.field@ noaa.gov Received 26 May 2006 Accepted 15 Aug 2006 284 Ó 2006 Blackwell Publishing Ltd F I S H and F I S H E R I E S , 2006, 7, 284–302
-
Upload
independent -
Category
Documents
-
view
0 -
download
0
Transcript of Does MPA mean 'Major Problem for Assessments'? Considering the consequences of place-based...
Does MPA mean ‘Major Problem for Assessments’?
Considering the consequences of place-based management
systems
John C. Field1*, Andre E. Punt2, Richard D. Methot3 & Cynthia J. Thomson1
1Fisheries Ecology Division, Southwest Fisheries Science Center, NOAA Fisheries, 110 Shaffer Rd., Santa Cruz, CA 95062,
USA; 2School of Aquatic and Fishery Sciences, University of Washington, Seattle, WA 98195-5020, USA; 3Office of Science
and Technology, NOAA Fisheries, 2725 Montlake Blvd. E, Seattle, WA 98112, USA
Introduction 285
MPAs, stock assessments and spatial modelling in marine ecosystems 286
The role of fisheries science in management 287
Fishery-dependent information 288
Life-history information 290
Catch demographic data 291
Fishery-independent surveys 291
Spatial variability and movement patterns 293
Structure of assessment models 293
Fisheries management objectives and obligations 296
Abstract
Marine protected areas (MPAs) have been increasingly proposed, evaluated and
implemented as management tools for achieving both fisheries and conservation
objectives in aquatic ecosystems. However, there is a challenge associated with the
application of MPAs in marine resource management with respect to the
consequences to traditional systems of monitoring and managing fisheries resources.
The place-based paradigm of MPAs can complicate the population-based paradigm of
most fisheries stock assessments. In this review, we identify the potential complica-
tions that could result from both existing and future MPAs to the science and
management systems currently in place for meeting conventional fisheries manage-
ment objectives. The intent is not to evaluate the effects of implementing MPAs on
fisheries yields, or even to consider the extent to which MPAs may achieve
conservation oriented objectives, but rather to evaluate the consequences of MPA
implementation on the ability to monitor and assess fishery resources consistent with
existing methods and legislative mandates. Although examples are drawn primarily
from groundfish fisheries on the West Coast of the USA, the lessons are broadly
applicable to management systems worldwide, particularly those in which there
exists the institutional infrastructure for managing resources based on quantitative
assessments of resource status and productivity.
Keywords fisheries assessment, fisheries management, fish stock, marine protected
area, spatial model
*Correspondence:
John C. Field, Fisher-
ies Ecology Division,
Southwest Fisheries
Science Center,
NOAA Fisheries, 110
Shaffer Rd., Santa
Cruz, CA 95062, USA
Tel.: +1-831-420-
3907
Fax: +1-831-420-
3977
E-mail: john.field@
noaa.gov
Received 26 May 2006
Accepted 15 Aug 2006
284 � 2006 Blackwell Publishing Ltd
F I S H and F I S H E R I E S , 2006, 7, 284–302

Summary 297
Acknowledgements 298
References 298
Introduction
The application of marine protected areas (MPAs1)
and other spatially based management efforts (such
as rotating closures and ocean zoning) has been
increasingly accepted as a feasible tool for marine
resource management (Murray et al. 1999;
Murawski et al. 2000; Roberts et al. 2001; Pikitch
et al. 2004). For example, a National Research
Council (NRC) panel found ‘compelling empirical
evidence and strong theoretical arguments’ for the
use of MPAs and marine reserves as tools for
managing fisheries, protecting habitat and biodiver-
sity, and enhancing the anthropocentric value
(esthetic and otherwise) of marine habitat (NRC
2001). As management tools, MPAs potentially offer
a form of insurance against (a) overexploitation of
target species, (b) the compression of the age struc-
ture of fished populations, (c) undesirable fishing-
induced impacts on non-target species, (d) reduction
in biodiversity and (e) fishing-induced impacts to
habitat (NRC 2001; Gerber et al. 2003; Halpern
2003). Consequently, there is widespread consensus
that MPAs are appropriate tools for achieving con-
servation needs that may be difficult to achieve under
stock-wide or fishery-wide management approaches.
Marine protected areas are, however, not a pan-
acea for solving marine resource management prob-
lems, and the effect of MPAs on yield remains a
critical issue. As Botsford et al. (2004) discuss, fishing
is typically the primary action being limited so the
effects of MPAs on yield are central to any policy
decisions regarding MPA implementation. Mangel
(1998) and Botsford et al. (2004) have shown that,
in the absence of detailed information regarding
larval transport and benthic productivity, it is
possible to show a rough equivalence between the
yield of a single species that is possible with
reserves and with conventional management tech-
niques, such that reserves can function roughly
equivalent to reducing effort in a fishery. However,
MPAs more typically reduce the maximum poten-
tial yield because fish in the MPA do not directly
contribute to this yield (Mangel 1998; Sladek-
Nowlis and Roberts 1999), although exceptions to
this generalization are possible (Berkeley 2006).
To achieve conservation objectives, many fisher-
ies management bodies throughout the world have
found it necessary to implement measures that
could be argued to be comparable to MPAs. For
example, a system of closed areas has been imple-
mented to assist in meeting the conservation
objective of rebuilding the depleted groundfish
species managed by the Pacific Fishery Management
Council (PFMC). In this system, the closed areas act
to move the fishery out of regions where bycatch of
depleted stocks would be highest. Ancillary benefits
to habitat, diversity and other ecosystem services
aside, the question of whether, and how, to incor-
porate protected areas as a strategic management
tool to sustain low productivity stocks or otherwise
optimize production of healthy stocks will be one
that fisheries managers throughout the world are
likely to consider to meet continually changing
conservation objectives. However, policy decisions
should be made with the awareness that adopting
spatially based management could create new
challenges for scientists and managers alike, partic-
ularly in regions with an infrastructure and history
of using contemporary applied assessment models as
the basis for decision making.
Within the USA, MPAs would not replace existing
legislative obligations such as status determinations
and the provision of estimates of optimal yields (OY)
for target species. Consequently, two critical ques-
tions for managers to consider with respect to these
obligations are: (1) whether/how the portion of the
stock in the MPA is accounted for with respect to
determination of stock status and depletion levels;
and (2) whether restrictions on data collection inside
the MPA would impact the ability to determine the
1Throughout this paper we will use the term ‘MPA’ to
mean an area with legal boundaries in which fishing is
prohibited for all or a subset of species, or particular fishing
gears are disallowed with some degree of permanence
(excluding spatial management measures that are more
dynamic in nature). According to this definition, ‘marine
reserves’ are a type of MPA in which all fishing is
disallowed.
Impacts of MPAs on Fisheries Science J C Field et al.
� 2006 Blackwell Publishing Ltd, F I S H and F I S H E R I E S , 7, 284–302 285
status of the entire stock. The first question can be
paraphrased as considering whether the spawning
biomass within MPAs is ‘on the table’ or ‘off the
table’ with respect to status determinations. In other
words, would the biomass estimated to exist within
the MPA be included as part of the total biomass
when evaluating stock status and harvest policies.
Given existing mandates to rebuild depleted stocks,
the current answer is clearly that such biomass is
‘on the table.’ However, if MPAs were developed for
a wider range of healthy stocks, the ‘on the table’
policy could lead to unfavourable management
outcomes for healthy stocks and habitats that occur
outside of the reserve (in the absence of a propor-
tional reduction in effort), as the stocks outside the
reserve would be subject to a proportionately greater
fishing mortality rate than the status quo (Hilborn
et al. 2006). This highlights that the ‘on the table’
approach might not result in an optimal environ-
mental or socioeconomic outcome.
With respect to the second question, whether or
not MPAs would restrict data collection within
closed areas, it is clear that the inability to maintain
time series of abundance estimates based on mon-
itoring within closed areas could severely compro-
mise the ability to assess the status of stocks.
Although monitoring is an essential component of
spatial management, the issue of how to monitor
could be controversial. Moreover, greater patchiness
in the distribution and abundance of resources
could lead to greater variance in the data, and
possibly greater uncertainty with respect to stock-
wide abundance and trends. This paper evaluates
the likely and plausible impacts of MPAs on the
scientific process that supports management, with
examples drawn from the West Coast and elsewhere
to provide context.
MPAs, stock assessments and spatial modelling in
marine ecosystems
In a comprehensive review of fisheries and marine
ecosystem simulation models that include spatial
dynamics, Pelletier and Mahevas (2005) rated the
potential for each modelling approach to address a
range of effects described as important elements of
the success (or lack thereof) of MPA implementa-
tion. These included restoring spawning biomass
within MPAs, restoring demographic structure
within MPAs, increasing fecundity, providing spil-
lover, enhancing fisheries yield, improving popula-
tion stability and resilience, protecting biodiversity
and effecting changes in community structure.
Overall, the review suggests that MPAs tended to
meet the conservation goals of maintaining or
restoring populations and population demographics.
Although most studies suggest that yields would be
likely to decline, even this broad generalization may
be uncertain, as outcomes tend to be dependent on
a range of assumptions related to larval dispersal,
compensatory processes (including the life-history
stage at which compensation takes place), maternal
effects, movement and spillover (Botsford et al.
2003; Hilborn et al. 2004; Starr et al. 2004; Hart
2006; Berkeley 2006).
For example, Hart (2006) developed an analytical
approach for assessing the effects of long-term
closures on yield based on no movement between
open and closed areas, and found that with MPAs,
yields increased only when fishing mortality was
greater than that associated with maximum sus-
tainable yield (MSY). Similarly, using a spatially
explicit multispecies simulation model of the Geor-
ges Bank region, Holland (2003) found that while
area closures of 10–30% of fishable habitat resulted
in modest increases in maximum potential revenue,
they also increased the effort required to attain such
revenue. The transient effects between existing and
future conditions are also important considerations.
For example, Hobday et al. (2005) evaluated the
impact of MPAs established for habitat and biodi-
versity conservation on the recovery of rock lobster
in the coastal waters of Victoria, Australia, and
found that while MPAs would likely enhance the
rate of recovery, they would also be likely to delay
the recovery of the exploitable biomass in the areas
open to fishing, because of the loss of fishable area.
From a more practical perspective, MPAs may
pose a particularly complex challenge with respect
to actually conducting the stock assessments from
which status and yield are estimated. One necessary
assumption of most assessment models is that the
population being assessed has a high diffusivity, or
alternatively, that all members of the target species
are subject to the same fishing mortality rate as a
result of the mobility and behaviour of the fishing
fleet. This means that the effect of local recruitment
events and regional fisheries are assumed to spread
rapidly throughout the entire stock, which allows
fishing mortality to be defined relative to the entire
stock. The design of an MPA is based on the opposite
assumption, which is that stocks are sufficiently
viscous (low movement or diffusivity), that the
protection afforded to the portion of the stock in the
Impacts of MPAs on Fisheries Science J C Field et al.
286 � 2006 Blackwell Publishing Ltd, F I S H and F I S H E R I E S , 7, 284–302
MPA will not quickly dissipate outside. In reality,
there is clearly a continuum of diffusivity and
viscosity in nature that is both stock dependent and
difficult to quantify.
As the application of spatial management meas-
ures increases, it would be beneficial for most single-
species assessment models to become spatially expli-
cit. This is particularly important for high-viscosity
stocks, as MPAs by design would be expected to
further establish and maintain heterogeneous pat-
terns of abundance, age and size distribution
(Guenette et al. 1998; Holland 2002; Punt and
Methot 2004, Hart 2006). Consequently, if large-
scale MPAs are implemented, stock assessment
methods will likely need to account for spatial
differences in population structure and movement
patterns, both of which are poorly understood for
most populations. Such considerations could poten-
tially be incorporated into future assessments of data-
rich species, by using spatially stratified population
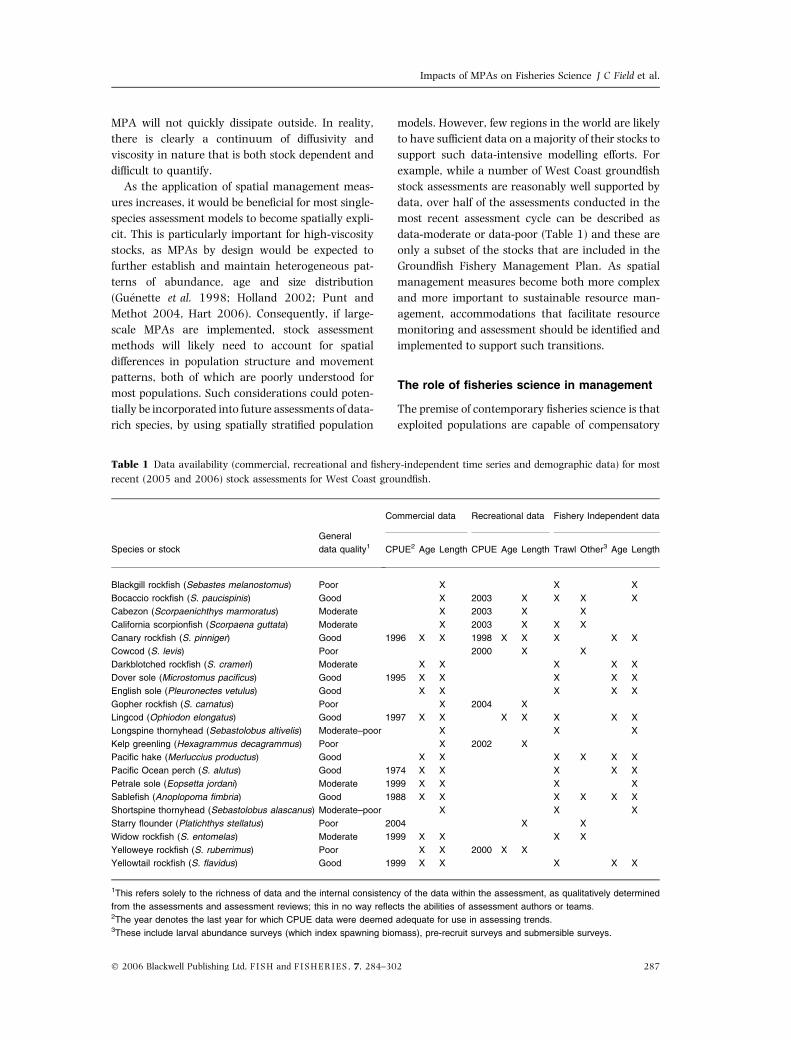
models. However, few regions in the world are likely
to have sufficient data on a majority of their stocks to
support such data-intensive modelling efforts. For
example, while a number of West Coast groundfish
stock assessments are reasonably well supported by
data, over half of the assessments conducted in the
most recent assessment cycle can be described as
data-moderate or data-poor (Table 1) and these are
only a subset of the stocks that are included in the
Groundfish Fishery Management Plan. As spatial
management measures become both more complex
and more important to sustainable resource man-
agement, accommodations that facilitate resource
monitoring and assessment should be identified and
implemented to support such transitions.
The role of fisheries science in management
The premise of contemporary fisheries science is that
exploited populations are capable of compensatory
Table 1 Data availability (commercial, recreational and fishery-independent time series and demographic data) for most
recent (2005 and 2006) stock assessments for West Coast groundfish.
Species or stock
General
data quality1
Commercial data Recreational data Fishery Independent data
CPUE2 Age Length CPUE Age Length Trawl Other3 Age Length
Blackgill rockfish (Sebastes melanostomus) Poor X X X
Bocaccio rockfish (S. paucispinis) Good X 2003 X X X X
Cabezon (Scorpaenichthys marmoratus) Moderate X 2003 X X
California scorpionfish (Scorpaena guttata) Moderate X 2003 X X X
Canary rockfish (S. pinniger) Good 1996 X X 1998 X X X X X
Cowcod (S. levis) Poor 2000 X X
Darkblotched rockfish (S. crameri) Moderate X X X X X
Dover sole (Microstomus pacificus) Good 1995 X X X X X
English sole (Pleuronectes vetulus) Good X X X X X
Gopher rockfish (S. carnatus) Poor X 2004 X
Lingcod (Ophiodon elongatus) Good 1997 X X X X X X X
Longspine thornyhead (Sebastolobus altivelis) Moderate–poor X X X
Kelp greenling (Hexagrammus decagrammus) Poor X 2002 X
Pacific hake (Merluccius productus) Good X X X X X X
Pacific Ocean perch (S. alutus) Good 1974 X X X X X
Petrale sole (Eopsetta jordani) Moderate 1999 X X X X
Sablefish (Anoplopoma fimbria) Good 1988 X X X X X X
Shortspine thornyhead (Sebastolobus alascanus) Moderate–poor X X X
Starry flounder (Platichthys stellatus) Poor 2004 X X
Widow rockfish (S. entomelas) Moderate 1999 X X X X
Yelloweye rockfish (S. ruberrimus) Poor X X 2000 X X
Yellowtail rockfish (S. flavidus) Good 1999 X X X X X
1This refers solely to the richness of data and the internal consistency of the data within the assessment, as qualitatively determined
from the assessments and assessment reviews; this in no way reflects the abilities of assessment authors or teams.2The year denotes the last year for which CPUE data were deemed adequate for use in assessing trends.3These include larval abundance surveys (which index spawning biomass), pre-recruit surveys and submersible surveys.
Impacts of MPAs on Fisheries Science J C Field et al.
� 2006 Blackwell Publishing Ltd, F I S H and F I S H E R I E S , 7, 284–302 287

increases in per capita productivity in response to
removals through fishing. Fishing increases the
mortality rate of a given stock, leading to a smaller
population of younger, faster growing individuals.
Populations fished down below their equilibrium
levels tend to have higher per capita production of
young, which implies a density-dependent capacity
to support some sustainable level of fishery remov-
als. The ultimate objective in stock assessment
science is to estimate both the abundance and the
productivity of a given stock, in order to optimize the
potential yield resulting from such compensation.
Doing so requires estimating what the current
biomass is, what the historical biomass has been,
how productive the stock is, how much uncertainty
there is around all of these measurements, and what
the likely consequences of possible management
actions (typically harvest levels) are.
A key role of fisheries management is to translate
the guidance provided by fisheries scientists based
on stock assessments into allowable harvest rates,
catches and other management measures with the
goal of maintaining populations at or above their
target levels. Both the Magnuson-Stevens Fishery
Conservation and Management Act (MSFCMA) in
the USA and the UN FAO Code of Conduct for
Responsible Fisheries, call for stock-specific biologi-
cal reference points to serve as limits, targets and
performance indicators for management actions
when setting allowable fishing levels. For the USA
fisheries, limit reference points are defined with
respect to both fishing mortality (harvest) rates and
biomass thresholds. Biomass thresholds, referred to
in the USA as minimum stock size thresholds
(MSST), are reference points that specify the relative
biomass level at which a stock is considered
overfished or depleted. The harvest rate associated
with the MSY is also a limit reference point, and is
referred to as the maximum fishing mortality
threshold (MFMT, or alternatively, FMSY). Exceeding
this harvest rate (or the associated catch, referred
to as the allowable biological catch or ABC) is
considered overfishing according to current USA
law. Target catches, known as OY, are legally
defined in the USA as the ABC values as reduced by
relevant ecological or socioeconomic factors. The
objective for most stock assessments is to develop
and integrate life-history, catch and relative abun-
dance information into a statistical model to
estimate absolute stock abundance, reproduction
and mortality relative to these established manage-
ment limits and targets.
The very earliest reference points were based on
estimating the MSY of a given population using the
logistic growth curve (Schaefer 1954). These simple
curves predicted that populations were most pro-
ductive when fished down to half of their unfished
biomass. As population models became more com-
plex, it was found that the population size at which
MSY is predicted to occur, BMSY, was actually very
difficult to estimate and sensitive to model assump-
tions. As a result, both FMSY and BMSY are now
commonly based on ‘proxies’ that can be deter-
mined from readily available fisheries data and
models. For example, the fishing mortality rate that
reduces spawning biomass per recruit (SPR) to
levels ranging from 35% to 50% of the unfished
level (F35%, F50%) have been used as both targets
and limits for many fisheries (Clark 1991, 1993;
Goodman et al. 2002; Ralston 2002).
Stock assessment models generally require three
categories of information: total catch (what has
been removed), life-history information (growth,
maturity and natural mortality), and absolute or
relative abundance data to determine trends in
abundance.2 Age- and length-structured models
require more detailed demographic data (catch
age- and length-composition information), but are
better able to adjust for the details of fishery
selectivity, use multiple data sources and make
realistic projections. In a typical stock assessment,
observed catch demographic and trend data are
fitted to predicted values by varying model param-
eters related to, for example, recruitment, mortality,
selectivity and productivity (primarily the steepness
of the spawner/recruit function). The principal types
of information used in stock assessment models are
shown graphically in Fig. 1, and the extent to which
MPAs could potentially affect each of these types of
information is examined in the following sections.
Fishery-dependent information
Fishery-dependent information includes retained
catch, discarded catch, demographic characteristics
of the catch (generally its age, sex and size compo-
sitions) and catch per unit of nominal effort (CPUE).
2The assessment model Stock Synthesis 2 (SS2; Methot
2000, 2005) is used most widely for modelling stock
abundance and productivity for fisheries off the West Coast
of the USA, primarily because it was designed to use the
mix of length, age, trend and discard data commonly
available for these stocks.
Impacts of MPAs on Fisheries Science J C Field et al.
288 � 2006 Blackwell Publishing Ltd, F I S H and F I S H E R I E S , 7, 284–302

For CPUE, effort may be area (or time) trawled, the
number of hooks on a longline or the number of
angler hours in a recreational fishery. Fishery-
dependent data can provide insight into trends in
abundance if they meet the assumptions necessary
to be useful as a time series of relative abundance
(such as constant catchability, stable gear and
vessel efficiency). The presumed consequences of
implementing closed areas include changes in the
distribution and level of effort, thus weakening the
assumption that catchability is constant. There
could also be substantial bias, or more variability
in catch-rate data as some vessels ‘fish the line’
along MPA boundaries because of either real or
perceived higher catch rates in boundary areas
associated with spillover (McClanahan and Mangi
2000; Murawski et al. 2000; Goni et al. 2006). For
example, using vessel monitoring system and log-
book data, Murawski et al. (2005) found that the
implementation of large closed areas in the Georges
Bank region had fundamentally restructured the
spatial dynamics of the fishery in that region, with
both a reduction in overall fishing effort as well as a
concentration of effort near closed area boundaries.
Even if such bias could be accounted for (by
removing CPUE data associated with boundary
areas), the resulting CPUE indices would presuma-
bly represent population trends of the exploited
portion of the stock, rather than the entire stock, as
trends within protected areas would presumably be
quite different from those outside. MPAs could also
limit the ability of fishermen to make choices of
where to fish in a manner consistent with the period
prior to their implementation, particularly if MPAs
are established in areas of high density or where fish
aggregate seasonally (Holland 2002).
In practice however, fishery CPUE data are often
considered suspect as an index of stock abundance
for a variety of reasons. For example, catch rates
may be stable in the face of stock declines as a result
of increasing fishing power or changing spatial
patterns in effort (Hilborn and Walters 1992;
Walters 2003). Furthermore, management meas-
ures can substantially alter the integrity of fishery-
dependent data, particularly for resources that are
considered overfished or depleted and consequently
become subject to efforts by managers to reduce or
control catches. For example, in response to declines
in rockfish abundance, trip limits off the USA West
Coast have become increasingly restricted over time
(e.g. Fig. 2), culminating in complete non-retention
of some species and massive closures of habitat in
recent years. As a result, for all but one of the nine
assessments in Table 1 that included commercial
CPUE indices, the index was truncated by 2000
because of difficulties interpreting catch rates given
the impact (perceived or otherwise) of regulatory
changes. CPUE indices based on data from recre-
ational fishers have largely continued to be used for
several West Coast groundfish assessments where
STATISTICAL STOCK ASSESSMENT MODEL
STOCK STATUS AND TRENDS
OPTIMUMYIELD
FISHERY-DEPENDENT• CATCH AND DISCARDS• DEMOGRAPHIC DATA• CPUE TRENDS
LIFE HISTORY• GROWTH, MATURITY AND FECUNDITY
• NATURAL MORTALITY
FISHERY-INDEPENDENT• SURVEY TRENDS AND
ABUNDANCE• DEMOGRAPHIC DATA
EXTENDED MODELSSPATIAL STRUCTURE,SEASONAL STRUCTURE, CLIMATE, ECOSYSTEM INTERACTIONS
HARVEST POLICY
SOCIOECONOMIC FACTORS
Figure 1 Principal sources of data
and information used in most age-
and length-structured stock assess-
ments.
0
100
200
300
400
1984 1988 1992 1996 2000 2004
1000
s p
ou
nd
s/m
on
th
southnorth
Figure 2 Example of regulatory changes that may bias
catch per unit effort (CPUE) time series as indices that
change linearly with changes in abundance, shown are
changes in bimonthly trip limit equivalents for West Coast
rockfish (all Sebastes species except splitnose rockfish, S.
diploproa) south and north of Cape Mendocino, CA.
Impacts of MPAs on Fisheries Science J C Field et al.
� 2006 Blackwell Publishing Ltd, F I S H and F I S H E R I E S , 7, 284–302 289
fishery-independent surveys are lacking or partic-
ularly imprecise. Standardization of these CPUE data
typically involves analysis of the spatial (depth) and
temporal (seasonal) restrictions that primarily affec-
ted catch rates in these fisheries (Maunder and Punt
2004; Stephens and MacCall 2004) so there is some
confidence that the standardized annual index
represents the trend in stock abundance.
Life-history information
For heavily exploited or depleted species, estimates
of life-history parameters are often not available or
reliable as a result of substantial compression of age
and size distributions. For example, Kronlund and
Yamanaka (2001) found differences in growth
parameters in lightly versus heavily exploited
aggregations of yelloweye rockfish (Sebastes ruberri-
mus) off British Columbia, which they attributed in
part to a lack of older fish in the heavily exploited
site. Bobko and Berkeley (2004) evaluated the
consequences of maternal age on black rockfish
(S. melanops) larval survival and timing of post-
parturation, yet had difficulties in finding adequate
numbers of older females with which to conduct
their analysis (S. Berkeley, personal communica-
tion). Consequently, it is possible that MPAs may
provide a source of specimens and data for larger,
older individuals for biological studies. For example,
Attwood (2003) estimated natural mortality rates
for the galjoen (Dichistius capensis) from large MPAs
off South Africa, and Punt et al. (2001) used a
simulation model to show that there was some
improvement in estimates of natural mortality rates
for coral trout (Plectropomus leopardus) when data
from MPAs were available. However, Punt and
Methot (2004), also using a simulation model,
found that MPAs improved the ability to estimate
natural mortality and other biological parameters
only modestly.
Marine protected areas also have the potential to
alter life-history parameters such as growth and
natural mortality rates as a result of changes in
community structure (predator, competitor and
prey abundance). For example, Salomon et al.
(2002) modelled the effects of MPA zoning policies
in British Columbia using Ecospace (Walters et al.
1999) and predicted that top predators were likely
to cause localized depletion of some prey species,
possibly resulting in trophic cascades.3 Similarly,
Martell et al. (2005) modelled the effects of imple-
menting large-scale MPAs in the North Pacific to
protect pelagic loggerhead and leatherback sea
turtles, as well as marlin populations, all of which
are facing substantial conservation problems. They
found that although closed areas had the potential
to reduce turtle bycatch mortality, this could also
lead to greater predation mortality for both turtles
and marlin.4 In contrast, for groundfish communi-
ties in the California Current, empirical evidence
suggests that higher trophic level rockfish play a
structuring role in the ecosystem, such that habitats
with high piscivore density are associated with few
of the small, fast-growing and early-maturing rock-
fish species found in high abundance in heavily
fished environments (Stein et al. 1992; Yoklavich
et al. 2000; Levin et al. 2006). Moreover, theoret-
ical considerations suggest that smaller species of
rockfish could consume or outcompete recruiting
juveniles of larger species under scenarios of heavy
exploitation for the higher trophic level species,
potentially leading to shifts in equilibrium condi-
tions (MacCall 2002; Baskett et al. 2006). Baskett
et al. (2006) found that under such conditions, area
closures could be among the most effective means of
ensuring that a given species or guild is able to
persist and maintain their functional role in a
habitat or ecosystem.
Such observations lead to two basic conclusions.
The first is that fisheries themselves, through
ecosystem changes, trophic interactions and cas-
cades, and selective forces on demographic charac-
teristics, have the potential to alter life-history
characteristics such as growth, natural mortality
and maturity rates, which would not be expected to
be time invariant even in an unfished system
(Hollowed et al. 2000; Pauly et al. 2002; Walters
et al. 2005). The second is that regardless of
3It has also been acknowledged that some conservation
objectives are not achievable simply by implementing
MPAs. For example, empirical studies of sea otter and
abalone interactions suggest that some California near-
shore MPAs may not be able to serve the dual purpose of
biodiversity enhancement and abalone conservation, as
the abundance of abalone in the presence of sea otters will
be too low to contribute to regional fishery sustainability
(Fanshawe et al. 2003).
4Both these authors and others have qualified such general
results by noting that this type of modelling approach is
limited in its ability to capture demographic structure and
ontogenetic migrations at the population level, and, as
such, may be limited in their ability to predict impacts to
community diversity.
Impacts of MPAs on Fisheries Science J C Field et al.
290 � 2006 Blackwell Publishing Ltd, F I S H and F I S H E R I E S , 7, 284–302

whether such changes have occurred, the imple-
mentation of MPAs could also result in shifts in
life-history characteristics, presumably (but not
reliably) in the opposite direction. Although the
direction of such factors would be difficult to either
assess or predict, the possibility that such charac-
teristics may not be the same inside MPAs as outside
is something of which those who develop or apply
such information should be cognizant. However,
even with the recognition that mean values for
growth, mortality or other factors within MPAs
might not reflect mean values outside of MPAs, the
potential to gain insight regarding the range or
plasticity of such values could be important. Per-
haps more significantly, MPAs could play a role in
preserving genotypic diversity and age structure in
exploited populations. Fishing has been widely
accepted (and experimentally demonstrated) to be
a form of artificial selection towards both smaller
size and earlier maturity (Mangel et al. 1993;
Conover and Munch 2002). The potential conse-
quences of such selection are important for both
conservation and economic reasons. By protecting a
fraction of a given stock from the evolutionary
consequences of fishing, MPAs could provide a
refuge for fish genetically predisposed to fast growth,
late maturity or large size at age. Similarly, it has
been argued that a broad age structure is beneficial
to the recruitment and productivity of many stocks
(Berkeley et al. 2004), and area closures offer one of
very few means of achieving a broad age structure
based on currently available management practices
(Berkeley 2006).
Catch demographic data
A major source of information for most contempor-
ary stock assessments, particularly those in temper-
ate waters, is demographic data (catch at age and/
or catch at length) taken directly from fisheries
catches. Such information is an important compo-
nent of most (21 of 22) of the stock assessments in
Table 1 and contributes to the estimation of fishing
mortality as well as the relative strengths of the
year-classes reflected in the catch. With low rates of
mixing, it is reasonable to assume that the age
structure of the population in an MPA would be
similar to that in the unfished state whereas that in
the fished area would reflect the impact of fishing.
The mixing of animals across MPA boundaries can
be problematic for an assessment at low mixing
rates, as the age structure of the exploited area will
not reflect the impact of fishing mortality. Depend-
ing upon movement rates and other factors, older
and/or large fish can be expected to be over-
represented in catches near the boundary (Kramer
and Chapman 1999; Sladek-Nowlis and Roberts
1999). This has been widely demonstrated in a
number of studies of both fishes (Johnson et al.
1999; McClanahan and Mangi 2000; Russ et al.
2003; Willis et al. 2003) and invertebrates (Cox and
Hunt 2005; Hobday et al. 2005; Goni et al. 2006).
Although such spillover represents productivity that
can contribute to overall yield for a given resource,
the consequences of diffusion of old fish outside
reserve boundaries and into fisheries catches could
cause assessment models to misinterpret the popu-
lation size of the whole stock (Punt and Methot
2004). However, it is worth noting that such
diffusion may already be a factor in contemporary
assessments, when animals that inhabit untrawla-
ble habitat (natural refugia) diffuse randomly or at
high densities to trawlable areas. Furthermore, with
high rates of mixing the effect is unlikely to be
significant.
Fishery-independent surveys
Fishery-independent surveys are specifically de-
signed to be a reliable source of information on
trends in stock abundance (NRC 1998). On the
West Coast, the results from such surveys were used
in 15 of the 23 assessments in Table 1. Addition-
ally, surveys are often a primary source of the
biological data used to estimate life-history param-
eters. Most fishery-independent survey techniques
involve lethal sampling (e.g. to obtain otoliths for
age determination) and may impact the habitat.
Although monitoring is typically considered to be
an essential element of MPA-based approaches for
resource management (NRC 2001; Gerber et al.
2005), the issue of how to monitor has the potential
to be controversial if extractive methods have been
used in traditional surveys. Although non-lethal
means of estimating abundance (such as direct
observation surveys from submersibles or towed
vehicles) offer an alternative way to track abun-
dance and size structure, particularly in areas
difficult or impossible to sample with trawl or other
extractive survey gear (Richards 1986; O’Connell
and Carlile 1993; Jagielo et al. 2003), these surveys
also have limitations. For example, the spatial
extent covered is considerably less than in trawl
surveys, there is an inability to collect age, maturity
Impacts of MPAs on Fisheries Science J C Field et al.
� 2006 Blackwell Publishing Ltd, F I S H and F I S H E R I E S , 7, 284–302 291
and often sex information, length information exist,
but has a higher variance, and the cost may be
prohibitive. Other non-lethal survey methods in-
clude egg or larval abundance (or production)
surveys (Mangel and Smith 1990; Moser et al.
2000; MacCall 2003; Ralston et al. 2003) and
hydroacoustic surveys (Stanley et al. 2000; Helser
et al. 2006), none of which would presumably be
affected by area closures. However, any new indices
of abundance based on non-lethal methods cannot
replace historical time series without a period of
overlap and calibration.
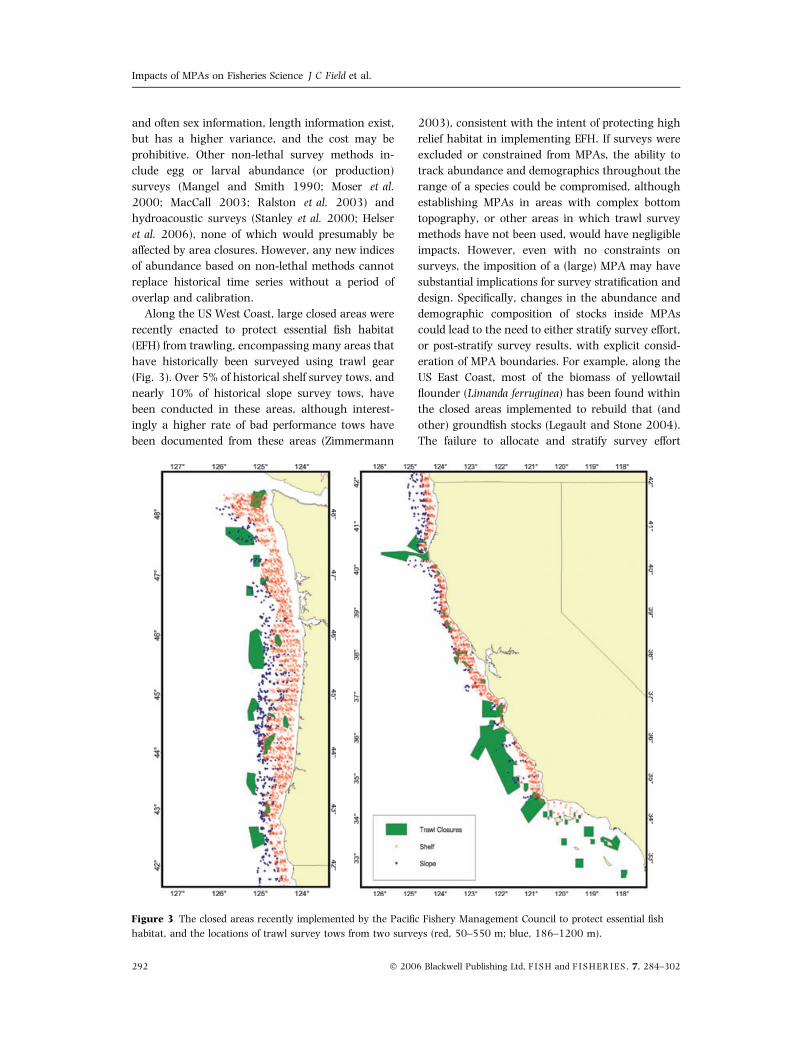
Along the US West Coast, large closed areas were
recently enacted to protect essential fish habitat
(EFH) from trawling, encompassing many areas that
have historically been surveyed using trawl gear
(Fig. 3). Over 5% of historical shelf survey tows, and
nearly 10% of historical slope survey tows, have
been conducted in these areas, although interest-
ingly a higher rate of bad performance tows have
been documented from these areas (Zimmermann
2003), consistent with the intent of protecting high
relief habitat in implementing EFH. If surveys were
excluded or constrained from MPAs, the ability to
track abundance and demographics throughout the
range of a species could be compromised, although
establishing MPAs in areas with complex bottom
topography, or other areas in which trawl survey
methods have not been used, would have negligible
impacts. However, even with no constraints on
surveys, the imposition of a (large) MPA may have
substantial implications for survey stratification and
design. Specifically, changes in the abundance and
demographic composition of stocks inside MPAs
could lead to the need to either stratify survey effort,
or post-stratify survey results, with explicit consid-
eration of MPA boundaries. For example, along the
US East Coast, most of the biomass of yellowtail
flounder (Limanda ferruginea) has been found within
the closed areas implemented to rebuild that (and
other) groundfish stocks (Legault and Stone 2004).
The failure to allocate and stratify survey effort
Figure 3 The closed areas recently implemented by the Pacific Fishery Management Council to protect essential fish
habitat, and the locations of trawl survey tows from two surveys (red, 50–550 m; blue, 186–1200 m).
Impacts of MPAs on Fisheries Science J C Field et al.
292 � 2006 Blackwell Publishing Ltd, F I S H and F I S H E R I E S , 7, 284–302
consistently within and outside of these areas could
result in increasing the variance in the abundance
time series, as could the simple consequence of
having greater spatial heterogeneity in the distri-
bution of the resource itself.
Spatial variability and movement patterns
Movement and dispersal of larvae, juveniles and
adults impact both the efficacy of MPAs and the
likelihood of increased or decreased yields in fisher-
ies. With respect to larval and juvenile movement, it
is worth noting that population persistence is
greater if there is not much dispersal, but increased
(or maintained) yield is more likely if dispersal is
fairly extensive (Botsford et al. 2004). Issues rela-
ting to larval and juvenile dispersal are not
addressed in this paper, because these have been
reviewed extensively elsewhere (Warner et al. 2000;
Gaines et al. 2003; Botsford et al. 2004). Instead,
we briefly review what is known about movement
patterns for the adults of the major groundfish
species and assemblages presented in Table 1, and
consider what this might infer about the ability to
conduct stock assessments and understand changes
in fishing behaviour.
A reasonable amount of information is known
about the seasonal, ontogenetic and nomadic
movement rates for the key species and assemblages
of groundfish along the USA West Coast (Table 2).
There is clearly a wide range of movement patterns
for groundfish in the California Current System. For
example, large-scale (>1000 km), highly predict-
able seasonal movements of Pacific hake are
observed coastwide, while many flatfish (as well as
lingcod and California scorpionfish) have distinctive
seasonal migrations across depth strata. In addition,
many species are relatively mobile (nomadic) on
both small (lingcod, California scorpionfish) and
large (sablefish) spatial scales. By contrast, the
limited evidence for most rockfish suggests that
the bulk of the adults are highly sedentary, with
some gradual ontogenetic movement to greater
depths common for most shelf and slope species. As
a result, MPAs would presumably protect ‘islands’ of
individuals for rockfish, such that these species
would presumably show greater contrast in age and
size structures inside and outside of MPAs. The
observation that the stocks most vulnerable to
overfishing in the California Current System also
appear to be the most viscous with respect to
movement rates might suggest that the spillover of
such species would be low, while the spillover of
more productive species such as sablefish, lingcod
and flatfish (with generally higher movement rates)
could be greater. If so, this would also suggest that
monitoring and assessment efforts will have a
greater need to consider such heterogeneity in
assessing stock status and trends for rebuilding
stocks. However, it is also feasible that future
management strategies could utilize MPAs not only
to hasten the rebuilding of depleted stocks, but to
ensure their persistence while allowing for fishing
opportunities on co-occurring healthy stocks in
open areas. This is particularly true for some of the
higher trophic level, and more vulnerable, species
such as yelloweye rockfish and cowcod (S. ruberri-
mus and S. levis respectively), for which sustainable
yields even over the long term are expected to be a
small fraction of historical catches.
Structure of assessment models
Punt and Methot (2004) conducted a quantitative
evaluation of the effects of implementing large-scale
MPAs on the performance of stock assessment
methods. Using the Management Strategy Evalua-
tion approach,5 they found that while the negative
impacts of MPAs on assessments were substantial if
MPA and non-MPA data were aggregated, the
impacts were minor when spatially structured
models were used. Bias and errors increased with
movement rate, particularly when movement in-
creased with age, because the models treated each
area separately; performance was less sensitive to
assumptions about larval dispersal and density
dependence. Not surprisingly, a lack of fishery-
independent survey data for the population inside
the MPA led to considerably degraded model
performance. Overall, the study suggested that the
negative impacts of MPAs on assessment ability
were relatively slight if measures were taken to
account for spatial patterns in demography and
abundance (e.g. if MPA and non-MPA data are kept
separate), although the simulations were based
5Management strategy evaluation involves developing an
(operating) model that reflects reality and using this model
to generate data on which assessments could be based. The
ability of stock assessment models to estimates quantities of
management interest can be determined by comparing the
estimates from the assessment model (which uses the
generated data) with the true values from the operating
model.
Impacts of MPAs on Fisheries Science J C Field et al.
� 2006 Blackwell Publishing Ltd, F I S H and F I S H E R I E S , 7, 284–302 293

Ta
ble
2S
um
ma
ryo
fk
no
wn
or
susp
ecte
dm
ov
emen
tp
att
ern
sfo
rk
eyg
rou
nd
fish
spec
ies
inth
eC
ali
forn
iaC
urr
ent
syst
em.
Specie
sor
assem
bla
ge
Seasonalm
ovem
ent
Onto
genetic
movem
ent
Nom
adic
movem
ent
Pacifi
chake
Larg
e-s
cale
,w
ell-
defined
seasonalm
igra
tions
1,2
Incre
ase
innort
herly
and
south
erly
dis
trib
ution
with
age
1,2
Dis
trib
ution
ishig
hly
variable
,
influenced
by
clim
ate
1,2
,3
Nears
hore
rockfish
(oliv
e,
copper,
quill
back,
kelp
,blu
e,
bla
ck)
Sm
all-
scale
movem
ent
suspecte
d
for
som
especie
s4,5
,6
Som
esm
all-
scale
movem
ent,
prim
arily
betw
een
juvenile
and
adult
sta
ges
5,6
,7
Very
low
for
most
specie
s,
gre
ate
r
movem
ent
inbla
ck
rockfish
6,7
,8,9
,10,1
1,1
2
Sem
ipela
gic
shelf
rockfish
(yello
wta
il,
wid
ow
,bocaccio
)
Sm
all-
scale
movem
ent
suspecte
d
for
som
especie
s4,1
0,1
1
Som
em
ovem
ent
of
juvenile
sto
deeper
or
off
shore
habitat
with
age
5,1
1
Less
than
10
km
for
most
matu
readults,
sm
all
num
bers
of
yello
wta
ilm
oved
50–250
km
4,1
3,1
4,1
5
Shelf
and
slo
pe
rockfish
(canary
,
Pacifi
cocean
perc
h,
dark
blo
tched,
gre
enspott
ed)
None
know
nor
suspecte
dM
ovem
ent
todeeper
habitat
with
age
for
many
specie
s(c
anary
,dark
blo
tched)1
6,1
7,1
8
Thought
tobe
hig
hly
limited
(1–5
km
)
for
most
specie
s,
with
som
enota
ble
exceptions
15,1
6
Thorn
yheads
(short
spin
eand
longspin
e)
None
know
nor
suspecte
dJuvenile
short
spin
em
ove
deeper
with
age,
no
movem
ent
for
longspin
e19,2
0
Thought
tobe
hig
hly
sedenta
ry,
may
be
som
em
ovem
ent
on
the
ord
er
of
50
km
21
Lin
gcod
Bath
ym
etr
icm
ovem
ent
patt
ern
sre
late
d
tospaw
nin
gactivity
(�10–50
km
)22,2
3,2
4
Little
or
none
Movem
ents
of
up
to400
km
for
a
sm
all
fraction
of
taggin
gstu
dy
recoveries
22,2
3,2
4,2
5
Calif
orn
iaS
corp
ionfish
Form
larg
eseasonalspaw
nin
g
aggre
gations
indeep
wate
r4,2
6
Little
or
none
Dis
pers
ed
and
mobile
in
non-s
paw
nin
gseason
4,2
6
Sable
fish
Poorly
unders
tood
Movem
ent
todeeper
wate
rw
ith
age
27
Movem
ent
of
up
to250
km
com
mon
(�35%
recoveries),
with�
10%
up
to1000
km
28,2
9,3
0
Dover
sole
,E
nglis
hsole
,P
etr
ale
sole
Bath
ym
etr
icm
ovem
ent
shallo
win
sum
mer
(spaw
nin
gfo
rD
over,
Petr
ale
sole
),deep
inw
inte
r
(spaw
nin
gfo
rE
nglis
hsole
)31,3
2,3
3,3
4
Dover,
Englis
hsole
dis
pers
eto
deeper
wate
rw
ith
age
34,3
5
Most
recoveries
within
10–50
km
of
rele
ase,
10–20%
were
50–200
km
.
Str
ong
spaw
nin
gsite
fidelit
y
for
Petr
ale
sole
31,3
2,3
3,3
4
1B
aile
yetal.
(1982),
2D
orn
(1995),
3W
are
and
McF
arlane
(1995),
4Love
(1981),
5Love
et
al.
(2002),
6M
att
hew
s(1
990),
7Lea
et
al.
(1999),
8C
oom
bs
(1979),
9C
ulv
er
(1987),
10M
ath
ew
sand
Bark
er
(1983),
11H
art
mann
(1987),
12E
isenhard
t(2
003),
13P
earc
y(1
992),
14S
tanle
yet
al.
(1994),
15S
tarr
et
al.
(2002),
16G
unders
on
(1997),
17M
eth
ot
and
Ste
wart
(2005),
18R
ogers
(2005),
19W
akefield
(1990),
20Jacobson
and
Vett
er
(1996),
21G
aic
has
and
Ianelli
(2005),
22M
ath
ew
sand
LaR
ivie
re(1
987),
23Jagie
lo(1
990),
24Jagie
lo(1
999),
25S
tarr
et
al.
(2004),
26Love
et
al.
(1987),
27M
eth
ot
et
al.
(1999),
28D
ark
(1983),
29B
eam
ish
and
McF
arlane
(1983),
30K
imura
et
al.
(1998),
31K
etc
hen
and
Forr
este
r(1
966),
32Jow
(1969),
33P
eders
en
(1975),
34W
estr
heim
et
al.
(1992),
35S
tew
art
(2005).
Impacts of MPAs on Fisheries Science J C Field et al.
294 � 2006 Blackwell Publishing Ltd, F I S H and F I S H E R I E S , 7, 284–302

upon relatively data-rich species with low rates of
adult movement. Moreover, these results were based
on there being a relatively large, contiguous MPA,
rather than a large number of more moderately
sized MPAs, and it is not clear whether the results
obtained by Punt and Methot (2004) are robust to
alternative MPA designs.
Ideally, stock assessment models for species sub-
ject to MPAs or other area closures should explicitly
account for variability in population demographics.
For example, depending upon mixing rates and
demographic variability, one might include three
spatial units (protected, exploited and MPA-adjacent
edge areas) in an assessment for a species that is
found to some extent in an MPA. However, moving
to even a three-area model would require both a
substantial shift in the basic modelling framework
and a tremendous increase in the amount and
quality of demographic data from open and closed
areas. Quantifying and understanding movement
and migration rates would become a critical new
focus for assessment-related research. If data or
modelling were not sufficient to explicitly account
for spatial differences in the age or size structure of
the population, the trends and population structure
inferred by catch-at-age and catch-at-length data
may not accurately reflect the demographic status
of the population.
In cases in which the data are too sparse to apply
a fully spatial model, a reasonable compromise to
ignoring spatial structure might be to allow the
availability of fish of different ages/sizes to drop off
with age. Allowing for declining availability with
age/size is already common when conducting stock
assessments for species such as shortspine thorny-
heads (S. alascanus), for which there is an apparent
ontogenetic movement of older (larger) individuals
of both sexes into deeper water. The assumption of
declining availability with age/size (Fig. 4) implies
that a reservoir of larger, older individuals exists in
a population that is less vulnerable to fishing gear
than their smaller, younger counterparts, which
might superficially mimic the impact of an MPA.
However, dome-shaped selectivity has the potential
to be misleading in some circumstances, and
consequently this approach is not likely to be a
reasonable means of approximating differences in
vulnerability across space, in general. Specifically, it
implicitly implies that the trend in abundance inside
and outside the MPA is the same, and could result
in a change in the apparent selectivity over time,
neither of which is likely to reflect reality.
As Schnute and Richards (2001) point out, the
principal assumptions behind assessment models are
often challenged by a mix of complex biological,
oceanographic and interspecific interactions, as well
as by ever changing fisheries practices and manage-
ment measures. Most, if not all, of these assumptions
are not fully met in reality. Wilen (2004) notes that
applied fisheries science has lagged behind more
academic research in marine ecology with respect to
adopting an increasingly ‘spatially rich’ interpret-
ation of the complexity in population, subpopulation
and metapopulation structure in marine populations.
This is largely because of the extensive data neces-
sary to adopt such a spatially explicit body of
research. Although it is true that few stock assess-
ments have confronted spatial variability in abun-
dance, demographics and dispersal, there are a
modest, but increasing, number of examples in which
such factors have been incorporated into catch-at-
age (or catch-at-length) models, such as northern
Atlantic cod (Fu and Fanning 2004), school shark off
southern Australia (Punt et al. 2000) and southern
Pacific tunas (Fournier et al. 1998; Hampton and
Fournier 2001). In all of these examples, the increase
in model complexity was substantial. For example,
Punt et al. (2000) found that while adding
spatial complexity and movement was warranted
by evidence and stakeholder concerns, movement
parameters ultimately accounted for 36 of the 50
parameters used in the model and made quantifying
the uncertainty in the model results more difficult.
Similarly, while Hampton and Fournier (2001)
found that including spatial structure in an assess-
ment of yellowfin tuna allowed the model to better
replicate the patchiness in population distribution
and exploitation (critical for facilitating multina-
0
0.2
0.4
0.6
0.8
1
2 10 18 26 34 42 50 58 66 74+
length bins (cm)
sele
ctiv
ity
0
3
6
9
12
15
18
% b
iom
ass
by s
ize
biomassfisherysurvey
Figure 4 Population length structure and length-based
selectivity curves for shortspine thornyheads (Sebastolobus
alascanus) (Hamel 2005).
Impacts of MPAs on Fisheries Science J C Field et al.
� 2006 Blackwell Publishing Ltd, F I S H and F I S H E R I E S , 7, 284–302 295
tional management of the resource), the high
complexity of the model limited their ability to test
many alternatives to the base model design. Advan-
ces in both assessment and simulation methods
should provide the means to incorporate such
complexity into fisheries science and management
approaches in the future.
Fisheries management objectives and
obligations
Most Fishery Management Councils in the USA
have implemented large-scale closed areas to
rebuild depleted species and to protect EFH (Mu-
rawski et al. 2000; Holland 2005). The duration of
such closures is reflective of the particular issue
they are intended to address. For instance, the
PFMCs gear restrictions and closures implemented
to protect EFH are likely to be quasi-permanent,
while the rockfish conservation areas (RCAs) were
designed to reduce the incidental bycatch of
rebuilding rockfish species, and were not intended
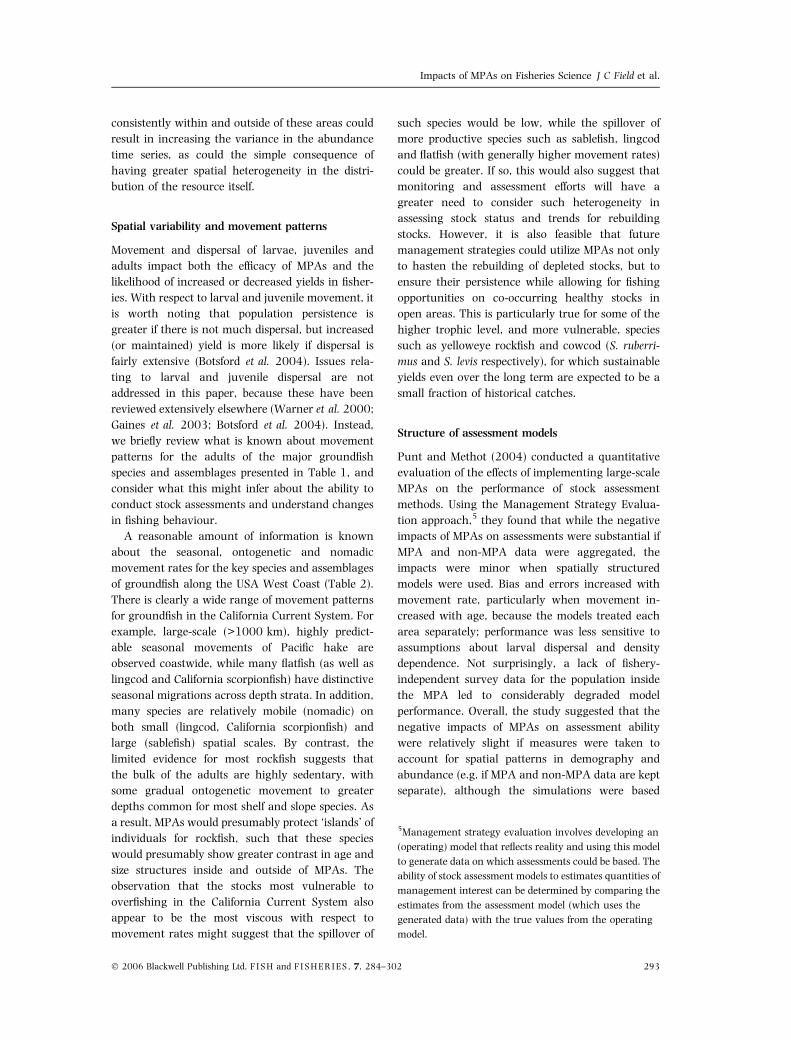
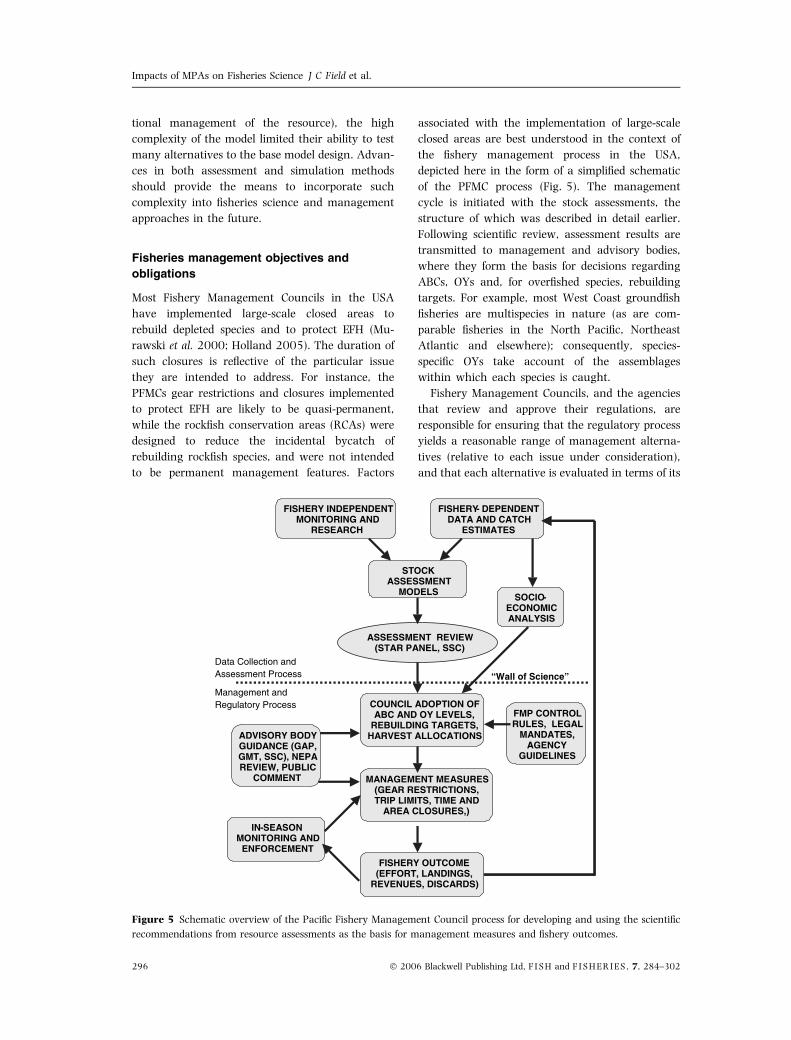
to be permanent management features. Factors
associated with the implementation of large-scale
closed areas are best understood in the context of
the fishery management process in the USA,
depicted here in the form of a simplified schematic
of the PFMC process (Fig. 5). The management
cycle is initiated with the stock assessments, the
structure of which was described in detail earlier.
Following scientific review, assessment results are
transmitted to management and advisory bodies,
where they form the basis for decisions regarding
ABCs, OYs and, for overfished species, rebuilding
targets. For example, most West Coast groundfish
fisheries are multispecies in nature (as are com-
parable fisheries in the North Pacific, Northeast
Atlantic and elsewhere); consequently, species-
specific OYs take account of the assemblages
within which each species is caught.
Fishery Management Councils, and the agencies
that review and approve their regulations, are
responsible for ensuring that the regulatory process
yields a reasonable range of management alterna-
tives (relative to each issue under consideration),
and that each alternative is evaluated in terms of its
FISHERY INDEPENDENT MONITORING AND
RESEARCH
COUNCIL ADOPTION OF ABC AND OY LEVELS,
REBUILDING TARGETS, HARVEST ALLOCATIONS
STOCK ASSESSMENT
MODELS
FISHERY- DEPENDENT DATA AND CATCH
ESTIMATES
ASSESSMENT REVIEW (STAR PANEL, SSC)
Data Collection and Assessment Process
Management and Regulatory Process
“Wall of Science”
FMP CONTROL RULES, LEGAL
MANDATES, AGENCY
GUIDELINES
MANAGEMENT MEASURES (GEAR RESTRICTIONS, TRIP LIMITS, TIME AND
AREA CLOSURES,)
ADVISORY BODY GUIDANCE (GAP, GMT, SSC), NEPA REVIEW, PUBLIC
COMMENT
FISHERY OUTCOME (EFFORT, LANDINGS,
REVENUES, DISCARDS)
SOCIO-ECONOMIC ANALYSIS
IN-SEASON MONITORING AND
ENFORCEMENT
Figure 5 Schematic overview of the Pacific Fishery Management Council process for developing and using the scientific
recommendations from resource assessments as the basis for management measures and fishery outcomes.
Impacts of MPAs on Fisheries Science J C Field et al.
296 � 2006 Blackwell Publishing Ltd, F I S H and F I S H E R I E S , 7, 284–302

biological, environmental and socioeconomic
effects, monitoring and enforcement requirements
and allocation implications. These requirements
help ensure that the Council and the public are
aware of the consequences of management alterna-
tives prior to the selection of a preferred alternative.
Stock assessments and regulatory analyses are
subject to a wide range of dynamic environmental
and economic influences, as well as intrinsic obser-
vation and model uncertainty. Such uncertainty is
explicitly reflected in stock assessments and regula-
tory analyses and in the adoption of precautionary
management measures (such as setting OYs at
levels below ABCs). Uncertainty in pre-season effort
and catch projections is addressed by intensive
in-season monitoring and in-season regulatory
changes (including the possibility of early fishery
closure) as warranted.
In common with most management systems, the
regulatory infrastructure that supports the PFMC
process has had to adapt to the increasing demands
of spatial management. Spatial data were essential
for establishing the boundaries of the RCAs and
continue to be used for monitoring changes in effort
and catch in the open area. The need for an
observer programme became more compelling to
monitor both the magnitude and the spatial distri-
bution of discards, and such a program was
established in 2001. While spatial closures are not
unique in terms of precipitating displacement of
effort to other fisheries, the RCAs led to the
development of customized spatial bycatch models
that predict the effect of RCA boundary changes on
displaced effort and consequent changes in the
catch of target and bycatch species.6 Although this
should not imply that all important data and
methodological issues associated with their use
have necessarily been resolved, the long time
periods expected for several of the rebuilding stocks
suggest that spatial management measures will
remain an important element of the management
toolbox into the foreseeable future. The experience
of the PFMC and other management bodies with
spatial management points out the need for data
and models that suit real world, operational needs of
managers, as well as the need for managers to scale
their priorities and expectations to the limits of
scientific capability and institutional capacity.
Summary
There is general agreement that MPAs can result
in benefits for marine ecosystems, particularly in
situations where scientific information is scarce,
management measures and enforcement are weak,
and resources are depleted below target levels (NRC
2001; Halpern 2003; Alcala et al. 2005). Clearly,
spatial management measures also have a role to
play in facilitating the recovery of rebuilding
species, as evidenced by the increasing implemen-
tation of large-scale closed areas in temperate water
fisheries worldwide. However, there is an ironic
twist to the role that MPAs may play in rebuilding
populations that have been historically depleted, as
the ability to assess stock status and trends may be
compromised to some extent as a result of their
implementation. The issue of bias is important with
respect to the impact on the ability to conduct
assessments, as there is the potential to bias
assessment results in either direction. For example,
if catch-at-age models are based on demographic
data from open fished areas only, the result could be
a more ‘risk adverse’ bias to overestimate fishing
mortality throughout the entire range of the stock.
However, if an assessment is structured to estimate
fishing mortality only on the fraction of the stock
outside MPAs, yet there are larger, older fish from
within MPA moving across boundaries and being
caught in fisheries, the bias could be in the other
direction. In general, the direction of bias is not
likely to be predictable, and will depend both on the
life history of the stock, the dynamics of the fishery
and the nature of the management regime. For
instance, the question of whether the biomass
within MPAs is on or off the table with respect to
estimating stock status relative to target mortality
rates and reference points will have a much greater
influence on the extent to which a management
approach might be risk prone or risk adverse.
The impacts described here are based on the
technical consequences to status quo science and
management systems, which are themselves evol-
ving and changing over time. For managers, the
policy considerations related to choices of whether
and why to implement MPAs are (and should be)
larger than the considerations described in the
paper. Spatially based management has proven to
6A description of this model and the way in which it is
applied in West Coast groundfish management can be
found in Chapter 4 of the 2005–2006 Groundfish FMP
Management Specifications Environmental Impact State-
ment (EIS), available online at http://www.pcouncil.org/
groundfish/gfspex/gfspex05-06.html.
Impacts of MPAs on Fisheries Science J C Field et al.
� 2006 Blackwell Publishing Ltd, F I S H and F I S H E R I E S , 7, 284–302 297
be critical to meeting conflicting management goals
and objectives, such as maintaining fishing oppor-
tunities on healthy stocks while reducing incidental
catches of rebuilding species, and meeting habitat
protection requirements. Furthermore, there is a
growing appreciation of the significance of hetero-
geneity in population structure for most marine
organisms, as well as for the potential interaction
between population structure and fishing beha-
viour, that scientists and managers alike will find
increasingly necessary to confront in population
models and management measures (Berkeley et al.
2004; Wilen 2004; Pelletier and Mahevas 2005).
For example, a recent NRC Committee on the
Ecosystem Effects of Fishing found that ‘Spatial
analyses may be one of the greatest obstacles faced
by fishery managers, yet new developments in
measurement and analysis methods allow for the
explicit consideration of spatial variability in marine
systems’ (NRC 2006). This committee recommen-
ded a new focus on the collection and analysis of
spatially explicit data to monitor and assess popu-
lations at both large and fine scales. While nearly
everyone can agree on a perceived need to move in
this direction, policy decisions should be made with
awareness of the real or potential consequences,
and with the recognition that new policy objectives
and implementation measures create new suites of
challenges, each of which may have their own
cadre of supporters, methods, assumptions and
objectives. Just as predicting the impacts of MPAs
on total fisheries yield with any meaningful confid-
ence tends to be based on a range of immeasurable
caveats and assumptions, the actual impacts of
implementing MPAs on the systems established to
monitor and manage resources is to some extent
unpredictable.
Acknowledgements
This manuscript is a product of the NOAA Working
Group to integrate the science of MPAs and Fishery
Science and Management, and we thank all of
the participants of the Working Group for their
guidance and feedback. We thank Steve Berkeley,
Devora Hart, Alec MacCall, Steve Ralston, Daniel
Waldeck, Lisa Wooninck and Anna Zagorska for
their thoughtful comments and review of earlier
drafts of this manuscript, and we are grateful to the
Editor and two anonymous reviewers for their
helpful comments, suggestions and observations.
We also thank E.J. Dick for help with Fig. 3, Owen
Hamel for providing the data for Fig. 4, and Chris
Legault for comments on the yellowtail flounder
stock assessment.
References
Alcala, A.C., Russ, G.R., Maypa, A.P. and Calumpong, H.P.
(2005) A long-term, spatially replicated experimental
test of the effect of marine reserves on local fish yields.
Canadian Journal of Fisheries and Aquatic Sciences 62, 98–
108.
Attwood, C.G. (2003) Dynamics of the fishery for Galjoen
Dichistius capensis, with an assessment of monitoring
methods. African Journal of Marine Science 25, 311–330.
Bailey, K.M., Francis, R.C. and Stevens, P.R. (1982) The
life history and fishery of Pacific whiting, Merluccius
productus. CaPCOFI Reports 23, 81–98.
Baskett, M.L., Yoklavich, M. and Love, M.S. (2006)
Predation, competition, and the recovery of overexploited
fish stocks in marine reserves. Canadian Journal of Fisheries
and Aquatic Sciences 63, 1214–1229.
Beamish, R.J. and McFarlane, G.A. (1983) Summary of
results of the Canadian sablefish tagging program. In:
Proceedings of the International Sablefish Symposium (Lo-
well-Wakefield Fisheries Symposia Series, Anchorage, 29–
31 March 1983). B.R. Melteff, ed. University of Alaska
Sea Grant Report 83-8, Fairbanks, AK, pp. 147–184.
Berkeley, S.A. (2006) Pacific rockfish management: are we
circling the wagons around the wrong paradigm?
Bulletin of Marine Science 78, 655–668.
Berkeley, S.A., Hixon, M.A., Larson, R.J. and Love, M.S.
(2004) Fisheries sustainability via protection of age
structure and spatial distribution of fish populations.
Fisheries 29, 23–32.
Bobko, S.J. and Berkeley, S.A. (2004) Maturity, ovarian
cycle, fecundity, and age-specific parturition of black
rockfish, Sebastes melanops. Fishery Bulletin 102, 418–
429.
Botsford, L.W., Micheli, F. and Hastings, A. (2003)
Principles for the design of marine reserves. Ecological
Applications 13, S25–S31.
Botsford, L.W., Kaplan, D.M. and Hastings, A. (2004)
Sustainability and yield in marine reserve policy. In:
Aquatic Protected Areas as Fisheries Management Tools
(American Fisheries Society Symposium 42, Quebec, Can-
ada, 11–12 August 2003). J.B. Shipley, ed. American
Fisheries Society, Bethesda, MD, pp. 75–86.
Clark, W.G. (1991) Groundfish exploitation rates based on
life history parameters. Canadian Journal of Fisheries and
Aquatic Sciences 48, 734–750.
Clark, W.G. (1993) The effect of recruitment variability on
the choice of target level of spawning biomass per
recruit. In: Proceedings of the International Symposium on
Management Strategies for Exploited Fish Populations
(Lowell-Wakefield Fisheries Symposia Series, Anchorage,
AK, 21–24 October 1992). G. Kruse, D.M. Eggers, R.J.
Impacts of MPAs on Fisheries Science J C Field et al.
298 � 2006 Blackwell Publishing Ltd, F I S H and F I S H E R I E S , 7, 284–302

Marasco, C. Pautzke and T.J. Quinn, eds. University of
Alaska Sea Grant AK-SG-93-02, Fairbanks, AK, pp.
233–246.
Conover, D.O. and Munch, S.B. (2002) Sustaining fisheries
yields over evolutionary time scales. Science 297, 94–96.
Coombs, C.I. (1979) Reef Fishes near Depoe Bay, Oregon:
Movement and the Recreational Fishery. MS Thesis.
Oregon State University, Corvallis, OR, 39 pp.
Cox, C. and Hunt, J.H. (2005) Change in size and
abundance of Caribbean spiny lobsters Panulirus argus
in a marine reserve in the Florida Keys National Marine
Sanctuary, USA. Marine Ecology Progress Series 294,
227–239.
Culver, B. (1987) Results from tagging black rockfish
(Sebastes melanops) off the Washington and northern
Oregon coast. In: Proceedings of the International Rockfish
Symposium (Lowell-Wakefield Fisheries Symposia Series,
Anchorage, AK, 20–22 October 1986). B.R. Melteff, ed.
University of Alaska Sea Grant Report 87-2, Fairbanks,
AK, pp. 231–240.
Dark, T.A. (1983) Movement of tagged sablefish released at
abundance index sites off Southeastern Alaska, Wash-
ington, Oregon and California during 1978–81. In:
Proceedings of the International Sablefish Symposium (Lo-
well-Wakefield Fisheries Symposia Series, Anchorage, March
29–31, 1983). B.R. Melteff, ed. University of Alaska Sea
Grant Report 83-8, Fairbanks, AK, pp. 191–208.
Dorn, M.W. (1995) The effects of age composition and
oceanographic conditions on the annual migration of
Pacific whiting, Merluccius productus. CalCOFI Reports
36, 97–105.
Eisenhardt, E.P. (2003) Acoustic Telemetry of Rocky Reef
Fish Home Range to Evaluate Marine Protected Area Size.
San Juan County Marine Resources Committee Report,
Friday Harbor, WA, 18 pp.
Fanshawe, S., Vanblaricom, G.R. and Shelly, A.A. (2003)
Restored top carnivores as detriments to the perform-
ance of marine protected areas intended for fishery
sustainability: a case study with red abalones and sea
otters. Conservation Biology 17, 273–283.
Fournier, D.A., Hampton, J. and Sibert, J.R. (1998)
MULTIFAN-CL: a length-based, age-structured model
for fisheries stock assessment, with application to South
Pacific albacore, Thunnus alalunga. Canadian Journal of
Fisheries and Aquatic Sciences 55, 2105–2116.
Fu, C. and Fanning, L.P. (2004) Spatial considerations in
the management of Atlantic Cod off Nova Scotia,
Canada. North American Journal of Fisheries Management
24, 775–784.
Gaichas, S. and Ianelli, J. (2005) Gulf of Alaska thorny-
heads. In: North Pacific Groundfish Stock Assessment and
Fishery Evaluation Reports for 2006. North Pacific
Fishery Management Council, Anchorage, AK, 36 pp.
Gaines, S.D., Gaylord, B. and Largier, J.L. (2003) Avoiding
current oversights in marine reserve design. Ecological
Applications 13, S32–S46.
Gerber, L.R., Botsford, L.W., Hastings, A. et al. (2003)
Population models for marine reserve design: a retro-
spective and prospective synthesis. Ecological Applications
12, S47–S64.
Gerber, L.R., Beger, M., McCarthy, M.A. and Possingham,
H.P. (2005) A theory for optimal monitoring of marine
reserves. Ecology Letters 8, 829–837.
Goni, R., Quetglas, A. and Renones, O. (2006) Spillover of
spiny lobsters Palinurus elephas from a marine reserve to
an adjoining fishery. Marine Ecology Progress Series 308,
207–219.
Goodman, D., Mangel, M., Parkes, G. et al. (2002) Scientific
Review of the Harvest Strategy Currently Used in the BSAI
and GOA Groundfish Fishery Management Plans. North
Pacific Fishery Management Council, Anchorage, AK,
145 pp.
Guenette, S., Lauck, T. and Clark, C. (1998) Marine
reserves: from Beverton and Holt to the present. Reviews
in Fish Biology and Fisheries 8, 251–272.
Gunderson, D.R. (1997) Spatial patterns in the dynamics
of slope rockfish stocks and their implications for
management. Fisheries Bulletin 95, 219–230.
Halpern, B.S. (2003) The impact of marine reserves: do
reserves work and does reserve size matter? Ecological
Applications 12, S117–S137.
Hamel, O.S. (2005) Status and Future Prospects for the
Shortspine Thornyhead Resource in Waters Off Washington,
Oregon, and California as Assessed in 2005. Pacific Fishery
Management Council: Stock Assessment and Fishery
Evaluation Report, Portland, OR, 74 pp.
Hampton, J. and Fournier, D.A. (2001) A spatially
disaggregated, length-based, age-structured population
model of yellowfin tuna (Thunnus albacares) in the
Western and central Pacific Ocean. Marine and Fresh-
water Research 52, 937–963.
Hart, D.R. (2006) When do marine reserves increase
fishery yield? Canadian Journal of Fisheries and Aquatic
Science 63, 1445–1449.
Hartmann, A.R. (1987) Movement of scorpionfishes
(Scorpaenida: Sebastes and Scorpaena) in the Southern
California Bight. California Fish and Game 73, 68–79.
Helser, T.E., Stewart, I.J., Fleisher, G. and Martell, S.
(2006) Stock assessment of Pacific hake (whiting) for
2006. In: Status of the Pacific Coast Groundfish Fishery
through 2005, Stock Assessment and Fishery Evaluation:
Stock Assessments and Rebuilding Analyses. Pacific Fishery
Management Council, Portland, Oregon, 145 pp.
Hilborn, R. and Walters, C.J. (1992) Quantitative Fisheries
Stock Assessment: Choice, Dynamics and Uncertainty.
Chapman & Hall, New York.
Hilborn, R., Stokes, K., Maguire, J.J. et al. (2004) When
can marine reserves improve fisheries management?
Ocean and Coastal Management 47, 197–205.
Hilborn, R., Micheli, F. and DeLeo, G.A. (2006) Integrating
marine protected areas with catch regulation. Canadian
Journal of Fisheries and Aquatic Sciences 63, 642–649.
Impacts of MPAs on Fisheries Science J C Field et al.
� 2006 Blackwell Publishing Ltd, F I S H and F I S H E R I E S , 7, 284–302 299

Hobday, D., Punt, A.E. and Smith, D.C. (2005) Modelling
the effects of marine protected areas (MPAs) on the
southern rock lobster (Jasus edwardsii) fishery of Victoria,
Australia. New Zealand Journal of Marine and Freshwater
Research 39, 675–686.
Holland, D.S. (2002) Integrating marine protected areas
into models for fishery assessment and management.
Natural Resource Modeling 15, 369–386.
Holland, D.S. (2003) Integrating spatial management
measures into traditional management systems: the
case of the Georges Bank multispecies groundfish
fishery. ICES Journal of Marine Science 60, 915–929.
Holland, D.S. (2005) Economic analysis of protection of
essential fish habitat in alaskan fisheries: an analysis of
research needs. US Department of Commerce, NOAA
Technical Memorandum, NMFS-AFSC-154, 39 pp.
Hollowed, A.B., Bax, N., Beamish, R. et al. (2000) Are
multispecies models an improvement on single-species
models for measuring fishing impacts on marine eco-
systems? ICES Journal of Marine Science 57, 707–719.
Jacobson, L.D. and Vetter, R.D. (1996) Bathymetric
demography and niche separation of thornyhead rock-
fish: Sebastolobus alascanus and Sebastolobus altivelis.
Canadian Journal of Fisheries and Aquatic Sciences 53,
600–609.
Jagielo, T.H. (1990) Movement of tagged lingcod (Ophiodon
elongates) at Neah Bay, Washington. Fishery Bulletin 88,
815–820.
Jagielo, T.H. (1999) Movement, mortality, and size selec-
tivity of sport- and trawl-caught lingcod off Washington.
Transactions of the American Fisheries Society 128, 31–
48.
Jagielo, T.H., Hoffman, A., Tagart, J. and Zimmermann, M.
(2003) Demersal groundfish densities in trawlable and
untrawlable habitats off Washington: implications for
the estimation of habitat bias in trawl surveys. Fishery
Bulletin 101, 545–565.
Johnson, D.R., Funicelli, N.A. and Bohnsack, J.A. (1999)
Effectiveness of an existing estuarine no-take fish sanc-
tuary within the Kennedy Space Center, Florida. North
American Journal of Fisheries Management 19, 436–453.
Jow, T. (1969) Results of English sole tagging off Califor-
nia. Pacific Marine Fisheries Commission (PMFC) Bulletin
7, 16–33.
Ketchen, K.S. and Forrester, C.R. (1966) Population
dynamics of the petrale sole, Eopsetta jordani, in waters
off Western Canada. Bulletin of the Fisheries Research
Board of Canada 153, 195.
Kimura, D.K., Shimada, A.M. and Shaw, F.R. (1998) Stock
structure and movement of tagged sablefish, Anoplopoma
fimbria, in offshore northeast Pacific waters and the
effects of El Nino-Southern Oscillation on migration and
growth. Fishery Bulletin 96, 462–481.
Kramer, D.L. and Chapman, M.R. (1999) Implications of
fish home range size and relocation for marine reserve
function. Environmental Biology of Fishes 55, 65–79.
Kronlund, A.R. and Yamanaka, K.L. (2001) Yelloweye
rockfish (Sebastes ruberrimus) life history parameters
assessed from areas with contrasting fishing histories.
In: Spatial Processes and Management of Marine Popula-
tions (Lowell-Wakefield Fisheries Symposia Series, Anchor-
age, October, 1999). G.H. Kruse, N. Bez, A. Booth, M.W.
Dorn, S. Hills, R.N. Lipcius, D. Pelletier, C. Roy, S.J.
Smith and D. Withrell, eds. University of Alaska Sea
Grant Report AK-SG-01-02, Fairbanks, AK, pp. 257–
280.
Lea, R.N., McAllister, R.D. and VanTresca, D.A. (1999)
Biological Aspects of Nearshore Rockfishes of the Genus
Sebastes from Central California. Department of Fish and
Game Fish Bulletin, 177 pp.
Legault, C.M. and Stone, H.H. (2004) Stock Assessment of
Georges Bank (5Zhjmn) Yellowtail Flounder for 2005.
Transboundary Resource Assessment Committee Reference
Document 2004/03. Department of Fisheries and
Oceans, Canada, 102 pp.
Levin, P.S., Holmes, E.E., Piner, K.R. and Harvey, C.J.
(2006) Shifts in a Pacific ocean fish assemblage: the
potential influence of exploitation. Conservation Biology
20, 1181–1190.
Love, M.S. (1981) Evidence of movements of some
deepwater rockfishes (Scorpaenidae: Genus Sebastes) off
Southern California. California Fish and Game 67, 246–
249.
Love, M.S., Axell, B., Morris, P., Collins, R. and Brooks, A.
(1987) Life history and fishery of the California Scorpi-
onfish, Scorpaena guttata, within the Southern California
Bight. Fishery Bulletin 85, 99–116.
Love, M.S., Yolkavich, M. and Thorsteinson, L. (2002) The
Rockfishes of the Northeast Pacific. University of California
Press, Berkeley, CA.
MacCall, A.D. (2002) Fishery-management and stock-
rebuilding prospects under conditions of low-frequency
environmental variability and species interactions.
Bulletin of Marine Science 70, 613–628.
MacCall, A.D. (2003) Status of bocaccio off California in
2003. In: Appendix to the Status of the Pacific Coast
Groundfish Fishery through 2003: Stock Assessment and
Fishery Evaluation. Pacific Fishery Management Council,
Portland, OR, 63 pp.
Mangel, M. (1998) No-take areas for sustainability of
harvested species and a conservation invariant for
marine reserves. Ecology Letters 1, 87–90.
Mangel, M. and Smith, P.E. (1990) Presence–absence
sampling for fisheries management. Canadian Journal of
Fisheries and Aquatic Sciences 47, 1875–1887.
Mangel, M., Hofman, R.J., Norse, E.A. and Twiss, J.R.
(1993) Sustainability and ecological research. Ecological
Applications 3, 573–575.
Martell, S.J.D., Essington, T.E., Lessard, B., Kitchell, J.F.,
Walters, C.J. and Boggs, C.H. (2005) Interactions of
productivity, predation risk, and fishing effort in the
efficacy of marine protected areas for the central Pacific.
Impacts of MPAs on Fisheries Science J C Field et al.
300 � 2006 Blackwell Publishing Ltd, F I S H and F I S H E R I E S , 7, 284–302
Canadian Journal of Fisheries and Aquatic Sciences 62,
1320–1336.
Mathews, S.B. and Barker, M.W. (1983) Movements of
rockfish (Sebastes) tagged in northern Puget Sound,
Washington. Fishery Bulletin 82, 916–922.
Mathews, S.B. and LaRiviere, M. (1987) Movement of
tagged lingcod, Ophiodon elongates, in the Pacific North-
west. Fishery Bulletin 85, 153–159.
Matthews, K.R. (1990) An experimental study of the
habitat preferences and movement patterns of copper,
quillback, and brown rockfishes (Sebastes spp.). Environ-
mental Biology of Fishes 29, 161–178.
Maunder, M.N. and Punt, A.E. (2004) Standardizing catch
and effort data: a review of recent approaches. Fisheries
Research 70, 141–159.
McClanahan, T.R. and Mangi, S. (2000) Spillover of
exploitable fishes from a marine park and its effect on
the adjacent fishery. Ecological Applications 10, 1792–
1805.
Methot, R.D. (2000) Technical Description of the Stock
Synthesis Assessment Program. US Department of Com-
merce, NOAA Technical Memorandum NMFS-NWFSC-
43, 56 pp.
Methot, R.D. (2005) User Manual for the Assessment
Program Stock Synthesis 2 (SS2). Available online:
http://nft.nefsc.noaa.gov/
Methot, R.D. and Stewart, I.J. (2005) Status of the U.S.
canary rockfish resource in 2005. In: Status of the Pacific
Coast Groundfish Fishery through 2005, Stock Assessment
and Fishery Evaluation: Stock Assessments and Rebuilding
Analyses. Pacific Fishery Management Council, Portland,
OR, 272 pp.
Methot, R.D., Crone, P., Conser, R.J., Brodziak, J., Builder,
T. and Kamikawa, D. (1999) Status of the sablefish
resource off the U.S. Pacific Coast in 1998. In: Appendix
to the Status of the Pacific Coast Groundfish Fishery through
1998: Stock Assessment and Fishery Evaluation. Pacific
Fishery Management Council, Portland, OR, pp. 102.
Moser, H.G., Charter, R.L., Watson, W. et al. (2000)
Abundance and distribution of rockfish (Sebastes) larvae
in the southern California Bight in relation to environ-
mental conditions and fishery exploitation. CalCOFI
Reports 41, 132–147.
Murawski, S.A., Brown, R., Lai, H.L., Rago, P.J. and
Hendrickson, L. (2000) Large-scale closed areas as a
fishery-management tool in temperate marine systems:
the Georges Bank experience. Bulletin of Marine Science
66, 775–798.
Murawski, S.A., Wigley, S.E., Fogarty, M.J., Rago, P.J. and
Mountain, D.G. (2005) Effort distribution and catch
patterns adjacent to temperate MPAs. ICES Journal of
Marine Science 62, 1150–1167.
Murray, S.N., Ambrose, R.F. and Bohnsack, J.A. et al.
(1999) No-take reserve networks: sustaining fishery
populations and marine ecosystems. Fisheries 24, 11–
25.
National Research Council (NRC). (1998) Improving Fish
Stock Assessments. National Academy Press, Washing-
ton, DC.
National Research Council (NRC). (2001) Marine Protected
Areas: Tools for Sustaining Ocean Ecosystems. National
Academy Press, Washington, DC.
National Research Council (NRC). (2006) Dynamic Changes
in Marine Ecosystems: Fishing, Food Webs, and Future
Options. National Academy Press, Washington, DC.
O’Connell, V.M. and Carlile, D.W. (1993) Habitat-specific
density of adult yelloweye rockfish Sebastes ruberrimus in
the eastern Gulf of Alaska. Fishery Bulletin 91, 304–309.
Pauly, D., Christensen, V., Guenette, S. et al. (2002)
Towards sustainability in world fisheries. Nature 418,
689–695.
Pearcy, W.G. (1992) Movements of acoustically-tagged
yellowtail rockfish Sebastes flavidus on Heceta Bank,
Oregon. Fishery Bulletin 90, 726–735.
Pedersen, M.G. (1975) Movement and growth of petrale
sole (Eopsetta jordani) tagged off Washington and
southwest Vancouver Island. Journal of the Fisheries
Research Board of Canada 32, 2169–2177.
Pelletier, D. and Mahevas, S. (2005) Spatially explicit
fisheries simulation models for policy evaluation. Fish
and Fisheries 6, 307–349.
Pikitch, E.K., Santora, C. and Babcock, E.A. et al. (2004)
Ecosystem-based fishery management. Science 305,
346–347.
Punt, A.E. and Methot, R.D. (2004) Effects of marine
protected areas on the assessment of marine fisheries. In:
Aquatic Protected Areas as Fisheries Management Tools
(American Fisheries Society Symposium 42, Quebec, Can-
ada, 11–12 August 2003). J.B. Shipley, ed. American
Fisheries Society, Bethesda, MD, pp. 133–154.
Punt, A.E., Pribac, F., Walker, T.I., Taylor, B.L. and Prince,
J.D. (2000) Stock assessment of school shark Galeorhinus
galeus based on a spatially-explicit population dynamics
model. Marine and Freshwater Research 51, 205–220.
Punt, A.E., Smith, A.D., Davidson, A.J., Mapstone, B.M.
and Davies, C.R. (2001) Evaluating the scientific benefits
of spatially explicit experimental manipulations of com-
mon coral trout (Plectropomus leopardus) on the Great
Barrier Reef, Australia. In: Spatial Processes and Manage-
ment of Marine Populations (Lowell-Wakefield Fisheries
Symposia Series, Anchorage, October, 1999), G.H. Kruse,
N. Bez, A. Booth, M.W. Dorn, S. Hills, R.N. Lipcius, D.
Pelletier, C. Roy, S.J. Smith and D. Withrell, eds.
University of Alaska Sea Grant Report AK-SG-01-02,
Fairbanks, AK, pp. 67–103.
Ralston, S. (2002) West coast groundfish harvest policy.
North American Journal of Fisheries Management 22, 249–
250.
Ralston, S., Bence, J.R., Eldridge, M.B. and Lenarz, W.H.
(2003) An approach to estimating rockfish biomass
based on larval production, with application to Sebastes
jordani. Fishery Bulletin 101, 129–146.
Impacts of MPAs on Fisheries Science J C Field et al.
� 2006 Blackwell Publishing Ltd, F I S H and F I S H E R I E S , 7, 284–302 301
Richards, L.J. (1986) Depth and habitat distributions of
three species of rockfish (Sebastes) in British Columbia:
observation from the submersible PICES IV. Environmen-
tal Biology of Fishes 17, 13–21.
Roberts, C.M., Bohnsack, J.A., Gell, F., Hawkins, J.P. and
Goodridge, R. (2001) Effects of marine reserves on
adjacent fisheries. Science 294, 1920–1923.
Rogers, J. (2005) Status of the darkblotched rockfish
(Sebastes crameri) resource in 2005. In: Status of the
Pacific Coast Groundfish Fishery through 2005, Stock
Assessment and Fishery Evaluation: Stock Assessments and
Rebuilding Analyses. Pacific Fishery Management Coun-
cil, Portland, OR, 121 pp.
Russ, G.R., Alcala, A.C. and Maypa, A.P. (2003) Spillover
from marine reserves: the case of Naso vlamingii at Apo
Island, the Philipinnes. Marine Ecology Progress Series
264, 15–20.
Salomon, A.K., Waller, N.P., McIlhagga, C., Yung, R.L.
and Walters, C. (2002) Modeling the trophic effects of
marine protected area zoning policies: a case study.
Aquatic Ecology 36, 85–95.
Schaefer, M.B. (1954) Some aspects of the dynamics of
populations important to the management of the com-
mercial marine fisheries. Bulletin of the Inter-American
Tropical Tuna Commission 1, 27–56.
Schnute, J.T. and Richards, L.J. (2001) Use and abuse of
fishery models. Canadian Journal of Fisheries and Aquatic
Sciences 58, 10–17.
Sladek-Nowlis, J. and Roberts, C.M. (1999) Fisheries
benefits and optimal design of marine reserves. Fishery
Bulletin 97, 604–616.
Stanley, R.D., Leaman, B.M., Haldorson, L. and O’Connell,
V.M. (1994) Movement of tagged adult yellowtail
rockfish, Sebastes flavidus, off the west coast of North
America. Fisheries Bulletin 92, 655–663.
Stanley, R.D., Kieser, R., Cooke, K., Surry, A.M. and Mose,
B. (2000) Estimation of a widow rockfish (Sebastes
entomelas) shoal off British Columbia, Canada as a joint
exercise between stock assessment staff and the fishing
industry. ICES Journal of Marine Science 57, 1035–1049.
Starr, R.M., Heine, J.N. and Cailliet, G.M. (2002) Move-
ments of bocaccio (Sebastes paucispinis) and greenspotted
(S. chlorostictus) rockfishes in a Monterey submarine
canyon: implications for the design of marine reserves.
Fishery Bulletin 100, 324–337.
Starr, R.M., O’Connell, V. and Ralston, S. (2004) Move-
ments of lingcod (Ophiodon elongates) in southeast
Alaska: potential for increased conservation and yield
from marine reserves. Canadian Journal of Fisheries and
Aquatic Sciences 61, 1083–1094.
Stein, D.L., Tissot, B.N., Hixon, M.A. and Barss, W. (1992)
Fish-habitat associations on a deep reef at the edge of the
Oregon continental shelf. Fishery Bulletin 90, 540–551.
Stephens, A.E. and MacCall, A. (2004) A multispecies
approach to subsetting logbook data for purposes of
estimating CPUE. Fisheries Research 70, 299–310.
Stewart, I.J. (2005) Status of the U.S. English sole
resource in 2005. In: Status of the Pacific Coast
Groundfish Fishery through 2005, Stock Assessment and
Fishery Evaluation: Stock Assessments and Rebuilding
Analyses. Pacific Fishery Management Council, Port-
land, OR, 221 pp.
Wakefield, W.W. (1990) Patterns in the Distribution of
Demersal Fishes on the Upper Continental Slope Off Central
California with Studies on the Role of Ontogenetic Vertical
Migration in Particle Flux. PhD Dissertation Scripps
Institution of Oceanography, University of California
San Diego, San Diego, CA, 229 pp.
Walters, C. (2003) Folly and fantasy in the analysis of
spatial catch rate data. Canadian Journal of Fisheries and
Aquatic Sciences 60, 1433–1436.
Walters, C., Pauly, D. and Christensen, V. (1999) Eco-
space: prediction of mesoscale spatial patterns in trophic
relationships of exploited ecosystems, with emphasis on
the impacts of marine protected areas. Ecosystems 2,
539–554.
Walters, C.W., Christensen, V., Martell, S.J. and Kitchell,
J.F. (2005) Possible ecosystem impacts of applying MSY
policies from single species assessments. ICES Journal of
Marine Science 62, 558–568.
Ware, D.M. and McFarlane, G.A. (1995) Climate-induced
changes in Pacific hake (Merluccius productus) abun-
dance and pelagic community interactions in the
Vancouver Island Upwelling System. In: Climate change
and northern fish populations (ed. R.J. Beamish). Canadian
Special Publications in Fisheries and Aquatic Sciences
121, 509–521.
Warner, R.R., Swearer, S.E. and Caselle, J.E. (2000) Larval
accumulation and retention: implications for the design
of marine reserves and essential fish habitat. Bulletin of
Marine Science 66, 821–830.
Westrheim, S.J., Barss, W.H., Pikitch, E.K. and Quirollo,
L.F. (1992) Stock delineation of Dover sole in the
California-British Columbia region, based on tagging
studies conducted during 1948–1979. North American
Journal of Fisheries Management 12, 172–181.
Wilen, J.E. (2004) Spatial management of fisheries. Marine
Resource Economics 19, 7–19.
Willis, T.J., Millar, R.B. and Babcock, R.C. (2003) Protec-
tion of exploited fish in temperate regions: high density
and biomass of snapper Pagrus auratus (Sparidae) in
northern New Zealand marine reserves. Journal of
Applied Ecology 40, 214–227.
Yoklavich, M.M., Greene, H.G., Cailliet, G.M., Sullivan,
D.E., Lea, R.N. and Love, M.S. (2000) Habitat associa-
tions of deep-water rockfishes in a submarine canyon:
an example of a natural refuge. Fisheries Bulletin 98,
625–641.
Zimmermann, M. (2003) Calculation of untrawlable areas
within the boundaries of a bottom trawl survey.
Canadian Journal of Fisheries and Aquatic Sciences 60,
657–669.
Impacts of MPAs on Fisheries Science J C Field et al.
302 � 2006 Blackwell Publishing Ltd, F I S H and F I S H E R I E S , 7, 284–302