DOES GENDER MATTER? by Denyse Lafrance Horning A the
371
AN INVESTIGATION OF SPONSORSHIP EFFECTS AT CHARITY-LINKED SPORTING EVENTS: DOES GENDER MATTER? by Denyse Lafrance Horning A thesis submitted in partial fulfillment of the requirements for the degree of Doctor of Philosophy (PhD) in Human Studies The Faculty of Graduate Studies Laurentian University Sudbury, Ontario, Canada © Denyse Lafrance Horning, 2014
-
Upload
khangminh22 -
Category
Documents
-
view
1 -
download
0
Transcript of DOES GENDER MATTER? by Denyse Lafrance Horning A the

AN INVESTIGATION OF SPONSORSHIP EFFECTS AT CHARITY-LINKED
SPORTING EVENTS: DOES GENDER MATTER?
by
Denyse Lafrance Horning
A thesis submitted in partial fulfillment
of the requirements for the degree of
Doctor of Philosophy (PhD) in Human Studies
The Faculty of Graduate Studies
Laurentian University
Sudbury, Ontario, Canada
© Denyse Lafrance Horning, 2014

ii
THESIS DEFENCE COMMITTEE/COMITÉ DE SOUTENANCE DE THÈSE
Laurentian Université/Université Laurentienne
Faculty of Graduate Studies/Faculté des études supérieures
Title of Thesis
Titre de la thèse AN INVESTIGATION OF SPONSORSHIP EFFECTS AT CHARITY-
LINKED SPORTING EVENTS: DOES GENDER MATTER?
Name of Candidate
Nom du candidat
Lafrance Horning, Denyse
Degree
Diplôme
Doctor of Philosophy
Department/Program
Département/Programme
Human Studies
Date of Defence
Date de la soutenance
November 6, 2014
APPROVED/APPROUVÉ
Thesis Examiners/Examinateurs de thèse:
Dr. Norm O'Reilly
(Supervisor/Directeur de thèse)
Dr. Ann Pegoraro
(Committee member/Membre du comité)
Dr. Benoit Seguin
(Committee member/Membre du comité)
Approved for the Faculty of Graduate Studies
Approuvé pour la Faculté des études supérieures
Dr. David Lesbarrères
M. David Lesbarrères
Dr. Marijke Taks Acting Dean, Faculty of Graduate Studies
(External Examiner/Examinateur externe) Doyen intérimaire, Faculté des études supérieures
Dr. Ron Mulholland
(Internal Examiner/Examinateur interne)
ACCESSIBILITY CLAUSE AND PERMISSION TO USE
I, Denyse Lafrance-Horning, hereby grant to Laurentian University and/or its agents the non-exclusive
license to archive and make accessible my thesis, dissertation, or project report in whole or in part in all forms of
media, now or for the duration of my copyright ownership. I retain all other ownership rights to the
copyright of the thesis, dissertation or project report. I also reserve the right to use in future works (such as
articles or books) all or part of this thesis, dissertation, or project report. I further agree that permission for
copying of this thesis in any manner, in whole or in part, for scholarly purposes may be granted by the professor
or professors who supervised my thesis work or, in their absence, by the Head of the Department in which my
thesis work was done. It is understood that any copying or publication or use of this thesis or parts thereof for
financial gain shall not be allowed without my written permission. It is also understood that this copy is being
made available in this form by the authority of the copyright owner solely for the purpose of private study and
research and may not be copied or reproduced except as permitted by the copyright laws without written
authority from the copyright owner.

iii
Abstract
The purpose of my dissertation was two-fold. First, this research contributed to an understanding
of the effects of the emerging area of cause-related sport sponsorship (CRSS) on consumer
perceptions and responsiveness in terms of sponsor interest, favourability, and intended use.
Second, this investigation examined the potential influence of gender at all stages of the
sponsorship process through a comparison of grouped samples that included respondents of
spectators of men‘s versus women‘s hockey, and cancer-cause versus social-cause affiliated
events. A proposed framework of consumer processing of CRSS extended earlier findings by
Speed and Thompson (2000) and Alay (2008) in highlighting multiple paths of possible
influence for both women and men to process sponsorship factors and to respond at the various
levels of effect, leading to an investigation of the relationships between five possible predictors
of sponsorship response. These included gender, personal involvement (with sport and with
cause), gender-support (for women and for men), sponsor-event fit, and perceived sincerity of
the sponsor.
Field-level data was collected among spectators of five different charity-linked (women‘s and
men‘s) hockey events across three different Ontario cities. A total of 314 women and 319 men
participated in this study. Findings confirmed the direct and indirect influence of personal
involvement, sponsor-event fit, and perceived sincerity of the sponsor on CRSS response. The
potential impact of sponsorship at all levels of the hierarchy of effects was also recognized. This
study conceptualizes the Diamond of CRSS Goodwill to highlight the expanded platform of
consumer engagement offered through these evolved forms of sponsorship. This proposed
concept illustrates the interacting effects of goodwill, involvement, and reciprocal return in
sponsorships that unite consumers and sponsors with elements of both sport and cause. With
regards to gender differences, women expressed significantly greater involvement with social
causes than did men. Gender support was also established as a significant and mediating
influence on all levels of female consumer response. The answer to whether gender matters in
CRSS was discovered to be highly contextual and reflective of complex relationships that are not
only based on differences but also on equally important similarities between genders.
Keywords Sponsorship, cause-linked sport, gender differences in consumer behaviour

iv
Acknowledgments
As most PhD students acknowledge, the journey to a doctoral degree is one filled with many
significant imprints. I joined forces with Dr. Norm O‘Reilly in 2008 and Norm has stuck with
me as my advisor through this lengthy process. Along with my other committee members, Dr.
Ann Pegoraro and Dr. Benoit Séguin, these accomplished scholars have offered valuable insight
and direction through the development of my dissertation.
I also acknowledge Nipissing University for signing me on as an industry practitioner and
supporting me through my studies. I thank Dr. David Hemsworth who took every opportunity to
ensure that I was progressing and for showing great patience in answering my many stats
questions. I am also grateful to Nipissing University and Laurentian University Athletics, the
Ottawa Senators, and the Sudbury Wolves organizations for supporting my data collection. I
applaud the tremendous efforts of the Nipissing University Sport Marketing and Laurentian
University Event Management students in raising almost $8,000 for event-affiliated charities.
Every PhD student should be so fortunate as to have a version of Dr. Callie Mady in their corner.
Little did I know when the Mady family moved into our neighborhood that Callie would become
not only a cherished friend and colleague but also an incredible mentor, proof-reader, listener,
and enthusiastic cheerleader. I hope that one day I can serve as a similar mentor for a developing
scholar.
I have saved the best for last – my family is truly the best! My parents, siblings, husband, and
children have all contributed in so many meaningful ways. They have all legitimately earned a
piece of this degree. Thank you all for your interest, encouragement, and unconditional love.
Steve, thank you for always believing in me, for your relentless support, for tending to many
neglected household tasks, and for always reminding me of our ―bigger picture‖. To my girls –
Ellie & Sydney, your patience, genuine inquisitiveness and cheerfulness always fuels me. Your
―Go Mommy Go‖ chant rings on.
Sincere appreciation to you all,
Denyse

v
Table of Contents
Abstract .......................................................................................................................................... iii
Acknowledgments.......................................................................................................................... iv
Table of Contents ............................................................................................................................ v
List of Tables ............................................................................................................................... viii
List of Figures .............................................................................................................................. xiii
List of Appendices ....................................................................................................................... xiv
Chapter 1 ......................................................................................................................................... 1
1.0 Introduction .......................................................................................................................... 1
Chapter 2 ......................................................................................................................................... 9
2.0 Review of Literature ............................................................................................................ 9
2.1 Sponsorship Marketing .................................................................................................... 9
2.1.1 Nature of Sponsorship .................................................................................................... 10
2.1.1.1 Defining Sponsorship .......................................................................................... 11
2.1.1.2 Sponsorship Spending ......................................................................................... 13
2.1.1.3 Sponsorship and the Promotional Mix ................................................................ 18
2.1.2 Managerial Aspects of Sponsorship ............................................................................... 20
2.1.2.1 Strategic Evolution of Sponsorship ..................................................................... 26
2.1.2.2 Consumer and Business Oriented Objectives ..................................................... 27
2.1.2.3 Formalized Management Processes .................................................................... 29
2.1.2.4 Sponsorship Evaluation ....................................................................................... 31
2.1.3 Sponsorship Effects ........................................................................................................ 33
2.1.3.1 Cognitive Effects of Sponsorship ........................................................................ 36
2.1.3.2 Affective and Behavioural Effects of Sponsorship ............................................. 42
2.1.4 Strategic Use of Sponsorship: Strategies and Counter Strategies .................................. 49
2.1.4.1 Sponsorship Activation/ Leverage ...................................................................... 49
2.1.4.2 Ambush Marketing .............................................................................................. 56
2.2 Cause and Cause-Related Sport Sponsorship................................................................. 60
2.2.1 Defining Corporate Goodness ........................................................................................ 61

vi
2.2.2 Sport as a Gateway to Goodness .................................................................................... 68
2.2.3 Characteristics of Cause Sponsorship ............................................................................ 74
2.2.3.1 Objectives and Benefits of Cause Sponsorship ................................................... 75
2.2.3.2 Fit in Cause Sponsorship ..................................................................................... 77
2.2.3.3 Involvement in Cause Sponsorship ..................................................................... 78
2.2.3.4 Cause Sponsorship Activation ............................................................................ 82
2.2.4 Cause Sponsorship Effects ............................................................................................. 83
2.3 Gender Considerations in Sponsorship Marketing......................................................... 87
2.3.1 Gender Evolution and Gender Research ........................................................................ 88
2.3.2 Marketing to Women – Economic Opportunity Number One ....................................... 92
2.3.3 Women and Men: Equals but Not the Same .................................................................. 96
2.3.4 Priorities and Interests of Female Consumers .............................................................. 100
2.3.5 Gender Differences in Sport Consumption .................................................................. 106
2.3.6 Gender Differences in Sponsorship Effects ................................................................. 108
Chapter 3 ..................................................................................................................................... 121
3.0 Conclusions from Literature Review and Conceptual Framework .................................. 121
3.1 Conclusions from Literature Review ........................................................................... 121
3.2 Development of Conceptual Framework ..................................................................... 130
Chapter 4 ..................................................................................................................................... 133
4.0 Research Hypotheses and Methodology .......................................................................... 133
4.1 Research Purpose ......................................................................................................... 133
4.2 Hypotheses Development ............................................................................................. 133
4.3 Research Design and Methodology ............................................................................. 139
Chapter 5 ..................................................................................................................................... 149
5.0 Results .............................................................................................................................. 149
5.1 Initial Analysis ............................................................................................................. 149
5.2 Demographic Characteristics and Sample Treatment Rationale .................................. 151
5.3 Hypotheses Testing ...................................................................................................... 164
5.3.1 Hypothesis 1 ................................................................................................................. 164
5.3.2 Hypothesis 2 ................................................................................................................. 170
5.3.3 Hypothesis 3 ................................................................................................................. 173

vii
5.3.4 Hypothesis 4 ................................................................................................................. 176
5.3.5 Hypotheses 5a to 9a...................................................................................................... 179
5.3.6 Hypotheses 5b to 9b ..................................................................................................... 187
5.3.7 Hypothesis 10 ............................................................................................................... 201
5.3.8 Hypothesis 11 ............................................................................................................... 203
5.4 Model Testing .............................................................................................................. 208
5.5 Summary of Results ..................................................................................................... 211
Chapter 6 ..................................................................................................................................... 217
6.1 Discussion .................................................................................................................... 217
6.1.1 Personal Involvement in CRSS (H1, H2, H5, H6, H7) ................................................ 226
6.1.2 Gender Support in CRSS (H3, H4, H10) ..................................................................... 248
6.1.3 Sponsor-Event Fit in CRSS (H8) ................................................................................. 253
6.1.4 Sincerity of the Sponsor in CRSS (H9) ........................................................................ 258
6.1.5 CRSS Response (H11) ................................................................................................. 262
6.1.6 Proposed Model of Consumer Processing of CRSS .................................................... 266
6.1.7 Does Gender Matter in CRSS?..................................................................................... 275
6.2 Contributions ................................................................................................................ 281
6.2.1 What‘s New? ................................................................................................................ 281
6.2.2 So What? ...................................................................................................................... 282
6.2.3 Why So? ....................................................................................................................... 283
6.2.4 Well Done? ................................................................................................................... 283
6.2.5 Done Well? ................................................................................................................... 284
6.2.6 Why Now?.................................................................................................................... 285
6.2.7 Who Cares? .................................................................................................................. 285
6.3 Implications .................................................................................................................. 286
6.4 Limitations of this Study .............................................................................................. 289
6.5 Direction for Future Research ...................................................................................... 290
Appendices .................................................................................................................................. 324

viii
List of Tables
Table 1: Sponsorship Spending Trends (IEG, 2014) .................................................................... 13
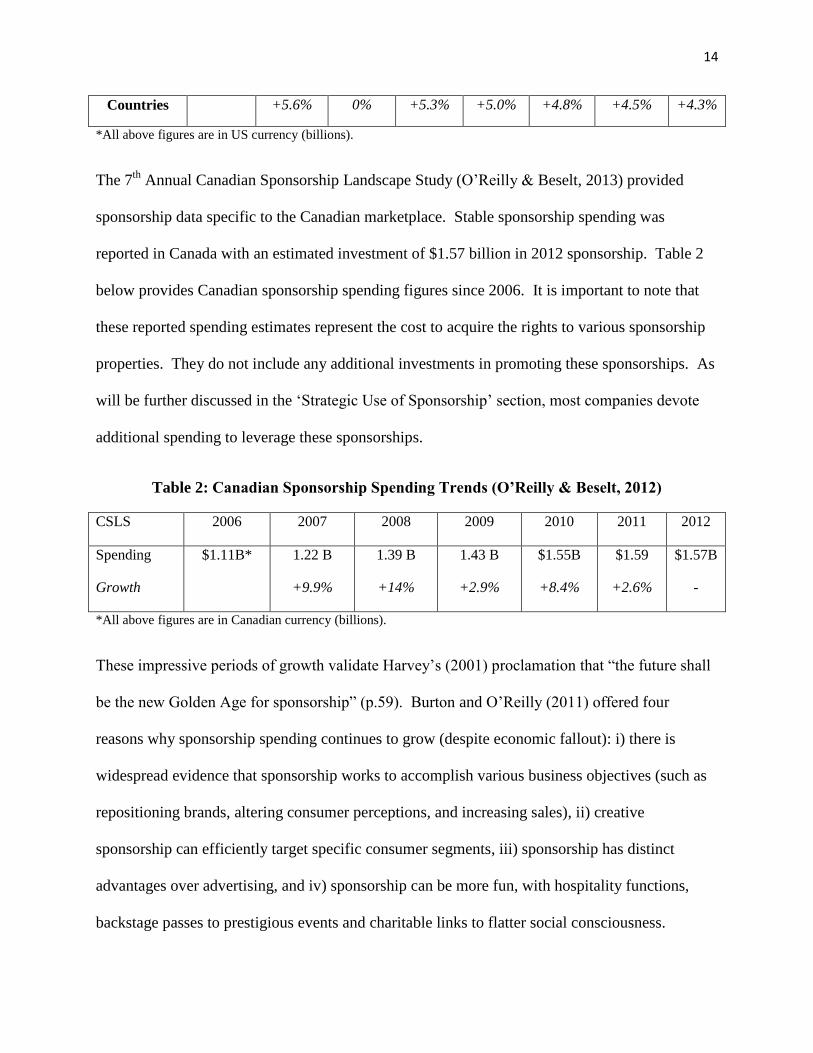
Table 2: Canadian Sponsorship Spending Trends (O‘Reilly & Beselt, 2012) ............................. 14
Table 3: Summary of Managerial Aspects of Sponsorship Literature .......................................... 21
Table 4: Summary of Sponsorship Objectives.............................................................................. 28
Table 5: Summary of Cognitive, Affective and Behavioural Effects Studies .............................. 44
Table 6: Summary of Sponsorship Activation Methods ............................................................... 52
Table 7: Definitions of Various Forms of Corporate Social Responsibility ................................. 62
Table 8: Examples of Canadian Spectator-Based Cause-Linked Sport Events ............................ 70
Table 9: Cause-Related Participant-Based Sport Events .............................................................. 72
Table 10: Summary of Cognitive, Affective and Behavioural Effects Studies in Cause Affiliated
Marketing ...................................................................................................................................... 84
Table 11: Summary of Gender Difference in Sponsorship Effects Studies................................ 114
Table 12: Summary of Guiding Literary Findings ..................................................................... 128
Table 13: Number of Participants at the Five Investigated CRSS Events .................................. 140
Table 14: Questionnaire Development ....................................................................................... 144
Table 15: Data Collection Events ............................................................................................... 147
Table 16: Comparison of Gender across Sampled Events .......................................................... 152
Table 17: Comparison of Age across Sampled Events ............................................................... 153
Table 18: Comparison of Household Income across Sampled Events ....................................... 153

ix
Table 19: Comparison of Number of Children across Sampled Events ..................................... 154
Table 20: Correlation of Demographic and Independent Variables ........................................... 156
Table 21: Demographic Characteristics (Women‘s Hockey Sample) ........................................ 157
Table 22: Demographic Characteristics (Men‘s Hockey Sample) ............................................. 158
Table 23: Demographic Characteristics (Cancer-Causes Sample) ............................................. 160
Table 24: Demographic Characteristics (Social-Causes Sample) .............................................. 162
Table 25: Gender Comparisons of Personal Involvement with Cause ....................................... 167
Table 26: T-Tests for Equality of Means – Personal Involvement with Cause .......................... 168
Table 27: Mann- Whitney U Test – Personal Involvement with Cause ..................................... 168
Table 28: T-Tests for Equality of Means –Cancer vs. Social Cause Involvement ..................... 169
Table 29: Gender Comparisons of Personal Involvement with Sport (Hockey) ........................ 170
Table 30: T-Tests for Equality of Means – Personal Involvement with the Sport of Hockey ... 172
Table 31: Mann- Whitney U Test – Personal Involvement with Sport ...................................... 172
Table 32: Gender Comparisons of Gender Support for Women ................................................ 174
Table 33: T-Tests for Equality of Means – Gender Support for Women ................................... 175
Table 34: Mann-Whitney U Test – Gender Support for Women ............................................... 176
Table 35: Gender Comparisons of Gender Support for Men ...................................................... 177
Table 36: T-Tests for Equality of Means – Gender Support for Men ........................................ 178
Table 37: Mann-Whitney U Test – Gender Support for Women ............................................... 179
Table 38: Correlation Matrix (All-Events Sample) .................................................................... 180

x
Table 39: Correlation Matrix (Women‘s Hockey Sample)......................................................... 181
Table 40: Correlation Matrix (Men‘s Hockey Sample) .............................................................. 183
Table 41: Correlation Matrix (Cancer-Causes Sample) .............................................................. 184
Table 42: Correlation Matrix (Social-Causes Sample) ............................................................... 185
Table 43: Correlation Matrix by Gender (All-Events Sample) .................................................. 188
Table 44: Correlation Matrix by Gender (Women's Hockey Sample) ....................................... 190
Table 45: Correlation Matrix by Gender (Men‘s Hockey Sample) ............................................ 191
Table 46: Correlation Matrix by Gender (Cancer-Causes Sample) ............................................ 193
Table 47: Correlation Matrix by Gender (Social-Causes Sample) ............................................. 195
Table 48: Comparison of Correlation Coefficients ..................................................................... 198
Table 49: Comparison of Correlation Coefficients ..................................................................... 199
Table 50: Correlation Matrix for Female Respondents .............................................................. 202
Table 51: Comparison of Women‘s Correlation Coefficients at Women‘s vs. Men‘s Events ... 203
Table 52: T-Test for Equality of Means – Sponsorship Response ............................................. 205
Table 53: Gender Comparison Results - Event Specific Sponsorship Response ....................... 208
Table 54: Multiple Regression Coefficient: All-Events Sample ................................................ 209
Table 55: Multiple Regression Coefficient: Women Sample ..................................................... 210
Table 56: Multiple Regression Coefficient: Men Sample .......................................................... 211
Table 57: Summary of Findings from Tested Hypotheses ......................................................... 212
Table 58: Comparison of Findings across Samples .................................................................... 215

xi
Table 59: Summary of Sponsorship Effects Studies ................................................................... 219
Table 60: Cause Affiliations for Sampled Events....................................................................... 226
Table 61: Comparison of PI*FIT Correlations ........................................................................... 232
Table 62: Sponsorship Activation ............................................................................................... 234
Table 63: Gender Comparison of Personal Involvement (PI) .................................................... 236
Table 64: Reciprocal Exchange of CRSS ................................................................................... 241
Table 65: Gender Comparisons of Correlation Results - PI*SR (INT/FAV/USE) .................... 243
Table 66: Gender Comparisons of Correlation Results by Type of Cause Sample .................... 244
Table 67: Comparison of PI*SR Correlations by Type of Hockey and Type of Cause ............. 245
Table 68: Comparison of PI*SR (INT/FAV/USE) Correlation Findings ................................... 246
Table 69: Comparison of FIT* SR (INT/FAV/USE) Correlations ............................................. 254
Table 70: Gender Comparison of Correlation Results - FIT*SR (INT/FAV/USE) ................... 255
Table 71: Comparison of Men‘s FIT*SR Correlations by Type of Hockey............................... 256
Table 72: Comparison of SINC*SR (INT/FAV/USE) Correlations........................................... 259
Table 73: Gender Comparison of Correlation Results - SINC*SR (INT/FAV/USE) ................ 260
Table 74: Correlation Results of SR (INT/FAV/USE) ............................................................... 263
Table 75: Comparison of Findings - Research Design ............................................................... 269
Table 76: Comparison of Models – Sponsor Interest ................................................................. 270
Table 77: Comparison of Models – Sponsor Favourability ........................................................ 272
Table 78: Comparison of Models – Sponsor Use ....................................................................... 273

xii
Table 79: Summary of Gender Differences and Similarities ...................................................... 275

xiii
List of Figures
Figure 1: 2013 North American Sponsorship Spending by Property Type (IEG, 2014) .............. 15
Figure 2: Canadian Sponsorship Spending by Property Type (O‘Reilly & Beselt, 2013). .......... 16
Figure 3: Sponsorship Effects - Framework of Understanding .................................................... 36
Figure 4: An Overview of the Various Forms of Corporate Social Responsibility (CSR)........... 64
Figure 5: Conceptual Framework for Current Study – Consumer Processing of CRSS ............ 132
Figure 6: Consumer Processing of CRSS - Hypothesized Relationships ................................... 139
Figure 7: CRSS Conceptual Framework - Results ..................................................................... 216
Figure 8: Goodwill Effects of Fan Involvement (Meenaghan, 2001b) ....................................... 238
Figure 9: Goodwill Effects of CRSS – Current Study ................................................................ 240
Figure 10: Effects of PI in CRSS (Total Sample) ....................................................................... 247
Figure 11: Effects of PI in CRSS (Women‘s Sample) ................................................................ 248
Figure 12: Effects of PI in CRSS (Men‘s Sample) ..................................................................... 248
Figure 13: Effects of GSW in CRSS (Total Female Sample) ..................................................... 253
Figure 14: Effects of FIT in CRSS (Total Sample) .................................................................... 257
Figure 15: Effects of FIT in CRSS (Women‘s Sample) ............................................................. 257
Figure 16: Effects of FIT in CRSS (Men‘s Sample) ................................................................... 258
Figure 17: Effects of SINC in CRSS (Total Sample) ................................................................. 261
Figure 18: Effects of SINC in CRSS (Women‘s Sample) .......................................................... 261
Figure 19: Effects of SINC in CRSS (Men‘s Sample) ............................................................... 262

xiv
List of Appendices
Appendix A: Event #1 -Nipissing University Men‘s Hockey Real Men Wear Pink Survey ..... 324
Appendix B: Event #2 - Laurentian University Women‘s Hockey Pink the Rink Survey ......... 329
Appendix C: Event #3 - Nipissing University Women‘s Hockey Pink the Rink Survey ........... 334
Appendix D: Event #4 – Ottawa Senators NHL Food Drive Game Survey ............................... 339
Appendix E: Event #5 – Sudbury Wolves Teddy Bear Toss Game Survey ............................... 344
Appendix F: Consent Form for Research Participation .............................................................. 349
Appendix G: Reliability of Measurement Scales........................................................................ 351
Appendix H: Correlation Matrices for Each Sampled Event...................................................... 352

Chapter 1
1.0 Introduction
The modern marketing landscape is dynamic and in a perpetual state of evolution. Tied to social
trends and changing consumer attitudes and behaviours, marketing strategies must be quickly
adapted to new marketplace realities. Sponsorship has evolved to become an important strategy
for marketers to engage consumers and to realize various business objectives. Sponsorship is a
growing industry that is projected to reach over $55 billion in global investment in 2014 (IEG,
2014). Sport remains the most prominent form of sponsorship while growth is also observed in
other areas such as causes, entertainment, and festivals (IEG, 2014; O‘Reilly & Beselt, 2013).
As the industry matures, various types of sponsorship are beginning to merge (such as sport and
cause, art and cause, and sport and festivals) and are effectively blurring the traditional set of
sponsorship classifications.
Given the prominence of sport, early sponsorship research efforts have been mainly grounded in
the context of sport (Farrelly, Quester, & Burton, 1997; Quester & Thompson, 2001).
Furthermore, sport has traditionally been male-dominated and therefore a significant portion of
sponsorship knowledge has been derived through investigations of male sports and male
consumers with little consideration for women‘s sports or for women as targets of sponsorship
efforts (Lough & Irwin, 2001). Over the past decade, increased attention has been devoted to
women in the sponsorship industry (Dodds et al., 2014; Sack & Fried, 2001; Shaw & Amis,
2001; Maxwell & Lough, 2009). A synthesis of reviewed literature suggests that this marked
shift toward female interests can be attributed to three main influences. The first is that gender is
among the most relied upon consumer segmentation variables. Gender (in the context of
biological sex) is an objective variable that is sizeable, identifiable and reachable through

2
marketing campaigns (Darley & Smith, 1995; Perreault, McCarthy, Meredith, & Ricker, 2007;
Putrevu, 2001). The second factor driving interest in the female market is the increased
recognition of the influence of women and the corresponding profit potential of engaging this
lucrative female market (Barletta, 2006; Johne, 2010; Johnson & Learned, 2004). Finally,
evidence of fundamental gender differences in consumer behaviour has effectively captured the
attention of sponsorship scholars and practitioners who realize the need to adapt marketing
strategies to reflect these significant differences (Dodds et al., 2014; Goodrich, 2014; Green &
Antoine, 2011; Kempf, Laczniak, & Smith, 2006; Meyers-Levy, 1989; Wajda, Hu, & Cui, 2008).
This dissertation was guided by a review of close to three hundred sources that allowed for the
identification, quantification, and thorough analysis of leading trends in sponsorship marketing.
The purpose of this dissertation is to contribute to an understanding of the effects of the
emerging area of cause-related sport sponsorship (CRSS) on consumer perceptions and
responsiveness in terms of sponsor interest, favourability, and intended use. Furthermore, the
potential influence of gender at all stages in the sponsorship process is investigated.
The review of the sponsorship literature is structured around the primary streams of published
research (i.e., nature of sponsorship, managerial aspects of sponsorship, sponsorship effects, and
strategic use of sponsorship). The strategic evolution and worldwide adoption of sponsorship
validates this promotional method as an effective means to emotionally engage consumers at the
cognitive, affective and behavioural stages. Thirty-three sponsorship studies focusing on
consumer effects are considered. Through this review, involvement is identified as an important
consumer dimension in the processing of sponsorship efforts. Sponsor-event fit, as well as
consumer perceptions of sponsor sincerity, are also identified as key predictors of consumer
response. The need to activate sponsorship associations is detailed with an observed trend

3
toward new forms of consumer engagement such as experiential marketing and digital
connections. Ambush marketing is reviewed both as a threat to sponsorship as well as a
competitively sound marketing approach.
Given the recent attention and growing importance of corporate social responsibility (CSR),
charitable/cause associations are addressed in the review of literature. The many blurring forms
of corporate goodness (e.g., CSR, community involvement, philanthropy, strategic giving, cause
marketing, cause-related marketing, and cause sponsorship) are first distinguished allowing for a
more focused review of current findings and emerging trends specific to cause sponsorship. The
blending of sport and cause in the form of CRSS is highlighted as an increasingly prevalent
industry practice in need of increased research efforts. The inclusion of cause in sponsorship
programs injects an enhanced element of goodwill and shared benefits that distinguish this form
of sponsorship from others (Hyllegard, Yan, Ogle, & Attman, 2011; Meher, 1999; Menon &
Kahn, 2003). The remaining characteristics and influences of cause sponsorship remain
consistent with those identified in the review of sponsorship literature. Namely, consumer
involvement (Chang, 2012; Filo, Funk, & O‘Brien, 2010; Hyllegard et al., 2011) and perceptions
of fit and sincerity (Becker-Olsen & Simmons, 2002; Close & Lacey, 2013; Heue & Plewa,
2010; Roy, 2011) along with sufficient activation investment (Meyer, 1999; Pearsall, 2009;
Pope, 2010; Watt, 2010) are critical to the success of cause-affiliated marketing efforts. A
review of an additional fifteen consumer effect studies affirms consumers‘ favourable response
to cause-affiliated efforts (e.g., Berger, Cunningham, & Kozinets, 1999; Cornwell & Coote,
2005; Hajjat, 2003; Irwin, Lachowetz, Cornwell, & Clark, 2003; Roy & Graeff, 2003; Walker &
Kent, 2009).

4
The literature review further focuses on sponsorship discovery from a gendered perspective.
This section highlights the importance of gender considerations in marketing and proceeds to
detail key differences that impact consumer behaviour and ultimately sponsorship response. The
information processing styles of males and females are contrasted with the understanding that
females tend to follow a more comprehensive and elaborate approach while males favour a more
streamlined process that relies mainly on existing or readily-available information (Green &
Antoine, 2011; Meyers-Levy, 1989; Wajda et al., 2008). An important distinction in the
application of this selectivity hypothesis is that consumer processing can be influenced by
situational factors and that adequate cues can prompt more detailed consideration by either
gender (Darley & Smith, 1995). This caveat supports the expressed need for strategic
sponsorship activation identified in the preceding review. The review of cause-affiliated studies
(e.g., Meyers-Levy & Sternthal, 1991; Kolyesnikova, Dodd, & Wilcox, 2009) highlights female
consumers‘ heightened sense of social responsibility and corresponding favour toward
corporations that display genuine acts of kindness. Women‘s motivation to participate in
sporting events associated with relevant causes is also considered as a significant observation
(Bennett, Mousley, Kitchen, & Ali-Choudhury, 2007). A review of the development of women
in sport is included to establish the growing relevance of sport in the lives of women (Adams,
2003; CCAA, 2011; CIS, 2011; IOC, 2013; Statistics Canada, 2010). It is recognized through
this literature that women value sport and that the combination of sport and cause has the
potential for exponential effect on female consumer perceptions and behaviours. These effects
however have only been minimally explored.
The sport consumption behaviours of men and women are also contrasted. The importance of
teamwork and enjoyment of sport above individual achievement and winning is highlighted as

5
being greater for women than for men (Bush, Bush, Shannahan, & Dupuis, 2007; Wiley, Shaw,
& Havitz, 2000). Furthermore, the social aspect of sport is presented as a primary motivation for
female sport participation and spectatorship (Bush et al., 2007; Clark, Apostolopoulou, &
Gladden, 2009; Ridinger & Funk, 2006; Shani, Sandler, & Long, 1992). Past studies (James &
Ridinger, 2002; Kahle, Aiken, Dalakas, & Duncan, 2003; Fink, Trail, & Anderson, 2002)
indicate that attendees of women‘s sporting events differ from those of men‘s events in terms of
perceptions of various environmental factors (e.g., entertainment, concessions, seating,
atmosphere, promotions, social interactions, and pricing). There is also growing observation of
gender solidarity as women express a desire to celebrate and support the advancement of women
in sport (Bennett et al., 2007; Ridinger & Funk, 2006; Sack & Fried, 2001). Further research
contrasting men‘s and women‘s sport is recommended in order to better understand possible
differences and similarities in spectators‘ motivations and behaviours (James & Ridinger, 2002).
Adding to the thirty-three sponsorship effect studies and the fifteen cause-affiliated marketing
effect inquiries, twelve further investigations involving gender differences in consumer response
are considered. A total of sixty consumer effect studies are therefore examined in this review of
published knowledge pertaining to consumer response. Findings from these gender involved
studies support growing propositions that gender can impact consumer response to sponsorship
and that involvement levels and perceptions of fit and sincerity are key considerations across
genders (Bennett, Ferreira, Lee, & Polite, 2009; Bush et al., 2007; Bush, Martin, & Bush, 2004;
Kinney, McDaniel, & DeGaris, 2008; McDaniel & Kinney, 1998; McDaniel, 1999).
Chapter three summarizes the review of existing sponsorship, cause, and gender marketing
literature. Ten primary findings are extracted and directly linked to the purpose and design of
this dissertation. These include:

6
i) the blending of sport and cause sponsorships,
ii) the significance of sponsor-event fit, perceived sincerity of the sponsor, and consumer
involvement levels as determinants of sponsorship response,
iii) the prevalent use of the hierarchy of effects model to measure consumer response to
sponsorship,
iv) women‘s affinity to corporate goodness,
v) women‘s increasing and distinctive involvement in sport,
vi) the notion of gender solidarity among women in sport and causes,
vii) the validity of the Sponsorship Evaluation Scale (SES),
viii) the need to further understand the role of gender in consumer response to
sponsorship,
ix) the demand for field-based sponsorship investigations, and
x) a noted absence of Canadian-based sponsorship effects studies.
Based on existing knowledge and identified gaps, a conceptual framework for understanding
consumer processing of CRSS is presented.
Chapter four formalizes the purpose of this dissertation and develops the hypothesized
relationships that were tested through the proposed model of consumer processing of CRSS.
There are three categories of variables from which the hypotheses for this study were formed.
The categories include: i) consumer factors (gender, personal involvement with the sport,
personal involvement with the cause, gender support for women, gender support for men), ii)
sponsorship factors (sponsor-event fit, and perceived sincerity of the sponsor), and iii)
sponsorship response in accordance with the hierarchy of effects (interest, favourability, and
use). Eleven hypotheses were developed grounded in these categories. Each proposed

7
relationship was also tested for possible gender influence in an effort to highlight any significant
differences between the processing and response of women and men in the context of this cause-
related sport sponsorship investigation. The design of this spectator-based field level study is
detailed along with a review of measurement scales relied upon to develop the consumer
questionnaire. The importance of Speed and Thompson (2000) and Alay‘s (2008) earlier models
of consumer response to sponsorship are noted as integral to the design of this current study.
Data was collected at five different charity-linked (women‘s and men‘s) hockey events across
three different cities (i.e., North Bay, Sudbury, and Ottawa) in the province of Ontario. A total
of 314 women and 319 men participated in this study.
Chapter five presents the results of this investigation and details the statistical analyses
undertaken to examine the hypotheses and to test the proposed model of consumer processing of
CRSS. Statistical analysis was conducted at four levels of sample investigation: i) the all-events
sample, ii) spectators of women‘s hockey events versus spectators of men‘s hockey events, iii)
cancer-cause affiliated events versus social-cause affiliated events, and iv) attendees at the five
individual CRSS hockey events.
Chapter six reflects on the results of this study in comparison to other relevant (and published)
findings. Confirmed support for existing knowledge is detailed along with a discussion of the
unique observations and contributions of this Canadian-based field-level investigation of CRSS
from a gendered perspective. Guided by the output of this inquiry, an answer is offered to the
question of whether gender matters in CRSS. The significance of findings in terms of support
for existing theories across different sponsorship settings as well as unique discoveries offered
through this dissertation are next highlighted, followed by a presentation of implications in terms
of marketing to women through CRSS, marketing to men through CRSS, and general guidelines

8
for sponsorship success in the emerging area of CRSS. The final section of this dissertation
acknowledges limitations of this study and suggests directions for future research.

9
Chapter 2
2.0 Review of Literature
A review of relevant literature was conducted in order to establish a sound understanding of
existing sponsorship knowledge and to identify key areas in need of further research. This
literature review is organized into three major sections. The first section reviews the four main
streams of sponsorship research as categorized by Walliser (2003). These include: i) nature of
sponsorship, ii) managerial aspects of sponsorship, iii) sponsorship effects, and iv) strategic use
of sponsorship (strategies and counter-strategies). The second section focuses on the areas of
cause-affiliated marketing and sponsorship, and the final section considers gender differences as
they pertain to consumer processing of sponsorship marketing. This chapter is organized in a
manner that first establishes a broad understanding of the sponsorship literature followed by a
more focused presentation of topics most significant to the purpose of this dissertation (i.e.,
CRSS and gendered consumer response).
2.1 Sponsorship Marketing
Despite beliefs that sponsorship has actually existed for thousands of years, it is still often
referred to as a new form of marketing promotion (Shanklin & Kuzma, 1992). This section
details the evolution and growth of sponsorship as a core marketing strategy.
Cornwell and Maignan (1998) conducted an extensive international review of sponsorship
research that included eighty articles spanning the 1983-1995 period. These authors organized
their analysis around five major research streams. Walliser (2003) included an additional 153
articles in an extended and updated review which condensed the major sponsorship research
streams into the following four areas: i) nature of sponsorship; ii) managerial aspects of

10
sponsorship; iii) measurement of sponsorship effects; and iv) strategic use of sponsorship
(strategies and counter-strategies). Given the extensive nature of these well cited reviews, the
same categorization of sponsorship streams was used to structure this literary review. Emphasis
is placed on the measurement of sponsorship effects which is the focus of this dissertation.
2.1.1 Nature of Sponsorship
In understanding the nature of sponsorship, the following section begins with a review of
commonly cited definitions, followed by an examination of industry spending and the role that
sponsorship plays in the broader promotional mix.
Shanklin and Kuzma (1992) provided a historical account of sponsorship which dates back over
2,000 years to Ancient Rome where gladiator battles were sponsored by aristocrats. As early as
590 BC the Greek state sponsored Olympic athletes (Harris, 1964 as cited in Smith, 2004, p.
457) and the first Modern Olympic Games of 1896 benefited from Eastman Kodak‘s
sponsorship. Coca-Cola‘s long standing Olympic partnership also dates back to 1928 (Davis,
2012). Despite these early roots, sponsorship as a formal promotional tool in modern marketing
is still considered relatively new (Copeland, Frisby, & McCarville, 1996; O‘Reilly, Nadeau,
Seguin, & Harrison, 2007).
The contemporary version of sponsorship began in the early 1980s and has spiked and evolved
over the past four decades (Meenaghan, 2001a; Cahill & Meenaghan, 2013). Meenaghan and
O‘Sullivan (2001) described this phenomenon as ―…recent, spectacular, and pervasive‖ (p.87).
According to Cornwell and Kwon (as cited in Cornwell & Humphreys, 2013, p.394) more than
three-hundred academic papers regarding various aspects of sponsorship (e.g., concepts,
management, measurement, and policy) have been published over the last decade. Throughout

11
this period of accelerated growth, the nature of sponsorship has progressed from altruistic and
philanthropic motives to a more commercial, bottom-line focus (Copeland et al., 1996; Gwinner,
Larson, & Swanson, 2009). Firms typically progress through three stages of sponsorship goals
and participation: the first consists of pure donation with no expected return, the next level
introduces some commercial interest, and the highest stage, which represents the majority of
current sponsorship activity, demands clear financial return and is therefore planned and
managed in a more sophisticated and controlled manner (Cornwell & Maignan, 1998; Thjomoe,
Olson, & Bronn, 2002).
2.1.1.1 Defining Sponsorship
Over the past four decades, many attempts have been made to define sponsorship (Cornwell,
1995; Cornwell & Maignan, 1998; Javalgi, Traylor, Gross, & Lampman, 1994; Lee & Sandler,
1997; Meenaghan, 1983; Sandler & Shani, 1989; Quester & Thompson, 2001). The following
definition is prominent throughout the sponsorship literature. Meenaghan (1983) recognized
commercial motives of sponsorship and defined it as, ―…the provision of assistance either
financial or in-kind to an activity by a commercial organization for the purpose of achieving
commercial objectives‖ (p.9). Following an extensive review of the sponsorship literature,
Walliser (2003) concluded that despite the lack of a universally agreed upon definition of
sponsorship, there are a sufficient number of variations that exist leading the author to suggest
that ―instead of continuing a possibly never-ending academic debate about concurrent definitions
of sponsorship, it may be more useful to focus research on the perception of sponsorship by its
different targets‖ (Walliser, 2003, p.18). Using this recommendation by Walliser (2003), this
dissertation focuses on examining consumer effects of sponsorship on both genders.

12
Sponsorship can involve a single sponsor but in most cases, properties encourage and rely on
multiple sponsors (Chien, Cornwell, & Pappu, 2011). For instance, the National Hockey League
(NHL) lists Kraft, Gatorade, Reebok, and Molson Canadian among twenty-two North American
sponsors (NHL, 2014). A sponsor can also choose to partner with several properties thus
creating a sponsorship portfolio (Chien et al., 2011) or a sponsorship roster (Ruth & Simonin,
2006). As an example, in addition to sponsoring the NHL, the Gatorade brand sponsors the
National Football League (NFL), the National Basketball Association (NBA), Major League
Baseball (MLB), and Major League Soccer (MLS). These multiple sponsorship systems are
understandably more complex and have only recently begun to receive attention in the academic
literature (Chanavat, Martinent, & Ferrant, 2009; Chanavat, Martinent, & Ferrant, 2010; Chien et
al., 2011; Ruth & Simonin, 2006).
There are also different types of sponsorship according to the International Event Group (IEG,
2013), who identifies the following six property types: i) sports, ii) entertainment, iii) causes, iv)
arts, v) festivals/fairs/annual events, and vi) associations and membership organizations. The
Canadian Sponsorship Landscape Study (CSLS) (O‘Reilly & Beselt, 2013) adopts a similar
grouping of six categories: i) sports (which includes mainly sporting events, facilities, athletes,
teams, clubs, leagues and organizations), ii) causes (events, charities, and causes), iii)
festivals/events (annual community events, music festivals, fairs, etc.), iv) entertainment (tours
and attractions), v) arts (museums, festivals, theatre, etc.), and vi) others (such as education,
hospitals, tradeshows and conferences). The relative strength and roles of the various types of
sponsorship will be further discussed following a review of sponsorship spending.

13
2.1.1.2 Sponsorship Spending
Sponsorship has evolved into a large industry. In 1984 (the infancy stage of corporate
sponsorship), global sponsorship spending was estimated at $2 billion (Sponsorship Research
International, 2000, as cited in Meenaghan & O‘Sullivan, 2001, p.87). In 2013, this modest
figure grew to a thriving $53.1 billion (IEG, 2014). Sponsorship spending is largest in North
America with $19.8 billion in 2013 (37% of global spending), followed closely by Europe ($14.5
billion) and Asian Pacific markets ($12.6 billion). As detailed in Table 1 below, healthy
sponsorship growth is observed across the globe. For 2014, IEG projects worldwide spending to
increase 4.1% to $55.3 billion (IEG, 2014).
Table 1: Sponsorship Spending Trends (IEG, 2014)
IEG
Sponsorship
Report
2007 2008 2009 2010 2011 2012 2013
2014
(est.)
Global
Spending
% Growth
$37.9
billion*
$43.1B
+13.7%
$44.0B
+2.1%
$46.3B
+5.2%
$48.6B
+5.1%
$51.1B
+5.1%
$53.1B
+3.9%
$55.3B
+4.1%
North
America
% Growth
$14.9B
$16.6B
+11.4%
$16.5B
-0.6%
$17.2B
+4.2
$18.1B
+5.2%
$18.9B
+4.4%
$19.8B
+4.5%
$20.6B
+4.3%
Europe
% Growth
$10.6B $11.7B
+10.4%
$12.1B
+3.4%
$12.9B
+6.6%
$13.5B
+4.7%
$14.1B
+4.4%
$14.5B
+2.8%
$14.8B
+2.1%
Asian Pacific
% Growth
$7.6B $9.5B
+25%
$10.0B
+5.3%
$10.6B
+6.0%
$11.2B
+5.7%
$12.0B
+7.1%
$12.6B
+5%
$13.3B
+5.6%
Central &
South
America
% Growth
$3.0B $3.4B
+13.3%
$3.5B
+2.9%
$3.6B
+2.9%
$3.7B
+2.8%
$3.9B
+5.4 %
$4.0B
+2.6%
$4.2B
+5%
All Other $1.8B $1.9B $1.9B $2B $2.1B $2.2B $2.3B $2.4B
14
Countries +5.6% 0% +5.3% +5.0% +4.8% +4.5% +4.3%
*All above figures are in US currency (billions).
The 7th
Annual Canadian Sponsorship Landscape Study (O‘Reilly & Beselt, 2013) provided
sponsorship data specific to the Canadian marketplace. Stable sponsorship spending was
reported in Canada with an estimated investment of $1.57 billion in 2012 sponsorship. Table 2
below provides Canadian sponsorship spending figures since 2006. It is important to note that
these reported spending estimates represent the cost to acquire the rights to various sponsorship
properties. They do not include any additional investments in promoting these sponsorships. As
will be further discussed in the ‗Strategic Use of Sponsorship‘ section, most companies devote
additional spending to leverage these sponsorships.
Table 2: Canadian Sponsorship Spending Trends (O’Reilly & Beselt, 2012)
CSLS 2006 2007 2008 2009 2010 2011 2012
Spending
Growth
$1.11B* 1.22 B
+9.9%
1.39 B
+14%
1.43 B
+2.9%
$1.55B
+8.4%
$1.59
+2.6%
$1.57B
-
*All above figures are in Canadian currency (billions).
These impressive periods of growth validate Harvey‘s (2001) proclamation that ―the future shall
be the new Golden Age for sponsorship‖ (p.59). Burton and O‘Reilly (2011) offered four
reasons why sponsorship spending continues to grow (despite economic fallout): i) there is
widespread evidence that sponsorship works to accomplish various business objectives (such as
repositioning brands, altering consumer perceptions, and increasing sales), ii) creative
sponsorship can efficiently target specific consumer segments, iii) sponsorship has distinct
advantages over advertising, and iv) sponsorship can be more fun, with hospitality functions,
backstage passes to prestigious events and charitable links to flatter social consciousness.

15
Sport accounts for the majority of sponsorships, commanding 69% of all North American
spending and outpacing all other category growth with an increase of 5.1% in 2013 (IEG, 2014).
As shown in Figure 1 below, the entertainment category is a distant second to sport capturing
10% of sponsorship spending but also realizing moderate growth at +2.1%. Causes are also
receiving growing support from sponsors with 9% of category spending and a strong increase of
4.8% in 2013. IEG projects that 2014 cause sponsorship spending will increase by an additional
3.4%. The arts and festivals hold similar shares (5% and 4%) and finally, associations represent
the least amount (3%) of North American sponsorships (IEG, 2014).
Figure 1: 2013 North American Sponsorship Spending by Property Type (IEG, 2014)
Sport also dominates the Canadian sponsorship market but to a lesser extent than reported by
IEG (2014) for all North American markets. According to the CSLS (O‘Reilly & Beselt, 2013),
corporate investment by sponsorship type in 2012 was as follows: sport 49.4%, festivals and fairs
18.1%, arts 10.5%, causes 9.9%, media 5.9% and entertainment 1%. Figure 2 captures this
Canadian sponsorship spending by type. Several of these Canadian findings differ from that
reported by IEG (2014). The CSLS investigators; O‘Reilly & Beselt (2013) suggested that
varying interpretations of the category labels by survey respondents may account for some of
Sports
69%
(+5.1%)
Entertainment
10%
(+2.1%)
Causes
9%
(+4.8%)
Arts
5%
(+2.6%)
Festivals
4%
(+1.7%)
Associations
3%
(+3.3 %)

16
these discrepancies. For instance, sponsors could classify major sporting events (such as the
Canadian Football League‘s Grey Cup or the Calgary Stampede) as either a sport or a festival
type sponsorship. Similar re-classifications may be impacting other categories such as cause-
related sport events (such as the CIBC Run for the Cure) being captured as either a cause or a
sport. The occurrence of mega events (such as the 2010 Winter Olympic Games and the hosting
of the G8 Summit) can also impact observed trends. These blurred category boundaries and
inconsistent sponsorship descriptions are indicative of the previously mentioned challenges of
defining sponsorship in a rapidly growing and complex environment. It is clear however from
these two sponsorship spending studies that sponsorship is growing across all global markets;
that sport remains the dominant choice of sponsors; causes are receiving increasing support; and
that the traditional sponsorship categories are evolving and in some cases interrelating.
Figure 2: Canadian Sponsorship Spending by Property Type (O’Reilly & Beselt, 2013).
Given the stature of sport in sponsorship, the vast majority of past sponsorship knowledge has
been derived from sport frameworks (Farrelly et al., 1997; Quester & Thompson, 2001). Various
researchers have considered the relative strengths of the different types of sponsorships. Farrelly
and Quester (2005) chose the sport context (Australian Football League) in their investigation of
Sport
49%
Causes
10%
Festivals
18%
Entertainment
1%
Arts
10%
Media
6% Other
6%

17
co-marketing alliances. Their choice of sport was supported by the large-scale use of sport
sponsorship, sport entities‘ reliance on sponsorship revenue, and the potential for mutual gain
between sponsors and property owners. These authors captured the uniqueness of sport that
attracts sponsors and researchers alike; ―…sport has a substantial nonverbal component
involving universal images of hope, pain, and victory, which can transcend language and cultural
boundaries in order to provide companies with a persuasive platform on which to build
awareness … (Farrelly & Quester, 2005, p.56). McCarville and Copeland (1994) also listed the
strong characteristics of sport sponsorship to include the ability to target specific groups, the high
level of consumer/fan involvement, the potential for differentiation from the unique
characteristics of each sport, and the opportunity to connect with the local community. Bal,
Quester, and Plewa (2009) stressed the uniqueness and intensity of sports-related emotions as a
platform to connect with consumers while Poon and Prendergast (2006) cautioned that ethical
issues in sports (such as drug abuse and corruption) can deter sponsors and shift preference to art
and social causes.
Art (or cultural) sponsorship refers to ―the creative output from theatre, classical and popular
music, dance, opera, and film, as well as the visual arts‖ (Sylvestre & Moutinho, 2007, p.283).
As established in the above spending review, art sponsorship represents a small proportion of
industry spending and as such has received very little research attention. This gap in the
literature is slowly being addressed (Meenaghan, 2001a; Quester & Thompson, 2000; Sylvestre
& Moutinho, 2007). Through focus-group research with consumers as recipients of sponsorship
imagery, Meenaghan (2001a) found that the notion of goodwill varies by sponsorship type.
Categories such as social and environmental causes, high-brow arts and cultural events were
viewed as more philanthropic and therefore recorded higher levels of goodwill. Conversely,

18
sports and popular arts offered lower levels of goodwill as these were considered by respondents
as more commercially driven and in some cases described as ―brash, blatant, loud, and
obtrusive‖ (Meenaghan, 2001a, p.198). Sylvestre and Moutinho (2007) also explored cultural
sponsorship (from a leveraging standpoint) contending that art sponsorship is distinct in the
audience that it attracts, its image, and its community and economic influence.
Given its recent growth, the sponsorship of causes also warrants elaboration. IEG (2014) valued
North American cause sponsorship at $1.78 billion while the CSLS reported an increase in
Canadian cause sponsorship from $82 million in 2011 to $155 million in 2012 (+86%) (O‘Reilly
& Beselt, 2013). Johnston (2010) recently examined various managerial variables that influence
sponsorship decision-making. Findings from this study showed a strong and growing managerial
preference for cause-related sponsorship. To support these findings, Johnston (2010) referenced
a recent North American study (Performance Research, 2009, as cited in Johnston, 2010, p.375)
that found that 84% of consumers would like to see more spending on their favourite causes or
not-for profit organizations (NPOs). Given this evolving preference of cause, the author
recommended that other categories (such as sport and art) collaborate with cause-related partners
to strengthen their property appeal and potential consumer response. Cause-affiliated marketing
is further discussed in section 2.2 of this literature review.
2.1.1.3 Sponsorship and the Promotional Mix
The traditional promotional mix includes four elements: advertising, sales promotion, publicity
and personal selling (Crane, Kerin, Hartley, & Rudelius, 2014). The increased investment in
sponsorship as a promotional tool has raised questions about where sponsorship fits within this
mix. There is growing support for the proposition that sponsorship is a legitimate and distinct

19
―fifth‖ element of the promotional mix (Ali, Cornwell, Nguyen, & Coots, 2006; Seguin &
O‘Reilly, 2007).
In their study of corporate executives involved in sponsorship, Shanklin and Kuzma (1992)
commented on the evolving role of sponsorship:
It defies neat classification as philanthropy or as one of the traditional elements of the
promotion mix. As (companies) gain experience, they begin to treat is as a new, distinct
element of the mix, an adjunct to rather than a part of other marketing functions. It
makes use of all of the other mix tools, yet it is none of them. (p.66)
IEG (2014) tracks the annual growth of advertising, promotions (including public relations,
direct marketing and sales promotions) and sponsorship spending in North America and reported
that in 2013, advertising spending increased by only 1.8%, sales promotions by 4.3% and
sponsorship outpaced all other forms of promotion with a 4.5% increase. IEG (2014) predicts
continued growth for all elements in 2014 with North American advertising expected to grow
2.8% (mainly driven by digital media), promotions 4.4% and sponsorship is anticipated to realize
similar gain as in 2013 with a 4.3% increase in spending. Given this trend, more attention has
been devoted to distinguishing these promotional elements.
Crimmins and Horn (1996) insisted that, ―Sponsorship is a means of persuasion that is
fundamentally different from traditional advertising. Sponsorship persuades
indirectly…sponsorship works by tapping into the elementary mental calculus that is natural in
us all‖ (p.12). Meenaghan (2001a) further compared consumer perceptions of the differences
between advertising and sponsorship finding that consumers were generally more favourable
toward sponsorship. Sponsors benefits from what Meenaghan referred to as a ―halo of goodwill‖

20
(p.209) that engages consumers on an emotional level and leads them to believe that sponsorship
benefits society more than advertising. Given the more indirect/ subtle nature of sponsorship,
consumers tend to be less skeptical and therefore lower their defense mechanism and are
normally more receptive to sponsorship activities. In contrast, advertising was perceived by
respondents to have a ―halo of commercial intent‖ (Meenaghan, 2001a, p.210) which raised
consumers‘ suspicions and created a heightened defense to advertising messages. Meenaghan
(2001a) contended that this goodwill factor inherent in sponsorship is what ultimately
differentiates it from advertising and serves as the main trigger to consumer response. This
differentiation is the central thrust of Meenaghan‘s (2001b) proposed framework for
understanding how sponsorship works and is explained as follows; ―…(sponsorship) engages the
consumer differently by bestowing benefit on an activity (e.g., sports or arts) with which the
consumer has an intense emotional relationship‖ (p.96).
Cornwell, Weeks and Roy (2005) also distinguished these approaches by highlighting that
sponsorship requires that a fee be paid in advance for the right to potentially benefit whereas
advertising is normally more ownable and controlled by the advertising company. The authors
also noted that advertising and sponsorship can also interact as advertising is often used to
promote or leverage a sponsorship (Cornwell et al., 2005). In a similar fashion, Sneath, Finney,
and Close (2005) suggested that sponsorship be managed as part of a fully integrated marketing
communications strategy that involves all consumer interaction.
2.1.2 Managerial Aspects of Sponsorship
An increase in sponsorship investment has inspired a corresponding scrutiny of the managerial
aspects of sponsorship. Twenty-two studies exploring the various facets of sponsorship
management are summarized (in chronological order from 1992 to 2013) in Table 3 delineating a

21
number of important contributions and identifying sponsorship trends. These include a transition
from tactical to strategic management, a shift from mere exposure and image related objectives
to more behavioural and business-oriented goals, more sophisticated management practices and a
reinforced emphasis on the need for actionable sponsorship measurement. Following the
presentation of Table 3, each of these trends is fully discussed.
Table 3: Summary of Managerial Aspects of Sponsorship Literature
Author(s) (Year) Purpose of Study Findings / Conclusions
Shanklin & Kuzma
(1992)
To identify the
critical issues that
corporate leaders
must examine in
making sponsorship
choices.
Companies must do better at setting market-oriented
objectives, choosing the right events for their target
market, separating sponsorship from philanthropy,
making sponsorship a distinct function with the
marketing department, and holding it accountable for
performance.
Objectives are either awareness or image related.
Evaluating sponsorship results is the weakest link in
sponsorship management. Only about 60% evaluate
(normally awareness and image tracking). Marketers
should consider several evaluation measures.
Copeland, Frisby &
McCarville (1996)
To understand the
sport sponsorship
process from a
corporate perspective.
Corporate Sponsor Profile: most simply layer on
sponsorship management to existing marketing
workloads; tend to support all levels of sport (grassroots,
elite, professional); contract length of 3-5 years; mean
number of requests is 484/year, most actively leverage
with multiple forms of communication.
Selection Criteria: 37 identified, top 3 are exclusivity,
increase awareness, reinforce image
Post-Event Evaluation: 61.5% indicated that awareness,
exposure, and media coverage were key metrics. 46.2%
indicated sales.
Reasons for Termination: little value, inadequate ROI,
change in corporate strategy/direction
Crimmins & Horn
(1996)
To provide a guide to
improve sponsorship
impact on consumers.
Persuasive Impact Equation= strength of link X duration
of link X {gratitude felt due to link + % change due to
link}

22
Guidelines for successful sponsorship:
1/Work Backwards (target market, objectives, message)
2/Check the Fit
3/Start Early
4/Forge a Link
5/Define for Your Target the Meaning
6/Remember that one sponsorship with impact is better
than ten without.
Amis, Pant & Slack
(1997)
To develop a
theoretical
framework of
achieving a
sustainable
competitive
advantage through a
resource-based
approach to sport
sponsorship.
Sponsorship can provide a sustainable competitive
advantage. Four preconditions:
1/heterogeneity (unique congruency and fit)
2/imperfect imitability (difficult to imitate)
3/imperfect mobility ( non-tradable /exclusivity)
4/ex-ante limits to competition (high risk, high return)
Farrelly, Quester &
Burton (1997)
To investigate the
level of integration of
sport sponsorship into
the broader marketing
function through an
international
comparative study.
(North America vs.
Australia)
Varying levels of sophistication exist between the two
markets. North American firms take a more strategic
view of sponsorship, devote greater efforts to integrating
sponsorship with other communication elements and
activate more aggressively (1-2:1 vs. .50-1:1 ratios).
There is a general lack of attention to performance
measures with 72.2% of North American firms and 55%
of the Australian sample, investing less than 10 cents for
every dollar on sponsorship performance measurement.
McCook, Turco &
Ruley (1997)
To ascertain the
process by which
corporations decide
upon sport
sponsorship
proposals.
Decision-making authority depends on the level and
cost. Large companies often use agencies as the
gatekeeper of proposals. Main objectives includes:
awareness/visibility, image enhancement, and increased
sales. There is a strong movement toward more
business-oriented objectives. Companies consider
costs/benefits in their decision-making.
Amis, Slack &
Berrett (1999)
To identify the
critical components
that can render sport
sponsorship a distinct
competence.
Three key components:
1/perceived customer value
2/competitor differentiation
3/extendability
Miyazaki & Morgan To assess market Valuation is a dilemma in sponsorship. This study uses

23
(2001) value of corporate
sponsorship of the
1996 Summer
Olympics.
event study analysis to confirm that the investment
marketplace found value in this Olympic sponsorship.
Thjomoe, Olson &
Bronn (2002)
To identify the
sponsorship decision-
making process.
Most viewed sponsorship as being commercially driven
(vs. philanthropic).
Marketing department leads the process.
Sponsorship goals include increased awareness, image
enhancement, trade and consumer relations, employee
loyalty, increase sales, and competitive advantage.
There is little measurement of results.
Crompton (2004) To evaluate the
effectiveness of
existing measures of
sponsorship.
The further through the communication process an
evaluation takes place, the stronger the evidence of
sponsorship‘s contribution to increased sales.
Measuring media equivalency: common but flawed
Measuring impact on awareness: common but flawed
Measuring impact on image: consider trust and
credibility
Measuring impact on sales: most desirable measure.
Consider increase in retail traffic, sales leads and actual
sales.
Fahy, Farrelly, &
Quester (2004)
To develop a
conceptual model of
the sponsorship-
competitive
advantage
relationship.
Proposed model of sponsorship-based competitive
advantage includes 3 key resources: i) tangible assets
(such as financial); ii) intangible assets (brand equity,
image transfer), and iii) capabilities (sponsorship
management expertise)
These 3 resources should be deployed to develop a
sustainable competitive advantage (SCA) in sponsorship
which drives a SCA in the market and leads to superior
performance.
Chadwick &
Thwaites (2005)
To examine the
practice of
sponsorship
management from an
English (soccer)
perspective
Proposed a six stage sponsorship management process;
i) objective setting (most cited objectives include
generating public awareness, media attention, product
awareness, enhanced corporate image and consumer
perceptions); ii) screening & selection (proactive
decisions based on local proximity, profile/status and
existing relationships); iii) contract content (most
contracts are 2-3 years) ; iv) execution (58% devote up
to 25% of contract value in activation); v) evaluation
(media recognition as primary tool); vi) critical success
factors (good communication, complete and creative

24
activation, club success).
Cornwell, Weeks &
Roy (2005)
To propose a
theoretical model of
how sponsorship
works.
Model of consumer-focused sponsorship-linked
marketing communications includes the following: i)
individual and group factors; ii) market factors; iii)
management factors (policies, activation); iv) the
mechanics of processing; and v) consumer-focused
outcomes of sponsorship (cognitive, affective,
behavioural)
Farrelly & Quester
(2005)
To explore
sponsorship‘s
potential as a co-
marketing alliance.
Sponsorship relationships can operate as alliances,
providing a strategic platform for mutual gain. The
critical success factors include:
1/strategic compatibility
2/goal convergence
3/commitment
4/trust
5/economic and noneconomic satisfaction
Farrelly, Quester &
Burton (2006)
To identify the key
competencies for
successful
sponsorship
relationships.
Core competencies include:
1/reciprocal commitment
2/sponsorship led brand building capabilities
3/collaborative capabilities
O‘Reilly & Madill
(2009)
To assess sponsorship
evaluation in the
literature and in
practice.
Literary Contributions:
1/Five areas require metrics: awareness, image, brand
effects, media output, behaviour.
2/An extensive range of objectives and metrics are
identified.
3/The majority of models focus on awareness.
Industry Findings: Most common measurements involve
sales / purchase intention and media/exposure.
Smolianov & Aiyeku
(2009)
To determine how
sponsorship should
be evaluated.
Primary corporate goal is to increase sales. In order to
do so, the following four objectives should be
established:
1/To increase exposure.
2/To enhance consumer processing (in the form of
awareness, recall and recognition).
3/To enhance communication effects (attitudes, image,

25
purchase intention).
4/To change or increase target audience action (sales,
market share, profit)
These objectives should be managed in a systematic and
sequential manner that reflects the consumer buying
process.
Alay (2010) To validate the
Sponsorship
Evaluation Scale
(SES) as a measure of
sponsorship effects
on consumer
response.
SES (adjustment to Speed & Thompson (2000)
sponsorship questionnaire) is a valid and reliable scale to
measure consumer response (interest, favour, product
use). The eight determinants of consumer response
include: status of the event, liking the event, attitude
toward the event, sponsor-event fit, attitude toward
sponsor, sincerity of sponsor, ubiquity of sponsor, image
of the sponsor.
Farrelly (2010) To identify the
drivers of
sponsorship
termination.
Key reasons for termination include:
1/ strategic vs. tactical intent
2/failure to adapt to the evolution of the relationship
3/conflicting perceptions of contribution / need for proof
4/commitment asymmetry
5/capability gaps
Recommended viewing sponsorship as a co-marketing
alliance where both parties invest assets and play an
active role in the strategic goal setting.
Johnston (2010) To examine the
relationship between
differences in
managerial status,
gender and
experience, on
sponsorship category
preference.
Managerial status, gender and sponsorship experience
influence managers‘ preferences for sponsoring arts,
causes, celebrities and sports
Senior executives, males and experienced managers
have the strongest preference for sport sponsorship.
Female managers value sport and art sponsorship
equally.
Consistent and strong support for cause-related
sponsorship across all samples.
Meenaghan (2013) To review current
approaches to
sponsorship
evaluation.
Sponsorship is now viewed as a more strategic and
holistic platform of engagement with multiple
stakeholders. There is an increased demand for greater
sponsorship accountability.
Sponsorship management requires the specification of
objectives, budgets, activation programs, and evaluation

26
plans.
Sponsorship objectives have evolved beyond mere
exposure to include experiential consumer engagement.
Social media assists in meeting objectives and can be
measured through buzz monitoring, sentiment analysis,
and online engagement measures.
Return on objectives (ROO) and return on involvement
are preferred over return on investment (ROI). A
―measurement deficit‖ persists in sponsorship.
Meenaghan,
McLoughlin, &
McCormack (2013)
To address changes
in sponsorship that
are impacting
performance
measurement.
Sponsorship connects a wide range of stakeholders that
include: internal staff, trade associations/suppliers
/distributors, government/regulators, shareholders, rights
holders, media, and customers.
There is a transition from short-term ―badging‖ (by
sponsors) to long-term ―building‖ (brand engagement
and relationships).
Basic principles of measuring sponsorship performance
include:
1/ specify the role of sponsorship
2/ establish sponsorship objectives
3/ confirm target market(s)
4/ update objectives through life of sponsorship
5/ establish evaluation plan that is rigorous, independent,
and credible
2.1.2.1 Strategic Evolution of Sponsorship
In the early stages of corporate sponsorship, a more isolated and tactical approach was used.
More recently, organizations are realizing the strategic value of sponsorship and are making
efforts to more fully integrate all communication elements (Cornwell et al., 2005; Farrelly et al.,
1997, 2006; Farrelly & Quester, 2005). Farrelly et al. (2006) recognized that sponsorship is ―in
full transformation, from the tactical to the strategic, from the transactional to the relationship-
oriented, from the short-term to the long term, and from the periphery to the very core of
corporate and brand positioning‖ (p.1019). In a similar manner, Meenaghan, McLoughlin, and

27
McCormack (2013) explained that sponsorship is transitioning from short-term ―badging‖ by the
sponsor to long-term ―building‖ through brand engagement initiatives such as loyalty rewards,
cause-related marketing, and experiential marketing (p.451).
Increasingly, firms are recognizing that sponsorship is in fact a valuable resource that can be
leveraged to create a sustainable competitive advantage that impacts consumer response and
improves market performance (Amis et al., 1997; Amis et al., 1999; Fahy et al., 2004). In order
to secure a distinct competence, there must be perceived value, meaningful differentiation
(through creative and integrated activation) and the ability to extend sponsorship impact both
internally (employees, corporate culture) and externally (customers, suppliers, community) to a
wide range of stakeholders (Amis et al., 1999; Meenaghan et al., 2013).
Sponsorship can be viewed as a co-marketing alliance that provides a ―strategic platform to bring
parties together to work toward enhancing mutual satisfaction and long-term prospect‖ (Farrelly
& Quester, 2005, p.61). This extended view of sponsorship beyond strictly the sponsor‘s
perspective, requires further planning and consideration. Farrelly and Quester (2005) identified
the following critical success factors in co-marketing sponsorship alliances: i) strategic
compatibility, ii) goal convergence, iii) commitment, iv) trust, and v) economic and
noneconomic satisfaction.
2.1.2.2 Consumer and Business Oriented Objectives
It is recommended that any strategic planning process begin with the establishment of specific
and measurable objectives (Crane et. al., 2014). Table 4 captures the most prevalent objectives
cited in the sponsorship literature. This review illustrates that awareness and image from both a
corporate and product/brand perspective have traditionally been the dominant objectives of

28
sponsorship. The proven commercial benefits of sponsorship have encouraged more business-
oriented objectives with a stronger focus on the bottom-line (i.e., profit and sales). In
recognizing that an increase in sales is the ultimate objective of sponsorship, Smolianov and
Aiyeku (2009) proposed that objectives are realized in a sequential fashion that parallels the
consumer decision-making process. For instance, exposure is needed to create consumer
awareness, which is needed to form attitudes and preferences which then drive consumer action
(purchase/no purchase). Nicholls, Roslow, and Dublish (1999) supported this view that
awareness measures remain valuable as they reflect the consumer path to purchase. The
consumer-oriented approach was also adopted by Cornwell et al. (2005) who categorized
sponsorship outcomes by cognitive (think), affective (feel) and behavioural (act) factors. This
hierarchy of effects concept is central in understanding the effects of sponsorship and is further
reviewed in the ―Sponsorship Effects‖ section.
Table 4: Summary of Sponsorship Objectives
Author(s) (Year) Stated Sponsorship Objectives
Chadwick & Thwaites
(2005) public awareness
media attention
product awareness
enhanced corporate image
consumer perceptions
Copeland, Frisby, &
McCarville
(1996)
awareness
media exposure
reinforce image
Cornwell, Weeks, & Roy
(2005) cognitive (awareness, image)
affective (liking, preference)
behavioural (purchase intent, purchase commitment,
purchase)
McCook, Turco, & Ruley
(1997) awareness/visibility
image enhancement

29
increases sales
Shanklin & Kuzma
(1992)
current objectives: awareness and image
need more market-oriented objectives
Smolianov & Aiyeku
(2009)
Sequential Objectives:
exposure
consumer processing (awareness, recall, recognition)
communication effects (attitudes, image, purchase
intentions)
consumer action / purchase
Thjomoe, Olson, & Bronn
(2002) awareness
image enhancement
trade and consumer relations
employee loyalty
increase sales
competitive advantage
More recently, the sponsorship literature has proposed the transition of objectives toward more
experiential ambitions that connect brands and consumers on a more emotional level and over a
longer term (Bal et al., 2009; DeGaris, West, & Dodds, 2009; Cahill & Meenaghan, 2013).
Examples of such initiatives could include loyalty programs, participative interaction, consumer
endorsements, charitable affiliations, and online engagement.
2.1.2.3 Formalized Management Processes
The rapid growth of sponsorship has introduced new complexities and managerial challenges.
Copeland et al. (1996) found that large national companies received on average 484 sponsorship
proposals per year and that in the majority of cases, sponsorship was simply layered on to
existing marketing workloads. These authors highlighted the need for better sponsorship
management. In that same year, Crimmins and Horn (1996) responded to this need with
guidelines for successful sponsorship management that included: i) work backwards (define

30
target market, then objectives, then message), ii) check the fit, iii) start early, iv) forge a link, v)
define for your target market the meaning (i.e. activate), and vi) remember that one sponsorship
with impact is better than ten without.
As a means to navigate increasingly complex sponsorship programs, Chadwick and Thwaites
(2005) proposed a sponsorship management model that involves the following five stages: i)
objective setting, ii) screening & selection, iii) contract content, iv) execution, and v) evaluation.
The authors added that critical to the success of sponsorship management is effective
communication between all stakeholders, complete and creative activation, and the success of the
sponsored property (Chadwick & Thwaites, 2005). The reviewed literature also highlighted the
need for managerial expertise in sponsorship as a distinct function and not a generic lumping
with other marketing functions (Copeland et al., 1996; Cornwell et al., 2005; Fahy et al., 2004;
Shanklin & Kuzma, 1992). This proposition is in-line with the earlier argument that sponsorship
is an additional element of the promotional mix that requires specialized knowledge, skill and
experience.
Johnston (2010) recently probed further into the managerial variables that affect sponsorship
decisions, finding that gender, management status, and sponsorship expertise can all impact the
choice of sponsored categories. Additionally, Johnston (2010) found that senior executives,
males and experienced managers have the strongest preference for sport sponsorship while
female managers value sport and art sponsorship equally. Interestingly, there was consistent and
strong support for cause-related sponsorship across all samples, supporting the observed increase
in cause-related sponsorship spending (Johnston, 2010).

31
2.1.2.4 Sponsorship Evaluation
Sponsorship evaluation remains an area of need in research related to sponsorship management.
It has long been reported that measurement is the ―grey area‖ (Tripodi, Hirons, Bednall, &
Sutherland, 2003) or ―weak link‖ (Shanklin & Kuzma, 1992) of sponsorship with few sponsors
devoting sufficient resources to evaluation (Farrelly et al., 1997; O‘Reilly & Madill, 2009;
Shanklin & Kuzma, 1992; Thjomoe et al., 2002). Meenaghan (2013) referred to this observation
as a ―measurement deficit‖ (p.388) and argued that the extent, nature, and quality of sponsorship
evaluation is limited. Shanklin and Kuzma (1992) reported that only 60% of sponsors evaluate
sponsorship outcomes, which normally involve awareness and image-related metrics. Farrelly et
al. (1997) found that 72.2% (of the 116) of North American firms sampled, invest 10 cents for
every sponsorship dollar spent on performance measurement. More recently, the CSLS
(O‘Reilly & Beselt, 2013) reported that only 2.7% of sponsorship spending was allocated to
measurement and that 50.1% of sponsorship programs were evaluated when an agency was
involved. In addition to the complete absence of evaluation, O‘Reilly and Madill (2009) added
that poorly applied measurement tools and the use of inappropriate tools also pose challenges for
sponsorship management.
Sponsorship metrics should align with sponsorship objectives (Crane et al., 2014; Meenaghan,
2013). There are many sponsorship objectives so naturally there are also many possible metrics.
O‘Reilly and Madill (2009) conducted an extensive review of more than forty sponsorship
evaluation studies to identify five areas that require measurement: i) recognition, recall and
awareness, ii) image and attitude, iii) brand, service or product effects, iv) media output, and v)
behaviour. After this review, O‘Reilly and Madill (2009) concluded that the majority of
evaluation models focus on awareness despite a clear shift to sales-oriented objectives. Given

32
that awareness metrics are normally easy to collect, easy to understand and involve quantifiable
measures, widespread use prevails. These methods are common but faulty as recall and
recognition can stem from various other communication efforts thereby making it near
impossible to isolate the sole effects of sponsorship (Crompton, 2004; Grohs, Wagner, &
Vsetecka, 2004; Meenaghan, 2001b; Speed & Thompson, 2000). Sneath et al. (2005) referred to
this challenge as the ―spillover effect‖ (p.375).
Crompton (2004) advocated for improved measurement that better relates to the desired
outcomes of sponsorship: ―There is a tendency to measure what is easy, namely visibility, rather
than what is important, namely impact‖ (p.273). Thus, as sponsorship objectives progress to
behavioural stages so must evaluation measures. Crompton (2004) contended that the further
along the communication process an evaluation takes place, the stronger the evidence of
sponsorship contributing to sales. O‘Reilly and Madill (2009) supported the need for evaluation
measures that are better grounded in an understanding of sponsorship; ―The evaluation of the
tactic, in many cases, is framed using evaluation techniques from advertising and not techniques
developed based on the uniqueness and reality of sponsorship‖ (p.227).
Steyn (2009) drew further attention to the insufficiency of traditional advertising measurement in
the new digital era. Steyn (2009) recommended that sponsors monitor on-line consumer
engagement and suggested that brand recommendations ―could be the ultimate yardstick for
measuring sponsorship effectiveness in the digital age‖ (p.324). Meenaghan et al. (2013)
recently recommended buzz monitoring (i.e., mentions online), sentiment analysis (i.e., mining
of online opinions and attitudes), and engagement metrics (i.e., social media likes, followers, and
fans) as viable approaches to measure online sponsorship effectiveness.

33
Although challenges remain, the grey area of sponsorship evaluation is becoming clearer and is
continuing to draw needed academic and practitioner attention. Metrics must align with
objectives which are evolving to the behavioural stages of the consumer adoption process and
evaluation must be ―rigorous, independent, and credible‖ (Meenaghan et al., 2013).
2.1.3 Sponsorship Effects
Studies have highlighted the need for further research on consumer response to sponsorship
(Gwinner et al., 2009; Koo, Quarterman, & Flynn, 2006; McDaniel, 1999; Speed & Thompson,
2000). Over sixty articles pertaining to various aspects of sponsorship effects were reviewed to
gain an understanding of current knowledge and directions for future research. The primary
theoretical foundation for this line of discovery is the hierarchy of effects model that was
originally inspired by classical psychology and developed by Lavidge and Steiner (1961) to
predict advertising effects. This model was selected as it reflects the reality that communication
efforts (such as advertising and sponsorship) are rarely capable of producing immediate sales but
rather move the consumer through a series of stages that ideally lead to eventual purchase.
According to this model (Lavidge & Steiner, 1961), consumers begin their path to purchase at
the cognitive level, where awareness and knowledge is first required. This is commonly
referred to as the thinking stage. A deeper psychological connection is then formed at the
affective stage of the model where consumers progress to a state of liking or preference for the
brand. This second stage is commonly referred to as the feeling or emotional stage. And finally,
the conative (or behavioural) stage secures consumer conviction and ultimately purchase. This is
the do level. Lavidge and Steiner (1961) also pointed out that the pace at which consumers
progress through these stages can be impacted by the level of product involvement (for instance
products with high economic or psychological risk may demand longer processing) as well

34
individual consumer‘s involvement levels (such as brand knowledge, attitudes, beliefs, feelings,
and experiences). As will be discussed later in this review, gender can also impact this process
and is a key variable in this dissertation.
Several variations of the theory of hierarchy of effects have been proposed in the context of
sponsorship however the fundamental premise of Lavidge and Steiner (1961) has been
preserved. For instance, Speed and Thompson (2000) applied a classical conditioning
framework to determine consumer response to sponsorship at three similar levels: interest,
favourability and use. In this treatment, the level of consumer response (i.e., interest,
favourability, use) was proposed to be dependent on consumers‘ attitudes toward the sponsored
event (i.e., unconditioned stimulus); prior attitudes toward the sponsor (i.e., conditioned
stimulus), and the perception of congruence between the event and sponsor (Speed & Thompson,
2000). Meenaghan (2001b) modeled sponsorship response as a progression through the
following stages: awareness, favourable disposition, transfer of image value, intent to purchase,
and actual purchase. More recently, Alexandris and Tsiotsou (2012) captured the psychological
connection between sports fans and their teams in an alternate hierarchy of effects sequence that
is initiated through affection and then progresses through stages of cognition and eventual
conation. The hierarchy of effects model has been well adopted in the more recent sponsorship
literature as a means of assessing consumer response (Alay, 2008, 2010; Chanavat et al., 2009;
Mason, 2005; Poon & Prendergast, 2006; Prendergast, Poon, & West, 2010; Sozer & Vardar,
2009; Speed & Thompson, 2000; Alexandris & Tsiotsou, 2012).
Favourable consumer response is influenced by strong brand equity. Brand equity is an important
construct in marketing as it reflects both the financial worth of a brand (i.e., market performance)
as well as marketing productivity and consumer impact (Keller, 1993). Keller (1993) explained

35
that consumer-based brand equity is the differential effect of brand knowledge (derived through
awareness and image associations) on consumer response (manifested through perceptions,
preferences and behaviour) arising from marketing mix activity. In support of this definition,
Keller (1993) stated that; ―Perhaps a firm‘s most valuable asset for improving marketing
productivity is the knowledge that has been created about the brand in consumers‘ minds‖ (p.2).
Aaker (1996) identified the four dimensions of brand equity (that are most prominent in the
literature) as: i) brand awareness, ii) brand associations, iii) perceived quality, and iv) brand
loyalty. Cornwell, Pruitt, and Van Ness (2001) distinguished between ―general brand equity
elements‖ (p.42) (which consist of brand awareness, brand image and corporate image) and
―distinctive brand equity elements‖ (p.42) (which they consider to be brand personality,
differentiation, perceived quality and loyalty). This study by Cornwell et al. (2001) contributed
that corporate sponsorship managers perceived sponsorship to contribute more to general brand
equity (i.e., the cognitive dimension) than distinct brand equity (i.e., the affective and
behavioural dimensions). Ross, Russel, and Bang (2008) approached brand equity from a sport
service (versus product) perspective and introduced the spectator-based brand equity (SBBE)
model. A sample of professional basketball fans was used to empirically support this model that
demonstrated that brand associations and brand awareness are relevant constructs in assessing
SBBE. These various dimensions of brand equity are integrated into the different stages of the
hierarchy of effects model.
Based on the examined literature, Figure 3 was developed to visually capture an understanding
of this hierarchy of effects model in the broader context of sponsorship and to guide the
following discussion of the sponsorship effects literature. This framework emphasizes the
importance of personal consumer (or fan) involvement as a mediating influence on consumer

36
processing of sponsorship. Involvement is represented as a construct capable of impacting
perceptions of fit and the transfer of images as well as all levels of consumer response. The
concept of image transfer is highlighted as a key sponsorship principle that also shapes consumer
response. The common measures of consumer effect are listed for each of the cognitive,
affective, and behavioural stages and the alternate paths of consumer behaviour (i.e., cognitive,
affective, behavioural versus affective, cognitive, behaviour) are represented by the directional
arrows. Each of these elements is examined next.
Figure 3: Sponsorship Effects - Framework of Understanding
2.1.3.1 Cognitive Effects of Sponsorship
Consumer knowledge relates to the familiarity, experience, expertise, and use of a product or
service and, as such, is an important foundation in consumer response to marketing activities
(Lacey, Close, & Finney, 2010). The cognitive stage is about getting brand messages into the

37
minds of targeted consumers. This is accomplished through awareness (commonly measured as
recall and recognition), perceived quality and associations. In a sponsorship environment,
cognitive effects are most influenced by the transfer of images between affiliates of sponsorship.
As shown in Table 4, most sponsorship initiatives seek some form of image-related outcome.
Keller (1993) defined brand image as ―the set of associations linked to the brand that consumers
hold in memory‖ (p.2). Memory and the retrieval of information is fundamental in
understanding how consumers respond to sponsorship programs and how images are created,
enhanced and transferred in the cognitive stage of consumer processing. A theoretical
foundation for understanding image transfer is the associative network memory model theory.
Based on the collective explanations and sponsorship applications of the associative network
memory model theory from various authors (Chanavat et al., 2010; Chien et al., 2011; Gwinner
et al., 2009; Gwinner & Bennett, 2008; Keller, 1993), the following understanding of this theory
is presented. The associative network memory model applied to sponsorship views brand
knowledge as a set of nodes and links in consumers‘ minds. These many nodes store the
sponsor‘s brand information and are connected with links of varying strengths. High brand
knowledge and relatedness for instance would strengthen the link (or association) between the
sponsor‘s network of nodes occupied in the consumer‘s mind. A node is activated from either an
internal drive (such as thirst) or an external stimulus (such as a strategically placed vending
machine). A strong link will ignite spreading activation whereby other nodes will be retrieved in
a connect-the-dots manner. The challenge for marketers at this cognitive stage is to create
meaningful nodes with strong links in the minds of their targeted consumers in order to develop
strong awareness and relevant associations.

38
In sponsorship marketing, image transfer takes place when a sponsor becomes linked with a
property (event, athlete, cause, etc.) and some of the associations inherent to this property
transfer back to the sponsor (Keller, 1993; Grohs & Reisinger, 2005; Gwinner & Eaton, 1999;
Gwinner et al., 2009). Meenaghan (2001b) referred to this process as the rub-off or halo effect
while Hickman and Lawrence (2010) introduced the notion of the ―pitchfork effect‖ to illustrate
that the image transferred can be either positive or negative. Meenaghan et al. (2013) referred to
Tiger Woods and Lance Armstrong as examples of athlete scandals that have generated negative
images for affiliated organizations. The main consideration in understanding image transfer is
the perceived degree of congruency (also referred to throughout the literature as fit, match,
relatedness, relevance, cohesiveness and similarity) between the joined entities (Fleck & Quester,
2007; Olson & Thjomoe, 2011).
Congruency theory (or match-up hypothesis) proposes that sponsorship is most effective when
the image of the sponsor matches the image of the sponsored property (Gwinner & Eaton, 1999;
McDaniel, 1999). Fleck and Quester (2007) believe that some things naturally go well together
while others clash and they related congruency to the old adage ―birds of a feather flock
together‖ (p.975). Fleck and Quester (2007) suggested that congruence is a two-dimensional
construct that involves expectancy and relevancy. In this context, relevancy considers the
sensibility of the sponsored association as perceived by the target market and was explained as
―the degree to which the information contained in the stimulus favours (or hinders) the
identification of the theme or message being communicated‖ (Fleck & Quester, 2007, p.976).
Expectancy takes into account the element of surprise and was explained as ―the degree to which
an item or information falls into a predetermined schema or a structure evoked by the theme‖
(Fleck & Quester, 2007, p.976). According to Fleck and Quester (2007) then, an association that

39
is highly relevant and expected is congruent, while perceptions of unexpectedness and
irrelevance renders an association incongruent. There are however different manners in which a
match can materialize. McDonald (1991) presented the concept of direct (sponsor‘s products are
directly used in the event) and indirect (image related) sponsorship relevance. In a similar
application, Gwinner (1997) discussed functional based (sponsored brand is used during the
event) and image based (image of event is related to image of brand) similarities. An example of
a direct or functional sponsorship is a tire or oil company sponsoring a car racing event while an
indirect or image-based match could take place if a luxury car brand sponsors a prestigious golf
tournament.
A significant body of research confirms that a strong sponsor-sponsee fit (either function or
image-based) will result in the most effective image transfer and sponsor recognition (Chien et
al., 2011; Deane, Smith, & Adams, 2003; Donahay & Rosenberger, 2007; Fleck & Quester,
2007; Grohs et al., 2004; Grohs & Reisinger, 2005; Gwinner & Bennett, 2008; Gwinner &
Eaton, 1999; Johar & Pham, 1999; Koo et al., 2006; McDaniel, 1999; Sozer & Vardar, 2009;
Speed & Thompson, 2000). Prendergast et al. (2010) are cautious of confused image transfer
and believe that the best type of fit is dependent on the product/service category. Their study
found that sponsors of thinking products (which involve more rational processing) benefit further
from a functional match whereas feeling products (which tend to be more emotionally
influenced) generate more powerful effects on brand attitude with an image-based match.
Telecommunications, airlines, and courier services were offered as examples of thinking
products while hotels, resorts, and fine dining restaurants were regarded as feeling products
(Prendergast et al., 2010). There is also strong support for the proposition that low congruency
can be mitigated by articulating (through promotional communication) the fit to the intended

40
audience (Coppetti, Wentzel, Tomczak, & Henkel, 2009; Olson & Thjomoe, 2011; Sozer &
Vardar, 2009). In other words, if the fit is not natural, it can be created through effective
sponsorship activation. As an example, a locksmith sponsoring a hockey game may not be
considered as a natural or obvious fit. By integrating sponsor messaging into the game, a
relevant connection can be presented. In this example, when a player must serve a penalty, the
game announcer can state ―lock them up with X Locksmithing‖ as the player enters the penalty
box.
The proposition that a moderate degree of incongruity (which involves more effortful processing
and possible cognitive arousal) can be equally effective in generating positive cognitive
sponsorship response is also supported, albeit to a much lesser extent (Jagre, Watson, & Watson,
2001; Speed & Thompson, 2000). Koo et al. (2006) provided the following perspective:
―Despite the research of those who support schema incongruity as the more effective means of
stimulating affect, more research has supported the alternative position that schema congruency
results in stronger affect on consumer behaviours‖ (p.82).
Thus far, the idea of image congruence has been constructed according to the perceived fit
between the sponsor and the event (or other sponsored property). Prendergast et al. (2010)
identified another dimension of congruity; consumer self-congruity. Prendergast et al. (2010)
referenced Arnett, German, and Hunt (2003) in explaining that; ―when consumers are involved
with a sponsored event and identify with this, this self-identification can lead to a strong sense of
attachment with the sponsored brand‖ (p.214). In understanding consumer effects of sponsorship
it is therefore essential to extend consideration beyond simply the sponsor-sponsee relationship
to include any relevant consumer dimensions that can impact the processing of these efforts.

41
Personal involvement with a sponsored property (e.g., sport, athlete, event, cause, etc.) can
influence consumers‘ response to sponsorship efforts. Involvement reflects personal relevance
and was explained by Hajjat (2003) as ―the degree of consumer engagement in different aspects
of the consumption episode and is considered to have a primary influence on consumer
response‖ (p.96). Involvement can materialize through personal relevance with a product or
service, a response, or a particular issue such as a cause, event, or sport (Hajjat, 2003). Petty and
Cacioppo (1979) found that increased involvement amplified the importance of message content
in producing either positive or negative persuasion. In examining the role of involvement and
donation on cause-related marketing outcomes, Hajjat (2003) applied two routes of persuasion
suggested by Petty and Cacioppo (1983): the central and peripheral routes. This understanding
of persuasion suggests that highly involved individuals engage in more elaborate processing and
carefully scrutinize all relevant information. In contrast, low involvement individuals perceive
less relevance and are therefore less likely to invest much effort into processing messages and
instead rely on a collection of peripheral cues to form a more general opinion.
Meenaghan (2001b) extended this concept to sports fans by defining fan involvement as ―the
extent to which consumers identify with and are motivated by, their engagement and affiliation
with particular leisure activities‖ (p.106). There is a mounting trend toward leveraging consumer
emotions and passion points as a pathway to engagement (Bal et al., 2009; Cahill & Meenaghan,
2013; Close et al., 2006; Meenaghan et al., 2013). Pham (1992) however found that high
emotion can lead to poorer memorization since highly involved fans process game related
activities more intensely and are therefore more likely to recognize sponsors but only to a certain
point. These same fans prioritize viewing of the game and will reach a point where game
concentration will supersede sponsor activity thereby creating a curvilinear effect on sponsorship

42
recognition. This phenomenon is referred to as the intensity principle and was also revealed in an
investigation of Super Bowl viewers by Pavelchak, Antil, and Munch (1988). In this study, the
intense emotion of the Super Bowl had a greater impact on viewers than did any advertising
efforts. Pavelchak et al. (1988) concluded that ―program induced arousal and polarization lead to
reduced ad recall‖ (p.365). In a similar context, Pham‘s (1992) study also found that arousal has
a negative effect on sponsor recognition as an overload of processing demands favoured game
details over sponsor messaging. Several studies however have in fact established a positive
relationship between event (or sport, team, cause, etc.) involvement and sponsor recall (Grohs et
al., 2004; Grohs & Reisinger, 2005; Madrigal, 2001), while other studies have found that
involvement effects extend from the cognitive straight through to the behavioural stages
(Alexandris & Tsiotsou, 2012; Cahill & Meenaghan, 2013; Close et al., 2006; Gwinner &
Bennett, 2008; Gwinner et al., 2009; Ko, Kim, Claussen, & Kim, 2008; Lings & Owen, 2007;
Meenaghan, 2001b). This moderating role of involvement on behavioural responses to
marketing stimuli (such as sponsorship) is an important consideration.
2.1.3.2 Affective and Behavioural Effects of Sponsorship
Table 5 summarizes (in chronological order) the cognitive, affective and behavioural effect
findings from thirty-three sponsorship studies. Although the majority of early findings support
lower-order sponsorship effects, there is growing evidence that sponsorship can also impact
consumers on both the emotional and behavioural levels (Bal et al., 2009; Cahill & Meenaghan,
2013; Close et al., 2006; Gwinner & Bennett, 2008; Gwinner et al., 2009; Ko et al., 2008; Koo et
al., 2006; Lings & Owen, 2007; McDaniel, 1999; Madrigal, 2001; Meenaghan, 2001b; O‘Keeffe
& Zawadzka, 2011; O‘Reilly, Lyberger, McCarthy, Seguin, & Nadeau, 2008; Pope & Voges,

43
2000; Prendergast, 2010; Sneath et al., 2005; Speed & Thompson, 2000; Tsiotsou & Alexandris,
2009).
In describing the lower-order perspective, Prendergast et al. (2010, citing Koffka, 1935) applied
the Gestalt concept of perceptual figure and ground to sponsorship. The authors explained that;
More often than not the sponsorship arrangement is the ground and the event is the
figure. Being the ground, sponsorship does not involve higher-order processing from
observers of the event, and so it is more likely to achieve affective rather than
behavioural objectives. (Prendergast et al., 2010, p.216).
Prendergast et al. (2010) proceeded, however, to report that an image match for a fine dining
restaurant (i.e., a feeling service) had a positive influence on purchase intention and that the
traditional think-feel-act order of effects can be altered in emotional buying situations to a feel-
think-act order. Alexandris and Tsiotsou (2012) supported this alternative path of effects in a
study that highlighted the significance of activity involvement and team attachment (affect) on
behavioural intentions (conation) directly and indirectly through sponsor image and attitude
toward sponsorship (cognition). Bal et al. (2009) also contended that the intense drama potential
of sports can move consumers to an affective state and provide sponsors with an experiential
platform upon which to engage consumers. As will be supported in the following review of
sponsorship leveraging strategies, creative and interactive activation is elevating sponsorship to
the forefront of events and propelling consumers through all effective stages.
The studies noted in Table 5 substantiate sponsorship as a powerful promotional tool capable of
engaging and influencing consumer behaviour at all levels of effect. The influence of
involvement (or identification), fit, sincerity, activation, and attitudes towards the events and

44
sponsors are all noted in this summary of sponsorship effects as is the more recent observation of
emotional and online consumer engagement.
Table 5: Summary of Cognitive, Affective and Behavioural Effects Studies
Findings
Author(s)
(Year) Cognitive
Stage
Affective
Stage
Behavioural
Stage
Pham
(1992)
Involvement has a
curvilinear effect on
sponsor recall. Arousal
has a negative effect on
recognition. Pleasure
has no effect on
recognition.
Gwinner & Eaton
(1999)
When event and brand
are matched on an
image or functional
basis, image transfer is
enhanced.
Johar & Pham
(1999) Sponsor identification is
biased toward brands
that are prominent in the
marketplace and
semantically related to
the event.
Pope & Voges
(2000)
Corporate image and the
belief that a company
sponsors a sport(s)
significantly influence
purchase intention
whereas prior brand use
has no effect on
purchase intention.
Speed & Thompson
(2000)
-Sponsor-event fit has a positive influence on consumer response to
sponsorship.
-Positive interaction between fit and personal event liking.
-Perceived sincerity, perceived ubiquity and a positive attitude toward sponsor
generate favourable consumer response.
-High fit and high event status can have a negative impact on perceived
sincerity (as perceived ubiquity increases) and unfavourable consumer

45
response.
Jagre, Watson, &
Watson (2001)
Propose that a
moderately inconsistent
fit will be viewed more
favourably as more
elaborate processing
increases arousal and
recall.
Madrigal
(2001)
Team identification has
a positive effect on
attitude toward
sponsors.
The strength and
favorability of the
association between a
sponsor and a property
influences intentions to
purchase the sponsor‘s
products.
Meenaghan
(2001)
Degree of involvement
and level of knowledge
determine ability to
perceive congruence
and transfer image.
Positive emotional
orientation (―halo of
goodwill‖) toward a
sponsor who supports
an activity in which the
consumer is heavily
involved.
Highly involved fans
develop a level of
gratitude that leads to
purchase intention for
low-involvement
purchases.
Deane, Smith, & Adams
(2003)
Strong perceived fit will
enhance image transfer.
Grohs, Wagner, &
Vsetecka
(2004)
Event-sponsor fit, event
involvement and
exposure, effect sponsor
recall and image
transfer.
Pitts & Slattery
(2004)
Sponsorship advertising
increased post-season
recognition rates.
No intention to purchase
sponsors‘ products.
Grohs & Reisinger
(2005)
Event-sponsor fit has a
positive impact on
image transfer.
Event involvement also
impacts (to lesser
extent) image transfer.
Sneath, Finney, & Close
(2005)
Event sponsorship leads
to favourable
perceptions of a
Personal interaction
with the sponsor‘s
products during the
After experiencing the
sponsored event,
consumers are more

46
sponsoring firm and its
brands.
event enhanced the
brand‘s personality.
likely to consider
purchasing the
sponsored products.
Close, Finney, Lacey, &
Sneath
(2006)
An attendee‘s
enthusiasm and
activeness in the
sport/event being
sponsored, along with
knowledge of the
sponsor‘s product
positively influences the
desire that the sponsor
be involved in the event.
Event involvement
generates positive brand
opinions.
A better opinion of the
sponsor contributes to
increased intentions to
purchase the sponsor‘s
products.
Koo, Quarterman, &
Flynn
(2006)
High fit group had more
positive image and
higher recognition.
High fit group had more
positive brand attitudes.
Cognitive and effective
responses positively
impact purchase
intention.
Donahay & Risenberger
(2007)
Sponsors need a
functional similarity in
order to maximize
sponsorship.
Highly involved fans
are more responsive.
Fleck & Quester
(2007)
Fit is based on
expectancy and
relevancy. Seek to
surprise with otherwise
relevant associations.
Lings & Owen
(2007)
The greater the
identification with the
sponsored team, the
greater the intention to
purchase sponsors‘
products.
Team success will
moderate team
identification and
purchase intention.
Gwinner & Bennett
(2008)
Brand cohesiveness
leads to greater brand
knowledge and ability
to see event-sponsor fit.
Highly identified fans
modify their thinking to
more easily find fit.
Fit impacts attitude
toward the sponsor.
Positive brand attitude
influences purchase
intentions.

47
Ko, , Kim, Claussen, &
Kim (2008)
Consumer involvement
has a direct positive
effect on awareness,
image, and purchase
intention. Sponsorship
awareness has a direct
effect on corporate
image.
Consumer involvement
has a direct effect on
purchase intention.
Sponsorship awareness
and purchase intention
is mediated by corporate
image.
O‘Reilly, Lyberger,
McCarthy, Seguin, &
Nadeau
(2008)
Super Bowl promotions
have a moderate affect
on purchase intention.
Bal, Quester, & Plewa
(2009)
Sponsors who
implement emotional
activation will perform
better in terms of
recognition…
attitude toward the
brand, and…
purchase likelihood.
Coppetti, Wentzel,
Tomczak, & Henkel
(2009)
Negative effects of low
congruency can be
mitigated through
articulation and
audience participation.
Gwinner, Larson, &
Swanson
(2009)
High levels of team
involvement and strong
perceived fit lead to
higher levels of image
transfer.
Higher perceptions of
image transfer are
associated with higher
levels of purchase
intention.
Pope, Voges, & Brown
(2009)
Sponsorship
announcements
immediately ―spill over‖
to perceived brand
quality and corporate
image while longer term
team performance spills
over to perceived
quality but not image.
Sozer & Vardar
(2009)
Sponsorship produces
positive effect for the
cognitive dimensions of
brand equity
(awareness, perceived
quality) if there is; i)
active sponsor
participation; ii)
perceived congruence;
and iii) positive attitude

48
toward the sponsor
brand.
Tsiotsou & Alexandris
(2009)
Highly attached fans are
more likely to develop a
positive image for team
sponsors.
Highly attached fans
with a positive sponsor
image will exhibit
higher intentions to
purchase sponsors‘
products and generate
positive word-of-mouth.
Prendergast, Poon, &
West
(2010)
For thinking services
(e.g. courier), a
functional match will
effect brand attitude
whereas an image match
will not.
For feeling products
(e.g. fine restaurant) an
image match is more
powerful on brand
attitude than a
functional match.
For thinking services,
congruency (neither
functional nor image)
does not impact
purchase intention.
{think, feel, act}
For feeling services, an
image match has a
positive influence on
purchase intention.
{feel-think-act}
Chien, Cornwell, &
Pappu (2011)
Sponsorship category
relatedness leads to
higher brand meaning,
consistency and clarity
than categorically
unrelated sponsorship.
O‘Keeffe & Zawadzka
(2011)
Team sponsorship
creates positive
associations with team
fans, fans of the sport
and competitor fans.
If all else is equal (price,
quality, value), core
fans will support
sponsors through
purchase.
Olson & Thjomoe
(2011)
Perceptions of fit are
based on i) use of
sponsor‘s products by
event participants; ii)
match between
sponsor‘s target market
and event audience, and
iii) attitude similarities
(equal liking for both
sponsor and sponsored).
Poor ―natural‖ fit can be

49
partially overcome with
effective articulation.
Alexandris & Tsiotsou
(2012)
Team attachment is
positively related to
sponsor image and
attitudes toward
sponsorship (stage 2)
Involvement is
positively related to
team attachment (stage
1).
Team attachment,
sponsor image and
attitudes toward
sponsorship all
positively influence
consumer behavioral
intentions (stage 3).
Cahill & Meenaghan
(2013)
In order to meaningfully
differentiate a brand,
sponsors should connect
with consumers through
areas of passion in their
lives (e.g., sport, music).
Sentiment analysis can
be used to measure
consumer feelings
toward a brand and
sponsorship activation.
Encourage consumers to
participate in
sponsorship programs
by developing
innovative activation
programs that spur
brand conversations,
recommendations, and
engagement.
Social media
conversations can assist
in measuring
sponsorship
performance.
2.1.4 Strategic Use of Sponsorship: Strategies and Counter Strategies
The final stream of sponsorship knowledge involves sponsorship activation (also referred to as
leverage) as well as the counter strategy known as ambush marketing.
2.1.4.1 Sponsorship Activation/ Leverage
IEG defines activation (or leverage) as ―the marketing activities that a company conducts to
promote its sponsorship‖ (IEG Lexicon and Glossary, para 1) and they specify that the money
spent on activation is over and above the rights fee paid to the sponsored property (IEG, 2010).
Papadimitriou and Apostolopoulou (2009) adopted a similar interpretation and added
sponsorship ―exploitation‖ (p.91) as a third term used along with activation and leverage.
Cornwell (1995) defined sponsorship-linked marketing as ―the orchestration and implementation
50
of marketing activities for the purpose of building and communicating an association to a
sponsorship‖ (p.15). This characterization pushes sponsorship beyond mere association to also
encompass the incremental marketing activity required to promote such investments. Weeks,
Cornwell, and Drennan (2008) provided a more granular view of sponsorship activation by
distinguishing between activational communication and nonactivational communication. In this
sense, activational communications such as event-related sweepstakes, contests or websites
―promote the engagement, involvement, or participation of the sponsorship audience with the
sponsor‖ while nonactivational communications such as on-site signage and sponsor name
mentions are more ―passively processed by the sponsorship audience‖ (Weeks et al., 2008,
p.639). The basic premise throughout these definitions of activation is the act of bringing target
market awareness to acquired sponsorship rights.
There is widespread belief that sponsorship without any form of activation is of little value and
that it is essential to invest additional resources in order to realize the full potential of
sponsorship marketing (Cornwell & Maignan, 1998; Crimmins & Horn, 1996; DeGaris et al.,
2009; O‘Reilly & Lafrance Horning, 2013; Papadimitriou & Apostolopoulou; 2009; Quester &
Thompson; 2001; Sylvestre & Moutinho, 2007; Weeks et al., 2008). Crimmins and Horn (1996)
directly stated that: ―If the brand cannot afford to spend to communicate its sponsorship, then the
brand cannot afford sponsorship at all‖ (p.16). Without added effort to bring recognition to a
sponsorship property, a sponsor can only hope that their target will notice them and
independently make the necessary connection. This is a risky proposition. Some of the top
scholars in marketing have included aspects of activation in their definitions of sponsorship. For
example, Cornwell and Maignan (1998, p. 12) emphasized the need for activation in providing
this view on sponsorship:

51
On the basis of the definitions found in the literature, we propose that sponsorship
involves two main activities: (1) an exchange between a sponsor and a sponsee
whereby the latter receives a fee and the former obtains the right to associate itself
with the activity sponsored, and (2) the marketing of the association by the
sponsor. Both activities are necessary if the sponsorship fee is to be a meaningful
investment.
Effective activation can assist in the realization of specific sponsorship goals (e.g., awareness,
favourability, image, consumer engagement, sales), can strengthen sponsor differentiation and
can help brands breakthrough increased promotional clutter (Cornwell et al., 2001; DeGaris et
al., 2009; O‘Keefe, Titlebaum & Hill, 2009; Quester & Thompson, 2001; Papadimitriou &
Apostolopoulou; 2009; Sylvestre & Moutinho, 2007). Fortunato (2013) added that activation
programs can also include social responsibility initiatives to further assist corporations in
reaching their objectives (in particular image enhancement).
The benefits of activation are well recognized but the ideal cost of activation is more obscure.
Several researchers suggest that proficient sponsors will at minimum match their sponsorship
investment with similar sums dedicated to adequate activation (Farrelly et al., 1997; Meenaghan,
1991; Quester & Thompson, 2001; Seguin & O‘Reilly, 2007; Séguin, Teed, & O‘Reilly, 2005).
The ratio of expenditures to activation is known as the activation ratio and has been reportedly
increasing in conjunction with the growth of sponsorship. According to IEG data, in 2001
sponsors expected to spend $1.20 on activation activities for every dollar spent on sponsorship
fees, a 1.2:1 ratio. In 2012, this estimation of the activation ratio increased to 1.7:1 (IEG, 2013).
The CSLS observed lower activation levels in Canada, however also indicated significant growth
from a 0.57:1 ratio in 2011 to a ratio of 0.75:1 in 2012 (O‘Reilly & Beslet, 2013). In Canada

52
therefore, for every dollar spent on sponsorship, an additional .75 is invested in promoting this
association. A very wide range of activation ratios are observed in practice and throughout the
literature; from 0:1 to 8:1 (Chadwick & Thwaites, 2004; Davies & Tsiantas, 2008; Farrelly et al.,
1997; O‘Keefe et al., 2009; Quester & Thompson, 2001; Seguin & O‘Reilly, 2007). Activation
ratios in the range of 1-2:1 are most common and appear to be acceptable by industry standards
(Farrelly et al., 2007; IEG, 2013; O‘Keefe et al., 2009; Séguin & O‘Reilly, 2007).
Although the activation investment level is a key consideration, how that money is spent is of
equal importance. Cornwell et al. (2005) stated that ―both the weight and the nature of
leveraging activities are central to communication efforts achieved in sponsorship‖ (p.36). There
are countless ways that a sponsor can activate their acquired rights in order to maximize
sponsorship outcomes. These range from mass awareness efforts such as advertising and public
relations, to event signage, sampling, hospitality, retail sales programs, and various on-line and
digital promotions. The only limitations appear to be the extent of creativity and resources that
an organization is able or willing to exert in developing activation programs. Table 6 summarizes
common sponsorship activation tactics referred to throughout the reviewed sponsorship
literature.
Table 6: Summary of Sponsorship Activation Methods
Advertising (TV, Radio, Magazines, Newspaper,
Brochures, Outdoor)
Digital/Social/Mobile Media
PR/Media Coverage On-Line Campaigns (Websites, Blogs)
Signage/Logo Placement/Banners/PA Announcements
/Logo on Scoreboard or Uniforms
On-Site Hospitality/Events/Client Entertainment
/ VIP Passes
In-Store Displays /Point-of-Sales Promotion/ Coupons Off-Site Events
Samples / Product-Event Integration/ Product
Demonstrations
Sponsorship Tie-In Promotions

53
On-Pack Signage / Company Vehicle Signage Direct Marketing
Licensing / Merchandise Business-to-Business Communication
Giveaways/Contests/Sweepstakes/Games/
Memorabilia/Premiums
Internal Marketing/Employee Programs
Player Sponsorship / Meet & Greets / Product Use New Products/Services
On-Site Personnel/ Research / Consumer Interaction Cause-Related Tie-Ins
Event-Based Distribution
Most sponsors implement a multi-method approach that is fully integrated with all other
elements of their marketing communication program (Ladousse, 2009; O‘Keeffe et al., 2009;
Papadimitriou & Apostolopoulou, 2009; Sneath et al., 2005). IEG (2013) reported that public
relations and social media are the two most popular forms of leverage (used by 89% and 88% of
the sample respectively), followed closely by internal communications (86%), hospitality (81%),
traditional advertising (77%), online promotions (69%), business-to-business communications
(60%), on-site sampling (51%), direct marketing (48%) and sales promotions (32%). Most
recent trends in activation include digital, mobile and on-line mediums. Sponsor websites and
social media are offering an alternative means of connecting with and engaging sponsorship
audiences (Cahill & Meenaghan, 2013; Meenaghan et al., 2013; O‘Keefe et al., 2009; Weeks et
al., 2008;). Online consumer engagement offers a reciprocal outlet of exchange as ―online social
media such as forums, wall-postings, instant messaging, tweets, blogs, vlogs, wikis, podcasts,
and product reviews, all play a vital role in broadcasting consumers‘ opinions and biases‖ (Steyn,
2009, p.318).
Davies and Tsiantas (2008) distinguished between high and low involvement brands in
recommending ideal leveraging strategies. By applying their Optimal Leveraging Activity
(OLA) model to six national sponsors of the Athens 2004 Olympic Games, they found that high

54
involvement brands (such as banks and airlines) spent more on activation and implemented
multiple activities in order to increase awareness, differentiate themselves and strengthen long-
term consumer relationships. Low involvement items (such as beverages and dairy products)
were more concerned with obtaining trial and as such, favoured the use of product integration,
distribution and point-of-sale promotions. In this case, quality leveraging was emphasized over
the mere quantity of activation spending.
Sylvestre and Moutinho (2007) directly linked business objectives and ideal leveraging
strategies. A case study of five corporate culture sponsors in the United Kingdom exposed
advertising and public relation programs as the ideal leveraging tactic for building brand
awareness. Personal selling and public relations were recommended to strengthen customer and
community relations (Sylvestre & Moutinho, 2007).
Recent investigations of activation strategies have revealed a shift from simple logo placement
and short-term awareness objectives to more experiential leveraging that seeks to connect with
targeted consumers and offers the ability to form long-term emotional ties through sponsorship
(Bal et al., 2009; Cahill & Meenaghan, 2013; Choi, Stotlar, & Park, 2006; Meenaghan et al.,
2013; O'Keefe et al., 2009; DeGaris et al., 2009). Choi et al. (2006) referred to more consumer-
oriented sponsorship activation and recommended that activation be elevated beyond ―one-
dimensional logo viewing‖ (p.72). Ladousse (2009) detailed Lenovo‘s global sponsorship of
Formula One and the Olympic Games. Although specific investment levels were not revealed,
Lenovo‘s extensive list of integrated activation techniques were described. These included
encompassing on-site hospitality, web initiatives, on-site programs and product integration,
advertising and public relations (Ladousse, 2009). Lenovo further raised the activation bar by
being the first ever sponsor to design the Olympic torch for the 2008 Beijing Games. According

55
to Ladousse (2009), Lenovo‘s efforts were rewarded with increased worldwide brand awareness
of 11 percentage points. NASCAR offers another high profile example of well integrated and
emotional sponsorship activation. NASCAR fans are well known for their support and loyalty to
their sport and sponsors alike. DeGaris et al. (2009) argued that regardless of favourable fan
attitudes, NASCAR sponsorships still require active promotion to generate awareness and
response to the sponsorship. The authors maintained that "sponsorship tie-ins possess emotional
equity among clearly defined target markets (e.g. NASCAR fans) which marketers can leverage
into more effective sales promotions‖ (DeGaris et al., 2009, p. 90).
Bal et al. (2009) compared the experiential activation platforms of four sponsors of the 2008
Australian Open. They found that the brand that activated with a full on-site spa with
complementary treatments and samples was most relevant to its target market and performed
best in terms of on-site recognition (92%), attitude towards the brand and purchase likelihood.
Bal et al. (2009) proposed that the emerging view of activation is to provide consumers with rich
emotional experiences; ―By offering them opportunities to meet their favourite athletes, a chance
to watch a game from the commentators‘ box, or even by partnering with broadcast replay
moments, sponsors can enter into a fundamentally affectively driven relationship with the event
audience‖ (p.375).
Sponsorship leveraged packaging (SLP) is another form of activation that has received very little
research focus. Woodside and Summers (2011) defined SLP as ―depicting the sponsored
property‘s image, logos or symbols on the sponsoring brand‘s packaging‖ (p.87). An example of
SLP is Coke including Olympic imagery on their products or a company affixing a pink-ribbon
image to their packaging when affiliated with a breast-cancer charity. Woodside and Summers
(2011) recently examined how consumers process SLP and found poor general recall. When the

56
sponsored property was cause-related (vs. sport) however, a positive impact on consumer
response was noted. This study concluded that response to SLP is directly impacted by the
choice of sponsorship property, brand loyalty, and other activation efforts by the sponsor.
Woodside and Summers (2011) also noted that SLP is different than cause-related marketing
(CRM). In the later, a contribution is made to the cause based on sales while in SLP the package
is a medium to promote awareness of the sponsorship (with no corresponding donation).
2.1.4.2 Ambush Marketing
Another broadly endorsed benefit of sponsorship activation is as a means of combating ambush
marketing (Burton & Chadwick, 2009; Crompton, 2004; Séguin et al., 2005; Shani & Sandler,
1998; Tripodi, 2001). Sandler and Shani (1989) defined ambush marketing as: ―…the efforts of
an organization to associate itself indirectly with an event in an effort to reap the same benefits
as an official sponsor‖ (p. 9). Seguin, Lyberger, O‘Reilly, and McCarthy (2005) described
ambush marketing as ―activities that lead to benefits without the cost‖ (p.217). Tripodi and
Hirons (2009) referred to ambush marketing as ―the cancer of sponsorship; an aggressive
strategy employed by firms to indirectly align themselves to an event (at the expense of official
sponsors), without purchasing the event‘s sponsorship rights‖ (p.121). Burton and Chadwick
(2009) highlighted the evolution of ambush marketing over the past 25 years in proposing a
renewed definition that offers a more neutral outlook of ambush marketing as a legitimate
alternative to sponsorship and a legitimate competitive practice:
―Ambush marketing is a form of associative marketing, utilized by an organization to
capitalise upon the awareness, attention, goodwill, and other benefits, generated by

57
having an association with an event or property, without that organization having an
official or direct connection to that event or property‖ (p.305).
Sandler and Shani (1989) emphasized that ambushing is typically well planned and funded and
shared well documented cases of ambushing such as Wendy‘s ambushing McDonald‘s during
the 1988 Winter Olympics as well as American Express targeting Visa, and Quality Inn attacking
Hilton. Tripodi and Hirons (2009) studied the leveraging strategies of three official sponsors of
the Sydney 2000 Olympic Games (Nike, Westpac Bank and Ansett Airline) as well as the impact
from competitive ambush tactics of three corresponding non-official sponsors (Adidas, National
Australian Bank and Quantas Airline). According to these researchers, all sponsors ―leveraged
their investment in a credible fashion to continuously remain in the public conscience‖ (Tripodi
& Hirons, 2009, p.133). Ambushers however were equally aggressive and committed significant
resources in an attempt to neutralize the impact of sponsors‘ efforts. Ambush tactics in these
cases were diverse and included such activities as athlete sponsorships, TV and outdoor
advertising, PR events, celebrity endorsements and event-related internet campaigns. In all three
cases, Tripodi and Hirons (2009) reported that the official sponsors‘ investment in activation
paid off in the form of superior recognition as official sponsors. As a result of their efforts, the
three ambushers also experienced increased awareness albeit at inferior levels than the sponsors.
An important finding from Tripodi and Hirons (2009) was the quick tail-off effect observed at
the end of the Games. Once activation activities were reduced (or ended) following the
Olympics, sponsorship awareness levels were ―quick to evaporate‖ (Tripodi & Hirons, 2009,
p.134). It is reasonable, therefore, to link activation activity to successful sponsorship
awareness. It was also evident through this study of three distinct product categories, that

58
leveraging strategies must adapt to different business scenarios. Factors such as competitive
pressures, market leadership, and past Olympic associations were all relevant in the choice of
activation programs as well as the recorded recognition levels throughout this study.
Most mega events rely heavily on sponsorship revenue. The success and profile of these events
draw interest from many companies who want to benefit from an association with these events,
however category exclusivity and rising sponsorship fees can restrict commercial access and
unintentionally encourage ambush marketing (Davis, 2012; Seguin et al., 2005; Tripodi &
Hirons, 2009). As Davis (2012) explained, ―Protecting official sponsors by policing the
activities of ambush (or stealth) marketers is a complex undertaking, and there are more holes
than there are plugs in the rules governing sponsor protection‖ (p.216). Davis (2012) proceeded
to list several examples of Olympic ambushers including: Kodak sponsoring the 1984 Olympic
TV broadcast (Fuji was an official sponsor), Nike sponsoring a news conference with the 1992
U.S. basketball team (Reebok was an official sponsor), a 1996 British sprinter who wore contact
lenses with Puma‘s logo on them (Reebok was the official sponsor), and MasterCard using
catering trucks to serve coffee around the 2010 Vancouver venues (Visa was the official
sponsor). Burton and Chadwick (2009) acknowledged that ambush efforts have evolved over
time, from predominantly broadcast campaigns and venue advertising, to more creative and
integrated associative marketing efforts.
Although these activities can be confusing to consumers, in most cases they are not illegal
(Grady, McKelvey, & Bernthal, 2010). Consumer perceptions of ambushers are mixed and for
companies that choose to implement such strategies, they consider this a legitimate form of

59
competitive marketing and are convinced that the benefits outweigh the potential risks and moral
implications (Burton & Chadwick, 2009). In a large study involving consumers from Canada,
France and the United States during the 2000 Olympic Games, Seguin et al. (2005) found that
the majority of consumers consider ambush marketing as unethical and are confused by
sponsorship clutter, often unable to properly distinguish between official sponsors and
ambushers.
In reviewing ambush marketing findings, Grady et al. (2010) recognized two types of ambush
marketing. The first simply involves an attempt to associate with a desirable event without
paying to be a sponsor. The second view of ambush marketing is more in line with the common
criticism of this practice. True to the common nature of the term ambushing, this second
understanding is a more aggressive approach that purposely intends to mislead the audience to
believe that the ambusher is in fact an official sponsor. There is ongoing debate as to whether
ambush marketing is a sound competitive strategy or an immoral business practice. Grady et al.
(2010) believe that past perceptions of ambush marketing as an unethical business practice are
shifting to less negative and more accepting views as an alternative to purchasing sponsorship
rights. Alternatively, reported consumer confusion and distain for this growing trend of
ambushing, is driving the development of anti-ambush strategies (Burton & Chadwick, 2009;
Seguin et al., 2005). Burton and Chadwick (2009) suggested that past counter-strategies have
been mainly reactive including ―name and shame‖ (p.310) public relations campaigns and legal
action. These reactive measures have been largely ineffective (and often benefit the ambusher
with added exposure) thus given rise to more proactive strategies such as creating competitive

60
marketing-free zones and adding broadcast to sponsorship packages to eliminate this common
opportunity for ambushers.
A further anti-ambush strategy is the enactment of event-specific legislation to deter ambush
attacks. The Olympic Games are among the most coveted sport properties and as such are also
the target of the most sophisticated ambushing efforts (Davis, 2012). Since the 2000 Sydney
Games, all Olympic host countries enact such legislation in an effort to protect official sponsors
and deter ambush attempts (Burton & Chadwick, 2009; Grady et al., 2010; Tripodi & Hirons,
2009). Grady et al. (2010) are critical of such legislation submitting that it favours the Olympic
movement and alienates local businesses by limiting commercial freedoms. Burton and
Chadwick (2009) are cautiously optimistic about this legislative movement however they
continue to advocate that the best defense against ambush marketing is a combination of
proactive strategies and effective sponsorship activation.
This first section of literature review has examined the main streams of sponsorship research.
Grounded in this broad understanding of sponsorship, the next section elaborates on the
emergence of charities and causes in the practice and study of sponsorship.
2.2 Cause and Cause-Related Sport Sponsorship
This section delves deeper into the various ways by which corporations associate with charitable
organizations and causes. Corporate goodness is first defined as the focus of this inquiry begins
to funnel towards the emerging area of cause-related sport sponsorship. Examples of the
increasing blending of sport and cause are detailed. The core sponsorship concepts reviewed in

61
the preceding section are extended here to cause sponsorship. While the basic premises remain
(such as objectives, fit, sincerity, involvement, activation and consumer effects), cause
associations entail a number of unique characteristics that are reviewed in this section.
2.2.1 Defining Corporate Goodness
North American companies invested close to $2 billion dollars in cause sponsorship in 2013
(IEG, 2014). This figure represents an increase in cause spending of 4.8% over 2012 and does
not take into account all of the other ways that companies partner with charitable causes. Along
with increased corporate investment there has been significant scholarly effort dedicated to
marketing promotions incorporating some form of social dimension. Consumers increasingly
expect and demand business organizations to demonstrate good corporate citizenship (Fortunato,
2013; Geue & Plewa, 2010; Hajjat, 2003; Roy & Graeff, 2003; Plewa & Quester, 2011;
Springfield, 2009; Watt, 2010). Pope (2010) referred to ―ethical consumerism‖ (p.244) and
maintained that strong evidence confirms that consumers want to buy ethical brands with shared
values. According to Pope (2010), consumers want brands to be transparent, accountable and
―committed to me‖ (p.244). Some sources propose that the terrorist attacks on the United States
on September 11th
, 2001 ignited a surge in philanthropic interest and activities (King, 2006;
Lachowetz & Gladden, 2003). Another common cited trigger for an increase in profit and non-
profit alliances is an observed decrease in public funding of non-profit organizations (Bernardo,
2011; Doherty & Murray, 2007; Taylor & Shanka, 2008). Regardless of the specific motives, it
is evident that goodness has become a requirement of marketing.
There are many ways that for-profit companies can engage in corporate goodness. Several terms
are introduced, applied and interrelated throughout the marketing and management literature.
Carrigan and Attalla (2001) noted that there is yet to be a definitive definition and agreed upon

62
understanding of what exactly is social responsibility of marketing. Corporate social
responsibility (CSR), corporate community involvement (CCI), philanthropy, strategic giving,
social marketing, cause marketing , cause-related marketing (CRM) and cause or social
sponsorship are all legitimate business practices for which the boundaries are becoming
increasingly blurred (Pharr & Lough, 2012; Pope, 2010). Table 7 presents the accepted
definitions of these principal forms of corporate social responsibility. Figure 4 was developed to
visually portray the relationships between these social business strategies and to guide this
presentation of reviewed literature.
Table 7: Definitions of Various Forms of Corporate Social Responsibility
Concept
/Terminology
Definition / Explanation
Corporate Social
Responsibility (CSR)
A management philosophy that recognizes that business and society are
interconnected and organizations need to give back and be accountable to
society. Managing companies in a socially responsible and ethical manner (Geue
& Plewa, 2010; Lacey, Close, & Finney, 2010; Pharr & Lough, 2012; Séguin,
Parent, & O‘Reilly, 2010)
Corporate
Community
Involvement (CCI)
―Umbrella term within which corporate philanthropy, sponsorship and cause-
related marketing are positioned‖ (Seitanidi & Ryan, 2007, p.247)
Corporate
Philanthropy
Donation to a cause with no, or little expected return (Polonsky & Speed, 2001;
Séguin, Parent, & O‘Reilly, 2010)
Strategic Charitable
Giving / Corporate
Social Investment
Giving with the intention of some form of return on donation. A means of
driving both profit and social welfare (Mullen, 1997; Polonsky & Speed, 2001;
King, 2006; Watt, 2010)
Social Marketing Direct strategy to demonstrate social responsibility and address social and health
related issues. Benefits of social marketing tend to be intangible (such as
improved health and reduction of disease) with a primary focus on behavioural
change that increases personal and/or social welfare while secondarily also
improving brand awareness, equity and loyalty for the supporting brand (Pharr &
Lough, 2012).
―The adaptation and adoption of commercial marketing activities, institutions

63
and processes as a means to induce behavioural change in a targeted audience on
a temporary or permanent basis to achieve a social goal (Dann, 2010, p.151).
Cause Marketing ―A business strategy that helps an organization stand for a social issue(s) to gain
significant bottom line and social impacts while making an emotional and
relevant connection to stakeholders‖ (Cone Inc. as cited in Washington & Miller,
2010, p.35).
Cause-Related
Marketing (CRM)
―The process of formulating and implementing marketing activities that are
characterized by an offer from the firm to contribute a specified amount to a
designated cause when customers engage in revenue-providing exchanges that
satisfy organizational and individual objectives‖ (Varadarajan & Menon, 1988,
p.60).
―An agreement between nonprofit and for-profit organizations to promote a
product that provides benefit for the cause through increasing awareness and
financial contributions from sales‖ (Harvey & Strahilevitz, 2009, p.26).
―…CRM campaigns try to persuade consumers to buy a certain product by
promising to donate something in return to a specific cause‖ (Hajjat, 2003, p.94).
―…conditional form of corporate giving‖ (Chang, 2012, p.318).
Benefits of CRM are focused primarily on the charity/cause and the business
partner while benefits to society are secondary (Pharr & Lough, 2012).
Cause-Related Sport
Marketing (CRSM)
Implementing CRM initiatives in the marketing of sport (Lachowetz & Gladden,
2003; Pharr & Lough, 2012).
Cause/Social
Sponsorship
Demonstrating CSR through sponsorship of social causes or environmental
issues (Geue & Plewa, 2010; Lacey et al., 2010).
Firm‘s donation to a cause is not dependent on company sales. The sponsorship
fee is paid at the beginning of the partnership and any consumer effect follows
sponsorship implementation and activation (Cornwell & Coote, 2005; Chang,
2012).
Cause-Related Sport
Sponsorship (CRSS)
Sponsorship that creates a mutually beneficial link between a sport event,
corporate sponsor, and benefitting charity (Lachowetz & Gladden, 2003; Irwin et
al., 2003).
Integration of CSR and sport sponsorship (Watt, 2010)
Virtually all participatory sports events are now linked to a charitable cause
(King, 2006; Watt, 2010).

64
CSR and CCI are umbrella terms that capture a corporate commitment to manage in a socially
responsible manner and to contribute to societal welfare (Geue & Plewa, 2010; Lacey, Close, &
Finney, 2010; Séguin, Parent, & O‘Reilly, 2010; Seitanidi & Ryan, 2007). Séguin et al. (2010)
offered an important distinction in highlighting that CSR is a business philosophy rather than
specific social action. These authors stated that CSR is ―the belief that an organization needs to
give back to society‖ (Séguin et al., 2010, p.205). This high level of commitment serves as an
important guide for more actionable corporate giving.
Corporate philanthropy is the purest form of giving as it involves an outright donation with no
expected commercial return (Polonsky & Speed, 2001; Séguin et al., 2010). Social marketing
adopts commercial marketing activities to influence behavioural change (such as increased
physical activity, decreased smoking, elimination of drinking and driving or driving and texting,
etc.) and improve personal or social welfare (Dann, 2010). Social marketing initiatives are
designed to benefit society and any corporate returns (such as improved awareness, image and
equity) are secondary (Pharr & Lough, 2012). Increasingly, social partnerships are evolving
Corporate Social Responsibility (CSR)/ Corporate Community Involvement (CCI)
Corporate
Philanthropy
Strategic Giving / Corporate Social Investment
Cause Marketing/Branding
Cause-Related
Marketing (CRM)
Cause /Social
Sponsorship
Cause-Related
Sport Sponsorship
(CRSS)
Social
Marketing
Cause-Related
Sport Marketing
(CRSM)
Figure 4: An Overview of the Various Forms of Corporate Social Responsibility (CSR)

65
from short-term campaigns into long-term strategic partnerships in order to serve the dual
purpose of business and society (Broderick, Jogi, & Garry, 2003; Seitanidi & Ryan, 2007).
When corporations seek tangible gain, giving becomes an investment rather than mere charity.
King (2001) suggested that most large corporations now employ business-driven approaches to
charitable contributions as they seek more tangible return.
Strategic giving can take the form of cause-related marketing (CRM) or cause sponsorship. A
widely cited definition of CRM originates from Varadarajan and Menon (1988) who describe
CRM as the ―process of formulating and implementing marketing activities that are characterized
by an offer from the firm to contribute a specified amount to a designated cause when customers
engage in revenue-providing exchanges that satisfy organizational and individual objectives‖
(p.60). Similarly, Hajjat (2003) explained that ―…CRM campaigns try to persuade consumers to
buy a certain product by promising to donate something in return to a specific cause‖ (p.94) and
Chang (2012) reinforced that CRM is a ―…conditional form of corporate giving‖ (p.318). King
(2001) referred to CRM as ―a new form of subsidized philanthropy‖ (p.116).
Cause sponsorship is different from CRM in that the sponsorship fee is paid prior to any
consumer-oriented promotion related to the cause. Consumer transactions are not a requirement
for charitable contribution nor do they influence the amount of the donation (Chang, 2012;
Polonsky & Speed, 2001). The sponsorship fee is normally paid well in advance in order to
make a cause-related event possible (Cornwell & Coote, 2005). In sponsorship, there are no
guaranteed sales but rather an onus on the part of the sponsor to activate these partnerships in a
manner that will have a positive effect on their targeted consumers (Geue & Plewa, 2010; Lacey
et al., 2010). In comparing consumer response to CRM versus cause sponsorship, Chang (2012)
found that consumers appreciate that both approaches contribute to society but that sponsorship

66
generates more positive attitudes as it is viewed as less sales and profit-oriented than CRM.
Chang (2012) believes that sponsorship is less risky than CRM stating that ―consumers hold
ambivalent attitudes towards CRM but positive attitudes towards sponsorship‖ (p.331). Plewa
and Quester (2011) also recognized the subtlety of sponsorship as a significant advantage over
CRM stating that sponsorship is ―often perceived as less commercially aggressive and faces less
consumer resistance and scepticism‖ (p.303). Polonsky and Speed (2001) suggested integrating
CRM and cause sponsorship to maximize consumer impact. Building on the contested notion
that sponsorship mainly influences lower order effects (such as awareness, image and attitudes)
while the conditional purchase requirement of CRM has a more profound impact on the
behaviour stage, Polonsky and Speed (2001) recommended that CRM be used to leverage
sponsorship activities. Implementing such a dual approach could therefore more effectively
move consumers through all levels of effect. Fortunato (2013) presented the case of MasterCard
and Major League Baseball (MLB) partnering in a cause-affiliated sponsorship involving the
charity Stand Up To Cancer. In this case, the sponsor (i.e., MasterCard) developed activation
programs (―Eat, Drink, and Be Generous‖ in 2011 and ―Dine and Be Generous‖ in 2012) where
donations were made to the affiliated charity (i.e., Stand Up To Cancer) when consumers used
their MasterCard when dining at restaurants. In addition to this CRM component, this
sponsorship also included an array of other activation programs such as advertising, celebrity
endorsements, stadium promotions, on-field presentations, and online and social media
initiatives.
As in the MLB example above, a quickly emerging area of CSR is the blending of cause and
sport in the form of either CRSM or CRSS. Sport has proven to positively contribute to society
while also serving as an effective vehicle for corporations to display their socially responsible

67
behaviour (Fortunato, 2013; Neale, Filo, & Funk, 2007; Smith & Westerbeek, 2007; Roy &
Graeff, 2003). Walker and Kent (2009) declared that the sport industry is ―a lens through which
to see the larger social perspectives of symbolism, identification, community, and sociability due
in part to the strong affective connection of sport fans‖ (p.746). Watt (2010) also championed
sport as the ―greatest social movement in the world today‖ and strongly promoted the enormous
―opportunity for sponsors to engage consumers and communities using their sport sponsorship
activities to further the cause of social development projects‖ (p.224). Roy (2011) stated that the
―unique characteristics of the sport industry make cause marketing participation compelling, if
not expected for sport organizations‖ (p. 21) while Watt (2010) supported industry predictions
that in the next decade no sponsorship deal will go through without some element of CSR.
Walker and Kent (2009) further portrayed the sport industry as the ideal setting for CSR given
the deep emotional connection that athletes, teams and events can have with local communities.
The sponsorship of local grassroots events is increasingly observed as the costs of elite (and
often saturated) properties rapidly rise and sponsors seek a stronger connection with local
audiences (Plewa & Quester, 2011).
CRSM is the application of CRM in the marketing of sport. As an example, Nike‘s Livestrong
program was a CRSM initiative as donations by Nike to the Lance Armstrong Foundation were
tied to consumer purchase of Livestrong merchandise such as apparel, shoes or equipment
(McGlone & Martin, 2006; Pharr & Lough, 2012). Cause-related sport sponsorship (CRSS)
integrates CSR and sport sponsorship by linking sport, corporate sponsorship and a benefitting
charity with no conditional purchase (Irwin et al., 2003; Lachowetz & Gladden, 2003; Pope,
2010; Watt, 2010). The successful unity of sport, cause and marketing can reinforce emotional
connections with consumers and as will be reviewed in the ―Cause Sponsorship Effects‖ section,
68
such active affiliations can also influence positive consumer behaviour (Lachowetz & Gladden,
2003).
2.2.2 Sport as a Gateway to Goodness
While the sport industry has faced scandal (doping, violence, corruption, etc.), it remains an ideal
outlet to promote social causes and charitable giving. The blending of sport and cause is widely
observed throughout major sport leagues. Professional leagues promote expanding community
outreach programs (such as NBA/WNBA CARES and MLS WORKS) that address a variety of
important societal issues including education, youth development, health and wellness (NBA,
2013; MLS, 2013). The National Hockey League (NHL) founded Hockey Fights Cancer in 1998
to support national and local cancer research institutions, children‘s hospitals, player charities
and local cancer organizations. This program is a component of the NHL‘s Biggest Assist
Happens Off the Ice campaign and has raised more than $12.8 million (NHL, 2013). Similarly,
Major League Baseball (MLB) supports cancer research with the Going to Bat Against Breast
Cancer program launched in 2009 (MLB, 2013) and the National Football League (NFL)
contributes to the American Cancer Society with their A Crucial Catch initiative (NFL, 2013).
The WNBA has raised more than $2.5 million through WNBA Breast Health Awareness Week, is
tackling diabetes with the Dribble to Stop Diabetes program, and seeks to inspire women and
young girls in the areas of leadership and physical activity (WNBA, 2013). Most individual
teams also promote their own foundations (such as the Ottawa Senators Foundation, the Maple
Leaf Sports & Entertainment Foundation, the Montreal Canadians Children‘s Foundation, etc.) to
assist with community causes. These are but a few examples of the many important cause
initiatives being championed by professional sport.

69
Categorizing these various initiatives within the expanding area of CSR in sport is becoming
increasingly challenging. Walker and Kent (2009) categorized CSR activities for professional
sport teams as: i) philanthropy, ii) community involvement, iii) youth educational initiatives, and
iv) youth health initiatives and concluded that these activities have a significant impact on
organizations‘ reputation and consumer behaviour. Pharr and Lough (2012) relied on five
distinguishing variables (locus of benefit, objectives, target market, voluntary exchange, and
marketing perspective) to classify forty-three professional sport cause-related programs as either
social marketing, CRM or community outreach. This study did not include a category of
social/cause sponsorship in their classification of these programs. Pharr and Lough (2012)
identified significantly more instances of social marketing (51.2%) than CRM (18.6%) or
community outreach (30.2%) at the professional sport level and called for more research to
understand the impact of such cause-related programs in sport consumer behaviour (Pharr &
Lough, 2012).
Spectator-based events represent an important opportunity for CRSS and have been found to
favourably impact spectators‘ impressions of sponsors (Close & Lacey, 2013; Irwin et al., 2003;
Walker & Kent, 2009). Table 8 details several of these well recognized partnerships at major
spectator-based events throughout Canada, corroborating reports that sport, sponsorship and
charity alliances are increasingly occurring (Roy, 2011; Walt, 2010). Pink the Rink / Pink at the
Rink is also a growing movement throughout the sport of ice hockey. Reportedly initiated as an
annual event to increase awareness and raise funds for breast cancer research through women‘s
NCAA hockey teams, Pink at the Rink efforts have effectively spread to all levels of both female
and male hockey (Staffieri, 2012).

70
Table 8: Examples of Canadian Spectator-Based Cause-Linked Sport Events
Sport Event Corporate Sponsors Charity / Social Cause
Canadian Formula 1
Grand Prix (2003)
Official: Mercedes-Benz
Partners: McDonalds, RUSH
Media: 8 sponsors
Services: 2 sponsors
32 different charitable
organizations and events
Canadian Curling
Association
-Tim Horton‘s Briar
-Scotties Tournament
of Hearts
-Ford World
Championships
Season of Champions Sponsors:
Kruger Products, Tim Hortons, Ford, M&M
Meat Shop, The Dominion, Capital One, Bell,
World Financial Group, AMJ Campbell Van
Line, Great Western Brewing
Sandra Schmirler Foundation
Grey Cup Festival
(2013)
Premier: Mosaic, Harvard Broadcasting, Pilsner,
Richardson Pioneer, Telus
Festival: Dash Tours
School Literacy and Nutrition
Program
Regina Food Bank
Chris Knox Cancer
Foundation
Calgary Stampede
(2013)
Champion: Agrium, Bell, BMO, Budweiser,
Coca-Cola, Enmax, GMC, TAWA, TransAlta
Stockmen‘s Club: 22 sponsors
Calgary Stampede Foundation
(funding community
facilities, youth programs and
agriculture opportunities)
RBC Canadian Open
(2013)
Title: RBC
Premier: Shaw Business
Platinum: BMW
Partners: 5 sponsors
Children‘s Wellness in
Canada
(RBC and Golf Canada
committed to raising $5
million over 5 years.)
Rogers Cup (2013)
Men‘s
Title: Rogers
Presenting: National Bank
Platinum: Buick, Casino Montreal, Corona,
Emirates Airline, Iris
Gold: FedEx, La Press, Rolex, SAQ, Tenniszon
Silver: 6 sponsors
Bronze: 8 sponsors
Broadcast: 5 sponsors
Grassroots Tennis in Canada

71
Rogers Cup (2013) –
Women‘s
Title: Rogers
Presenting: National Bank
Platinum: Buick, Casino Montreal, Emirates
Airline, Iris
Gold: Lindt, Province of Ontario, Rexall, Rolex
Silver: 7 sponsors
Bronze: 6 sponsors
Broadcast: 4 sponsors
Grassroots Tennis in Canada
CHL Memorial Cup
2013 Title: MasterCard
Associates: BMO, Old Dutch, Post Shreddies,
Subway
Affiliates: Kal Tire, Jack Kink‘s Beef Jerky
Partners: 13 sponsors
Media: 2 sponsors
Championship Legacy
Funding (supporting KidSport
Saskatoon and Dream
Brokers)
IIHF Women‘s World
Hockey
Championships 2013
Premier Marketing Partners: Esso, Nike, RBC,
Telus, TSN
International: 20 marketing partners
National: 3 marketing partners
Local: Acart Communications
Event Charity: Do It For
Daron (youth mental health
awareness)
Team Canada Charity:
Livestrong (Nike and Sport
Check‘s Fight With Us
Program)
At the grassroots level, virtually all participatory sport events are also now linked to a charitable
cause creating opportunities for simultaneous engagement in two meaningful activities (i.e., sport
and cause) and for interaction among participants, not-for profit organizations and sponsors (Filo
et al., 2010; King, 2006; Taylor & Shanka, 2008; Wood, Snelgrove, & Danylchuk, 2010). Wood
et al. (2010) identified four distinct segments of event fundraisers: i) non-identifiers (no
connection to either the cause or the sport), ii) cause fundraisers (connection to the cause), iii)
road warriors (connection to the sport), and iv) event enthusiasts (connection to both the event

72
and the sport). In this study, event enthusiasts raised the most funds and were loyal to the event
for longer periods of time. Participation in charity-related sporting events has been found to be
especially popular with females (Bennett et al., 2007) for whom involvement (i.e., have fun, raise
money for charity, get fit) and status (i.e., prove to others and myself that I can do it) are primary
motivating factors for participation (Taylor & Shanka, 2008). Bennett et al. (2007) affirmed the
powerful influence that charity affiliations can have on consumer behaviour and showed that
involvement with the cause and/or sport can induce participants to pay a higher entrance fee. In
fact, 81% of respondents in this particular study were willing to pay an additional entrance fee
for events affiliated with a cause. Bennett et al. (2007) focused on the purchase of event
participation and did not extend consideration to purchase behaviour of sponsor products.
In Canada, sponsoring someone in an event is among the most common forms of donation as
30% of Canadians contributed in this manner in 2010 (Turcotte, 2012). Table 9 offers examples
of participant-based CRSS events hosted throughout Canada. In addition to these main events,
there are countless community-based for the cure themed sporting events such as curl for the
cure, spike for the cure, putt for the cure, tri for the cure, swim for the cure, kick for the cure,
paddle for the cure, etc.
Table 9: Cause-Related Participant-Based Sport Events
Sport Event Corporate Sponsors Charity / Social Cause
Becel Heart &
Stroke Ride for the
Cure
Title: Becel
Corporate Challenge: The Printing House, Zoll
Official: SunRype
Heart & Stroke Foundation
Celebrity Hockey
Classic Series
10 Sponsorship Levels:
Gold: Nurse Chevrolet
Easter Seals

73
Accommodation Sponsor: Holiday Inn
Beverage Sponsor: PepsiCo
CIBC Run for the
Cure
Title: CIBC
National: New Balance, East Side Mario‘s,
Running Room, Egg Farmers of Canada, Canpar
Courier, Revlon
Suppliers: Dole Sparklers, Lipton Green Tea,
Country Harvest
Canadian Breast Cancer
Foundation
Embridge Ride to
Conqueur Cancer
National Title: Embridge
Ontario Sponsors: Credit Suisse, Sugoi, KPMG,
Roche, Sporting Life, Sobeys, Norco, Steam
Whistle, East Dell, Chantler‘s
Media: 7 sponsors
The Princess Margaret Cancer
Foundation
Golf for the Cure
(by Golf Canada)
Presenting: Subaru
Media: Best Health
Pink: Investors Group, Molson Canadian 67
Canadian Cancer Society
(breast cancer)
Hockey Helps the
Homeless
National: Great West Life , London Life, Canada
Life
Hockey Helps the Homeless
Shoppers Drug
Mart Run for
Women
-Shoppers Drug Mart
-Moving Comfort
-Running Room
Women‘s Mental Health
Organizations across Canada
Shoppers Drug
Mart Weekend to
End Women‘s
Cancers
Title: SDM / Pharmaprix
Official: CIBC, Rogers, Toronto Blue Jays,
Johnson & Johnson, Trade Secrets, Suzy Shier,
Browns, Reitmans, Royal
Media: 5 sponsors
Princess Margaret Cancer
Foundation
Shoot for a Cure
(hockey, curling,
moto-sport and
horse racing
events)
Hockey: over 50 sponsors
Curling: 7 sponsors
Moto-Sport: 2 sponsors
Horse Racing: 1 sponsor
Canadian Spinal Research
Organization
Telus Walk to
Cure Diabetes /
JDRF Ride for
Title: Telus
National: OneTouch
Juvenile Diabetes Research
Foundation

74
Diabetes Research
Toronto Women
Run Series
Major: Mizuno
Associate: Goodlife Fitness, Running Room, Foxi,
eska, eload
Contributing: 6 sponsors
Official: 9 sponsors
Pediatric Oncology Group of
Ontario (POGO)
Walk for Miracles Title: Walmart Children‘s Hospitals
Table 9 is simply a sample of the growing number of participant-based CRSS events occurring
throughout Canada. These include a wide range of sports, sponsors, and affiliated causes. The
strategic considerations required to successfully unite these multiple properties are discussed in
the following section.
Despite some muddling in attempting to label specific cause-related activities, all levels of sport
are increasingly aligning with causes that generate mutual gain for all involved stakeholders.
The popularity of this trend is creating clutter and increased competition for coveted sponsorship
deals (Taylor & Shanka, 2008). Breast cancer is often the charity of choice as Orenstein (2003)
referred to it as ―the queen of all good causes‖ (p.89). The pink ribbon associated with breast
cancer awareness is an instantly recognized symbol that many firms wish to leverage. Pink
washing is a term used to describe insincere motives by corporations seeking to exploit disease
for profit and has many advocates cautioning businesses to think before they pink (Harvey &
Strahilevitz, 2009 King, 2006; Orenstein, 2003; Twombly, 2004).
2.2.3 Characteristics of Cause Sponsorship
This next section of review reconsiders the main elements of sponsorship (namely objectives and
benefits, fit, involvement, and activation) from a cause perspective. Much of this knowledge is

75
consistent with findings presented in the previous review of sponsorship literature. Attributes
unique to the cause environment are highlighted.
2.2.3.1 Objectives and Benefits of Cause Sponsorship
The characteristics of cause sponsorship are essentially the same fundamental principles as
presented in the preceding sponsorship review. There are however additional layers when
engaging in cause-related activities. Associating with a relevant social cause can offer firms
many possible returns. Similar to other kinds of sponsorship (such as sport), cause sponsors can
create a meaningful point-of-differentiation and enjoy an enhanced image, positive publicity,
favourable attitudes and increased revenue (Hajjat, 2003; Meyer, 1999). In cause sponsorship
however, sponsors play a crucial role in raising awareness and funds for social causes, generating
strong goodwill and brand character with a targeted audience, providing consumers with a sense
of personal fulfillment and building strong emotional and spiritual bonds among various
stakeholders with shared common values (Hyllegard et al., 2011; Menon & Kahn, 2003; Meyer,
1999). Pope (2010) defended corporate interests in explaining that ―social sponsorship is being
delivered by brands that are listening to their customers, as well as their own passions, ethics and
concerns. Do they or should they feel guilty that they are helping their brands along the way?
Absolutely not‖ (p.248). Despite this, corporate and social benefits must be balanced in the
sponsorship of causes. Consumers understand and accept that sponsors will benefit from their
involvement in a cause, but if the corporation is perceived to benefit more than consumers or
society, then corporate trustworthiness risks being eroded (Geue & Plewa, 2010; Haley, 1996).
Consumers also demand transparent communication in detailing corporate charitable efforts,
including the amount donated as well as the length of involvement with the cause (Cone, 2010a).
In the earlier example of MasterCard‘s sponsorship of the MLB and Stand Up To Cancer,

76
MasterCard‘s on-field donation presentation was witnessed by thousands of spectators and
broadcast viewers (Fortunato, 2013). Sixty-one percent of Americans do not believe that
companies currently provide enough information about their cause-related programs (Cone,
2010a).
The benefits to the nonprofit sector distinguish cause from other types of alliances. Cone
Communications is a commonly cited industry authority on corporate social responsibility and
cause marketing. The 2010 Cone Nonprofit Marketing Trend Tracker (online survey among
1,055 US adults) revealed that as a result of social and corporate partnerships, 59% of consumers
are more likely to buy a product associated with a cause, 50% of consumers are more likely to
donate to the nonprofit, 49% are more likely to participate in an event for the nonprofit, and 41%
are more likely to volunteer for the nonprofit (Cone, 2010b). Consumers are inspired by
corporate good deeds and want companies to give them the opportunity to buy a cause-related
product, learn about a cause, change their behaviour, donate to a nonprofit, advocate for an issue
or volunteer (Cone, 2010a).
Meyer (1999) highlighted that cause branding is different than merely associating with a social
cause as the former requires a more long-term stakeholder-based approach that requires a
substantial amount of sophistication, time, effort and money to fully integrate social issues into
business strategies, brand equity, and corporate identity. Meyer (1999) concluded that essentials
for cause branding success include: i) synergy (i.e., fit) between the company and the cause, ii)
deep, senior-level commitment, iii) sufficient resources, iv) a sustained, multi-year commitment,
v) open and mutually beneficial relationships, vi) lots of communication, vii) measurable results,
viii) walking the talk, and ix) innovation.

77
2.2.3.2 Fit in Cause Sponsorship
Congruency in sponsorship was examined earlier in this literature review. The need for synergy
between the company and the cause is also well supported throughout the cause literature
(Becker-Olsen & Simmons, 2002; Berger et al., 1999; Haley, 1996; Menon & Kahn, 2003; Roy,
2010; Simmons & Becker-Olsen, 2006; Zdravkovic, Magnusson, & Stanley, 2010). Becker-
Olsen and Simmons (2002) explained that ―good deeds that are unrelated to the firm‘s image risk
being uninteresting and are unlikely to encourage much thought‖ (p.287). Geue and Plewa
(2010) also stressed the need for fit as they argue that ―cause sponsorship is an effective medium
through which a firm can communicate its social responsibility to key stakeholders, if the right
cause is sponsored‖ (p.236). Roy (2011) supported the need for congruent linkages between
sponsor and cause and found that such synergy increases both perceived sincerity and attitudes
toward the sponsor. Close and Lacey (2013) found that event-sponsor fit improved consumer
perceptions of the sponsor and that the integration of the sponsor‘s CSR efforts improved
consumer attitudes and purchase intentions. In this investigation by Close and Lacey (2013),
congruity was significant for the sponsor but did not impact consumers‘ attitudes toward the
event itself.
Fit can stem from different sources. Nan and Heo (2007) defined fit in CRS as ―the overall
perceived relatedness of the brand and the cause with multiple cognitive bases‖ (p.66). Becker-
Olsen and Simmons (2002) defined native (or natural) fit as ―the extent to which the firm and the
sponsored cause are perceived as fitting together, independent of program details or
communications that may create a fit between organizations‖ (p.287). Created fit, as implied
above, is produced and communicated through marketing efforts. Zdravkovic et al. (2010) also
referred to created prominence fit as the ―manner in which the cause relationship is presented and

78
explained to potential customers‖ (p.158) while also identifying natural marketing strategy fit as
―similarity in segmentation, targeting, and positioning‖ (p.158). Lachowetz and Gladden (2003)
identified resonance as a necessary condition for successful CRSM programs and referred to a
required fit with the target market as well as congruency between the values of the sponsor and
the values of the cause. Fit is a multidimensional concept that can stem from product
dimensions, consumer bases, corporate or brand images and values, or personal involvement
(Menon & Khan, 2003; Nan & Heo, 2007).
2.2.3.3 Involvement in Cause Sponsorship
Similar to the notion of fit, involvement is a multidimensional construct that is generally
captured under various labels such as identification, relevance, interest, importance, personal
investment, engagement or even passion. Zaichkowsky (1985) defined involvement as ―a
person‘s perceived relevance of the object based on inherent needs, values, and interests‖ (p.342)
and validated a twenty-item scale to measure consumer involvement levels. Hyllegard et al.
(2011) separated interest from involvement in a study that found that participants‘ interest in a
social cause positively influenced brand attitudes but negatively predicted purchase intention.
Involvement in this study, however, had a more positive influence on both attitudes and purchase
intentions. These authors described interest in terms of importance, relevance, excitement,
meaning, appeal, fascination, value and need, while involvement with a social cause was based
on more tangible actions such as time and money donated, CRM purchases, participation in
fundraising events, advocating for the cause, and personal impact.
In cause-related activities, the term emotional involvement commonly emerges. Chang (2012)
defined emotional involvement as ―a state of psychological engagement associated with
emotional responses‖ (p.321) and contributed to findings that social causes emotionally engage

79
consumers. In that study, levels of emotional involvement were based on responses to three
statements: i) I felt warm-hearted about the even,; ii) I was moved thinking about the event, and
iii) I became emotional thinking about the event (Chang, 2012, p.327).
Funk and James (2001) addressed the emotional and psychological engagement through sport
with the Psychological Continuum Model (PCM). This model conceptualizes the various levels
of connection between sport fans and a sport or team in terms of four distinct stages along a
vertical psychological continuum: awareness, attraction, attachment, and allegiance. Awareness
is the beginning of the relationship when an individual first learns that a sport/team exists with
no particular favourite. The second level is attraction when strong awareness guides an
individual to confirm a favourite sport/team although preference at this stage is not necessarily
enduring. An emotional and psychological connection begins to form at the attachment phase
when the sport/team becomes increasingly central to the individual who assigns important
emotional, symbolic and functional meaning to the relationship. The top of the model is
allegiance which is characterized by strong and lasting loyalty of a truly committed fan. Funk
and James (2001) drew attention to the similarity of the PCM to the hierarchy of effects theory
and explained that the later focuses on outcomes of behavioural change while the PCM captures
the psychological relationships that are formed between entities. These authors encouraged
widespread application of the PCM in guiding research efforts beyond sport fans and highlighted
sponsorship and charitable relationships as sound choices for investigation. Filo et al. (2010)
incorporated the PCM (specifically the attachment stage) when examining the factors that
contributed to participants‘ perceptions of event sponsors at a cause-related marathon event.
Event attachment was based on functional knowledge, emotional importance, and symbolic
expression. Results of this study revealed that participants‘ recreational and charity motives

80
contributed to event attachment while charity motives and event attachment in turn impacted
sponsor image. Both sponsor image and event attachment contributed to intentions to purchase
the sponsors‘ products (Filo et al., 2010).
Through qualitative interviews, Haley (1996) determined that consumer understanding of
organizational sponsorship of advocacy messaging is based on perceptions of the organization,
perceptions of the issue and perceptions of self. Respondents‘ personal investment in the chosen
cause heightened their attention to corporate efforts and fostered favourable opinions of the
sponsoring organization. A participant in this investigation effectively captured the affirmed
importance of cause relevance by stating: ―I‘ll support a company that supports things I believe
in‖ (p.30).
Pearsall (2009) found that consumers‘ ties with specific sports, events or causes have a pervasive
influence on sponsorship response and that this inherent passion can prevail over challenges such
as a harsh economy. This on-line study involving 1,000 US shoppers also revealed that
consumers are favouring sponsorships with a goodwill component and are encouraged most by
cause associations. Pearsall (2009) concluded that: ―For sponsors, a paradigm shift towards the
support of causes is critical to combat the prevailing current perceptions; however these tie-ins
must be authentic in nature or today‘s consumer will rebel both with their hearts and their
wallets‖ (p. 32-33).
The belief that involvement is a strong predictor of consumer response is strongly endorsed
through cause research (Bennett et al., 2007; Broderick et al., 2003; Chang, 2012; Hajjat, 2003;
Haley, 1996; Hyllegard et al., 2011; Pearsall, 2009; Walker & Kent, 2009). Cone (2010a)
reported that 54% of consumers will purchase from a company that supports a cause that is

81
personally relevant to them over a company that is associated with a cause that has less personal
meaning. In addition, an overwhelming 89% of consumers believed that a company should
consider what is most important to their target market in choosing a social issue to champion
(Cone, 2010a).
More closely tied to cause-related sport events, Bennett et al.‘s (2007) examination of
motivations for participation in cause-related sporting events revealed that involvement with
both the cause and the sport significantly influence participants‘ behaviour. Extending the
concept of involvement from sport participation to spectatorship, Funk, Mahony, Nakazawa, and
Hirakawa (2001) found that attendees (both male and female) of the Women‘s World Cup in
1999 were motivated by a desire to support women‘s opportunity in sport. This suggestion that
involvement can be based on the gender of sport being played (or fan in attendance) will be
further explored in the final section of this review. Gender support is a significant consideration
in this dissertation exploring the role of gender in consumer response to CRSS.
Walker and Kent (2009) also assessed the influence of CSR on consumers in the sport industry
and identified team identification as an important predictor of fans‘ assessments of reputation
and patronage intentions. In this case, CSR‘s influence significantly increased four patronage
dimensions (repeat purchase, word-of-mouth, merchandise consumption, and media
consumption) as the respondents‘ level of team identification increased. Walker and Kent (2009)
also found that highly identified fans are more confident in assessing their team and will seek out
positive information to affirm their beliefs while dismissing information that contradicts their
positive views. This desired level of loyalty could reasonably be classified as the allegiance
stage of the PCM reviewed above.

82
2.2.3.4 Cause Sponsorship Activation
As with all forms of sponsorship, cause sponsorship must be adequately activated in order to
reap the true rewards of association (Meyer, 1999; Pearsall, 2009; Pope, 2010). Watt (2010)
recommended that the integration of CSR into sponsorship evolve beyond inanimate signage and
that ―every point of contact provides an opportunity to live out the company‘s values and
principles while making a meaningful contribution to social development‖ (p.223). Marketers
are cautioned, however, not to interrupt customers but rather to share in social concerns by
adopting a wide range of consumer-facing and interactive communication channels using a tone
that is enabling and empowering rather than instructional (Pope, 2010). Pope (2010) testified
that: ―Consumers who are more committed to mindful consumption are encouraging brands to
demonstrate their social credentials provided that they are genuinely meant and credibly and
transparently delivered‖ (p.244). Pope (2010) offered examples of American Express, Google
and Nike to propagate the power of digital and social media in inspiring mass involvement and
cooperative social behaviour.
The 17th
Annual 2010 Cone Cause Evolution Study revealed that 90% of consumers want
companies to tell them how they are supporting causes and recommends that companies continue
to innovate to ensure that their activation programs offer ―an original consumer experience‖
(Cone, 2010a, p.27). This report identified forward-thinking trends that include deeper
engagement through social media that also encourages offline charitable action, the use of
contemporary new media tools (e.g., Quick Response codes) to heighten interaction and
information exchange in-store, the integration of social messaging into popular entertainment
(e.g., sitcoms and dramas), and the use of social math to transform hard data into soft and

83
compelling stories. The need to sufficiently activate cause sponsorships and the various possible
methods of leverage are consistent with the previous full review of sponsorship activation.
2.2.4 Cause Sponsorship Effects
In reviewing existing CSR literature, Walker and Kent (2009) identified three main streams of
research: i) theoretical / conceptual, ii) motives-oriented, and iii) outcomes-oriented. Their
review found that the overwhelming majority of work to-date has concentrated on the conceptual
understanding and possible motives of CSR. Less attention has been reportedly devoted to the
outcomes of CSR, in particular relating to consumer response to cause-related initiatives. Albeit
limited (in comparison to other streams), the outcomes-focused research that has been conducted
thus far, does suggest a positive link between social initiatives and consumer response (Becker-
Olsen & Simmons, 2002; Berger et al., 1999; Broderick et al., 2012; Chang 2012; Close &
Lacey, 2013; Filo et al., 2010; Hajjat, 2013; Hyllegard et al., 2011; Irwin et al., 2003; Lacey et
al., 2010, Nan & Heo, 2007; Ross, Patterson, & Stutts, 1992; Roy & Graeff, 2003; Walker &
Kent, 2009). Cornwell and Coote (2005) promoted the power of cause-related marketing stating
that it ―locks in customers and creates brand loyalty by offering them the chance to have a
positive effect on issues they feel they have in common with the company‘s policies‖ (p.271).
The Cone Cause Evolution Study (2010a) also found that consumers, in particular mothers,
continue to expect, welcome and respond favourably to corporate cause efforts. Specifically, this
on-line survey (of 1057 adult Americans) found that:
85% of consumers have a more positive image of a product/company when it supports a
cause that they care about,

84
41% of Americans claim to have bought a product because it was associated with a cause
(vs. 20% in 1993), and
80% of consumers are likely to switch brands to one that supports a cause (with price and
quality being equal).
In this same study, Cone (2010a) singled out Moms and Millennials (aged 18-24 at time of the
survey) as particularly receptive to cause efforts and described Moms as the ―epitome of the
cause consumer‖ (p.13) given their strong purchasing power, socially-minded youth influencers,
and virtually unanimous support for cause-related initiatives (p.13):
95% find cause marketing acceptable (versus 88% average),
93% are likely to switch brands (versus 80% average), and
92% want to buy a product that supports a cause (versus 91% average).
Building on the thirty-three sponsorship studies presented in Table 5, Table 10 summarizes the
cognitive, affective, and behavioural effect findings of an additional fifteen studies that pertain
specifically to cause-related marketing or cause sponsorship scenarios.
Table 10: Summary of Cognitive, Affective and Behavioural Effects Studies in Cause
Affiliated Marketing
Findings
Author(s)
(Year)
Cognitive
Stage
Affective
Stage
Behavioural
Stage
Becker-Olsen &
Simmons
(2002)
High-fit sponsorships
built brand equity while
low-fit diluted equity.
A nonprofit source
resulted in more
favourable response
than a company source.

85
Berger, Cunningham,
& Kozinets
(1999)
Attitude toward the
cause and perceived
involvement increased
information processing
and persuasion.
Female students had more positive attitudes and
higher purchase intentions for brands that use
cause-related advertising than did male students.
Chang
(2012)
Attitudes toward social
sponsorship were more
positive than attitudes
toward CRM.
Cone
(2010a) 85% of consumers have
a more positive image
of a company when it
supports a cause they
care about.
95% of Moms believe
that cause marketing is
acceptable (vs. 88%
average)
-80% of consumers (and
93% of Moms) are
likely to switch brands
to one that supports a
cause (price and quality
being equal).
-81% (and 92% of
Moms) want to buy a
product that supports a
cause.
-41% of respondents
claim to have bought a
product because it was
associated with a cause
(vs. 20% in 1993).
Cornwell & Coote
(2005)
Participants‘ years of
partaking in the charity-
based sporting event,
increased their
identification with the
nonprofit.
Consumers‘
identification with the
charity had a positive
effect on sponsorship-
linked purchase
intentions (based on five
PI measures).
Filo, Funk, & O‘Brien
(2010)
Charity motives and
event (cause-related
marathon) attachment
positively contributed to
sponsor‘s image.
Sponsor image and
event attachment
favourably contributed
to purchase intention of
sponsor‘s products.
Hajjat
(2003)
When there was a match between cause involvement and donation levels
(high/high, low/low), CRM was superior to ordinary marketing in generating

86
favourable consumer response (attitudes and purchase intentions).
Hyllegard, Yan, Ogle, &
Attmann
(2011)
-Consumers were more
likely to form positive
attitudes toward an
apparel brand when the
amount of the donation
was clearly
communicated.
-Participants who were
more involved (vs.
interested) in social
causes, had more
positive attitudes toward
the brand.
-Participants who were
more involved (vs.
interested) in social
causes, had stronger
purchase intent.
-Gender did not
influence brand attitudes
but did predict purchase
intention. Females were
generally more involved
and recorded stronger
intentions to purchase
sponsors‘ brands.
Irwin, Lachowetz,
Cornwell, & Clark
(2003)
-Consumers‘ attitudes, beliefs, and purchase intentions were positively
impacted by Fed Ex‘ sponsorship of the St. Jude Classic professional golf
tournament.
-Female participants‘ response on all measurements was stronger than males.
Lacey, Close, & Finney
(2010)
Product knowledge and perceptions of CSR were key variables that
strengthened attendees‘ commitment to an event sponsor and purchase
intention.
Nan & Heo
(2007) Brand/cause fit only
impacted attitudes of
brand conscious
consumers.
Regardless of fit, CRM
had a positive impact on
attitudes toward the
company versus no
CRM.
Ross, Patterson, &
Stutts
(1992)
Women had a more
positive attitude than
men toward both the
firm and the cause that
used CRM.
CRM had a positive
influence on purchase
intention, particularly
among women and
respondents who had
children.
Roy & Graeff
(2003) -90% of respondents
had a more positive
image of a business or
78% of consumers
agreed that cause-
related marketing

87
professional athlete that
supports community
charities or causes.
-Females were more
likely to have a positive
image of a local team if
they partnered with
causes.
activities influence their
purchase intentions.
Simmons & Becker-
Olsen
(2006)
High fit (natural or
created) between
sponsor and cause
reinforced sponsors‘
positioning.
High fit created
favourable brand
attitudes.
High fit enhanced firm‘s
equity (intention to
consider, purchase or
recommend) for up to a
year.
Walker & Kent
(2009) -NFL teams‘ CSR
activities had a strong
and positive impact on
the organizations‘
perceived reputation.
-More highly identified
fans, had more
confident opinions of
the team and were less
influenced by CSR than
less identified fans.
-CSR was a significant
predictor of word-of-
mouth and merchandise
consumption.
-CSR‘s influence
increased repeat
purchase, word-of-
mouth, and both
merchandise and media
consumption as
respondents‘ level of
team ID increased.
These cause-related studies support earlier propositions that sponsorship can effectively motivate
consumers at all levels (cognitive, affective, and behavioural). The inclusion of cause properties
augments stakeholder factors, heightens the impact of involvement and furthers consideration for
congruency. Gender effect was considered in six of the above studies, each of which suggests
that female consumers are more receptive and affected by cause efforts (Berger et al., 1999;
Cone, 2010a; Hyllegard et al., 2011; Irwin et al., 2003; Ross et al., 1992; Roy & Graeff, 2003).
2.3 Gender Considerations in Sponsorship Marketing

88
This section focuses on gender considerations in sponsorship marketing. The evolution of
gender research briefly introduces this section. The significance of the lucrative female
consumer market is then established, followed by an examination of key gender differences that
can impact consumer behaviour. The relevance of cause and the importance of sport are
presented as growing interests and priorities for women before concluding this section with a
review of past studies that have measured the influence of gender on sponsorship response. It is
important to note that the identified gender traits and behaviours are generalizations based on the
findings of mainly North American studies. Behaviour can certainly be influenced by many
individual characteristics and factors beyond biological gender. It is therefore understood that
there are always exceptions to the presented findings.
2.3.1 Gender Evolution and Gender Research
The social status and roles of both women and men continue to evolve as does the corresponding
study of each respective gender. Given the increased marketing priority devoted to the lucrative
female consumer segment, the following review is primarily grounded in the evolution of the
female gender. It is generally acknowledged that women are increasingly powerful as decision-
makers and influencers. In business, politics, sports, and social settings, women are transforming
the landscape and blurring traditional gender boundaries. Gender roles however were not always
so fluid and the opportunities enjoyed by the modern women are the result of relentless effort
and sacrifice of women past.
Bettany, Dobscha, O‘Malley, and Prothero (2010), argued that feminist views are integral to the
understanding of consumer behaviour and the practice of marketing. There are many different
forms of feminism as well as conflicting approaches to feminist philosophy. A broad

89
understanding of the key milestones of this important social movement is necessary to
effectively contextualize the current evolved role and powerful influence of women. According
to Haslanger, Tuana, and O‘Connor (2011), ―feminism is both an intellectual commitment and a
political movement that seeks justice for women and the end of sexism in all forms‖ (Stanford
On-line Encyclopedia of Philosophy, Topics in Feminism, para.1). Drawing on social theory,
Brace-Govan (2010) provided an overview of women‘s political activism over what is
commonly referred to as the three waves of feminism. The first wave of feminism, occurring
around the turn of the 19th
century (1880s to 1920s), was successful in gaining voting rights for
women as well as access to education and physical activity (Brace-Govan, 2010). After a lull in
action between the two world wars, feminism was revived with a second wave in the late 1960s
and 1970s with renewed passion for power, control and equality in important matters such as
higher education, employment, sports and on the domestic front. Recognizing that identity is
more than just gender, third wave feminism considers the social conditions of women (such as
race, ethnicity, class, nationality and religion) in a continued quest for equality (Brace-Govan,
2010; Haslanger et al., 2011). Advertising scholars also refer to consumer feminism or
commodity feminism as the commercialization of feminist ideals (Goldman, Heath, & Smith,
1991; Brace-Govan, 2010; Howard, 2010). Motivated by market share and corporate profits, the
concern through the 1970s and even into the 1990s, was that marketers were misrepresenting or
trivializing important feminist accomplishments in an effort to differentiate their offerings and
sell more products (Goldman et al., 1991). Howard (2010) contended that despite a ―narrow
view of women‘s liberation‖ (p.155), the tension between feminist activism and corporate culture
led to a significant shift in women‘s images in popular culture.

90
Throughout scholarly discourse, various terms are used in reference to the multiple facets of
gender. Although often used interchangeably in practice, sex and gender are in fact distinct
concepts. According to Fischer and Arnold (1994, p.164), ‗sex‘ refers to the biologically based
categories of male and female, ‗gender‘ represents the psychological features associated with
males and females, ‗gender identity‘ means the personality traits of the sexes, and ‗gender role
attitudes‘ signifies the attitudinal differences regarding roles, rights, and responsibilities of
women and men. Biological sex studies normally focus on ―gender as a variable‖ in male versus
female comparisons (Bettany et al., 2010, p.7). As noted by Fisher and Arnold (1994), gender
identity is a more comprehensive concept and as such is often referred to as ―psychological sex‖
(Kolyesnikova et al., 2009, p. 201). Gender identity broadens factors beyond mere biological
differences ―to include the notion of social and cultural constructions of masculinity and
femininity‖ (Bettany et al., 2010, p.8). It is beyond the scope of this paper to further distinguish
these definitions. Given the strong psychological aspect of marketing, the term gender is deemed
most appropriate for this review (although the measurement of gender for this dissertation was
based on the biological classifications of female and male).
Bettany et al. (2010), while documenting the history of gender research, stated that ―gender
research has existed in many forms since the birth of science and philosophy‖ (p.6). These
authors referenced early Aristotelian and Darwinian views but maintained that gender research in
modern form truly emerged during the 1960-1970s in the humanities and social sciences as a
response to the strong feminist movement at that time. Specific to the discipline of marketing,
gender culture only became a meaningful consideration over the past two decades. Barletta
(2006), a respected authority and author on the subject of ―marketing to women‖ (M2W),

91
recounted her experience as a business student in the 1970s when most business matters were
essentially dominated by men:
Thirty years later, there have been literally thousands of studies, in fields as diverse as
anthropology, biochemistry, neuroscience, human development, psychology, and
sociolinguistics,….we now have hard data that confirm there are significant differences
between men and women in every field just mentioned (p.16).
Beetles and Harris (2005) pointed to the introduction of the bi-annual Academy of Consumer
Research conference on gender, marketing and consumer behaviour in 1991 as ―a significant
landmark for gender based research from a business, as well as marketing, perspective‖ (p.206).
Bettany et al. (2010) highlighted the expanding marketing related topics (such as gender, culture,
technology, fashion, consumerism and masculinity) that have broadened the application of
gender theory in consumer behaviour and marketing.
There is clearly strong and growing interest in gender issues in marketing and as Beetles and
Harris (2005) pointed out: ―many opportunities and under-explored areas of marketing would
benefit from a gendered or feminist perspective‖ (p.222). Kolyesnikova et al. (2009) added that
―less is known about how specifically social norms differ between males and females and how
this difference relates to consumption‖ (p.200). Bettany et al. (2010) echo these sentiments
noting that: ―there remains many areas within marketing and consumer research where gender
and feminist research could offer new insights, theories and approaches‖ (p.4). These persistent
gaps in marketing knowledge substantiate the purpose and contributions of this dissertation in
identifying the potential impact of gender on sponsorship response.

92
2.3.2 Marketing to Women – Economic Opportunity Number One
Well known marketing theorist Tom Peters described women as the most promising market and
―economic opportunity number one‖ (in Barletta, 2006, p. xiii). Skoloda (2009) also referenced
Peters‘ position as it relates to the power of female consumers, ―…women are the primary
purchasers of…damn near everything. We must, therefore, strive on every front to achieve
nothing less than total enterprise realignment around this awesome, burgeoning, astoundingly
untapped market‖ (p.5).
Historically, women have often been referred to as a niche market or opportunity (Barletta, 2006;
Johnson & Learned, 2004; Skoloda, 2009). Considering the demographic size of the female
population as well as the commanding influence that women exert in marketplace decision-
making, women are far from niche. In both the Canadian and American populations, there are
currently more females than males. In Canada, population estimates for 2013 indicate over 17.7
million females (50.4% of the Canadian population) with the sixty-five and older segment
growing most rapidly at +3.7% (Statistics Canada, 2013). Similar trends are observed in the
United Stated where over 157.6 million female residents account for 51% of the U.S. population
(United States Census Bureau, 2012). In addition to the fact that there are physically more
females than males in both Canada and the U.S., the increased presence and influence of women
is examined here from the following three perspectives: i) education, ii) employment and
income, and iii) purchasing influence and behaviour.
Education: Silverstein and Sayre (2009) contend that education is the primary driver of women‘s
increased earning power and influence. They offered the following statistics regarding the
education of women in the U.S. (p.32):

93
In 2007, 70% of female high school graduates enrolled in college, up from 40% prior to
1972.
Women account for the majority (60%) of the college population, up from only 44%
before 1972.
30% of American women versus 28% of men hold an undergraduate degree.
Catalyst, a non-profit organization with a membership of over 450 companies, firms, and
educational institutions from five continents, is a trusted and often cited resource for research
and information about women and work. Catalyst (2011) reported that in 2008-2009, women
earned 57.2% of U.S. undergraduate degrees, 60.4% of graduate degrees and 52.3% of doctoral
degrees. Similar profiles are observed in Canada, where women earned 59% of college, 62% of
bachelor, 54% of masters and 44% of doctorate degrees (Statistics Canada, 2011). These higher
levels of education are leading women to higher paying occupations and expanding career
opportunities.
Employment and Income: By the 1970s, many women had shed the ‗housewife‘ label in favour
of ‗work wife‘ (Howard, 2010). Today, women make up 47.5% of the Canadian labour force,
and of the dual-career couples in the U.S. in 2008, wives earned more than their husbands 26.6%
of the time (Catalyst, 2011). Women have embraced entrepreneurship. In the U.S., women-
owned firms generate an economic impact of $3 trillion annually and account for 16% of all U.S.
jobs (Catalyst, 2011). In addition to small business, women are also entering traditionally male-
dominated professions such as law (34.9% of Canadian lawyers in 2007 were women according
to Catalyst, 2011), medicine (29% of U.S. physicians), higher education (39% of U.S. faculty),
and military (14% of U.S. military) (Silverstein & Sayre, 2009). Women are also climbing the
corporate ladder in hopes of shattering the proverbial glass ceiling. In the U.S., 51.5% of

94
management and professional positions are held by women while at the top of the management
pyramid, 15.7% of board seats with Fortune 500 companies are occupied by women, up from
14.4% in 2004 (Catalyst, 2011).
Maclaren and Catterall (2000), focusing specifically on women in the marketing profession,
distinguished women‘s leadership styles as encouraging, participatory, more cautious and risk-
adverse with a longer-term orientation. They linked feminine traits such as empathy,
helpfulness, caring, nurturance, sensitivity and cooperation with the more modern marketing era
of consumer-centricity and relationship-based marketing. These authors encouraged the
continued professional presence and development of women in marketing management.
In a study of 12,000 women in forty countries, Silverstein and Sayre (2009) calculated that
‗working women around the world earn the equivalent of $12 trillion in salaries and wages
annually‖ (p.31). This tremendous amount of wealth (and corresponding power and marketing
appeal) is the result of the noted educational and professional accomplishments of women.
Although inequality persists, US women‘s average income has increased 63% over the past three
decades (1970-2002) whereas men‘s has remained relatively stable at +0.6% (Barletta, 2006).
This surge in female earnings has narrowed the gender wage gap. In 2010, women in Canada
earned 74.5% of what men made, while U.S. women earned 81.2% (Catalyst, 2011). The wage
gap between genders varies by age, with younger women enjoying more equitable pay. For
instance, in the U.S., women 20-24 years old earned more than the national average in 2009,
taking home 92.9% of men‘s earnings, while 25-34 year olds earned 88.7% (Catalyst, 2011).

95
This data highlights the progression that has been realized in the workplace as well as the
disparities that still exist, in particular in top leadership positions.
Purchasing Influence and Behaviour: There is abundant data to support the claim that women
are key purchase influencers and decision-makers. Most studies report that women control
roughly 80% of consumer spending (Barletta, 2006; Johnson & Learned, 2004; Johne, 2010).
Johnson and Learned (2004) referenced the Centre for Women‘s Business Research in indicating
that 51% of all purchasing managers and agents are women and that these businesswomen
transfer their influence into their homes where they make 95% of purchase decisions. Similarly,
Silverstein and Sayre (2009) state that, in developing countries, 40% of women control 91-100%
of household spending. The premier symposium on marketing to women in the U.S. is the M2W
Conference which was launched in 2005 by PME Enterprises. The M2W Conference website
(2011) provides the following facts (that are commonly cited) to validate what has been termed
‗the power of the purse‘ or the ‗she-conomy‘:
Women account for 85% of all consumer purchases, 91% of new homes, 66% of personal
computers, 92% of vacations, 80% of healthcare, 65% of new cars, 89% of bank
accounts, 93% of food and 93% of over-the-counter pharmaceuticals.
American women spend about $7 trillion annually (over half the U.S. GDP).
Women represent the majority of the online market.
Seventy percent of new businesses are started by women and when women are aware that
you support women owned businesses, 79% will try your product or service and 80% will
solidify their brand loyalty. These findings suggest strong solidarity among women in
business.

96
The above statistics confirm that women‘s purchasing power thoroughly spans both their
personal and professional lives. As the various authors referenced above have duly noted,
women are not a niche market but rather a leading population that marketers must recognize and
uniquely address. Warner (2006) summarized by stating that ―…women are indeed the world‘s
most powerful consumer‖ (p.6).
2.3.3 Women and Men: Equals but Not the Same
The goal of the original feminist movement was equality across genders, including equality in
education, employment, politics, sport and society in general. The natural tendency for many
may be to assume that equality means sameness and that any recognition of differences is a form
of sexism (Cunningham & Roberts, 2007). The scientific advancements in the study of gender
have acknowledged that profound biological and societal differences between sexes are
legitimate and significant. Barletta (2006) categorized these differences by chromosomes,
hormones and brains in favour of the old cheeky adage of ―sugar and spice and everything nice‖
(p.21). There is common belief that male and female brains function differently and that males
are generally considered to be right hemisphere dependent (i.e., non-verbal production, visual
activity, spatial abilities) while females are predominantly left hemisphere dependent (i.e., verbal
communication, comprehensive information processing, linguistic skills) (Bush, 1997; Goodrich,
2014; Hu et al., 2013; Meyers-Levy, 1994; Schlaepfer, Harris, Tien, Peng, Lee, & Pearlson,
1995). In a review of gender differences, Darley and Smith (1995) identified gender differences
that have been suggested throughout various fields of research. Among these stated differences
were men‘s superior spatial orientation and female‘s stronger verbal or linguistic skills, women‘s
greater accuracy in detecting non-verbal cues, women‘s tendency to more easily conform and be
influenced by others, and the stronger intrinsic motivation of women. Studies that investigate

97
gender differences normally acknowledge that differences can stem from physiological,
environmental and/or sociocultural factors (Darley & Smith, 1995; Goodrich, 2014; Putrevu,
2001). Regardless of the source of distinction, the impacts of these differences on information
processing and decision-making are most relevant in the context of this particular dissertation.
There is extensive support for the belief that women and men differ in their approach to
information processing (Beetles & Harris, 2005; Bush, 1997; Cunningham & Roberts, 2009;
Granot, Greene, & Bashear, 2010; Green & Antoine, 2011; Lee, Haley, & Avery, 2010; Meyers-
Levy & Maheswaran, 1991; Meyers-Levy & Sternthal, 1991; Putrevu, 2001; Passyn, Drriker, &
Settle, 2011; Wajda et al., 2008; Wolin, 2003). Meyers-Levy‘s (1989) selectivity model is the
basis for many of the observed gender differences in consumer decision-making. According to
this model, women engage in broader, more comprehensive processing of information as they
gather and consider multiple sources and devote greater effort to all relevant and subtle details.
Women are classified as more caring and nurturing as they exhibit greater concern for others. In
comparison, this model defines men as selective processors who rely on less information and
follow a more single and self-serving approach to streamlined decision-making with less
sensitivity to the needs of others.
In explaining this same model, Green and Antoine (2011) added that females‘ processing of
information is normally ―effortful, detailed, and elaborate‖ (p.91) and Wajda et al. (2008)
suggested that males ―consider only a subset of all available information‖ (p.15) and seek out
cues that are consistent with existing knowledge. In their study of category width dimensions,
Wajda et al. (2008) found that males simplify the selection process by lumping what they believe

98
to be similar products into one category or evoked set. Women however are more attentive to
subtle differences and nuances and therefore consider a wider set of alternatives and seek greater
and more meaningful differentiation in evaluating numerous options (Wajda et al., 2008). These
commonly accepted differences in processing can be situational dependent. For instance,
involvement has been identified as a factor that can alter these processing roles (Meyers-Levy,
1989; Meyers-Levy & Sternthal, 1991). Darley and Smith (1995) acknowledged the potential
influence of situational factors in stating that; ―gender differences in information processing will
disappear if situational factors motivate males to also engage in comprehensive processing‖
(p.43). In the context of sport sponsorship for instance, it is reasonable to expect that men‘s
involvement with sport could motivate more elaborate processing.
Meyers-Levy and Sternthal (1991) also considered the psychological orientation of males and
females along the dimensions of agency and communion. These authors contend that agency is
normally assumed by males and represents a ―single, self-assertive and achievement-oriented
concern‖ (p.94). In contrast, communion more accurately depicts females and is characterized as
a broader concern beyond one‘s own self with an emphasis on affiliation and attachment to
others (Meyers-Levy & Sternthal, 1991). In a similar vein, Kolyesnikova et al. (2009) referred
to ―the male assertiveness-female nurturance patterns‖ (p.202). These authors pointed out that
early gender research demonstrated that masculinity is typically associated with assertiveness
and accomplishment while femininity is more related to nurturance and emotional concerns for
others and great conformity to social norms. These deeper understandings of motivation offer
further insight into the considerations of males and females in their respective decision-making
processes.

99
In marketing, gender remains one of the most common bases for consumer segmentation as
gendered segments satisfy the requirements of being easily identified, accessible, and large
enough to be profitable (Darley & Smith, 1995; Perreault et al., 2007; Putrevu, 2001).
Prior marketing research has supported gender differences in information processing mainly
from the perspective of advertising. Darley and Smith (1975) provided empirical support for the
selectivity model‘s predictions of how males and females process advertising claims as women
in this study were more likely to notice subtle messaging differences and devoted more elaborate
effort in processing both objective and subjective advertising claims. In a critical review of the
literature on the information processing differences between males and female, Putrevu (2001)
recommended that advertisers targeting men (who are selective-processors) focus on a single
theme ad while ads directed at women (who are comprehensive-processors) should contain a lot
of product information. In this case, it was proposed that women will attempt to assimilate all
available information before forming an opinion. Kempf et al. (2006) also found support for the
selectivity hypothesis in a study that showed women as more sensitive and elaborate in the
processing of both advertising and more subtle product trial offers. Men in this study tended to
rely on readily available information and were less likely to seek out additional details regarding
trial offers. Most recently, Goodrich (2014) confirmed the applicability of the selectivity
principle with on-line advertising as women in this study devoted greater attention to text-based
appeals and detailed product explanations while men favoured more graphic-oriented
advertisements. This inquiry also found that women expressed more favourable attitudes
towards advertisements appearing on the right of the page while males were more favourable to
left page ad placement. Kempf et al. (2006) highlighted the need to study gender-based
differences in consumer processing beyond the confines of advertising.

100
2.3.4 Priorities and Interests of Female Consumers
Barletta (2006) stated that ―to motivate and persuade people you have to talk to them about
things they care about, in terms that matter to them, what they cherish, what they‘re proud of,
what they enjoy‖ (p.83). Silverstein and Sayre (2009) found that women‘s priorities include
family, health, security, love, friends, learning/education, career success, helping others, and
giving back. Underhill (2010) followed the path of women through relevant places such as the
home, hair salons, hotels, malls, gyms, and social network sites and summarized women‘s more
practical wants as cleanliness, control, safety and consideration. Warner (2006) introduced the
terms ―gender flipping‖ and ―gender somersaulting‖ (p.49) to describe the tension that women
often feel as they mix and match traditional roles of the past with realities of the present. As an
example of this ―turn and churn of gender roles‖ (Warner, 2006, p.49), women continue to value
a clean home and want to provide healthy and homemade meals for their families but given their
demanding full-time careers, they do not necessarily have the time. Warner (2008) advised
marketers to truly listen to women and learn what is most important to them in their new
realities. In relation to this dissertation, two areas are of most interest: i) women‘s attitudes and
behaviours toward charitable causes, and ii) women‘s intensifying engagement with sport.
Women‘s purchase decisions are often symbolic of greater motivations and meanings
(Grohmann, 2009). Women want to do business with organizations that care, are responsible,
and contribute to societal causes (Barletta, 2006; Warner, 2006). The previous review of cause
sponsorship also revealed compelling evidence that women respond most favourably to cause-
affiliated marketing efforts (Berger et al., 1999; Cone, 2010a; Hyllegard et al., 2011; Irwin et al.,
2003; Ross et al., 1992; Roy & Graeff, 2003). According to Silverstein and Sayre (2009),
women have a passion for giving, are careful about the charities they support and are drawn by

101
the social aspect of banding together for a worthy cause. This trend was also identified in
previously reviewed studies involving participant-based fundraising events (Bennett et al., 2007;
Taylor & Shanka, 2008).
Gender matters in philanthropy as women are generally found to be more likely to give to charity
and to support multiple causes (Piper & Schnept, 2007). In summarizing the literature on
charitable giving, Mesch, Brown, Moore, and Hayat (2011) listed four possible explanations for
observed gender differences in donor behaviour: i) women have been socialized as caregivers, ii)
women view philanthropy as a means of demonstrating their caring, iii) women are more
emotional than men, and iv) women are more egalitarian whereas men are more competitive
(p.344). These authors proceeded to confirm that women were more empathetic and had a
stronger moral sense to help others in need that resulted in a greater propensity to give to charity
and the tendency to donate significantly higher amounts to charity than men (Mesch et al., 2011).
In Canada, reports also confirm that women are more likely than men to donate to a charitable
cause and that women tend to favour health organizations while men direct their donations to
sport and recreational organizations (Turcotte, 2012). Recent studies comparing the moral
philosophies of men and women suggest that, in general, women exhibit higher intentions to
behave ethically and favour companies who are ethically responsible (Bateman & Valentine,
2010; Green & Antoine, 2011).
Sport has already been established as an effective gateway to goodness as more events are
uniting sport and cause for the purpose of mutual gain. Sport is also increasingly considered as a
meaningful platform upon which to engage women consumers (Dodds, DeGaris, & Perricone,
2014). Women represent an important segment of the sport market as female sport opportunities
(for participation and spectatorship) from recreational to professional ranks continues to grow.

102
The 2008 Physical Activity Monitor revealed that 45% of Canadian women are active in sport
compared to 51% of men. Team sport participation has increased among women from 39% in
2004 to 59% in 2008, particularly among 25-44 year olds (CFLRI, 2009). More recently, 25% of
Canadian females (aged 15 and older) reported daily active sport participation with an average
duration of 1 hour and 34 minutes (Statistics Canada, 2010, p.10). Although absolute numbers
may vary, the general findings of the 2005 study of Sport Participation in Canada (Ifedi, 2008)
revealed similar promising results for women and sport. While men in this study appear to
participate more in sport (36% of men), the gap between genders dropped 15 percentage points
from 1998 to 2005 when an encouraging 21% of women reported regularly participating in sport
(Ifedi, 2008, p.18). Equally interesting is the report that women coaches in Canadian amateur
sport (882,000) outnumbered male coaches (874,000) in this same 2005 study (p. 44). When
considering Canadian children aged 5 to 14 years, 44.1% of girls and 55.4% of boys were active
in sport (Ifedi, 2008, p.34). It‘s worth noting in this case that boys‘ participation in sport over
the observed seven year period of 1998-2005 dropped from 58.8% to 55.4% while girls‘
participation rates (44.3.% to 44.1%) remained relatively stable (p.34).
At the collegiate level, Canadian Interuniversity Sport (CIS) is the governing body for university
sport in Canada and offers athletes the opportunity to combine a high-quality sport experience
and a university education. The CIS currently offers eleven women‘s and ten men‘s sports.
With the exception of football for men and field hockey and rugby for women, the sport
offerings are the same for university men and women (CIS, 2011). In 2012-2013, the number of
interuniversity teams for women (482) and for men (483) was virtually equal. In terms of CIS
leadership however, women remain under-represented as 24% of Athletic Directors (up from
17% in 2010-2011) and 17% of head coaches were female (Donnelly, Norman, & Kidd, 2013).

103
The Canadian Collegiate Athletic Association (CCAA) governs college sport in Canada and is
comprised of over 9,000 intercollegiate athletes, 700 coaches and more than 150 sport
administrators (CCAA, 2011). The CCAA offers seven sports with equal access to both male
and female athletes. Similar to the CIS, the majority (88%) of head coaches in the CCAA are
male. The CCAA is investing in the development of female coaches through the Female Coach
Apprenticeship Program (CCAA, 2011).
Female athletes‘ presence at the Olympic level is also noteworthy. In 1896, there was a critical
element absent from the first Modern Olympic Games in Athens: women. No women were
invited to compete in these games and according to the International Olympic Committee, it is
even believed that all contestants, judges, coaches, trainers and spectators were men (IOC, 2008).
Strong lobbying efforts from determined advocates of women and sport changed the
international landscape for female sports. Since the 1980s the Olympic Movement has made
social inclusion and gender equality a priority. In 1995, the IOC Women and Sport Commission
was established with the clear mandate of ―encouraging women to be active in the Olympic
Movement alongside boys and men‖ (IOC, 2008, p.15). At the 2009 Women and Sport Awards
ceremony, Anita DeFrantz, IOC member and Chairwoman of the IOC Women and Sport
Commission stated the following:
On the field of play, we are moving closer and closer to men and women competing in
even numbers on the world‘s greatest sporting stage. It is still the mission of the IOC
Women and Sport Commission to see more women in sport involved in decision-making
and in the media. The landscape is slowly changing, and women will have a much bigger
role to play in sport in the future (www.olympic.org).

104
Women‘s participation rates at the Olympic level have surged from 0% in 1896 to a peak of 44%
at the 2012 London Summer Games (IOC, 2013). At the 2014 Sochi Winter Games, women
represented 45% of Canadian Olympic athletes (Canadian Olympic Committee, 2013). This data
confirms that women have indeed made remarkable inroads at the highest level of athletic
excellence.
Female athletes have also made an impressive mark at the professional sport level. There are a
variety of professional women‘s leagues, most notably the Ladies Professional Golf Association
(LPGA), the Women‘s National Basketball Association (WNBA), the Women‘s Tennis
Association (WTA) and the Pro Beach Volleyball Tour. High profile athletes such as Serena and
Venus Williams (tennis), Steffi Graf (tennis), Annika Sorenstam (golf), Michelle Wie (golf), Mia
Ham (soccer), Gabrielle Reese (volleyball), Hayley Wickenheiser (ice hockey) and Danica
Patrick (auto racing) are among a growing list of female athletes that are becoming household
names and role models for a new generation of girls. Women are also realizing historical gender
breakthroughs at the professional level of traditionally male dominated sports. Women‘s boxing
debuted at the 2012 London Olympic Games, women‘s ski jumping was introduced at the 2014
Sochi Games (IOC, 2013), Danica Patrick was the first women to sit on the pole at the 2013
Daytona 500 and is the only women to lead a lap in this prestigious race (Associate Press, 2013),
and Ronda Rousey defeated Liz Carmouche in the first ever women‘s Ultimate Fighting
Championship in February, 2013 (The Canadian Press, 2013).
In addition to participating in sport, a growing number of girls and women are avid sport fans
and spectators. At the amateur sport level in Canada, 48.3% of spectators are female and 51.7%
are male (Ifedi, 2008). At the professional level, according to Adams (2003), 47% of MLB fans,
46% of NBA fans, 43% of NFL fans, 41% of NHL fans, 41% of NASCAR fans, and 49% of

105
MLS fans are women. Dietz-Uhler, Harrick, End, and Jacquemotte (2000) also found that an
equal number of males and females considered themselves to be sports fans, although in this
study males identified more strongly as sport fans. When considering sport apparel purchases,
Shank (in Armstrong, 2001) reported that women who purchased merchandise for themselves
represented 35% of total NHL licensed product sales, 44% of NBA sales and that 70% of the
NFL‘s female fan base purchased NFL merchandise. Barbano (in Armstrong, 2001) states that
―Not only are women watching men‘s sports, but men‘s sports are watching women - very
closely‖ (p.2). Recognizing the growth and potential of female fans, professional sport
organizations are adapting and increasing their marketing efforts to women. Clark et al. (2009)
detail the success of the NFL‘s ―Football 101‖ clinics that attract over 10,000 women annually.
Others have implemented similar initiatives in an effort to build their female fan base. The
Washington Capitals launched ―Club Scarlet‖, the first NHL customized female fan club
(www.scarletcaps.com). The MLB has also initiated several female-specific initiatives,
including players using pink bats on Mother‘s Day, Baseball 101 educational programs, and
Stitch N‘ Pitch, a ballpark needle point event (Dodds et al., 2014). Dodds et al. (2014) critiqued
such programs as ―pandering to the female fan, similar to the old pink and shrink theory of
merchandising‖ and recommended that baseball sponsors take female fans seriously and market
to them on their sport interest rather than simply gender. There are ―pink versions‖ for
essentially every major league merchandising line. Often sales of these items are tied to
charitable causes, an increasingly common strategy in marketing to female sport fans (Clark et
al., 2009).

106
The above review confirms that women‘s involvement with sport has evolved at all levels (i.e.,
grassroots, collegiate, Olympic, and professional) and in various capacities (e.g., participants,
coaches, and spectators). As with cause, this increased importance of sport in the lives of
women, creates new and expanding opportunities for meaningful consumer engagement. Next,
gender differences in the consumption of sport are highlighted before reviewing existing findings
pertaining to female consumers‘ response to sponsorship.
2.3.5 Gender Differences in Sport Consumption
Research efforts examining gender differences in sport motivations, perceptions and
consumption behaviours have identified important distinctions between male and female sport
participants, fans, and spectators. Eccles and Harold (1991) determined that gender differences
in children‘s attitudes toward sports emerge at a young age and that girls generally feel inferior
to boys in terms of their athletic ability and the importance and enjoyment that they attribute to
the sport domain. Aiken and Sukhdial (2004) established men as having an ‗old school‘
orientation characterized by three main components. These include: i) being a good role model
with strong traditional work ethic, ii) playing for the love of the sport and not being consumed by
inflated egos and materialistic wealth, and iii) putting fair play, respect and sportsmanship above
winning. Contrary to Aiken and Sukhdial (2004), Bush et al. (2007) found that women had more
of an old school sport orientation that surpassed men with respect to the importance of
responsible role models and the belief that teamwork is favoured over winning at all costs.
Wiley, Shaw, and Havitz (2000) found that personal relevance and involvement profiles for
sports vary by gender and that women are increasingly attracted to non-conforming sports (such
as ice hockey) for which opportunities for equal participation were historically limited. Similar
to Bush et al. (2007), Wiley et al. (2000) asserted that women are more likely than men to value

107
the pleasure and enjoyment aspects of sport with less concern for competition and individual
achievement. Similar findings were reported by Dietz-Uhler et al. (2000) who confirmed that
women were more drawn to sports for social reasons that included attending games, enjoyment
of cheering, and spending time with family and friends. Men in this case attributed their fandom
to their enjoyment of participating in sports and acquiring sports information. The social aspect
of sport has been widely acknowledged as a primary motive for female sport participation and
spectatorship as females tend to place greater value on sharing sport experiences (Bush et al.,
2007; Clark et al., 2009; Ridinger & Funk, 2006; Shani, Sandler, & Long, 1992). Armstrong
(2001) suggested that marketers of sport seek image congruency with female fans by promoting
the human qualities of the team. James and Ridinger (2002) found that males reported higher
sport fan ratings than females but that females had stronger allegiance to a specific team (rather
than to sport in general). Women in this study also reportedly felt that women‘s basketball was
more aesthetically appealing than men‘s basketball (James & Ridinger, 2002). This observation
may suggest sentiments of gender solidarity. James and Ridinger (2002) stressed the need to
continue to contrast men‘s and women‘s sports in an effort to better understand possible
differences and similarities in event characteristics and attendees motivations and behaviours.
Kahle, Aiken, Dalakas, and Duncan (2003) proposed that consumers of women‘s sporting events
(including predominantly women but also men) make up an entirely different consumption
community than for men‘s sporting events. A study of 759 consumers of four collegiate
basketball games (two men‘s games and two women‘s games) found that environmental factors
(such as half-time entertainment, food and beverage concessions, comfort and location of
seating, stadium atmosphere, and courteousness of staff) were favoured more strongly by

108
spectators at the women‘s games than spectators at the men‘s games (Kahle et al., 2003). To
note, sponsorship activities were not specifically considered among environmental factors in this
study. The majority (72%) of respondents at the men‘s game were male, while the majority
(57%) of respondents at the women‘s game were female. Fink, Trail, and Anderson (2002)
conducted a comparable study with similar results. This study also found that environmental
variables (promotions, family, friends, and ticket pricing), team loyalty and purchase intentions
(future games and team merchandise) were most significant with spectators of women‘s
basketball games while respondents at men‘s games reported stronger feelings about following
their team in the media, purchasing merchandise and wearing team apparel (Fink et al., 2002).
There is growing observation that women support female sport in part to demonstrate gender
solidarity and to celebrate the development and accomplishments of women in sport (Bennett et
al., 2007; Edwards & La Ferle, 2009; Ridinger & Funk, 2006; Sack & Fried, 2001). Whiteside
and Hardin (2011) recognized the disconnect between growing female sport participation and the
lack of (TV) viewership of women‘s sports. They noted women‘s expressed support for equality
in women‘s sport coverage but also the lack of corresponding devotion to actual consumption of
women‘s sport broadcasts. Thus, the idea of gender solidarity as an influence on sport behaviour
remains rather obscure.
2.3.6 Gender Differences in Sponsorship Effects
Early sponsorship studies seldom considered gender in examining consumer response and Dodds
et al. (2014) caution that females remain an ―under-activated target in terms of sponsorship‖
(p.71). Women‘s increased power and influence (in the marketplace, sports arena and with
charitable causes) has driven a corresponding interest in understanding the role that gender plays

109
in sponsorship outcomes. Since the majority of sponsorship campaigns revolve around some
aspect of sport, the growing importance of sport to women was established above. Sport has
long been a means of reaching male consumers, but according to Lough and Irwin (2001),
women were not considered as targets of sport sponsorship due to a perceived lack of sport
knowledge, sport interest and marketplace power. Shaw and Amis (2001) raised the question
that ―If sport sponsorship is seen as a viable medium through which to influence actual and
potential male consumers, then could it not be used to influence females in a comparable way?‖
(p.227). A case study approach guided these authors to conclude that there is ―no evidence, or
logic, to suggest that it could not‖ (Shaw & Amis, 2001, p.227).
In 1992, Shani et al. were among the first to identify sport as an untapped opportunity to engage
female consumers. A content analysis of advertising shown during the men‘s and women‘s 1990
US Tennis Open revealed that marketers at this time, ―made almost no attempt to appeal to the
female market as a separate segment having different needs‖ (Shani et al., 1992, p.392). In 1995,
a featured article in Marketing News (Rubel, 1995) brought further attention to the sponsorship
of women‘s sports as an emerging and unsaturated means of marketing to the lucrative female
market. Sack and Fried (2001) found that women‘s sport sponsorship was increasingly
prominent in promotional efforts and that women‘s sport (tennis in this case) could transcend
gender as it was enjoyed not only by women, but also by male fans. Over the past several
decades, the sponsorship of women‘s sport has gained momentum and greater credibility as an
effective means of reaching specific consumer segments, overcoming sponsorship clutter,
projecting a wholesome and positive image, accessing cooperative and responsible female role
models, and conveying a corporate commitment to the movement of female sport development
(Lough & Irwin, 2001; Maxwell & Lough, 2009; Sack & Fried, 2001; Shaw & Amis, 2001).

110
Earlier in this review, gender differences in cause-related marketing and advertising response
were presented. This final section considered existing knowledge as it pertains to gender
differences in response to sponsorship. Table 11 summarizes (in chronological order) an
additional twelve studies specific to gendered consumers‘ response and brings together all other
studies (one from sponsorship review and six from cause review) referenced throughout this
analysis that in some manner consider gendered response at the cognitive, affective and /or
behavioural levels.
The contexts of these investigations span a range of sponsorship scenarios including sport
sponsorship (male, female, and gender-neutral sports at the collegiate, Olympic and professional
levels), CRSS (male, female, gender-neutral sports and causes), celebrity endorsements (male
and female athletes and non-athletes), cause-related advertising (in service, apparel and
consumer packaged goods industries) and more general cause association marketing.
Participants in these inquiries included event attendees, broadcast viewers and in most cases,
convenient samples in controlled settings. In fact, ten of these nineteen studies (53%) include a
student sample. A notable gap in these analyzed efforts is consideration for sponsorship effects
on event participants.
Findings from these studies support growing propositions that gender is a significant variable in
consumer response at the cognitive, affective and behavioural stages. In addition to addressing
the acknowledged need to move beyond mere sponsor recognition and to more effectively
measure consumer engagement, Alay (2008), was among the first to solely focus on female
response to sponsorship. Alay (2008) extended the determinants of sports sponsorship response
framework presented by Speed and Thompson (2000) in order to investigate sponsorship

111
response (also measured in terms of interest, favourability and use) of 413 female university
students in Turkey. The design of this study was completely female oriented. In addition to an
all-female sample, this investigation focused on the sponsorship of women‘s sport (specifically,
the European Women‘s Volleyball Championship) by a female-only product line (feminine
hygiene). Alay (2008) relied on the Sponsorship Evaluation Questionnaire (SEQ) to collect data
for this study. This 55-item-11 component SEQ was originally inspired by Speed and Thompson
(2000) and subsequently confirmed as a valid and reliable tool for measuring the effects of
sponsorship by Alay (2010). The first part of the SEQ includes 43 items under eight subscales of
determinants of sponsorship response which consist of: i) status of the event, ii) attitude toward
the event, iii) personal liking of the event, iv) attitude toward the sponsor, v) image of the
sponsor, vi) sincerity of the sponsor, vii) ubiquity of the sponsor, and viii) sponsor-event fit. The
second part of the questionnaire measures consumers‘ response to sponsorship using 12 items
that are captured through three additional outcome components: ix) interest, x) favourability, and
xi) use.
Consistent with Speed and Thompson (2000), Alay (2008) concluded that in general all
identified event, sponsorship and sponsor factors effect sponsorship response in terms of interest,
favourability and the use of sponsors‘ products. The only contradiction between these studies
was that Alay (2008) found that dislike for an event can be overcome by strong sponsor-event fit
and still positively influence product use. In order to maximize sponsorship outcomes with a
female audience, this study recommended that a suitable fit between sponsor and event be
established, that the sponsor exhibit genuine sincerity, and that high-status events be selected.
The significance of these particular constructs with a female audience served as an important
guide in the design of this current dissertation.
112
Speed and Thompson (2000), as well as Alay (2008; 2010), grouped the determinants of
sponsorship response according to consumers‘ perceptions of event factors, sponsorship factors,
and sponsor factors. Although some of the variables across these three main groupings are
elements of involvement (such as personal liking for the event and attitude to the event) these
versions of the model do not specifically emphasize personal involvement as a distinct influential
factor on consumer response.
Alay‘s (2008) study was limited to female response and therefore no gender comparisons could
be drawn. The remaining studies in Table 11 all include both male and female subjects in order
to distinguish the magnitude of behavioural difference between genders. Only one of the
reviewed studies found that male respondents consumed more of the sponsored product than
females (Bennett et al., 2009). In this case, the choice of sponsor (Mountain Dew soft drink) and
the particular sporting event (extreme sport) were both male skewed which the authors
acknowledged as a possible influence on observed outcomes. In a study involving NASCAR
fans, Kinney et al. (2008) found that male respondents were able to recall a slightly larger
number (2-3) of sponsors than female fans while a study of Olympic sponsors‘ advertising
revealed no gender difference in sponsor recall or ability to distinguish official sponsors from
ambush marketers (McDaniel & Kinney, 1998). Pham (1992) unexpectedly corroborated reports
that males outperform females in sponsorship recognition and concluded that men‘s higher level
of involvement with the sport (Belgian soccer in this case) lead to higher order processing of all
details surrounding the event while women‘s lower level of sport (i.e., soccer) knowledge
resulted in more attention being devoted to the game itself and reduced notice of surrounding
stimuli such as sponsor messaging. Lake, Reece, and Rifon (2010) concluded that men were
more forgiving than women of celebrity athletes‘ negative publicity. Partnering with a credible

113
and suitable celebrity is paramount for female consumers as they show favour for positive role
models with a team above self-approach (Bush et al., 2004; Bush et al., 2007) and tend to trust
female endorsers more than male endorsers (Edwards & La Ferle, 2009).
The inclusion of cause truly resonates with women and motivates them at all levels of effect
(Berger et al., 1999; Hyllegard et al., 2011; Irwin et al., 2003; Roy & Graeff, 2003). The impact
of cause is reported by some to be greatest with mothers (Cone, 2010a; Ross et al., 1992).
Maxwell and Lough (2009) found that spectator identification was a stronger predictor of
sponsor recognition than was gender. Similarly, Tobar (2006) reported that enjoyment of Super
Bowl advertisements (for which women scored higher) was the best predictor of purchase
intentions. The thought that men and women identify differently with certain sports or causes
was considered in the design of this dissertation.
A final observation drawn from this summary of studies (i.e., Table 11) is the dates of these
published reports. Only five studies were conducted in the 1990s while fourteen studies were
completed in the 2000s (of which twelve are from 2006 or later). Recent increased research
attention in this trending area is very promising and is reflective of a subject prime for further
inquiry and discovery. The latest CSLS reported that very few sponsorships (4.8%) currently
target women however 31% of sponsors indicated that they expect sponsorship targeting women
to increase (O‘Reilly & Biselt, 2013). Dodds et al. (2014) recently found that gender plays an
important role in sponsorship promotion and stated that: ―it is imperative that academic research
begins to examine the role of gender as it affects sponsorship activation‖ (p.72).

114
Table 11: Summary of Gender Difference in Sponsorship Effects Studies
Findings
Author(s)
(Year)
Context Sample /
Event
Cognitive
Stage
Affective
Stage
Behavioural
Stage
McDaniel &
Kinney
(1998)
Sport
Sponsorship
(TV
spectators)
n=215
university
students (U.S.,
58% female)
Event:
experiment
(Olympic
advertisements
of official
sponsors and
ambushers)
Gender did not
impact the
ability to
correctly recall
or recognize
official
Olympic
sponsors.
Females had more favourable
attitudes and purchase
intentions for two of the three
sponsored product categories
tested (fast food and credit card
companies.) Findings may have
been influenced by category
choice or creative execution.
McDaniel
(1999) Sport
Sponsorship
(TV
spectators)
n=216
university
students (U.S.,
59% female)
Event:
experiment
Women process
information
differently.
Females responded more
favourably (attitude toward ad
and purchase intention) to sport
sponsorship than did men.
Bush, Martin,
& Bush
(2004)
Celebrity
Athlete
Endorsement
n=218
Generation Y
(aged 13-18,
46% female)
Event:
experiment
Females
favoured
products that
were
endorsed by
their
favourite
sport role
models.
-Females were
more
influenced by
sport celebrities
and more likely
to spread
positive word-
of-mouth about
endorsed
products.
-Females
agreed more
than males that
athlete role
models
influence them

115
to buy certain
brands.
Tobar
(2006)
Sport
Sponsorship
(TV
spectators)
n1=81 students
(27% female)
n2=111 parents
(54% mothers)
Event: Super
Bowl television
spectators
-Men
reported
higher sport
fandom
scores than
women.
-Women
reported
elevated
scores for
tension and
vigour
compared to
men before
the Super
Bowl but
lower scores
following the
game.
-Women
reported
higher
enjoyment of
the half-time
show.
Gender was not
found to
influence
purchase
intentions while
enjoyment of
the
advertisements
was the best
predictor of
purchase
intentions.
Bush, Bush,
Shannahan, &
Dupuis
(2007)
Celebrity
Athlete
Endorsement
n=303
university
adults (80%
US, 20%
Canada, 45%
female)
Event:
experiment
Women had
more of an old
school’ sport
orientation
(believe that
athletes should
be good role
models and that
winning is not
everything).
-The more females believe that
athletes should be good role
models, the more their favourite
athlete influences their
switching behaviour.
-The more women believe that
winning is not everything, the
less their favourite athlete
influences their brand loyalty.
-Women‘s brand loyalty is
more influenced by athletes
who represent teamwork (vs.

116
winning).
Alay
(2008)
Female Sport
Sponsorship
(event
spectators)
n=413 female
students
(Turkey)
Event:
European
Women‘s
Volleyball
Championships
Sponsor-event fit, sincerity of sponsor, interaction
of fit with status of event all influenced female
consumers‘ interest, favour, and use of sponsor‘s
products.
Kinney,
McDaniel, &
DeGaris
(2008)
Sport
Sponsorship
(fans)
n=935
NASCAR fans
(U.S.. 42%
female)
Event:
NASCAR
sponsorships
Fan
involvement
predicts sponsor
recall.
Males were able
to recall a larger
number (2-3) of
sponsors than
were female
respondents.
Bennett,
Ferreira, Lee,
& Polite (2009)
Sport
Sponsorship
(event
spectators)
n=552
attendees (35%
female)
Event: Dew
Action Sports
Tour (U.S.)
Age, gender
and
spectatorship (4
measures of
involvement)
had a direct
impact on
sponsor‘s brand
use. Young
males were
more likely to
consume
Mountain Dew
than females.
Edwards &
La Ferle
(2009)
Celebrity
Endorsement
n=135 college
students (U.S.)
Event:
experiment
-Women
rated
celebrity
endorsements
more

117
positively
than men.
-Women
rated female
celebrity
endorsers as
more
trustworthy
while men
rated male
endorsers as
more
trustworthy
(gender
congruity
was found to
be important)
Maxwell &
Lough
(2009)
Female Sport
Sponsorship
(event
spectators)
n1=316 (65.5%
female)
n2=334 (72.2%
female)
Event: NCAA
women‘s
basketball
games (U.S.)
-Gender did not
contribute
significantly to
correct
sponsorship
recognition.
-Spectator
identification
and age of
spectators both
contributed to
correct sponsor
recognition.
Lake, Reece, &
Rifon
(2010)
Celebrity
Athlete
Endorsement
n=240
university
students (U.S.)
Event:
experiment
Males had a
more
favourable
attitude
toward a
sport
celebrity
endorser
when
exposed to
negative

118
feedback.
Males were
more
forgiving of
negative
publicity than
females.
Commitment
to the team
and sport
lessened the
effect of
negative
publicity
about the
celebrity
athlete.
Dodds,
DeGaris, &
Perricone
(2014)
Sport
Sponsorship
(baseball fans)
n=1,000 U.S.
baseball fans
(42.2% female)
Event: national
telephone
survey
Both women
and men had
similar levels of
baseball fan
avidity however
males were
more interested
in MLB while
women were
more interested
in little league
(suggesting
strong market
of Little League
Mothers).
Female fans
were less aware
of baseball
sponsors‘
promotions.
Women
(55.7%)
participated
more in general
sales
promotions
than did men
(42%).
For baseball
sponsors‘
promotions, no
significant
gender
differences in
response.
Both men and
women
preferred free
gifts over
sweepstakes
while women
preferred
different
rewards (e.g., t-

119
shirt) than men
(e.g., team
cap).
The following gender-findings are pasted from sponsorship studies summarized in Table 5
Pham
(1992)
Sport
Sponsorship
(TV
spectators)
n=85 university
students
(Belgium)
Event:
experiment
Gender effect
observed as
males
outperformed
females in
recognition
tests.
The following gender-findings are pasted from cause studies summarized in Table 10
Ross, Patterson,
& Stutts
(1992)
Cause-Related
Advertising
(consumer
packaged
goods)
n=238 US
adults
Event:
experiment
(mall intercepts
testing CRM
efforts of P&G)
Women had a
more positive
attitude than
men toward
both the firm
and the cause
that used
CRM.
CRM had a
positive
influence on
purchase
intention,
particularly
among women
and
respondents
who had
children.
Berger,
Cunningham,
& Kozinets
(1999)
Cause-Related
Advertising
(service
industry)
n1= 196
students
(50.5% female)
n2= 210
students
(50.5% female)
Event:
experiment
Female students had more
positive attitudes and higher
purchase intentions for brands
that use cause-related
advertising than did male
students.
Irwin,
Lachowetz,
Cornwell, &
Clark
(2003)
Cause-Related
Sport
Sponsorship
(event
spectators)
n= 442 (31%
female)
Event: FedEx
St. Jude Golf
Classic
Female participants‘ attitudes, beliefs, and
purchase intentions were stronger than males.

120
Roy & Graeff
(2003)
Cause-Related
Sport
Sponsorship
(professional
sport fans)
n=500 US
adults (48.8%
female)
Event:
experiment
(telephone
interviews,
local NFL
team)
Females had a
stronger image
of a local team
if they
partnered with
causes.
Cone
(2010a)
Cause
Associated
Marketing
n=1057
American
adults (51.6%
female)
Event: online
survey
95% of
Moms
believe that
cause
marketing is
acceptable
(vs. 88%
average)
-93% of Moms
are likely to
switch brands
to one that
supports a
cause (price
and quality
being equal).
-92% of Moms
want to buy a
product that
supports a
cause.
Hyllegard, Yan,
Ogle, &
Attmann
(2011)
Cause-Related
Advertising
(apparel
industry)
N=562 GenY
college
students (US,
51.4% female)
Gender did not influence brand
attitudes but did predict
purchase intention. Females
were generally more involved
and recorded stronger intentions
to purchase sponsors‘ brands.
After establishing the prominence of the female consumer market, this section elaborated on key
gender differences that are most significant to this particular dissertation. Gender differences in
information processing were identified as the basis for many of the reported differences in
consumer response to advertising, cause-affiliated marketing and most notably (for this inquiry),
sponsorship response. The importance of cause and sport to women was also established
through this review of literature in order to substantiate the current study‘s focus on CRSS.

121
Chapter 3
3.0 Conclusions from Literature Review and Conceptual Framework
The literature review undertaken in support of this dissertation involved close to three hundred
sources across the fields of sponsorship, corporate social responsibility /cause-affiliated
marketing, and gender research in both marketing and sport management. This chapter begins
with a summary of acquired learning from these areas. Next guiding principles revealed through
the examination of existing knowledge are directly linked to the purpose and design of this
dissertation. These findings serve as the basis for the conceptual framework of consumer
processing of CRSS that was tested through this study.
3.1 Conclusions from Literature Review
This comprehensive analysis of sponsorship-related sources extends earlier scholarly efforts
(Cornwell & Maignan, 1998; Walliser, 2003) to present verified knowledge regarding
sponsorship. This review also profiles recent trends in sponsorship practice and highlights key
areas in need of further exploration.
The literature supports the legitimacy of sponsorship as an integral element of the promotional
mix (Ali et al., 2006; Seguin & O‘Reilly, 2008; Shanklin & Kuzma, 1992). Corporate
investment in sponsorship continues to grow while the nature and managerial expectations also
have evolved in terms of complexity as well as sophistication. Today‘s sponsorship is no longer
a pure philanthropic gesture of goodwill but rather it is an important strategic business-building
approach that is capable of realizing significant corporate objectives, necessary consumer effects,
and socially demanded goodness (Cahill & Meenaghan, 2013; Cornwell et al., 2005; Farrelly et

122
al., 2006; Gwinner et al., 2009). Meenaghan (2013) recently described today‘s sponsorship as a
‗versatile platform for communication and engagement with multiple stakeholders‖ (p.387).
Meenaghan et al. (2013) elaborated on this broadened view of sponsorship by listing seven
stakeholders of sponsorship. These include: i) internal staff, ii) trade associates/ suppliers/
distributors, iii) government/ regulators, iv) shareholders, v) rights holders, vi) media, and vii)
customers. These authors highlighted that such multi-stakeholder platforms are a significant, but
largely overlooked trend in the sponsorship industry.
While several forms of sponsorship exist, the unique intensity, drama and emotion of sport
render this the dominant choice of sponsors and an ideal gateway to consumer passion and
engagement (Bal et al., 2009; Quester, 2005). Similarly, cause sponsorship is reportedly also
enjoying a surge in both consumer and corporate interest, bringing attention to the notion of
corporate goodwill (IEG, 2014; Johnston, 2010). The merging of sponsorship types (such as
sport with cause) was presented as gaining significant momentum as sponsors seek to deliver
exponential consumer impact (Fortunato, 2013; Roy, 2011; Walker & Kent, 2009; Watt, 2010).
This unity is however blurring traditional sponsorship boundaries and impacting the neat
classification of sponsorship activity. This progression of sponsorship into hybrid forms of
identity is reflective of a domain in a state of transformation and in need of evolved
understanding.
Theories relating to the need for congruency (Chien et al., 2011; Fleck & Quester, 2007;
Gwinner & Bennett, 2008) and the process of image transfer (Grohs & Reisinger, 2005; Gwinner
et al., 2009; Meenaghan, 2001b) in sponsorship as well as perceived sponsor sincerity (Alay,
2008; Speed & Thompson, 2000) are well developed and supported throughout the literature.
Consumer involvement was also identified as an important moderator of sponsorship effects and

123
is considered a multi-dimensional construct that can significantly vary by consumer segment
(Alexandris & Tsiotsou, 2012; Close et al., 2006; Gwinner & Bennett, 2008; Ko et al., 2008).
Comparing involvement levels across different consumer groups (such as gender) and
understanding the corresponding impact of this variable on sponsorship response is drawing
increased research attention.
Researchers strongly advocate for further strategic evaluation of sponsorship efforts. Simply
relying on awareness measures is generally regarded as insufficient to accurately capture the
potential consumer impact of modern sponsorship campaigns (Crompton, 2004; O‘Reilly &
Madill, 2009; Sneath et al., 2005). The hierarchy of effects model was revealed as a primary
theoretical framework adopted throughout the literature to measure consumer response at the
cognitive, affective, and behavioural stages (Alay, 2008; Chanavat et al., 2009; Prendergast et
al., 2010; Speed & Thompson, 2000). An analysis of thirty-three general sponsorship effect
studies; fifteen cause-affiliated marketing studies; and twelve gender-based sponsorship response
studies corroborate the view that sponsorship can impact consumers at all levels of effect.
The review of sponsorship activation and the growing observance of purposeful ambush attempts
highlighted important trends in sponsorship practice. Sponsorship is an increasingly cluttered
landscape that requires creativity, experiential consumer exchange and full integration in order to
provide a compelling point of differentiation in a competitive marketplace (Bal et al., 2009;
DeGaris et al., 2009; O‘Keefe et al., 2009). Simple logo placement once deemed acceptable as
sponsorship activation is no longer enough to motivate consumers. Social media, reciprocal
engagement, and the emotional leverage of meaningful properties (sports, causes, etc.) are
acknowledged trends in the most recent sponsorship findings (Cahill & Meenaghan, 2013;
Meenaghan et al., 2013; Steyn, 2009). Sponsorship is still considered to be a young and

124
evolving field with ample opportunity for the discovery and contribution of new knowledge.
Much of the current understanding of sponsorship has been derived from experimental settings
prompting more recent appeals for greater external validity through realistic field-based studies
(Close & Lacey, 2013; Gwinner et al., 2009).
The review of cause-related sources confirmed that corporate connection to cause is a growing
and credible means of brand marketing. Goodness is indeed required and rewarded for
organizations that truly commit to long-term, fitting partnerships that leverage or enhance the
emotional involvement of consumers (Fortunato, 2013; Plewa & Quester, 2011; Pope, 2010).
The tangible benefits of cause-related efforts have incited a surge in corporate-cause partnerships
thereby creating some clutter and blurring of sectors (as also noted in the main sponsorship
review). Success therefore requires strategic thought and execution. Among these key strategic
decisions, is the selection of sponsorship partners.
The societal importance, massive reach and emotion of sport (at all levels) render it a natural
conduit to goodness (Roy, 2011; Walker & Kent, 2009; Watt, 2010). The unity of business,
sport, and cause at both participant and spectator-based events is increasingly common and
effective at communicating shared values and delivering mutual gain for all involved parties.
Sponsorship effects in such increasingly popular settings however remain under-investigated.
According to Walker and Kent (2009), ―while the study of CSR has become increasingly
prevalent in the management and organizational behavior literature, the concept has only
recently entered the sport management discourse‖ (p.746).
The examination of cause-affiliated marketing progressed from the broader sponsorship review
and was afforded individual consideration due to the significance of the CSR movement and the

125
many facets of cause that seep beyond the confines of sponsorship application. A broad
introduction of CSR was channeled to focus on the main tenants of cause sponsorship. The
benefits to the nonprofit sector distinguish cause from other types of alliances and compound the
potential for emotional involvement and leverage (Hyllegard et al., 2011; Menon & Kahn, 2003).
The sponsor-sponsee partnership is expanded in these cases to include a third-party cause.
Consumers value this additional interest and demand transparency in charitable dealings (Cone,
2001a). As in other forms of reviewed sponsorship, the significance of fit, perceived sincerity,
and involvement as a multidimensional construct were stressed in the review of cause (Chang,
2012; Close & Lacey, 2013; Pearsall, 2009; Roy, 2011; Zdravkovic et al., 2010). Although not
yet thoroughly tested, the literature (Funk et al., 2001) suggests that involvement can be gender-
based and that women may respond more favourably to opportunities to be involved with and/or
support other women (through cause, sport, etc.).
In order to further assess consumer response, fifteen additional consumer effects studies were
considered in the context of cause and were found to support the developing proposition that
cause partnerships effectively motivate consumers at all levels of the hierarchy of effects (Chang,
2012; Filo et al., 2010; Hyllegard et al., 2011; Lacey et al., 2010; Walker & Kent, 2009). Forty
percent of these studies considered gender and found that women (in particular mothers) are
more receptive and impacted by cause efforts. The prevalence of gender consideration in cause
effect studies is observed mainly in more recent publications (since 2000) and is in need of
reinforcement.
Cornwell and Coote (2005) recognized a critical disconnect between increased industry spending
in cause sponsorship and corresponding research efforts, claiming that ―the sponsorship of cause
is all but ignored‖ (p.268). Pharr and Lough (2012) more recently also acknowledged that

126
although CSR has been the focus of academic research since the early 1980s, CSR in sport has
only recently begun to receive research attention. The need to better understand consumer
response to cause marketing efforts is strongly advocated (Geue & Plewa, 2010; Irwin et al.,
2003; Lacey et al., 2010; Walker & Kent, 2009) as is the persistent knowledge gaps in the
application of CSR in the area of sport (Chang, 2012; Filo et al., 2010; Lachowetz & Gladden,
2003; Pharr & Lough, 2012; Plewa & Quester, 2011). The majority of CRSM or CRSS findings
have been spectator based, highlighting the need for expanded consideration at the growing
participant level (Taylor & Shanka, 2008; Wood et al., 2010). The role of gender in response to
cause associated marketing efforts is also being noticed, and given the increasing influence of
women, is expected to draw more research attention (Ross et al., 1992; Wheeler, 2009).
The third section of the literature review considered gender differences in consumer behaviour.
Gender is an important construct in marketing as it remains the most common basis for consumer
segmentation (Perreault et al., 2007; Putrevu, 2001). Marketers also recognize the enormous
profit potential in targeting the lucrative female consumer market (Barletta, 2006; Skoloda, 2009;
Silverstein & Sayre, 2009). As such, understanding meaningful gender differences is of great
interest and concern for marketing scholars and practitioners.
Women and men are indeed different in many significant ways. The selectivity model is well
grounded in the reviewed literature and suggests that women are more comprehensive
information processors while men are more selective in the information that they consider and
the pace at which they make decisions (Meyers-Levy, 1989). Women are believed to devote
more effort to gathering and evaluated broad sources of information and opinions that aid in
making the most perfect decisions (Green & Antoine, 2011). In comparison, men are considered
more likely to streamline their decision-making, considering only a subset of readily available

127
information and relying mainly on existing knowledge (Wajda et al., 2008). A key point in
applying the selectivity hypothesis, however, is that these patterns are subject to situational
influences (Darley & Smith, 1995). Men will engage in more elaborate processing if they are
adequately prompted to do so. Sport may serve as such a prompt.
Sport has long been used to reach and engage avid male athletes and sport fans. It was not until
the 1990s that savvy marketers began to recognize the untapped opportunity to connect with the
increasingly lucrative female market through the uncluttered and progressively meaningful
medium of sport (Shani et al., 1992; Rubel, 1995). Sport is relevant in women‘s lives. Sport
connects women to other women and to social causes that they care about. Sport is the basis for
meaningful and at times, fanatical relationships. Involvement (or fan identification) is a key lever
in consumer response and it is proposed that the strength of this influence is magnified by the
blending of two passion points; sport and cause. The marriage of sport and cause is particularly
attractive to women but has received minimal research attention (Irwin et al., 2003; Roy &
Graeff, 2003).
This examination of literature dedicated particular attention to consumer processing of
sponsorship. The SEQ was identified as a valid and reliable measurement of consumer response
to sponsorship. Speed and Thompson (2000) used this questionnaire with a student sample in
Australia while Alay (2008) employed it with female students in Turkey. There remains ample
opportunity to integrate these measurement scales in examining Canadian events (such as cause-
related sport) that engage on-site spectators and/or participants of both genders.
Gender congruency was also noted throughout the reviewed literature with findings suggesting
that women trust women and seek to support female sports and causes (Bennett et al., 2007;

128
Edwards & La Ferle, 2009; Funk et al., 2001; Ridinger & Funk, 2006; Sack & Fried, 2001).
Whether gender solidarity is a factor in female sponsorship response was not revealed through
this extensive review of existing literature, thereby establishing a meaningful line of inquiry.
The literature insists that further attention and investigation are required to better understand the
many dimensions surrounding the dynamics of women and sport. Specifically, research is
needed in the areas of women‘s sports fans and spectators (Bush et al., 2007; Kahle et al, 2003;
Ridinger & Funk, 2006), the sponsorship of women‘s sports (Sack & Fried, 2001; Shaw & Amis,
2001) as well as gender effects in sponsorship (Dodds et al., 2014; McDaniel & Kinney, 1998;
McDaniel, 1999). Pegoraro (2009) articulated this need, stating that, ―The question facing us all
is how best to use sponsorship to connect with the ever-increasing valuable female consumer
segment‖ (p.300). Presuming that involvement levels will be elevated by sheer event attendance,
Kinney et al. (2008) advocated for on-site data collection as Bush et al. (2007) suggested that
samples be extended to the Canadian market. The blending of sport and cause in an effort to
reach and engage women is also recommended as an area in need of initiating insight (Lough &
Irwin, 2001; Pegoraro, O‘Reilly, & Levallet, 2009).
Table 12 summarizes ten principal findings derived from the reviewed literature that guided the
development of this dissertation.
Table 12: Summary of Guiding Literary Findings
Guiding Literary Findings Application to Dissertation
1. Sponsorship is evolving with the blending of
sport and cause at all levels of sport (i.e.
grassroots, collegiate, professional). CRSS is
only beginning to draw research attention.
This dissertation focuses on the emerging area of
cause-related sport sponsorship. Various levels of
the sport of hockey (both women and men‘s) were
considered as well as a variety of causes (cancer
and social) linked to these specific events.

129
2. Several variables were identified as
determinants of sponsorship response. These
include: status of event, liking of event, attitude
to event, sponsor-event fit, attitude to sponsor,
sincerity of sponsor, ubiquity of sponsor, and
image of sponsor. Involvement is a key
multidimensional construct that also predicts
sponsorship response.
The focus of this dissertation is consumer response
to sponsorship. The primary motivations identified
through the reviewed literature guided the selection
of variables to be measured. While elements of
involvement were considered by others, this study
heightens the focus of this consumer variable from
both a sport and cause perspective at a mix of both
female and male-based hockey events linked to
different types of charitable causes.
3. The hierarchy of effects model is a prevalent
tool to measure sponsorship response.
The hierarchy of effects model guided the
measurement of consumer response in terms of; i)
interest; ii) favourability; and iii) use. Reliable
scales from previous studies (Speed & Thompson,
2000; Alay, 2008; 2010) were adapted to best fit
the context of this study.
4. Women value corporate goodness and respond
to sincere cause associations.
Cause/charity associations were inherent in all
sampled sport venues. Perceived sincerity of the
sponsor was considered among the predictors of
sponsorship outcomes.
5. Women are increasingly involved in sport while
their sport consumption differs from that of
men.
Women‘s involvement with sport was measured
alongside their involvement with cause to establish
a more robust view of consumer involvement.
Similar metrics were collected for men in order to
draw meaningful gender comparisons.
6. Gender solidarity in the form of women
supporting women is suggested but untested in
the context of sponsorship research.
Gender support is introduced in this study as a
consumer factor in the sponsorship process and is
independently considered for both genders (i.e.,
women supporting women, women supporting
men, men supporting women, men supporting
men). This gender support variable was measured
and contrasted at both women and men‘s sporting
events. In order to partially control for sport
variance, the studied sport (hockey) was consistent
in all tested spectator sponsored events.
7. The Sponsorship Evaluation Scale (SES) is a
valid and reliable instrument to measure the
effects of sponsorship.
The SES was used as appropriate in the
development of applicable measurement scales.
8. The effect of gender in sponsorship response
has received limited research attention.
The purpose of this dissertation is to further the
understanding of consumer response to
sponsorship. Gender comparisons of main effects

130
and interactions of key sponsorship determinants
provide insight into the magnitude of gender
differences in sponsorship outcomes.
9. Many sponsorship investigations are
experiment-based in controlled settings. There
is a need to capture consumer response in more
realistic field settings.
In order to capture the essence of the actual
sponsorship experience, data was collected from
spectators at multiple charity-linked hockey events.
10. There is a noted absence of Canadian-based
sponsorship effects studies.
This study collected data from five different CRSS
events across three different Canadian cities in the
province of Ontario.
3.2 Development of Conceptual Framework
The analysis of existing theories presented through this review of literature guided the
development of a conceptual framework of relationships that were investigated through this
current study. This inquiry is grounded in the theoretical framework originally introduced by
Speed and Thompson (2000) and later extended and validated by Alay (2008; 2010). Adopting a
classical conditioning framework, Speed and Thompson (2000) tested six independent variables
as determinants of sponsorship response (measured by the three dependent variables of interest,
favorability and use). Alay (2008) added two additional independent measures (attitude to event
and image of sponsor) for a total of eight independent variables measuring the same three levels
of sponsorship response in accordance with the hierarchy of effects model. As previously
detailed, these earlier investigations confirmed significant relationships between these factors
and sponsorship response.
The proposed framework in Figure 5 omits variables strongly supported in previous models
(such as status of event, attitude to sponsor, image of sponsor and ubiquity of sponsor) in order
to introduce and focus on consumer elements proposed to be of particular importance to a female

131
audience and previously unexamined in the proposed sponsorship setting of cause-related sport.
Gender is the principal component driving this inquiry and, as such, all proposed relationships in
the sponsorship process were tested for significant gender influence. Personal involvement is
also central to this proposed framework and was considered on two levels: i) involvement with
the sport, and ii) involvement with the cause. It is important to note that earlier models also
acknowledged forms of personal relevance or involvement (i.e., personal liking of event, attitude
to event) under the grouping of ―event factors‖. Given the multidimensional nature of
involvement as well as potential gender interactions with this variable, involvement in this model
is considered as a separate consumer construct that mediates consumer perceptions and
ultimately consumer response to sponsorship. As noted, an extensive review of sponsorship
literature did not reveal any studies that have considered the influence of gender solidarity on
sponsorship response. The importance of gender support however was strongly conveyed
through efforts in the areas of marketing to women, sport management, and cause marketing and
is therefore introduced in this model as a possible influence on sponsorship outcomes.
Sponsorship factors include sponsor-event fit and perceived sincerity of the sponsor and are
preserved as in past models given the importance of these variables in previous studies.
Sponsorship response is the final stage of this examined process and measurement of these
outcomes conforms to the well-established hierarchy of effects model. Consumer cognition is
measured through interest in the sponsor, affection is assessed through sponsor favourability, and
behavioural effects are tracked through consumers‘ intended use of the sponsor‘s offerings.

132
Figure 5: Conceptual Framework for Current Study – Consumer Processing of CRSS

133
Chapter 4
4.0 Research Hypotheses and Methodology
This chapter begins by formalizing the purpose of this dissertation. The hypothesized
relationships captured in the proposed framework of consumer processing of CRSS are then
developed followed by a detailed account of the design and methods used to fulfill the stated
purpose of this dissertation.
4.1 Research Purpose
The purpose of this dissertation is two-fold. First, this research contributes to an understanding
of the effects of the emerging area of cause-related sport sponsorship on consumer perceptions
and responsiveness in terms of sponsor interest, favourability, and intended use. Second, this
investigation examines the potential influence of gender at all stages of the sponsorship process.
The proposed model highlights multiple paths of possible influence for both women and men to
process sponsorship factors and to respond at the various levels of effect, leading to the
investigation of the relationship between five possible predictors of sponsorship response. These
include gender, personal involvement (with sport and with cause), gender support (for women
and for men), sponsor-event fit, and perceived sincerity of the sponsor.
4.2 Hypotheses Development
There are three categories of variables from which the hypotheses for this study were formed.
The categories are: a) consumer factors (gender, personal involvement with the sport, personal
involvement with the cause, gender support for women, gender support for men), b) sponsorship
factors (sponsor-event fit, and perceived sincerity of the sponsor), and c) sponsorship response

134
in accordance with the hierarchy of effects (interest, favourability, and use). Eleven hypotheses
were developed grounded in these categories. Each proposed relationship was also tested for
possible gender influence in an effort to highlight any significant differences between the
processing and response of women and men in the context of this cause-related sport sponsorship
investigation.
A. Consumer Factors:
Published studies have demonstrated that involvement levels in sport settings can vary
significantly by gender and that sponsorship response is positively linked to high involvement.
Several cases have found male involvement in sport to exceed that of females (James &
Ridinger, 2002; Kinney et al., 2008; Pham, 1992). Cause involvement however is suggested to
generally favour females. Female involvement with cause has been shown to exceed male
involvement and positively influence attitudes and intentions to purchase sponsors‘ brands
(Berger et al., 1999; Hyllegard et al., 2011; Ross et al., 1992; Roy & Graeff, 2003). Given that
all investigated sporting events also incorporated a strong cause connection, it is hypothesized
that the interactions between tested constructs will be stronger for women than for men. This
strong stance in terms of gender expectations reflects the charitable emphasis and cause-themed
promotion of the examined venues. In terms of sponsorship outcomes, consumer involvement or
identification with sport or cause has also been proven to have both a direct and indirect effect on
consumer responsiveness (Alexandris & Tsiotsou, 2012; Berger et al., 1999; Cornwell & Coote,
2005; Donahay & Risenberger, 2007; Ko et al., 2008; Lings & Owen, 2007; Madrigal, 2001;
Maxwell & Lough, 2009; O‘Keeffe & Zawadzka, 2011). Guided by this learning, the following
consumer factor hypotheses are presented:

135
H1: Females are more highly involved with cause (PIC) than males at charity-linked sporting
events.
H2: Males are more highly involved with sport (PIS) than females at charity-linked sporting
events.
There is growing proposition that women strive to show gender solidarity by supporting other
women in business and in sport (Bennett et al., 2007; Edwards & La Ferle, 2009; Funk et al.,
2001; PME Enterprise, 2011; Ridinger & Funk, 2006; Sack & Fried, 2001). The notion of
gender solidarity as an influence on sponsorship response has not yet been considered in the
context of sponsorship research. This study will consider levels of gender support by both
female and male respondents at a variety of women and men‘s charity-linked hockey events.
The following hypotheses are proposed regarding this new construct of gender support:
H3: Females are more supportive of women‘s sport and causes/charities (GSW) than are
males.
H4: Males are more supportive of men‘s sporting events and men‘s charitable/social causes
(GSM) than are females.
B. Consumer Perceptions of Sponsorship:
Event-sponsor fit is the extent to which an attendee perceives that the event and its sponsor have
a similar image and a logical connection. The need for perceived fit between sponsors and
events as a determinant of favourable sponsorship response is widely supported (Alay, 2008;
Becker-Olsen & Simmons, 2002; Close & Lacey, 2013; Fleck & Quester, 2007; Grohs et al.,
2004; Gwinner & Eaton, 1999; Johar & Pham, 1999; McDaniel, 1999; Speed & Thompson,

136
2000). Involvement as a precursor to perceived fit has also been explored and validated in
previous sport sponsorship studies (Grohs & Reisinger, 2005; Gwinner & Bennett, 2008;
Gwinner et al., 2009). Gwinner and Bennett (2008) concluded that highly identified sport fans
have a greater ability to identify sponsor-event fit and are more likely to modify their thinking in
order to ensure an acceptable fit. Through an investigation of football fans, Gwinner et al.
(2009) confirmed that high levels of team involvement and strong perceived fit lead to higher
levels of image transfer and purchase intention. With respect to sponsor-event fit, it is therefore
expected that:
H5a: Personal involvement (PI) has a direct and positive effect on perceived sponsor-event
fit (FIT) in charity-linked sport settings.
H5b: Gender has a significant impact on the interaction of PI*FIT and the effect is greater
for women.
The sponsorship literature supports a significant relationship between involvement and perceived
sponsor sincerity. Meenaghan (2001b) concluded that highly involved fans develop a sense of
gratitude toward sponsors (i.e. corporate halo) which in turn drives purchase intent. When
consumers perceive sponsors to be genuine and sincere in their sponsorship efforts, favourable
consumer response has been commonly observed (Alay, 2008; Meenaghan, 2001b; Speed &
Thompson, 2000). Based on these recognitions, the following is hypothesized:
H6a: Personal involvement (PI) has a direct and positive effect on perceived sincerity
(SINC) of the sponsor in charity-linked sport settings.
H6b: Gender has a significant impact on the interaction of PI *SINC and the effect is greater
for women.

137
C. Sponsorship Response:
Based on the rationale presented above, the five predictors of sponsorship outcomes (GENDER,
PI, GSW, FIT, and SINC) are all expected to directly and positively influence the three levels of
sponsorship response.
H7a: Personal involvement (PI) has a direct and positive effect on sponsorship response
(INT, FAV, and/or USE) in charity-linked sport settings.
H7b: Gender has a significant impact on the interaction of PI*INT, PI*FAV, and PI*USE
and the effect is greater for women.
H8a: Perceived sponsor-event fit (FIT) has a direct and positive effect on sponsorship
response (INT, FAV and/or USE) in charity-linked sport settings.
H8b: Gender has a significant impact on the interaction of FIT* INT, FIT*FAV, and
FIT*USE and the effect is greater for women.
H9a: Perceived sincerity (SINC) of the sponsor has a direct and positive effect on
sponsorship response (INT, FAV and/or USE) in charity-linked sport settings.
H9b: Gender has a significant impact on the interaction of SINC*INT, SINC*FAV, and
SINC*USE and the effect is greater for women.
H10a: Gender support for women (GSW) has a direct and positive effect on women‘s
sponsorship response (INT, FAV, and/or USE).

138
H10b: Gender support for women (GSW) has a greater influence on women‘s sponsorship
response (INT, FAV, and/or USE) at female sporting events than at male sporting
events.
This dissertation aims to discover new insights regarding gender differences in sponsorship
response specific to the emerging area of CRSS. Favourable female response has been certified
in sport sponsorship (McDaniel, 1999; McDaniel & Kinney, 1999), cause partnerships (Berger et
al., 1999; Cone, 2010a; Ross et al., 1992) and to a lesser extend in CRSS settings (Irwin et al.,
2003). These existing findings of positive female response lead to the following final
hypothesis:
H11: Direct sponsorship response (INT, FAV and/or USE) at charity-linked sporting events
is stronger among female spectators than male spectators.
These hypothesized relationships are reflected in the conceptual framework of consumer
processing of CRSS presented in Figure 6.

139
Figure 6: Consumer Processing of CRSS - Hypothesized Relationships
4.3 Research Design and Methodology
In order to contribute to the latest understanding of sponsorship marketing, this study was
designed to: i) intercept consumers at the point of field-based sponsorship consumption, ii) focus
specifically on the emerging practice of cause-related sport sponsorship, and iii) secure balanced
input from both women and men in order to allow for meaningful gender comparisons. Details
of the methods implemented to empirically test the proposed framework of cause-related sport
sponsorship response are described below.
Research Participants
Participants of this study were spectators at a variety of charity-linked hockey events taking
place during the period of October to December 2013 across three different cities in Ontario,

140
Canada. Respondents were consenting adults (i.e., minimum of 18 years old) and included
representation of both male and female spectators. A total of 670 individuals attending charity-
linked hockey events participated in this study. Twenty-eight of these surveys were incomplete
and discarded for the purpose of analysis. The combined sample size for all tested events was
therefore 642 with near balanced gender representation (48.9% female, 49.7% male, and 1.4%
unanswered gender). Women‘s participation levels were greatest at the two female hockey
events (56.4% and 64.7% of sample) while men‘s participation (64.2% of event sample)
outpaced that of women‘s at the NHL game. The NHL event provided the largest sample size
(n=215) followed by the OHL game (n=167). The women‘s OUA Pink the Rink games had
similar sample sizes (n=101, n=99) while the first men‘s OUA event generated the smallest
response (n=60). Table 13 below summarizes the number of respondents who completed this
survey at each of the five investigated venues.
Table 13: Number of Participants at the Five Investigated CRSS Events
Event / Cause
Female Male Gender -
Unanswered
Total
N % N % N % N %
1. OUA Men‘s
Hockey/
Canadian Breast
Cancer
Foundation
(CBCF)
35 58.3 25 41.7 0 0 60 100
2. OUA Women‘s
Hockey /
Northern Cancer
Research
Foundation
(NCRF)
57 56.4 42 41.6 2 2 101 100
3. OUA Women‘s
Hockey / CBCF
64 64.7 34 34.3 1 1 99 100

141
4. NHL Hockey /
Food Bank
73 33.9 138 64.2 4 1.9 215 100
5. OHL Hockey /
Salvation Army
85 50.9 80 47.9 2 1.2 167 100
Total 314 48.9 319 49.7 9 1.4 642 100
Measurement Scales
The review of literature undertaken for this dissertation identified suitable research instruments
for the purpose of this quantitative study. In order to best fit the context of this particular field-
based consumer intercept study, some minor wording modifications and content reductions were
necessary. The original draft questionnaire was compiled from various published studies in
contributing fields. Members of this dissertation committee were instrumental in providing
feedback through public defense of this dissertation proposal. A second draft questionnaire was
tested for proper construction, content validity, and accurate interpretation from an expert panel
consisting of nine academic professionals. A second pre-test of a revised version of the
questionnaire was then verified with a consumer panel of 33 individuals. This final stage of
instrument testing was implemented through an e-mail invitation to 50 members of the author‘s
personal network who fit the profile of research participants for this study. Final revisions were
made to the questionnaire reflecting feedback obtained from this consumer panel.
Table 14 lists the literature sources used to construct the various sections of this 25 question
survey. Required data for this study consists of six main sections:
i) demographic profile of respondents (including gender, age, income, and number of
dependent children),

142
ii) personal involvement levels with both the sport of hockey and the cause specific to
the event attended,
iii) perceptions of sponsor-event fit,
iv) gender support for women and for men (in terms of sport and cause),
v) perceived sincerity of the sponsor, and
vi) sponsorship response measured through interest in the sponsor, favourability toward
the sponsor, and intended use/purchase of the sponsor‘s offerings.
Apart from the four demographic profile questions (measured as nominal data), all items were
measured on five-point Likert interval scales anchored by Strongly Disagree (1) and Strongly
Agree (5).
Personal Involvement
This research is situated in sporting events linked to charitable causes. Personal involvement
therefore was assessed from both a sport and a cause perspective. Bennett et al.‘s (2007)
involvement with charity scale (Cronbach‘s alpha=.91) was used to measure three items of
personal involvement with the cause. As charitable partnerships varied by event, these questions
were adjusted to reflect the name of the specific charities involved at each venue. The sport of
hockey was consistent in all test sites. Access to events for the purpose of data collection
influenced the original selection of the sport of hockey. This evolved, however, into a deliberate
strategy to focus on a singular sport in order to minimize potential sport bias and to allow for
purer contrasting of female and male spectators of a common sport (James & Ridinger, 2002).
Measuring involvement in sport often involves consideration for both elements of attraction to
the sport as well as measures of centrality to determine the importance of this activity in the lives

143
of respondents (Alexandris & Tsiotsou, 2012; Funk, Ridinger, & Moorman, 2004; Gwinner &
Swanson, 2003; McIntyre & Pigram, 1992; Stewart, Smith, & Nicholson, 2003; Tsiotsou &
Alexandris, 2009). McIntyre and Pigram‘s (1992) scales were used to measure three items of
personal involvement with the sport of hockey. This included two measures of centrality and
one measure of attraction. These same scales were used by Tsiotsou and Alexandris (2009) in a
similar investigation of sponsorship outcomes that registered internal consistency for
involvement-attraction of =0.74 and involvement-centrality of =0.84.
Gender Support
Including gender support as a determinant of sponsorship response is a new approach
unexamined in the reviewed sponsorship literature. Cornwell and Coote‘s (2005) measures of
motivation for participation in a fundraising race provided some direction in developing two
items to measure: i) support for women‘s / men‘s sport, and ii) support for women‘s /men‘s
charitable or social causes.
Sponsor-Event Fit, Perceived Sincerity of the Sponsor, and Sponsorship Response
As noted, consumer perception of sponsor-event fit has been well tested in sport sponsorship
research. In this investigation of CRSS, the Sponsorship Evaluation Scales (SES) originally
developed by Speed and Thompson (2000) and later validated by Alay (2008; 2010) were used
to measure three items of sponsor-event fit. Reliability of Alay‘s (2010) scale was reported at
=0.92. As with personal involvement with the cause, sponsors varied by event and therefore
this question was adjusted to reflect the main sponsor involved at each venue. The SES were
also relied upon to measure two items of perceived sincerity of the sponsor (reported Cronbach‘s
alpha =0.76) as well as the three levels of sponsorship response (i.e., interest in the sponsor,

144
favourability toward the sponsor, and intent to use the sponsor‘s offerings). Alay (2010)
reported strong internal consistency (=0.95) for all of the above measures of sponsorship
response.
Table 14: Questionnaire Development
Construct Number
of Items
Sources Survey Questions
Demographic
Profile
4 Included gender, age range, income range,
number of children in household
Involvement
with the cause
3 -Bennett, Mousley, Kitchin
& Ali-Choudhury (2007)
-Bennett & Gabriel (1999)
1. I regularly feel that I want to become
involved in events that support the
charity/cause (specify the specific cause)
associated with this game.
2. My decision to attend this charity-linked
hockey game was mainly determined by my
desire to help (specify cause).
3. Supporting a charity gives me a sense of
satisfaction.
Involvement
with the sport
of hockey
3 -Tsiotsou & Alexandris,
(2009; 2012)
-McIntyre & Pigram (1992)
-Funk, Ridinger, &
Moorman (2004)
-Gwinner & Swanson (2003)
-Stewart, Nicholson, &
Smith (2003)
1. Hockey (as a player and/or spectator) is
an important part of my life.
2. Hockey (as a player and/or spectator) is
one of the most enjoyable activities for me.
3. Most of my friends are in some way
connected with hockey.
Gender support
for women
Gender support
for men
2
2
Cornwell & Coote, 2005
(adapted from Motivations
for Participation scale to
include both sport and
cause)
1. It is important for me to show support for
women‘s sporting events.
2. It is important for me to show support for
women's charitable/social causes.
1. It is important for me to show support for
men‘s sporting events.
2. It is important for me to show support for
men's charitable/social causes.

145
Event-sponsor
fit
3 Sponsorship Evaluation
Scale (SES); Speed &
Thompson (2000); Alay,
(2008; 2010)
1. There is a logical connection (or
association) between this charity-linked
hockey game and the main sponsor (specify
sponsor).
2. The image of this event (specify event)
and the image of the main sponsor (specify
sponsor) are similar.
3. It makes sense to me that this
organization (specify sponsor) sponsors a
charity-linked hockey event.
Perceived
sincerity
2 Sponsorship Evaluation
Scales (SES); Speed &
Thompson (2000); Alay,
(2008;2010)
1. The main reason that the sponsor (specify
sponsor) is involved in this event is that
they believe that charitable sporting events
deserve support.
2. The sponsor of this event (specify
sponsor) likely has the best interest of the
cause at heart.
Interest 2 Sponsorship Evaluation
Scales (SES); Speed &
Thompson (2000); Alay
(2008; 2010)
1. This sponsorship makes me more likely
to notice the sponsor's name (specify
sponsor) on other occasions than I might
otherwise.
2. This sponsorship makes me more likely
to pay attention to (specify sponsor)‘s
advertising and other promotions than I
might otherwise.
Favour 2 Sponsorship Evaluation
Scales (SES); Speed &
Thompson (2000); Alay
(2008; 2010)
1. Sponsorship of this charity-linked hockey
event makes me feel more favorable toward
(specify sponsor) than I might otherwise.
2. This sponsorship improves my perception
of (specify sponsor) more than I might
otherwise.
Use 2 Sponsorship Evaluation
Scales (SES); Speed &
Thompson (2000); Alay
(2008; 2010).
1. This sponsorship makes me more likely
to consider (specify sponsor) the next time I
am in need of (specify sponsor’s offering).
2. I am more likely to buy the sponsoring
company‘s products/services as a result of
their sponsorship of this charity-linked
hockey event.
Total Items 25

146
As explained above, the questionnaire was adapted slightly for each of the investigated events in
order to specify the main sponsor and supported charity or cause. In total, five versions of the
questionnaire were therefore used in the collection of data. Each event survey is presented as
Appendices A through E.
Data Collection
Natural field settings are an emerging method to examine the realistic dynamics of sponsorship
and event-based marketing (Armstrong, 2001; Bennett et al., 2009; Close & Lacey, 2013;
Gwinner et al., 2009; Irwin et al., 2003; Maxwell & Lough, 2009; Ridinger & Funk, 2006; Sack
& Fried, 2001; Walker & Kent, 2009). A key objective of this research was to capture consumer
perceptions at the point of sponsorship consumption. With a focus on the growing trend of
sporting events associated with charitable causes, many possible opportunities were considered
and efforts made to gain access for the purpose of data collection. Twenty-two different
organizations were contacted and presented with a proposal to support this research through
access to suitable CRSS events. Events were selected based on research fit as well as timing to
accommodate fall collection and the ability of the researcher to travel to events. Efforts to secure
event access took place from June through November 2013 and resulted in admission to five
suitable events. These events included two women‘s hockey games and three men‘s games and
spanned three levels of hockey including collegiate (i.e., OUA), major junior (i.e., OHL), and
professional (i.e., NHL). While the investigated sport of hockey was constant at all events, the
associated causes varied across the investigated settings. Data was gathered at events in three
cities across Ontario (North Bay, Sudbury and Ottawa). Table 15 details the events and
corresponding sponsors and charities at which data were collected for this research. To note,
none of the main sponsors were overtly gender-skewed. At Event #1 (i.e., Nipissing University

147
Real Men Wear Pink), there was not a title sponsor but rather a variety of regular season
sponsors. As such, the questionnaire for this event did not specify a specific sponsor (as in the
case of the other four events) but rather generally referred to ―event sponsors‖ in measuring
consumer perceptions of this particular sponsorship. This case is referred to as an ―unspecified
sponsor‖ in Table 15 below.
Table 15: Data Collection Events
Event Sport Cause Sponsor Date Location Est.
Attendance
1. Nipissing
University
Real Men
Wear Pink
(NU-
RMWP)
Men‘s
OUA
Hockey
Canadian
Breast
Cancer
Foundation
Unspecified October 18,
2013
North Bay 1090
2. Laurentian
University
Pink the
Rink
(LU-PTR)
Women‘s
OUA
Hockey
Northern
Cancer
Research
Foundation
Deluxe
Hamburgers
November
2, 2013
Sudbury 350
3. Nipissing
University
Pink the
Rink
(NU-PTR)
Women‘s
OUA
Hockey
Canadian
Breast
Cancer
Foundation
True North
Chevrolet
Cadillac
November
9, 2013
North Bay 600
4. Ottawa
Senators
Food
Drive
Night
Men‘s NHL
Hockey
Ottawa Food
Bank
Canadian
Tire
December
12, 2013
Ottawa 15,578
5. Sudbury
Wolves
Teddy
Bear Toss
Men‘s OHL
Hockey
Salvation
Army Toy
Drive
Travelodge
Hotel
December
15, 2013
Sudbury 4,148
Procedures
The procedures employed to collect data were approved by the Research Ethics Boards of both
Laurentian University and Nipissing University to ensure that all research-related activities

148
respected the ethical principles of free and informed consent, privacy, confidentiality and
minimum risk. Participant recruitment took place through event intercepts (upon entry to the
game, during intermissions, in common areas, and upon exit) with spectators at the selected
charity-linked hockey games. A team of trained research assistants were employed to support in
the collection of data. The research team wore identification badges to clearly distinguish their
role at these events. The number of data collectors varied according to event size with a
minimum of three at the smallest event and a team of eight engaged at the largest venue. A
research table was set up in the main entrance and was hosted by at least two members of the
research team. Other data collectors roamed approved areas to recruit as many suitable
participants as possible to complete the survey. Spectators were first screened to ensure that they
were of minimum age (i.e., 18) and then invited to complete the brief survey with an estimated
completion time of 5-10 minutes. All interested individuals were assured of the voluntary and
confidential nature of this study and presented with a consent form (see Appendix F) that was
explained by the researchers. The consent form was modified for each event to include a unique
link to the e-survey in cases where respondents would prefer to complete the survey
independently or at a different time. Willing participants were then given the option to complete
the questionnaire through paper format or through an e-survey (hosted on the Canadian server of
FluidSurvey) and accessible through iPads carried by members of the research team. As an
incentive for participation, a draw for an iPad Mini was also incorporated into this study. A
gender-neutral prize was chosen to avoid biased gender participation. Upon completion of the
survey, participants were presented with a paper draw ballot or prompted with an e-ballot if
completing the survey by iPad. Approximately 30% of respondents opted for the e-questionnaire
presented through the iPad.

149
Chapter 5
5.0 Results
This chapter presents the results from this study and details the statistical analyses undertaken to
test the stated hypotheses and the proposed model of consumer processing of CRSS. Analyses
were performed at four levels of sample investigation: i) the total all-events sample, ii) spectators
of women‘s hockey events versus spectators of men‘s hockey events, ii) respondents at cancer-
cause events versus respondents at social-cause events, and iv) attendees at the five individual
CRSS hockey events. Both women and men were part of each investigated spectator sample.
Gender was treated as an independent variable while other variables (personal involvement,
gender-support, sponsor-event fit and sincerity of the sponsor) were assigned dual roles as either
independent or dependent variables contingent on the hypothesis being tested. Sponsor interest,
favourability and use were dependent variables in all investigated scenarios. This section is
organized into four parts: i) initial analysis, ii) demographic characteristics and sample treatment
rationale, iii) hypotheses testing, and iv) model testing.
5.1 Initial Analysis
Raw data collected from all five sampled events were entered into SPSS (version 21). This
consisted of a total of 642 entries after discarding 20 incomplete surveys. Before beginning
analysis, data was checked for errors by inspecting frequencies for all variables. One input error
was found and corrected.
Reliability refers to the internal consistency of a measurement scale. In selecting the measures
for this particular study, the reliability of existing scales were considered (and previously noted
in section 4.3). The questionnaire used for this inquiry relies on multi-item measurement scales

150
and therefore it was necessary to test the reliability of each of these scales for all considered
samples. Cronbach‘s alpha is among the most commonly used and accepted indicators of
internal consistency. An alpha coefficient () equal to or above .70 is generally considered
acceptable (DeVellis, 2003; Nunnally, 1978). With shorter scales (fewer than ten items)
Cronbach values are often quite low therefore the inter-item correlation mean is recommended as
a measurement of scale reliability in these cases (Pallant, 2010). An optimal range for the inter-
item correlation is .2 to .4 (Briggs & Cheek, 1986). Both tests were run for all samples at all
levels of investigation. Results from these tests are presented in Appendix G. All applied scales
had good internal consistency with inter-item correlation means within an acceptable range from
a low of .24 to a high of .88. With the exception of the PIC scale (for which the inter-item
correlation means suggest acceptable reliability), all Cronbach alpha coefficients were also above
the .70 cut-off providing support for the applied measurements.
Several of the statistical techniques relied upon for the analyses of this study‘s data assume that
the distributions of scores on dependent variables have a reasonably normal distribution. Given
possible biases associated with hockey event attendance, it was expected that the study sample
may not perfectly represent the general population. In order to assess normality, for all levels of
sample investigation (i.e., all-events, women‘s hockey, men‘s hockey, cancer-cause events,
social-cause events, and five individual events), formal tests of normality were performed along
with skewness and kurtosis values. Both Kolmogorov-Smirnov (for samples larger than 50) and
Shapiro-Wilk tests (for samples smaller than 50) were considered and in all cases revealed
significance and therefore suggested a violation of the assumption of normality. With larger
sample sizes (n >200 cases as per Tabachnick & Fidell, 2007) these procedures are overly
sensitive and commonly reject variables that only slightly deviate from normality (Micceri,

151
1989; Pallant, 2010; Tabachnick & Fidell, 2007). Given that the all-events sample (n=642),
women‘s hockey sample (n=200), men‘s hockey sample (n=442), cancer-causes sample (n=257)
and social-causes sample (n=376) are relatively large these samples were deemed reasonably
normal for the purpose of conducting parametric tests that are commonly supported as
sufficiently robust to overcome moderate variations from normality (DeCarlo, 1997; Glass,
Peckham, & Sanders, 1972; Pallant, 2010; Micceri, 1989; Vickers, 2005). As small sample sizes
are more vulnerable to possible violations of assumptions of normality (Vickers, 2005; Yazinici
& Yolacan, 2007) non-parametric alternatives for the five event specific samples were also
computed. In the absence of clear consensus on acceptable degrees of deviation from normality,
inclusion of both parametric and non-parametric results for these smaller samples substantiates
presented findings from this study.
5.2 Demographic Characteristics and Sample Treatment Rationale
As previously noted, data was gathered at five different venues. All of these were spectator-
based charity-linked sporting events. The sport of hockey was consistent across all events and
included both women‘s and men‘s charity-linked games. Affiliated charities varied however
with three events linked to cancer-related causes (events #1, 2, and 3) and two events focused on
social causes (events #4 and 5). The demographic characteristics (including gender, age range,
household income bracket, and number of dependent children) of each event were first analyzed
to identify any significant differences between the investigated samples.
In terms of gender, greater female participation was noted at all three university events (i.e.,
events #1, 2, and 3). In total, 60% of the university events sample was female. Stronger female
participation may be attributed to the fact that two of these three events involved women‘s

152
hockey and all three events were associated with pink-themed cancer causes. For Nipissing
University events (i.e., #1 and 3), almost 70% of this student body is female and therefore an
overrepresentation of female respondents was expected. The NHL sample (i.e., event 4) was the
only event for which a stronger male response was realized (64.2% of responses). Data from the
final event (i.e., OHL Sudbury Wolves) was the most equitable gender response with 50.9%
female and 47.9% male response. When considering all five events combined (i.e., all-events
sample), a balanced gender representation was achieved with 48.9% female and 49.7% male
participation. Gender comparisons across these sampled events are presented in Table 16 below.
Table 16: Comparison of Gender across Sampled Events
Gender
Event 1:
NU-
RMWP
Event 2:
LU-PTR
Event 3:
NU-PTR
Event 4:
Senators
Food Drive
Event 5:
Wolves
Teddy
Bear Toss
All –
Events
Sample
Female 58.3% 56.4% 64.6% 34% 50.9% 48.9%
Male 41.7% 41.6% 34.3% 64.2% 47.9% 49.7%
Attendance at these events, tended to favour a younger demographic. When comparing the age of
respondents across the various events, 46.5% of university game respondents were 18-24 years
of age. This is likely reflective of the primary target of university athletic events being students.
(The only exception was event #1, NU-RMWP where the 45-55 cohort was slightly larger than
the 18-24 group). NHL event respondents were older with the largest response group being 25-
34 years old, although the 18-24 group represented 24.2% of responses. The OHL event (i.e.,
event #5) had the largest portion of 35-44 responses (27.5%) and over 25% of research
participants were over the age of 55, thereby reflecting a more mature crowd at this particular
event. As will be noted later, characteristics of this event suggest that it was the most family-

153
oriented event (possibly driven by the Teddy Bear Christmas link, afternoon scheduled game,
strong community following, etc.). For the all-events sample, over 30% of respondents belonged
to the youngest age segment (i.e., 18-24 years old). A comparison of reported age across the five
sampled events is presented in Table 17 below.
Table 17: Comparison of Age across Sampled Events
Age
Event 1
Event 2
Event 3 Event 4 Event 5 All –
Events
18-24 26.7% 62.4% 42.4% 24.2% 12.6% 30.2%
25-34 10.0% 4.0% 8.1% 28.8% 16.8% 16.8%
35-44 16.7% 7.9% 16.2% 18.6% 27.5% 18.7%
45-54 28.3% 16.8% 22.2% 12.6% 17.4% 17.4%
55-64 8.3% 5.9% 8.1% 12.6% 15.0% 11.1%
65+ 10.0% 1.0% 3.0% 2.8% 10.2% 5.1%
With the exception of the NHL event, the most frequent response concerning household (HH)
income was under $50,000. This is in line with the higher proportion of younger (i.e., 18-24)
respondents who are presumed to earn lower income levels. The NHL sample had more
respondents in the $50,000-$100,000 HH income range. Given the higher cost of NHL tickets
and the older age of participants at this event, this finding is reasonable. HH income
comparisons across sampled events are presented in Table 18 below.
Table 18: Comparison of Household Income across Sampled Events
Household Income
Event 1
Event 2
Event 3 Event 4 Event 5 All –
Events
Under
$50k
38.4% 23.8% 32.3%% 25.1% 32.4% 29.0%
$50-100k 26.6% 19.8% 24.3% 31.6% 28.8% 27.4%
$100-150k 11.7% 14.9% 20.2% 19.1% 16.2% 17.1%

154
$150+ 11.7% 21.8% 11.1% 14.9% 10.2% 13.9%
Prefer not
to answer
10.0% 17.8% 12.1% 8.4% 10.8% 11.2%
The final demographic measure was the number of dependent children in the home. An answer
of zero could indicate that the respondent had no children or that their child/ren were no longer
living at home. In all sampled cases, the most frequent response was no children living in the
home. This finding was strongest at university events where the majority of spectators were also
part of the youngest age cohort. The OHL event (#4) is the only case where more respondents
had children in the home (52.1%) than not (46.1%). This lends support to the suggestion that
event #5 (Sudbury Teddy Bear Toss) was perhaps the most family-oriented event. The
scheduled time of events could also have impacted the profile of attendees. For instance, all
events were evening games with the exception of the OHL game, which was a Sunday matinee
game. In this case, a game beginning at 2pm on a Sunday afternoon may have encouraged more
families to attend. The NHL game was a Thursday night (i.e., a school night) game which could
have deterred families with young children from attending. The second most frequent response
from the all-events sample (i.e. 20.6%) was from families with two children currently in the HH,
followed by 1 child (13.7%). A comparison of the number of dependent children across
investigated events is presented in Table 19 below.
Table 19: Comparison of Number of Children across Sampled Events
Number of (Dependent) Children
Event 1
Event 2
Event 3 Event 4 Event 5 All –
Events
0 55.0% 69.3% 64.6% 55.3% 46.1% 56.5%
1 21.7% 5.9% 12.1% 14.4% 15.6% 13.7%

155
2 20.0% 14.9% 17.2% 19.5% 27.5% 20.6%
3 1.7% 6.9% 5.1% 6.5% 3.6% 5.1%
4 0% 2.0% 1.0% 1.9% 3.6% 2.0%
more than 4 1.7% 0% 0% 1.9% 1.8% 1.2%
Differences in measured event samples are acknowledged above. In order to determine if these
observed demographic differences among sampled events were statistically significant, Kruskal-
Wallis tests were conducted. For the variable of age, a Kruskal-Wallis test revealed a
statistically significant difference in reported age levels across the five investigated events (χ2(4,
n=638)=56.83, p=.000). Events 1 and 5 recorded higher median age range scores (Md=35-
44yrs), events 3 and 4 both recorded median age ranges of 25-34 years old, and the youngest
respondents (18-24) were at event #2 (LU-PTR). For the variable of household income, the
same technique was used to determine if reported income was significantly different across the
five events. In this case, results revealed that variances in income were not significantly
different (χ2(4, n=634)=8.918, p=.063) and therefore not likely to skew reported research
findings. With respect to the number of dependent children in the home, significant differences
were revealed across the five samples (χ2(4, n=637)=13.793, p=.008). Event 5 respondents
reported having significantly more children (md=1 child) than all other events where the median
response was no dependent children. A child effect could therefore influence findings for event
#5 (Wolves Teddy Bear Toss).
The relationships between these demographic measures (i.e., age, income, and number of
children) and the independent variables of this study (i.e., PIC, PIS, PI, GSW, GSM, FIT, and
SINC) were investigated using Spearman rho correlation analysis. Results revealed only one
weak correlation between PIS and number of children (rho=.081, n=637, p=.04). All other
variables were not significantly associated with these demographic characteristics. Although the

156
five event samples may not be completely equivalent in terms of demographic characteristics, the
impact of any noted differences on reported research findings is therefore considered to be
minimal. Correlation results are presented in Table 20 below.
Table 20: Correlation of Demographic and Independent Variables
PIC PIS PI GSW GSM FIT SINC
AGE Correlation
Coefficient -.058 -.019 -.029 .020 -.066 -.024 .012
Sig.
(2-tailed) .146 .628 .472 .616 .096 .551 .760
N 638 638 638 638 638 638 638
INCOME Correlation
Coefficient -.014 .063 .041 .077 .059 -.075 .029
Sig.
(2-tailed) .716 .112 .304 .053 .141 .061 .469
N 634 634 634 634 634 634 634
CHILDREN Correlation
Coefficient .003 .081* .070 .057 .043 .012 .054
Sig.
(2-tailed) .948 .041 .077 .150 .279 .771 .173
N 637 637 637 637 637 637 637
*Correlation is significant at the 0.05 level (2-tailed).
In order to thoroughly address the research hypotheses, analyses were performed with several
sample treatments. The all-events sample offered a broad view of findings with the greatest
number of respondents and balanced gender representation while the individual event samples
provided unique perspectives and contrasting features. The gender of sport being played was
also an important consideration in this investigation of gender effects. As such, women‘s hockey
and men‘s hockey samples were distinguished. As a final level of investigation, the various
causes linked to these events were grouped into two broad categories: cancer-cause events and
social-cause events. Exploring the data from these multiple perspectives extended the platform
of potential discovery and offered a deeper understanding of outcomes. Demographic profiles
for these additional samples (i.e., women‘s hockey versus men‘s hockey, cancer-causes versus

157
social causes) are presented in Table 21, Table 22, Table 23, and Table 24 below. Each is
followed by a brief profile description that resembles much of the observations presented in the
preceding event comparisons analysis.
Table 21: Demographic Characteristics (Women’s Hockey Sample)
Measure Women Men Total
Event: Frequency Percent Frequency Percent Frequency Percent
Event #2 – LU-PTR 57 47.1% 42 55.3% 99 50.3%
Event #3-NU-PTR 64 52.9% 34 44.7% 98 49.7%
Total 121 100.0% 76 100.0% 197 100.0%
Age:
18-24 53 43.8% 51 68.0% 104 53.1%
25-34 9 7.4% 3 4.0% 12 6.1%
35-44 20 16.5% 4 5.3% 24 12.2%
45-54 29 24.0% 9 12.0% 38 19.4%
55-64 8 6.6% 6 8.0% 14 7.1%
65 or above 2 1.7% 2 2.7% 4 2.0%
Total 121 100.0% 75 100.0% 196 100.0%
Household Income:
Under $50,000 29 24.2% 26 34.2% 55 28.1%
$50,000-$100,000 26 21.7% 18 23.7% 44 22.4%
$100,000-150,000 21 17.5% 13 17.1% 34 17.3%
$150,000 or more 24 20.0% 9 11.8% 33 16.8%
Prefer Not to Answer 20 16.7% 10 13.2% 30 15.3%
Total 120 100.0% 76 100.0% 196 100.0%
Dependent
Children:
0 70 57.9% 62 81.6% 132 67.0%
1 14 11.6% 4 5.3% 18 9.1%
2 25 20.7% 7 9.2% 32 16.2%
3 10 8.3% 2 2.6% 12 6.1%
4 2 1.7% 1 1.3% 3 1.5%
More than 4 0 0.0% 0 0.0% 0 0.0%
Total 121 100.0% 76 100.0% 197 100.0%

158
The women‘s hockey sample consisted of 197 responses from two university events: LU-PTR
and NU-PTR. This sample was female-skewed as women represented 61.4% of respondents and
men accounted for 38.6% of this group. The majority of men (68.0%) and 43.8% of women
belonged to the youngest age category (18-24 years old). A presence of more mature women
was also noted among this sample as 32.3% of females reported being over the age of 45 (versus
22.7% of men). The most common response in terms of HH income for both men (34.2%) and
women (24.2%) was the lowest income bracket (under $50,000). Perhaps influenced by the
presence of an older segment of female spectators, 20% of female respondents indicated the
highest income option ($150,000 or more). Most sampled spectators (67%) at these combined
events did not report having any children in their homes. This was the case for 81.6% of male
respondents and 57.8% of females.
Table 22: Demographic Characteristics (Men’s Hockey Sample)
Measure Women Men Total
Event: Frequency Percent Frequency Percent Frequency Percent
Event #1 –
NU-RMWP 35 18.1% 25 10.3% 60 13.8%
Event #4 -
NHL Food Drive 73 37.8% 138 56.8% 211 48.4%
Event #5-
OHL Toy Drive 85 44.0% 80 32.9% 165 37.8%
Total 193 100.0% 243 100.0% 436 100.0%
Age:
18-24 33 17.1% 55 22.6% 88 20.2%
25-34 45 23.3% 50 20.6% 95 21.8%
35-44 46 23.8% 50 20.6% 96 22.0%
45-54 33 17.1% 40 16.5% 73 16.7%
55-64 23 11.9% 32 13.2% 55 12.6%
65 or above 13 6.7% 16 6.6% 29 6.7%
Total 193 100.0% 243 100.0% 436 100.0%
Household Income:

159
Under $50,000 69 35.9% 62 25.8% 131 30.3%
$50,000-$100,000 46 24.0% 86 35.8% 132 30.6%
$100,000-150,000 35 18.2% 38 15.8% 73 16.9%
$150,000 or more 21 10.9% 34 14.2% 55 12.7%
Prefer Not to Answer 21 10.9% 20 8.3% 41 9.5%
Total 192 100.0% 240 100.0% 432 100.0%
Dependent
Children:
0 94 49.2% 133 54.7% 227 52.3%
1 33 17.3% 35 14.4% 68 15.7%
2 49 25.7% 51 21.0% 100 23.0%
3 7 3.7% 14 5.8% 21 4.8%
4 6 3.1% 4 1.6% 10 2.3%
More than 4 2 1.0% 6 2.5% 8 1.8%
Total 191 100.0% 243 100.0% 434 100.0%
The men‘s hockey sample size was larger than the women‘s hockey sample, consisting of 436
responses from three different levels of charity-linked hockey events: one university event (NU-
RMWP), one NHL event (Ottawa Senators Food Drive), and one OHL event (Sudbury Wolves
Teddy Bear Toss). This sample was more gender balanced than the women‘s hockey group as
female respondents represented 44.3% of this sample and males accounted for 55.7%. The
distribution of age was also more varied with this segment. While almost 44% of female
respondents at the women‘s games were between the ages of 18-24, at men‘s games this same
segment represented only17.1% of responses while 47.1% were between the ages of 25-44. The
age of male respondents among this sample were also more diverse as only 22.6% belonged to
the youngest age range (versus 68% at the women‘s events) and 41.2% were between 25-44
years old. Almost 20% of respondents (18.6% of women and 19.8% of men) were aged 55 or
older. The most common response in terms of HH income for women (35.9%) was the lowest
income bracket (under $50,000) while 35.8% of men reported income in the range of $50,000-
$100,000. More respondents of this sample reported dependent children (47.7% versus 33% of

160
the women‘s hockey sample). Slightly more women had children (50.8%) than not (49.2%)
while 45.3% of male respondents indicated children in the home.
In order to assess any significant differences in the demographic characteristics of these two
samples (i.e., spectators of women‘s hockey versus spectators of men‘s hockey), Mann-Whitney
U tests were conducted. Similar to the Kruskal-Wallis tests reported for the comparison of the
five individual events, a significant difference was revealed for the variables of age. In this case,
the women‘s hockey sample was younger (Md=18-24 years, n=198) than the men‘s hockey
sample (Md=35-44 years, n=440). The magnitude of this age difference however was very small
(U=31348, z=-5.81, p=.00, r=0.2). The reported number of children between these groups was
also significantly different as the women‘s hockey sample reported less children (Md=0, n=199)
than the men‘s hockey sample (which had a higher mean rank, Md=0, n=438). The effect of this
difference was also very small (U=37452, z=-3.17, p=.001, r=.1). Differences in reported HH
income were not found to be significant (U=40224.5, z=-1.388, p=.165). As noted above, the
absence of significant correlations between these demographic factors and the predictor variables
of this study renders the potential effect of these differences minimal.
The final sample treatment was the classification of events by types of causes: cancer-related
causes and social-related causes.
Table 23: Demographic Characteristics (Cancer-Causes Sample)
Measure Women Men Total
Event: Frequency Percent Frequency Percent Frequency Percent
Event #1: NU-RMWP 35 22.4% 25 24.8% 60 23.3%
Event #2: LU-PTR 57 36.5% 42 41.6% 99 38.5%
Event #3: NU-PTR 64 41.0% 34 33.7% 98 38.1%
Total 156 100.0% 101 100.0% 257 100.0%

161
Age:
18-24 64 41.0% 56 56.0% 120 46.9%
25-34 14 9.0% 4 4.0% 18 7.0%
35-44 26 16.7% 8 8.0% 34 13.3%
45-54 39 25.0% 16 16.0% 55 21.5%
55-64 10 6.4% 9 9.0% 19 7.4%
65 or above 3 1.9% 7 7.0% 10 3.9%
Total 156 100.0% 100 100.0% 256 100.0%
Household Income:
Under $50,000 44 28.4% 34 34.0% 78 30.6%
$50,000-$100,000 34 21.9% 26 26.0% 60 23.5%
$100,000-150,000 24 15.5% 17 17.0% 41 16.1%
$150,000 or more 29 18.7% 11 11.0% 40 15.7%
Prefer Not to Answer 24 15.5% 12 12.0% 36 14.1%
Total 155 100.0% 100 100.0% 255 100.0%
Dependent
Children:
0 87 55.8% 78 77.2% 165 64.2%
1 25 16.0% 6 5.9% 31 12.1%
2 32 20.5% 12 11.9% 44 17.1%
3 10 6.4% 3 3.0% 13 5.1%
4 2 1.3% 1 1.0% 3 1.2%
More than 4 0 0.0% 1 1.0% 1 0.4%
Total 156 100.0% 101 100.0% 257 100.0%
The cancer-causes sample consisted of 257 responses from the three university pink-themed
events: NU-RMWP, LU-PTR and NU-PTR. The demographic composition of this sample was
therefore similar to the women‘s hockey sample (which captured two of these three events).
This group was female-skewed as women represented 60.7% of respondents and men accounted
for 39.3%. The majority of men (56.0%) and 41.0% of women belonged to the youngest age
range (18-24 years old). A more mature presence was also noted among this sample with 33.3%
of females and 32.0% of males reportedly over the age of 45. The most common response in
terms of HH income for both men (34.0%) and women (28.4%) was the lowest income bracket

162
(under $50,000) followed by the next increment of $50,000-100,000 (indicated by 21.9% of
females and 26.0% of males). Most sampled spectators (64.2%) at these combined events did
not report having any children in their homes. This was the case for 77.2% of male respondents
and 55.8% of females.
Table 24: Demographic Characteristics (Social-Causes Sample)
Measure Women Men Total
Event: Frequency Percent Frequency Percent Frequency Percent
Event #4:
NHL Food Drive 73 46.2% 138 63.3% 211 56.1%
Event #5:
OHL Toy Drive 85 53.8% 80 36.7% 165 43.9%
Total 158 100.0% 218 100.0% 376 100.0%
Age:
18-24 22 13.9% 50 22.9% 72 19.1%
25-34 40 25.3% 49 22.5% 89 23.7%
35-44 40 25.3% 46 21.1% 86 22.9%
45-54 23 14.6% 33 15.1% 56 14.9%
55-64 21 13.3% 29 13.3% 50 13.3%
65 or above 12 7.6% 11 5.0% 23 6.1%
Total 158 100.0% 218 100.0% 376 100.0%
Household Income:
Under $50,000 54 34.4% 54 25.0% 108 29.0%
$50,000-$100,000 38 24.2% 78 36.1% 116 31.1%
$100,000-150,000 32 20.4% 34 15.7% 66 17.7%
$150,000 or more 16 10.2% 32 14.8% 48 12.9%
Prefer Not to Answer 17 10.8% 18 8.3% 35 9.4%
Total 157 100.0% 216 100.0% 373 100.0%
Dependent
Children:
0 77 49.4% 117 53.7% 194 51.9%
1 22 14.1% 33 15.1% 55 14.7%
2 42 26.9% 46 21.1% 88 23.5%
3 7 4.5% 13 6.0% 20 5.3%
4 6 3.8% 4 1.8% 10 2.7%

163
More than 4 2 1.3% 5 2.3% 7 1.9%
Total 156 100.0% 218 100.0% 374 100.0%
The social-causes sample consisted of 376 responses from the NHL and OHL events. These
events supported social causes that included both a food and a toy drive for local communities.
Women represented 42% of this segment while men accounted for 58%. Similar to the men‘s
hockey sample, the distribution of age was more varied with this segment than with the cancer-
causes group. While 41% of female respondents from the cancer-causes sample were between
the ages of 18-24, this same young segment represented only13.9% of responses among the
social-causes sample while 50.6% of women were between the ages of 25-44. The age of male
respondents among this sample were also more varied as only 22.9% belonged to the youngest
age range (versus 56% of the cancer-causes segment) and 43.6% were between 25-44 years old.
Almost 20% of respondents (20.9% of women and 18.3% of men) were aged 55 or older. The
most common response in terms of HH income for women (34.4%) was the lowest income
bracket (under $50,000) while 36.1% of men reported income in the range of $50,000-$100,000.
More respondents of this sample reported dependent children (48.1% versus 35.8% of the
cancer-causes sample). Slightly more women had children (50.6%) than not (49.4%) while
46.3% of male respondents indicated children in the home.
In order to assess any significant differences in the demographic characteristics of these two
samples (i.e., cancer-causes versus social-causes), Mann-Whitney U tests were again conducted
with consistent results as the previously compared samples. Significant differences were
revealed for the variables of age and number of dependent children. The cancer-causes sample
was younger (Md=25-34 years, n=258) than the social-causes sample (Md=35-44 years, n=380),
however the effect of this difference was very small (U=39030.5, z=-4.48, p=.00, r=0.18). The

164
number of children reported by the cancer-causes sample was less (Md=0, n=259) than the
social-causes sample (which had a higher mean rank, Md=0, n=378) and the magnitude of this
difference was also very small (U=42429, z=-3.19, p=.001, r=.1). Differences in reported
income were not found to be significant (U=47476.5, z=-.432, p=.67). As noted above, the
absence of significant correlations between these demographic factors and the predictor variables
of this study renders the potential effect of these differences minimal.
5.3 Hypotheses Testing
In this section, the eleven hypothesized relationships are tested and differences between genders
are examined for all levels of investigation (i.e., all-events sample, women‘s hockey sample vs.
men‘s hockey sample, cancer-cause sample versus social cause sample, and five individual
events).
5.3.1 Hypothesis 1
H1: Females are more highly involved with cause (PIC) than males at charity-linked sporting
events.
In order to compare cause involvement levels between genders, independent sample t-tests were
performed to compare the mean PIC scores of females and males. For the all-events sample H1
was supported as there was a significant difference in scores for females (M= 3.85, SD=.71) and
males (M=3.69, SD=.69; t (631) = 3.05, p=.002, two-tailed). Women reported stronger
involvement with the investigated causes than did men. In order to assess the strength of these
observed differences, partial eta squared effect size statistics were also computed. According to
Cohen (1988), eta squared (% of variance explained) is small for values of .01, while .06
indicates a moderate effect and large effects are in the range of .14. The magnitude of the

165
difference in the means (mean difference = .17, 95% CI: .06 to .28) in this case was relatively
small as eta squared=.014.
When considering the women‘s hockey sample, there was not a statistically significant
difference in the reported PIC of women and men thereby rejecting H1 with this sample group.
Several reviews contend that unequal (or small) sample sizes can compromise the robustness of
parametric procedures (Blair, 1981; Ito, 1980; Tan, 1982 as cited in Micceri, 1989). Given that
the sample size for women (n=121) was larger than for men (n=76) in this case, the t-test test
was rerun with an equal sample size of 76 by randomly selected a sub-sample of the female
population and maintaining the full male sample of 76. The same insignificant results were
found in this case.
When considering the men‘s hockey sample, H1 was supported as there was significant
difference in the mean PIC scores for females (M= 3.78, SD=.712) and males (M= 3.61,
SD=.686); t (434)=2.476, p= .014, two-tailed). At these men‘s hockey games, women reported
higher involvement with the corresponding causes. The magnitude of the difference between
means (mean difference = .167, 95% CI: .034 to .299) was again fairly small (eta squared= .01).
Same sample size (n=193) analysis rendered the same conclusion (women‘s M=3.77, SD=.71;
men‘s M=3.59, SD=.68; t(384)=2.63, p=.009, 95% CI: .047 to .235).
When contrasting results by type of cause, women reported significantly stronger PIC at social-
cause events than did men while no significant gender differences were noted among the cancer-
causes sample. For the social-causes sample, there was significant difference in the mean PIC
scores for females (M= 3.78, SD=.67) and males (M= 3.57, SD=.67); t (374 )= 3.00, p= .003,
two-2-tailed). The magnitude of the difference between means (mean difference = .210, 95% CI:

166
.072 to .347) was fairly small (eta squared= .02). Same sample size (n=158) analysis rendered
the same significant conclusion (women‘s M=3.78, SD=.67; men‘s M=3.58, SD=.69; t(314) =
2.58, p=.01, 95% CI: .047 to .348).
The five individual events were also investigated in terms of PIC score comparisons between
genders. In all cases, t-tests were performed first with the actual collected sample sizes for each
gender group and then in instances where the difference in sample size was 10 cases or more,
analysis was repeated with equal randomly adjusted sample sizes. For events 1 through 4, no
significant differences were observed. For event 5 (Sudbury Wolves Teddy Bear Toss), women
reported significantly stronger involvement levels with the cause. Results in this case for women
were M=3.92, SD=.698 while men‘s reported findings were M=3.61, SD=.713; t(163)=2.798,
p=.006, two-tailed). The magnitude of the difference between means (mean difference = .307,
95% CI: .09 to .524) was moderate (eta squared= .05) and the strongest distinction of all
observed scenarios. The Mann-Whitney U test (non-parametric alternative to the independent
samples t-test) was also run for all individual event samples and revealed the same insignificant
results for Events 1-4 and similar significance for Event 5. In this case, women‘s PIC levels
(Md=4, n=85) were significantly higher than men‘s (Md=3.6, n=80, U=2362, z=-3.43, p=.001).
The effect size in this calculation was also moderate at r=.27.
The statistical analyses for the testing of hypothesis one (H1) are presented in Table 25 and
Table 26 with Mann-Whitney U test calculations itemized in Table 27.

167
Table 25: Gender Comparisons of Personal Involvement with Cause
Statistic Female Male
All Events
N 314 319
Mean 3.85 3.69
S.D. .706 .686
Women’s Hockey
N 121 [76]* 76
Mean 3.98 [3.92] 3.94
S.D. .679 [.653] .625
Men’s Hockey
N 193 243 [193]
Mean 3.77 3.61 [3.59]
S.D. .712 .686 [.677]
Cancer-Causes
N 156 [101] 101
Mean 3.93 [3.98] 3.93
S.D. .732 [.751] .667
Social-Causes
N 158 218 [158]
Mean 3.78 3.57 [3.58]
S.D. .674 .666 [.685]
Event 1
N 35 [25] 25
Mean 3.73 [3.57] 3.91
S.D. .874 [.920] .797
Event 2
N 57 [42] 42
Mean 4.12 [4.13] 3.92
S.D. .599 [.589] .694
Event 3
N 64 [34] 34

168
Mean 3.86 [3.83] 3.96
S.D. .727 [.753] .537
Event 4
N 73 138 [73]
Mean 3.63 3.55 [3.60]
S.D. .613 .639 [.687]
Event 5
N 85 80
Mean 3.92 3.61
S.D. .698 .713
*Numbers in brackets represent results for adjusted sample sizes to allow for equitable comparison
Table 26: T-Tests for Equality of Means – Personal Involvement with Cause
95% Confidence
Internal
Sample t df Sig.
(2-
tailed)
Mean
Differences
Eta
Squared*
Std. Error
Difference
Lower Upper
All
Events
3.047 631 .002 .169 .014 .055 .059 .277
Women‘s
Hockey
0.466 195 .642 .045 n.s. .096 -.145 .235
Men‘s
Hockey
2.476 434 .014 .166 .01 .067 .034 .299
Cancer-
Causes
-0.037 255 .970 -.003 n.s. .090 -.181 .174
Social-
Causes
3.000 374 .003 .210 .02 .070 .072 .347
Event 1 -0.786 58 .435 -.173 n.s. .220 -.615 .268
Event 2 1.506 97 .135 .196 n.s. .130 -.062 .455
Event 3 -0.679 96 .499 -.096 n.s. .142 -.377 .185
Event 4 0.821 209 .413 .075 n.s. .091 -.105 .255
Event 5 2.798 163 .006 .307 .05 .109 .090 .524 *Eta Squared is provided for significant relationships.
Table 27: Mann- Whitney U Test – Personal Involvement with Cause
Sample U Z P r
Event 1 366.5 -1.080 0.281 n.s.
Event 2 1030.0 -1.200 0.230 n.s.

169
Event 3 1009.5 -0.593 0.553 n.s.
Event 4 4673.5 -0.875 0.382 n.s.
Event 5 2362.0 -3.430 0.001 0.27 *Effect size (r) is provided for significant relationships.
Given that women and men reported comparable involvement levels (PIC) at cancer-cause
events while women indicated significantly greater involvement with social-causes, a further
level of analysis was conducted to determine if each gender was significantly more involved with
one type of cause over the other. Independent sample t-tests comparing the responses by gender,
indicated that women‘s PIC was similar between cancer-causes (M=3.93, SD=.732) and social
causes (M=3.78, SD=.674; t(312) = 1.84, p=.07). Male respondents, however, reported that PIC
was significantly higher for cancer-causes (M=3.93, SD=.667) than for social-causes (M=3.57,
SD=.666; t(317) = 4.47, p=.000). The magnitude of the differences in men‘s means (mean
difference =.358, 95% CI: .20 to .52) was moderate (eta squared=.06). Results of this
comparison of means are presented in Table 28 below.
Table 28: T-Tests for Equality of Means –Cancer vs. Social Cause Involvement
95% Confidence
Internal
Sample t df Sig.
(2-
tailed)
Mean
Differences
Eta
Squared*
Std. Error
Difference
Lower Upper
Women‘s
Cancer
vs. Social
Causes
1.836 312 .067 .146 n.s. .079 -.010 .302
Men‘s
Cancer
vs. Social
Causes
4.473 317 .000 .359 .06 .080 .201 .517

170
Based on these reported findings, H1 is partially supported as women were found to have greater
personal involvement with the cause at sporting events that are linked to a charity/cause when
considering the all-events sample, men‘s hockey sample, social-causes sample, and Event #5
(men‘s OHL game in support of Salvation Army Toy Drive). The influence of gender on PIC
was greatest at Event 5. Women‘s PIC was not significantly different between types of causes
while men reported significantly greater PIC with cancer-causes than with social-causes.
5.3.2 Hypothesis 2
H2: Males are more highly involved with sport (PIS) than females at charity-linked hockey
sporting events.
The same process of analysis as H1 was conducted in order to test for significant gender
differences in reported involvement levels with the sport of hockey. In this case, independent
sample t-tests comparing the mean PIS scores between gender groups revealed no significant
differences. For event specific samples, Mann-Whitney U tests were also run with the same
insignificant findings. These results were consistent across all levels of investigation thereby
establishing that H2 is not supported. Table 29 and Table 30 summarize the results of this
analysis. Table 31 details the non-parametric support for event specific samples.
Table 29: Gender Comparisons of Personal Involvement with Sport (Hockey)
Statistic Female Male
All Events
N 314 319
Mean 4.00 4.04
S.D. .916 .901
Women’s Hockey
N 121 [76] 76

171
Mean 4.07 [4.15] 4.07
S.D. .991[.971] .933
Men’s Hockey
N 193 243 [193]
Mean 3.96 4.03 [4.03]
S.D. .866 .893 [.896]
Cancer-Causes
N 156 [101] 101
Mean 3.99 [3.96] 4.03
S.D. 1.00 [1.022] .991
Social-Causes
N 158 218 [158]
Mean 4.01 4.04 [3.98]
S.D. .819 .859 [.869]
Event 1
N 35 [25] 25
Mean 3.71 [3.56] 3.91
S.D. 1.03 [1.14] 1.17
Event 2
N 57 [42] 42
Mean 4.13 [4.08] 4.06
S.D. .978 [1.03] .994
Event 3
N 64 [34] 34
Mean 4.02 [4.11] 4.07
S.D. 1.01 [1.08] .868
Event 4
N 73 138 [73]
Mean 3.87 3.98 [4.01]
S.D. .817 .892 [.915]
Event 5
N 85 80
Mean 4.14 4.14

172
S.D. .806 .794
Table 30: T-Tests for Equality of Means – Personal Involvement with the Sport of Hockey
95% Confidence
Internal
Sample t Df Sig.
(2-tailed)
Mean
Differences
Std. Error
Difference
Lower Upper
All Events -.470 631 .639 -.034 .072 -.176 .108
Women‘s
Hockey
.041 195 .967 .006 .142 -.274 .286
Men‘s
Hockey
-.805 434 .421 -.068 .850 -.235 .099
Cancer-
Causes
-.290 255 .772 -.037 .128 -.289 .215
Social-
Causes
-.296 374 .768 -.026 .088 -.199 .147
Event 1 -.709 58 .481 -.202 .285 -.772 .368
Event 2 .355 97 .724 .071 .200 -.326 .468
Event 3 -.260 96 .796 -.053 .204 -.458 .352
Event 4 -.883 209 .378 -.111 .125 -.358 .137
Event 5 -.035 163 .972 -.004 .125 -.250 .242
Table 31: Mann- Whitney U Test – Personal Involvement with Sport
Sample U Z p r
Event 1 377.5 -0.912 0.36 n.s
Event 2 1115 -0.596 0.55 n.s
Event 3 1087.5 -0.004 1.00 n.s
Event 4 4532 -1.209 0.23 n.s
Event 5 3383 -0.56 0.96 n.s
*Effect size (r) is provided for significant relationships.
Given the non-significance of this comparison, the construct of PIS was further examined from
an all-events sample perspective. This added level of analysis was undertaken to verify for any
additional insights into the construct of PIS. Independent sample t-tests were conducted for all
three measures of PIS to determine if any elements of this construct were impacted by gender.
While PIS_1 scores (i.e., Hockey is an important part of my life.) were nearly identical for both

173
women (M=4.03) and men (M=4.04), differences (albeit not significant at the .05 level) were
observed with PIS_2 (i.e., Hockey is one of the most enjoyable activities for me.). In this case,
men reported a higher mean (M=4.08) than did women (M=3.96) but with a non-significant p
value of .16. At an alpha value of .10, this observation nears significance. The final measure of
PIS (i.e., Most of my friends are in some way connected to hockey) generated slightly higher
(but still not significantly different) mean scores for women (M=4.02) than from men (M=3.99).
When considering responses gathered at women‘s hockey games, women‘s agreement with this
measure was the highest of all considered scenarios (M=4.17) and had the greatest distinction
from the reported mean of men (M=4.08) however none of these further dissections of the PIS
construct revealed any significant gender differences.
5.3.3 Hypothesis 3
H3: Females are more supportive of women‘s sport and causes/charities (GSW) than are
males.
Independent sample t-tests were again relied upon to investigate the significance of possible
differences between gender groups and their respective levels of support for women in terms of
women‘s sports and women‘s causes. Significant differences were found in all investigated
scenarios with the one exception of the smallest sampled event (i.e. Event 1: NU Real Men Wear
Pink). An analysis of the all-events sample revealed that women (M=4.41, SD=.683) claim
significantly stronger support for their own gender than do men (M=3.99, SD=.795;
t(631)=7.234, p=.000, two-tailed). The magnitude of the difference in the means (mean
difference=.427, 95% CI: .311 to .542) was moderate (eta squared=.08). A stronger gender
effect on GSW was observed at women‘s hockey games. When considering the women‘s hockey
sample, 13% (eta squared=.13) of the observed variance in GSW was explained by gender. This

174
reported effect was greatest at Event 2 (LU Women‘s Hockey Pink the Rink) where gender
explained 19% of the variance observed in GSW. Results for all sample treatments are detailed
in Table 32 and Table 33. Mann-Whitney U tests for the five event samples rendered the same
conclusions as with the independent sample t-tests and are presented in Table 34. These results
strongly support H3.
Table 32: Gender Comparisons of Gender Support for Women
Statistic Female Male
All Events
N 314 319
Mean 4.41 3.99
S.D. .683 .795
Women’s Hockey
N 121 [76] 76
Mean 4.63 [4.61] 4.16
S.D. .535 [.544] .699
Men’s Hockey
N 193 243 [193]
Mean 4.28 3.93 [3.92]
S.D. .730 .816 [.819]
Cancer-Causes
N 156 [101] 101
Mean 4.53 [4.52] 4.16
S.D. .664 [.707] .718
Social Causes
N 158 218 [158]
Mean 4.30 3.91 [3.94]
S.D. .686 .817 [.794]
Event 1
N 35 [25] 25
Mean 4.16 [4.02] 4.16

175
S.D. .906 [.995] .787
Event 2
N 57 [42] 42
Mean 4.67 [4.68] 4.06
S.D. .494 [.466] .782
Event 3
N 64 [34] 34
Mean 4.60 [4.63] 4.29
S.D. .572 [.466] .566
Event 4
N 73 138 [73]
Mean 4.35 3.95 [3.97]
S.D. .686 .832 [.895]
Event 5
N 85 80
Mean 4.26 3.83
S.D. .688 .788
Table 33: T-Tests for Equality of Means – Gender Support for Women
95% Confidence
Internal
Sample t df Sig.
(2-
tailed)
Eta-
Squared
Mean
Differences
Std. Error
Difference
Lower Upper
All
Events
7.234 631 .000 .08 .427 .059 .311 .542
Women‘s
Hockey
5.293 195 .000 .13 .468 .088 .293 .642
Men‘s
Hockey
4.593 434 .000 .05 .345 .075 .197 .493
Cancer-
Causes
4.136 255 .000 .06 .362 .088 .190 .535
Social-
Causes
4.979 374 .000 .06 .398 .080 .241 .555
Event 1 -.013 58 .990 - -.003 .225 -.453 .447
Event 2 4.726 97 .000 .19 .607 .129 .352 .862
Event 3 2.543 96 .013 .06 .307 .121 .067 .547
Event 4 3.489 209 .001 .06 .396 .114 .172 .620
Event 5 3.823 163 .000 .08 .440 .115 .213 .667

176
Table 34: Mann-Whitney U Test – Gender Support for Women
Sample U Z p r
Event 1 428 1.5 0.88 n.s
Event 2 624.5 4.361 0.00 0.47
Event 3 737 2.806 0.01 0.28
Event 4 3619.5 3.522 0.00 0.24
Event 5 2261.5 -3.947 0.00 0.31
*Effect size (r) is provided for significant relationships.
5.3.4 Hypothesis 4
H4: Males are more supportive of men‘s sporting events and men‘s charitable/social causes
(GSM) than are females.
Independent sample t-tests were conducted to compare reported scores for GSM between gender
groups. When collectively considering all sampled events, there was a significant difference in
scores for females (M=4.25, SD=.717) and males (M=4.02, SD=.719; t (631) =4.02, p=.024,
two-tailed). Females in this case however were found to be more supportive of men‘s sports and
charitable causes than were men. The magnitude of the difference in the means (mean difference
= .230, 95% CI: .117 to .342) was relatively small (eta squared=.03). Significant differences
contrary to H4 were also found when analyzing the women‘s hockey sample, the men‘s hockey
sample, the social-causes sample and individual Events 2 (LU Pink the Rink), 4 (Ottawa
Senators Food Drive) and 5 (Sudbury Wolves Toy Drive). Only the smallest investigated venue
(Event 1: NU Real Men Wear Pink) revealed a higher mean for GSM for men than for women
but the difference in this finding was not significant. Non- significant gender differences in
GSM were also noted for the cancer-causes and event 3 samples. H4 is therefore not supported
with any of the sample treatments. Full statistical results for this analysis are presented in Table

177
35 and Table 36. Mann-Whitney U test results for the five individual events are presented in
Table 37.
Table 35: Gender Comparisons of Gender Support for Men
Statistic Female Male
All Events
N 314 319
Mean 4.25 4.02
S.D. .717 .719
Women’s Hockey
N 121 [76] 76
Mean 4.35 [4.36] 4.13
S.D. .660 [.647] .617
Men’s Hockey
N 193 243 [193]
Mean 418 3.98 [3.98]
S.D. .745 .746 [.730]
Cancer-Causes
N 156 [101] 101
Mean 4.28 [4.31] 4.16
S.D. .730 [.774] .636
Social Causes
N 158 218 [158]
Mean 4.21 3.95 [3.98]
S.D. .706 .747 [.703]
Event 1
N 35 [25] 25
Mean 4.03 [3.88] 4.26
S.D. .899 [.992] .694
Event 2
N 57 [42] 42
Mean 4.50 [4.55] 4.08

178
S.D. .575 [.561] .594
Event 3
N 64 [34] 34
Mean 4.22 [4.29] 4.18
S.D. .706 [.676] .650
Event 4
N 73 138 [73]
Mean 4.23 4.01 [3.99]
S.D. .703 .727 [.788]
Event 5
N 85 80
Mean 4.19 3.85
S.D. .712 .773
Table 36: T-Tests for Equality of Means – Gender Support for Men
95% Confidence
Internal
Sample T df Sig.
(2-
tailed)
Eta-
Squared
Mean
Differences
Std. Error
Difference
Lower Upper
All
Events
4.02* 631 .000 .03 .23 .057 .117 .342
Women‘s
Hockey
2.44** 167.5 .016 .03 .226 .093 .043 .409
Men‘s
Hockey
2.587 384 .010 .02 .194 .075 .047 .342
Cancer-
Causes
1.398*** 233.7 .164 n.s. .120 .086 -.049 .290
Social-
Causes
3.443 374 .001 .03 .262 .076 .113 .412
Event 1 -1.077 58 .286 n.s. -.231 .215 -.661 .199
Event 2 3.515 97 .001 .11 .417 .119 .181 .652
Event 3 0.290 96 .773 n.s. .042 .146 -.247 .332
Event 4 2.168 209 .031 .02 .226 .104 .021 .431
Event 5 2.977 163 .003 .05 .344 .116 .116 .572 *Levene‘s Test for Equality of Variances is significant (F=5.127, Sign=.024) therefore equal variance is not
assumed in this case and alternate values are presented according to equal variances not assumed.
**Levene‘s Test for Equality of Variances is significant (F=5.547, Sign=.020) therefore equal variance is not
assumed in this case and alternate values are presented according to equal variances not assumed.

179
**Levene‘s Test for Equality of Variances is significant (F=6.516, Sign=.011) therefore equal variance is not
assumed in this case and alternate values are presented according to equal variances not assumed.
Table 37: Mann-Whitney U Test – Gender Support for Women
Sample U Z p R
Event 1 376.5 -0.953 0.34 n.s.
Event 2 761 -3.273 0.00 0.26
Event 3 1051 -0.288 0.77 n.s.
Event 4 4085 -2.368 0.02 0.18
Event 5 2539 -2.989 0.00 0.23
*Effect size (r) is provided for significant relationships.
5.3.5 Hypotheses 5a to 9a
Hypotheses 5 through 9 address the relationships between key variables in the sponsorship
process. There are eleven such relationships (PI*FIT, PI*SINC, PI*INT, PI*FAV, PI*USE,
FIT*INT, FIT*FAV, FIT*USE, SINC*INT, SINC* FAV, SINC*USE) that are first considered
from a total sample perspective followed by an examination of possible gender effects with each
of these relationships. This presentation of findings begins by addressing the main interaction of
variables and then proceeds to compare results by gender.
H5a: Personal involvement (PI) has a direct and positive effect on perceived sponsor-event
fit (FIT) in charity-linked sport settings.
H6a: Personal involvement (PI) has a direct and positive effect on perceived sincerity
(SINC) of the sponsor in charity-linked sport settings.
H7a: Personal involvement (PI) has a direct and positive effect on sponsorship response
(INT, FAV, and/or USE) in charity-linked sport settings.

180
H8a: Perceived sponsor-event fit (FIT) has a direct and positive effect on sponsorship
response (INT, FAV and/or USE) in charity-linked sport settings.
H9a: Perceived sincerity (SINC) of the sponsor has a direct and positive effect on
sponsorship response (INT, FAV and/or USE) in charity-linked sport settings.
Pearson product-moment correlation coefficients were used to assess the strength and direction
of the relationships to be tested. Scatterplots were generated and inspected to confirm linear
relationships between variables. Cohen (1988) suggested that r =.10 to .29 is reflective of small
correlation, r =.30 to .49 is moderate, and r =.50 to1.0 represents strong relationships between
tested variables. Hair, Celsi, Ortinau, and Bush (2013) further distinguished between statistical
and substantive significance and recommend considering the coefficient of determination (r2) to
understand the proportion of variance in one variable (such as FIT) that is explained by another
variable (such as PI). These measures will assist in determining the practical use of correlation
findings.
H5a to H9a were supported when analyzing the all-events sample as significant interactions were
revealed among all eleven relationships. For this sample, significant correlations ranged from r=
.37 to r=.53 among hypothesized variables. The weakest (but still significant) relationships were
PI*USE (r=.37) and PI* FAV (r=.38) and the strongest observed correlations in this case were
FIT*INT (r=.53) and SINC*INT (r=.51). Table 38 details all calculated correlations for the all-
events sample.
Table 38: Correlation Matrix (All-Events Sample)
PI FIT SINC INT FAV USE
PI Pearson
Correlation .440**
.439**
.415**
.375**
.370**

181
For the women‘s hockey sample, significant relationships were also confirmed among all
considered variables within a range of r=.24 to .52. For data collected at women‘s hockey
events, the weakest (but still significant) association was PI*USE (r=.24) and the strongest
reported correlation was FIT*INT (r=.52) with very similar results as the total sample view.
Table 39 presents the correlation results for this women‘s hockey sample.
Table 39: Correlation Matrix (Women’s Hockey Sample)
PI FIT SINC INT FAV USE
Sig. (2-tailed) .000 .000 .000 .000 .000
R2 .19 .193 .172 .141 .137
N 642 642 642 642 642
FIT Pearson
Correlation .518**
.533**
.441**
.454**
Sig. (2-tailed) .000 .000 .000 .000
R2 .27 .28 .19 .21
N 642 642 642 642
SINC Pearson
Correlation .513**
.481**
.461**
Sig. (2-tailed) .000 .000 .000
R2 .26 .23 .21
N 642 642 642
INT Pearson
Correlation .724**
.697**
Sig. (2-tailed) .000 .000
R2 .524 .486
N 642 642
FAV Pearson
Correlation .778**
Sig. (2-tailed) .000
R2 .61
N 642
M 3.897 3.72 4.10 3.80 3.87 3.78
SD .6564 .775 .783 .815 .772 .841
** Correlation is significant at the 0.01 level (2-tailed).

182
PI Pearson
Correlation .338**
.399**
.291**
.280**
.235**
Sig. (2-tailed) .000 .000 .000 .000 .001
R2 .114 .159 .085 .078 .056
N 200 200 200 200 200
FIT Pearson
Correlation .447**
.521**
.428**
.443**
Sig. (2-tailed) .000 .000 .000 .000
R2 .200 .271 .183 .196
N 200 200 200 200
SINC Pearson
Correlation .449**
.437**
.409**
Sig. (2-tailed) .000 .000 .000
R2 .202 .191 .167
N 200 200 200
INT Pearson
Correlation .663**
.654**
Sig. (2-tailed) .000 .000
R2 .440 .428
N 200 200
FAV Pearson
Correlation .723**
Sig. (2-tailed) .000
R2 .523
N 200
M 4.03 3.57 4.26 3.91 4.00 3.85
SD .622 .809 .674 .732 .665 .757
**Correlation is significant at the 0.01 level (2-tailed).
Significant relationships were also confirmed with the men‘s hockey sample. For spectators of
men‘s hockey, reported correlations ranged from r=.40 to r=.57. While still significant, the
weakest of observed correlations with this men‘s hockey sample was PI*FAV (r=.40) and the

183
strongest correlations were FIT*INT (r=.57) as well as PI*FIT (r=.53), and SINC*INT (r=.53).
Table 40 contains all calculated correlations for this men‘s hockey sample.
Table 40: Correlation Matrix (Men’s Hockey Sample)
PI FIT SINC INT FAV USE
PI Pearson
Correlation .525
** .439
** .451
** .395
** .414
**
Sig. (2-
tailed) .000 .000 .000 .000 .000
R2 .276 .193 .203 .156 .171
N 442 442 442 442 442
FIT Pearson
Correlation .591
** .568
** .481
** .479
**
Sig. (2-
tailed) .000 .000 .000 .000
R2 .349 .323 .231 .229
N 442 442 442 442
SINC Pearson
Correlation .527
** .483
** .475
**
Sig. (2-
tailed) .000 .000 .000
R2 .278 .233 .226
N 442 442 442
INT Pearson
Correlation .741
** .710
**
Sig. (2-
tailed) .000 .000
R2 .549 .504
N 442 442
FAV Pearson
Correlation .795
**
Sig. (2-
tailed) .000
R2 .632
N 442
M 3.84 3.79 4.02 3.75 3.81 3.74
SD 0.66 .751 .817 .846 .810 .875
**Correlation is significant at the 0.01 level (2-tailed).

184
Significant relationships were also confirmed with the cancer-causes sample. For spectators of
cancer-cause events, reported correlations ranged from r=.24 to r=.51. While still significant, the
weakest of observed correlations with this cancer-causes sample was PI*USE (r=.24) and the
strongest correlation was FIT*INT (r=.51). Table 41 contains all calculated correlations for this
cancer-causes sample.
Table 41: Correlation Matrix (Cancer-Causes Sample)
PI FIT SINC INT FAV USE
PI Pearson
Correlation
.368**
.359**
.297**
.290**
.243**
Sig. (2-
tailed)
.000 .000 .000 .000 .000
R2 .135 .129 .088 .084 .059
N
260 260 260 260 260
FIT Pearson
Correlation
.470**
.514**
.430**
.463**
Sig. (2-
tailed)
.000 .000 .000 .000
R2 .221 .264 .185 .214
N
260 260 260 260
SINC Pearson
Correlation
.479**
.455**
.428**
Sig. (2-
tailed)
.000 .000 .000
R2 .229 .207 .183
N
260 260 260
INT Pearson
Correlation
.672**
.659**
Sig. (2-
tailed)
.000 .000
R2 .452 .434
N
260 260
FAV Pearson
Correlation
.733**
Sig. (2-
tailed)
.000
R2
.537

185
N 260
M 3.98 3.65 4.25 3.90 3.98 3.87
SD .696 .822 .708 .745 .700 .764
**Correlation is significant at the 0.01 level (2-tailed).
Significant relationships were also confirmed with the social-causes sample. For spectators of
social-cause events, reported correlations ranged from r=.42 to r=.57. While still significant, the
weakest of observed correlations with this social-causes sample was PI*FAV (r=.42) and the
strongest correlation was FIT*INT (r=.57). Table 42 contains all calculated correlations for this
social-causes sample.
Table 42: Correlation Matrix (Social-Causes Sample)
PI FIT SINC INT FAV USE
PI Pearson
Correlation
.520**
.483**
.487**
.423**
.448**
Sig. (2-
tailed)
.000 .000 .000 .000 .000
R2 .270 .233 .237 .179 .201
N
382 382 382 382 382
FIT Pearson
Correlation
.589**
.571**
.475**
.470**
Sig. (2-
tailed)
.000 .000 .000 .000
R2 .347 .326 .226 .221
N
382 382 382 382
SINC Pearson
Correlation
.520**
.480**
.468**
Sig. (2-
tailed)
.000 .000 .000
R2 .270 .384 .219
N
382 382 382
INT Pearson
Correlation
.746**
.712**
Sig. (2-
tailed)
.000 .000
R2 .557 .507

186
N
382 382
FAV Pearson
Correlation
.797**
Sig. (2-
tailed)
.000
R2
.635
N 382
M 3.84 3.77 3.99 3.73 3.79 3.71
SD .623 .740 .814 .853 .810 .884
**Correlation is significant at the 0.01 level (2-tailed).
Correlation analyses were also conducted for each of the five individual events with results
supporting the hypotheses in most cases. The only exception were two cases of insignificance
(PI*FIT r= .19 and PI*USE r=.17) at Event 2 (LU Pink the Rink). The non-parametric
alternative to Pearson‘s product-moment correlation coefficient (i.e., Spearman Rank Order
correlation) was also used to calculate correlations for the five event specific samples. In this
case, the two noted cases of insignificance at Event 2 were found to be significant at the .01 level
albeit with very weak correlations (PI*FIT=.20 and PI*USE=.22). Event specific correlation
results can be found in Appendix H.
The testing of the eleven relationships specific to hypotheses 5a to 9a revealed significant
correlations for all investigated samples with several strong relationships (r value above .5) noted
across these scenarios. Based on these findings H5a, H6a, H7a, H8a, and H9a are all strongly
supported.
Also noteworthy is the strong relationship between the constructs of FIT and SINC (all-events
sample r=.52; women‘s hockey sample r=.45, men‘s hockey sample r =.57, cancer-causes sample
r=.47, social-causes sample r=.59) as well as the powerful overlap between the three levels of

187
measured response (INT*FAV*USE). For instance, for the all-event sample, INT has over 52%
shared variance with FAV and FAV helps to explain 61% of the variance in respondents‘ USE.
5.3.6 Hypotheses 5b to 9b
The following section re-considers the above tested relationships from a gendered perspective.
Correlation matrices are first produced for both distinct groups and then the strength of the
correlation coefficients are compared to determine any significant differences between the
findings of women and men. The five grouped sample treatments (i.e., all-events, women‘s
hockey, men‘s hockey, cancer-causes, and social-causes) were considered in these gender-level
analyses. Event specific comparisons were not conducted as these individual events were
captured in multiple sample groupings which allowed for significant comparisons and more
focused discussion.
H5b: Gender has a significant impact on the interaction of PI*FIT and the effect is greater
for women.
H6b: Gender has a significant impact on the interaction of PI *SINC and the effect is greater
for women.
H7b: Gender has a significant impact on the interaction of PI*INT, PI*FAV, and PI*USE
and the effect is greater for women.
H8b: Gender has a significant impact on the interaction of FIT* INT, FIT*FAV, and
FIT*USE and the effect is greater for women.
H9b: Gender has a significant impact on the interaction of SINC*INT, SINC*FAV, and
SINC*USE and the effect is greater for women.

188
The hypothesized relationships were again tested using Pearson product-moment correlation
coefficients with gender-split data. For the all-events sample, there were strong, positive
correlations between all variables. For women, values for theorized relationships ranged from a
low of r=.36 (PI*USE) to a high of r=.52 (FIT*INT). For men within this sample, correlations
ranged from a low of r=.35 (PI*SINC and PI*FAV) to a high of r=.54 (FIT*INT). A detailed
correlation matrix for the all-events sample is presented in Table 43.
Table 43: Correlation Matrix by Gender (All-Events Sample)
Gender PI FIT SINC INT FAV USE
Women PI Pearson
Correlation .466
** .514
** .443
** .392
** .355
**
Sig. (2-tailed) .000 .000 .000 .000 .000
R2 .217 .264 .196 .154 .126
N 314 314 314 314 314
FIT Pearson
Correlation .488
** .519
** .445
** .469
**
Sig. (2-tailed) .000 .000 .000 .000
R2 .238 .269 .198 .220
N 314 314 314 314
SINC Pearson
Correlation .477
** .485
** .462
**
Sig. (2-tailed) .000 .000 .000
R2 .228 .235 .213
N 314 314 314
INT Pearson
Correlation .721
** .683
**
Sig. (2-tailed) .000 .000
R2 .520 .466
N 314 314
FAV Pearson
Correlation .789
**
Sig. (2-tailed) .000
R2 .623
N 314
M 3.93 3.66 4.16 3.84 3.88 3.81
SD .654 .772 .776 .802 .770 .828
Men PI Pearson .407
** .347
** .366
** .346
** .369
**

189
Correlation
Sig. (2-tailed) .000 .000 .000 .000 .000
R2 .166 .120 .134 .120 .136
N 319 319 319 319 319
FIT Pearson
Correlation .551
** .540
** .423
** .435
**
Sig. (2-tailed) .000 .000 .000 .000
R2 .304 .292 .179 .189
N 319 319 319 319
SINC Pearson
Correlation .531
** .466
** .448
**
Sig. (2-tailed) .000 .000 .000
R2 .282 .217 .201
N 319 319 319
INT Pearson
Correlation .715
** .699
**
Sig. (2-tailed) .000 .000
R2 .511 .489
N 319 319
FAV Pearson
Correlation .762
**
Sig. (2-tailed) .000
R2 .581
N 319
M 3.86 3.77 4.03 3.75 3.85 3.74
SD .654 .769 .781 .812 .767 .847
**Correlation is significant at the 0.01 level (2-tailed).
*Correlation is significant at the 0.05 level (2-tailed).
For the women‘s hockey sample, three non-significant correlations were observed. These were
all among the male sample and involved the PI construct (PI*FIT, PI*FAV, PI*USE). All other
relationships were significant and positive. For women, significant results for hypothesized
associations extended from a low of r=.29 (PI*USE) to a high of r=.52 (FIT*INT). Among the
significant correlations found for the male sample, the lowest reported value was r= .24 (PI*INT)
and the highest reported correlation was r=.51 (SINC*INT). A detailed correlation matrix for the
women‘s hockey sample is presented in Table 44.

190
Table 44: Correlation Matrix by Gender (Women's Hockey Sample)
Gender PI FIT SINC INT FAV USE
Women PI Pearson Correlation .393**
.450**
.297**
.317**
.283**
Sig. (2-tailed) .000 .000 .001 .000 .002
R2 .154 .203 .088 .100 .080
N 121 121 121 121 121
FIT Pearson Correlation .420**
.521**
.442**
.474**
Sig. (2-tailed) .000 .000 .000 .000
R2 .176 .271 .195 .225
N 121 121 121 121
SINC Pearson Correlation .416**
.444**
.406**
Sig. (2-tailed) .000 .000 .000
R2 .173 .197 .165
N 121 121 121
INT Pearson Correlation .656**
.674**
Sig. (2-tailed) .000 .000
R2 .430 .454
N 121 121
FAV Pearson Correlation .751**
Sig. (2-tailed) .000
R2 .564
N 121
M 4.03 3.47 4.28 3.86 3.94 3.80
SD .636 .797 .716 .744 .691 .754
Men PI Pearson Correlation .218 .276* .243
* .187 .103
Sig. (2-tailed) .059 .016 .035 .105 .376
R2 .048 .076 .059 .035 .011
N 76 76 76 76 76
FIT Pearson Correlation .527**
.489**
.356**
.352**
Sig. (2-tailed) .000 .000 .002 .002
R2 .278 .239 .127 .124
N 76 76 76 76
SINC Pearson Correlation .514**
.439**
.408**
Sig. (2-tailed) .000 .000 .000
R2 .264 .193 .166

191
N 76 76 76
INT Pearson Correlation .661**
.599**
Sig. (2-tailed) .000 .000
R2 .437 .359
N 76 76
FAV Pearson Correlation .670**
Sig. (2-tailed) .000
R2 .449
N 76
M 4.00 3.69 4.22 3.95 4.07 3.90
SD .594 .804 .608 .710 .618 .748
**Correlation is significant at the 0.01 level (2-tailed).
*Correlation is significant at the 0.05 level (2-tailed).
For the men‘s hockey sample, all relationships were strong and positive. For female respondents
of this sample, r values ranged from a low of r=.40 (PI*USE) to a high of r=.58 (PI*FIT). For
men of this same sample, significant r values ranged from r=.35 (PI*SINC) to r=.58 (FIT*INT).
A detailed correlation matrix for the men‘s hockey sample is presented in Table 45.
Table 45: Correlation Matrix by Gender (Men’s Hockey Sample)
Gender PI FIT SINC INT FAV USE
Women PI Pearson
Correlation .577
** .538
** .522
** .426
** .399
**
Sig. (2-
tailed) .000 .000 .000 .000 .000
R2 .333 .289 .272 .181 .159
N 193 193 193 193 193
FIT Pearson
Correlation .592
** .544
** .486
** .482
**
Sig. (2-
tailed) .000 .000 .000 .000
R2 .350 .296 .236 .232
N 193 193 193 193
SINC Pearson
Correlation .509
** .500
** .496
**
Sig. (2-
tailed) .000 .000 .000

192
R2 .259 .250 .246
N 193 193 193
INT Pearson
Correlation .753
** .689
**
Sig. (2-
tailed) .000 .000
R2 .567 .475
N 193 193
FAV Pearson
Correlation .810
**
Sig. (2-
tailed) .000
R2 .656
N 193
M 3.87 3.78 4.09 3.83 3.84 3.81
SD .660 .733 .805 .838 .815 .873
Men PI Pearson
Correlation .477
** .349
** .383
** .365
** .421
**
Sig. (2-
tailed) .000 .000 .000 .000 .000
R2 .228 .122 .147 .133 .177
N 243 243 243 243 243
FIT Pearson
Correlation .581
** .575
** .463
** .472
**
Sig. (2-
tailed) .000 .000 .000 .000
R2 .338 .331 .202 .223
N 243 243 243 243
SINC Pearson
Correlation .524
** .456
** .447
**
Sig. (2-
tailed) .000 .000 .000
R2 .275 .208 .200
N 243 243 243
INT Pearson
Correlation .719
** .717
**
Sig. (2-
tailed) .000 .000
R2 .517 .514
N 243 243
FAV Pearson
Correlation .778
**
Sig. (2-
tailed) .000
R2 .605

193
N 243
M 3.82 3.79 3.98 3.69 3.78 3.69
SD .667 .758 .820 .833 .796 .871
*Correlation is significant at the 0.05 level (2-tailed).
**Correlation is significant at the 0.01 level (2-tailed).
For the cancer-causes sample, four non-significant correlations were observed. These
were all among the male sample and involved the PI construct (PI*SINC, PI*INT,
PI*FAV, PI*USE). All other relationships were significant and positive. For women,
significant results for hypothesized associations extended from a low of r=.33 (PI*USE)
to a high of r=.51 (FIT*INT). Among the significant correlations found for the male
sample, the lowest reported value was r= .33 (PI*FIT) and the highest reported
correlation was r=.50 (SINC*INT). A detailed correlation matrix for the cancer-causes
sample is presented in Table 46 below.
Table 46: Correlation Matrix by Gender (Cancer-Causes Sample)
Gender PI FIT SINC INT FAV USE
Women PI Pearson
Correlation .380**
.463**
.367**
.364**
.327**
Sig. (2-
tailed) .000 .000 .000 .000 .000
R2 .144 .214 .135 .132 .107
N 156 156 156 156 156
FIT Pearson
Correlation .471**
.514**
.423**
.499**
Sig. (2-
tailed) .000 .000 .000 .000
R2 .222 .264 .179 .249
N 156 156 156 156
SINC Pearson
Correlation .471**
.480**
.466**
Sig. (2-
tailed) .000 .000 .000
R2 .222 .230 .217
N 156 156 156

194
INT Pearson
Correlation .673**
.678**
Sig. (2-
tailed) .000 .000
R2 .453 .460
N 156 156
FAV Pearson
Correlation .750**
Sig. (2-
tailed) .000
R2 .563
N 156
M 3.96 3.54 4.25 3.83 3.86 3.79
SD .700 .817 .752 .772 .733 .771
Men PI Pearson
Correlation .328**
.154 .147 .139 .066
Sig. (2-
tailed) .001 .123 .143 .166 .509
R2 .108 .024 .022 .019 .004
N 101 101 101 101 101
FIT Pearson
Correlation .485**
.476**
.382**
.359**
Sig. (2-
tailed) .000 .000 .000 .000
R2 .235 .227 .146 .129
N 101 101 101 101
SINC Pearson
Correlation .497**
.425**
.353**
Sig. (2-
tailed) .000 .000 .000
R2 .247 .181 .125
N 101 101 101
INT Pearson
Correlation .648**
.598**
Sig. (2-
tailed) .000 .000
R2 .420 .358
N 101 101
FAV Pearson
Correlation .691**
Sig. (2-
tailed) .000
R2 .477
N 101
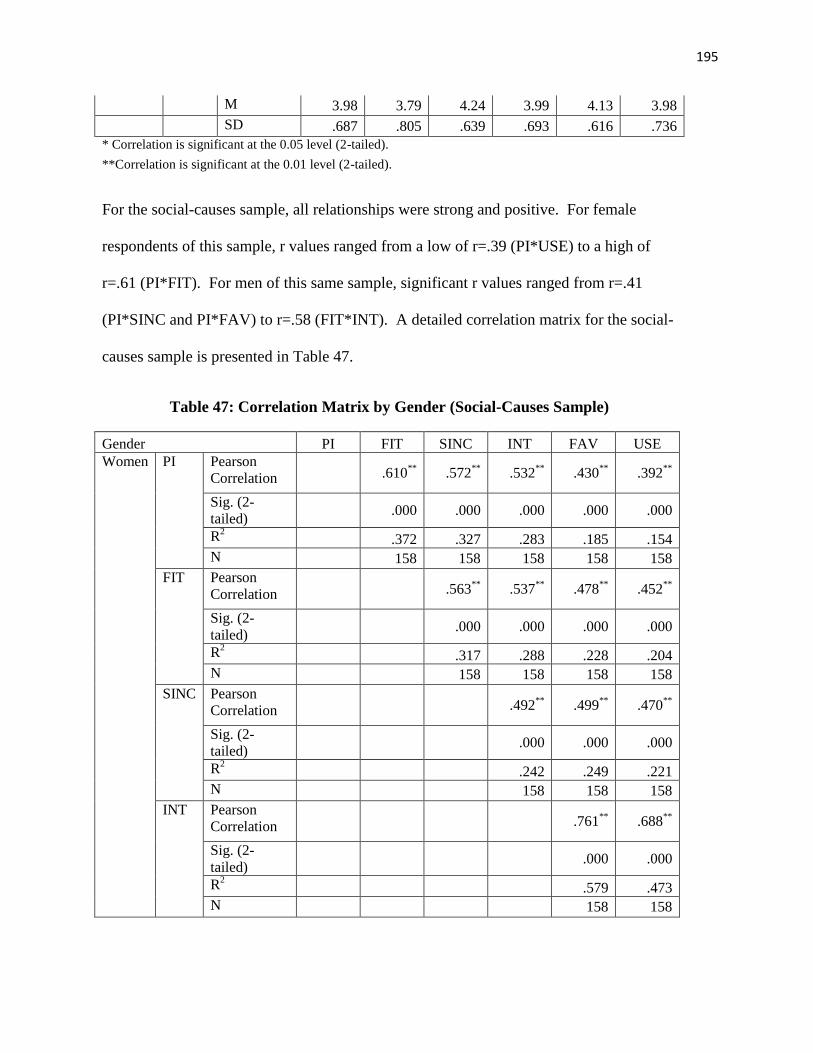
195
M 3.98 3.79 4.24 3.99 4.13 3.98
SD .687 .805 .639 .693 .616 .736
* Correlation is significant at the 0.05 level (2-tailed).
**Correlation is significant at the 0.01 level (2-tailed).
For the social-causes sample, all relationships were strong and positive. For female
respondents of this sample, r values ranged from a low of r=.39 (PI*USE) to a high of
r=.61 (PI*FIT). For men of this same sample, significant r values ranged from r=.41
(PI*SINC and PI*FAV) to r=.58 (FIT*INT). A detailed correlation matrix for the social-
causes sample is presented in Table 47.
Table 47: Correlation Matrix by Gender (Social-Causes Sample)
Gender PI FIT SINC INT FAV USE
Women PI Pearson
Correlation .610**
.572**
.532**
.430**
.392**
Sig. (2-
tailed) .000 .000 .000 .000 .000
R2 .372 .327 .283 .185 .154
N 158 158 158 158 158
FIT Pearson
Correlation .563**
.537**
.478**
.452**
Sig. (2-
tailed) .000 .000 .000 .000
R2 .317 .288 .228 .204
N 158 158 158 158
SINC Pearson
Correlation .492**
.499**
.470**
Sig. (2-
tailed) .000 .000 .000
R2 .242 .249 .221
N 158 158 158
INT Pearson
Correlation .761**
.688**
Sig. (2-
tailed) .000 .000
R2 .579 .473
N 158 158

196
FAV Pearson
Correlation .820**
Sig. (2-
tailed) .000
R2 .672
N 158
M 3.90 3.77 4.08 3.85 3.90 3.83
SD .606 .709 .792 .834 .806 .883
Men PI Pearson
Correlation .451**
.407**
.440**
.406**
.479**
Sig. (2-
tailed) .000 .000 .000 .000 .000
R2 .203 .166 .194 .165 .229
N 218 218 218 218 218
FIT Pearson
Correlation .593**
.583**
.458**
.477**
Sig. (2-
tailed) .000 .000 .000 .000
R2 .352 .340 .210 .228
N 218 218 218 218
SINC Pearson
Correlation .518**
.445**
.452**
Sig. (2-
tailed) .000 .000 .000
R2 .268 .198 .204
N 218 218 218
INT Pearson
Correlation .716**
.716**
Sig. (2-
tailed) .000 .000
R2 .513 .513
N 218 218
FAV Pearson
Correlation .771**
Sig. (2-
tailed) .000
R2 .594
N 218
M 3.81 3.76 3.94 3.64 3.71 3.63
SD .633 .753 .823 .839 .794 .875
*Correlation is significant at the 0.05 level (2-tailed).
** Correlation is significant at the 0.01 level (2-tailed).

197
With this understanding of correlations for each gender, the next step was to investigate if these
findings were significantly different between women and men. In order to test the statistical
significance of these differences between correlation coefficients, r values were converted into z
scores and then observed values of z (Zobs) were calculated (Preacher, 2002; Cohen & Cohen,
1983). To be considered statistically significant, Zobs values must fall outside the boundaries of -
1.96 and +1.96 (Pallant, 2010).
For the all-events sample, only one correlation was deemed significantly different. PI*SINC
(Zobs =2.58) had a significantly stronger correlation among women respondents that it did for the
sampled male population, thereby supporting only H6b. H5b, H7b, H8b, and H9b were therefore
not supported as differences between genders were not statistically significant for this all-events
sample.
For the women‘s hockey sample, all Zobs values were within the specified bounds (i.e., -1.96 to
+1.96) and therefore confirmed no statistically significant differences between correlation results
of these two sampled gender groups. These tests were also run with randomly equalized samples
(n=76) and generated similar non-significant results. For this women‘s hockey sample, H5b,
H6b, H7b, H8b, and H9b were not supported.
For the men‘s hockey sample, one significant difference was again observed. Women‘s
PI*SINC (Zobs =2.44) was significantly stronger than the correlation findings for men,
contributing further support for H6b. H5b, H7b, H8b, and H9b were not supported. These tests
were also run with randomly equalized samples (n=193) and confirmed these same conclusions.
For the cancer-causes sample two significant gender differences were observed. In this case,
women‘s PI*SINC (Zobs =2.68) was significantly stronger than the correlation findings for men,
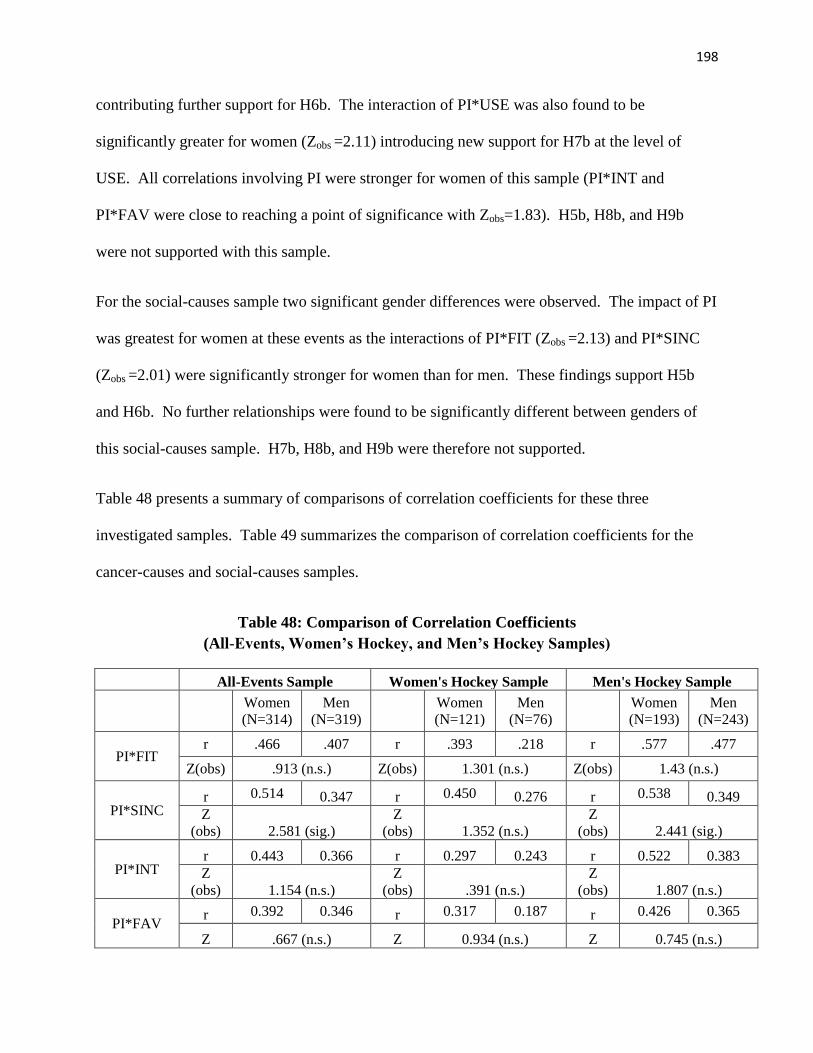
198
contributing further support for H6b. The interaction of PI*USE was also found to be
significantly greater for women (Zobs =2.11) introducing new support for H7b at the level of
USE. All correlations involving PI were stronger for women of this sample (PI*INT and
PI*FAV were close to reaching a point of significance with Zobs=1.83). H5b, H8b, and H9b
were not supported with this sample.
For the social-causes sample two significant gender differences were observed. The impact of PI
was greatest for women at these events as the interactions of PI*FIT (Zobs =2.13) and PI*SINC
(Zobs =2.01) were significantly stronger for women than for men. These findings support H5b
and H6b. No further relationships were found to be significantly different between genders of
this social-causes sample. H7b, H8b, and H9b were therefore not supported.
Table 48 presents a summary of comparisons of correlation coefficients for these three
investigated samples. Table 49 summarizes the comparison of correlation coefficients for the
cancer-causes and social-causes samples.
Table 48: Comparison of Correlation Coefficients
(All-Events, Women’s Hockey, and Men’s Hockey Samples)
All-Events Sample Women's Hockey Sample Men's Hockey Sample
Women
(N=314)
Men
(N=319)
Women
(N=121)
Men
(N=76)
Women
(N=193)
Men
(N=243)
PI*FIT r .466 .407 r .393 .218 r .577 .477
Z(obs) .913 (n.s.) Z(obs) 1.301 (n.s.) Z(obs) 1.43 (n.s.)
PI*SINC r 0.514 0.347 r 0.450 0.276 r 0.538 0.349
Z
(obs) 2.581 (sig.)
Z
(obs) 1.352 (n.s.)
Z
(obs) 2.441 (sig.)
PI*INT r 0.443 0.366 r 0.297 0.243 r 0.522 0.383
Z
(obs) 1.154 (n.s.)
Z
(obs) .391 (n.s.)
Z
(obs) 1.807 (n.s.)
PI*FAV r 0.392 0.346 r 0.317 0.187 r 0.426 0.365
Z .667 (n.s.) Z 0.934 (n.s.) Z 0.745 (n.s.)

199
(obs) (obs) (obs)
PI*USE r 0.355 0.369 r 0.283 0.103 r 0.399 0.421
Z
(obs) -0.202 (n.s.)
Z
(obs) 1.26 (n.s.)
Z
(obs) -0.272 (n.s.)
FIT*SINC r 0.488 0.551 r 0.42 0.527 r 0.592 0.581
Z
(obs) -1.081 (n.s.)
Z
(obs) -0.929 (n.s.)
Z
(obs) 0.173 (n.s.)
FIT*INT r 0.519 0.54 r 0.521 0.489 r 0.544 0.575
Z
(obs) -0.365(n.s.)
Z
(obs) 0.289 (n.s.)
Z
(obs) -0.465 (n.s.)
FIT*FAV r 0.445 0.423 r 0.442 0.356 r 0.486 0.463
Z
(obs) 0.339 (n.s.)
Z
(obs) .688 (n.s.)
Z
(obs) 0.306 (n.s.)
FIT*USE r 0.469 0.435 r 0.474 0.352 r 0.482 0.472
Z
(obs) .535 (n.s.)
Z
(obs) .991 (n.s.)
Z
(obs) 0.133 (n.s.)
SINC*INT r 0.477 0.531 r 0.416 0.514 r 0.509 0.524
Z
(obs) -.907 (n.s.)
Z
(obs) -0.842 (n.s.)
Z
(obs) -0.211 (n.s.)
SINC*FAV r 0.485 0.466 r 0.444 0.439 r 0.5 0.456
Z
(obs) .307 (n.s.)
Z
(obs) 0.042 (n.s.)
Z
(obs) 0.588 (n.s.)
SINC*USE r 0.462 0.448 r 0.406 0.408 r 0.496 0.447
Z
(obs) .221 (n.s.)
Z
(obs) -0.016 (n.s)
Z
(obs) 0.649 (n.s.)
INT*FAV r 0.721 0.715 r 0.656 0.661 r 0.753 0.719
Z
(obs) .155 (n.s.)
Z
(obs) -0.059 (n.s.)
Z
(obs) 0.765 (n.s.)
INT*USE r 0.683 0.699 r 0.674 0.599 r 0.689 0.717
Z
(obs) -0.383 (n.s.)
Z
(obs) 0.849 (n.s.)
Z
(obs) -0.57 (n.s.)
FAV*USE
r 0.789 0.762 r 0.751 0.67 r 0.81 0.778
Z
(obs) .849 (n.s.)
Z
(obs) 1.105 (n.s.)
Z
(obs) 0.893 (n.s.)
Table 49: Comparison of Correlation Coefficients
(Cancer-Causes and Social Causes Samples)
Cancer-Causes Sample Social-Causes Sample
Women
(N=156)
Men
(N=101)
Women
(N=158)
Men
(N=218)
PI*FIT r .38 .33 r 0.61 0.45

200
Z(obs) 0.442 (n.s.) Z(obs) 2.128
PI*SINC r .46 .15 r 0.57 0.41
Z
(obs) 2.676
Z
(obs) 2.011
PI*INT r 0.37 0.15 r 0.53 0.44
Z
(obs) 1.834 (n.s.)
Z
(obs) 1.119 (n.s.)
PI*FAV r 0.36 0.14 r 0.43 0.41
Z
(obs) 1.824 (n.s.)
Z
(obs) 0.23 (n.s.)
PI*USE r 0.33 0.07 r 0.39 0.39
Z
(obs) 2.108
Z
(obs) 0 (n.s.)
FIT*SINC r 0.47 0.49 r 0.56 0.59
Z
(obs) -0.201 (n.s.)
Z
(obs) -0.425 (n.s.)
FIT*INT r 0.51 0.48 r 0.54 0.58
Z
(obs) 0.307 (n.s.)
Z
(obs) -0.553 (n.s.)
FIT*FAV r 0.42 0.38 r 0.48 0.46
Z
(obs) 0.368 (n.s.)
Z
(obs) 0.244 (n.s.)
FIT*USE r 0.5 0.36 r 0.45 0.48
Z
(obs) 1.333 (n.s.)
Z
(obs) -0.363 (n.s.)
SINC*INT r 0.47 0.50 r 0.49 0.52
Z
(obs) -0.303 (n.s.)
Z
(obs) -0.382 (n.s.)
SINC*FAV r 0.48 0.43 r 0.50 0.45
Z
(obs) 0.488 (n.s.)
Z
(obs) 0.613 (n.s.)
SINC*USE r 0.47 0.35 r 0.47 0.45
Z
(obs) 1.118 (n.s.)
Z
(obs) 0.241 (n.s.)
INT*FAV r 0.67 0.65 r 0.76 0.72
Z
(obs) 0.274 (n.s.)
Z
(obs) 0.841 (n.s.)
INT*USE r 0.68 0.6 r 0.69 0.72
Z
(obs) 1.051 (n.s.)
Z
(obs) -0.566 (n.s.)
FAV*USE r 0.75 0.69 r 0.82 0.77
Z 0.966 (n.s.) Z 1.295 (n.s.)

201
(obs) (obs)
5.3.7 Hypothesis 10
Hypothesis 10 focuses specifically on the female sample of respondents. In this effort to
investigate the notion of gender solidarity among women in sponsorship settings, women‘s
expressed support of women‘s sports and causes/charities is first correlated with the three levels
of sponsorship response. The strength of correlation coefficients is then compared between the
women‘s hockey sample and the men‘s hockey sample to determine if the gender of the
sponsored sport impacts women‘s sponsorship response.
H10a: Gender support for women (GSW) has a direct and positive effect on women‘s
sponsorship response (INT, FAV, and/or USE).
H10b: Gender support for women (GSW) has a greater influence on women‘s sponsorship
response (INT, FAV, and/or USE) at female sporting events than at male sporting
events.
The relationship between GSW and all levels of female sponsorship response (INT, FAV, and
USE) was investigated using Pearson product-moment correlation coefficients. Hypothesis 10a
was supported as all associations were found to be positive and significantly correlated to the
investigated variables by the all-events female sample as well as the female samples recruited at
both women‘s and men‘s hockey events. For the all-events female sample, the association
between GSW and the three levels of sponsorship response were as follows: GSW*INT: r=.38,
GSW*FAV: r=.38, and GSW*USE: r=.29. At women‘s hockey games, women‘s reported

202
correlations were GSW*INT: r=.29, GSW*FAV: r=.32, and GSW*USE: r=.23. At the
investigated men‘s hockey games, the observed correlations were all stronger: GSW*INT: r=.42,
GSW*FAV: r=.40, and GSW*USE: r=.34. The GSW correlation findings for all modeled
variables are presented in Table 50. Very strong correlations were also observed with other study
constructs (i.e., GSW*PI: r=.69 for women from the men‘s hockey sample) beyond the
considerations of this specific hypothesis. Men‘s reported GSW also had significant correlation
with all levels of response.
Table 50: Correlation Matrix for Female Respondents
Female Respondents – All-Events Sample
PI FIT SINC INT FAV USE
GSW Pearson Correlation .60
** .37
** .49
** .38
** .38
** .29
**
Sig. (2-tailed) .000 .000 .000 .000 .000 .000
R2 .36 .14 .24 .14 .14 .08
N 314 314 314 314 314 314
Female Respondents at Women's Hockey Events
PI FIT SINC INT FAV USE
GSW Pearson Correlation .383
** .354
** .442
** .291
** .315
** .227
*
Sig. (2-tailed) .000 .000 .000 .001 .000 .012
R2 .147 .125 .195 .085 .099 .052
N 121 121 121 121 121 121
Female Respondents at Men's Hockey Events
GSW Pearson Correlation .688**
.489**
.503**
.424**
.400**
.339**
Sig. (2-tailed) .000 .000 .000 .000 .000 .000
R2 .473 .239 .253 .180 .160 .115
N 193 193 193 193 193 193
**Correlation is significant at the 0.01 level (2-tailed).
*Correlation is significant at the 0.05 level (2-tailed).
To determine if there was a significant difference in the interaction of GSW and women‘s
response to sponsorship based on the gender of hockey being played, the strength of the above
correlation coefficients were compared between the women‘s hockey sample and the men‘s

203
hockey sample. The same procedure of comparison relied upon for the testing of hypotheses 5b-
9b were again applied in this case. Correlation values were converted to observed values of z to
check if z values were beyond the boundary of insignificance (-1.96< Z(obs)< 1.96). Computed
Z(obs) values were within the range of -1.3 to -0.8 and therefore no significant differences in
correlation coefficients were confirmed. H10b was therefore rejected. Based on these findings,
women‘s stronger identified support of women did not translate into more favourable
sponsorship response at women‘s sporting events than it did at men‘s sporting events. The
impact of GSW on sponsorship outcomes was not event specific as this influence was noted at
both women‘s and men‘s sporting events with no meaningful differences observed between these
two types of events. Table 51 contains all computed values for this comparison of correlations.
Table 51: Comparison of Women’s Correlation Coefficients at Women’s vs. Men’s Events
Women's Hockey
(N=121)
Men's Hockey
(N=193)
GSW*INT r .291 .424
Z(obs) -1.305 (n.s.)
GSW*FAV r 0.315 0.400
Z(obs) -0.832 (n.s.)
GSW*USE r 0.227 0.339
Z(obs) -1.04 (n.s.)
5.3.8 Hypothesis 11
This final hypothesis considers the direct impact of gender on sponsorship response.
H11: Direct sponsorship response (INT, FAV and/or USE) at charity-linked sporting events
is stronger among female spectators than male spectators.

204
Independent sample t-tests were conducted to compare the sponsorship response scores (on all
three levels of INT, FAV, and USE) for women and men. When considering the all-events
sample, no significant differences were observed. Similar non-significant results were found
with the sample of respondents from the women‘s hockey games. This finding was confirmed
for both the collected samples for women (n=121) and men (n=76), as well as for randomly
equalized samples of n=76. For the men‘s hockey sample, t-test results with the collected
sample sizes were close to significant (p=.09) for the INT variable. The male sample was also
randomly reduced to be equal with the women‘s sample (n=193). This treatment yielded one
significant difference. Women‘s INT score (M=3.83, SD=.84) was significantly higher than
male respondents‘ (M=3.64, SD=.86; t(384) = 2.13, p=.03, two-tailed) for this particular men‘s
hockey sample. The magnitude of the difference in the means however (mean difference = .18,
95% CI: .014 to .354) was quite small (eta squared =0.01).
For the cancer-causes sample, men indicated significantly stronger FAV (M=4.13, SD=.616)
than women (M=3.86, SD=.733; t(255) = -3.08, p=.002, two-tailed). This is a unique finding
from all other samples and is contrary to the expectations of H11. The magnitude of the
difference in the means (mean difference = -.27, 95% CI: -.445 to -.098) was moderate (eta
squared =0.04). These same findings were confirmed with equal sample size treatment for this
cancer-causes group.
H11 was supported at all levels of response (i.e., INT, FAV, and USE) with the social-causes
sample. In this case, women were found to have significantly stronger INT (M=3.85, SD=.834)
than men (M=3.64, SD=.839; t(374) = 2.48, p=.01, two-tailed). The magnitude of the difference
in the means (mean difference = -.22, 95% CI: .045 to .389) was however small (eta squared
=0.02). Women also reported greater FAV (M=3.90, SD=.806) than men (M=3.71, SD=.794;

205
t(374) = 2.18, p=.03, two-tailed). The magnitude of the difference in these means (mean
difference = -.18, 95% CI: .018 to .346) was quite small (eta squared =0.01). Women of the
social-causes sample also revealed greater USE (M=3.83, SD=.883) than men (M=3.63,
SD=.875; t(374) = 2.13, p=.03, two-tailed). The magnitude of the difference in these means
(mean difference = -.195, 95% CI: .015 to .376) was also quite small (eta squared =0.01). These
same significant findings were confirmed with equal sample size treatment for this social-causes
group.
H11 was therefore not supported with the all-events, women‘s hockey, men‘s hockey, and
cancer-causes samples. H11 was however supported at all levels of effect (i.e., INT, FAV, and
USE) with the social-causes sample. T-test results for these five sample treatments are included
in Table 52.
Table 52: T-Test for Equality of Means – Sponsorship Response
95% Confidence Interval
t df
Sig.
(2-
tailed)
Eta-
Squared
Mean
Differences
Std. Error
Differences Lower Upper
ALL-EVENTS SAMPLE
INT 1.427 631 .154 n.s. .092 .064 -.034 .218
FAV .534 631 .594 n.s. .033 .061 -.087 .153
USE 1.014 631 .311 n.s. .068 .067 -.063 .198
Women's Hockey Sample
INT -.782 195 .435 n.s. -.084 .107 -.295 .127
FAV -1.315 195 .190 n.s. -.128 .097 -.319 .064
USE -.943 195 .347 n.s. -.104 .110 -.321 .113
Women's Hockey Equalized Sample
INT -1.136 150 .258 n.s. -.138 .122 -.378 .102
FAV -1.843 150 .067 n.s. -.197 .107 -.409 .014
USE -1.611 150 .109 n.s. -.197 .123 -.440 .045
Men's Hockey Sample
INT 1.729 434 .085 n.s. .139 .081 -.019 .297
FAV .827 434 .408 n.s. .064 .078 -.088 .217

206
USE 1.477 434 .140 n.s. .124 .084 -.041 .289
Men's Hockey Equalized Sample
INT 2.128 384 .034 .01 .184 .086 .014 .354
FAV .913 384 .362 n.s. .075 .082 -.087 .237
USE 1.734 384 .084 n.s. .155 .090 -.021 .332
Cancer-Causes Sample
INT -1.722 255 .086 n.s. -.163 .095 -.350 .023
FAV -3.083 255 .002 .04 -.271 .088 -.445 -.098
USE -1.931 255 .055 n.s. -.187 .097 -.377 .004
Cancer-Causes Equalized Sample
INT -.866 200 .388 n.s. -.089 .103 -.292 .114
FAV -2.442 200 .015 .03 -.228 .093 -.412 -.044
USE -1.001 200 .318 n.s. -.104 .104 -.309 .101
Social-Causes Sample
INT 2.479 374 .014 .02 .217 .087 .045 .389
FAV 2.183 374 .030 .01 .182 .083 .018 .346
USE 2.127 374 .034 .01 .195 .092 .015 .376
Social-Causes Equalized Sample
INT 2.256 314 .025 .02 .218 .097 .028 .409
FAV 2.083 314 .038 .01 .193 .093 .011 .375
USE 2.371 314 .018 .02 .244 .103 .042 .446
Independent sample t-tests were also conducted for the five individual events. Event 1 (NU Real
Men Wear Pink) generated all significant differences revealing higher mean scores for men
(INT:M=4.12; FAV: M=4.32; USE: M=4.20) across all three variables than for women
(INT:M=3.70, FAV: M=3.60, USE: M=3.76). Mann-Whitney U tests for this same small sample
confirmed significant differences but only at the FAV and USE levels. For FAV, men‘s results
were significantly stronger (Md=4.50, n=25) than women‘s (Md=3.50, n=35), U=204.5, z=-3.59,
p=.00, r=0.46. For USE, men‘s results were also significantly stronger (Md=4.0, n=25) than
women‘s (Md=4.00, n=35), U=312.50, z=-1.95, r=0.25. These results fail to support H11.

207
H11 was not supported for events 2, 3 and 4 as no significant differences in mean response
scores between genders were discovered with these sample groups. This was confirmed through
both independent sample t-tests and the non-parametric equivalent of Mann-Whitney U tests.
Event 5 (Sudbury Wolves Teddy Bear Toss) revealed significant differences in favour of women
at all levels of response, thereby fully supporting H11. Women expressed significantly stronger
INT in the sponsor (M=3.98, SD=.78) than did men (M=3.64, SD=.82; t(163) = 2.78, p=.006).
The magnitude of the difference in these INT means (mean difference = .45, 95% CI: .10 to .59)
was moderate (eta squared=.05). Women also reported significantly greater favourability toward
the sponsor of this event (M=3.95, SD=.75) than did men (M=3.56, SD=.96; t(151)=2.97,
p=.003). The magnitude of the difference in the FAV means (mean difference = .40, 95% CI:
.133 to .661) was again moderate (eta squared =.05). Women at this event also reported
statistically higher intentions to USE the sponsors products (M=3.89, SD=.93) than did men
(M=3.55, SD=.99; t(163)=2.26, p=.03). The magnitude of the difference in the INT means
(mean difference = .34, 95% CI: .043 to .634) was smaller than the other observed response
levels (eta squared=0.03). Significance at all three levels of response for Event 5 were also
confirmed through non-parametric testing.
Based on the above event-specific results, H11 is only supported by the Event 5 sample and not
supported with respondents of events 1, 2, 3, and 4. Event specific results for the testing of this
hypothesis are presented in Table 53.
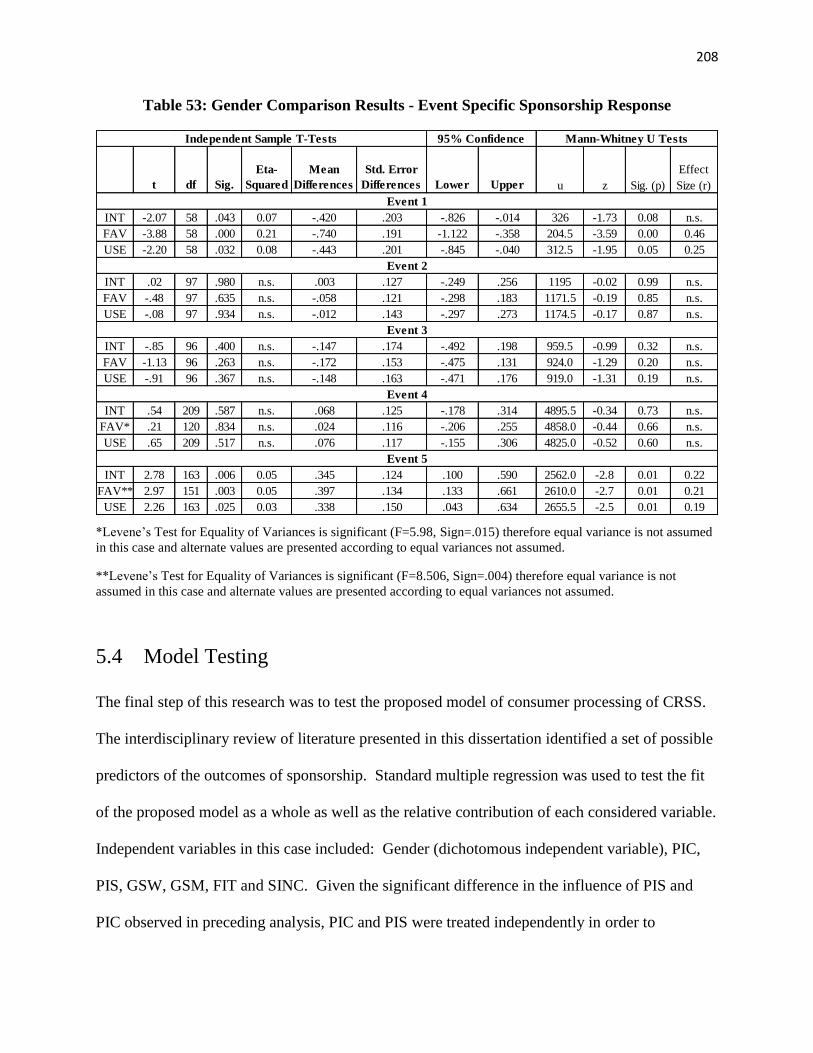
208
Table 53: Gender Comparison Results - Event Specific Sponsorship Response
*Levene‘s Test for Equality of Variances is significant (F=5.98, Sign=.015) therefore equal variance is not assumed
in this case and alternate values are presented according to equal variances not assumed.
**Levene‘s Test for Equality of Variances is significant (F=8.506, Sign=.004) therefore equal variance is not
assumed in this case and alternate values are presented according to equal variances not assumed.
5.4 Model Testing
The final step of this research was to test the proposed model of consumer processing of CRSS.
The interdisciplinary review of literature presented in this dissertation identified a set of possible
predictors of the outcomes of sponsorship. Standard multiple regression was used to test the fit
of the proposed model as a whole as well as the relative contribution of each considered variable.
Independent variables in this case included: Gender (dichotomous independent variable), PIC,
PIS, GSW, GSM, FIT and SINC. Given the significant difference in the influence of PIS and
PIC observed in preceding analysis, PIC and PIS were treated independently in order to
t df Sig.
Eta-
Squared
Mean
Differences
Std. Error
Differences Lower Upper u z Sig. (p)
Effect
Size (r)
INT -2.07 58 .043 0.07 -.420 .203 -.826 -.014 326 -1.73 0.08 n.s.
FAV -3.88 58 .000 0.21 -.740 .191 -1.122 -.358 204.5 -3.59 0.00 0.46
USE -2.20 58 .032 0.08 -.443 .201 -.845 -.040 312.5 -1.95 0.05 0.25
INT .02 97 .980 n.s. .003 .127 -.249 .256 1195 -0.02 0.99 n.s.
FAV -.48 97 .635 n.s. -.058 .121 -.298 .183 1171.5 -0.19 0.85 n.s.
USE -.08 97 .934 n.s. -.012 .143 -.297 .273 1174.5 -0.17 0.87 n.s.
INT -.85 96 .400 n.s. -.147 .174 -.492 .198 959.5 -0.99 0.32 n.s.
FAV -1.13 96 .263 n.s. -.172 .153 -.475 .131 924.0 -1.29 0.20 n.s.
USE -.91 96 .367 n.s. -.148 .163 -.471 .176 919.0 -1.31 0.19 n.s.
INT .54 209 .587 n.s. .068 .125 -.178 .314 4895.5 -0.34 0.73 n.s.
FAV* .21 120 .834 n.s. .024 .116 -.206 .255 4858.0 -0.44 0.66 n.s.
USE .65 209 .517 n.s. .076 .117 -.155 .306 4825.0 -0.52 0.60 n.s.
INT 2.78 163 .006 0.05 .345 .124 .100 .590 2562.0 -2.8 0.01 0.22
FAV** 2.97 151 .003 0.05 .397 .134 .133 .661 2610.0 -2.7 0.01 0.21
USE 2.26 163 .025 0.03 .338 .150 .043 .634 2655.5 -2.5 0.01 0.19
Mann-Whitney U Tests
Event 1
Event 2
Event 3
Event 4
Independent Sample T-Tests 95% Confidence
Event 5

209
distinguish between the relative predictive power of each of these variables on sponsorship
response. For this analysis, the three levels of sponsorship outcomes (INT, FAV, and USE) were
combined into the dependent variable of Sponsorship Response (SR). The internal consistency
of this 6-item scale is strong with a Cronbach alpha coefficient of .92.
The assumptions of multiple regression were met as the relationships modeled did not violate the
assumptions of multicollinearity, linearity and homoscedasticity. Given the large sample size for
this analysis, the assumption concerning normality is consistent with the rationale presented in
the initial analysis. Tolerance values ranged from .30 to .88 (above a cut-off point of .10) and
the variance inflation factors (VIF) were below a cut-off of 10 with results ranging from 1.2 to
3.3 (Pallant, 2010). Normal probability plots of the regressions standardized residuals and
scatterplots were also observed to ensure no violation of the above assumptions.
The multiple regression model for the all-events sample was significant and indicated that 39.8%
of the variance in SR was explained by the tested model. Of the independent variables included
in this model, FIT (=.278) and SINC (=.271) made the strongest unique contributions to SR
while PIC (=.186) also significantly contributed to the prediction of SR. Gender (=.004), PIS
(=.009), GSW (=.067) and GSM (=-.016) did not make significant contributions. The
multiple regression coefficients are presented in Table 54.
Table 54: Multiple Regression Coefficient: All-Events Sample
Model
Standardized
Coefficients
t Sig.
95.0% Confidence
Interval for B Correlations
Collinearity
Statistics
Beta
Lower
Bound
Upper
Bound
Zero-
order Partial Part Tolerance VIF
(Constant) 5.218 .000 .603 1.331
Gender .004 .127 .899 -.089 .101 -.036 .005 .004 .880 1.137

210
PIC .186 4.681 .000 .112 .273 .468 .184 .145 .609 1.642
PIS .009 .263 .793 -.047 .061 .234 .011 .008 .833 1.200
GSW .067 1.171 .242 -.042 .167 .398 .047 .036 .298 3.358
GSM -.016 -.286 .775 -.127 .094 .401 -.011
-
.009 .302 3.307
FIT .278 7.196 .000 .190 .333 .522 .277 .223 .647 1.546
SINC .271 6.561 .000 .177 .328 .531 .254 .204 .566 1.767
Dependent variable: SR
The same model was run a second time with the data set split by gender. Gender as an
independent variable was removed from this regression. The model was significant for both
genders (p=.000), explaining 38.6% of SR variance for women and 39.3% for men. For women,
the strongest unique predictor of SR was FIT (=.288), followed closely by SINC (=.269) and
to a lesser extent (but still significant), PIC (=.151). Men‘s strongest predictors were the same
three variables as women however SINC was the greatest (=.285), followed by FIT (=.254)
and then PIC (=.220). All other variables were not significant as unique contributors to SR.
The results these from multiple regression tests for the samples of women and men are presented
in Table 55 and Table 56.
Table 55: Multiple Regression Coefficient: Women Sample
Model Standardized
Coefficients
t Sig.
95.0%
Confidence
Interval for B Correlations
Collinearity
Statistics
Beta
Lower
Bound
Upper
Bound
Zero-
order Partial Part Tolerance VIF
(Constant)
4.458 .000 .589 1.520
PIC .151 2.533 .012 .034 .271 .462 .143 .113 .564 1.772
PIS .000 -.007 .994 -.078 .078 .251 .000 .000 .778 1.285
GSW .042 .588 .557 -.104 .192 .386 .034 .026 .388 2.578
GSM .027 .375 .708 -.115 .169 .406 .021 .017 .379 2.635
FIT .288 5.293 .000 .167 .365 .517 .289 .237 .678 1.476

211
SINC .269 4.598 .000 .142 .353 .522 .254 .206 .585 1.711
Dependent variable: SR
Table 56: Multiple Regression Coefficient: Men Sample
Model Standardized
Coefficients
t Sig.
95.0%
Confidence
Interval for B Correlations
Collinearity
Statistics
Beta
Lower
Bound
Upper
Bound
Zero-
order Partial Part Tolerance VIF
(Constant) 4.134 .000 .506 1.426
PIC .220 4.012 .000 .120 .351 .460 .221 .177 .646 1.548
PIS .012 .245 .807 -.068 .088 .207 .014 .011 .820 1.220
GSW .075 .824 .411 -.096 .233 .396 .047 .036 .237 4.218
GSM -.058 -.644 .520 -.240 .121 .372 -.036 -.028 .241 4.152
FIT .254 4.580 .000 .138 .347 .515 .251 .202 .633 1.581
SINC .285 4.827 .000 .159 .377 .528 .264 .213 .559 1.790
5.5 Summary of Results
This study investigated many (i.e., seventeen) relationships across a total of ten different sample
groups. Some hypotheses were supported across all investigated samples (i.e., H5a, H6a, H7a,
H8a, H9a) while others were fully rejected (i.e., H2, H4, H8b, H9b, H10b). There were also
cases of mixed results, as expected outcomes were realized with some sample groups but
rejected by others (i.e., H1, H5b, H6b, H7b, H11). To effectively capture all of these key
findings, several summary visuals are presented. Table 57 itemizes the relationships, analytical
procedures, and results of each individual hypothesis. Table 58 contrasts results across the ten
sample treatments and condenses findings as either supported (denoted by ) or non-supported
(denoted by X). Figure 7 follows, with an enhanced version of the consumer processing of
CRSS framework that incorporates the results of this study.

Hypotheses Analyses Results
H1: Females are more highly involved with cause (PIC)
than males at charity-linked sporting events.Gender PIC T-Tests
Supported
(all-events, men's hockey, social-causes, event 5)
Not Supported
(women's hockey, cancer-causes, events 1-4)
H2: Males are more highly involved with sport (PIS)
than females at charity-linked hockey sporting events.Gender PIS T-Tests
Not Supported
H3: Females are more supportive of women‘s sport
and causes/charities (GSW) than are males.Gender GSW T-Tests
Supported
(with all samples, except event 1)
H4: Males are more supportive of men‘s sporting
events and men‘s charitable/social causes (GSM) than
are females.
Gender GSM T-Tests Not Supported
H5a: Personal involvement (PI) has a direct and
positive effect on perceived sponsor-event fit (FIT) in
charity-linked sport settings.
PI FIT Correlation Supported
H5b: Gender has a significant impact on the interaction
of PI*FIT and the effect is greater for women. Gender PI*FIT
Comparison
of
Correlations
Supported
(social-causes sample only)
Not Supported
(all-events, women's hockey, men's hockey)
Relationships
Table 57: Summary of Findings from Tested Hypotheses

213
H6a: Personal involvement (PI) has a direct and
positive effect on perceived sincerity (SINC) of the
sponsor in charity-linked sport settings.
PI SINC Correlation Supported
H6b: Gender has a significant impact on the interaction
of PI *SINC and the effect is greater for women.Gender PI*SINC
Comparison
of
Correlations
Supported
(all-events, men's hockey, cancer-causes, social-
causes)
Not Supported
(women's hockey sample)
H7a: Personal involvement (PI) has a direct and
positive effect on sponsorship response (INT, FAV,
and/or USE) in charity-linked sport settings.
PIINT
FAV
USE
Correlation Supported
H7b: Gender has a significant impact on the interaction
of PI*INT, PI*FAV, and PI*USE and the effect is
greater for women.
GenderPI*INT
PI*FAV
PI*USE
Comparison
of
Correlations
Supported
(cancer-causes sample only)
Not Supported
(all-events, women's hockey, men's hockey,
social-causes)
H8a: Perceived sponsor-event fit (FIT) has a direct and
positive effect on sponsorship response (INT, FAV
and/or USE) in charity-linked sport settings.
FITINT
FAV
USE
Correlation Supported
H8b: Gender has a significant impact on the interaction
of FIT* INT, FIT*FAV, and FIT*USE and the effect
is greater for women.
GenderFIT*INT
FIT*FAV
FIT*USE
Comparison
of
Correlations
Not Supported

214
H9a: Perceived sincerity (SINC) of the sponsor has a
direct and positive effect on sponsorship response
(INT, FAV and/or USE) in charity-linked sport
settings.
SINCINT
FAV
USE
Correlation Supported
H9b: Gender has a significant impact on the interaction
of SINC*INT, SINC*FAV, and SINC*USE and the
effect is greater for women.
GenderSINC*INT
SINC*FAV
SINC*USE
Comparison
of
Correlations
Not Supported
H10a: Gender support for women (GSW) has a direct
and positive effect on women‘s sponsorship response
(INT, FAV, and/or USE).
GSW
(female
sample)
INT
FAV
USE
Correlation Supported
H10b: Gender support for women (GSW) has a greater
influence on women‘s sponsorship response (INT,
FAV, and/or USE) at female sporting events than at
male sporting events.
GSW
(female
sample)
INT
FAV
USE
(women's
hockey)
Comparison
of
CorrelationsNot Supported
H11: Direct sponsorship response (INT, FAV and/or
USE) at charity-linked sporting events is stronger
among female spectators than male spectators.
GenderINT
FAV
USE
T-Tests
Supported
(men's hockey at INT level, social causes and
event 5 at all levels)
Not Supported
(all-events, women's hockey, cancer-causes,
events 1-4)
Proposed Model - Consumer Processing of CRSS Significant Fit of 39.8%

Table 58: Comparison of Findings across Samples
All-
Events
Women‘s
Hockey
Men‘s
Hockey
Cancer-
Causes
Social-
Causes
Event
1
Event
2
Event
3
Event
4
Event
5
H1 X X X X X X
H2 X X X X X X X X X X
H3 X
H4 X X X X X X X X X X
H5a
H5b X X X X n/a n/a n/a n/a n/a
H6a
H6b X n/a n/a n/a n/a n/a
H7a
H7b X X X X n/a n/a n/a n/a n/a
H8a
H8b X X X X X n/a n/a n/a n/a n/a
H9a
H9b X X X X X n/a n/a n/a n/a n/a
H10a n/a n/a n/a n/a n/a n/a n/a
H10b X n/a n/a n/a n/a n/a n/a n/a
H11 X X
(INT) X
(INT,
FAV,
USE) X X X X
(INT,
FAV,
USE)
: Supported Hypothesis
X: Non-Supported Hypothesis

216
Figure 7: CRSS Conceptual Framework - Results
Figure 7 portrays the results of this study. In this representation, supported hypotheses are
depicted by the following symbol: , non-supported hypotheses are depicted by: , and results
that were mixed across sample groups are denoted by: . These visual summaries of results
guide the following discussion of findings.
м

217
Chapter 6
6.1 Discussion
This chapter discusses the empirical findings of this research. Multiple relationships were
integrated across the various hypotheses of this study and therefore results are considered
according to the key constructs examined in the proposed CRSS process. This section begins by
reviewing the consumer factors of: i) personal involvement, and ii) gender support. Next the
consumer perceptions of sponsorship factors are considered, including: iii) sponsor-event fit, and
iv) perceived sincerity of the sponsor, followed by v) sponsorship response. The interactions of
these variables on sponsorship response are then discussed as testing results of the proposed
model are reviewed.
Throughout each section of this discussion chapter, results are compared to similar published
studies. Table 59 is a summary of thirty-seven studies that also considered similar relationships
in the context of sport, cause or CRSS. This table serves as an important guide in contrasting the
findings of this study with the published work of others. Of the reviewed research, there are
twenty-four sport studies and one festival/fair sponsorship study. The majority of sport
sponsorship studies are based on male sports as only two of these sport investigations considered
female sport. Six studies measured consumer response to cause associations and six studies
focused specifically on CRSS. This summary table is structured by type of sponsorship (sport,
female sport, cause, CRSS) and is presented in chronological order in order to appreciate the
progression of research in these areas. For instance, efforts concerning CRSS are more recent
with studies published during the 2003-2013 period. Ten of the reviewed studies commented on
gender differences observed in these tested relationships of consumer response. The levels of

218
response span all three stages of the hierarchy of effect (i.e., cognitive, affective, and
behavioural) and are specified in the summary table. This dissertation offers a unique
contribution to the field as none of these published studies were specific to the Canadian
marketplace with shared results stemming from the US, Australia, Belgium, Austria, Korea,
Ireland, Greece, and Turkey. The concept of gender support in the context of sponsorship effects
was introduced in this current study and therefore omitted from this comparison table (but fully
discussed in text).
Following a thorough discussion of research results, an answer is provided to the question
underlining this CRSS effects dissertation: ―Does Gender Matter‖? Contributions of this
dissertation are then highlighted followed by a presentation of the implications of these findings.
Limitations of this study are next acknowledged before concluding with directions for future
research.

219
Table 59: Summary of Sponsorship Effects Studies
Consumer Factors- Personal Involvement Sponsorship Factors and Response
Author(s)
(Year)
Type N Method Gender
*
PI
PI*FIT PI*
SINC
PI*
SR
FIT*
SR
SINC
*
SR
Gender
*
SR
SR
Level
Gender
Effects
Pham
(1992)
Sport
(soccer)
85 students
(Belgium)
Experiment cognitive Males
outperformed
women in
sponsor
recognition.
McDaniel
& Kinney
(1998)
Sport 215
students
(US)
Experiment X
cognitive
affective
behavioural
Gender did
not impact
ability to
recognize
Olympic
sponsors.
Females had
more
favourable
attitudes and
purchase
intentions.
Gwinner &
Eaton
(1999)
Sport 360
students
(US)
Experiment cognitive
McDaniel
(1999)
Sport 216
students
(US)
Experiment
cognitive
affective
behavioural
Females
responded
more
favourable
(attitude and
purchase
intention)
than men.
Speed &
Thompson
(2000)
Sport 195
students
(Australian)
Experiment (Personal
Liking)
(Personal
Liking)
X
cognitive
affective
behavioural

220
Consumer Factors- Personal Involvement Sponsorship Factors and Response
Author(s)
(Year)
Type N Method Gender
*
PI
PI* FIT
PI*
SINC
PI*
SR
FIT*
SR
SINC
*
SR
Gender
*
SR
SR
Level
Gender
Effects
Madrigal
(2001)
Sport
(university)
368
(Ohio)
Telephone (Team
ID)
affective
behavioural
Meenaghan
(2001b)
Ireland
UK
Europe
Expert
Interview/
Focus
Groups
(Goodwill)
cognitive
affective
behavioural
Deane,
Smith, &
Adams
(2003)
Sport 109
(US)
golfers
Field
Survey
cognitive
Grohs,
Wagner, &
Vsetecka
(2004)
Sport
(alpine ski)
132
(Austria)
Field
Survey
cognitive
Grohs &
Reisinger
(2005)
Sport
(alpine ski)
125
(Austria)
Field
Survey
cognitive
Close,
Finney,
Lacey, &
Sneath
(2006)
Sport
(cycling)
1741
(US)
Field
Surveys
affective
behavioural
Koo,
Quarterman
& Flynn
(2006)
Sport
(college)
427
students
(US)
Student
Surveys
cognitive
affective
behavioural

221
Consumer Factors- Personal Involvement Sponsorship Factors and Response
Author(s)
(Year)
Type N Method Gender
*
PI
PI*FIT PI*
SINC
PI*
SR
FIT*
SR
SINC
*
SR
Gende
r*
SR
SR
Level
Gender
Effects
Tobar
(2006)
Sport
(TV-Super
Bowl)
N1=81
students
N2=111
parents
(US)
Survey
X
behavioural
Men
reported
higher sport
fandom
scores.
Gender did
not influence
purchase
intentions.
Donahay &
Risenberger
(2007)
Sport
(car racing)
160
(Australia)
Field
Surveys
cognitive
Lings &
Owen
(2007)
Sport
(football)
250
(Australia)
On-Line
Survey
(Team
ID)
behavioural
Gwinner &
Bennett
(2008)
Sport
(action)
552 Fans
(US)
Field
Surveys
(Team
ID)
cognitive
affective
behavioural
Ko, Kim,
Claussen,
& Kim
(2008)
Sport
(soccer)
390
(Korean)
Field
Surveys
cognitive
affective
behavioural
Kinney,
McDaniel,
& DeGaris
(2008)
Sport 935
NASCAR
Fans
(US)
Telephone
Survey
cognitive
Males were
able to recall
a larger
number of
sponsors that
were
women.

222
Consumer Factors- Personal Involvement Sponsorship Factors and Response
Author(s)
(Year)
Type N Method Gender
*
PI
PI*FIT PI*
SINC
PI*
SR
FIT*
SR
SINC
*
SR
Gende
r*
SR
SR
Level
Gender
Effects
Bennett,
Ferreira,
Lee, &
Polite
(2009)
Sport
(action)
552
(US)
Field
Survey
behavioural
Young
males more
likely to
consumer
Mountain
Dew than
females.
(Note:
sample=65%
male )
Gwinner,
Larson, &
Swanson
(2009)
Sport
(football)
N1=881
N2=612
(US)
Field
Surveys
cognitive
behavioural
Tsiotsou &
Alexandris
(2009)
Sport
(basketball)
354
(Greece)
Field
Surveys
cognitive
behavioural
Alexandris
& Tsiotsou
(2012)
Sport
(basketball)
354
(Greece)
Field
Surveys
affective
cognitive
behavioural
Sozer &
Vardar
(2009)
Fair
(SpringFest
)
N1=250
N2=240
Students
(Turkey)
Student
Surveys
cognitive
Alay (2008) Female
Sport
(volleyball)
413
Female
Students
(Turkey)
Post-Event
Survey
(Personal
Liking)
(Personal
Liking)
X
cognitive
affective
behavioural
Maxwell &
Lough
(2009)
Female
Sport
(basketball)
N1=316
N2=334
Spectators
Field
Surveys
X cognitive

223
Consumer Factors- Personal Involvement Sponsorship Factors and Response
Author(s)
(Year)
Type N Method Gender
*
PI
PI*FIT PI*
SINC
PI*
SR
FIT*
SR
SINC
*
SR
Gender
*
SR
SR
Level
Gender
Effects
Ross,
Patterson, &
Strutts (1992)
CRM 238
(US)
Mall-
Intercept
Interviews
affective
behavioural
Women had
more
positive
attitudes and
stronger
purchase
intentions
toward the
firm that
used CRM
than did
men.
Berger,
Cunningham,
& Kozinets
(1999)
Cause
Related
Advertising
N1=196
N2=210
Students
Experiment
affective
behavioural
Female
students had
more
positive
attitudes and
higher
purchase
intentions
for brands
that use CR-
adv than did
male
students.
Becker-Olsen
& Simmons
(2002)
Social
Sponsorship
Experiment cognitive
affective
behavioural
Simmons &
Becker-Olsen
(2006)
Social
Sponsorship
N1=236
N2=120
Students
(US)
Experiment
cognitive
affective
behavioural

224
Consumer Factors- Personal
Involvement
Sponsorship Factors and Response
Author(s)
(Year)
Type N Method Gender
*
PI
PI*FIT PI*
SINC
PI*
SR
FIT*
SR
SINC
*
SR
Gender
*
SR
SR
Level
Gender
Effects
Nan & Heo
(2007)
CRM 100
Students
(US)
Experiment X (CRM
impact
regardless
of FIT)
Hyllegard,
Yan, Ogle,
& Attmann
(2011)
CRM 562
Students
(US)
Experiment
behavioural
Women had
higher cause
involvement.
Gender did
not influence
brand
attitudes but
did impact
purchase
intentions.
Irwin,
Lachowetz,
Cornwell,
& Clark
(2003)
CRSS
(Spectator)
442
Spectators
(US)
Field
Survey
affective
behavioural
Women
response to
CRSS was
stronger than
men in terms
of
favourable
attitudes,
beliefs and
purchase
intentions.
Roy &
Graeff
(2003)
Cause-Sport
Marketing
500
(US)
Telephone
Survey
cognitive
behavioural
Females
more likely
to have
positive
image of an
organization
if partnered
with causes.

225
Consumer Factors- Personal
Involvement
Sponsorship Factors and Response
Author(s)
(Year)
Type N Method Gender
*
PI
PI*FIT PI*
SINC
PI*
SR
FIT*
SR
SINC
*
SR
Gender
*
SR
SR
Level
Gender
Effects
Cornwell
& Coote
(2005)
CRSS
(Participant)
501 women
Participants
(US)
Field
Survey
behavioural
Walker &
Kent
(2009)
CSR-Sport 297
(US)
Field
Survey
affective
behavioural
Filo,
Funk, &
O'Brien
(2010)
CRSS
(Participant)
672
Participants
(US)
On-Line
(post-
event)
cognitive
behavioural
Close &
Lacey
(2013)
Sport
(cycling)
1615
(US)
Field
Surveys
behavioural
Lafrance
Horning,
D. (2014)
CRSS
(Participant)
642
Spectators
(Canada)
Field
Surveys (5)
(mixed
results)
cognitive
affective
behavioural
-Stronger PIC,
GSW, GSM
for women
-PIC*SINC
stronger for
women
-Women
responded
more
favourably to
sponsorships
affiliated with
social causes.
-Men less
impacted at
women’s
sports.
-Gender
support among
women impacts
response.

226
6.1.1 Personal Involvement in CRSS (H1, H2, H5, H6, H7)
Theories of personal involvement or forms of identification are well integrated in sport
sponsorship research (Alexandris & Tsiotsou, 2012; Close et al., 2006; Grohs et al., 2004; Grohs
& Reisinger, 2005; Madrigal, 2001; Gwinner & Bennett, 2008; Gwinner et al., 2009; Ko et al.,
2008; Lings & Owen, 2007; Meenaghan, 2001b; Pham, 1992), cause literature (Berger et al.,
1999; Broderick et al., 2003; Chang, 2012; Hajjat, 2003; Hyllegard et al., 2011) and the
emerging area of cause-related sport (Bennett et al., 2007; Cornwell & Coote, 2005; Filo et al.,
2010; Irwin et al., 2003; Walker & Kent 2009). Given that the context of this sponsorship
investigation focused on the trending hybrid of sport and cause, it was necessary to measure the
construct of personal involvement in terms of both cause (H1) and sport (H2). This consideration
was given to spectators of sporting events linked to a cause and did not extend to participants of
such events. Personal involvement as a core construct was also considered in terms of impact on
sponsor-event fit (H5) and perceived sincerity of the sponsor (H6) as well as a direct predictor of
the three levels of sponsorship response (H7). Each relationship is discussed below.
As previously detailed, the affiliated causes varied by investigated event. Table 60 re-lists these
details for the purpose of discussion.
Table 60: Cause Affiliations for Sampled Events
Event Sport Cause
1. Nipissing University - Real Men
Wear Pink
Men‘s OUA Hockey Canadian Breast Cancer
Foundation
2. Laurentian University - Pink the
Rink
Women‘s OUA
Hockey
Northern Cancer Research
Foundation
3. Nipissing University - Pink the
Rink
Women‘s OUA
Hockey
Canadian Breast Cancer
Foundation
4. Ottawa Senators Food Drive
Night
Men‘s NHL Hockey Ottawa Food Bank
5. Sudbury Wolves Teddy Bear Toss Men‘s OHL Hockey Salvation Army Toy Drive

227
Gender * PIC (H1)
H1 expected women to indicate a greater level of involvement than men with the affiliated
causes. In support of past sponsorship related findings (Berger et al., 1999; Hyllegard et al.,
2011; Ross et al., 1992; Roy & Graeff, 2003), this hypothesis was found to be true for the all-
events sample, spectators at the men‘s hockey games, the social-causes group, and attendees of
Event #5. For the remaining sample treatments (i.e., women‘s hockey, cancer-causes, events 1-
4), PIC scores were not significantly different between genders. The women‘s hockey sample
was made up of two pink-themed cancer-cause events and therefore rendered the same non-
significant results as the cancer-causes sample. Furthermore, both genders indicated greater
involvement with cancer causes than with social causes. For men this difference was significant
while in contrast, women‘s PIC was not significantly different between reported cause types.
Men‘s strong attachment to pink cancer-related causes may be driven by a number of factors.
Breast cancer is no longer a women-only issue. In addition to the female patient, a breast cancer
diagnosis has a notable impact on men. Whether it‘s their wife, sister, mother, relative, or friend,
men are invested as supporters and co-survivors of breast cancer (Varner, 2011). As presented in
the review of sport as a gateway to goodness (section 2.2.2), most sport leagues have partnered
with breast cancer as both a charitable act and a means of targeting a growing female fan base
(Clark et al., 2009). Merging the masculinity of sports and the femininity of pink-marketed
breast cancer (King, 2001) has created a more level platform of cause engagement across
genders as evidenced by the results of this investigation. This knowledge that women and men
are equally invested in breast cancer initiatives presents sponsors with multiple targeting
opportunities.

228
As noted, women‘s expressed involvement with social causes was found to be significantly
greater than men‘s. This was particularly true with respondents of the Sudbury Wolves Teddy
Bear Toss event in support of the Salvation Army Christmas Toy Drive. Women‘s stronger
attachment to this particular cause may be driven by the strong link to children in need during the
Christmas season and women‘s tendencies to engage in more nurturing and demonstrative acts of
caring in comparison to men‘s more individual forms of helping behaviour (Bosak, Sczesny, &
Eagly, 2008; Einolf, 2011; Mesch et al., 2011). Women are typically also the primary Christmas
shoppers and gift givers (Fischer & Arnold, 1990) which may have augmented their involvement
in this charity-linked game that asked fans to donate a stuffed animal by tossing it on the ice after
the first home team goal. The Salvation Army runs a women‘s shelter in the local Sudbury
community which also may have strengthened ties between this charity and female respondents.
Mesch et al. (2011) concluded that ―gender matters in philanthropy‖ (p.35) and that women tend
to be more empathetic, feel a greater need to help others, and are more impacted by emotional
appeals for support. These factors may account for women‘s deeper involvement with these
investigated social causes that asked fans to take specific action in donating food or a toy at the
cause-linked sporting event.
When considering the all-events, men‘s hockey, social-causes and event 5 samples, H1 was
supported and confirmed generally stronger involvement with causes among women. While
significant differences persist with several investigated groups, it is important to also note that
this disparity between genders is relatively small and that men also indicated commitment to
these important community causes. Gender similarities noted at pink-themed events also implies
that pink causes may be less gender-centric than originally presumed. Such a finding expands
the selection of possible cause-affiliations and presents sponsors with opportunities to venture

229
beyond common areas of support and to differentiate in new and meaningful ways. Further
discussion will consider whether these involvement levels brought about favourable sponsorship
response.
Gender* PIS (H2)
H2 anticipated that male respondents would report greater involvement with the sport of hockey
than would women. Despite exponential growth in female hockey since the first women‘s world
hockey championships in 1990, hockey continues to be a male dominated sport as male players
currently represent 86% of the 625,152 registered players in Canada (Hockey Canada, 2013).
Previous studies have also found that men‘s involvement in sport (basketball, football, soccer
and car racing in these referred cases) exceeded that of women‘s (Clark et al., 2009; Eccles &
Harold, 1991; James & Ridinger, 2002; Kinney et al., 2008; Pham, 1992; Tobar, 2006). In
addition to the above reasoning, the majority (69%) of surveys for this study was collected at
men‘s hockey events. It was therefore surprising to discover that hockey involvement levels
between surveyed men and women were not significantly different in any of the investigated
samples. Certainly favourable bias toward the sport of hockey is expected to have influenced
reported involvement levels as all research participants were intercepted as paid spectators of
these various hockey events. Mere attendance suggests a certain level of involvement with the
sport which contributes to high mean scores (women‘s M=4.00, men‘s M=4.04) but does not
necessarily imply gender equivalence in response.
The growth of women‘s hockey in Canada is another probable justification for these comparable
levels of gender involvement in hockey. Reported registration for female hockey has grown
131% since 1998 with over 87,000 girls and women participating in this sport (Hockey Canada,

230
2013). Wiley et al. (2000) also unexpectedly found that women‘s attraction to the sport of
hockey was greater while this sport remained more central to the lives of men. The earlier report
of PIS findings, further scrutinized the three measures of PIS. The first item measured consumer
response to the statement: ―Hockey is an important part of my life‖. At this level of inquiry, men
and women had nearly identical responses in terms of the central role that the sport of hockey
plays in their lives. In this case, the predisposed favour toward hockey as paid spectators is
recognized. The second item of PIS measured response to the statement: ―Hockey is one of the
most enjoyable activities for me‖. For this sentiment of attraction to the sport, men‘s mean
response (M=4.08) was slightly (but not significantly) greater than women‘s (M=3.96). In
comparison, response to the final item of PIS: ―Most of my friends are in some way connected to
hockey‖ was slightly (but not significantly) higher for women (M=4.02) than for men (M=3.99).
This distinction was most pronounced at women‘s hockey games as women‘s mean score
jumped to M=4.17 and men‘s reached M=4.08. This observation may be reflective of the profile
of supporters attending women‘s games and will be further discussed when the construct of
gender support is presented. Although these PIS findings were not significantly different
between genders, there is some suggested support for published studies concerning gender
differences in the consumption of sport. For instance, women‘s attraction to the social aspect of
sport and the opportunity to share sport experiences with friends (Armstrong, 2001; Bush et al.,
2007; Clark et al., 2009; Dietz-Uhler et al., 2000; Ridinger & Funk, 2006; Shani et al., 1992)
may coincide with women‘s response to item three above and men‘s stronger response to the
individual orientation of the sport. The fact that women and men expressed comparable
involvement in the stereotypical male sport of hockey is encouraging for promoters of women‘s

231
hockey. The evolution of the women‘s game presents promising opportunities for commercial
support (Theberge, 2000) and a meaningful outlet to engage both genders of hockey fans.
PI*FIT (H5)
As the review of sponsorship literature established, sponsor-event fit is an important factor in the
consumer processing of sponsorship efforts and has been studied from various perspectives.
Forms of involvement as precursors to consumer perceptions of fit has also been explored and
validated in previous sport and cause sponsorship studies (Alay, 2008; Close & Lacey, 2013;
Gwinner & Bennett, 2008; Meenaghan, 2001b; Speed & Thompson, 2000). H5 of this
investigation anticipated similar results in CRSS settings. The correlation between the total
measure of personal involvement (including both PIC and PIS) and perceptions of sponsor-event
fit was confirmed as significant across all investigated samples.
When considering the all-events sample, the PI*FIT correlation coefficient was moderate at
r=.44. This interaction was stronger for the men‘s hockey (r=.53) and social causes (r=.52)
samples than for the women‘s hockey (r=.34) and cancer-causes (r=.37) samples. The overlap
found between PI and FIT are among the strongest in the reviewed literature. Speed and
Thompson (2000) reported the weakest reviewed relationship between ―personal liking‖ and
perceived fit at r=.15. Personal liking in this case considered similar measures (i.e., support,
attendance, enjoyment, importance) as the current study. Extending Speed and Thompson‘s
(2000) method, Alay (2008) found a slightly stronger correlation at r=.24 in an all-female sample
investigation. In addition to the above sport sponsorship studies, Gwinner and Bennett (2008)
reported further improved correlation (r=.30) between sport identification and sponsor-event fit.
Their measure of sport identification was again similar with consideration for importance,

232
relevance, value and concern. In this case (Gwinner & Bennett, 2008), the sponsor of the
investigated Dew Action Sport Tour was Panasonic and the research findings support the theory
that highly involved fans more easily accept sponsor-event fit or will make a greater effort to
adjust their thinking to establish an acceptable fit. Recommendations stemming from the
findings of Gwinner and Bennett (2008) encouraged sponsors to activate their sponsorships in
order to promote fit. All of the above studies were purely sport driven.
More recently, Close and Lacey (2013) measured fit at a cycling event that tied in the CSR
efforts of the main sponsor. The relationship between PI (measured as activeness in sport) and
perceived event-sponsor fit was again improved with correlation of r=.30. In the present study,
all investigated sport events were connected to a cause. This more robust view of involvement
considering both sport and cause may have contributed to the strongest observed correlations
between levels of PI and perceptions of sponsor-event FIT. Table 61 compares (in chronological
order) PI*FIT correlations from this study with the comparable research findings discussed
above.
Table 61: Comparison of PI*FIT Correlations
Study Correlation (r)
Speed & Thompson (2000) 0.15
Alay (2008) 0.24
Gwinner & Bennett (2008) 0.30
Close & Lacey (2013) 0.39
Current Study:
All-Events Sample 0.44
Women's Hockey sample 0.34
Men's Hockey sample 0.53
Cancer-Causes sample 0.37
Social-Causes sample 0.52
Event #1: NU-RMWP 0.57
Event #2: LU-PTR 0.19

233
Event specific analysis revealed that Event 5 (Sudbury Wolves Teddy Bear Toss) produced the
strongest observed PI*FIT correlation (r=.60). Shared variance (r2) of 36% is significant overlap
between PI and FIT. When comparing findings of these individual events, the degree of
sponsorship activation is a key differentiator on results of perceived FIT as well as other
sponsorship variables and outcomes (as will be later discussed). Although consumer opinions of
activation were not measured in this study, activation efforts by sponsors and event organizers
were noted. Given results from previous studies (Coppetti et al., 2009; Gwinner & Bennett,
2008; Olson & Thjomoe, 2011; Sozer & Vardar, 2009) it is reasonable to presume that activation
levels could influence the perceptions of sponsor-event FIT among highly involved fans. Table
62 summarizes the activation activities for each attended event. Events 3, 4, and 5 had the most
comprehensive activation programs that included such activities as promotional posters,
advertising (radio, newspapers, internet), social media campaigns, broadcast mentions and press
conferences. As evidenced by this activity log, heavily activated events were all effective in
realizing strong perceived association between PI and FIT. Events 1 and 2 had minimal
activation. In the case of Event 2, the result was non-significant correlation between PI*FIT
(r=.19). It is less clear why Event 1, with a mix of sponsors and minimal activation still realized
strong correlation (r=.57). This may be due to the fact that this was the 5th
annual NU RMWP
event with several regular returning sponsors. Previous years‘ efforts by longstanding corporate
supporters may have therefore established some degree of rapport between these variables.
Event #3: NU-PTR 0.48
Event #4: Senators Food Drive 0.46
Event #5: Wolves Teddy Bear Toss 0.60

234
Table 62: Sponsorship Activation
CRSS Event Sponsor Charity Activation Activities PI*FIT
Correlation
Event #1:
NU-RMWP
(5th Annual)
Unspecified Canadian Breast
Cancer
Foundation
-non-sponsor specific promotion r=.57
Event #2:
LU-PTR
(1st Annual)
Deluxe
Hamburgers
Northern Cancer
Research
Foundation
- logo on event fundraising t-shirts r=.19
(n.s.)
Event #3:
NU-PTR
(1st Annual)
True North
Chevrolet
Canadian Breast
Cancer
Foundation
-posters
-radio ads
-social media
-campus promotion
-car display
-game day announcements
-promotional material
r=.48
Event #4:
Senators
Food Drive
(Recurring
Event)
Canadian
Tire
Ottawa Food
Bank
-radio ads
-newspaper ads
-social media (team, sponsor, non-
profit accounts)
-e-mail promotion
-web promotion
-broadcast mentions
r=.46
Event #5:
Wolves
Teddy Bear
Toss
(Annual
Event)
Travelodge
Hotel
Salvation Army -radio ads
-newspaper ads
-arena posters
-home game announcements
-website promotion
-sponsor press conference
-broadcast mentions
-Teddy Bear sales (at event)
r=.60
While activation efforts were observed for each investigated event, spectators‘ awareness and
assessment of these activities were not measured. Sponsorship activation is an acknowledged
determinant of sponsorship response that was beyond the scope of this particular inquiry.
Consumer perceptions of such activation programs should be considered in future sponsorship
research.

235
A final consideration in the discussion of PI*FIT is the presence of gender differences (H5b). In
this case, the relationship between PI*FIT was significant for female respondents of all samples.
For male respondents, significant PI*FIT correlations were reported with all but the women‘s
hockey sample. Men of this particular group reported generally weaker PI effect on all
predictors of sponsorship response. Specifically, (in addition to PI*FIT), PI*FAV and PI*USE
were not significantly correlated with this population while PI*SINC (r=.28) and PI*INT (r=.24)
were significant but weakly linked. Despite these insignificant results among this segment of
male respondents however, the comparison of correlation coefficients between genders was not
significantly different between women and men of the all-events, women‘s hockey, men‘s
hockey, and cancer-causes samples. The only significant gender difference in PI*FIT was
discovered among the social-causes sample where women‘s reported PI*FIT correlation was
significantly higher than men‘s. Women‘s PI at sporting events linked to social causes was
therefore a stronger predictor of perceptions of FIT than it was for men at these same events.
H1 established women‘s stronger PIC among four of the tested sample treatments while H2
determined that there was no significant gender difference in PIS. As PI is a combined measure
of PIC and PIS, a further comparison of PI means was conducted to assess if differences in total
reported involvement levels (i.e., PI) could explain these H5b results. As reported in Table 63,
there was no significant difference in PI between genders of any sample. Support for H5b
among only the social cause sample therefore reflects a more powerful PI*FIT interaction among
women at sporting events that are affiliated with social causes. This finding is consistent with
the rationale presented in relation to H1 and women‘s propensity to respond more intensely to
emotional appeals (such as the Teddy Bear Toss event) and to display more demonstrative acts
of social giving. This significant connection of women to social causes is an important

236
distinction and consideration in sponsors‘ selection of charitable partners. The impact of
perceptions of sponsor-event FIT on sponsorship response is later addressed in the discussion of
H8.
Table 63: Gender Comparison of Personal Involvement (PI)
Sample Women‘s Personal Involvement
(PI)
Men‘s Personal Involvement (PI) Difference
(Significance)
N Mean SD N Mean SD p (two-tailed)
All-Events 314 3.93 .65 319 3.86 .65 .07
Women‘s
Hockey
121 4.03 64 76 4.00 .59 .78
Men‘s
Hockey
193 .3.87 .66 243 3.82 .67 .44
Cancer-
Causes
156 3.96 .70 101 3.98 .69 .82
Social-
Causes
158 3.90 .61 218 3.81 .63 .16
PI* SINC (H6)
The interaction of personal involvement and perceived sincerity of the sponsor is next discussed
(H6). Only two of the reviewed studies specifically considered this relationship. Speed and
Thompson (2000) did not hypothesize interaction at this level but did report non-significant
correlation between personal liking of an event and perceived sincerity of the event sponsor.
Meenaghan (2001b) recognized the importance of sincerity in sponsorship and advocated that the
―goodwill phenomenon‖ (Meenaghan, 2001b, p.100) is what ultimately differentiates
sponsorship from advertising and is the impetus for favourable consumer response. Meenaghan

237
(2001b) proposed three levels of sponsorship goodwill: generic, category, and individual activity.
Generic goodwill is the most distant and passive form of sincerity as consumers simply deem
sponsorship to be generally positive. The next level of goodwill as explained by Meenaghan
(2001b) is more relevant to consumers as sponsors are associated with categories (such as sport,
art, festivals, causes, etc.) that are of personal interest. The individual activity level is where
goodwill effects are most powerful according to Meenaghan (2001b); ―…goodwill effects are
most apparent, being driven by the intensity of consumer involvement with the activity‖ (p.102).
According to this theory, partnering with properties that are relevant and deeply meaningful to a
sponsor‘s targeted consumers will generate the greatest level of return. This principle is captured
in this current study through the construct of personal involvement (PI). In the context of sport,
Meenaghan (2001b) developed a triangular relationship framework for understanding the
goodwill effect of fan involvement in sponsorship. In this presentation, the interaction among
fans, sponsors and sport/activity is mediated by fan involvement with the activity, which
generates ―positive emotional orientation toward the sponsor who bestows benefit on the
consumers‘ favored activity‖ (Meenaghan, 2001b, p.106). This triangular relationship (as
developed by Meenaghan, 2001b) involves unidirectional relationships between all elements and
is presented in Figure 8.

238
Figure 8: Goodwill Effects of Fan Involvement (Meenaghan, 2001b, p.106)
The conceptual relationship suggested by Meenaghan (2001b) was quantifiably verified in this
current study. PI*SINC correlations were significant with all investigated samples (H6a). For
the all-events sample, the relationship was positive and strong at r=.44. The social-causes
(r=.48), event 3 (r=.51) and event 5 (r=.59) samples were among the strongest reported PI*SINC
interactions. These events were also the most aggressively leveraged sponsorships (as detailed
above) thereby suggesting that activities promoting the sponsor‘s involvement in cause-linked
sporting events could strengthen the association between fans‘ PI and perceived SINC of the
sponsor. Actual message content was not considered in this particular study however it is
recommended that future research distinguish between the impact of sponsor-oriented versus
charity-oriented messaging on perceived sincerity and sponsorship response.
The PI*SINC relationship was also tested for gender differences (H6b) and revealed the most
significant and consistent distinctions of all verified relationships. The all-events, men‘s hockey,
cancer-causes, and social causes samples all supported H6b, confirming that the PI*SINC effect
was significantly stronger for women than for men. In cases where women feel a strong personal

239
connection with the event, their perceptions of sponsor sincerity are stronger than men‘s. In the
case of CRSS relationships, involvement may be with the sport and/or the cause which extends
the platform for potential consumer engagement. As will be later discussed, these perceptions of
goodwill generate favourable consumer response. In Meenaghan‘s model (2001b) referenced
above, the sponsor is shown to benefit the activity. As was confirmed in the sponsorship
response findings of this study (and will be later discussed), the sponsored activity can also
greatly benefit the sponsor.
In this current study of CRSS, Meenaghan‘s (2001b) triangular relationship evolved from
sponsor, activity (sport), fan to also include cause affiliations. The interaction between involved
stakeholders was amplified in this scenario as consumers‘ dual-involvement with both sport and
cause expanded the potential for goodwill toward sponsors and shared benefits were broadened
between the sponsor, charity/cause, and sport/event. As an extension to Meenaghan‘s (2001b)
triangular relationship, Figure 9 presents the ―Diamond of CRSS Goodwill‖ derived from this
current study. The extended platform of engagement is represented by the diamond shape below
that unites consumer, sponsor, sport, and charity. The direction of relationships (represented by
arrows) is also modified in this conceptual representation of goodwill effects in CRSS scenarios.
Whereas Meenaghan (2001b) indicated all unidirectional exchange (fan involved with activity;
fan extends goodwill to sponsor; and sponsor benefits the activity), this expanded view
recognizes mutual exchange and reciprocal return. Consumers‘ one-way involvement with sport
and sentiments of goodwill (or perceived sincerity) are maintained as per Meenaghan‘s (2001b)
original depiction. A new involvement relationship is introduced as consumers are also
connected with an affiliated cause. Reciprocal exchange (depicted as two-way arrows) captures
the interaction between sponsors and sports; sponsors and causes; and causes and sports.

240
The earlier review of sport and cause sponsorship literature identified the numerous benefits of
such partnerships. For sponsors of sport, benefits include strategic targeting of consumer
segments, the opportunity to engage consumers in an emotional and receptive state, the
generation of goodwill, brand awareness, favourable brand image and preference, and consumer
response in terms of sales revenue (Chadwick & Thwaites, Copeland et al., 1996; Cornwell et al.,
2005; McCarville & Copeland, 1994; McCook et al., 1997; Meenaghan, 2001b). The partnering
sport property benefits mainly from funding and in-kind assistance as well event profiling and
sport promotion (Davis, 2012; O‘Reilly & Seguin, 2009). For sponsors of cause, the benefits are
similar to sport (i.e., brand awareness, enhanced image, emotional engagement, goodwill and
sales) with the added features of being able to display tangible acts of CSR and generating cause-
linked publicity and meaningful differentiation from competing brands (Chang, 2012; Close &
Lacey, 2013; Hyllegard et al., 2011; Irwin et al., 2003, Hajjat, 2003; Menon & Kahn, 2003;
Meyer, 1999). For the affiliated causes, the benefits are mainly funding, awareness, cause
Figure 9: Goodwill Effects of CRSS – Current Study
(“Diamond of Goodwill”)

241
education and the recruitment of volunteers and donations (Bernardo, 2011; Cone LLC, 2010a;
Doherty & Murray, 2007; Harvey & Strahilevitz, 2009; Taylor & Shank, 2008). The final
exchange is among sports and causes. For sport organizations the benefits of cause-associations
include enhanced image, new audience reach, and grassroots development of sport (King, 2001;
Plewa & Quester, 2011; Walker & Kent, 2009). King (2001) referred to the NFL‘s Real Men
Wear Pink campaign as an example of associating with a cause to reach a new (female) market
and to improve a faulty brand/player image. Finally, sport can benefit cause (in similar ways as
sponsors benefit causes) by extending mass audience reach, generating cause awareness and
education, providing access to sponsors and incremental funding opportunities, offering an
attractive outlet for corporations to promote their social goodness, and by linking charitable
partners to emotionally charged sports fans (Neale et al., 2007; Smith & Westerbreek, 2007; Roy
& Graeff, 2003; Walker & Kent, 2009; Watt, 2010). Table 64 summarizes these reciprocal
exchanges among extended sponsorship partners.
Table 64: Reciprocal Exchange of CRSS
Sponsor Benefits Sport Sport Benefits Sponsor
-funds (or in-kind assistance) for sport and athlete
development
-event funding
-profile / awareness of sport
(Davis, 2012; O‘Reilly & Seguin, 2009)
-strategic consumer targeting
-emotional connection/ involvement of sport fans
-generation of goodwill
-brand awareness /broad audience reach
-brand/company image
-brand preference
-consumer response /sales
(Chadwick & Thwaites, Copeland et al., 1996;
Cornwell et al., 2005; McCarville & Copeland,
1994;McCook et al., 1997; Meenaghan, 2001b )
Sponsor Benefits Cause Cause Benefits Sponsor
-funding /revenue
-cause awareness
-education
-fundraising / donations
-volunteer recruitment
-enhanced image
-outlet to display CSR
-positive brand attitudes
-emotional engagement
-positive publicity

242
(Bernardo, 2011; Cone, 2010a; Doherty & Murray,
2007; Harvey & Strahilevitz, 2009; Taylor &
Shank, 2008)
-consumer goodwill / perceived sincerity
-meaningful differentiation
-consumer response / sales
(Chang, 2012; Close & Lacey, 2013; Hyllegard et
al., 2011; Irwin et al., 2003, Hajjat2003; Menon &
Kahn, 2003; Meyer, 1999)
Cause Benefits Sport Sport Benefits Cause
-positive image
-reach / new audience
-community outreach
-grassroots development and sport participation
(King, 2001; Plewa & Quester, 2011; Walker &
Kent, 2009)
-mass audience reach
-cause awareness and education
-access to sponsors
-access to fundraising
-outlet for corporations to display social goodness
-emotional connection of sport fans
(Neale et al., 2007; Smith & Westerbreek, 2007;
Roy & Graeff, 2003; Walker & Kent, 2009; Watt,
2010)
Meenaghan et al. (2013) recently presented a broadened view of sponsorship that includes a
multi-stakeholder relationship platform. Although charitable affiliates are not explicitly
examined among this list of expanded stakeholders, these authors bring attention to a major
development in the sponsorship industry. A more holistic approach to sponsorship is expanding
organizational connections, objectives, and corresponding expectations of return. The Diamond
of Goodwill is, therefore, an important reflection of these current industry dynamics. As sports
and causes increasingly partner to deliver exponential return, there is a corresponding need to
further the understanding of these relationships. The development of this framework is a
substantial output of this dissertation and the foundation for future investigations.
PI* SR (H7)
H7 addresses the final PI interaction that was studied in this research, PI*SR. Following the
approach of Speed and Thompson (2000) and Alay (2008), SR was measured in terms of INT,
FAV and USE. This direct influence of PI on SR has been examined by the majority of

243
reviewed sponsorship effects studies. In fact, twenty-four of the thirty-seven reviewed studies
considered the impact of PI*SR. Only one of these studies (Alay, 2008) did not confirm a direct
relationship. In this case of female students in Turkey, PI was however determined to have an
indirect effect on SR through FIT. All other reviewed studies confirmed a significant, direct
relationship between PI*SR (Alexandris & Tsiotsou, 2012; Bennett et al., 2009; Berger et al.,
1999; Close et al., 2006; Cornwell & Coote, 2005; Donahay & Risenberger, 2007; Filo et al.,
2010; Grohs & Reisinger, 2005; Grohs et al., 2004; Gwinner & Bennett, 2008; Gwinner &
Eaton, 1999; Gwinner et al., 2009; Hyllegard et al., 2011; Kinney et al., 2008; Ko et al., 2008;
Ling & Owen, 2007; Madrigal, 2001; Maxwell & Lough, 2009; Meenaghan, 2001b; Pham, 1982;
Speed & Thompson, 2000; Walker & Kent, 2009). These effects were noted at all three levels of
the hierarchy of effects and are specified in the summary of sponsorship effects studies (Table
59). Of these studies, the vast majority (i.e., seventeen of twenty-four, 71%) involved sport
sponsorship, two were cause-linked and four studies were based on CRSS. None of these studies
were Canadian-based.
A summary of this study‘s findings pertaining to this relationship (PI*SR) are re-presented in
Table 65 (all-events, women‘s hockey, and men‘s hockey samples) and in Table 66 (cancer-
causes and social causes sample).
Table 65: Gender Comparisons of Correlation Results - PI*SR (INT/FAV/USE)
All-Events Women’s Hockey Men's Hockey
Total Women Men Total Women Men Total Women Men
PI*INT 0.42 0.44 0.37 0.29 0.30 0.24 0.45 0.52 0.38
PI*FAV 0.38 0.39 0.35 0.28 0.32
0.19
(n.s.) 0.40 0.43 0.37
PI*USE 0.37 0.36 0.37 0.24 0.28
0.10
(n.s.) 0.41 0.40 0.42

244
Table 66: Gender Comparisons of Correlation Results by Type of Cause Sample
Cancer-Causes Social-Causes
Total Women Men Total Women Men
PI*INT .30 .37
.15
(n.s.) .49 .53 .44
PI*FAV .29 .36
.14
(n.s.) .42 .43 .41
PI*USE .24 .33
.07
(n.s.) .45 .39 .48
This study joins the many published findings referenced above in supporting a direct and positive
relationship between PI and SR at all levels of consumer effect (i.e., INT, FAV, and USE). This
was the case when considering all grouped samples (without gender split). For the all-events
sample, the correlation between PI*INT (lowest level of effect) was the strongest (r=.42) while
FAV (r=.38) and USE (r=.37) were comparable. When considering the gendered hockey
samples, stronger correlations were reported among the men‘s hockey sample than the women‘s
hockey sample. Although still significant, there was a marked drop in the strength of all levels
of correlation with respondents at these university pink-themed women‘s games. When
contrasting correlations by type of cause both the cancer-cause and social cause samples also
indicated significant correlations at all levels of response although the strength of these
relationships were again strongest among respondents of social-cause events.
In order to determine if these observed correlation differences across grouped samples were
significant, an additional level of analysis was performed for the purpose of this discussion.
Correlation coefficients were compared by gender of hockey sample and by type of cause
sample. These results are presented in Table 67. This assessment confirmed that PI*INT and
PI*USE effects were both significantly stronger for the men‘s hockey sample (relative to the
women‘s hockey sample) and for the social-causes sample (relative to the cancer-causes sample).

245
At the level of FAV, the differences in reported correlations were not significantly different
between contrasted sample groups. The men‘s hockey sample was mainly made up of social-
cause responses (over 86% of respondents) therefore it is reasonable that these sample treatments
produced consistent results. These findings indicate that personal involvement levels expressed
at men‘s hockey and social-cause events had the greatest impact on consumers‘ response to
sponsorship and that these responses were most pronounced at the cognitive level of effect,
followed by intended behaviour and then favourable feelings toward the sponsor. PI registered
at cancer-cause events had a weaker impact on SR. As previously reported (H1), both genders
indicated strong involvement with cancer causes (and men‘s PIC was significantly greater with
cancer causes than with social causes). It was therefore interesting to discover that this strong
expressed connection to cancer-causes had a diluted impact on sponsorship response. It is
possible that this finding is explained by the saturation of pink efforts targeting consumers and
the increased scrutiny of such efforts often viewed as pink-washing (King, 2006; Orenstein,
2003). There is a growing call to ―think before you pink‖ (Twombly, 2004, p.1736) as Harvey
and Strahilevitz (2009) warn that the ―overuse of the pink ribbon could potentially lead to visual
saturation, with a decline or loss of the emotional and intellectual response‖ (p.30).
Table 67: Comparison of PI*SR Correlations by Type of Hockey and Type of Cause
Gender of Hockey Sampling Type of Cause Sampling
Women's
Hockey
(n=200)
Men's
Hockey
(n=442)
Cancer-
Causes
(n=260)
Social
Causes
(n=382)
PI*INT r .29 .45 r 0.30 0.49
Z(obs) -2.171 Z(obs) -2.804
PI*FAV r .28 .40 r 0.29 0.42
Z
(obs) -1.586
Z
(obs) -1.845
PI*USE r 0.24 0.41 r 0.24 0.45

246
Z
(obs) -2.225
Z
(obs) -2.969
Table 68 summarizes a comparison of findings to similar sponsorship effect efforts. Of note, the
results from this study are strong at all levels as are the other cause-associated studies (Close &
Lacey, 2013; Filo et al., 2010; Walker & Kent, 2009). Alay (2008) and Speed and Thompson
(2000) report the lightest observed PI*SR effects from their pure sport sponsorship
investigations. Cause connections therefore may in fact amplify consumer response.
Table 68: Comparison of PI*SR (INT/FAV/USE) Correlation Findings
Study PI*INT PI*FAV PI*USE
Current Study 0.42 0.38 0.37
Alay (2008) 0.15 0.18 0.09
Close & Lacey (2013) 0.32
Filo et al. (2010) 0.30 0.34
Ko et al. (2008)
.37 to
.56
Speed & Thompson
(2000) 0.19 0.18 0.17
Walker & Kent (2009) 0.51 0.56
H7b anticipated gender differences in the interaction of PI*SR whereby women would report a
greater effect than men. This hypothesis was only supported at one level of response and with
only one sample group. Women of the cancer-causes sample reported significantly stronger
PI*USE than did men. This behavioural effect may be influenced by the widespread promotion
of pink-ribbon products often targeted primarily to women. The correlation of PI*SR was not
significant at any level of effect for men of this cancer-causes sample and correlations at the
higher levels of effect (i.e., FAV and USE) were not significant for male spectators of women‘s
hockey. There was a loss of connection for these male fans between personal involvement levels
and direct sponsorship response. This finding may relate to the earlier discussion concerning the

247
saturation of pink-themed events and the corresponding dilution of consumer impact. As will be
reviewed later, gender support may have also shaped these findings as men‘s support of
women‘s sport is significantly less than women‘s and in this case, may not have served as
sufficient motivation for sponsor support at these higher levels of effect. Observed PI*SR
distinctions between genders of all other grouped samples (i.e., all events, women‘s hockey,
men‘s hockey, and social causes) were not significantly different. In the reviewed literature,
three studies found males‘ PI*SR to be greater than women‘s (Pham, 1992; Kinney et al., 2008;
Bennett et al., 2009). Two were at the cognitive level (sponsor recall) and one was at the
behavioural stage (purchase). These three studies however involved strongly male skewed sports
(men‘s soccer, car racing, and action sports) with no cause associations. In line with current
findings, two cause-linked studies also found women‘s PI levels to impact sponsorship response
more strongly at the higher levels of effect (Berger et al., 1999; Hyllegard et al., 2011).
To visually summarize the PI relationships confirmed through this investigation, Figure 10
captures the significant paths of the total sample (i.e., women and men combined); Figure 11
illustrates women‘s PI relationships, and Figure 12 outlines men‘s PI paths in CRSS. As
discussed, the main gender differences highlighted in this presentation is women‘s stronger
PI*SINC connection as well as the direct impact of PI on the INT level of sponsorship response.
PI
SIN
C
FIT
USE
SR
INT
FAV
.44
.44
.42
.38
.37
Figure 10: Effects of PI in CRSS (Total Sample)

248
6.1.2 Gender Support in CRSS (H3, H4, H10)
Gender solidarity is defined by Fajak and Haslam (1998) as ―an identification and unity amongst
members of the same sex, expressed in a sense of community and mutual support regarding
interests, feelings and reactions‖ (p.73). There is strong support for the proposition that women
tend to unite more strongly based on gender than do men (Bruins et al., 1993; Fajak & Haslam,
1998; Lorenzi-Cioldi & Doise, 1991). The notion of gender support surfaced in the management,
sport management, and cause literature reviews. In the context of entrepreneurship, the M2W
Conference Group (2011) noted the support that women extend to their female counterparts,
reporting that 79% of surveyed women will try a company‘s products/services if they believe
that this organization supports women-owned businesses. Fajak and Haslam (1998) also found
PI
SIN
C
FIT
USE
SR
INT
FAV
.47
.51
.44
.39
.36
Figure 11: Effects of PI in CRSS (Women’s Sample)
PI
SIN
C
FIT
USE
SR
INT
FAV
.41
.35
.37
.35
.37
Figure 12: Effects of PI in CRSS (Men’s Sample)

249
some support of gender solidarity in their examination of gender identification and promotion in
the workplace. In this study, there was evidence that in addition to considerations of fairness and
qualifications, women first nominated other women (versus men) as most worthy of promotion.
In advertising, Edwards and La Ferle (2009) made the case for gender-specific support reporting
findings that women rated female celebrities as more trustworthy while men believed male
endorsers to be more trustworthy. Specific to sport spectatorship, Funk et al. (2001) measured
the motivation of attendance of spectators at the 1999 FIFA Women‘s World Cup and found that
the desire to support women‘s opportunities (SWO) in sport was among the primary motives
driving event attendance. SWO as part of Funk et al.‘s (2001) Sports Interest Inventory is
defined as: ―the extent to which interest in the team is a reflection of support for women‘s sport
in general (Funk, Ridinger, & Moorman, 2003, p.26). However, in this study, there was no
distinction made between the responses of women and men. Ridinger and Funk (2006) did
contrast gender response with respect to supporting both women‘s and men‘s opportunities and
found that at men‘s basketball games, there was no significant gender difference in feelings of
supporting male athletes in men‘s sports. At the women‘s games however, this study found that
female spectators felt more strongly about the importance of supporting women‘s sports.
Ridinger and Funk (2006) acknowledged the historical support of men‘s sport and suggested that
women‘s support of women‘s sport may be a means of showing gender solidarity. Sack and
Fried (2001) considered the idea of gender support from the sponsor‘s perspective reporting that
some companies support women‘s tennis through sponsorship as an ―ideological commitment to
women‘s sports‖ (p.76). From a cause perspective, Broderick et al. (2012) found that women
supported CRM campaigns benefiting breast cancer awareness as a gesture of solidarity and a
means of ‗doing something for the women out there‖ (p.596).

250
In terms of sponsorship effects, there were no existing studies found that included elements of
gender support or solidarity as a possible determinant of sponsorship response. Given that the
purpose of this dissertation was to identify any significant gender effects in the sponsorship
process, it was deemed necessary to introduce gender support as a potential motivation of female
consumer response and to initiate discussion around this topic. Gender support for women
(GSW) was treated as a consumer factor and measured in terms of general support for women‘s
sport and women‘s causes. Consideration for both sport and cause conforms to the
characteristics of the investigated CRSS events. Similarly, gender support for men was
measured in terms of general support for men‘s sport and men‘s causes. Responses to these
variables were collected from both female and male research participants.
Based on the reviewed literature, gender solidarity was expected to be observed by both genders.
In other words, the expectation of this study was that women would mostly support women (H3)
and that men would mostly support men (H4). H3 was supported as results from this study did
in fact confirm stronger GSW among female respondents (M=4.41) than male respondents
(M=3.99). Significant differences in favour of women‘s stronger GSW were observed among
the all-events, women‘s hockey, men‘s hockey, cancer-causes, social-causes, and four of the five
individual event samples. Only Event #1 revealed non-significant GSW differences between
genders. Consistent with the findings of Ridinger and Funk (2006), the magnitude of the
difference between sentiments of GSW between genders was greatest among spectators of
women‘s hockey. In this scenario, gender explained 13% of the variance in GSW versus 8% in
the all-events sample. Women‘s support of their own gender was strongest at women‘s hockey
games. This finding suggests that sponsors targeting female consumers may effectively leverage
the passion of gender solidarity through association with female sports.

251
H4 anticipated similar results for men whereby gender solidarity would be ascertained through
stronger expressions of support for men‘s sports and causes by men. This presumption was
proven wrong. In fact, the opposite was revealed as women expressed significantly stronger
support than men, not only for women‘s sports and causes but also for men‘s. For the all-events
sample, women‘s GSM response (M=4.25) was significantly stronger than men‘s (M=4.02).
This same conclusion was found for the women‘s hockey, men‘s hockey, cancer-causes, social-
causes, and events 2, 4, and 5 samples. Event 3 results were consistent with the above trend but
not significantly different between genders. Male respondents at Event 1 (NU-RMWP) actually
indicated stronger support (M=4.26) for their own gender than did women (M=4.03) but this
difference was not significant with this smaller sampled event. The review of relevant literature
did not reveal any studies with similar results.
This new consideration for gender support established that women support both women
(M=4.41) and men (M=4.25). Having said this however, women ultimately support women
more than they do men. Women (of this study) indicated that they care most for their own
gender. What remains unknown is whether these feelings of gender solidarity manifest into
favourable sponsorship response and if this effect is stronger at women‘s CRSS events than at
men‘s CRSS events. These were the issues explored in H10a and H10b. Focusing strictly on the
female segment of respondents, the direct relationship between gender support for women and
sponsorship response was investigated and confirmed as significant at all levels of response.
H10a was therefore supported. Although not hypothesized in the current model, it is also worth
noting that GSW also had an indirect impact on sponsorship response through significant
correlations with all other predictive variables (i.e., PI, FIT, and SINC).

252
The final test regarding gender support was to determine if the gender of the sport being played
impacted the strength of women‘s sponsorship response. H10b anticipated that gender solidarity
would manifest more strongly at women‘s events and that this would result in more favourable
sponsorship response than at men‘s events. A comparison of female responses between the
women‘s hockey spectators and men‘s hockey spectators revealed no significant differences in
sponsorship response based on the gender of sport being played. H10b was therefore not
supported. While recorded GSW was stronger for women at female events, the corresponding
impact on sponsorship response was not significantly different and therefore not dependent on
the gender of sport being played.
Unlike other variables in the proposed model of this study (such as involvement, fit and
sincerity), gender support was approached in a more exploratory fashion. An extensive review
of sponsorship effects studies did not reveal any past efforts to integrate this concept into the
testing of consumer response. Gender support /solidarity learning from related areas of sport
management (and beyond) therefore guided the inclusion of this variable in the current study.
Observations of differences between genders and the impact of gender support on sponsorship
response are sufficient to engage further discussion on the importance of this consideration in the
consumer processing of sponsorship programs. As hybrid forms of sponsorship continue to
develop (such as sports and cause, festivals and sports, arts and causes, etc.), the potential basis
of gender support also broadens. Sponsors therefore have increased opportunity to establish
shared relevance and consumer engagement.
A diagram of the significant paths confirmed in this review of GSW is presented in Figure 13.
PI, FIT and SINC are represented by dashed lines to denote that these relationships were not part
of the original hypotheses of this study.

253
6.1.3 Sponsor-Event Fit in CRSS (H8)
The interaction of PI and sponsor-event fit was already discussed at length in section 6.1. The
role of perceived sponsor-event fit in the sponsorship process is now addressed in terms of direct
interaction with the outcomes of sponsorship. The testing of this relationship in sponsorship
literature is well established. Fifteen of the thirty-seven reviewed studies (40.5%), considered
the construct of fit. The majority (i.e., nine) of these studies involved sport (Speed & Thompson;
Deane et al., 2003; Grohs et al., 2004; Grohs & Reisinger, 2005; Koo et al., 2006; Donahay &
Risenberger, 2007; Gwinner & Bennett, 2008; Gwinner et al., 2009; Sozer & Vardar, 2009;
Alay, 2008). Three studies considered the impact of fit in consumer cause association response
(Becker-Olsen & Simmons, 2002; Simmons & Becker-Olsen, 2006; Nan & Heo, 2007). Only
one of these studies however involved CRSS (Close & Lacey, 2013). In all cases, fit was
revealed as a significant predictor of sponsorship response at the levels of cognition, affection,
and / or behaviour.
The current study lends further support to the significance of sponsor-event fit in realizing
favourable CRSS response (H8). For all grouped samples, FIT had the strongest interaction at
GSW
SINC
FIT
USE
SR
INT
FAV
.37
.49
.38
.38
.29
PI
.60
Figure 13: Effects of GSW in CRSS (Total Female Sample)

254
the lowest order of effect, INT. This may imply that assessing sponsor-event fit is a more
cerebral exercise that mainly resonates at the level of consumer cognition. In terms of the
measures of this particular study, cognition refers to consumers‘ awareness of the sponsor and
corresponding propensity to pay attention to this sponsor‘s future promotional efforts. FIT
correlations with FAV and USE were both also significant and comparable to one another in
strength. Results of this investigation are well aligned with past studies. Table 69 compares
correlation coefficients for similar published measures. Results at the INT level are strongest in
the current study while correlations at the higher orders of effect were noted in these other
investigated cases. The interaction of FIT with FAV and USE was notably strongest in Alay‘s
(2008) study of female students‘ evaluation of a female product‘s sponsorship of women‘s
volleyball. Based on Alay‘s (2008) reported findings, the strength of this more natural (and
perhaps obvious) fit moved respondents to higher levels of response. Furthermore, as previously
expressed, activation efforts can also influence consumer response which may account for some
of these observed variations across studies. For instance, purchase incentives can be tied to
sponsorship programs which can prompt greater behavioural response.
Table 69: Comparison of FIT* SR (INT/FAV/USE) Correlations
Study FIT*INT FIT*FAV FIT*USE
Current Study:
All-events sample .53 .44 .45
Women‘s hockey sample .52 .43 .44
Men‘s hockey sample .57 .48 .48
Cancer-causes sample .51 .43 .46
Social-causes sample .57 .47 .47
Alay (2008) .45 .59 .56
Close & Lacey (2013) - - .55
Speed & Thompson (2000) .43 .48 .47

255
None of the fifteen reviewed studies that examined FIT *SR commented on gender differences.
This current investigation was unique in this consideration as H8b expected the interaction of
FIT*SR (INT/FAV/USE) to be stronger among women than men. This expectation did not
materialize as there were no significant gender differences observed between the interactions of
FIT with any of the levels of response across any of the grouped sample treatments. Consumer
perceptions of sponsor-event fit directly impacted sponsorship response. This finding was
equally as true for women as it was for men. Both women and men experienced the strongest
effect of FIT at the cognitive level (i.e., INT) as confirmed with all investigated samples. The
impact of FIT on FAV and USE was comparable for both genders. Gender comparison results
are presented in Table 70.
Table 70: Gender Comparison of Correlation Results - FIT*SR (INT/FAV/USE)
All-Events Women's Hockey Men's Hockey
Total Women Men Total Women Men Total Women Men
FIT*INT 0.53 0.52 0.54 0.52 0.52 0.49 0.57 0.54 0.58
FIT*FAV 0.44 0.45 0.42 0.43 0.44 0.36 0.48 0.49 0.46
FIT*USE 0.45 0.47 0.44 0.44 0.47 0.35 0.48 0.48 0.47
Cancer-Causes Social-Causes
Total Women Men Total Women Men
FIT*INT .51 .51 .48 .57 .54 .58
FIT*FAV .43 .42 .38 .48 .48 .46
FIT*USE .46 .50 .36 .47 .45 .48
An additional observation in considering the type of hockey samples was that men‘s weakest
correlations were from spectators of women‘s hockey. In this case, correlations between FIT and
all three levels of response were still significant however perceptions of sponsor-event fit did not
appear to be as motivating for men who attended women‘s hockey as it was for male spectators
of men‘s hockey. A further level of analysis was conducted to test the statistical significance of
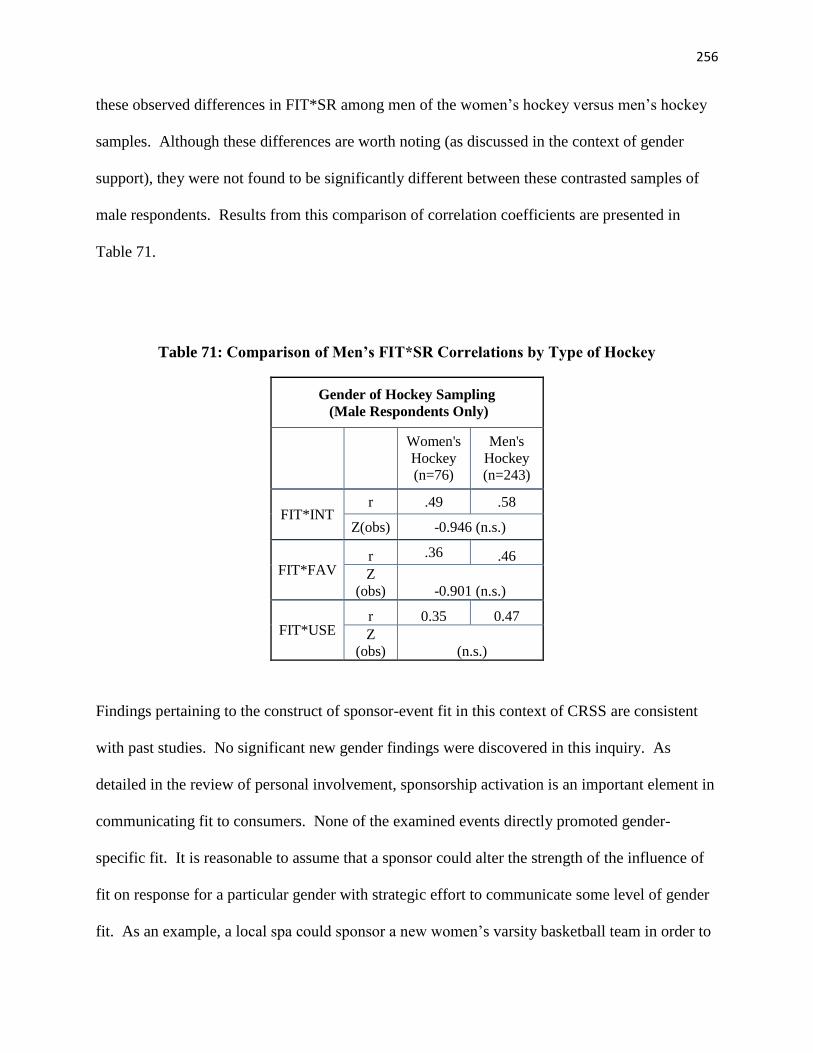
256
these observed differences in FIT*SR among men of the women‘s hockey versus men‘s hockey
samples. Although these differences are worth noting (as discussed in the context of gender
support), they were not found to be significantly different between these contrasted samples of
male respondents. Results from this comparison of correlation coefficients are presented in
Table 71.
Table 71: Comparison of Men’s FIT*SR Correlations by Type of Hockey
Gender of Hockey Sampling
(Male Respondents Only)
Women's
Hockey
(n=76)
Men's
Hockey
(n=243)
FIT*INT r .49 .58
Z(obs) -0.946 (n.s.)
FIT*FAV r .36 .46
Z
(obs) -0.901 (n.s.)
FIT*USE r 0.35 0.47
Z
(obs) (n.s.)
Findings pertaining to the construct of sponsor-event fit in this context of CRSS are consistent
with past studies. No significant new gender findings were discovered in this inquiry. As
detailed in the review of personal involvement, sponsorship activation is an important element in
communicating fit to consumers. None of the examined events directly promoted gender-
specific fit. It is reasonable to assume that a sponsor could alter the strength of the influence of
fit on response for a particular gender with strategic effort to communicate some level of gender
fit. As an example, a local spa could sponsor a new women‘s varsity basketball team in order to

257
generate awareness and trial for a new location near campus. They could activate this
sponsorship by partnering with the student food bank and integrating a promotion that would
reward food donations with a chance to win a spa package at the new location. Such a targeted
campaign could feasibly strengthen the perceived fit with female spectators. The communicated
call to action in this case could also strengthen the link between fit and behavioural response.
Diagrams of the significant paths confirmed through this review of FIT*SR are presented in
Figure 14 (total sample), Figure 15 (women‘s sample) and Figure 16 (men‘s sample). Reflecting
the discussion above, the correlations noted among the women‘s and men‘s samples are similar.
FIT
USE
SR
INT
FAV
.53
.44
.45
Figure 14: Effects of FIT in CRSS (Total Sample)
FIT
USE
SR
INT
FAV
.52
.45
.47
Figure 15: Effects of FIT in CRSS (Women’s Sample)

258
6.1.4 Sincerity of the Sponsor in CRSS (H9)
Perceived sincerity of the sponsor and the goodwill phenomenon of sponsorship were also
reviewed in the presentation of PI. As with the discussion of fit above, sincerity is next
discussed in terms of its direct impact on sponsorship response. Of the reviewed studies, only
Alay (2008) and Speed and Thompson (2000) directly measured the interaction of sincerity on
sponsorship response (i.e., INT/FAV/USE). Both sport-based studies found support for this
SINC*SR relationship at all three levels of effect. Close and Lacey (2013) more recently
examined the effects of consumers‘ perceptions of the sponsor‘s actions of CSR on purchase
intent. Similar items (helping the community, shared benefits, corporate giving) were measured
and can be reasonably considered as an element of perceived sincerity for the purpose of
comparing general findings. Close and Lacey (2013) reported very strong correlation between
the sponsor‘s CSR and consumers‘ purchase intent (r=.77).
H9 expected to confirm this same SINC*SR dynamic in the context of CRSS. This hypothesis
was strongly supported at all levels of effect and among all grouped samples. A strong link was
confirmed between perceived sincerity of the sponsor and CRSS response. In comparison to past
studies, the correlations recorded in this research were all stronger than Speed and Thompson‘s
(2000) results and were greater than Alay‘s (2008) at the level of INT but weaker at the levels of
FIT
USE
SR
INT
FAV
.54
.42
.44
Figure 16: Effects of FIT in CRSS (Men’s Sample)

259
FAV and USE. Similar to the comparison of Alay‘s (2008) study in terms of the superior impact
of FIT* SR, these SINC results may also be attributed to the strong natural fit between the event,
sponsor, and sample. Close and Lacey‘s (2013) treatment of CSR was more direct in presenting
respondents with a link to corporate good deeds. A CSR*USE (in this case measured only by
purchase intent) correlation of r= .77 far exceeds any other published findings, perhaps
indicating that an overt link to the sponsor‘s sincere charitable efforts generates more powerful
response. Results of this current study are again in agreement with previously published
findings. Table 72 below presents these comparisons of SINC*INT/FAV/USE.
Table 72: Comparison of SINC*SR (INT/FAV/USE) Correlations
H9b expected the interaction of SINC*INT/FAV/USE to be greater for women than for men.
Similar to FIT*SR, no significant gender differences were observed among the grouped samples,
therefore, concluding that perceptions of sponsor sincerity effect the sponsorship response of
both genders in similar manners. A review of published research did not reveal any studies that
considered this same relationship and therefore a comparison to other findings in not feasible in
this case. Although not fulfilling the required level of significance, it is interesting to note that
the interaction of SINC*SR was strongest for men (of all sample treatments) at the level of INT
Study SINC*INT SINC*FAV SINC*USE
Current Study:
All-events sample .51 .48 .46
Women‘s hockey sample .45 .44 .41
Men‘s hockey sample .53 .48 .48
Cancer-causes sample .48 .46 .43
Social-causes sample .52 .48 .47
Alay (2008) .45 .60 .59
Close & Lacey (2013)
CSR*USE - - .77
Speed & Thompson (2000) .35 .37 .40

260
relative to the higher orders of effect (i.e., FAV and USE). For women, however, perceptions of
sincerity appeared to have more similar effect across all levels of response (INT, FAV, and
USE). This distinction between the specific levels of effect could be further explored in future
studies to examine if women‘s perceptions of sincerity connect more on the emotional level
while this effect with men may be most profound at the cognitive level. Good deeds may in fact
connect more with the hearts of women and the minds of men. Gender comparison results are
presented in Table 73.
Table 73: Gender Comparison of Correlation Results - SINC*SR (INT/FAV/USE)
All-Events Women's Hockey Men's Hockey
Total Women Men Total Women Men Total Women Men
SINC*INT 0.51 0.48 0.53 0.45 0.42 0.51 0.53 0.51 0.53
SINC*FAV 0.48 0.49 0.47 0.44 0.44 0.44 0.48 0.50 0.46
SINC*USE 0.46 0.46 0.45 0.41 0.41 0.41 0.48 0.50 0.45
Cancer-Causes Social-Causes
Total Women Men Total Women Men
SINC*INT .48 .47 .50 .52 .49 .52
SINC*FAV .46 .48 .42 .48 .50 .45
SINC*USE .43 .47 .35 .47 .47 .45
FIT*SINC
A final observation (although not hypothesized) regarding consumer perceptions of sponsorship
is the strong interaction between the constructs of FIT and SINC. For the all-events sample,
there was a FIT*SINC correlation of r= 0.52 indicating that these two variables overlap with a
shared variance of 27%. In comparison, Speed and Thompson also reported significance but
with weaker correlation (r=.40) in their sport study involving students. These results imply that
when consumers perceive a strong fit between sponsor and event, they are less skeptical of the
motives of the sponsors and willing to assume greater sincerity. This relationship can also stem

261
from perceptions of sincerity, as consumers who believe the sponsor to be genuine in their
motives will make greater efforts to reconcile an acceptable level of fit between involved
organizations.
Diagrams of the significant paths confirmed and discussed through this review of SINC*SR are
presented in Figure 17 (total sample), Figure 18 (women‘s sample) and Figure 19 (men‘s
sample). Reflecting the discussion above, the correlations noted among the women‘s and men‘s
samples are again similar.
SINC USE
SR
INT
FAV
.51
.48
.46
Figure 17: Effects of SINC in CRSS (Total Sample)
SINC USE
SR
INT
FAV
.48
.49
.46
Figure 18: Effects of SINC in CRSS (Women’s Sample)

262
6.1.5 CRSS Response (H11)
The preceding sections confirmed multiple consumer paths to reach favourable sponsorship
outcomes. PI, GSW, FIT and SINC were all confirmed as significant predictors of sponsorship
response at all three levels of effect (INT, FAV and USE). For all grouped samples, the
strengths of correlations were greatest at the cognitive level of effect (i.e., INT). There was one
noted exception among female respondents of the women‘s hockey sample. In this case, GSW
had a greater impact with the affective level of response (i.e., FAV). Emotions associated with
feeling of gender solidarity may have encouraged this particular outcome. For the hockey
samples, strengths of correlations between PI, FIT, and SINC and the higher levels of response
(i.e., FAV and USE) were similar. This was not the case however when contrasting the cause-
type samples. For cancer-cause affiliated events, PI had a greater interaction with FAV (r=.29)
than with USE (r=.24). The opposite was observed among social-cause respondents who
indicated stronger effect between PI*USE (r=.45) than with PI*FAV (r=.42). Although these
differences are slight, they do imply that cancer-CRSS may have the greatest emotional impact
while social-CRSS may motivate a greater behavioural response in terms of intentions toward
event sponsors. Consistent with previous discussions, all reported correlations were stronger
with the social-cause sample than with the cancer-causes sample.
Figure 19: Effects of SINC in CRSS (Men’s Sample)
SINC USE
SR
INT
FAV
.53
.47
.45

263
The construct of GSW also offered distinct results as there was a more notable dip in effect at the
highest level of response (i.e., USE). This was true for female respondents of both the women‘s
hockey and men‘s hockey samples. With the women‘s hockey group, GSW interacted with INT
at r=.29, with FAV at r=.32 and dropped to r=.23 at the level of USE. For the men‘s hockey
sample, measured correlations were all stronger but revealed a similar drop at the behavioural
stage (GSW*INT=.42, GSW*FAV=.40, and GSW*USE=.34). These findings suggest that
women‘s feelings of gender support interact most with women‘s minds and hearts but less so
with behavioural intentions. This gap could conceivably be addressed through strategic
sponsorship activation programs. Given that the notion of gender support as a predictor of
sponsorship response was introduced in this current investigation, there were no known studies
available to contribute in further explaining these results. This is an area recommended for
future research.
It is also noted that the three levels of response were confirmed as highly correlated. It is
therefore expected that a successful connection with consumers at any one level can effectively
ignite response at the remaining levels of effect. Reported correlations between these levels of
response (i.e., INT*FAV, INT*USE, FAV*USE) are well aligned with results published by
Speed and Thompson (2000). Correlation results regarding these three levels of sponsorship
response across grouped sample treatments are detailed in Table 74.
Table 74: Correlation Results of SR (INT/FAV/USE)
All-Events Women’s Hockey Men’s Hockey
INT FAV USE INT FAV USE INT FAV USE
PI* 0.42 0.38 0.37 .29 .28 .24 .45 .40 .41
GSW* 0.38 0.38 0.29 .29 .32 .23 .42 .40 .34
FIT* 0.53 0.44 0.45 .52 .43 .44 .57 .48 .48
SINC* 0.51 0.48 0.46 .45 .44 .41 .53 .48 .48

264
INT*
Current Study
(Speed &Thompson, 2000)
0.72
(0.69)
0.70
(0.72)
.66
.65
.74
.71
FAV*
(Speed &Thompson, 2000)
0.78
(0.75)
.72 .80
Cancer-Causes Social-Causes
INT FAV USE INT FAV USE
PI* .30 .29 .24 .49 .42 .45
GSW* n/a n/s n/a n/a n/a n/a
FIT* .51 .43 .46 .57 .48 .47
SINC* .48 .46 .43 .52 .48 .47
INT* .67 .66 .75 .71
FAV* .73 .80
A final direct relationship to sponsorship response was considered in this study. H11 expected
women to respond more favourably to the investigated sponsorship efforts uniting sport and
cause. Eight previous sponsorship effects studies considered this same Gender*SR relationship
with mixed results. A study by Maxwell and Lough (2009) involving spectators of women‘s
basketball revealed no significant difference in the response to sponsorship by women and men.
Tobar (2006) also found that gender did not play a significant role in influencing purchase
intentions of sponsors‘ products by television viewers of the Super Bowl. Kinney et al. (2008)
reported that men were able to recall a larger number of NASCAR sponsors than women. Two
other sport sponsorship studies reported similar cognitive effects between genders but more
favourable attitudes and purchase intentions among women (McDaniel & Kinney, 1998;
McDaniel, 1999). The three cause-related studies that considered the direct influence of gender
on sponsorship response, all supported the view that women respond more favourably to such
cause affiliated efforts (Ross et al., 1992; Hyllegard et al., 2011; Roy & Graeff, 2003).

265
Findings from the current study also produced mixed results in terms of support for H11. No
significant gender differences were reported in terms of any level of sponsorship response among
the all-events, women‘s hockey, cancer-causes, and events 1 to 4 samples. The social-cause
sample however fully supported H11 with results indicating stronger sponsorship response by
women at all levels of effect. These same significant results in favour of women‘s stronger
response were also observed among the event 5 sample. In this case of the Sudbury Wolves
Teddy Bear Toss, women expressed significantly stronger response at all three levels of effect.
Reasons for women‘s significantly stronger sponsorship response (than men) among these two
specific samples may include some of the earlier discussed points. The community need for gift
giving to needy children during the emotional Christmas season (event 5), strong activation
programs (social-causes and event 5), and recurring events with pre-established fan rapport
(social causes and event 5) may have all collectively resonated stronger with women of these
particular events.
As detailed in the results chapter (section 5.3.8) an additional level of analysis included
randomly equalizing the gender samples to verify for any differences in reported significance. In
all other cases, this procedure rendered the same outcomes. When conducting this analysis for
the original men‘s hockey sample, t-test results for the INT variable were very close to
significance (p=.09). Randomly equalizing the sample sizes of men and women (to n=193), did
in this case nudge results within acceptable measures of significance. Women‘s mean INT score
(M=3.83) reached a level of significant difference (p=.03) to men‘s (M=3.64). The magnitude of
this difference however was quite small (eta squared=.01) and therefore these results are
interpreted with some level of caution.

266
This discussion of results has thus far considered all of the hypothesized relationships between
consumer factors (i.e., PI, gender, GSW, GSM), sponsorship factors (i.e., FIT and SINC), and
sponsorship response (i.e., INT, FAV, USE). Next, these variables are brought together in the
testing of the proposed model of consumer processing of CRSS.
6.1.6 Proposed Model of Consumer Processing of CRSS
The review of literature presented throughout this dissertation guided the development of a
conceptual framework to capture an understanding of consumer processing of CRSS with a
specific view to gender differences. The testing of hypotheses independently addressed each of
these variables and relationships. The final step of this research was to assemble these potential
predictors of sponsorship response in an effort to evaluate the interrelationships among them as
well as the ability of this set of variables to predict sponsorship response. Whetten (1989)
recommended that researchers ―err in favour of including too many factors in the mapping of
conceptual landscapes, recognizing that over time these ideas will be refined‖ (p.490). The
proposed model was purposely comprehensive and included the following seven independent
variables: i) gender, ii) PIC, iii) PIS, iv) GSW, v) GSM, vi) FIT, and vii) SINC. As explained in
the results chapter, the two measures of personal involvement (i.e., PIC and PIS) were treated
independently in this analysis in order to better distinguish between the relative strengths of these
measures in predicting sponsorship outcomes. For the purpose of this analysis, the three
measures of sponsorship response (INT, FAV, and USE) were also combined into one measure
of sponsorship response (SR).
As detailed in the results chapter, multiple regression of the all-events sample revealed a
significant model for which the independent variables explained 39.8% of the variance in SR.
Of the independent variables included in this model, FIT (=.278) and SINC (=.271) made the

267
strongest unique contributions to SR while PIC (=.186) also significantly contributed to the
prediction of SR. Gender (=.004), PIS (=.009), GSW (=.067) and GSM (=-.016) did not
make significant contributions. These results reaffirm the importance of FIT, SINC and PI in
sponsorship response. While this knowledge is already well documented in the contexts of pure
sport and pure cause settings, validation in the emerging area of CRSS is an important
contribution of this research. The relative importance of each determinant of SR is also
meaningful learning. In this model, FIT and SINC were essentially revealed as equally
contributing to sponsorship outcomes while PIC (although still significant) delivered less of an
impact on SR. Personal involvement was also examined from the aspect of both sport and cause
in an effort to discern the relative power of each in influencing consumer behaviour. Results
indicated that PIC was of greater significance than PIS despite sampling at sponsored events that
were primarily sport-driven and secondarily cause-affiliated. Future research could further
investigate the primary consumer driver (i.e., sport or cause) for different types of sponsored
events. It would be particularly interesting to explore participant-based cause-related sport
settings to assess if participation in such events (such as the CIBC Run for the Cure) is motivated
primarily by the associated sport (such as a running) or by the affiliated cause (such as breast
cancer). Such knowledge would assist sponsors in developing the most effective consumer
messaging and activation programs.
The same model was run a second time with the data split by gender. Gender was therefore
removed as an independent variable for this analysis while all other variables were maintained.
The model was significant for both genders (p=.000), explaining 38.6% of SR variance for
women and 39.3% for men. For women, the strongest unique predictor of SR was FIT (=.288),
followed closely by SINC (=.269) and to a lesser extent (but still significant), PIC (=.151).

268
Men‘s strongest predictors were the same three variables as women however SINC was the
greatest (=.285), followed by FIT (=.254) and then PIC (=.220). All other variables were not
significant as unique contributors to SR. This gender comparison of the CRSS model revealed
important similarities. The model fit equally well for both genders, the same three variables (i.e.,
FIT, SINC, and PIC) were identified as significant predictors of SR, and PIC was the weakest
predictor of SR for both women and men. The main difference was the relative strength of these
predictors as FIT had the greatest impact on women‘s response and SINC was the main predictor
of men‘s response. These model results can be linked to the earlier testing of individual
hypotheses. H8b and H9b expected women to have stronger FIT*SR and SINC*SR
relationships than men. Both of these hypotheses were not supported as reported differences
between genders were not found to be significant. Despite minor differences in these beta
scores, these tested models produced comparable gender findings.
This dissertation was strongly guided by the work of Speed and Thompson (2000) and Alay
(2008). Despite noted differences in sample characteristics, the proposed sponsorship model of
this current study most closely follows the design of these earlier efforts. An advantage of
collecting common measures and conducting similar analyses is the ability to compare results
across key measures and effectively contextualize the findings of this particular study. Both
previous studies treated the three levels of sponsorship response as separate dependent variables
(INT, FAV, and USE). In order to conduct a thorough comparison, multiple regressions were re-
run (with gender split data) three additional times for each of these dependent variables.
Table 75 describes the methods and designs of each of the relevant studies. Speed and
Thompson (2000) relied on student participation at an Australian university to examine response
to proposed sport sponsorships. The sample size in this study was 195. Alay (2008) also

269
sampled students but in this case the focus was on an all-female segment (n=412) from a Turkish
university. Both the sport (women‘s volleyball) and sponsor in Alay‘s investigation were
female-oriented. As a reminder, this current Canadian-based field study included an equal
representation of male (n=319) and female (n-=314) spectators of five different charity-linked
hockey events. These games included both women‘s and men‘s hockey.
Table 75: Comparison of Findings - Research Design
Year Authors Sample
Size
Gender Respondent
Profile
Country Sponsorship Setting
2000 Speed &
Thompson
195 Female
and Male
Students Australia -Classroom
-Two possible sponsors
and 2 possible events
(sport) 2008 Alay 412 Female
Only
Students aware
of event
Turkey -Classroom
-Women‘s Volleyball
Championships (sport)
-Sanitary towel sponsor
(heavy female skew)
- 3 months post-event Current Study 642 Female
and Male
Spectators in
attendance at
five different
charity-linked
hockey events
Canada -Event-intercepts prior,
during and post events
-Five different charity-
linked hockey games
(sport + cause)
-Four different
charity/cause affiliations
Speed and Thompson (2000) included the following six independent variables in their model:
attitude toward the sponsor, sponsor-event fit, personal liking of event, perceived ubiquity, event
status, and perceived sincerity. Alay (2008) included the same six variables as Speed and
Thompson (2000) and added the following two additional independent variables in her model:
attitude toward the event, and image of the sponsor. The overlap between these three compared
models involves the three variables of fit, sincerity and personal involvement/personal liking
(PL). The observed similarities and differences are discussed by dependent variable.

270
At the INT level, the strengths of the tested models were all within a similar range. Speed and
Thompson (2000) reported the lowest fit (27%) and the current study had the strongest fitting
models for both women (37.5%) and for men (40.4%). Alay‘s (2008) model fit was 30.7%. In
all three studies, FIT and SINC were revealed as significant predictors of INT. The beta values
for FIT were the same (=.30) in Speed and Thompson‘s (2000) model as well as both the
women and men‘s models of the current study. For Alay (2008), FIT made a significant unique
contribution to INT but to a much lesser extend (=.17) than in the contrasted models. The
significant contribution of SINC on INT was recorded in all models. This was the strongest
predictor of INT in Alay‘s (2008) study (=.22). In the current study, SINC was a stronger
predictor of INT in the men‘s model (=.28) than in the women‘s model (=.19). For Speed and
Thompson (2000), SINC was also a significant predictor of INT (=.24) at levels similar to Alay
(2008). The greatest observed difference between models at the response level of INT was the
influence of personal involvement. Only the current study confirmed personal involvement as a
significant contributor to INT. In this case (and at both subsequent levels), PIC was recognized
as uniquely contributing to consumer response. At this level, the influence of PIC was stronger
for women (=.21) than for men (=.19). The other models did not find PL to significantly
contribute to this outcome of INT. PIS did not uniquely contribute to any level of sponsorship
response. Comparative results for the response level of INT are presented in Table 76.
Table 76: Comparison of Models – Sponsor Interest
Speed &Thompson (2000)
Model Fit= 27%
Alay (2008)
Model Fit=30.7%
Current Study
Women's Model Fit=37.5%
Men's Model Fit=40.4%
Variable Beta T p Beta T p Beta T p
FIT 0.30 8.28 0.00 0.168 3.008 0.003
W: .299
M: .301
W: 5.445
M: 5.482
W: .000
M: .000

271
SINC 0.24 6.51 0.00 0.222 3.840 0.000
W: .186
M: .281
W: 3.156
M: 4.804
W: .002
M: .000
Personal
Liking 0.08 -0.06 0.96 -0.09 -1.696 0.091
PIC
W: .213
M: .190
W: 3.547
M: 3.489
W: .000
M: .001
PIS
W: .019
M: .009
W: .362
M: .177
W: .718
M: .859
At the next level of effect (i.e., FAV) the strongest fitting model was Alay‘s (2008) with R2=
47.2%. Speed & Thompson‘s (2000) model (31% fit) and the women‘s model (31.7% fit) of the
current study had comparable model fits while the men‘s model was the weakest fit (29.1%),
though very close to the other reported fit measures. In terms of similarities, all three studies
again confirmed the unique predictive influence of FIT and SINC on FAV. Speed and
Thompson (2000) reported the strongest beta value for fit (=.33), followed by Alay (2008) with
=.29. Although still significant, FIT in the current study did not have as strong an influence on
the outcome of FAV for either women (=.22) or men (=.17). In fact, the level of FAV marked
the lowest contributions of FIT of the three levels in this current study. SINC was the strongest
unique predictor in both Alay‘s (=.35) and the current study‘s models (women‘s model =.26;
men‘s model =.29). For Speed and Thompson (2000) SINC uniquely contributed less to FAV
than in the other reviewed models. Personal involvement is again the main differentiator
between models at this level of FAV. While not significant in the contrasted models, PIC made
a significantly unique contribution to FAV for both women (=.13) and particularly for men
(=.20) of this study. Comparative results for the response level of FAV are presented in
Table 77.

272
Table 77: Comparison of Models – Sponsor Favourability
Speed & Thompson (2000)
Model Fit=31%
Alay (2010)
Model Fit=47.2%
Current Study
Women's Model Fit=31.7%
Men's Model Fit=29.1%
Variable Beta T p Beta T p Beta T p
FIT 0.33 9.41 0.00 0.289 5.944 0.00
W: .219
M: .174
W: 3.816
M: 2.900
W: .000
M: .004
SINC 0.22 6.19 0.00 0.347 6.871 0.00
W: .261
M: .285
W: 4.235
M: 4.414
W: .000
M: .000
Personal
Liking 0.05 1.28 0.20 -0.100 -2.162 0.03
PIC
W: .134
M: .197
W: 2.134
M: 3.321
W: .034
M: .001
PIS
W: -.002
M: .033
W: -.038
M: .625
W: .970
M: .532
At the final level of effect, Alay‘s (2008) model fit best (46.1%). The remaining models were all
very similar in their abilities to explain the variance in USE (32% for Speed & Thompson, 2000;
30.5% for current study‘s women model; and 29.7% for men‘s model). As with both INT and
FAV, FIT continued to be the strongest predictor of the dependent variable for Speed and
Thompson (2000). SINC on the other hand remained the strongest unique predictor of outcomes
for Alay (2008). In the current study‘s models, women‘s USE was most strongly impacted by
FIT (=.28) while SINC (= .23) was the strongest unique contributor to men‘s USE. Only at
the level of USE, did measures of personal involvement become significant in the compared
models. The effects on USE are not as strong as the other reviewed variable but PL was
confirmed as significantly contributing to USE for both Speed and Thompson (=10) and
negatively contributing to USE for Alay (=-.18). Unlike Speed and Thompson (2000), Alay
(2008) found that consumers‘ dislike for an event could be overcome through strong FIT and
SINC and still result in favourable USE. PIC remained a significant contributor in both the

273
women‘s (=.15) and the men‘s models (=.22). Comparative results for the response level of
USE are presented in Table 78.
Table 78: Comparison of Models – Sponsor Use
Speed & Thompson
(2000)
Model Fit=32%
Alay (2008)
Model Fit=46.1%
Current Study
Women's Model Fit=30.5%
Men's Model Fit=29.7%
Variable Beta T p Beta T p Beta T p
FIT 0.32 9.24 0.00 0.28 5.703 0.00
W: .282
M:.192
W: 4.877
M: 3.212
W: .000
M: .001
SINC 0.25 7.08 0.00 0.344 6.748 0.00
W: .264
M: .227
W: 4.249
M: 3.567
W: .000
M: .000
Personal
Liking 0.10 2.37 0.02 -0.183 -3.922 0.00
PIC
W: .152
M: .217
W: 2.393
M: 3.672
W: .017
M: .000
PIS
W: -.013
M: .033
W: -.239
M: .637
W: .811
M: .524
This detailed comparison of models is valuable in situating current research findings. Speed and
Thompson (2000) developed the original model. With a student sample, these researchers
established an important framework and range of findings upon which future studies could
compare. For Speed and Thompson (2000), FIT was the most significant predictor of all levels
of response, with published beta values tightly ranging from = .30 to .33. This seminal study
also acknowledged SINC as a primary determinant of sponsorship response. The range of SINC
beta measures were lower than for FIT (= .22 to .25). PL for Speed and Thompson (2000) was
only significant at the USE level and was acknowledged as a weaker (but significant) predictor
of response.
Alay‘s (2008) follow-up study was important in bringing attention to female consumers‘
response to sponsorship. This work contributed new learning, highlighting that SINC in this all-

274
female investigation took precedence over FIT in predicting all levels of sponsorship outcomes.
Alay‘s (2008) SINC measures were stronger, ranging from = .22 to .35.
The current study further extends the understanding of sponsorship response by building on the
knowledge offered through these earlier efforts. This study is similar to Speed and Thompson
(2000) in supporting the principal importance of FIT at the INT level. The reported beta values
(= .30) at this level are identical between these two studies. Current findings also align well
with Alay (2008) at the FAV level where SINC was identified as the most significant predictor
of FAV in both the women and men‘s models. At the level of USE, the women‘s model of this
study is most reflective of Speed and Thompson‘s (2000) finding that FIT is again the strongest
predictor of USE. The male model at this stage supports Alay‘s (2008) reports of SINC as the
strongest influence on USE.
While findings of FIT and SINC align well with these past studies, this dissertation also offers
new and valuable learning of the sponsorship process. The important role of personal
involvement at all three levels of effect was established in this study of the emerging area of
CRSS. As cause affiliations seep into traditional types of sponsorship, it is expected that
involvement will play an increasingly complex and important role in consumer response to
sponsorship. A review of literature established that involvement is more than merely liking an
event. There is a need to capture a deeper understanding of consumer connections and
motivations of response. Findings from this study suggest that gender support may serve as such
motivation.
In the absence of any similar efforts, gender support was introduced into the sponsorship process
in an attempt to establish significance and encourage further dialogue concerning this variable.

275
Sentiments of gender solidarity were discovered (in earlier hypotheses findings) and are indeed
worthy of future research attention. The potential influence of gender at all stages of the
presented sponsorship process in an important contribution of this research. The following
section will reflect on all reported findings to answer the question of whether gender matters in
the investigation of CRSS effects.
6.1.7 Does Gender Matter in CRSS?
Many efforts are made to identify differences between genders. In the reviewed literature gender
differences were highlighted with regards to physicality, information processing, decision-
making, priorities and interests, sport consumption, charitable giving and gender support. The
original intent of this inquiry was to follow these tendencies of distinguishing genders through
differences. The findings from this research suggest that in the context of CRSS, women and
men may be more similar than they are different. Understanding not only points of difference
but also shared likeliness can assist marketers in developing the most effective strategies to
engage multiple target markets. The answer to the underlining question of whether gender
matters in CRSS is addressed by distinguishing between the significant differences and
similarities revealed through the discussion of hypothesized relationships of CRSS. Table 79
summarizes these findings.
Table 79: Summary of Gender Differences and Similarities
Gender Differences Gender Similarities
Women indicated similar PIC with both cancer
and social causes. Men indicated greater PIC
with cancer causes than social causes. Women
expressed stronger personal involvement with
social causes than did men. (H1)
…men also care about community causes.
Involvement with pink-themed cancer related
events was similar between genders.
However…

276
…women may be more motivated by the social
aspect of the game.
Men and women reported similar involvement
with the sport of hockey. (H2)
…at social-cause linked sporting events,
PI*FIT was greater for women.
Personal involvement had an equally positive
interaction with event-sponsor FIT for both
genders of the all-events, women‘s hockey,
men‘s hockey and cancer-cause samples. (H5b)
Women‘s personal connection to an event
(sport and/or cause) had a stronger influence
on perceptions of sponsor sincerity. (H6b)
…at women‘s hockey events, there was no
significant gender difference in the relationship
between PI and SINC.
…women of the cancer-causes sample,
reported stronger PI*USE than did men.
...at women‘s hockey games, men‘s PI did not
impact the higher orders of effect (FAV and
USE).
The direct influence of personal involvement
on sponsorship response was equally
significant for both genders. (H7b)
Women‘s support of women was stronger than
men‘s support of women and was most
strongly expressed at women‘s sporting events.
(H3)
…men do support women (just not as much as
women support women).
Women‘s support of men was stronger than
men‘s support of men. (H3)
…men do support men (just not as much as
women support men).
The positive influence of sponsor-event fit on
consumer response was similar for both
women and men. (H8b)
However…
However…
However…
However…
However…
However…

277
…FIT did not motivate men‘s response as
strongly at women‘s hockey games as at men‘s
games.
…the impact of sincerity was strongest at the
lower orders of effect (INT, FAV) for men and
at the higher levels of effect for women (FAV,
USE).
For both women and men, sincerity of the
sponsor was an important determinant of
sponsorship response. (H9b and model test)
…noted gender differences did mediate
sponsorship response of both women and men.
…women of the social-causes sample
responded more favourably to all levels of
sponsorship response.
For most samples gender was not a significant
direct predictor of sponsorship response. Mere
gender did not determine sponsorship
response. (H11)
…women‘s interest in the sponsor was more
influenced by their personal involvement with
the cause while men‘s interest levels were
more influenced by perceptions of sincerity.
Sponsorship interest (INT) was most strongly
predicted by perceptions of sponsor-event fit
for both women and men. (model test)
…women‘s favourability toward the sponsor
was more influenced by fit while men‘s
favourability was more greatly impacted by
personal involvement with the cause.
Sponsor sincerity was the strongest predictor
of favourability (FAV) for both women and
men. (model test)
Women‘s intended use of the sponsors‘
offerings was most influenced by fit, followed
closely by perceptions of sponsor sincerity.
Men‘s intended use was predicted mainly by
perceived sincerity followed closely by their
personal involvement with the affiliated cause.
Fit was less significant for men at the highest
order of effect.
However…
However…
However…
However…
However…

278
With regards to the construct of involvement, Table 79 highlights women‘s greater expressed
involvement with social causes while also acknowledging the support conveyed by men. The
similarity in terms of involvement with pink-themed events was also revealed as an interesting
connection between genders. Regarding PIS, women and men were found to have similar
involvement levels with the sport of hockey. Although not significantly confirmed or
purposefully addressed in this investigation, there was some indication that women may be more
motivated by the social aspect of the sport than are men.
Involvement is clearly an important construct in consumer processing of sponsorships. This
variable has a direct and positive interaction with FIT, SINC and all levels of sponsorship
response. Based on the findings of this study, this is generally the case for both women and men.
A few notable differences however were discovered through this research. At social-cause
affiliated events, women‘s PI had a greater impact on perceptions of sponsor-event fit. Women
of the cancer-causes sample also reported stronger interaction of PI*USE. The most consistent
gender difference observed across samples was women‘s greater PI*SINC scores. When women
are connected to a sponsored event, they are more likely to perceive the sponsor as being sincere
in their motives to contribute to the event and affiliated causes. It was also discovered that men‘s
involvement levels did not significantly impact the higher orders of effect (FAV and USE) at
women‘s hockey games. This observation, as previously discussed, may suggest that men
remain most influenced at men‘s sporting events while women‘s responses are less dependent on
the gender of sport being played.
Although men reported strong support for both genders, women‘s expressed support for both
women and men was significantly stronger. Women‘s feelings of gender solidarity surfaced

279
strongest at women‘s hockey games (versus men‘s games). Sponsors seeking to connect with
women‘s passion for gender solidarity could therefore promote affiliations with women‘s events.
Further analysis revealed that although these sentiments of gender solidarity were greatest at
women‘s events, the corresponding impact on sponsorship response was similar at both women‘s
and men‘s games. Women‘s feelings of support and corresponding response to sponsors are
therefore not restricted to female-only events. This finding broadens sponsorship opportunities
for organizations targeting female consumers.
For both genders, perceptions of fit were significant in predicting sponsorship response however
the strength of this influence was diluted for men when attending women‘s games. This finding
supports the earlier proposition that men‘s sporting events may continue to be the best venues for
specifically targeting male consumer segments.
Similar to fit, both genders reported strong correlation between perceived sincerity and
favourable sponsorship response. This impact however was strongest at the lower orders of effect
for men (INT, FAV) and at the higher levels (FAV, USE) for women.
Gender in isolation of other mediating variables, was not a significant predictor of consumer
response for all, but one investigated sample. For the social-causes group, women‘s response at
all levels of effect was significantly greater than men‘s.
When comparing the interaction of all combined variables on sponsorship response, further
similarities and differences were confirmed at the three levels of response. For interest, fit was
the strongest predictor of response for both women and men. Women however were more
influenced by personal involvement at this level while men‘s perceived sincerity was of greater
significance. At the level of favourability, sincerity of the sponsor was the strongest predictor of

280
response for both genders. At this level, fit was of greater importance to women, while personal
involvement with the cause was more meaningful for men. At the highest level of effect, further
differences between the modeled behaviour of women and men were observed. Women‘s
intended use of the sponsors‘ offerings was most influenced by fit, followed closely by
perceptions of sincerity. Conversely, men‘s use was most predicted by their perceptions of
sponsor sincerity followed closely by their personal involvement with the affiliated cause. Fit
was less significant for men at this highest level of effect.
When scrutinizing consumer response by the levels of effect, there is strong overlap between the
priorities of genders and their corresponding response. Fit, sincerity and personal involvement
are all important to both genders at all various levels of response. The only difference is the
magnitude of the influence on specific levels of effect. Promoting any one of these variables will
resonate with both women and men. For instance, while promoting fit may have greater impact
on women‘s use, it is not expected to alienate men in any way. Rather, such a message would
also favourably influence men. This same rationale can be reasonably applied to any of these
three variables of fit, sincerity, and personal involvement.
This section focused on both the differences and similarities of women and men identified in this
investigation of CRSS. Understanding differences allows marketers to be effective in
developing strategies that best resonate with multi-targeted consumers. Recognizing similarities,
however, also allows marketers to be more efficient by combining segments with common needs
and behaviours (Perreault et al., 2007). Based on the examined findings of this study, the impact
of gender is highly contextual and is reflective of complex relationships that are not only based
on difference, but also on equally significant similarities between genders. So, does gender
matter in CRSS? Yes and no.

281
6.2 Contributions
Whetten (1989) proposed that there are seven main factors in assessing theoretical contributions.
These (posed as questions) include: i) what‘s new? ii) so what? iii) why so? iv) well done? v)
done well? vi) why now? and vii) who cares? The contributions of this dissertation are presented
in accordance with these factors.
6.2.1 What‘s New?
This dissertation contributes new and value-added insights to the current understanding of
sponsorship in four principle ways. These include: i) the focus on CRSS and the expanded
platform of reciprocal exchange that this form of sponsorship entails, ii) a more rigorous
understanding of personal involvement as a determinant of sponsorship response, iii) the addition
of gender support as a new variable in understanding consumer behaviour in sponsorship
marketing, and iv) the testing of sponsorship effects from a gendered lens.
The merging of sport and cause is a new and growing reality of the sponsorship industry.
Focusing on this hybrid form of sponsorship revealed a broader portrayal of the reciprocal
relationships among multiple partners of sport and cause. The Diamond of CRSS Goodwill is an
important conceptual contribution that was not initially planned but rather developed through the
integration of literature and primary data gathered through this research. This framework serves
as a foundation for further inquiry and development.
The layering of cause with sport demanded a more robust treatment of the construct of personal
involvement. Earlier concepts of personal liking were broadened in this investigation to capture
consumer connections with elements of both sport and cause. This approach revealed interesting
insights concerning differences but also similarities between the involvement levels of women

282
and men. The disparity between genders regarding cause connections was much less than
originally presumed. Grouping individual event samples by both types of hockey (i.e., women‘s
hockey versus men‘s hockey samples) and by type of affiliated cause (i.e., cancer causes versus
social causes) also revealed intriguing outcomes. These included women‘s greater involvement
and interaction with social (versus cancer) causes and the diluted impact among men at women‘s
(versus men‘s) hockey events. The likeliness of men and women regarding pink-themed
sporting events and the suggestion of pink saturation are particularly relevant in terms of
managerial implications. Women and men‘s common involvement with the sport of hockey
serves as notice that sponsorship properties should no longer be restricted to gender-tied lines.
The inclusion of gender support as a potential influence on sponsorship response is another
significant contribution of this dissertation. As earlier established, notions of gender support and
solidarity were adjusted from varied fields in order to explore how this construct may interact in
the sponsorship process. These preliminary observations of the influence of gender support
throughout the sponsorship process are hoped to initiate further scholarly discourse and research
attention. The scrutiny placed on gender differences for each investigated relationship is another
significant contribution of this dissertation. Important differences were identified and equally
important similarities were revealed. These were summarized (in Table 79) and fully discussed
in section 6.1.7.
6.2.2 So What?
These contributions extend the current understanding of sponsorship effects. The focus on
CRSS, the expanded view of PI, the addition of gender support as an influence in sponsorship
response, and the discovery of both gender differences and similarities ―push back the
boundaries of (sponsorship) knowledge by providing compelling and logical justification for

283
altered views (Whetten, 1989, p.470). The comparison of grouped samples by type of hockey
and type of cause revealed interesting learning from the view of both sport and cause (as noted
above). Distinguishing effects between types of causes is a particularly valuable perspective to
contribute to the sponsorship literature given the growth of cause and cause-affiliated
sponsorships. These findings alter the current understanding and potential practice of
sponsorship.
6.2.3 Why So?
Evidence gathered from a large sample of consumers, combined with a rigorous comparison of
past studies, lends credibility to the findings of this research. By comparing results to thirty-
seven sponsorship effects studies published over the past two decades (i.e., 1992-2013) and
spanning multiple domains (i.e., sport, cause, CRSS), the findings of this research are presented
with a thorough and evolving understanding of sponsorship that effectively discerns the unique
contributions of this work. The evidence and logic presented in this dissertation are intended to
direct future research that will further scrutinize these propositions, extend findings, and advance
theory development (Sutton & Staw, 1995).
6.2.4 Well Done?
The design of this study was guided by past efforts with shared purpose. Specifically, this
research extended the seminal work of Speed and Thompson (2000) that developed a framework
of the determinants of sports sponsorship response. Alay‘s (2008) follow-up study was also
influential as it placed much needed attention on female sponsorship response. Prior to Alay‘s
(2008) work, women‘s response to sponsorship (and even the sponsorship of women‘s sports),
was generally overlooked. Hypotheses stemmed from a broad and recent understanding of

284
sponsorship marketing. Several findings from this study supported published research
conclusions thereby validating the applicability of these relationships in cause-linked sport
settings. These confirmations included: women‘s stronger expressed involvement with
charities/causes, the direct and indirect (via fit and sincerity) influence of personal involvement,
sponsor-event fit, and perceived sincerity of the sponsor on sponsorship response, and the
recognition of sponsorship‘s potential impact at all levels of the hierarchy of effects. Samples
were grouped and compared on multiple levels of inquiry. As with any research, there were
limitations in the methods used in this study. These are acknowledged (in the following section)
and provide sound direction for future research.
6.2.5 Done Well?
Whetten (1989) describes ―done well‖ as work that is ―well written with logical flow, central
ideas that are easily accessible, comprehensive content, and appearance that reflects high
professional standards‖ (p.494). This dissertation is the result of input and direction from a
variety of seasoned scholars, several rounds of improved revisions, and much learning. The
review of literature considers close to three-hundred sources across multiple disciplinary fields in
order to establish, integrate, and build upon the most recent scholarly knowledge. The analysis
of results includes multiple relationships across various sample treatments that generated a vast
amount of findings. In order to effectively present such information, summary tables and figures
are presented throughout this document with thorough consideration and discussion for all
principle findings.

285
6.2.6 Why Now?
Sponsorship has evolved to become an integral part of the marketing mix. Global sponsorship
spending is projected to exceed $55 billion in 2014 (IEG, 2014). Understanding the intricacies
of sponsorship marketing has therefore become increasingly important to both practitioners and
scholars. A review of sponsorship research verified the need for further examination of
consumer response to sponsorship (Gwinner et al., 2009; Koo et al., 2006; McDaniel, 1999;
Speed & Thompsons, 2000). Greater understanding of women‘s role in the sponsorship process
was also highlighted in the reviewed literature (Alay, 2008; Dodds et al., 2014; McDaniel &
Kinney, 1998; McDaniel, 1999; Sack & Fried, 2001; Shani et al., 1992; Shaw & Amis, 2001).
More recently, the merging of sponsorship types (such as sport and cause) and stakeholders has
been identified as an area ripe for new discovery (Lough & Irwin, 2001; Meenaghan et al., 2013;
Pegoraro et al., 2009). Field-based data has also been encouraged (Close & Lacey, 2013;
Gwinner et al., 2009) and Bush et al. (2007) suggested that samples be extended to the Canadian
market. The above stated needs were addressed through this dissertation. The focus of inquiry
was consumer response to sponsorship; data was collected from both women and men allowing
for important gender comparisons; the selection of charity-linked sporting events (both women‘s
and men‘s) offered new insights into the merging of sport and cause sponsorships; and data was
collected through field surveys across three Ontario cities.
6.2.7 Who Cares?
An interdisciplinary approach was followed in the development, implementation, and analysis of
this research. Connecting insights assists in addressing questions that transcend disciplinary
boundaries (Newell, 1992). Understanding the influences, relationships, and effects of CRSS on
consumer response is an inquiry that relies on integrated insights across multiple fields of study.

286
Marketing, gender behaviour, and sport management (including sponsorship), are all fields that
are inherently interdisciplinary (Beetles & Harris, 2005; Bettany et al., 2010; Bell & Blakey,
2010; Cornwell et al., 2005; Mason, 2005; Repko, 2012). The synthesis of literature from these
various fields guided the development of the framework for consumer processing of CRSS that
was tested through this study. Findings from this research are useful to multiple stakeholders
including scholars across various disciplines, corporate sponsors, sport properties, and charitable
organizations. This learning could also be extended to other forms of sponsorship such as arts,
entertainment, festivals, etc.
New understandings of sponsorship marketing are, therefore, of interest to both scholars and
practitioners. The growth of sponsorship research and funding, as well as, gaps in current
knowledge have been cited throughout this dissertation. The significance of these findings in
terms of conceptual and theoretical contributions was noted in the ‗what‘s new‘ section above.
Practical implications are discussed next.
6.3 Implications
Based on the findings of this research, several practical suggestions are proposed. These are
presented in terms of marketing to women through CRSS, marketing to men through CRSS, and
general sponsorship recommendations.
Marketing to Women through CRSS
Sponsor-event fit was the strongest predictor of women‘s response to sponsorship. In order to
establish acceptable perceived fit, sponsors must first align with congruent partners. Congruency
(as previously reviewed) can be based on several factors including functional or image-based fit.
This fit should be clearly articulated to consumers through aggressive sponsorship activation

287
programs. Given women‘s significantly higher involvement with social causes, sponsors should
seek such affiliations when targeting a female audience and ensure that these partnerships are
sufficiently promoted. All sponsor‘s actions must be genuine and transparent in order to
strengthen women‘s perceptions of sponsor sincerity. Although not significantly proven,
findings from this study implied that perceptions of sincerity may impact women mainly at the
higher levels of effect (i.e., affection and behaviour). In this case, sponsor messaging should be
emotionally-based with a possible call-to-action.
Gender solidarity was found to be strong among women. Women seek opportunities to support
women‘s sports and causes. Sponsors can tap into this emotional space by supporting women‘s
sports and causes and genuinely promoting these associations. Having said this, women‘s
response to sponsorship was consistent across both women‘s and men‘s hockey games.
Sponsors should therefore not limit themselves to women‘s sports and causes and can consider
broader opportunities to engage women. Comparable gender involvement with the sport of
hockey reported in this study supports the proposition that women are actively engaged in sports
beyond the traditional female-oriented activities. The risk of pink-saturation was also implied
through the findings of this study. The suggestion made here to sponsors is not to avoid pink-
themed event sponsorship but rather to expand consideration beyond simply stereotypical female
events and sports. Resonance can be derived from sources other than gender. For instance,
during the collection of data for this study, several men anecdotally commented on the fact that
they actively support breast cancer research because family member have suffered from this
disease.

288
Marketing to Men through CRSS
Given the many similarities confirmed between genders, the fit, sincerity, and activation related
suggestions (made above) for marketing to women are equally applicable to a male audience.
One noted difference is that the effect of sincerity on men was suggested to be strongest at the
level of cognition. Given this finding, a more rational communication approach could be used to
establish sincerity with men. Men indicated significantly greater involvement with cancer-cause
affiliated events (versus social-causes). Sponsors seeking to engage a male audience should
therefore prioritize cancer causes over social causes. This study was limited in its consideration
of only two broad types of causes. There are many other causes (such as education, animal
welfare, environment, etc.) that are available to sponsors and event organizers for the purpose of
partnership. Male respondents reported strong involvement with both cause and sport. Sponsors
of charity-linked hockey events can therefore leverage either of these properties in their
promotional efforts. The platform for potential consumer engagement is broadened when
multiple properties come together. Given that men‘s reported involvement with sport was higher
than cause, messaging priority for a male audience could first be given to the sponsored sport.
In this study, the interaction of sponsorship predictors was somewhat diluted for men when
attending female hockey games. While it was recommended that targeting women through
sponsorship not be confined by gender lines, in the case of men, continuing to sponsor traditional
male (or gender neutral) sports may remain most effective.
General Recommendations
Regardless of gender, sponsors should connect with their targeted consumers through points of
relevance. The merging of sport and cause effectively expands the platform for consumer

289
engagement. Meaningful connections can be made through affiliations with sport and/or through
cause. Marketers must understand their consumers at deeper levels than simply gender. It is
essential to recognize and respond to significant gender differences in order to effectively satisfy
the needs of different consumer segments. Equally important is the need to seek and accept
gender similarities in developing common marketing strategies.
6.4 Limitations of this Study
Limitations of this current study should be kept in mind when interpreting results. Given that
data was gathered at five different hockey events linked to a variety of causes, demographic
characteristics varied between event samples. These differences (mainly in age and number of
dependent children) were analyzed and determined to have a minimal impact on reported
findings. These demographic variations across samples remain however a limitation of this
study. Whitten (1989) cautioned that ―meaning is derived from context‖ (p.492). In order to
accurately capture research results, we must first acknowledge where and when data was
collected. In the case of this dissertation, the common denominator across all tested venues was
cause-linked hockey events. The inclusion of both men‘s and women‘s hockey allowed for
interesting comparisons that contributed to gender findings. The consistency of hockey however
did restrict findings to this one sport. Geographic coverage spanned three different Canadian
cities however these were all Ontario-based. Given this one sport and one province coverage,
findings cannot be generalized to other sports or geographic markets without further
collaborating research. The number of affiliated causes provided more breadth than did sport by
including four different charitable organizations. These were grouped by themes of cancer and
social-related causes for the purpose of data analysis and discussion. Again, this treatment of
samples allowed for insightful comparisons and new discoveries but findings are limited to these

290
specific types of causes and are unable to be extended to charitable causes beyond this particular
scope of inquiry.
The inclusion of cause-related issues can elicit social desirability response bias when relying on
self-reported data (Hyllegard et al., 2011). A bias such as this could inflate favourable response.
Field based studies also introduce uncontrollable factors that can influence respondents. For
instance, at Event #4 the research table was set up in a high traffic entrance that was very cold.
In this setting respondents appeared rushed to complete the survey. In comparison, at Event #5,
the research station was located near the concession area where long waiting lines may have
encouraged more thoughtful response. Gender support was also treated in more of an
exploratory fashion as pre-existing sponsorship measurements were non-existing. Gender
solidarity was examined strictly from the female perspective and did not consider this same
dynamic from a male standpoint. As is common practice in the sponsorship literature, the
behavioural measures were based on intentions and not actual behaviour. It is acknowledged
that there are many situations in which intentions do not accurately predict actual behaviour.
6.5 Direction for Future Research
The framework originally developed by Speed and Thompson (2000) and later extended by Alay
(2008), has been further advanced through this study of CRSS and gender comparisons. The
scope of this investigation was purposely broad in order to extend the boundaries of sponsorship
knowledge. This included measuring the influence of multiple consumer and sponsorship
variables (gender, gender support, involvement with sport, involvement with cause, sponsor-
event fit, and perceived sincerity of the sponsor) on three levels of sponsorship response
(interest, favourability, and use), with four levels of sample analysis (i.e., all events, type of

291
hockey, type of cause, event specific). As a follow-up to this study, a tighter scope of particular
elements of this model could offer additional depth of understanding. For instance, the Diamond
of CRSS Goodwill framework could be empirically verified to validate the suggested
relationships and exchanges between stakeholders in cause-linked sport sponsorship
arrangements.
Gender support as an influence in consumer processing of sponsorship was introduced in this
study. Further efforts are needed to better understand the role of this variable from the
perspective of both genders. Sources of gender solidarity (sport, cause, or other) could also be
explored and measured in terms of influence in the sponsorship process. Consumer response
measured along the hierarchy of effects could also be re-examined in terms of gender differences
to substantiate suggestions that women‘s engagement may be more affective while men‘s may be
more cognitive.
The construct of involvement could also be further extended to capture the emotional
involvement of consumers. This would be of particular interest where causes are involved and
could be differentiated by gender and types of cause. Chang (2012) measured emotional
involvement with cause with the following three statements; i) ―I felt warm-hearted thinking
about the event‖; ii) ―I was moved thinking about the event‖; and iii) ―I became emotional
thinking about the event‖ (p.327). The Psychological Continuum Model developed by Funk and
James (2001) could also be used to measure levels of sport (or cause) consumer connection along
the continuum of awareness, attraction, attachment or allegiance.
The extent to which these findings are applicable to other sports, causes, and geographical
markets should also be empirically examined. These could be isolated by gender (i.e., female

292
sports and causes versus male sports and causes) or could integrate more gender-neutral
properties. Cause considerations should extend beyond the two broad types (i.e., cancer and
social) considered in this study. Piper & Sylke (2007) found that women had greater support for
causes that involved animals, education and the elderly while men preferred to support sports
and recreational causes. Consideration for these and other topical causes (such as the
environment or mental health) would be of significant value in advancing cause-related
sponsorship knowledge.
The growth of participant-based CRSS events should also be considered in measuring consumer
response to sponsorship. Charitable organizations are increasingly relying on sport-based events
to raise awareness and funds for their respective causes. Several recent studies have focused on
these important events by examining motivations for participation (Bennett et al., 2007; Taylor
& Shanka, 2008; Wood et al., 2010). These efforts have confirmed that involvement is a
powerful influence in these settings. The current study sampled spectators of charity-linked
sporting events. Future research could extend findings to participant-based events in order to
examine differences in involvement levels and the corresponding impact on sponsorship
response. Women are particularly drawn to sport-based fundraising events (Bennett et al., 2007)
and therefore gender comparisons would also be insightful in such settings. For sponsors of
participant-based charity-linked sporting events, understanding the motives of participation
would also be helpful in developing promotional messaging. For instance, if men are more
motivated by the sport, and women by the cause, then distinct marketing messaging would be
required to effectively engage the sponsor‘s particular consumer target.
Future research could also consider consumer response to the non-profit partner. Bennett, Kim,
and Loken (2013) recently discovered that ―there are caveats to the win-win‖ (p.297) generally

293
expected in the merging of sport and cause sponsorships. Consumers‘ willingness to individually
donate to non-profit partners was diminished by the presence of corporate sponsorship (Bennett
et al., 2013). Gender comparisons in this context would be interesting as would the measurement
of the simultaneous impact on perceptions of both the non-profit and the sponsor. These findings
would enhance the understanding and applicability of the Diamond of CRSS Goodwill by
extending consideration to both positive and negative exchange.
Sponsorship response can be impacted by many variables beyond the current scope of
investigation. Among others, these could include further demographic variables, sponsorship
portfolios, duration of partnerships, competitive activity, or sponsorship activation. Sponsorship
activation was commonly noted throughout this dissertation as a key factor in sponsorship
response. The addition of this variable to the current predictors of sponsorship outcomes would
inject an additional level of understanding. In the current data collection, several participants
commented on a lack of awareness of the affiliated charity. Formally measuring consumers‘
knowledge of affiliated partners would help in contextualizing responses. For instance,
consumers could be asked if they feel that they were well informed about the cause linked to the
attended sport event. Activation measures could also distinguish the impact of sponsor-oriented
and charity-oriented messaging on consumer perceptions of sponsor sincerity.

294
References
Aaker, D. A. (1996). Measuring brand equity across products and markets. California
Management Review, 38(3), 102-120.
Adams, R. (2003). Leagues work to build diverse crowds. Street & Smith’s SportsBusiness
Journal, 6(8), 19-24.
Aiken, D., & Sukhdial, A. (2004). Exploring the Old School Concept: Adding Definition to a"
New" Market Segmentation Dimension. Sport Marketing Quarterly, 13(2).
Alay, S. (2008). Female consumers' evaluations of sponsorship and their response to sponsorship.
South African Journal for Research in Sport, Physical Education & Recreation (SAJR
SPER), 30(2), 15-29.
Alay, S. (2010). Sponsorship evaluation scale (SES): a validity and reliability study. South
African Journal for Research in Sport, Physical Education & Recreation (SAJR SPER),
32(2), 1-12.
Alexandris, K., & Tsiotsou, R. H. (2012). Testing a Hierarchy of Effects Model of Sponsorship
Effectiveness. Journal Of Sport Management, 26(5), 363-378.
Ali, C., Cornwell, T. B., Nguyen, D., & Coote, L. (2006). Exploring the usefulness of a
consumer activity index in the sponsorship-linked marketing context. International Journal
of Sports Marketing & Sponsorship, 7(2), 115-124.
Amis, J., Slack, T., & Berrett, T. (1999). Sport sponsorship as distinctive competence. European
Journal of Marketing, 33(3/4), 250-272.
Amis, J., Pant, N., & Slack, T. (1997). Achieving a sustainable competitive advantage: A
resource-based view of sport sponsorship. Journal of Sport Management, 11(1), 80.

295
Armstrong, K. L. (2001). Self and product image congruency among male and female minor
league ice hockey spectators: Implications for women's consumption of professional men's
sports. Women in Sport & Physical Activity Journal, 10(2), 1-27.
Associate Press (2013). Danica Patrick win Daytona 500 pole. Retrieved from
http://espn.go.com/racing/nascar/cup/story/_/id/8956961/danica-patrick-first-woman-win-
daytona-500-pole
Bal, C., Quester, P., & Plewa, C. (2009). Event-related emotions: A key metric to assess
sponsorship effectiveness. Journal of Sponsorship, 2(4), 367-378.
Barletta, M. (2006). Marketing to women; how to increase your share of the world's largest
market (Second Edition). Chicago: Dearborn.
Bateman, C., & Valentine, S. (2010). Investigating the effects of gender on consumers’ moral
philosophies and ethical intentions. ( No. 95).Springer Science & Business Media B.V. doi:
10.1007/s10551-010-0386-4
Becker-Olsen, K., & Simmons, C. J. (2002). When do social sponsorships enhance or dilute
equity? Fit, message source, and the persistence of effects. Advances in Consumer Research,
29(1), 287-289.
Beetles, A., & Harris, L. (2005). Marketing, gender and feminism: A synthesis and research
agenda. Marketing Review, 5(3), 205-231.
Bell, B., & Blakey, P. (2010). Do boys and girls go out to play? Women's football and social
marketing at Euro 2005. International Journal of Sport Management & Marketing, 7(3), 2-2.
Bennett, G., Ferreira, M., Lee, J., & Polite, F. (2009). The role of involvement in sports and sport
spectatorship in sponsor's brand use: The case of mountain dew and action sports
sponsorship. Sport Marketing Quarterly, 18(1), 14-24.

296
Bennett, R., & Gabriel, H. (1999). Charity involvement and customer preference for charity
brands. Journal of Brand Management, 7(1), 49-66.
Bennett, C. M., Kim, H., & Loken, B. (2013). Corporate sponsorships may hurt nonprofits:
Understanding their effects on charitable giving. Journal Of Consumer Psychology (Elsevier
Science), 23(3), 288-300. doi:10.1016/j.jcps.2012.10.010
Bennett, R., Mousley, W., Kitchin, P., & Ali-Choudhury, R. (2007). Motivations for
participating in charity-affiliated sporting events. Journal of Customer Behaviour, 6(2), 155-
178. doi: 10.1362/147539207X223375
Berger, I. E., Cunningham, P. H., & Kozinets, R. V. (1999). Consumer persuasion through
cause-related advertising. Advances in Consumer Research, 26(1), 491-497.
Bernardo, M. (2011). Implementing sponsorship initiatives and a national youth programme in a
not-for-profit organisation. Journal of Sponsorship, 4(2), 116-123.
Bettany, S., Dobscha, S., O'Malley, L., & Prothero, A. (2010). Moving beyond binary opposition:
Exploring the tapestry of gender in consumer research and marketing. Marketing Theory,
10(1), 3-28. doi: 10.1177/1470593109355244
Blair, R. (1981). A Reaction to ―Consequences of Failure to Meet Assumptions Underlying the
Fixed Effects Analysis of Variance and Covariance‖. Review of Educational Research,
51(4), 499-507.
Brace-Govan, J. (2010). Representations of women‘s active embodiment and men‘s ritualized
visibility in sport. Marketing Theory, 10(4), 369-396. doi: 10.1177/1470593110382825
Briggs, S. R., & Cheek, J. M. (1986). The role of factor analysis in the development and
evaluation of personality scales. Journal of Personality, 54(1), 106. doi:10.1111/1467-
6494.ep8970518
Broderick, A., Jogi, A., & Garry, T. (2003). Tickled Pink: The Personal Meaning of Cause
Related Marketing for Customers. Journal of Marketing Management, 19(5/6), 583-610.

297
Burton, N., & Chadwick, S. (2009). Ambush marketing in sport: An analysis of sponsorship
protection means and counter-ambush measures. Journal of Sponsorship, 2(4), 303-315.
Burton, R., & O'Reilly, N. (2011). Understanding why sponsorship continues to grow. Street &
Smith's Sportsbusiness Journal, 13(38), 20-20.
Bush, A. J., Martin, C. A., & Bush, V. D. (2004). Sports celebrity influence on the behavioral
intentions of generation Y. Journal of Advertising Research, 44(1), 108-118.
Bush, T. (1997). Gender differences in cognitive functioning: A literature review. Cyber-Journal
of Sport Marketing, 1(1)
Bush, V. D., Bush, A. J., Shannahan, K. L. J., & Dupuis, R. J. (2007). Segmenting markets based
on sports orientation: An investigation of gender, race and behavioral intentions. Marketing
Management Journal, 17(1), 39-50.
Cahill, J., & Meenaghan, T. (2013). Sponsorship at O2-'The Belief that Repaid'. Psychology &
Marketing, 30(5), 431-443. doi:10.1002/mar.20617
Canadian Collegiate Athletic Association (CCAA). (2011). Retrieved from http://www.ccaa.ca/
Canadian Fitness & Lifestyle Research Institute (CFLRI). (2009). 2008 physical activity facts
and figures; sport participation in Canada.
Canadian Intercollegiate Sport (CIS). (2011). 2010-2011 AFA report-by sport.
Canadian Olympic Committee. (2013). 2014 Sochi. Retrieved from
http://olympic.ca/games/2014-sochi/
Carrigan, M., & Attalla, A. (2001). The myth of the ethical consumer -- do ethics matter in
purchase behaviour? Journal of Consumer Marketing, 18(7), 560-577.
Catalyst. Women's earnings and income. Retrieved August 8, 2011, from
http://www.catalyst.org/publication/217/womens-earnings-and-income

298
Chadwick, S., & Thwaites, D. (2004). Advances in the management of sport sponsorship: Fact or
fiction? Evidence from English professional soccer. Journal of General Management, 30(1),
39-60.
Chadwick, S., & Thwaites, D. (2005). Managing sport sponsorship programs: Lessons from a
critical assessment of English soccer. Journal of Advertising Research, 45(3), 328-338.
Chang, C. (2012). The effectiveness of advertising that leverages sponsorship and cause-related
marketing: A contingency model. International Journal of Advertising, 31(2), 317-338. doi:
10.2501/IJA-31-2-317-337
Chavanat, N., Martinent, G., & Ferrand, A. (2009). Sponsor and sponsees interactions: Effects on
consumers' perceptions of brand image, brand attachment, and purchasing intention. Journal
of Sport Management, 23(5), 644-670.
Chavanat, N., Martinent, G., & Ferrand, A. (2010). Brand images causal relationships in a
multiple sport event sponsorship context: Developing brand value through association with
sponsees. European Sport Management Quarterly, 10(1), 49-74.
Chien, P. M., Cornwell, T. B., & Pappu, R. (2011). Sponsorship portfolio as a brand-image
creation strategy. Journal of Business Research, 64(2), 142-149. doi:
10.1016/j.jbusres.2010.02.010
Choi, J. A., Stotlar, D. K., & Park, S. R. (2006). Visual ethnography of on-site sport sponsorship
activation: LG action sports championship Fitness Information Technology, Inc.
Clark, J. S., Apostolopoulou, A., & Gladden, J. M. (2009). Real women watch football: Gender
differences in the consumption of the NFL super bowl broadcast. Journal of Promotion
Management, 15(1), 165-183. doi: 10.1080/10496490902837510
Close, A. G., Finney, R. Z., Lacey, R. Z., & Sneath, J. Z. (2006). Engaging the consumer through
event marketing: Linking attendees with the sponsor, community, and brand. Journal of
Advertising Research, 46(4), 420-433.

299
Close, A. G., & Lacey, R. (2013). Fit Matters? Asymmetrical Impact for Effectiveness on
Sponsors and Event Marketers. Sport Marketing Quarterly, 22(2), 71-82.
Cohen, J.W. (1988). Statistical power analysis for the behavioral sciences (2nd edn.). Hillsdale,
NJ: Lawrence Erlbaum Associates.
Cohen, J., & Cohen, P. (1983). Applied multiple regression/correlation analysis for the
behavioral sciences. Hillsdale, NJ: Erlbaum.
Cone LLC. (2010a). 2010 Cone Cause Evolution Study. Boston, MA: Cone LLC. Retrieved from
http://www.conecomm.com/stuff/contentmgr/files/0/6bc819050a7914fc99b99c205493d8bc/
files/2010_cone_cause_evolution_study_report.pdf
Cone LLC (2010b). 2010 Cone Nonprofit Marketing Trend Tracker. Boston, MA: Cone LLC.
Retrieved from http://www.conecomm.com/2010-cone-nonprofit-marketing-trend-tracker
Copeland, R., Frisby, W., & McCarville, R. (1996). Understanding the sport sponsorship process
from a corporate perspective. Journal of Sport Management, 10(1), 32-48.
Coppetti, C., Wentzel, D., Tomczak, T., & Henkel, S. (2009). Improving incongruent
sponsorships through articulation of the sponsorship and audience participation. Journal of
Marketing Communications, 15(1), 17-34. doi: 10.1080/13527260802012788
Cornwell, T. B. (1995). Sponsorship-linked marketing development. Sport Marketing Quarterly,
4(4), 13-24.
Cornwell, T. B., & Coote, L. V. (2005). Corporate sponsorship of a cause: The role of
identification in purchase intent. Journal of Business Research, 58(3), 268-276. doi:
10.1016/S0148-2963(03)00135-8.
Cornwell, T., & Humphreys, M. S. (2013). Memory for Sponsorship Relationships: A Critical
Juncture in Thinking. Psychology & Marketing, 30(5), 394-407. doi:10.1002/mar.20614

300
Cornwell, T. B., & Maignan, I. (1998). An international review of sponsorship research. Journal
of Advertising, 27(1), 1-21.
Cornwell, T. B., Pruitt, S. W., & Van Ness, R. (2001). The value of winning in motorsports:
Sponsorship-linked marketing. Journal of Advertising Research, 41(1), 17-31.
Cornwell, T. B., Weeks, C. S., & Roy, D. P. (2005). Sponsorship-linked marketing: Opening the
black box. Journal of Advertising, 34(2), 21-42.
Crane, F., Kerin, R., Hartley, S., & Rudelius, W. (2014). Marketing, Nine Canadian edition.
McGraw-Hill Ryerson.
Crimmins, J., & Horn, M. (1996). Sponsorship: From management ego trip to marketing success.
Journal of Advertising Research, 36(4), 11-21.
Crompton, J. L. (2004). Conceptualization and alternate operationalizations of the measurement
of sponsorship effectiveness in sport. Leisure Studies, 23(3), 267-281. doi:
10.1080/0261436042000183695
Cunningham, J., & Roberts, P. (2006). What women want. Brand Strategy, (208), 40-41.
Dann, S. (2010). Redefining social marketing with contemporary commercial marketing
definitions. Journal of Business Research, 63(2), 147-153. doi:
10.1016/j.jbusres.2009.02.013
Darley, W. K., & Smith, R. E. (1995). Gender differences in information processing strategies:
An empirical test of the selectivity model in advertising response. Journal of Advertising,
24(1), 41-56.
Davies, F., & Tsiantas, G. (2008). Selection of leveraging strategies by national Olympic
sponsors: A proposed model. International Journal of Sports Marketing & Sponsorship,
9(4), 271-289.

301
Davis, J., A. (2012). The Olympic Games effect: How sports marketing builds strong brands
(Second ed.). Singapore: John Wiley & Sons.
Deane, J., Smith, G., & Adams, A. (2003). Sports sponsorship and brand personality -- the Ryder
cup team and IBM. International Journal of Sports Marketing & Sponsorship, 5(3), 193-208.
DeCarlo, L. T. (1997). On the meaning and use of kurtosis. Psychological Methods, 2(3), 292-
307. doi:10.1037/1082-989X.2.3.292
DeGaris, L., West, C., & Dodds, M. (2009). Leveraging and activating NASCAR sponsorships
with NASCAR-linked sales promotions. Journal of Sponsorship, 3(1), 88-97.
DeVellis, R.F. (2003). Scale development: Theory and applications (2nd edn.). Thousand Oaks,
California: Sage.
Dietz-Uhler, B. B., & Harrick, E. A., End, C., Jacquemotte, L. (2000). Sex differences in sport
fan behavior and reasons for being a sport fan. Journal of Sport Behavior, 23(3), 219-231.
Dodds, M., DeGaris, L., & Perricone, D. (2014). The influence of gender on baseball
sponsorship activation tactics. Journal of Brand Strategy, 3(1), 71-79.
Doherty, A., & Murray, M. (2007). The strategic sponsorship process in a non-profit sport
organization. Sport Marketing Quarterly, 16(1), 49-59.
Donahay, B., & Rosenberger III, P. J. (2007). Using brand personality to measure the
effectiveness of image transfer in formula one racing. Marketing Bulletin, 18, 1-15.
Donnelly, P., Norman, M., & Kidd, B. (2013). Gender Equity in Canadian Interuniversity Sport:
A Biennial Report (No 2). Toronto: Centre for Sport Policy Studies (Faculty of Kinesiology
and Physical Education, University of Toronto).
Eccles, J. S., & Harold, R. D. (1991). Gender differences in sport involvement: Applying the
Eccles' expectancy-value model. Journal of Applied Sport Psychology, 3(1), 7-35.

302
Edwards, S. M., & La Ferle, C. (2009). Does gender impact the perception of negative
information related to celebrity endorsers? Journal of Promotion Management, 15(1), 22-35.
doi: 10.1080/10496490902837940
Fahy, J., Farrelly, F., & Quester, P. (2004). Competitive advantage through sponsorship: A
conceptual model and research propositions. European Journal of Marketing, 38(8), 1013-
1030. doi: 10.1108/03090560410539140
Farrelly, F. (2010). Not playing the game: Why sport sponsorship relationships break down.
Journal of Sport Management, 24(3), 319-337.
Farrelly, F. J., Quester, P. G., & Burton, R. (1997). Integrating sports sponsorship into the
corporate marketing function: an international comparative study. International Marketing
Review, 14(3), 170-182.
Farrelly, F., & Quester, P. (2005). Investigation large-scale sponsorship relationships as co-
marketing alliances. Business Horizons, 48(1), 55-62. doi: 10.1016/j.bushor.2004.10.003
Farrelly, F., Quester, P., & Burton, R. (2006). Changes in sponsorship value: Competencies and
capabilities of successful sponsorship relationships. Industrial Marketing Management,
35(8), 1016-1026. doi: 10.1016/j.indmarman.2006.05.006
Filo, K., Funk, D., & O'Brien, D. (2010). The antecedents and outcomes of attachment and
sponsor image within charity sport events. Journal of Sport Management, 24(6), 623-648.
Fink, J. S., Trail, G. T., & Anderson, D. F. (2002). Environmental Factors Associated With
Spectator Attendance and Sport Consumption Behavior: Gender and Team Differences.
Sport Marketing Quarterly, 11(1).
Fischer, E., & Arnold, S. J. (1994). Sex, gender identity, gender role attitudes, and consumer
behavior. Psychology & Marketing, 11(2), 163-182.

303
Fleck, N. D., & Quester, P. (2007). Birds of a feather flock together...definition, role and
measure of congruence: An application to sponsorship. Psychology & Marketing, 24(11),
975-1000.
Fortunato, J. A. (2013). Sponsorship activation and social responsibility: How MasterCard and
Major League Baseball partner to Stand Up To Cancer. Journal of Brand Strategy, 2(3),
300-311.
Funk, D. C., & James, J. (2001). The psychological continuum model: A conceptual framework
for understanding an individual's psychological connection to sport. Sport Management
Review (Sport Management Association of Australia & New Zealand), 4(2), 119-150.
Funk, D. C., Mahony, D. F., Nakazawa, M., & Hirakawa, S. (2001). Development of the Sports
Interest Inventory(SII): Implications for measuring unique consumer motives at sporting
events. International Journal of Sports Marketing & Sponsorship, 3.
Funk, D. C., Ridinger, L. L., & Moorman, A. M. (2003). Understanding consumer support:
extending the Sport Interest Inventory (SII) to examine individual differences among
women's professional sport consumers. Sport Management Review (Sport Management
Association of Australia & New Zealand), 6(1), 1-31.
Funk, D. C., Ridinger, L. L., & Moorman, A. M. (2004). Exploring origins of involvement:
understanding the relationship between consumer motives and involvement with
professional sport teams. Leisure Sciences, 26(1), 35-61.
Geue, M., & Plewa, C. (2010). Cause sponsorship: A study on congruence, attribution and
corporate social responsibility. Journal of Sponsorship, 3(3), 228-241.
Glass, G. V., Peckham, P. D., & Sanders, J. R. (1972). Consequences of failure to meet
assumptions underlying the fixed effects analyses of variance and covariance. Review of
educational research, 237-288.
Goldman, R., Heath, D., & Smith, S. L. (1991). Commodity feminism. Critical Studies in Mass
Communication, 8(3), 333-351.

304
Goodrich, K. (2014). The gender gap: Brain-processing differences between the sexes shape
attitudes about online advertising. Journal of Advertising Research, 54(1), 32-43.
Grady, J., McKelvey, S., & Bernthal, M. J. (2010). From Beijing 2008 to London 2012:
Examining event-specific Olympic legislation vis-à-vis the rights and interests of
stakeholders. Journal of Sponsorship, 3(2), 144-156.
Granot, E., Greene, H., & Brashear, T. G. (2010). Female consumers: Decision-making in brand-
driven retail. Journal of Business Research, 63(8), 801-808. doi:
10.1016/j.jbusres.2010.04.006
Green, R., & Antoine, G. (2011). Do female consumers have higher ethical perceptions of
marketing? Global Journal of Business Research (GJBR), 5(1), 85-100.
Grohmann, B. (2009). Gender dimensions of brand personality. Journal of Marketing Research
(JMR), 46(1), 105-119. doi: 10.1509/jmkr.46.1.105
Grohs, R., & Reisinger, H. (2005). Image transfer in sports sponsorships: An assessment of
moderating effects. International Journal of Sports Marketing & Sponsorship, 7(1), 42-48.
Grohs, R., Wagner, U., & Vsetecka, S. (2004). Assessing the effectiveness of sport sponsorships-
-an empirical examination. Schmalenbach Business Review (SBR), 56(2), 119-138.
Gwinner, K. (1997). A model of image creation and image transfer in event sponsorship.
International Marketing Review, 14(2), 145.
Gwinner, K. P., & Eaton, J. (1999). Building brand image through event sponsorship: The role of
image transfer. Journal of Advertising, 28(4), 47-57.
Gwinner, K., & Bennett, G. (2008). The impact of brand cohesiveness and sport identification on
brand fit in a sponsorship context. Journal of Sport Management, 22(4), 410-426.

305
Gwinner, K. P., Larson, B. V., & Swanson, S. R. (2009). Image transfer in corporate event
sponsorship: Assessing the impact of team identification and event-sponsor fit. International
Journal of Management & Marketing Research (IJMMR), 2(1), 1-15.
Gwinner, K., & Swanson, S. R. (2003). A model of fan identification: antecedents and
sponsorship outcomes. Journal of Services Marketing, 17(3), 275-294.
Hair, J., Celsi, M., Ortinau, D., & Bush, R. (2013). Essentials of Marketing Research (3rd
edn.).
New York, NY: McGraw-Hill.
Hajjat, M. M. (2003). Effect of cause-related marketing on attitudes and purchase intentions: The
moderating role of cause involvement and donation size. Journal of Nonprofit & Public
Sector Marketing, 11(1), 93.
Haley, E. (1996). Exploring the construct of organization as source: Consumers' understandings
of organizational sponsorship of advocacy advertising. Journal of Advertising, 25(2), 19-35.
Harvey, B. (2001). Measuring the effects of sponsorships. Journal of Advertising Research,
41(1), 59-65.
Harvey, J., & Strahilevitz, M. (2009). The power of pink: cause-related marketing and the impact
on breast cancer. Journal Of The American College Of Radiology: JACR, 6(1), 26-32.
doi:10.1016/j.jacr.2008.07.010
Haslanger, S. Tuana, N., & O‘Connor, P. (2011). Topics in Feminism. The Stanford
Encyclopaedia of Philosophy (Summer 2011 Edition), Retrieved from
http://plato.stanford.edu/entries/feminism-topics/#WhaFem
Hickman, T. M., & Lawrence, K. E. (2010). The halo effect of goodwill sponsorship versus the
pitchfork effect of supporting the enemy. Journal of Sponsorship, 3(3), 265-276.
Howard, E. (2010). Pink truck ads: Second-wave feminism and gendered marketing. Journal of
Women's History, 22(4), 137-161.

306
Hu, Y., Xu, Q., Li, K., Zhu, H., Qi, R., Zhang, Z., & Lu, G. (2013). Gender Differences of Brain
Glucose Metabolic Networks Revealed by FDG-PET: Evidence from a Large Cohort of 400
Young Adults. Plos ONE, 8(12), 1-9. doi:10.1371/journal.pone.0083821
Hyllegard, K. H., Yan, R., Ogle, J. P., & Attmann, J. (2011). The influence of gender, social
cause, charitable support, and message appeal on gen Y's responses to cause-related
marketing. Journal of Marketing Management, 27(1), 100-123. doi:
10.1080/02672571003683755
IEG (2011). Decision-makers survey: Sponsors favor activation budgets in 2011. Retrieved May
5, 2011, from
https://www.sponsorship.com/User/Login.aspx?ReturnUrl=%2fiegsr%2f2011%2f03%2f14
%2fDecision-maker-Survey--Sponsors-Favor-Activation-
B.aspx&Access=0&Reason=NoSub
IEG (2011). Sponsorship Spending: 2010 proves better than expected; bigger gains set for
2011. Retrieved May 5, 2011, from http://www.sponsorship.com/About-IEG/Press-
Room/Sponsorship-Spending--2010-Proves-Better-Than-Expe.aspx
IEG (2012). Economic uncertainty to slow sponsorship growth in 2012. Retrieved July 4, 2012,
from
https://www.sponsorship.com/User/Login.aspx?ReturnUrl=%2fiegsr%2f2012%2f01%2f03
%2fEconomic-Uncertainty-To-Slow-Sponsorship-Growth-
In.aspx&Access=0&Reason=NoSub
IEG Sponsorship Report (2009). Sponsorship spending receded for first time; better days ahead.
Retrieved May 5, 2011, from http://www.sponsorship.com/iegsr/2009/12/21/Sponsorship-
Spending-Recedes-For-First-Time;-Bette.aspx
IEG Sponsorship Report (2013). 2013 Sponsorship outlook: spending increase is double-edged
sword. Retrieved January 9, 2013, from
http://www.sponsorship.com/IEGSR/2013/01/07/2013-Sponsorship-Outlook--Spending-
Increase-Is-Dou.aspx

307
IEG Sponsorship Report (2014). Sponsorship spending growth slows in North America as
marketers eye newer media and marketing options. Retrieved January 9, 2014, from
http://www.sponsorship.com/iegsr/2014/01/07/Sponsorship-Spending-Growth-Slows-In-
North-America.aspx
Ifedi, F. (2008). Sport Participation in Canada, 2005.
International Olympic Committee. (2008). Progress report: From Marrakech to the dead sea:
Tangible progress for women in sport.
International Olympic Committee. (2013). Women in the Olympic Movement. Retrieved from
http://www.olympic.org/Documents/Reference_documents_Factsheets/Women_in_Olympic
_Movement.pdf
Irwin, R. L., Lachowetz, T., Cornwell, T. B., & Clark, J. S. (2003). Cause-related sport
sponsorship: An assessment of spectator beliefs, attitudes, and behavioral intentions. Sport
Marketing Quarterly, 12(3), 131-139.
Ito, P. K. (1980). Robustness of ANOVA and MANOVA test procedures. Handbook of statistics.
Vol. 6, pp. 199-236. Amsterdam: North-Holland.
Jagre, E., Watson, J. J., & Watson, J. G. (2001). Sponsorship and congruity theory: A theoretical
framework for explaining consumer attitude and recall or event sponsorship. Advances in
Consumer Research, 28(1), 439-445.
James, J. D., & Ridinger, L. L. (2002). Female and male sport fans: A comparison of sport
consumption motives. Journal of Sport Behavior, 25(3).
Javalgi, R. G., Traylor, M. B., Gross, A. C., & Lampman, E. (1994). Awareness of sponsorship
and corporate image: An empirical investigation. Journal of Advertising, 23(4), 47-58.
Johar, G. V., & Pham, M. T. (1999). Relatedness, prominence, and constructive sponsor
identification. Journal of Marketing Research (JMR), 36(3), 299-312.

308
Johne, M. (2003). What women want. CMA Management, 77(8), 19-21.
Johnson, L., & Learned, A. (2004). Don't think pink. New York: AMACOM.
Johnston, M. A. (2010). Illuminating the dark corners of sponsorship decision making. Journal
of Sponsorship, 3(4), 365-378.
Kahle, L. R., Aiken, D., Dalakas, V., & Duncan, M. (2003). Men's versus women's collegiate
basketball customers: Attitudinal favorableness and the environment. International Journal
of Sports Marketing & Sponsorship, 5(2), 145-159.
Keller, K. L. (1993). Conceptualizing, measuring, managing customer-based brand equity.
Journal of Marketing, 57(1), 1-22.
Kempf, D. S., Laczniak, R. N., & Smith, R. E. (2006). The effects of gender on processing
advertising and product trial information. Marketing Letters, 17(1), 5-16.
King, S. (2001). An All-Consuming Cause: Breast Cancer, Corporate Philanthropy, and the
Market for Generosity. (2001). Social Text, 19(4_69), 115-143.
King, S. (2006). Pink Ribbons, Inc.: Breast cancer and the politics of philanthropy. United States
of America: University of Minnesota Press.
Kinney, L., McDaniel, S. R., & DeGaris, L. (2008). Demographic and psychographic variables
predicting NASCAR sponsor brand recall. International Journal of Sports Marketing &
Sponsorship, 9(3), 169-179.
Ko, Y. J., Kim, K., Claussen, C., & Kim, T. H. (2008). The effects of sport involvement, sponsor
awareness and corporate image on intention to purchase sponsors' products. International
Journal of Sports Marketing & Sponsorship, 9(2), 79-94.
Kolyesnikova, N., Dodd, T. H., & Wilcox, J. B. (2009). Gender as a moderator of reciprocal
consumer behavior. Journal of Consumer Marketing, 26(3), 200-213.

309
Koo, G. Y., Quarterman, J., & Flynn, L. (2006). Effect of perceived sport event and sponsor
image fit on consumers' cognition, affect, and behavioral intentions. Sport Marketing
Quarterly, 15(2), 80-90.
Lacey, R., Close, A. G., & Finney, R. Z. (2010). The pivotal roles of product knowledge and
corporate social responsibility in event sponsorship effectiveness. Journal of Business
Research, 63(11), 1222-1228. doi: 10.1016/j.jbusres.2009.11.001
Lachowetz, T., & Gladden, J. (2003). A framework for understanding cause-related sport
marketing programs. International Journal of Sports Marketing & Sponsorship, 4(4), 313-
333.
Ladousse, C. (2009). How Lenovo deploys powerful creative sponsorship activation techniques
for a global brand. Journal of Sponsorship, 2(3), 199-205.
Lake, D. A., Reece, B. B., & Rifon, N. J. (2010). Sports team athletes as product endorsers: The
moderating role of fan team commitment on the effects of negative publicity. American
Academy of Advertising Conference Proceedings, , 30-32.
Lavidge, R. J., & Steiner, G. A. (1961). A model for predictive measurements of advertising
effectiveness. Journal of Marketing, 25(6), 59-62.
Lee, M., & Sandler, D. M. (1997). Attitudinal constructs towards sponsorship. International
Marketing Review, 14(2), 159.
Lee,Y-J., Haley, E., & Avery, E. J. (2010). The role of gender and message strategy in the
perception of advocacy advertising. Journal of Current Issues & Research in Advertising,
32(1), 47-55.
Lings, I. N., & Owen, K. M. (2007). Buying a sponsor's brand: The role of affective commitment
to the sponsored team. Journal of Marketing Management, 23(5), 483-496.
Lough, N. L., & Irwin, R. L. (2001). A comparative analysis of sponsorship objectives for U.S.
women's sport and traditional sport sponsorship. Sport Marketing Quarterly, 10(4), 202.

310
Maclaran, P., & Catterall, M. (2000). Bridging the knowledge divide: Issues on the feminisation
of marketing practice. Journal of Marketing Management, 16(6), 635-646.
Madrigal, R. (2001). Social identity effects in a belief-attitude-intentions hierarchy: Implications
for corporate sponsorship. Psychology & Marketing, 18(2), 145-165.
Mason, K. (2005). How corporate sport sponsorship impacts consumer behavior. Journal of
American Academy of Business, Cambridge, 7(1), 32-35.
Maxwell, H., & Lough, N. (2009). Signage vs. no signage: An analysis of sponsorship
recognition in women's college basketball. Sport Marketing Quarterly, 18(4), 188-198.
McCarville, R. E., & Copeland, R. P. (1994). Understanding sport sponsorship through exchange
theory. Journal of Sport Management, 8(2), 102-114.
McCook, K., Turco, D., & Riley, R. (1997). A look at the corporate sponsorship decision-
making process. Cyber-Journal of Sport Marketing, 1(2)
McDaniel, S., & Kinney, L. (1999). Audience characteristics and event sponsorship response:
The potential influence of demographics, personal interests and values on brand awareness
and brand image. International Journal of Sports Marketing and Sponsorship, 1(2), 125-145.
McDaniel, S. R. (1999). An investigation of match-up effects in sport sponsorship advertising:
The implications of consumer advertising schemas. Psychology & Marketing, 16(2), 163-
184.
McDaniel, S. R., & Kinney, L. (1998). The implications of recency and gender effects in
consumer response to ambush marketing. Psychology & Marketing, 15(4), 385-403.
McDonald, C. (1991). Sponsorship and the Image of the Sponsor. European Journal of
Marketing, 25(11), 31.
McGlone, C., & Martin, N. (2006). Nike's corporate interest lives strong: A case of cause-related
marketing and leveraging. Sport Marketing Quarterly, 15(3), 184-188.

311
McIntyre, N., & Pigram, J. J. (1992). Recreation specialization reexamined: The case of vehicle‐
based campers. Leisure Sciences, 14(1), 3-15.
Meenaghan, J. A. (1983). Commercial sponsorship. European Journal of Marketing, 17(7), 5.
Meenaghan, T. (2001a). Sponsorship and advertising: A comparison of consumer perceptions.
Psychology & Marketing, 18(2), 191-215.
Meenaghan, T. (2001b). Understanding sponsorship effects. Psychology & Marketing, 18(2), 95-
122.
Meenaghan, T. (2013). Measuring Sponsorship Performance: Challenge and Direction.
Psychology & Marketing, 30(5), 385-393. doi:10.1002/mar.20613
Meenaghan, T., McLoughlin, D., & McCormack, A. (2013). New Challenges in Sponsorship
Evaluation Actors, New Media, and the Context of Praxis. Psychology & Marketing, 30(5),
444-460. doi:10.1002/mar.20618
Meenaghan, T., & O'Sullivan, P. (2001). Editorial: The passionate embrace—consumer response
to sponsorship. Psychology & Marketing, 18(2), 87-94.
Menon, S., & Kahn, B. E. (2003). Corporate sponsorships of philanthropic activities: When do
they impact perception of sponsor brand? Journal of Consumer Psychology (Lawrence
Erlbaum Associates), 13(3), 316.
Mesch, D. J., Brown, M. S., Moore, Z. I., & Hayat, A. D. (2011). Gender differences in
charitable giving. International Journal of Nonprofit and Voluntary Sector Marketing,
16(4), 342-355.
Meyer, H. (1999). When the cause is just. Journal of Business Strategy, 20(6), 27.
Meyers-Levy, J. (1989). Gender differences in information processing: A selectivity
interpretation. In P. Cafferata, A. M. Tybout (Eds.). Cognitive and affective responses to
advertising (pp. 219-260). Lexington, MA England: Lexington Books/D. C. Heath and
Com.

312
Meyers-Levy, J. (1994). Gender differences in cortical organization: Social and biochemical
antecedents and advertising consequences (pp. 107-124). Hillsdale, NJ: Erlbaum.
Meyers-Levy, J., & Maheswaran, D. (1991). Exploring differences in males' and females'
processing strategies. Journal of Consumer Research, 18(1), 63-70.
Meyers-Levy, J., & Sternthal, B. (1991). Gender differences in the use of message cues and
judgments. Journal of Marketing Research (JMR), 28(1), 84-96.
Micceri, T. (1989). The unicorn, the normal curve, and other improbable creatures.
Psychological Bulletin, 105(1), 156-166. doi:10.1037/0033-2909.105.1.156
Miyazaki, A. D., & Morgan, A. G. (2001). Assessing market value of event sponsoring:
Corporate Olympic sponsorships. Journal of Advertising Research, 41(1), 9-15.
MLB. (2013). Retrieved May 5, 2013, from http://web.mlbcommunity.org/index.jsp
MLS. (2013). MLS Works. Retrieved May 5, 2013, from
http://www.mlssoccer.com/mlsworks/about
Mullen, J. (1997). Performance-based corporate philanthropy: How "giving smart" can further
corporate goals. Public Relations Quarterly, 42(2), 42-48.
Nan, X., & Heo, K. (2007). Consumer responses to corporate social responsibility (CSR)
initiatives. Journal of Advertising, 36(2), 63-74.
NBA. (2013). NBA Cares: Bigger than basketball. Retrieved May 5, 2013, from
http://www.nba.com/cares/overview.html
Neale, L., Filo, K., & Funk, D. (2007). Corporate social responsibility and sport event
sponsorship. In ANZMAC 2007, 3-5 December 2007, University of Otago, Dunedin.
(Unpublished). Retrieved from http://eprints.qut.edu.au/26209/ .
Newell, William H., Academic disciplines and undergraduate interdisciplinary education:
Lessons from the School of Interdisciplinary Studies at Miami University, Ohio, (European

313
Journal of Education, vol. 27 no3, 1992, p. 211-221) dans William H. Newell (dir.),
Interdisciplinarity: Essays From the Literature, New York, College Entrance Examination
Board, 1998, p. 213-224.
NFL. (2013). NFL and the community. Retrieved May 5, 2013, from
http://www.nfl.com/community
NHL (2014). NHL corporate marketing partners. Retrieved August 22, 2014, from
http://www.nhl.com/ice/page.htm?id=75916
NHL. (2013). Hockey fights cancer. Retrieved May 5, 2013, from
http://www.nhl.com/ice/page.htm?id=25343
Nicholls, J. A. F., Roslow, S., & Dublish, S. (1999). Brand recall and brand preference at
sponsored golf and tennis tournaments. European Journal of Marketing, 33(3), 365-387.
Nunnally, J.O. (1978). Psychometric theory. New York: McGraw-Hill.
O'Keefe, R., Titlebaum, P., & Hill, C. (2009). Sponsorship activation: Turning money spent into
money earned. Journal of Sponsorship, 3(1), 43-53.
O'Keeffe, M., & Zawadzka, J. (2011). Does passion for a team translate into sales for a sponsor?
The Irish case. Journal of Sponsorship, 4(2), 190-196.
Olson, E. L., & Thjømøe, H. M. (2011). Explaining and articulating the fit construct in
sponsorship. Journal of Advertising, 40(1), 57-70.
O‘Reilly, N., Beselt, E. (2012). 6th annual Canadian sponsorship landscape study. Presented at
the Sponsorship Marketing Council of Canada, Toronto, Canada, April 2012.
O‘Reilly, N., Beselt, E. (2013). 7th
annual Canadian sponsorship landscape study. Presented at
the Canadian Sponsorship Forum, Saskatoon, Canada, May 2013.
O‘Reilly, N. & Lafrance Horning, D. (2013). Leveraging sponsorship: The activation ratio,
Sport Management Review, 16(4), 424–437.

314
O'Reilly, N., Lyberger, M., McCarthy, L., Séguin, B., & Nadeau, J. (2008). Mega-special-event
promotions and intent to purchase: A longitudinal analysis of the super bowl. Journal of
Sport Management, 22(4), 392-409.
O'Reilly, N., & Madill, J. (2009). Methods and metrics in sponsorship evaluation. Journal of
Sponsorship, 2(3), 215-230.
O'Reilly, N., Nadeau, J., Séguin, B., & Harrison, M. (2007). In-stadium sponsorship evaluation
of a mega-sponsee: The 2004 Grey Cup. International Journal of Sports Marketing and
Sponsorship, 8(2)
O'Reilly, N., & Séguin, B. (2008). Sport marketing: A Canadian perspective. Nelson Education.
Orenstein, S. (2003). The selling of breast cancer. Business 2.0, 4(1), 88.
Pallant, J. (2010). SPSS Survival Manual: A Step by Step Guide to Data Analysis Using SPSS.
Maidenhead: Open University Press/McGraw-Hill.
Papadimitriou, D., & Apostolopoulou, A. (2009). Olympic sponsorship activation and the
creation of competitive advantage. Journal of Promotion Management, 15(1), 90-117. doi:
10.1080/10496490902892754
Passyn, K. A., Diriker, M., & Settle, R. B. (2011). Images of online versus store shopping: Have
the attitudes of men and women, young and old really changed? Journal of Business &
Economics Research, 9(1), 99-110.
Pavelchak, M. A., Antil, J. H., & Munch, J. M. (1988). The Super Bowl: An Investigation into
the Relationship Among Program Context, Emotional Experience, and Ad Recall. Journal
Of Consumer Research, 15(3), 360-367.
Pearsall, J. (2009). Tightening our belts: What research tells us about corporate sponsorship in
the current economic crisis. Journal of Sponsorship, 3(1), 23-34.
Pegoraro, D. A. (2009). Guest Editorial Women's brands and sponsorship. Journal of
Sponsorship, 2(4), 300-302.

315
Pegoraro, A., O'Reilly, N., & Levallet, N. (2009). Gender-based sponsorship of grassroots events
as an agent of corporate social responsibility: The case of a national women's triathlon series.
Journal of Sponsorship, 2(2), 140-151.
Perreault, W., McCarthy, J., Meredith, M., & Ricker, L. (2007). Basic marketing, a global-
managerial approach (12 Canadian ed., pp. 358-377). United States: McGraw-Hill Ryerson.
Petty, R. E., & Cacioppo, J. T. (1979). Issue involvement can increase or decrease persuasion by
enhancing message-relevant cognitive responses. Journal of Personality and Social
Psychology, 37(10), 1915-1926. doi: 10.1037/0022-3514.37.10.1915
Petty, R. E., & Cacioppo, J. T. (1983). Central and peripheral routes to persuasion: Application
to advertising. Advertising and Consumer Psychology, 3-23.
Pham, T. (1992). Effects of involvement, arousal, and pleasure on the recognition of sponsoring
stimuli. Advances in Consumer Research, 19(1), 85.
Pharr, J. R., & Lough, N. L. (2012). Differentiation of social marketing and cause-related
marketing in US professional sport. Sport Marketing Quarterly, 21(2), 91-103.
Piper, G., & Schnepf, S. V. (2007). Gender differences in charitable giving (No. 3242). IZA
Discussion Papers.
Pitts, B. G., & Slattery, J. (2004). An examination of the effects of time on sponsorship
awareness levels. Sport Marketing Quarterly, 13(1), 43-54.
Plewa, C., & Quester, P. G. (2011). Sponsorship and CSR: Is there a link? A conceptual
framework. International Journal of Sports Marketing & Sponsorship, 12(4), 301-317.
PME Enterprises. The marketing to women conference: Fast facts. Retrieved from
http://www.m2w.biz/fast_facts.php
Polonsky, M. J., & Speed, R. (2001). Linking sponsorship and cause related marketing:
Complementarities and conflicts. European Journal of Marketing, 35(11/12), 1361.

316
Poon, D. T. Y., & Prendergast, G. (2006). A new framework for evaluating sponsorship
opportunities. International Journal of Advertising, 25(4), 471-487.
Pope, N. K. U., & Voges, K. E. (2000). The impact of sport sponsorship activities, corporate
image, and prior use on consumer purchase intention. Sport Marketing Quarterly, 9(2), 96.
Pope, N., Voges, K. E., & Brown, M. (2009). Winning ways. Journal of Advertising, 38(2), 5-20.
Pope, R. (2010). The making of social sponsorship. Journal of Sponsorship, 3(3), 242-248.
Preacher, K. J. (2002, May). Calculation for the test of the difference between two independent
correlation coefficients [Computer software]. Available from http://quantpsy.org.
Prendergast, G. P., Poon, D., & West, D. C. (2010). Match game. Journal of Advertising
Research, 50(2), 214-226.
Putrevu, S. (2001). Exploring the origins and information processing differences between men
and women: Implications for advertisers. Academy of Marketing Science Review, 10(1), 1-
14.
Quester, P. G., & Thompson, B. (2001). Advertising and promotion leverage on arts sponsorship
effectiveness. Journal of Advertising Research, 41(1), 33-47.
Repko, Allen F., Interdisciplinary Research: Process and Theory, Los Angeles, London, New
Delhi and Singapore, Sage, 2008.
Ridinger, L., & Funk, D. (2006). Looking at gender differences through the lens of sport
spectators. Sport Marketing Quarterly, 15(3), 155-166.
Ross III, J. K., Patterson, L. T., & Stutts, M. A. (1992). Consumer perceptions of organizations
that use cause-related marketing. Journal of the Academy of Marketing Science, 20(1), 93.
Ross, S. D., Russell, K. C., & Bang, H. (2008). An empirical assessment of spectator-based
brand equity. Journal of Sport Management, 22(3), 322-337.

317
Roy, D. P., & Graeff, T. R. (2003). Consumer attitudes toward cause-related marketing activities
in professional sports. Sport Marketing Quarterly, 12(3), 163-172.
Roy, D. P. (2010). The impact of congruence in cause marketing campaigns for service firms.
Journal of Services Marketing, 24(3), 255-263. doi: 10.1108/08876041011040659
Roy, D. P. (2011). Impact of congruence in cause marketing campaigns for professional sport
organisations. International Journal of Sport Management & Marketing, 10(1), 21-34.
Rubel, C. (1995). Women's sports in the spotlight as corporations become sponsors. Marketing
News, 29(11), 2-13.
Ruth, J. A., & Simonin, B. L. (2006). The power of numbers. Journal of Advertising, 35(4), 7-20.
Sack, A. L., & Fried, G. (2001). Pitching women's tennis to corporate sponsors: A case study of
pilot pen tennis. Sport Marketing Quarterly, 10(2), 68-76.
Sandler, D. M., & Shani, D. (1989). Olympic sponsorship vs. 'ambush' marketing: Who gets the
gold? Journal of Advertising Research, 29(4), 9-14.
Schlaepfer, T., Harris, G., Tien, A., Peng, L., Lee, S., & Pearlson, G. (1995). Structural
differences in the cerebral cortex of healthy female and male subjects: a magnetic resonance
imaging study. Psychiatry Research, 61(3), 129-135.
Séguin, B., Lyberger, M., O'Reilly, N., & McCarthy, L. (2005). Internationalising ambush
marketing: A comparative study. International Journal of Sports Marketing & Sponsorship,
6(4), 216-230.
Séguin, B., & O'Reilly, N. (2007). 'Sponsorship in the trenches': Case study evidence of its
legitimate place in the promotional mix. Sport Journal, 10(1), 7.
Seguin, B., Teed, K., & O'Reilly, N. J. (2005). National sports organisations and sponsorship: An
identification of best practices. International Journal of Sport Management and Marketing,
1(1), 69-92.

318
Seguin, B., Parent, M. M., & O'Reilly, N. (2010). Corporate support: A corporate social
responsibility alternative to traditional event sponsorship. International Journal of Sport
Management & Marketing, 7(3), 5-5.
Seitanidi, M. M., & Ryan, A. (2007). A critical review of forms of corporate community
involvement: From philanthropy to partnerships. International Journal of Nonprofit &
Voluntary Sector Marketing, 12(3), 247-266. doi: 10.1002/nvsm.306
Shani, D., & Sandler, D. M. (1998). Ambush marketing: Is confusion to blame for the flickering
of the flame? Psychology & Marketing, 15(4), 367-383.
Shani, D., Sandler, D. M., & Long, M. M. (1992). Courting women using sports marketing A
content analysis of the US open. International Journal of Advertising, 11(4), 377-392.
Shanklin, W. L., & Kuzma, J. R. (1992). Buying that sporting image. Marketing Management,
1(2), 58-67.
Shaw, S., & Amis, J. (2001). Image and investment: Sponsorship and women's sports. Journal of
Sport Management, 15(3), 219.
Silverstein, M., & Sayre, K. (2009). Women want more how to capture your share of the world's
largest, fastest-growing market. New York: Harper Collins.
Simmons, C. J., & Becker-Olsen, K. (2006). Achieving marketing objectives through social
sponsorships. Journal of Marketing, 70(4), 154-169.
Skoloda, K. M. (2009). Too busy to shop; marketing to multi-minding women. Westport, CT:
Greenwood Publishing Group.
Smith, A. C. T., & Westerbeek, H. M. (2007). Sport as a vehicle for deploying corporate social
responsibility. Journal of Corporate Citizenship, (25), 43-54.
Smith, G. (2004). Brand image transfer through sponsorship: A consumer learning perspective.
Journal of Marketing Management, 20(3), 457-474.

319
Smolianov, P., & Aiyeku, J. F. (2009). Corporate marketing objectives and evaluation measures
for integrated television advertising and sports event sponsorships. Journal of Promotion
Management, 15(1), 74-89. doi: 10.1080/10496490902901977
Sneath, J. Z., Finney, R. Z., & Close, A. G. (2005). An IMC approach to event marketing: The
effects of sponsorship and experience on customer attitudes. Journal of Advertising
Research, 45(4), 373-381. doi: 10.1017/S0021849905050440
Sözer, E. G., & Vardar, N. (2009). How does event sponsorship help in leveraging brand equity?
Journal of Sponsorship, 3(1), 35-42.
Speed, R., & Thompson, P. (2000). Determinants of sports sponsorship response. Journal of the
Academy of Marketing Science, 28(2), 227-238.
Springfield, R. (2009). A two-way partnership to promote a cause. Journal of Sponsorship, 2(4),
340-353.
Staffieri, M. (2013). Montreal to go pink at the rink for November 17 contest. Retrieved May 26,
2013, from http://cwhl.ca/view/cwhl/news-644/news_59479
Statistics Canada (2010). Population by sex and age group, by province and territory. Retrieved
May 11, 2010, from http://www.statcan.gc.ca/tables-tableaux/sum-som/l01/cst01/demo31c-
eng.htm
Statistics Canada. (2011). General social survey 2010: Overview of the time use of Canadians.
( No. Catalogue no. 89-647-X). Ottawa, ON: Minister of Industry.
Statistics Canada (2013). Population by sex and age group, by province and territory. Retrieved
from http://www.statcan.gc.ca/tables-tableaux/sum-som/l01/cst01/demo31c-eng.htm
Stewart, B., Smith, A. T., & Nicholson, M. (2003). Sport Consumer Typologies: A Critical
Review. Sport Marketing Quarterly, 12(4), 206-216.

320
Steyn, P. G. (2009). Online recommendation as the ultimate yardstick to measure sponsorship
effectiveness. Journal of Sponsorship, 2(4), 316-329.
Sutton, R. I., & Staw, B. M. (1995). What theory is not. Administrative Science Quarterly, 371-
384.
Sylvestre, C. M., & Moutinho, L. (2007). Leveraging associations: The promotion of cultural
sponsorships. Journal of Promotion Management, 13(3), 281-303. doi:
10.1080/10496490802308497
Tabachnick, B. G. & Fidell, L.S. (2007). Using multivariate statistics (5th
edn.). Boston: Pearson
Education.
Taylor, R., & Shanka, T. (2008). Cause for event: Not-for-profit marketing through participant
sports events. Journal of Marketing Management, 24(9), 945-958.
Theberge, N. (2000). Higher goals: Women's ice hockey and the politics of gender. Albany, NY:
State University of New York Press.
The Canadian Press. (2013). Ronda Rousey beats Liz Carmouche in historic women's debut at
UFC 157. Retrieved March 8, 2013, from
http://www.cbc.ca/sports/mma/story/2013/02/24/sp-ufc-157-ronda-rousey-liz-carmouche-
130223.html
Thjømøe, H. M., Olson, E. L., & Brønn, P. S. (2002). Decision-making processes surrounding
sponsorship activities. Journal of Advertising Research, 42(6), 6-15.
Tobar, D. A. (2006). Affect and purchase intentions of super bowl XL television spectators:
Examining the influence of sport fandom, age, and gender. Sport Marketing Quarterly,
15(4), 243-252.
Tripodi, J. A. (2001). Sponsorship-A confirmed weapon in the promotional armoury., 95-116.

321
Tripodi, J. A., & Hirons, M. (2009). Sponsorship leveraging case studies-Sydney 2000 Olympic
games. Journal of Promotion Management, 15(1), 118-136. doi:
10.1080/10496490902907966
Tripodi, J. A., Hirons, M., Bednall, D., & Sutherland, M. (2003). Cognitive evaluation: Prompts
used to measure sponsorship awareness. International Journal of Market Research, 45(4),
435-455.
Tsiotsou, R., & Alexandris, K. (2009). Delineating the outcomes of sponsorship: Sponsor image,
word of mouth, and purchase intentions. International Journal of Retail & Distribution
Management, 37(4), 358-369. doi: 10.1108/09590550910948583
Turcotte, M. (2011). Women and education. Statistics Canada. Retrieved from
http://www.statcan.gc.ca/pub/89-503-x/2010001/article/11542-eng.pdf
Turcotte, M. (2012). Charitable giving by Canadians, Statistics Canada. Retrieved from
http://www.statcan.gc.ca/pub/11-008-x/2012001/article/11637-eng.pdf
Twombly, R. (2004). Corporations Flock to Selling for the (Breast Cancer) Cure. JNCI: Journal
of The National Cancer Institute, 96(23), 1736-1737.
United States Census Bureau.2006-2008 American community survey. Retrieved May 14, 2010,
from http://factfinder.census.gov/servlet/STTable?bm=y&-geoid=01000US&-qrname=ACS
United States Census Bureau (2012). Population by age and sex: 2012. Retrieved from
http://www.census.gov/population/age/data/2012comp.html
Underhill, P. (2010). What women want: The science of female shopping. New York: Peekshee.
Varadarajan, P. R., & Menon, A. (1988). Cause-related marketing: A coalignment of marketing
strategy and corporate philanthropy. Journal of Marketing, 52(3), 58-74.

322
Varner, A (2011). Co-Survivors, Family, and Friends. In K. Miller (Ed.), Excellent Care for
Cancer Survivors: A Guide to Fully Meet Their Needs in Medical Offices and in the
Community (pp. 155-161). Santa Barbara, California: Praeger.
Vickers, A. J. (2005). Parametric versus non-parametric statistics in the analysis of randomized
trials with non-normally distributed data. BMC Medical Research Methodology, 5(1), 35.
Wajda, T. A., Hu, M. Y., & Cui, A. P. (2008). Gender differences on the "width" dimension of
category structure: A case of brand typicality. Marketing Management Journal, 18(1), 14-29.
Walker, M., & Kent, A. (2009). Do fans care? Assessing the influence of corporate social
responsibility on consumer attitudes in the sport industry. Journal of Sport Management,
23(6), 743-769.
Walliser, B. (2003). An international review of sponsorship research: Extension and update.
International Journal of Advertising, 22(1), 5-40.
Warner, F. (2006). The power of the purse: How smart businesses are adapting to the world’s
most important consumers - women. New Jersey: Pearson Education.
Washington, K., & Miller, R. K. (2010). Chapter 6: Cause marketing. (pp. 35-39). Richard K.
Miller & Associates.
Watt, K. (2010). The future of sponsorship integrated with CSR/CSI strategy. Journal of
Sponsorship, 3(3), 220-227.
Weeks, C. S., Cornwell, T. B., & Drennan, J. C. (2008). Leveraging sponsorships on the internet:
Activation, congruence, and articulation. Psychology & Marketing, 25(7), 637-654.
Wheeler, R. T. (2009). Nonprofit advertising: Impact of celebrity connection, involvement and
gender on source credibility and intention to volunteer time or donate money. Journal of
Nonprofit & Public Sector Marketing, 21(1), 80-107. doi: 10.1080/10495140802111984

323
Whetten, D. A. (1989). What constitutes a theoretical contribution? Academy of Management
Review, 14(4), 490-495.
Whiteside, E., & Hardin, M. (2011). Women (not) watching women: Leisure time, television,
and implications for televised coverage of women's sports. Communication, Culture &
Critique, 4(2), 122-143.
Wiley, C. G. E., Shaw, S. M., & Havitz, M. E. (2000). Men's and women's involvement in sports:
An examination of the gendered aspects of leisure involvement. Leisure Sciences, 22(1), 19-
31.
WNBA. (2013). WNBA Cares. Retrieved May 5, 2013, from http://www.wnba.com/cares/
Wolin, L. D. (2003). Gender issues in advertising--an oversight synthesis of research: 1970-2002.
Journal of Advertising Research, 43(1), 111-129.
Wood, L., Snelgrove, R., & Danylchuk, K. (2010). Segmenting volunteer fundraisers at a charity
sport event. Journal of Nonprofit & Public Sector Marketing, 22(1), 38-54. doi:
10.1080/10495140903190408
Woodside, F., & Summers, J. (2011). Sponsorship leveraged packaging: An exploratory study in
FMCG. Journal of Marketing Communications, 17(2), 87-105. doi:
10.1080/13527260903194667
Yazici, B., & Yolacan, S. (2007). A comparison of various tests of normality. Journal of
Statistical Computation & Simulation, 77(2), 175-183. doi:10.1080/10629360600678310
Zaichkowsky, J. L. (1985). Measuring the involvement construct. Journal of Consumer Research,
12(3), 341-352.
Zdravkovic, S., Magnusson, P., & Stanley, S. M. (2010). Dimensions of fit between a brand and
a social cause and their influence on attitudes. International Journal of Research in
Marketing, 27(2), 151-160. doi: 10.1016/j.ijresmar.2010.01.005

324
Appendices
Appendix A: Event #1 -Nipissing University Men’s Hockey Real Men Wear Pink Survey
Sponsorship of Charity-Linked Sporting Events
1. Please select the event that you are attending, or recently attended:
Female Charity- Linked Hockey Event
Male Charity- Linked Hockey Event
2. Please indicate your gender.
Male
Female
3. Please select your age group.
18-24
25-34
35-44
45-54
55-64
65 or Above
4. What is your total household income?
Under $20,000
$20,000 - $30,000
$30,000 - $40,000
$40,000 - $50,000
$50,000 - $75,000

325
$75,000 - $100,000
$100,000 - $150,000
$150,000 or more
Prefer Not to Answer
5. If you have children, how many of your children currently live in your
household?
0
1
2
3
4
More than 4
Not Applicable
6. Please indicate your level of agreement by selecting the option (on a
scale of 1 to 5) that best represents how you feel about each of the
statements below.
Strongly
Disagree (1)
Disagree
(2)
Neutral
(3)
Agree
(4)
Strongly Agree
(5)
I regularly feel that I want to become
involved in events that support the charity
(Canadian Breast Cancer Foundation)
associated with this game/event.
My decision to attend this charity linked
hockey game/event was mainly determined
by my desire to help the cause of breast
cancer.
Supporting a charity gives me a sense of
satisfaction.
Hockey (as a player and/or spectator) is an

326
important part of my life.
Hockey (as a player and/or spectator) is one
of the most enjoyable activities for me.
Most of my friends are in some way
connected with hockey.
There is a logical connection (or
association) between this charity linked
hockey game and the main sponsor(s).
The image of this event and the image of
the main sponsor(s) are similar.
It makes sense to me that this company
sponsors a charity-linked hockey event.
7. Please indicate your level of agreement by selecting the option (on a
scale of 1 to 5) that best represents how you feel about each of the
statements below.
Strongly
Disagree
(1)
Disagree
(2)
Neutral
(3)
Agree
(4)
Strongly Agree
(5)
It is important for me to show support for
women’s sporting events.
It is important for me to show support for
men’s sporting events.
It is important for me to show support for
women's charitable/social causes.
It is important for me to show support for
men's charitable/social causes.
The main reason the sponsor(s) are involved
in this event is that they believe that
charitable sporting events deserve support.
Sponsor(s) of this event likely have the best
interest of the cause at heart.

327
8. Please indicate your level of agreement by selecting the option (on a scale of
1 to 5) that best represents how you feel about each of the statements below.
Strongly
Disagree
(1)
Disagree
(2)
Neutral
(3)
Agree
(4)
Strongly
Agree
(5)
This sponsorship makes me more likely to
notice the sponsors’ name on other occasions
than I might otherwise.
This sponsorship makes me more likely to pay
attention to the sponsors’ advertising and
other promotions than I might otherwise.
Sponsorship of this charity linked hockey
event makes me feel more favourable toward
the sponsoring companies than I might
otherwise.
This sponsorship improves my perception of
the sponsoring companies more than I might
otherwise.
This sponsorship makes me more likely to
consider the sponsor(s) the next time I am in
need of these products/services.
I am more likely to buy the sponsoring
company’s products/services as a result of
their sponsorship of this charity linked hockey
event.

328
9. Please include in the space below any additional feedback on the
sponsorship of causes through sporting events. Your input is very much
appreciated.
Thank you for your participation in this study.
As part of this sponsorship research, you are invited to participate in a draw for an
iPad Mini. If you wish to be included in this draw, please complete the ballot provided
by the research team. A separate draw ballot will ensure that your response to this
survey remains anonymous.

329
Appendix B: Event #2 - Laurentian University Women’s Hockey Pink the Rink Survey
Sponsorship of Charity-Linked Sporting Events
1. Please select the event that you are attending, or recently attended:
Female Charity-Linked Hockey Event
Male Charity-Linked Hockey Event
2. Please indicate your gender.
Male
Female
3. Please select your age group.
18-24
25-34
35-44
45-54
55-64
65 or Above
4. What is your total household income?
Under $20,000
$20,000 - $30,000
$30,000 - $40,000
$40,000 - $50,000
$50,000 - $75,000
$75,000 - $100,000
$100,000 - $150,000

330
$150,000 or more
Prefer Not to Answer
5. If you have children, how many of your children currently live in your
household?
0
1
2
3
4
More than 4
Not Applicable
6. Please indicate your level of agreement by selecting the option (on a
scale of 1 to 5) that best represents how you feel about each of the
statements below.
Strongly
Disagree
(1)
Disagree
(2)
Neutral
(3)
Agree
(4)
Strongly
Agree (5)
I regularly feel that I want to become
involved in events that support the charity
(Northern Cancer Research Foundation)
associated with this game/event.
My decision to attend this charity-linked
hockey game/event was mainly determined
by my desire to help the Northern Cancer
Research Foundation.
Supporting a charity gives me a sense of
satisfaction.
Hockey (as a player and/or spectator) is an
important part of my life.

331
Hockey (as a player and/or spectator) is one
of the most enjoyable activities for me.
Most of my friends are in some way
connected with hockey.
There is a logical connection (or association)
between this charity-linked hockey game and
the main sponsor (Deluxe Hamburgers).
The image of this event and the image of the
main sponsor(s) are similar.
It makes sense to me that this organization
sponsors a charity-linked hockey event.
7. Please indicate your level of agreement by selecting the option (on a
scale of 1 to 5) that best represents how you feel about each of the
statements below.
Strongly
Disagree
(1)
Disagree
(2)
Neutral
(3)
Agree
(4)
Strongly
Agree (5)
It is important for me to show support for
women’s sporting events.
It is important for me to show support for
men’s sporting events.
It is important for me to show support for
women's charitable/social causes.
It is important for me to show support for
men's charitable/social causes.
The main reason the sponsor(s) are involved
in this event is that they believe that
charitable sporting events deserve support.
Sponsor(s) of this event likely have the best
interest of the cause at heart.

332
8. Please indicate your level of agreement by selecting the option (on a
scale of 1 to 5) that best represents how you feel about each of the
statements below.
Strongly
Disagree
(1)
Disagree
(2)
Neutral
(3)
Agree
(4)
Strongly
Agree (5)
This sponsorship makes me more likely to
notice the sponsors’ name on other
occasions than I might otherwise.
This sponsorship makes me more likely to
pay attention to the sponsors’ advertising
and other promotions than I might
otherwise.
Sponsorship of this charity-linked hockey
event makes me feel more favourable
toward the sponsoring companies than I
might otherwise.
This sponsorship improves my perception of
the sponsoring companies more than I might
otherwise.
This sponsorship makes me more likely to
consider the sponsor(s) the next time I am in
need of these products/services.
I am more likely to buy the sponsoring
company’s products/services as a result of
their sponsorship of this charity-linked
hockey event.

333
9. Please include in the space below any additional feedback on the
sponsorship of causes through sporting events. Your input is very much
appreciated.
Thank you for your participation in this study.
As part of this sponsorship research, you are invited to participate in a draw for an
iPad Mini. If you wish to be included in this draw, please complete the ballot provided
by the research team. A separate draw ballot will ensure that your response to this
survey remains anonymous.

334
Appendix C: Event #3 - Nipissing University Women’s Hockey Pink the Rink Survey
Sponsorship of Charity-Linked Sporting Events
1. Please select the event that you are attending, or recently attended:
Female Charity-Linked Hockey Event
Male Charity-Linked Hockey Event
2. Please indicate your gender.
Male
Female
3. Please select your age group.
18-24
25-34
35-44
45-54
55-64
65 or Above
4. What is your total household income?
Under $20,000
$20,000 - $30,000
$30,000 - $40,000
$40,000 - $50,000
$50,000 - $75,000
$75,000 - $100,000

335
$100,000 - $150,000
$150,000 or more
Prefer Not to Answer
5. If you have children, how many of your children currently live in your
household?
0
1
2
3
4
More than 4
Not Applicable
6. Please indicate your level of agreement by selecting the option (on a
scale of 1 to 5) that best represents how you feel about each of the
statements below.
Strongly
Disagree
(1)
Disagree (2) Neutral
(3)
Agree
(4)
Strongly
Agree (5)
I regularly feel that I want to become
involved in events that support the
charity associated with this game
(Canadian Breast Cancer Foundation).
My decision to attend this charity-linked
hockey game was mainly determined by
my desire to help the Canadian Breast
Cancer Foundation.
Supporting a charity gives me a sense of
satisfaction.

336
Hockey (as a player and/or spectator) is
an important part of my life.
Hockey (as a player and/or spectator) is
one of the most enjoyable activities for
me.
Most of my friends are in some way
connected with hockey.
There is a logical connection (or
association) between this charity-linked
hockey game and the main sponsor
(True North Chevrolet Cadillac).
The image of this event and the image
of the main sponsor (True North
Chevrolet and Cadillac) are similar.
It makes sense to me that this
organization (True North Chevrolet
Cadillac) sponsors a charity-linked
hockey event.
7. Please indicate your level of agreement by selecting the option (on a
scale of 1 to 5) that best represents how you feel about each of the
statements below.
Strongly
Disagree
(1)
Disagree
(2)
Neutral
(3)
Agree
(4)
Strongly
Agree (5)
It is important for me to show support for
women’s sporting events.
It is important for me to show support for
men’s sporting events.
It is important for me to show support for
women's charitable/social causes.
It is important for me to show support for
men's charitable/social causes.
The main reason the sponsor(s) are involved
in this event is that they believe that

337
charitable sporting events deserve support.
Sponsor(s) of this event likely have the best
interest of the cause at heart.
8. Please indicate your level of agreement by selecting the option (on a
scale of 1 to 5) that best represents how you feel about each of the
statements below.
Strongly
Disagree
(1)
Disagree
(2)
Neutral
(3)
Agree
(4)
Strongly
Agree (5)
This sponsorship makes me more likely to
notice the sponsor's name (True North
Chevrolet Cadillac) on other occasions than I
might otherwise.
This sponsorship makes me more likely to
pay attention to the sponsor's advertising
and other promotions than I might
otherwise.
Sponsorship of this charity-linked hockey
event makes me feel more favourable
toward the sponsoring company than I might
otherwise.
This sponsorship improves my perception of
the sponsoring company more than I might
otherwise.
This sponsorship makes me more likely to
consider the sponsor the next time I am in
need of these products/services.
I am more likely to buy the sponsoring
company’s products/services as a result of
their sponsorship of this charity-linked
hockey event.

338
9. Please include in the space below any additional feedback on the sponsorship
of causes through sporting events. Your input is very much appreciated.
Thank you for your participation in this study.
As part of this sponsorship research, you are invited to participate in a draw for an
iPad Mini. If you wish to be included in this draw, please complete the ballot provided
by the research team. A separate draw ballot will ensure that your response to this
survey remains anonymous.

339
Appendix D: Event #4 – Ottawa Senators NHL Food Drive Game Survey
Sponsorship of Charity-Linked Sporting Events
1. Please select the event that you are attending, or recently attended:
Female Charity-Linked Hockey Event
Male Charity-Linked Hockey Event
2. Please indicate your gender.
Male
Female
3. Please select your age group.
18-24
25-34
35-44
45-54
55-64
65 or Above
4. What is your total household income?
Under $20,000
$20,000 - $30,000
$30,000 - $40,000
$40,000 - $50,000
$50,000 - $75,000
$75,000 - $100,000
$100,000 - $150,000

340
$150,000 or more
Prefer Not to Answer
5. If you have children, how many of your children currently live in your
household?
0
1
2
3
4
More than 4
Not Applicable
6. Please indicate your level of agreement by selecting the option (on a
scale of 1 to 5) that best represents how you feel about each of the
statements below.
Strongly
Disagree (1)
Disagree
(2)
Neutral
(3)
Agree
(4)
Strongly
Agree (5)
I regularly feel that I want to become
involved in events that support the
charity/cause (i.e. The Ottawa Food
Bank) associated with this game
My decision to attend this charity-
linked hockey game was mainly
determined by my desire to help the
Ottawa Food Bank.
Supporting a charity gives me a sense of
satisfaction.
Hockey (as a player and/or spectator) is
an important part of my life.
Hockey (as a player and/or spectator) is
one of the most enjoyable activities for

341
me.
Most of my friends are in some way
connected with hockey.
There is a logical connection (or
association) between this charity-linked
hockey game and the main sponsor
(Canadian Tire).
The image of this event (Ottawa
Senators Food Drive Night) and the
image of the main sponsor (Canadian
Tire) are similar.
It makes sense to me that this
organization (Canadian Tire) sponsors a
charity-linked hockey event.
7. Please indicate your level of agreement by selecting the option (on a
scale of 1 to 5) that best represents how you feel about each of the
statements below.
Strongly
Disagree
(1)
Disagree
(2)
Neutral
(3)
Agree
(4)
Strongly
Agree (5)
It is important for me to show support for
women’s sporting events.
It is important for me to show support for
men’s sporting events.
It is important for me to show support for
women's charitable/social causes.
It is important for me to show support for
men's charitable/social causes.
The main reason that the sponsor (Canadian
Tire) is involved in this event is that they
believe that charitable sporting events
deserve support.
The sponsor of this event (Canadian Tire)
likely has the best interest of the cause at

342
heart.
8. Please indicate your level of agreement by selecting the option (on a
scale of 1 to 5) that best represents how you feel about each of the
statements below.
Strongly
Disagree
(1)
Disagree
(2)
Neutral
(3)
Agree
(4)
Strongly
Agree (5)
This sponsorship makes me more likely to
notice the sponsor's name (Canadian Tire)
on other occasions than I might otherwise.
This sponsorship makes me more likely to
pay attention to the sponsor's advertising
and other promotions than I might
otherwise.
Sponsorship of this charity-linked hockey
event makes me feel more favourable
toward the sponsoring company than I might
otherwise.
This sponsorship improves my perception of
the sponsoring company more than I might
otherwise.
This sponsorship makes me more likely to
consider the sponsor the next time I am in
need of their products/services.
I am more likely to buy the sponsoring
company’s products/services as a result of
their sponsorship of this charity-linked
hockey event.

343
9. Please include in the space below any additional feedback on the
sponsorship of causes through sporting events. Your input is very much
appreciated.
Thank you for your participation in this study.
As part of this sponsorship research, you are invited to participate in a draw for an
iPad Mini. If you wish to be included in this draw, please complete the ballot provided
by the research team. A separate draw ballot will ensure that your response to this
survey remains anonymous.

344
Appendix E: Event #5 – Sudbury Wolves Teddy Bear Toss Game Survey
Sponsorship of Charity-Linked Sporting Events
1. Please select the event that you are attending, or recently attended:
Female Charity-Linked Hockey Event
Male Charity-Linked Hockey Event
2. Please indicate your gender.
Male
Female
3. Please select your age group.
18-24
25-34
35-44
45-54
55-64
65 or Above
4. What is your total household income?
Under $20,000
$20,000 - $30,000
$30,000 - $40,000
$40,000 - $50,000
$50,000 - $75,000
$75,000 - $100,000

345
$100,000 - $150,000
$150,000 or more
Prefer Not to Answer
5. If you have children, how many of your children currently live in your
household?
0
1
2
3
4
More than 4
Not Applicable
6. Please indicate your level of agreement by selecting the option (on a
scale of 1 to 5) that best represents how you feel about each of the
statements below.
Strongly
Disagree
(1)
Disagree
(2)
Neutral (3) Agree (4) Strongly
Agree (5)
I regularly feel that I want to become
involved in events that support the
charity/cause (i.e. the Salvation Army)
associated with this game.
My decision to attend this charity-
linked hockey game was mainly
determined by my desire to help the
Salvation Army.
Supporting a charity gives me a sense
of satisfaction.

346
Hockey (as a player and/or spectator)
is an important part of my life.
Hockey (as a player and/or spectator)
is one of the most enjoyable activities
for me.
Most of my friends are in some way
connected with hockey.
There is a logical connection (or
association) between this charity-
linked hockey game and the main
sponsor (Travelodge Hotel Sudbury).
The image of this event (Sudbury
Wolves Teddy Bear Toss) and the
image of the main sponsor
(Travelodge Hotel) are similar.
It makes sense to me that this
organization (Travelodge Hotel)
sponsors a charity-linked hockey
event.
7. Please indicate your level of agreement by selecting the option (on a
scale of 1 to 5) that best represents how you feel about each of the
statements below.
Strongly
Disagree (1)
Disagree
(2)
Neutral
(3)
Agree
(4)
Strongly
Agree (5)
It is important for me to show support
for women’s sporting events.
It is important for me to show support
for men’s sporting events.
It is important for me to show support
for women's charitable/social causes.
It is important for me to show support
for men's charitable/social causes.

347
Strongly
Disagree (1)
Disagree
(2)
Neutral
(3)
Agree
(4)
Strongly
Agree (5)
The main reason that the sponsor
(Travelodge) is involved in this event
is that they believe that charitable
sporting events deserve support.
The sponsor of this event
(Travelodge) likely has the best
interest of the cause at heart.
8. Please indicate your level of agreement by selecting the option (on a
scale of 1 to 5) that best represents how you feel about each of the
statements below.
Strongly
Disagree
(1)
Disagree
(2)
Neutral
(3)
Agree
(4)
Strongly
Agree (5)
This sponsorship makes me more likely to
notice the sponsor's name (Travelodge
Hotel) on other occasions than I might
otherwise.
This sponsorship makes me more likely to
pay attention to Travelodge's advertising
and other promotions than I might
otherwise.
Sponsorship of this charity-linked hockey
event makes me feel more favourable
toward Travelodge Hotel than I might
otherwise.
This sponsorship improves my perception
of Travelodge Hotel more than I might
otherwise.
This sponsorship makes me more likely to
consider Travelodge the next time I am in
need of a hotel.
I am more likely to stay at Travelodge
Hotels as a result of their sponsorship of

348
this charity-linked hockey event.
9. Please include in the space below any additional feedback on the
sponsorship of causes through sporting events. Your input is very much
appreciated.
Thank you for your participation in this study.
As part of this sponsorship research, you are invited to participate in a draw for an
iPad Mini. If you wish to be included in this draw, please complete the ballot provided
by the research team. A separate draw ballot will ensure that your response to this
survey remains anonymous.

349
Appendix F: Consent Form for Research Participation
Title of Study: An Investigation of Sponsorship Effects at Charity-Linked Sporting Events: A Gendered Consumer Perspective
Principal Investigator: Thesis Supervisor:
Denyse Lafrance Horning Dr. Norm O‘Reilly
PhD Student Associate Professor / Adjunct Professor
Laurentian University University of Ottawa/ Laurentian University
(705) 474-3450, ext. 4319 (613) 562-5800, ext 7083
1-800-655-5154 1-877-868-8292
[email protected] [email protected]
Invitation to Participate: You are invited to participate in the abovementioned research study conducted by Denyse Lafrance Horning from the PhD in Human Studies Program at Laurentian University. The results of this study will contribute to PhD student research.
Purpose of the Study: The purpose of this research is to understand the consumer effects of sponsorship at sporting events associated with a cause. The role of gender in predicting sponsorship outcomes is being explored by comparing findings between adult (i.e. 18 years and older) male and female respondents.
Participation: Participation in this study consist of completing a brief survey (approximately 5
minutes) during which you will be asked to answer questions and provide your opinion on
different subjects relating to the sponsorship of sporting events associated with a charitable
cause. You may complete this survey at the event or on-line at the following link:
http://fluidsurveys.com/surveys/dlh/sudbury-wolves-teddy-bear-toss/ . Once the questionnaire is
done, your participation in this study is complete.
Risks: There are no foreseeable risks in participating in this study as all answers will remain anonymous. Participation in this study is voluntary and you are free to withdraw at any time. Respondents have the right to refuse to answer any questions that they find objectionable or which make them feel uncomfortable.
Benefits: Your participation in this study with help event organizers, sponsors and charitable organizations learn more about the impact of sponsorship on participants and spectators of sporting events that affiliate with charitable causes and will assist in the ongoing success of such important events. A better understanding of the effects of sponsorship on consumers will allow event organizers and sponsors to develop effective programs that best meet the needs of various consumer and organizational segments.
Confidentiality and Anonymity: You are not asked to provide any unique identifiers in this questionnaire in order to ensure complete anonymity of participants. As such, the confidentiality of the respondents will be fully maintained. Any information that is obtained from research in connection with this study is anonymous.

350
Conservation of Data: The data collected through this study will be stored in a secure manner (locked in the private office of the principal investigator) and only the researchers will have access to it. The data collected will be kept for a maximum of five (5) years before electronic files are securely deleted from hard drives and hard copy data is shredded.
Compensations: There is no compensation for this study other than the chance to win a draw prize. Ballot information will only be used for this draw and will not be shared for any other purpose.
Voluntary Participation: You are under no obligation to participate in this study. If you choose to participate, you can withdraw from the study at any time and /or refuse to answer any questions, without suffering any negative consequences. If you choose to withdraw, all data gathered until the time of withdrawal will be used in the study unless you specify that you do not wish for it to be used in which case it will be destroyed.
Consent: By completing either the hard copy survey or the on-line questionnaire (as instructed by the researcher of your particular event), you are consenting to participate in this study. Please keep a copy of this information letter for your reference.
Research Contacts: For further information regarding this research you may contact the researcher or her supervisor. This study has been reviewed and received ethics clearance through the Laurentian University Research Ethics Board (REB # 2013-07-12) and the Nipissing University Research Ethics Board (REB#13-10-14IA). If you have questions regarding your rights as a research participant, please contact: Research Ethics Officer, Laurentian University Research Office, telephone: 705-675-1151 ext 2436 or toll free at 1-800-461-4030 or email [email protected].
Research Results: If you wish to receive results from this study, please provide your preferred contact information below. This personal information will be used for the sole purpose of sharing research results and will not be shared with others.
_____________________________________________________________________
_____________________________________________________________________
Thank you for your participation.
Denyse Lafrance Horning
PhD Student
Laurentian University

351
Appendix G: Reliability of Measurement Scales
Sample/Scale PIC PIS PI GSW GSM FIT SINC INT FAV USE
Total Sample
IIC-Mean .38 .62 .33 .79 .74 .59 .67 .75 .75 .76
.62 .83 .74 .88 .85 .81 .80 .86 .86 .87
N 640 637 635 639 641 634 640 642 639 640
Event Type 1: Women’s Charity-Linked Hockey Events
IIC-Mean .44 .66 .29 .70 .68 .61 .61 .68 .59 .71
.67 .86 .70 .82 .81 .82 .76 .81 .74 .83
N 200 200 200 199 200 198 200 200 200 200
Event Type 2: Men’s Charity-Linked Hockey Events
IIC-Mean .35 .60 .35 .81 .76 .57 .68 .78 .81 .79
.59 .82 .76 .89 .86 .80 .81 .86 .89 .88
N 440 437 435 440 441 436 440 442 439 440
Cancer-Cause Events
IIC-Mean .47 .67 .37 .76 .72 .62 .60 .70 .64 .73
.70 .86 .77 .86 .83 .83 .75 .82 .78 .84
N 259 260 259 259 259 255 260 260 259 259
Social -Cause Events
IIC-Mean .31 .58 .31 .80 .76 .56 .69 .78 .81 .78
.55 .81 .72 .89 .86 .79 .82 .88 .90 .88
N 381 377 376 380 382 379 380 382 380 381
Event #1: NU Real Men Wear Pink
IIC-Mean .54 .69 .55 .87 .79 .63 .60 .77 .76 .79
.75 .87 .87 .93 .88 .84 .75 .87 .86 .88
N 59 60 59 60 59 57 60 60 59 59
Event #2: LU Pink the Rink
IIC-Mean .49 .69 .29 .74 .70 .61 .62 .59 .57 .61
.71 .87 .71 .85 .82 .83 .76 .74 .73 .75
N 101 101 101 100 101 100 101 101 101 101
Event #3: NU Pink the Rink
IIC-Mean .39 .64 .29 .65 .67 .61 .59 .73 .60 .78
.63 .84 .70 .78 .80 .83 .74 .84 .74 .87
N 99 99 99 99 99 99 99 99 99 99
Event #4: Ottawa Senators Food Drive Night
IIC-Mean .24 .56 .29 .78 .71 .52 .64 .78 .75 .70
.47 .79 .71 .88 .83 .77 .78 .88 .86 .82
N 215 213 213 214 215 214 214 215 215 215
Event #5: Sudbury Wolves Toy Drive
IIC-Mean .41 .60 .33 .83 .83 .63 .78 .78 .88 .87
.66 .82 .74 .90 .91 .84 .87 .88 .94 .93
N 166 164 163 166 167 165 166 167 165 166

352
Appendix H: Correlation Matrices for Each Sampled Event
Correlation Matrix - Event 1
PI FIT SINC INT FAV USE
PI Pearson
Correlation .574**
.282* .319
* .299
* .302
*
Sig. (2-tailed) .000 .029 .013 .020 .019
R2 .329 .080 .102 .089 .091
N 60 60 60 60 60
FIT Pearson
Correlation .590**
.540**
.506**
.522**
Sig. (2-tailed) .000 .000 .000 .000
R2 .348 .292 .256 .272
N 60 60 60 60
SINC Pearson
Correlation .558**
.492**
.492**
Sig. (2-tailed) .000 .000 .000
R2 .311 .242 .242
N 60 60 60
INT Pearson
Correlation .699**
.681**
Sig. (2-tailed) .000 .000
R2 .489 .464
N 60 60
FAV Pearson
Correlation .783**
Sig. (2-tailed) .000
R2 .613
N 60
M 3.797 3.91 4.21 3.88 3.91 3.94
SD .8830 .813 .815 .795 .810 .792
**. Correlation is significant at the 0.01 level (2-tailed).
*. Correlation is significant at the 0.05 level (2-tailed).
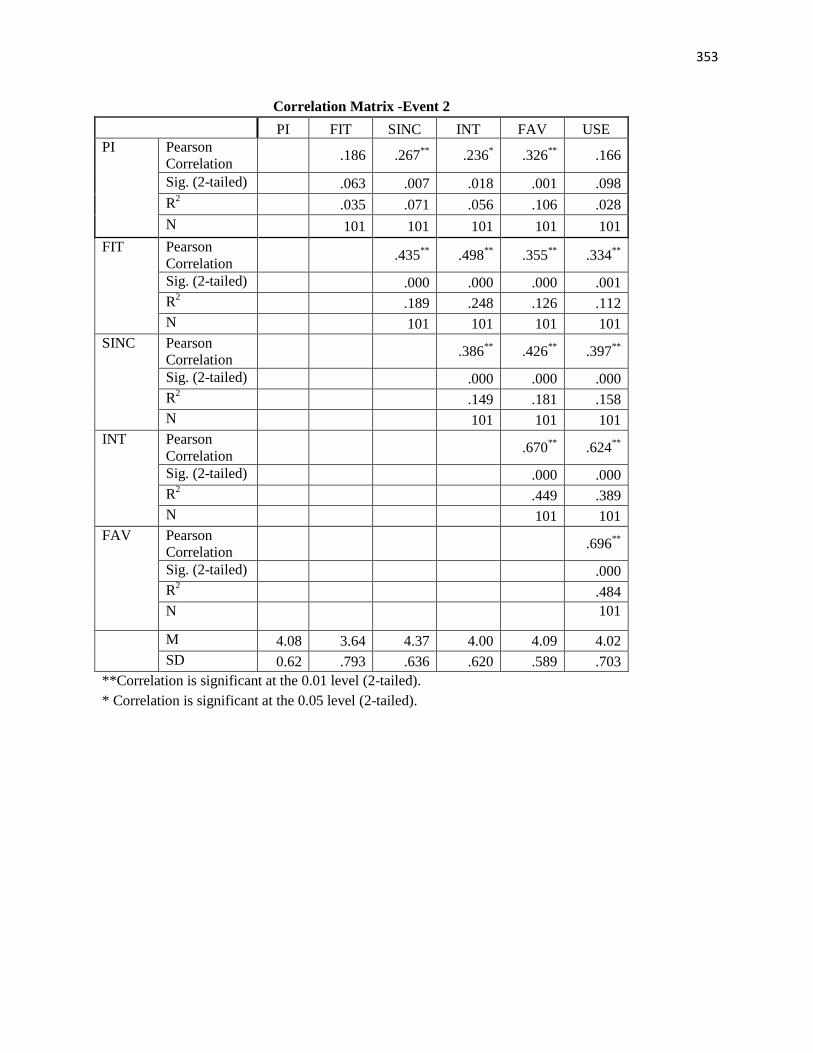
353
Correlation Matrix -Event 2
PI FIT SINC INT FAV USE
PI Pearson
Correlation .186 .267
** .236
* .326
** .166
Sig. (2-tailed) .063 .007 .018 .001 .098
R2 .035 .071 .056 .106 .028
N 101 101 101 101 101
FIT Pearson
Correlation .435
** .498
** .355
** .334
**
Sig. (2-tailed) .000 .000 .000 .001
R2 .189 .248 .126 .112
N 101 101 101 101
SINC Pearson
Correlation .386
** .426
** .397
**
Sig. (2-tailed) .000 .000 .000
R2 .149 .181 .158
N 101 101 101
INT Pearson
Correlation .670
** .624
**
Sig. (2-tailed) .000 .000
R2 .449 .389
N 101 101
FAV Pearson
Correlation .696
**
Sig. (2-tailed) .000
R2 .484
N 101
M 4.08 3.64 4.37 4.00 4.09 4.02
SD 0.62 .793 .636 .620 .589 .703
**Correlation is significant at the 0.01 level (2-tailed).
* Correlation is significant at the 0.05 level (2-tailed).

354
Correlation Matrix -Event 3
PI FIT SINC INT FAV USE
PI Pearson
Correlation .476**
.506**
.325**
.229* .275
**
Sig. (2-tailed) .000 .000 .001 .023 .006
R2 .227 .256 .106 .052 .076
N 99 99 99 99 99
FIT Pearson
Correlation .447**
.537**
.478**
.530**
Sig. (2-tailed) .000 .000 .000 .000
R2 .200 .288 .228 .281
N 99 99 99 99
SINC Pearson
Correlation .478**
.425**
.381**
Sig. (2-tailed) .000 .000 .000
R2 .228 .181 .145
N 99 99 99
INT Pearson
Correlation .648**
.667**
Sig. (2-tailed) .000 .000
R2 .648 .667
N 99 99
FAV Pearson
Correlation .733**
Sig. (2-tailed) .000
R2 .537
N 99
M 3.98 3.50 4.16 3.81 3.90 3.68
SD 0.63 .824 .699 .822 .725 .774
**. Correlation is significant at the 0.01 level (2-tailed).
*. Correlation is significant at the 0.05 level (2-tailed).
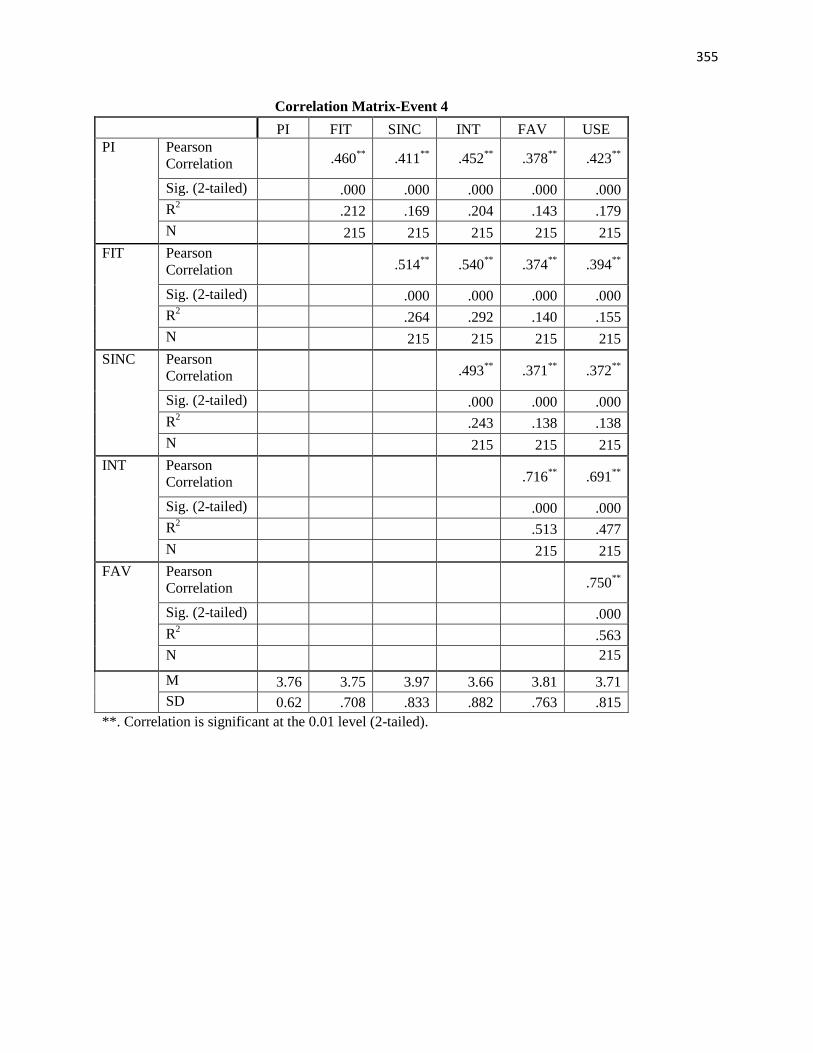
355
Correlation Matrix-Event 4
PI FIT SINC INT FAV USE
PI Pearson
Correlation .460**
.411**
.452**
.378**
.423**
Sig. (2-tailed) .000 .000 .000 .000 .000
R2 .212 .169 .204 .143 .179
N 215 215 215 215 215
FIT Pearson
Correlation .514**
.540**
.374**
.394**
Sig. (2-tailed) .000 .000 .000 .000
R2 .264 .292 .140 .155
N 215 215 215 215
SINC Pearson
Correlation .493**
.371**
.372**
Sig. (2-tailed) .000 .000 .000
R2 .243 .138 .138
N 215 215 215
INT Pearson
Correlation .716**
.691**
Sig. (2-tailed) .000 .000
R2 .513 .477
N 215 215
FAV Pearson
Correlation .750**
Sig. (2-tailed) .000
R2 .563
N 215
M 3.76 3.75 3.97 3.66 3.81 3.71
SD 0.62 .708 .833 .882 .763 .815
**. Correlation is significant at the 0.01 level (2-tailed).

356
Correlation Matrix - Event 5
PI FIT SINC INT FAV USE
PI Pearson
Correlation .599**
.586**
.522**
.499**
.488**
Sig. (2-tailed) .000 .000 .000 .000 .000
R2 .359 .343 .272 .249 .238
N 167 167 167 167 167
FIT Pearson
Correlation .685**
.617**
.582**
.545**
Sig. (2-tailed) .000 .000 .000 .000
R2 .469 .381 .339 .297
N 167 167 167 167
SINC Pearson
Correlation .558**
.617**
.583**
Sig. (2-tailed) .000 .000 .000
R2 .311 .381 .340
N 167 167 167
INT Pearson
Correlation .807**
.755**
Sig. (2-tailed) .000 .000
R2 .651 .570
N 167 167
FAV Pearson
Correlation .844**
Sig. (2-tailed) .000
R2 .712
N 167
M 3.95 3.79 4.02 3.81 3.76 3.72
SD 0.61 .780 .792 .809 .867 .969
**. Correlation is significant at the 0.01 level (2-tailed).

357
Non Parametric Correlation Matrix (Spearman rho) – Event Specific Samples
Personal Involvement Fit Sincerity
Event
PI * FIT
PI* SINC
PI* INT
PI* FAV
PI* USE
FIT* INT
FIT* FAV
FIT* USE
SINC* INT
SINC* FAV
SINC* USE
Event 1
N=60
rho .611** .269
* .325
* .295
* .357
** .462
** .483
** .527
** .467
** .424
** .480
**
p .000 .038 .011 .022 .005 .000 .000 .000 .000 .001 .000
Event 2
N=101
rho .197* .294
** .276
** .353
** .223
* .460
** .343
** .346
** .437
** .425
** .447
**
p .049 .003 .005 .000 .025 .000 .000 .000 .000 .000 .000
Event 3
N=99
rho .469** .521
** .282
** .232
* .251
* .530
** .501
** .585
** .473
** .425
** .318
**
p .000 .000 .005 .021 .012 .000 .000 .000 .000 .000 .001
Event 4
N=215
rho .471** .413
** .450
** .349
** .418
** .486
** .359
** .393
** .462
** .335
** .369
**
p .000 .000 .000 .000 .000 .000 .000 .000 .000 .000 .000
Event 5
N=167
rho .495** .484
** .469
** .425
** .458
** .581
** .594
** .579
** .500
** .579
** .579
**
p .000 .000 .000 .000 .000 .000 .000 .000 .000 .000 .000
*Correlation is significant at the 0.01 level (2-tailed).
**Correlation is significant at the 0.05 level (2-tailed).