Does Augmented Reality Affect High School Students' Learning Outcomes in Chemistry? (
198
Does Augmented Reality Affect High School Students’ Learning Outcomes in Chemistry? Submitted by Jonathan Christopher Renner A Dissertation Presented in Partial Fulfillment of the Requirements for the Degree Doctorate of Education Grand Canyon University Phoenix, Arizona June 11, 2014
-
Upload
independent -
Category
Documents
-
view
0 -
download
0
Transcript of Does Augmented Reality Affect High School Students' Learning Outcomes in Chemistry? (

Does Augmented Reality Affect High School Students’ Learning Outcomes in
Chemistry?
Submitted by
Jonathan Christopher Renner
A Dissertation Presented in Partial Fulfillment
of the Requirements for the Degree
Doctorate of Education
Grand Canyon University
Phoenix, Arizona
June 11, 2014

All rights reserved
INFORMATION TO ALL USERSThe quality of this reproduction is dependent upon the quality of the copy submitted.
In the unlikely event that the author did not send a complete manuscriptand there are missing pages, these will be noted. Also, if material had to be removed,
a note will indicate the deletion.
Microform Edition © ProQuest LLC.All rights reserved. This work is protected against
unauthorized copying under Title 17, United States Code
ProQuest LLC.789 East Eisenhower Parkway
P.O. Box 1346Ann Arbor, MI 48106 - 1346
UMI 3628589
Published by ProQuest LLC (2014). Copyright in the Dissertation held by the Author.
UMI Number: 3628589

© by Jonathan Christopher Renner
All rights reserved.

Abstract
Some teens may prefer using a self-directed, constructivist, and technologic approach to
learning rather than traditional classroom instruction. If it can be demonstrated, educators
may adjust their teaching methodology. The guiding research question for this study
focused on how augmented reality affects high school students’ learning outcomes in
chemistry, as measured by a pretest and posttest methodology when ensuring that the
individual outcomes were not the result of group collaboration. This study employed a
quantitative, quasi-experimental study design that used a comparison and experimental
group. Inferential statistical analysis was employed. The study was conducted at a high
school in southwest Colorado. Eighty-nine respondents returned completed and signed
consent forms, and 78 participants completed the study. Results demonstrated that
augmented reality instruction caused posttest scores to significantly increase, as
compared to pretest scores, but it was not as effective as traditional classroom instruction.
Scores did improve under both types of instruction; therefore, more research is needed in
this area. The present study was the first quantitative experiment controlling for
individual learning to validate augmented reality using mobile handheld digital devices
that affected individual students’ learning outcomes without group collaboration. This
topic was important to the field of education as it may help educators understand how
students learn and it may also change the way students are taught.
Keywords: augmented reality simulation, comparison group, pretest, posttest,
traditional classroom instruction, quantitative, quasi-experimental
v
Acknowledgements
The journey to gain my doctorate would not have been possible without the
assistance and encouragement from several people: my parents, Dr. Andrew McGill
(dissertation chair), Dr. Alberto Flores (colleague and friend), Dr. Chris Holden (for his
personal assistance with ARIS), and Anovisions (APA editor and statistician).
vi
Table of Contents
List of Tables .......................................................................................................................x
List of Figures .................................................................................................................... xi
Chapter 1: Introduction to the Study ....................................................................................1
Introduction ..................................................................................................................1
Background of the Study ..............................................................................................4
Problem Statement .......................................................................................................7
Purpose of the Study .....................................................................................................9
Research Question and Hypotheses ...........................................................................11
Advancing Scientific Knowledge ...............................................................................15
Significance of the Study ...........................................................................................17
Rationale for Methodology ........................................................................................19
Nature of the Research Design for the Study .............................................................20
Definition of Terms ....................................................................................................24
Assumptions, Limitations, Delimitations ...................................................................29
Summary and Organization of the Remainder of the Study ......................................32
Chapter 2: Literature Review .............................................................................................34
Introduction ................................................................................................................34
Background to the Problem ........................................................................................35
Theoretical Foundations .............................................................................................38
Theories of learning. ..........................................................................................40
Technology in education. ..................................................................................44
Review of the Literature .............................................................................................46
vii
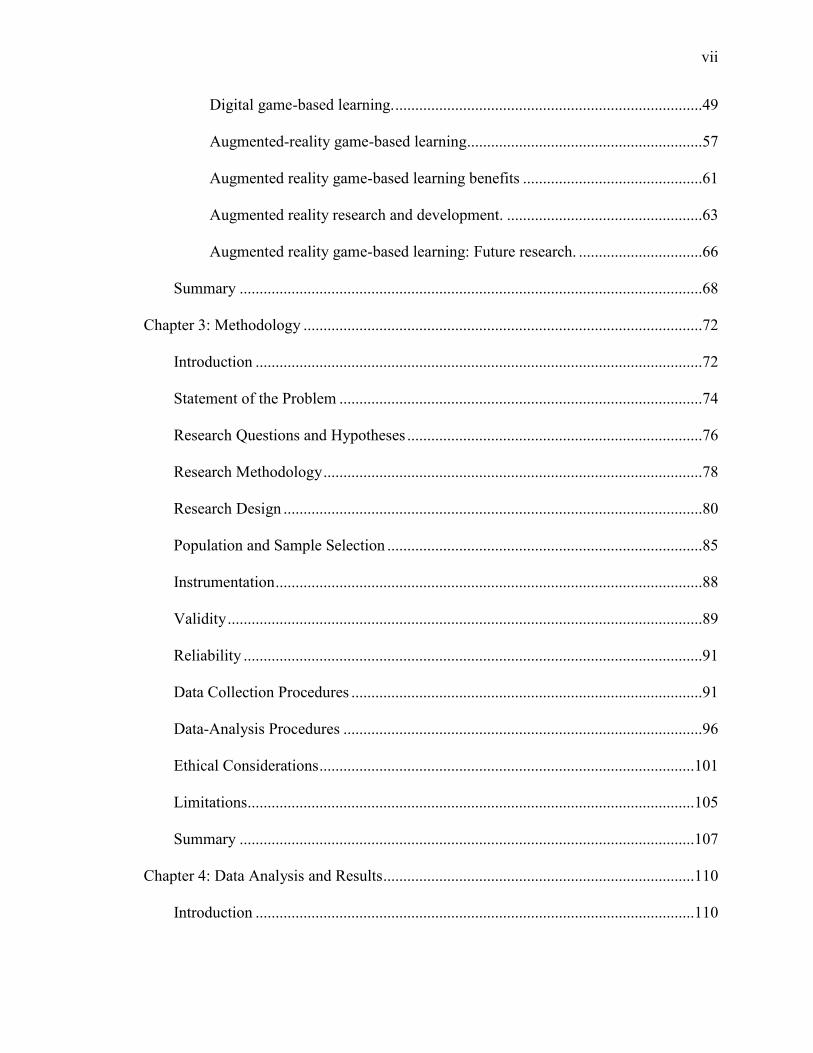
Digital game-based learning. .............................................................................49
Augmented-reality game-based learning ...........................................................57
Augmented reality game-based learning benefits .............................................61
Augmented reality research and development. .................................................63
Augmented reality game-based learning: Future research. ...............................66
Summary ....................................................................................................................68
Chapter 3: Methodology ....................................................................................................72
Introduction ................................................................................................................72
Statement of the Problem ...........................................................................................74
Research Questions and Hypotheses ..........................................................................76
Research Methodology ...............................................................................................78
Research Design .........................................................................................................80
Population and Sample Selection ...............................................................................85
Instrumentation ...........................................................................................................88
Validity .......................................................................................................................89
Reliability ...................................................................................................................91
Data Collection Procedures ........................................................................................91
Data-Analysis Procedures ..........................................................................................96
Ethical Considerations ..............................................................................................101
Limitations ................................................................................................................105
Summary ..................................................................................................................107
Chapter 4: Data Analysis and Results ..............................................................................110
Introduction ..............................................................................................................110
viii
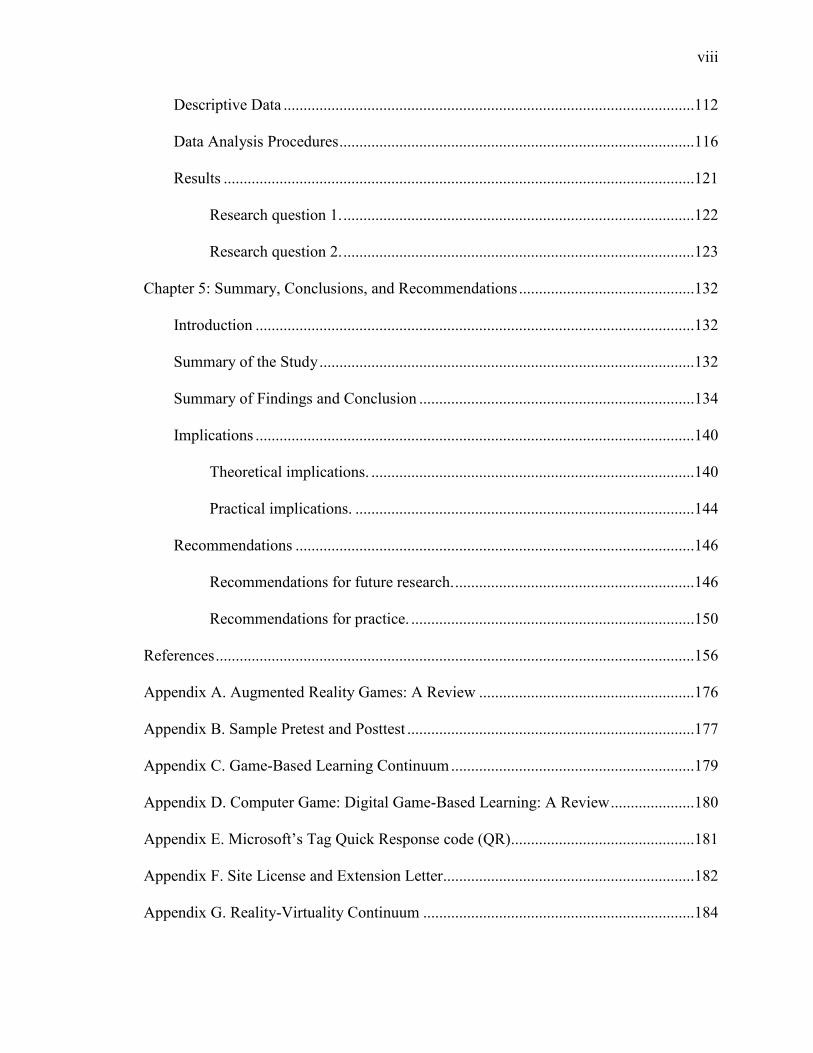
Descriptive Data .......................................................................................................112
Data Analysis Procedures .........................................................................................116
Results ......................................................................................................................121
Research question 1. ........................................................................................122
Research question 2. ........................................................................................123
Chapter 5: Summary, Conclusions, and Recommendations ............................................132
Introduction ..............................................................................................................132
Summary of the Study ..............................................................................................132
Summary of Findings and Conclusion .....................................................................134
Implications ..............................................................................................................140
Theoretical implications. .................................................................................140
Practical implications. .....................................................................................144
Recommendations ....................................................................................................146
Recommendations for future research. ............................................................146
Recommendations for practice. .......................................................................150
References ........................................................................................................................156
Appendix A. Augmented Reality Games: A Review ......................................................176
Appendix B. Sample Pretest and Posttest ........................................................................177
Appendix C. Game-Based Learning Continuum .............................................................179
Appendix D. Computer Game: Digital Game-Based Learning: A Review .....................180
Appendix E. Microsoft’s Tag Quick Response code (QR)..............................................181
Appendix F. Site License and Extension Letter...............................................................182
Appendix G. Reality-Virtuality Continuum ....................................................................184

ix
Appendix H. Sample Data Collection Ledger for Pretest and Posttest ............................185
Appendix I. Same Content: Lesson Outline for Instructional Methodologies.................186
x
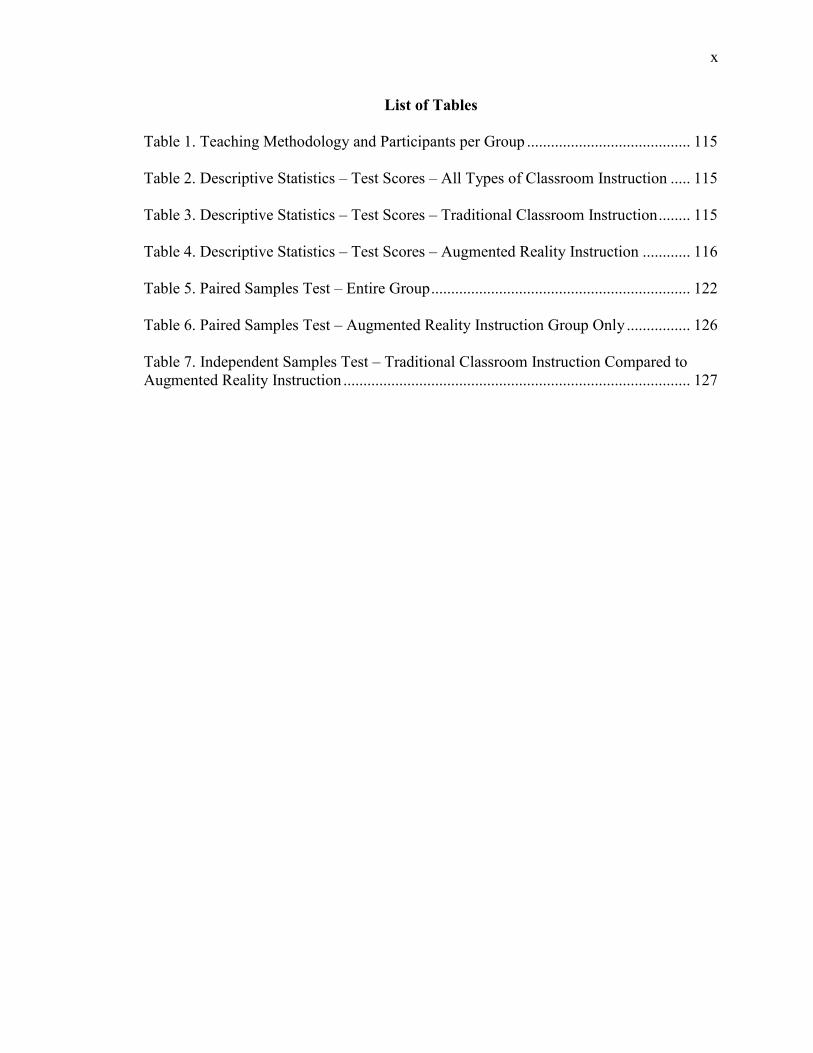
List of Tables
Table 1. Teaching Methodology and Participants per Group ......................................... 115
Table 2. Descriptive Statistics – Test Scores – All Types of Classroom Instruction ..... 115
Table 3. Descriptive Statistics – Test Scores – Traditional Classroom Instruction ........ 115
Table 4. Descriptive Statistics – Test Scores – Augmented Reality Instruction ............ 116
Table 5. Paired Samples Test – Entire Group ................................................................. 122
Table 6. Paired Samples Test – Augmented Reality Instruction Group Only ................ 126
Table 7. Independent Samples Test – Traditional Classroom Instruction Compared to Augmented Reality Instruction ....................................................................................... 127
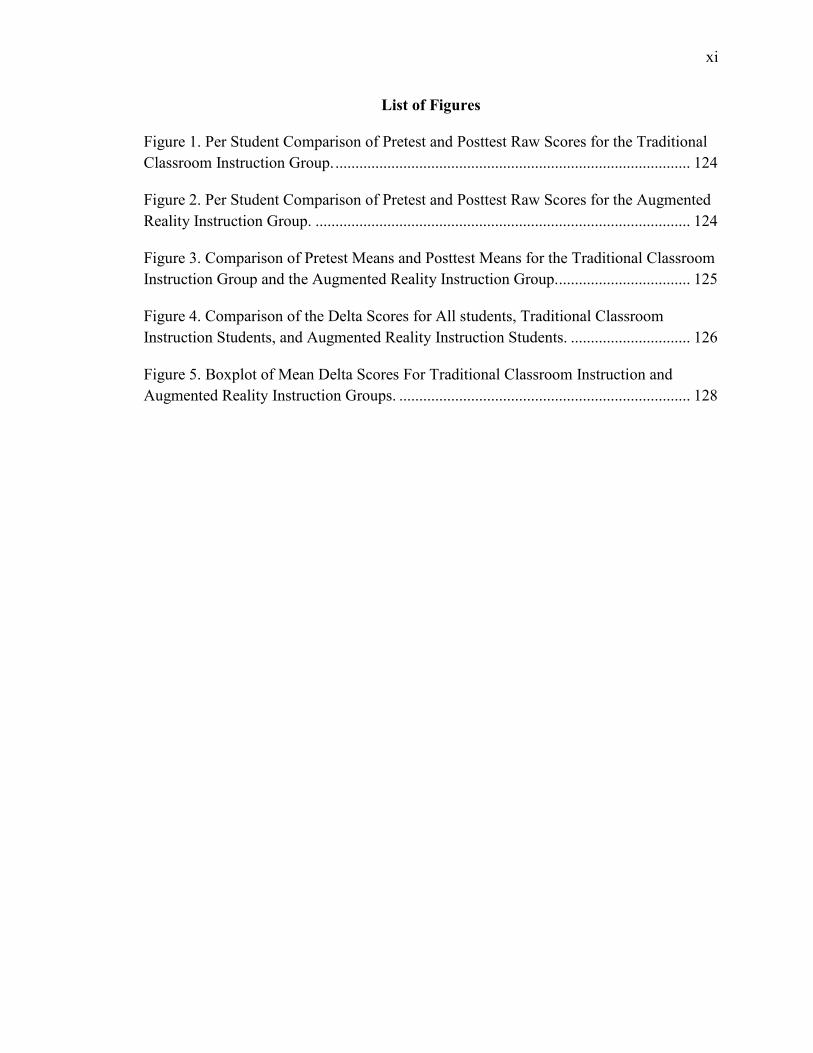
xi
List of Figures
Figure 1. Per Student Comparison of Pretest and Posttest Raw Scores for the Traditional Classroom Instruction Group. ......................................................................................... 124
Figure 2. Per Student Comparison of Pretest and Posttest Raw Scores for the Augmented Reality Instruction Group. .............................................................................................. 124
Figure 3. Comparison of Pretest Means and Posttest Means for the Traditional Classroom Instruction Group and the Augmented Reality Instruction Group.................................. 125
Figure 4. Comparison of the Delta Scores for All students, Traditional Classroom Instruction Students, and Augmented Reality Instruction Students. .............................. 126
Figure 5. Boxplot of Mean Delta Scores For Traditional Classroom Instruction and Augmented Reality Instruction Groups. ......................................................................... 128
1
Chapter 1: Introduction to the Study
Introduction
There may be a disconnection between the learning style of some students and the
way in which they are being taught. These students include the Millennial Generation,
also known as Generation Y, who were born in the early 1980s and the newest
generation, Generation Z or the Silent Generation, who were born in early 2000s (Jones,
Jo, & Martin, 2007). These generations have been given the nickname “digital natives”
(Kennedy, Judd, Churchward, Gray, & Krause, 2008, p. 108; Van Eck, 2006). Digital
natives use technology in a variety of ways from e-mail, texting, and social networking to
file-sharing, creating documents, and the playing of computer games. Adolescents and
young adults today are almost inseparable from their favorite technological devices. A
short observation of most schools, libraries or public spaces will yield several situations
in which people are using their favorite technology, such as networking on Facebook
(2012), listening to music on iPods, playing Massively Multiplayer Online Games
(MMOG), and accessing applications. All a person needs is the Internet and a device like
a Smartphone, tablet, laptop or desktop computer to access information digitally.
Some students use the available technology to acquire knowledge through
discovery, collect information from multiple sources, integrate the visual with the spatial
(Oblinger & Oblinger, 2005), and seek self-directed learning experiences (Dieterle, Dede,
& Schrier, n.d.). Thus, this learning style may be in direct conflict with traditional
classroom instruction. Traditional classroom instruction has been characterized as an
educator-led activity (Tinzmann et al., 1990), and identified as guided instruction. If
some students seek self-directed learning experiences that are technology-based, then
2
their learning style is not conducive to educator-led, traditional classroom instruction.
These students may prefer a learning format that follows a constructivist, game-based
learning approach. This study investigated game-based learning, specifically an
augmented-reality simulation, compared with traditional classroom instruction. The
guiding research question for this study was: Does augmented reality affect high school
students’ learning outcomes in chemistry, as measured by a pretest and posttest
methodology when ensuring that the individual outcomes are not the result of group
collaboration.
This study contributed to the existing knowledge about game-based learning, and
specifically augmented reality game-based learning, because previous studies were not
conclusive as to how augmented reality games improved individual students’ learning
outcomes without group collaboration. Previous studies that investigated augmented
reality game-based learning used groups of two to eight participants working
collaboratively (see Appendix A), but learning was not assessed (Dunleavy, Dede, &
Mitchell, 2009; Klopfer & Squire, 2008; Rosenbaum, Klopfer, & Perry, 2007; Schrier,
2006; Squire & Jan, 2007). Four studies were found that investigated augmented reality
and learning outcomes: Tamsui (Chang, Wang, Lin, & Yang, 2009), Frequency 1550
(Huizenga, Admiraal, Akkerman, & ten Dam, 2009), Beetle Breeders, Beasties, Island
Hoppers, and Chomp (Rosenheck & Perry, 2012), and Human Digestive System
(Vilkoniene, 2009). These studies are further discussed in Chapter 2: Literature Review,
on pages 65, 65, 64, and 65, respectively. Of these studies, Chang, Wang, Lin, & Yang
(2009), Huizenga, Admiraal, Akkerman, & ten Dam (2009), and Vilkoniene (2009)
demonstrated positive learning outcomes. None of these four studies controlled for
3
collaboration or ensured that the individual outcomes were not the result of group
collaboration (see Appendix A). Therefore, omissions found in the existing literature
center on the lack of evidence of individual-learning outcomes from augmented reality
games using handheld digital devices. The present study would become the first
quantitative experiment controlling for individual learning to validate augmented reality
using mobile handheld digital devices that affect individual students’ learning outcomes
without group collaboration.
This topic is important to the field of education as it may help educators
understand how students learn and it may also change the way students are taught.
Augmented reality is expanding with the creation of new technologies and has not been
extensively researched as to how it affects individual student learning, in contrast to
traditional classroom learning. Because augmented reality has qualities similar to today’s
computer games and is founded in game-based learning research, this researcher
hypothesized that learning will occur. Additionally important, the findings of this study
may reshape how students are taught in the classroom. Currently, teaching is mainly an
educator-led, guided, two-dimensional or pen-and-paper process. This study
demonstrated that learning was three-dimensional or hands-on through an augmented
reality simulation.
This study analyzed a comparison group of high school students in a traditional
classroom setting with an approximately equal number of students in an experimental
group taught using an augmented reality simulation. Both groups investigated the same
subject matter: Alpha, Beta, and Gamma radiation. The chemistry classroom instructor
created two equal-ability groups based on participants’ science grade-point average
4
(GPA). One group became the comparison group and the other became the experimental
group. All participants were given a 20-minute pretest before the treatment (see
Appendix B). After the treatment, participants were given a 20-minute posttest. The
posttest contained the same questions as the pretest, but in a randomized order. Data
collected from the two groups were analyzed using SPSS software (IBM Corporation,
2011).
This chapter contains information regarding the background of the study, as well
as introduces the problem statement, the purpose of the study, the research question and
hypotheses. This is followed by a brief discussion on how this study advances scientific
knowledge, its significance, rationale and methodology, the nature of the research design,
and assumptions, limitations, and delimitations. Chapter 1 concludes with a summary
and description of organization of the remainder of the study.
Background of the Study
Technological innovations have changed the way some people today live, work,
and learn. According to Nagel (2010) “About half of all public schools in the United
States are using computing technology in some way as part of instruction,” (p. 1). The
Pew Research Center’s Internet and American Life Project conducted a nationally
representative survey of 802 teens between the ages of 12 and 17. This work indicated
that 9 in 10 teens have a computer or access to a computer at home, and 3 in 4 teens use
mobile digital devices, like Smartphones and tablets, at least occasionally, to access the
Internet (Madden, et. al. 2013). These teens are considered digital natives (Dede, 2005;
Kennedy et al., 2008; Van Eck, 2006) and pervasive users of technology (Oblinger, 2003;
Willems, 2009). To prepare these digital natives for the technologic workplace, “students
5
must be able to gather information from any format and make sense of that information,
use it, and communicate it to others” (Stripling, 2010, p. 16). These ideals are further
outlined by The Partnership for 21st Century Skills (2011), which seeks realignment in
curricula to prepare students for the technologic workplace of the 21st century. These
new skills include critical thinking, communication, creativity, and information and
media literacy (Partnership for 21st Century Skills, 2011).
The changing needs and skills of students may require a shift in the style of
learning and teaching currently being implemented. Traditionally, classroom instruction
has been characterized as an educator-led, guided, paper-and-pencil process in which the
teacher stands in front of the class and lectures students who are sitting at rows of desks.
The teacher controls the learning by providing the materials and deciding the focus and
line of thought. In essence, learning is transmitted from the teacher to the student by drill
and practice or transcription and memorization. In contrast to the transmission of
knowledge as an educator-led process is the idea of minimal guidance or giving more
autonomy to the students in controlling the learning process. In this case, the learner
becomes an active participant in their learning process, and the instructor is a guide or
facilitator for the learner (Dieterle et al., n.d.; Siemens, 2008). The minimally guided
approach to learning, or constructivist view of teaching, advocates that learning takes
place in realistic settings, with hands-on activities, and in designed situations where
learners create sense by constructing knowledge in their own context (Siemens, 2008).
This learning style has been classified as neomillennial (Dieterle et al., n.d.; Oblinger &
Oblinger, 2005; Sankey, 2006) and may be in conflict with traditional classroom
instruction.

6
One method for integrating technology into the classroom is through the use of
game-based learning (GBL). GBL can be described as any game that entertains with
educational aims (Susi, Johannesson, & Backlund, 2007). Games for GBL can range
from card games, board games, and digital computer games, which include professionally
produced software games, as well as commercial off-the-shelf games, Internet-based
games, and augmented-reality games (see Appendix C). GBL using digital computer
games and its ability to increase students’ learning outcomes were investigated at Rice
University (2012), and by the following authors: Kaufman, Suave, and Renaud (2011);
Foster (2011); Carr and Bossomaier (2011); Kebritchi, Hirumi, and Bai (2010); Tuzun,
Yilmaz-Soylu, Karakus, Inal, and Kizikaya (2009); Cheung et al. (2008); Yip and Kwan
(2006); Barnett, Squire, Higgenbotham, and Grant (2004); and Dede, Nelson, Ketelhut,
Clark, and Bowman (2004); see Appendix D. To demonstrate that computer games can
provide students’ learning outcomes, the science computer games Supercharged (Jenkins
& Henrichs, 2003), Nothing to Rave About (Rice University, 2012), and River City
(Harvard University, 2007) are discussed further in Chapter 2: Literature Review, starting
on page 50.
Augmented reality has been considered one of the newest forms of and a
progressive step in GBL. Augmented reality can be defined as “the ability to overlay
computer graphics onto the real world” (Billinghurst, 2002, p. 1), and as a “technology
that allows computer-generated virtual imagery information to be overlaid onto a live
direct or indirect real-world environment in real time” (Lee, 2012, p. 13). A review of
literature on augmented reality GBL revealed several studies that used groups of two to
eight participants, but in which learning was not assessed (Dunleavy et al., 2009; Klopfer
7
& Squire, 2008; Rosenbaum et al., 2007; Schrier, 2006; Squire & Jan, 2007). Rosenheck
and Perry (2012), Vilkoniene (2009), Chang et al. (2009), and Huizenga et al. (2009)
used mobile handheld digital devices and investigated augmented reality games and
learning, but group learning was unidentified or uncontrolled. Either the author/s did not
clarify whether the learning occurred through individual or group learning methods or the
authors did not limit or control the study for individual or group learning outcomes. The
full literature review provided in Chapter 2 shows that there is a lack of quantitative
research on the learning outcomes of students participating in augmented reality GBL.
Augmented reality games may provide a means for teaching complex concepts
because they are placed in an “authentic [real-world] learning environment where
participants can work on realistic problems while interacting with other participants, the
physical environment and actual data” (Schrier, 2006, p. 7). Thus, augmented reality
simulations are ideally placed to teach 21st century skills. This study investigated
individual students’ outcomes without group collaboration and the statistical variance
between traditional classroom instruction and an augmented reality simulation.
Problem Statement
The Program for International Student Assessment (2009) reported that the United
States scored 17th out of 34 countries in science. Since this report, researchers have been
seeking to understand and find ways to improve science education in the United States.
Desy, Peterson, and Brockman (2011) suggested educators build interest in science by
integrating hands-on, experiential activities that are fun, engaging, and simulate science
processes and careers. Doulík and Škoda (2009) suggested that science education should
arise from students’ interests, be focused on a common core curriculum that is covered
8
thoroughly, have an interdisciplinary approach, and develop science skills. Despite the
abundance of researchers’ suggestions, the over-arching problem of increasing students’
science outcomes is still a challenge.
Some teens, such as those classified above as digital natives, may prefer using a
self-directed, constructivist, and technologic approach to learning rather than traditional
classroom instruction. The educational system in the United States is a system of
assessments based on individual-student outcomes, demonstrated by standardized testing.
If it can be demonstrated that augmented reality simulations without group collaboration
can produce greater individual-student outcomes compared to outcomes from traditional
classroom instruction without group collaboration, then educators may change their
teaching methodology to better meet the neomillennial learning style. In addition,
although working in groups does provide benefits to the learner, students still have to be
able to process and solve problems individually. Augmented-reality simulations may
become an effective learning tool to increase individual learning outcomes without group
collaboration, but more research needs to be conducted to determine if augmented-reality
simulations can yield positive individual-student outcomes.
This study has been designed to investigate augmented reality games and
associated student learning outcomes. There are two primary differences between this
study and previous studies. First, this study investigated individual-learner outcomes
rather than collaborative outcomes. Secondly, this study compared two groups: those
receiving traditional classroom instruction and those receiving an augmented reality
simulation. It is important to investigate if individual students learned more effectively in

9
an augmented reality setting without group collaboration when compared to a baseline
measurement such as a traditional classroom setting.
It was not known to what extent augmented reality could be used to further high
school students’ learning outcomes in chemistry as compared to traditional classroom
instruction, as measured by a pre- and posttest methodology without group collaboration.
This study, based on the comparison of educational results from students in a traditional
classroom setting to those in an augmented reality simulation setting, has helped to
address the problem of meeting the changing needs of students. Because some of today’s
students engage in a neomillennial learning style, augmented reality simulations that are
created for individual-learning situations may result in enhanced student outcomes. The
findings of this study have also increased understanding of the problem by demonstrating
that augmented reality simulations do not always need to be conducted in collaborative
groups. However, it has yet to be shown whether augmented reality can improve
individual students’ outcomes without group collaboration, as compared to those
receiving traditional classroom instruction. Until research shows that students can benefit
from a neomillennial learning approach, a disconnect may still exist between teaching
methods and some students’ learning outcomes in science.
Purpose of the Study
The purpose of this quasi-experimental, quantitative, pre-and posttest design
study was twofold. The first purpose was to determine if learning occurred with
augmented reality instruction. The second purpose was to examine if there was a
difference in approximately 50 students’ learning outcomes between an augmented
reality simulation and traditional classroom instruction in the chemistry topic of Alpha,
10
Beta, and Gamma radiation, as measured by a pre- and posttest methodology without
group collaboration in southwest Colorado. Traditional teaching methods may no longer
be the most appropriate for digital natives and students who are familiar with acquiring
knowledge using technological advances. Augmented reality simulations, as a form of
minimally guided education, may be better suited for teaching students the skills they
need to work and function in a more technologically minded world. However, little
research exists showing the direct benefits of augmented reality education. In addition,
since previous studies looking at augmented reality sought to demonstrate that students
learn collaboratively (Klopfer, Squire, Perry, & Jan, 2005; Rosenbaum et al., 2007), this
study sought to control for individual learning without group collaboration to discern if
augmented reality, using mobile handheld digital devices, positively affects individual
students’ learning outcomes in science.
In order to determine the impact of augmented reality simulations, learning
outcomes of approximately 50 high school students from a southwest Colorado high
school were assessed. In doing so, the results from a comparison group of students in a
traditional instructional setting have been compared to an experimental group of students
using an augmented reality simulation. For this study, the instructional methodology was
the independent variable. Jha (2008) described the independent variable “as a factor that
the researcher controls; the researcher can choose what it should be and can manipulate it
to study the effect that it causes” (p. 28). Wetcher-Hendricks (2011) described the
independent variable as “the predictor of behaviors, attitudes, or characteristics; a given
condition either already existing or created by the researcher before the start of data
gathering” (p. 5). For this study, the dependent variable was the level of students’

11
learning outcomes as measured by the difference in the pre- and posttests. The dependent
variable was responsible or depended upon the independent variable (Jha, 2008). As
Wetcher-Hendricks (2011) described, the dependent variable is the “behaviors attitudes,
characteristics predicted by the independent variable” (p. 5).
This study included t tests (paired t tests and independent samples t tests). In
doing so, this study focused attention on the means being tested, the “delta” values. Delta
is the difference between the pretest and posttest score (posttest minus pretest). The goal
of this study was to determine if a statistically significant difference existed between the
comparison and experimental group in students’ learning outcome without group
collaboration.
This study has advanced the understanding of how augmented reality can enhance
students’ learning outcomes. Omissions found in the existing literature center on the lack
of evidence of individual-learning outcomes from augmented reality games using
handheld digital devices without group collaboration. This study sought to address the
void in existing augmented reality research. This study has become the first quantitative
quasi-experimental research controlling for individual learning without group
collaboration to validate augmented reality using mobile handheld digital devices. By
doing so, this study attempted to determine if this type of augmented reality teaching
positively affects individual students’ learning outcomes, without group collaboration.
Research Question and Hypotheses
The research questions in this study were developed to answer the overall goal of
assessing whether augmented reality simulations without group collaboration have an
impact on student learning outcomes as compared to traditional classroom instruction
12
without group collaboration. Specifically, this study looked at high school students and
their pre- and posttest results regarding the chemistry topic of Alpha, Beta, and Gamma
radiation. Comparing test scores of students in a comparison group, who received
traditional classroom instruction, to those in an experimental group, who received an
augmented reality simulation, provided the basis for assessing the impacts of the
treatment under examination. The null and alternative hypotheses provided the basis for
study design and development of methodology. Statistical analysis of the test scores for
each group provided a quantitative comparison of the groups’ results and was used to
accept or reject the null hypothesis.
The following research questions and associated hypotheses guided this
quantitative study:
RQ1: Does augmented reality affect high school students’ learning outcomes in
chemistry, as measured by a pre- and posttest methodology when ensuring that
the individual outcomes are not the result of group collaboration? Testable
hypotheses were then developed to answer this question; these were:
H10: Augmented reality has no impact on students’ learning outcomes.
H11: Augmented reality has a positive impact on students’ learning outcomes.
H12: Augmented reality has a negative impact on students’ learning outcomes.
RQ2: Does augmented reality instruction or traditional classroom instruction have
a greater positive impact on high school students’ learning outcomes in chemistry,
as measured by a pre- and posttest methodology when ensuring that the individual
outcomes are not the result of group collaboration? The hypotheses associated
with this RQ were:

13
H20: Augmented reality instruction and traditional classroom instruction have the
same impact on students’ learning outcomes.
H21: Augmented reality instruction has a greater positive impact on students’
learning outcomes than traditional classroom instruction.
H22: Traditional classroom instruction has a greater positive impact on students’
learning outcomes than augmented reality instruction.
Data were collected from a test administered before and after the treatment. The
treatment was the instructional methodology. For this study, there were two instructional
methodologies: traditional classroom instruction, that is a teacher-led activity, and an
augmented reality simulation, that is a participant-led activity. The traditional classroom
instruction was conducted by the high school’s science teacher and the augmented reality
simulation was created by this researcher. All participants completed a pretest before the
activity. Following the traditional classroom instruction or augmented-reality simulation,
the posttest was given to measure student outcome or acquired knowledge. The pre- and
posttests were comprised of the same questions, but rearranged. This process provided a
way of measuring knowledge acquired from the treatment, either through classroom
instruction or augmented reality simulations. SPSS software (IBM Corporation, 2011)
was used to compile and analyze the data.
In development of the research question, this researcher considered theories of
learning and the role of technology, its feasibility, novelty, ethicality, and relevance. It
has been stated that traditional instruction is an educator-led process (Tinzmann, et. al.,
1990). In contrast, augmented reality can be used as an autonomous approach of learning
that utilized minimal guidance where the learner became an active participant in his/her

14
own learning process (Dieterle et. al., n.d.; Siemens, 2008). This learning methodology
was founded in the constructivist principles of Dewey (1910), Piaget (1947), and
Vygotsky (Dalgarno, 2002). By integrating handheld digital devices in a self-led
constructivist learning process, as previously demonstrated by researchers (see Appendix
A), this study sought to investigate a constructivist approach to learning, specifically one
that uses technology; iPod touches. Gaps in the existing literature generally centered on
the lack of evidence for the influence of augmented reality games on individual learning
outcomes. By conducting this study, the findings may provide new information through
the use of a comparison group (traditional classroom instruction) and an experimental
group (augmented reality simulation). The research questions in this study were
developed to answer the overall goal of assessing whether augmented reality simulations
without group collaboration have an impact on student learning outcomes as compared to
traditional classroom instruction without group collaboration.
The closest high school to attain a sample for the proposed study is one located in
southwest Colorado. The high school’s student population for the 2012–2013 academic
year was 215 students. This population was expected to support a sample of sufficient
size. The second consideration was novelty; asking if the study confirmed, refuted,
extended, or provided new findings. This study sought to extend the body of knowledge
by investigating individual students’ learning outcomes without group collaboration. A
third consideration concerned ethics. Because the study’s participants are high school
students, informed consent was necessary, and all data was coded for confidentiality. A
final consideration was determining if the research questions were relevant. The research
questions were relevant because they added to the scientific knowledge base of teaching
15
methodologies: traditional classroom instruction compared with a mobile augmented
reality simulation without group collaboration. Additionally, answers to this research
question provide direction for future research.
Advancing Scientific Knowledge
The results of this study have advanced scientific knowledge related to augmented
reality in the field of education, by providing a quantitative study on individual students’
learning outcomes without group collaboration. Previous studies that focused on
augmented reality simulations and learning in education used collaborative groups, but
either no learning was assessed (Dunleavy et al., 2009; Klopfer & Squire, 2008;
Rosenbaum et al., 2007; Schrier, 2006; Squire & Jan, 2007), or learning was assessed but
not controlled for collaboration (Chang et al., 2009; Huizenga et al., 2009; Rosenheck &
Perry, 2012, Vilkoniene, 2009). The findings of this study provide new information
through the use of a comparison group (traditional classroom instruction) and an
experimental group (augmented reality simulation). Comparing the test results of these
two groups demonstrated if there was a significant difference between traditional
classroom instruction and an augmented-reality simulation in science individual-learning
outcomes without group collaboration.
The work conducted in this study has been based on theories of learning and the
role of technology set forth by previous researchers. Specifically, this study compares
two learning methodologies: traditional instruction as an educator-led process (Tinzmann,
et. al., 1990) to an autonomous approach of learning that utilized minimal guidance
where the learner became an active participant in his/her own learning process (Dieterle
et. al., n.d.; Siemens, 2008). This learning methodology was founded in the constructivist
16
principles of Dewey (1910), Piaget (1947), and Vygotsky (Dalgarno, 2002). By
integrating handheld digital devices in a self-led constructivist learning process, as
previously demonstrated by researchers (see Appendix A), this study sought to
investigate a constructivist approach to learning, specifically one that uses technology.
In Chapter 2, the theoretical foundations for understanding how students may be
able to improve their learning experience by engaging as an active participant and
constructing knowledge from their experiences, rather than through traditional classroom
teaching, is explained further. Chapter 2 also presents a review of the literature
surrounding the use of GBL and augmented reality in education, and as such, provides
the basis for the approach chosen for this study. The findings of this study have advanced
the understanding of constructivist learning, and specifically quantified the influence of
using augmented reality on digital hand held devices for improving learning outcomes of
students.
It is not yet known how augmented reality can be used to further high school
students’ learning outcomes in chemistry, without group collaboration. Currently,
teaching is primarily a two-dimensional, pen-and-paper process of traditional classroom
instruction. This study focuses on an alternative method of education, one that employs a
neomillennial approach of minimal guidance that may be better suited to digital natives
and students who prefer the use of new technologies. Here the augmented reality
simulations that form the basis of the experimental treatment incorporate a layer of three-
dimensional digital images imposed on the real-world environment. The findings may
demonstrate whether this type of non-traditional learning enhance students’ outcomes
without group collaboration.
17
Significance of the Study
Augmented reality has been introduced as a possible tool for improving learning
experiences and outcomes for students. It is known that the use of augmented reality in
education draws on research from computer games and their ability to increase student
learning (Carr & Bossomaier, 2011; Cheung et al., 2008; Foster, 2011; Kaufman et al.,
2011; Kebritchi et al., 2010; Tuzun et al., 2009; Yip & Kwan, 2006); these studies are
summarized in Appendix D. In addition to increasing learning outcomes, computer
games can be entertaining, educational, and encourage group learning (Billinghurst,
Hirokazu, & Poupyrev, 2001). Computer games can be motivating (Dede et al., 2004;
Squire, 2005), challenging, and fun (Squire, 2007a). They can be used to help teach
complex concepts (Barnett et al., 2004), provide students with the tools “to explore
complex systems, and to experiment with different possibilities and outcomes”
(Hoffmann, 2009, p. 21).
An important difference between computer games and augmented reality is that
augmented reality has “the ability to overlay computer graphics onto the real world”
(Billinghurst, 2002, p. 1). This is accomplished by using a digital device such as a
Smartphone, tablet, or computer to overlay the digital information on the real world. With
augmented reality, the computer game becomes a mobile, real-world, interactive
experience. As Livingston, Brown, Julier, and Schmidt (2006) stated, “an augmented
reality system mixes computer-generated graphics with the real world” (p. 25-1).
Augmented reality is perfectly suited for learning collaboratively or in groups (Dunleavy
et al., 2009; Klopfer & Squire, 2008; Rosenbaum et al., 2007; Schrier, 2006; Squire &
Jan, 2007). Rosenheck and Perry (2012), Vilkoniene (2009), Chang et al. (2009), and
18
Huizenga et al. (2009) conducted research into augmented reality and learning using a
quantitative methodology, but collaboration was undefined. However, studies of
individual students’ learning outcomes without group collaboration, where traditional
classroom instruction was compared to augmented reality simulations, have yet to be
conducted.
Gaps in the existing literature generally centered on the lack of evidence for the
influence of augmented reality games on individual learning outcomes. This study has
become the first quantitative experiment controlling for individual learning to validate the
use of augmented reality simulations, using mobile handheld digital devices, to influence
individual students’ learning outcomes without group collaboration. This researcher
predicted that an augmented reality simulation without group collaboration would
increase students’ performance outcomes, when compared to the outcomes of students
who receive traditional classroom instruction without group collaboration. Although this
hypothesis was not supported by the present research, this study was one of the first to
investigate the use of augmented-reality simulation, and therefore, still has an important
impact on the field, hopefully encouraging more research into the use of such
simulations. This study is valuable because today’s students have different interests from
those of previous generations. Some of today’s students may prefer learning that uses a
more hands-on and self-directed approach (Dieterle, n.d.; Oblinger & Oblinger, 2005)
that uses available technology to conduct their work, which contrasts with traditional
classroom instruction.
The results of this study did not support the null hypothesis (H10) that augmented
reality simulation had no impact on students’ outcomes without group collaboration. This
19
conclusion adds to the existing body of knowledge by showing that the group who
received the augmented reality simulation did achieve a significant positive outcome. The
second hypothesis (H20), stating that augmented reality instruction and traditional
classroom instruction have the same impact on students’ learning outcomes was also
rejected. However it was not shown that augmented reality significantly improved
learning as compared to traditional instruction. These results should encourage
continuing research into other uses and potential benefits of augmented reality
simulations.
Rationale for Methodology
A quantitative methodology was chosen for this study for its ability to compare
two groups statistically and quantify results for significance. The use of quantitative
methods allowed the findings of this study to be interpreted as statistically significant and
to be analyzed with more certainty as the true impacts of the treatment on the
experimental group. The quantitative methodology proposed here was suitable for this
study as it represents an experimental design that tested observed measurements: it
measured pre- and posttest scores, used equivalent groups (a comparison group verses an
experiment group), and tested both groups simultaneously (Campbell & Stanley, 1966).
A mixed-methods design was sometimes used when a quantitative or qualitative method
was inadequate (Vogt & Burke-Johnson, 2011). Because the quantitative design met the
needs for this study, a mixed-methods design was not considered. For these reasons, this
researcher believed that this research design was the best suited for answering the
research question proposed in this study.
20
Previous studies that investigated augmented reality game-based learning used
groups of two to eight participants working collaboratively (see Appendix A), but
learning was not assessed (Dunleavy, Dede, & Mitchell, 2009; Klopfer & Squire, 2008;
Rosenbaum, Klopfer, & Perry, 2007; Schrier, 2006; Squire & Jan, 2007). Four studies
were found that investigated augmented reality and learning outcomes. Tamsui (Chang,
Wang, Lin, & Yang, 2009), Frequency 1550 (Huizenga, Admiraal, Akkerman, & ten
Dam, 2009), Beetle Breeders, Beasties, Island Hoppers, and Chomp (Rosenheck & Perry,
2012), and Human Digestive System (Vilkoniene, 2009); these are all discussed in detail
in Chapter 2: Literature Review. Of these studies, Chang, Wang, Lin, and Yang (2009),
Huizenga, Admiraal, Akkerman, and ten Dam (2009), and Vilkoniene (2009)
demonstrated positive learning outcomes. Yet, none of these four studies controlled for
collaboration or ensured that the individual outcomes were not the result of group
collaboration (see Appendix A). Therefore, omissions found in the existing literature
center on the lack of evidence of individual-learning outcomes from augmented reality
games using handheld digital devices. The present study would become the first
quantitative experiment controlling for individual learning to validate augmented reality
using mobile handheld digital devices that affect individual students’ learning outcomes
without group collaboration.
Nature of the Research Design for the Study
This study utilized a quasi-experimental, pre -and posttest, quantitative research
design that compared a group of traditional classroom students without group
collaboration with a group who used an augmented-reality simulation without group
collaboration. Using a comparison group and an experimental group, this researcher was
21
able to establish a baseline to assess whether an improvement in learning outcomes
occurred with the implementation of the experimental treatment. Without a comparison
group, relative improvement or lack thereof cannot be established.
The justification of using a quasi-experimental, pre- and posttest design for this
study was a process in which participants are not randomly assigned to groups, but rather
are purposely assigned to groups; this is defined as quasi-experimental (Shadish, Cook, &
Campbell, 2002). For this study, the high school chemistry teacher assigned students to
groups based on their cumulative science GPA (Panoutsopoulos & Sampson, 2012).
Assigning groups based on the science GPA, instead of randomly, has the goal of
forming two groups with participants of similar ability, so that a similar baseline of
ability is established between the groups.
In a pre- and posttest design, two groups participate, measurements are taken
before and after an activity, and data analyses determines if one group’s posttest scores
differed more significantly from the pretest scores than the other group’s scores
(Weinfurt, 2000). Here the tests (pre- and posttest) were administered to both the
experimental group and the comparison group before the activity and immediately after
the activity. The comparison group received traditional classroom instruction and the
experimental group received the augmented-reality simulation, both covering the same
lesson. As a quantitative study, the methodology was developed so as to numerically
compare the results of a comparison group (traditional classroom instruction) with an
experimental group (augmented-reality simulation). Both groups worked independently
and without group collaboration. This researcher observed all aspects of the pretest,
22
activity, and posttest to assure all participants worked in compliance with the
methodology, which is fully described in Chapter 3.
This methodological framework of the pretest-posttest comparison group was
chosen for this study because it is “one of the most extensively used methods to evaluate
clinical research” (Gliner, Morgan, & Harmon, 2003, p. 500). As seen in previous
educational studies (Landrum & Chastain, 1998; Tieso, 2005), the pretest-posttest
comparison group design is an effective means for comparing curricular methods
between two groups. For this study, as described by Jha (2008), “the motivating purpose
was theory testing” (p. 49). Therefore, for this study I used a quantitative approach. The
study was developed similarly to the process described by Jha: he said it
begins with a theory. From theory, prior research is reviewed; from theoretical
frameworks hypotheses are generalized … Hypotheses lead to data collection and
the strategy needed to test them and analyze according to the hypothesis …
Conclusions are drawn [that] confirm or conflict with the theory. (Jha, 2008, p.
49-50)
For this study, the factors were traditional classroom instruction as compared to an
augmented-reality simulation that both utilized the same curriculum. The outcome was
measured through a pre- and posttest methodology. Since the desired outcome of this
research was to determine if a statistical difference existed between the groups being
investigated, this study employed a quantitative design. In addition, the quantitative
design enhanced both the reliability and validity of the study (Lowhorn, 2007).
Validity and reliability of the pre- and posttest were claimed by the textbook
authors as subject matter experts (Glencoe Science White Paper, 2013; Hunt, 2013) and
23
the questions previous use demonstrated stability reliability. The tests were validated in
the present research where Cronbach’s alphas show reliabilities of .826 in the pretest and
.835 on the posttest.
The sample to be used in this study was comprised of approximately 50 high
school students. The classroom instructor divided participants into two groups of similar
ability based on participants’ cumulative science GPA. The comparison group then
experienced the traditional classroom instruction, while the experimental group
experienced an augmented reality simulation covering the same subject matter; Alpha,
Beta, and Gamma radiation. This quasi-experimental approach was used to ensure that
the mean test scores of the two groups are comparable and can be used to assess whether
or not there was a difference in learning that occurred between the two groups.
Data was collected through a pretest and posttest, which was then used to measure
knowledge acquired during the treatments. All participants took the pretest before the
activity. The pretest took approximately 20-minutes to complete. After the pretest, both
groups received 30 minutes of their corresponding treatment on the chemistry topic:
Alpha, Beta, and Gamma radiation. The comparison group received approximately 30
minutes of traditional classroom instruction while the experimental group received the
same curriculum, but in the form of an augmented reality simulation that also took 30
minutes to complete. Immediately after the activity, participants were given a posttest to
measure acquired knowledge. This researcher was present at the traditional classroom
instruction and augmented reality simulation to assure all participants learned
independently without group collaboration. The posttest consisted of the same questions
as the pretest, but in a randomized order. This method of data collection provided
24
numerical test results that could then be used to run statistical analyses to determine the
significance of differences seen in the scores of the two groups. When the study
concluded, a debriefing session was offered where participants had the opportunity to
experience the alternative treatment.
Definition of Terms
The history of augmented reality can be traced to the late 1960s (Johnson, Levine,
Smith, & Stone, 2010). As in other specialized fields such as medicine, law, and
manufacturing, education and technology have developed their own terminology. The
following terms were used operationally in this study:
Augmented reality. Augmented reality can be described as the ability to overlay
one or more computer graphics or virtual images onto a live direct or indirect real-world
environment while using a tool such as a digital device to provide additional information
to the user in real time (Billinghurst, 2002; Dunleavy et al., 2008; Klopfer & Squire,
2007; Laux, Trausch, & Wyatt, 2012; Lee, 2012; Shelton, 2002; Squire & Jan, 2007).
Augmented reality simulation. In conducting this study, this researcher
employed a marker-system, or a system of quick-response codes (QR). In this system,
participants used a handheld digital device (iPod Touch), and the digital device’s camera
focused on the QR code. The digital device then communicated wirelessly using a
Verizon Wireless Mi-Fi to Augmented Reality and Interactive Storytelling’s server
(ARIS; Gagnon, 2010). The ARIS server recognized the QR code and sent a special
digital image back to the handheld device with which the participant interacted. The goal
of the simulation was for students to use their existing knowledge and clues provided
during the simulation to learn about Alpha, Beta, and Gamma radiation. Similar to GBL,
25
augmented reality simulations are another way to engage students in learning (Lee,
2012).
Authentic learning. Schooling that is related to real-life situations and requires
teamwork, problem-solving skills, and the ability to organize and prioritize the tasks
needed to complete the project (Brandt & McBrien, 1997). Authentic learning “is based
on experimentation and action in which students solve real-world problems” (Lombardi
& Oblinger, 2007).
Collaboration. The term collaboration in this document refers to “face-to-face
collaboration in which people use speech, gesture, gaze, and non-verbal cues to attempt
to communicate” (Billinghurst, 2002, p. 1). For example, two or more students, or the
teacher with a student was communicating.
Comparison group. By definition, a “control group does not receive the
experimental treatment… are not exposed to any of the independent variable values”
(Jha, 2008, p. 33). Since the purpose of this study was to compare two instructional
methods, traditional classroom instruction with an augmented reality simulation, both
groups received a treatment. Therefore, the two groups have been referred to as the
comparison group, or traditional classroom instruction group, and the experimental
group, or augmented reality group.
Dependent variable. For this study, the dependent variable was the level of
students’ learning outcomes as measured by the difference in the pre- and posttests. The
dependent variable was responsible or depended upon the independent variable (Jha,
2008). As Wetcher-Hendricks (2011) described, the dependent variable is the “behaviors
attitudes, characteristics predicted by the independent variable” (p. 5).
26
Digital natives. Individuals who are part of the Millennial Generation (or
Generation Y) and Generation Z (or the Silent Generation) have been given the nickname
digital natives (Kennedy et al., 2008, p. 108; Van Eck, 2006). They are called digital
natives because they use technology in a variety of ways from e-mail, texting, file-
sharing, photo sharing, and the playing of games on a regular basis.
Independent variable. For this study, the independent variable was the
instructional methodology. Jha (2008) described the independent variable “as a factor that
the researcher controls; the researcher can choose what it should be and can manipulate it
to study the effect that it causes” (p. 28). Wetcher-Hendricks (2011) described the
independent variable as “the predictor of behaviors, attitudes, or characteristics; a given
condition either already existing or created by the researcher before the start of data
gathering” (p. 5).
Marker. A type of augmented reality system that uses a specialized symbol or a
distinct pattern that a camera captures or a computer recognizes, which is converted into
a three-dimensional object for investigation (Lee, 2012, p. 15). This code is shown in
Appendix E.
Neomillennial. The term refers to the learning style required for the new
millennium (Sankey, 2006). People who prefer this learning style learn through
discovery, collecting information from multiple sources (Oblinger & Oblinger, 2005),
and collaborating with others to solve authentic problems (Dieterle et al., n.d.). People
who use the neomillennial learning style would favor constructivist-teaching approaches.
Outcome. This is the intended result of schooling or that which students are
supposed to know and be able to do (Brandt & McBrien, 1997).
27
Pretest and posttest design. In a pre- and posttest design, two groups participate,
measurements are taken before and after an activity, and data analysis determined if one
group’s posttest scores differed more significantly from the pretest scores than the other
group’s scores (Weinfurt, 2000). Here the tests (pre- and posttest) are administered to
both the experimental group and the comparison group before the activity and
immediately after the activity, and both tests took participants approximately 20 minutes
to complete. The pretest was identical to the posttest with one exception: the questions
were in a different order (see Appendix B). The pre- and posttest were created using the
chemistry textbook’s ExamView Pro Testmaker CD-ROM (Chemistry: Matter and
Change, 2005). The pretest measured the participants’ baseline knowledge of Alpha,
Beta, and Gamma radiation. After the activity, the posttest was given to all participants.
The posttest was to measure acquired knowledge.
Twenty-first century skills. As outlined by the Partnership for 21st Century
Skills (2011), these skills include critical thinking, communication, collaboration,
creativity, and information and media literacy (Partnership for 21st Century Skills, 2011).
The goal of realigning curriculum with these skills is to prepare students for the
technologic workplace of the 21st century (Partnership for 21st Century Skills, 2011).
Traditional classroom instruction. In traditional classroom instruction, the
teacher is the giver of information; knowledge flows from the teacher to the student; and
the teacher is responsible for setting goals, designing learning tasks, and assessing what is
learned (Tinzmann et al., 1990).
Quasi-experimental research design. In a quasi-experimental design,
participants are not randomly assigned to groups, but rather, are purposely assigned to
28
groups (Shadish, Cook, & Campbell, 2002). For this study, the high school chemistry
teacher assigned students to groups based on their cumulative science GPA
(Panoutsopoulos & Sampson, 2012). Two groups were created with a similar number of
participants who previously received A, B, C, and below C grades. Assigning groups
based on the science GPA, instead of randomly, has the goal of forming two groups with
participants of similar ability, so that a similar baseline of ability is established between
the groups. One group will then become the comparison group and the other will become
the experimental group.
Quantitative research design. A quantitative research design could be described
as it beginning
with a theory. From theory, prior research is reviewed; from theoretical
frameworks, hypotheses are generalized … Hypotheses lead to data collection and
the strategy needed to test them and analyze according to the hypothesis …
Conclusions are drawn [that] confirm or conflict with the theory. (Jha, 2008, p.
49-50)
In this study, the factors were the educational treatments applied to students participating
in a chemistry lesson; traditional classroom instruction as compared to an augmented
reality simulation. The outcome was a measure of how much was learned through the
lesson, as measured through a pre- and posttest methodology. The quantitative
methodology proposed here was suitable for this study as it represents an experimental
design that tested observed measurements: it measured pre- and posttest scores, used
equivalent groups (a comparison group verses an experimental group), and tested both
groups simultaneously (Campbell & Stanley, 1966).

29
Assumptions, Limitations, Delimitations
Assumptions include what this researcher has considered to be true, in particular
regarding the information gathered for the purposes of this study. The following
assumptions were present in this study:
1. This researcher assumed that participants were not deceptive while
participating in their treatment group (traditional classroom instruction or
augmented reality simulation). Participants were instructed to work
individually. In addition, this researcher was present and observed that all
participants worked individually.
2. This researcher assumed that participants answered all questions honestly and
to the best of their ability on the pretest and posttest. Participants were
instructed to answer the assessments individually. In addition, this researcher
was present and observed that all participants worked individually.
3. This researcher assumed that this study was an accurate representation of the
current situation at the proposed study location: the high school. The study
sought a stratified sample from the high school. For the comparison group, the
high school science teacher led the traditional classroom instruction. By doing
so, the participants in this group received instruction in a similar manner as
they normally would during the school year. For the experimental group, the
augmented reality simulation took place on the school grounds, which is
familiar to the participants.
Limitations to this study also exist; these include things that this researcher cannot
control such as bias and technology failure. This study has the following limitations:
30
1. The augmented-reality tool itself has certain limitations. The mobile
augmented tool was created using ARIS (Gagnon, 2010), the handheld digital
devices that participants used: iPod Touch with data provided by a Verizon
Wireless Mi-Fi. The augmented reality tool uses the iPod’s camera to
recognize QR codes, and when recognized, special data will appear on the
iPod’s screen. The mobile augmented reality tool can be affected by a lack of
connectivity to the Mi-Fi and ARIS server, failure to recognize a QR code, or
damage from a participant dropping the iPod.
2. Weather can be a potential limiting factor to the effectiveness of the
technological tools being used. Technology can be affected by weather. Cold
temperatures reduce battery life. Adverse weather, such as rain, can be
potentially damaging to handheld devices and can be counterproductive to the
learning process in outdoor activities. Additionally, with too much sun,
viewing screens on handheld devices becomes extremely difficult to visualize.
If the weather is hot, participants may become uncomfortable.
Delimitations include factors that define the boundaries of this study, including
characteristics of the sample being used. The study has the following delimitations:
1. The location of the study was in southwest Colorado. The location of the
study was chosen for its convenience; however, this area is sparsely
populated. The chosen school district is an hour and a half away from the next
school district by automobile.
31
2. The participants in this study include a relatively small sample. A stratified
sample of approximately 50 students was used, where half of the students
were placed in the comparison group and half in the experimental group.
3. The time of the treatments, as well as time for the pretest and posttest, was
controlled. To provide equal opportunity to all participants, this study allowed
equal time to the pre- and posttests for the comparison and experimental
groups. For example, pre- and posttests were limited to 20 minutes in
duration. Additionally, the traditional classroom instruction (comparison
group) and augmented reality simulation (experimental group) had the same
amount of time: 30 minutes. In short, learning and assessment times were
controlled.
4. Both treatments (traditional classroom instruction and augmented reality
simulation) had individual learning methods. The purpose of this study was to
determine individual students’ learning outcomes without group collaboration.
All effort was made to ensure that no collaboration or group interaction
occurred. This researcher was present to supervise all pretests, the comparison
and experimental-group activities, and posttests.
This study compared two teaching methodologies: traditional classroom
instruction, which was instructor-led, to an augmented reality simulation that was self-
led. All participants worked individually, and the researcher observed all participants so
they worked individually (without group collaboration). Taking into consideration the
above assumptions, limitations, and delimitations, the potential generalizability of the
study findings must be considered. Since this study utilized a relatively small sample size
32
of approximately 50 participants, before results can be generalized to any degree, there
must be more testing; such as replication studies with larger groups of participants. A
larger sample size would increase the power of the results (Vogt & Burke-Johnson,
2011).
Summary and Organization of the Remainder of the Study
Some students may prefer a neomillennial learning style that uses real-world, self-
directed activities (Dieterle et al., n.d.; Oblinger & Oblinger, 2005), and technology.
Augmented reality simulations may be a form of teaching that appeals to neomillennial
learners. Omissions were found in the existing literature that center on the lack of
research focusing on individual-learning outcomes, without group collaboration, from
augmented reality games. This study is the first quantitative experiment controlling for
individual learning that has assessed the influence of augmented reality simulations using
mobile handheld digital devices on individual students’ learning outcomes.
This study was designed to investigate whether teaching using augmented reality
simulations affected individual high school students’ learning outcomes in chemistry, as
measured by a pretest and posttest methodology. To answer the proposed research
questions, approximately 50 participants were divided and placed in either a comparison
or experimental group. The groups were matched based on students’ cumulative science
GPA, in order to establish a baseline for comparison of test scores. A pretest was given to
all participants prior the activity. The comparison group was given traditional classroom
instruction and the experimental group was given an augmented reality simulation, both
covered the same chemistry topic of Alpha, Beta, and Gamma radiation. All participants
were observed by the researcher to assure students’ worked without group collaboration.
33
Upon completion of the traditional instruction and augmented reality simulation, a
posttest was given. The pre- and posttest were used in the statistical analysis to determine
whether the change in mean scores of these groups was significantly different. When the
study concluded, a debriefing session was offered where participants had the opportunity
to experience the alternative treatment.
The first chapter of this paper has outlined the intentions and basis of this study
and the remaining chapters provide a more thorough description of all aspects of this
work. Chapter 2 provides a review of current research surrounding this topic, specifically
focusing on how game-based learning technology has been used to augment or enhance
learning. Chapter 3 describes the methodology, research design and procedures for this
investigation. Details as to how the data were analyzed, as well as written and graphic
summaries of the results are given in Chapter 4. The last chapter, Chapter 5, discusses the
results and provides interpretation of the results as they relate to the existing body of
research on how augmented reality affected high school students’ learning outcomes in
chemistry without group collaboration.
34
Chapter 2: Literature Review
Introduction
The study presented was centered on the idea that a self-led, constructivist
teaching method using an augmented reality simulation may be able to improve learning
outcomes in newer generation high school students. This topic draws on established work
conducted in the fields of game-based learning (GBL), constructivist teaching
methodology, and augmented reality. Chapter 2 includes a review of literature pertaining
to these fields. This examination of existing knowledge demonstrates that a gap exists in
the area of quantitative research looking at the direct impacts of GBL using augmented
reality on individual learning outcomes. The results of this study contribute to filling that
deficiency and improving the understanding and improvement of student learning
experiences by establishing whether or not an augmented reality simulation, without
collaboration, can improve learning outcomes.
This chapter includes a discussion of the theoretical foundations of this study, as
well as a review of existing literature. The theoretical foundations are discussed first,
including an explanation of the millennial generation, the neomillennial learning style, an
explanation of the traditional and constructivist theories of learning, and how new
technology such as augmented reality may be of benefit. This section concludes with the
rationale used to develop the research question. In order to ensure this review is thorough,
this researcher investigated peer-reviewed literature, personally met with several leaders
in the field of GBL and augmented reality, and participated in conventions that specialize
in GBL and augmented reality. The literature was surveyed using a variety of online
databases including ERIC and ProQuest. In the case of literature concerning augmented
35
reality, literature was found at specific university’s databases; such as those of the
University of Wisconsin-Madison, Rice University, Massachusetts Institute of
Technology, and Harvard University. Another literature source was found by searching
past professional conferences for presentations of research papers; such as the
International Society for Technology in Education, the International conference on
Learning Sciences, and the International Conference on Mobile, Hybrid, and On-line
Learning. A fourth source for finding literature, was searching professional organizations
databases; such as the Institute of Electrical and Electronic Engineers, International
Society for Technology in Education, and the Learning Sciences Research Institute.
Once information was gathered, a series of charts was developed and refined in
order to compare the literature (See Appendix A and D). Upon comparison, a gap in the
field of study was identified; therefore, this study investigated individual students’
learning outcomes without group collaboration and sought statistical variance between
traditional classroom instruction and an augmented-reality simulation. To explain game-
based learning and to demonstrate the gap in the research that resulted from conducting
research on GBL and augmented reality simulations for learning, the literature review
section is organized so as to examine the state of game-based learning (including a closer
look at several specific games), the state of augmented reality GBL (again including a
look at several specific games), a description of the development of augmented reality as
a tool, and a discussion of the future of augmented reality GBL.
Background to the Problem
Recent research by Pew Research Center’s Internet and American Life Project has
found 90% of teens between the age of 12 and 17 have a computer or access to a home
36
computer, and 75% use a mobile digital device to access the Internet (Madden, et. al.
2013). These findings demonstrate that more high school aged students are digital natives
(Dede, 2005) and pervasive users of technology (Oblinger, 2003; Willems, 2009). Thus,
some high school students use available technology, like digital handheld devices, to
acquire knowledge through discovery, collecting information from multiple sources,
integrating the visual with the spatial (Oblinger & Oblinger, 2005), and seeking self-
directed learning experiences (Dieterle et al., n.d.). This learning style has been classified
as neomillennial (Dieterle et al., n.d.; Oblinger & Oblinger, 2005; Sankey, 2006) and may
be in conflict with traditional classroom instruction.
Traditional classroom instruction has been characterized as an educator-led
activity in which the educator sets the goals, designs the learning tasks, and conducts the
assessment to determine what has been learned (Tinzmann et al., 1990). Thus, traditional
classroom instruction can be identified as guided instruction. If some high school
students seek self-directed experiences that are technology-based, then their learning
style is not conducive to educator-led traditional classroom instruction, and they may
prefer a learning format that follows a constructivist GBL approach.
GBL can be comprised of any game that entertains with educational aims (Susi et
al., 2007), ranging from card games, board games, and digital computer games (see
Appendix C). Research on GBL using digital computer games and its ability to increase
students’ learning outcomes, has been investigated by Rice University (2012), Kaufman
et al. (2011), Foster (2011), Carr and Bossomaier (2011), Kebritchi et al. (2010), Tuzun
et al. (2009), Cheung et al. (2008), Yip and Kwan (2006), Barnett et al. (2004), and Dede
et al. (2004). These studies are summarized in Appendix D. To demonstrate that
37
computer games can provide students’ learning outcomes, the science computer games of
Supercharged (Jenkins & Henrichs, 2003), Nothing to Rave About (Rice University,
2012), and River City (Harvard University, 2007) are discussed in detail later in this
chapter. Augmented reality, defined as “the ability to overlay computer graphics onto the
real world” (Billinghurst, 2002, p. 1), is considered one of the newest forms of GBL.
Augmented reality is described as a “technology that allows computer-generated virtual
imagery information to be overlaid onto a live direct or indirect real-world environment
in real time” (Lee, 2012, p. 13). Augmented reality systems can be classified by their
display as head-worn, hand-held, and spatial (Van Krevelen & Poelman, 2010), making
them a good fit for digital natives.
A review of research focused on augmented-reality GBL reveals studies that
investigated augmented reality game-based learning used groups of two to eight
participants working collaboratively (see Appendix A), but learning was not assessed
(Dunleavy, Dede, & Mitchell, 2009; Klopfer & Squire, 2008; Rosenbaum, Klopfer, &
Perry, 2007; Schrier, 2006; Squire & Jan, 2007). Four studies were found that
investigated augmented reality and learning outcomes. Tamsui (Chang, Wang, Lin, &
Yang, 2009), Frequency 1550 (Huizenga, Admiraal, Akkerman, & ten Dam, 2009),
Beetle Breeders, Beasties, Island Hoppers, and Chomp (Rosenheck & Perry, 2012), and
Human Digestive System (Vilkoniene, 2009). Of these studies, Chang, Wang, Lin, &
Yang (2009), Huizenga, Admiraal, Akkerman, & ten Dam (2009), and Vilkoniene (2009)
demonstrated positive learning outcomes. Yet, none of these four studies controlled for
collaboration or ensured that the individual outcomes were not the result of group
collaboration (see Appendix A). By not controlling for collaboration, there was a lack of
38
evidence showing the impact of GBL on individual learning outcomes, especially when
looking at augmented-reality games using handheld digital devices. This study has
become the first quantitative quasi-experimental research controlling for individual
learning to validate augmented reality using mobile handheld digital devices that affect
individual students’ learning outcomes without group collaboration.
The purpose of this study was to investigate whether an augmented reality
simulation affected high school students’ learning outcomes in comparison to traditional
classroom instruction in chemistry, measured by a pre- and posttest methodology without
group collaboration. In doing so, the proposed study used handheld digital devices: iPod
touches (Apple Press Info, 2012) and an augmented reality simulation that was created by
this researcher using Augmented Reality and Interactive Storytelling (ARIS) (Gagnon,
2010). The following sections contain a discussion of the theoretical basis for this study
and an investigation of key literature that examines GBL.
Theoretical Foundations
This study was founded upon the premise that some of today’s students are
neomillennials (Sankey, 2006) who seek self-directed (Dieterle, et. al., n. d.) and
constructivist-learning experiences while integrating available technology to assist in
their knowledge acquisition (Jonassen, Carr, & Yuen, 1998) rather than the traditional or
educator-led philosophy of instruction. From this premise, the following research
questions were derived:
RQ1: Does augmented reality affect high school students’ learning outcomes in
chemistry, as measured by a pre- and posttest methodology when ensuring that
the individual outcomes are not the result of group collaboration?
39
RQ2: Does augmented reality instruction or traditional classroom instruction have
a greater positive impact on high school students’ learning outcomes in chemistry,
as measured by a pre- and posttest methodology when ensuring that the individual
outcomes are not the result of group collaboration?
This section describes the connection between the research questions and the
theories that formed them, beginning with a description of neomillennial and their
preferred learning style. The section continues by describing two theories of teaching:
traditional classroom instruction, which is a teacher-led process, and a student-led
process that integrates the constructivist principles of Dewey, Vygotsky, and Piaget. This
section concludes by explaining that augmented reality in integrating constructivist ideals
and being a student-led activity may better serve the neomillennial learning style and
therefore have the potential to increase students’ learning outcomes as found in other
GBL research.
Children born between 1980 and 2000 are considered to be of the Generation Y,
Net Generation or Millennial Generation (Jones et al., 2007). Members of the Millennial
Generation currently could be considered to be between the ages of 12 and 22, or
perceived as ranging from current middle school students to recent college graduates.
Members of the Millennial Generation were born into the age of computers, and thus
relate to a world of cell phones, computers, and the Internet. “Technology is a natural part
of their environment and the younger they are; the more they expect technology to be
used in their schooling (in their lives)” (Oblinger, 2003, p. 38). Because they are “active
participants of our 24/7 wired world, they have been labeled as neomillennials” (Willems,
2009, p.272).
40
Neomillennial is a term first used by Sankey (2006) and refers to the learning
style for the new millennium. The neomillennial learning style includes learning through
discovery, collecting information from multiple sources, integrating the visual with the
spatial (Oblinger & Oblinger, 2005), and seeking learning experiences that are
collaborative, authentic, and self-directed (Dieterle et al., n.d.). Dede (2005) identified
several aspects of the learning styles of neomillennials: “involvement of multimedia,
active learning, participation in communal learning experiences, and the co-design of
those experiences” (p. 7). Millennials are glocal (Willems, 2009, p. 273); as such, they
are simultaneously global and local in their communication practices. This is
demonstrated in the way millennials can communicate face-to-face, through texting, and
by searching the Internet at the same time. Multitasking is a way of life for millennials,
learning is done through trial and error, results and actions have more value than facts
and figures, typing is preferred to writing, staying connected is essential, and there is no
tolerance for delay (Frand, 2000). Neomillennials are considered to be digital natives
(Dede, 2005) and pervasive users of technology (Oblinger, 2003; Willems, 2009), who
acquire knowledge through discovery, collect information from multiple sources
(Oblinger & Oblinger, 2005), and who seek real-world learning experiences that are self-
directed (Dieterle et al., n.d.). Since this is the case, the learning style of these students
may be in direct conflict with the traditional classroom instruction they are receiving.
Theories of learning. Traditional classroom instruction can be identified as a
system in which knowledge is transmitted through a teacher-led process. Traditional
teaching is characterized by classroom instruction as such that the teacher stands in front
of the class and lectures students who are sitting in rows of desks (Tinzmann, et al.,
41
1990). The teacher controls the learning by providing the materials and deciding the
focus and line of thought. In essence, learning is transmitted from the teacher to the
student by drill and practice or transcription and memorization.
In contrast to the transmission of knowledge as an educator-led process is the idea
of giving more autonomy to the students with minimal guidance. Dieterle et al. (n.d.)
believed that “learning takes place in realistic settings and that the learning must be
relevant to the students’ lived experiences” (p. 277). Siemens (2008) indicated that
“learning involves each individual learner making sense and constructing knowledge
within his or her own context” (p. 10). In conducting their work, Dieterle et al. and
Siemens theorized that the learner becomes an active participant in his/her own learning
process and the role of the instructor is as a guide or facilitator for the learner. These
viewpoints of learning are found in the constructivist principles of Dewey, Piaget, and
Vygotsky (Dalgarno, 2002).
Dewey (1910), an American psychologist and philosopher, advocated the value of
personal experience in education. Others have held that human beings understand their
world through interaction with their environment; knowledge is constructed by the
individual (Lutz & Huitt, 2004). Piaget, a Swiss biologist, philosopher, and behavioral
scientist, developed a theory of cognitive-development stages. Piaget’s (Piaget, 1947)
four stages of development are sensory-motor (aged 0–2), preoperational (aged 2–7),
concrete operational (aged 7–11), and formal operational (aged 11 and over). At the
fourth stage, intelligence is said to be demonstrated through the logical use of symbols
related to abstract concepts. However, as shown by Lutz and Huitt (2004), most students
have not attained this stage by high school. Another criticism of Piaget’s theory is that it
42
“overlooks the role of context, uses, media, and the importance of individual preferences
or styles of human learning” (Ackermann, 2001, p. 4). Despite the criticism, Piaget is
attributed with developing a theory that explains; “Learning occurs when, during active
exploration of the knowledge domain, the learner uncovers a deficiency in their
knowledge and their experience” (Dalgarno, 2002, p. 2).
Vygotsky, a Russian psychologist, advocated that children gain knowledge by
interacting with the environment through hands-on experiences and social interaction
with others (as cited in Costley, 2012). Vygotsky believed that each person has an
individual range of potential for learning; he called this range of potential the zone of
proximal development (Lutz & Huitt, 2004). Vygotsky is credited with demonstrating
that “learning occurs in a social context, and instruction between learners and their peers
is a necessary part of the learning process” (Dalgarno, 2002, p. 2). His ideas on learning
and development contribute to GBL because the digital tools used today have not only
become social but also learning tools for millennials (Norris, Hossain, & Soloway, 2011).
The work of Dewey, Piaget, and Vygotsky demonstrated that humans seek
meaningful interactions with the environment and construct knowledge through these
interactions (Lutz & Huitt, 2004). Moshman believed that there were three competing
forms of constructivism: endogenous, exogenous, and dialectical (as cited in Lutz &
Huitt, 2004). Endogenous constructivism emphasizes internal cognitive processes that are
sparked by experiences in the environment (Armstrong, 2011), or engaging in an active
exploration process (Dalgarno, 2002). The endogenous constructivism perspective has
been influenced by Piaget’s (Armstrong, 2011; Lutz & Huitt, 2004) belief that “humans
encounter situations in their environment that cause them to construct contradictions to
43
what they do and think. … This disequilibrium is the chief motivator for the development
of intelligence” (Armstrong, 2011, p. 9). Thus, learning is an individual process, and the
teacher should act as a facilitator in providing experiences that would challenge the
learner (Dalgarno, 2002) as in problem-solving experiments (Armstrong, 2011), or
computer-generated three-dimensional simulations (Dalgarno, 2002). Computer-
generated three-dimensional simulations can also be used as digital GBL. From an
endogenous constructivist perspective, “simulations can provide a realistic context in
which learners can explore and experiment … allowing learners to construct their own
mental model of the environment” (Dalgarno, 2002, p.4).
The second view, exogenous constructivism, focuses on the influence of the
external world on the construction of knowledge (Armstrong, 2011). In a school setting,
exogenous knowledge construction occurs when the instructor conducts an exercise that
includes modeling and explanation, and the learner adapts them rather than copying them,
using their own context to make them their own (Armstrong, 2011). Vygotsky’s beliefs
have influenced the exogenous constructivist viewpoint in that “the individual first adapts
social and cultural artifacts and then adapts these to his or her own knowledge structures”
(Lutz & Huitt, 2004, p. 13). In a simulation, exogenous constructivism can be
experienced in a tutorial (Dalgarno, 2002). As at the beginning of a computer game, the
simulation can be devised with a tutorial that must be completed before the learner is
allowed to proceed to the next level. Additionally, the cognitive tools of concept mapping
and graphing that “help the learner to develop an understanding of concepts” (Dalgarno,
2002, p. 6), are exogenous interpretations of constructivism.
44
The third view, dialectical constructivism, takes elements from the exogenous and
endogenous perspectives. Dialectical constructivists believe “knowledge and cognitive
processing competencies derive from the interaction of the individual and environment
… [but] all knowledge is [not] inextricably tied to specific environments nor are specific
structural capacities necessary for learning to occur” (Lutz & Huitt, 2004, p. 79). A
dialectical-constructivist approach in the classroom would include a view of learning as
occurring through realistic experiences, but where these experiences need to be
scaffolded by the instructor and include collaborative experiences with peers (Dalgarno,
2002). Through scaffolding, instructors “promote the path of discovery via careful
guidance in learning, asserting that deep learning and a greater ability to transfer that
learning to other scenarios results” (Armstrong, 2011, p. 15). Multiuser virtual
environments (MUVE), like River City (Dede et al., 2004), are examples of the
dialectical-constructivist approach. MUVE accomplishes this by creating an authentic
activity to investigate and solve a problem, by providing an embedded communication
tool that allows peers to work collaboratively, by offering visual agents that act as a guide
to the learning process, and by offering support tools that help the learner conduct
complex tasks (Dalgarno, 2002). Supervising the entire activity is the instructor; who is
present to provide additional support to the learners as necessary. Those who follow the
philosophy of Dewey and Vygotsky would subscribe to a dialectical-constructivist
approach (Lutz & Huitt, 2004).
Technology in education. Technology may be a valuable asset in developing and
implementing a more constructivist approach to learning and teaching students. Jonassen,
Carr, and Yueh (1998) believed that “technology can be used as knowledge construction

45
tools that students learn with, not from” (p. 24). These tools, which Jonassen et al. called
mindtools, “are computer applications that, when used by learners to represent what they
know, engage them in critical thinking about the content they are studying” (1998, p. 24).
For example, learners can organize information by creating a spreadsheet, concept map,
multimedia presentation, simulation, or network with others, to gain further insight. With
advances in mobile computing, wireless Internet, and social networking, some learners
are being introduced to new ways of representing their knowledge and organizing their
thoughts. Computing and learning are becoming ubiquitous by allowing users to access
digital information anytime, anywhere, and across multiple media. GBL using
augmented-reality simulations may be the answer to meeting the educational needs of
some digital natives, allowing students not only to visualize the information, but also to
interact and solve problems using scientific methods that lead to content mastery in an
entertaining manner (Gee, 2010). Augmented reality games or simulations can be
designed using constructivist pedagogy.
Augmented reality games can be defined as “games played in the real world with
the support of digital devices that create a fictional layer on top of the real world”
(Dunleavy et al., 2009, p. 9). GBL and augmented reality simulations are relatively new
to the classroom and are different from traditional classroom instruction, which has been
characterized as an educator-led activity; the educator sets the goals, designs the learning
tasks, and conducts assessments to determine what has been learned (Tinzmann et al.,
1990). In contrast, an augmented reality game or simulation is not educator-led, but rather
is a student-led and self-directed activity that uses technologies such as a mobile
handheld digital device. The mobile handheld digital device has the necessary software,

46
hardware, and data connection to allow the user to play the game or simulation. By doing
so, the learner becomes engaged in a learning experience by focusing on real-world
scenarios (Lombardi & Oblinger, 2007). In this study, the experimental group utilized an
augmented reality simulation that was created so students independently worked in a self-
directed, constructivist manner.
In comparing this study to other research, other research of augmented reality
using digital handheld devices (see Appendix A) reveals that several of the studies
incorporate collaborative groups of two to eight participants, but learning was not
assessed (Dunleavy et al., 2009; Klopfer & Squire 2008; Rosenbaum et al., 2007; Schrier,
2006; Squire & Jan, 2007). Of the remaining studies investigated, Vilkoniene (2009),
Chang et al. (2009), and Huizenga et al. (2009) investigated augmented reality and found
an increase in students’ learning outcomes, but group interaction or collaboration was
unidentified or uncontrolled. From these findings, a gap in the research was identified:
therefore, this study investigated students’ learning outcomes by comparing augmented
reality (a student-led, self-directed, and constructivist process) with traditional classroom
instruction (a teacher-led and directed process) and ensured that the individual learner
outcomes were not the result of group collaboration.
Review of the Literature
To explore the potential of using mobile augmented reality simulations as an
alternative to traditional classroom instruction, a review of literature surrounding GBL
has been conducted. Specifically this review was focused specifically on using digital and
augmented-reality games as an alternative to traditional learning. This section will clarify
some key terminology commonly used in GBL, provide a review of GBL as a
47
progression to augmented reality simulations and learning, and explain how augmented
reality can become the next teaching methodology of some digital natives.
Hays (2005) described a game as “an artificially constructed, competitive activity
with a specific goal, a set of rules and constraints that are located in a specific contest”
(Hays, 2005, p. 15). If this is the case, then the spectrum of games can include card
games, board games, and computer games. GBL can be described as any game that
entertains with educational aims (Susi et al., 2007). The Horizon Report 2011 (Johnson,
Smith, Willis, Levine, & Haywood, 2011), an industry authority created by The New
Media Group and EDUCAUSE Learning Initiative, organized games for learning
purposes into three categories: “non-computer games, computer games but not
collaborative, and computer games with collaboration” (p. 20). Similarly, Hall (2010)
outlined three categories of online games as basic online, multiplayer, and massively
multiplayer. Examples of basic online games would be chess against the computer, or
timed drill-games in mathematics, grammar, or other curriculum. In a multiplayer online
game, the participant can encounter more than one opponent at the same time. Depending
on the game, the players can work together or against each other. In the MMOG, the
gamer enters a virtual world with hundreds of other players situated around the block or
around the world. This virtual world, like our real world, continues even when the gamer
is not playing. When the player returns to the game, time has passed, events have
occurred, and the game has changed.
To provide context and differentiate the number of children and adults who play
computer games, a Pew research study (Hoffmann, 2009) and a study by Squire (2007b)
will be compared. In 2008, The Pew Research Center conducted a study of children

48
between the ages of 12 and 17 and found that 73% play games on a desktop or laptop
computer, 60% use portable gaming systems like the Sony Playstation or Nintendo DS,
and 48% play games on a Smartphone (Hoffmann, 2009). From these results, it should be
identified that many gamers play on multiple devices, so the numbers may be skewed
upward. A study conducted by Squire (2007b) investigated a wide range of gamers (mean
age of 30), and found that the average gamer plays the same digital game 20 hours per
week, and for as long as 6 months to a year. A study conducted by Hussain and Griffiths
(2009) used an online questionnaire to determine if online gaming had an adverse effect
on the health of gamers. The questionnaire asked the 199 gamers (mean age was 28.5
with an SD of 9.6) about their demographics, playing frequency, reasons for playing, and
to provide six statements that were assessed and coded to rate the level of behavioral
addiction (Hussain & Griffiths, 2009). The results of the study found that many gamers
play online for 20 hours or more per week, which is consistent with the findings
described by Squire (2007b). Hussain and Griffiths also suggested that “dependent
gamers appear to possess components of addiction, such as mood modification, tolerance,
and relapse” (p. 569).
Hussain and Griffiths (2009) explained that the addiction to computer games may
be caused by psychological immersion and the ability for games to provide anonymity.
These authors stated, “Psychological immersion is aided by the use of realistic graphics,
sound effects, and enhanced social interaction” (p. 563). Games also provide players with
anonymity, which is created through the creation of a nickname or by creating an avatar;
a fictitious virtual image of oneself. With a created identity, the gamer can interact with
others through the game’s chat or text room from a library, the person’s home, or another
49
safe environment. Today’s computer games allow gamers “to construct, investigate, and
interrogate hypothetical worlds that are increasingly a part of how we work and play”
(Squire, 2006, p. 19). Although most game players describe their play as a social
experience (Squire, 2006, p. 23), computer games can “communicate powerful ideas and
open new avenues for learning” (Squire, 2006, p. 19). Whether the person is playing a
basic, multiplayer, or MMOG, games can be seen as a subset of play (McDaniel & Vick,
2010) as they are organized around doing, and learning by doing (Squire, 2006).
Digital game-based learning. An investigation of digital GBL reveals three
overlapping-terms: edutainment, good games, and serious games. The first term,
edutainment, “refers to any kind of education that entertains even though it is usually
associated with video games with educational aims” (Susi et al., 2007, p. 2). Edutainment
games would be games that drill certain skills in an entertaining yet educational manner.
Two examples of edutainment games are Math Playground (King, 2012) and Funbrain
(Pearson Education, 2012). Math Playground (King, 2012) is a source for elementary and
middle school students to practice mathematics through a variety of colorful, interactive,
computer games. Similarly, Funbrain (Pearson Education, 2012) is a place for elementary
students to practice their mathematics and reading skills. An edutainment game can
become a good game if it “teaches players more than just facts, but ways of seeing and
understanding problems and opportunities to become different kinds of people” (Squire,
2008, p. 2). Good games place learners as active participants (Gee, 2005); they are about
choices and consequences, they test students’ thinking against simulated outcomes, they
motivate and inspire students’ to play further, and they “teach more than just facts, but
ways of seeing and understanding problems and opportunities” (Squire, 2008, p. 2).
50
Good games have flow. Flow can be referred to as “the complete engagement
with and immersion in an activity” (Hoffman & Novak, 2009, p. 5). This immersion can
be physical, mental, or both (Van Eck, 2006). Flow is also created through role-playing.
Role-playing triggers deep investment and learning (Gee, 2005). In Supercharged,
students actively use a ship that is propelled by controlling the ship’s electromagnetic
charge and setting charges outside. In River City, students manipulate an avatar that goes
back in time to solve the city’s health problems. Flow can also be created by experiencing
the scientific method of observation, hypothesis formation, testing the hypothesis,
controlling for variables, and forming a conclusion (Osterweil & Le, 2010).
Second, good games have well-ordered problems that lead to hypotheses and later
solutions and harder problems (Gee, 2005). Nothing to Rave About was designed as a
web adventure in which students must solve problems associated with the first episode to
move to the next. In comparison, River City’s virtual environment allows users to
navigate a map that instantly places the student’s avatar at a particular location. At that
location, the student is presented with key information or a problem to investigate.
Third, good games have problems or challenges that feel hard, but are doable
(Gee, 2005). People are motivated by challenges that seem attainable. Games create
challenge by setting difficult goals or higher levels to attain, so that players must then
find ways to solve these challenges. For example, River City creates a health crisis in the
late 1800s. This crisis could easily happen in the students’ own town. Having the
simulation in the past creates a safe learning experience. The game’s challenge is
identifying which of the three diseases is causing the health crisis. However, without
River City’s avatars, which provide helpful hints and an internal chat feature for
51
collaborating with other students, the game may be too challenging or perhaps impossible
for students.
A fourth element of good games is that they teach through repetition (Gee, 2005).
In Supercharged, if the ship’s charges or the external charges are placed wrongly, the
ship will not fly in the correct direction. The student must be able to make the correction
and see the ship fly properly; doing so teaches the student about electromagnetism.
Supercharged, Nothing to Rave About and River City are forms of inquiry-based learning.
These games, although based on fictitious scenarios, can be equated to real-life situations.
As such, students must be able to build meaning on the spot as they learn by doing
(Shaffer, Squire, Halverson, & Gee, 2005).
In addition to edutainment and good games, some GBL can be classified as a
serious game. A serious game has a specific purpose other than edutainment (Susi et al.,
2007). Serious games incorporate the qualities of edutainment and good games, and are
targeted to a specific concept or situation. Serious games are both a form of entertainment
and training (Navarro, Padilla, Londono, & Madrinan, 2011). It was said that “Serious
games allow learners to experience situations that are impossible in the real world for
reasons of safety, cost, time, etc.” (Susi et al., 2007, p. 1). Serious games can be
considered the successors, or the further development of, edutainment or entertainment-
education games (Bente & Breuer, 2010). Serious games are “virtual environments
explicitly intended to educate or train” (Shute, Ventura, Bauer, & Zupata-Rivera, 2010).
Serious games can also be considered “a theory-based communication strategy for
purposefully embedding educational and social issues in the creation, production,
processing, and dissemination process of an entertainment program” (Wang & Singhal,
52
2010, p. 272–273). Three examples of computer games that are also considered “serious
games” are Supercharged, Nothing to Rave About, and River City; these games are
purposefully designed to achieve a desired educational outcome. To demonstrate that
computer games can provide learning outcomes, the science computer games of
Supercharged (Jenkins & Henrichs, 2003), Nothing to Rave About (Rice University,
2012), and River City (Harvard University, 2007) were assessed based on their ability to
create students’ learning outcomes.
Serious Game: Supercharged. Supercharged was created to teach middle school
students the concept of electromagnetism. The game was designed by Belcher, an MIT
physicist (Barnett et al., 2004). In this digital game, individual students guide their
spaceship through electromagnetic mazes by placing charged particles and altering the
spaceship’s magnetic charge. Because this simulation focuses on a single topic,
electromagnetism, it is considered a targeted game or simulation (Squire, 2007a).
Because many students struggle to understand abstract and multidimensional concepts,
the game was designed to provide visual and interactive information necessary to gain a
greater understanding of electromagnetism. As Barnett et al. (2004) stated, the “mastery
of abstract scientific concepts requires that students build flexible and testable mental
models … but students are asked to develop these mental models without having real-life
referents” (p. 513).
The Supercharged study used a mixed-methods design (Barnett et al., 2004). All
participants came from five classes of eighth grade students. “Two classes became the
control group (n=35) which left the other three classes to play Supercharged and so serve
as the experimental group (n=61)” (Barnett et al, 2004, p. 516). The control group
53
received instruction in the form of a lecture by the classroom teacher, as well as
demonstrations and guided experiments conducted by the instructor. The experimental
group played the game Supercharged, received supplemental material, and interactive
lectures by the instructor. All participants were given a 12-question pretest and posttest.
Video cameras were arranged to gather observational data and pre–post intervention
interviews of 58 students from the experimental and 32 students from the control group.
Quantitative data analysis used SPSS with ANOVA and ANCOVA techniques.
Qualitative data analysis used constant-comparative methodology to gain themes from
the data, video, and field notes. Results of the study demonstrated a small gain in posttest
scores of the experimental group over the control group. This gain in posttest scores was
found to be statistically significant (see Appendix D). The study did not find a difference
between the genders in posttest scores. The findings suggested that a digital game,
Supercharged, can be an effective tool in helping students understand complex physics
concepts (Squire et al., 2004).
Serious Game: Nothing to Rave About. Nothing to Rave About (Rice University,
2012) is an online digital game designed to teach middle school students “about club
drugs and the basic neuroscience concepts that explain their effects” (Miller, Moreno,
Willcockson, Smith, & Mayes, 2006, p. 137). The game is designed as a web-adventure
conducted by individual students. The game was divided into parts. In the first part,
participants discover that more teens are going to the hospital. In the second part,
participants learn about Ecstasy and its neurotic affects. Methylenedioxy-
methamphetamine is known as Ecstasy, and has been known to produce a variety of
neurotic effects including “an easily controlled state characterized by euphoria, increased

54
well-being, increased sociability, and decreased anxiety” (Baggott, Jerome, & Stuart,
2001, p. 13).
The quantitative study was conducted at five schools: two urban, two suburban,
and one rural school. In all, 289 students participated from the seventh and eighth grades.
The study was conducted in three parts: a pretest, game play, and posttest. The pre- and
posttest consisted of the same 30 questions, but in a different order. Questions used a
standardized format followed by four choices: A, B, C, or D. The study was designed to
allow for 3 days between each phase: 3 days between the pretest and game play, and 3
days between the game play and posttest.
Data analysis was conducted by comparing the mean pre- and posttest score,
based on the total sample, and the gains on each episode the results were found to be
statistically significant (see Appendix D). Episode 1 had a mean pretest score of 26 with a
standard deviation of 24, had a posttest score of 33 with a standard deviation of 27, and
this produced a t-score of 5.16 with p < .001 (Miller et al., 2006). Episode 2 had a mean
pretest score of 34 with a standard deviation of 24, had a posttest score of 51 with a
standard deviation of 21, and this produced a t-score of 12.03 with p < .001 (Miller et al.,
2006). Episode 3 had a mean pretest score of 33 with a standard deviation of 22, had a
posttest score of 61 with a standard deviation of 26, and this produced a t-score of 19.00
with p < .001 (Miller et al., 2006). The findings demonstrate that in all three episodes,
students’ learning outcomes increased between the pre- and posttest in learning
neuroscience. The study did not show a significant difference between the genders in
study results. The study results suggest that future research should compare the efficiency
55
of Nothing to Rave About with other forms of instruction in comparing student outcomes
(Miller et al., 2006).
Serious Game: River City. River City (Harvard University, 2007) is a MUVE
and provides an experience similar to a MMOG for participants to access a virtual world,
interact with digital artifacts, represent themselves through avatars, and communicate
with other players using the game’s chat or text feature. The River City Project began in
the late 1990s by Dede at George Mason University and is currently located at Harvard
University (Dieterle, 2010). The project has received three National Science Foundation
and Department of Education grants, and is used by more than 100 teachers and 5,500
students annually (Dieterle, 2010). River City is a virtual city set in the late 1800s. The
city has a river running through it and the townspeople develop symptoms caused by
Escherichia Coli, malaria, and tuberculosis (Dieterle, 2010). Participants work in teams to
gather data, develop hypotheses, and present their findings (Ketelhut & Dede, 2006).
Participants portray themselves as an avatar in the multiuser virtual environment, travel
back in time to help the townspeople investigate and solve the mysterious disease
(Dieterle, 2010), and identify the source of the disease as caused by water, insect, or air.
The goal of the River City study was to improve learning outcomes of
underperforming middle school students by improving their scientific-inquiry skills
(Dede et al., 2004; Ketelhut, Dede, Clark, & Nelson, 2006). According to Dede et al.,
In the pilot implementation, two public school classrooms were used…the
control classroom used a curriculum delivered via paper-based materials
rather than technology [River City] ... Participants worked in teams to
develop hypotheses regarding one of the three strands of illness … At the
56
end of the project, students compared their research with other teams of
students to discover other hypotheses to explore. (2004, p. 159-160)
The entire study used a mixed-methodology with a pre- and posttest design, included at
11 schools, and incorporated about 2,000 participants (Ketelhut et al., 2006). Part of this
larger River City study was a case study (see Appendix D) that used a sample of 330
participants, three experimental groups, and a control group (Ketelhut et al., 2006). The
three experimental groups were a guided social-constructivist group, an expert modeling
and coaching group, and a legitimate peripheral participation group.
Results indicated that the guided social-constructivist group improved its posttest
scores by 35%, the control group improved by 17%, and the other two experimental
groups, expert modeling and coaching and legitimate peripheral participation,
demonstrated little improvement (Ketelhut et al., 2006). The results demonstrated that
learning by doing or using constructivist teaching methodology with guidance from the
teacher and group partners improves students’ learning outcomes more than the control
group traditional classroom instruction. The study also found that participants perceived
the activity to be motivating, which is consistent with findings by Squire (2005). The data
demonstrates favorable results, but it does not appear that the researchers of this study
intended to test for statistical significance.
As demonstrated by Supercharged, Nothing to Rave About, and River City,
computer games can not only be entertaining, but also educational and produce learning
outcomes (see Appendix D). Based on these findings, this researcher proposed to build
on computer game-based research by creating an augmented reality game to teach the
high school chemistry concept of Alpha, Beta, and Gamma radiation without group

57
collaboration. In doing so, the augmented reality simulation contained several key
qualities that are found in computer edutainment games, good games, and serious games.
As an augmented reality edutainment game, it was educational and entertaining. As a
good augmented reality game, it taught more than just facts (Squire, 2008) and engaged
learners as active participants who have choices, well-ordered problems and challenges,
as well as taught through trial and error (Gee, 2005). The augmented reality game for use
in this study was designed as a scavenger hunt, where participants travelled in a particular
order from one location to another. By traveling in a sequence, the simulation provided
the well-ordered problems for participants to make choices. The challenge for
participants was to learn about the history, properties, and naturally occurring sources of
Alpha, Beta, and Gamma radiation in the community. This is also an augmented reality
serious game because it was designed specifically to teach a targeted concept (Navarro et
al., 2011); Alpha, Beta, and Gamma radiation.
Augmented-reality game-based learning. With a foundation established that
digital computer games can be used for GBL, attention is now directed toward augmented
reality, as the next progression of GBL and its ability to produce learning outcomes.
Augmented reality can be described as the ability to overlay one or more computer
graphics or virtual imagery onto a live direct or indirect real-world environment while
using a tool such as a digital device to provide additional information to the user in real
time (Billinghurst, 2002; Dunleavy et al., 2008; Klopfer & Squire, 2008; Laux et al.,
2012; Lee, 2012; Shelton 2002; Squire & Jan, 2007). To clarify the difference between
virtual reality and augmented reality, The Reality-Virtuality Continuum was used
(Milgram & Kishino, 1994) and is included as Appendix G. At each of the ends of the
58
spectrum are the real-world environment and the virtual environment. The real-world
environment is where living organisms go through their daily routine and are affected by
time, nature, gravity, and chance. The virtual environment is a digital world that is
created by a computer programmer to mimic a real or fictional world. Virtual
environments can be experienced by sitting in front of a screen or by wearing personal
video eyewear, such as those marketed and sold by Vuzix (2012). Augmented virtuality
consists of digitally generated images with some real-world imagery (Yuen,
Yaoyuneyong, & Johnson, 2011). With augmented reality, the environment is the real
world; the digital information is delivered in real time and displayed on a screen to
provide additional information.
Two common methods for classifying an augmented reality system were by the
display it used and whether it used a marker to identify information. Van Krevelen and
Poelman (2010) classified augmented displays in three categories: head-worn, handheld,
and spatial. Head-worn displays include head-mounted display, virtual retinal display,
and head-mounted projective display; yet, no matter which head-mounted display system
is used, they all share the same drawback. “They all have to connect to a computer and
this restricts mobility due to limited battery life” (Van Krevelen & Poelman, 2010, p. 4).
Handheld systems are the second type of augmented-reality display and include handheld
video/optical see-through displays and hand-held projectors (Van Krevelen & Poelman,
2010). This category of displays includes mobile handheld digital devices like personal
digital assistants, tablet computers, and Smartphones. The third category of displays,
known as spatial displays, are displays placed statically in an environment. These include
59
see-through displays like heads-up displays in military aircraft or during sports telecasts
when digital markers are placed overlaying a football field or swimming pool.
The other common method for classifying augmented reality systems is whether
the system uses a marker or markerless system (Johnson et al., 2010). The marker-based
augmented reality system uses a camera and a visual marker, also known as a fiducial, to
determine the center, orientation, and range of a coordinate system (Hubbard, 2009). The
visual marker is designed with a unique pattern so that when the camera views the marker
and is recognized by the software, it produces specific digital information on the screen
(Madden, 2011). QR codes and Tags are two examples of markers (see Appendix E). QR
codes were created by Denso Corp, a subsidiary of Toyota, in 1994 to track automobile
parts (Pidaparthy, 2011). A QR code can be read or recognized by applications that are
programmed to identify that pattern, and once recognized, the QR code can connect the
person to a link, quick-dial a phone, or send a message (Madden, 2011). The Tag was
created by Microsoft © and has a few benefits over QR codes (Madden, 2011). The Tags
can be printed in more than two colors, they can provide a tracking function, they can be
hidden in an image or logo, and the information can be updated without creating a new
Tag.
In contrast, gravimetric or markerless augmented reality systems track an object
in the real world without a marker (Hubbard, 2009). The markerless system uses the
mechanism’s gravimeter that “calculates the precise positioning and angle of the display
device to determine the center, orientation, and range of the coordinate system”
(Hubbard, 2009, p. 1). Gravimetric augmented reality systems can be divided into two
groups: wearable and handheld. The wearable augmented-reality system allows for
60
unconstrained mobility and consists of a computer that is securely packaged in a
backpack and an optical head-mounted display. Three examples of wearable augmented
reality systems are the Battlefield Augmented Reality System (Livingston et al., 2006),
Military Operations in Urban Terrain (Brown, Stripling, & Coyne, n.d.), and CroMAR,
which is a mobile augmented reality system for supporting reflective learning (Mora,
Boron, Pannese, & Divitini, 2012).
This study incorporated mobile digital handheld devices and a marker system to
display the augmented reality information. More specifically in the experimental group
for this study, participants used an iPod Touch. Working individually and following a
series of markers or QR codes (see Appendix E), as observed by the researcher,
participants used the camera feature of the iPod, captured the image of a marker, then the
iPod sent the image of the marker wirelessly to the ARIS server. When the ARIS server
received the marker image, it compared the image to other images in its database. When a
match was found, the ARIS server sent an event (picture, video, or other digital
information) back to the participant’s iPod. This data transfer from marker to digital
information took approximately one second. In order to provide a better understanding of
digital devices used in augmented reality game-based learning, two previously conducted
studies that used a similar methodology were reviewed here. These were Mad City
Mystery (Academic ADL Co-Lab, 2007) and Reliving the Revolution (Schrier, 2005).
Augmented Reality: Mad City Mystery. In Mad City Mystery (Squire & Jan,
2007), the learning environment was the shore of Lake Mendota near the University of
Wisconsin, Madison. The study used a convenience sample of 18 elementary, three
middle school, seven high school, and six graduate students to investigate if augmented-

61
reality games on handheld digital devices could be used to engage students in scientific
inquiry (Squire & Jan, 2007). Students chose one of three roles: medical director,
environment specialist, or government officer, and worked in groups to investigate the
death of an individual through scientific means. Each role was given a specific task and
could only access specific information. Researchers collected data through a series of
observations, interviews, and pre- and postquestionnaires. The study found that
participants were engaged in the augmented-reality game and “all participants were
observed engaged in argumentation cycles similar to those advocated by science
educators” (Squire & Jan, 2007, p. 23).
Augmented Reality: Reliving the Revolution. In Reliving the Revolution (Schrier,
2006), the learning environment was historic Lexington, Massachusetts, and the site of
the Battle of Lexington of 1775. The challenge was for the students to work in groups of
eight to solve the problem of who fired the first shot at the Battle of Lexington, 1775. The
initial study used three trials (Schrier, 2005): Trails 1 and 2 used adults (n = 8 & n = 6
respectively), and Trial 3 used high school students (n = 8). The purpose of the study was
to teach historic inquiry, decision-making, and critical-thinking skills (Schrier, 2006).
Results of the study found that the augmented-reality game provided a means for
scientific inquiry of “gathering, evaluating, and interpreting historical information,
devising hypotheses and counter-arguments, and drawing informed conclusions”
(Schrier, 2006, p. 2).
Augmented reality game-based learning benefits. Mad City Mystery
(Academic ADL Co-Lab, 2007) and Reliving the Revolution (Schrier, 2005)
demonstrated the benefits of augmented reality games as a GBL tool. One author said,
62
“Augmented reality games seem to have the potential to make large amounts of
information more navigable, intriguing, and memorable” (Schrier, 2006, p. 7). By playing
the augmented-reality game in familiar places, “it encouraged participants to apply what
they know, are familiar with” (Squire & Jan, 2007, p. 24). It also provided for “real-world
learning where participants can work on realistic problems” (Schrier, 2006, p. 7). Thus,
augmented-reality games can be described as place based. With place-based augmented-
reality games, the learning environment can be the student’s own community (Klopfer,
Sheldon, & Perry, 2012) or a specific real-world, historical, or geographic site (Squire &
Jan, 2007). In place-based augmented-reality simulations, the place becomes the setting
for the simulation and the primary motivation. Squire and Jan explained that place-based
learning positions “players in a complex system while drawing on players’ emotional and
cognitive relations with the environment to create designed experiences for solving
complicated problems” (2007, p. 6).
Another advantage of GBL with mobile digital devices is that the devices have
become context-aware or aware of their surroundings with global positioning systems
(GPS), recognition of objects with radio-frequency identification, and instant
connectivity with wireless local area networks (Sharples, 2010). Because of this, mobile
devices are being developed for not only place-based augmented-reality simulations that
use markers, but also location-based simulations. Location-based simulations “make use
of geolocative data … that can obtain and transmit the device’s physical location [while
giving participants] ways to integrate [their] experiences in the physical world with those
online” (Johnson, Levine, & Smith, 2009, p. 15). In doing so, the learning process
becomes mobile, personal, and interactive (Glahn, Borner, & Specht, 2010).
63
Augmented reality research and development. To help individuals, educators, and
researchers create their own augmented reality games, some developers have made
source code freely available (Krosinsky, 2011). Two open-source programs for creating
augmented reality games or simulations are TaleBlazer (Massachusetts Institute of
Technology, 2011) and ARIS (Academic ADL Co-Lab, 2012). TaleBlazer
(Massachusetts Institute of Technology, 2011) operates on digital devices with the
Android operating system, and ARIS (Academic ADL Co-Lab, 2012) operates on Apple
(Apple Press Info, 2012) products. This study used iPod Touches and an augmented-
reality simulation using ARIS. The premise of this dissertation was the belief that some
students today are digital natives (Jones et al., 2007); thus, educators should incorporate
the tools and media these students use every day (Dede, 2005). In this study, an
augmented reality simulation on the chemistry concept of Alpha, Beta, and Gamma
radiation was created using the open-source program ARIS. This researcher agreed with
Yuen et al. (2011) in that students should gravitate toward augmented-reality-based
learning because it is similar to today’s high-technology computer games and provides an
interactive and immersive experience. Thus, augmented reality games or simulations
should be the next progression in GBL (see Appendix C).
Other researchers in the field of augmented reality simulations for educational
purposes are investigating methods for making the learning experience more realistic and
user friendly. Researchers in the Massachusetts Institute of Technology, Scheller Teacher
Education Program are researching four ubiquitous biology games (Rosenheck & Perry,
2012): Beetle Breeders, Beasties, Island Hoppers, and Chomp. Since ubiquitous games
allow students to access simulations anytime from a variety of digital tools, Rosenheck
64
and Perry (2012) sought to determine if ubiquitous learning could be used outside of
school, such as for homework, and then enhanced with a follow-up, teacher-led activity
to facilitate the knowledge transfer. Preliminary results based on qualitative data of
observations, interviews, and game log files found students were engaged and motivated
through a feeling of competition (Rosenheck & Perry, 2012). Quantitative data was used
to compare control groups to treatment groups (Rosenheck & Perry, 2012); no significant
difference was found in learning outcomes between the two groups (Rosenheck & Perry,
2012).
Researchers at Harvard University are investigating whether tools like probeware,
cameras, or microphones can mediate the disconnection students are experiencing
between real and virtual environments. Their research is called Ecosystems Mobile
Outdoor Blended Immersive Learning Environment (EcoMOBILE; Dede & Kamarainen,
2012). This project uses mobile broadband devices to supply augmented reality
simulations in a real-world ecosystem and allows students to integrate probeware,
cameras, and microphones for additional investigations (Dede & Kamarainen, 2012).
Preliminary results demonstrate participants had difficulty making connections between
the real and virtual experiences and that using technology such as probeware could
mediate the interaction (Dede & Kamarainen, 2012).
Vilkoniene (2009) utilized a pretest and posttest methodology to investigate three
instructional methodologies: traditional instruction or auditory group (A), augmented
reality instruction group (E1), and computer instruction group (E2). All three forms of
instruction taught the same biology concept: the human digestive system. For the study,
114 students participated. The study found that the augmented reality group (E1)
65
produced better learning outcomes than the auditory group (A) in understanding the
organs of the digestive system (see Appendix A). This study demonstrated that
augmented reality games can be used to increase learning outcomes over traditional
classroom instruction (Vilkoniene, 2009).
Chang et. al. (2009) created Tamsui; an augmented reality game to teach Taiwan’s
historical culture. The purpose of the project was to make e-learning more practical by
using location-aware, digital game-based learning (DGBL). To test their approach, Chang
et al (2009) conducted a “pretest-posttest experiment assessing 27 students in a
Taiwanese university” (p. 32). Results of the study found the average score was 58.15 for
the pretest and 82.93 for the posttest (see Appendix A). The results of this study
demonstrate an increase in learning outcomes using an augmented reality game.
The Waag Society (Huizenga et. al., 2009) has created Frequency 1550; an
augmented reality game that is played on digital handheld devices for learning historical
knowledge of medieval Amsterdam. The game is designed to be played within a single
day by groups of four or five participants. Participants in this study ranged in age from 12
to 16. In total 458 began the study, 232 participants played the mobile history game and
became the experimental group and 226 followed a project-based lesson and became the
control group (Huizenga et al., 2009). Of those participants that completed the study, the
results compared 200 participants in the control group with 211 participants of the
experimental group. Results showed a significant increase in the questions answered
correctly on the posttest by the experimental group (Huizenga et. al, 2009). On average,
the experimental group answered 60% of the questions correctly as compared to 36% of
the control group (see Appendix A).
66
Augmented reality game-based learning: Future research. Based upon the review
of literature, some questions for future research include: How does a mobile handheld
augmented reality simulation change the way students learn? How does a mobile
handheld augmented reality simulation change the way educators teach? How does a
mobile handheld augmented reality simulation compare to an environment that splits
instruction between the classroom and the online environment? Future research must
investigate how mobile augmented-reality simulations can teach 21st-century skills
(Schrier, 2006) and meet the expectations of future students. Students will be “expected
to draw on various knowledge bases, integrate them, conduct sophisticated analyses, and
use integrated knowledge to solve complex problems” (Clayton-Pederson & O’Neill,
2005, p. 9.4). Additionally, future research should investigate the benefits of students
designing games with educators (Schrier, 2006). Because game-developers are typically
not educators (Laurence, 2010), it is logical to have developers work closely with
educators and students. By including students, whether technologically literate or not in
the design process, students will benefit in two ways: they will learn how to build
augmented reality simulations and they will have the possibility to increase their content
knowledge (Rosenheck & Sheldon, 2012; Van Eck, 2006).
This study is aligned with other research in the field, discussed in this review, for
it demonstrated that augmented reality games or simulations have become the next
progression in digital computer GBL and can be used to increase learning outcomes.
GBL using digital computer games and its ability to increase students’ learning outcomes
have been investigated by Rice University (2012), Kaufman et al. (2011), Foster (2011),
Carr and Bossomaier (2011), Kebritchi et al. (2010), Tuzun et al. (2009), Cheung et al.
67
(2008), Yip and Kwan (2006), Barnett et al. (2004), and Dede et al. (2004); see Appendix
D for a summary of these and additional studies.
A review of augmented reality games and augmented reality GBL demonstrates
that augmented reality has been rigorously assessed (see Appendix A). Several of these
studies were designed to look at collaborative groups of two to eight participants, but
learning was not assessed (Dunleavy et al., 2009; Klopfer & Squire, 2008; Rosenbaum et
al., 2007; Schrier, 2006; Squire & Jan, 2007). Some of these studies also included an
examination of learning outcomes and found that improved learning outcomes were
achieved (Chang et al., 2009; Huizenga et al., 2009; Vilkoniene, 2009). In one study, the
researchers Rosenheck and Perry (2012), did assess learning outcomes and found no
significant difference between the control and treatment groups. A review of all the
augmented-reality games investigated found that collaboration was unidentified or
uncontrolled (see Appendix A). It is evident that the existing research is fragmented, as
the findings make generalized claims that cover a wide range of ages, tasks, curriculum,
and instructional methodology (Hays, 2005; Squire, 2007b; Susi et al., 2007).
Based on the review of previous research in the field, this study investigated
individual students’ outcomes, sought statistical variance between traditional classroom
instruction and an augmented-reality simulation, and in doing so instructed all
participants to work individually without group collaboration. The study has become the
first quantitative controlled quasiexperiment research to validate augmented reality as a
means of affecting individual students’ learning outcomes without group collaboration.
The findings of this study have contributed to the existing body of work on this topic by
investigating individual students’ outcomes using a quantitative research methodology;
68
specifically this researcher investigated two teaching methodologies: a comparison group
(traditional classroom instruction) with an experimental group (augmented reality
simulation). It was not known to what extent how mobile augmented reality can be used
to further high school students’ learning outcomes in chemistry, as measured by a pre-
and posttest methodology without group collaboration. By investigating individual
students’ outcomes quantitatively, this study sought to yield new insights into the benefits
of mobile augmented reality simulations for educational use. If this study could
demonstrate that a mobile augmented reality simulation produced significant learning
enhancement over traditional classroom instruction, it could extend prior understanding
of student learning and drive changes in the way future students are educated.
Summary
This study is founded upon the premise that some of today’s students are
neomillennials (Sankey, 2006). As such, they seek self-directed (Dieterle, et. al., n. d.),
constructivist-learning experiences such as those described by Dewey (1910), Vygotsky
(Costley, 2012), and Piaget (Dalgarno, 2002), which integrate available technology to
assist students in their knowledge acquisition (Jonassen, Carr, & Yuen, 1998) rather than
the traditional or educator-led philosophy of instruction. Research has demonstrated that
GBL, computers, and augmented reality games and simulations, can produce positive
learning outcomes (Carr & Bossomaier, 2011; Chang et al., 2009; Dunleavy et al., 2009;
Foster, 2011; Huizenga et al., 2009; Kaufman et al., 2011; Kebritchi et al., 2010; Schrier,
2006; Squire & Jan, 2007; Tuzun et al., 2009; Vilkoniene, 2009; Yip & Kwan, 2006).
Omissions in the existing literature centered on the lack of evidence of individual
69
students’ learning outcomes from GBL, and specifically from augmented reality games
using handheld digital devices without group collaboration.
Previous studies on GBL using augmented reality with mobile handheld digital
devices incorporated collaborative groups of two to eight participants, but learning was
not assessed (Dunleavy et al., 2009; Klopfer & Squire, 2008; Rosenbaum et al., 2007;
Schrier, 2006; Squire & Jan, 2007). Rosenheck and Perry (2012), Vilkoniene (2009),
Chang et al. (2009), and Huizenga et al. (2009) used mobile handheld digital devices and
investigated augmented reality games and learning, but collaboration was unidentified or
uncontrolled. These studies are summarized in Appendix A. By not controlling for
collaboration, researchers cannot draw clear conclusions about the origin of learner
outcomes. This study investigated individual students’ outcomes and the statistical
variance between traditional classroom instruction and an augmented-reality simulation.
This study is new and different from previous studies because it has become the
first quantitative experiment controlling for individual learning to validate augmented
reality using mobile handheld digital devices that affect individual students’ learning
outcomes without group collaboration. In doing so, this study addressed that lack of
evidence by conducting a quantitative quasi-experimental study using a comparison and
experimental group, with a pre- and posttest methodology to assess individual students’
learning outcomes in chemistry without group collaboration. The comparison group
followed traditional classroom instruction and the experimental group or augmented-
reality group used a mobile handheld device. In both groups, the variable of individual
learning was controlled. This study aligned with other research in the field, discussed in
70
this review, as it demonstrated that augmented reality simulations, like digital computer
games, can be used to enhance learning outcomes.
This study extended prior research in the field of GBL and augmented reality
simulations by being the first quantitative controlled experiment to validate augmented
reality as affecting individual students’ learning outcomes without group collaboration.
This study has built on previous research by investigating individual students’ outcomes
using a quasi-experimental, pre- and posttest design to analyze a comparison group
(traditional classroom instruction) with an experimental group (augmented reality group).
It was not known to what extent how mobile augmented reality can be used to enhance
high school students’ learning outcomes in chemistry, as measured by a pre- and posttest
methodology without group collaboration. By investigating individual students’
outcomes quantitatively, this study sought to yield new insights into the benefits of
mobile augmented reality simulations for educational use. If this study could demonstrate
that a mobile augmented reality simulation could produce significant learning outcomes
over traditional classroom instruction without group collaboration, it could extend prior
research and drive changes in the way future students are educated.
This study has addressed the identified gap in the existing literature: the lack of
evidence of individual students’ learning outcomes without group collaboration from
augmented reality games or simulations using handheld digital devices. If this study
found that a mobile augmented reality simulation could produce significant positive
learning outcomes compared to traditional classroom instruction, it can extend prior
research and drive changes in how future students are educated. This study has become
the first quantitative quasi-experimental research controlling for individual learning to
71
validate the effects of augmented reality using mobile handheld digital devices on
individual students’ learning outcomes without group collaboration.
The next chapter, Chapter 3, discusses the methodology. The chapter begins with
a restatement of the research focus, purpose, problem statement, and discusses the
research questions and hypotheses. The chapter continues with discussion of the research
methodology, research design, population and sample selection, sources of data, data
collection and data analysis procedures, ethical considerations, and limitations. The
chapter ends with a summary.
72
Chapter 3: Methodology
Introduction
The purpose of this quasi-experimental, quantitative, pre- and posttest design
study was to determine if there was a difference between learning outcomes of students
exposed to traditional instruction verses an augmented reality simulation, without group
collaboration. Augmented reality has been described as the ability to overlay one or more
computer graphics or virtual images onto a live direct or indirect real-world environment
while using a tool such as a digital device to provide additional information to the user in
real time (Billinghurst, 2002; Dunleavy et al., 2008; Klopfer & Squire, 2007; Laux et al.,
2012; Lee, 2012; Shelton, 2002; Squire & Jan, 2007). An examination of existing
literature has found little evidence that has shown the impact of augmented reality as a
tool for improving learning outcomes of individual students. This study has addressed
that gap by investigating two related research questions. The first question was: Does
augmented reality affect high school students’ learning outcomes in chemistry, as
measured by a pre- and posttest methodology when ensuring that the individual outcomes
are not the result of group collaboration? The second research question was: Does
augmented reality instruction or traditional classroom instruction have a greater positive
impact on high school students’ learning outcomes in chemistry, as measured by a pre-
and posttest methodology when ensuring that the individual outcomes are not the result
of group collaboration?
In order to not be confused with virtual reality, augmented reality has been
described as the ability to overlay one or more computer graphics or virtual images onto a
live direct or indirect real-world environment while using a tool such as a digital device
73
to provide additional information to the user in real time (Billinghurst, 2002; Dunleavy et
al., 2008; Klopfer & Squire, 2007; Laux, Trausch, & Wyatt, 2012; Lee, 2012; Shelton,
2002; Squire & Jan, 2007). In this study, some participants used a handheld digital device
(iPod Touch) to display digital information (text, diagrams, videos) while moving around
a classroom environment. In contrast, “virtual reality is a completely artificial digital
environment that uses computer hardware and software to create the appearance of a real
environment to the user” (Kipper & Rampolla, 2013, p. 21). In short, augmented reality
overlays digital information on a screen, such as a smartphone or other digital device, as
the user moves about in the real-world environment. In virtual reality, the user receives
all input from the computer system and the computer responds to the user’s input. The
user is captive to the computer and the digital world it creates, while in augmented reality
the user can move around in their real-world environment as is demonstrated by The
Reality-Virtually Continuum (see Appendix G) demonstrates this relationship.
The methodology described in this chapter was developed to answer the stated
research question and address the associated hypotheses. The null hypothesis was stated
as: augmented reality has no influence on students’ learning outcomes without group
collaboration. This researcher anticipated an alternative hypothesis to be true: augmented
reality will improve students’ learning outcomes without group collaboration. This study
sought approximately 50 high school students to participate. This chapter restates the
problem, research question, and hypotheses in order to reorient the reader. Then the
research methodology, research design, population, and sample selection are described.
Lastly, an explanation of the study’s instrumentation, sources of data, procedures used for
validity, reliability, data collection, data analysis, ethical considerations, and limitations
74
are discussed. The goal of this chapter was to thoroughly describe how this study was
conducted, so that the findings and implications could be comprehensively assessed and
understood.
Statement of the Problem
It is not known to what extent augmented reality can be used to further high
school students’ learning outcomes in science, as measured by a pre- and posttest
methodology without group collaboration. Much research was aimed at understanding
student learning and finding ways to improve science education in the United States.
Some students, such as those who are part of the newer generation, Millennial, and
considered digital natives, may prefer using a self-directed, constructivist, and
technologic approach to learning rather than traditional classroom instruction. If it can be
demonstrated that augmented reality simulations without group collaboration can produce
greater individual-student outcomes as compared to outcomes from traditional classroom
instruction without group collaboration, then educators may change their teaching
methodology to better meet the neomillennial learning style. In addition, although
working in groups has provided benefits to the learner, students still have to be able to
process and solve problems individually. Augmented reality simulations may become an
effective learning tool to increase individual learning outcomes without group
collaboration, but more research needs to be conducted to determine if augmented reality
simulations can yield positive individual-student outcomes.
The findings of previous studies have been found to be inconclusive in
demonstrating how augmented reality improves individual students’ learning outcomes
(Chang et al., 2009; Huizenga et al., 2009; Vilkoniene, 2009; see Appendix A).

75
Specifically, it is currently not known how augmented reality can impact high school
students’ learning outcomes, particularly in chemistry without group collaboration.
Therefore, new research should focus on the potential of game-based learning tools, such
as augmented reality simulations, as a means of improving individual learning outcomes.
The augmented reality tool, which this researcher used, is composed of a digital handheld
device, an iPod Touch, with mobile data service provided by Verizon Wireless’s Mi-Fi.
The augmented reality simulation was created using ARIS (Academic ADL Co-Lab,
2012), an open-source, web-based augmented reality tool developed by the University of
Wisconsin-Madison (Gagnon, 2010). The proposed study used a pre- and posttest
methodology without group collaboration to investigate the impacts of an augmented
reality tool on student learning outcomes, when compared to traditional classroom
instruction.
By using a quantitative, pre- and posttest, methodology in which a comparison
group was contrasted to an experimental group, this study differed from earlier studies
and offered new insight into the influence of augmented reality simulations on individual
learning outcomes. In addition, by controlling for group collaboration, the design of this
study focused on comparing two educational treatments. The traditional classroom
instruction group was referred to as a “comparison” group rather than a “control” group.
By definition, a “control group does not receive the experimental treatment… are not
exposed to any of the independent variable values” (Jha, 2008, p. 33). Since the purpose
of this study was to compare two instructional methods, traditional classroom instruction
with an augmented reality simulation, both groups are receiving a treatment. Therefore,
76
the two groups are referred to as the comparison group or traditional classroom
instruction group and experimental group or augmented reality group.
A quantitative methodology was chosen to determine if there exists a difference
between students’ learning outcomes of two groups: those who receive traditional
instruction and those who receive an augmented reality simulation, and also whether
learning occurred in an augmented reality instruction setting. The students’ pre- and
posttest scores provide numerical data that were analyzed using SPSS statistical
procedures. By collecting numerical data, this researcher sought to determine if an
augmented reality simulation produced better student outcomes in chemistry without
group collaboration than traditional classroom instruction. The findings could help
address the problem of meeting the changing needs of students. Since some of today’s
students engage in a neomillennial learning style, augmented reality simulations that are
created for individual learning situations may result in enhanced student outcomes. The
findings of this study could also increase understanding of the problem by demonstrating
that augmented reality simulations do not always need to be conducted in collaborative
groups.
Research Questions and Hypotheses
This study has been designed to answer a specific research question and to
address one of the three associated hypotheses. The following research questions and
hypotheses guided this study:
RQ1: Does augmented reality affect high school students’ learning outcomes in
chemistry, as measured by a pre- and posttest methodology when ensuring that
77
the individual outcomes are not the result of group collaboration? Testable
hypotheses were then developed to answer this question; these were:
H10: Augmented reality has no impact on students’ learning outcomes.
H11: Augmented reality has a positive impact on students’ learning outcomes.
H12: Augmented reality has a negative impact on students’ learning outcomes.
RQ2: Does augmented reality instruction or traditional classroom instruction have
a greater positive impact on high school students’ learning outcomes in chemistry,
as measured by a pre- and posttest methodology when ensuring that the individual
outcomes are not the result of group collaboration? The hypotheses associated
with this RQ were:
H20: Augmented reality instruction and traditional classroom instruction have the
same impact on students’ learning outcomes.
H21: Augmented reality instruction has a greater positive impact on students’
learning outcomes than traditional classroom instruction.
H22: Traditional classroom instruction has a greater positive impact on students’
learning outcomes than augmented reality instruction.
In order to clarify the purpose for the research questions and associated
hypotheses, it was important to identify the variables in the study; the approach used to
collect data, and explain the purpose of the design as a best approach to answer the
research questions and test the hypotheses. For RQ1, the independent variable was
augmented reality. For RQ2, the independent variable was the instructional methodology.
There were two instructional methodologies: traditional classroom instruction and an
augmented reality simulation. The dependent variable for both research questions was the
78
level of students’ learning outcomes as measured by the difference in the pre- and
posttests.
The pretest was identical to the posttest with one exception: the questions were in
a different order (see Appendix B). The pre- and posttest were created using the
chemistry textbook’s ExamView Pro Testmaker CD-ROM (Chemistry: Matter and
Change, 2005). All participants took the pretest before the activity; the pretest measured
the participants’ baseline knowledge of Alpha, Beta, and Gamma radiation. The pretest
took approximately 20 minutes to complete. After the activity, the posttest was given to
all participants. The posttest was used to measure acquired knowledge and consisted of
the same questions as the pretest, arranged in a different order (see Appendix B). The
posttest took approximately 20 minutes to complete. All participants took the same pre-
and posttest. All aspects of the study were observed by the researcher to assure the
participants worked independently. Data analysis employed SPSS software (IBM
Corporation, 2011). Taking into consideration, the quasi-experimental design of this
study in which two groups received a treatment, both groups received a pretest and a
posttest, and data were compared statistically, this study employed a quantitative, pre-
and posttest design to best answer the research question and corresponding hypotheses.
The next section, Research Methodology, explains this further.
Research Methodology
To expand the body of knowledge of augmented reality for education purposes, it
was important to investigate whether augmented reality simulations improved individual
students’ learning outcomes without group collaboration, when compared to traditional
classroom instruction. To accomplish this, this researcher pursued a quantitative research
79
design because the motivating purpose was theory testing (Jha, 2008). This study was
based on a quantitative, quasi-experimental, pretest and posttest design. The quantitative
methodology included a statistical comparison of two groups undergoing different
treatments, and produced quantitative results to be assessed for significance.
This quantitative research design was chosen based on the review of theory, the
hypotheses generated, and the question needing to be answered. As Jha stated, it
begins with a theory. From theory, prior research is reviewed; from theoretical
frameworks, hypotheses are generalized… Hypotheses lead to data collection and
the strategy needed to test them and analyze according to the hypothesis …
Conclusions are drawn [that] confirm or conflict with the theory. (Jha, 2008, p.
49-50)
In this study, the primary factors included the educational treatments applied to students
participating in a chemistry lesson; traditional classroom instruction verses an augmented
reality simulation. The outcome was a measure of how much was learned through the
lesson, as measured through a pre- and posttest methodology. The quantitative
methodology used here was suitable for this study because it was an experimental design
that tested observed measurements: it measured pre- and posttest scores, used equivalent
groups (a comparison group verses an experiment group), and tested both groups
simultaneously (Campbell & Stanley, 1966). A mixed-methods design is sometimes used
when a quantitative or qualitative method was inadequate (Vogt & Burke-Johnson,
2011). Because the quantitative design met the needs for this study, a mixed-methods
design was not considered.
80
Based on what was known about digital natives and the neomillennial learning
style, it has been theorized that digital natives learn better through discovery and real-
world learning situations, rather than being told; by piecing information from multiple
sources; by integrating the visual with the spatial (Oblinger & Oblinger, 2005), and
through self-directed tasks (Dieterle et al., n.d.). As is documented in existing literature
covering the topic of GBL and described in above chapters, computer games have been
investigated for students’ learning outcomes (Carr & Bossomaier, 2011; Cheung et al.,
2008; Foster, 2011; Kaufman et al., 2011; Kebritchi et al., 2010; Tuzun et al., 2009; Yip
& Kwan, 2006; see Appendix D). Additionally, augmented reality games using digital
handheld devices have been investigated for students’ learning outcomes (Chang et al.,
2009; Huizenga et al., 2009; Rosenheck & Perry, 2012; Vilkoniene, 2009; see Appendix
A). However, gaps were found in the existing literature that centered on the lack of
evidence of improved individual learning outcomes, without group collaboration, from
augmented reality games that used handheld digital devices. It was not known if positive
individual student outcomes would be produced in this study. However, this researcher
predicted that an augmented reality simulation in science would increase students’
learning outcomes when compared to traditional classroom instruction.
Research Design
This study used a quasi-experimental, quantitative, pretest and posttest design, as
modeled by the pre- and posttest design explained by Weinfurt (2000). Two groups
participated, measurements were taken before and after an intervention, and data analysis
determined if one group’s posttest scores changed from pretest scores significantly more
than the other group’s scores. In this study, the two groups were referred as the
81
experimental group and the comparison group. A pretest and posttest were administered
to both groups, and both groups received a treatment. The comparison group received
traditional classroom instruction and the experimental group received the augmented
reality simulation.
As a quasi-experimental design, participants were not randomly assigned to
groups, but rather assigned based on their cumulative science GPA (Panoutsopoulos &
Sampson, 2012). The high school’s chemistry instructor created the groups to be
approximately equal in ability. Hence the entire sample of participants was not randomly
assigned although the assignments within each stratum were random. This was
accomplished by dividing the participants based on their science GPA. Two groups were
created with a similar number of A, B, C, and below C participants. One group became
the comparison group and the other became the experimental group. This method was
chosen rather than a random assignment because a random assignment of participants
may have created unequal ability groups. Since the purpose of this study was to compare
traditional instruction with an augmented reality simulation, if one group had superior
participants, it may have biased the results. Therefore, participant assignment was
preferred to random assignment.
A key part of this quantitative methodology was the measurement of student
scores to establish a connection between the observed difference in learning outcomes
and the received educational treatments. Data were collected from a stratified sample of
approximately 50 participants from a local high school. Students were given a pretest that
assessed participants’ baseline knowledge and a posttest that assessed knowledge
acquired by students during their lesson. Both groups learned about Alpha, Beta, and
82
Gamma radiation: the control group received 30 minutes of traditional classroom
instruction and the experimental group received 30 minutes with an augmented reality
simulation, which was created using ARIS (Gagnon, 2010). All participants worked
individually and the researcher observed them to assure participants worked individually.
Thus, the proposed study was the first quantitative, quasi-experimental research that
controlled for individual learning to validate augmented reality using mobile handheld
digital devices that affected individual students’ learning outcomes without group
collaboration.
To demonstrate the motivation for a quasi-experimental design, it was helpful to
examine a correlational design, which is an alternative to the chosen design. There are
two types of correlational designs: explanatory and predictive. In an explanatory design,
“the research addresses the extent to which variation in one concept is related to variation
in another concept” (Fawcett, 2008, p. 114). For example, in playing video games and
performing in school, the researcher would collect two sets of scores: hours of playing
games and school performance. In this example, two sets of data are collected and a
relation between the two variables could be drawn, but the direction (which variable
affects the other) would not be known. This data would then be analyzed and
correlational statistical analysis conducted; typically bivariate correlation and multiple-
regression are used (Fiala, 2011). Because this study used an experimental intervention
and sought to find a difference between two variables rather than a relationship between
the variables, this study was not an explanatory correlational design.
In a prediction design, “the goal is to estimate a future value of the dependent
variable (Vogt & Burke-Johnson, 2011, p. 300). For example, the researcher would
83
identify one or more predictor variables, such as motivation and collaboration, and make
a prediction that these variables could increase an outcome of student success. This study
was not a prediction design for several reasons. First, the purpose statement would need
to include the word “predict” or make a prediction. Secondly, the predictor variable
would be measured at a different point of time than the criterion variable. Although this
study used a pre- and posttest methodology, two sets of data were collected at two
different times. The data from the pretest measured current knowledge and the posttest
measured acquired knowledge. The pre- and posttest were identical except that the
questions were in a different order.
This study was a quasi-experimental study because it had elements of an
experimental design, but took into account that not all aspects could be completely
randomized or controlled (Campbell & Stanley, 1963). Here two independent groups
were compared with respect to an outcome variable, specifically; learning outcomes of a
group exposed to an augmented reality simulation were compared to a group not exposed
to this simulation. Often in quasi-experimental studies, the groups were not chosen
randomly, but were chosen so that initial differences between groups were minimal
(Gribbons et al., 1997). Here the groups were matched based on prior GPA scores of
students in those groups.
In this study, it was not known to what extent augmented reality improves
individual student learning outcomes without group collaboration when compared to
traditional classroom instruction. Therefore, extensive research into computer GBL and
augmented reality GBL has been conducted. This study explored if a difference existed
between a comparison group that received traditional classroom instruction and an
84
experimental group that received an augmented reality simulation. This study used a pre-
and posttest methodology. All participants took the pretest before the activity, and a
pretest after the activity; traditional classroom instruction for the comparison group or
augmented reality simulation for the experimental group. Discovery occurred when the
mean difference between the comparison and experimental groups’ pre- and posttest
scores were compared using an independent t test (Weinfurt, 2000).
This study used statistical methods to evaluate the influence of the independent
variable on a dependent variable. The independent variable was the instructional method
(traditional classroom instruction and the augmented reality simulation) and the
dependent variable was the level of students’ learning outcomes. Vogt and Burke-
Johnson (2011) described the independent variable as the variable that is “the presumed
cause of the study” (p. 178). Wetcher-Hendricks (2011) described the independent
variable as “the predictor of behaviors, attitudes, or characteristics; a given condition
either already existing or created by the researcher before the start of data gathering” (p.
5). The independent variable was the instructional method, which may influence or affect
the dependent variable, test scores. Vogt and Burke-Johnson (2011) explained the
dependent variable “as the presumed effect of the study” (p. 103). Wetcher-Hendricks
(2011) described the dependent variable as the “behaviors attitudes, characteristics
predicted by the independent variable” (p. 5). It was not known to what extent how
augmented reality could be effective in increasing student learning without group
collaboration. By choosing an experimental design, this researcher sought to determine if
an augmented reality simulation could enhance student outcomes when compared with
traditional classroom instruction, in both cases without group collaboration.
85
Population and Sample Selection
This section describes the population and sample characteristics relevant to this
study. For feasibility reasons, this study was conducted at a high school that was
convenient for the researcher. The researcher was located in southwest Colorado. This
area is sparsely populated with towns and corresponding high schools approximately and
an hour’s drive from each other. Therefore, the researcher attempted to conduct the study
at the closest high school in southwest Colorado. The high school’s student population
for the 2012–2013 academic year was 215 students. Participants of the study consisted of
approximately 50 high school students selected by a type of stratified sampling. As
minors, participants sought permission from a parent or guardian to participate in the
study. Once signed, and consent was received by the researcher, the participant was
considered eligible to join the study. Participants had the right to withdraw from the study
at any time.
Upon return of the signed consent forms, this researcher created a ledger listing
all participants. This ledger was used by the high school’s chemistry teacher to match the
students’ cumulative science GPA to the participant. The participants were then divided
into subcategories based on GPA: A, B, C, and below C. In dividing by GPA, two similar
groups of student were attained (Panoutsopoulos & Sampson, 2012). Half of each
category was then randomly placed into the final comparison and experimental groups.
This sample was a stratified sample because the entire sample of participants was not
randomly assigned, but assigned by science GPA, although the assignments within each
stratum were random. Since this study was a quasi-experimental design, the groups were
86
made to be similar so that it was easier to identify a true relationship between the
educational treatment and the attributed improvement in students’ learning outcomes.
Berkowitz (n.d.) suggested that comparative studies estimate sample size through
power calculations. This calculation requires the determination of an effect size and
significance level. Effect size is “a statistic indicating the standardized difference in
outcome for the average subject who received a treatment as compared to the average
subject who did not or who received a different level of treatment” (Vogt & Burke-
Johnson, 2011, p. 121). Cohen (1992) classified effect size into three areas: small (0.2),
medium (0.5), and large (0.8). Significance can be defined “as the degree to which a
research finding is meaningful or important” (Vogt & Burke-Johnson, 2011, p. 360). For
this study, the significance was (<.05). Cohen (1992) suggested that in order “to detect a
large difference between two independent sample means” (p. 158) an effect size of 80%
and a significance level of .05 should be utilized. Using these values, each group in the
study should have 26 participants. Based on this calculation, and using G*Power software
(Erdfelder & Buchner, 1996), a sample size of 52 participants was deemed sufficient for
this study.
Two types of errors may occur when testing a hypothesis: Type 1 or Type 2. Type
1 error, or alpha, occurs when the “wrongly rejects a true null hypothesis” (Vogt &
Burke-Johnson, 2011, p. 407). This mistake would occur if the researcher found a
significant difference between the two groups when a difference really did not exist. A
Type 2 error would occur when the researcher “wrongly accepts a false null hypothesis”
(Vogt & Burke-Johnson, 2011, p. 408). This can occur when a researcher concludes there
is no significant difference when a significant difference does exist. The ability to
87
correctly reject a false null hypothesis, or correctly reject a Type 2 error, is referred to as
“power of a test or statistical power” (Vogt & Burke-Johnson, 2011, p. 297).
Special attention was to be given in the recruitment and organization of
participants during the study. This researcher met the superintendent and science teacher
of the high school identified for this study, and acquired permission to conduct the study
at that school. This researcher also attained Institutional Review Board (IRB) approval
from Grand Canyon University to conduct the study. This researcher read the recruitment
script to perspective participants, perspective participants returned the signed consent
forms, and the study was then conducted. At the conclusion of the researcher’s reading of
the recruitment script and before participants began the study, participants were reminded
that involvement in this study was voluntary and that all information would be coded for
confidentiality. Participants were given a copy of the recruitment script, an informed-
consent form, parental-permission consent form, and a copy of the confidentiality
agreement (Grand Canyon University, n.d.). Eighty-nine participants returned their
signed consent forms, including the informed-consent and parental-permission consent
form.
Although 89 participants originally returned signed consent forms, due to student
absence, incompletion of tests, or participants withdrawing from the study, fewer
participants actually completed the study. At the conclusion of the study, the traditional
instruction group finished with 42 completed pretest and posttests; one participant did not
complete the tests (A35) and two participants were absent. The augmented reality group
finished with 36 completed pretests and posttests; three participants withdrew (B21, B32,
and B37) and five participants were absent. The pre- and posttest scores were then

88
analyzed to determine the difference in learning outcomes due to the educational
treatment received. A debriefing session was offered where participants had the
opportunity to experience the alternative treatment.
Instrumentation
The methodology relied on for conducting this study used a pretest and posttest
design to obtain a measurement of the difference in learning outcomes of students. The
instruments used to obtain the numerical data were the pretest and posttest. Both groups
received and completed the same pre- and posttest; the difference between the groups
was the form of instruction. The comparison group received the traditional classroom
instruction and the experimental group received the augmented reality simulation. After
experiencing the 30 minute lesson, both groups received and completed a posttest.
Statistical analyses, in the form of t tests (paired t tests and independent t tests), were then
used to analyze the test scores. In these t tests, the means of the two group (comparison
and experimental) scores were compared. The variable tested was “delta,” the difference
between the posttest and pretest score. In this study, delta was expected to be a positive
number.
The data-collection instruments used to measure the dependent variable being
examined included pre- and posttests comprised of 30 closed-ended questions, created
with the textbook manufacturer’s companion software: ExamView Pro (Chemistry:
Matter and Change, 2005). The test questions were designed by the editors of the
textbook to yield specific answers about Alpha, Beta, and Gamma radiation. In this case,
the textbook and its associated test bank can be considered a constant or given. As part of
the study, a Cronbach’s alpha was calculated for the pre- and posttest subjects, in order to
89
assess internal consistency. However regardless of the results, the same textbook and test
bank must have been and were used. The expectation, though, was that Cronbach’s alpha
would be quite high because school textbooks are considered to be validated by subject
matter experts, including the textbook authors. ExamView Pro (Chemistry: Matter and
Change, 2005) was a software tool used in creating assessments based on the textbook,
not an instrument in itself. This study used pre- and posttest questions that were pulled
directly from the chemistry textbook and an augmented reality simulation that was
created using ARIS (Gagnon, 2010; Academic ADL Co-Lab, 2012). These instruments
provided the measurements and numerical data needed to statistically and quantitatively
assess the impact of comparative educational treatments.
Validity
Validity is an important factor in any study because it reflects how well the study
accomplishes its goals or purpose. Two kinds of validity are discussed here: external and
internal validity. External validity affects the generalizability of the study, while internal
validity is representative of the thoroughness of the study.
The instruments used in this study improved its external validity. Because the pre-
and posttests have been used previously as chemistry textbook questions, they have had
success at measuring learning, or were deemed valid. The tests have established external
validity because the results are generalizable. A threat to external validity may arise as an
effect of testing. Since participants took a pretest, the pretest may increase or decrease the
participant’s attention or interaction during the treatment (traditional classroom
instruction or augmented reality simulation) (Campbell & Stanley, 1963). To minimize
90
this, the researcher only used a multiple-choice pre- and posttest and then drew
generalizable conclusions from the results.
Textbook authors, subject matter experts, describe internal validity development
(Glencoe Science White Paper, 2013; Hunt, 2013) based on National Science Education
Standards (National Research Council, 1996), research-based instructional strategies that
were used to explain and justify the standards supporting curricula, and the assessment of
student understanding through a variety of means: section and chapter assessments,
standardized test practice, and supplemental materials such as ExamView Pro Testmaker
CD-ROM. A possible threat to internal validity was that after taking the pretest,
participants may have become familiar with the outcome measure and remembered
responses for the posttest (Shadish, Cook, & Campbell, 2002). To prevent this from
happening, the researcher scrambled the research questions and possible answers on the
posttest. Another threat to internal validity may arise from the selection of subjects
(Campbell & Stanley, 1963). This study did not use randomly assigned subjects, but
rather subjects were divided based on GPA, then randomly assigned to a group as
described in the Research Design section of this chapter.
The measurement tools of this study have face validity and criterion validity. Face
validity is “so called because it is determined by whether a measure appears to make
sense… In determining face validity, one often asks expert judges whether the measure
seems to them to be valid” (Vogt & Burke-Johnson, 2011, p. 137). The textbook authors
were subject matter experts and expert judges who justified the textbook and the
assessment methods to be accurate. Criterion validity “is the ability of the test to make
accurate predictions” (Vogt & Burke-Johnson, 2011, p. 84). Given the prior successful
91
usage of the textbook assessments by educators and students, these tools, pre- and
posttest, provided reliable results to determine if an augmented reality simulation could
affect students’ learning outcomes by comparing traditional classroom instruction to an
augmented reality simulation. This study has criterion validity because it compared two
levels of the independent variable (traditional instruction and augmented reality
simulation).
Reliability
Reliability of the data collected was based largely on the test instruments used in
this study. The pre- and posttest was comprised of questions that have been used
previously as chemistry textbook questions, to gain understanding in radioactivity. The
chemistry textbook questions have also been correlated to national science standards, as
explained in Glencoe Science White Paper (2013) and by Hunt (2013). Because these
textbook questions have been previously used to yield the designed results, they have
been tested for stability reliability (test after test, it is reliable to derive similar results)
and internal consistency (testing the same characteristics) (Vogt & Burke-Johnson, 2011).
This researcher also examined the pre- and posttest for reliability using Cronbach’s alpha
(Cronbach, 1951; Pallant, 2010) and found .826 in the pretest and .835 for the posttest.
Data Collection Procedures
The study proceeded after the Dissertation Committee and Grand Canyon
University’s IRB approved this proposal with the first step of collecting the proposed
data. The sample for this quantitative study was a stratified sample of approximately 50
high school students in southwestern Colorado. Sufficient sample size was determined by
consulting formulae and a published table (Cohen, 1992). This researcher introduced
92
participants to the proposed study by visiting the school and giving a brief overview.
During this time, this researcher explained that all participation would be voluntary and
would require a signed, informed consent of the student and parental-permission consent
form by a parent or guardian (Grand Canyon University, n.d.). The Belmont Report
(National Commission for the Protection of Human Subjects of Biomedical and
Behavioral Research, 1979) established a series of ethical principles and guidelines for
the protection of human subjects in research. Part C, section 1 of the Belmont Report
(National Commission for the Protection of Human Subjects of Biomedical and
Behavioral Research, 1979) explained the importance of informed consent as “the respect
of persons requires that subjects, to the degree that they are capable, be given the
opportunity to choose what shall or shall not happen to them” (Part C, section 1, para. 1).
Based on these guidelines, participants were informed of the purpose of this study, which
was to test two teaching methodologies through a pre- and posttest. The introduction
concluded by reminding participants that the study was voluntary, and all students were
given a copy of the recruitment script, informed-consent form, parental-permission
consent form, and a copy of the confidentiality agreement (Grand Canyon University,
n.d.).
Sample selection, as well as final sample size, was based on the number of signed
and returned consent forms. A total of 89 prospective participants returned their signed
consent forms: both an informed-consent and parental-permission consent form. Of the
89 participants who returned signed consent forms, 45 were placed into the traditional
classroom instruction group and 44 were placed into the augmented reality simulation
group. Recall this study sought to create two equal ability groups by dividing the number

93
of participants equally based on science GPA. In doing so, the science teacher divided
students and randomly placed an equal number of A, B, C, and below C students into
each group. When placement was complete, the traditional instruction group had an
average science GPA of 3.13 and the augmented reality group had an average science
GPA of 3.18.
On the day of the study, two neighboring classrooms were used that had an
adjoining door, allowing the researcher to observe all participants in both groups. One
classroom was set-up for traditional classroom instruction and the other was prepared for
the augmented reality simulation. The researcher called participants to one or the other
room. Upon arrival at either site, participants were again reminded that the study was
voluntary, and were given a written child assent form (Grand Canyon University, n. d.) to
sign and to verify their voluntary participation. After this form was signed and collected
by the researcher, the pretest was administered. The pretest was coded A for the
traditional instruction group and B for the augmented reality group. The pretest was also
coded 1 to 45 to represent the participant (the posttest was coded in a similar manner).
Participants were given 20 minutes to complete the pretest and immediately following the
pretest, the 30 minute activity in which participants learn the same content; Alpha, Beta,
and Gamma radiation, was given. The traditional classroom group received 30 minutes of
teacher-led instruction in which the science teacher lectured and conducted a series of
demonstrations. The augmented reality group participants were given an iPod. After a
brief demonstration on the use of the camera feature with the markers (QR codes), they
conducted their self-led, 30 minute activity. In doing so, the participants would move
around the classroom, and take a picture of the marker; the captured image of the marker
94
would be sent wirelessly to the ARIS server; the ARIS server would receive the image,
and compare it to other images in its database. When a match was found, it would send
the event (picture, video, or other digital information) back to the participant’s iPod.
Immediately following the traditional classroom instruction and augmented reality
activity, the posttest was given, and participants had approximately 20 minutes to
complete this test. The pretest and posttest were identical except the questions were in a
different order.
Although 89 participants originally returned signed consent forms, due to student
absence, not completing tests, or participant withdrawing from the study (this is the
participants right to withdraw at any time), the traditional instruction group had 42
completed pretest and posttests. One participant did not complete the tests (A35) and two
participants were absent. The augmented reality group had 36 completed pretests and
posttests. Three participants withdrew as is their choice (B21, B32, and B37), and five
participants were absent. The pre- and posttest scores were then analyzed to determine
the difference in learning outcomes due to the educational treatment received. A
debriefing session was offered where participants had the opportunity to experience the
alternative treatment.
This researcher was responsible for maintaining all of the data. This study
required the assistance of the high school science teacher to access students’ cumulative
GPAs, as well as to conduct the traditional classroom instruction. This researcher has
maintained and kept secure in a lock-box the participants’ consent forms (informed-
consent, parental-permission and written child assent form), the ledger list of participants
and corresponding GPAs as submitted by the science teacher, the completed pre- and

95
posttests, and data generated from statistical calculations using SPSS. Data have been
securely retained in the researcher’s possession for a minimum of 3 years. After this time,
data can be destroyed by a cross cutting shredder.
Data collection was based on a pre- and posttest methodology, and was designed
to be completed in one school day. An approximate study timeline included the 20-
minute pretest, 30-minute activity, and 20-minutes to complete the posttest. The pre- and
posttest used 30 closed-ended questions requiring answers such as true/false, multiple
choice, matching, and completion (see Appendix B). The pre- and posttest were created
using ExamView Pro software (Chemistry: Matter and Change, 2005) with permission
from the high school science teacher and superintendent.
Of the 89 prospective participants, 45 became the comparison group and 44
became the experimental group as determined by dividing the students based upon their
cumulative science GPA. As previously stated, on the day of the study, due to absences,
withdrawing from the study and unfinished tests, 42 participants completed the traditional
classroom instruction tests and 36 completed the augmented reality simulation tests. To
accommodate all the participants, three traditional instructional groups and five
augmented reality groups were formed. The traditional instruction groups were instructed
in a classroom that could accommodate a maximum of 24 students at a session, while the
experimental group could only accommodate a maximum of 10 participants at a time.
This was because the data source, the Verizon Wireless Mi-Fi, could only be connected
or supply data to 5 iPod Touches at a time. The study used two Verizon Wireless Mi-Fis
and each Mi-Fi can connect to a maximum of 5 iPod Touches; therefore, the
96
experimental group was limited to 10 participants individually conducting the augmented
reality simulation at a time.
After the pre- and posttests were completed by participants, this researcher
collected them and compiled the data based on the coded test results. Each group’s
pretests and posttests were graded and received a percentage score based on a total of
100-points. These scores were then itemized on a ledger (see Appendix H). The ledger
data was then translated into SPSS statistical software for further analysis. To ensure the
validity and reliability of the data throughout the data-collection process, and to secure
the integrity of the study, this researcher was present at every stage of the study.
Data-Analysis Procedures
This study was for the purpose of investigating the following research questions
and associated hypotheses:
RQ1: Does augmented reality affect high school students’ learning outcomes in
chemistry, as measured by a pre- and posttest methodology when ensuring that
the individual outcomes are not the result of group collaboration? Testable
hypotheses were then developed to answer this question; these were:
H10: Augmented reality has no impact on students’ learning outcomes.
H11: Augmented reality has a positive impact on students’ learning outcomes.
H12: Augmented reality has a negative impact on students’ learning outcomes.
RQ2: Does augmented reality instruction or traditional classroom instruction have
a greater positive impact on high school students’ learning outcomes in chemistry,
as measured by a pre- and posttest methodology when ensuring that the individual
97
outcomes are not the result of group collaboration? The hypotheses associated
with this RQ were:
H20: Augmented reality instruction and traditional classroom instruction have the
same impact on students’ learning outcomes.
H21: Augmented reality instruction has a greater positive impact on students’
learning outcomes than traditional classroom instruction.
H22: Traditional classroom instruction has a greater positive impact on students’
learning outcomes than augmented reality instruction.
Students participating in the study were divided into two groups: one group that
was taught the topic using traditional classroom instruction and another group that was
taught using augmented reality instruction. All students took the pretest before the
activity (see Appendix B), which consisted of 30 questions and took approximately 20
minutes. The pretest measured prior student knowledge on the topic of Alpha, Beta, and
Gamma radiation, and was assessed upon a 100-point scale. The pretest questions were
comprised of questions with answers such as true or false, multiple choice, matching, and
completion using suggestions from a word-bank, all created using ExamView Pro
Testmaker CD-ROM (Chemistry: Matter and Change, 2005). This software parallels the
chemistry textbook series by Dingrando et al. (2005), published by McGraw Hill, and
was used by the high school’s science department to produce worksheets, quizzes, and
tests. Approval to use this software was granted to this researcher by the high school’s
chemistry teacher and the superintendent. The school district of interest has a site-license
to use ExamView Pro Testmaker CD-ROM. A site-license extension was granted by the
school district’s superintendent to produce the test for this study (see Appendix F).
98
After the traditional instruction and augmented reality simulation were completed,
all students took the posttest (see Appendix B), which consisted of the same questions as
the pretest but arranged in a different order. Students were again given approximately 20
minutes to complete it, and also like the pretest, the posttest was assessed upon a 100-
point scale. In order to determine if and how much the participants in the comparison and
experimental groups learned, paired t tests were used. The first step was a paired t test for
each group, which determined if further testing needed to be undertaken. If the paired t
test results were insignificant (the hypothesis that the pre- and posttest scores were the
same could not be rejected), then no further research needed to be conducted, as the
intervention had no impact on scores. Subsequently the “delta” scores, the difference
between scores of each participant, were calculated. Lastly, an independent sample t test
compared the delta from the comparison group with the delta from the experimental
group to determine if one group significantly increased in students’ learning outcomes
over the other.
This researcher conducted all coding of the pre- and posttests. There were two
codes on each test. The first code identified the group. The letter A identified the
comparison group and the letter B identified the experimental group. The second code
was a number that identified the participants’ completed test. For example, Pretest A23
identified the pretest from the comparison group that corresponds to participant 23. After
the pre- and posttests, the researcher had approximately 140 tests (two from each
participant: a pretest and posttest). Of these tests, half were coded Pretest A1 to A35 for
the comparison group and the others were coded Pretest B1 to B35 for the experimental
group. The same coding methodology was applied for the posttest.
99
On the day of the study, two neighboring classrooms were used that had an
adjoining door. This allowed the researcher to observe all participants; both groups at the
same time. One classroom was set-up for traditional classroom instruction and the other
was prepared for the augmented reality simulation. The researcher called participants to
one or the other room. Upon arrival at either site, participants were again reminded that
the study was voluntary, and were given a written child assent form (Grand Canyon
University, n.d.) to sign and to verify their voluntary participation. After this form was
signed and collected by the researcher, the pretest was administered. The pretest was
coded A for the traditional instruction group and B for the augmented reality group, as
well as coded with numbers 1 to 45 to represent the participant. The posttest was coded in
a similar manner. Participants were given 20 minutes to complete the pretest and
immediately following the pretest, the 30 minute activity in which participants learned
the same content (Alpha, Beta, and Gamma radiation) was administered. Immediately
following the activity, the posttest was given; again participants had approximately 20
minutes to complete this test. The pretest and posttest were identical except the questions
were in a different order. These pretest and posttest scores were the variables that were
utilized in the study. Descriptive statistics were used to present the means, standard
deviations, and ranges of the pre- and posttest data; this information is described in text
as well as displayed in tables.
The primary method for comparing the two groups’ means was t tests. Pallant said
that “t tests are utilized for comparing the mean scores of two different groups” (Pallant,
2010, p. 239). The first t test was a paired t test to examine whether the scores were
significantly different in the pre- and posttests. This paired t test was run for all students;
100
the null hypothesis was that the pretest and posttest scores were the same for all students
in the sample. This was a one-tailed test because this researcher was looking for an
increase in the test scores—not just looking to see if the scores were different. Once this
analysis was completed, the results revealed whether and to what extent the participants
in both groups learned. If the results of the paired t test indicated that no learning
occurred in either of the groups, then no further analysis was required. If the scores were
significantly higher for the posttest, two more t tests would be performed. The first test
would be a paired t test on the augmented instruction group only. This test was designed
to prove whether learning occurred as a result of the augmented reality instruction. The
null hypothesis for this test was that the pre- and posttest scores were the same for the
students in this instructional group. For the second research question, an independent t
test would be performed on the two groups. In this case, the two groups were the
comparison and experimental groups, where the comparison group experienced
traditional classroom instruction and the experimental group experienced an augmented
reality simulation. Both groups did learn a significant amount and additional testing was
carried out.
Assuming learning occurred in either or both groups (determined by the paired t
test) an independent samples t test was performed to compare the learning score of the
comparison group with the learning score of the experimental group. This independent
samples test was two-tailed. If the results were that both groups’ learning scores were the
same, then the null hypothesis would be accepted: Augmented reality simulations did not
have had an impact on improving students’ learning outcomes without group
101
collaboration. If the learning scores were different, then one of the alternate hypotheses
would be accepted (either one group or the other group learned more).
The use of parametric tests was based on certain characteristics of the data. The
rationale for using parametric tests was that the samples (participants in the comparison
and experimental group) were independent of each other; the data were expected to have
normal distributions, and the variances between the groups were expected to be equal. In
the event that the results did not meet these assumptions, then this researcher would
employ the nonparametric method, Mann-Whitney U-test (MacFarland, 1998).
This was a quantitative assessment of whether augmented reality simulations
resulted in learning in the subject of chemistry (without group collaboration). A quasi-
experimental, quantitative, pre- and posttest design was employed. Parametric techniques
of paired t test and independent samples t test were used to compare the pre- and posttest
scores of two matched groups that received different educational treatments. For all tests
in the study, a 5% level of significance was used to determine whether the null
hypotheses should be rejected or not. Data analysis was calculated using SPSS software
(IBM Corporation, 2011), and results lend evidence for the acceptance or rejection of
each proposed hypothesis.
Ethical Considerations
This study sought adolescent human subjects as participants; thus, possible ethical
issues related to the study are discussed here. The study was founded upon the premise
that some of today’s students are neomillennials (Sankey, 2006). As such, they seek self-
directed (Dieterle, et. al., n. d.), constructivist-learning experiences as described by
Dewey (1910), Vygotsky (Costley, 2012), and Piaget (Dalgarno, 2002) that integrate
102
available technology to assist in their knowledge acquisition rather than the traditional or
educator-led philosophy of instruction (Jonassen, Carr, & Yuen, 1998). The purpose of
this quasi-experimental, pre- and posttest design study was to determine if there was a
difference between traditional classroom instruction and an augmented reality simulation
in high school students’ individual learning outcomes in the chemistry topic of Alpha,
Beta, and Gamma radiation.
In reflecting upon this study’s design, sampling procedures, theoretical
framework, research problem, and research question, this study made every effort to
adhere to the basic ethical principles; respect of persons, beneficence, and justice, as
outlined by The Belmont Report (National Commission for the Protection of Human
Subjects of Biomedical and Behavioral Research, 1979) for the protection of human
subjects in research. The first ethical principle was respect for persons. The Belmont
Report stated that “individuals should be treated as autonomous agents, and second, that
persons with diminished autonomy are entitled to protection” (National Commission for
the Protection of Human Subjects of Biomedical and Behavioral Research, 1979a, p. 3).
Participants in this study, high school students, were treated as autonomous agents and as
such, were respected for their opinions and choices they made. For example, participants
were reminded before they began the study that their participation was voluntary and that
they would be observed for individual learning. Yet, the choices the participants made on
the pretest, during the activity, and posttest were of the participants’ individual freedom.
The second ethical principle was beneficence; efforts made to secure the
participants’ well-being (National Commission for the Protection of Human Subjects of
Biomedical and Behavioral Research, 1979a). This study did not foresee any harm

103
originating from participation. The study was held on the high school’s property, during
normal school hours, and utilized traditional teaching methodology that the participants
experienced every day or an augmented reality simulation that utilized Smartphone
technology with which many students were familiar. If a participant required assistance
with the augmented reality simulation, this researcher was present to assist in order to
“maximize possible benefits and minimize possible harms” (p. 4) that could arise from
the simulation.
The third ethical principle was justice or “fairness in distribution” (National
Commission for the Protection of Human Subjects of Biomedical and Behavioral
Research, 1979a, p. 5). This study was not supported by outside funding. This researcher
purchased, at his personal expense, all the tools necessary to conduct the study. As such,
this study was not influenced by outside means and treated all participants equally. All
participation was voluntary. The study did not screen participants. All volunteers from
the high school were accepted as participants. The high school’s science teacher created
the comparison group (traditional classroom instruction) and experimental group
(augmented reality simulation) by providing the participants’ science GPA. This created
two groups with a similar ability in science. The groups were not created based upon
gender, race, or socioeconomic status.
Before students could participate in this study, they were to secure signed,
informed consent of the student, and parent or guardian. The Belmont Report stated the
importance of informed consent: “the respect of persons requires that subjects, to the
degree that they are capable, be given the opportunity to choose what shall or shall not
happen to them” (National Commission for the Protection of Human Subjects of
104
Biomedical and Behavioral Research, 1979, Part C, section 1, para. 1). Participants also
completed and received other forms as deemed necessary such as a Social Behavioral
Application Human Subjects, and a confidentiality statement (Grand Canyon University,
2010).
Since the participants knew each other, the researcher paid particular attention to
maintaining the confidentiality of participants during the testing process. The participants
knew each other because they lived in the same community, attended the same school,
and were friends or siblings. Participants were instructed to conduct the study
independently, and this researcher was present to observe all elements of the study and
made sure it was conducted individually.
Two other ethical considerations were to use nondiscretionary language and to
respect the research location. Nondiscretionary language was used in conducting and
writing the study. The research site was honored by seeking site permission, by not
disturbing the site, and by presenting oneself as a guest and professional researcher. This
researcher did not foresee any conflict of interest. This researcher was not associated with
the school district or the high school of interest. This researcher was previously a middle
school mathematics and science educator in a different state.
The reporting of research data was done fully and honestly. All effort was made
to secure data and test-subject information through coding and locking data in a secure
offsite location to which this researcher has the only access. After 3 years, the data would
be destroyed. The results of this study are to be published with the completed dissertation
on ProQuest©.
105
Limitations
Despite a researcher’s planning, limitations still exist in every study (Shadish,
Cook, & Campbell, 2002). A limitation can be described as a weakness of the study as
identified by the researcher (Brutus, Aquinis, & Wassmer, 2012). The researcher of this
study has attempted to mitigate any possible limitations. The following are the limitations
that this researcher has identified to the research approach and methodology. The
researcher has identified four limitations that relate to the sample, instrumentation, and
data analysis.
A first limitation of this study could result from the sample, and more specifically
the sample’s size. In order to minimize the impact of sample size on the results, this
researcher has consulted formulae and a published table (Cohen, 1990). From this
information, an appropriate sample size of approximately 52 participants had been
determined for this study. If more than 52 participants volunteer for the study, the
researcher would have welcomed their participation. If there were less than 52
participants who volunteered and completed the study, the potential impact of the smaller
sample size would adversely affect the results. If this occurred, the limitation would be
unavoidable. In order to not affect the study negatively, data analysis would employ the
Mann-Whitney U-test on the data scores in order to compare the two groups and seek
results. The sample could also be biased because of the number of students that did not
complete both the pretest and the posttest and because of the sampling method itself,
which comprised choosing students for groups based on science GPA.
A second limitation of this study could result from a threat to internal validity and
more specifically from the selection of subjects (Campbell & Stanley, 1963). This study
106
did not use randomly assigned subjects, but rather subjects who were assigned to a group
based on their science GPA. This was necessary to create two groups that were equal in
science ability. Therefore, each group had an approximately similar number of A, B, C,
and below C participants. Equal ability groups were important for this study because
unequal groups could impact the results by giving one group an advantage over the other.
Since the purpose of this study was to compare two instructional methodologies, equal
ability groups (Panoutsopoulos & Sampson, 2012) were sought rather than random
assignment of participants to each group. This limitation would be unavoidable and
would not affect the study negatively.
The third limitation could result from the instrumentation: pretest and posttest.
This limitation could arise from taking the pretest in which participants may become
familiar with the outcome measure and remember responses for the posttest (Shadish,
Cook, & Campbell, 2002). To prevent this from happening, the researcher scrambled the
research questions and order of the answers on the posttest in order to minimize the
potential impact on the results. To prevent this, the researcher designed the study to be
completed within one school day. Participants took the pretest immediately before the
intervention and took the posttest directly after the intervention. The main purpose of this
was to prevent the participants from collaborating or discussing the intervention or test
questions. Lastly, this researcher was present during all aspects of the study to observe
and make sure all participants worked independently. If a participant did get the
opportunity to discuss aspects of the study with another participant, prior to taking the
study, this would be unavoidable. A discussion outside the scope of the study (pretest,
intervention, and posttest) could not affect the study negatively. It as it was vital that the
107
participants conduct the pretest, intervention, and posttest independently. The researcher
was present to assure this occurred. A discussion outside the timeframe of the study
(pretest, intervention, and posttest) would have been unavoidable but would not have
affected the study negatively.
A fourth limitation may be found in the data analysis and may arise as an effect of
testing as a threat to external validity. Since participants took a pretest, the pretest may
increase or decrease the participant’s attention or interaction during the treatment
(traditional classroom instruction or augmented reality simulation) (Campbell & Stanley,
1963). This limitation was unavoidable. To minimize the limitation, the researcher only
used a multiple-choice pretest and posttest, and the posttest’s questions and possible
answers were in a random order. The reasoning for using multiple-choice tests rather than
non-structured tests was because multiple-choice tests were easier for participants to
answer, easier for the researcher to analyze, and multiple-choice tests reduced interviewer
bias because the tests were self-administered (Malohtra, 2006). The use of a pretest and
posttest methodology would not affect the study negatively.
By identifying these limitations to the sample, instrumentation, and data analysis,
this research sought to aid other potential researchers who may desire to conduct a
replication or similar study (Brutus, Aquinis, & Wassmer, 2012). The above stated
limitations were unavoidable. As such, the researcher did not foresee any of these
limitations as adversely affecting the study negatively.
Summary
This study used a quantitative methodology and quasi-experimental design to
investigate how an augmented reality simulation affects high school students’ learning
108
outcomes in chemistry, using a pre- and posttest methodology without group
collaboration. A quasi-experimental design was used to investigate how an augmented
reality simulation compares to traditional classroom instruction in its influence on
students learning outcomes in chemistry. A previously tested augmented reality tool,
ARIS, was used for the augmented reality simulations. Data were collected from pretests
and posttests administered to all students in each group. The pre- and posttest questions
were drawn from the chemistry textbook (Dingrando, et al., 2005) and tests were created
utilizing the textbook’s companion software, ExamView Pro Testmaker CD-ROM
(Chemistry: Matter and Change, 2005). The textbook authors have determined validity
for the textbook and associated software as they are considered subject matter experts
(Glencoe Science White Paper, 2013; Hunt, 2013). Since the textbook and companion
software have been used previously by other educators (Glencoe Science White Paper,
2013; Hunt, 2013) as an assessment tool for teaching radioactivity, and the chemistry
textbook questions have been correlated to national science standards (Glencoe Science
White Paper, 2013; Hunt, 2013), they have been previously designed to yield results. As
such, they have been tested for stability reliability (test after test, it is reliable to derive
similar results) and internal consistency (testing the same characteristics). This researcher
also tested the pre- and posttest for reliability using Cronbach’s alpha (Cronbach, 1951;
Pallant, 2010), and obtained results proving reliability of both tests, as both alphas were
above .8. By statistically analyzing the two groups’ test scores using SPSS software (IBM
Corporation, 2011), variance and statistical significance of the impacts of the educational
treatment could be determined.
109
This study has followed all of Grand Canyon University’s IRB requirements, as
established by Grand Canyon University (2010), and all ethical guidelines as established
by The Belmont Report (National Commission for the Protection of Human Subjects of
Biomedical and Behavioral Research, 1979). Because this study required participants to
answer all questions on the pretest and posttest independently, no co-mingling, group
work, or group collaboration was allowed. To prevent this from occurring, this researcher
observed all aspects of the study. All efforts were made to maintain confidentiality of
participants, reliability of data collected, and both external and internal validity of this
study. Limitations, although out of this researcher’s control, were managed in a
professional manner, as they arose. For example to avoid weather effects on the
augmented reality simulation, the simulation was conducted inside and in a neighboring
room to the traditional classroom instruction.
This chapter outlined the proposed methods for conducting the study, with
particular focus on the collection and analysis of data to be used in answering the
proposed research question. Chapter 4 explains in more detail the actual collection and
analysis of data and the associated results of the completed study. The following chapters
describe the data collected using the methodology proposed here, discuss the results of
the statistical analyses conducted, as well as any changes in the procedures used to
investigate the data. Chapter 5 provides a discussion and an interpretation of those
results, as well as further explanation of the implications of this study. It is this
researcher’s belief that this study contributes valuable knowledge to the field of GBL,
utilizing augmented reality as a tool for improving learning outcomes, and especially for
those students who may prefer an alternative to traditional classroom instruction.
110
Chapter 4: Data Analysis and Results
Introduction
There is currently a lack of information on the effectiveness of augmented reality
simulations in helping students improve learning outcomes. To expand the body of
knowledge surrounding augmented reality for educational purposes, it was important to
investigate whether an augmented reality simulation improved individual students’
learning outcomes without group collaboration when compared to traditional classroom
instruction. Therefore, this quasi-experimental, quantitative, pre- and posttest design
study was implemented to fill that gap and determine if there was a difference in learning
outcomes of students exposed to two different learning methodologies: traditional
classroom instruction and an augmented reality simulation, without group collaboration.
Since the motivating purpose was theory testing, this researcher used a
quantitative research design (Jha, 2008). Data was collected from a stratified sample of
approximately 50 participants from a local high school. Participants were divided into
two similar groups, which were created by the high school’s chemistry instructor and
based on participants’ science GPA (Panoutsopoulos & Sampson, 2012). The comparison
group and experimental group were created to have a similar number of participants with
a similar distribution of science GPA (A, B, C, and below C). The independent variables
were the educational treatments applied to students participating in a chemistry lesson:
traditional classroom instruction verses an augmented reality simulation. Students were
given a pretest that assessed baseline knowledge before the activity and a posttest
immediately after the activity that assessed knowledge acquired by students during their
lesson. Both groups learned the same content: Alpha, Beta, and Gamma radiation. Both
111
groups also received the same amount of time: 20 minute pretest, 30 minute activity, and
20 minute posttest. All participants worked individually and this researcher observed
them to assure participants worked individually.
It was not known if positive individual student outcomes would be produced in
this study. However, this researcher predicted that an augmented reality simulation in
science would increase students’ learning outcomes when compared to traditional
classroom instruction. The research question in this study was developed to answer the
overall goal of assessing whether augmented reality simulations without group
collaboration would have an impact on student learning outcomes as compared to
traditional classroom instruction without group collaboration. The research questions for
this study were:
RQ1: Does augmented reality affect high school students’ learning outcomes in
chemistry, as measured by a pre- and posttest methodology when ensuring that
the individual outcomes are not the result of group collaboration?
RQ2: Does augmented reality instruction or traditional classroom instruction have
a greater positive impact on high school students’ learning outcomes in chemistry,
as measured by a pre- and posttest methodology when ensuring that the individual
outcomes are not the result of group collaboration?
In order to test RQ1, scores of the experimental (augmented reality) group were
tested for improvement from the pretest to the posttest. Testing RQ2 involved comparing
test scores of students in a comparison group, who received traditional classroom
instruction, to those in an experimental group, who received an augmented reality
simulation, provided the basis for assessing the impacts of the treatment under
112
examination. The null and alternative hypotheses provided the basis for study design and
development of methodology:
H10: Augmented reality has no impact on students’ learning outcomes.
H11: Augmented reality has a positive impact on students’ learning outcomes.
H12: Augmented reality has a negative impact on students’ learning outcomes.
H20: Augmented reality instruction and traditional classroom instruction have the
same impact on students’ learning outcomes.
H21: Augmented reality instruction has a greater positive impact on students’
learning outcomes than traditional classroom instruction.
H22: Traditional classroom instruction has a greater positive impact on students’
learning outcomes than augmented reality instruction.
The purpose of this chapter was to present the findings of the study. The
following sections present a narrative and visual summary of the population and the data
used in this study. This is followed by a detailed description of the data analysis. Lastly,
the results are presented. A discussion of these results then follows in Chapter 5.
Descriptive Data
This section provides a descriptive summary of the population sample used in this
analysis, including the sample size, age level, organization, and setting. For feasibility
reasons, this study was conducted at a high school in southwest Colorado that was
convenient for the researcher. This high school had a student population for the 2012–
2013 academic year of 215 students.
After investigating several sample-size methodologies, a sample size of 89
participants was identified for this study. Participants of the study were drawn from the
113
high school’s science department and as such, the only demographic classification was
that they were assumed to be of high school age. This study did not differentiate between
male or female, grade level, or English and non-English speaking students. To remain
true to the purpose of this study, this study investigated just the influence of two teaching
methodologies on the learning outcomes of high school aged students without group
collaboration. Since many of the participants were minors (under the age of 18),
participants were instructed to seek permission from a parent or guardian in order to
participate in the study in addition to providing their own consent. When the parental-
permission and informed-consent forms were returned appropriately signed and received
by this researcher, the participant was then eligible to join the study. In this manner, A
total of 89 participants returned signed consent forms and were eligible to partake in the
study.
Upon return of the signed consent forms, this researcher created a list of all
participants. This list was used by the high school’s chemistry teacher to match the
students’ cumulative science GPA to the participant. The participants were then divided
into subcategories based on GPA: A, B, C, and below C. Half of each category was
placed into the comparison group and the other half in the experimental group. Dividing
by GPA created two similar groups that could be compared and based only on teaching
methodology (Panoutsopoulos & Sampson, 2012). Using a quasi-experimental design
and the two similar groups, it was easier to identify whether a true relationship existed
between the educational treatment and the attributed improvement in students’ learning
outcomes. Of the 89 participants who returned the signed consent forms, 44 were placed
into the augmented reality group and 45 were placed into the traditional classroom
114
instruction group. The average science GPA of each group was 3.18 for the augmented
reality group and 3.13 for the traditional classroom instruction group.
The study was conducted in two adjoining science classrooms; one room hosted
the traditional classroom instruction and the other hosted the augmented reality
simulation. Between the rooms was a doorway so that this researcher was able to observe
both rooms and all participants at the same time. The study was conducted during a
typical school day. All participants took the pretest before the activity and the posttest
immediately after the activity. In order to accommodate all participants, they were
separated into smaller sessions. Three traditional classroom instruction sessions were
created in which all participants received traditional classroom instruction by the same
high school chemistry teacher about Alpha, Beta, and Gamma radiation and five
augmented reality simulation sessions were created so that all received the same
simulation (see Appendix I for an outline of the content used in the teaching
methodologies). Table 1 shows the number of high school students in each session and
group that completed the pretest, activity, and posttest. As noted in the data analysis
section, a total of 78 participants completed the study: 42 for the traditional classroom
instruction group and 36 for the augmented reality simulation group.
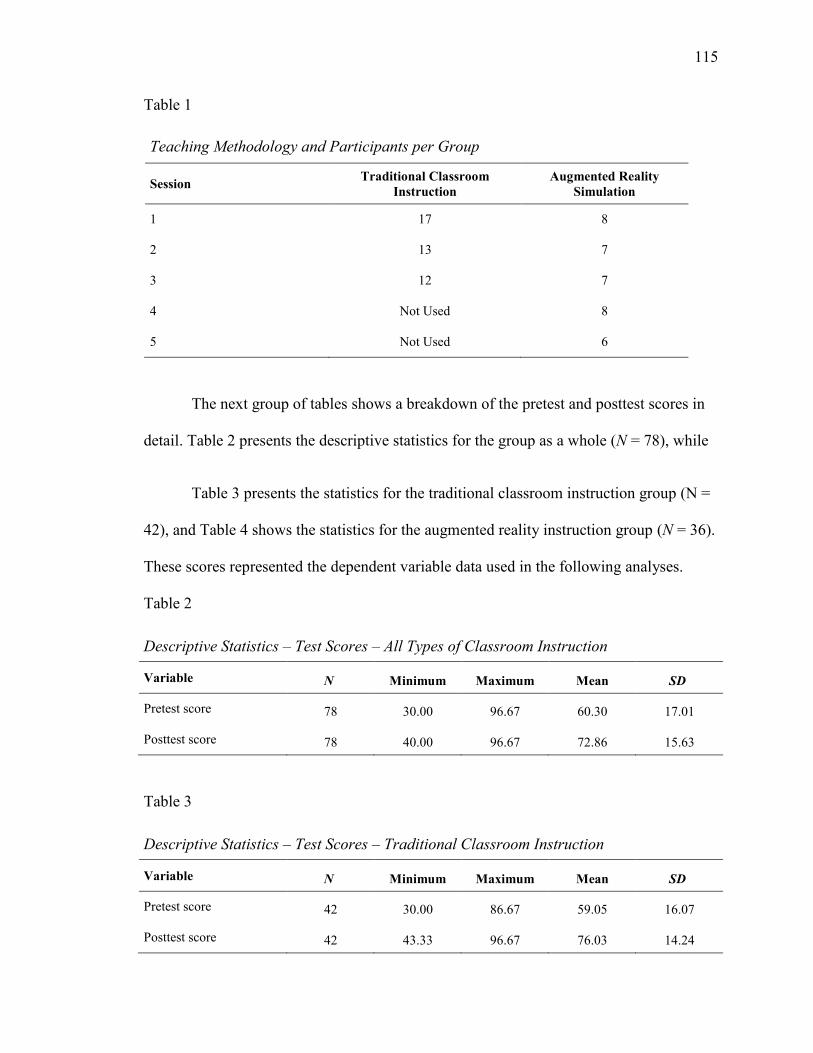
115
Table 1
Teaching Methodology and Participants per Group
Session Traditional Classroom Instruction
Augmented Reality Simulation
1 17 8
2 13 7
3 12 7
4 Not Used 8
5 Not Used 6
The next group of tables shows a breakdown of the pretest and posttest scores in
detail. Table 2 presents the descriptive statistics for the group as a whole (N = 78), while
Table 3 presents the statistics for the traditional classroom instruction group (N =
42), and Table 4 shows the statistics for the augmented reality instruction group (N = 36).
These scores represented the dependent variable data used in the following analyses.
Table 2
Descriptive Statistics – Test Scores – All Types of Classroom Instruction
Variable N Minimum Maximum Mean SD
Pretest score 78 30.00 96.67 60.30 17.01
Posttest score 78 40.00 96.67 72.86 15.63
Table 3
Descriptive Statistics – Test Scores – Traditional Classroom Instruction
Variable N Minimum Maximum Mean SD
Pretest score 42 30.00 86.67 59.05 16.07
Posttest score 42 43.33 96.67 76.03 14.24
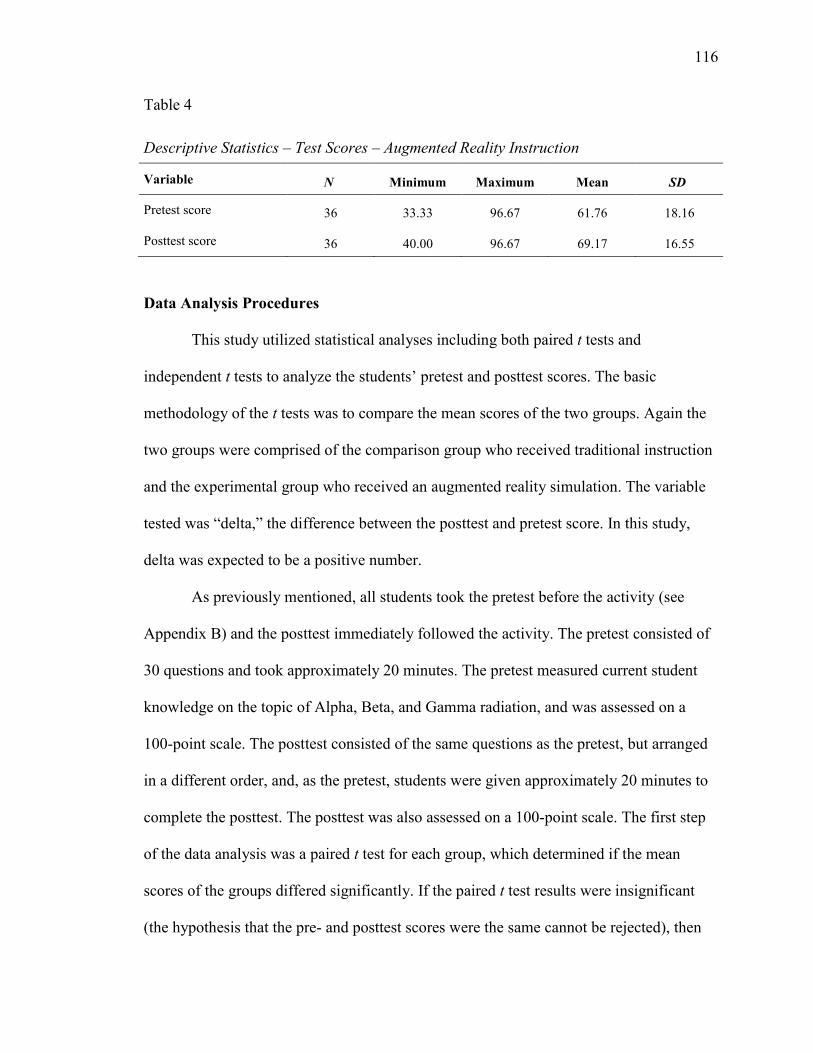
116
Table 4
Descriptive Statistics – Test Scores – Augmented Reality Instruction
Variable N Minimum Maximum Mean SD
Pretest score 36 33.33 96.67 61.76 18.16
Posttest score 36 40.00 96.67 69.17 16.55
Data Analysis Procedures
This study utilized statistical analyses including both paired t tests and
independent t tests to analyze the students’ pretest and posttest scores. The basic
methodology of the t tests was to compare the mean scores of the two groups. Again the
two groups were comprised of the comparison group who received traditional instruction
and the experimental group who received an augmented reality simulation. The variable
tested was “delta,” the difference between the posttest and pretest score. In this study,
delta was expected to be a positive number.
As previously mentioned, all students took the pretest before the activity (see
Appendix B) and the posttest immediately followed the activity. The pretest consisted of
30 questions and took approximately 20 minutes. The pretest measured current student
knowledge on the topic of Alpha, Beta, and Gamma radiation, and was assessed on a
100-point scale. The posttest consisted of the same questions as the pretest, but arranged
in a different order, and, as the pretest, students were given approximately 20 minutes to
complete the posttest. The posttest was also assessed on a 100-point scale. The first step
of the data analysis was a paired t test for each group, which determined if the mean
scores of the groups differed significantly. If the paired t test results were insignificant
(the hypothesis that the pre- and posttest scores were the same cannot be rejected), then
117
no further research needed to be conducted, as the intervention had no impact on scores.
If there was a difference in mean scores, calculations were made to determine “delta,” the
difference between scores of each participant. Lastly, an independent sample t test
compared the delta from the comparison group with the delta from the experimental
group to determine if one group significantly increased in students’ learning outcomes
over the other.
The null hypothesis of RQ1 addressed the possibility that augmented reality has
no impact on students’ learning outcomes. The paired t test already described and
conducted initially checked whether students in one group scored differently than
another. In order to test RQ1, a paired t test was performed that examined the augmented
reality students only. This t test examined whether students subjected to the augmented
reality instruction scored higher on the posttest than the pretest. RQ2 was tested using an
independent sample t test that examined whether the change, or “delta score”, was higher
for the control group, the experimental group, or the same for both groups.
All tests were coded to ensure the privacy of participants. This researcher
conducted all coding of the pre- and posttests. There were two codes on each test. The
first code identified the group; the letter A identified the comparison group or traditional
classroom instruction group and the letter B identified the experimental group or
augmented reality instruction group. The second code was a number that identified the
participants’ completed test; for example, Pretest A23 identified the pretest from the
comparison group that corresponds to participant 23. The same coding methodology was
applied for the posttest.
118
Validity of the data can be discussed in terms of external and internal validity.
External validity affects the generalizability of the study, while internal validity is
representative of the thoroughness of the study. The instruments used in this study
improved its external validity. Because the pre- and posttests have been used previously
as chemistry textbook questions, they have had success at measuring learning, or were
deemed valid. The tests have established external validity because the results are
generalizable. A threat to internal validity may arise as an effect of testing. Since
participants took a pretest, the pretest may increase or decrease the participant’s attention
or interaction during the treatment (traditional classroom instruction or augmented reality
simulation) (Campbell & Stanley, 1963). To minimize this, the researcher only used a
multiple-choice pre- and posttest and then drew generalizable conclusions from the
results. Another potential threat to validity could occur with some students guessing on
both the pretest and the posttest which, in a few instances, seemed to cause the pretest
score to be higher than the posttest score.
The tests used here have established internal validity as determined by the
textbook authors, who were considered subject matter experts. The explanation of
textbook development in Glencoe Science White Paper (2013) and Hunt (2013) provided
some description of validity and textbook development. A possible threat to internal
validity was that after taking the pretest, participants may become familiar with the
outcome measure and remember responses for the posttest (Shadish, Cook, & Campbell,
2002). To prevent this from happening, the researcher scrambled the research questions
and possible answers on the posttest. Another threat to internal validity may have arisen
in the selection of subjects (Campbell & Stanley, 1963). This study did not use randomly
119
assigned subjects, but rather subjects were assigned to a group. The only criterion for
assignment to a group was the student’s science GPA, which was used to create two
groups that were equal in science ability. Therefore, each group had approximately the
same number of participants with grades of A, B, C, and below C.
The measurement tools used in this study also had face validity and criterion
validity. These tools were previously used in other work and their usage was considered
successful, hence for the purposes of this study, those tools were considered reliable for
providing results that could be used to determine if an augmented reality simulation could
affect students’ learning outcomes. This was done by comparing traditional classroom
instruction to an augmented reality simulation using a pre- and posttest methodology.
This study also had criterion validity because it compared two levels of the independent
variable (traditional instruction and augmented reality simulation).
Reliability of the data used was also largely based on the test instruments used in
this study. The pre- and posttest was comprised of questions that have been used
previously as chemistry textbook questions, to gain understanding in radioactivity. The
chemistry textbook questions have also been correlated to national science standards, as
explained in Glencoe Science White Paper (2013) and Hunt (2013). Because these
textbook questions have been previously used to yield the designed results, they have
been tested for stability reliability (test after test, it is reliable in deriving similar results)
and internal consistency (testing the same characteristics). This researcher also examined
the pre- and posttest for reliability using Cronbach’s alpha. The Cronbach’s alpha for the
pretest was .826, while the alpha for the posttest was .835. These results show both tests
to be reliable.
120
Two sources of error were identified by this researcher while conducting this
study, which may have had an impact on the data. The first source of error was identified
as a limitation of the instrumentation, the pretest and posttest. This limitation might have
arisen in taking the pretest, where participants can become familiar with the outcome
measure and remember responses for the posttest (Shadish, Cook, & Campbell, 2002).
This type of bias should not be an issue, however, because both the traditional and
augmented reality groups would be equally subject to this limitation. To attempt to
prevent this effect, the researcher scrambled the research questions and order of the
answers on the posttest in order to minimize the potential impact on the results. Also, the
researcher designed the study to be completed within one school day; participants took
the pretest immediately before the intervention and took the posttest directly after the
intervention. The main purpose of this was to prevent the participants from collaborating
or discussing the intervention or test questions. In addition, this researcher was present
during all aspects of the study to observe and make sure all participants worked
independently, without group collaboration, as this was a crucial element of the study.
A second possible error may have arisen from the instructional methodology.
Both the traditional classroom instruction and augmented reality simulation taught the
same content: Alpha, Beta, and Gamma radiation. They were created from the same
textbook, chapters, page numbers, and terminology (see Appendix I). An observed
difference between the two groups was that the classroom instruction utilized the entire
30 minute instructional time where some participants of the augmented reality group
completed their review of the simulation in less time (approximately 15 minutes) and
stopped reviewing the lesson. By having less time to review content, it may adversely
121
affect their scores on the posttest. Participants are volunteers and the amount of effort that
they place into the study was not under the control of the researcher.
Results
The first step in the analysis was to conduct a paired t test on the pretest and
posttest scores of the students in the study in order to determine if and how much the
participants in the comparison and experimental groups learned. This was undertaken as a
first step in order to determine if further testing needed to be carried out. If the paired t
test results were insignificant (the hypothesis that the pre- and posttest scores were the
same could not be rejected), then no further research needed to be conducted, as the
intervention had no impact on scores.
As stated earlier, the pretest and posttests both consisted of 30 questions.
The raw scores on these tests were then converted to percentages by dividing the raw
score by 30 and multiplying the result by 100. The possible scores on the pretest and
posttest thus ranged from 0 to 100. The null and alternate hypotheses for the paired t test
were as follows:
H0: μ2 - μ1 = 0 or μpostttest - μpretest = 0
and
H1: μ2 - μ1 > 0 or μpostttest - μpretest > 0.
Note that the null and alternate hypotheses were one-tailed tests because the
research would only continue if the posttest scores were significantly higher than the
pretest scores. Failing to reject the null hypothesis would lead to the conclusion that
neither classroom method was effective in imparting the lesson to the students in the
sample.
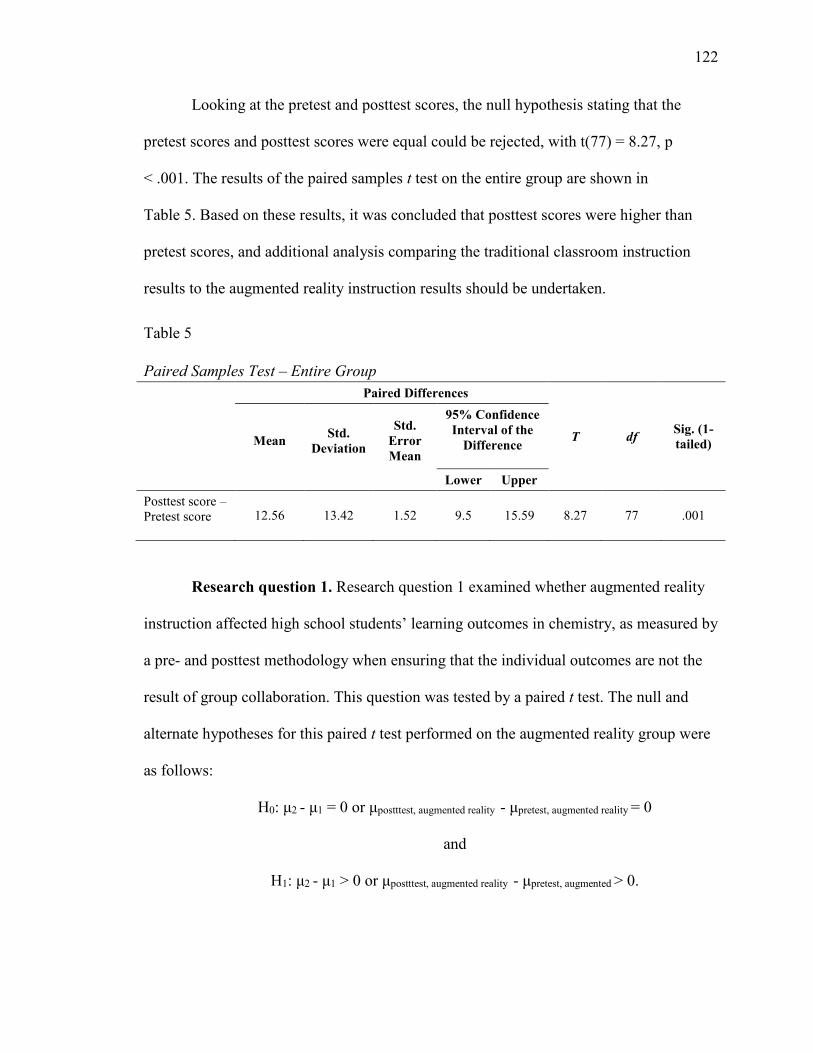
122
Looking at the pretest and posttest scores, the null hypothesis stating that the
pretest scores and posttest scores were equal could be rejected, with t(77) = 8.27, p
< .001. The results of the paired samples t test on the entire group are shown in
Table 5. Based on these results, it was concluded that posttest scores were higher than
pretest scores, and additional analysis comparing the traditional classroom instruction
results to the augmented reality instruction results should be undertaken.
Table 5
Paired Samples Test – Entire Group
Paired Differences
T df Sig. (1-tailed) Mean Std.
Deviation
Std. Error Mean
95% Confidence Interval of the
Difference
Lower Upper Posttest score – Pretest score 12.56 13.42 1.52 9.5 15.59 8.27 77 .001
Research question 1. Research question 1 examined whether augmented reality
instruction affected high school students’ learning outcomes in chemistry, as measured by
a pre- and posttest methodology when ensuring that the individual outcomes are not the
result of group collaboration. This question was tested by a paired t test. The null and
alternate hypotheses for this paired t test performed on the augmented reality group were
as follows:
H0: μ2 - μ1 = 0 or μpostttest, augmented reality - μpretest, augmented reality = 0
and
H1: μ2 - μ1 > 0 or μpostttest, augmented reality - μpretest, augmented > 0.

123
As with the earlier paired t test, this was a one-tailed test, as the researcher was
only concerned about whether posttest scores were significantly higher than pretest
scores. In this case, the null hypothesis stating that the pretest scores and posttest scores
were equal for the augmented reality group could be rejected, with t(35) = 4.46, p < .001.
It was therefore concluded that posttest scores were higher than pretest scores for the
augmented reality instruction group. This test, therefore, supported the research
hypothesis H11, which stated that augmented reality had a positive impact on students’
learning outcomes, without group collaboration. The results of the paired samples t test
are shown in Table 6.
Table 6
Paired Samples Test – Augmented Reality Instruction Group Only
Paired Differences
T df Sig. (1-tailed) Mean Std.
Deviation
Std. Error Mean
95% Confidence Interval of the
Difference
Lower Upper Posttest score – Pretest score 7.41 9.96 1.66 4.04 10.78 4.46 35 .001
Research question 2. The first step in the examination of RQ2 was to compare
the pretest and posttest scores of the traditional classroom group to the augmented reality
group. Figure 1 shows the pretest and posttest scores for each student in the traditional
classroom instruction group, while Figure 2 shows the same scores for the augmented
reality instruction group. Additionally, in order to gain a greater understanding into which
of the two groups may have gained more between the pretest and the posttest, Figure 3
shows a comparison of the means between the two groups.
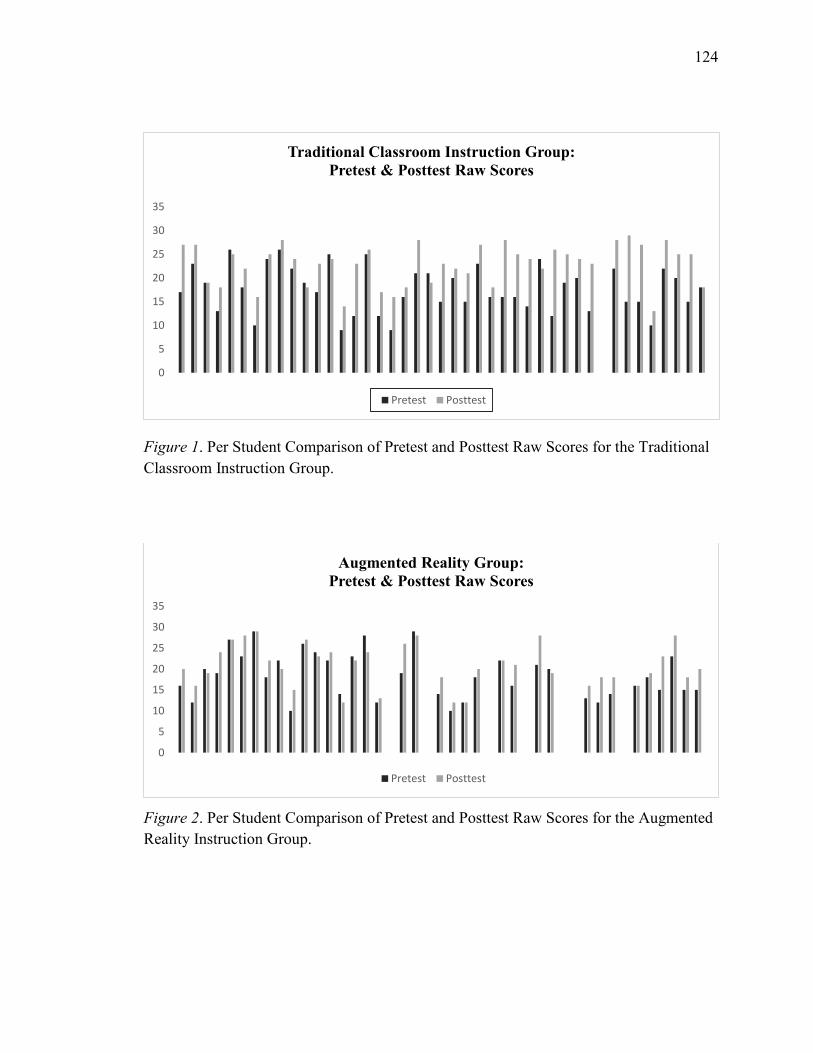
124
Figure 1. Per Student Comparison of Pretest and Posttest Raw Scores for the Traditional Classroom Instruction Group.
Figure 2. Per Student Comparison of Pretest and Posttest Raw Scores for the Augmented Reality Instruction Group.
0
5
10
15
20
25
30
35
Traditional Classroom Instruction Group: Pretest & Posttest Raw Scores
Pretest Posttest
0
5
10
15
20
25
30
35
Augmented Reality Group: Pretest & Posttest Raw Scores
Pretest Posttest
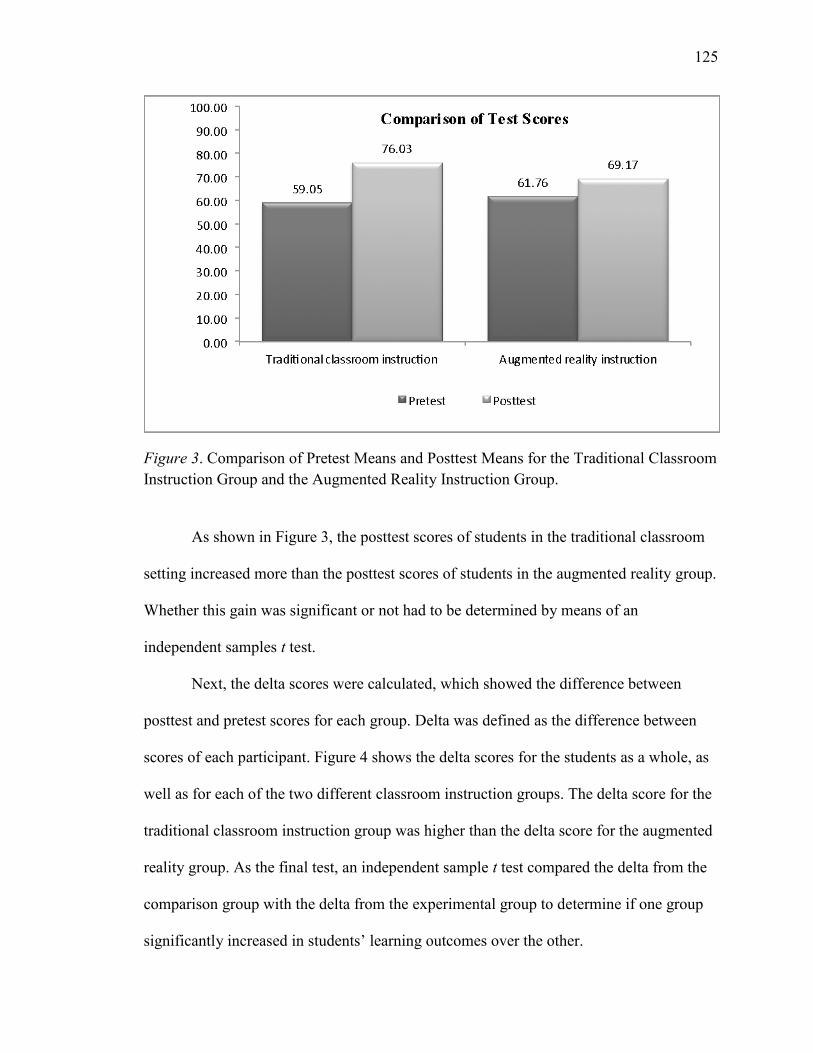
125
Figure 3. Comparison of Pretest Means and Posttest Means for the Traditional Classroom Instruction Group and the Augmented Reality Instruction Group.
As shown in Figure 3, the posttest scores of students in the traditional classroom
setting increased more than the posttest scores of students in the augmented reality group.
Whether this gain was significant or not had to be determined by means of an
independent samples t test.
Next, the delta scores were calculated, which showed the difference between
posttest and pretest scores for each group. Delta was defined as the difference between
scores of each participant. Figure 4 shows the delta scores for the students as a whole, as
well as for each of the two different classroom instruction groups. The delta score for the
traditional classroom instruction group was higher than the delta score for the augmented
reality group. As the final test, an independent sample t test compared the delta from the
comparison group with the delta from the experimental group to determine if one group
significantly increased in students’ learning outcomes over the other.
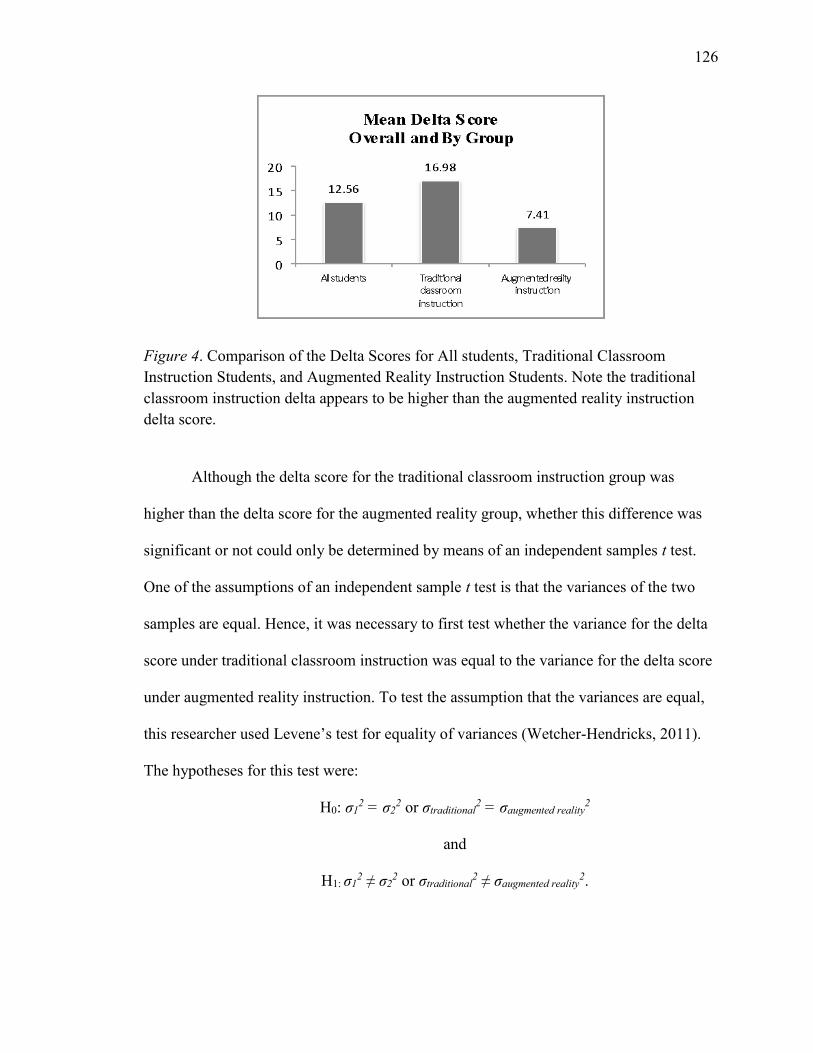
126
Figure 4. Comparison of the Delta Scores for All students, Traditional Classroom Instruction Students, and Augmented Reality Instruction Students. Note the traditional classroom instruction delta appears to be higher than the augmented reality instruction delta score.
Although the delta score for the traditional classroom instruction group was
higher than the delta score for the augmented reality group, whether this difference was
significant or not could only be determined by means of an independent samples t test.
One of the assumptions of an independent sample t test is that the variances of the two
samples are equal. Hence, it was necessary to first test whether the variance for the delta
score under traditional classroom instruction was equal to the variance for the delta score
under augmented reality instruction. To test the assumption that the variances are equal,
this researcher used Levene’s test for equality of variances (Wetcher-Hendricks, 2011).
The hypotheses for this test were:
H0: σ12 = σ2
2 or σtraditional2 = σaugmented reality
2
and
H1: σ12 ≠ σ2
2 or σtraditional2 ≠ σaugmented reality
2.
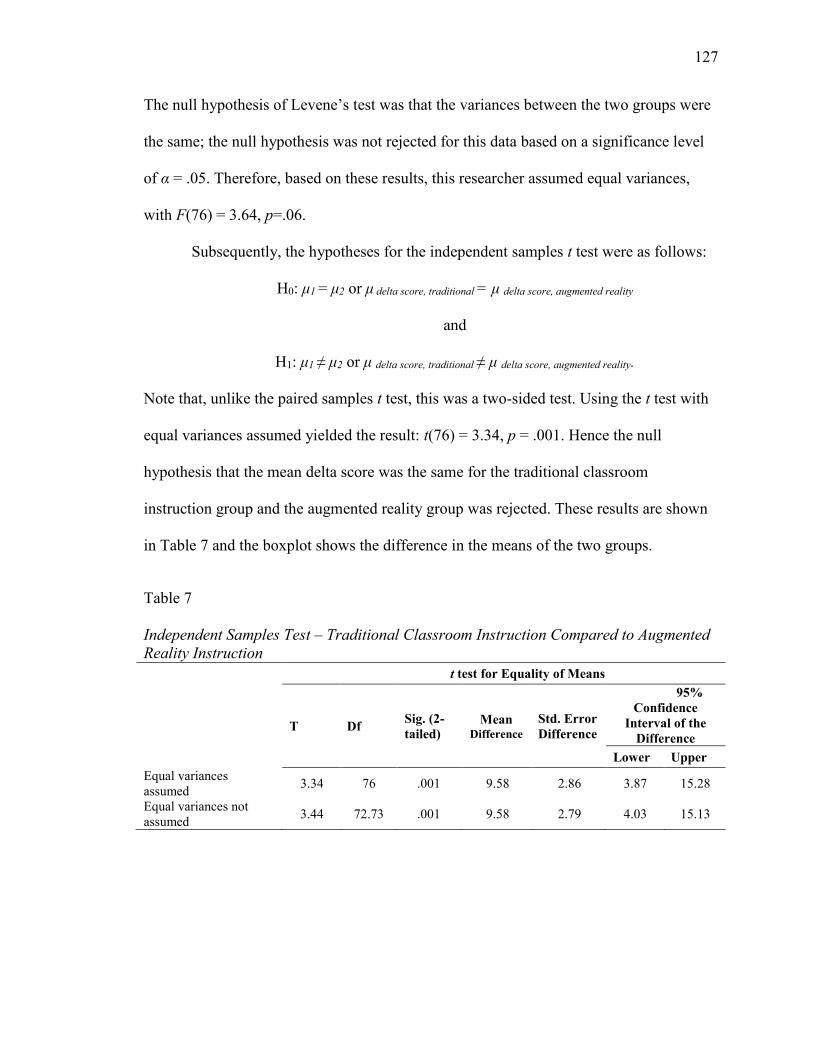
127
The null hypothesis of Levene’s test was that the variances between the two groups were
the same; the null hypothesis was not rejected for this data based on a significance level
of α = .05. Therefore, based on these results, this researcher assumed equal variances,
with F(76) = 3.64, p=.06.
Subsequently, the hypotheses for the independent samples t test were as follows:
H0: μ1 = μ2 or μ delta score, traditional = μ delta score, augmented reality
and
H1: μ1 ≠ μ2 or μ delta score, traditional ≠ μ delta score, augmented reality.
Note that, unlike the paired samples t test, this was a two-sided test. Using the t test with
equal variances assumed yielded the result: t(76) = 3.34, p = .001. Hence the null
hypothesis that the mean delta score was the same for the traditional classroom
instruction group and the augmented reality group was rejected. These results are shown
in Table 7 and the boxplot shows the difference in the means of the two groups.
Table 7
Independent Samples Test – Traditional Classroom Instruction Compared to Augmented Reality Instruction
t test for Equality of Means
T Df Sig. (2-tailed)
Mean Difference
Std. Error Difference
95% Confidence
Interval of the Difference
Lower Upper Equal variances assumed 3.34 76 .001 9.58 2.86 3.87 15.28
Equal variances not assumed 3.44 72.73 .001 9.58 2.79 4.03 15.13

128
Figure 5. Boxplot of Mean Delta Scores For Traditional Classroom Instruction and Augmented Reality Instruction Groups.
As can be seen in Figure 5, the mean and distribution of delta scores does appear
lower for the augmented reality instruction group as compared to the traditional
classroom group. It is difficult to conclude if the larger number of incomplete augmented
reality simulation tests than the traditional classroom group, has resulted in lowering the
overall mean and distribution scores for the augmented reality group. In an ideal
situation, both groups would have an equal number of participants who completed the
tests. Since the participation was voluntary, participant absence, withdrawing from the
study, or not completing test is not under the control of the researcher. Another
interesting possibility arose because of the large number of students in the augmented
reality group who scored high in the pretest. A high pretest score left little room for
improvement and hence a low delta score. This could be a potential source of bias in the
outcome. The results of the independent sample t test led to the rejection of H20, but the
129
researcher was unable to reject H22, that in a setting without group collaboration,
traditional classroom instruction has a greater positive impact on students’ learning
outcomes than augmented reality instruction.
In conclusion, the null hypothesis (H10) that augmented reality has no impact on
students’ learning outcomes, without group collaboration, was rejected. Following the
results of the paired samples t test, the alternate hypothesis (H11) that augmented reality
has a positive impact on students’ learning outcomes, without group collaboration, could
not be rejected. Thus, it was possible to conclude from the research that augmented
reality instruction did cause posttest scores to increase, as compared to pretest scores. The
results of the independent samples t test, however, showed that the increase in the delta
scores was lower for the augmented reality group than it was for the traditional classroom
group, thus leading to the acceptance of H22. Hence, although augmented reality
instruction did lead to an increase in delta scores, it was not as effective as traditional
classroom instruction.
Summary
This study looked at the pre- and posttest scores of 78 high school students who
participated in either an augmented reality simulation or traditional classroom lesson
covering the topic of Alpha, Beta, and Gamma radiation, a high school chemistry topic.
Those students were separated into two groups, based on their cumulative science GPA;
this resulted in matched groups so there was a more even basis for comparing the
learning outcomes of the two groups. The researcher was present during the
administration of the pre- and posttests, as well as during the lesson, to ensure there was
no group collaboration among the students. After the study was complete, the traditional
130
instruction group had 42 complete tests and the augmented reality group had 36 complete
tests. This study attempted to control variables by creating equal ability groups based on
science GPA; but in the end, the unpredictability of participant absence, withdrawing
from the study, or not completing a test has created a slight unevenness between the
groups (groups may not have been equal by ability after all).
Once scores were obtained, statistical analyses were used to compare the results
of the two groups. First a one-tailed paired t test looked at the difference between the
pretest and posttest scores of each group. The null hypothesis of this test, stating that the
scores were the same, was rejected, indicating that the posttest scores were higher than
pretest scores for both groups. This indicated that further investigation was warranted.
The paired t test performed for RQ1 showed that augmented reality instruction did lead to
an improvement in test scores from the pretest to the posttest. A subsequent comparison
of the mean scores of the pretest and posttest for each group indicated that a larger
increase in mean scores occurred in the group that received traditional classroom
instruction, as compared to the group who received the augmented reality simulation. In
order to test RQ2, an independent sample t test was used to determine whether the
difference in scores between the groups was significant. For this test, after confirming the
assumption of equal variances, the null hypothesis was rejected, indicating that the
differences between pre- and posttest scores for the two groups were significantly higher
for the traditional instruction group, thus upholding H22 of Research Question 2.
The combined results of these statistical analyses indicated that augmented reality
simulation did increase posttest scores in the group of high school chemistry students.
However, these results also indicated the increase in scores was less for the augmented
131
reality group than it was for the group that received traditional classroom instruction. The
next chapter, Chapter 5, provides a summary of the study, findings, and conclusions.
Following this, the chapter primarily provides a description of what could occur
theoretically and in the future as a result of this research. The chapter ends with
recommendations for future research and practice.
132
Chapter 5: Summary, Conclusions, and Recommendations
Introduction
At the time this study was conducted, it was not known to what extent how
augmented reality could be used to further high school students’ learning outcomes in
chemistry, without group collaboration. An investigation of existing literature found
omissions centering on the lack of research looking at individual learning outcomes
without group collaboration from augmented reality games. Therefore, this study
examined the impact of an augmented reality simulation by comparing learning outcomes
of high school students who received an augmented reality simulation to those who
received traditional instruction in a high school chemistry topic, using a pre- and posttest
methodology, the same content for both approaches, and without group collaboration.
This study is important because it was the first quantitative experiment controlling for
individual learning that assessed the influence of augmented reality simulations using
mobile handheld digital devices on individual students’ learning outcomes. The results
may have implications for how future students are taught.
Summary of the Study
This study investigated two research questions:
RQ1: Does augmented reality affect high school students’ learning outcomes in
chemistry, as measured by a pre- and posttest methodology when ensuring that
the individual outcomes are not the result of group collaboration?
RQ2: Does augmented reality instruction or traditional classroom instruction have
a greater positive impact on high school students’ learning outcomes in chemistry,
133
as measured by a pre- and posttest methodology when ensuring that the individual
outcomes are not the result of group collaboration?
The study was designed to compare two teaching methodologies and their impact
on individual high school students’ learning outcomes in chemistry, as measured by a
pretest and posttest methodology, without group collaboration. A teaching approach
using an augmented reality simulation was compared to a traditional teaching approach,
and, again, the outcome was assessed based on the learning outcomes of high school
students exposed to each teaching method.
To specifically answer the proposed research questions and associated
hypotheses, 89 participants were divided and placed in either a comparison or
experimental group. The groups were matched based on individual students’ cumulative
science GPA, in order to establish a baseline for comparing test scores. A pretest was
given to all participants prior the activity. The comparison group was given traditional
classroom instruction and the experimental group was given an augmented reality
simulation; both covered the same chemistry topic. All participants were observed by the
researcher to assure students worked without group collaboration. Upon completion of
the traditional instruction (42 participants) and augmented reality simulation (36
participants), all students from both groups took a posttest covering the same material.
The pre- and posttest scores were then used in the statistical analysis to determine
whether the change in mean scores of these groups were significantly different.
This study contributed to existing knowledge about game-based learning, and
specifically augmented reality game-based learning, because previous studies were not
conclusive as to how augmented reality games/simulations improved individual students’
134
learning outcomes without group collaboration (see Appendix A). This topic is important
to the field of education as it may help educators better understand how students learn.
Augmented reality is expanding with the creation of new technologies and has not been
extensively researched as to how it affects individual student learning, in contrast to
traditional classroom learning. Because augmented reality has qualities similar to today’s
computer games and is founded in game-based learning research, this researcher
hypothesized that improved learning would occur. Additionally important, the findings of
this study may contribute to reshaping how students are taught in the classroom. When
this study was conducted, teaching was mainly an educator-led, guided, two-dimensional
or pen-and-paper process. This study demonstrated that three-dimensional or hands-on
learning through an augmented reality simulation may also be a method of instruction
that leads to successful learning for some students.
The remainder of this chapter is focused on discussion of the study results and the
implications of this work. In doing so, the researcher first summarizes the findings and
conclusions of this study, with a focus on the meaning of statistical results. Then the
implications derived from the study are discussed, and lastly some recommendations for
future research and for future practice are presented.
Summary of Findings and Conclusion
The work conducted in this study was based upon theories of learning and the role
of technology set forth by previous researchers. Specifically, this study compared two
learning methodologies: traditional instruction as an educator-led process (Tinzmann, et.
al., 1990) to an autonomous approach of learning that utilized minimal guidance where
the learner became an active participant in his/her own learning process (Dieterle et. al.,
135
n.d.; Siemens, 2008). This learning methodology was founded in the constructivist
principles of Dewey (1910), Piaget (1947), and Vygotsky (Dalgarno, 2002). By
integrating handheld digital devices in a self-led constructivist learning process, as
previously demonstrated by researchers (see Appendix A), this study sought to
investigate a constructivist approach to learning, specifically one that uses technology.
Augmented reality has been introduced as a possible tool for improving learning
experiences and outcomes for students. It is known that the use of augmented reality in
education draws on research from computer games and their ability to increase student
learning (Carr & Bossomaier, 2011; Cheung et al., 2008; Foster, 2011; Kaufman et al.,
2011; Kebritchi et al., 2010; Tuzun et al., 2009; Yip & Kwan, 2006; see Appendix D).
Gaps in the existing literature generally centered on the lack of evidence for the influence
of augmented reality games on individual learning outcomes.
Previous studies that focused on augmented reality simulations and learning in
education used collaborative groups, but either no learning was assessed (Dunleavy et al.,
2009; Klopfer & Squire, 2008; Rosenbaum et al., 2007; Schrier, 2006; Squire & Jan,
2007), or learning was assessed but not controlled for collaboration (Chang et al., 2009;
Huizenga et al., 2009; Rosenheck & Perry, 2012, Vilkoniene, 2009). The findings of this
study provided new information through the use of a comparison group (traditional
classroom instruction) and an experimental group (augmented reality simulation).
Comparing the test results of these two groups demonstrated if there was a significant
difference between traditional classroom instruction and an augmented-reality simulation
in Alpha, Beta, and Gamma radiation, and controlling for individual-learning outcomes
without group collaboration.
136
The research questions in this study were developed to answer the overall goal of
assessing whether augmented reality simulations without group collaboration have an
impact on student learning outcomes as compared to traditional classroom instruction
without group collaboration. Specifically, this study sought a stratified sample of students
at a high school in southwest Colorado and data was collected through a pre- and posttest
methodology. Data analysis compared the test scores of students in a comparison group,
who received traditional classroom instruction, to those in an experimental group, who
received an augmented reality simulation, provided the basis for assessing the impacts of
the treatment under examination. Null and alternative hypotheses provided the basis for
study design and development of methodology. Statistical analysis of the test scores for
each group provided a quantitative comparison of the groups’ results, and was used to
accept or reject the null hypothesis. The following research questions and associated
hypotheses guided this quantitative study:
RQ1: Does augmented reality affect high school students’ learning outcomes in
chemistry, as measured by a pre- and posttest methodology when ensuring that
the individual outcomes are not the result of group collaboration? Testable
hypotheses were then developed to answer this question; these were
H10: Augmented reality has no impact on students’ learning outcomes.
H11: Augmented reality has a positive impact on students’ learning outcomes.
H12: Augmented reality has a negative impact on students’ learning outcomes.
RQ2: Does augmented reality instruction or traditional classroom instruction have
a greater positive impact on high school students’ learning outcomes in chemistry,
as measured by a pre- and posttest methodology when ensuring that the individual
137
outcomes are not the result of group collaboration? The hypotheses associated
with this RQ were
H20: Augmented reality instruction and traditional classroom instruction have the
same impact on students’ learning outcomes.
H21: Augmented reality instruction has a greater positive impact on students’
learning outcomes than traditional classroom instruction.
H22: Traditional classroom instruction has a greater positive impact on students’
learning outcomes than augmented reality instruction.
In order to investigate the research questions and determine if and how much the
participants in the comparison and experimental groups learned, paired t tests were
conducted for each group; these results determined if further testing needed to be
undertaken. If the paired t test results were insignificant (the hypothesis that the pre- and
posttest scores were the same could not be rejected), then no further research needed to
be conducted, as the intervention had no impact on scores. In order to conduct this test,
the pretest and posttest scores (which both consisted of 30 questions) were converted into
percentages by dividing the raw score by 30 and multiplying the result by 100. The
possible scores on the pretest and posttest thus ranged from 0 to 100.
The paired t test was conducted on both groups and the null hypothesis was
rejected; it was concluded that posttest scores were higher than pretest scores. This
indicated that further analysis comparing the traditional classroom instruction results to
the augmented reality instruction results was warranted. In order to test RQ1, a paired t
test was then undertaken to discover if posttest scores were higher than pretest scores for
the augmented reality instruction group only. The null hypothesis in this case was
138
rejected, and it was concluded that posttest scores were significantly higher than pretest
scores for the augmented reality instruction group. This test, therefore, supported the
research hypothesis, H11, stating that augmented reality had a positive impact on students’
learning outcomes, without group collaboration.
In order to test RQ2, delta scores were calculated; these were defined as the
difference between scores of each participant. The delta score for the traditional
classroom instruction group was higher than the delta score for the augmented reality
group; an independent samples t test was then lastly used to determine whether this
difference was significant or not. Equal variances were assumed, based on the results of
Levene’s test of equality of variances at a significance level of α = .05, and the results of
the independent samples t test indicated that the null hypothesis (stating that the mean
delta score was the same for the traditional classroom instruction group and the
augmented reality group) was rejected.
In conclusion, for RQ1, the null hypothesis that augmented reality has no impact
on students’ learning outcomes, without group collaboration, was rejected. Following the
results of the paired samples t test, the alternate hypothesis that augmented reality has a
positive impact on students’ learning outcomes, without group collaboration, could not be
rejected. Thus, it was possible to conclude from the research that augmented reality
instruction did cause posttest scores to increase, as compared to pretest scores. The
results of the independent samples t test for RQ2, however, showed that the increase in
the delta scores was lower for the augmented reality group than it was for the traditional
classroom group. Hence, although augmented reality instruction did lead to an increase in
delta scores, it was not as effective as traditional classroom instruction.
139
This study did demonstrate that an augmented reality simulation on the topic of
Alpha, Beta, and Gamma radiation has a positive impact on students’ learning outcomes,
without group collaboration. This has been demonstrated with a level of acceptable
statistical significance, and as such could have an important impact on the field of
augmented-reality simulations in education. This study has become valuable because
some of today’s students have different interests from those of previous generations and
may prefer learning that uses a more hands-on and self-directed approach (Dieterle, n.d.;
Oblinger & Oblinger, 2005) that uses available technology to conduct their work, which
contrasts with traditional classroom instruction. More research needs to be conducted
before one can generalize to all students and educators can replace traditional classroom
instruction with augmented reality simulations. This study was worthwhile because it
begins to demonstrate that an augmented-reality simulation without group collaboration
can produce increased learning outcomes. In doing so, this study has become the first
quantitative experiment controlling for individual learning to validate the use of
augmented reality simulations, using mobile handheld digital devices, to influence
individual students’ learning outcomes without group collaboration.
However, even if the results of this study had supported the null hypotheses, that
augmented reality simulation has not impacted students’ outcomes without group
collaboration, this conclusion would still have added to the existing body of knowledge.
It should encourage continuing research into other uses and benefits for augmented
reality simulations. Although the null hypotheses were rejected in the current research,
the examination of alternative learning techniques could still provide an interesting
avenue for future research. This study has influenced the future of how students learn and
140
are taught, as well as the future of research in this field. In doing so, the results of this
study have advanced scientific knowledge related to augmented reality in the field of
education, by providing a quantitative study on individual students’ learning outcomes
without group collaboration.
Implications
The findings of this study included results of a paired t test that showed learning
does occur under augmented reality instruction, illustrated by the significant differences
between the pretest and posttest scores. However an independent samples t test showed
that the delta score, which was the difference between the pretest and posttest scores,
increased more under traditional classroom instruction than under the augmented reality
instruction. Scores did improve under both types of instruction; therefore more research
is needed in this area. In the remainder of this section, the theoretical, practical, and
future implications of the research are examined in detail.
Theoretical implications. All findings and methodology were sound given the
available data. One of the strengths of this study was that the researcher obtained a
sufficiently large sample given the power requirements of the study, as described in the
section Population and Sample Selection found in Chapter 3: Methodology. In order to
meet the initial requirements of the research, approximately 52 participants were sought,
89 signed up, and 78 completed the study. This researcher was thereby able to directly
examine the effect of the intervention (traditional class or augmented reality) by
comparing pretest and posttest scores. In order to make the groups as similar as possible
for comparison purposes, the researcher divided the students so that the overall science
GPA in each group was close to equal for the traditional and augmented reality groups
141
A weakness of the study was that there may have been unidentified differences
between the traditional and augmented reality groups, especially given the
disproportionately large dropout factor in the augmented reality group. For this particular
study, given the information available, it was impossible to break down the students to
see which type of student benefitted most from the traditional instruction and which type
from the augmented instruction. No information was available on individual student’s
GPA. It was possible that lower GPA students benefitted most from the augmented
reality instruction, or vice versa. Only the overall means of the groups were examined,
not individual differences between students.
Additionally, the study looked at a single school in southwest Colorado. One must
be careful about generalizing too much based on these results only. Although the N was
sufficiently large for the study, a larger sample size would yield more powerful results.
Also, this only compared one teacher using the traditional instruction method.
Differences exist among chemistry teachers and using classes taught by different teachers
in the study would likely yield different results. Whether the traditional class would gain
more or less compared to the augmented reality group with another instructor is
unknown.
Lastly, the augmented reality simulation may have been flawed. This researcher
created the augmented reality simulation using ARIS; a user-friendly, open-source, free
to download, software. The simulation used markers (QR codes) to present a series of
text, videos, and images to the participant. The simulation was not previously tested for
edutainment or game-like qualities. The augmented reality simulation may have been too
basic or not as interesting for participants. This may explain why some participants were
142
observed as quitting the simulation after 15 minutes, and it may explain why the
simulation did not do as well as the traditional group overall.
The conclusions were credible given the method and data: according to the power
calculations described in Chapter 3: Methodology, Population and Sample Selection, a
sample of 52 was deemed necessary for the study. The actual sample was 78 students, 42
students in the traditional classroom instruction group and 36 students in the augmented
reality instruction group. This was above the minimum necessary, thus yielding results
that are credible.
T tests are considered effective methods of analysis for comparing groups;
according to the author Pallant, “t tests are utilized for comparing the mean scores of two
different groups” (2010, p. 239). In this case, it was possible to employ both a paired
samples t test and an independent samples t test. The paired samples t test could be
conducted because there was a directly comparable pretest and posttest administered. The
t tests conducted in the study all yielded consistent results. These results were that scores
for all students increased from the pretest to the posttest. This included the augmented
reality group, whose scores did show improvement after the intervention. The difference
in scores, or delta score, was, however, greater for the traditional instruction group. All t
tests and descriptive statistics employed were consistent in illustrating this result: that
both interventions led to an increase in posttest scores, but the increase was greater for
the traditional classroom group than the augmented reality group.
This study was founded upon the premise that some of today’s students are
neomillennials (Sankey, 2006). As such, they may seek self-directed (Dieterle, et. al., n.
d.), constructivist-learning experiences as described by Dewey (1910), Vygotsky

143
(Costley, 2012), and Piaget (Dalgarno, 2002). Such learning experiences integrate
available technology to assist in students’ knowledge acquisition (Jonassen, Carr, &
Yuen, 1998) rather than the traditional or educator-led philosophy of instruction.
“Technology is a natural part of their environment and the younger they are the more
they expect technology to be used in their schooling (in their lives)” (Oblinger, 2003, p.
38). Because they are “active participants of our 24/7 wired world, they have been
labeled as neomillennials” (Willems, 2009, p.272).
Other researchers that have looked at augmented reality using digital handheld
devices (see Appendix A) revealed that several of the studies incorporate collaborative
groups of two to eight participants, but that learning was not assessed (Dunleavy et al.,
2009; Klopfer & Squire 2008; Rosenbaum et al., 2007; Schrier, 2006; Squire & Jan,
2007). Of the remaining studies investigated, Vilkoniene (2009), Chang et al. (2009), and
Huizenga et al. (2009) investigated augmented reality and found an increase in students’
learning outcomes, but group interactions or collaboration was unidentified or
uncontrolled. From these findings, a question arose that had not been answered: Does
augmented reality affect high school students’ learning outcomes in chemistry, as
measured by a pretest and posttest methodology when ensuring that the individual
outcomes are not the result of group collaboration?
This study expanded the body of knowledge on this topic by investigating
individual students’ learning outcomes without group collaboration. This study measured
students’ learning outcomes using a pre- and posttest methodology without group
collaboration. Half of the participants became the comparison group or traditional
classroom instruction group, and the remainder became the augmented reality group or
144
experimental group. The independent variable for RQ2 was the instructional
methodology and the dependent variable was the level of students’ learning outcomes,
measured by the difference in the pre- and posttests. Unless there were intervening
variables, the treatment or augmented reality simulation would elicit a result: students’
learning outcomes. The results of the study demonstrate that, at least in this particular
situation, learning did occur in the augmented reality setting without group collaboration,
although the learning was not as great as in the traditional classroom setting.
Practical implications. Studies such as the current research can help teachers and
administrators generate ideas and evidence supporting new methods of teaching that may
improve science scores of American students in the future. According to the Program for
International Student Assessment (2012), the United States scored 23 out of 65
participating economies in science. The challenge of improving student learning
outcomes therefore continues. This study demonstrated that augmented reality can be
used as a tool to improve student learning outcomes without group collaboration. As in
the ongoing PISA study (PISA, n.d.), which is conducted using individual students
approximately 15 years old and a standardized test format, this study also utilized
students of a similar age who also conducted their pre- and posttests and treatment
individually. It is important to continue researching methods for improving individual
student learning outcomes. Augmented reality based on constructivist and game-based
learning theory is one such avenue.
Future implications. Future research in this field should build on the basic
understanding of the potential influence of augmented reality simulation on learning
outcomes established in this study. The sample size should be expanded, and the research
145
should be carried into other classes and other schools. This researcher attempted to make
the groups as similar as possible by splitting the participants evenly between the
traditional and augmented reality groups based upon science GPA. Before the study
began, there were 89 participants who returned signed consent forms. Of these
participants, 45 were placed in the traditional and 44 into the AR group. The traditional
group had an average science GPA of 3.13, and the augmented reality group had an
average science GPA of 3.18. Theoretically, both groups were of equal ability before the
study began. However, average grade criteria itself can be inconclusive. Breaking down
the sample by individual GPA and looking for anomalies between students and in the
individual students’ reactions to the interventions would strengthen the conclusions of the
analysis. Teachers and administrators using this study should avoid jumping to
conclusions about "all students" based on the results. Much more research is needed
before the results can be generalized to “all students” or even “all chemistry students at
the study school.”
The study raises, as well as answers, certain questions. The results provided some
evidence that augmented reality instruction can be effective in imparting chemistry
knowledge to students, at least in this setting. Much more research is needed before any
conclusions about replacing traditional instruction with augmented reality instruction can
be drawn. At the same time, the research did indicate that traditional classroom
instruction was more effective at imparting the necessary knowledge than the augmented
reality instruction. Again, before drawing too many conclusions and eliminating
augmented reality instruction as a potential teaching tool, more research is needed.
Although in this study, augmented reality appeared less effective than traditional
146
instruction, other studies may yield very different results. Much more research and study
is needed in this area before definitive conclusions can be drawn and acted upon.
Recommendations
This section includes recommendations based on the findings of the research, as
well as on the limitations and gaps noted in conducting this research. First, a discussion
of possible avenues for future research in this field is presented. Secondly, possible
practical changes that could be made based on the knowledge gained from this work are
discussed.
Recommendations for future research. The following recommendations offer
suggestions for future research that could improve the understanding of the relationship
between learning and augmented reality as a teaching tool or method. Some of the
recommendations address the need for replicating the current study; other
recommendations introduce other methodologies that could be employed to strengthen
the results of the research. These recommendations are focused on additional types of
data and programs that could be gathered and implemented in order to gain an even
greater insight into these diverse interrelationships. The ideas for future research are as
follows:
1. Conduct a more in-depth study by breaking students down by individual GPA
and looking for anomalies. One idea would be to conduct a similar study, but
code each test packet containing the pre- and posttest with the students actual
science GPA. This would enable the researcher to create a ledger that not only
had the participants pre- and posttest scores, but also their actual science GPA.
This could lead to more interesting results into which type of students (high
147
GPA or low GPA) gained the most under each type of instruction.
2. Conduct additional tests on other classes at other schools. Other sections of
chemistry instruction could also be included. Before the results can be
generalized to any degree, there must be further testing. Currently, there is not
enough evidence to draw any definite conclusions as to which type of
instruction was “best.” Although the study showed that augmented reality
instruction was beneficial, but less effective than traditional classroom study;
this result should not be generalized to other classes and schools at this time.
The study should be replicated a number of times first. Additional data over
time would yield richer results and allow the researcher to draw more
definitive conclusions. Future research of augmented reality should continue
to pursue the pre- and posttest methodology to measure student outcomes. If
the learning community is going to embrace augmented reality as an
instructional methodology, the research must continue to utilize quantitative
means to analyze the results.
3. Increase the sample size and replicate the results. The sample size used in the
current study was sufficient according to the power analysis conducted in
Chapter 3: Methodology, Population and Sample Selection, but larger sample
sizes do increase the overall power of the tests used in the analysis.
Replication of the study with a similar size or larger sample would also lead to
stronger conclusions.
4. Other methods of analysis could be used to look for consistency of results. For
example, a similar study could be conducted using ANCOVA analysis
148
(Wetcher-Hendricks, 2011). This type of analysis predicts posttest scores
using the pretest as a covariate and the two different types of instruction as the
independent variable. This test assumes that the only difference between the
groups would be the intercept, or the type of instruction. Similar results
between another type of analysis and the t tests would strengthen the results
by adding consistency. Another type of test that could yield more in-depth
results could be an exhaustive CHAID (Kass, 1980), or Chi-square automatic
interaction detection, analysis. This type of analysis is a type of decision tree
analysis that can be used for prediction in a manner similar to regression
analysis.
5. Another type of analysis that could be employed to add consistency to the
results could be multiple regression analysis (Vogt & Burke-Johnson, 2011).
This could allow the researcher to also collect demographic variables and
include them as control variables. The GPA or science GPA of the students
could also be included as a control variable. The posttest score would serve as
the dependent, or outcome variable. The major predictor variable of interest
would be a dummy variable representing the type of classroom instruction.
The pretest score, GPA, and demographic variables would be included as
control variables. The coefficient on the classroom instruction variable would
then be examined for sign and significance. This test could be run on different
classes and in different schools, again looking for consistency of results
among the different settings and among the different methodologies. A larger
sample size would be required for this type of analysis.
149
This study begins to address the lack of evidence of individual-learning outcomes
from augmented reality games using handheld digital devices without group
collaboration. More research needs to be conducted and the recommendations listed
above would be a beginning. The next steps in forwarding this line of research would
begin with planning. Part of this planning would include finding a school or series of
schools that would permit a study of this magnitude and also provide a substantially
larger stratified or convenience sample. With a larger participant base, planning and
implementation would require additional researchers or assistant researchers. With a
larger study, there would be more costs. The current study spent approximately $4000 in
miscellaneous costs (iPods, mobile hot spots, data plans, etc.). A larger study’s
expenditures would need to be planned and funding would need to be sought, possibly
through grants or private means.
This research has become valuable because today’s students have different
interests from those of previous generations. Some of today’s students may prefer
learning that uses a more hands-on and self-directed approach (Dieterle, n.d.; Oblinger &
Oblinger, 2005) that uses available technology to conduct their work, which contrasts
with traditional classroom instruction. To demonstrate this, a series of t tests were
conducted.
First, the one-tailed paired t test looked at the difference between the pretest and
posttest scores of each group. The null hypothesis of this test, stating that the scores were
the same, was rejected, indicating that the posttest scores were higher than pretest scores
for both groups. This indicated that further investigation was warranted. For RQ1, an
examination of the augmented reality instruction group showed that posttest scores were
150
higher than pretest scores thus indicating that learning occurred through this type of
instruction. This result was validated by means of a paired t test. For RQ2, a comparison
of the mean scores of the pretest and posttest for each group indicated that a larger
increase in mean scores appeared to occur in the group that received traditional classroom
instruction, as compared to the group who received the augmented reality simulation.
After confirming the assumption of equal variances, an independent sample t test was
used to determine whether the difference in scores between the groups was significant.
For this test, the null hypothesis was rejected, indicating that the differences between pre-
and posttest scores for the two groups were significantly different, with more learning
occurring in the traditional instruction group.
The combined results of these statistical analysis indicated that augmented reality
simulation did increase posttest scores in the group of high school chemistry students.
However, these results also indicated the increase in scores was less for the augmented
reality group, than it was for the group that received traditional classroom instruction.
Regardless of the outcome, this study has influenced the future of how students learn and
are taught, as well as the future of research in this field.
Recommendations for practice. The current research compared mean scores.
Without pairing, there was no way of knowing whether, for a subset of students, the
augmented reality method might not have worked better. This point should be
emphasized because both methods resulted in learning. It is possible that some types of
students learned more using the augmented reality method than they would have if in a
live classroom. Too often education studies like this one are taken as definitive, and
educators eliminate a form of teaching in favor of the one with the higher mean score.
151
Mean scores are useful for administrators and teachers to look at their performance and
useless to individual students, not one of whom is likely to have the mean score. It would
be a mistake to come to the conclusion here that live classrooms are always better. Since
both methods work, it is imperative to perform a paired t test as a follow-up and to create
a CHAID tree (as recommended the Recommendations for Future Research section) to
get a better understanding of how individual students learn (Kass, 1980). More work
needs to be done, even with this data set, before action such as eliminating augmented
reality as a teaching method for all students. Both learning methodologies demonstrated
increased learning outcomes (see Table 3 & 4); the traditional just did better. This does
not mean the end of augmented reality simulations, rather the contrary. It means further
investigation could build on what this researcher has learned in this study. Further
investigation might include answering the following questions:
x Will a more advanced augmented reality program (more game-like)
demonstrate better results?
x Will more time with the augmented reality simulation demonstrate better
results?
x Will an augmented reality simulation that interacts more with the environment
demonstrate better results?
The next steps in research should focus on maximizing the augmented reality
simulation for learning outcomes. Once this is achieved, then a comparison study with
the traditional classroom instruction could be repeated. To emphasize, the current
research findings did not demonstrate that the augmented reality simulation out-
performed the traditional classroom instruction. Rather both resulted in increases in
152
student learning outcomes without group collaboration between the pre- and posttests.
These findings demonstrate the ability of augmented reality simulations to produce
learning outcomes. By utilizing handheld digital devices, it provides the opportunity to
replace the textbook, which can be heavy and cumbersome, with a device that can
provide information sent to the user in real-time and remotely by way of the Internet and
global positioning. With the addition of advanced software such as probe-ware and more
advanced operating systems, data can be entered, stored, and analyzed for further
investigation. Augmented reality simulations utilizing digital handheld devices have the
potential to allow the user to be more mobile as he or she moves throughout an
environment and investigates by constructivist means.
The findings of this study could benefit developers, educators, and researchers.
This study utilized a very basic form of augmented reality simulations, in which
participants used a handheld digital device (iPod Touch), and the digital device’s camera
focused on the QR code. The digital device then communicated wirelessly using a
Verizon Wireless Mi-Fi to Augmented Reality and Interactive Storytelling’s server
(ARIS; Gagnon, 2010). The ARIS server recognized the QR code and sent a special
digital image back to the handheld device with which the participant interacted.
Developers of educational technologies in the field of augmented reality are more skilled
in creating simulations than this researcher and could develop new and more advanced
programs to teach important concepts. With more advanced simulations that are more
computer game-like, fun (Squire, 2007a), and include “authentic [real-world] learning
environment where participants can work on realistic problems while interacting with
153
other participants, the physical environment and actual data” (Schrier, 2006, p. 7),
augmented reality may improve their future learning outcomes.
Educators and researchers should be encouraged by this study’s findings.
Educators who seek a new way to teach a concept could use any of the open-source
programs to freely create simulations of their own by using Taleblazer (Massachusetts
Institute of Technology, 2011) or ARIS (Academic ADL Co-Lab, 2012). This study does
not advocate replacing traditional instruction all-together with augmented reality
simulations. Based on this study’s findings, augmented reality simulations could be used
as an alternative teaching methodology to integrate constructivist teaching principles
(Dalgarno, 2002), add some variety, and fun (Squire, 2007a) to the curriculum.
This study should be of interest to researchers because the results indicated that
augmented reality did positively improve students’ learning outcomes without group
collaboration. There has been a body of research conducted on augmented reality and
collaboration. This study “opens the door” to augmented reality simulations investigating
students’ learning outcomes without group collaboration. As this study suggests, more
research needs to be conducted and researchers could investigate utilizing other methods
of analysis to look for consistency of results. For example, a similar study could be
conducted using ANCOVA analysis (Wetcher-Hendricks, 2011). This type of analysis
predicts posttest scores using the pretest as a covariate and the two different types of
instruction as the independent variable. This test assumes that the only difference
between the groups would be the intercept, or the type of instruction. Similar results
between another type of analysis and the t tests would strengthen the results by adding
consistency.
154
Another type of analysis that could be employed to add consistency to the results
could be multiple regression analysis (Vogt & Burke-Johnson, 2011). This could allow
the researcher to also collect demographic variables and include them as control
variables. The GPA or science GPA of the students could also be included as a control
variable. The posttest score would serve as the dependent, or outcome variable. The
major predictor variable of interest would be a dummy variable representing the type of
classroom instruction. The pretest score, GPA, and demographic variables would be
included as control variables. The coefficient on the classroom instruction variable would
then be examined for sign and significance. This test could be run on different classes and
in different schools, again looking for consistency of results among the different settings
and among the different methodologies.
Based upon the premise that some of today’s students are neomillennials (Sankey,
2006), and seek self-directed, constructivist learning experiences, this researcher can
attempt to explain the increase in learning outcomes of the augmented reality simulation.
Possible reasons why the traditional classroom instruction out-performed the augmented
reality instruction include several possibilities such as the following:
x A knowledgeable and gifted chemistry teacher as compared to a simple and
basic augmented reality program;
x The chemistry teacher could adjust the lesson to meet the needs of the
students (reteach and emphasize important areas); and
x The chemistry teacher taught for 30 minutes, where some participants of the
augmented reality group were observed completing the simulation in about 15
minutes and stopped, rather than going back to review the material.
155
Again, this study provided a quantitative comparison of the learning outcomes of
students who experienced an augmented reality simulation verses those who received
traditional instruction. The study showed that learning occurred in both groups, but that
those who experienced traditional classroom instruction improved their test scores more
significantly than those who received the augmented reality simulation. However, much
more research is needed in the area of augmented reality instruction. Once again, drawing
too many conclusions based on the current research alone would be a mistake. While it
may be the case that traditional classroom instruction always outperforms augmented
reality instruction, this conclusion cannot be generalized from the current research.
Likewise, it cannot be concluded that augmented reality instruction always leads to
learning of the subject matter. More research is needed including larger samples, more
sophisticated augmented reality settings, and additional methodologies before definitive
statements about the efficacy of augmented reality instruction in the field of high school
chemistry can be made.
156
References
Academic ADL Co-Lab. (2007). Mad city mystery [augmented reality game]. Retrieved
from http://www.academiccolab.org/randd
Academic ADL Co-Lab. (2012). Augmented reality interactive storytelling [open-source
program]. Retrieved from http://arisgames.org/
Ackermann, E. (2001). Piaget’s constructivism, Papert’s constructivism: What’s the
difference? In Constructivism: Uses and Perspectives in Education (Vol. 1&2, p.
85–94). Geneva, Switzerland: Research Center in Education.
Apple Press Info. (2012). iPod and iTunes timeline. Retrieved from
http://www.apple.com/pr/products/ipodhistory/
Armstrong, C. M. (2011). Implementing education sustainable development: The
potential use of time-honored pedagogical practice from the progressive era of
education. Journal of Sustainability Education, 2, 1–25.
Baggott, M., Jerome, L., & Stuart, R. (2001). Methylenedioxymethamphetamine
(MDMA): A review of the English-language scientific and medical literature.
Retrieved from http://www.maps.org/research/mdma/protocol/mdmareview.pdf
Barnett, M., Squire, K., Higgenbotham, T., & Grant, J. (2004). Electromagnetism
supercharged! In Y. Kafai, W. Sandoval, N. Enyedy, A. Dixon, & F. Herrera
(Eds.), Proceedings of the 2004 International Conference of the Learning
Sciences (p. 513–520). Mahwah, NJ: Lawrence Erlbaum.
Bente, G., & Breuer, J. (2010). Making the implicit explicit: Embedded measurement in
serious games. In A. Hirumi (Ed.), Playing games in school: Video games and
157
simulations for primary and secondary education (p. 292–322). Eugene, OR:
International Society for Technology in Education.
Berkowitz, J. (n.d.). Sampling and sample size. Retrieved from http://www.columbia.edu
/~mvp19/RMC/M6/M6.doc
Billinghurst, M. (2002). Augmented reality in education. New Horizons for Learning.
Retrieved from
http://www.newhorizons.org/strategies/technology/billinghurst.htm
Billinghurst, M. (2002). Collaborative augmented reality. Communications of the ACM.
Retrieved from http;//portal.acm.org
Billinghurst, M., Hirokazu, K., & Poupyrev, I. (2001). The magicbook: A transitional AR
interface. Retrieved from http://citeseerx.ist.psu.edu/viewdoc/summary?doi=10.1
.1.100.2194
Brandt, R., & McBrien, L. (1997). The language of learning: A guide to educational
terms. Alexandria, VA: Association for Supervision and Curriculum
Development.
Brown, D. G., Stripling, R., & Coyne, J. T. (n.d.). Augmented reality for urban skills
training. Retrieved from http://www.dtic.mil/cgi-bin/GetTRDoc?AD
=ADA495901
Brutus, S., Aquinis, H., & Wassmer, U. (2012). Self-reported limitations and future
directions in scholarly reports: Analysis and recommendation. Journal of
Management. 39(1). 48-75.
158
Campbell, D. T., & Stanley, J. C. (1963). Experimental and quasi-experimental designs
for research on teaching. In N. L. Gage (Ed.), Handbook of research on teaching
(p. 171–246). Chicago, IL: Rand McNally.
Campbell, D. T., & Stanley, J. C. (1966). Experimental and quasi-experimental designs
for research. New York, NY: Houghton Mifflin.
Carr, D., & Bossomaier, T. (2011). Relativity in a rock field: A study of physics learning
with a computer game. Australasian Journal of Educational Technology, 27,
1042–1067. Retrieved from http://www.ascilite.org.au/ajet/ajet27/carr.pdf
Chang, W.-C., Wang, T.-H., Lin, F. H., & Yang, H.-C. (2009). Game-based learning with
ubiquitous technologies. IEEE Internet Computing, 13(4), 26–33.
Chemistry: Matter and Change. (2005). ExamView Pro: Testmaker CD-ROM [software].
Chicago, IL: McGraw-Hill.
Cheung, K. K. F., Jong, M. S. Y., Lee F. L., Lee, J. H. M., Luk, E. T. H., Shang, J., &
Wong, M. K. H. (2008). Farmtasia: An online game-based learning environment
based on the VISOLE pedagogy. Virtual Reality, 12(1), 17–25. doi:10.1007
/s10055-008-0084-z
Clayton-Pederson, A. R., & O’Neill, N. (2005). Curricula designed to meet 21st century
expectations. In D. G. Oblinger & J. L. Oblinger (Eds.), Educating the net
generation (p. 9.1–9.16). Washington, DC: EDUCAUSE.
Cohen, J. (1992). A Power Primer. Psychological Bulletin, 112(1), 155-159.
Costley, K. C. (2012). An overview of the life, central concepts, including classroom
applications of Lev Vygotsky. Retrieved from EBSCOhost database.
159
Cronbach, L. J. (1951). Coefficient alpha and the internal structure of tests.
Psychometrika. 16(3). 297-334.
Dalgarno, B. (2002). The potential of 3D virtual learning environments: A constructivist
analysis. Electronic Journal of Instructional Science and Technology, 5(2).
Retrieved from http://farrer.riv.csu.edu.au/~dalgarno
Dede, C. (2005, November). Planning for neomillennial learning styles. Educause
Quarterly, 7–12. Retrieved from http://net.educause.edu/ir/library/pdf/eqm0511
Dede, C., & Kamarainen, A. (2012, June). Blending real and virtual immersive ecosystem
experiences: EcoMOBILE. Poster session presented at the International Society
for Technology in Education Annual Conference, San Diego, CA.
Dede, C., Nelson, B., Ketelhut, D. J., Clark, J., & Bowman, C. (2004). Design-based
research strategies for studying situated learning in a multi-user virtual
environment. In Y. B. Kafai, W. A. Sandoval, & N. Enyedy (Eds.), Proceedings
of the 6th International Conference on Learning Sciences (p. 158–165). New
York, NY: Taylor and Francis.
Desy, E. A., Peterson, S. A., & Brockman, V. (2011). Gender differences in science-
related attitudes and interests among middle school and high school students.
Science Educator, 20(2), 23–30.
Dewey, J. (1910). How we think. Boston, MA: D. C. Heath.
Dieterle, E. (2010). Games for science education. In A. Hirumi (Ed.), Playing games in
school: Video games and simulations for primary and secondary education (p.
89–117). Eugene, OR: International Society for Technology in Education.
160
Dieterle, E., Dede, C., & Schrier, K. (n.d.). Neomillennial learning styles propagated by
wireless handheld devices. In M. Lytras & A. Naeve (Eds.), Ubiquitous and
pervasive knowledge and learning management: Semantics, social networking
and new media to their full potential. Hershey, PA: Idea Group.
Dingrando, L., Tallman, K., Hainen, N., & Wistrom, C. (2005). Chemistry: Matter and
change. New York, NY: McGraw Hill.
Doulík, P., & Škoda, J. (2009). Challenges of contemporary science education. Problems
of Education in the 21st Century, 11, 45–50.
Dunleavy, M., Dede, C., & Mitchell, R. (2009). Affordances and limitations of
immersive participatory augmented reality simulations for teaching and learning.
Journal of Science Education and Technology, 18, 7–22. doi:10.1007/s10956-
008-9119-1
Erdfelder, E., Faul, F., &Buchner, A. (1996). GPOWER: A general power analysis
program. Behavior Research Methods, Instruments, & Computers, 28, 1–11
Facebook. (2012). Facebook [Browser-based social networking]. Retrieved from
http://www.facebook.com/
Fawcett, J. (2008). Evaluating research for evidence-based nursing practice.
Philadelphia, Pennsylvania: F. A. Davis Company.
Fiala, S. (2011). Research methods: Correlational and quasi-experimental research
(video lecture). Retrieved from http://www.youtube.com/watch?v=
XLirMm1TV8g
161
Foster, A. N. (2011). The process of learning in a simulation strategy game: Disciplinary
knowledge construction. Journal of Educational Computing Research, 45, 1–27.
doi:10.2190/EC.45.1.a
Frand, J. (2000, September/October). The information-age mindset: Changes in students
and implications for higher education. Educause Review, 15–24.
Gagnon, D. J. (2010). ARIS: An open source platform for developing mobile learning
experiences (Master’s project). University of Wisconsin-Madison. Retrieved from
http://arisgames.org/wp-content/uploads/2011/04/ARIS-Gagnon-MS-Project.pdf
Gee, J. P. (2005). Learning by design: Good video games as learning machines. E-
Learning, 2(1), 5–16.
Gee, J. P. (2010). Deep learning properties of good digital games. In A. Hirumi (Ed.),
Playing games in school: Video games and simulations for primary and
secondary education (p. 67–82). Eugene, OR: International Society for
Technology in Education.
Glahn, C., Borner, D., & Specht, M. (2010). Mobile informal learning. In E. Brown (Ed.),
Education in the wild: Contextual and location-based mobile learning in action
(Report from the STELLAR Alpine Rendez-Vous; p. 27–31). Nottingham,
England: Learning Sciences Research Institute.
Glencoe Science White Paper (2013). Research-Based Strategies Used to Develop
Chemistry: Matter and Change, Chemistry: Concepts and Applications, and
Physics: Principles and Problems. Retrieved from http://www.glencoe.com/
glencoe_research/research_science.html
162
Gliner, J. A., Morgan, G. A., Harmon, R. J. (2003). Pretest-posttest comparison group
designs: Analysis and interpretation. Jounal of the American Academy of Child
and Adolesent Psychiatry. 42(4). 500-503.
Google.com. (n.d.). Our history in depth. Retrieved from http://www.google.com/
about/company/history/
Grand Canyon University. (n.d.). IRB forms. Retrieved from http://dc.gcu.edu/
documents/ethicsinstitutionalreview/institutionalreviewboardirb
/irbforms~2/informedconsentformsocialbehaviorminriskdocx
Grand Canyon University. (2010). Grand Canyon University Ed.D. dissertation
workbook. Phoenix, AZ: Author.
Gribbons, Barry, Herman, & Joan (1997). True and quasi-experimental designs. Practical
Assessment, Research & Evaluation, 5(14). Retrieved from http://pareonline.net/
getvn.asp?v=5&n=14
Hall, R. (2010). The magic of online games. In A. Hirumi (Ed.), Playing games in school:
Video games and simulations for primary and secondary education (p. 369–380).
Eugene, OR: International Society for Technology in Education.
Harvard University. (2007). The River City project [multiuser virtual environment].
Retrieved from http://muve.gse.harvard.edu/rivercityproject/contributors/
contributors.html
Hays, R. T. (2005). The effectiveness of instructional games: A literature review and
discussion (Technical Report 2005-004). Orlando, FL: Naval Air Warfare Center
Training Systems Division.
163
Hoffman, D. L. & Novak, T. P. (2009). Flow online: Lessons learned and future
prospects. Journal of Interactive Marketing. 23(1). 23-34.
Hoffmann, L. (2009). Learning through games. Communications of the ACM, 52(8), 21–
22. doi:10.1145/1536616.1536624
Hubbard, S. (2009). Augmented reality: A human interface for ambient intelligence.
Retrieved from http://readwrite.com
Huizenga, J. J., Admiraal, W. W., Akkerman, S. S., & ten Dam, G. (2009). Mobile game-
based learning in secondary education: Engagement, motivation and learning in a
mobile city game. Journal of Computer Assisted Learning, 25, 332–344. doi:10
.1111/j.1365-2729.2009.00316.x
Hunt, K. (2013) Pre- Development Research: The Research Base for PreK-12 Science.
Retrieved from http://www.glencoe.com/glencoe_research/ Science/PreK-
12_Science_Pre-Dev.pdf
Hussain, Z., & Griffiths, M. D. (2009). Excessive use of massively multi-player online
role-playing games: A pilot study. International Journal of Mental Health and
Addiction, 7, 563–571. doi:10.1007/s11469-009-9202-8
IBM Corporation. (2011). IBM SPSS Statistics Premium Grad Pack v20.0 [software].
Armonk, NY: Author.
Jenkins, H., & Henrichs, R. (2003). Supercharged [computer game]. Retrieved from
http://www.educationarcade.org/gtt/proto.html
Jha, N. K. 92008). Research Methodology. Chandigarh, India: Global Media.
164
Johnson, L., Levine, A., & Smith, R. (2009). The 2009 Horizon Report. Austin, TX: The
New Media Consortium. Retrieved from http://www.nmc.org/pdf/2009-Horizon-
Report.pdf
Johnson, L., Levine, A., Smith, R., & Stone, S. (2010). The Horizon Report. Austin, TX:
The New Media Consortium. Retrieved from http://infousa.state.gov/education
/overview/docs/2010-Horizon-Report.pdf
Johnson, L., Smith, R., Willis, H., Levine, A., & Haywood, K. (2011). The Horizon
Report. Austin, Texas: The New Media Consortium. Retrieved from http://net
.educause.edu/ir/library/pdf/HR2011.pdf
Jonassen, D. H., Carr, C., & Yueh, H.-P. (1998). Computers as mindtools for engaging
learners in critical thinking. TechTrends, 43(2), 24–32. doi:10.1007/BF02818172
Jones, V., Jo, J., & Martin, P. (2007). Future schools and how technology can be used to
support millennial and Generation Z students. In C.-H. Kim (Ed.), Proceedings of
the first international conference of ubiquitous information technology (p. 1–6).
Piscataway, NJ: Institute of Electrical and Electronics Engineers. Retrieved from
http://www.webkb.org/doc/papers/icut07/icut07_JonesJoMartin.pdf
Kass, G. V. (1980). An exploratory technique for investigating large quantities of
categorical data. Applied Statitics. 29 (2). 119-127. Retrieved from JSTOR
Kaufman, D., Sauve, L., & Renaud, L. (2011). Enhancing learning through an online
secondary school educational game. Journal of Educational Computing Research,
44, 409–428. doi:10.2190/EC.44.4.c
165
Kebritchi, M., Hirumi, A., & Bai, H. (2010). The effects of modern mathematics
computer games on mathematics achievement and class motivation. Computers &
Education, 55, 427–443. doi: 10.1016/j.compedu.2010.02.007.
Kennedy, G. E., Judd, T. S., Churchward, A., Gray, K., & Krause, K. (2008). First year
students’ experiences with technology: Are they really digital natives?
Australasian Journal of Educational Technology, 24, 108–122. Retrieved from
EBSCOhost database.
Ketelhut, D. J., & Dede, C. (2006, October). Assessing inquiry learning. Paper presented
at the National Association of Research in Science Teaching, San Francisco, CA.
Ketelhut, D. J., Dede, C., Clark, J., & Nelson, J. (2006, April). A multi-user virtual
environment for building and assessing higher order inquiry skills in science.
Paper presented at the annual meeting of the American Educational Research
Association, San Francisco, CA.
Kevin, K. F. C., Morris, S. Y. J., F, L. L., Jimmy, H. M. L., Eric, T. H. L., Shang, J., &
Marti, K. H. W. (2008). Farmtasia: An online game-based learning environment
based on the VISOLE pedagogy. Virtual Reality, 12(1), 17-25.
doi:http://dx.doi.org/10.1007/s10055-008-0084-z
King, C. (2012). Math playground [computer game]. Retrieved from
http://www.mathplayground.com/
Kipper, G. & Rampolla, J. (2013). Augmented reality: an emerging technologies guide to
ar. Waltham, Massachusetts: Syngress
Klopfer, E., Coulter, R., Perry, J., & Sheldon, J. (2012). Discovering familiar places:
Learning through mobile place-based games. In C. SteinKuehler, K. Squire, & S.

166
Barab (Eds.), Games, learning, and society: Learning and leading in the digital
age (p. 327–354). New York, NY: Cambridge University Press.
Klopfer, E., Sheldon, J., & Perry, J. (2012). Discovering familiar places: Learning and
meaning in the digital age. In Barab, S., Squire, K., & SteinKuehler (eds). Games,
learning, and society: Learning and leading in the digital age. New York:
Cambridge University Press.
Klopfer, E., & Squire, K. (2008). Environmental detectives—The development of an
augmented reality platform for environmental simulations. Educational
Technology Research & Development, 56, 203–228. doi:10.1007/s11423-007
-9037-6
Klopfer, E., Squire, K., Perry, J., & Jan, M.-F. (2005). Collaborative learning through
augmented reality role playing. In T.-W. Chan (Ed.), Proceedings of the 2005
conference on Computer Support for Collaborative Learning: The next 10 years!
(p. 311–315). Philadelphia, PA: Computer-Supported Collaborative Learning.
Krosinsky, S. (2011). Augmented reality enhances learning. Retrieved from
http://news.unm.edu/2011/04/augmented-reality-enhances-learning/
Laurence, M. (2010). Educational gaming: Where is the industry going? In A. Hirumi
(Ed.), Playing games in school: Video games and simulations for primary and
secondary education (p. 409–419). Eugene, OR: International Society for
Technology in Education.
Laux, T., Trausch, E., & Wyatt, P. (2012, June). Augmented reality to improve student
engagement and enhance learning. Poster session presented at the International
Society for Technology in Education Annual Conference, San Diego, CA.
167
Lee, K. (2012). Augmented reality in education and training. TechTrends, 56(2), 13–21.
doi:10.1007/s11528-012-0559-3
Li, S. (2010, June 20). “Augmented reality” on smartphones brings teaching down to
earth. The Chronicle of Higher Education. Retrieved from http://chronicle.com
/article/Augmented-Reality-on/65991/
Livingston, M. A., Brown, D. G., Julier, S. J., & Schmidt, G. S. (2006). Mobile
augmented reality: Applications and human factors evaluations. Virtual Media for
Military Applications (p. 25-1–25-6; Meeting proceedings RTO-MP-HFM-136,
Paper 25). Neuilly-sur-Seine, France: North Atlantic Treaty Organization
Research and Technology Organization.
Lombardi, M. M., & Oblinger, D. G. (2007). Authentic learning for the 21st century: An
overview (Educause Learning Initiative Paper 1). Retrieved from
http://net.educause.edu/ir/library/pdf/ELI3009.pdf
Lowhorn, G. L. (2007). Quantitative and qualitative research: How to choose the best
design. Presented at Academic Business World International Conference.
Nashville, Tennesse. In Lutz, S., & Huitt, W. (2004). Connecting cognitive
development and constructivism: Implications from theory for instruction and
assessment. Constructivism in the Human Sciences, 9(1). 67–90.
MacFarland, T. W. (1998). Mann-whittney u-test. Retrieved from
http://www.nyx.net/~tmacfarl/STAT_TUT/mann_whi.ssi
Madden, L. (2011). Professional augmented reality browsers for smartphones. The
Atrium, England: Wiley & Sons.
Madden, M., Lenhart, A., Duggan, M., Cortesi, S., & Gasser, U. (2013). Teens and

168
technology 2013. Pew Research Center’s Internet and American Life Project. 1-
19. Retrieved from http://www.pewinternet.org/Reports/2013/Teens-and-
Tech.aspx
Massachusetts Institute of Technology Scheller Teacher Education Program. 2011).
Taleblazer [augmented reality open-source software]. Retrieved from
http://education.mit.edu/projects/taleblazer
McDaniel, R., & Vick, E. H. (2010). Games for good: Why they matter, what we know,
and where do we go from here. Cognitive Technology Journal, 14(2), 66–73.
Milgram, P., & Kishino, F. (1994). A taxonomy of mixed reality visual displays. IEICE
Transactions on Information Systems, E77-D(12). 1–15.
Miller, L., Moreno, J., Willcockson, I., Smith, D., & Mayes, J. (2006). An online,
interactive approach to teaching neuroscience to adolescents. CBE Life Science
Education, 5, 137–143. doi:10.1187/cbe.05-08-0115
Mora, S., Boron, A., Pannese, P., & Divitini, M. (2012, February). Playing with mobile
augmented reality for fostering information learning. Poster session presented at
the annual conference of the Association for Computing Machinery Computer
Supported Cooperative Work, Seattle, WA.
Nagel, D. (2010). Report: mobile and classroom technologies surge in schools. Education
Technology Research. Retrieved from http://thejournal.com
/articles/2010/05/05/ report-mobile-and-classroom-technologies-surge-in
-schools.aspx
National Commission for the Protection of Human Subjects of Biomedical and
Behavioral Research. (1979). The Belmont report: Ethical principles and
169
guidelines for the protection of human subjects of research. Retrieved from
http://www.hhs.gov/ohrp/humansubjects/guidance/belmont.html
National Commission for the Protection of Human Subjects of Biomedical and
Behavioral Research. (1979a). The Belmont report: Ethical principles and
guidelines for the protection of human subjects of research. U.S. Department of
Health and Human Services. Retrieved from http://videocast.nih.gov/
pdf/ohrp_appendix_belmont_report_vol_2.pdf
National Research Council (1996). National Science Education Standards. Washington,
DC: National Academy Press
Navarro, A, Padilla, J. V., Londono, S., & Madrinan, P. (2011, February). Serious games:
Between training and entertainment. Paper presented at the Third International
Conference on Mobile, Hybrid, and On-line Learning, Guadeloupe, France.
New Media Consortium. (2009). Four to five years: Location-based learning. 2009
Horizon Report. Retrieved from http://wp.nmc.org/horizon
-anz-2009/section/location-based-learning/
Norris, C., Hossain, A., & Soloway, E. (2011). Using smartphones as essential tools for
learning: A call to place schools on the right side of 21st century. Educational
Technology. 51(3). 18-25.
Oblinger, D. (2003). Boomers, gen-xers and millennials: Understanding the new students.
EDUCAUSE, 38(4), 37–47.
Oblinger, D. G., & Oblinger, J. L. (2005). Is it age or IT: First steps toward
understanding the net generation. In D. G. Oblinger & J. L. Oblinger (Eds.),
Educating the net generation (p. 2.1–2.20). Washington, DC: EDUCAUSE.
170
Osterweil, S., & Le, L. X. (2010). Learning and change—A view from MIT’s education
arcade. Cognitive Technology Journal, 14(2), 58–65.
Pallant, J. (2010). SPSS survival manual: A step by step guide to data analysis using
SPSS (4th ed.). New York, NY: McGraw-Hill
Panoutsopoulos, H., & Sampson, D. G. (2012). A study on exploiting commercial digital
games into school context. Journal of Educational Technology & Society, 15(1),
15–27.
Partnership for 21st Century Skills. (2011). 21st century student outcomes. Retrieved,
from http://www.p21.org/storage/documents/1.__p21
_framework_2-pager.pdf
Pearson Education. (2012). Funbrain [computer game]. Retrieved October 1, 2012, from
http://www.funbrain.com/
Piaget, J. (1947, 2003). The Psychology of Intelligence. New York: Littlefield Adams &
Co.
Pidaparthy, U. (2011). Marketers embracing QR codes, for better or worse. Retrieved
from http://articles.cnn.com/2011-03-28/tech/qr.codes
.marketing_1_qr-smartphone-users-symbian?_s=PM:TECH
Program for International Student Assessment, Organization for Economic Cooperation
and Development. (n.d.). Overview. Retrieved from http://nces.ed.gov/surveys/
pisa/
Program for International Student Assessment, Organization for Economic Cooperation
and Development. (2012). Snapshot of performance in mathematics, reading and
171
science. Retrieved from http://www.oecd.org/pisa/keyfindings/PISA-2012-results-
snapshot-Volume-I-ENG.pdf
Rice University. (2012). Nothing to rave about [computer game]. Retrieved from
http://webadventures.rice.edu/ed/Teacher-Resources/_games
/Reconstructors/_701/Game-Overview.html
Rosenbaum, E., Klopfer, E., & Perry, J. (2007). On location learning: Authentic applied
science with networked augmented realities. Journal of Science Education and
Technology, 16, 31–45. doi:10.1007/s10956-006-9036-0
Rosenheck, L., & Perry, J. (2012). Ubiqbio: A playful approach to learning biology with
mobile games. Retrieved from http://www.isteconference.org/2012/uploads/
KEY_70132706/PerryRosenheckUbiqBio_RP.pdf
Rosenheck, L., & Sheldon, J. (2012). TaleBlazer: Designing location-based augmented
reality games for education. Poster session presented at the International Society
for Technology in Education Annual Conference, San Diego, CA.
Sankey, M. D. (2006). A neomillennial learning approach: Helping non-traditional
learners studying at a distance. International Journal of Education, 2(4), 82–99.
Retrieved from http://ijedict.dec.uwi.edu/viewarticle.php?id=224&layout=html
Schrier, K. L. (2005). Revolutionizing history education: Using augmented reality games
to teach history (Master’s thesis). Massachusetts Institute of Technology.
Retrieved from http://erax1201.eliterax.com/research/theses
/KarenSchrier2005.pdf
172
Schrier, K. L. (2006). Using augmented reality games to teach 21st century skills.
Retrieved from http://nguyendangbinh.org/Proceedings/Siggraph/2006/cd1
/content/educators/schrier.pdf
Shadish, W. R., Cook, T. D., & Campbell, D. T. (2002). Experimental and Quasi-
experimental Designs for Generalized Causal Inference. New York, New York:
Houghton Mifflin Comapany.
Shaffer, D. W., Squire, K. R., Halverson, R., & Gee, J. P. (2005). Video games and the
future of learning. Phi Delta Kappan, 87, 104–111.
Sharples, M. (2010). Forward. In E. Brown (Ed.), Education in the wild: Contextual and
location-based mobile learning in action (Report from the STELLAR Alpine
Rendez-Vous; p. 4–6). Nottingham, England: Learning Sciences Research
Institute.
Shelton, B. E. (2002). Augmented reality and education: Current projects and the
potential for classroom learning. New Horizons for Learning, 9(1), 1–5.
Shute, V. J., Ventura, M., Bauer, M., & Zupata-Rivera, D. (2010). Melding the power of
serious games and embedded assessment to monitor and foster learning. In A.
Hirumi (Ed.), Playing games in school: Video games and simulations for primary
and secondary education (p. 296–321). Eugene, OR: International Society for
Technology in Education.
Siemens, G. (2008). Learning and knowing in networks: Changing roles for educators
and designers. ITForum. Retrieved from http://it.coe.uga.edu
/itforum/Paper105/Siemens.pdf
173
Squire, K. (2005). Changing the game: What happens when video games enter the
classroom? Journal of Online Education, 1(6), 1–20. Retrieved from
http://website.education.wisc.edu/kdsquire/tenure-files/manuscripts/26
-innovate.pdf
Squire, K. (2006). From content to context: Videogames as design experience.
Educational Researcher, 35(8), 19–29. doi:10.3102/0013189X035008019
Squire, K. (2007a). Open-ended video games: A model for developing learning for the
interactive age. Retrieved from http://website.education.wisc.edu/kdsquire/tenure-
files/12-macarthur-book-salen
-squire.pdf
Squire, K. (2007b). Video-game literacy: A literacy of expertise. In D. Leu, J. Coiro, M.
Knobel, & C. Lankshear (Eds.), A handbook of new literacies research (p. 639–
667). Mahwah, NJ: Erlbaum. Retrieved from http://website.education.wisc.edu/
kdsquire/tenure-files/04-video-game%20literacy.pdf
Squire, K. (2008). Video game-based learning: An emerging paradigm for instruction.
Performance Improvement Quarterly, 21(3), 1–36. Retrieved from http://website
.education.wisc.edu/kdsquire/tenure-files/09-PIQ-Squire-submitted.pdf
Squire, K., & Jan, M. (2007). Mad city mystery: developing scientific argumentation
skills with a place-based augmented reality game on handheld computers. Journal
of Science Education and Technology, 16, 5–29. doi:10.1007/s10956-006-9037-z
Stripling, B. (2010). Teaching students to think in the digital environment: Digital
literacy and digital inquiry. School Library Monthly, 26(8), 16–19. Retrieved from
EBSCOhost database.
174
Susi, T., Johannesson, M., & Backlund, P. (2007). Serious games—An overview.
(Technical report HS-IKI-TR-07-001). Skövde, Sweden: University of Skövde
School of Humanities and Information.
Teed, R. (2012). Game-based learning. Retrieved from http://serc.carleton.edu/introgeo/
games/index.html
Tieso, C. L. (2005). The effects of grouping and curricular practices on intermediate
sudents’ math achievement. Journal for the Education of the Gifted. 29(1). 60-89.
Tinzmann, M. B., Jones, B. F., Fennimore, T. F., Bakker, J., Fine, C., & Pierce, J. (1990).
What is the collaborative classroom? Retrieved from http://www.ncrel.org/sdrs/
areas/rpl_esys/collab.htm
Tuzun, H., Yilmaz-Soylu, M., Karakus, T., Inal, Y., & Kizilkaya, G. (2009). The effects
of computer games on primary school students’ achievement and motivation in
geography learning. Computers & Education, 32, 68–77.
Van Eck, R. (2006). Digital game-based learning: It’s not just the digital natives who are
restless. Educause Review, 41(2), 16–18, 20, 22, 24, 26, 28, 30.
Van Krevelen, D. W. F., & Poelman, R. (2010). A survey of augmented reality
technologies, applications and limitations. International Journal of Virtual
Reality, 9(2), 1–20. Retrieved from http://kjcomps.6te.net/upload/paper1%20.pdf
Vilkoniene, M. (2009). Influence of augmented reality technology upon pupils’
knowledge about human digestive system: The results of the experiment. US–
China Education Review. 6(1), 36–43.
Vogt, W. P., & Burke-Johnson, R. (2011). Dictionary of Statistics & Methodology (4th
ed.). Los Angeles, California: Sage Publications
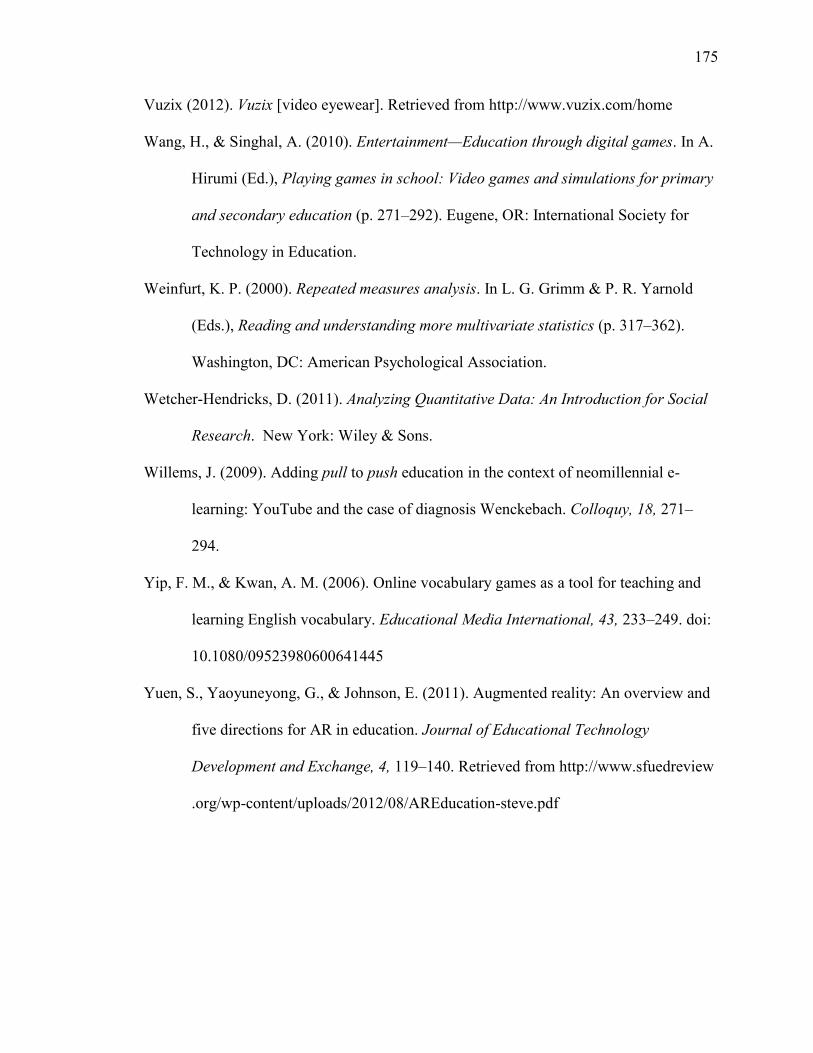
175
Vuzix (2012). Vuzix [video eyewear]. Retrieved from http://www.vuzix.com/home
Wang, H., & Singhal, A. (2010). Entertainment—Education through digital games. In A.
Hirumi (Ed.), Playing games in school: Video games and simulations for primary
and secondary education (p. 271–292). Eugene, OR: International Society for
Technology in Education.
Weinfurt, K. P. (2000). Repeated measures analysis. In L. G. Grimm & P. R. Yarnold
(Eds.), Reading and understanding more multivariate statistics (p. 317–362).
Washington, DC: American Psychological Association.
Wetcher-Hendricks, D. (2011). Analyzing Quantitative Data: An Introduction for Social
Research. New York: Wiley & Sons.
Willems, J. (2009). Adding pull to push education in the context of neomillennial e-
learning: YouTube and the case of diagnosis Wenckebach. Colloquy, 18, 271–
294.
Yip, F. M., & Kwan, A. M. (2006). Online vocabulary games as a tool for teaching and
learning English vocabulary. Educational Media International, 43, 233–249. doi:
10.1080/09523980600641445
Yuen, S., Yaoyuneyong, G., & Johnson, E. (2011). Augmented reality: An overview and
five directions for AR in education. Journal of Educational Technology
Development and Exchange, 4, 119–140. Retrieved from http://www.sfuedreview
.org/wp-content/uploads/2012/08/AREducation-steve.pdf
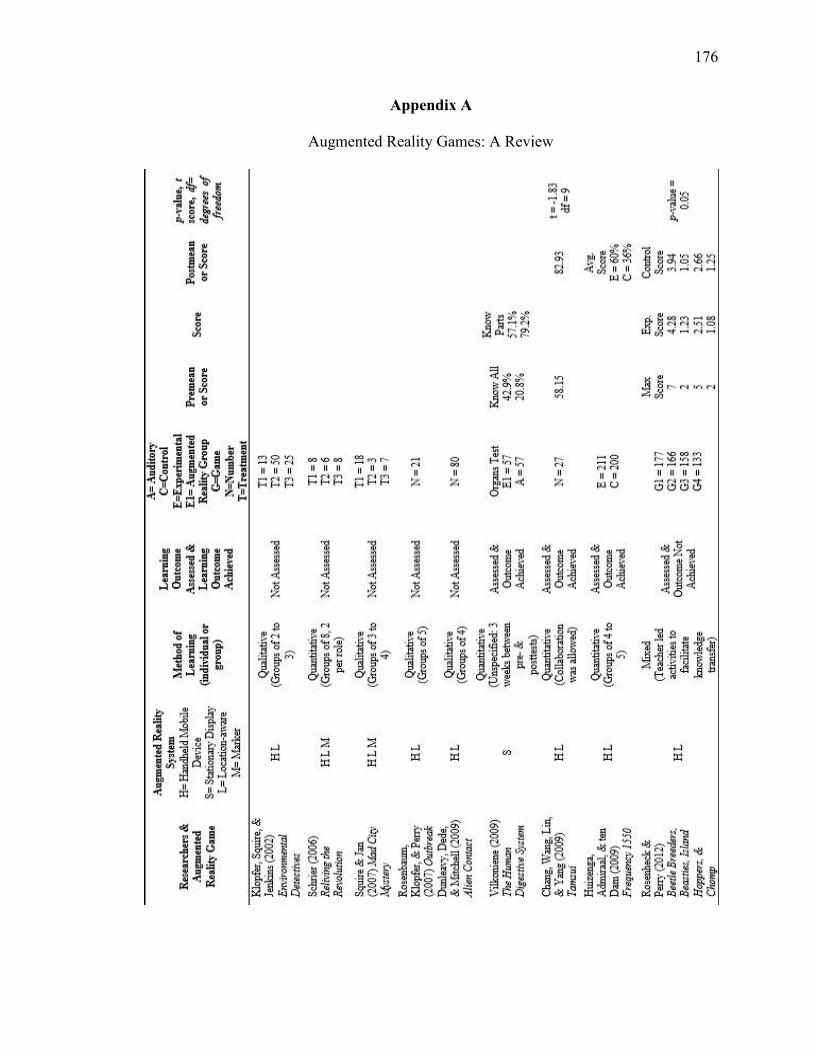
176
Appendix A
Augmented Reality Games: A Review
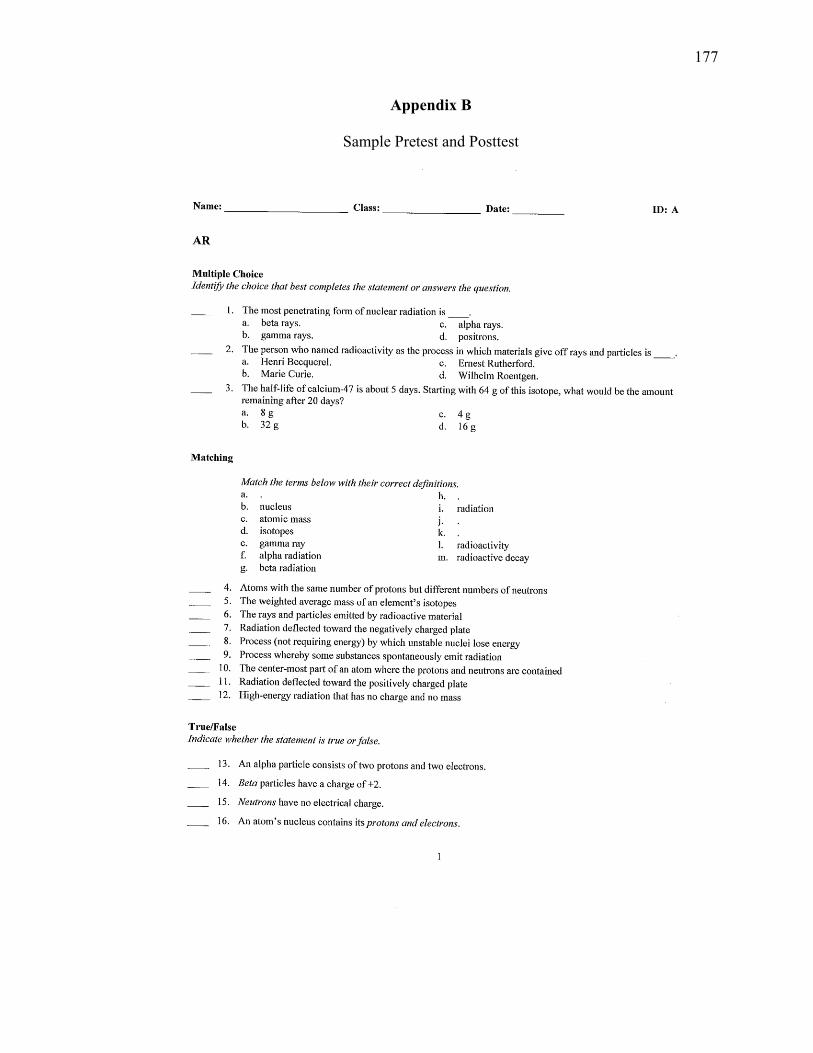
177
Appendix B
Sample Pretest and Posttest

178
179
Appendix C
Game-Based Learning Continuum
From Game-Based Learning, by R. Teed, 2012, retrieved January 16, 2013 from http://serc.carleton.edu/introgeo/games/ index.html; The Horizon Report, by L. Johnson, R. Smith, H. Willis, A. Levine, & K. Haywood, 2011, Austin, TX: The New Media Consortium, Retrieved from http://net.educause.edu/ir/library/pdf/HR2011.pdf; “Digital game-based learning: It’s Not Just the Digital Natives Who Are Restless, by R. Van Eck, 2006, Educause Review, 41(2), 16–18, 20, 22, 24, 26, 28, 30.
Game-Based Learning
Non-Digital Games
Card Games
Board Games
Digital Games
Computer Console Games
(Software games)
Ex: COTS games like Civilization
Online Games
Basic Online
Ex: Games for drill and
practice like FunBrain
MultiplayerEx: MUVE game like River City
Massively Multiplayer Ex: Second Life
Ubiquitous Games
Mixes game elements of the real and virtual world
Augmented Reality Games

180
Appendix D
Computer Games: Digital Game-Based Learning: A Review
181
Appendix E
Microsoft’s Tag Quick Response code (QR)
Microsoft’s Tag Quick Response code (QR)
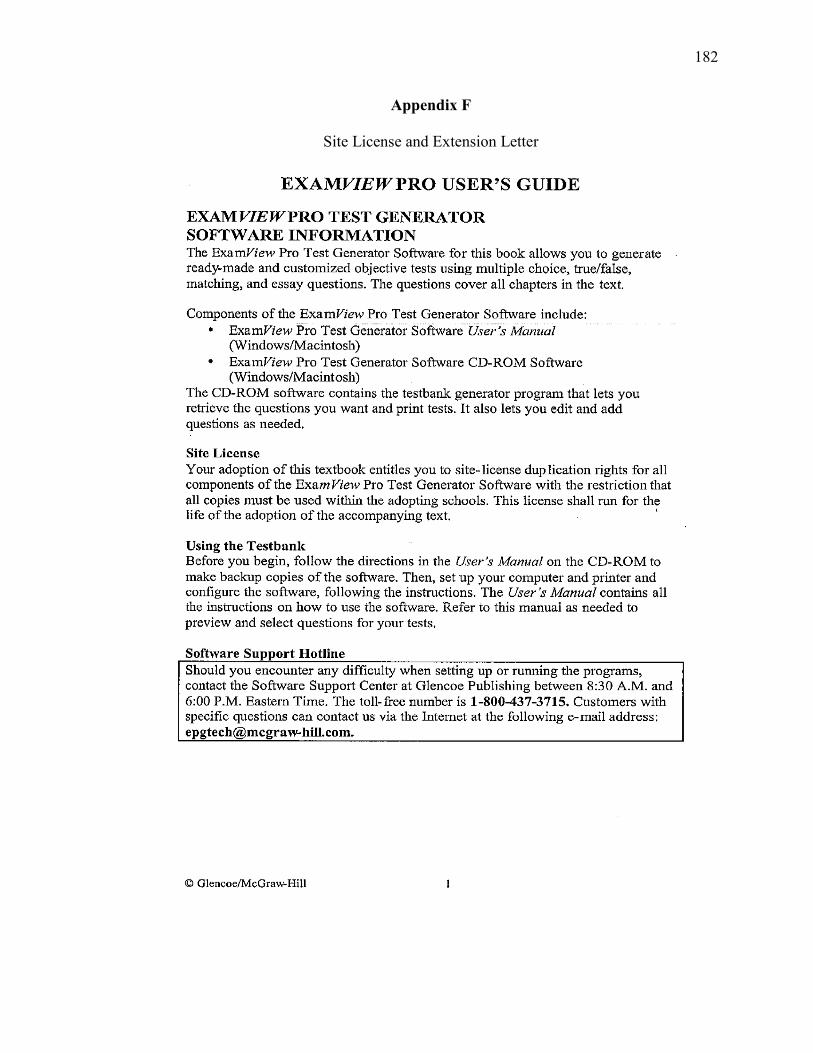
182
Appendix F
Site License and Extension Letter
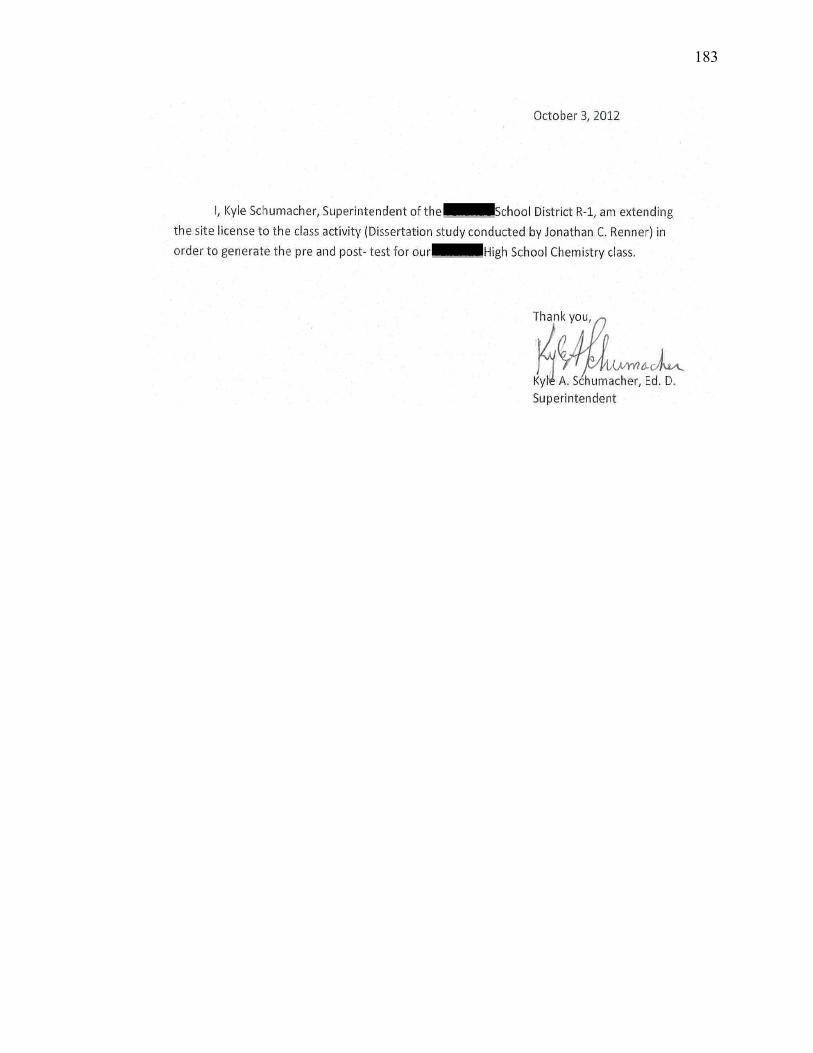
183
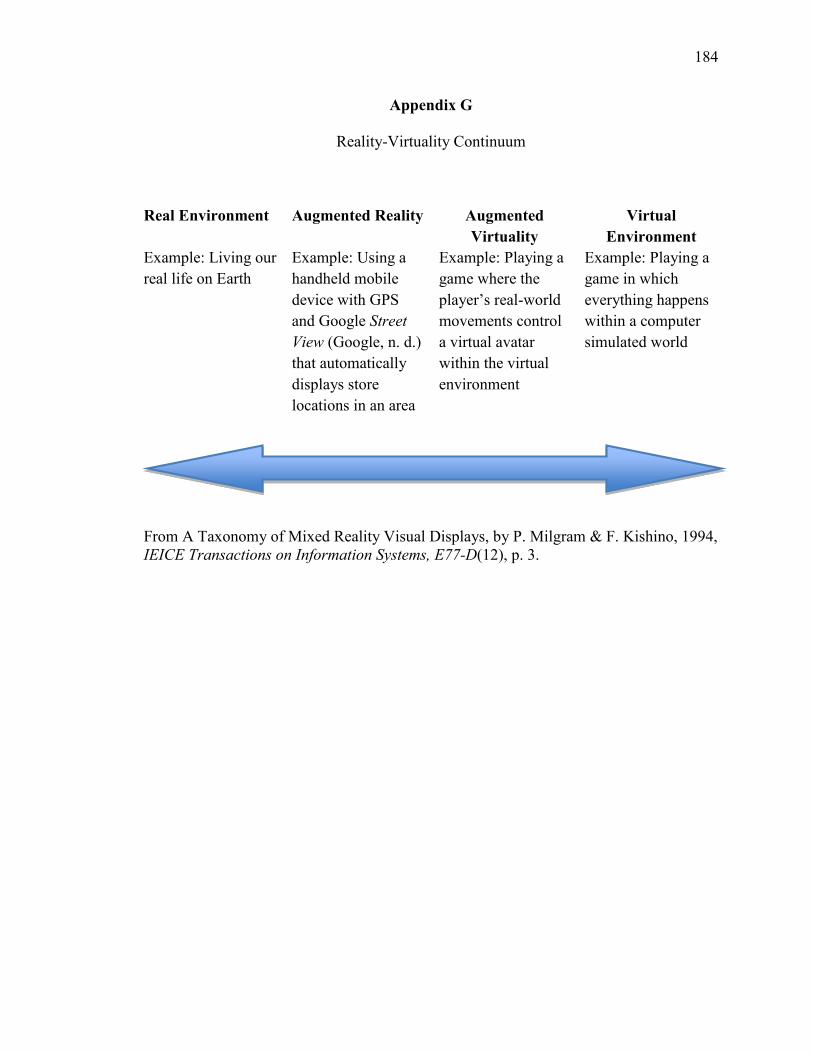
184
Appendix G
Reality-Virtuality Continuum
Real Environment Augmented Reality Augmented Virtuality
Virtual Environment
Example: Living our real life on Earth
Example: Using a handheld mobile device with GPS and Google Street View (Google, n. d.) that automatically displays store locations in an area
Example: Playing a game where the player’s real-world movements control a virtual avatar within the virtual environment
Example: Playing a game in which everything happens within a computer simulated world
From A Taxonomy of Mixed Reality Visual Displays, by P. Milgram & F. Kishino, 1994, IEICE Transactions on Information Systems, E77-D(12), p. 3.
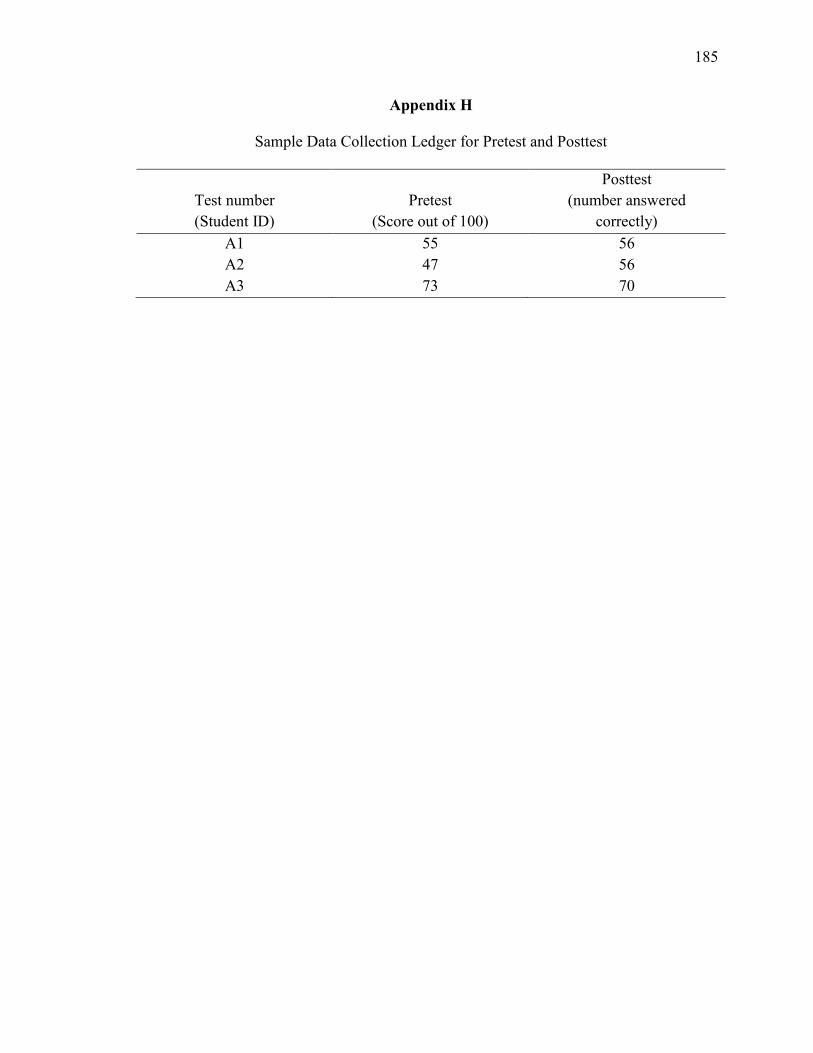
185
Appendix H
Sample Data Collection Ledger for Pretest and Posttest
Test number (Student ID)
Pretest (Score out of 100)
Posttest (number answered
correctly) A1 55 56 A2 47 56 A3 73 70
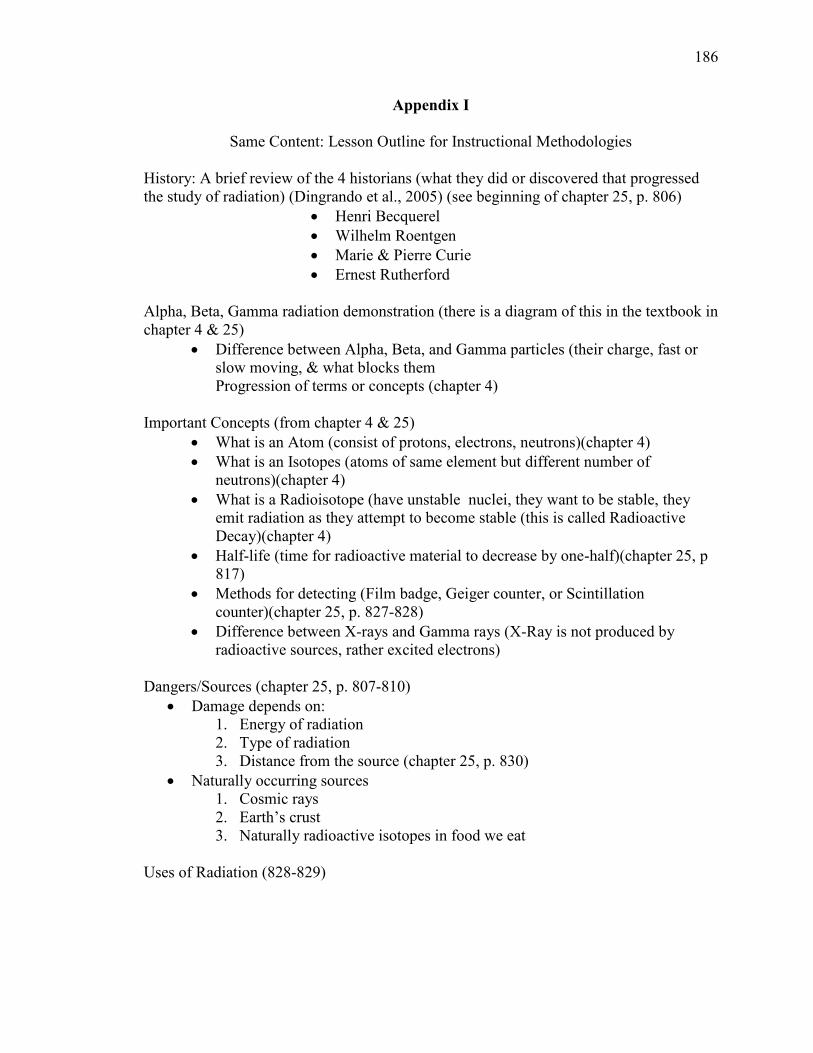
186
Appendix I
Same Content: Lesson Outline for Instructional Methodologies
History: A brief review of the 4 historians (what they did or discovered that progressed the study of radiation) (Dingrando et al., 2005) (see beginning of chapter 25, p. 806)
x Henri Becquerel x Wilhelm Roentgen x Marie & Pierre Curie x Ernest Rutherford
Alpha, Beta, Gamma radiation demonstration (there is a diagram of this in the textbook in chapter 4 & 25)
x Difference between Alpha, Beta, and Gamma particles (their charge, fast or slow moving, & what blocks them Progression of terms or concepts (chapter 4)
Important Concepts (from chapter 4 & 25)
x What is an Atom (consist of protons, electrons, neutrons)(chapter 4) x What is an Isotopes (atoms of same element but different number of
neutrons)(chapter 4) x What is a Radioisotope (have unstable nuclei, they want to be stable, they
emit radiation as they attempt to become stable (this is called Radioactive Decay)(chapter 4)
x Half-life (time for radioactive material to decrease by one-half)(chapter 25, p 817)
x Methods for detecting (Film badge, Geiger counter, or Scintillation counter)(chapter 25, p. 827-828)
x Difference between X-rays and Gamma rays (X-Ray is not produced by radioactive sources, rather excited electrons)
Dangers/Sources (chapter 25, p. 807-810)
x Damage depends on: 1. Energy of radiation 2. Type of radiation 3. Distance from the source (chapter 25, p. 830)
x Naturally occurring sources 1. Cosmic rays 2. Earth’s crust 3. Naturally radioactive isotopes in food we eat
Uses of Radiation (828-829)