A mobile Augmented Reality application - DiVA-Portal
58
A mobile Augmented Reality application for visualizing and interacting with online data Author Nurane Kuqi Supervisor Aris Alissandrakis Co-supervisor Nico Reski Examiner Ilir Jusufi Exam date 30 th May 2017 Subject Social Media and Web Technologies Level Master Course code 5ME11E
-
Upload
khangminh22 -
Category
Documents
-
view
5 -
download
0
Transcript of A mobile Augmented Reality application - DiVA-Portal

A mobile Augmented Reality applicationfor visualizing and interacting with online data
Author Nurane KuqiSupervisor Aris AlissandrakisCo-supervisor Nico ReskiExaminer Ilir JusufiExam date 30th May 2017Subject Social Media and Web TechnologiesLevel MasterCourse code 5ME11E

i
“Computing is not about computers anymore. It is about living.”
Nicholas Negroponte (MIT Media Lab founder)

ii
Abstract
Augmented Reality (AR) technology has recently received a lot of attention for hav-ing lots of potential for uses in a variety of contexts. From an interaction perspective,an important factor is not only the usability of the applications, but also the engage-ment that these allow. Of particular interest is the possibility of allowing users tointeract with data from online sources via an Augmented Reality interface.
The main focus of this master thesis is to create a mobile AR application that allowsvisualization and interaction with online data. For this purpose a prototype wasdesigned and implemented using the Unity game engine with C# and the VuforiaSDK on the front-end (mobile app) and NodeJS with MongoDB on the back-end(database server). The prototype was tested, and also deployed in a two week userstudy to evaluate a) how the system allowed the participants to explore availabledata, and b) how the use of the system affected the participants daily behaviour.The results indicate that the prototype was well received by the users. They enjoyedthe experience not only due to the functionality of the system, but also given theopportunity for better involvement and completion of the given task (schedulingtheir lunch at the university campus restaurant) successfully.
The outcomes of the thesis are a proposed architecture for a mobile AR system thatallows users to interact in an engaging manner with online data, the developed pro-totype, and the initial testing and evaluation of the prototype in a specific use case.
It is hoped that this work constructively contributes to the overall Augmented Real-ity field, especially regarding the development of mobile Augmented Reality appli-cations.
Keywords: Augmented Reality, mobile Augmented Reality, AR Cube, Vuforia, Unity3D, NodeJS, MongoDB.

iii
Acknowledgements
In order to successfully complete the Master Studies, many components have givensupport financially, spiritually and academically.
First, I want to thank the Swedish Institute for the scholarship provision duringthese two years of studies. SI is the first institute that made possible a dream, toaccomplish the master studies abroad. Throughout studies I have always thankedSI for this great opportunity to advance my knowledge in the IT field.
I wish to express my sincere gratitude to the Professor Marcelo Milrad for providingme the opportunity to work as a student researcher within the Media TechnologyDepartment.
I would like to express my deepest appreciation to Dr. Aris Alissandrakis. Our firstacademic collaboration was throughout the student research work that I had withinthe Media Technology department. Based on the good working experience, I de-cided to chose him as a supervisor for my thesis. He has not only been a greatmentor, but he has also supported me a lot to advance my skills and knowledge. Inaddition, as part of the academic level support, I want to thank Nico Reski, for hissincere support and technical consultancy. Nico has not only been a co-supervisorbut also a great friend. I feel lucky for the possibility to have spent this journeywith professional mentors that helped me advance through their consultancy, pro-fessional conduct and fruitful discussions.
My family has been one of the key motivations for pursuing the studies abroad.Their support in everything and heart warming care has boosted my motivation tosuccessfully complete the studies.
My fiancé has played an important role on the whole journey. He has been thegreatest support of mine during all this time. He has supported me in every step,with advices, technical support and has been with me in the bad and in the good.His unconditional love and help has motivated me to successfully pass the difficultbattles throughout this time.
I also want to thank all the friends that helped me through this masters. Their sup-port and fika time together helped me become a better person in life. Moreover,participants of the user study played a crucial role in the validation of the prototype.Thank you for the readiness to participate and add value to the study.
In order to bridge the gaps throughout the phase of literature review and technicalimplementation I have consulted a lot of online resources from very scientific toless formal communities of people. I appreciate the work of each of the people thatcontribute to the shared knowledge online.
Thank you all good people!

iv
Contents
Abstract ii
Acknowledgements iii
Contents iv
List of Figures vi
List of Tables vii
List of Abbreviations viii
1 Introduction 11.1 Background . . . . . . . . . . . . . . . . . . . . . . . . . . . . . . . . . . 11.2 Motivation . . . . . . . . . . . . . . . . . . . . . . . . . . . . . . . . . . . 21.3 Research Question and Hypotheses . . . . . . . . . . . . . . . . . . . . . 31.4 Thesis Outline . . . . . . . . . . . . . . . . . . . . . . . . . . . . . . . . . 4
2 Related Work 52.1 Literature Review . . . . . . . . . . . . . . . . . . . . . . . . . . . . . . . 52.2 The Previous AR Cube Prototype . . . . . . . . . . . . . . . . . . . . . . 7
3 Methodology 93.1 System Development . . . . . . . . . . . . . . . . . . . . . . . . . . . . . 103.2 User Study . . . . . . . . . . . . . . . . . . . . . . . . . . . . . . . . . . . 10
3.2.1 Testing . . . . . . . . . . . . . . . . . . . . . . . . . . . . . . . . . 113.2.2 Data Collection . . . . . . . . . . . . . . . . . . . . . . . . . . . . 11
4 Prototype 124.1 Prototype Design . . . . . . . . . . . . . . . . . . . . . . . . . . . . . . . 124.2 Server and Database Implementation . . . . . . . . . . . . . . . . . . . . 14
4.2.1 Query Data From MongoDB and Google Calendar API . . . . . 144.2.2 Activity Diagram . . . . . . . . . . . . . . . . . . . . . . . . . . . 16
4.3 User scenario . . . . . . . . . . . . . . . . . . . . . . . . . . . . . . . . . 16
5 User study 195.1 User Study Setting . . . . . . . . . . . . . . . . . . . . . . . . . . . . . . 19
5.1.1 Testing . . . . . . . . . . . . . . . . . . . . . . . . . . . . . . . . . 205.1.2 Data collection . . . . . . . . . . . . . . . . . . . . . . . . . . . . 20
5.2 Summary . . . . . . . . . . . . . . . . . . . . . . . . . . . . . . . . . . . . 21
6 Results and Analysis 226.1 Testing . . . . . . . . . . . . . . . . . . . . . . . . . . . . . . . . . . . . . 226.2 Weekly Diaries . . . . . . . . . . . . . . . . . . . . . . . . . . . . . . . . . 22

v
6.3 System Logs . . . . . . . . . . . . . . . . . . . . . . . . . . . . . . . . . . 236.4 Interview . . . . . . . . . . . . . . . . . . . . . . . . . . . . . . . . . . . . 25
7 Discussion and Conclusion 277.1 Research Question . . . . . . . . . . . . . . . . . . . . . . . . . . . . . . 277.2 Hypotheses . . . . . . . . . . . . . . . . . . . . . . . . . . . . . . . . . . 287.3 Limitations . . . . . . . . . . . . . . . . . . . . . . . . . . . . . . . . . . . 287.4 Lessons Learned . . . . . . . . . . . . . . . . . . . . . . . . . . . . . . . . 297.5 Future Work . . . . . . . . . . . . . . . . . . . . . . . . . . . . . . . . . . 30
A Test Protocol 31
B Participant Initial Questionnaire 35
C Participant Weekly Diaries 38
D System Development 42D.1 Unity 3D . . . . . . . . . . . . . . . . . . . . . . . . . . . . . . . . . . . . 42D.2 Vuforia SDK . . . . . . . . . . . . . . . . . . . . . . . . . . . . . . . . . . 42D.3 NodeJS . . . . . . . . . . . . . . . . . . . . . . . . . . . . . . . . . . . . . 43
D.3.1 Single Threaded Approach . . . . . . . . . . . . . . . . . . . . . 43D.3.2 JSON . . . . . . . . . . . . . . . . . . . . . . . . . . . . . . . . . . 44
D.4 MongoDB . . . . . . . . . . . . . . . . . . . . . . . . . . . . . . . . . . . 45D.4.1 Database API . . . . . . . . . . . . . . . . . . . . . . . . . . . . . 45
Bibliography 46
vi
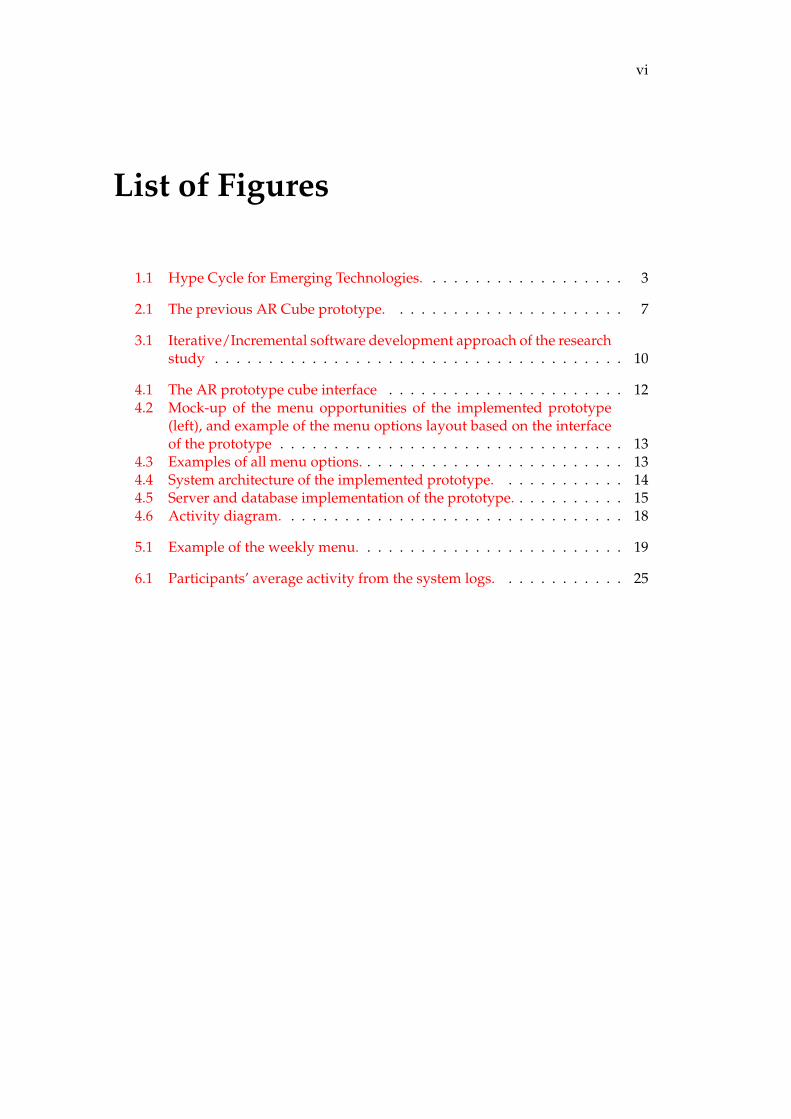
List of Figures
1.1 Hype Cycle for Emerging Technologies. . . . . . . . . . . . . . . . . . . 3
2.1 The previous AR Cube prototype. . . . . . . . . . . . . . . . . . . . . . 7
3.1 Iterative/Incremental software development approach of the researchstudy . . . . . . . . . . . . . . . . . . . . . . . . . . . . . . . . . . . . . . 10
4.1 The AR prototype cube interface . . . . . . . . . . . . . . . . . . . . . . 124.2 Mock-up of the menu opportunities of the implemented prototype
(left), and example of the menu options layout based on the interfaceof the prototype . . . . . . . . . . . . . . . . . . . . . . . . . . . . . . . . 13
4.3 Examples of all menu options. . . . . . . . . . . . . . . . . . . . . . . . . 134.4 System architecture of the implemented prototype. . . . . . . . . . . . 144.5 Server and database implementation of the prototype. . . . . . . . . . . 154.6 Activity diagram. . . . . . . . . . . . . . . . . . . . . . . . . . . . . . . . 18
5.1 Example of the weekly menu. . . . . . . . . . . . . . . . . . . . . . . . . 19
6.1 Participants’ average activity from the system logs. . . . . . . . . . . . 25

vii
List of Tables
6.1 Dates that the participants ate at the restaurant, based on their weeklydiaries. . . . . . . . . . . . . . . . . . . . . . . . . . . . . . . . . . . . . . 22
6.2 How often participants used the app, based on their weekly diaries. . . 236.3 System logs of participants’ overall activity. . . . . . . . . . . . . . . . . 246.4 System logs of participants’ choices and cancellations. . . . . . . . . . . 246.5 Participants’ overall activity from the system logs. . . . . . . . . . . . . 246.6 Menu options chosen by the participants during the study. . . . . . . . 256.7 Matches and mismatches between system logs and participants diaries. 26

viii
List of Abbreviations
API Application Programming InterfaceAR Augmented RealityCLI Command Line Interface
CRUD Create Read Update DeleteCS Computer Science
ECMA European Computer Manufacturer’s AssociationGQM Goal Question Metric
HCI Human Computer InteractionHDM Head Mounted DisplayHTTP HyperText Transfer Protocol
IDE Integrated Development EnvironmentIoT Internet of Things
IT Information TechnologyJSON JavaScript Object Notation
MARS Mobile Augmented Reality SystemsPEAR Public Engagement Augmented Reality
POI Point Of InterestREST REpresentational State TransferSDK Software Development KitSSCI Social Science Citation Index
UI User InterfaceURL Uniform Resource Locator
UX User ExperienceVR Virtual Reality
WWW World Wide Web

ix
To my parents Mr. Xhevad Kuqi and Mrs. Saide Kuqi,To my siblings Fatlinda Kuqi and Elida Kuqi and
To my life partner Sazan LushiThis work is a sign of my love to you!

1
Chapter 1
Introduction
1.1 Background
According to (Wu et al., 2013),“[Augmented Reality] can be defined as a system thatfulfils three basic features: a combination of real and virtual worlds, real-time inter-action, and accurate 3D registration of virtual and real objects”. The first appearanceof AR, based on (Azuma et al., 2001), “dates back to Sutherland’s work in the 1960s,which used a see-through HMD to present 3D graphics”. Another study suggeststhat AR dates earlier on, as stated on the paper of (Carmigniani and Furht, 2011)“[t]he first appearance of Augmented Reality (AR) dates back to the 1950s whenMorton Heilig, a cinematographer, thought of cinema as an activity that would havethe ability to draw the viewer into the on-screen activity by taking in all the sensesin an effective manner”.
According to (Butchart, 2011), “not so long ago, Augmented Reality was an experi-mental technology that rarely left the lab and required a high level of technical ex-pertise and knowledge to create new applications”. But recent technological ad-vancements brought AR to the forefront, with mobile AR having many applicationsin different fields.
AR technology provides interesting real-time interaction possibilities encouragingactive engagement. As (Höllerer et al., 2001) suggest, “mobile augmented realitysystems (MARS) have the potential to revolutionize the way in which information isprovided to users”; but still in order to achieve this adjustment mobile AR develop-ers need to take into considerations the different UI design rules and be cautious ofthe HCI factors on the process.
This thesis work aims to propose a mobile Augmented Reality application for visu-alizing and interacting with online data. It is intended to add value to the area withadditional exploration towards mobile AR, in the context of the PEAR1 project. Theemphasis is to have a digital object as an AR overlay and allow users to interact, viathis AR visualization, with online data.
1Augmented Reality for Public Engagement, by Aris Alissandrakis and Nico Reski,https://lnu.se/en/research/searchresearch/forskningsprojekt/project-augmented-reality-for-public-engagement-pear

Chapter 1. Introduction 2
1.2 Motivation
According to (Olsson et al., 2013), “despite the recent advent of various AR demon-strators, user experience and users’ expectations of MAR services have received littleconsideration in the research and, because of their salience in the design of successfulservices, deserve more attention”. AR offers unique advantages, such as the combi-nation of virtual and real objects in a real setting. AR as a novel technology offersto the users a new view of reality, adding overlay information that can be interactedwith, in real time. Moreover, such applications can allow the users to take advantageof their physical world skills and senses in combination with networked computingin the digital world.
In recent years AR techonology has been brought to the mainstream: Microsoft(HoloLens2), Nintendo (Pokemon Go3), and Snapchat4 are just some examples ofbig companies that show interest. There is a perception in retail that 40% would paymore for a product if they could experience it through AR (Augment.com, 2016).
Based on the research of (Johnson et al., 2013), “the new era of mobile technologiesand applications have become too capable and ubiquitous and they already presenta very useful tools that should not be neglected because their distribution confrontstraditional patterns of adoption”. The recent Hype Cycle for Emerging Technolo-gies (see Figure 1.1), further supports this. As reported by Mike J. Walker, researchdirector at Gartner Inc, “this Hype Cycle specifically focuses on the set of technolo-gies that is showing promise in delivering a high degree of competitive advantageover the next five to 10 years” (Gartner.com, 2016). AR technology is listed as oneto gain mainstream adoption in the next 5-10 years, and is seen to provide a moretransparent immersing experience, getting more human-centric in the future.
According to (Papagiannis, 2010), “we are now entering the second wave of AR, en-tryway, where the definition of AR is expanding to include things like wearables,big data, artificial intelligence, machine-learning, and social media”. In order to im-merse in the AR experience we need to work on creating, designing, and developingAR applications that deliver value and experience to the users.
According to (Zuckerberg, Schroepfer, and Liu, 2017), AR is going to be a reallyimportant technology that will change how we use our phones and eventually allof technology. Mark Zuckerberg throughout his talk discussed about the three im-portant cases related to AR such as the ability to display information, to add digitalobjects, and to enhance existing (physical) objects. Already there are many exam-ples of applications that provide such functionality. For example Instagram (andsimilar apps) give the ability to display information over a picture. Pokemon Go ispossibly the most mainstream example that uses the overlay of digital objects on thereal world as a game mechanic. Snapchat allows to enhance existing objects (usuallyfaces) through the help of different kinds of filters and effects.
According to (Kim et al., 2014), “with the prevalence of smart phones, the interactionbetween humans and the context through ubiquitous technology has been givenmore attention”. Certainly, in recent years we could argue that the peoples’ usage ofsmart phones has experienced a shift. Smart phones are primarily used for purposesother rather than phone calls, which are now regarded as a secondary function.
2https://www.microsoft.com/en-us/hololens3http://www.pokemongo.com/4Recent application for a US patent on “Image Based Tracking in Augmented Reality Systems”.

Chapter 1. Introduction 3
FIGURE 1.1: Hype Cycle for Emerging Technologies.This Hype Cyclespecifically focuses on the set of technologies that is showing promisein delivering a high degree of competitive advantage over the next
five to 10 years. (Source: Gartner.com, 2016)
In general, considering AR applications, in the early days people were required touse a computer and a Head Mounted Display (HMD) in order to experience them.Fortunately due to recent developments, in particular regarding smart phones, morefeasible technologies allow broader access.
1.3 Research Question and Hypotheses
The overall thesis goal is defined using the Goal-Question-Metric paradigm5 as fol-lows: “Design a mobile AR interface that allows the user to visualize and interactwith data obtained from online sources.”
Purpose design a mobile interface that obtains data from online sourcesIssue allow users to visualize, and interact with the data
Object mobile devicesViewpoint AR technology
The research question derived from the above GQM is:
RQ How to design a mobile AR interface that obtains data from online sources,and allows the user to visualize them, and to interact with them?
The overall aim is to gain insights on designing a mobile AR interface that visualizesonline data and lets users interact with them.
The developed prototype was deployed in a user study, and was evaluated by test-ing two hypotheses:
H1 Using the prototype visualization will encourage people to explore the data.
5(Basili, 1992) explains that the GQM paradigm “was initially created to evaluate defects for a setof projects in the NASA/GSFC environment but later on it has been expanded to a larger context.”

Chapter 1. Introduction 4
H2 Using the prototype interface to create reminders will affect the people’s dailyschedule and behaviour.
In order to support or reject each of the two hypotheses, system logs as well as theparticipants study diaries were considered.
1.4 Thesis Outline
The thesis is structured as follows: Chapter 1 provides the motivation for the thesis,together with the research question and hypotheses that lead the development ofthe mobile AR application for visualizing and interacting with online data. Chapter2 presents related work in the field of AR, including both a literature review anddescription of previous work by the author. Chapter 3 discusses the methodologythat was used, both in terms of the technical development, as well as the way testingand the user study was conducted.
Chapter 4 presents the prototype design. In addition, the server and database im-plementations of the prototype are discussed, the overall user interaction with theprototype is presented through an activity diagram. . The user study is presentedin Chapter 5. Chapter 6 presents the results and analysis of the collected data fromuser study. Finally, Chapter 7 includes the discussion and conclusions regardingthe findings from Chapter 6. Moreover this chapter also discusses the limitations,lessons learned, and the future work.
5
Chapter 2
Related Work
2.1 Literature Review
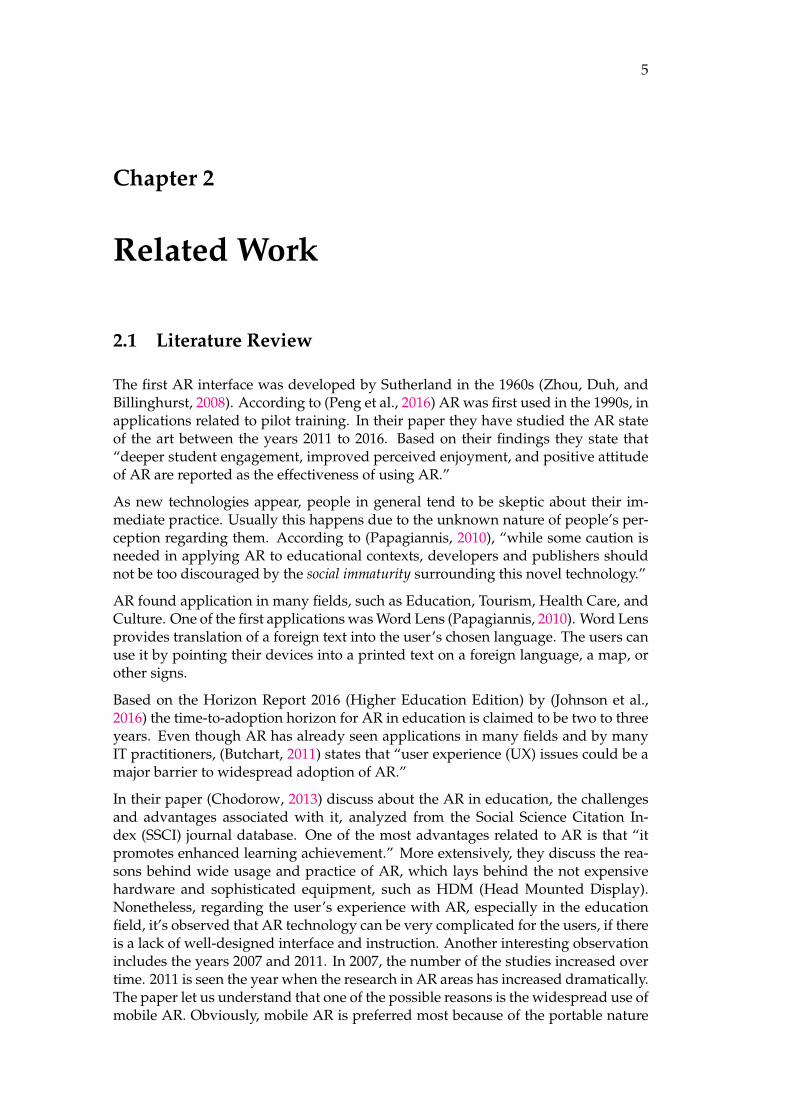
The first AR interface was developed by Sutherland in the 1960s (Zhou, Duh, andBillinghurst, 2008). According to (Peng et al., 2016) AR was first used in the 1990s, inapplications related to pilot training. In their paper they have studied the AR stateof the art between the years 2011 to 2016. Based on their findings they state that“deeper student engagement, improved perceived enjoyment, and positive attitudeof AR are reported as the effectiveness of using AR.”
As new technologies appear, people in general tend to be skeptic about their im-mediate practice. Usually this happens due to the unknown nature of people’s per-ception regarding them. According to (Papagiannis, 2010), “while some caution isneeded in applying AR to educational contexts, developers and publishers shouldnot be too discouraged by the social immaturity surrounding this novel technology.”
AR found application in many fields, such as Education, Tourism, Health Care, andCulture. One of the first applications was Word Lens (Papagiannis, 2010). Word Lensprovides translation of a foreign text into the user’s chosen language. The users canuse it by pointing their devices into a printed text on a foreign language, a map, orother signs.
Based on the Horizon Report 2016 (Higher Education Edition) by (Johnson et al.,2016) the time-to-adoption horizon for AR in education is claimed to be two to threeyears. Even though AR has already seen applications in many fields and by manyIT practitioners, (Butchart, 2011) states that “user experience (UX) issues could be amajor barrier to widespread adoption of AR.”
In their paper (Chodorow, 2013) discuss about the AR in education, the challengesand advantages associated with it, analyzed from the Social Science Citation In-dex (SSCI) journal database. One of the most advantages related to AR is that “itpromotes enhanced learning achievement.” More extensively, they discuss the rea-sons behind wide usage and practice of AR, which lays behind the not expensivehardware and sophisticated equipment, such as HDM (Head Mounted Display).Nonetheless, regarding the user’s experience with AR, especially in the educationfield, it’s observed that AR technology can be very complicated for the users, if thereis a lack of well-designed interface and instruction. Another interesting observationincludes the years 2007 and 2011. In 2007, the number of the studies increased overtime. 2011 is seen the year when the research in AR areas has increased dramatically.The paper let us understand that one of the possible reasons is the widespread use ofmobile AR. Obviously, mobile AR is preferred most because of the portable nature

Chapter 2. Related Work 6
and easiness to use, compared with HMDs. Throughout analysis on the SSCI journaldatabase, under the educational field, the AR technology fostered greater interac-tion between the students. On the other side, the findings show that a challenge forAR technology is the difficulty to use. This is why it is suggested a well-designedinterface for AR technologies, because they lighten the burden of the novelty thatcharacterizes it. These recommendations are crucial to consider, in order to succeedin the aim of creating an AR product that would foster usability and engagement.
Another application of AR is seen in the Health Care by Rajiv Mongia, director of theIntel RealSense Interaction Design Group. Mongia and his team have developed awearable prototype to help people with low or no vision gain a better sense of theirsurroundings (Kaplan, 2015). The technology augments reality with the combina-tion of camera, computer vision and sensors. These technologies are worn on thebody of a person and can help him/her become aware of the surroundings.
A bright example of the practice and usage of AR is D47, a restaurant, museum, anddesign travel store, showcases the best of each region in Japan (Papagiannis, 2015).In addition, D47 includes storytelling on the showcases. This approach adds valueto user’s experience.
Moreover, an extensive interest nowadays is giving “life” to the static objects onthe environment. Applications of AR in tourism have also helped travellers get in-formed about places, nearby local stores, restaurants, etc. This can become alivethrough the 3D object models in AR. Instead of reading the historical notes on themuseums or other paper works, with the help of AR the surroundings can cometo live in a novel and interesting way. According to (Chang et al., 2015), “visitorsperceive AR guidance activities as interesting, fun, challenging, and a method ofachieving first-hand experience.”
Visualization is crucial in AR because it conveys information and encourages inter-action. Based on the paper of (Olshannikova et al., 2015) "one of the more promisingmethods for improving upon current Big Data visualization techniques is in its cor-relation with Augmented Reality (AR) and Virtual Reality (VR) that are suitable forthe limited perception capabilities of humans". For this reason it is important touse data visualization wisely in the context of AR and vice versa, to know how thecapabilities of AR could be applied to the field of Data Visualization.
In regard to education, (Wu et al., 2013) state that "AR systems could support learn-ers in visualizing abstract science concepts or unobservable phenomena, such asairflow or magnetic fields, by using virtual objects including molecules, vectors,and symbols". As a result, the augmented objects create visualizations that can en-hance students’ understanding of abstract and invisible phenomena. According to(Olshannikova, Ometov, and Koucheryavy, 2014)"any visualization method can beclassified in all three parameters, thus by type of processing data, visual images thatit can provide, and the ability to interact with visual images" . Meanwhile, the data,graphical objects and interaction techniques should be taken in consideration in or-der to foster greater user interaction and experience.
Based on the paper of (Teyseyre and Campo, 2008) "the inclusion of aestheticallyappealing elements such as 3D graphics and animation can greatly increase the de-sign’s appeal, intuitiveness, and memorability of a visualization" . Besides the factthat 3D visual representation can enhance the user perception, it has some draw-backs too, such as the user adaptability. Users are mostly used to 2D graphical repre-sentations and the interaction with the 3D visualizations requires higher adaptation

Chapter 2. Related Work 7
efforts. In addition, in the paper it is discussed the fact that navigation in 3D spacescan be difficult, and even simple tasks can be problematic. To oppose the drawbacks,simpler interfaces with less complex tasks are proposed.
There are two ways to develop and use AR applications; one involves programmingskills , but it could also be approached without any programming at all. The POI Au-thoring and Publishing tools are discussed on a section of the report by (Butchart,2011). Some of the most known include: Junaio Channel Creator1, Wikitude.me POIpublisher, Layar Test Web Page2, Layar 3d model publisher3, Hoppala Augmenta-tion4, etc. These tools enable the creation of AR channels very easily based on thepurposes of users or developers. These non-programming tools are diversified andeasy to use, but they also encompass limitations. Usually the limitation includes notbeing easy to adjust, reshape, or fit for some specific practice.
2.2 The Previous AR Cube Prototype
There are many ways to use mobile AR, but for the purposes of the thesis the focuswas on creating a prototype within the Unity 3D game engine with C# programminglanguage (to design and develop the visualization), and the Vuforia SDK for Unity(for creating the AR app). In this section is briefly described the previous prototype,which served as foundation to the newly created prototype for the purpose of thethesis project. AR Cube was partially based on the design, development and tech-nical validation of a previous AR prototype (on Figure 2.1) during the “AdvancedTopics in Media Technology” course in the “Social Media and Web Technologies”master programme.
FIGURE 2.1: The previous AR Cube prototype implemented duringthe mini-thesis course on the scope of the Social Media and Web Tech-
nologies master programme. The use case included weather data.
The “AR Cube” prototype (see Figure 2.1) was used to explore the AR design ofhaving an interface shaped like a cube, floating above an AR marker, that the usercould rotate (by swiping gestures on the phone screen) along the horizontal or verti-cal axis. Each face of the cube included information, in this case the weather forecastof a specific day. By rotating the cube horizontally, the user can move in a linear and
1http://opus.bath.ac.uk/34847/1/AR_Smartphone_final.pdf2http://opus.bath.ac.uk/34847/1/AR_Smartphone_final.pdf3https://www.layar.com/4http://www.hoppala-agency.com/

Chapter 2. Related Work 8
sequential manner back and forth through the days. The system was intended5 toretrieve the current weather information based on the day. On a specific day (dis-played on the front facing side of the cube), the user can rotate the cube vertically andspecify if they “like”6 or “dislike”7 that day’s weather conditions. Besides recordingthe specific user’s preferences, the interface was also additionally meant to indicatethe “consensus” based on all the user preferences for each day. The generic intentionof the cube interface was to allow users to move linearly through a sequence of data(retrieved online, in that case the weather forecast), interact (in that case express-ing either a like or dislike), and also have indirect interactions (in that case see theconsensus of the weather preferences, that they also participate in).
That prototype was tested and shown to be functional and also understood by theusers. Furthermore it allowed to explore different technologies for developing anAR app, and informed the design of the more extended thesis prototype.
5At that phase the weather data presented through the prototype were static as the main goal wasthe technical validation of the prototype.
6Swipe gesture downwards, cube rotates vertically to (upper) side that displays a “like” icon andthen resets, front cube side (with weather information) turns green.
7Swipe gesture upwards, cube rotates vertically to (bottom) side that displays a “dislike” icon andthen resets, front cube side (with weather information) turns red.

9
Chapter 3
Methodology
Software development is a complex field that requires attention, especially in therecent fast pace environment. According to (Cohen, Lindvall, and Costa, 2003),"these so-called Agile Methods are creating a buzz in the software developmentcommunity". Agile Methods are a reaction to traditional ways of developing soft-ware and acknowledge the ”need for an alternative to documentation driven, heavy-weight software development processes” (Beck et al., 2001). In order to ensure flex-ibility, adaptability and iterative development, it was decided to follow the itera-tive/incremental approach of agile software development. The development of theprototype included many iterations until the final release. That was to ensure properfunctionality and UI design, especially when developing in a novel field such as AR.Developing software in an agile way allows developers to rapidly respond to chang-ing requirements.
"An iterative life cycle model does not attempt to start with a full specification ofrequirements. Instead, development begins by specifying and implementing justpart of the software, which can then be reviewed in order to identify further re-quirements. This process is then repeated, producing a new version of the softwarefor each cycle of the model"1. For an incremental model the whole requirement isdivided into various builds2. Cycles are divided up into smaller, more easily man-aged modules. Figure 3.1 is a graphical representation of the iterative cycles for theprototype development3.
The incremental and iterative development approach implies an agile model thatgrows with time. In the beginning, work is accomplished based on the initial idea ofthe prototype and main requirements. Afterwards, the rest of the features are added.More concretely for this prototype purpose, first the client-side implementation wasdesigned in many iterative steps, and then the database structure on the server-sidewas implemented . In this way the prototype was created incrementally followingthe iterative approach, and it was useful as it allowed to efficiently address any is-sues in subsequent iterations.
1Iterative model: http://istqbexamcertification.com/what-is-iterative-model-advantages-disadvantages-and-when-to-use-it/
2Incremental model: http://istqbexamcertification.com/what-is-incremental-model-advantages-disadvantages-and-when-to-use-it/
3Figure from https://www.projectsmart.co.uk/which-life-cycle-is-best-for-your-project.php

Chapter 3. Methodology 10
FIGURE 3.1: Iterative/Incremental software development approachof the research study. A representative model that was used to de-
velop the final prototype.
3.1 System Development
To answer the research question, and based on the previous experience (see subsec-tion 2.2), a prototype was developed that includes both a front-end (a mobile AR appclient) and a back-end (a database server). The prototype is described in Chapter 4and was created using the Unity Game Development Engine (see subsection D.1),the Vuforia SDK for Unity (see subsection D.2), Node.js (see subsection D.3), andMongoDb (see subsection D.4). The prototype is cross-platform, available for bothAndroid and iOS users. The created prototype is marker based. A chosen test casefor the user study includes menu options from the Campus restaurant.
3.2 User Study
In order to test the two hypotheses, the app was deployed to the mobile devices ofa number of participants and a user study was conducted. The context of the studywas providing an interface that allowed the users to make menu food choices, for acampus restaurant. For each date, the different options were presented, and makinga choice would create a Google Calendar event. The participants were provided withthe app, and were instructed to make use of it for two weeks. The study is presentedin detail on Chapter 5.

Chapter 3. Methodology 11
3.2.1 Testing
Prior to the user study, the prototype was tested to ensure proper functionality, andto make sure there would not be any technical issues during the study. A test user(not a participant of the user study) was guided through the different features of theapp (see Appendix A). System logs, both on the phone and on the server, were alsochecked to make sure the system operated as expected.
3.2.2 Data Collection
A number of quantitative and qualitative data were collected from the user study.These included demographic information from the participants (see Appendix B),weekly diaries (see Appendix C), system logs from the participants’ phones and theserver, and an interview after the study.
The phone logs were used to test hypothesis H1, by analyzing the phone logs to seehow active the users were (how much did they use the app to explore the differentmenu options available, how many calendar events they created). A cross-reference(for matches and mismatches) of the system logs and the participants diaries wasused to test hypothesis H2, by analyzing whether making a calendar event was fol-lowed through by the participants, or if they ate at the restaurant without previouslyplanning to (via the app).

12
Chapter 4
Prototype
4.1 Prototype Design
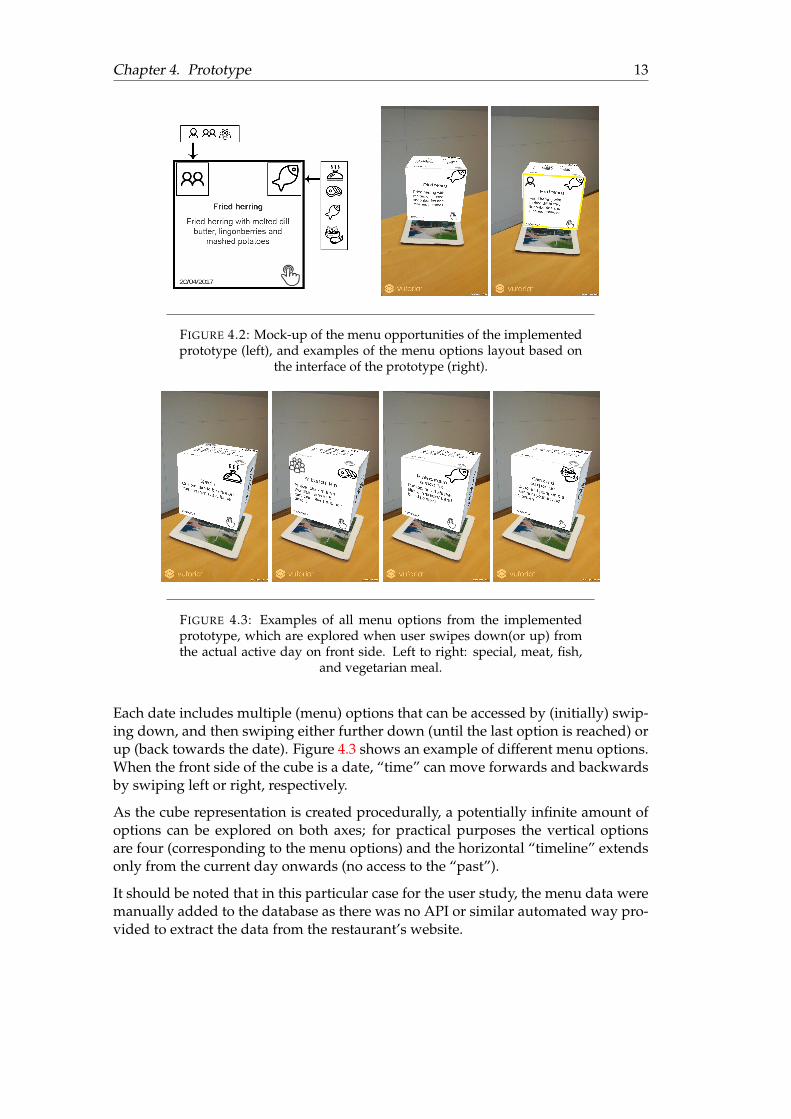
The developed prototype is shown in Figure 4.1 (left). Similar to the previous pro-totype (see subsection 2.2), the interface is a cube. The front side (initially) displaysa date which the user can navigate by swiping right or left (going forwards or back-wards in time). In contrast to the previous prototype, swiping vertically providesmultiple options, each displayed on a different cube side, and any of these optionsneeds to be additionally tapped to be chosen. In Figure 4.1 (right) the AR markerused is shown; it is a photo of the campus restaurant, and relevant to the context ofthe user study.
Figure 4.2 shows the layout of the menu options. The menu type (special, meat,fish, or vegetarian), along with a description (taken from the restaurant menu) ispresented in the center. Additionally, an icon representing the menu type is shownin the upper right corner. The date is shown in the lower left corner, and an icon toremind the users that they need to tap in order to create a calendar event is shown inthe lower right corner. An icon on the upper left corner indicates how popular thischoice is; based on the small number of participants for the current user study, thelevels were simply defined as one, two, or many (more than two). Once a choice ismade, the frame around that cube side becomes highlighted in yellow, and an eventis created in the user’s Google Calendar with the details of the menu.
FIGURE 4.1: The AR prototype cube interface (left), and AR markerused to load the prototype (right). AR marker is the picture of the
campus restaurant.
Chapter 4. Prototype 13
FIGURE 4.2: Mock-up of the menu opportunities of the implementedprototype (left), and examples of the menu options layout based on
the interface of the prototype (right).
FIGURE 4.3: Examples of all menu options from the implementedprototype, which are explored when user swipes down(or up) fromthe actual active day on front side. Left to right: special, meat, fish,
and vegetarian meal.
Each date includes multiple (menu) options that can be accessed by (initially) swip-ing down, and then swiping either further down (until the last option is reached) orup (back towards the date). Figure 4.3 shows an example of different menu options.When the front side of the cube is a date, “time” can move forwards and backwardsby swiping left or right, respectively.
As the cube representation is created procedurally, a potentially infinite amount ofoptions can be explored on both axes; for practical purposes the vertical optionsare four (corresponding to the menu options) and the horizontal “timeline” extendsonly from the current day onwards (no access to the “past”).
It should be noted that in this particular case for the user study, the menu data weremanually added to the database as there was no API or similar automated way pro-vided to extract the data from the restaurant’s website.

Chapter 4. Prototype 14
FIGURE 4.4: System architecture of the implemented prototype. Agraphical representation of the client- and server-side implemen-tation and the integration with Google Calendar API to create re-
minders for the users.
4.2 Server and Database Implementation
In order to provide and store the data for the AR visualization, a NodeJS server wasimplemented connected to a MogoDB database. MongoDB offers a rich set of query-ing options such as create-read-update-delete (CRUD) (Kyle, 2011) and providesdocument-oriented data storage in JSON format. Node.js is a lightweight server-sideimplementation of JavaScript that is considered “perfect for data-intensive real-timeapplications that run across distributed devices” (Cantelon et al., 2014).
In addition, the built-in HTTP server library of Node.js provides independence ofexternal services. In this way the data can be offered to external services via a REST-ful API (Cantelon et al., 2014). In 2000, representational state transfer (REST) wasintroduced by Roy Fielding1, one of the prominent contributors to the HTTP 1.0 and1.1 specifications (Cantelon et al., 2014).
Figure 4.4 provides an overview of the overall system architecture of the imple-mented prototype. For the prototype implementation was used NodeJS in version4.5.0, MongoDB in version 3.2.9 and Unity 5.4.0 (64-bit). The source code was writ-ten using IntelliJ IDEA in version 2016.2.5. These technologies were familiar becauseof previous work (see subsection 2.2).
4.2.1 Query Data From MongoDB and Google Calendar API
The database was structured through the JSON schema, in order to present prop-erly the different options from the scenario. In addition, the JSON schema was veryhelpful when creating the RESTful APIs for sending data to the client-side and per-forming CRUD operations based on the specific actions.
The database is initially queried to fetch the data. Then the data are processedthrough different routes (pertaining CRUD operations). RESTful APIs played a cru-cial role on the overall implementation due to the many requests continuously sentclient-side.
Another crucial connection is with the Google Calendar API. The Google CalendarAPI enables the integration of the Google Calendar with the application. This exter-nal service was meant to allow further possibilities for the users to interact with theAR interface and create events based on the explored data. The event handling be-tween NodeJS and Google Calendar API was implemented using RESTful APIs. The
1http://www.ics.uci.edu/~fielding/pubs/dissertation/top.htm.

Chapter 4. Prototype 15
FIGURE 4.5: Server and database implementation of the prototype.More in depth graphical representation of the prototype functionality
and methods used to connect the client and server side.
implementation offers options to list events from the user’s Google Calendar, createnew events, and also delete events. The list, creation, and deletion of the events wasexecuted on top of the user’s primary (default) Google Calendar. Each event createdhas a unique Id therefore the calendarID parameter was used for the ‘primary’value. If another calendar was needed to be used instead, the parameter could beconfigured to the contain that specific calendarID.
The authentication in Google Calendar API is done through the OAuth 2.0 autho-rization protocol. The authorization flow for the created prototype was done throughthe CLI (command-line interface). Prior to the user study, there was a meet-up ses-sion with participants in order to configure the authorization to each of their GoogleCalendars. This needed to be done once. An issue encountered during the autho-rization process with Google Calendar API was the token expiration time, whichwas 1 hour. It featured a great implication for the study because the user studieswere planned to run in a period of two weeks. Finally through consultation of differ-ent sources online, adding an approval for refresh token, like approval_prompt:’force’ created automatically a refresh token and fixed the problem. Afterwards,there was not a need for the users to authorize every time the token expires.
On the other hand, the client-side implementation was done through Unity. Unityreceives the data through UnityWebRequest, a method within Unity that enablesit to interact with web browser back-ends. UnityWebRequest provides a modularsystem for composing HTTP requests and handling HTTP responses.2
The data exchange between Unity client-side and server-side were implementedthrough the help of the Coroutine, class in UnityEngine and the IEnumeratorfunction. A coroutine3 “is a function that can suspend its execution (yield) until thegiven given YieldInstruction finishes.” From the Unity documentation online,the IEnumerator4 allows the program to yield functions like the WaitForSeconds
2https://docs.unity3d.com/Manual/UnityWebRequest.html3https://docs.unity3d.com/ScriptReference/Coroutine.html4https://docs.unity3d.com/ScriptReference/MonoBehaviour.StartCoroutine.
html
Chapter 4. Prototype 16
(part of YeildInstruction class), which makes the script wait and resume whenthe yield condition is met. Through the IEnumerator functionName() weresaved the users’ data on the database and also were recorded the created/cancelledchoice of the menus through the prototype. Another important method is WWW, aUnityEngine class. This class is used to retrieve contents of URLs or send GETand POST requests to the server.
In regard to the prototype interaction, it was used TouchKit5, a solution for Unitythat facilitates the touch process and serves as a gesture recognizer tool. The toolmethods were used to recognize the tap, which was used to create/cancel a menuwithin the prototype menu options. In addition the tool served the purpose to iden-tify between the different touches, in this case between a swipe left, swipe right,swipe down and swipe up.
Figure 4.5 provides an overview of the server and database implementation andtheir connection with the Google Calendar API.
4.2.2 Activity Diagram
Figure 4.6 presents the overall user interaction with the prototype through the ac-tivity diagram. The diagram shows the entire process, taking into consideration thefact that the user has been previously registered in the application.
The whole process starts with users logging in with their user name and password.Afterwards, they scan the marker with their phone camera in order to load the ARcube. On load the cube shows today’s day on front and all the respecting data areloaded based on server request (see example in Figure 4.1). Users have the optionsto scroll the cube horizontally or vertically. By swiping horizontally the users cannavigate the days of the week. Afterwards the user has two options: to close the appor to explore the menus of a specific day. By swiping vertically the user has the op-portunity to explore the menu options provided on the cube. By using a tap gesture,the users can choose a specific menu (see Figure 4.2 right), which will be insertedon the database and an event will be created on their primary Google Calendar. Asa consequence of that, they will receive a reminder from Google Calendar, on thespecific day, with the details of the specific menu. Tapping an already chosen optionresults on cancellation. When a menu option is canceled, it gets removed from boththe database and the Google Calendar of the user. It is not possible to choose twodifferent options for the same day, and it is also not possible to navigate and makechoices for previous days.
4.3 User scenario
Personas: Pia, Henry and Zara.
User group: Students, frequenting the campus restaurant, technology enthusiasts.
Background: Pia, Henry and Zara are Computer science students. Pia is a PhD stu-dent and Henry and Zara are master students. All three of them are interested in
5https://github.com/prime31/TouchKit

Chapter 4. Prototype 17
novel technologies such as AR. They have read about AR but did not have an op-portunity to use themselves any AR applications. Pia has an iPhone, and Henry andZara have Android mobile phones. All of them usually eat at the campus restaurant.They were presented with the AR Cube mobile app and they are interested to try itout in a longitudinal user study. Moreover, their interest is in the experience of theAR app regarding a routines they perform every day.
Scenario 1: Pia Scenario 1: Henry Scenario 1: Zara
The AR Cube app is installedin Pia’s phone.
The AR Cube app is installedin Henry’s phone.
The AR Cube app is installedin Zara’s phone.
The AR Cube functionality ispresented to the users. More-over, usage instructions aredelivered and markers are dis-tributed.
The AR Cube functionality ispresented to the users. More-over, usage instructions aredelivered and markers are dis-tributed.
The AR Cube functionality ispresented to the users. More-over, usage instructions aredelivered and markers are dis-tributed.
Pia is an organized person.She likes to arrange the wholeweek menu options from thebeginning of the week.
Henry usually leaves every-thing to the last minute. Heprefers more to explore theapp every day and decideabout the menu options thenight before.
Zara likes to explore a lot thefood options. She also likesto get recommendations fromfriends about food choices.
Pia opens the AR Cube appfrom her device and starts toexplore the data.
Henry opens the AR Cube appfrom his device and starts toexplore the data.
Zara opens the AR Cube appfrom her device and starts toexplore the data.
Pia gives her login credentialsand scans the marker to loadthe AR Cube.
Henry gives his login creden-tials and scans the marker toload the AR Cube.
Zara gives her login creden-tials and scans the marker toload the AR Cube.
She swipes left and right to ex-plore the different days of theweek.
He swipes left and right to ex-plore the different days of theweek.
She swipes left and right to ex-plore the different days of theweek.
She swipes down and up toexplore the menu available ineach day. She chooses to eatthe special menu on Mondayand Wednesday, meat menuon Tuesday; fish menu onThursday and veggie menu onFriday.
Henry swipes down and up tosee the different menu optionsoffered for a specific day. Hechooses to eat meat menu forTuesday.
She swipes down and up toexplore the different menu op-tions of each day. Whatshe likes more is the popular-ity icon shown on the upper-left part of the menu option.The menu popularity helpsher make better choices. Shesees that Tuesday already has2 people choosing meat, soshe chooses it too for Tues-day. Then she decides to tryout veggie menu on Wednes-day and fish menu on Friday.
Pia sees that all her choices arenow shown in her Google Cal-endar. She likes the fact thatshe will be reminded abouther menu options.
Henry confirms that all hismenu choices are shown in hisGoogle Calendar. Usually, hedoesn’t like to get remindedabout his daily routine.
Zara’s menu choices are regis-tered in her Google Calendar.
Pia closes the AR Cube app. Henry closes the AR Cubeapp.
Zara closes the AR Cube app.

Chapter 4. Prototype 18
FIGURE 4.6: Activity diagram as a graphical representation of thepossible user interactions with the prototype. Clearly can be noticedthe dual create/remove functions on the database and Google Calen-
dar side.

19
Chapter 5
User study
5.1 User Study Setting
A longitudinal (lasting two weeks) user study was conducted with five participants(3 female, 2 male). The participants were provided with AR markers (see Figure 4.1,right) and the AR app installed in their mobile phones (3 iOS, 2 Android). They wereintroduced to the functionality of the prototype (see section 4.1) and they were askedto make use of it in the context of them eating at the university campus restaurant.
The choice of the particular task for the user study scenario was motivated by con-sidering something practical and useful for the participants. All participants werefamiliar with, and usually ate at that restaurant. The restaurant is open to both uni-versity students and staff, and offers four different menu choices for lunch each day:a meat dish, a fish dish, a vegetarian dish, and a special meal-of-the-day dish. Figure5.1 shows an example of the weekly menu from the restaurant’s website.
FIGURE 5.1: Example of the weekly menu (meat, fish, vegetarian)from the campus restaurant website. The special option is not shown.
The prototype was designed to present two dimensional information, on horizontaland vertical axis, dependent on each other. The horizontal axis include the days ofthe week and it was designed to support infinite scrolling. The vertical axis showsthe menu options from campus restaurant, specific to the day on the horizontal axis.
Overall, the user study was conducted with multiple participants. The first phaseincludes one-to-one sessions. Since they were also using different operating systemson their devices the private sessions were an obvious study decision. Moreover, thenovel nature of the topic required delicate and dedicated approach. Throughoutthe session the participants were presented with the AR Cube and were done sometesting in order to assure for the proper functionality. In addition, the devices were

Chapter 5. User study 20
checked if logs were created. Logs play a crucial role on data collection about theuser interaction with the prototype. There were two phases of the research study.The testing phase and the actual data collection phase.
5.1.1 Testing
Testing was done with one user (not one of the participants), following the protocolin Appendix A and also notes with comments were taken. The main goal with thetesting was to examine the prototype functionality and overall performance beforethe user study took place, and served as validation. The goal was to obtain as muchinformation as possible regarding the functionality of the designed prototype andfix in time if there are any major flaws.
5.1.2 Data collection
Data encompass an important aspect of a research. The thesis research encompassesmixed methodology approach. For the research purpose were implemented quanti-tative and qualitative methods for data collection.
Initially, before the actual user study, questionnaires were distributed to the partici-pants. The questionnaire (see in Appendix B) was meant to collect demographic in-formation, their knowledge and previous experience with AR. Moreover, they wereasked for the frequency of visiting the campus restaurant. Finally, participants wereasked whether they want to get reminded about their daily routine. Based on results60% of the participants were familiar with AR. 40% of them mentioned that theyeat often at the campus restaurant, 20% sometimes, and 40% rarely. Regarding theirdaily routines, 60% responded that they would like to receive reminders.
Logs represent another methof of data collection. Users were informed that the ap-plication will collect phone logs from the file system and also server logs on theserver-side. Phone logs follow the “action-object-target-details” approach to trackthe user interaction. The phone logs provide information about the time, navigation(swipe left, right, up, or down), and making a choice or cancellation (tap). The serverwas keeping logs of the overall activity of the database (when choices and calendarevents were created or canceled).
Another form of data collection encompass the weekly diaries. Additional self-reporting data were collected from the participants at the end of each week, regard-ing their activity during the week, using the questionnaire in Appendix C.
At the end of the study an interview regarding the overall experience was also con-ducted. The final interview was also performed individually with all the partici-pants. They were asked about their general experience with the application; whatwas the difference between checking the campus restaurant website for menus anddoing the same with the app (plus the Google Calendar integration); and whetherthey would prefer to use the app afterwards. The results from the interview arepresented on Chapter 6.

Chapter 5. User study 21
5.2 Summary
The developed AR Cube app was deployed on the mobile devices of five partici-pants, and a user study was conducted for a period of two weeks. Methodologicallya didactic approach was used, as the prototype design was first developed and thenpresented to the participants. There were two phases: a testing phase which was per-formed before and independently to the user study, and the longitudinal user study.The testing phase identified a number of issues and helped to considerably improvethe prototype logic and UX for the user study. Demographic data about the par-ticipants were gathered through a questionnaire. In addition to demographic data,users were asked also about their familiarity with AR technologies and about theirbehaviour towards daily routine events and reminders. Data collection includedsystem logs (phone logs and server-side logs). The phone logs were collected fromthe user’s mobile devices at the end of the user study period. Another data collec-tion method that helped gain insights about the study (and also verify the systemlogs), were the weekly diaries that users completed at at the end of each week. Fi-nally, individual interviews were conducted with each participant at the end of theuser study, for the purpose of obtaining first-hand comments and opinions about theentire study.
22
Chapter 6
Results and Analysis
Even though the user study was planned to run for two weeks (10 working days),there was an interruption due to the Easter holiday weekend that affected the results(restaurant was closed on Good Friday and Easter Monday). This interruption wasknown beforehand but the user study could not be shifted at a later stage becausethere were milestones put beforehand and a hard deadline for the thesis documenta-tion submission that needed to be respected. Another technical issue occurred at thestart of the second week, and affected the iOS users. Fortunately this was addressedimmediately and no potential data or interactions were lost.
6.1 Testing
Testing was conducted with a single user, following the protocol in Appendix A, andno issues were detected. Additional comments regarding functionality and designincluded: using a lighter color for the cube, showing more information about themenu choices, disable allowing to make choice on previous dates, and changing thedate format to long-date. These were addressed prior to the study.
6.2 Weekly Diaries
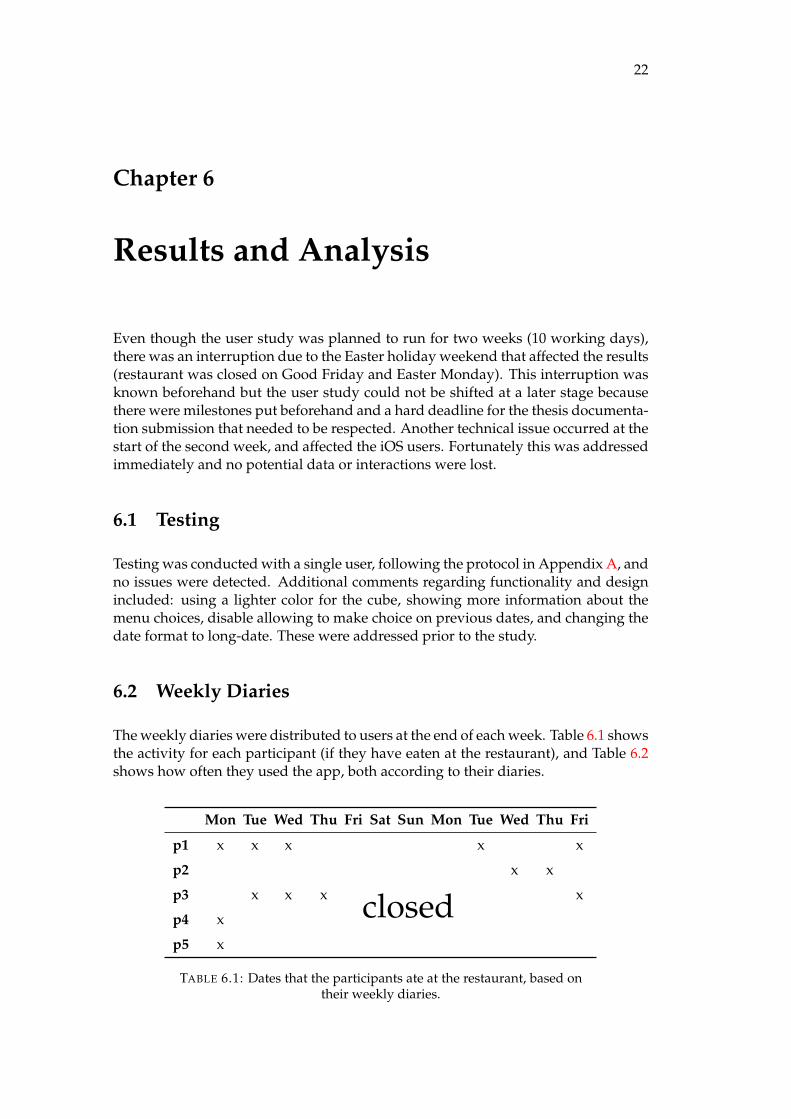
The weekly diaries were distributed to users at the end of each week. Table 6.1 showsthe activity for each participant (if they have eaten at the restaurant), and Table 6.2shows how often they used the app, both according to their diaries.
Mon Tue Wed Thu Fri Sat Sun Mon Tue Wed Thu Fri
p1 x x x x x
p2 x x
p3 x x x x
p4 x
p5 x
closed
TABLE 6.1: Dates that the participants ate at the restaurant, based ontheir weekly diaries.

Chapter 6. Results and Analysis 23
First week Second week
p1 every day three days
p2 two days two days
p3 three days once
p4 two days once
p5 two days two days
TABLE 6.2: How often participants used the app, based on theirweekly diaries.
During first week the results from the weekly diaries showed that users got engageda lot with the prototype, two or more days of the week. Besides exploring the menu,it was also used to create calendar events on eight occasions.
Compared to the first week, the participants during the second week used the appless often, but also ate less often at the restaurant.
The wear-off of the novelty effect was to be expected, but it is also worth noting thedisruption of the regular schedule due to the holidays.
The participants did appreciate the Google Calendar integration, and additionallythey noted that:
• It is fun to use / It is really useful / Easy to use• I quite like interacting with a cube / It’s cool to scroll it back and forth• Cool to see popularity of a menu• Not so convenient to log every time• Sometimes it gets stuck and needs some time to come to its senses• It would be better to have a picture of the food menu• It would be good to show more error messages
6.3 System Logs
The (subjective, self-reported) data from the participant diaries were compared andcross-referenced with the (objective) data from the participant phone logs, to form amore complete picture of the participants activity.
Table 6.3 shows the system logs of the participants’ overall activity over the twoweeks of the user study, and Table 6.4 focuses on the choices and cancellations.
As noted from the diary data too, the participants were more active during the initialdays, and experimented more with creating and cancelling different menu options.During the later days, more confident patterns of app use are seen (e.g. participantsp1 and p2 would browse the menu and make a single choice). In contrast, the otherthree participants would spend a lot of time navigating the menu, making manychoices but also cancelling them.
Table 6.5 presents the overall activity of the users, also including the choices andcancellations. Participant p1 was the most consistent when it comes to number of
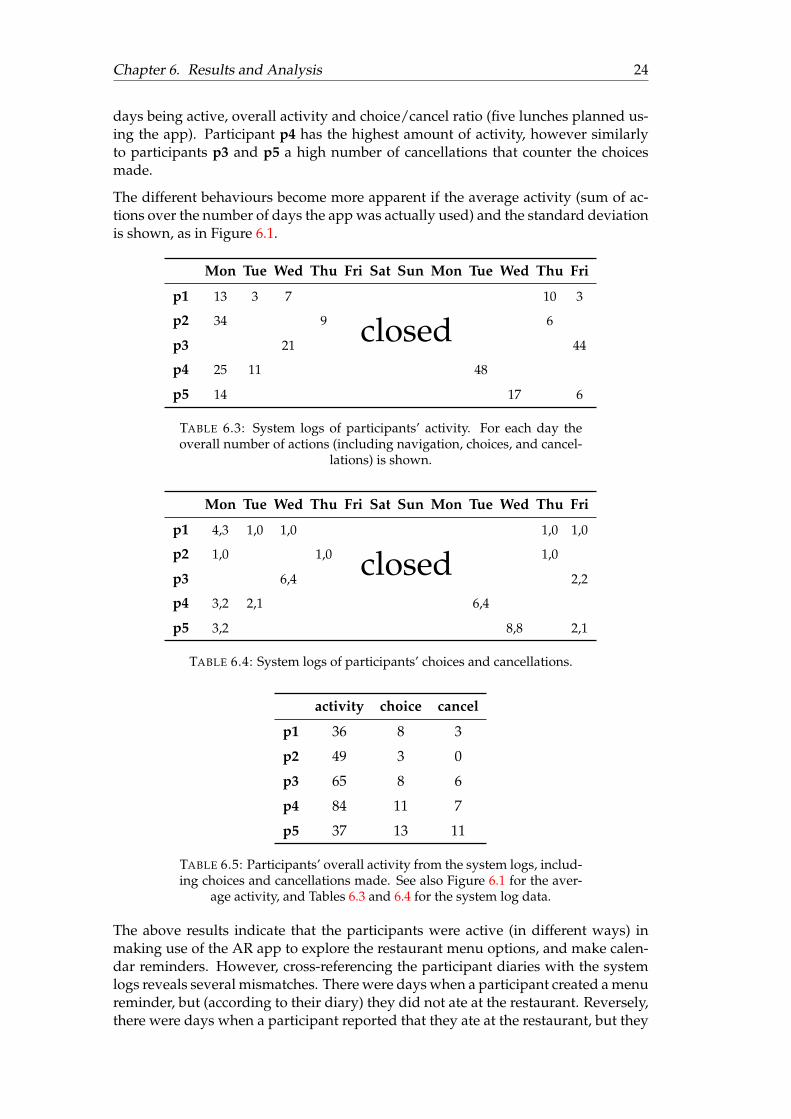
Chapter 6. Results and Analysis 24
days being active, overall activity and choice/cancel ratio (five lunches planned us-ing the app). Participant p4 has the highest amount of activity, however similarlyto participants p3 and p5 a high number of cancellations that counter the choicesmade.
The different behaviours become more apparent if the average activity (sum of ac-tions over the number of days the app was actually used) and the standard deviationis shown, as in Figure 6.1.
Mon Tue Wed Thu Fri Sat Sun Mon Tue Wed Thu Fri
p1 13 3 7
closed10 3
p2 34 9 6
p3 21 44
p4 25 11 48
p5 14 17 6
TABLE 6.3: System logs of participants’ activity. For each day theoverall number of actions (including navigation, choices, and cancel-
lations) is shown.
Mon Tue Wed Thu Fri Sat Sun Mon Tue Wed Thu Fri
p1 4,3 1,0 1,0
closed1,0 1,0
p2 1,0 1,0 1,0
p3 6,4 2,2
p4 3,2 2,1 6,4
p5 3,2 8,8 2,1
TABLE 6.4: System logs of participants’ choices and cancellations.
activity choice cancel
p1 36 8 3
p2 49 3 0
p3 65 8 6
p4 84 11 7
p5 37 13 11
TABLE 6.5: Participants’ overall activity from the system logs, includ-ing choices and cancellations made. See also Figure 6.1 for the aver-
age activity, and Tables 6.3 and 6.4 for the system log data.
The above results indicate that the participants were active (in different ways) inmaking use of the AR app to explore the restaurant menu options, and make calen-dar reminders. However, cross-referencing the participant diaries with the systemlogs reveals several mismatches. There were days when a participant created a menureminder, but (according to their diary) they did not ate at the restaurant. Reversely,there were days when a participant reported that they ate at the restaurant, but they

Chapter 6. Results and Analysis 25
p1 p2 p3 p4 p5
par
ticip
ant a
ctiv
ity (
aver
age)
010
2030
4050
FIGURE 6.1: Participants’ average activity, with standard deviation.Only the days when each participant used the app were considered.
Mon Tue Wed Thu Fri Sat Sun Mon Tue Wed Thu Fri
p1 m m s ? s? m
p2 m? m? ? m
p3 ? f s ?
p4 m m? m? m?
p5 s
closeds?
TABLE 6.6: Menu options chosen by the participants during the study(m = meat, f = fish, s = special). Question marks indicate mismatchesbetween system logs and diary entries; either, according to their diary,participants did not eat at the restaurant that day (as they planned to),
or they did but without making use of the app.
did not use the app to create a calendar event. Table 6.6 illustrate those matchesand mismatches. Table 6.7 presents the summary of those matches and mismatchesbetween the system logs and participant’s diaries. From the system perspective par-ticipant p1 was the most “consistent”; p2 and p4 used the app, but did not actuallyate lunch at the restaurant; p3 ate a number of times at the restaurant but did not usethe app beforehand.
6.4 Interview
After the completion of the user study, individual interviews were conducted witheach participant. Despite the actual usage, the overall impression was positive. It isworth noting that the participant’s previous ways to be informed about the campusrestaurant menu was either via a website, or on cite (at the restaurant entry). The ARapp compared favourably to this, and they expressed interest to continue using the

Chapter 6. Results and Analysis 26
matchmismatch
diary app
p1 4 1 1
p2 1 1 2
p3 2 2 0
p4 1 0 3
p5 1 0 1
TABLE 6.7: Matches and mismatches between system logs and par-ticipant’s diaries. (See also Table 6.6.)
system if it was made available (besides one participants that stated that he is not asmartphone user in general).
27
Chapter 7
Discussion and Conclusion
This chapter discusses the findings from Chapter 6 and also includes conclusion,limitations, and future work. As identified in Chapter 1, the focus of this researchwas to explore the possible AR systems that allow users to not only visualize, butalso interact and engage with online data, contributing to the overall AR field re-search. AR is a growing field with promising developments predicted for its future.Based on the latest investments in AR technology and the great interest expressedfrom the high profile companies such as Facebook, especially in the latest F8 20171
Facebook Developer Conference, it is certainly an interesting topic for research anddevelopment.
The outcomes of the thesis are a proposed mobile AR system architecture, and animplemented prototype that was validated, tested and evaluated in a small longitu-dinal user study.
7.1 Research Question
The thesis RQ was: How to design a mobile AR interface that obtains data from onlinesources, and allows the user to visualize them, and to interact with them?
To address this, a cross-platform (iOS and Android) mobile AR system was de-signed, using Unity 3D with C# and Vuforia SDK on the client-side and NodeJS andMongoDB on the server side. The AR interface consists of a cube, that visualizes oneach side data obtained from online sources. By rotating the cube horizontally, theuser can navigate the data in a linear sequential manner; by rotating the cube verti-cally, additional data can be explored and also interacted with using taping gestures.This interaction can modify the data on the database server and also trigger exter-nal services (in the use case considered in this thesis, creating or deleting GoogleCalendar events). The cube visualization allows for a creative and intuitive way ofperceiving and interacting with structured data.
The design and technologies used were based on, and expanded on, previous workby the author regarding an earlier version of this mobile AR cube interface proto-type.
The client-server architecture allows the application to be flexible. The compiledmobile app can be deployed, and all data are requested from the server. The serveritself obtains the data from online sources, and also updates the data based on inter-actions from each client. Therefore the user can have access to online data, interact
1https://developers.facebook.com/videos/f8-2017/f8-2017-keynote/
Chapter 7. Discussion and Conclusion 28
with them, retrieve previous interactions – but also create actions based on the data(e.g. calendar events) and indirectly interact with other users (e.g. perceiving thepopularity of a menu choice).
7.2 Hypotheses
In order to evaluate the prototype and test the hypotheses, a user study was con-ducted. It was important to involve a task within a context that was relevant to thepotential users, so that they would be motivated to use the system. It was also im-portant for the study to have some duration, and be longitudinal. The study tookplace and data were collected, but there were some constrains and limitations.
Hypothesis H1 was: Using the prototype visualization will encourage people to explore thedata. In order to test this hypothesis, the participant’s diaries, but more importantlythe system (phone) logs were considered.
Looking at Tables 6.3 and 6.5, as well as Figure 6.1, it can be seen that the partici-pants did use the visualization of AR app to explore the data (menu options), usingdifferent strategies; the exploration was in some cases distributed and in some con-centrated, and to different amounts.
Given the limitations (number of participants, duration of study that was addition-ally disrupted by external factors) and these results, it can be argued that H1 is sup-ported, although further studies are needed.
Hypothesis H2 was: Using the prototype interface to create reminders will affect the peo-ple’s daily schedule and behaviour. As noted from the initial questionnaire to the partic-ipants, most but not all were positive to the idea of receiving reminders. In order totest this hypothesis, a cross-reference of the participant diaries (when they reportedthat they had lunch) with the phone logs (the menu choices that they made, and theresulting calendar events and reminders) were considered.
Looking at the Tables 6.6 and 6.7, it can be seen that there were mismatches for allparticipants. There were days when the participants ate at the restaurant and theyhad previously explored and made a calendar event. But there were days when theparticipants ate at the restaurant without having used the app – perhaps they hadforgotten, or the lunch choice was spontaneous (note that none of the participantsate at the restaurant every single day). There were also days when a calendar eventwas created, but the participants did not eat at the restaurant on that day – therecould be many reasons for this.
In this case, especially given the limitations, H2 can neither be accepted or rejected.Further studies are very much needed, considering both greater sample of partici-pants and duration of the deployment.
7.3 Limitations
Every development and user study comes across a number of constrains and limita-tions. Due to the complexity of this thesis work, there were quite a few.

Chapter 7. Discussion and Conclusion 29
First there were time limitations, both for the development, and the conduction ofthe study. Given the overall time-frame of the thesis course, despite some previouswork, a significant amount of time was spent in development. An early methodolog-ical decision was for the study to be longitudinal; this required additional time forpreparation but also considerations for participant availability. The disruption dueto the Easter holiday was unfortunate but unavoidable, in order to meet the overallschedule.
Secondly there was a small number of participants. Although the campus restau-rant is popular, it was difficult finding participants that were both frequently havinglunch there but also willing to participate (reliably) in a longitudinal study. In ret-rospect, more time in planning should have been considered. An alternative thatwas briefly considered was to not actively recruit participants, but make the appavailable on Google Play or the App Store for a period of time. But that would giveaccess only to server logs (more difficult to analyse, given the unknown number andbehaviour of users) and not allow to cross check if the users actually ate or not at therestaurant (for hypotheses similar to H2).
A combination of time constrains also did not allow for considering other restau-rants or lunch options on campus, which might allow for a bigger and more variedsample of users, but require more preparations.
Another limitation was the fact that the menu data needed to be manually added tothe database, as there was no API or other way to automatically retrieve them fromthe restaurant’s webpage. Related to this, the data availability (the menu options foronly two weeks in advance are posted on the website) affected the duration of thestudy. But in general, given a different context and an API, it is possible to createanother prototype implementation that deals with obtaining the online data in moreautomated ways.
The users’ technical knowledge can also be an issue, although the AR interface israther simple and intuitive, based on the results from the tables 6.1, 6.2 and asclaimed by the participants of the user study on section 6.2. Attitudes towards smartphone use, can be another limiting factor.
7.4 Lessons Learned
Working with novel AR technologies taught me that HCI knowledge is a crucialcomponent when conducting studies that the user is a crucial component. Interfacedesign plays a great role on the user’s perception and how they will interact witha prototype. As this was the first hands-on experience with AR, there were manylessons learned when it comes to AR in general.
In regard to the use case, in future studies it should be considered to distribute ques-tionnaires beforehand to get potential user’s opinions and interest from the veryearly phase. This can greatly affect and increase participant recruitment.
The prototype was developed with Unity 3D with C# and Vuforia SDK on the client-side and NodeJS and MongoDB on the server-side. Although these technologieswere familiar from the previous related work, still new issues appeared on the way.But these additional cases were eventually handled and progress was made.
Chapter 7. Discussion and Conclusion 30
Finally, based on the observation from user study, it was realized that especiallywhen considering relatively novel technologies (for the users), the whole experiencecan be very time consuming. All participants had an IT background and they stillencountered some issues while initially interacting and becoming familiar with thesystem. This needs to be taken in consideration in the future and plan ahead forthe enough time for each participant in order for them to become familiar with thesystem, prior to the study or experiment sessions.
7.5 Future Work
In all work there is always room for improvement and extensions, considering ad-ditional perspectives; especially when involving technologies such as AR.
The prototype was functional and served as a proof-of-concept, but additional tech-nical aspects can be improved, such as: easier authentication log in and additionalintegration with different services. The visualization design can also be further eval-uated for alternative information layouts.
Different use cases could be considered, and further studies with more participantsover potentially a long period of time (depending on the context).
Finally the form factor of a mobile phone or a tablet could be limiting for sure aninterface. An implementation of this concept using a combination of HMD devicesand (computer vision) gesture recognition could be a possibility.

31
Appendix A
Test Protocol

4/25/2017 Test Form
https://docs.google.com/a/student.lnu.se/forms/d/1LujWKpOLwjBdiaQx7GXNbHHPJAaNJisEgrTy11IBcmk/edit 1/3
Test FormThis form is a guide for the initial test in order to assure for the proper functionality of the app, before it is used for the real user studies. In addition, the main intention is to check whether there are bugs or problems in functionality, in order to fix them in time.
*Required
1. SWIPE LEFT three times *Tick all that apply.
Done
Bugs found
2. SWIPE RIGHT three times *Tick all that apply.
Done
Bugs found
3. SWIPE DOWN, to check the first menu option for that day *Tick all that apply.
Done
Bugs found
4. SWIPE DOWN, to check the second menu option for that day *Tick all that apply.
Done
Bugs found
5. SWIPE DOWN, to check the third menu option for that day *Tick all that apply.
Done
Bugs found
6. SWIPE DOWN, to check the fourth menu option for that day *Tick all that apply.
Done
Bugs found

4/25/2017 Test Form
https://docs.google.com/a/student.lnu.se/forms/d/1LujWKpOLwjBdiaQx7GXNbHHPJAaNJisEgrTy11IBcmk/edit 2/3
7. SWIPE UP and go to the first menu option *Tick all that apply.
Done
Bugs found
8. TAP first menu option, to book it and to automatically add an event on the primary GoogleCalendar *Tick all that apply.
Done
Bugs found
9. Check Google Calendar if the event is inserted *Tick all that apply.
Done
Bugs found
10. TAP again the first menu option, to cancel booking and to automatically remove the eventfrom the primary Google Calendar *Mark only one oval.
Done
Bugs found
11. TAP again the first option, to book it and to automatically add an event on the primary GoogleCalendar *Mark only one oval.
Done
Bugs found
12. SWIPE DOWN, to go to the second menu option *Tick all that apply.
Done
Bugs found
13. TAP second menu option, to book it and to automatically add an event on the primary GoogleCalendar *Tick all that apply.
Done
Bugs found
14. Check Google Calendar if the event is inserted *Tick all that apply.
Done
Bugs found

4/25/2017 Test Form
https://docs.google.com/a/student.lnu.se/forms/d/1LujWKpOLwjBdiaQx7GXNbHHPJAaNJisEgrTy11IBcmk/edit 3/3
Powered by
15. SWIPE UP to the first menu option, to check if it became unbooked *Tick all that apply.
Done
Bugs found
16. Check Google Calendar if the event is removed *Mark only one oval.
Done
Bugs found
17. SWIPE UP to the day of the week *Tick all that apply.
Done
Bugs found
18. SWIPE LEFT to go to a Saturday or Sunday *Tick all that apply.
Done
Bugs found
19. Is there a menu on date on Saturday or Sunday? *Tick all that apply.
Yes
No
20. Can you SWIPE DOWN or SWIPE UP on these days? *Tick all that apply.
No
Yes

35
Appendix B
Participant Initial Questionnaire

4/25/2017 Participants data
https://docs.google.com/a/student.lnu.se/forms/d/1grEzU6Cor3BIxunSRgj1TrCx5OH3y4hp3fLV48ASIfY/edit 1/2
Participants dataDemographic data about users of the study
*Required
1. What is your name? *
2. Sex *Mark only one oval.
Male
Female
3. Which LNU Faculty do you belong to? *Mark only one oval.
Faculty of Technology
Faculty of Social Sciences
Faculty of Arts and Humanities
Faculty of Health and Life Sciences
School of Buisness and Economics
Other:
4. Are you familiar with Augmented Reality (AR)? *Mark only one oval.
Yes
No
Other:
5. Please briefly clarify your familiarity with AR

4/25/2017 Participants data
https://docs.google.com/a/student.lnu.se/forms/d/1grEzU6Cor3BIxunSRgj1TrCx5OH3y4hp3fLV48ASIfY/edit 2/2
Powered by
6. How often do you eat at Kristina? *Mark only one oval.
Always
Often
Sometimes
Rarely
Never
7. Would you like to be reminded about events related with your daily routine? *Mark only one oval.
Yes
Maybe
No

38
Appendix C
Participant Weekly Diaries
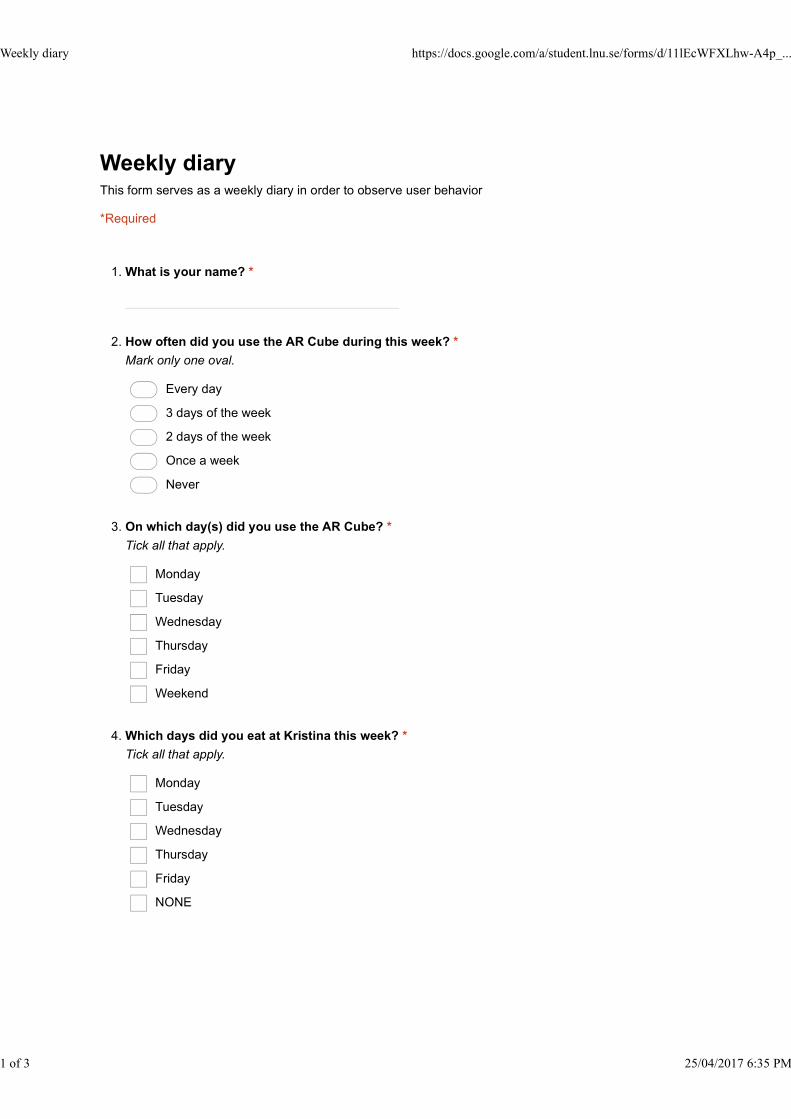
Weekly diaryThis form serves as a weekly diary in order to observe user behavior *Required
What is your name? *1.
How often did you use the AR Cube during this week? *Mark only one oval.
Every day3 days of the week2 days of the weekOnce a weekNever
2.
On which day(s) did you use the AR Cube? *Tick all that apply.
MondayTuesdayWednesdayThursdayFridayWeekend
3.
Which days did you eat at Kristina this week? *Tick all that apply.
MondayTuesdayWednesdayThursdayFridayNONE
4.
Weekly diary https://docs.google.com/a/student.lnu.se/forms/d/11lEcWFXLhw-A4p_...
1 of 3 25/04/2017 6:35 PM
Was the AR Cube functional? *Mark only one oval.
YesNo
5.
Any comments about the AR Cube functionality?6.
Is the AR Cube fun to use? *Mark only one oval.
YesNo
7.
Any comments about the above?8.
Did it affect your eating habits? *Mark only one oval.
YesNoMaybe
9.
If Yes or Maybe, in what way? *10.
Weekly diary https://docs.google.com/a/student.lnu.se/forms/d/11lEcWFXLhw-A4p_...
2 of 3 25/04/2017 6:35 PM

Powered by
Weekly diary https://docs.google.com/a/student.lnu.se/forms/d/11lEcWFXLhw-A4p_...
3 of 3 25/04/2017 6:35 PM

42
Appendix D
System Development
D.1 Unity 3D
According to (Kim et al., 2014) Unity1 “is a feature rich, fully integrated developmentengine that provides out-of-the-box functionality for the creation of interactive 3Dcontent”, and has found usage within VR and AR technologies. However it is worthnoting that Unity is primarily a game development engine, and as such can includesome functional and performance limitations for applications other than games. Agreat feature that Unity provides is making live changes; any change in the code canbe immediately shown on the graphical visualization interface. This offers develop-ers support and immediate feedback of their code development. Based on previousexperience, C# was chosen as the scripting language to work within Unity. Unityalso provides a great advantage for development as it supports the implementationof cross-platform applications (Creighton, 2010) – the developed prototype was de-ployed in both iOS and Android devices. This gives the possibility to have morepeople use and interact with the app.
D.2 Vuforia SDK
There are several AR frameworks for mobile programming but the prototype wasbuild through Vuforia SDK. That is due to previous experience working with it (seesubsection 2.2), but also because it is license-free and allows easy application devel-opment and distribution (Shatte, Holdsworth, and Lee, 2014).
According to (Amin and Govilkar, 2015) “Vuforia uses stable, and efficient computervision-based image recognition technique and provides several features, enablingcapability of mobile apps and frees developers from technical limitations.” Basedon the functionalities that it encompasses, Vuforia represents a suitable tool for ARdevelopment. What is more, Vuforia supports both iOS and Android platforms.Based on the aforementioned capabilities, combined with Unity they facilitate theAR development for cross platform.
According to their official website2, the Vuforia platform enables a variety of types ofrecognition. Through Vuforia the developer can bring digital features to life based onthe recognition and tracking of a broader set of objects. The Vuforia Target Managercontributes to the image improvement which in meantime leads to the optimization
1https://unity3d.com/2https://www.vuforia.com/

Appendix D. System Development 43
of the performance of the app. It also recognizes and tracks user defined images thatmake possible the interaction within AR environment.
Other features that Vuforia pertains include fast marker recognition, efficient track-ing also in low light condition and even when the marker is covered partially (Aminand Govilkar, 2015).
D.3 NodeJS
According to the NodeJS3 official website, “Node.js is a JavaScript runtime built onChrome’s V84 JavaScript engine. Node.js uses an event-driven, non-blocking I/Omodel that makes it lightweight and efficient” (Node.js Foundation 2017). One ofthe most apparent advantages of NodeJS is the fact it uses the JavaScript program-ming language both on the client and on the server. NodeJS also makes use of thenode package manager (npm), which represents the best reference to download, in-stall and manage third party modules that can be used within the application. Inaddition, NodeJS uses the JSON interchange format, which is widely used nowa-days. JSON also simplifies the communication with the NoSQL databases for Node.Moreover, Node uses one virtual machine (V8) that keeps up with the ECMAScript5
standard. So, this means that there is no delay for browsers to reach to use newJavaScript features in Node (Cantelon et al., 2014).
In contrast to other server-side programming languages such as PHP, JavaScript isan asynchronous programming language. Usually in PHP when the code performsan input/output (I/O) operation, the process of the program is blocked until thisoperation is completed. This approach is not efficient since could be generated somelatency starting from ms to some minutes, depending on the workload of the work ofI/O. In contrast, according to (Cantelon et al., 2014), “in Node, I/O is almost alwaysperformed outside of the main event loop, allowing the server to stay efficient andresponsive.”
In NodeJS, the event loop is very important since it arranges the asynchronousoperations within the application. The event loop means that the applications acton events (such as mouse clicks) (Teixeira, 2012).
D.3.1 Single Threaded Approach
In regard to the single threaded approach, seen from the developer’s perspective,there is no need to deal with multiple threads and their synchronization. A verycommon example of this approach is NodeJS, which uses one single thread for allthe requests. So, this means that NodeJS will not be blocked while many opera-tions happen simultaneously. All of the operations will be executed simultaneously,without waiting for the execution of another operation first.
NodeJS implements the single threaded approach and in this way the developersdeal with only one language on client and server side. Since there is only one thread
3https://nodejs.org/4Chrome V8, or simply V8, is an open source JavaScript engine developed by The Chromium Project
for the Google Chrome web browser.5ECMAScript is a standard for a scripting language. It specifies the core features that a scripting
language should provide and how those features should be implemented.

Appendix D. System Development 44
to execute the process, there is actually a separation of concerns between the taskswithin the thread. Asynchronous programming is another positive characteristic.This programming method provides more concurrent execution of the processeswithin the single thread, where one thread is available for all requests, but in mean-time all the requests are executed in order simultaneously. So, there is no waitingresponse time.
Being a non-blocking model makes it excellent for the applications with a lot of I/Ooperations (such as web apps). The most obvious example that is an advantage forthe single threaded approach includes the JSON data format and also the node pack-age manager (npm) that are used by NodeJS. Through npm can be installed the latestplugins, build with the knowledge of the latest architectural approaches. Also, JSONhas become very famous for its greater availability and accessibility on the web.Finally, the single threaded approach results to be very modern approach becauseof the enforcements of the best coding practices, higher order functions (callbacks)and the quite elegant APIs, which are exposing the programmers to the minimumamount of complexity.
D.3.2 JSON
According to (Introducing JSON, 2017)“JSON is a lightweight data-interchange for-mat.” It is easy for humans to read and write, and easy for machines to parse andgenerate. It is based on a subset of the JavaScript Programming Language, StandardECMA-262 3rd Edition - December 1999. JSON is a text format that is completelylanguage independent but uses conventions that are familiar to programmers of theC-family of languages, including C, C++, C#, Java, JavaScript, Perl, Python, andmany others. These properties make JSON an ideal data-interchange language.
JSON can be structure as a pair of key-value and as ordered list of values. In regardto the structure of the JSON that was needed for the database schema for the datamapping, a mixed approach was used in this thesis work. The JSON is structured asan object of key-value pairs, which includes nested array values.
JSON Schema is a powerful tool for validating the structure of JSON data (Under-standing JSON Schema). JSON Schema is usually used when there is a need to createa more structured JSON document that will get mapped to the data afterwards. Aselaborated above, for the implementation of the prototype it is used NodeJS andMongoDB on the server side and Unity 3D with C# on the client side. In meantimeRESTful APIs are used to access the server data. For this purpose JSON schema isa must in order to create a well defined structure and facilitate the data exchangeafterwards.
When it comes to the data structure of the JSON schema, there is not right or wrongway because it is dependent from the database structure that the developer intendsto create and also from the amount of the data incorporated.

Appendix D. System Development 45
D.4 MongoDB
According to (Kyle, 2011) “MongoDB6 is a database management system designedfor web applications and internet infrastructure. The data model and persistencestrategies are built for high read and write throughput and the ability to scale easilywith automatic fail-over.”
Scalability is one of the crucial reasons why MongoDB is widely used. Usually ap-plications start as small ones, but then when they grow big, they include more fluxof users and need to find ways to adapt the new environment. The decision to useMongoDB right from the beginning is very smart. Developers tend to save time lateron and also improve the user’s experience with the data provision.
In the other hand, developers that have been used to SQL based databases, can findit tough at the start to make the transition. That is because in MongoDB there are to-tally different names used for different database elements. For example, in SQL likedatabases there are databases, tables, rows and columns. In contrary, MongoDB’sdata model is document oriented. So, it works on concepts of collection and docu-ment.
Databases are generic representations of collections. MongoDB instead uses a “col-lection” which is similar to a table and “documents” which are similar to rows, tostore the data and schema information (Zachary, Scott, and V., 2013). In addition,MongoDB uses the JSON document style for data storage (Chodorow, 2013).
D.4.1 Database API
Applications are extended by introducing some external functionality. Usually, thatis achieved through the use of application programming interfaces. APIs providea way for one system to interact with the resources of another. According to (Es-pinha, Zaidman, and Gross, 2014),“software developers access APIs as interfaces forcode libraries, frameworks or sources of data, to free themselves from low-level pro-gramming tasks and/or speed up development.” What is more, APIs allow an ap-plication to gather data from several external sources, and even create entirely newfunctionalities and features by combining several APIs together into “mashups”.
In order to access data about the users and items of the scenario specific databaseschema, it was used a RESTful API. Through API were send queries to the databaseand afterwards the returned data were used in the application. Representationalstate transfer (REST) is an architectural style originally defined by Roy Fielding(Wilde and Pautasso, 2011). According to (Rodriguez, 2015), “one of the key charac-teristics of a RESTful Web service is the explicit use of HTTP methods in a way thatfollows the protocol as defined by RFC 2616.”
6https://www.mongodb.com/

46
Bibliography
Amin, Dhiraj and Sharvari Govilkar (2015). “Comparative study of Augmented Re-ality SDK’s”. In: International Journal on Computational Sciences & Applications (IJCSA)5, pp. 11–26. DOI: 10.5121/ijcsa.2015.5102. URL: https://is.muni.cz/el/1433/podzim2015/PA198/um/59482630/Comparative_Study_of_Augmented_Reality_SDK_s.pdf.
Augment.com (2016). What’s Next? The Biggest Augmented Reality Trends of 2017. URL:http : / / www . augment . com / blog / biggest - augmented - reality -trends-of-2017/ (visited on 05/13/2017).
Azuma, Ronald et al. (2001). “Recent Advances in Augmented Reality”. In: IEEEComput. Graph. Appl. 21.6, pp. 34–47. ISSN: 0272-1716. DOI: 10.1109/38.963459.URL: http://dx.doi.org/10.1109/38.963459.
Basili, Victor R (1992). “Software Modeling and Measurement: The Goal/Question/MetricParadigm”. In: Digital Repository at the University of Maryland, pp. 4–6. URL: http://drum.lib.umd.edu/handle/1903/7538.
Beck, Kent et al. (2001). “Manifesto for Agile Software Development”. In: Expert Sys-tems with Applications 41, 2174–2185. DOI: 10.5121/ijcsa.2015.5102. URL:http://www.sciencedirect.com/science/article/pii/S0957417413007471.
Butchart, Ben (2011). Augmented Reality for Smartphones. Tech. rep. URL: http://opus.bath.ac.uk/34847/ (visited on 05/15/2017).
Cantelon, Mike et al. (2014). Node.js in Action. Manning Publications Co.Carmigniani, Julie and Borko Furht (2011). “Augmented Reality: An Overview”. In:
Handbook of Augmented Reality. Ed. by Borko Furht. New York, NY: Springer NewYork, pp. 3–46. ISBN: 978-1-4614-0064-6. DOI: 10.1007/978-1-4614-0064-6_1. URL: http://dx.doi.org/10.1007/978-1-4614-0064-6_1.
Chang, Yu-Lien et al. (2015). “Apply an Augmented Reality in a Mobile Guidance toIncrease Sense of Place for Heritage Places”. In: Educational Technology and Society18, 166–178. ISSN: 1436-4522. URL: http://www.ifets.info/journals/18_2/13.pdf.
Chodorow, Kristina (2013). MongoDB. The Definitive Guide: Powerful and Scalable DataStorage. O’Reilly Media, Inc. ISBN: 1449344828, 9781449344825.
Cohen, David, Mikael Lindvall, and Patricia Costa (2003). Agile Software Develop-ments. Tech. rep. URL: http://users.jyu.fi/~mieijala/kandimateriaali/Agile%20software%20development.pdf (visited on 06/10/2017).
Creighton, AvRyan Henson (2010). Unity 3D Game Development by Example. A Seat-of-Your-Pants Manual for building fun, groovy little games quicky. Packt publishing.ISBN: 978-1-849690-54-6.
Droettboom, Michael. Understanding JSON Schema. Release 1.0.Espinha, Tiago, Andy Zaidman, and Hans-Gerhard. Gross (2014). “Web API grow-
ing pains: Loosely coupled yet strongly tied”. In: Journal of Systems and Software 07,pp. 27–43. URL: http://swerl.tudelft.nl/twiki/pub/Main/TechnicalReports/TUD-SERG-2014-017.pdf.

BIBLIOGRAPHY 47
Gartner.com (2016). Gartner’s 2016 Hype Cycle for Emerging Technologies Identifies ThreeKey Trends That Organizations Must Track to Gain Competitive Advantage. URL: http://www.gartner.com/newsroom/id/3412017 (visited on 05/13/2017).
Höllerer, Tobias et al. (2001). “User interface management techniques for collabo-rative mobile augmented reality”. In: ScienceDirect 25, 799––810. URL: http://www.sciencedirect.com/science/article/pii/S0097849301001224.
Introducing JSON, (2017). URL: http://json.org/ (visited on 05/13/2017).Johnson, Larry et al. (2013). NMC Horizon Report: 2013 K-12 Edition. Tech. rep. URL:https://www.nmc.org/pdf/2013-horizon-report-k12.pdf.
Johnson, Larry et al. (2016). The NMC Horizon Report: 2016 Higher Education Edition.The New Media Consortium and The EDUCAUSE Learning Initiative, an EDU-CAUSE Program.
Kaplan, Ken (2015). Assistive Technology for Visually Impaired Uses Intel 3D Cameras.URL: http://iq.intel.com/realsense- 3d- camera- technology-help-people-cant-see/ (visited on 05/13/2017).
Kim, Sung Lae et al. (2014). “Using Unity 3D to facilitate mobile augmented realitygame development”. In: IEEE Xplore Digital Library, pp. 21–22. URL: http://ieeexplore.ieee.org/document/6803110/.
Kyle, Banker (2011). MongoDB in Action. Greenwich. CT. USA: Manning PublicationsCo. ISBN: 1935182870. 9781935182870.
Node.js Foundation (2017). URL: https://nodejs.org/en/ (visited on 05/13/2017).Olshannikova, Ekaterina, Aleksandr Ometov, and Yevgeni Koucheryavy (2014). “To-
wards Big Data Visualization for Augmented Reality”. In: IEEE Xplore Digital Li-brary. DOI: 10.1109/CBI.2014.42. URL: http://ieeexplore.ieee.org/abstract/document/6904299/.
Olshannikova, Ekaterina et al. (2015). “Visualizing Big Data with augmented andvirtual reality: challenges and research agenda”. In: Journal of Big Data 15. ISSN:1077-2626. DOI: 10.1186/s40537-015-0031-2. URL: https://journalofbigdata.springeropen.com/articles/10.1186/s40537-015-0031-2.
Olsson, Thomas et al. (2013). “Expected user experience of mobile augmented realityservices: a user study in the context of shopping centres”. In: Personal and Ubiqui-tous Computing 17, 287––304. URL: http://link.springer.com/article/10.1007/s00779-011-0494-x.
Papagiannis, Helen (2010). Augmented Stories. URL: https://augmentedstories.com/ (visited on 05/13/2017).
– (2015). Augmented Reality Experience Design and Storytelling: Cues from Japan. URL:https://augmentedstories.com/ (visited on 05/13/2017).
Peng, Chen et al. (2016). “A review of using Augmented Reality in Education from2011 to 2016”. In: Springer Singapore, pp. 13–18. URL: http://dx.doi.org/10.1007/978-981-10-2419-1_2.
Rodriguez, Alex (2015). RESTful Web services: The basics. URL: http://www.ibm.com/developerworks/library/ws-restful/ (visited on 05/13/2017).
Shatte, Adrian, Jason Holdsworth, and Ickjai Lee (2014). “Mobile augmented realitybased context-aware library management system”. In: Expert Systems with Appli-cations 41, 2174–2185. DOI: 10.5121/ijcsa.2015.5102. URL: http://www.sciencedirect.com/science/article/pii/S0957417413007471.
Teixeira, Pedro (2012). Professional Node.js. Building Javascript Based Scalable Software.N.J.: Wiley.
Teyseyre, Alfredo R. and Marcelo R. Campo (2008). “An Overview of 3D SoftwareVisualization”. In: IEEE Xplore Digital Library 15, pp. 87 –105. ISSN: 1077-2626.

BIBLIOGRAPHY 48
DOI: 10.1109/TVCG.2008.86. URL: http://ieeexplore.ieee.org/abstract/document/4564449/.
Wilde, Erik and Cesare Pautasso (2011). REST: From Research to Practice. Springer.Wu, Hsin-Kai et al. (2013). “Current status, opportunities and challenges of aug-
mented reality in education”. In: ScienceDirect 62, pp. 41–49. URL: http://link.aip.org/link/?RSI/69/1236/1.
Zachary, Parker, Poe Scott, and Vrbsky Susan V. (2013). “Comparing NoSQL Mon-goDB to an SQL DB”. In: Proceedings of the 51st ACM Southeast Conference. ACMSE’13. Savannah, Georgia: ACM, 5:1–5:6. ISBN: 978-1-4503-1901-0. DOI: 10.1145/2498328.2500047. URL: http://doi.acm.org/10.1145/2498328.2500047.
Zhou, Feng, Henry Been-Lirn Duh, and Mark Billinghurst (2008). “Trends in Aug-mented Reality Tracking, Interaction and Display: A Review of Ten Years of IS-MAR”. In: IEEE, pp. 193–203. DOI: 10.1109/ISMAR.2008.4637362. URL:http://dx.doi.org/10.1109/ISMAR.2008.4637362.
Zuckerberg, Mark, Mike Schroepfer, and Deb Liu (2017). F8 2017 Keynote. URL: https://developers.facebook.com/videos/f8-2017/f8-2017-keynote/(visited on 05/13/2017).