DOCUMENT RESUME St. Petersburg Junior College ...
99
DOCUMENT RESUME ED 405 055 JC 970 181 AUTHOR Fischer, Susanne E. TITLE St. Petersburg Junior College Factbook, 1996-97. INSTITUTION Saint Petersburg Junior Coll., FL. Office of Institutional Research. PUB DATE Dec 96 NOTE 108p. PUB TYPE Statistical Data (110) Reports Descriptive (141) EDRS PRICE MF01/PC05 Plus Postage. DESCRIPTORS College Graduates; Community Colleges; Educational Facilities; Educational History; *Enrollment; *Enrollment Trends; Ethnicity; *Institutional Characteristics; *Outcomes of Education; *School Demography; Statistical Data; *Student Characteristics; Tables (Data); Two Year Colleges; Two Year College Students IDENTIFIERS Saint Petersburg Junior College FL ABSTRACT This handbook presents statistical data on students, outcomes, facilities, personnel, and finances at Florida's St. Petersburg Junior College (SPJC) as of fall 1996. Following an introduction and a list of SPJC Board of Trustees members, a history is provided of SPJC from its foundation in 1927 to the present and data are presented on Pinellas County demographics and high school graduate projections from 1980 to 2005. Statistics are then provided on the following aspects of student enrollment: (1) opening fall credit student headcounts, 1927-94; (2) SPJC graduates, 1929-94; (3) 1991-95 data on opening fall credit headcount by campus, gender, type of attendance, average load, residency, ethnicity, program, age, and class standing; (4) 1991-95 end-of-session fall credit headcount by campus, gender, attendance, program, ethnicity, and age; and (5) 1991-96 student registration. The next section provides data on annual unduplicated enrollment for credit/non-credit students, 1968-95, as well as 1991-96 data on enrollment compared to completers by gender and ethnicity; annual unduplicated enrollment by program; graduates by program; and non-credit enrollment. Indicators of effectiveness are then presented for the past 5 years, including transfers, assessment test pass rates, health exam pass rates, and student placement. The final sections present data on SPJC facilities, including site acreage and acquisition dates; personnel, including employees by gender and ethnicity; and finances, including distribution of revenues and expenses. Appendixes provide an inventory of programs, a table of 1993-94 employers of graduates by program, an accreditation schedule, and a description of special programs. (HAA) *********************************************************************** Reproductions supplied by EDRS are the best that can be made from the original document. ***********************************************************************
-
Upload
khangminh22 -
Category
Documents
-
view
1 -
download
0
Transcript of DOCUMENT RESUME St. Petersburg Junior College ...

DOCUMENT RESUME
ED 405 055 JC 970 181
AUTHOR Fischer, Susanne E.TITLE St. Petersburg Junior College Factbook, 1996-97.INSTITUTION Saint Petersburg Junior Coll., FL. Office of
Institutional Research.PUB DATE Dec 96NOTE 108p.
PUB TYPE Statistical Data (110) Reports Descriptive (141)
EDRS PRICE MF01/PC05 Plus Postage.DESCRIPTORS College Graduates; Community Colleges; Educational
Facilities; Educational History; *Enrollment;*Enrollment Trends; Ethnicity; *InstitutionalCharacteristics; *Outcomes of Education; *SchoolDemography; Statistical Data; *StudentCharacteristics; Tables (Data); Two Year Colleges;Two Year College Students
IDENTIFIERS Saint Petersburg Junior College FL
ABSTRACTThis handbook presents statistical data on students,
outcomes, facilities, personnel, and finances at Florida's St.Petersburg Junior College (SPJC) as of fall 1996. Following anintroduction and a list of SPJC Board of Trustees members, a historyis provided of SPJC from its foundation in 1927 to the present anddata are presented on Pinellas County demographics and high schoolgraduate projections from 1980 to 2005. Statistics are then providedon the following aspects of student enrollment: (1) opening fallcredit student headcounts, 1927-94; (2) SPJC graduates, 1929-94; (3)
1991-95 data on opening fall credit headcount by campus, gender, typeof attendance, average load, residency, ethnicity, program, age, andclass standing; (4) 1991-95 end-of-session fall credit headcount bycampus, gender, attendance, program, ethnicity, and age; and (5)1991-96 student registration. The next section provides data onannual unduplicated enrollment for credit/non-credit students,1968-95, as well as 1991-96 data on enrollment compared to completersby gender and ethnicity; annual unduplicated enrollment by program;graduates by program; and non-credit enrollment. Indicators ofeffectiveness are then presented for the past 5 years, includingtransfers, assessment test pass rates, health exam pass rates, andstudent placement. The final sections present data on SPJCfacilities, including site acreage and acquisition dates; personnel,including employees by gender and ethnicity; and finances, includingdistribution of revenues and expenses. Appendixes provide aninventory of programs, a table of 1993-94 employers of graduates byprogram, an accreditation schedule, and a description of specialprograms. (HAA)
***********************************************************************
Reproductions supplied by EDRS are the best that can be madefrom the original document.
***********************************************************************

,,,k- ,g
, , :, ,:), ,'...'\,
,;,,,,,-,,,k ,. , '',':.,-".L'Cl-';',-
''''',;' ",-AFts,- :,,,-.. 7.,,,,,,, --..:. ;,-, ,';';''''-`,., ri -',,, ;
-7*t.,' - ',..,..,.......-,:-, .,`", '4\'-: " .,
1: - t ,4,.4 s t
:'k''t .".':';',.21e,`,'Y',"?''''''''., ;."s,:4 2 /711?'S5* ..lat^ ,',.. k. ':: '- ;"i ""'' ' ,
/ ..
/ ,N ,,;
'
- .,.,.--,,,
< .,, , -,,,: 1 ;- ",:'''' ,:','.. , - '-''',3,,,, f,'-'-'..,. -Y,,:
1; "" i'-'. -''' ,
1 -' . "4"v/e,--",-"- ',..1,-,:% :' ---, ...:- l''....:,'-'' '. : .-:' ',-. - . , ,'
'S YiT7:\" tf ,....,< P,''
Z..
-; 5-s ; -
4 t,, - ^ 4ft' ft.t Jr
'
4 44,
7j'2iJ Di
r-tteA.,<' ,,
03 42
QUARTERLY REPORT
==
ID 41) 0) (1)
1
.v..,
"3.02.
4'69
)0.04
466.20
45.3 489
.214,
'300.03
345.0
F_
.1265.03
444.1.8
1 0.02.
403.20
1,655.03
4731.9
1,340.04
'399ao
.033'19
.202
6 14100.04
4S0.'
' .111205
.0441.2
.2
(13'369
U.S. DEPARTMENT OF EDUCATIONOnce or Educetoonal Research and improaemeni
EDUCATIONAL RESOURCES INFORMATIONCENTER (ERIC)
1,1qms document has been reproduced aseceorecf from the Person or organozahon
orogonatono ot
O Monor Changes have been made to improvereproductoon quality
Pants of view ot opinions stated on thosdocu-ment do not necessanly represent othcoalOE RI Madan or policy
5,
WOW
ON. 4.411MOIMS17 CALOSILAMIN
1.0 WO71 II%
0111 SCO
Fooll Van.. IsSa&mosso
I SO COSI 1..11ORM P.111M.S
IMO 000
11, 0.00
MOS Wel.'
M..MOMM..M..M..rICOMM..M..M..
11.1.014..MM
. .SURVEY RESPONSE
NO %SINS frYT Cl
ALIAIM YERRED /LINKS
Y OUESTIC*6 ALUMNI MINNA I
0 I 1 9
o 15 2211 34 650 I 25 392 9 186 I 6 151 I 12 161 2 11
1 I 3 7
"PERMISSION TO REPRODUCE THISMATERIAL HAS BEEN GRANTED BY
S. E. Fischer
TO THE EDUCATIONAL RESOURCESINFORMATION CENTER (ERICI."
ST. PETERSBURG JUNIOR COLLEGEa " " BEST COPY AVAILABLE r vs,"
a, 11".a<,.., ...agala;rea,
2

Table of Contents
INTRODUCTION
SPJC BOARD OF TRUSTEES ii
HISTORY 1
PINELLAS COUNTY SERVICE AREA
Pinellas County Profile 17Population of Pinellas County by Gender, Age and Ethnicity 20Pinellas County High School Graduates and Projections 21
STUDENT ENROLLMENT
Credit Student HistoryTable 1: Opening Fall Headcount Enrollment 1927-1994 22Table 2: Graduates 1929-1994 23
Opening Fall Credit HeadcountTable 3: By Home Campus 24Table 4: By Gender 25Table 5: By Type of Attendance 26Table 6: Average Student Enrollment Load By Campus 27Table 7: By Residency 28Table 8: By Ethnicity 29Table 9: By Program of Study 30Table 10: By Program of Study and Ethnicity 31Table 11: By Age 32Table 12: Average Age by Program of Study, Gender, and Type of Attendance 33Table 13: Average Age by Program of Study and Ethnicity 34Table 14: By Class Standing 35
End-of-Session Fall Credit HeadcountTable 15: By Home Campus 36Table 16: By Gender 37Table 17: By Type of Attendance 38Table 18: By Program of Study 39Table 19: In Degree Programs by Gender 40Table 20: By Ethnicity 42Table 21: In Programs by Ethnicity 43Table 22: By Age 45
Student RegistrationTable 23: Actual Annual vs. State Assigned Student/Equivalent Semester Hours
Enrollment By Course Classification 46Table 24: Full-Time Equivalent By Semester and Site 47Table 25: Annual Full-Time Equivalent Enrollment by Discipline 49
3

ACADEMICS
Table 26: Annual Unduplicated Enrollment-Credit/Non-Credit-1968-69 to 1994-95 50Table 27: Annual Unduplicated Enrollment-Comparison of Enrollment to Completers
by Gender and Ethnicity 51Table 28: Annual Unduplicated Enrollment in Programs 53Table 29: Annual Graduates by Program 55Table 30: Review of Active A. S. Degree Program Performance 57Table 31: Annual Non-Credit Headcount Enrollment 58
OUTCOMES/INDICATORS
Table 32: Students Transferring into the State University System 59Table 33: First-Time-Tested Student CLAST Passing Rates 61Table 34: First-Time-In-College Students' MAPS Passing/Failing Rates 63Table 35: Health Education Students National and State Exam Passing Rates 64Table 36: Placement and Follow-up Report 65
FACILITIES
Table 37: Site Acreage and Acquisition Dates 66Table 38: Site Gross Square Footage and Replacement Costs 67
PERSONNEL
Table 39: Number of College Employees by Gender. 68Table 40: Number of College Employees by Ethnicity 69Table 41: Number of Full-time College A&P by Highest Degree Earned 70
FINANCE
Table 42: Distribution of Revenue - General Current Fund 71Table 43: SPX Revenues, Personal Expenses, Current Expenses, and Capital Outlay 72
APPENDIX A: DEGREE AND CERTIFICATE PROGRAM INVENTORY Al
APPENDIX B: 1993-94 EMPLOYERS BY PROGRAMS B1
APPENDIX C: ACCREDITATION SCHEDULE Cl
APPENDIX D: DESCRIPTION OF SPECIAL PROGRAMS D1

ST. PETERSBURG JUNIOR COLLEGE
1996FactBook
INTRODUCTION
The St. Petersburg Junior College Fact Book is intended toprovide statistical information to support the administration insound planning and decision-making, as well as provide ahistorical perspective of the institution. It is designed for use asa desk reference documenting data to support academic andadministrative decisions and as a handbook for use by facultywishing to gain a college-wide perspective.
In general, data is provided for multiple years in eachsection to provide a comprehensive view of the area. Topicsinclude a brief college history, a description of the service area,and data related to the College's student body, academics,personnel, financial position, facilities, and outcomes indicators.Graphs and charts provide an at-a-glance comparativeperspective.
This marks the fourth publication of the Fact Book. Thisbook is a combination of tables in the A. S. Information Guide aswell as the standard FactBook tables. In addition to the printedcopy, tables are stored for easy access on the Big Apple and on theWorld Wide Web http://www.spjc.cc.fl.us and it is updatedon a continual basis as the data becomes available.
As with any publication, this book is the result of the timeand efforts of many people both in developing the "facts" andproducing the hard copy. An in-house production, the coverwas designed by the staff in Institutional Advancement and thebook printed in District Impressions. Many thanks to all SPJCstaff who were involved in this publication. We hope you willfind this FactBook useful and welcome any suggestions forimproving the content or presentation by completing theevaluation which follows on the next page.
SPJC Office of Institutional ResearchDecember, 1996
5

SPJC BOARD OF TRUSTEESNAMES AND DATES
Year Appointed Name Length of Service
1968 L. Chauncey Brown 1968 - May 19701968 Arthur Libby Albers 1968 - 19711968 James E. Hendry 1968 - 19751968 E. C. Marciardt 1968 - May 19741969 W. Richard Johnston July 1969 - September 19801970 William W. Gilkey July 1969 - May 19771971 Philip Benjamin July 1970 - October 19831974 Beatrice Lewis July 1974 - May 19781975 Reina Pollock July 1975 - June 19781978 Joseph H. Lang July 1978 - May 19891979 Janice Brockus Buchanan April 1979 - May 19871979 Paul Hatchett June 1978 - May 19811981 Thomas H. Gregory May 1981 - February 19921981 Robert C. Young August 1981 - May 19861983 J. Patrick McElroy November 1983 - February 19901986 Robert C. Young* April 1986 - June 19901988 Laurel J. Chadwick December 1987 - February 19921989 Stanley A. Brandimore May 1989 - May 19931990 Joseph H. Lang* May 1990 - March 19941990 Mac J. Williams June 1990 - February 19931992 Demos A. Megaloudis March 1992 - May 19951992 Pamela Jo Davis March 1992 - May 19951993 Robert C. Young* March 1993 - May 19941993 Ann G. Hines May 1993 - present1994 Joseph H. Lang* March 1994 - present1994 Robert C. Young* March 1994 - present1995 Pamela Jo Davis* June 1995 - present1995 Demos A. Megaloudis* April 1995 - September 19961996 Gary Megaloudis November 1996 - presentreappointed
SPJC PRESIDENTSNAMES AND DATES
Name Years of Service
George M. Lynch 1927 - 1935Robert B. Reed 1935 -1944Roland A. Wakefield 1944 - 1950Michael M. Bennett 1950 - 1978Carl M. Kuttler, Jr. 1978 - present
ii 6

HISTORY OF ST. PETERSBURG JUNIOR COLLEGE
Change and growth have been the hallmark of St. Petersburg Junior College,Florida's oldest two-year institution of higher education. Founded in 1927 as a privateinstitution, with its initial classes held in one section of a Pinellas County public highschool, it stands today as a multicampus public institution with sites throughout the county.Campuses are located in Clearwater and St. Petersburg; a center is in Tarpon Springs; theHealth Education Center and the District Office with its central services facilities are inPinellas Park; and the Marine Science Center at Bay Pines and the Allstate Center with itsCriminal Justice Institute are also in St. Petersburg. Development of a new, high-technology campus is under way on a 103-acre site in the city of Seminole. In addition,courses are offered in various community facilities throughout the county via the OpenCampus program.
In the Beginning
THE CHARTER
Captain George M. Lynch, superintendent of public instruction for St. Petersburg'spublic schools, spearheaded the founding of St. Petersburg Junior College in 1927 as aprivate, nonprofit corporation to meet the needs of a growing state population and toprovide local access to higher education for students with limited resources.
The nation's Great Depression of the 1930s had come early to Florida. The "paperboom" (inflated land values) fueled inflation during the mid '20s in the Sunshine State.Subsequently, many high school graduates found college beyond their means. St.Petersburg Junior College was founded to enable students to live at home, pay low tuition,work part-time and still pursue a postsecondary education. The 1928 charter application tothe State of Florida listed the following aims for the college:
To found, maintain and conduct a scientific institution of learning; having adepartment of fine arts; and such other departments as from time to timemay be added in accordance with the provisions of the by-laws; to own,buy, sell and mortgage real estate and personal property and to use allincome derived therefrom in its work and not for the benefit of the membersof said Corporation.
Led by Captain Lynch, who would become the college's first president, a group oflocal citizens signed the charter application. They were L. Chauncey Brown, publisher ofthe St. Petersburg Evening Independent; Frederick R. Francke, a Florida PowerCorporation executive; Frank N. Robinson, an insurance executive; George W. Wylie, anattorney; and Robert R. Walden, a merchant. These individuals, together with Mrs. H. C.Case, a Pinellas County trustee, made up the founding board of. governors. Theydemonstrated their dedication by signing personal bank notes guaranteeing expenses untiltuition could be collected. The city's Advertising and Library Board also backed the collegewith funds amounting to $10,000.
The board members managed the corporate affairs until the first election when Brownwas named board president, Francke vice president, Robinson treasurer and Wyliesecretary. Captain Lynch, who eventually rose to county superintendent, remainedpresident of the college until his death in 1935. At that time, Robert B. Reed, whom Lynchhad selected as dean of the college, was appointed by the board as the second president.G.V. Fuguitt succeeded Captain Lynch as the county superintendent. The informal
1
7

relationship between St. Petersburg Junior College and the Pinellas County School Systemcontinued.
COLLEGE PROGRAMS
In the beginning, advice was sought from educators at the University of Floridaregarding the type of college to be created. They recommended a two-year college, notingthat it would be much less expensive to operate than a four-year institution. Captain Lynchand the board agreed, but clung to the idea that St. Petersburg Junior College wouldbecome a four-year college as soon as it was financially feasible. In the 1927 catalog, thegoal of the college read as follows:
... to afford opportunity to the young men and young women of St.Petersburg and Pinellas County who have completed the 12th grade courseof study, to continue a two-year program of study of college grade, leadingto the degrees of Bachelor of Arts and Bachelor of Science. Non-residentstudents will be admitted upon certificate showing that they are living withtheir parents, legal guardians or relatives.
Students who attended the College planned to graduate in arts and sciences. At thetime, there were no separate departments at the college, but the curriculum includedhistory, English, mathematics, science, and education. Students would either transfer to acollege or university to complete their baccalaureate degrees or receive a teacher's certificatethat would permit them to seek employment in elementary and secondary schools. As notedby the State Superintendent of Public Instruction, W. S. Cawthon, in 1928:
This office will recognize graduates of the St. Petersburg Junior College ...and will issue limited Graduate State Certificates to the said graduates, saidcertificates authorizing the holders thereof to teach in the public schools upto and including the tenth grade.
The college became fully accredited in 1931. Preparation for transfer to four-yearcolleges was strengthened in September 1933 by the addition of a third year to thecurriculum, a year recognized under certain provisions by the University of Florida. In1934, under those same provisions, the third year of college also was recognized by theFlorida State College for Women (now Florida State University). The additional year of thecurriculum was dropped by St. Petersburg Junior College at the end of the 1938-39academic year because it had become evident that expenses progress geometrically, notarithmetically. At that time, the Board of Governors determined to maintain a strong, high-standard two-year college and abandoned further efforts to seek four-year status.
FACULTY AND STUDENTS
At the opening ceremonies September 14, 1927, the Fall enrollment was reported at102. The first full day of classes was held the next day. W.W. Little, principal of St.Petersburg High School and acting college dean, was in charge of 14 faculty members. By1928-29, Robert B. Reed had been appointed dean, teaching history while performing hisadministrative duties. In the Fall of that year (1928), 186 students enrolled; the followingJune, 50 students were graduated, the first class. The college granted diplomas, a practicethat continued until June 1946 when the first Associate in Arts degrees (44 in all) wereawarded. Opening fall enrollment had grown from 173 in 1930 to 389 in 1939.
At the beginning of the fall semester in 1941, enrollment was 317. It was during thatsemester that the United States became involved in World War II. The result: Enrollment
2

dropped sharply, reaching a low of 98 students almost all of them women in the Fallof 1943. The College avoided being closed by becoming an integral part of the war effort.A Civil Aeronautics Administration/War Training Service (CAA/WTS) installation wasestablished. Each six weeks, 60 naval V5 cadets were channeled through the College forpart of their early training. Housed in an old hotel near Albert Whitted Airport on the city'sbay front, they received their first experience as pilots while attending "ground school,"which included navigation, plane recognition, physical training and naval proceduresrelevant to their objective.
Upon the death of President Reed in 1944, Dr. Roland A. Wakefield, who had beenhead of the Department of Physical Sciences at the college since 1933, was appointedpresident. Dr. Wakefield's interest in aviation had taken him during the war from St.Petersburg Junior College's science classroom to Atlanta, Georgia where he served as theCivil Aeronautics Administration/War Training Service regional coordinator. He assumedthe presidency soon after his return to the College.
War's end brought the College's largest-ever enrollment as returning veterans tookadvantage of the GI Bill. Fall enrollments in 1946 and 1947 were 452 and 460,respectively. Dr. Wakefield retired at the end of the 1949-50 academic year; 88 studentsgraduated that June. He was succeeded by the Dean of Men, Michael M. Bennett, amember of the college faculty since 1940. Bennett, who eventually would earn a doctoratein education, was the first president to have attended St. Petersburg Junior College as astudent.
FACILITIES
When classes began in Fall 1927, Captain Lynch, as city superintendent, hadpersuaded the Pinellas County School Board to provide space, at no cost to the college, inone unused (and unwired) wing in the then 2-year-old St. Petersburg High School. At theend of the 1927 fall semester, students and faculty moved to a former public school at FifthStreet North and Second Avenue downtown, overlooking Mirror Lake. This mid-yearmove to downtown into a two-story, white-columned brick building gave the collegemuch more room. Although the College remained at this facility until 1942, it soon grewcramped and it became clear that larger quarters would be needed. In 1931, the City of St.Petersburg pledged an annual grant of $15,000 to the college. Six years later, it donated a24-acre tract in the city's Eagle Crest section. President Reed initiated a building campaignin 1938 that raised about $100,000 in pledges made by St. Petersburg residents andbusinesses.
The first permanent building which housed classrooms, offices, the library and anauditorium was erected at the corner of Fifth Avenue North and 66th Street. Built withWPA labor, it cost $91,000; equipment worth about $100,000 was transferred from theold building. The new building and its contents were valued at a quarter of a milliondollars. The move from downtown took place during the December 1941 holiday break.The first classes were held in the new building in January 1942. A small, temporarycafeteria building also was built. These two buildings, plus a limited library first occupiedin 1955, constituted the college's total facilities until 1957.
The original building, still in use today, is known as the James E. HendryAdministration Building on the St. Petersburg/Gibbs Campus. Renovated and airconditioned in 1963, it now houses administrative offices, conference rooms and facultyoffices. The Lynch Auditorium also was renovated, and redesigned as well. Moreadditions and renovations to the building were made in 1991 and 1992. In 1993-94, the
3

other buildings on campus underwent a multimillion-dollar renovation. In 1996, anotherauditorium remodeling got under way.
FROM PRIVATE TO PUBLIC
The wave of returning veterans subsided somewhat toward the end of the 1940s. Thecollege began losing superior faculty to better-paying positions at other colleges anduniversities. Demographics pointed to fewer college-age people for at least the next decade.This was the result of low birth rates during the 1930s. Tuition increases necessary tomaintain the operation of the college proved counterproductive by further depressingstudent enrollment. Prosperity was not evident in the college's service area; hence, outsidefinancial support for a private two-year college was extremely difficult to generate.
The Florida Legislature, in 1939, had adopted a law authorizing counties with apopulation of 50,000 or more to establish a public junior college, with permission of theState Board of Education. Then, in 1947, the Florida Legislature passed the MinimumFoundation Program (MFP), which provided financial support for operation and capitaloutlay (construction) for Florida public schools. On May 11, 1948, the Pinellas CountyBoard of Public Instruction adopted a resolution accepting the college. St. PetersburgJunior College converted from private to public school status, the second such institution(after Palm Beach Junior College) in the state to make the change. At that time, the Boardof Governors of the college dissolved the corporation and released all existing facilities tothe school board. L. C. Brown still remained president of the Board of Governors, whichhad consisted of 12 members. The Board became the College Advisory Committee,established by state statute (Chapter 230.0103 F. S. and State Board Regulations Chapter130-8.04) with L. C. Brown as chairman. Others on the five-member Advisory Boardwere Frederick R. Francke, Allen C. Grazier, Robert R. Walden and George W. Wylie,all former members of the Board of Governors.
With the change in status from private to public, the college became part of the schoolsystem with the president reporting to the superintendent of Pinellas County Schools.Shortly after the college became public, G. V. Fuguitt retired as Superintendent of PublicInstruction for Pinellas County. Floyd T. Christian was elected to succeed him. During thecollege's tenure under the County School Board, tuition was lowered. Although theFlorida Legislature authorized creation of the Division of Community Colleges in the StateDepartment of Education in 1957, it was not until July 1, 1968 that it authorized theseparation of the colleges from their county school systems. At that time, the CollegeAdvisory Committee of five members became the St. Petersburg Junior College DistrictBoard of Trustees.
At the state level, the Florida system of 28 community colleges has undergone variousreorganizations to insure its efficient and effective operation. In 1983, the FloridaLegislature replaced the State Community College Coordinating Board with the State Boardof Community Colleges which has preserved local control represented by local boards oftrustees while at the same time establishing system-wide policies and coordination.
1 04

AND IT GREW
EXPANSION OF THE COLLEGE MISSION
Pinellas County experienced unprecedented growth during the 1950s and the collegewas swept along with it. In Fall 1950, the first year of Dr. Bennett's presidency, 451students enrolled; in Fall 1978, the last year of his presidency, 14,445 students enrolled.During his 28-year tenure, enrollment increased by more than 3,100 percent. Additionally,during those 28 years, 25,449 degrees were awarded. This compares to 1,450 studentswho had graduated from 1928-29 through 1949-50 an increase of more than 1,650percent.
As part of the Self-Study of 1957-59, the faculty formulated a college philosophy anda set of institution-wide objectives reported in the 1958-59 College Bulletin.Acknowledging its relationship to the county schools, St. Petersburg Junior College notedthat its philosophy was contingent upon the Statement of Philosophy of Education for theSchools of Pinellas County, Florida. Moreover, it recognized an expanded responsibility tothe individual. The college mission was stated in the following manner:
St. Petersburg Junior College shares a responsibility with the community,county, state and nation in contributing to the development of the individualstudent so that he has the opportunity to become a useful citizen, to makeworthwhile contributions to society and to live a rich and satisfying life.
The purpose of the college is threefold: (1) to provide communityeducational facilities for those who may wish to transfer and continue theircollege education; (2) to provide community educational facilities for thosewho wish to terminate college work at the junior college level; and (3) toprovide the entire community with an educational program based upon itsneeds and demands.
The catalog listed seven enabling objectives to achieve the college purpose and oneobjective describing a method to measure their attainment. These objectives affirmed thecommitment to a college transfer program comparable to the lower division programavailable in four year colleges and universities, a terminal college curriculum that wouldlead to employment and non-credit life-long learning courses that would facilitate changingvocational and social needs.
The college rigorously developed its programs to meet its new educational vision forthe next 20 years. It was not until the 1978-79 College Bulletin that a major changeappeared. While the objectives previously stated were reaffirmed, attention was given tostudents who might profit from special opportunities, including instruction to overcomedeficiencies that might impede college-level work. The following six objectives wereidentified in the bulletin for the college:
(1) To provide educational opportunities for those students who willtransfer to other colleges in order to continue their education.
(2) To provide a variety of occupationally-oriented programs for thosestudents who complete their career preparation at St. Petersburg JuniorCollege.
(3) To provide opportunities for students who desire to increase theirgeneral education.
5
BEST COPY AVAiLABLE

(4) To provide opportunities for cultural enrichment, personal and socialdevelopment for members of the community.
To provide special opportunities for students with superiorqualifications as well as for students with inadequate skills andbackgrounds who need additional training in order to participate in thegeneral programs of the college.
(6) To provide, through counseling, guidance which will enable studentsto plan more effectively for the realistic attainment of their academicand personal goals.
(5)
These objectives became the foundation upon which a more comprehensive missionwould emerge in the next stage of the college's development.
COLLEGE PROGRAMS
As the enrollment grew, the college undertook the development of an expandedcurriculum. The School of Nursing was founded in 1954 and Anastasia M. Hartley, R.N.was named director. This school offered the first associate degree in nursing in the State ofFlorida. In addition to the two-year program in nursing, occupationally-oriented programsin business were developed.
Although Article II of the Application for Charter in 1928 called for "...a departmentof fine arts; and such other departments as from time to time may be added..." it was 1956before the college became departmentalized. Table 1 shows the first organization of thecollege.
TABLE 1COLLEGE'S FIRST DEPARTMENTS, 1956
Department
BusinessCommunicationsHumanitiesMathematics & EngineeringNatural SciencesNursing'Social Sciences
Chairperson
Melvin CoursonGertrude PorterHarriette G. RidleyCarol S. ScottArthur W. Gay Jr.Anastasia M. Hartley, R.N.E. L. Noel Jr.
In 1957-58, the School of Nursing became the Division of Nursing and continued tobe headed by Miss Hartley. By 1958-59, several changes had occurred in departmentchairpersons, and one new department and a second division had been created. The 1958-59 college organization is shown on Table 2.
1 School established 1954
6
12

TABLE 2COLLEGE DEPARTMENTS AND DIVISIONS, 1958-59
Department/Division
BusinessCommunicationsHumanitiesMathematicsNatural SciencesNursing Division2Radio, Television & FilmSocial SciencesTechnical Division
Chairperson
J. E. NicholsonM. Carolyn ParkerHarriette G. RidleyCarol S. ScottArthur W. Gay Jr.Anastasia M. Hartley, R.N.3Nancy E. ReissE. L. Noel Jr.William L. Bolin3
The 1960s saw continual change in college organization. In 1960-61, the Departmentof Communications was renamed the Department of English and continued to be headed byM. Carolyn Parker. All speech, dramatics and modern language courses were placed in thenew Department of Speech and Modern Languages, chaired by Roberta M. Buchanan. InJanuary 1965, this department was placed in the Department of Humanities and PeterMendoza Jr. was named Assistant Chairman for Speech and Modem Languages.
Also in 1960-61, the Department of Business became the Department of BusinessAdministration. The following year, the Department of Radio, Television and Film becamethe Department of Radio and Television, chaired by Robert C. Bohan.
The decade of the '60s saw the creation of several new departments. In 1960-61, theDepartment of Physical Education was created, chaired by Eleanore M. Gehlen. JoanCatherman was employed in 1962, as director of the new Dental Hygiene Division, to planfor the implementation of classes during 1963-64 year. The Department of PoliceAdministration was created in 1962 with James D. Stinchcomb as chairman. The followingyear, Harold V. Hoff was employed as chairman of the new Hotel-Motel-RestaurantDepartment. Students were initially enrolled in this program during 1964.
Two courses in data processing were offered in 1964-65, and in 1966 the DataProcessing Department was established with Wayne Laurents as chairman. Beginning withthe 1965-66 academic year, the college instituted a remedial Program of Directed Studiesfor students with ability whose educational background evidenced academic weaknesses.The department developed courses that focused on the use of programmed and non-programmed instructional materials to strengthen students' basic skills as well as studyskills.
St. Petersburg Junior College expanded into a three-campus institution in Summer1965 with the opening of the Clearwater Campus. A Directed Studies Department wasactivated on both the St. Petersburg and Clearwater campuses and was combined withCommunications on the short-lived Gibbs (later Skyway) Campus in south St. Petersburg.Clearwater Campus departments activated with its opening are shown on Table 3.
2 Created 1957-583 Dean of the Division
713
TABLE 3OPENING CLEARWATER CAMPUS DEPARTMENTS/DIVISIONS, 1965
Department/Division Chairperson
Business Administration Jack L. MillerCommunications Division Robert KreagerDirected Studies Merle E. MorganMathematics and Sciences Joseph GouldPhysical Education (None)Social Sciences William Hunt
The departments active on the Gibbs Campus in 1965 are shown in Table 4.
TABLE 4GIBBS CAMPUS DEPARTMENTS, 1965
Department Chairperson
Business Administration Chrystelle StewartCommunications-English-Humanities-Directed Studies Helen McLeanMathematics and Science Frank PiercePhysical Education Annie WoodardSocial Sciences Leo Ballard
In 1967, several organizational changes occurred on the Clearwater and St. Petersburgcampuses. In January 1967, the Humanities Department was established on the ClearwaterCampus with Donald L. Bisdorf as chairman, and the Communications Division becamethe English Department. On the St. Petersburg Campus, under the Dean of Instruction, twoassistant deanships were created for Technical-Related Programs and Health-RelatedPrograms, respectively. The Hotel-Motel-Restaurant, Radio-Television, PoliceAdministration and Electronic & Mechanical Technology departments were placed underTechnical-Related Programs. The Dental Hygiene and Nursing departments, as well as twonew programs, Inhalation Therapy and Hospital Care Administration, were placed underHealth-Related Programs.
On the Clearwater Campus, Leroy M. De Vane was named Assistant Dean ofInstruction for Governmental Services. The Data Processing Department and the newAerospace Technology program were placed under Dr. De Vane. A new program in Pre-School Education was begun on both the Clearwater and St. Petersburg Campuses. Itspurpose was to prepare competent instructional personnel for community, private andchurch-related pre-school institutions and to provide in-service opportunities for pre-schoolclassroom teachers.
Much expansion of college programs occurred during Dr. Bennett's tenure. Theprograms on the St. Petersburg and Clearwater Campuses at the time of his retirement areshown on Table 5.
814

TABLE 5ACADEMIC DEPARTMENTS/DIVISIONS BY CAMPUS, 1978
Campus Department/Division
Clearwater Architectural TechnologyAviation TechnologyBusinessCommunicationsComputer ScienceEmergency Medical TechnologyFire AdministrationHealthHumanitiesNatural ScienceNursingPhysical EducationRespiratory TherapyScienceSocial Science
St. Petersburg Animal Science TechnologyBusinessCommunicationsEngineering TechnologyHealthHotel-Motel-RestaurantManagementHuman ServicesMedical Laboratory TechnologyNatural ScienceNursingOptometric TechnologyPhysical EducationPhysical TherapyPolice AdministrationScienceSocial Science
at....madDirsaar
Robert SebekWayne J. HarrisonJack MillerHelen V. McLeanMary C. DurkinBarbara FinnEugene Z. JacksonAnastasia M. HartleyKarl GarrettHomer A. JoplingElizabeth WajdowiczRalph G. KernDavid C. ShelledyJoseph GouldWilliam S. Hunt Sr.
David C. TollonTod 0. DravisJoseph F. MaddenWilliam L BolinMerle H. Morgan
Harold V. HoffDonald DavisJo Ann R. AhistromMarvin L. IveyAlmeda B. MartinKenneth C. GatsonEleanor M. GehlenFrancis L. GoldenRobert B. TegardenWilliam R. RiceJoy A. Mitchell
In addition to those shown, a Deaf Program at the Clearwater Campus had been created,coordinated by Calvin D. Harris.
FACILITIES
As the enrollment increased so did the need for the construction of additional facilities.A direct appropriation by the Legislature in 1954 resulted in the start of new construction.The St. Petersburg Campus acquired a small new library, which was occupied in 1955.Five separate parcels of one to five acres of land were purchased for $360,742, extendingthe campus from the original 24 acres to 37.58 acres. The largest of these parcels is the siteof the natatorium and field house. Today, the campus has 17 buildings.
In 1953, as a result of requests from people living in the Clearwater area, nine eveningclasses were offered at Clearwater High School. Eighty-eight (88) persons registered forthe first session, and course offerings were increased each semester as the needs and
915

interests of the northern Pinellas students were identified. During the 1959 Fall semester,113 students were registered in 14 evening classes at Clearwater High School. Afterconsidering the current enrollment and projected growth of Pinellas County, the CollegeAdvisory Committee recommended that a Clearwater campus be established. In July 1959,a request was made to the State Department of Education for permission to plan a campusin the northern part of the county. After a study of enrollment projections for the next 10years and a survey by the State Department of Education, the plan for a campus inClearwater was approved, 14 miles north of the St. Petersburg Campus.
In 1962, a tract of land was selected and acquired through purchases and gifts. In1964, construction began. The 38.3 acres north of Drew street were purchased from thecounty for the token sum of one dollar; the 34.5 acres south of Drew Street were purchasedfor $226,008, with the City of Clearwater paying $127,000 of this amount. During thesecond semester of 1964-65, 532 students taking 35 evening classes were moved onto thenew campus and day classes were held there for the first time. In 1968, a parcel of one-halfacre was purchased for $1,275 for parking; in 1969 the Faith United Church of Christdonated a similar parcel, valued at $2,000, also used for parking. TheClearwater Campustoday encompasses 73.87 acres and contains 17 buildings.
In February 1965, Gibbs Junior College in South St. Petersburg (one of a dozen all-black colleges established by the State of Florida in the late 1950s before desegregation)was placed under the supervision of St. Petersburg Junior College. At the close of the1965 Spring semester, it became the Gibbs Campus of St. Petersburg Junior College. In1966, the campus name was changed to the Skyway Campus. For economic reasons,however, this campus was phased out of operation in June 1967. In February 1993, theSt. Petersburg Campus became the St. Petersburg/Gibbs Campus, to honor thecontributions that Gibbs Junior College, in its single decade of life, had made to St.Petersburg Junior College and to Pinellas County education in general.
Although operating three campuses for a time, St. Petersburg Junior College remaineda single institution with a central administrative organization. This one-college conceptcould best be maintained, it was decided, by having central administrative offices. In July1966, the Pinellas County Board of Public Instruction purchased a 9.47-acre site inPinellas Park for this purpose. Construction of two office buildings was started in 1967.Their "mid-county" location had no specific physical identification with any campus. Theywere occupied in August 1968.
Early in 1970, the mayor of Tarpon Springs approached President Michael Bennettregarding the possibility of opening a college site in that area. An initial study was madeand a special relationship was formed between Tarpon Springs Banker/philanthropist A. L.Ellis and city officials. The result: establishment of the Tarpon Springs Center, rent-free tothe college, on the second floor of the Ellis Springs State Bank in the fall of 1970, tooperate for a provisional three-year period. Later, the city's Rotary Club providedadditional space in the Rotary Youth Center. On October 19, 1972, the College purchased anearby tract consisting of 54.17 acres on Klosterman Road for $328,000. Seven buildingswith more than 21,000 square feet rose on the site and the brand-new Tarpon SpringsCenter opened in Fall 1975. Other structures were added, to try to keep pace with thebooming enrollment. Then, in February 1994, groundbreaking ceremonies were held for a$5.1-million expansion at the center. By Summer 1995, two large buildings one forclassrooms, the other for administration and student services had been completed atopthe hill overlooking Klosterman Road, giving the campus area a totally new core. Another18.6 acres of adjoining property had been acquired as well. Tarpon Springs Center hadgrown from an initial enrollment of 152 students housed in the second story of a bankbuilding to a student body of more than 4,500 occupying a 70-acre site. Today, the center
10

contains a dozen permanent structures plus several portable facilities and continues to servethe fastest growing part of the Pinellas County community.
In August 1970, and again in February 1971, the College purchased tracts of 81.4 and21.72 acres, respectively, in the Seminole area. Those 103 acres have sat empty for all theensuing years, occupied only by a family of bald eagles and other wildlife, but in 1996 thepicture began to change rapidly. In the summer, the Board of Trustees voted to proceedwith the first phase of development of what is to be SPJC's high-technology campus afacility that, through distance learning and the Internet and other electronic wizardry, willserve not only its resident student body but the rest of the college and beyond. Initially, asingle building is to be erected, augmented by several portables, providing a total of20,000-25,000 square feet of space. Groundbreaking is scheduled late in 1997, withanticipated occupancy the following summer and first classes to be held that fall. Aneventual enrollment of 1,000 students is expected. Besides being characterized by its high-tech status, the site is to retain its natural look and maintain environmental sensitivity aswell. It also will reflect the "partnering" that is going into its development, between thecollege and the City of Seminole, the surrounding community, legislators, corporateleaders, other educational institutions, and friends of the college.
The Bay Pines property of 55.21 acres, only 15 of which are above the mean highwater mark, was acquired in December 1973 by a quitclaim deed from the federalgovernment. The two buildings on the property have been converted to serve as storageand classrooms for the Life Skills Program. This offering, a training program that provideslife skills training for retarded adults past the of age 21, is under the direction and co-sponsorship of the Open Campus of St. Petersburg Junior College and the Pinellas CountySchool Board.
AND LOOKED TOWARD THE FUTURE
President Bennett's January 31, 1978 retirement was followed by the appointment ofCarl M. Kuttler Jr., J.D., who had been serving the college as Dean of AdministrativeAffairs. Dr. Kuttler, the second St. Petersburg Junior College graduate to be named to theCollege presidency, continues to serve.
COLLEGE MISSION
In 1987, the District Board of Trustees adopted a new mission statement that affirmedSt. Petersburg Junior College as a comprehensive, open-door institution whose policy wasto provide quality educational experiences to a diverse student body and community. Theoriginal goal of the college (to prepare students to transfer to a four-year institution)continued, as did the goals previously established regarding the preparation of students forentry into a job or career, the upgrading of students' occupational skills, and thestrengthening of their basic academic skills. Additionally, the mission statement addressedthe need for flexibility and innovation in the way services were provided, the integration ofeducational goals into lifelong learning, and the encouragement of minority students toutilize the available college resources and opportunities. The 1989 Florida Legislatureadded economic development as a component of the mission of all community colleges andgranted SPJC capital construction and renovation funds totaling $6,293,832 in 1989,$5,664,427 in 1990, $6,676,405 in 1991, $13,305,995 in 1992, $6,729,719 in 1993,$10,481,060 in 1994, $6,335,156 in 1995 and $8,353,332 in 1996.
During the 1993-94 school year, a committee was formed to review the college'smission. A new statement of the college's mission, which appears on the first page of theyearly catalog, states that the goals of the college are to:

prepare students for transfer to upper division baccalaureate programs atfour-year colleges and universities through the Associate in Arts degreeprogram;prepare students for careers requiring postsecondary education throughAssociate in Science and selected Certificate programs;prepare students for responsible and ethical citizenship, directedinteraction in the diverse community, participation in the global society,effective involvement in life activities, and informed decision-makingthrough general education courses;provide underprepared students with opportunities to achieve entry levelskills in reading, writing and mathematics through the collegepreparatory programs;provide opportunities to improve employability and enhance career skills,and to attain personal enrichment, through courses, seminars,workshops and other continuing education programs offered throughoutthe community;help students choose appropriate courses, programs, services andactivities as well as maximize their opportunity to succeed in collegethrough a comprehensive student development program;contribute to the economic development of the county through technicalcourses, workshops, programs and services designed to enhance thecompetitiveness of individuals, businesses and industries in the local,state, national and global economies;contribute to the international education of students through a variety ofcourses, foreign study tours, faculty and student exchanges, linkageswith international institutions and other special programs; andserve target populations beyond the borders of Pinellas County throughauthorized programs and activities that emanate from the institution'shistory of service and specialized expertise.
COLLEGE PROGRAMS
Under President Kuttler's leadership, the Open Campus, a flexible system forproviding educational services, was established to meet the growing needs of thecommunity for lifelong learning. This program provides credit and non-credit courses,workshops and seminars on the college campuses and at business sites throughout thecounty to meet existing community needs. It includes the Corporate Training Center as wellas the College for Kids Program, the Dual Credit Program for high school students, andother continuing education classes for job training and fun.
Today, the programs leading to the Associate in Arts degree are the traditional transferprograms with concentrations in art, arts and sciences, architectural/building construction,business administration, computer science (business option), corrections, early childhooddevelopment, education, engineering, corrections/criminal justice, English/humanities,fashion merchandising, fire administration, forestry, gerontology, human services, socialwork or occupational therapy, industrial arts education, international business, lawenforcement, mass communications, mathematics, medical technology, music or musiceducation, natural science, nursing, occupational therapy, pharmacy, physical therapy,speech/audio pathology, pre-dental, pre-medical, pre-veterinarian. These programs meet allthe requirements of the general education component for the baccalaureate degree.
The college has about three-dozen Associate in Science programs that prepare studentsfor entry-level jobs. Alphabetically, they are Accounting Technology; Architectural Design
12 18

and Construction Technology; Business Administration and Management (with options inEntrepreneurship, International Business, Marketing, and Quality Management); ChildDevelopment and Education; Computer Information Systems Analysis (with options inComputer Programming, Network Systems Management, and Office SystemsManagement); Criminal Justice Technology; Dental Hygiene; Electronics EngineeringTechnology; Emergency Administration & Management; Emergency Medical Services;Fashion Design (C.A.S.P.); Fire Science Technology; Funeral Services; Graphic DesignTechnology; Health Information Management; Health Services Management (with optionsin Home Health Care, Long Term Care, Medical Administration and Nursing HomeAdministration); Human Services (with options in Alcohol/Substance Abuse and SocialServices); Industrial Management Technology; Interpreter Training Program for theHearing Impaired; Legal Assisting; Manufacturing Technology; Medical LaboratoryTechnology; Nursing (RN); Physical Therapist Assistant; Radiography; Respiratory Care;Telecommunications Engineering Technology; and Veterinary Technology. Additionally,the College offers a limited number of vocational certificate programs which includeEmergency Medical Technology; Guardianship; Health Care Services; Long-Term CareSpecialist; Office Systems Specialist (with options in Information Processing Specialty orWord Procesing Specialty) and Paramedic.
In 1989, SPJC launched Project Flamingo, a collegewide, comprehensive approach tointegrate computer technology in a totally-networked standardized environment. The planwas created to enhance the curriculum and teaching-and-learning process, strengthen theadministrative systems and improve campus communications. This multi-year computerproject was developed with considerable help and cooperation of Apple Computer, Unisysand the Digital Equipment Corporation (DEC), who among them contributed more than $3-million in equipment to the college. Through the project all of the college sites are nowinterconnected; and the majority of faculty and staff are using the new tools of technologyto enhance quality and improve productivity. The major purpose of Project Flamingocontinues to the present time, to promote excellence in teaching and learning byincorporating computers, CD-ROM and laser disk technology into the curriculum asinstructional tools through a collegewide fiber network.
FACILITIES
During the first year of his tenure (1978), Dr. Kuttler went to the voters of PinellasCounty to request their approval, by referendum, of a temporary, additional 1/2 mill inproperty taxes for college improvements. Despite predictions of failure from somequarters, the referendum passed and the College was able to accomplish some much-needed renovations with the new funds.
In an effort to respond to the growing demand for health care providers and to makemore effective use of resources, the college petitioned the Florida Legislature for funding topurchase and remodel three buildings at the former Webb's City retail complex in PinellasPark. A special $6.5-million appropriation from the Legislature was obtained and theCollege acquired 170,000 square feet of floor space for its Health Education Center. Inaddition, a capital campaign, begun in 1981 and completed in 1986, raised $3.5-million,including a significant gift from Mr. and Mrs. W.W. Caruth Jr.
In the summer of 1981, 10 of the college's then-11 health care programs were movedinto the new center and classes began that August. The 11th program, VeterinaryTechnology, occupied its building in August 1983. Since then, the college has acquiredadditional property for parking space, plus two additional properties fronting on 66th StreetN. All of the buildings on the 11.63-acre tract have now undergone renovation. The libraryarea has been expanded into the newly renovated space and includes the M.M. Bennett
13
19

Library Processing Center. A $400,000 overhaul of the Center's parking lot wascompleted early in 1994.
The expansion of the College's Corporate Training Services program led to theestablishment of the Corporate Training Center in the Carillon office complex north of St.Petersburg in Winter 1988. This 7,000-square-foot facility houses class and conferencerooms with full computer, teleconference and dining facilities. In 1996, as an economymove, the college's facilities at Carillon were removed and transferred to other sites.Closed simultaneously with Carillon, and for the same reason, was the Canal ParkExtension of Tarpon Springs Center a cluster of six portable buildings the college hadset up in a wooded park in the town of Oldsmar in January 1994. The Canal Park site wasto relieve overcrowding at Tarpon Springs, and it had served a student body that averagedabout 400 persons. But its continuation was ruled no longer feasible and the portablessince have been moved to a location near the Health Education Center, where they functionin tandem with that facility and as a Corporate Training & Continuing Education alternatesite.
In July 1988, the Allstate Insurance Company turned over to the College the keys toits former regional office facility in south St. Petersburg. The 131,344-square-footbuilding on 20.85 acres was valued at more than $11-million. At the time, it was the largestproperty gift ever made to a Florida institution of higher education, and the largest ever to aU.S. community college. Extensive renovations were completed in 1991. The AllstateCenter houses the Administrative Computing Center as well as the Open Campus programsand the College's Southeastern Public Safety and Criminal Justice institutes (lawenforcement programs).
EXPANDED HORIZONS
In January 1987, the college played host to the first-ever "Roundtable on InstitutionalEffectiveness." A dozen national experts on higher education and community collegeadministration, led by former U.S. Secretary of Education Terrel Bell and Director JohnRoueche of the Community College Leadership Program at the University of TexasAustin,met to develop future directions for the College.
Within a year, St. Petersburg Junior College held the second of these conferences.The "Roundtable on Educational Partnerships" brought together leaders from nationalorganizations representing American postsecondary education. Together they analyzed theways St. Petersburg Junior College had successfully addressed many of the education andtraining issues facing the local community.
The second roundtable led to a request from the Association of Community CollegeTrustees (ACCT) Executive Director William H. Meardy for material relating to thecollege's presentations at the conference. Administrators, faculty and board membersresponded, providing 46 pages of information about the College, its programs andaccomplishments. Published in the A CCT Journal, this marked the first time an issue wasdevoted exclusively to a single institution. Mr. Meardy wrote: "Those of us who wereexpecting a 'typical' community college found out our expectations were wrong. St.Petersburg Junior College is anything but 'typical.' Words such as 'outstanding,''amazing,' innovative,"creative,"first class,' exemplary,"trend setting,' and'community centered' describe SPJC, but 'typical' it is not. What we found was a collegereplete with such an abundance of human services and educational programs that we wereawed."
2014

In 1982, at a national conference of college trustees, future Chairman of the Board ofTrustees Tom Gregory (who earlier had chaired the Florida Ethics Commission) andPresident Kuttler heard Dr. Paul Ylvisaker, former Dean of Harvard's Graduate School ofEducation, outline the rationale for an Applied Ethics program. Following Dr. Ylvisaker'svisit to St. Petersburg Junior College in November 1987, the Board of Trustees approvedthe creation of an Applied Ethics program for the College, which is required for all studentsseeking the A.A. degree. Finding no satisfactory text for the course, the college authorizedthe writing of a textbook. In July 1993, Ethics Applied was published by McGraw-Hilland marketed nationally. It was written by 17 specially commissioned authors from aroundthe U.S., including three from the College faculty.
The College's Central American Scholarship Program (CASP) was established inAugust 1987. Sixteen (16) students from modest backgrounds comprised the first class.The program provides students, in two years, with the academic and vocational educationneeded to improve their families' standard of living when they return home. While enrolledin the program, each student lives with an American family who helps him or her to adjustto life in the United States. The program, initiated by Georgetown University inWashington, D.C., is funded by the U.S. Agency for International Development.
St. Petersburg Junior College and the American Association of Community and JuniorColleges worked together to offer the first national conference on "The Role of theCommunity College in Shaping the Nation." Held at the Jimmy and Rosalyn Carter Centerin Atlanta, it brought some 200 educational administrators and public officials together atthe research and conference complex to discuss national and global issues as they relate tothe education of the nation's college students. In a message to the gathering, formerPresident Carter noted that better preparation of students holds the key to the United Statesregaining its competitive edge in world markets and adjusting to the evolving economy.
In 1989, former U.S. Secretary of Education Terrel Bell accepted the college'sinvitation to chair the College's FACET Commission (Focus on Access, Community andExcellence in Teaching), and agreed to work with Dr. John Roueche to help guide thecollege's faculty, staff and students. The purpose of this project was to insure continuededucational excellence into the next century. During the months following the creation ofthis commission, members met to discuss teaching effectiveness, evaluation of teachingperformance, recognition of teaching excellence, and professional development. Theirpublished report provided direction for the college.
In October 1989, the College and the American Association of Community and JuniorColleges co-convened their second leadership seminar, at the Gerald R. Ford Museum inGrand Rapids, Michigan. "Workforce 2000" looked at the future economy in terms of thepeople and forces that will make it function. Included in the topics discussed were the roleof technology, the importance of a quality workforce in a global economy, and theblending of enterprise and education.
In the international arena, as the breakup of the Soviet Union brought about profoundchanges in the structure of institutions within Russia, leadership at the college envisioned ajoint educational venture between the college and the Russians. In June 1990, PresidentKuttler and the president of Leningrad State University exchanged visits. The projectevolved from conversations Dr. Kuttler had had the previous spring with a Leningrad Statelaw professor, Valery Musin, who was visiting Dr. Kuttler's alma mater, Stetson Collegeof Law, in St. Petersburg.
Dr. Kuttler spent two weeks in Russia in Fall 1990, during which time he served ashonorary rector of Leningrad State University. He met with administrators, faculty and
1521

students as well as with Leningrad (now St. Petersburg) Mayor Anatoly Sobchak, one ofthe leading political figures on the Russian political scene in the post-Gorbachev era. TheRussians reciprocated that October when Mayor Sobchak and Leningrad State UniversityPresident Stanislav P. Merkuriev led a delegation to the Tampa Bay area. During their stay,Dr. Merkuriev was named honorary president of St. Petersburg Junior College. TheRussian entourage met with many educational, civic and business leaders while they werehere.
In June and July of 1991, Dr. Kuttler visited Baoji Teachers College in Baoji,Shaanxi, China. Dr. Yang Yijun returned that visit to St. Petersburg Junior College inMarch 1992, and was named honorary president. A St. Petersburg Junior Collegeprofessor, Jeff Hooks, and his wife and son spent a year in residence at Baoji. OtherChinese have visited here since.
At the special invitation of the U.S. Information Agency (an arm of the StateDepartment), Dr. Kuttler returned to Russia during late May and early June of 1993. Hewas chosen from among more than a thousand of his peers to assist the Russians in settingup a community college system within their country to help speed economic reform anddevelopment. While there, he arranged for future visits and exchanges on the part ofeducators and other representatives between Russia and the college. A long-term objectiveis a St. Petersburg Junior College campus in St. Petersburg, Russia.
In the Fall of 1996, recognition of St. Petersburg Junior College as a repository ofculture for this and future generations came about in a huge way. The world-renownedmodern artist, Dr. Allen Leepa, settled on the college specifically, its Tarpon SpringsCenter as the place where he and his wife Isabelle would bestow their Leepa/Rattner artcollection along with a gift of $2.15-million for the construction of the Leepa/RattnerMuseum of Fine Arts. Theirs is the largest contribution from private individuals ever madeto the college. The combined value of the museum project, including the art collection,construction endowment and matching state funds, was estimated to be more than $5-million. That was before the collection originally estimated to be "more than 150" worksof art by the likes of Leepa, Rattner (Leepa's stepfather, abstract expressionist AbrahamRattner), Picasso, Hofmann, Roualt, et al. was found, in fact, to number closer to 500pieces. At the Sept. 24 ceremony celebrating his and his wife's contribution, Leepa said hewished for the museum to be "a vibrant place (that would) engage the student and spectatorin examining the nature of human experience as visualized through painting." Thus is thecollege to expand on its considerable reputation as a locale for learning and become, aswell, a locale for the celebration of the human spirit
During the past half-decade St. Petersburg Junior College's move toward the center ofthe international education stage has been clear and pronounced. It has been evidenced by agrowing number of successful endeavors, ranging from an in-depth analysis of thecollege's programs to presidential roundtables to interaction with educational institutions inRussia, China and other countries around the world. The College's global outreach wassignificantly recognized again early in 1997 when President Kuttler was named winner ofthe Werner 0. Kubsch Award for International Achievement in Education. Armed with thismomentum and its traditional vision, St. Petersburg Junior College eagerly anticipates thecoming of the 21st century.

1995 FLORIDACOUNTY PROFILE.-!..!5tritiENTIFICATIO
County: PinellasCounty Seat: ClearwaterNearest Metropolitan Area:Tampa-St. Petersburg-Clearwater
County Population:1980 728,5311990 851,6591994 870,722
Population Projections:2000 924,1632005 959,2242010 993,422
Components of Population Change
Natural Change -10,069Net Migration 29,132Total 19,063
Population Age Breakdown :0 -17 159,01518-44 297,68545-64 189,83665+ 224,186
County Area (square miles) 280Population Density 3,109.70Population of immediate surroundingcounties 1,177,921
Largest Incorporated Municipalities
1. St. Petersburg 240,9022. Clearwater 100,6043. Largo 66,8694. Pinellas Park 44,1115. Dunedin 34,857
Labor Force:County Civilian Labor Force
440,258Unemployment .Rate 5.20%Labor Force of SurroundingCounties 602,977
County Nonfarm Employment byIndustryAgricultural Services 4,871Mining 370Trade 111,517Transportation, Public Utilities 14,077Manufacturing 45,925Construction 24,547Fin, Ins, Real Estate 38,877Services 166,262Government 43,383
-SELECTED ECONOMIC'INDICATORS,'
Income:Per Capita Personal Income(1992) $22,798©Median Effective Buying Income PerHousehold (1993) 0
Taxable Sales $8,801,837,000
Building Permits (Total Value)$690,506,000
GOVERNMENT
Type:CommissionerCommission/Manager
Zoning RegulationsPlanning Commission
23
noYes
YesYes
PINELLAS
Ad Valorem Millage Rate:Government 6.3910Special Districts 1.6308Schools 9.3590Total 17.3808
Are local option ad valorem taxexemptions available? no
Utility Service Tax/Range ...no/0.00%Local Option Sales Tax 1.00%Local Option Gasoline Tax ... $0.1060
per gallon
Number of Banks:
Domestic (1993) 249Foreign (1993) 0S&L Associations (1993) 39
Banks Financial
Domeitic (total deposits) $11,617,207Foreign (total assets) $0S&L Assoc (total savings). $1,820,722
Does local government issue industrialrevenue bonds? yesIs tax increment financingavailable? no
17 BEST COPY AVAILABLE

arnEv,Electricity
Power Suppliers: Florida Power,Tampa Electric Oldsmar
WaterSuppliers: Pinellas County - Citiesof St. Petersburg, DunedinWater Management District -Southwest FloridaMajor water source wellsWater available for new industry yes
Sanitation
Storm sewer yesSanitary sewer ycsSewage treatment type: secondary
Solid waste disposal. sanitary landfillOther resource recovery
Sewerage avail. for new industry
Natural Gas
Yes
Distributor: Peoples Gas, City ofClearwaterGas available for new industry yes
Other Fuel Sources
Number of Distributors Serving CountyFuel Oil 22Coal 0LP Gas 19
'SERVICES'
Computer Services yesEngineering yesPlating yesMachine Shop yesCar and Truck Rental yesSecurity Services yesJob Printing yesBonded Warehousing yesFreight Forwarder yes
-.INDUSTRIAL"` PARKS
Number of Industrial ParksDeveloped 67Developed acreage 3,904Acreage zoned formanufacturing 4,449.2
COUNTY ECONOMIC':;DEVECOPMENTa,:;..-
Foreign Trade Zone-closest. yesWorld Trade Council yesEnterprise Zone yes
MAJOR PRIVATE SECTOR7 EMPLOYERS.
Largest Employers/Product or Service/Total Employees:
1. Florida Power, UtilitiesEmployees 3,890
2. Times Publishing, Newspaper PublishingEmployees 3,606
3. Eckerd, Drug StoresEmployees 3,549
4. Home Shopping, Specialty RetailEmployees 3,400
5. Raymond James, Brokerage & FinancialEmployees 1,750
6. E-Systems, Communication EquipmentEmployees 1,700
7. AT&T Paradyne, Modems, NetworkEmployees 1,583
8. Honeywell, Space VehiclesEmployees 1,450
9. Essilor, Plastic LensEmployees 1,000
10. Val Pack, Direct Mail AdvertisingEmployees 845
24
Interstates/Turnpikes . 1. 1-2752. 1-75
Major Highways 1. US 19, SR 602. SR 688, SR 580
Railroads CSX
Major Commercial Airport ServingCounty: Tampa InternationalAilPortDistance from county seat.. 15 milesAverage no. of daily flights 574Airlines serving airport 25Length of longest runway ...11,000'
AIRPORT SERVICES OFFERED:
Charter yes
Private Aircraft Maintenance .... yes
Customs Port of Entry yes
Immigration
Air Cargo yes
International Air
yes
Yes
Local Commercial/Executive Airports:
1. St. Pete /Clearwater IntlRunway Length 8,500'Runway Surface AsphaltLighted Runway yesAircraft Tiedown yes
2. Albert WhittedRunway Length 3,702' IRunway Surface AsphaltLighted Runway yesAircraft Tiedown yes
Nearest Port with Docking Facilities: 111
1. Port of St. PetersburgDistance 0 miles IDepth 22'WarehousingStevedoring
2. Port of TampaDistance 15 milesDepth 34' IWarehousing yesStevedoring yes
Yesno I
1

Newspapers:
Lgst. LocalCirculation
Lgst. RegionalCirculation
Radio:
St. Petersburg Times450,750
Tampa Tribune391,434
Number of Radio StationsReceived 25 AM, 9 FM
Television:
Cable Available yesNumber of Non-cable ChannelsReceived 12
Telephone:
Telephone Service Company:General Telephone of Florida
Mail/Parcel:
Nearest Regional Mail HandlingFacility TampaParcel Service yesAir /Overnight Parcel Service yes
k-12'7-EDU-CAT ION
Schools Teachers Enrollment
Public 144 5,861 98,621
Private 99 994 14,119
State High School Competency TestPercent of 11th Graders PassingMath 85.00Communications 93.00
.POST:.SECONDARY
Colleges/Universities Serving the County:
1. University of South Florida2. Eckerd College3. Florida Institute of Technology4. University of Tampa5. Stetson Law School
Junior /Community Collegel within 50mile radius:
1. St. Petersburg Jr. College2. Schiller International College3. Hillsborough Community College
Vo-Tech Schools within 50 mile radius:
1. Pinellas Technical2. Florida Technical College3. Erwin Technical
Curriculum offered in Vo-Tech Schools:
Data Processing yesWelding and Cutting yesElectrical Wiring yesAviation/Avionics yesDrafting yesSheet Metal yesMachine Shop yesElectronic Technology yesLaser Electro Optics yesBiomedical Technology yesRobotics/Computer-aided Mad yes
MEDICAL
Hospitals 23Number of Beds 5,111
Nursing Homes 81
Number of Beds 9,241
Physicians 2,021Dentists 606
Motels 393Total Rooms Available 13,897
Hotels 34Total Rooms Available 4,680
Civic Auditoriums 4Total Seating Capacity 62,346
Regional Malls 10Shopping Centers 132
Libraries 21
Catholic 29
Jewish 12
Protestant 275Other 360
RECREATION
Tennis courts yesBeaches yesGolf courses yesCity/state parks yesBoating yesPublic swimming pools yesMovie theaters yesCountry clubs yesSymphony yesMuseums yesZoo yesPari-mutuel wagering yes
Primary Industrial DevelopmentContact:
St. Petersburg/Clearwater EconomicDevelopment Council2200 Tall Pines Drive, Suite 100Largo, FL 34641(813) 539-0200
Compiled byFlorida Department of CommerceDivision of Economic DevelopmentBureau of Economic Analysis(904) 487-2971
19 25 BEST COPY AVAILABLE

POPULATION OF PINELLAS COUNTY
Census Estimate Projected1990 1995 2000 2005 2010
TOTAL 851,659 876,200 907,298 937,698 967,803
GenderMale 397,549 411,378 431,172 448,116 464,145Female 454,110 466,921 476,126 489,582 503,658
0-14 127,275 138,986 142,874 141,466 136,60715-24 89,377 83,815 86,285 93,961 101,21925-44 242,085 239,396 229,916 212,726 201,38045-64 172,038 190,427 224,311 264,181 294,23065 & over 220,884 223,576 223,912 225,364 234,367
EthnicityWhite 773,732 790,637 813,871 836,494 858,619Black 66,088 71,847 77,642 83,301 89,093Others 11,839 13,716 15,785 17,903 20,091
SPX Office of Institutional ResearchSource: Bureau of Economic and Business Research
University of FloridaRevised: 7/17/96
2620

PINELLAS COUNTY
HIGH SCHOOL GRADUATES
AND PROJECTIONS
Year Number of Graduates
1980-81 5,6511981-82 5,6701982-83 5,2061983-84 5,1141984-85 5,0461985-86 4,8271986-87 5,0501987-88 5,5061988-89 5,4361989-90 5,0501990-91 4,9321991-92 4,8361992-93 4,7641993-94 4,7281994-95 4,5571995-96 4,3471996-97 4,6001997 -98 4,9091998-99 5,081
1999-2000 5,2642000-01 5,4392001-02 5,5662002-03 5,8282003-04 5,8582004-05 5,717
Note: Actual graduates 1980-81 through 1994-95.Projections 1995-96 through 2004-05
SPJC Office of Institutional ResearchSource: Division of Community Colleges
June 96Revised: 6/28/96

28
TA
BL
E 1
OPE
NIN
G F
AL
L H
EA
DC
OU
NT
EN
RO
LL
ME
NT
CR
ED
IT S
TU
DE
NT
S*
Fall
1927
- F
all 1
996
Fall
Num
ber
Perc
ent
Incr
ease
Fall
Num
ber
Perc
ent
Incr
ease
Fall
Num
ber
Perc
ent
Incr
ease
1927
-28
8719
47-4
846
01.
77%
1967
-68
9,07
24.
29%
1928
-29
186
113.
79%
1948
-49
398
-13.
48%
1968
-69
9,53
75.
13%
1929
-30
155
-16.
67%
5;19
49-5
047
920
.35%
1969
-70
9,50
9-0
.29%
1930
-31
173
11.6
1%19
50-5
145
1-5
.85%
1970
-71
9,81
53.
22%
1931
-32
185
6.94
%19
51-5
239
7-1
1.97
%19
71-7
29,
978
1.66
%19
32-3
321
114
.05%
1952
-53
431
8.56
%19
72-7
39,
398
-5.8
1%19
33-3
428
535
.07%
1953
-54
510
18.3
3%19
73-7
49,
759
3.84
%19
34-3
535
323
.86%
1954
-55
750
47.0
6%19
74-7
510
,675
9.39
%19
35-3
636
84.
25%
1955
-56
1,57
911
0.53
%.1
1975
-76
12,5
4617
.53%
1936
-37
323
-12.
23%
1956
-57
2,11
233
.76%
?:'
1976
-77
12,9
533.
24%
1937
-38
341
5.57
%19
57-5
82,
372
12.3
1%19
77-7
813
,288
2.59
%19
38-3
933
5-1
.76%
1958
-59
2,74
015
.51%
1978
-79
14,4
458.
71%
1939
-40
389
16.1
2%19
59-6
03,
324
21.3
1%19
79-8
014
,499
0.37
%19
40-4
138
5-1
.03%
1960
-61
3,59
98.
27%
1980
-81
15,4
306.
42%
1941
-42
317
-17.
66%
1961
-62
4,18
816
.37%
419
81-8
216
,106
4.38
%19
42 -
4315
9-4
9.84
%19
62-6
35,
021
19.8
9%19
82-8
316
,358
1.56
%19
43 -
4498
-38.
36%
1963
-64
5,32
05.
95%
1983
-84
16,6
171.
58%
1944
-45
137
39.8
0%19
64-6
56,
239
17.2
7%19
84-8
515
,865
-4.5
3%19
45-4
618
535
.04%
1965
-66
8,18
731
.22%
1985
-86
16,0
641.
25%
1946
-47
452
144.
32%
1966
-67
8,69
96.
25%
1986
-87
16,2
130.
93%
*Inc
lude
s au
dit s
tude
nts
taki
ng c
redi
t cou
rses
Not
e: 1
992-
93 in
flat
ed, h
urri
cane
req
uire
d da
tage
nera
tion
afte
r FI
E d
ate
Perc
ent
Fall
Num
ber
Incr
ease
1987
-88
16,5
992.
38%
1988
-89
17,9
197.
95%
1989
-90
18,0
190.
56%
1990
-91
18,7
193.
88%
1991
-92
19,2
712.
95%
1992
-93
20,7
937.
90%
1993
-94
20,4
82-1
.50%
1994
-95
19,6
62-4
.00%
1995
-96
19,2
07-2
.31%
1996
-97
17,5
35-8
.71%
SPJC
Off
ice
of I
nstit
utio
nal R
esea
rch
Sour
ce: P
SR 3
00 S
erie
sR
evis
ed: 9
/19/
9629
MN
MIN
IM
E M
I WM
MN
MN
WM
ME
IMP
MI M
O O
MM
MI
r M
N I
NS
1111
M

NM
IIII
IIIM
ISM
IN M
I NM
MR
1111
11=
I,M
IMI
MIN
MIM
IM
I MN
MI
IIIIII
1110
11=
I IN
N
Rep
ortin
gPe
rcen
tR
epor
ting
Yea
rN
umbe
rIn
crea
seY
ear
1928
-29*
5019
48-4
9
1929
-30*
43-1
4.0%
1949
-50
1930
-31*
38-1
1.6%
1950
-51
1931
-32*
6263
.2%
1951
-52
1932
-33*
49-2
1.0%
1952
-53
1933
-34*
7349
.0%
1953
-54
1934
-35*
64-1
2.3%
1954
-55
1935
-36*
8126
.6 %
:19
55-5
6
1936
-37*
9112
.3%
1956
-57
IJ19
37-3
8*11
122
.0%
1957
-58
to
1938
-39*
101
- 9.
0 %'.
1958
-59
1939
-40*
111
9.9%
^:
1959
-60
,-,
1940
41*
123
10.8
%19
60-6
1
1941
42*
84-3
1.7%
i'19
61-6
2
1942
-43*
17-7
9.8%
',19
62-6
3
1943
-44*
2547
,1%
1963
-64
1944
-45*
2916
.0%
i:
1964
-65
1
1945
-46*
4451
.7%
'19
65-6
6'
1946
-47
5320
.5%
,,19
66-6
7
1947
-48
108
103.
8%19
67-6
8
*Dip
lom
as w
ere
awar
ded
grad
uate
s th
ru 1
944-
45 s
choo
l yea
r.A
fter
194
4-45
Ass
ocia
tes
in A
rts
degr
ees
wer
e aw
arde
d.
TA
BL
E 2
HIS
TO
RY
OF
GR
AD
UA
TE
S
Num
ber
1928
-29
to 1
995-
96
Perc
ent
Rep
ortin
gIn
crea
seY
ear
Num
ber
Perc
ent
Incr
ease
85-2
1.3%
1968
-69
1,59
026
.5%
883.
5%19
69-7
01,
836
15.5
%
86-2
.3%
1970
-71
1,99
18.
4%°
882.
3%19
71-7
21,
943
-2.4
% :
.
880.
0%19
72-7
31,
740
- 10
.4 %
.
9811
.4%
1973
-74
1,84
05.
7%._
90-8
.2 %
,19
74-7
51,
953
6.1%
°
;1
142
57.8
%19
75-7
61,
917
-1.8
% :
161
13.4
%19
76-7
72,
042
6.5%
'
221
37.3
% -
1977
-78
2,00
9-1
.6%
:']:
187
-15.
4%19
78-7
92,
080
3.5%
f°71
220
17.6
% ''
,19
79-8
02,
065
-0.7
% t'
.'?fl
259
17.7
% ::
1980
-81
2,10
72.
0% .
313
20.8
%'j
1981
-82
2,57
922
A%
; i:
-
437
39.6
% ',
-.u.
1982
-83
2,24
3-1
3.0%
'r
476
8.9%
,19
83-8
42,
448
9.1%
''.
597
254%
!;:..
1984
-85
2,25
1-8
.0%
791
32.5
%19
85-8
619
92-1
1.5%
r'
979
23.8
% ..
:;19
86-8
72,
100
5.4 %
',
1,25
728
.4%
1987
-88
2,24
46.
9%
Rep
ortin
gPe
rcen
t
Yea
rN
umbe
rIn
crea
se
1988
-89
2,28
41.
8%
1989
-90
2,33
62.
3%
1990
-91
2,67
814
.6%
1991
-92
2,72
01.
6%
1992
-93
2,56
8-5
.6%
1993
-94
2,59
61.
1%
1994
-95
2,61
20.
6%
1995
-96
2,71
53.
9%
SPX
Off
ice
of in
stitu
tiona
l Res
earc
hSo
urce
: AA
-1A
rep
orts
Rev
ised
: 7/8
/96
3031

TABLE 3
OPENING FALL HEADCOUNT ENROLLMENT BY HOME CAMPUSCREDIT STUDENTS*Fall 1991 - Fall 1996
1991 1992 1993 1994 1995 1996
CLEARWATER 7930 8231 8131 7443 7339 669341.1% 39.6% 39.7% 37.9% 38.2% 38.3%
ST. PETERSBURG/G 9252 10098 9852 9625 9254 843048.0% 48.6% 48.1% 49.0% 48.2% 48.2%
TARPON SPRINGS 2087 2464 2499 2594 2614 234910.8% 11.9% 12.2% 13.2% 13.6% 13.5%
COLLEGE TOTAL" 19271 20793 20482 19662 19207 17535
*Includes audit students taking credit courses"College total includes any Open Campus enrollments
SPX Office of Institutional ResearchSource: PSR 300 SeriesRevised 9/17/96
24

TABLE 4
OPENING FALL HEADCOUNT ENROLLMENT BY GENDERCREDIT STUDENTS*Fall 1991 - Fall 1996
CLEARWATER Male
Female
1991 1992 1993 1994 1995 1996
3309
41.7%4621
58.3%
3375
41.0%4856
59.0%
3386
41.6%4745
58.4%
306741.2%
437658.8%
308642.0%4253
58.0%
2711
40.5%3982
59.5%
ST. PETERSBURG/G Male 3651 3933 3786 3613 3556 3145
39.5% 38.9% 38.4% 37.5% 38.4% 37.3%
Female 5601 6165 6066 6012 5698 5285
60.5% 61.1% 61.6% 62.5% 61.6% 62.7%
TARPON SPRINGS Male 770 879 895 990 967 852
36.9% 35.7% 35.8% 38.2% 37.0% 36.3%Female 1317 1585 1604 1604 1647 1497
63.1% 64.3% 64.2% 61.8% 63.0% 63.7%
COLLEGE TOTAL** Male 7731 8187 8067 7670 7609 6745
40.1% 39.4% 39.4% 39.0% 39.6% 38.5%
Female 11540 12606 12415 11992 11598 10790
59.9% 60.6% 60.6% 61.0% 60.4% 61.5%
70.0%
60.0%
50.0%
40.0%
30.0%
20.0%
10.0%
0.0%
*Includes audit students taking credit courses*College total includes any Open Campus enrollments
SPJC Office of Institutional ResearchSource: PSR 300 SeriesRevised 9/17/96

TABLE 5
OPENING FALL HEADCOUNT ENROLLMENTBY TYPE OF ATTENDANCE
CREDIT STUDENTS*Fall 1991 - Fall 1996
1991 1992 1993 1994 1995 1996
CLEARWATER Full-time 2485 2610 2293 2023 1982 1596313% 31.7% 28.2% 27.2% 27.0% 23.8%
Part-time 5445 5621 5838 5420 5357 509768.7% 683% 71.8% 72.8% 73.0% 76.2%
ST. PETERSBURG/G Full-time 2752 2882 2557 2541 2412 202229.7% 28.5% 26.0% 26.4% 26.1% 24.0%
Part-time 6500 7216 7295 7084 6842 640870.3% 71.5% 74.0% 73.6% 73.9% 76.0%
TARPON SPRINGS Full-time 647 740 660 685 676 56431.0% 30.0% 26.4% 26.4% 25.9% 24.0%
Part-time 1440 1724 1839 1909 1938 178569.0% 70.0% 73.6% 73.6% 74.1% 76.0%
COLLEGE TOTAL** Full-time 5886 6232 5510 5249 5070 420430.5% 30.0% 26.9% 26.7% 26.4% 24.0%
Part-time 13385 14561 14972 14413 14137 1333169.5% 70.0% 73.1% 733% 73.6% 76.0%
80.0%
70.0%
60.0%
50.0%
40.0%
30.0%
20.0%
10.0%
0.0%
*Includes audit students taking credit courses**College total includes any Open Campus enrollments
26
34
Office of Institutional ResearchSource: PSR 300 SeriesRevised 9/17/96

TABLE 6
OPENING FALL SEMESTERAVERAGE STUDENT ENROLLMENT LOAD BY CAMPUS
CREDIT STUDENTS*Fall 1991 - Fall 1996
1991 1992 1993 1994 1995 1996
CLEARWATER Student Semester Hrs 65045 67878 64156 58943 57870 51444
Student Headcount 7930 8231 8131 7443 7339 6693
Avg Student Loads 8.2 8.2 7.9 7.9 7.9 7.7
ST. PETERSBURG /G Student Semester Hrs 74877 81113 77096 75536 72515 54253
Student Headcount 9252 10098 9852 9625 9254 8430
Avg Student Loads 8.1 8.0 7.8 7.8 7.9 9.1
TARPON SPRINGS Student Semester Hrs 17319 20280 19977 20583 20322 18210
Student Headcount 2087 2464 2499 2594 2614 2349
Avg Student Loads 8.3 8.2 8.0 7.9 7.8 7.8
COLLEGEWIDE ** Student Semester Hrs 157274 169271 161229 155068 150707 135794
Student Headcount 19271 20793 20482 19662 19207 17535
Avg Student Loads 8.2 8.1 7.9 7.9 7.8 7.7
8.8
8.6
2 8.48.2
o8
Eo 7.8-> 7.6
7.4
7.200 en 'Cr VI k0 r." 00 Cr, e4 en Cr An VD
00 00 00 00 00 00 00 00 g r7N4
CrN
ON ON Cr% CK CT C1 CA ON C7, Crs
*Includes audit students taking credit courses and in-session at FIE date.**College total includes any Open Campus enrollments.
SPJC Office of Institutional ResearchSource: PSR 300 SummaryRevised: 9/20/96

TABLE 7
OPENING FALL HEADCOUNT ENROLLMENT BY RESIDENCYCREDIT STUDENTS*
Fall 1991 - Fall 1996
1991 1992 1993 1994 1995 1996CLEARWATER
In-district 7097 6702 7293 6150 6269 571789.5% 81.4% 89.1% 82.6% 85.4% 85.4%
Out-of-district 639 1306 698 1065 793 7238.1% 15.9% 8.5% 14.3% 10.8% 10.8%
Out-of-state 194 223 194 228 277 2532.4% 2.7% 2.4% 3.1% 3.8% 3.8%
ST. PETERSBURG/GIBBS
In-district 8598 8420 9144 8390 8150 742492.9% 83.4% 92.0% 87.2% 88.1% 88.1%
Out-of-district 484 1444 610 927 824 7515.2% 14.3% 6.1% 9.6% 8.9% 8.9%
Out-of-state 170 234 182 308 280 2551.8% 2.3% 1.8% 3.2% 3.0% 3.0%
TARPON SPRINGS
In-district 1752 1543 1887 1627 1608 144583.9% 62.6% 79.9% 62.7% 61.5% 61.5%
Out-of-district 316 893 450 938 984 88415.1% 36.2% 19.1% 36.2% 37.6% 37.6%
Out-of-state 19 28 24 29 22 200.9% 1.1% 1.0% 1.1% 0.8% 0.9%
COLLEGE TOTAL **
In-district 17448 16665 18324 16167 16027 1520890.5% 80.1% 89.5% 82.2% 83.4% 86.7%
Out-of-district 1439 3643 1758 2930 2601 18177.5% 17.5% 8.6% 14.9% 13.5% 10.4%
Out-of-state 384 485 400 565 579 5102.0% 2.3% 2.0% 2.9% 3.0% 2.9%
*Includes audit students taking credit courses
**College total includes any Open Campus enrollmentsSPJC Office of Institutional Research
Source: PSR 300 Series
Revised 9/26/96

TABLE 8
OPENING FALL HEADCOUNT ENROLLMENTBY ETHNICITY
CREDIT STUDENTS*Fall 1991 - Fall 1996
1991 1992 1993 1994 1995 1996
WHITE 17164 18273 17784 16835 16190 14752
89.1% 87.9% 86.8% 85.6% 843% 84.1%
BLACK 997 1191 1298 1319 1362 1306
5.2% 5.7% 63% 6.7% 7.1% 7.4%
HISPANIC 435 571 691 716 779 571
2.3% 2.7% 3.4% 3.6% 4.0% 3.3%
ASIAN 378 448 522 605 668 630
2.0% 2.2% 2.5% 3.1% 3.5% 3.6%
AMERICAN INDIANS 186 179 183 185 208 276
1.0% 0.9% 0.9% 1.0% 1.1% 1.6%
NOT KNOWN 111 131 4 2 0 0
0.6% 0.6% 0.0% 0.0% 0.0% 0.0%
100%
95%
90%
85%
80%
75%1991 1992 1993 1994 1995 1996
Not Known
0 American Indian
Asian
MI Hispanic
MI Black
White
*Includes audit students taking credit courses
29
Office of Institutional ResearchSource: PSR 300 SeriesRevised 9/17/96

TABLE 9
OPENING FALL HEADCOUNT ENROLLMENTBY PROGRAM OF STUDY
CLEAR WATER
A.A. Degree
1991
CREDIT STUDENTS*
Fall 1991 - Fall 1996
1992 1993 1994 1995 1996
522765.9%
5613
68.2%5814
71.5%5477
73.6%5099
69.5%4790
71.6%A.S. Degree 1322 1351 1363 1154 1147 958
16.7% 16.4% 16.8% 15.5% 15.6% 14.3%Other Personal Objectives 1381 1267 954 812 1093 945
17.4% 15.4% 11.7% 10.9% 14.9% 14.1%ST. PETERSBURG/G
A.A. Degree 6741 7239 7069 7033 6521 595472.9% 71.7% 71.8% 73.1% 70.5% 70.6%
A.S. Degree 1433 1584 1634 1584 1492 137815.5% 15.7% 16.6% 16.5% 16.1% 16.4%
Other Personal Objectives 1078 1275 1149 1008 1241 109811.7% 12.6% 11.7% 10.5% 13.4% 13.0%
TARPON SPRINGS
A.A. Degree 1466 1760 1782 1848 1950 181370.2% 71.4% 71.3% 71.2% 74.6% 77.2%
A.S. Degree 358 431 480 445 361 32717.2% 175% 19.2% 17.2% 13.8% 13.9%
Other Personal Objectives 263 273 237 301 303 20912.6% 11.1% 9.5% 11.6% 11.6% 8.9%
COLLEGE TOTAL *
A.A. Degree 13436 14612 14665 14358 13570 1258969.7% 70.3% 71.6% 73.0% 70.7% 71.8%
A.S. Degree 3113 3366 3477 3183 3000 266816.2% 16.2% 17.0% 16.2% 15.6% 15.2%
Other Personal Objectives 2722 2815 2340 2121 2637 227814.1% 133% 11.4% 10.8% 13.7% 13.0%
*Includes audit students taking credit courses"College total includes any Open Campus enrollmentsAA students include AA degree, dual credit and pre-limited
enrollment programsAS students include AS degree and vocational certificatesOPO students include students taking credit courses not
enrolled in any degree program
SPX Office of Institutional ResearchSource: PSR 300 SeriesRevised 9/19/96
BEST COPY AVAILABLE
3830

TABLE 10
OPENING FALL HEADCOUNT ENROLLMENT BYPROGRAM OF STUDY AND ETHNICITY
CREDIT STUDENTS*Fall 1991 - Fall 1996
1991 1992 1993 1994 1995 1996
WHITEA.A. Degree 11923 12770 12620 12202 11384 10548
A.S. Degree 2788 2972 3073 2756 2542 2264
Other Personal Objectives 2453 2531 2091 1877 2264 1940
BLACKA.A. Degree 755 896 1006 967 998 966
A.S. Degree 150 184 182 242 241 223
Other Personal Objectives 92 111 110 110 123 117
ASIANA.A. Degree 268 340 410 494 469 454
A.S. Degree 61 58 61 61 90 69
Other Personal Objectives 49 50 51 50 109 107
HISPANICA.A. Degree 295 384 492 556 576 424
A.S. Degree 61 95 138 102 95 72
Other Personal Objectives 79 92 61 58 108 75
AMERICAN INDIANA.A. Degree 109 124 135 138 143 197
A.S. Degree 37 33 22 22 32 40
Other Personal Objectives 40 22 26 25 33 39
NOT KNOWNA.A. Degree 86 98 2 1 0 0
A.S. Degree 16 24 1 0 0 0
Other Personal Objectives 9 9 1 1 0 0
*Includes audit students taking credit courses SPX Office of Institutional ResearchSource: PSR 300 SeriesRevised 9/19/96
313 9

TABLE 11
OPENING FALL HEADCOUNT ENROLLMENT BY AGECREDIT STUDENTS*Fall 1991 - Fall 1996
19 & UNDER
20 - 24
1991 1992 1993 1994 1995 1996
467024.2%
577630.0%
4683
22.1%
624629.5%
4487
21.2%
6100
28.8%
438422.3%
566328.8%
443923.0%
535627.9%
4131
23.6%
481027.4%
25 - 29 3010 3209 3248 3068 2951 286115.6% 15.2% 15.3% 15.6% 15.4% 16.3%
30 - 39 3667 4138 4249 4181 4009 349719.0% 19.5% 20.1% 213% 20.9% 19.9%
40 - 49 1649 1921 1846 1818 1820 16848.6% 9.1% 8.7% 9.2% 9.5% 9.6%
50 - 59 378 419 456 441 438 4532.0% 2.0% 2.2% 2.2% 23% 2.6%
60 & OVER 103 161 83 95 187 780.5% 0.8% 0.4% 0.5% 1.0% 0.4%
NOT KNOWN 18 16 13 12 7 210.1% 0.1% 0.1% 0.1% 0.0% 0.1%
Includes audit students taking credit courses SPX Office of Institutional ResearchSource: PSR 300 SeriesRevised 9/19/96
32
40

TABLE 12
AVERAGE AGE OF OPENING FALL HEADCOUNTENROLLMENT BY PROGRAM OF STUDY, GENDER
AND TYPE OF ATTENDANCECREDIT STUDENTS*
Fall 1991 - Fall 1996
Fall Program Males FemalesAll
Students
EEL ELI ELI Ea FT and PT
1991 A.A. Degree 20.8 25.5 21.0 27.5 24.7
A.S. Degree 27.1 28.8 28.5 31.0 29.6
Other Personal Objectives 21.3 32.3 20.4 34.2 32.3
All Groups 21.5 273 22.4 29.4 26.6
1992 A.A. Degree 21.4 25.8 21.4 27.8 25.1
A.S. Degree 27.5 30.8 29.5 31.7 30.6
Other Personal Objectives 20.5 32.8 20.7 34.3 32.6
All Groups 22.1 27.8 22.9 29.6 27.0
1993 A.A. Degree 21.4 25.9 21.2 27.9 25.4
A.S. Degree 29.7 29.9 29.6 31.6 30.6
Other Personal Objectives 20.8 31.9 20.2 34.0 32.3
All Groups 22.5 27.4 23.0 29.4 27.1
1994 A.A. Degree 21.3 25.7 21.6 28.1 25.6
A.S. Degree 30.2 30.7 30.1 31.9 31.1
Other Personal Objectives 19.9 31.9 19.8 34.0 32.3
All Groups 22.4 27.5 23.3 29.5 27.2
1995 A.A. Degree 21.1 25.2 20.7 27.5 25.1
A.S. Degree 30.6 31.8 29.7 32.1 31.5
Other Personal Objectives 23.4 34.5 23.2 36.0 34.4
All Groups 223 28.8 23.3 29.6 27.6
1996 A.A. Degree 21.5 25.1 21.2 27.3 25.1
A.S. Degree 30.4 32.1 29.5 32.8 32.1
Other Personal Objectives 23 33.7 21.7 34.5 32.8
All Groups 22.5 27.4 22.3 29.4 27.2
Includes audit students taking credit coursesCertificate enrollment in A.S. degree
SPX Office of Institutional ResearchSource: PSR 3YY ReportRevised: 10/03/96

TABLE 13
AVERAGE AGE OF OPENING FALL HEADCOUNTENROLLMENT BY PROGRAM OF STUDY AND ETHNICITY
CREDIT STUDENTS*Fall 1991 - Fall 1996
1991 1992 1993 1994 1995 1996WRITE
A.A. Degree 24.8 25.2 25.5 25.7 25.1 25.2A.S. Degree 29.8 30.8 30.8 31.4 31.8 32.3Other Personal Objectives 32.4 32.8 32.3 32.6 35.0 33.2All Groups 26.7 27.2 27.2 27.4 27.5 273
BLACKA.A. Degree 24.5 25.0 25.6 25.9 25.7 25.3A.S. Degree 28.8 29.3 29.4 30.0 30.3 30.5Other Personal Objectives 30.1 30.0 32.0 31.0 32.3 33.9All Groups 25.7 26.1 26.7 27.1 27.1 27.0
HISPANICA.A. Degree 23.0 24.7 24.6 24.6 24.4 24.9A.S. Degree 28.1 28.1 26.8 29.5 29.1 32.5Other Personal Objectives 33.0 30.0 31.4 28.0 29.7 29.9All Groups 26.1 26.2 25.7 25.6 25.7 26.5
ASIANA.A. Degree 23.3 23.4 23.4 23.1 23.2 23.5A.S. Degree 27.1 29.7 29.5 28.6 28.2 29.8Other Personal Objectives 28.8 30.8 34.5 26.2 28.1 27.6All Groups 24.6 25.0 25.2 23.9 25.7 24.9
AMERICAN INDIANA.A. Degree 26.0 25.8 26.9 26.3 26.6 24.5A.S. Degree 33.9 34.7 32.5 32.5 31.7 31Other Personal Objectives 33.2 32.0 33.0 35.2 36.4 31.5All Groups 29.1 283 28.4 28.2 29.0 26.4
NOT KNOWNA.A. Degree 22.3 22.4 24.5 27.0 N/A N/AA.S. Degree 23.3 25.5 32.0 N/A N/A N/AOther Personal Objectives 26.8 30.9 27.0 27.0 N/A N/AAll Groups 22.8 23.5 27.0 27.0 N/A N/A
*Includes audit students taking credit coursesCertificate in A.S. degree enrollmentN/A means data not available. The numberof students in the unknown category hassignificantly decreased (Fall 94 - 1, Fall 96 - 0).
BEST COPY AVAILABLE34
42
SPJC Office of Institutional ResearchSource: PSR 3YY ReportRevised: 10/3/96
II

TABLE 14
OPENING FALL HEADCOUNT ENROLLMENTBY CLASS STANDING
CREDIT STUDENTSFall 1990 - Fall 1995
1991 1992 1993 1994 1995 1996
1ST-TIME-IN-COLLEGE 3182 3551 2983 2922 2889 2422
16.5% 16.8% 14.6% 14.9% 15.0% 13.8%
OTHER FRESHMEN 7888 8393 8901 8001 7821 7383
40.9% 39.6% 43.5% 40.7% 40.7% 42.1%
SOPHOMORES 6065 6784 6283 6358 6222 5814
31.5% 32.0% 30.7% 32.3% 32.4% 33.2%
NON-DEGREE-SEEKING 2047 2316 2202 2234 2180 1846
10.6% 10.9% 10.8% 11.4% 11.4% 10.5%
AUDIT STUDENTS 89 133 113 147 95 70
0.5% 0.6% 0.6% 0.7% 0.5% 0.4%
COLLEGE TOTAL 19271 21177 20482 19662 19207 17535
*College total includes any Open Campus enrollments.
35
43
SPJC Office of Institutional ResearchSource: PSR310 & PSR3XX ReportsRevised: 10/3/96

TABLE 15
END OF FALL HEADCOUNT ENROLLMENT BY HOME CAMPUSCREDIT STUDENTS*
Fall 1991 Fall 1995
1991 1992 1993 1994 1995
CLEARWATER 9407 9205 9412 8563 828440.8% 39.2% 39.6% 37.3% 38.1%
ST. PETERSBURG/G 11118 11436 11408 11242 1052748.2% 48.7% 48.1% 49.1% 48.4%
TARPON SPRINGS 2533 2847 2927 3130 293711.0% 12.1% 12.3% 13.6% 13.5%
COLLEGE TOTAL** 23059 23488 23747 22935 21749
*Includes audit students taking credit courses**College total includes Open Campus student enrollments
36
SPJC Office of Institutional ResearchSource: PSR 300 SeriesRevised: 1/5/96
44

TABLE 16
END OF FALL TERM HEADCOUNT ENROLLMENT BY GENDERCREDIT STUDENTS*Fall 1991 - Fall 1995
CLEARWATER Male
Female
1991 1992 1993 1994 1995
3837
40.8%5570
59.2%
3735
40.6%5470
59.4%
388241.2%5530
58.8%
3498
40.9%5065
59.1%
3455
41.7%4829
58.3%
ST. PETERSBURG/G Male 4251 4399 4328 4229 3987
38.2% 38.5% 37.9% 37.6% 37.9%
Female 6867 7037 7080 7013 6540
61.8% 61.5% 62.1% 62.4% 62.1%
TARPON SPRINGS Male 936 986 1031 916 1080
37.0% 34.6% 35.2% 31.7% 36.8%
Female 1597 1861 1896 1974 1857
63.0% 65.4% 64.8% 683% 63.2%
COLLEGE TOTAL** Male 9025 9120 9241 8883 8523
39.1% 38.8% 38.9% 38.7% 39.2%
Female 14034 14368 14506 14052 13226
60.9% 61.2% 61.1% 61.3% 60.8%
70.0%
60.0%
50.0%
40.0%
30.0%
20.0%
10.0%
0.0%
*Includes audit students taking credit courses**College total includes Open Campus student enrollments
3745
SPJC Office of Institutional ResearchSource: PSR 300 3YYRevised: 1/5/96

TABLE 17
END OF FALL TERM HEADCOUNT ENROLLMENTBY TYPE OF ATTENDANCE
CREDIT STUDENTS*Fall 1991 - Fall 1995
CLEARWATER Full-time
1991 1992 1993 1994 1995
252426.8%
2630
28.6%2341
24.9%2071
24.2%2021
24.4%Part-time 6883 6575 7071 6492 6263
73.2% 71.4% 75.1% 75.8% 75.6%
ST. PETERSBURG/G Full-time 2811 2916 2639 2596 246725.3% 25.5% 23.1% 23.1% 23.4%
Part-time 8307 8520 8769 8646 806074.7% 74.5% 76.9% 76.9% 76.6%
TARPON SPRINGS Full-time 662 748 669 703 67626.1% 26.3% 22.9% 22.5% 23.0%
Part-time 1871 2099 2258 2427 226173.9% 73.7% 77.1% 77.5% 77.0%
COLLEGE TOTAL** Full-time 5998 6294 5649 5370 516426.0% 26.8% 23.8% 23.4% 23.7%
Part-time 17061 17194 18098 17565 1658574.0% 73.2% 76.2% 76.6% 763%
80.0%
70.0%
60.0%
50.0%
40.0%as
ar 30.0%
20.0%
10.0%
0.0%
II Full-time
Part-time
1991 1992 1993 1994 1995
*Includes audit students taking credit courses"College total includes Open Campus student enrollments
38
SPJC Office of Institutional ResearchSource: PSR 300 3YYRevised: 1/5/96
46

TABLE 18
END OF FALL HEADCOUNT ENROLLMENT BYPROGRAM OF STUDY
CREDIT STUDENTS*Fall 1991 Fall 1995
1991 1992 1993 1994 1995
CLEARWATERA.A. Degree 5707 5978 6000 5566 5596
60.7% 64.9% 63.7% 65.0% 67.5%
A.S. Degree 1422 1457 1517 1327 1232
15.1% 15.8% 16.1% 15.5% 14.9%
Other Personal Objectives 2278 1770 1895 1670 1456
24.2% 19.2% 20.1% 19.5% 17.6%
ST. PETERSBURG/GA.A. Degree 7422 7749 7387 7443 7225
66.8% 67.8% 64.8% 66.2% 68.6%
A.S. Degree 1617 1766 1837 1775 1599
14.5% 15.4% 16.1% 15.8% 15.2%
Other Personal Objectives 2079 1921 2184 2024 1703
18.7% 16.8% 19.1% 18.0% 16.2%
TARPON SPRINGSA.A. Degree 1643 1905 1861 2040 2117
64.9% 66.9% 63.6% 65.2% 72.1%
A.S. Degree 383 471 521 492 377
15.1% 16.5% 17.8% 15.7% 12.8%
Other Personal Objectives 507 471 545 598 443
20.0% 16.5% 18.6% 19.1% 15.1%
COLLEGE TOTAL **A.A. Degree 14773 15632 15248 15049 14938
64.1% 66.6% 64.2% 65.6% 68.6%
A.S. Degree 3422 3694 3875 3594 3209
14.8% 15.7% 16.3% 15.7% 14.8%
Other Personal Objectives 4864 4162 4624 4292 3602
21.1% 17.7% 19.5% 18.7% 16.6%
Includes audit students taking credit courses*College total includes Open Campus student enrollmentsCertificate enrollments in A.S. degreeAA students include AA degree, dual credit and pre-limited
enrollment programsAS students include AS degree and vocational certificatesOPO students include students taking credit courses not
enrolled in any degree program
39
SPJC Office of Institutional ResearchSource: PSR 300 3YYRevised: 1/8/96
47
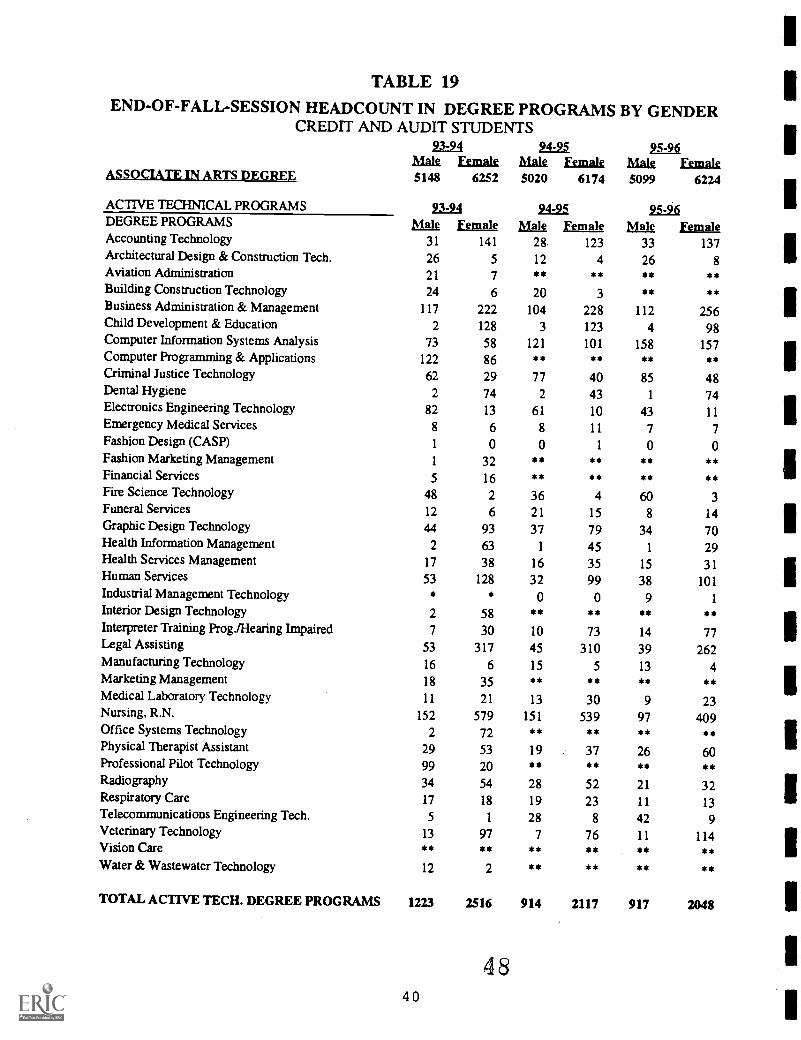
TABLE 19END-OF-FALL-SESSION HEADCOUNT IN DEGREE PROGRAMS BY GENDER
CREDIT AND AUDIT STUDENTS2124
Malt FemaleASSOCIATE IN ARTS DEGREE 5148 6252
ACTIVE TECHNICAL PROGRAMS 93-94DEGREE PROGRAMS IA& femaleAccounting Technology 31 141Architectural Design & Construction Tech. 26 5Aviation Administration 21 7Building Construction Technology 24 6Business Administration & Management 117 222Child Development & Education 2 128Computer Information Systems Analysis 73 58Computer Programming & Applications 122 86Criminal Justice Technology 62 29Dental Hygiene 2 74Electronics Engineering Technology 82 13Emergency Medical Services 8 6Fashion Design (CASP) 1 0Fashion Marketing Management 1 32Financial Services 5 16Fire Science Technology 48 2Funeral Services 12 6Graphic Design Technology 44 93Health Information Management 2 63Health Services Management 17 38Human Services 53 128Industrial Management Technology * *Interior Design Technology 2 58Interpreter Training Prog./Hearing Impaired 7 30Legal Assisting 53 317Manufacturing Technology 16 6Marketing Management 18 35Medical Laboratory Technology 11 21Nursing, R.N. 152 579Office Systems Technology 2 72Physical Therapist Assistant 29 53Professional Pilot Technology 99 20Radiography 34 54Respiratory Care 17 18Telecommunications Engineering Tech. 5 1
Veterinary Technology 13 97Vision Care ** **
Water & Wastewater Technology 12 2
TOTAL ACTIVE TECH. DEGREE PROGRAMS 1223 2516
4840
24,21Malt Female5020
94-95
6174
95-96
6224Mall Female5099
95-96MLLle Female Male femak
28 123 33 13712 4 26 8** ** ** **
20 3 ** **
104 228 112 2563 123 4 98
121 101 158 157** ** ** **
77 40 85 482 43 1 74
61 10 43 11
8 11 7 70 1 0 0
** ** ** **** ** ** **
36 4 60 321 15 8 1437 79 34 70
1 45 1 2916 35 15 3132 99 38 101
0 0 9 1
** ** ** **
10 73 14 7745 310 39 26215 5 13 4** ** ** **
13 30 9 23151 539 97 409** ** ** **
19 37 26 60** ** ** **
28 52 21 3219 23 11 1328 8 42 9
7 76 11 114** ** ** **** ** ** **
914 2117 917 2048
1

TABLE 19 Continued
CERTIFICATE PROGRAMS
Business Data ProcessingComputer Information ProcessingEmergency Medical TechnicianGuardianshipHealth Care ManagementLong Term Care SpecialistParamedicTOTAL TECHNICAL CERTIFICATES
TOTAL ACTIVE TECHNICAL PROGRAMS
93-94Male Female
24,25.Male emale
95-96Male, Female
* * * * 2 1
** ** 5* ** ** **
42 13 37 18 21 7
1 1 0 2 0 3
1 0 2 4 2 2
2 6 0 0 1 1
42 23 42 17 35 14
88 43 81 41 61 28
1311 2559 995 2158 978 2076
TECHNICAL PRE-LIMITED PROGRAMS 93-94
Pre-Dental HygienePre-Respiratory CarePre-NursingPre-Veterinary TechnologyPre-Physical Therapist AssistantPre-Emergency Medical ServicesPre-Medical Laboratory TechnicianPre-Health Information Mgmt (MRT)Pre-RadiographyPre-Health Services ManagementPre-Funeral ServicesPre-Criminal Justice TechnologyPathways Pre-Dental HygienePathways Pre-Respiratory CarePathways Pre-NursingPathways Pre-Physical Therapist Asst.Pathways Pre-Emergency Medical ServicesPathways Pre-Medical Laboratory Tech.Pathways Pre-Health Information Mgmt.Pathways Pre-RadiographyTOTAL PRE-LIMITED ENROLLMENT
INACTIVE TECHNICAL DEGREE TOTAL
INACTIVE TECHNICAL CERTIFICATE TOTAL
TOTAL TECH. DEGREE/PRE/CERTIFICATE
GRAND TOTAL (AA/PRE/TECHNICAL)
Male Female8 186
28 47233 1263
14 106187 39183 5517 4616 119
128 2295 98 8
39 151 41 1
2 192 11
0 01 00 22 1
775 2512
3 1
0 2
2089 5074
7237 11326
*Program did not exist**Program deletion occurred. Enrollment now shown with otherInactive Technical Degree or Certificate Programs for next five years.Note: Excludes students taking credit courses but not in degree programs.
4 941
2_4:25.
MAR Female95-96
aale Female8 205 7 165
27 48 26 45226 1130 165 946
24 157 14 160177 361 139 315104 63 90 47
14 38 12 369 118 4 98
95 192 75 1836 22 2 17
20 10 36 2233 22 36 23
1 2 0 5
1 4 1 02 13 2 294 10 1 8
0 0 0 00 0 0 1
0 1 0 1
3 9 2 6754 2405 612 2107
214 230 122 127
0 0 0 0
1963 4793 1712 4310
6983 10967 6811 10534
SPJC Office of Institutional ResearchSource: PISVED Report End-TermRevised 4/4/96

TABLE 20
END OF FALL HEADCOUNT ENROLLMENTBY ETHNICITY
CREDIT STUDENTS*Fall 1991 - Fall 1995
1991 1992 1993 1994 1995
WHITE 20480 20544 20648 19673 1835788.9% 87.5% 86.9% 85.7% 84.4%
BLACK 1251 1432 1535 1532 15505.4% 6.1% 6.5% 6.6% 7.1%
HISPANIC 546 643 769 827 8752.4% 2.8% 3.3% 3.7% 4.0%
ASIAN 439 501 576 679 7311.9% 2.1% 2.4% 3.0% 3.4%
AMERICAN INDIANS 219 219 219 222 2360.9% 0.9% 0.9% 1.0% 1.1%
NOT KNOWN 124 149 0 2 00.5% 0.6% 0.0% 0.0% 0.0%
105.0%
100.0%
95.0%
90.0%
85.0%
80.0%
75.0%1991 1992 1993 1994 1995
Not Known
Amer. Indian
II Asian
El Hispanic
Black
White
Includes audit students taking credit courses
42
SPJC Office of Institutional ResearchSource: PSR 300 3YYRevised: 1/5/96
50

TABLE 21
END-OF-FALL-SESSION HEADCOUNT IN PROGRAMS BY ETHNICITYCREDIT AND AUDIT STUDENTS
Associate in Arts Degree 1994-95 1995-96W 11 H A C) Total W B H A 0 'IW
9616 718 400 367 93 11400_ 9466 734 443 380 300 11323
1994-95 1995-96
A. S. Degree Programs W B H A 0 Total W B H A 0 Total
Accounting Technology 126 13 3 7 2 151'. 147 10 3 8 2 170
Architectural Design & Construction 15 1 0 0 0 16'- 30 1 1 1 1 34
Aviation Administration ** ** ** ** ** i*r' ** ** ** * ** **
Building Constniclion Technology 20 1 0 1 1 23 : ** 5* *5 ** *5 **
Business Administration & Management 291 18 11 10 2 332 291 27 11 6 33 368
Child Development and Education 98 23 5 0 0 126' 81 18 3 0 0 102
Computer Information Systems Analysis 172 15 16 16 3 222 249 25 17 15 9 315
Computer Programming and Application ** ** ** *5 *5 *5 ', ** *5 ** 5* ** **
Criminal Justice Technology 103 9 2 1 2 117 ,113 13 4 0 3 133
Dental Hygiene 41 3 1 0 0 45 67 2 2 0 4 75
Electronics Engineering Technology 61 4 3 2 I 71 45 4 1 3 1 54
Emergency Medical Services 18 1 0 0 0 19 11 1 2 0 0 14
Fashion Design (C.A.S.P.) 1 0 0 0 0 1 0 0 0 0 0 0
Fashion Marketing Management * ** * ** ** 0 ** ** ** 5* 5 5*
Financial Services ** *5 *5 ** ** 0 ** 5 * 55 5 *Fire Science Technology 37 1 1 0 1 40 , 59 2 0 0 2 63
Funeral Services 31 4 1 0 0 36' 16 5 1 0 0 22
Graphic Design Technology 106 2 4 2 2 116 86 3 2 4 9 104
Health Information Management (MRT) 38 8 0 0 0 46 27 2 1 0 0 30
Health Services Management 44 5 1 1 0 51 ' 38 3 3 0 2 46
Human Services 107 22 I 1 0 131 i 109 27 2 1 0 139
Industrial Management Technology * * * * , 9 0 0 1 0 10
Interior Design Technology ** *5 *5 *5 ** i * 5* *5 * ** *5
Interpreter Training Program 75 3 3 0 2 83 :: 82 5 3 0 1 91
Legal Assisting 313 31 8 1 2 355. 260 26 12 1 2 301
Manufacturing Technology 17 2 1 0 0 20 i. 14 2 0 1 0 17
Marketing Management ** ** ** ** ** **1,
** ** 5* ** *5 5*
Medical Laboratory Technology 35 3 2 2 1 43 , 28 0 0 3 1 32
Nursing (R.N.) 592 62 17 14 5 690 419 46 12 18 11 506
Office Systems Technology ** *5 ** *5 ** ** ** *5 *5 5* *5 0
Physical Therapist Assistant 43 10 2 1 0 56 72 10 3 1 0 86
Professional Pilot Technology ** ** ** ** *5 * ** *5 5* *5 *5 *Radiography 75 2 2 1 0 80 46 5 2 0 0 53
Respiratory Care 39 2 0 1 0 42 . 22 1 0 1 0 24
Telecommunications Engineering Tech. 28 7 1 0 0 36 i 37 9 4 0 1 51
Veterinary Technology 79 0 3 0 1 83 : 118 0 4 0 3 125
Vision Care ** ** *5 5* *5f-"
* *s as * as **
Water and Wastewater Technology ** ** ** ** **16
*4, *4, ** ** ** **
Total Active Tech. Degree Programs 2605 252 88 61 25 3031 E. 2476 247 93 64 85 2965
BEST COPY AVAILABLE
51L43

TABLE 21 Continued
Certificate Programs 1994-95 1995-96W B H A 0 Total W B H A 0 Total
Business Data Processing * a , 0 0 0 0 3 3Emergency Medical Technician 49 1 2 3 0 55: 24 2 0 0 2 28Guardianship 2 0 0 0 0 2' 3 0 0 0 0 3Health Care Services 6 0 0 0 0 6'. 4 0 0 0 0 4Long Term Care Specialist 0 0 0 0 0 0 ' 2 0 0 0 0 2Paramedic 45 0 1 2 1 49 45 0 1 2 1 49Total Technical Certificates 102 1 3 S 1 112 78 2 1 2 6 89
111111/ACIIILUShiliCHLPLIZIOnii 2707 253 91 66 26 3143 2554 249 94 66 91 3054
Technical Pre-Limited Programs 1994-95 1995-96W B H A 0 Total. W B H A 0 TotalPre-Dental Hygiene 191 5 8 4 5 213 ; 147 4 5 9 7 . 172Pre-Respiratory Care 57 12 4 2 0 75' 48 12 7 3 1 71Pre-Nursing 1090 163 54 30 19 1356 . 867 147 40 30 27 1111
Pie-Veterinary Technology 170 2 5 0 4 181 : 162 2 4 1 5 174Pre-Physical Therapist Assistant 444 43 29 13 9 538 , 367 46 26 11 4 454Pre-Emergency Medical Services 144 10 7 2 4 167. 120 9 5 1 2 137Pre-Medical Laboratory Technology 42 7 0 3 0 52 40 5 0 3 0 48Pre-Health Information Management 105 11 6 3 2 127 '. 86 6 6 3 1 102Pre-Radiography 251 8 17 9 2 287.., 225 11 11 4 7 258Pre-Health Services Management 26 0 1 1 0 28' 15 4 0 0 0 19Pre-Funeral Services 26 3 0 1 0 30' 45 12 1 0 0 58Pre-Criminal Justice Technology 46 7 1 1 0 55 i 44 11 1 2 1 59Pathways Pre-Dental Hygiene 2 1 0 0 0 3' 1 3 1 0 0 5Pathways Pre-Respiratory Care 5 0 0 0 0 5' 1 0 0 0 0 1Pathways Pre-Nursing 8 6 0 1 0 15:- 6 20 3 2 0 31Pathways Pre-Physical Therapist Assistant 6 6 2 0 0 14 3 4 0 0 2 9Pathways Pm-Emergency Med Services 0 0 0 0 0 .0 i 0 0 0 0 0 0Pathways PreMedical Laboratory Technology 0 0 0 0 0 0 't 0 0 1 0 0 1Pathways We-Health Information Management 0 1 0 0 0 1 ; 0 1 0 0 0 1Pathways We-Radiography 9 1 1 1 0 12 6 1 0 1 0 8Total Pre-Limited Enrollment 2622 286 135 71 45 3159
!2183 298 111 70 57 2719
I.Inactive Technical Degree Total 396 18 17 12 1 444 : 219 8 11 3 8 249
Inactive Tech. Certificate Total 1 0 0 0 0 1 0 0 0 0 0 0
Total Tech. Degree/Pre/Certificate 5726 557 243 149 72 6747 4956 555 216 139 156 6022
Grand Total (AA/Pre/Technical) 15342 1275 643 516 165 18147 14422 1289 659 519 456 17345
Program did not exist.
Program deletion occurred. Enrollment now shown withother Inactive Technical Degree or Certificate Programs for next five years.Note: Excludes students taking credit courses but not in degree programs.
544 52
SPJC Office of Institutional ResearchSource: PJSVED Report End-TermRevised 4/4/96
1
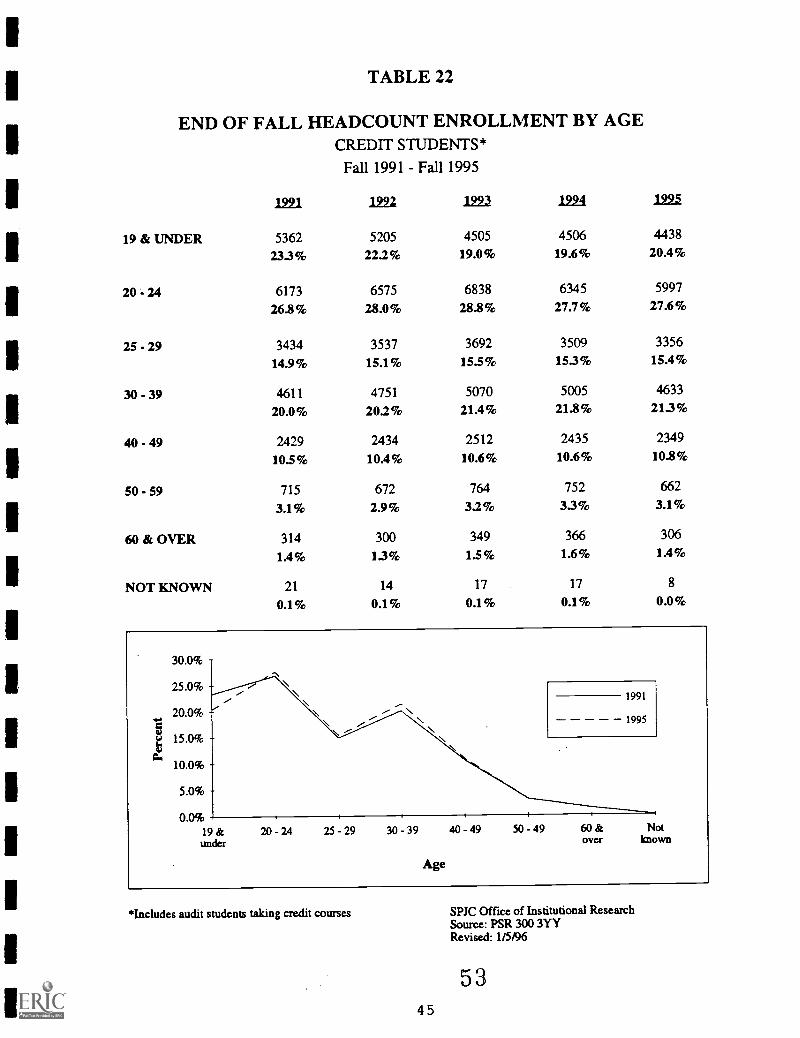
TABLE 22
END OF FALL HEADCOUNT ENROLLMENT BY AGECREDIT STUDENTS*
Fall 1991 - Fall 1995
1221 1222 1993 1224 1225
19 & UNDER 5362 5205 4505 4506 4438
23.3% 22.2% 19.0% 19.6% 20.4%
20 - 24 6173 6575 6838 6345 5997
26.8% 28.0% 28.8% 27.7% 27.6%
25 - 29 3434 3537 3692 3509 3356
14.9% 15.1% 15.5% 15.3% 15.4%
30 - 39 4611 4751 5070 5005 4633
20.0% 20.2% 21.4% 21.8% 213%
40 - 49 2429 2434 2512 2435 2349
10.5% 10.4% 10.6% 10.6% 10.8%
50 - 59 715 672 764 752 662
3.1% 2.9% 3.2% 33% 3.1%
60 & OVER 314 300 349 366 306
1.4% 13% 1.5% 1.6% 1.4%
NOT KNOWN 21 14 17 17 8
0.1% 0.1% 0.1% 0.1% 0.0%
*Includes audit students taking credit courses
45
SPJC Office of Institutional ResearchSource: PSR 300 3YYRevised: 1/5/96
53

TABLE 23
ACTUAL ANNUAL VS. STATE ASSIGNED STUDENT/EQUIVALENTSEMESTER HOUR ENROLLMENT BY COURSE CLASSIFICATION*
Reporting Year 1991-92 through 1995-96
1991-92 1992-93 1993-94 1994-95 1995-96ADVANCED & PROFESSIONAL
Actual SSH 266,632.0 269,280.0 262,908.0 251,379.0 241,705.0Assigned SSH 261,600.0 261,600.0 276,080.0 276,080.0 257,040.0Actual FTE 6,697.0 6,761.5 6,607.0 6,322.8 6,092.9Assigned FTE 6,540.0 6,540.0 6,902.0 6,902.0 6,426.0
POSTSECONDARY VOCATIONALActual SSH 113,658.0 117,045.0 119,117.0 109,576.0 103,360.0Assigned SSH 111,280.0 111,280.0 120,560.0 120,560.0 112,080.0Actual FTE 2,844.0 2,930.3 2,983.8 2,745.8 2,593.5Assigned FTE 2,782.0 2,782.0 3,014.0 3,014.0 2,802.0
PSAVActual ESH 249.0 189.0 42.0 0.0 0.0Assigned ESH 120.0 120.0 210.0 210.0 0.0Actual FTE 9.0 6.3 1.4 0.0 0.0Assigned FTE 4.0 4.0 7.0 7.0 0.0
VOCATIONAL SUPPLEMENTALActual ESH 7,597.5 6,735.3 9,013.9 10,741.0 11,017.8Assigned ESH 5,580.0 5,580.0 6,840.0 6,840.0 7,500.0Actual FTE 254.0 224.4 300.5 358.0 367.4Assigned FTE 186.0 186.0 228.0 228.0 250.0
COLLEGE PREPARATORYActual ESH 22,877.9 26,234.1 26,821.7 23,847.0 23,060.0Assigned ESH 22,950.0 22,950.0 27,420.0 27,420.0 26,730.0Actual FTE 763.0 874.5 894.1 796.4 770.0Assigned FTE 765.0 765.0 914.0 914.0 891.0
SUB-TOTAL FUNDED FTE **Actual SSH/ESH 411,014.4 419,483.4 417,902.6 395,543.0 379,142.8Assigned SSH/ESH 401,530.0 401,530.0 431,110.0 431,110.0 403,350.0Actual FIE* 10,567.0 10,797.0 10,786.8 10,223.0 9,823.8Assigned FTE** 10,277.0 10,277.0 11,065.0 11,065.0 10,369.0
LIFELONG LEARNING**Actual ESH 5,611.9 2,951.2 1,299.0 1,464.0 1,428.6Actual FTE 187.0 98.1 43.4 49.2 47.7
GRAND TOTALActual SSH/ESH 416,626.3 422,434.6 419,201.6 397,007.0 380,571.4Assigned SSH/ESH 401,530.0 401,530.0 431,110.0 431,110.0 403,350.0Actual FTE 10,754.0 10,895.1 10,830.2 10,272.2 9,871.5Assigned FTE 10,277.0 10,277.0 11,065.0 11,065.0 10,369.0
RECREATION & LEISURE***Actual ESH N/A N/A N/A N/A N/A
Data includes .25 for Dual Credit and Project Independence; excludesfee waivers, Lifelong Learning and Recreation/Leisure**These are the figures used as a basis for state funding. There is noassignment for Lifelong Learning. (Beginning 1992-93 only courserepeats are counted in LLL; grant discontinued). SPJC Office of Institutional Research***Recreation and Leisure is not reported on Student Data Base Source: Student Data Basereports. Revised: 11/13/96
BEST COPY MAILABLE46 54
1

TABLE 24
FULL TIME EQUIVALENT (FTE) BY SEMESTER AND SITE1994-95 THROUGH 1995-96
Clearwater
END
aummER
1994-95
END END
FALL SPRING
Advanced & Professional 371.5 1,014.1 912.2
Postsecondary Vocational 128.1 286.3 302.4
Supplemental Vocational 3.5 0.5 4.0
College Preparatory 46.5 162.7 119.2
Lifelong Learning 42 51 LITotal FIE 554.5 1,469.1 1,344.3
% of Collegewide Total 31.3% 33.1% 33.1%
St. Petersburg/GibbsAdvanced & Professional 479.8 1,219.6 1,125.0
Postsecondary Vocational 139.2 337.2 317.6
Supplemental Vocational 0.0 7.3 1.8
College Preparatory 55.9 186.5 138.6
Lifelong Learning 42 2.4 2 S2
Total FTE 679.2 1,760.0 1,592.0
% of Collegewide Total 38.4% 39.7% 39.1%
SeminoleAdvanced & Professional 0.0 16.7 15.5
Postsecondary Vocational 0.0 3.7 1.2
Supplemental Vocational 0.0 0.0 0.0
College Preparatory 0.0 2.7 1.4
Lifelong Learning LLD 9-1 1112
Total FTE 0.0 23.2 18.1
% of Collegewide Total 0.0% 0.5% 0.4%
Tarpon CenterAdvanced & Professional 101.1 303.7 266.8
Postsecondary Vocational 39.8 85.3 77.8
Supplemental Vocational 0.0 0.0 0.0
College Preparatory 9.5 46.2 27.2
Lifelong Learning 92 .L9 11Total FTE 151.3 436.8 373.3
% of Collegewide Total 8.6% 9.9% 9.2%
1995-96
TOTAL END END END TOTAL
YEAR aummER FALL SPRING YEAR
2,297.8 t .
716.88.04;
4'
328.4
192 -f3,367.9.32.7% ..
2,824.4r794.0 E.,
9.1
381.0P:.
22.7 [
4,031.2 'I-'
39.2% i,
32.2'IN,'
4.9 C.
0.04.1 ,,,.
9141.3
0.4%
671.6202.9,
0.0L.
82.9
343.9 944.9 886.7 2,175.5
119.8 292.8 282.9 695.5
0.7 0.5 2.8 4.045.4 157.5 120.2 323.1
al Li 54 152520.5 1,416.6 1,308.7 3,245.8
31.0% 33.4% 32.8% 32.8%
449.6 1,157.8 1,075.6 2,683.0
134.6 295.7 281.4 711.7
0.2 1.8 1.5 3.5
55.9 172.7 130.7 359.3
5,1 2-3. U 219645.8 1,637.3 1,496.4 3,779.5
38.5% 38.6% 37.6% 38.2%
0.0 18.3 13.8 32.1
0.0 1.5 1.3 2.8
0.0 0.0 0.0 0.0
0.0 1.3 0.8 2.1
ID ill QS/ 110.0 21.2 15.9 37.1
0.0% 0.5% 0.4% 0.4%
289.5 311.7 689.5
32.4 81.8 77.7 191.9
0.2 0.0 0.1 0.3
9.6 45.2 30.7 85.5
IQ a La LI 4.5961.4 131.5 418.3 421.9 971.7
9.4% 7.9% 9.9% 10.6% 9.8%

Carillon
END
SUMMER
TABLE 24
1994-95END END TOTAL
FALL SPRING YEAR
continued
1995-96END END END
SUMMER FALL SPRINGTOTALYEAR
Advanced & Professional 0.0 0.0 0.0 0.0 0.0 0.1 0.0 0.1Postsecondary Vocational 8.7 7.0 8.4 24.1 1.4 6.2 1.3 8.9Supplemental Vocational 5.2 9.4 8.4 23.0 10.7 14.7 8.1 33.5College Preparatory 0.0 0.0 0.0 0.0 0.0 0.0 0.0 0.0Lifelong Learning Q1 41Total FTE 14.1 163 16.9 47.5 12.1 21.1 9.4 42.6% of Collegewide Total 0.8% 0.4% 0.4% 0.5% 0.7% 0.5% 0.2% 0.4%
Health EducationAdvanced & Professional 0.0 0.0 1.8 1.8 0.7 0.0 1.5 2.2Postsecondary Vocational 113.7 371 334.2 818.9. 345.2 326.6 784.6Supplemental Vocational 6.7 7.7 3.6 18.0 10.1 9.2 13.5 32.8College Preparatory 0.0 0.0 0.0 0.0V 0.0 0.0 0.0 0.0Lifelong Learning Qd 92 11/ 1,/k la LS Q 2Total FTE 120.5 379.6 340.3 840.4 L 123.9 355.9 342.4 822.2% of Collegewide Total 6.8% 8.6% 8.4% 8.2% t'.. 7.3% 8.4% 8.6% 8.3%
Allstate CenterAdvanced & Professional 1.6 1.0 3.1 5.7 0.0 1.8 1.6 3.4Postsecondary Vocational 17.7 21.5 47.5 86.7 t; 18.0 41.7 48.3 108.0Supplemental Vocational 2.5 85.4 94.5 53.0 80.5 103.7 2College Preparatory 0.0 0.0 0.0 0.0 0.0 0.0 0.0 0.0Lifelong Learning ILA 9.2 ILITotal FTE 22.0 108.5 146.0 276.5 71.0 124.2 154.1 349.3% of Collegewide Total 1.2% 2.4% 3.6% 2.7% 4.2% 2.9% 3.9% 3.5%
Not Requiring Permanent FacilityAdvanced & Professional 128.4 179.1 181.8 489.3 134.2 192.9 180.0 507.1Postsecondary Vocational 25.3 36.2 36.0 97.5 22.6 34.2 33.3 90.1Supplemental Vocational 74.7 23.4 19.4 117.5 4. 17.8 18.2 20.1 56.1College Preparatory 0.0 0.0 0.0 0.0 0.0 0.0 0.0 0.0Lifelong Learning A2L 9.Z Ql ELI 2QTotal FTE 228.9 239.3 237.8 706.0 175.3 246.1 233.9 655.3% of Collegewide Total 12.9% 5.4% 5.8% 6.9% 10.4% 5.8% 5.9% 6.6%
CollegewideAdvanced & Professional 1,082.4 2,734.2 2,506.2 6,322.8 1,016.7 2,605.3 2,470.9 6,092.9Postsecondary Vocational 472.5 1,148.2 1,125.1 2,745.8 441.6 1,099.1 1,052.8 2,593.5Supplemental Vocational 92.6 133.7 131.7 358.0 92.7 124.9 149.8 367.4College Preparatory 111.9 398.1 286.4 796.4 110.9 376.7 282.4 770.0Lifelong Learning 111 121 421 121 222 1.C1 412Total FTE 1,770.5 4,433.0 4,068.7 10,272.2 1,672.6 4,226.9 3,972.0 9,871.5
4856
SPX Office of Institutional ResearchSource: Student Data BaseCreated: 7/24/96
TABLE 25
ANNUAL FULL-TIME-EQUIVALENT (FTE) ENROLLMENT BY DISCIPLINE *
21:22 92.93 93-94 94-95 2E2ADVANCED & PROFESSIONALBiological Science 350.0 355.6 340.4 311.7 242.4
Physical Sciences 621.0 627.4 629.6 613.9 566.0
Total Nat/Pbys Sciences 971.0 983.0 970.0 925.6 808.4
Fine and Applied Arts 707.0 762.4 736.8 710.6 735.2
Foreign Languages 223.0 216.1 202.6 199.0 177.1
Letters 1546.0 1573.1 1550.9 1532.7 1538.9
Total Letters/Languages 2476.0 2551.6 2490.3 2442.3 2451.2
Education 390.0 408.8 411.3 383.2 317.2
Mathematics 1286.0 1254.3 1237.5 1177.8 1142.1
Psychology 434.0 456.5 446.5 388.5 369.1
Social Sciences 919.0 876.0 818.1 768.6 794.1
Total Social Sciences 1353.0 1332.5 1264.6 1157.1 1163.2
library Science 1.4 0.4
Communications 221.0 228.6 233.3 235.4 210.4
Military Science 0.0 0.0 0.0 0.0 0.0
Interdisciplinary 2.5 0.0 0.0 0.0
TOTAL ADVANCED & PROFESSIONAL 6697.0 6761.3 6607.0 6322.8 6092.9
POSTSECONDARY VOCATIONALDistributive 61.0 62.3 65.6 53.7 50.3
Health 1212.0 1352.1 1413.8 1302.0 1208.4
Office 1243.0 1187.8 1167.6 1070.2 994.5
Trade and Industrial 180.0 175.8 190.2 164.4 171.6
Public Service 148.0 152.5 146.6 155.5 168.7
TOTAL POSTSECONDARY VOCATIONAL 2844.0 2930.5 2983.8 2745.8 2593.5
POSTSECONDARY ADULT VOC.Distributive 5.0 6.3 1.4 0.0 0.0
Office 4.0 0.0 0.0 0.0
TOTAL POSTSECONDARY ADULT VOC. 9.0 6.3 1.4 0.0 0.0
SUPPLEMENTAL VOCATIONALDistributive 3.0 1.8 12.4 7.9 6.6
Health 95.0 51.6 69.0 75.8 87.1
Home Economics 0.0 0.0 0.0 0.0 0.0
Office 37.0 36.8 25.3 57.2 55.6
Trade and Industrial 0.0 1.5 1.3 1.9 10.2
Public Service 119.0 132.8 192.5 215.2 207.9
TOTAL SUPPLEMENTAL VOCATIONAL 254.0 224.5 300.5 358.0 367.4
ADULT GENERAL EDUCATIONCollege Preparatory 763.0 874.5 894.1 796.4 770.0
lifelong Learning 187.0 98.0 43.4 49.2 47.7
TOTAL ADULT GENERAL EDUCATION 950.0 972.5 937.5 845.6 817.7
COMMUNITY INSTRUCTIONAL SERV.Recreational & Leisure
*** *** *5* *** ***n
TOTAL FIE (EXCLUDING C.LS.AND LIFELONG LEARNING) 10754.0 10895.1 10830.2 10272.2 9871.5
% INCREASE (DECREASE) OVER PREVIOUS YEAR 3.21% 1.31% -0.60% -5.15% -3.90%
*FIE have been adjusted for dual credit and Project Independence (as of 1991-92)students (+.25) and elimination of Sunshine State Skills & Fee Waivers. Also, in fall1990-91 selected biology and chemistry courses required by health educationstudents only were shifted to PSV category.**Postsecondary Adult Vocational Program created 1990-91***Not reported for 1991-92 on Student Data Base report.
49
Office of Institutional ResearchSource: Annual FIE ReportsRevised: 11/22/95
57

TA
BL
E 2
6
AN
NU
AL
UN
DU
PLIC
AT
ED
HE
AD
CO
UN
T E
NR
OL
LM
EN
TC
RE
DIT
AN
D N
ON
-CR
ED
IT S
TU
DE
NT
S19
68-6
9 th
roug
h 19
95-9
6
Rep
ortin
gY
ear
Cre
dit
Non
- C
redi
t
Tot
alR
epor
ting
Yea
rC
redi
tN
on-
Cre
dit
Tot
alN
umbe
rPe
rcen
tN
umbe
rPe
rcen
tN
umbe
rPe
rcen
tN
umbe
rPe
rcen
t
1968
-69
1188
787
.2%
1752
12.8
%13
639
1982
-83
2545
060
.5%
1660
339
.5%
4205
319
69-7
012
448
88.1
%16
7811
.9%
1412
619
83-8
426
251
60.8
%16
957
39.2
%43
208
1970
-71
1345
966
.7%
6734
33.3
%20
193
b19
84-8
526
569
62.9
%15
680
37.1
%42
249
1971
-72
1361
758
.4%
9717
41.6
%23
334
1985
-86
2737
164
.7%
1491
035
.3%
4228
119
72-7
313
071
55.1
%10
670
44.9
%23
741
1986
-87
2994
762
.2%
1820
037
.8%
4814
7U
,19
73-7
414
475
56.5
%11
160
43.5
%25
635
1987
-88
3006
757
.0%
2269
543
.0%
5276
219
74-7
516
104
56.6
%12
371
43.4
%28
475
1988
-89
3225
157
.6%
2378
042
.4%
5603
119
75-7
618
175
56.6
%13
916
43.4
%32
091
1989
-90
2883
851
.6%
2699
848
.4%
5583
619
76-7
718
595
56.2
%14
507
43.8
%33
102
1990
-91
3486
265
.9%
1805
0*34
.1%
5291
219
77-7
819
772
52.0
%18
252
48.0
%38
024
=19
91-9
235
134
61.1
%22
392*
38.9
%57
526
1978
-79
2249
455
.6%
1795
544
.4%
4044
919
92-9
336
024
61.1
%,
2290
9*38
.9%
5893
319
79-8
023
085
55.3
%18
681
44.7
%41
766
1993
-94
3713
556
.7%
2835
1*43
.3%
6548
619
80-8
124
192
55.6
%19
353
44.4
%43
545
1994
-95
3474
853
.2%
3058
6*46
.8%
6533
419
81-8
225
704
51.8
%23
965
48.2
%49
669
1995
-96
3287
754
.1%
2792
5*45
.9%
6080
2
*SPX
mai
ntai
ns s
epar
ate
stud
ent r
ecor
d sy
stem
s fo
r cr
edit
and
non-
cred
itst
uden
ts. T
here
are
sev
eral
type
s of
cou
rse
cate
gori
es w
ithin
the
non-
cred
itsy
stem
. Pri
or to
199
0-91
, the
hea
dcou
nt n
umbe
r fo
r no
n-cr
edit
stud
ents
repr
esen
ted
an u
ndup
licat
ed c
ount
with
in e
ach
of th
e va
riou
s no
n-cr
edit
cour
seca
tego
ries
. Beg
inni
ng 1
990-
91, t
he u
ndup
licat
ed h
eadc
ount
num
ber
repr
esen
tsan
und
uplic
ated
cou
nt b
etw
een
all n
on-c
redi
t cou
rse
cate
gori
es. H
owev
er th
ere
is s
till p
oten
tial d
uplic
atio
n be
twee
n cr
edit
and
non-
cred
it, i.
e.,
a st
uden
t who
take
sbo
th c
redi
t and
non
-cre
dit c
ours
es is
cou
nted
twic
e.
.c?
SPJC
Off
ice
of I
nstit
utio
nal R
esea
rch
Sour
ce: 1
968-
69 to
197
6-77
, Div
./Com
mun
ity C
olle
ges
"Rep
ort f
or F
lori
daC
omm
unity
Col
lege
s" 1
977-
78 to
199
4-95
, AA
-1A
, AA
-1B
, AA
-1C
, & E
A-3
Rev
ised
: 7/1
6/96
59
1111
1iM
I ill
1111
1111
1M
ilU
M M
il M
I- M
IN I=
INN
MIN
=II
MI

U,
MN
INN
En
NI
MI
III*
ME
IN
N A
M E
n N
E N
M M
N N
MI
TA
BL
E 2
7A
NN
UA
L U
ND
UPL
ICA
TE
D H
EA
DC
OU
NT
CO
MPA
RIS
ON
OF
EN
RO
LL
ME
NT
TO
CO
MPL
ET
ER
S B
Y G
EN
DE
R A
ND
ET
HN
ICIT
Y19
92-9
3 to
199
5-96
Rep
ortin
gY
ear
Prog
ram
Whi
teB
lack
His
pani
cA
sian
Am
. Ind
ian
Not
Kno
wn
Tot
als
emal
eM
ale
Fem
ale
Mal
eFe
mal
e M
ale
Fem
ale
Mae
Fem
ale
Mal
eFe
mal
eM
ale
rFe
mal
em
dcSu
m
92-9
3A
A D
egre
eE
7232
6432
631
352
187
210
154
209
8158
109
154
8395
7416
1581
1
C88
575
936
1714
1512
183
210
1396
082
417
84
AS
Deg
ree
E27
8113
4922
375
103
5558
3729
939
27 .
3233
1552
4785
C48
414
632
47
416
63
26
1t54
816
371
1
Voc
atio
nal
E67
136
311
165
510
03
05
9117
026
1
Cer
tific
ate
C20
260
09
25
90
20
01
3439
73
Voc
atio
nal
Pre-
Deg
ree
E27
7590
428
868
9138
5729
396
104
3260
1049
4309
Oth
er P
ers.
E60
8935
3442
116
916
613
212
382
6049
1419
6873
3985
1085
8
Obj
ectiv
esT
otal
E18
944
1235
515
6667
556
344
039
736
720
912
517
220
921
852
1417
236
024
C13
8993
168
2130
2133
336
616
1415
4210
2625
68
93-9
4A
A D
egre
eE
7301
6187
637
373
218
244
184
185
8261
102
109
8524
7159
1568
3
C88
069
851
1921
2218
98
59
898
776
117
48
AS
Deg
ree
E28
0414
4823
299
9466
5529
1910
3330
3237
1682
4919
C55
619
930
812
515
26
05
562
421
984
3
Voc
atio
nal
E51
113
29
32
03
10
10
5812
718
5
Cer
tific
ate
C0
30
10
01
00
00
01
45
Voc
atio
nal
E32
1810
8039
293
114
4973
3457
190
038
5412
7551
29
Pre-
Deg
ree
Oth
er P
ers.
E60
2638
3142
920
418
514
514
513
660
571
068
4643
7311
219
Obj
ectiv
es
Tot
alE
1940
012
659
1692
778
614
506
457
387
219
147
137
139
!.3
2251
914
616
3713
5
C14
3690
081
2833
2734
1114
514
13r
1612
984
2596
60
E =
Enr
ollm
ents
C =
Com
plet
ers
61

Rep
ortin
gY
ear
Prog
ram
Whi
teB
lack
TA
BL
E 2
7 C
ON
TIN
UE
D
His
pani
cA
sian
Am
. Ind
ian
Not
Kno
wn
Tot
als
Fem
ale
Mal
eFe
mal
e M
.&J'
emal
eM
akFe
mal
e ,M
ale
Fem
ale
NA
Fem
ale
Mal
ef7
'Fe
mal
eM
ale
Sum
94-9
5A
A D
egre
eE
7219
5874
599
400
242
259
223
215
6975
114
125
'..84
6669
4815
414
C89
265
237
1919
2217
2010
814
9 '
989
730
1719
AS
Deg
ree
E26
3813
4727
492
104
5344
3327
1539
29 "
3126
1569
4695
C54
820
927
827
82
62
210
5'61
623
885
4
Voc
atio
nal
E48
107
13
32
13
03
02
5312
017
3C
ertif
icat
eC
1816
10
10
11
01
00
2118
39
Voc
atio
nal
E26
7286
934
580
124
6160
3540
1420
532
6110
6443
25Pr
e-D
egre
e
Oth
er P
ers.
E52
5634
6237
518
518
511
614
611
357
6287
9761
0640
3510
141
Obj
ectiv
es
Tot
alE
1783
311
659
1594
760
658
491
474
399
193
169
260
258
2101
213
736
3474
8C
1458
877
6527
4730
2027
1211
2414
1626
986
2612
LP
95-9
6A
A D
egre
eE
7338
6022
679
412
309
231
253
9673
00
8653
7051
1570
4C
954
727
5224
2623
3629
53
00
1073
806
1879
AS
Deg
ree
E24
6312
7426
293
8655
5541
3119
00:
2897
1482
4379
C52
920
637
715
411
61
30
0`59
322
681
9
Voc
atio
nal
E51
102
11
13
12
01
00
;,154
109
163
Cer
tific
ate
C8
90
00
00
00
00
0''.
89
17r.
Voc
atio
nal
E22
5067
530
983
101
5458
2746
140
2764
853
3617
Pre-
Deg
ree
Oth
er P
ers.
E46
7031
7528
916
919
813
715
112
255
480
053
6336
5190
14O
bjec
tives
? !
Tot
alE
1677
211
248
1540
758
695
540
496
445
228
155
00
1 -119
731
1314
632
877
C14
9194
289
3141
2747
356
60
o'
,16
7410
4127
15
62E
= E
nrol
lmen
tsC
= C
ompl
eter
sSP
X O
ffic
e of
Ins
titut
iona
l Res
earc
h
Sour
ce: A
A-1
A R
epor
t Ser
ies
Rev
ised
: 7/1
5/96
63
MIN
MI
Mil
1111
EM
I =
I1.
111
illM
ISN
MI
MIM
I'M
IA
M il
lM
IN N
M M
INill

TABLE 28
ANNUAL UNDUPLICATED HEADCOUNT ENROLLMENT IN PROGRAMSCREDIT AND AUDIT STUDENTS
91-92 92-93 93-94 94-95 95-96
ASSOCIATE IN ARTS DEGREE 15600 15811 15683 15414 15704
ACTIVE TECHNICAL DEGREE PROGRAMS 21:22 92-93 93-94 94-95 95-96
Accounting Technology 202 203 229 212 228
Architectural Design & Construction Technology 41 39 44 31 46
Aviation Administration 31 30 38 ** **
Building Construction Technology 36 46 44 41 **
Business Administration & Management 457 490 484 478 478
Child Development & Education 112 160 177 200 154
Computer Information Systems Analysis 106 164 199 331 465
Computer Programming & Applications 268 275 297 ** **
Corrections 34 6 ** ** **
Criminal Justice Technology * 64 128 188 188
Dental Hygiene 73 53 78 50 78
Electronics Engineering Technology 123 115 130 103 77
Emergency Medical Services 5 14 23 31 36
Fashion Design (C.A.S.P.) 41 14 1 1 0
Fashion Marketing Management 41 59 37 ** **
Financial Services 60 41 27 ** **
Fire Administration 2 ** ** ** **
Fire Science Technology 49 75 72 65 81
Funeral Services * 2 24 46 55
Graphic Design Technology 111 157 177 159 145
Health Information Management 95 78 71 58 70
Health Services Management 93 87 86 66 64
Human Services 176 211 239 201 178
Industrial Management Technology * * * * 17
Interior Design Technology 87 93 89 ** **
Interpreter Training * 29 74 111 118
Law Enforcement 94 34 ** ** **
Legal Assisting 404 528 497 447 398
Manufacturing Technology 1 17 30 28 42
Marketing Management 84 89 65 ** **
Medical Laboratory Technology 39 37 47 44 34
Nursing, R.N. 729 828 848 745 630
Office Systems Technology 110 120 98 ** **
Physical Therapist Assistant 100 86 84 62 88
Professional Pilot Technology 183 182 157 ** **
Program for the Deaf 22 0 ** ** **
Radiography 123 130 94 92 80
Real Estate Management 19 11 ** ** **
Respiratory Care 56 35 54 53 58
Telecommunications Engineering Tech. * * 25 52 70
Veterinary Technology 160 158 126 193 182
Vision Care Technology 5 ** ** ** **
Water & Wastewater Technology 10 21 23 ** **
ACTIVE TECHNICAL DEGREE SUBTOTAL 4382 4781 4916 4088 4060
53 64

TABLE 28 Continued
ACTIVE TECH. CERTIFICATE PROGRAMS 91-92 92-93 93-94 94-95 95-96Computer Information Processing 2 31 0 0 0Emergency Medical Technician 125 122 89 84 53Health Care Services 19 7 15 14 23Paramedic 86 97 80 75 74ACTIVE TECH. CERTIFICATE SUBTOTAL 232 257 184 173 150
TECHNICAL PRE-LTD. PROGRAMS 91-92 92-93 93-94 94-95 95-96Pre-Dental Hygiene 227 283 264 278 215Pre-Respiratory Care 97 123 146 105 86Pre-Nursing 1782 2120 2331 1906 1558Pre-Veterinary Technology 89 137 180 167 202Pre-Physical Therapist Assistant 331 640 837 740 615Pre-Emergency Medical Services 166 216 239 228 183Pre-Medical Lab Technician 59 77 123 83 70Pre-Health Information Management 70 154 218 174 107Pre-Radiography 351 491 542 431 369Pre-Health Services Management * 5 27 33 26Pre-Funeral Services * 17 38 40 51Pre-Criminal Justice Technology * 17 89 85 88Pathways Pre-Dental Hygiene * 1 5 3 6Pathways Pre-Respiratory Care * * 7 7 3Pathways Pre-Nursing * 22 48 16 21Pathways Pre-Physical Therapist Assistant * 5 19 14 9Pathways Pre-Emergency Medical Services * * 0 0 0Pathways Pre-Medical Lab Technician * * 1 0 1
Pathways Pre-Health Information Management * * 2 1 1
Pathways Pre-Radiography * 1 13 14 6TECHNICAL PRE-LTD. SUBTOTAL 3172 4309 5129 4325 3617
INACTIVE TECHNICAL DEGREE TOTAL 37 4 3 607 319
INACTIVE TECHNICAL CERTIFICATE TOTAL 15 4 1 0 13
TOTAL TECH. DEGREE/PRE/CERTIFICATE 7838 9355 10233 9193 8159
GRAND TOTAL (AA/ PRE /TECHNICAL) 23438 25166 25916 24607 23863
*Program Did Not Exist**Program deletion occurred. Enrollment now shown withother Inactive Technical Degree or Certificate Programs for next five years.
6554
SPX Office of Institutional ResearchSource: AA-IA (PISVED)Revised: 7/19/96

TABLE 29
ANNUAL GRADUATES BY PROGRAM
91-92 92-93 93-94 94.95 95-96
ASSOCIATE IN ARTS DEGREE 1891 1784 1748 1719 1879
ACTIVE TECHNICAL DEGREE PROGRAMS 91-92 92-93 93-94 94-95 95-96
Accounting Technology 14 11 23 19 25
Architectural Design & Construction Tech 2 3 4 3 3
Aviation Technology/Administration 2 1 2 ** **
Bldg Construction Technology 3 2 2 4 **
Bus Administration/Management 39 33 24 27 41
Child Development & Education 5 5 14 18 8
Computer Information Systems Analysis 10 3 20 11 33
Computer Programming Applications 17 12 17 ** **
Criminal Justice Technology * 2 12 18 16
Dental Hygiene 31 39 33 39 38
Electronic Engineering Technology 8 8 8 10 6
Emergency Medical Services 4 8 17 28 17
Fashion Design (C.A.S.P.) 15 14 0 0 0
Fashion Marketing Management 4 4 0 ** **
Financial Services 12 3 3 ** **
Fire Administration 0 ** ** ** **
Fire Science Technology 3 4 2 7 8
Funeral Services * * 0 5 9
Graphic Design Technology 0 10 16 10 12
Health Information Management 15 30 21 31 33
Health Services Management 31 5 11 11 10
Human Services 9 3 17 12 8
Industrial Management Technology * * * * 0
Interior Design Technology 4 7 4 ** **
Interpreter Training * * 1 3 3
Law Enforcement 4 ** ** ** **
Legal Assisting 25 31 28 45 36
Manufacturing Technology * * 0 3 0
Marketing Management 11 10 12 ** **
Medical Laboratory Technology 10 4 17 15 9
Nursing, R.N. 268 317 377 332 302
Office Systems Technology 11 15 14 ** **
Physical Therapist Assistant 43 38 38 40 39
Professional Pilot Technology 8 5 8 ** **
Program for the Deaf 1 0 ** ** **
Radiography 32 31 36 33 30
Real Estate Management 0 0 ** ** **
Respiratory Care Technology 14 11 18 13 15
Telecommunications Engineering Tech. * * 0 0 4
Veterinarian Technology 26 35 40 39 50
Vision Care Technology 4 ** ** ** **
Water/Waste-Water Management 0 0 3 ** **
ACTIVE TECHNICAL DEGREE SUBTOTAL 685 704 842 776 755
TABLE 29 Continued
ACTIVE TECH. CERTIFICATE PROGRAMS 21-22 92-93 93-94 94-95 95-96Computer Information Processing (CASP) 26 0 0 0Emergency Medical Technology 130 44 0 26 1
Health Care Services 2 0 1 4 2Paramedics 3 3 4 9 1
ACTIVE TECH. CERTIFICATE SUBTOTAL 135 73 5 39 4
INACTIVE TECHNICAL DEGREE TOTAL 4 7 1 78 64
INACTIVE TECH. CERTIFICATE TOTAL 5 0 0 0 13
TOTAL TECH. DEGREE/CERTIFICATE 829 784 848 893 836
GRAND TOTAL (AA/TECHNICAL) 2720 2568 2596 2612 2715
Program Did Not ExistProgram deletion occurred. Enrollment now shown with otherInactive Technical Degree or Certificate Programs for next five years.
SPX Office of Institutional ResearchSource: AA- IA(PVEDCM)Revised: 7/17/96

MI
NM
OM
IO
NM
IMI
NM
MB
MI
MO
I= M
O M
O=
TA
BL
E 3
0R
EV
IEW
OF
AC
TIV
E A
.S. D
EG
RE
E P
RO
GR
AM
PER
FOR
MA
NC
E
PRO
GR
AM
AB
C
1995
-96
DE
F
Acc
ount
ing
Tec
hnol
ogy
432
4$
8.50
-$
11.5
022
825
21.0
31
Arc
h D
esig
n &
Con
st T
ech
q13
66.
50 -
10.
5046
316
.89
Bus
ines
s A
dmin
. & M
anag
emen
t4
669
7.20
- 1
1.81
483
4121
.031
Chi
ld D
evel
opm
ent &
Edu
catio
n33
85.
0315
48
18.4
8
Com
pute
r In
fo. S
yste
ms
Ana
lysi
s4
473
9.50
10.
6546
533
21.0
3 1
Cri
min
al J
ustic
e T
echn
olog
y4
128
9.61
- 1
2.50
188
1621
.31
Den
tal H
ygie
ne4
4115
.00
7838
7.10
Ele
ctro
nics
Eng
inee
ring
Tec
h.4
125
8.76
-9.
7377
613
.162
Em
erge
ncy
Med
ical
Ser
vice
sFi
re S
cien
ce T
echn
olog
yq 4
45 347.
507.
54 -
12.
4936 81
17 812
.75
10.6
3
Fune
ral S
ervi
ces
q16
9.62
559
18.1
2
Gra
phic
Des
ign
Tec
hnol
ogy
477
7.50
-9.
0014
512
25.5
53
Hea
lth I
nfor
mat
ion
Man
agem
ent
q47
8.55
7033
22.6
3
tfi
-.1
Hea
lth S
ervi
ces
Man
agem
ent
Hum
an S
ervi
ces
482 98
8.10
4.40
-5.
5764 17
810 8
14.3
5
Indu
stri
al M
anag
emen
t Tec
h.4
3110
.00
1721
.031
Inte
rpre
ter
Tra
in/H
eari
ng I
mpa
ired
J7.
2511
83
15.7
9
Leg
al A
ssis
ting
485
9.00
398
3621
.031
Man
ufac
turi
ng T
echn
olog
y4
125
7.50
-9.
7542
---
13.1
62
Med
ical
Lab
orat
ory
Tec
hnic
ian
-469
8.81
349
12.8
9
Nur
sing
, R.N
.4
830
13.1
263
030
210
.99
Phys
ical
The
rapi
st A
ssis
tant
q60
11.7
388
3919
.22
Rad
iogr
aphy
q88
9.00
8030
12.7
7
Res
pira
tory
Car
eq
439.
3158
156.
15
Tel
ecom
mun
icat
ions
Eng
. Tec
h.4
125
8.76
-9.
7370
413
.162
Vet
erin
ary
Tec
hnol
ogy
48
8.65
182
5012
.504
A =
Per
form
ance
Bas
ed F
undi
ng S
tatu
s (
.4 in
dica
tes
elig
ible
for
PB
F)B
= A
vaila
ble
Jobs
in T
ampa
Bay
Reg
ion
(Ann
ually
)C
= S
tart
ing
Wag
es f
or G
radu
ates
D =
Enr
ollm
ent H
eadc
ount
199
4-95
E =
Gra
duat
es 1
994-
95F
= P
rodu
ctiv
ity (
Stud
ent S
emes
ter
Hou
rs +
Ins
truc
tor
Equ
ated
Cre
dit H
ours
)G
= P
rodu
ctiv
ity (
Act
ual S
tude
nt S
emes
ter
flou
rs +
Bud
gete
d St
uden
t Sem
este
r H
ours
)H
= I
nstr
ucto
r R
atio
(70
:30)
1 D
ata
Con
solid
ated
for
Bus
ines
s T
echn
olog
ies
2Dat
a C
onso
lidat
ed f
or E
ngin
eeri
ng T
echn
olog
y3D
ata
Con
solid
ated
for
Fin
e &
App
lied
Art
s4D
ata
Con
solid
ated
for
Vet
erin
ary
Tec
h. A
. S. &
Dis
tanc
e L
rg.
68
GH
.811
62/3
81.8
2.8
1168
92/3
1811
.58
36/6
4.8
1162
/381
.87
.94
71/2
9.8
421.
0198
/ 2.3
0
59/4
12
13/8
7.7
315
/85
.98
.70
68/3
2351
/49
.54
49/5
1.4
967
/33
.811
62/3
811.
0831
/69
.811
.842
62/3
81
.59
1.04
759v
/429
12
91.
0894
/98
/6
.94
65/3
5.6
759
/412
.842
31/6
9
.784
76/2
44
SPJC
Off
ice
of I
nstit
utio
nal R
esea
rch
Sour
ce: A
. S. P
rogr
am P
erfo
rman
ce W
orks
heet
sR
evis
ed: 1
0/14
/96
69

TABLE 31
ANNUAL NON-CREDIT HEADCOUNT ENROLLMENTUNDUPLICATED WITHIN NON-CREDIT COURSE CATEGORY
1991-92 through 1995-96
1991-92* 1992-93* 1993-94* 1994-95* 1995-96*
POSTSECONDARY VOCATIONAL 11613 11367 15092 16485 15422SUPPLEMENTAL 50.6% 49.3% 52.1% 523% 53.8%
POSTSECONDARY ADULT 485 90 99 0 0VOCATIONAL 2.1% 0.4% 0.3% 0.0% 0.0%
ADULT GENERALLIFELONG LEARNING 4772 2056 0 960 758
20.8% 8.9% 0.0% 3.0% 2.6%
COMMUNITY INSTRUCTIONAL SERVICESRECREATIONAL AND LEISURE 6076 9541 13784 14101 12503
26.5% 41.4% 47.6% 44.7% 43.6%
TOTAL NON-CREDIT 22946 23054 28975 31546 28683
* The numbers are unduplicated within the non-credit course categories:postsecondary vocational supplemental, life-long learning and recreationaland leisure. When Supplemental, PAV, LLL & Recreational/Leisure are"unduplicated", the total non-credit unduplicated enrollment across coursecategories = 22,392 (91-92), 22,909 (92-93), 28,351 (93-94),30,586 (94-95) and 27,925 (95-96) (See Table 26).
58
SPJC Office of Institutional ResearchSource: AA-1C & EA-3 ReportsRevised 7/23/96
70

MN
NM
OM
NM
I=M
N N
M M
I MI
Ell
OM
MI
TA
BL
E 3
2
SPJC
ST
UD
EN
TS
TR
AN
SFE
RR
ING
IN
TO
TH
E S
TA
TE
UN
IVE
RSI
TY
SY
STE
MFa
ll 19
92 -
Fal
l 199
5
FAL
L 9
2SP
JCSU
SO
FFS
UFA
MU
USF
FAU
UW
FU
CF
FIU
UN
F
No
Deg
ree
314
4022
121
92
424
02
29.3
%33
.3%
17.3
%8.
3%30
.9%
100.
0%44
.4%
27.6
%0.
0%40
.0%
A. A
. Deg
ree
741
8010
411
477
04
611
3
69.2
%66
.7%
81.9
%67
.4%
0.0%
44.4
%70
.1%
100.
0%60
.0%
A. S
. Deg
ree
160
10
120
12
01.
5%0.
0%0.
8%0.
0%1.
7%0.
0%11
.1%
23%
0.0%
0.0%
Tot
al10
7112
012
712
708
29
87.1
5
Stat
ewid
e C
.C.
No
Deg
ree
4447
397
258
126
1118
626
287
669
595
371
31.7
%30
.0%
11.5
%55
.3%
41.7
%53
.2%
39.9
%22
.6%
34.8
%38
.4%
A. A
. Deg
ree
9339
910
1982
100
1528
523
410
2257
1057
572
66.6
%68
.8%
88.3
%43
.9%
57.0
%44
.4%
57.0
%76
.1%
61.9
%59
.2%
tit %C
.
A. S
. Deg
ree
227
1.6%
16
1.2%
4
0.2%
2
0.9%
36
1.3%
28
2.4%
223.
1%39
13%
563.
3%24
2.5%
Tot
al14
013
1323
2244
228
2682
1177
719
2965
1708
967
FAL
L 9
3SP
JCN
o D
egre
e31
219
333
218
34
292
1
32.6
%20
.9%
24.4
%25
.0%
36.3
%60
.0%
40.0
%30
.9%
33.3
%33
.3%
A. A
. Deg
ree
633
7110
29
374
26
634
2
66.2
%0.
0%75
.6%
75.0
%62
.3%
40.0
%60
.0%
67.0
%66
.7%
66.7
%A
. S. D
egre
e11
10
08
00
20
01.
2%1.
1%0.
0%0.
0%1.
3%0.
0%0.
0%2.
1%0.
0%0.
0%T
otal
956
9113
512
600
510
946
3
Stat
ewid
e C
.C.
No
Deg
ree
4571
317
411
151
1123
622
240
880
488
339
35.1
%35
.1%
23.7
%19
.8%
49.0
%48
.1%
54.3
%33
.5%
29.5
%37
.6%
A. A
. Deg
ree
8270
1008
1655
153
1185
513
445
2062
762
487
63.4
%75
.3%
79.8
%49
.7%
50.7
%44
.8%
62.1
%69
.2%
58.7
%57
.8%
A. S
. Deg
ree
195
137
427
1032
3848
16
1.5%
1.0%
0.3%
1.3%
1.2%
0.9%
4.5%
13%
3.7%
1.9%
Tot
al13
036
1338
2073
308
2335
1145
717
2980
1298
842
7172

73
FAL
L 9
4SP
JCSU
SO
F
TA
BL
E 3
2 C
ON
TIN
UE
D
FSU
FAM
UU
SFFA
UU
WF
UC
FFI
UU
NF
No
Deg
ree
348
3140
522
84
232
24
34.2
%29
.2%
35.7
%45
.5%
34.7
%44
.4%
22.2
%32
.0%
40.0
%44
.4%
A. A
. Deg
ree
650
7272
641
45
767
34
63.9
%67
.9%
64.3
%54
.5%
63.0
%55
.6%
77.8
%67
.0%
60.0
%44
.4%
A. S
. Deg
ree
203
00
150
01
01
2.0%
3.4%
0.0%
0.0%
2.3%
0.0%
0.0%
1.0%
0.0%
11.1
%
Tot
al10
1810
611
211
657
99
100
59
Stat
ewid
e C
.C.
No
Deg
ree
5255
569
566
153
1008
743
212
1009
577
418
38.9
%37
.3%
25.4
%52
.6%
42.9
%60
.2%
30.3
%35
.6%
41.6
%42
.9%
A. A
. Deg
ree
8074
946
1655
137
1308
489
469
1781
758
531
59.7
%62
.0%
74.3
%47
.1%
55.6
%39
.6%
67.0
%62
.8%
54.7
%54
.5%
A. S
. Deg
ree
197
105
136
219
4652
26
1.5%
0.7%
0.2%
03%
1.5%
0.2%
2.7%
1.6%
3.7%
2.7%
Tot
al13
526
1525
2226
291
2352
1234
700
2836
1387
975
FAL
L 9
5SP
JCN
o D
egre
e27
910
333
184
30
420
428
.5%
11.4
%28
.9%
33.3
%28
.8%
42.9
%0.
0%40
.0%
0.0%
66.7
%A
. A. D
egre
e61
977
806
440
36
23
2
63.3
%87
.5%
70.2
%66
.7%
68.7
%42
.9%
100.
0%1.
9%10
0.0%
33.3
%A
. S. D
egre
e80
11
016
10
610
08.
2%1.
1%0.
9%0.
0%2.
5%14
.2%
0.0%
58.1
%0.
0%0.
0%T
otal
978
8811
49
640
76
105
36
Stat
ewid
e C
.C.
No
Deg
ree
5331
282
581
136
1076
749
247
1078
799
383
39.3
%19
.3%
28.5
%51
3%45
.5%
60.0
%34
.7%
35.2
%56
.2%
39.2
%A
. A. D
egre
e78
3111
6514
5012
412
4446
444
318
1955
756
557
.8%
79.6
%71
.2%
46.8
%52
.5%
37.1
%62
.2%
59.3
%39
.2%
57.8
%A
. S. D
egre
e39
416
55
4736
2216
965
29
2.9%
1.1%
0.3%
1.9%
2.0%
2.9%
3.1%
5.5%
4.6%
3.0%
Tot
al13
556
1463
2036
265
2367
1249
712
3066
1421
977
Sour
ce: S
tate
Uni
vers
ity S
yste
m o
f Fl
orid
aSP
JC O
ffic
e of
Ins
titut
iona
l Res
earc
hR
evis
ed 1
2/12
/96
74
1111
1101
1111
1111
1111
1111
1111
1101
1111
1111
1111
1111
1111
1111
1111
1111
10=
1111
1111
1111
1111
11

TABLE 33
FIRST-TIME-TESTED STUDENTS' CLAST PASSING RATESMARCH 1989 - FEBRUARY 1996
Test Date
Oct 1989
ESSAY Ej4GLISH LANG. READING MATHENLATICS ALL SUBTESTS
NumberTested
PercentPassing
NumberTested
PercentPassing
Number PercentTested P. sing
NumberTested
PercentEasing
NumberTested
PercentEasing
SPJC 756 92 756 79 756 90 756 85 756 66
Statewide CC 11032 89 11047 76 11050 83 11047 77 11002 59
Statewide All 18723 91 18752 80 18754 86 18750 81 18668 66
Mar. 1990SPJC 1135 94 1136 76 1136 87 1136 81 1134 63
Statewide CC 19854 87 19878 68 19879 67 18742 67 19792 49
Statewide All 31180 90 31207 75 31209 81 31163 75 31086 59
June 1990SPJC 755 94 754 83 754 84 754 84 753 65
Statewide CC 10021 89 10043 73 10040 70 10038 75 9990 52
Statewide All 12495 90 12520 76 12518 73 12520 77 12466 56
Oct 1990SPJC 767 94 767 81 767 82 767 88 766 66
Statewide CC 9145 91 9171 77 9168 75 9160 79 9118 57
Statewide All 16201 93 16243 81 16239 79 16235 82 16160 64
Feb. 1991
SPJC 956 93 955 79 962 81 954 83 953 63
Statewide CC 12201 92 12207 75 12211 74 12192 76 12172 54
Statewide All 18640 93 18648 79 18651 77 18639 80 18598 60
June 1991SPJC 918 95 916 77 917 73 916 83 914 57
Statewide CC 10709 92 10713 75 10711 67 10704 78 10667 52
Statewide All 13907 93 13915 77 13911 70 13896 80 13844 56
Oct. 1991
SPJC 760 92 762 80 762 79 762 78 759 57
Statewide CC 9206 92 9214 78 9215 75 9207 78 9184 56
Statewide All 16020 93 16035 82 16034 78 16022 81 15976 62
Feb. 1992SPJC 1022 92 1022 76 1021 79 1023 76 1020 55
Statewide CC 11902 92 11925 74 11923 74 11921 74 1 1885 51
Statewide All 18708 93 18731 78 18728 78 18710 78 18656 57
June 1992SPJC 781 93 781 77 781 76 780 77 779 54
Statewide CC 8421 92 8427 77 8426 70 8410 75 8396 53
Statewide All 10710 93 10717 78 10717 72 10707 77 10676 56
Oct. 1992SPJC 570 86 569 74 570 74 568 64 568 46
Statewide CC 8258 86 8261 75 8261 69 8244 66 8230 47
Statewide All 15701 88 15708 80 15704 75 15678 71 15646 55
Feb. 1993SPJC 901 86 905 78 905 80 904 69 900 51
Statewide CC 11204 87 11214 76 11215 76 11206 69 11178 50
Statewide All 18350 88 18361 80 18360 79 18347 74 18309 56

Table 33 Continued
Test Date
ESSAYNumberTested
Percent
Passing
ENGLISH LANG READING MATHEMATICS ALL SUBTESTSNumber
TestedPercent
passingNumberTested
Percent
PassingNumberTested
Percent
Passing
NumberTested
Percent
EwingJune 1993
SPJC 683 89 681 79 680 85 680 73 680 57Statewide CC 7508 87 7508 77 7508 78 7502 71 7488 53Statewide All 1024.8 88 10246 79 10244 79 10244 72 10219 56
Oct 1993SPJC 668 87 669 73 670 84 668 75 665 54Statewide CC 9319 86 9325 74 9323 78 9302 73 9269 52Statewide All 17482 88 17501 80 17500 82 17469 77 17416 59
Feb. 1994SPJC 882 85 881 79 880 80 878 71 878 52Statewide CC 10995 84 10997 78 10996 75 10940 69 10911 51Statewide All 18913 87 18910 81 18910 79 18848 74 18804 57
June 1994SPJC 631 84 630 73 630 80 629 69 629 49Statewide CC 7604 84 7607 74 7606 76 7579 70 7543 50Statewide All 10388 85 10392 76 10390 78 10365 72 10319 53
Oct. 1994
SPJC 711 84 712 74 712 88 712 75 711 55Statewide CC 9386 86 9389 73 9389 84 9353 73 9308 53Statewide All 18023 88 18018 78 18016 87 17965 77 17910 60
Feb. 1995
SPJC 774 83 775 76 775 86 773 67 770 51Statewide CC 11022 83 11032 74 11031 82 11006 68 10935 49Statewide All 19592 85 19595 78 19591 85 19558 72 19469 56
June 1995
SPJC 467 89 468 79 468 78 467 70 465 55Statewide CC 7484 86 7494 77 7485 70 7463 70 9417 49Statewide All 10752 87 10766 79 10755 73 10739 72 10669 53
Oct 1995SPJC 702 84 704 72 703 83 703 65 699 46Statewide CC 7795 83 7797 73 7796 78 7703 64 7676 46Statewide All 16169 87 16175 78 16169 82 16059 70 16010 54
Feb. 1996
SPJC 859 90 859 76 859 83 860 66 859 50Statewide CC 8718 86 8721 73 8727 76 9047 64 8506 47Statewide All 16619 88 16638 78 16644 81 16959 69 16386 53
June 1996
SPJC 324 81 324 57 322 64 349 62 316 36Statewide CC 4373 81 4376 61 4373 66 4930 60 4093 39Statewide All 6367 82 6365 64 6378 68 7213 62 5937 41
Oct. 1996
SPJC 362 75 362 77 363 68 407 61 345 40Statewide CC 4149 74 4151 73 4175 61 5104 56 3746 37Statewide All 7646 77 7653 76 7687 66 9437 60 6769 41
"Statewide All" consists of all public state universities and community colleges only.
BEST COPY AVAILABLE
62
SPJC Office of Institutional Research
Source: Testing Office
Revised 1/15/97
76
III
II
1
1
I111
1

TABLE 34
FIRST - TIME -IN- COLLEGE STUDENTS'PLACEMENT TESTS PASSING/FAILING RATES*
1991-92 to 1995-96
No College CollegePreparatory Preparatory
Courses Required Courses Required
EntryLevel Test
NumberTested Number percent
1991-92 Reading 4632 3681 79.5
Writing 4616 3240 70.2
Mathematics 4655 2040 43.8
1992-93 Reading 4791 3672 76.6
Writing 4771 3166 66.4
Mathematics 4811 1606 33.4
1993-94 Reading 4130 3220 78.0
Writing 4131 2768 67.0
Mathematics 4137 1318 31.9
1994-95 Reading 3387 2570 75.9
Writing 3378 2164 64.1
Mathematics 3382 1117 33.0
1995-96 Reading 3426 2649 77.3
Writing 3420 2187 63.9
Mathematics 3445 1172 34.0
/slumber Percent
951 20.5
1376 29.8
2615 56.2
1119 23.4
1605 33.6
3205 66.6
910 22.0
1363 33.0
2819 68.1
817 24.1
1214 35.9
2265 67.0
777 22.7
1233 36.1
2273 66.0
*Based on State established scores. Office of Institutional ResearchSource: Entry Level Test Report
Student Data BaseRevised: 7/19/96
77
63

TABLE 35
HEALTH EDUCATION STUDENTS' NATIONAL AND STATEEXAMINATION PASSING RATES
1990-91 through 1995-96
1990-91 1991-92National Exams
Dental Hygiene 100 100
Funeral ServicesHealth Info Management 85.7 96Health Services
Administration 100 **
Medical Laboratory Technician 100
Radio logic Technician 100 100
Respiratory Care 91 100
Veterinary Technology 92.3 87
State ExamsDental Hygiene
Written 96 100
Clinical 100 97
Emergency Medical Services 92 86.4Funeral ServicesMedical Laboratory Technician 100 100
Nursing
July 92 88February 91 93SeptemberMarch
Paramedic 100 91.1
Physical Therapy Assistant 100 100
Veterinary Technology* 92.3 87
* Test Optional**Test results not available at this time
64
1992-93 1993-94 1994 -95 1995-96
100 100 100 100
100 100 100
64.3 88.5 70.4
** ** **
93 89 100
100 100 100 100
100 100 100
94 94 89 100
100 100 93 100
97.4 100 90 8690 77.9 91.6 86.8
100
100 100 100 100
92 ** **
91 93 **
89 91
86 8698 86.3 91.2 75.0100 100 97.4 92.394 85 76
Office of Institutional ResearchSource: Provost Office, HECRevised: .12/12/96
78

TA
BL
E 3
6
PLA
CE
ME
NT
AN
D F
OL
LO
W-U
P R
EPO
RT
1992
-93
thro
ugh
1994
-95
Pro
gram
Nam
e
1992
-93
1993
-94
1994
-95
Pssl
Mili
tary
Con
t.E
mp.
inad
dT
otal
Plas
zr9
&P.
221
Mili
tary
Con
t.Fl
oc,
Em
p. in
Hel
dT
otal
Baw
lS.
Pad
Mili
tary
Con
t.E
A=
Em
p. in
Fiel
dT
otal
Mos
t
Acc
ount
ing
Tec
hnol
ogy
91
78
8919
413
1789
151
1415
100
Arc
hite
ct D
esig
n &
Con
st. T
ech.
32
267
33
310
02
11
210
0
Avi
atio
n A
dmin
istr
atio
n0
00
22
210
07
51
686
Bui
ldin
g C
onst
ruct
ion
Tec
h2
22
100
22
210
04
13
410
0
Bus
ines
s A
dmin
istr
atio
n &
Mgm
t.31
326
2994
223
1821
9523
122
2310
0
Chi
ld D
evel
opm
ent a
nd E
duca
tion
43
375
1211
1192
141
1314
100
Com
pute
r In
fo. S
yste
ms
Ana
lysi
s0
00
183
1215
838
17
810
0
Com
pute
r Pr
ogra
m &
App
licat
ion
107
770
154
1014
939
17
889
Cri
min
al J
ustic
e T
echn
olog
y1
11
100
113
710
9117
1414
82
Den
tal H
ygie
ne38
3838
100
3130
3097
3535
3510
0
Ele
ctro
nics
Eng
inee
ring
Tec
h8
44
810
08
14
38
100
103
710
100
Em
erge
ncy
Med
ical
Ser
vice
s8
88
100
172
1517
100
264
2226
100
Em
erge
ncy
Med
ical
Tec
h, C
ert
4312
2436
840
00
257
1320
80
Fash
ion
Mar
ketin
g M
anag
emen
t3
11
330
00
11
110
0
Fina
ncia
l Ser
vice
s3
33
100
c3
33
100
00
0
Fire
Sci
ence
Tec
hnol
ogy
33
310
02
22
100
76
686
Fune
ral S
ervi
ces
00
00
00
44
410
0
Gra
phic
Des
ign
Tec
hnol
ogy
101
78
8015
57
1280
101
78
80
Os
Hea
lth I
nfor
mat
ion
Man
agem
ent
2928
2897
211
2021
100
261
2526
100
titH
ealth
Ser
vice
s M
anag
emen
t4
44
100
103
69
9011
37
1091
Hea
lth C
are
Serv
ices
, Cer
t.0
01
I1
100
11
110
0
Hum
an S
ervi
ces
Tec
hnol
ogy
21
150
143
1114
100
104
610
100
Inte
rior
Des
ign
Tec
hnol
ogy
62
35
833
22
674
13
410
0
Inte
rpre
ter
Tra
inin
g Pr
ogra
m0
00
11
110
03
33
100
Leg
al A
ssis
ting
293
2528
9724
319
2292
401
3334
85
Lon
g T
erm
Car
e Sp
ecia
list
00
00
00
00
0
Man
ufac
turi
ng T
echn
olog
y0
00
00
02
11
210
0
Mar
ketin
g M
anag
emen
t8
44
508
14
563
92
68
89
Med
ical
Lab
orat
ory
Tec
hnol
ogy
44
410
016
1616
100
141
1213
93
Nur
sing
300
629
229
899
332
1831
132
999
315
1829
531
399
Off
ice
Syst
ems
Tec
hnol
ogy
141
1213
9311
18
982
92
79
100
Para
med
ic2
22
100
41
34
100
91
89
100
Phys
ical
The
rapi
st A
ssis
tant
3736
3697
381
3738
100
3939
3910
0
Prof
essi
onal
Pilo
t Tec
hnol
ogy
42
250
71
32
686
81
67
88
Rad
iogr
aphy
311
3031
100
362
3436
100
331
3233
100
Res
pira
tory
Car
e11
1111
100
161
1516
100
121
1112
100
Vet
erin
ary
Tec
hnol
ogy
3029
2997
352
3032
9136
134
3597
Wat
er/W
aste
-Wat
er0
00
33
310
01
11
100
TE
CH
NIC
AL
/VO
CA
TIO
NA
L68
70
3861
565
395
760
271
658
731
9679
92
6570
677
397
A &
P17
813
1397
1400
7917
4412
7912
7973
1702
1219
6712
8676
TO
TA
L24
683
1435
615
2053
8325
042
1350
658
2010
8025
012
1284
773
2059
80
Del
eted
Pro
gram
in A
aale
mie
Yea
r 19
94-9
5as
Del
eted
Pro
gram
in A
cade
mie
Yea
r 19
95-9
6
NO
TE
: The
Mal
poo
l is
base
d on
ly o
n th
ose
mat
ches
whe
re a
trai
ning
rel
ated
dec
isio
n w
as m
ade.
Plac
emen
t rat
es d
o no
t inc
lude
thos
e re
cord
s w
ithou
t mat
ch d
ata,
or
thos
e th
at a
re u
nder
tenn
inab
le o
r un
suab
le.
App
endi
x B
pro
vide
s in
form
atio
n ab
out e
mpl
oyer
s of
gra
duat
es.
1995
-96
data
will
not
be
avai
labl
e un
til O
ctob
er 1
997.
79B
EST
CO
PY A
VA
ILA
BL
E
SPX
Off
ice
of I
nstit
utio
nal R
esea
rch
Sour
ce: F
h I
PIP
Follo
w-U
p R
epor
tR
evis
ed: 2
/111
97
8 0

TABLE 37
SITE ACREAGE AND ACQUISITION DATES
Site
OriginalAcquisition
DateArea inAcres
Type ofOwnership
District May, 1966 9.47 SPJC
Clearwater May, 1961 73.87 SPJC
St. Petersburg April, 1937 37.58 SPJC
Seminole August, 1970 103.12 SPJC
Tarpon Springs October, 1972 & 96 88.83 SPJC
Bay Pines December, 1973 55.21 SPJC
Health Education Center April, 1980 13.57 SPJC
Allstate June, 1988 20.86 SPJC
Firing Range March, 1989 10.30 Leased
SPJC Office of Institutional ResearchSource: Facilities Planning & Institutional ServicesRevised: 11/15/96
8166

TABLE 38
SITE GROSS SQUARE FOOTAGE AND REPLACEMENT COSTS
Site
Date FirstOccupied
Number ofBuildings*
Total GrossSquare Feet
CurrentReplacement
Cost
District 1968 7 50,207 $ 5.355,165
Clearwater 1965 23 343,585 38,995,839
St. Petersburg 1941 26 447,147 50,878,832
Tarpon Springs 1975 26 105,776 12,843,227
Bay Pines 1973 2 4,530 510,356
Health Education 1981 9 180,673 21,004,394
Allstate 1991 4 156,453 17,469,413
Firing Range 1989 5 1,441 Leased
' May include buildings such as relocatable classrooms, storage facilities, etc., leased or owned by the College.
Gross Square Footage by First Occupancy Date
SPJC Office of Institutional ResearchSource: Facilities Planning & Institutional ServicesRevised: 10/14/96
BEST COPY AVAILABLE
67
82

TABLE 39
NUMBER OF COLLEGE EMPLOYEES BY GENDER1993-94 through 1995-96
Executive Administrators/Managers
1993-1994
Mak Female1994-1995 1995-1996
Mak Female Malt Female
Full-time 23 12 23 10 23 19
Part-time 0 0 0 0 0 0Total 23 12 23 10 23 19
Instructional9 months 130 138 126 141 118 14010-12 months 19 5 19 8 23 7
Full-time 149 143 145 149 141 147
ProfessionalFull-time 49 84 54 91 54 89Part-time 1 0 1 1 1 1
Total 50 84 55 92 55 90SecretarlaVCierical
Full-time 14 207 9 218 7 210Part-time 2 20 4 15 4 18
Total 16 227 13 233 11 228Technical/Paraprofessional
Full-time 24 28 32 31 24 32Part-time 3 2 3 2 2 1
Total 27 30 35 33 26 33Skilled Craft
Full-time 39 2 36 3 37 4Part-time 0 0 0 0 0 0Total 39 2 36 3 37 4
Service/MaintenanceFull-time 73 11 71 12 71 17
Part-time 1 1 2 1 1 2
Total 74 12 73 13 72 19
All EmployeesFull-time 371 487 370 514 357 518Part-time 7 23 10 19 8 22Total 378 510 380 533 365 540
SPX Office of Institutional ResearchSource: Human ResourcesRevised: 11/14/96
8368

TABLE 40
NUMBER OF COLLEGE EMPLOYEES BY ETHNICITY1992-93 through 1995-96
Executive
19931994* 1994-95 1995-1996
a II D A a II 12 A a 11 Q
Admin./Mgrs. FIT 31 3 1 0 1-- 28 4 1 0 38 4 0 0
P/T 0 0 0 0 0 0 0 0= 0 0 0 0
Total 31 3 1 0 28 4 1 0 38 4 0 0
Instructional 9-10 Mos. 234 25 4 5 t" 231 27 4 223 26 4 5
11-12 Mos. 22 2 0 0 t 25 1 1 0 27 2 1 0
Total 256 27 4 5 t 256 28 5 5 t.. 250 28 5 5
Professional F/T 107 21 4 1 115 24 4 2 115 21 5 2
P/T 1 0 0 1 1 0 0 1 1 0 0
Total 108 21 4 1 116 25 4 2 116 22 5 2
Secretarial/ F/T 195 23 2 1 197 27 1 2 1 186 28 1 2
Clerical P/T 17 5 0 0 14 5 0 0 18 4 0 0
Total 212 28 2 1 211 32 1 2 1 204 32 1 2
Tech,/ F/T 44 6 2 57 5 1 0 52 4 0 0
Paraprofessional P/T 5 0 0 0 5 0 0 0 3 0 0 0
Total 49 6 2 62 5 1 0 1 55 4 0 0
SkWed Craft F/T 40 1 0 38 1 0 0 39 1 1 0
P/T 0 0 0 0 0 0 0 0 0 0 0 0
Total 40 1 0 38 1 0 0 1. 39 1 1 0
Service F/T 61 18 2 3 55 20 3 5 56 20 4 8
Maintenance Pa 2 0 0 0 3 0 0 0 3 0 0 0
Total 63 18 2 58 20 3 5 1 59 20 4 8
All Employees F/T 734 99 15 10 746 109 15 14 736 106 16 17
P/T 25 5 0 0 23 6 0 0 25 5 0 0
Total 759 104 15 10 769 115 15 14 I: 761 111 16 17
*Reclassification of employees in 1993-94 resulted in a shift fromthe Executive Administrators/Managers to the ProfessionalClassification for 24 employees.After the year 1993-94 the method of calculation changed.This was done to be consistent with EEO 6.
SPJC Office of Institutional ResearchSource: Human ResourcesReised: 11/14/96
BEST COPY AVAILABLE
69

TABLE 41
NUMBER OF FULL-TIME COLLEGE ADMINISTRATORS
AND FACULTY BY HIGHEST DEGREE EARNED
1991-92 through 1995-96
1993-94* 1994-95 1995-96EXECUTIVE ADMINISTRATORS/MANAGERS
Bachelor's 1 2 3Master's 1 1 1
Master's plus 30 2 1 1
Doctorate 11 9 8Other 0 0 0
PROFESSIONALBachelor's 33 33 32Master's 39 40 48Master's plus 30 11 12 17Doctorate 24 23 17Other 13 13 13
INSTRUCTIONALBachelor's 8 13 12Master's 126 116 114Master's plus 30 106 106 101Doctorate 69 71 67Other 3 3 2
TOTALBachelor's 42 48 47Master's 166 157 163Master's plus 30 119 119 119Doctorate 104 103 92Other 16 16 15
All Professional and Instructional Employees
*Reclassification of employees in 1993-94 resulted in ashift from the Executive Administrators/Managers tothe Professional classification for 24 employees.
7.0
447 443 436
SPJC Office of Institutional ResearchSource Human ResourcesRevised: 11/18/96
85
TABLE 42DISTRIBUTION OF REVENUE FOR GENERAL CURRENT FUND - UNRESTRICTED
1991-92 1992 -93 1993 -941 1994-95 1995-96
STUDENT FEESMatriculation - A & P 6,738,228 7,734,335 7,785,934 7,409,733 7,088,186Matriculation - PSV 2,898,024 3,399,718 3,563,820 3,275,848 3,068,987
Matriculation - PSAV 4,779Matriculation - Voc. N/C 197,654 218,767 288,838 262,050 324,425
Matriculation - Coll PrepMatriculation - LLL
979,22423,349
1,174,71428,240
1,283,693 1,255,736 1,264,4261,
Matriculation - AVOC/Rec. 506,387 619,433 856,037 1,022,499 910,925
Tuition - A & PTuition - PSV
553,263187,880
853,820253,593
806,205262,015
871,357263,360
845,747275,684
Tuition - PSAV 163 160Tuition - Voc. N/C 9,079 12,785 8,030 30,028 53,318
Tuition - College Prep 110,630 155,118 246,547 236,288 263,478
Tuition - LLL 940 86Laboratory Fees 1,710,321 1,729,075 2,007,170 2,505,131 2,334,883Application Fees 301,303 287,541 282,356 267,859 255,543
Graduation Fees 43,160 41,419 43,715 43,438 71,190
Other Student Fees* 47,337 58,052 46,705 751,476 654,953
Total 14,311,721 16,566,856 17,481,065 18,194,803 17,411,74531.1% 33.7% 33.8% 34.4% 32.2%
LOCAL GOVERNMENTGrants & Contracts 7,204 164,946 223,740 183,982 329,502
0.1% 03% 0.4% 03% 0.6%STATE SUPPORT
CCPF 23,610,859 24,062,074 25,825,502 26,600,267 28,253,767
Lifelong Learning 92,609 88,571License Tag Fees 8,000 8,778 8,046 8,046 8,263
Grants & Contracts 200,000 8,143 3,870 24,438
CCPF - Lottery 6,971,841 6,814,322 6,992,169 6,917,657 6,174,028
Other 1,764 22,000 7,659
Total 30,885,073 30,973,745 32,833,860 33,551,840 34,468,15567.0% 63.0% 63.4% 63.4% 63.8%
FEDERAL GOVERNMENT 51,452 57,009 133,689 107,183 167,0470.1% 0.1% 03% 0.2% 0.3%
PRIVATE GIFTS & GRANTS** 49,062 135,491 143,881 10,736 6,3980.1% 0.3% 0.3% 0.0% 0.0%
SALES AND SERVICES 241,071 215,869 190,311 294,882 385,1600.5% 0.4% 0.4% 0.5% 0.5%
MISCELLANEOUSInterest & Dividends 346,518 200,641 247,930 352,236 439,110Other 148,479 130,856 39,166 5,916 142,708
Transfers In 37,000 691,759 457,254 253,422 675,041
Total 531,997 1,023,256 744,350 611,574 1,256,85911% 2.1% 1.4% 1.2% 2.3%
TOTAL REVENUE 46,077,580 49,137,172 51,750,896 52,955,000 54,024,866
The increase in 1994-1995 "Other Student Fees" is directly attributable to thenew "Security Fee" implemented for the first time in 1994-95.These fees alone were $706,944."Private Gifts and Grants were down in 1994-95 in the Unrestricted Current Fund -1993 -94 - U=143,881, R=97,743 = Total 241,6241994-95 - U= 10,746, R= 198,061 = Total 208,797.The scholarship fund also increased slightly in 1994-95 (56,283).
SPX Office of Institutional ResearchSource: Annual Financial ReportRevised 11/7/96

TABLE 43
SPJC REVENUES, PERSONNEL EXPENSES,CURRENT EXPENSES, AND CAPITAL OUTLAY
1991-92 1992-93 1993-94 1994-95 1995-96
TOTAL REVENUES 46,000,480 49,137,172 51,750,896 52,955,000 54,024,866
EXPENSES:PERSONNEL EXPENSES 38,670,900 40,470,670 42,958,512 42,049,678 41,058,114AS % OF TOTAL 81.5% 83.3% 81.6% 80.7% 78.1%
CURRENT EXPENSES 7,937,836 7,422,914 8,923,294 9,674,600 10,725,876AS % OF TOTAL 16.7% 15.3% 17.0% 18.6% 20.4%
CAPITAL OUTLAY 857,973 669,362 742,254 358,535 761,562AS % OF TOTAL 1.8% 1.4% 1.4% 0.7% 1.4%
TOTAL EXPENSES 47,466,709 48,562,946 52,624,060 52,082,813 52,545,551
FM INCREASE -1,466,229 574,226 -873,164 872,187 1,479,315(DECREASE)
87
72
SPJC Office of Institutional ResearchSource: Annual Financial ReportRevised: 11/7/96

APPENDIX ADEGREE AND CERTIFICATE PROGRAM INVENTORY
AA Degree University Parallel ProgramsAA Status PendingArchitectural/Building ConstructionArtBusiness AdministrationComputer Science (Business Option)CorrectionsEducationEducation With Child DevelopmentEngineeringEnglish/HumanitiesFashion Marketing ManagementFine ArtsFire Science TechnologyForestry/AgricultureGerontologyHealth (Pre-Dent,Pre-Med,Pre-Vet.)Human ServicesIndustrial Arts EducationInternational BusinessLaw EnforcementLiberal Arts (Arts & Science)Mass CommunicationMathematicsMedical TechnologyMusicMusic EducationNatural ScienceNursingOccupational TherapyPharmacyPhysical TherapyPre-Law/CriminologyPsychology/CounselingRecreation/Physical EducationSocial Science/Social Work/Human ServicesSpeech/Audio PathologyUniversity Transfer (General Studies)
Active Technical Degree ProgramsBuilding Arts Program
Architectural Design & Construction TechnologyBusiness Technologies Program
Accounting TechnologyBusiness Administration & Management (with specialization in)
EntrepreneurshipInternational BusinessMarketingQuality Management
Computer Information Systems Analysis (with specialization in)Computer ProgrammingNetwork Systems ManagementOffice Systems Management
Industrial Management TechnologyLegal Assisting
Child Development and Education ProgramCriminal Justice Technology (Academy Track)Engineering Technology
Electronics Engineering TechnologyManufacturing TechnologyTelecommunications Engineering Technology
Fashion Design (C.A.S.P.) [2/27/91]Fire Science TechnologyGraphic Design Technology
Ns
REGISCode
SOLARCode
FloridaCIP Code
TotalCredit
GEN-AA 101 1 192401010 60ARCH-AA 105 1 192401010 60ARTS-AA 135 1 192401010 60
BUS-AA 110 1 192401010 60COPSC-AA 115 1 192401010 60CRMJC-AA 177 1 192401010 60EDUC-AA 120 1 192401010 60
CHDEV-AA 121 1 192401010 60ENGNR-AA 130 1 192401010 60ENGHM-AA 125 1 192401010 60
FASH-AA 140 1 192401010 60ARTS-AA 135 1 192401010 60FIRE -AA 143 1 192401010 60
FORAG-AA 145 1 192401010 60GERON-AA 149 1 192401010 60HELTH-AA 150 1 192401010 60HUSEV-AA 190 1 192401010 60
EDUC-AA 120 1 192401010 60INTBS-AA 111 1 192401010 60
LAWEF-AA 176 1 192401010 60LIBRL-AA 155 1 192401010 60
MCOMM-AA 160 1 192401010 60MATH-AA 165 1 192401010 60
HELTH-AA 150 1 192401010 60ARTS-AA 135 1 192401010 60EDUC-AA 120 1 192401010 60
NATSC-AA 170 1 192401010 60NURSE-AA 151 1 192401010 60HUSEV-AA 190 1 192401010 60HELTH-AA 150 1 192401010 60BELTH-AA 150 1 192401010 60PRLAW-AA 175 1 192401010 60PSYCH-AA 180 1 192401010 60RECPE-AA 185 1 192401010 60HUSEV-AA 190 1 192401010 60
SPCH-AA 195 1 192401010 60GEN-AA 100 1 192401010 60
ARCH-AS 29 0 615010100 66
ACCTG-AS 3 0 507010100 64
ENTRP-AS 56 0 506040102 64INBUS-AS 57. 0 506040102 64
MAR/CT-AS 58 0 506040102 64QUMGT-AS 59 0 506040102 64
PROG-AS 60 0 507030600 63NETWK-AS 61 0 507030600 63OSMGT-AS 62 0 507030600 63INDMG-AS 45 0 606200101 60LEGAL-AS 49 0 722010300 69CHDEV-AS 19 0 420020203 63CJTRK-AS 71 0 743010300 64
ELEC-AS 6 0 615030301 68MNTEC-AS 40 0 615060302 64TELEC-AS 44 0 615030302 64
CASP-AS 38 0 420030601 70FIRE -AS 52 0 743020100 60
GRAPH-AS 39 0 650040200 64

APPENDIX A Continued
isAikgusijitysislizziarausunnonigHealth Programs
REGISCode
SOLARCode
FloridaCIP Code
TotalCredit
Dental Hygiene DENHY-AS 5 0 317010200 88
Emergency Medical Services EMS-AS 42 0 317020601 73
Funeral Services FUNSE-AS 55 0 312030100 72
Health Information Management (Medical Record Technology) HIM-AS 67 0 317050600 67
Health Services Management (with specialization in)Home Health Care HHECR-AS 72 0 318070100 62
Long Term Care LTMCR-AS 73 0 318070100 62
Medical Administration MEDAD-AS 74 0 318070100 62
Nursing Home Administration (Baccalaureate Track) NSHAD-AS 75 0 318070100 62
Human Services (with specialization in)Alcohol/Substance Abuse HSM-AS 25 0 317040600 73
Social Services HSDIS -AS 28 0 317040600 65
Medical Laboratory Technology MLT-AS 33 0 317030900 76
Nursing, R.N. NURSE-AS 12 0 318110100 72
Physical Therapist Assistant PTA-AS 27 0 317081500 74
Radiography RAD-AS 51 0 317020900 77
Respiratory Care RESC-AS 20 0 317081800 76
Veterinary Technology VETTC-AS 32 0 317051200 74
Interpreter Training Program For Hearing Impaired INTRP-AS 41 0 713100301 64
Active Technical Certificate ProgramsBusiness Data Processing BUSDP-CT 247 0 507030100 30
Emergency Medical Technician EMT-CT 246 0 317020500 9
Office Systems Specialist(Information Processing Speciality) OSSIP-CT 248 0 507060301 30
Office Systems Specialist (Word Processing Specialty) OSSWP-CT 249 0 507060301 30
Paramedic PMED-CT 245 0 317020600 38
Bealtb Care Services CertificatesGuardianship Certificate GUARD-CT 242 0 318070101 19
Health Care Services HCMGT-CT 202 0 318070101 32
Long Term Care Specialist Certificate LTCSP-CT 238 0 318070101 25
ItshnicalPirl&LPnaritunPathways Pre-Dental Hygiene DENHY-PW 321 0 317010200Pathways Pro - Emergency Medical Services EMS-PW 326 0 317020601Pathways Pre-Health Information Management HIM-PW 328 0 317050600Pathways Pm-Medical Lab Technology MLT-PW 327 0 317030900Pathways Pre-Nursing NURSE-PW 323 0 318110100Pathways Pre-Physical Therapist Asst PTA-PW 325 0 317081500Pathways Pre-Radiography RAD-PW 329 0 317020900Pathways Pm-Respiratory Care RESC-PW 322 0 317081800Pre-Criminal Justice Technology (Academy Track) CITRIC-PR 312 0 743010300Pro - Dental Hygiene DENHY-PR 301 0 317010200Pm-Emergency Medical Services EMS-PR 306 0 317020601Pre-Funeral Services FUNSE-PR 311 0 312030100Pre-Health Information Management (Medical Records Technology) HIM-PR 308 0 317050600Pre-Medical Lab Technology MLT-PR 307 0 317030900Pre-Nursing NURSE-PR 303 0 318110100Pre-Physical Therapist Assistant PTA-PR 305 0 317081500Pm-Radiography RAD-PR 309 0 317020900Pro - Respiratory Care RESC-PR 302 0 317081800Pre-Veterinary Technology VETTC-PR 304 0 317051200
Note: English as a Second Language and Program for the Deaf are not academic programs,but rather desaiptions of services/courses designed for special students. See Appendix Dfor description.
BEST COPY AVAILABLE
A2 89

APPENDIX A Continued
REGIS SOLAR Florida TotalCode Code CIP Code Credit
Parallel Programs
Inactive & Deleted ProgramsArchitectural Drafting Certificate 261 8 888888888*
Architectural Rendering Certificate 262 8 888888888*
Aviation Administration (DEL 3/945) AVIAT-AS 35 8 888888888*
Bookkeeping Certificate 256 8 888888888*
Building Construction Technology (DEL 1/956) CON ST-A S 65 8 888888888*
Building Construction Certificate 263 8 888888888*
Building Construction Supervision 253 8 888888888*
Business Administration & Management*+ (DEL 2/945) 4 8 888888888*Computer Information Processing (CASP-DEAF) 251 8 888888888*
Computer Information Systems Analysis*+ (DEL 2/945) 36 8 888888888*
Computer Science (Phased out 89-90) 16 8 888888888*
Computer Science Certificate 240 8 888888888*
Computer Programming & Applications (DEL 1/945) COPPA-AS 11 8 888888888*
Construction Estimating Certificate 264 8 888888888*
Corrections (DEL 1/923) CJTCO -DL 70 8 888888888*
Early Childhood Education Certificate 241 8 888888888*
Enterpreneurship Certificate 243 8 888888888*
Fashion Marketing Management (DEL 1/945) FASH-AS 34 8 888888888*
Financial Services /Banking (DEL 3/945) FINSV-AS 22 8 888888888*
Financial Services/Credit Union Management (DEL 3/945) FNMGT-A S 21 8 888888888*
Fire Administration (Phased out by 91-92) 26 8 888888888*
Fire Administration Certificate 237 8 888888888*
Fire Prevention (DEL 1/967) 24 8 888888888*
Fire Suppression (DEL 1/967) 14 8 888888888*
General Business (Deaf only) (DEL 1/934) BUSDF-AS 8 8 888888888*
Health Services Management*+ (DEL 1/945) 18 8 888888888*
Interior Design Technology (DEL 2/945) INDES-AS 43 8 888888888*
Interior Design Certificate (DEL 2/945) 239 8 888888888*
Law Enforcement (DEL 1/923) CJTLE-AS 13 8 888888888*
Marketing Management (DEL 1/945) MKTMG -AS 15 8 888888888*
Microcomputer Business Technology 201 8 888888888*
Office Systems Technology (DEL 1/945) WPMGT 7, 10 & 68 8 888888888*
Professional Pilot (DEL 3/945) PILOT -AS 17 8 888888888*
Professional Pilot Certificate 255 8 888888888*
Real Estate Management (DEL 2/923) REMGT-AS 23 8 888888888*
Retail Selling Certificate 260 8 888888888*
Vision Care Technology (Closed END III-90/1) 31 8 888888888*
Water & Wastewater Technology (DEL 2/945) WWMGT-AS 66 8 888888888*
Word Processing Certificate 252 8 888888888*
SPJC Office of Institutional Research SOURCE: Educational and Student Services Created6/5/91 Updated: 9/24/96
*+No longer base program. Program reorganized to include several options
and to be reported under the same CIP code.
A3
90
SPJC Office of Institutional ResearchSource: Program Code DirectoryRevised 9/24/96

APPENDIX B
4TH QUARTER 1994 EMPLOYERS OF COMPLETERSBY PROGRAM
FROM WHICH STUDENT GRADUATED
EMPLOYERS
Pinellas County SheriffsState Court SystemA D Morgan CorporationHarlow'sE Systems IncPall Aeropower CorpBarnett Bank of PinellasPsychiatric HospitalsHelen M BeckCity of St. PetersburgPinellas County BoardTimes Publishing CorpJoanne RebackThe Sembler CompanyInterim Personnel Inc
EMPLOYERS
Macre Construction IncE Systems IncReedy Photoprocess Corp
EMPLOYERS
Publix Super Markets IncThe CTF Hotel Management
EMPLOYERS
Reedy Photoprocess CorpSoutheast Employers
ACCOUNTING
JOB TITLES
Communications SupervisorJudicial AssistantBookkeeperBookkeeper ManagerGeneral Office ClerkAccounting ClerkBookkeeperBilling ClerkAccountants AssociateTypistAccountant
ARCHITECTURAL TECHNOLOGY
TOB TITLES
Construction ManagerFacilities PlannerLab Technician
AVIATION /ADMINISTRATION/PILOT
JOB TITLES
BUILDING CONSTRUCTION TECHNOLOGY
JOB TITLES
Lab Technician
Note: Each firm employs one graduate unless otherwise noted in parentheses.The areas where a job title does not appear, means that the information was not provided.
91B1

APPENDIX B Continued
BUSINESS ADMINISTRATION & MANAGEMENT
EMPLOYERS
Times Publishing CorpSquare D CompanyTechnology ResearchR & T Distributors IncCho Lon Oriental Market IncSeminole Pizza IncShells Seafood RestaurantsAgency Services IncAegon USA Inc (2)National Risk Services IncCity of St. Petersburg HousingComputer People IncDental Staffing Solutions IncMicrofilm Services IncRadiation Therapy Oncology (2)Palm Harbor Community ServiceEastern Research Services IncPinellas County BoardDept of Health & Rehab SvcsBea Ils IncStaff Leasing
EMPLOYER
LOILIIILES
ClerkHuman Resources RepBookkeeperGeneral Office Clerk/ComputerSales ClerkDelivery DriverRestaurant ManagerCustomer Services RepNon-Placement ProcessorAdministrative AssistantComprehensive Grant SpecialistManagerDental AssistantMicrofilm TechnicianOncology Nurse & SupervisorSuperintendent of ParksTelephone InterviewerOffice SpecialistGeneral Office Clerk
CHILD DEVELOPMENT AND EDUCATION
Gehl CorpPinellas County School Board (2)First Presbyterian Day SchoolBayfront Child Development CenterEAO IncCorporate Child Care Inc (4)St. Andrew Lutheran ChurchLight of Christ CatholicYMCA of St. PetersburgYoung Women's ChristianLakeview Developmental
EMPLOYERS
JOB TITLES
ClerkSubstitute TeacherTeacherLead TeacherSubstitute TeacherPre-Kindergarten TeacherSubstitute Child Care WorkerTeacherChild Care WorkerTeacher
COMPUTER INFORMATION SYSTEMS ANALYSIS
Val-Pak Direct MarketingJabil Circuit CoStorz ophthalmics IncHome Shopping Network IncHome Shopping Club IncChase Home Mortgage CorpPinellas County Board
B2
92
JOB TITLES
Project CoordinatorPrecision InspectorInformation Svcs Support TechnicianHelp Desk OperatorSenior Buyer ClerkComputer OperatorInformation Systems Clerk

APPENDIX B Continued
COMPUTER INFORMATION SYSTEMS ANALYSIS continued
EMPLOYERS
Computer Generated SolutionsAtlanta Staff IncBaxter Healthcare CorpDMP of Pinellas County IncLandmark ResearchNesco Design Corp NescoTri-Data Management IncA C Nielsen Company (2)Electronic Billing
EMPLOYERS
LQI11111 FS
Technical Lead Database Queue
COMPUTER PROGRAMMING AND ANALYSIS
Beckwith Electric Co IncMartin Marietta SpecialtyAdvanced Plasma Systems IncHome Shopping Network IncSun Bank of TampaChase Home Mortgage CorpSofisticated Software IncTomasino & Associates IncPinellas County BoardPinellas County TaxAMP IncorporatedCity of Safety Harbor
EMPLOYERS
Pinellas County Sheriffs (3)Dept of Corrections OfficeCity of ClearwaterCity Delray BeachCity of St. PetersburgLure IncApplication Profiles IncRecon Security IncGrand Prix LtdStarling Printing IncNations Bank of FLDenny's Inc
LOB TITLES
Production Control ManagerIndustrial Production ManagerComputer ProgrammerHelp Desk OperatorTellerComputer OperatorSystems AnalystSurveying & Mapping TechComputer Operations ClerkSystems Analyst
CRIMINAL JUSTICE TECHNOLOGY
B3
93
LOB TITLES
Detention DeputyPolice OfficerFire FighterPolice OfficerTruck DriverInvestigators SpecialistSecurity OfficerAsst. ManagerPressman

EMPLOYER
Dental Staffing Solutions Inc (4)D-Accu Florida Inc.Absolute Dental Care PC (2)Robert P. Hearn, DDS, PA (2)Arthur F. Burt, DDS PAC S Willie Szeto, DDS PACharles A PeterCrawford, Gause & ReynoldsCynthia S. Harper, DDS PADouglas A. Edward, DDS PADr. Peggy Joyce MasonE. Keith Easter, DDS PAGerald L. Spoto, DDS PAHank A. Insko, DDS PAHarry A. Palo, PAJoseph J. Meyer, DDSKarl Pardee, DDSLori M. Degaetano, DDS PAMark J. Fleming, DDS IncNortheast Dental CarePeter J. Congiundi, DDS PAS. T. Childers, DDS PaWilliam N. Pantazes, DMD PAWoodrow D. Wheetley Enterprises
EMPLOYER
Inex IncRoadway Package System IncS P B No. 1 Pizza CorpA 1 Rent A Car of OrlandoTimes Publishing CorpSears Roebuck and Co
EMPLOYERS
APPENDIX B Continued
DENTAL HYGIENE
10B TITLES
DentalDentalDentalDentalDentalDentalDentalDentalDentalDentalDentalDentalDentalDentalDentalDentalDentalDentalDentalDentalDentalDentalDentalDental
ELECTRONICS ENGINEERING
HygienistsHygienistHygienistHygienistHygienistHygienistHygienistHygienistHygienistHygienistHygienistHygienistHygienistHygienistHygienistHygienistHygienistHygienistHygienistHygienistHygienistHygienistHygienistHygienist
lOB TITLES
Electronics TechnicianCheck In CoordinatorCafe AttendantCounter & Rental Clerk
EMERGENCY MEDICAL SERVICES
Honeywell, Inc.Seminole Volunteer Fire Dept.Bayfront Medical Center Inc (3)Medic One Ambulance Service (4)St. Joseph HospitalSun Coast Hospital IncNME Hospitals IncOak Manor Nursing Home
B494
JOB TITLES
Fire FighterRegister NursesEmergency Medical TechsEMT

APPENDIX B Continued
EMERGENCY MEDICAL SERVICES,continued
EMPLOYERS JOB TITLES
Theodore J. Mach ler, Jr., MD PADelta Land Surveyors IncCity of ClearwaterCtiy of LargoCity of Madeira BeachOkaloosa County BoardIndustrial Leasing Affiliated
FINANCIAL SERVICES
EMPLOYER JOB TITLES
NationsBanc Services IncAmerican Municipal Securities
SupervisorAccounting Clerk
FIRE SCIENCE TECHNOLOGY
EMPLOYER JOB TITLES
Palm Harbor Special Fire FirefighterSeminole Volunteer Fire FirefighterDiscount Auto Parts Inc
GRAPHIC DESIGN TECHNOLOGY
EMPLOYER JOB TITLES
Seamans Press Inc Desktop PublisherAtlanta Constitution Art DesignerAnderson News Corp ReceptionistJerry's Artarama South Inc Picture FramerC W Kay-Bee Inc Sales AssociateBarnett Bank of Pinellas ManagerDollar Sign Company Unlimited ArtistMega Direct Inc DesignerComtel Sun Graphics Graphic DesignerDon Secours Maria ManorAir CanadaPublix Super Markets IncFlorida Software Systems IncGreat American EmployeeSt. Jospehs Hospital Inc
HEALTH INFORMATION MANAGEMENT
EMPLOYERS JOB TITLES
Mease Hospital Inc (2)Morton F Plant Hospital (2)Edward White HospitalArbor Health Care CompanyFlorida Spine Institute
BO 5
In Patient CoderMedical Records DesigneeLicense Practical Nurse

APPENDIX B Continued
HEALTH INFORMATION MANAGEMENT continued
EMPLOYERS
University General HospitalSt. Petersburg GeneralTheraTx IncSt. Joseph HospitalBrandon HospitalFlorida Cntr for GastroenterologyHelen Ellis Memorial HospitalUniversity Family MedicineBayfront Medical CenterThe Abbey Nursing CenterPalms of Pasadena HospitalDept. of Health & Rehab Svcs
EMPLOYERS
Bayfront Medical Center IncCollege Harbor IncFlorida Convalescent CentersGenesis Managment ResourcesLillian & Jackie IncSuncoast Christian Housing IncBayfront Health ServicesSt. Anthony's Hospital IncLane Bryant Inc
JOB TILT S
Records ClerkCoderMarketing AnalystTranscriptionist/CoderMedical AbstractorManagerMedical Records SupervisorPhysician's Office CoordinatorCoding SupervisorMedical Records SupervisorCoder
HEALTH SERVICES MANAGEMENT
EMPLOYERS
Professional Comprehensive (2)Operation PAR IncSunshine Behavioral Health ServicesPinellas Emergency MentalRehab Consultants IncSt. Petersburg Junior CollegeEckerd Family Youth (2)St. Anthony's HospitalGreens Landing at BaileySandy LemkeShell of Hope Inc
EMPLOYERS
Dundee Optical IncTake If For GrantedJ Dennis Gordon Inc
HUMAN SERVICES
INTERIOR DESIGN
B6
96
JOB TITLES
Register NurseCare TakerAdministrative SecretaryAdmission/Marketing DirectorOperations ManagerResident Services Coordinator
JOB TITLES
Addictions TechCounselor ISubstance Abuse CounselorPsychiatric AideHuman Services WorkerGroup LeaderYouth Care WorkerMental Health TechnicianTest TechnicianCounselorPrimary Therapist
JOB TITLES
File ClerkInterior DesignerArtist

EMPLOYER
APPENDIX B Continued
INTERPRETER TRAINING PROGRAM FOR HEARING IMPAIRED
JOB TITLES
Sign Language InterpreterDeaf Service Center Inc
EMPLOYERS
Chambers Salzman & Bannon (2)Pinellas County Board (2)Arahamson & Kennedy PAAlan S Gassman PAAllen & Melrose PACal A Schuh AttyDana L Greenbaum PAJustice Administrative CommFlorida Power CorpBeltram Supply IncHancock Fabrics IncSouth Trust Bank of AlabamaFlorida PrestigeDonald Knapmeyer, PAFrazer Hubbard & BrandtFreeborn & Jennings PAJames R Kennedy Jr EsqLeonard M Cincenti PAMarc E Yonker PaSimmons & Seeley PAWilliam L Penrose EsqPublix Super Market IncLegal Registry IncRes Care Home Health Inc
EMPLOYERS
Times Publishing Corp.Ideas for Medicine Inc.GTE of Florida Inc.Tech Data Corp.Pinellas County SupervisorT J Maxx Companies IncVery Important PropertiesRadiation Therapy OncologyNestor Sales Co. Inc.
EMPLOYERS
Allied Clinical Laboratories (2)Tarpon Springs Hospital (3)International Medical
LEGAL ASSISTING
JOB TITLES
ParalegalsOffice & Records SpecialistParalegalParalegalLegal SecretaryParalegalParalegalLegal SecretaryDept. Support AdministratorOffice ManagerSalespersonLoan OfficerReal Estate AgentParalegalParalegalParalegalLegal SecretaryParalegalParalegalLegal Secretary
MARKETING MANAGEMENT
JOB TITLES
Advertising Sales RepresentativeAdministratorSr. IC Operations PlannerMarketing Operations AnalystPoll Worker
MEDICAL LABORATORY TECHNICIAN
JOB TITLES
Medical & Clinical Lab TechnicianMedical Lab TechnologistMedical Lab Technologist

APPENDIX B Continued
MEDICAL LABORATORY TECHNICIAN continued
EMPLOYERS
Manatee Hospital & HealthNew Port Richey Hospital IncRH PC IncSt. Anthonys Hospital IncSt. Josephs Hospital IncEdward White HospitalHelen Ellis HospitalARM Medical CenterVA- Baypines Hospital
EMPLOYERS
Nurses 2000 Inc (2)Morton F Plant Hospital (25)Bayfront Medical Center (24)Mease Hospital Inc (21)St. Anthony's Hospital Inc (15)St. Josephs Hospital Inc (14)NME Hospitals Inc (13)Anclote Psychiatric Hospital (7)Sun Coast Hospital Inc (7)New Port Richey Hospital Inc (5)The Hillsborough County (5)University Community Hospital (4)University General Hospital (4)C C H Management Inc (3)Arbor Health Care Company (2)Bayada Nurses Inc (2)Drew Village Nursing Home Inc (2)Florida Convalescent Centers (2)H Lee Moffitt Canter Center (2)Manatee Hospitals & Health (2)Pinellas Emergency Mental (2)Sarasota Memorial HospitalVaicattis Schorr Richards (2)Sunset Point Nursing Center (2)Dept of Health & Rehab Svcs (2)1st American Home HealthAble Palms Home & Health CareAgia Mallis & Pautler MD's PAAlachua Genral Hospital IncAlhambra Nursing Home IncAll Children's HospitalAllergy & Asthma CenterBay Pines VAMCBayway Medical CenterBelleair Surgery Center LTDBeverly California CorporationBio-Medical Applications
B8
NURSING
98
JOB TITLES
Medical Lab TechnologistMedical Lab TechnologistMedical Lab TechnologistMedical Lab TechnologistMedical Lab TechnologistMedical Lab TechnologistMedical Lab TechnologistMedical Lab TechnologistMedical Lab Technologist
JOB TITLES
Registered NursesRegistered NursesICU Nurses, Register NursesRegistered NursesRegistered NursesRegistered NursesRegistered NursesRegistered NursesRegistered NursesRegistered Nurses & EMT'sRegistered NursesRegistered NursesNursesNursesNursesNursesNursesRegistered NursesRegistered NursesNursesNursesNursesRegistered NursesNursesMedicare SupervisorNurseNurseNurseNurseRegistered NurseRegistered NurseStaff NurseRegistered NurseNurseNurseNurse

EMPLOYERS
Bon Secours Maria ManorBrenda S Kinard MD PACarrollwood Care CenterCentral Florida RegionalClearwater Community HospitalCharter Medfield BehavioralColumbia Hospital CorporationCommunity Dialysis CentersConsulting ManagementDependable Nurses IncDoctors HospitalDr. David AveryDr.Joy Wolff MD PAEast Pasco Medical Center IncElmore Medical CenterFairwinds Properties IncFirst Healthcare CorporationFranklin Massari MDHarbor Hospital CenterHealth InstituteHealth South fo Florida IncHelen Ellis HospitalHobby Rowley & Smith MDS PAHospice of Marion County IncIndependent Home Health ServicesIntegrated Health Services IncIra B Azneer Do PAJames L. Bradley DDS PAJames B. Haggin Memorial HospitalJames A. Haley Veteran HospitalJaylene Manor Nursing HomeKimberly Services IncKaiser PermaneteLakeland Regional MedicalLife link Foundation IncMark W Morris MD PAMost Worshipful Grand LdgNational Health CareNew Port Richey Surgi-CenterNorthside HospitalOak Manor Nursing HomeOak Hill HospitalOlsten Home Healthcare IncOrlando Ear Nose & ThroatPalms of Pasadena HospitalPaul A Mevoli DMDPeter Freund & St. John MD's PAPia Medfield IncProgressive Home Heath LtdPsychiatric Hospital
APPENDIX B Continued
NURSING continued
B9 99
1013 TITLES
NurseNurseNurses SupervisorNurseRegistered NurseNurseNurseNurseNurseNurseRegisered NurseNurseNurseRegistered NurseRegistered NurseNurseNurseNurseOncology Staff NurseTeacherRegistered NurseRegister NurseNurseStaff NurseOncology RNNurseNurseNurseRegistered NurseStaff NurseNurseNurseNurse AdvisorRegistered NurseNurseNurseNurseNurseNurseStaff NurseNurseRegister NurseRegistered NurseNurseRegistered NurseNurseNurseNurseNurseNurse

FMPLOYERS
RHPCIncRehab Consultants IncRes Care Home Health IncRes Care Scs Management IncRobert Garda Iglesias MDSHCC Services IncShriners HospitalsSMH Homestead Hospital IncSouthwest Florida RegionalSt. Petersburg General HositalSt. Petersburg Health CareSun Coast HospitalSuncoast PeadiatricsTarpon Springs HospitalTampa General HospitalTotal Professional Health CareTGC Home Health Care IncThe Hospice of the FloridaTriso C Ignacio DMDUltimate Home Care & ServicesUnicare Health Facilities IncUniversity of Louisville HospitalVencor Hospitals South IncVenice Hospital IncVictor L Dragon MD PAWestminster ShoresWest Coast Family Medical CareWomens Medical Center IncHighland PinesRoberts Home Health CareDr. RothermelWuesthoff Memorial HospitalHillsborough County SchoolPinellas County School BoardHospice of Pasco IncOrchard Ridge Nursing CenterSt. Petersburg MethodistAmerican Legion Post 104Professional Medical ResourcesPalm Harbor Fire Dept.City of Madeira BeachCity of TampaCity of Tarpon SpringsHernando County BoardPasco County BoardIndustrial Leasing AffiliatedAir Ambulance Care FlightMedic One Ambulance Service
APPENDIX B Continued
NURSING continued
100B1 0
'MamaNurseNurseRegistered NurseRegistered NurseNurseNurseRegistered NurseNurseStaff NurseRegistered NurseNurseRegistered NurseRegistered NurseNurseStaff NurseStaff NurseNurseNurseNurseNurseNurseRegister NurseNurseNurseNurseRegistered NurseNurseNurseNurseRegistered NurseOffice NurseNurseTeacherSubstitute TeacherRegistered NurseLicensed Practical NurseRegistered NurseBartenderRegistered NurseEmergency Medical TechFirefighterFirefighterFirefighter /ParamedicFirefighterFirefighterCNANurseEmergency Medical Tech

APPENDIX B Continued
NURSING continued
EMPLOYERS
Global Health Care IncMederi Temporary Services IncNurses Choice IncThe Registry Network IncToday's Temporary IncTotal Employee LeasingShapes Family Fitness IncKash N Karry Food Stores IncGolden Bear of Pinellas IncClaims Insurance Service Corp
JOB TITLES
OFFICE SYSTEMS TECHNOLOGY
EMPLOYERS
Deloach & Hofstra PAWilliam F Blews PASt. Petersburg Junior CollegeConsulting EngineeringPinellas County BoardAdvantage Weight ControlPrinting Logic IncL Luria & Son IncCheckers of Palm Harbor IncHome Shopping Club IncInternational Health Care
PARAMEDIC
EMPLOYERS
Medic One Ambulance Service (2)City of St. Petersburg FLHoneywell, Inc
JOB TITLES
ParalegalLegal AssistantGeneral Office ClerkTypistOffice AssistantExecutive Secretary
JOB TITLES
Emergency Medical TechsFirefighterCustodian
PHYSICAL THERAPY ASSISTANT
EMPLOYERS
Morton F Plant Hospital (5)Nova Care Inc (3)Communic-Care/Pro-Rehab (2)Health South of Florida Inc (2)National Health Rehabilitation (2)St. Anthony's Hospital Inc (2)Arbor Health Care CompanyAssociated TherapistsBay Area Rehab Inc DIPBay Area Rehabilitative
1 0 1 B11
JOB TITLES
Physical Therapist AssistantsPhysical Therapist AssistantsPhysical Therapist AssistantsPhysical Therapist AssistantsPhysical Therapist AssistantsPhysical Therapist AssistantsPhysical Therapist AssistantsPhysical Therapist AssistantsPhysical Therapist AssistantsPhysical Therapist Assistants

APPENDIX B Continued
PHYSICAL THERAPY ASSISTANT
EMPLOYERS
Bayfront Medical Center IncC C H Managment IncComprehensive RehabilitationEwing & Thomas IncR & F IncRehab Consultants IncSt. Josephs Hospital IncTarpon Harbor RehabilitationUltimate Home Care & ServicesUniversity General HospitalWest Florida OrthopedicWinter Haven Hospital IncSt. Petersburg Junior CollegeMN Medinvest Company LimitedTransitional Hospital of Tampa
EMPLOYERS
Blockbuster SC Music CorpCracker Barrel Old Country
EMPLOYERS
JOB TITLES
Physical Therapist AssistantsPhysical Therapist AssistantsPhysical Therapist AssistantsPhysical Therapist AssistantsPhysical Therapist AssistantsPhysical Therapist AssistantsPhysical Therapist AssistantsPhysical Therapist AssistantsPhysical Therapist AssistantsPhysical Therapist AssistantsPhysical Therapist AssistantsPhysical Therapist AssistantsPhysical Therapist AssistantsPhysical Therapist AssistantsPhysical Therapist Assistants
PROFESSIONAL PILOT TECHNOLOGY
JOB TITLES
Customer Service
Bayfront Medical Center Inc (4)Mease Hospital Inc (4)Morton Plant Hospital (2)New Port Richey Hospital Inc (2)Rads Radiography Service Inc (2)St Anthony's Hospital (2)RADS Radiography Service Inc (2)Sun Coast Hospital Inc (2)C C H Management IncFlorida Spine InstituteGnage & Hamilton MD's PANadeal & Pelaez PANME Hospitals IncRADS Mobile X-Ray & EKGRH PC IncTarpon Springs HospitalThomas E Mathias DO PAVaicaitis Schorr RichardsWest Hernando Diagnostic
RADIOGRAPHY
B12
102
lOB TITLES
Radiologic TechnologistsRadiology TechnologistsRadiology TechnologistsRadiology TechnologistsRadiology TechnologistsRadiology TechnologistsRadiology TechnologistsRadiology TechnologistsRadiologic TechnologistRadiology TechnologistRadiology TechnologistRadiology TechnologistRadiology TechnologistRadiologic TechnologistRadiology TechnologistRadiology TechnologistRadiology TechnologistRadiology TechnologistRadiology Technologist

EMPLOYERS
Florida CHS Inc (2)Vencor Hospitals South Inc (2)C C H Managment IncH Lee Moffitt Cancer CenterMease Hospital IncMorton Plant HospitalSt. Josephs Hospital IncUniversity Community HospitalRegional Healthcare IncTransitional Hospital of Tampa (2)
EMPLOYERS
Debbies Critter Sitter Ltd (2)John G McLemore DVM PA (2)Veterinary Medical Clinic Inc (2)All Pets Inn IncAnimal Medical HospitalBayshore Animal Hospital of FlaBayshore Animal Hospital, IncCare Animal HospitalCentral Animal Hospital IncFox & Friends Animal HospitalHammocks Veterinary HospitalKrall & Tollon OakhurstLee & Morgan Bluffs AnimalPatrick P McCallum, JrPaul H. Langston DVMRiviera Animal Hospital IncRobert E. Robinson DVM PASpanish Trail VeterinarySteele Animal Hospital PATampa Bay Animal MedicalValerie FucciZephyrhills Veterinary ClinicJupiter Crab Company IncGray's Pet landToday's Temporary IncBudget Rent a Car Systems IncHumane Society of NorthPinellas County BoardFurperson Retreat IncAmeristaff of Florida Inc
APPENDIX B Continued
RESPIRATORY CARE
IOB TITLES
Respiratory TherapistsRespiratory TherapistsRespiratory TherapistRespiratory TherapistRespiratory TherapistRespiratory TherapistRespiratory TherapistRespiratory TherapistRespiratory TherapistRespiratory Therapist
VETERINARY TECHNOLOGY
Bk 3
IOB TITLES
Veterinary TechniciansVeterinary TechniciansVeterinary TechniciansVeterinary TechnicianVeterinary TechicianVeterinary TechnicianVeterinary TechnicianVeterinary TechnicianVeterinary TechnicianVeterinary TechnicianVeterinary TechnicianVeterinary TechnicianVeterinary TechnicianVeterinary TechnicianVeterinary TechnicianVeterinary TechnicianVeterinary TechnicianVeterinary TechnicianVeterinary TechnicianVeterinary TechnicianVeterinary TechniciansVeterinary TechniciansWaitressAvian TechnicianVeterinary AssitantClerkWildlife Center SupervisorVeterinary TechniciansSupervisor of Animal Shelter

APPENDIX B Continued
WATER Sr WASTEWATER TECHNOLOGY
EMPLOYERS JOB
City of ClearwaterCity of Pinellas ParkCity of St. Petersburg
Sewer Service CoordinatorMachinery Main Mech (Water)Construction Inspector
4TH QUARTER 1994 EMPLOYERS OF1993-94 VOCATIONAL COMPLETERS
FREQUENCIES OF EMPLOYMENT BY COUNTYFOR KNOWN OCCUPATIONAL WORKSITES
WORKSITE COUNTY FREO
Alachua 3Brevard 2Broward 20Dade 9Duval 2Escambia 3Hernando 4Hillsborough 73Lake 4Manatee 7Orange 11Palm Beach 3Pasco 31Pinellas 442Polk 6Sarasota 10Other Florida Counties 13
TOTALS KNOWN COUNTY WORKSITES = 643
% OF ALL KNOWN WORKSITES
104B14
.5
.33.11.4
.3
.5
.611.4
.61.11.7
.54.8
68.7.9
1.62.0
Source: Florida Educational TrainingPlacement Information ProgramDuane Whitfield - 12/4/95

I11
MI
MI
INN
MN
MI
NE
IE
MI
NM
I O
M M
I N
M M
O M
I N
SM
I M
I
PRO
GR
AM
NA
ME
Den
tal H
ygie
ne
Ele
ctro
nic
Eng
inee
ring
Em
erge
ncy
Med
ical
Serv
ices
Fune
ral S
ervi
ces
Hea
lth I
nfor
mat
ion
Man
agem
ent
Hea
lth S
ervi
ces
(") 1,
Med
ical
Lab
orat
ory
Tec
hnol
ogy
Nur
sing
Para
med
ic
Phys
ical
The
rapi
stA
ssis
tant
Rad
iogr
aphy
Res
pira
tory
Car
e
Vet
erin
ary
Tec
hnol
ogy
105
APP
EN
DIX
C
A. S
. DE
GR
EE
PR
OG
RA
M A
CC
RE
DIT
AT
ION
SC
HE
DU
LE
LA
STA
CC
RE
DIT
AT
ION
NE
XT
AC
CR
ED
ITA
TIO
N
5/1/
915/
1/98
12/3
/95
12/3
/200
1
2/1/
942/
1/97
4/1/
948/
1/20
01
3/8/
903/
8/98
Non
e R
equi
red
7/1/
94
11/1
/88
10/3
1/20
00
10 /1
/%
4/27
/96
5/13
/98
9/19
/90
3/16
/97
2/19
/91.
2/19
/96
10/2
8/93
10/2
8/98
10/1
5/96
10/1
5/20
03
AC
CR
ED
ITIN
GA
NN
UA
L C
OST
S PA
IDSP
EC
IAL
CO
STS
RE
LA
TIN
G T
OA
GE
NC
YT
O A
CC
RE
DIT
ING
AG
EN
CIE
ST
HE
RE
AC
CR
ED
ITIN
G P
RO
CE
SS
Am
eric
an D
enta
lA
ssoc
iatio
n
Acc
redi
tatio
n B
oard
for
Eng
inee
ring
&
Tec
hnol
ogy
Flor
ida
HR
S fo
r E
MT
Am
eric
an B
oard
of
Fune
ral S
ervi
ces
Am
eric
an H
ealth
Info
rmat
ion
Ass
ocia
tion,
CA
AH
EP
Nat
'l A
ccre
ditin
g A
genc
yC
linic
al L
abor
arto
y Sc
ienc
e
Nat
iona
l Lea
gue
for
Nur
sing
Com
mitt
ee o
f A
ccre
d. o
fA
llied
Hea
lth E
duc.
Pro
g.
Am
eric
an P
hysi
cal
The
rapy
Ass
ocia
tion
SAC
S
Ann
ual F
ee -
$23
0
Ann
ual F
ee -
$25
0
No
Fee
Ann
ual F
ee -
$70
0
Ann
ual F
ee -
$75
0
Ann
ual F
ee -
$12
00
Ann
ual F
ee -
$1,
800
Ann
ual F
ee -
$50
0
Ann
ual F
ee -
$1,
500
Com
mitt
ee o
f A
ccre
d. o
fA
nnua
l Fee
- $
825
Alli
ed H
ealth
Edu
c. P
rog.
Am
eric
an V
eter
inar
y
LB
ES
T C
OP
Y A
VA
ILA
BLE
Ann
ual F
ee -
$1,
935.
60
Prog
ram
Eva
luat
ion
Fee
- $1
,800
On-
site
Vis
it -
$1,8
00
On-
Site
Vis
it -
$2,0
00
On-
site
Vis
it -
$2,0
00 -
5,0
00
Proc
essi
ng F
ee -
$40
0O
n-si
te V
isit
- $3
,900
Dir
ect E
xpen
ses
- $5
00
Sour
ce: E
duca
tion
and
Stud
ent S
ervi
ces
Upd
ate:
9/2
6/96
106

APPENDIX D
DESCRIPTION OF SPECIAL PROGRAMS
English as a Second Language (ESL)
The English as a Second Language (ESL) program offers a series of English courses tomeet the needs of non-native English Speakers. The ESL program is designed for thosestudents who are interested in learning to read, write, speak, listen, and understand theEnglish language in order to work toward the associate in arts or associate in sciencedegree and to progress toward higher degree or enter the workforce.
Description of Services for Program for the Deaf
The Program for the Deaf was established at St. Petersburg Junior College in 1966.Services in the program include interpreting, notetaking, and tutoring. In addition, theprogram offers academic advising, counseling, audiological consulting, and jobplacement services. Telecommunication Devices for the deaf (TDD), Assistive ListeningDevices and amplified telephones are available. This program ensures accessibility forstudents who are deaf and hard of hearing through the provision of comprehensive qualitysupport service, in-service training, and innovation in educational programming
DiO7

St. Petersburg Junior College is dedicated to the concept of equal opportunity. The college will not discriminate on thebasis of race, color, religion, sex, age, national origin or marital status or against any qualified individual with disabilities,in its employment practices or in the admission and treatment of students. Recognizing that sexual harassmentconstitutes discrimination on the basis of sex and violates this rule, the college shall not tolerate such conduct. Shouldyou experience such behavior, please contact the director of EA/EO at 341-3257.
108
U.S. Department of EducationOffice of Educational Research and Improvement (OERI)
Educational Resources Information Center (ERIC)
REPRODUCTION RELEASE(Specific Document)
I. DOCUMENT-IDENTIFICATION:
Title:
ERIC11-0 tcbl
/?croof /97-6-='-f7
Author(s): j:/.4.4414/./ rach etd7,.,1)/ICes'keie.,. of Z/5-6 filLed./:-Ze12:gdz.Corporate Source: Publicatio4 Date:,51; 4eesda.ey -7144/10/C do Were-
/13/3-/ech if/6II. REPRODUCTION RELEASE:
In order to disseminate as widely as possible timely and significant materials of interest to the educational community, documents announcedin the monthly abstract journal of the ERIC system, Resources in Education (RIE), are usually made available to users in microfiche, reproducedpaper copy, and electronic/optical media, and sold through the ERIC Document Reproduction Service (EDRS) or other ERIC vendors. Credit isgiven to the source of each document, and, if reproduction release is granted, one of the following notices is affixed to the document.
If permission is granted to reproduce and disseminate the identified document, please CHECK ONE of the following two options and sign atthe bottom of the page.
ECheck here
For Level 1 Release:Permitting reproduction inmicrofiche (4' x 6" film) orother ERIC archival media(e.g., electronic or optical)and paper copy.
The sample sticker shown below will be
affixed to all Level 1 documents
PERMISSION TO REPRODUCE ANDDISSEMINATE THIS MATERIAL
HAS BEEN GRANTED BY
\e
TO THE EDUCATIONAL RESOURCESINFORMATION CENTER (ERIC)
Level 1
The sample sticker shown below will beaffixed to all Level 2 documents
PERMISSION TO REPRODUCE ANDDISSEMINATE THIS
MATERIAL IN OTHER THAN PAPERCOPY HAS BEEN GRANTED BY
\e
TO THE EDUCATIONAL RESOURCESINFORMATION CENTER (ERIC)
Level 2
Documents will be processed as indicated provided reproduction quality permits. If permissionto reproduce is granted, but neither box is checked, documents will be processed at Level 1.
ECheck here
For Level 2 Release:Permitting reproduction inmicrofiche (4' x 6" film) orother ERIC archival media(e.g., electronic or optical),but not in paper copy.
'I hereby grant to the Educational Resources Information Center (ERIC) nonexclusive permission to reproduce and disseminatethis document as indicated above. Reproduction from the ERIC microfiche or electronic/optical media by persons other thanERIC employees and its system contractors requires permission from the copyright holder. Exception is made for non-profitreproduction by libraries and other service agencies to satisfy information needs of educators in response to discrete inquiries.'
Sign Sigiee:here-)please
rganization/Address:
A'0.00is/30,/6detes,6d, FL -3 3 73 3
knted Name/Positiongjtle,..te, Sus A./ e . PoSc e1 0 CP fi 10,41 I do
Telephone:
E-Mail Address:3 374 1/.3 f- i/.55
Date:fisihe/es643'epiA:1 . spa. c,. cc, f as
(over)