Document Contents
118
Toggle SGML Header (+) Section 1: 10-K (FORM 10-K) Table of Contents UNITED STATES SECURITIES AND EXCHANGE COMMISSION Washington, D.C. 20549 FORM 10-K ☑ ANNUAL REPORT PURSUANT TO SECTION 13 OR 15(d) OF THE SECURITIES EXCHANGE ACT OF 1934 For the fiscal year ended December 31, 2017 OR ☐ TRANSITION REPORT PURSUANT TO SECTION 13 OR 15(d) OF THE SECURITIES EXCHANGE ACT OF 1934 For the transition period from __________ to __________ Commission file number 1-10899 Kimco Realty Corporation (Exact name of registrant as specified in its charter) Maryland 13-2744380 (State or other jurisdiction of incorporation or organization) (I.R.S. Employer Identification No.) 3333 New Hyde Park Road, New Hyde Park, NY 11042-0020 (Address of principal executive offices) (Zip Code) (516) 869-9000 (Registrant’s telephone number, including area code) Securities registered pursuant to Section 12(b) of the Act: Name of each exchange on Title of each class which registered Common Stock, par value $.01 per share. New York Stock Exchange Depositary Shares, each representing one-thousandth of a share of 6.000% Class I Cumulative Redeemable Preferred Stock, $1.00 par value per share. New York Stock Exchange Depositary Shares, each representing one-thousandth of a share of 5.500% Class J Cumulative Redeemable Preferred Stock, $1.00 par value per share. New York Stock Exchange Depositary Shares, each representing one-thousandth of a share of 5.625% Class K Cumulative Redeemable Preferred Stock, $1.00 par value per share. New York Stock Exchange Depositary Shares, each representing one-thousandth of a share of 5.125% Class L Cumulative Redeemable Preferred Stock, $1.00 par value per share. New York Stock Exchange Depositary Shares, each representing one-thousandth of a share of 5.250% Class M Cumulative Redeemable Preferred Stock, $1.00 par value per share. New York Stock Exchange Securities registered pursuant to section 12(g) of the Act: None Indicate by check mark if the registrant is a well-known seasoned issuer, as defined in Rule 405 of the Securities Act. Yes ☑ No ☐ Indicate by check mark if the registrant is not required to file reports pursuant to Section 13 or Section 15(d) of the Act. Yes ☐ No ☑ Indicate by check mark whether the registrant (1) has filed all reports required to be filed by Section 13 or 15(d) of the Securities Exchange Act of 1934 during the preceding 12 months (or for such shorter period that the registrant was required to file such reports), and (2) has been subject to such filing requirements for the past 90 days. Yes ☑ No ☐ Indicate by check mark whether the registrant has submitted electronically and posted on its corporate website, if any, every Interactive Data File required to be submitted and posted pursuant to Rule 405 of Regulation S-T (§ 232.405 of this chapter) during the preceding 12 months (or for such shorter period that the registrant was required to submit and post such files). Yes ☑ No ☐ Indicate by check mark if disclosure of delinquent filers pursuant to Item 405 of Regulation S-K (§ 229.405 of this chapter) is not contained herein, and will not be contained, to the best of registrant's knowledge, in definitive proxy or information statements incorporated by reference in Part III of this Form 10-K or any amendment to this Form 10-K. ☑ Go to...
-
Upload
khangminh22 -
Category
Documents
-
view
0 -
download
0
Transcript of Document Contents

Toggle SGML Header (+)
Section 1: 10-K (FORM 10-K)
Table of Contents
UNITED STATES
SECURITIES AND EXCHANGE COMMISSIONWashington, D.C. 20549
FORM 10-K
☑ ANNUAL REPORT PURSUANT TO SECTION 13 OR 15(d) OF THE SECURITIES EXCHANGE ACT OF 1934
For the fiscal year ended December 31, 2017
OR ☐ TRANSITION REPORT PURSUANT TO SECTION 13 OR 15(d) OF THE SECURITIES EXCHANGE ACT OF 1934
For the transition period from __________ to __________
Commission file number 1-10899
Kimco Realty Corporation(Exact name of registrant as specified in its charter)
Maryland 13-2744380
(State or other jurisdiction ofincorporation or organization)
(I.R.S. Employer Identification No.)
3333 New Hyde Park Road, New Hyde Park, NY 11042-0020
(Address of principal executive offices) (Zip Code)
(516) 869-9000(Registrant’s telephone number, including area code)
Securities registered pursuant to Section 12(b) of the Act:
Name of each exchange onTitle of each class which registered
Common Stock, par value $.01 per share. New York Stock ExchangeDepositary Shares, each representing one-thousandth of a share of 6.000% Class I Cumulative Redeemable Preferred
Stock, $1.00 par value per share. New York Stock Exchange
Depositary Shares, each representing one-thousandth of a share of 5.500% Class J Cumulative Redeemable Preferred Stock,$1.00 par value per share. New York Stock Exchange
Depositary Shares, each representing one-thousandth of a share of 5.625% Class K Cumulative Redeemable Preferred Stock,$1.00 par value per share. New York Stock Exchange
Depositary Shares, each representing one-thousandth of a share of 5.125% Class L Cumulative Redeemable Preferred Stock,$1.00 par value per share. New York Stock Exchange
Depositary Shares, each representing one-thousandth of a share of 5.250% Class M Cumulative Redeemable Preferred Stock,$1.00 par value per share. New York Stock Exchange
Securities registered pursuant to section 12(g) of the Act: None
Indicate by check mark if the registrant is a well-known seasoned issuer, as defined in Rule 405 of the Securities Act. Yes ☑ No ☐
Indicate by check mark if the registrant is not required to file reports pursuant to Section 13 or Section 15(d) of the Act. Yes ☐ No ☑
Indicate by check mark whether the registrant (1) has filed all reports required to be filed by Section 13 or 15(d) of the Securities Exchange Act of 1934 during the
preceding 12 months (or for such shorter period that the registrant was required to file such reports), and (2) has been subject to such filing requirements for the past90 days. Yes ☑ No ☐
Indicate by check mark whether the registrant has submitted electronically and posted on its corporate website, if any, every Interactive Data File required to besubmitted and posted pursuant to Rule 405 of Regulation S-T (§ 232.405 of this chapter) during the preceding 12 months (or for such shorter period that the registrantwas required to submit and post such files). Yes ☑ No ☐
Indicate by check mark if disclosure of delinquent filers pursuant to Item 405 of Regulation S-K (§ 229.405 of this chapter) is not contained herein, and will not becontained, to the best of registrant's knowledge, in definitive proxy or information statements incorporated by reference in Part III of this Form 10-K or any amendmentto this Form 10-K. ☑
Go to...

Table of Contents
Indicate by check mark whether the registrant is a large accelerated filer, an accelerated filer, a non-accelerated filer, smaller reporting company or an emerginggrowth company. See the definitions of “large accelerated filer,” “accelerated filer,” “smaller reporting company, and “emerging growth company”” in Rule 12b-2 ofthe Exchange Act.
Large accelerated filer ☑ Accelerated filer ☐Non-accelerated filer ☐ Smaller reporting company ☐Emerging growth company ☐
(Do not check if a smaller reporting company.)
If an emerging growth company, indicate by check mark if the registrant has elected not to use the extended transition period for complying with any new orrevised financial accounting standards provided pursuant to Section 13(a) of the Exchange Act. ☐
Indicate by check mark whether the registrant is a shell company (as defined in Rule 12b-2 of the Act). Yes ☐ No ☑
The aggregate market value of the voting and non-voting common equity held by non-affiliates of the registrant was approximately $7.6 billion based upon theclosing price on the New York Stock Exchange for such equity on June 30, 2017.
(APPLICABLE ONLY TO CORPORATE REGISTRANTS)Indicate the number of shares outstanding of each of the registrant's classes of common stock, as of the latest practicable date.
As of February 20, 2018, the registrant had 425,455,523 shares of common stock outstanding.
DOCUMENTS INCORPORATED BY REFERENCE
Part III incorporates certain information by reference to the Registrant's definitive proxy statement to be filed with respect to the Annual Meeting of Stockholders
expected to be held on April 24, 2018.
Index to Exhibits begins on page 43.
Page 1 of 98

Table of Contents
TABLE OF CONTENTS
Item No.Form 10-K
Report PagePART I
Item 1. Business 3Item 1A. Risk Factors 6Item 1B. Unresolved Staff Comments 13Item 2. Properties 13Item 3. Legal Proceedings 15Item 4. Mine Safety Disclosures 15
PART II
Item 5. Market for the Registrant's Common Equity, Related Stockholder Matters and Issuer Purchases of Equity Securities 16Item 6. Selected Financial Data 19Item 7. Management's Discussion and Analysis of Financial Condition and Results of Operations 20Item 7A. Quantitative and Qualitative Disclosures About Market Risk 39Item 8. Financial Statements and Supplementary Data 40Item 9. Changes in and Disagreements With Accountants on Accounting and Financial Disclosure 40Item 9A. Controls and Procedures 40Item 9B. Other Information 40
PART III Item 10. Directors, Executive Officers and Corporate Governance 40Item 11. Executive Compensation 40Item 12. Security Ownership of Certain Beneficial Owners and Management and Related Stockholder Matters 41Item 13. Certain Relationships and Related Transactions, and Director Independence 41Item 14. Principal Accounting Fees and Services 41
PART IV Item 15. Exhibits, Financial Statement Schedules 42Item 16. Form 10-K Summary 42
2

Table of Contents
FORWARD-LOOKING STATEMENTS
This annual report on Form 10-K (“Form 10-K”), together with other statements and information publicly disseminated by Kimco Realty Corporation (the“Company”) contains certain forward-looking statements within the meaning of Section 27A of the Securities Act of 1933, as amended, and Section 21E of theSecurities Exchange Act of 1934, as amended. The Company intends such forward-looking statements to be covered by the safe harbor provisions for forward-lookingstatements contained in the Private Securities Litigation Reform Act of 1995 and includes this statement for purposes of complying with the safe harbor provisions.Forward-looking statements, which are based on certain assumptions and describe the Company’s future plans, strategies and expectations, are generally identifiableby use of the words “believe,” “expect,” “intend,” “anticipate,” “estimate,” “project,” “will,” “target,” “forecast” or similar expressions. You should not rely onforward-looking statements since they involve known and unknown risks, uncertainties and other factors which are, in some cases, beyond the Company’s controland could materially affect actual results, performances or achievements. Factors which may cause actual results to differ materially from current expectations include,but are not limited to (i) general adverse economic and local real estate conditions, (ii) the inability of major tenants to continue paying their rent obligations due tobankruptcy, insolvency or a general downturn in their business, (iii) financing risks, such as the inability to obtain equity, debt or other sources of financing orrefinancing on favorable terms to the Company, (iv) the Company’s ability to raise capital by selling its assets, (v) changes in governmental laws and regulations, (vi)the level and volatility of interest rates and foreign currency exchange rates and managements’ ability to estimate the impact thereof, (vii) risks related to theCompany’s international operations, (viii) the availability of suitable acquisition, disposition, development and redevelopment opportunities, and risks related toacquisitions not performing in accordance with our expectations, (ix) valuation and risks related to the Company’s joint venture and preferred equity investments, (x)valuation of marketable securities and other investments, (xi) increases in operating costs, (xii) changes in the dividend policy for the Company’s common stock, (xiii)the reduction in the Company’s income in the event of multiple lease terminations by tenants or a failure by multiple tenants to occupy their premises in a shoppingcenter, (xiv) impairment charges, (xv) unanticipated changes in the Company’s intention or ability to prepay certain debt prior to maturity and/or hold certain securitiesuntil maturity and (xvi) the risks and uncertainties identified under Item 1A, “Risk Factors” and elsewhere in this Form 10-K and in the Company’s other filings withthe Securities and Exchange Commission (“SEC”). Accordingly, there is no assurance that the Company’s expectations will be realized. The Company disclaims anyintention or obligation to update the forward-looking statements, whether as a result of new information, future events or otherwise. You are advised to refer to anyfurther disclosures the Company makes or related subjects in the Company’s quarterly reports on Form 10-Q and current reports on Form 8-K that the Company fileswith the SEC.
PART I
Item 1. Business
Overview Kimco Realty Corporation, a Maryland corporation, is one of North America’s largest publicly traded owners and operators of open-air shopping centers. The
terms “Kimco,” the “Company,” “we,” “our” and “us” each refer to Kimco Realty Corporation and our subsidiaries, unless the context indicates otherwise. TheCompany’s mission is to create destinations for everyday living that inspire a sense of community and deliver value to our many stakeholders.
The Company is a self-administered real estate investment trust (“REIT”) and has owned and operated open-air shopping centers for 60 years. The Company has
not engaged, nor does it expect to retain, any REIT advisors in connection with the operation of its properties. As of December 31, 2017, the Company had interests in493 shopping center properties (the “Combined Shopping Center Portfolio”), aggregating 83.2 million square feet of gross leasable area (“GLA”), located in 29 states,Puerto Rico and Canada. In addition, the Company had 372 other property interests, primarily through the Company’s preferred equity investments and other realestate investments, totaling 5.8 million square feet of GLA. The Company’s ownership interests in real estate consist of its consolidated portfolio and portfolios wherethe Company owns an economic interest, such as properties in the Company’s investment real estate management programs, where the Company partners withinstitutional investors and also retains management.
The Company's executive offices are located at 3333 New Hyde Park Road, New Hyde Park, New York 11042-0020 and its telephone number is (516) 869-9000.
Nearly all operating functions, including leasing, legal, construction, data processing, maintenance, finance and accounting are administered by the Company from itsexecutive offices in New Hyde Park, New York and supported by the Company’s regional offices. As of December 31, 2017, a total of 546 persons were employed bythe Company.
The Company’s website is located at http://www.kimcorealty.com. The information contained on our website does not constitute part of this Form 10-K. On the
Company’s website you can obtain, free of charge, a copy of this Form 10-K, quarterly reports on Form 10-Q, current reports on Form 8-K and amendments to thosereports filed or furnished pursuant to Section 13(a) or 15(d) of the Exchange Act of 1934, as amended, as soon as reasonably practicable, after we file such materialelectronically with, or furnish it to, the SEC. The public may read and copy any materials we file with the SEC at the SEC's Public Reference Room at 100 F Street, NE,Washington, DC 20549. The public may obtain information on the operation of the Public Reference Room by calling the SEC at 1-800-SEC-0330. The SEC alsomaintains a website that contains reports, proxy and information statements, and other information regarding issuers that file electronically with the SEC athttp://www.sec.gov.
3

Table of Contents
The Company began operations through its predecessor, The Kimco Corporation, which was organized in 1966 upon the contribution of several shopping centerproperties owned by its principal stockholders. In 1973, these principals formed the Company as a Delaware corporation, and, in 1985, the operations of The KimcoCorporation were merged into the Company. The Company completed its initial public stock offering (the “IPO”) in November 1991, and, commencing with its taxableyear which began January 1, 1992, elected to qualify as a REIT in accordance with Sections 856 through 860 of the Internal Revenue Code of 1986, as amended (the“Code”). If, as the Company believes, it is organized and operates in such a manner so as to qualify and remain qualified as a REIT under the Code, the Companygenerally will not be subject to federal income tax, provided that distributions to its stockholders equal at least the amount of its REIT taxable income, as defined underthe Code. The Company maintains certain subsidiaries which made joint elections with the Company to be treated as taxable REIT subsidiaries (“TRS”), which permitthe Company to engage in certain business activities which the REIT may not conduct directly. A TRS is subject to federal and state income taxes on its income, andthe Company includes a provision for taxes in its consolidated financial statements. In 1994, the Company reorganized as a Maryland corporation. In March 2006, theCompany was added to the S & P 500 Index, an index containing the stock of 500 Large Cap companies, most of which are U.S. corporations. The Company's commonstock, Class I Depositary Shares, Class J Depositary Shares, Class K Depositary Shares, Class L Depositary Shares and Class M Depositary Shares are traded on theNew York Stock Exchange (“NYSE”) under the trading symbols “KIM”, “KIMprI”, “KIMprJ”, “KIMprK”, “KIMprL”, and “KIMprM”, respectively.
The Company’s initial growth resulted primarily from real estate under development and the construction of shopping centers. Subsequently, the Company
revised its growth strategy to focus on the acquisition of existing shopping centers and continued its expansion across the nation and internationally within Canada,Mexico and South America (Chile, Brazil and Peru). The Company implemented its investment real estate management format through the establishment of variousinstitutional joint venture programs, in which the Company has noncontrolling interests. The Company earns management fees, acquisition fees, disposition fees aswell as promoted interests based on achieving certain performance metrics.
During 2013, the Company began its efforts to exit its foreign investments due to perceived changes in market conditions. As of December 31, 2017, the Company
has substantially liquidated its investments in Mexico and Canada and has completely exited South America. In addition, the Company has capitalized on its established expertise in retail real estate by establishing other ventures in which the Company owns a smaller
equity interest and provides management, leasing and operational support for those properties. The Company has also provided preferred equity capital in the past toreal estate entrepreneurs and, from time to time, provides real estate capital and management services to both healthy and distressed retailers. The Company has alsomade selective investments in secondary market opportunities where a security or other investment is, in management’s judgment, priced below the value of theunderlying assets, however these investments are subject to volatility within the equity and debt markets. For the years ended December 31, 2017, 2016 and 2015, theCompany’s consolidated revenues were $1.2 billion, $1.2 billion and $1.1 billion, respectively, which includes $0.3 million, $0.6 million and $8.6 million, respectively,from the Company’s consolidated foreign investments. For the years ended December 31, 2017, 2016 and 2015, the Company’s equity in income from unconsolidatedjoint ventures and preferred equity investments were $60.8 million, $218.7 million and $480.4 million, respectively, which includes equity loss of $1.6 million, equityincome of $149.0 million and equity income of $408.4 million, respectively, from the Company’s unconsolidated foreign investments. See Item 7A Quantitative andQualitative Disclosures About Market Risk for further details regarding the Company’s foreign investments.
Business Objective and Strategies
Business Objective
The Company’s primary business objective is to be the premier owner and operator of open-air shopping centers in the U.S. The Company believes it canachieve this objective by: ● increasing value of its existing portfolio of properties and generating higher levels of portfolio growth; ● increasing cash flows for reinvestment and/or for distribution to shareholders; ● continuing growth in desirable demographic areas with successful retailers; and ● increasing capital appreciation.
Operating Strategies
The Company’s operating strategies are to (i) own and operate its shopping center properties at their highest potential through maximizing and maintainingrental income and occupancy levels, (ii) attract local area customers to its shopping centers, which offer day-to-day necessities rather than high-priced luxury items,and (iii) maintain a strong balance sheet.
To effectively execute these strategies the Company seeks to:
● increase rental rates through the leasing of space to new tenants;
● attract a diverse and robust tenant base across a variety of retailers at its properties, which include grocery store, national or regional discountdepartment store or drugstore tenants;
● renew leases with existing tenants; ● decrease vacancy levels and duration of vacancy; ● monitor operating costs and overhead; ● redevelop existing shopping centers to obtain the highest and best use to maximize the real estate value; ● provide unmatched tenant services deriving from decades of experience managing retail properties; and ● provide communities with a destination for everyday living goods and services.
4

Table of Contents
The Company reduces its operating and leasing risks through diversification achieved by the geographic distribution of its properties and a large tenant base. Asof December 31, 2017, no single open-air shopping center accounted for more than 1.8% of the Company's annualized base rental revenues, including theproportionate share of base rental revenues from properties in which the Company has less than a 100% economic interest, or more than 1.6% of the Company’s totalshopping center GLA. Furthermore, at December 31, 2017, the Company’s single largest tenant represented only 3.6% and the Company’s five largest tenantsaggregated less than 12.0% of the Company’s annualized base rental revenues, including the proportionate share of base rental revenues from properties in which theCompany has less than a 100% economic interest.
As one of the original participants in the growth of the shopping center industry and one of the nation's largest owners and operators of open-air shopping
centers, the Company has established close relationships with major national and regional retailers and maintains a broad network of industry contacts. Managementis associated with and/or actively participates in many shopping center and REIT industry organizations. Notwithstanding these relationships, there are numerousregional and local commercial developers, real estate companies, financial institutions and other investors who compete with the Company for the acquisition ofproperties and other investment opportunities and in seeking tenants who will lease space in the Company’s properties.
Investment Strategies
The Company’s investment strategy is to invest capital into high quality assets which are concentrated in major metro markets that provide opportunity forgrowth while disposing of lesser quality assets in more undesirable locations. Through this strategy, the Company has steadily progressed in its transformation of itsportfolio and will continue these efforts as deemed necessary to maximize the quality and growth of its portfolio. The properties acquired are primarily located in majormetro areas allowing tenants to generate higher foot traffic resulting in higher sales volume. The Company believes that this will enable it to maintain higheroccupancy levels, rental rates and rental growth.
The Company’s investment strategy also includes the retail re-tenanting, renovation and expansion of its existing centers and acquired centers. The Companymay selectively acquire established income-producing real estate properties and properties requiring significant re-tenanting and redevelopment, primarily ingeographic regions in which the Company presently operates. Additionally, the Company may selectively acquire land parcels in its key markets for real estatedevelopment projects for long-term investment. The Company may consider investments in other real estate sectors and in geographic markets where it does notpresently operate should suitable opportunities arise. The Company also continues to simplify its business by reducing the number of joint venture investments andpursuing redevelopment opportunities to increase overall value within its portfolio.
As part of the Company’s investment strategy each property is evaluated for its highest and best use, which may include residential and mixed-use components.In addition, the Company may consider other opportunistic investments related to retailer controlled real estate such as, repositioning underperforming retaillocations, retail real estate financing and bankruptcy transaction support. The Company has an active capital recycling program which provides for the disposition ofcertain properties. If the Company accepts sales prices for any of these assets that are less than their net carrying values, the Company would be required to takeimpairment charges and such amounts could be material.
In order to execute the Company’s strategy, the Company intends to continue to strengthen its balance sheet by pursuing deleveraging efforts over time,providing it the necessary flexibility to invest opportunistically and selectively, primarily focusing on U.S. open-air shopping centers.
The Company may either purchase or lease income-producing properties in the future and may also participate with other entities in property ownership through
partnerships, joint ventures or similar types of co-ownership. Equity investments may be subject to existing mortgage financing and/or other indebtedness. Financingor other indebtedness may be incurred simultaneously or subsequently in connection with such investments. Any such financing or indebtedness would havepriority over the Company’s equity interest in such property.
Corporate Responsibility and Sustainability
The Company is focused on building a thriving and sustainable business, one that succeeds by delivering long-term value for its stakeholders. The Companytakes pride in how it conducts business, including the positive contribution it makes to communities and its initiatives to safeguard the environment.
By investing in technologies and improved processes, the Company has delivered significant year-over-year reductions in energy consumption across its
portfolio of properties. Re-thinking how it controls and lights its parking areas significantly reduces operating costs and meaningfully curbs negative environmentalimpacts associated with fossil-fuel based energy sources.
The Company’s responsibility efforts are not limited to promoting operational efficiency. The Company believes that sustainability leadership also requires an
understanding of how environmental, social, and governance issues impact both its customers and the organization’s future growth prospects. As a result, it is takingsteps to engage with its tenants on these issues and to better understand how the shopping centers it chooses to own and manage can grow in value by viewingthem through this unique lens.
5

Table of Contents
To focus the Company’s corporate responsibility efforts, it has established a set of five strategic program priorities: ● openly engage its key stakeholders; ● lead by example in its operations; ● positively influence tenants & partners; ● enhance its communities; and ● build and retain a quality team.
For the third consecutive year, the Company was named to the Dow Jones Sustainability North America Index, remaining the sole U.S. retail owner among eligible
companies. The Company also earned the Green Star designation by the Global Real Estate Sustainability Benchmark (“GRESB”) for the fourth year in a row andremains the top-ranked North American company among a peer group of open-air retail property owners.
Executive Officers The following table sets forth information with respect to the executive officers of the Company as of December 31, 2017:
Name Age Position Joined KimcoMilton Cooper 88 Executive Chairman of the Board of Directors Co-FounderConor C. Flynn 37 Chief Executive Officer 2003Ross Cooper 35 President and Chief Investment Officer (1) 2006
Glenn G. Cohen 53 Executive Vice President,Chief Financial Officer and Treasurer 1995
David Jamieson 37 Executive Vice President,Chief Operating Officer (2) 2007
(1) Ross Cooper was elected President and Chief Investment Officer in February 2017 and prior to that had served as Executive Vice President and ChiefInvestment Officer since May 2015.
(2) David Jamieson was elected Executive Vice President, Chief Operating Officer in February 2017 and prior to that had served as Executive Vice President ofAsset Management and Operations since May 2015.
Item 1A. Risk Factors
We are subject to certain business and legal risks including, but not limited to, the following:
Risks Related to Our Business and Operations Adverse global market and economic conditions may impede our ability to generate sufficient income and maintain our properties. Our properties consist primarily of open-air shopping centers and other retail properties. Our performance, therefore, is generally linked to economic conditions in
the market for retail space. The economic performance and value of our properties is subject to all of the risks associated with owning and operating real estate,including but not limited to:
● changes in the national, regional and local economic climate; ● local conditions, including an oversupply of, or a reduction in demand for, space in properties like those that we own; ● trends toward smaller store sizes as retailers reduce inventory and new prototypes; ● increasing use by customers of e-commerce and online store sites; ● the attractiveness of our properties to tenants; ● the ability of tenants to pay rent, particularly anchor tenants with leases in multiple locations; ● tenants who may declare bankruptcy and/or close stores; ● competition from other available properties to attract and retain tenants; ● changes in market rental rates; ● the need to periodically pay for costs to repair, renovate and re-let space; ● ongoing consolidation in the retail sector; ● the excess amount of retail space in a number of markets; ● changes in operating costs, including costs for maintenance, insurance and real estate taxes;
● the expenses of owning and operating properties, which are not necessarily reduced when circumstances such as market factors and competition cause areduction in income from the properties;
6

Table of Contents ● changes in laws and governmental regulations, including those governing usage, zoning, the environment and taxes; ● acts of terrorism and war, acts of God and physical and weather-related damage to our properties; and ● the risk of functional obsolescence of properties over time.
Competition may limit our ability to purchase new properties or generate sufficient income from tenants and may decrease the occupancy and rental rates for
our properties. Numerous commercial developers and real estate companies compete with us in seeking tenants for our existing properties and properties for acquisition. New
regional malls, open-air lifestyle centers or other retail shopping centers with more convenient locations or better rents may attract tenants or cause them to seek morefavorable lease terms at or prior to renewal. Retailers at our properties may face increasing competition from other retailers, e-commerce, outlet malls, discountshopping clubs, direct mail, telemarketing or home shopping networks, all of which could (i) reduce rents payable to us; (ii) reduce our ability to attract and retaintenants at our properties; or (iii) lead to increased vacancy rates at our properties. We may fail to anticipate the effects of changes in consumer buying practices,particularly of growing online sales and the resulting retailing practices and space needs of our tenants or a general downturn in our tenants’ businesses, which maycause tenants to close stores or default in payment of rent.
We face competition in the acquisition or development of real property from others engaged in real estate investment that could increase our costs associated
with purchasing and maintaining assets. Some of these competitors may have greater financial resources than we do. This could result in competition for theacquisition of properties for tenants who lease or consider leasing space in our existing and subsequently acquired properties and for other real estate investment ordevelopment opportunities.
Our performance depends on our ability to collect rent from tenants, including anchor tenants, our tenants’ financial condition and our tenants maintaining
leases for our properties. At any time, our tenants may experience a downturn in their business that may significantly weaken their financial condition. As a result, our tenants may delay a
number of lease commencements, decline to extend or renew leases upon expiration, fail to make rental payments when due, close stores or declare bankruptcy. Any ofthese actions could result in the termination of tenants’ leases and the loss of rental income attributable to these tenants’ leases. In the event of a default by a tenant,we may experience delays and costs in enforcing our rights as landlord under the terms of the leases.
In addition, multiple lease terminations by tenants, including anchor tenants, or a failure by multiple tenants to occupy their premises in a shopping center could
result in lease terminations or significant reductions in rent by other tenants in the same shopping centers under the terms of some leases. In that event, we may beunable to re-lease the vacated space at attractive rents or at all, and our rental payments from our continuing tenants could significantly decrease. The occurrence ofany of the situations described above, particularly involving a substantial tenant with leases in multiple locations, could have a material adverse effect on our financialcondition, results of operations and cash flows.
A tenant that files for bankruptcy protection may not continue to pay us rent. A bankruptcy filing by , or relating to, one of our tenants or a lease guarantor would
bar all efforts by us to collect pre-bankruptcy debts from the tenant or the lease guarantor, or their property, unless the bankruptcy court permits us to do so. A tenantbankruptcy could delay our efforts to collect past due balances under the relevant leases and could ultimately preclude collection of these sums. If a lease is rejectedby a tenant in bankruptcy, we would have only a general unsecured claim for damages. As a result, it is likely that we would recover substantially less than the fullvalue of any unsecured claims we hold, if at all.
We may be unable to sell our real estate property investments when appropriate or on terms favorable to us. Real estate property investments are illiquid and generally cannot be disposed of quickly. In addition, the Code restricts a REIT’s ability to dispose of properties
that are not applicable to other types of real estate companies. Therefore, we may not be able to vary our portfolio in response to economic or other conditionspromptly or on terms favorable to us within a timeframe that we would need.
We may acquire or develop properties or acquire other real estate related companies, and this may create risks. We may acquire or develop properties or acquire other real estate related companies when we believe that an acquisition or development is consistent with our
business strategies. We may not succeed in consummating desired acquisitions or in completing developments on time or within budget. When we do pursue aproject or acquisition, we may not succeed in leasing newly developed or acquired properties at rents sufficient to cover the costs of acquisition or development andoperations. Difficulties in integrating acquisitions may prove costly or time-consuming and could divert management’s attention from other activities. Acquisitions ordevelopments in new markets or industries where we do not have the same level of market knowledge may result in poorer than anticipated performance. We may alsoabandon acquisition or development opportunities that management has begun pursuing and consequently fail to recover expenses already incurred and will havedevoted management’s time to a matter not consummated. Furthermore, our acquisitions of new properties or companies will expose us to the liabilities of thoseproperties or companies, some of which we may not be aware of at the time of the acquisition. In addition, development of our existing properties presents similarrisks.
7

Table of Contents
Newly acquired or re-developed properties may have characteristics or deficiencies currently unknown to us that affect their value or revenue potential. It is alsopossible that the operating performance of these properties may decline under our management. As we acquire additional properties, we will be subject to risksassociated with managing new properties, including lease-up and tenant retention. In addition, our ability to manage our growth effectively will require us tosuccessfully integrate our new acquisitions into our existing management structure. We may not succeed with this integration or effectively manage additionalproperties, particularly in secondary markets. Also, newly acquired properties may not perform as expected.
Unsuccessful real estate under development activities or a slowdown in real estate under development activities could have a direct impact on our growth,
results of operations and cash flows. Real estate under development is a component of our operating and investment strategy. We intend to continue pursuing select real estate under development
opportunities for long-term investment and construction of retail and/or mixed-use properties as opportunities arise. We expect to phase in construction untilsufficient preleasing is reached. Our real estate under development and construction activities include the following risks:
● we may abandon real estate under development opportunities after expending resources and could lose all or part of our investment in such opportunities,including loss of deposits or failure to recover expenses already incurred;
● development, construction or operating costs, including increased interest rates and higher materials, transportation, labor, leasing or other costs, mayexceed our original estimates;
● occupancy rates and rents at a newly completed property may not meet our expectations and may not be sufficient to make the property profitable; ● construction or permanent financing may not be available to us on favorable terms or at all;
● we may not complete construction and lease-up on schedule due to a variety of factors including construction delays or contractor changes, resulting inincreased expenses and construction costs or tenants or operators with the right to terminate pre-construction leases; and
● we may not be able to obtain, or may experience delays in obtaining, necessary zoning, land use, building, occupancy and other required governmentalpermits and authorizations.
Additionally, new real estate under development activities typically require substantial time and attention from management, and the time frame required for
development, construction and lease-up of these properties could require several years to realize any significant cash return. The foregoing risks could hinder ourgrowth and have an adverse effect on our financial condition, results of operations and cash flows.
Construction and development projects are subject to risks that materially increase the costs of completion. In the event that we decide to develop and construct new properties or redevelop existing properties, we will be subject to risks and uncertainties associated with
construction and development. These risks include, but are not limited to, risks related to obtaining all necessary zoning, land-use, building occupancy and othergovernmental permits and authorizations, risks related to the environmental concerns of government entities or community groups, risks related to changes ineconomic and market conditions between development commencement and stabilization, risks related to construction labor disruptions, adverse weather, acts of Godor shortages of materials which could cause construction delays and risks related to increases in the cost of labor and materials which could cause construction coststo be greater than projected and adversely impact the amount of our development fees or our financial condition, results of operations and cash flows.
We do not have exclusive control over our joint venture and preferred equity investments, such that we are unable to ensure that our objectives will be pursued. We have invested in some properties as a co-venturer or partner, instead of owning directly. In these investments, we do not have exclusive control over the
development, financing, leasing, management and other aspects of these investments. As a result, the co-venturer or partner might have interests or goals that areinconsistent with ours, take action contrary to our interests or otherwise impede our objectives. These investments involve risks and uncertainties. The co-venturer orpartner may fail to provide capital or fulfill its obligations, which may result in certain liabilities to us for guarantees and other commitments. Conflicts arising betweenus and our partners may be difficult to manage and/or resolve and it could be difficult to manage or otherwise monitor the existing business arrangements. The co-venturer or partner also might become insolvent or bankrupt, which may result in significant losses to us.
8

Table of Contents
In addition, joint venture arrangements may decrease our ability to manage risk and implicate additional risks, such as:
● potentially inferior financial capacity, diverging business goals and strategies and the need for our venture partner’s continued cooperation; ● our inability to take actions with respect to the joint venture activities that we believe are favorable to us if our joint venture partner does not agree; ● our inability to control the legal entity that has title to the real estate associated with the joint venture;
● our lenders may not be easily able to sell our joint venture assets and investments or may view them less favorably as collateral, which could negativelyaffect our liquidity and capital resources;
● our joint venture partners can take actions that we may not be able to anticipate or prevent, which could result in negative impacts on our debt and equity;and
● our joint venture partners’ business decisions or other actions or omissions may result in harm to our reputation or adversely affect the value of ourinvestments.
Our joint venture and preferred equity investments generally own real estate properties for which the economic performance and value is subject to all the risks
associated with owning and operating real estate as described above. We may not be able to recover our investments in mortgage receivables or other investments, which may result in significant losses to us. In the event of a default by a borrower, it may be necessary for us to foreclose our mortgage or engage in costly negotiations. Delays in liquidating defaulted
mortgage loans and repossessing and selling the underlying properties could reduce our investment returns. Furthermore, in the event of default, the actual value ofthe property securing the mortgage may decrease. A decline in real estate values will adversely affect the value of our loans and the value of the mortgages securingour loans.
Our mortgage receivables may be or become subordinated to mechanics' or materialmen's liens or property tax liens. In these instances, we may need to protect a
particular investment by making payments to maintain the current status of a prior lien or discharge it entirely. Where that occurs, the total amount we recover may beless than our total investment, resulting in a loss. In the event of a major loan default or several loan defaults resulting in losses, our investments in mortgagereceivables would be materially and adversely affected.
The economic performance and value of our other investments which we do not control and are in retail operations, are subject to risks associated with owning
and operating retail businesses, including:
● changes in the national, regional and local economic climate; ● the adverse financial condition of some large retailing companies; ● increasing use by customers of e-commerce and online store sites; and ● ongoing consolidation in the retail sector.
A decline in the value of our other investments may require us to recognize an other-than-temporary impairment (“OTTI”) against such assets. When the fair
value of an investment is determined to be less than its amortized cost at the balance sheet date, we assess whether the decline is temporary or other-than-temporary.If we intend to sell an impaired asset, or it is more likely than not that we will be required to sell the impaired asset before any anticipated recovery, then we mustrecognize an OTTI through charges to earnings equal to the entire difference between the asset’s amortized cost and its fair value at the balance sheet date. When anOTTI is recognized through earnings, a new cost basis is established for the asset and the new cost basis may not be adjusted through earnings for subsequentrecoveries in fair value.
We intend to continue to sell our non-strategic assets and may not be able to recover our investments, which may result in significant losses to us. There can be no assurance that we will be able to recover the current carrying amount of all of our non-strategic properties and investments and those of our
unconsolidated joint ventures in the future. Our failure to do so would require us to recognize impairment charges for the period in which we reached that conclusion,which could materially and adversely affect our financial condition, results of operations and cash flows.
We have substantially completed our efforts to exit our investments in Mexico, South America and Canada, however, we cannot predict the impact of laws and
regulations affecting these international operations, including the United States Foreign Corrupt Practices Act, or the potential that we may face regulatorysanctions.
Our international operations have included properties in Canada, Mexico, Chile, Brazil and Peru and are subject to a variety of United States and foreign laws and
regulations, including the United States Foreign Corrupt Practices Act (“FCPA”) and foreign tax laws and regulations. Although we have substantially completed ourefforts to exit our investments in Mexico, South America and Canada, we cannot assure you that our past or any current international operations will continue to befound to be in compliance with such laws or regulations. In addition, we cannot predict the manner in which such laws or regulations might be administered orinterpreted, or when, or the potential that we may face regulatory sanctions or tax audits as a result of our international operations.
9

Table of Contents
We face risks relating to cybersecurity attacks which could adversely affect our business, cause loss of confidential information and disrupt operations. A cyber incident is considered to be any adverse event that threatens the confidentiality, integrity, or availability of our information resources. More specifically,
a cyber incident is an intentional attack or an unintentional event that can include gaining unauthorized access to systems to disrupt operations, corrupt data, or stealconfidential information. We may face cyber incidents and security breaches through malware, computer viruses, attachments to e-mails, persons inside ourorganization or persons with access to systems inside our organization and other significant disruptions of our IT networks and related systems. The risk of acybersecurity breach or disruption, particularly through a cyber incident, including by computer hackers, foreign governments and cyber terrorists, has generallyincreased as the number, intensity and sophistication of attempted attacks and intrusions from around the world have increased. Our IT networks and related systemsare essential to the operation of our business and our ability to perform day-to-day operations and, in some cases, may be critical to the operations of certain of ourtenants. Although we make efforts to maintain the security and integrity of these types of IT networks and related systems, and we have implemented variousmeasures to manage the risk of a security breach or disruption, there can be no assurance that our security efforts and measures will be effective or that attemptedsecurity breaches or disruptions would not be successful or damaging.
While we maintain some of our own critical information technology systems, we also depend on third parties to provide important information technology
services relating to several key business functions, such as payroll, human resources, electronic communications and certain finance functions. Our measures toprevent, detect and mitigate these threats, including password protection, firewalls, backup servers, threat monitoring and periodic penetration testing, may not besuccessful in preventing a data breach or limiting the effects of a breach. Furthermore, the security measures employed by third-party service providers may prove tobe ineffective at preventing breaches of their systems.
The primary risks that could directly result from the occurrence of a cyber incident include operational interruption, damage to our relationship with our tenants,
and private data exposure. Our financial results may be negatively impacted by such an incident or resulting negative media attention. A cyber incident could:
● disrupt the proper functioning of our networks and systems and therefore our operations and/or those of certain of our tenants; ● result in misstated financial reports, violations of loan covenants and/or missed reporting deadlines; ● result in our inability to properly monitor our compliance with the rules and regulations regarding our qualification as a REIT;
● result in the unauthorized access to, and destruction, loss, theft, misappropriation or release of proprietary, confidential, sensitive or otherwise valuableinformation of ours or others, which others could use to compete against us or for disruptive, destructive or otherwise harmful purposes and outcomes;
● result in our inability to maintain the building systems relied upon by our tenants for the efficient use of their leased space; ● require significant management attention and resources to remedy and damages that result; ● subject us to claims for breach of contract, damages, credits, penalties or termination of leases or other agreements; or ● damage our reputation among our tenants, investors and associates.
Moreover, cyber incidents perpetrated against our tenants, including unauthorized access to customers’ credit card data and other confidential information, could
diminish consumer confidence and consumer spending and negatively impact our business. We may be subject to liability under environmental laws, ordinances and regulations. Under various federal, state, and local laws, ordinances and regulations, we may be considered an owner or operator of real property and may be responsible for
paying for the disposal or treatment of hazardous or toxic substances released on or in our property, as well as certain other potential costs relat ing to hazardous ortoxic substances (including governmental fines and injuries to persons and property). This liability may be imposed whether or not we knew about, or wereresponsible for, the presence of hazardous or toxic substances.
10

Table of Contents
Natural disasters and severe weather conditions could have an adverse impact on our financial condition, results of operations and cash flows. Real estate properties are subject to natural disasters and severe weather conditions such as hurricanes, tornados, earthquakes, snow storms, floods and fires.
The occurrence of natural disasters or severe weather conditions could cause substantial damages or losses to our properties which could exceed any applicableinsurance coverage and could also cause delays in development projects, negatively impact tenant demand for our properties and result in increased costs for futureproperty insurance.
Risks Related to Our Debt and Equity Securities We may be unable to obtain financing through the debt and equities market, which would have a material adverse effect on our growth strategy, our results of
operations and our financial condition. We cannot assure you that we will be able to access the credit and/or equity markets to obtain additional debt or equity financing or that we will be able to obtain
financing on terms favorable to us. The inability to obtain financing on a timely basis could have negative effects on our business, such as:
● we could have great difficulty acquiring or developing properties, which would materially adversely affect our investment strategy; ● our liquidity could be adversely affected; ● we may be unable to repay or refinance our indebtedness; ● we may need to make higher interest and principal payments or sell some of our assets on terms unfavorable to us to fund our indebtedness; or ● we may need to issue additional capital stock, which could further dilute the ownership of our existing shareholders.
Adverse changes in our credit ratings could impair our ability to obtain additional debt and equity financing on terms favorable to us, if at all, and could
significantly reduce the market price of our publicly traded securities. We are subject to financial covenants that may restrict our operating and acquisition activities. Our revolving credit facility and the indentures under which our senior unsecured debt is issued contain certain financial and operating covenants, including,
among other things, certain coverage ratios and limitations on our ability to incur debt, make dividend payments, sell all or substantially all of our assets and engagein mergers and consolidations and certain acquisitions. These covenants may restrict our ability to pursue certain business initiatives or certain acquisitiontransactions that might otherwise be advantageous. In addition, failure to meet any of the financial covenants could cause an event of default under our revolvingcredit facility and the indentures and/or accelerate some or all of our indebtedness, which would have a material adverse effect on us.
Changes in market conditions could adversely affect the market price of our publicly traded securities. The market price of our publicly traded securities depends on various market conditions, which may change from time-to-time. Among the market conditions that
may affect the market price of our publicly traded securities are the following:
● the extent of institutional investor interest in us; ● the reputation of REITs generally and the reputation of REITs with portfolios similar to ours; ● the attractiveness of the securities of REITs in comparison to securities issued by other entities, including securities issued by other real estate companies; ● our financial condition and performance; ● the market’s perception of our growth potential, potential future cash dividends and risk profile; ● an increase in market interest rates, which may lead prospective investors to demand a higher distribution rate in relation to the price paid for our shares; and ● general economic and financial market conditions.
We may change the dividend policy for our common stock in the future. The decision to declare and pay dividends on our common stock in the future, as well as the timing, amount and composition of any such future dividends, will be
at the sole discretion of our Board of Directors and will depend on our earnings, operating cash flows, liquidity, financial condition, capital requirements, contractualprohibitions or other limitations under our indebtedness including preferred stock, the annual distribution requirements under the REIT provisions of the Code, statelaw and such other factors as our Board of Directors deems relevant or are requirements under the Code or state or federal laws. Any negative change in our dividendpolicy could have a material adverse effect on the market price of our common stock.
11

Table of Contents
Risks Related to Our Status as a REIT and Related U.S. Federal Income Tax Matters
Loss of our tax status as a REIT or changes in U.S. federal income tax laws, regulations, administrative interpretations or court decisions relating to REITscould have significant adverse consequences to us and the value of our securities.
We have elected to be taxed as a REIT for U.S. federal income tax purposes under the Code. We believe that we are organized and operate in a manner that has
allowed us to qualify and will allow us to remain qualified as a REIT under the Code. However, there can be no assurance that we have qualified or will continue toqualify as a REIT for U.S. federal income tax purposes.
Qualification as a REIT involves the application of highly technical and complex Code provisions, for which there are only limited judicial and administrative
interpretations. The determination of various factual matters and circumstances not entirely within our control may affect our ability to qualify as a REIT. The rulesdealing with U.S. federal income taxation are constantly under review by persons involved in the legislative process and by the IRS and U.S. Department of theTreasury. We cannot predict how changes in the tax laws might affect our investors or us. New legislation, regulations, administrative interpretations or courtdecisions could significantly and negatively change the tax laws with respect to qualification as a REIT, the U.S. federal income tax consequences of suchqualification or the desirability of an investment in a REIT relative to other investments.
In order to qualify as a REIT, we must satisfy a number of requirements, including requirements regarding the composition of our assets and a requirement that at
least 95% of our gross income in any year be derived from qualifying sources, such as “rents from real property.” Also, we must make distributions to stockholdersaggregating annually at least 90% of our REIT taxable income, excluding net capital gains. Furthermore, we own a direct or indirect interest in certain subsidiary REITswhich elected to be taxed as REITs for U.S. federal income tax purposes under the Code. Provided that each subsidiary REIT qualifies as a REIT, our interest in suchsubsidiary REIT will be treated as a qualifying real estate asset for purposes of the REIT asset tests. To qualify as a REIT, the subsidiary REIT must independentlysatisfy all of the REIT qualification requirements. The failure of a subsidiary REIT to qualify as a REIT could have an adverse effect on our ability to comply with theREIT income and asset tests, and thus our ability to qualify as a REIT.
If we lose our REIT status, we will face serious tax consequences that will substantially reduce the funds available to pay dividends to stockholders for each of
the years involved because:
● we would not be allowed a deduction for dividends to stockholders in computing our taxable income and we would be subject to the regular U.S. federalcorporate income tax;
● we could possibly be subject to increased state and local taxes;
● unless we were entitled to relief under statutory provisions, we could not elect to be taxed as a REIT for four taxable years following the year during which wewere disqualified; and
● we would not be required to make distributions to stockholders. Moreover, the Tax Cuts and Jobs Act, enacted on December 22, 2017, has significantly changed the U.S. federal income taxation of U.S. businesses and their
owners, including REITs and their stockholders. Changes made by the legislation that could affect us and our stockholders include:
● temporarily reducing individual U.S. federal income tax rates on ordinary income; the highest individual U.S. federal income tax rate has been reduced from39.6% to 37% (excluding the 3.8% Medicare tax on net investment income) for taxable years beginning after December 31, 2017 and before January 1, 2026;
● permanently eliminating the progressive corporate tax rate structure, with a maximum corporate tax rate of 35%, and replacing it with a flat corporate tax rate of21%;
● allowing a deduction for certain pass-through business income, including dividends received by our stockholders from us that are not designated by us ascapital gain dividends or qualified dividend income, which will allow individuals, trusts, and estates to deduct up to 20% of such amounts for taxable yearsbeginning after December 31, 2017 and before January 1, 2026; REIT dividends, as described herein, will be allowed the full 20% deduction thereby reducingthe highest marginal income tax rate on these dividends to 29.6% from 37% (excluding the 3.8% Medicare tax on net investment income);
● reducing the highest rate of withholding with respect to our distributions to non-U.S. stockholders that are treated as attributable to gains from the sale orexchange of U.S. real property interests from 35% to 21%;
● limiting our deduction for net operating losses arising in taxable years beginning after December 31, 2017 to 80% of REIT taxable income (after the applicationof the dividends paid deduction);
● generally limiting the deduction for net business interest expense in excess of 30% of a business’s adjusted taxable income, except for taxpayers that engage
in certain real estate businesses and elect out of this rule (and requiring such electing taxpayers to use the less favorable alternative depreciation system);and
● elimination of the corporate alternative minimum tax.
Many of these changes are effective immediately, without any transition periods or grandfathering for existing transactions. The legislation is unclear in manyrespects and could be subject to potential amendments and technical corrections, as well as interpretations and implementing regulations by the Treasury and IRS,any of which could lessen or increase certain adverse impacts of the legislation. In addition, it is unclear how these U.S. federal income tax changes will affect stateand local taxation, which often uses U.S. federal taxable income as a starting point for computing state and local tax liabilities.
12
Table of Contents
While some of the changes made by the tax legislation may adversely affect us in one or more reporting periods and prospectively, other changes may bebeneficial on a going forward basis. We continue to work with our tax advisors to determine the full impact that the recent tax legislation as a whole will have on us.We urge our investors to consult with their legal and tax advisors with respect to such legislation and the potential tax consequences of investing in our commonstock.
Our failure to qualify as a REIT or new legislation or changes in U.S. federal income tax laws (including interpretations and regulations with respect to the Tax
Cuts and Jobs Act), and with respect to qualification as a REIT or the tax consequences of such qualification, could also impair our ability to expand our business orraise capital and have a materially adverse effect on the value of our securities.
To maintain our REIT status, we may be forced to borrow funds during unfavorable market conditions , and the unavailability of such capital on favorable terms
at the desired times, or at all, may cause us to curtail our investment activities and/or to dispose of assets at inopportune times, which could adversely affect ourfinancial condition, results of operations, cash flows and per share trading price of our common stock.
To qualify as a REIT, we generally must distribute to our stockholders at least 90% of our net taxable income each year, excluding net capital gains, and we will be
subject to regular corporate income taxes on the amount we distribute that is less than 100% of our net taxable income each year, including capital gains. In addition,we will be subject to a 4% nondeductible excise tax on the amount, if any, by which distributions paid by us in any calendar year are less than the sum of 85% of ourordinary income, 95% of our capital gain net income and 100% of our undistributed income from prior years. While we have historically satisfied these distributionrequirements by making cash distributions to our stockholders, a REIT is permitted to satisfy these requirements by making distributions of cash or other property,including, in limited circumstances, its own stock. Assuming we continue to satisfy these distribution requirements with cash, we may need to borrow funds to meetthe REIT distribution requirements and avoid the payment of income and excise taxes even if the then prevailing market conditions are not favorable for theseborrowings. These borrowing needs could result from differences in timing between the actual receipt of cash and inclusion of income for U.S. federal income taxpurposes, or the effect of non-deductible capital expenditures, the creation of cash reserves or required debt or amortization payments. These sources, however, maynot be available on favorable terms or at all. Our access to third-party sources of capital depends on a number of factors, including the market's perception of ourgrowth potential, our current debt levels, the market price of our common stock, and our current and potential future earnings. We cannot assure you that we will haveaccess to such capital on favorable terms at the desired times, or at all, which may cause us to curtail our investment activities and/or to dispose of assets atinopportune times, and could adversely affect our financial condition, results of operations, cash flows and per share trading price of our common stock.
The tax imposed on REITs engaging in “prohibited transactions” may limit our ability to engage in transactions which would be treated as sales for U.S. federal
income tax purposes. A REIT's net income from prohibited transactions is subject to a 100% penalty tax. In general, prohibited transactions are sales or other dispositions of property,
other than foreclosure property, held primarily for sale to customers in the ordinary course of business. Although we do not intend to hold any properties that wouldbe characterized as held for sale to customers in the ordinary course of our business, unless a sale or disposition qualifies under certain statutory safe harbors, suchcharacterization is a factual determination and no guarantee can be given that the IRS would agree with our characterization of our properties or that we will always beable to make use of the available safe harbors.
Item 1B. Unresolved Staff Comments
None
Item 2. Properties Real Estate Portfolio. As of December 31, 2017, the Company had interests in 493 shopping center properties aggregating 83.2 million square feet of GLA located
in 29 states, Puerto Rico and Canada. In addition, the Company had 372 other property interests, primarily through the Company’s preferred equity investments andother real estate investments, totaling 5.8 million square feet of GLA. The Company’s portfolio is used by its single reportable segment. Open-air shopping centerscomprise the primary focus of the Company's current portfolio. As of December 31, 2017, the Company’s Combined Shopping Center Portfolio, includingnoncontrolling interests, was 96.0% leased.
The Company's open-air shopping center properties, which are generally owned and operated through subsidiaries or joint ventures, had an average size of
168,433 square feet as of December 31, 2017. The Company generally retains its shopping centers for long-term investment and consequently pursues a program ofregular physical maintenance together with redevelopment, major renovations and refurbishing to preserve and increase the value of its properties. This includesrenovating existing facades, installing uniform signage, resurfacing parking lots and enhancing parking lot lighting. During 2017, the Company expended $206.8 millionin connection with these property improvements and expensed to operations $32.6 million.
13

Table of Contents
The Company's management believes its experience in the real estate industry and its relationships with numerous national and regional tenants gives it anadvantage in an industry where ownership is fragmented among a large number of property owners. The Company's open-air shopping centers are usually"anchored" by a grocery store, national or regional discount department store or drugstore. As one of the original participants in the growth of the shopping centerindustry and one of the nation's largest owners and operators of shopping centers, the Company has established close relationships with a large number of majornational and regional retailers. Some of the major national and regional companies that are tenants in the Company's shopping center properties include TJXCompanies, The Home Depot, Ahold Delhaize, Bed Bath & Beyond, Albertsons, Ross Stores, Petsmart, Kohl’s, Wal-Mart and Whole Foods.
The Company reduces its operating and leasing risks through diversification achieved by the geographic distribution of its properties and a large tenant base. As
of December 31, 2017, no single open-air shopping center accounted for more than 1.8% of the Company's annualized base rental revenues, including theproportionate share of base rental revenues from properties in which the Company has less than a 100% economic interest, or more than 1.6% of the Company’s totalshopping center GLA. At December 31, 2017, the Company’s five largest tenants were TJX Companies, The Home Depot, Ahold Delhaize, Bed Bath & Beyond andAlbertsons, which represented 3.6%, 2.5%, 2.2%, 1.8% and 1.8%, respectively, of the Company’s annualized base rental revenues, including the proportionate share ofbase rental revenues from properties in which the Company has less than a 100% economic interest.
A substantial portion of the Company's income consists of rent received under long-term leases. Most of the leases provide for the payment of fixed-base rentals
monthly in advance and for the payment by tenants of an allocable share of the real estate taxes, insurance, utilities and common area maintenance expenses incurredin operating the shopping centers. Although many of the leases require the Company to make roof and structural repairs as needed, a number of tenant leases placethat responsibility on the tenant, and the Company's standard small store lease provides for reimbursements by the tenant as part of common area maintenance.
Minimum base rental revenues and operating expense reimbursements accounted for 97% and other revenues, including percentage rents, accounted for 3% of
the Company's total revenues from rental properties for the year ended December 31, 2017. The Company's management believes that the base rent per leased squarefoot for many of the Company's existing leases is generally lower than the prevailing market-rate base rents in the geographic regions where the Company operates,reflecting the potential for future growth. Additionally, a majority of the Company’s leases have provisions requiring contractual rent increases. The Company’sleases may also include escalation clauses, which provide for increases based upon changes in the consumer price index or similar inflation indices.
As of December 31, 2017, the Company’s consolidated operating portfolio, comprised of 59.4 million square feet of GLA, was 95.9% leased. The consolidatedoperating portfolio consists entirely of properties located in the U.S., inclusive of Puerto Rico. For the period January 1, 2017 to December 31, 2017, the Companyincreased the average base rent per leased square foot, which includes the impact of tenant concessions, in its consolidated portfolio of open-air shopping centersfrom $14.99 to $15.43, an increase of $0.44. This increase primarily consists of (i) a $0.30 increase relating to new leases signed net of leases vacated and rent step-upswithin the portfolio, (ii) a $0.13 increase relating to dispositions and (iii) a $0.01 increase relating to acquisitions.
The Company has a total of 6,089 leases in the U.S. consolidated operating portfolio. The following table sets forth the aggregate lease expirations for each of the
next ten years, assuming no renewal options are exercised. For purposes of the table, the Total Annual Base Rent Expiring represents annualized rental revenue,excluding the impact of straight-line rent, for each lease that expires during the respective year. Amounts in thousands except for number of lease data:
Year EndingDecember 31,
Number ofLeases
Expiring Square Feet
Expiring Total Annual Base
Rent Expiring
% of GrossAnnual
Rent (1) 184 613 $ 12,093 1.4%
2018 638 3,269 $ 56,322 6.5%2019 883 6,353 $ 98,004 11.3%2020 873 6,135 $ 97,651 11.3%2021 813 6,802 $ 100,238 11.6%2022 858 7,093 $ 111,304 12.8%2023 512 6,015 $ 85,560 9.9%2024 255 3,057 $ 49,345 5.7%2025 228 2,126 $ 35,719 4.1%2026 233 3,822 $ 52,415 6.0%2027 253 3,572 $ 55,419 6.4%2028 202 2,551 $ 42,614 4.9%
(1) Leases currently under month to month lease or in process of renewal
During 2017, the Company executed 1,196 leases totaling over 8.9 million square feet in the Company’s consolidated operating portfolio comprised of 451 new
leases and 745 renewals and options. The leasing costs associated with these leases are estimated to aggregate $75.7 million or $28.58 per square foot. These costsinclude $59.3 million of tenant improvements and $16.4 million of leasing commissions. The average rent per square foot on new leases was $18.83 and on renewalsand options was $15.86. The Company will seek to obtain rents that are higher than amounts within its expiring leases, however, there are many variables anduncertainties which can significantly affect the leasing market at any time; as such, the Company cannot guarantee that future leases will continue to be signed forrents that are equal to or higher than current amounts.
14

Table of Contents
Ground-Leased Properties. The Company has interests in 43 consolidated shopping center properties that are subject to long-term ground leases where a thirdparty owns and has leased the underlying land to the Company to construct and/or operate a shopping center. The Company pays rent for the use of the land andgenerally is responsible for all costs and expenses associated with the building and improvements. At the end of these long-term leases, unless extended, the landtogether with all improvements reverts to the landowner.
More specific information with respect to each of the Company's property interests is set forth in Exhibit 99.1, which is incorporated herein by reference.
Item 3. Legal Proceedings The Company is not presently involved in any litigation nor, to its knowledge, is any litigation threatened against the Company or its subsidiaries that, in
management's opinion, would result in any material adverse effect on the Company's ownership, management or operation of its properties taken as a whole, or whichis not covered by the Company's liability insurance.
Item 4. Mine Safety Disclosures
Not applicable.
15

Table of Contents
PART II
Item 5. Market for the Registrant's Common Equity, Related Stockholder Matters and Issuer Purchases of Equity Securities Market Information: The table below sets forth, for the quarterly periods indicated, the high and low sales prices per share reported on the NYSE Composite Tape and declared
dividends per share for the Company’s common stock. The Company’s common stock is traded on the NYSE under the trading symbol "KIM".
2017 2016
Period High Price Low Price DividendsDeclared High Price Low Price
DividendsDeclared
First Quarter $ 26.16 $ 21.46 $ 0.27 $ 29.11 $ 24.75 $ 0.255 Second Quarter $ 23.03 $ 17.02 $ 0.27 $ 31.38 $ 26.79 $ 0.255 Third Quarter $ 21.24 $ 17.60 $ 0.27 $ 32.24 $ 28.34 $ 0.255 Fourth Quarter $ 19.79 $ 17.76 $ 0.28 (a) $ 29.23 $ 24.35 $ 0.27 (b)
(a) Paid on January 16, 2018 to stockholders of record on January 2, 2018. (b) Paid on January 15, 2017 to stockholders of record on January 3, 2017.
Holders: The number of holders of record of the Company's common stock, par value $0.01 per share, was 2,162 as of January 31, 2018. Dividends: Since the IPO, the Company has paid regular quarterly cash dividends to its stockholders. While the Company intends to continue paying regular
quarterly cash dividends, future dividend declarations will be paid at the discretion of the Board of Directors and will depend on the actual cash flows of theCompany, its financial condition, capital requirements, the annual distribution requirements under the REIT provisions of the Code and such other factors as theBoard of Directors deems relevant. The Company’s Board of Directors will continue to evaluate the Company’s dividend policy on a quarterly basis as they monitorsources of capital and evaluate operating fundamentals. The Company is required by the Code to distribute at least 90% of its REIT taxable income. The actual cashflow available to pay dividends will be affected by a number of factors, including the revenues received from rental properties, the operating expenses of theCompany, the interest expense on its borrowings, the ability of lessees to meet their obligations to the Company, the ability to refinance near-term debt maturities andany unanticipated capital expenditures.
Year ended December 31, 2017 2016 Dividend paid per share $ 1.08 $ 1.02 Ordinary income 57% 62%Capital gains 2% 30%Return of capital 41% 8%
In addition to its common stock offerings, the Company has capitalized the growth in its business through the issuance of unsecured fixed and floating-rate
medium-term notes, underwritten bonds, unsecured bank debt, mortgage debt and construction loans, convertible preferred stock and perpetual preferred stock.Borrowings under the Company's revolving credit facility have also been an interim source of funds to both finance the purchase of properties and other investmentsand meet any short-term working capital requirements. The various instruments governing the Company's issuance of its unsecured public debt, bank debt, mortgagedebt and preferred stock impose certain restrictions on the Company regarding dividends, voting, liquidation and other preferential rights available to the holders ofsuch instruments. See "Management's Discussion and Analysis of Financial Condition and Results of Operations" and Footnotes 12, 13 and 16 of the Notes toConsolidated Financial Statements included in this Form 10-K.
The Company does not believe that the preferential rights available to the holders of its Class I Preferred Stock, Class J Preferred Stock, Class K Preferred Stock,
Class L Preferred Stock and Class M Preferred Stock, the financial covenants contained in its public bond indentures, as amended, or its revolving credit agreementswill have an adverse impact on the Company's ability to pay dividends in the normal course to its common stockholders or to distribute amounts necessary tomaintain its qualification as a REIT.
The Company maintains a dividend reinvestment and direct stock purchase plan (the "Plan") pursuant to which common and preferred stockholders and other
interested investors may elect to automatically reinvest their dividends to purchase shares of the Company’s common stock or, through optional cash payments,purchase shares of the Company’s common stock. The Company may, from time-to-time, either (i) purchase shares of its common stock in the open market or (ii) issuenew shares of its common stock for the purpose of fulfilling its obligations under the Plan.
Recent Sales of Unregister Securities:None.
16

Table of Contents
Issuer Purchases of Equity Securities: During the year ended December 31, 2017, the Company repurchased 232,304 shares in connection with common sharessurrendered or deemed surrendered to the Company to satisfy statutory minimum tax withholding obligations relating to the vesting of restricted stock awards underthe Company’s equity-based compensation plans. The Company expended approximately $5.6 million to repurchase these shares.
Period
TotalNumber of
SharesPurchased
AveragePrice
Paid perShare
Total Number ofShares Purchasedas Part of PubliclyAnnounced Plans
or Programs
Approximate DollarValue of Shares that
May Yet BePurchased Under thePlans or Programs
(in millions) January 1, 2017 – January 31, 2017 12,364 $ 25.34 - $ - February 1, 2017 - February 28, 2017 186,397 $ 25.04 - - March 1, 2017 – March 31, 2017 452 $ 23.38 - - April 1, 2017 – April 30, 2017 - $ - - - May 1, 2017 – May 31, 2017 15,625 $ 18.90 - - June 1, 2017 – June 30, 2017 1,544 $ 17.56 - - July 1, 2017 – July 31, 2017 1,824 $ 19.51 - - August 1, 2017 – August 31, 2017 10,314 $ 20.32 - - September 1, 2017 – September 30, 2017 916 $ 19.62 - - October 1, 2017 – October 31, 2017 2,868 $ 18.49 - - November 1, 2017 – November 30, 2017 - $ - - - December 1, 2017 – December 31, 2017 - $ - - - Total 232,304 $ 24.23 - $ -
Total Stockholder Return Performance: The following performance chart compares, over the five years ended December 31, 2017, the cumulative total stockholder
return on the Company’s common stock with the cumulative total return of the S&P 500 Index and the cumulative total return of the FTSE NAREIT All Equity REITsIndex (the “FTSE NAREIT Equity REITs”) prepared and published by the National Association of Real Estate Investment Trusts (“NAREIT”). The FTSE NAREITEquity REITs is a free-float adjusted, market capitalization-weighted index of U.S. equity REITs. Constituents of the index include all tax-qualified REITs with morethan 50% of total assets in qualifying real estate assets other than mortgages secured by real property.
17

Table of Contents
Stockholder return performance, presented annually for the five years ended December 31, 2017, is not necessarily indicative of future results. All stockholderreturn performance assumes the reinvestment of dividends. The information in this paragraph and the following performance chart are deemed to be furnished, notfiled.
Dec-12 Dec-13 Dec-14 Dec-15 Dec-16 Dec-17 Kimco Realty Corporation $ 100 $ 106.65 $ 140.69 $ 153.54 $ 152.00 $ 116.24 S&P 500 $ 100 $ 132.39 $ 150.51 $ 152.59 $ 170.84 $ 208.14 FTSE NAREIT Equity REITs $ 100 $ 102.47 $ 133.35 $ 137.62 $ 149.35 $ 157.16
18

Table of Contents Item 6. Selected Financial Data
The following table sets forth selected, historical, consolidated financial data for the Company and should be read in conjunction with the Consolidated Financial
Statements of the Company and Notes thereto and Management’s Discussion and Analysis of Financial Condition and Results of Operations included in this Form10-K.
The Company believes that the book value of its real estate assets, which reflects the historical costs of such real estate assets less accumulated depreciation, is
not indicative of the current market value of its properties. Historical operating results are not necessarily indicative of future operating performance.
Year ended December 31, 2017 2016 2015 2014 2013 (in thousands, except per share information) Operating Data: Revenues from rental properties (1) $ 1,183,785 $ 1,152,401 $ 1,144,474 $ 958,888 $ 825,210 Interest expense (2) $ 191,956 $ 192,549 $ 218,891 $ 203,759 $ 212,240 Early extinguishment of debt charges $ 1,753 $ 45,674 $ - $ - $ - Depreciation and amortization (2) $ 360,811 $ 355,320 $ 344,527 $ 258,074 $ 224,713 Gain on sale of operating properties, net (2) $ 93,538 $ 92,823 $ 132,908 $ 618 $ 2,798 Benefit/(provision) for income taxes, net (3) $ 880 $ (78,583) $ (67,325) $ (22,438) $ (32,654)Impairment charges (4) $ 67,331 $ 93,266 $ 45,383 $ 39,808 $ 32,247 Income from continuing operations (5) $ 426,075 $ 378,850 $ 894,190 $ 375,133 $ 276,884 Income per common share, from continuing operations:
Basic $ 0.87 $ 0.79 $ 2.01 $ 0.77 $ 0.53 Diluted $ 0.87 $ 0.79 $ 2.00 $ 0.77 $ 0.53
Weighted average number of shares of common stock: Basic 423,614 418,402 411,319 409,088 407,631 Diluted 424,019 419,709 412,851 411,038 408,614
Cash dividends declared per common share $ 1.090 $ 1.035 $ 0.975 $ 0.915 $ 0.855
December 31, 2017 2016 2015 2014 2013 (in thousands) Balance Sheet Data: Real estate, before accumulated depreciation $ 12,653,446 $ 12,008,075 $ 11,568,809 $ 10,018,226 $ 9,123,344 Total assets $ 11,763,726 $ 11,230,600 $ 11,344,171 $ 10,261,400 $ 9,644,247 Total debt $ 5,478,927 $ 5,066,368 $ 5,376,310 $ 4,595,970 $ 4,202,018 Total stockholders' equity $ 5,394,244 $ 5,256,139 $ 5,046,300 $ 4,774,785 $ 4,632,417 Cash flow provided by operations $ 614,181 $ 592,096 $ 493,701 $ 629,343 $ 570,035 Cash flow (used for)/provided by investing activities $ (294,280) $ 165,383 $ 21,365 $ 126,705 $ 72,235 Cash flow used for financing activities $ (223,874) $ (804,527) $ (512,854) $ (717,494) $ (635,377)
(1) Does not include revenues from rental properties relating to (i) unconsolidated joint ventures and (ii) properties included in discontinued operations.(2) Does not include amounts reflected in discontinued operations.(3) Does not include amounts reflected in discontinued operations. Amounts include income taxes related to gain on sale of operating properties.(4) Amounts exclude noncontrolling interests and amounts reflected in discontinued operations.(5) Amounts include gain on sale of operating properties, net of tax and net of income attributable to noncontrolling interests.
19

Table of Contents Item 7. Management's Discussion and Analysis of Financial Condition and Results of Operations
The following discussion should be read in conjunction with the Consolidated Financial Statements and Notes thereto included in this Form 10-K. Historicalresults and percentage relationships set forth in the Consolidated Statements of Income contained in the Consolidated Financial Statements, including trends, shouldnot be taken as indicative of future operations.
Critical Accounting Policies
The Consolidated Financial Statements of the Company include the accounts of the Company, its wholly-owned subsidiaries and all entities in which the
Company has a controlling interest, including where the Company has been determined to be a primary beneficiary of a variable interest entity in accordance with theconsolidation guidance of the FASB Accounting Standards Codification (“ASC”). The Company applies these provisions to each of its joint venture investments todetermine whether the cost, equity or consolidation method of accounting is appropriate. The preparation of financial statements in conformity with accountingprinciples generally accepted in the United States requires management to make estimates and assumptions in certain circumstances that affect amounts reported inthe accompanying Consolidated Financial Statements and related notes. In preparing these financial statements, management has made its best estimates andassumptions that affect the reported amounts of assets and liabilities. These estimates are based on, but not limited to, historical results, industry standards andcurrent economic conditions, giving due consideration to materiality. The most significant assumptions and estimates relate to revenue recognition and therecoverability of trade accounts receivable, depreciable lives, valuation of real estate and intangible assets and liabilities, valuation of joint venture investments andother investments, realizability of deferred tax assets and uncertain tax positions. Application of these assumptions requires the exercise of judgment as to futureuncertainties, and, as a result, actual results could materially differ from these estimates.
The Company is required to make subjective assessments as to whether there are impairments in the value of its real estate properties, investments in joint
ventures, marketable securities and other investments. The Company’s reported net earnings are directly affected by management’s estimate of impairments. Revenue Recognition and Accounts Receivable Base rental revenues from rental properties are recognized on a straight-line basis over the terms of the related leases. Certain of these leases also provide for
percentage rents based upon the level of sales achieved by the lessee. These percentage rents are recorded once the required sales level is achieved. Operatingexpense reimbursements are recognized as earned. Rental income may also include payments received in connection with lease termination agreements. In addition,leases typically provide for reimbursement to the Company of common area maintenance, real estate taxes and other operating expenses.
The Company makes estimates of the collectability/recoverability of its accounts receivable related to base rents, straight-line rent, expense reimbursements and
other revenues. The Company analyzes accounts receivable and historical bad debt levels, customer credit-worthiness and current economic trends when evaluatingthe adequacy of the allowance for doubtful accounts. In addition, tenants in bankruptcy are analyzed and estimates are made in connection with the expectedrecovery of pre-petition and post-petition claims. The Company’s reported net earnings are directly affected by management’s estimate of the collectability ofaccounts receivable.
Real Estate The Company’s investments in real estate properties are stated at cost, less accumulated depreciation and amortization. Expenditures for maintenance and repairs
are charged to operations as incurred. Significant renovations and replacements, which improve and extend the life of the asset, are capitalized. Upon acquisition of real estate operating properties, the Company estimates the fair value of acquired tangible assets (consisting of land, building, building
improvements and tenant improvements) and identified intangible assets and liabilities (consisting of above and below-market leases, in-place leases, and tenantrelationships, where applicable), assumed debt and redeemable units issued at the date of acquisition, based on evaluation of information and estimates available atthat date. Fair value is determined based on a market approach, which contemplates the price that would be received to sell an asset or paid to transfer a liability in anorderly transaction between market participants at the measurement date. The Company elected to early adopt ASU 2017-01, Business Combinations (Topic 805):Clarifying the Definition of a Business at the beginning of its fiscal year ended December 31, 2017, including its interim periods within the year, and appropriatelyapplied the guidance to its asset acquisitions of operating properties, which included the capitalization of acquisition costs.
Depreciation and amortization are provided on the straight-line method over the estimated useful lives of the assets, as follows:
Buildings and building improvements (in years) 15 to 50Fixtures, leasehold and tenant improvements (including certain
identified intangible assets) Terms of leases or useful lives, whichever
is shorter
20

Table of Contents
The Company is required to make subjective assessments as to the useful lives of its properties for purposes of determining the amount of depreciation to reflecton an annual basis with respect to those properties. These assessments have a direct impact on the Company’s net earnings.
On a continuous basis, management assesses whether there are any indicators, including property operating performance, changes in anticipated holding period
and general market conditions, that the value of the real estate properties (including any related amortizable intangible assets or liabilities) may be impaired. A propertyvalue is considered impaired only if management’s estimate of current and projected operating cash flows (undiscounted and unleveraged) of the property over itsanticipated hold period is less than the net carrying value of the property. Such cash flow projections consider factors such as expected future operating income,trends and prospects, as well as the effects of demand, competition and other factors. To the extent impairment has occurred, the carrying value of the property wouldbe adjusted to reflect the estimated fair value of the property.
When a real estate asset is identified by management as held-for-sale, the Company ceases depreciation of the asset and estimates the sales price of such asset
net of selling costs. If, in management’s opinion, the net sales price of the asset is less than the net book value of such asset, an adjustment to the carrying valuewould be recorded to reflect the estimated fair value of the property.
Investments in Unconsolidated Joint Ventures The Company accounts for its investments in unconsolidated joint ventures under the equity method of accounting as the Company exercises significant
influence, but does not control, these entities. These investments are recorded initially at cost and are subsequently adjusted for cash contributions and distributions.Earnings for each investment are recognized in accordance with each respective investment agreement and, where applicable, are based upon an allocation of theinvestment’s net assets at book value as if the investment was hypothetically liquidated at the end of each reporting period.
The Company’s joint ventures and other real estate investments primarily consist of co-investments with institutional and other joint venture partners in open-air
shopping center properties, consistent with its core business. These joint ventures typically obtain non-recourse third-party financing on their property investments,thus contractually limiting the Company’s exposure to losses to the amount of its equity investment, and, due to the lender’s exposure to losses, a lender typically willrequire a minimum level of equity in order to mitigate its risk. From time to time the joint ventures will obtain unsecured debt, which may be guaranteed by the jointventure. The Company’s exposure to losses associated with its unconsolidated joint ventures is primarily limited to its carrying value in these investments.
On a continuous basis, management assesses whether there are any indicators, including property operating performance and general market conditions, that the
value of the Company’s investments in unconsolidated joint ventures may be impaired. An investment’s value is impaired only if management’s estimate of the fairvalue of the investment is less than the carrying value of the investment and such difference is deemed to be other-than-temporary. To the extent impairment hasoccurred, the loss shall be measured as the excess of the carrying amount of the investment over the estimated fair value of the investment.
The Company’s estimated fair values are based upon a discounted cash flow model for each joint venture that includes all estimated cash inflows and outflows
over a specified holding period and, where applicable, any estimated debt premiums. Capitalization rates, discount rates and credit spreads utilized in these models arebased upon rates that the Company believes to be within a reasonable range of current market rates.
Realizability of Deferred Tax Assets and Uncertain Tax Positions The Company is subject to federal, state and local income taxes on the income from its activities relating to its TRS activities and subject to local taxes on certain
non-U.S. investments. The Company accounts for income taxes using the asset and liability method, which requires that deferred tax assets and liabilities berecognized based on future tax consequences of temporary differences between the financial statement carrying amounts of existing assets and liabilities and theirrespective tax basis. Deferred tax assets and liabilities are measured using enacted tax rates expected to apply in the years in which temporary differences are expectedto be recovered or settled. The effect on deferred tax assets and liabilities of a change in tax rates is recognized in earnings in the period when the changes areenacted.
A reduction of the carrying amounts of deferred tax assets by a valuation allowance is required, if based on the evidence available, it is more likely than not (a
likelihood of more than 50 percent) that some portion or all of the deferred tax assets will not be realized. The valuation allowance, which requires significantjudgement from management, should be sufficient to reduce the deferred tax asset to the amount that is more likely than not to be realized. The Company’s reportednet earnings are directly affected by management’s judgement in determining a valuation allowance.
The Company recognizes and measures benefits for uncertain tax positions, which requires significant judgment from management. Although the Company
believes it has adequately reserved for any uncertain tax positions, no assurance can be given that the final tax outcome of these matters will not be different. TheCompany adjusts these reserves in light of changing facts and circumstances, such as the closing of a tax audit or the refinement of an estimate. Changes in therecognition or measurement of uncertain tax positions could result in material increases or decreases in the Company’s income tax expense in the period in which achange is made, which could have a material impact on operating results (see Footnote 21 of the Notes to Consolidated Financial Statements included in this Form 10-K).
21

Table of Contents
Executive Overview Kimco Realty Corporation is one of North America’s largest publicly traded owners and operators of open-air shopping centers. As of December 31, 2017, the
Company had interests in 493 shopping center properties aggregating 83.2 million square feet of GLA located in 29 states, Puerto Rico and Canada. In addition, theCompany had 372 other property interests, primarily through the Company’s preferred equity investments and other real estate investments, totaling 5.8 million squarefeet of GLA.
The executive officers are engaged in the day-to-day management and operation of real estate exclusively with the Company, with nearly all operating functions,
including leasing, asset management, maintenance, construction, legal, finance and accounting, administered by the Company. The following highlights the Company’s significant transactions, events and results that occurred during the year ended December 31, 2017:
Financial and Portfolio Information:
● Net income available to the Company’s common shareholders was $372.5 million, or $0.87 per diluted share for the year ended December 31, 2017, ascompared to $332.6 million, or $0.79 per diluted share for the corresponding period in 2016.
● Funds from operations (“FFO”) increased to $655.6 million or $1.55 per diluted share for the year ended December 31, 2017 from $555.7 million or $1.32 perdiluted share for the year ended December 31, 2016 (see additional disclosure on FFO beginning on page 36).
● FFO as adjusted increased to $644.2 million or $1.52 per diluted share for the year ended December 31, 2017 from $629.4 million or $1.50 per diluted share forthe year ended December 31, 2016, (see additional disclosure on FFO beginning on page 36).
● Same property net operating income (“Same property NOI”) increased 1.7% for the year ended December 31, 2017, as compared to the corresponding periodin 2016 (see additional disclosure on Same property NOI beginning on page 37).
● Executed 1,196 new leases, renewals and options totaling approximately 8.9 million square feet in the consolidated operating portfolio. ● The Company’s consolidated operating portfolio occupancy at December 31, 2017 was 95.9% as compared to 95.2% at December 31, 2016.
Acquisition Activity (see Footnotes 3 and 7 of the Notes to Consolidated Financial Statements included in this Form 10-K):
● Acquired four consolidated operating properties and six parcels comprising an aggregate 1.9 million square feet of GLA, for an aggregate purchase price of$368.2 million including the assumption of $43.0 million of non-recourse mortgage debt encumbering one property.
● Acquired the controlling interest, in separate transactions, from joint ventures in which, the Company previously held noncontrolling ownership interests, inthree operating properties comprising an aggregate 0.9 million square feet of GLA, for an aggregate gross purchase price of $320.1 million, including theassumption of $206.0 million of non-recourse mortgage debt encumbering one of the properties. The Company recognized an aggregate gain on change incontrol of interests of $71.2 million from the fair value adjustment in connection with these transactions.
Disposition Activity (see Footnote 5 of the Notes to Consolidated Financial Statements included in this Form 10-K):
● During 2017, the Company disposed of 25 consolidated operating properties and nine parcels, in separate transactions, for an aggregate sales price of $352.2million. These transactions resulted in (i) an aggregate gain of $93.5 million and (ii) aggregate impairment charges of $17.1 million.
22

Table of Contents Capital Activity (for additional details see Liquidity and Capital Resources below):
● During the years ended December 31, 2017, the Company repaid the following notes (dollars in millions):
Type Date Paid Amount Repaid Interest Rate Maturity Date
Medium Term Notes Aug-17 & Nov-17 $ 300.0 4.30% Feb-18Term Loan Jan-17 $ 250.0 LIBOR + 0.95% Jan-17
● In February 2017, the Company closed on a $2.25 billion unsecured revolving credit facility (the “Credit Facility”) with a group of banks, which is scheduled
to expire in March 2021, which accrues interest at a rate of LIBOR plus 87.5 basis points (2.28% as of December 31, 2017) with two additional six-monthoptions to extend the maturity date, at the Company’s discretion, to March 2022.
● Also during 2017, the Company (i) assumed/consolidated $257.5 million of individual non-recourse mortgage debt (including a fair market value adjustment of
$8.5 million) related to two operating properties, (ii) paid off $692.9 million of mortgage debt (including fair market value adjustments of $5.8 million) thatencumbered 27 operating properties and (iii) obtained a $206.0 million non-recourse mortgage relating to one operating property.
● As a result of the above activity, the Company extended its debt maturity profile, including extension options, as follows:
● As of December 31, 2017, the weighted average interest rate was 3.84% and the weighted average maturity profile was 10.7 years.
The Company faces external factors which may influence its future results from operations. The convenience and availability of e-commerce has continued tohave an impact on the retail sector, which could affect our ability to increase or maintain rental rates and our ability to renew expiring leases and/or lease availablespace. To mitigate the effect of e-commerce on its business, the Company’s strategy has been to attract local area customers to its properties by providing a diverseand robust tenant base across a variety of retailers, including grocery stores, national or regional discount department stores or drugstores, which offer day-to-daynecessities rather than high-priced luxury items. In addition, the Company’s strategy includes investing capital into high quality assets, which are concentrated inmajor metro markets, allowing our tenants to generate higher foot traffic resulting in higher sales volume while also disposing of lesser quality assets in moreundesirable locations. For a further discussion of these and other factors that could impact our future results, performance or transactions, see Item 1A. “RiskFactors.”
23

Table of Contents
As the Company moves forward, it intends to take steps to strengthen its portfolio in the rapidly changing retail environment. The Company intends to continueto dispose of assets outside its core markets, which will allow it to concentrate its presence in target coastal markets by completing development projects underwayand continuing to invest in redevelopment, ultimately producing a stronger portfolio for sustained long-term growth.
Results of Operations Comparison of Years Ended December 31, 2017 to 2016
The following table presents the comparative results from the Company’s Consolidated Statements of Income for the year ended December 31, 2017, as comparedto the corresponding period in 2016 (in thousands, except per share data):
Year Ended December 31, 2017 2016 $ Change Revenues
Revenues from rental properties $ 1,183,785 $ 1,152,401 $ 31,384 Management and other fee income 17,049 18,391 (1,342)
Operating expenses Rent (1) (11,145) (10,993) (152)Real estate taxes (157,196) (146,615) (10,581)Operating and maintenance (2) (142,787) (140,910) (1,877)General and administrative (3) (118,455) (117,302) (1,153)Provision for doubtful accounts (5,630) (5,563) (67)Impairment charges (67,331) (93,266) 25,935 Depreciation and amortization (360,811) (355,320) (5,491)
Other income/(expense) Interest, dividends and other investment income 2,809 1,478 1,331 Other (expense)/income, net (250) 3,947 (4,197)Interest expense (191,956) (192,549) 593 Early extinguishment of debt charges (1,753) (45,674) 43,921 Benefit/(provision) for income taxes, net 880 (72,545) 73,425 Equity in income of joint ventures, net 60,763 218,714 (157,951)Gain on change in control of interests 71,160 57,386 13,774 Equity in income of other real estate investments, net 67,001 27,773 39,228 Gain on sale of operating properties, net, net of tax 93,538 86,785 6,753 Net income attributable to noncontrolling interests (13,596) (7,288) (6,308)Preferred stock redemption charges (7,014) - (7,014)Preferred dividends (46,600) (46,220) (380)
Net income available to the Company's common shareholders $ 372,461 $ 332,630 $ 39,831 Net income available to the Company:
Diluted per common share $ 0.87 $ 0.79 $ 0.08 (1) Rent expense relates to ground lease payments for which the Company is the lessee.
(2) Operating and maintenance expense consists of property related costs including repairs and maintenance costs, roof repair, landscaping,parking lot repair, snow removal, utilities, property insurance costs, security and various other property related expenses.
(3) General and administrative costs include employee-related expenses (salaries, bonuses, equity awards, benefits, severance costs and payrolltaxes), professional fees, office rent, travel expense and other company-specific expenses.
The following describes the activity of certain line items from the Company’s Consolidated Statements of Income, which it believes represent items that
significantly changed during the year ended December 31, 2017, as compared to the corresponding period in 2016:
Revenue from rental properties - The increase in Revenues from rental properties of $31.4 million is primarily from the combined effect of (i) the acquisition andconsolidation of operating properties during 2017 and 2016, providing incremental revenues for the year ended December 31, 2017 of $57.5 million, as compared to thecorresponding period in 2016, and (ii) the completion of certain redevelopment projects, tenant buyouts and net growth in the current portfolio, providing incrementalrevenues for the year ended December 31, 2017 of $5.2 million, as compared to the corresponding period in 2016, partially offset by (iii) a decrease in revenues of $31.3million from properties sold during 2017 and 2016.
Real estate taxes - Real estate taxes increased $10.6 million primarily due to (i) an increase of $8.4 million related to the acquisition and consolidation of operatingproperties during 2017 and 2016, and (ii) an overall net increase of $5.0 million primarily due to refunds received during 2016, partially offset by (iii) a decrease of $2.8million resulting from properties sold during 2017 and 2016.
24

Table of Contents
Impairment charges - During the years ended December 31, 2017 and 2016, the Company recognized impairment charges related to adjustments to propertycarrying values of $67.3 million and $93.3 million, respectively, for which the Company’s estimated fair values were primarily based upon (i) signed contracts or lettersof intent from third party offers or (ii) discounted cash flow models. These adjustments to property carrying values were recognized in connection with the Company’sefforts to market certain properties and management’s assessment as to the likelihood and timing of such potential transactions. Also, the Company has re-evaluatedits long-term plan for a property due to unfavorable local market conditions. Certain of the calculations to determine fair value utilized unobservable inputs and assuch are classified as Level 3 of the fair value hierarchy. For additional disclosure, see Footnote 15 of the Notes to Consolidated Financial Statements included in thisForm 10-K.
Depreciation and amortization - The increase in Depreciation and amortization of $5.5 million is primarily due to (i) an increase of $21.8 million related to theacquisition/consolidation of operating properties during 2017 and 2016, and (ii) an increase of $15.2 million related to write-offs relating to the Company’sredevelopment projects in 2017 and 2016, partially offset by (iii) a decrease of $31.5 million resulting from property dispositions and tenant vacates in 2017 and 2016.
Other (expense)/income, net - The change in Other (expense)/income, net of $4.2 million is primarily due to (i) the recognition of a gain on forgiveness of debt of
$3.1 million resulting from the foreclosure of an encumbered property during 2016, and (ii) lower equity in income from retail store lease investments of $2.8 millionresulting from a lease termination during 2016, partially offset by (iii) an increase in gains on land sales of $1.5 million.
Early extinguishment of debt charges - During 2017, the Company incurred early Extinguishment of debt charges aggregating $1.8 million in connection with the
tender premium on Medium Term Notes that were partially tendered prior to maturity. During 2016, the Company incurred early extinguishment of debt chargesaggregating $45.7 million in connection with the optional make-whole provisions of unsecured notes that were repaid prior to maturity and prepayment penalties on amortgage encumbering 10 operating properties, which the Company also paid prior to the scheduled maturity date.
Benefit/(provision) for income taxes, net - The change in Benefit/(provision) for income taxes, net of $73.4 million is primarily due to (i) a decrease in tax expense
of $63.5 million resulting from the recognition of a valuation allowance as a result of the Company’s merger of its taxable REIT subsidiary into a wholly owned LLC ofthe Company on August 1, 2016, and (ii) a decrease in foreign tax expense of $30.4 million primarily relating to the sale of certain unconsolidated properties during 2016within the Company’s Canadian portfolio which were subject to foreign taxes at a consolidated reporting entity level, partially offset by (iii) a decrease in tax benefit of$17.1 million primarily related to impairment charges recognized during 2016, (iv) a tax refund during 2016 of $2.0 million resulting from the favorable settlement of a taxaudit and (v) an increase in tax expense of $1.1 million due to effects of changes in U.S. tax law, which lowered corporate tax rates impacting the amounts relating to theCompany’s deferred tax assets and liabilities within its TRS.
Equity in income of joint ventures, net - The decrease in Equity in income of joint ventures, net of $158.0 million is primarily due to (i) a decrease in net gains of
$158.1 million resulting from fewer sales of properties and ownership interests within various joint venture investments during 2017 as compared to 2016, (ii) lowerequity in income of $5.3 million primarily resulting from the sales of properties within various joint venture investments and the acquisition of partnership interests injoint ventures by the Company during 2017 and 2016, and (iii) the recognition of a cumulative foreign currency translation loss of $4.8 million as a result of thesubstantial liquidation of the Company’s investments in Canada during 2017, partially offset by (iv) a decrease in impairment charges of $10.2 million recognizedduring 2017 as compared to 2016.
Gain on change in control of interests - During 2017, the Company acquired, in separate transactions, a controlling interest in three operating properties from
certain joint venture partners in which the Company had noncontrolling interests. As a result of these transactions, the Company recorded an aggregate gain onchange in control of interests of $71.2 million related to the fair value adjustment associated with its previously held equity interest in these operating properties.During 2016, the Company acquired, in separate transactions, a controlling interest in nine operating properties and one development project from certain joint venturepartners in which the Company had noncontrolling interests. As a result of these transactions, the Company recorded a gain on change in control of interests of $57.4million related to the fair value adjustment associated with its previously held equity interest in these operating properties and the development project.
Equity in income from other real estate investments, net - The increase in Equity in income from other real estate investments, net of $39.2 million is primarily due
to (i) an increase of $34.6 million in equity in income from the Albertsons joint venture resulting from cash distributions received in excess of the Company’s carryingbasis during 2017 and (ii) the recognition of cumulative foreign currency translation gain of $14.8 million as a result of the substantial liquidation of the Company’sinvestments in Canada during 2017, partially offset by (iii) a decrease in earnings and profit participation from capital transactions related to Company’s PreferredEquity Program of $10.1 million during 2017, as compared to the corresponding period in 2016.
Gain on sale of operating properties, net of tax - During 2017, the Company disposed of 25 consolidated operating properties and nine parcels, in separate
transactions, for an aggregate sales price of $352.2 million. These transactions resulted in (i) an aggregate gain of $93.5 million and (ii) aggregate impairment charges of$17.1 million. During 2016, the Company disposed of 30 consolidated operating properties and two parcels, in separate transactions, for an aggregate sales price of$378.7 million. These transactions resulted in an aggregate gain of $86.8 million, after income tax expense, and aggregate impairment charges of $37.2 million, beforeincome tax benefit of $10.0 million.
25

Table of Contents
Net income attributable to noncontrolling interests – The increase in Net income attributable to noncontrolling interests of $6.3 million is primarily due to (i) anincrease of $10.9 million in equity in income attributable to the Company’s noncontrolling partners in the Albertsons joint venture during 2017, partially offset by (ii)lower equity in income of $4.4 million resulting from the redemption of certain noncontrolling interests, the sales of properties within various joint venture investmentsand/or acquisition/consolidation of ownership interests in joint ventures by the Company during 2017 and 2016.
Preferred stock redemption charges – During 2017, the Company partially redeemed its Class I Preferred Stock shares and as a result, the Company recorded a
non-cash redemption charge of $7.0 million. This $7.0 million charge was subtracted from net income attributable to the Company to arrive at net income available tothe Company’s common shareholders and used in the calculation of earnings per share for the year ended December 31, 2017.
Net income available to the company’s common shareholders and Diluted earnings per share - Net income available to the Company’s common shareholderswas $372.5 million for the year ended December 31, 2017, as compared to $332.6 million for the year ended December 31, 2016. On a diluted per share basis, net incomeavailable to the Company for the year ended December 31, 2017 was $0.87 as compared to $0.79 for the year ended December 31, 2016. These changes are primarilyattributable to (i) incremental earnings due to the acquisition of operating properties during 2017 and 2016, as well as increased profitability from the Company’soperating properties, (ii) a benefit for income taxes in 2017 as compared to a provision for income taxes in 2016, (iii) a decrease in early extinguishment of debt charges,(iv) an increase in equity in income of other real estate investments, net, (v) a decrease in impairment charges of operating properties, (vi) an increase from gain onchange of control of interests and (vii) an increase in gains on sale of operating properties, partially offset by (viii) a decrease in equity in income of joint ventures,net, resulting from the sales of properties within various joint venture investments and the acquisition of partnership interests in joint ventures by the Companyduring 2017 and 2016, (ix) an increase in real estate taxes, (x) an increase in preferred stock redemption charges and (xi) an increase in net income attributable tononcontrolling interests. Comparison of Years Ended December 31, 2016 to 2015
The following table presents the comparative results from the Company’s Consolidated Statements of Income for the year ended December 31, 2016, as comparedto the corresponding period in 2015 (in thousands, except per share data):
Year Ended December 31, 2016 2015 $ Change Revenues
Revenues from rental properties $ 1,152,401 $ 1,144,474 $ 7,927 Management and other fee income 18,391 22,295 (3,904)
Operating expenses Rent (10,993) (12,347) 1,354 Real estate taxes (146,615) (147,150) 535 Operating and maintenance (140,910) (144,980) 4,070 General and administrative expenses (117,302) (122,735) 5,433 Provision for doubtful accounts (5,563) (6,075) 512 Impairment charges (93,266) (45,383) (47,883)Depreciation and amortization (355,320) (344,527) (10,793)
Other income/(expense) Interest, dividends and other investment income 1,478 39,061 (37,583)Other income, net 3,947 5,174 (1,227)Interest expense (192,549) (218,891) 26,342 Early extinguishment of debt charges (45,674) - (45,674)Provision for income taxes, net (72,545) (60,230) (12,315)Equity in income of joint ventures, net 218,714 480,395 (261,681)Gain on change in control of interests 57,386 149,234 (91,848)Equity in income of other real estate investments, net 27,773 36,090 (8,317)Loss from discontinued operations - (75) 75 Gain on sale of operating properties, net, net of tax 86,785 125,813 (39,028)Net income attributable to noncontrolling interests (7,288) (6,028) (1,260)Preferred stock redemption charges - (5,816) 5,816 Preferred dividends (46,220) (57,084) 10,864
Net income available to the Company's common shareholders $ 332,630 $ 831,215 $ (498,585)Net income available to the Company:
Diluted per common share $ 0.79 $ 2.00 $ (1.21)
26

Table of Contents
The following describes the activity of certain line items from the Company’s Consolidated Statements of Income, which it believes represent items thatsignificantly changed during the year ended December 31, 2016, as compared to the corresponding period in 2015:
Revenue from rental properties - The increase in Revenues from rental properties of $7.9 million is primarily from the combined effect of (i) the acquisition ofoperating properties during 2016 and 2015, providing incremental revenues for the year ended December 31, 2016, of $57.4 million, as compared to the correspondingperiod in 2015 and (ii) the completion of certain redevelopment projects, tenant buyouts and net growth in the current portfolio, providing incremental revenues for theyear ended December 31, 2016, of $17.4 million, as compared to the corresponding period in 2015, partially offset by (iii) a decrease in revenues of $66.9 million fromproperties sold during 2016 and 2015.
Management and other fee income - The decrease in Management and other fee income of $3.9 million is primarily attributable to (i) the sale of properties within
various joint venture investments and the acquisition of partnership interests in joint ventures by the Company during 2016 and 2015, and (ii) the recognition ofenhancement fee income related to the Company’s prior investment in InTown Suites of $1.2 million during 2015.
Operating and maintenance expense - Operating and maintenance expense consists of property related costs including repairs and maintenance costs, roof
repair, landscaping, parking lot repair, snow removal, utilities, property insurance costs, security and various other property related expenses. Operating andmaintenance expense decreased $4.1 million primarily due to the disposition of properties during 2016 and 2015, partially offset by the acquisition of properties during2016 and 2015.
General and administrative expenses - General and administrative costs include employee-related expenses (salaries, bonuses, equity awards, benefits,
severance costs and payroll taxes), professional fees, office rent, travel expense and other company-specific expenses. General and administrative expenses decreased$5.4 million primarily due to a decrease in severance costs and a reduction in professional fees.
Impairment charges - During 2016, the Company recognized impairment charges related solely to adjustments to property carrying values of $93.3 million. During
2015, the Company recognized impairment charges of $45.5 million, before noncontrolling interests and income taxes, of which $0.1 million is included in discontinuedoperations. The 2015 impairment charges consisted of (i) $30.3 million related to adjustments to property carrying values, (ii) $9.0 million relating to a cost methodinvestment, (iii) $5.3 million related to certain investments in other real estate investments and (iv) $0.8 million related to marketable debt securities investments. Theadjustments to property carrying values for 2016 and 2015 were recognized in connection with the Company’s efforts to market for sale certain properties andmanagement’s assessment as to the likelihood and timing of such potential transactions and the anticipated hold period for such properties. Certain of thecalculations to determine fair value utilized unobservable inputs and as such are classified as Level 3 of the fair value hierarchy. For additional disclosure, seeFootnote 15 of the Notes to Consolidated Financial Statements included in this Form 10-K.
Depreciation and amortization - The increase in Depreciation and amortization of $10.8 million is primarily due to operating property acquisitions during 2016and 2015 and write-offs relating to the Company’s redevelopment projects in 2016, partially offset by property dispositions.
Interest, dividends and other investment income - The decrease in Interest, dividends and other investment income of $37.6 million is primarily due to the sale of
certain marketable securities during the year ended December 31, 2015, which resulted in an aggregate gain of $39.9 million. Interest expense - The decrease in Interest expense of $26.4 million is primarily the result of lower levels of borrowings and lower interest rates on borrowings
during 2016, as compared to 2015. Early extinguishment of debt charges - During 2016, the Company incurred Early extinguishment of debt charges aggregating $45.7 million in connection with the
optional make-whole provisions of unsecured notes that were repaid prior to maturity and prepayment penalties on a mortgage encumbering 10 operating properties,which the Company also paid prior to the scheduled maturity date. See “Liquidity and Capital Resources” for additional details.
Provision for income taxes, net - The increase in Provision for income taxes, net of $12.3 million is primarily due to (i) an increase in the Company’s valuation
allowance of $63.5 million as a result of the Company’s merger of its taxable REIT subsidiary into a wholly owned LLC of the Company, partially offset by (ii) adecrease in foreign tax expense of $26.1 million primarily relating to fewer sales of unconsolidated properties within the Company’s Canadian portfolio which weresubject to foreign taxes at a consolidated reporting entity level during 2016, as compared to 2015, (iii) an increase in tax benefit of $13.4 million related to impairmentcharges recognized during 2016, as compared to 2015, (iv) a decrease of $4.5 million in tax expense related to gains recognized during 2015, as compared to 2016, (v) adecrease of $3.0 million in tax expense on operations due to fewer properties in the taxable REIT subsidiary as a result of the TRS Merger, (vi) a decrease in tax expenseof $2.0 million resulting from the settlement of a tax audit during 2016 and (vii) a decrease in tax expense of $2.0 million relating to equity income recognized inconnection with the Company’s Albertsons investment during 2015.
27

Table of Contents
Equity in income of joint ventures, net - The decrease in Equity in income of joint ventures, net of $261.7 million is primarily due to (i) a decrease in gains of $248.1million resulting from fewer sales of properties and interests within various joint venture investments, including the Company’s Canadian Portfolio, during 2016, ascompared to 2015 and (ii) lower equity in income of $26.0 million resulting from the sales of properties within various joint venture investments and the acquisition ofpartnership interests in joint ventures by the Company during 2016 and 2015, partially offset by (iii) a decrease in impairment charges of $7.2 million recognized during2016, as compared to 2015.
Gain on change in control of interests - During 2016, the Company acquired nine operating properties and one development project from joint ventures in which
the Company had a noncontrolling interest. The Company recorded a gain on change in control of interests of $57.4 million related to the fair value adjustmentassociated with its previously held equity interest in the operating properties. During 2015, the Company acquired 43 properties from joint ventures in which theCompany had noncontrolling interests. The Company recorded a net gain on change in control of interests of $149.2 million related to the fair value adjustmentassociated with its previously held equity interests in these properties.
Equity in income from other real estate investments, net - The decrease in Equity in income from other real estate investments, net of $8.3 million is primarily due
to (i) a decrease in equity in income of $4.9 million resulting from a cash distribution received in excess of the Company’s carrying basis in 2015, (ii) a decrease inincome resulting from the sale of the Company’s leveraged lease portfolio of $3.8 million during 2015 and (iii) a decrease of $2.8 million in earnings from the Company’sPreferred Equity Program during the year ended December 31, 2016, primarily resulting from the sale of the Company’s interests in certain preferred equity investmentsduring 2016 and 2015, partially offset by (iv) an increase of $3.3 million in profit participation from the Company’s Preferred Equity Program from capital transactionsduring the year ended December 31, 2016, as compared to the corresponding period in 2015.
Gain on sale of operating properties, net of tax - During 2016, the Company disposed of 30 consolidated operating properties and two parcels, in separate
transactions, for an aggregate sales price of $378.7 million. These transactions resulted in an aggregate gain of $86.8 million, after income tax expense, and aggregateimpairment charges of $37.2 million, before income tax benefit of $10.0 million. During 2015, the Company disposed of 89 consolidated operating properties and eightparcels, in separate transactions, for an aggregate sales price of $492.5 million. These transactions resulted in an aggregate gain of $143.6 million, after income taxexpense, and aggregate impairment charges of $10.2 million, before income tax expense of $2.3 million. Additionally, during 2015, the Company disposed of itsremaining operating property in Chile for a sales price of $51.3 million. This transaction resulted in the release of a cumulative foreign currency translation loss of $19.6million due to the Company’s liquidation of its investment in Chile, partially offset by a gain on sale of $1.8 million, after income tax expense.
Net income available to the Company’s common s hareholders and Diluted earnings per share - Net income available to the Company’s common shareholders
was $332.6 million for the year ended December 31, 2016, as compared to $831.2 million for the year ended December 31, 2015. On a diluted per share basis, net incomeavailable to the Company for the year ended December 31, 2016 was $0.79 as compared to $2.00 for the year ended December 31, 2015. These changes are primarilyattributable to (i) a decrease in equity in income of joint ventures, net, resulting from gains on sales of properties within various joint venture investments during 2015,(ii) a decrease in gain on change in control of interests, net related to the fair value adjustment associated with the Company’s previously held equity interests inproperties acquired from various joint ventures during 2016 and 2015, (iii) an increase in impairments of operating properties during 2016, (iv) an increase in earlyextinguishment of debt charges resulting from the prepayment of secured and unsecured debt by the Company, (v) a decrease in gains on sale of operating properties,(vi) a decrease in gain on sale of marketable securities during 2016, as compared to the corresponding period in 2015, (vii) an increase in provision for income taxes dueto a valuation allowance on net deferred tax assets resulting from the merger of KRS into a wholly-owned LLC of the Company and (viii) a decrease in gains throughthe Company’s preferred equity program and other investments, partially offset by (ix) a decrease in interest expense, (x) a decrease in preferred dividends andpreferred stock redemption charges and (xi) incremental earnings due to the acquisition of operating properties during 2016 and 2015 and increased profitability fromthe Company’s operating properties.
Liquidity and Capital Resources The Company’s capital resources include accessing the public debt and equity capital markets, mortgage and construction loan financing, and immediate access
to an unsecured revolving credit facility (the “Credit Facility”) with bank commitments of $2.25 billion which can be increased to $2.75 billion through an accordionfeature.
28

Table of Contents
The Company’s cash flow activities are summarized as follows (in thousands):
Year Ended December 31, 2017 2016 Cash and cash equivalents, beginning of year $ 142,486 $ 189,534
Net cash flow provided by operating activities 614,181 592,096 Net cash flow (used for)/provided by investing activities (294,280) 165,383 Net cash flow used for financing activities (223,874) (804,527)
Change in cash and cash equivalents 96,027 (47,048)Cash and cash equivalents, end of year $ 238,513 $ 142,486
Operating Activities The Company anticipates that cash on hand, cash flows from operations, borrowings under its Credit Facility, and the issuance of equity and public debt, as well
as other debt and equity alternatives, will provide the necessary capital required by the Company. Cash flows provided by operating activities for the year ended December 31, 2017, were $614.2 million, as compared to $592.1 million for the comparable period in
2016. The increase of $22.1 million is primarily attributable to: ● the acquisition of operating properties during 2017 and 2016; ● new leasing, expansion and re-tenanting of core portfolio properties; ● a decrease in interest expense; and ● changes in operating assets and liabilities due to timing of receipts and payments; partially offset by
● a decrease in operational distributions from the Company’s joint venture programs due to the sale of certain joint venture properties during 2017 and2016.
During the years ended December 31, 2017 and 2016, the Company capitalized personnel costs of $16.1 million and $15.4 million, respectively, relating to deferredleasing costs.
Investing Activities Cash flows used for investing activities was $294.3 million for 2017, as compared to cash flows provided by investing activities of $165.4 million for 2016.
Investing activities during 2017 consisted primarily of:Cash outflows:
● $367.1 million for improvements to operating real estate related to the Company’s active redevelopment pipeline and improvements to real estate underdevelopment;
● $163.9 million for acquisition of operating real estate and other related net assets, including seven consolidated operating properties and six parcels, andacquisition of real estate under development related to one development project;
● $35.3 million for investments in and advances to real estate joint ventures, primarily related to a redevelopment project in one joint venture and therepayment of a mortgage in another joint venture; and
● $9.8 million for investment in marketable securities.Cash inflows:
● $181.3 million in proceeds from the sale of operating properties, including 25 consolidated operating properties and nine parcels; and
● $96.5 million in reimbursements of investments and advances to real estate joint ventures, primarily related to disposition of properties within the joint
venture portfolio, and reimbursements of investments and advances to other real estate investments, primarily related to a distribution received from theCompany’s Albertsons investment.
Investing activities during 2016 consisted primarily of:
Cash inflows:
● $330.4 million in proceeds from distributions and return of investments from liquidation of real estate joint ventures, primarily due to the liquidation ofcertain Canadian joint ventures in 2016;
● $304.6 million in proceeds from the sale of operating properties related to 30 consolidated operating properties and two parcels; and
● $82.7 million in reimbursements of investments and advances to real estate joint ventures, primarily related the refinancing of certain property mortgages
within various joint ventures, and reimbursements of investments and advances to other real estate investments, primarily related to the sale of onepreferred equity investment.
Cash outflows:
● $254.8 million for acquisition of operating real estate and other related net assets, including 12 consolidated operating properties and two parcels, andacquisition of real estate under development related to two development projects;
● $216.2 million for improvements to operating real estate, including expenditures related to the Company’s active redevelopment pipeline andimprovements to real estate under development; and
● $86.5 million for investments in and advances to real estate joint ventures, primarily related to the acquisition of a property within one joint venture,
redevelopment projects with the Company’s joint ventures, the purchase of additional ownership in certain joint ventures and the repayment of debt incertain joint ventures.
29

Table of Contents
Acquisitions of Operating Real Estate and Other Related Net Assets
During the years ended December 31, 2017 and 2016, the Company expended $153.9 million and $203.2 million, respectively, towards the acquisition of operatingreal estate properties. The Company continues to transform the quality of its portfolio by disposing of lesser quality assets and acquiring larger, higher qualityproperties in key markets identified by the Company. The Company anticipates spending up to approximately $50.0 million towards the acquisition of operatingproperties during 2018. The Company intends to fund these acquisitions with proceeds from property dispositions, cash flow from operating activities and availabilityunder its Credit Facility.
Improvements to Operating Real Estate During the years ended December 31, 2017 and 2016, the Company expended $206.8 million and $143.5 million, respectively, towards improvements to operating
real estate. These amounts consist of the following (in thousands):
Year Ended December 31, 2017 2016 Redevelopment and renovations $ 177,840 $ 96,319 Tenant improvements and tenant allowances 16,995 39,016 Other 11,965 8,154 Total (1) $ 206,800 $ 143,489
(1) During the years ended December 31, 2017 and 2016, the Company capitalized interest of $3.5 million and $2.4 million, respectively, and capitalized payroll of$3.1 million and $2.1 million, respectively, in connection with the Company’s improvements to operating real estate.
The Company has an ongoing program to redevelop and re-tenant its properties to maintain or enhance its competitive position in the marketplace. The Company
is actively pursuing redevelopment opportunities within its operating portfolio which it believes will increase the overall value by bringing in new tenants andimproving the assets’ value. The Company has identified three categories of redevelopment, (i) large scale redevelopment, which involves demolishing and buildingnew square footage, (ii) value creation redevelopment, which includes the subdivision of large anchor spaces into multiple tenant layouts, and (iii) creation of out-parcels and pads located in the front of the shopping center properties. The Company anticipates its capital commitment toward these redevelopment projects and re-tenanting efforts during 2018 will be approximately $225.0 million to $300.0 million. The funding of these capital requirements will be provided by proceeds fromproperty dispositions, cash flow from operating activities and availability under the Company’s Credit Facility.
Improvements to Real Estate Under Development The Company is engaged in select real estate development projects, which are expected to be held as long-term investments. As of December 31, 2017, the
Company had in progress a total of four active real estate development projects and two additional projects held for future development. During the years endedDecember 31, 2017 and 2016, the Company expended $160.3 million and $72.8 million, respectively, towards improvements to real estate under development. TheCompany capitalized (i) interest of $11.0 million and $6.9 million, (ii) real estate taxes, insurance and legal costs of $5.7 million and $5.2 million and (iii) payroll of $3.3million and $1.8 million during the years ended December 31, 2017 and 2016, respectively, in connection with these real estate development projects. The Companyanticipates the total remaining costs to complete these four active projects to be approximately $200.0 million to $250.0 million. The Company anticipates its capitalcommitment toward these development projects during 2018 will be approximately $175.0 million to $225.0 million. The funding of these capital requirements will beprovided by proceeds from property dispositions, cash flow from operating activities and availability under the Company’s Credit Facility.
Financing Activities Cash flow used for financing activities was $223.9 million for 2017, as compared to $804.5 million for 2016. Financing activities during 2017 primarily consisted of
the following:Cash outflows:
● $702.3 million for principal payments on debt, including normal amortization on rental property debt; ● $550.0 million for repayments under unsecured term loan/notes, including $300.0 million Medium Term Notes and payoff of $250.0 million Term Loan; ● $17.1 million for repayments under unsecured revolving credit facility, net; ● $506.2 million of dividends paid; ● $225.0 million for the partial redemption of Class I Preferred Stock;
● $96.6 million for conversion/distribution of noncontrolling interests, primarily related to the redemption of certain partnership units by consolidatedsubsidiaries; and
● $23.3 million for financing origination costs, primarily related to costs associated with the issuance of Senior Unsecured Notes and the Credit Facility.
30

Table of Contents
Cash inflows:
● $1.3 billion in proceeds from issuance of unsecured notes, including $500.0 million, $350.0 million and $400.0 million of Senior Unsecured Notes, issuedseparately;
● $440.9 million in proceeds from issuance of stock, net, including the issuances of Class L Preferred Stock and Class M Preferred Stock; and ● $206.0 million in proceeds from mortgage loan financing.
Financing activities during 2016 primarily consisted of:Cash outflows:
● $1.26 billion for repayments under unsecured term loan/notes, including paydown of $400.0 million Term Loan, $300.0 million Medium Term Notes, $290.0million Senior Unsecured Notes and $270.9 million Canadian Notes Payable;
● $719.9 million for principal payments on debt, including normal amortization on rental property debt; ● $474.0 million of dividends paid;
● $45.7 million for payment of early extinguishment of debt charges related to the optional make-whole provisions on unsecured notes that were repaidprior to maturity and prepayment penalties on a mortgage encumbering 10 operating properties;
● $25.7 million for financing origination costs, primarily related to costs associated with the issuance of Senior Unsecured Notes; and ● $12.6 million for conversion/distribution of noncontrolling interests.
Cash inflows:
● $1.4 billion in proceeds from issuance of unsecured notes, including $500.0 million, $400.0 million, $350.0 million and $150.0 million of Senior UnsecuredNotes, issued separately;
● $307.4 million in proceeds from issuance of stock, including common stock issued under the Company's ATM program; and ● $26.4 million in proceeds from unsecured revolving credit facility, net.
The Company continually evaluates its debt maturities, and, based on management’s current assessment, believes it has viable financing and refinancing
alternatives that will not materially adversely impact its expected financial results. The Company continues to pursue borrowing opportunities with large commercialU.S. and global banks, select life insurance companies and certain regional and local banks. The Company has noticed a continuing trend that, although pricingremains dependent on specific deal terms, generally spreads for non-recourse mortgage financing has stabilized and the unsecured debt markets are functioning welland credit spreads are at manageable levels.
Debt maturities for 2018 consist of: $73.0 million of consolidated debt; $203.7 million of unconsolidated joint venture debt; and $6.1 million of debt on properties
included in the Company’s Preferred Equity Program, assuming the utilization of extension options where available. The 2018 consolidated debt maturities areanticipated to be repaid with operating cash flows, borrowings from the Company’s Credit Facility and debt refinancing where applicable. In addition, the Companyhas $12.4 million of consolidated debt related to one non-recourse mortgage that is currently in default for which the Company is working with the special servicers ona resolution. The 2018 debt maturities on properties in the Company’s unconsolidated joint ventures and Preferred Equity Program are anticipated to be repaidthrough operating cash flows, debt refinancing, unsecured credit facilities, proceeds from sales and partner capital contributions, as deemed appropriate.
The Company intends to maintain strong debt service coverage and fixed charge coverage ratios as part of its commitment to maintain its investment-grade
senior, unsecured debt ratings. The Company may, from time-to-time, seek to obtain funds through additional common and preferred equity offerings, unsecureddebt financings and/or mortgage/construction loan financings and other capital alternatives.
Since the completion of the Company’s IPO in 1991, the Company has utilized the public debt and equity markets as its principal source of capital for its
expansion needs. Since the IPO, the Company has completed additional offerings of its public unsecured debt and equity, raising in the aggregate over $13.8billion. Proceeds from public capital market activities have been used for the purposes of, among other things, repaying indebtedness, acquiring interests in open-airshopping centers, funding real estate under development projects, expanding and improving properties in the portfolio and other investments.
During February 2015, the Company filed a shelf registration statement on Form S-3, which is effective for a term of three years, for the future unlimited offerings,
from time-to-time, of debt securities, preferred stock, depositary shares, common stock and common stock warrants. The Company, pursuant to this shelf registrationstatement may, from time-to-time, offer for sale its senior unsecured debt for any general corporate purposes, including (i) funding specific liquidity requirements in itsbusiness, including property acquisitions, development and redevelopment costs and (ii) managing the Company’s debt maturities. (See Footnote 12 of the Notes toConsolidated Financial Statements included in this Form 10-K.)
31

Table of Contents
Preferred Stock- During August 2017, the Company issued 9,000,000 Depositary Shares (the "Class L Depositary Shares"), each representing a one-thousandth fractional interest
in a share of the Company's 5.125% Class L Cumulative Redeemable Preferred Stock, $1.00 par value per share. Dividends on the Class L Depositary Shares arecumulative and payable quarterly in arrears at the rate of 5.125% per annum based on the $25.00 per share initial offering price, or $1.28125 per annum. The Class LDepositary Shares are redeemable, in whole or part, for cash on or after August 16, 2022, at the option of the Company, at a redemption price of $25.00 per depositaryshare, plus any accrued and unpaid dividends thereon. The Class L Depositary Shares are not convertible or exchangeable for any other property or securities of theCompany. The net proceeds received from this offering of $218.1 million, before legal costs, were used for general corporate purposes, including the reduction ofborrowings outstanding under the Company’s revolving credit facility and the redemption of shares of the Company’s preferred stock.
On August 7, 2017, the Company called for the partial redemption of 9,000,000 of its outstanding depositary shares of the Company’s 6.00% Class I Cumulative
Redeemable Preferred Stock, $1.00 par value per share (the "Class I Preferred Stock"), representing 56.25% of the issued and outstanding Class I Preferred Stock. Theaggregate redemption amount of $225.0 million plus accumulated and unpaid dividends of $1.9 million, was paid on September 6, 2017. Upon partial redemption, theCompany recorded a charge of $7.0 million resulting from the difference between the redemption amount and the carrying amount of the Class I Preferred Stock on theCompany’s Consolidated Balance Sheets in accordance with the FASB’s guidance on Distinguishing Liabilities from Equity. This $7.0 million charge was subtractedfrom net income attributable to the Company to arrive at net income available to the Company’s common shareholders and used in the calculation of earnings pershare for the year ended December 31, 2017.
During December 2017, the Company issued 9,200,000 Depositary Shares (the "Class M Depositary Shares"), each representing a one-thousandth fractional
interest in a share of the Company's 5.250% Class M Cumulative Redeemable Preferred Stock, $1.00 par value per share. Dividends on the Class M Depositary Sharesare cumulative and payable quarterly in arrears at the rate of 5.250% per annum based on the $25.00 per share initial offering price, or $1.3125 per annum. The Class MDepositary Shares are redeemable, in whole or part, for cash on or after December 20, 2022, at the option of the Company, at a redemption price of $25.00 perdepositary share, plus any accrued and unpaid dividends thereon. The Class M Depositary Shares are not convertible or exchangeable for any other property orsecurities of the Company. The net proceeds received from this offering of $222.8 million, before legal costs, were used for general corporate purposes, including thereduction of borrowings outstanding under the Company’s revolving credit facility. Additionally, during January 2018, the underwriters exercised the over-allotmentoption for the issuance of an additional 1,380,000 Class M Depositary Shares each representing a one-thousandth fractional interest in a share of the Company's5.250% Class M Cumulative Redeemable Preferred Stock, $1.00 par value per share. The net proceeds from the issuance of these shares were $33.4 million, before legalcosts, which were used for general corporate purposes, including the reduction of borrowings outstanding under the Company’s Credit Facility.
Common Stock During February 2018, the Company’s Board of Directors authorized a share repurchase program, pursuant to which the Company may repurchase shares of its
common stock, par value $0.01 per share, with an aggregate gross purchase price of up to $300.0 million. During February 2015, the Company established an At the Market Continuous Offering Program (“ATM program”), which is effective for a term of three years,
pursuant to which the Company may offer and sell shares of its common stock, par value $0.01 per share, with an aggregate gross sales price of up to $500.0 millionthrough a consortium of banks acting as sales agents. Sales of the shares of common stock may be made, as needed, from time to time in “at the market” offerings asdefined in Rule 415 of the Securities Act of 1933, including by means of ordinary brokers’ transactions on the NYSE or otherwise (i) at market prices prevailing at thetime of sale, (ii) at prices related to prevailing market prices or (iii) as otherwise agreed to with the applicable sales agent. The Company did not offer for sale anyshares of common stock under the ATM program during the year ended December 31, 2017. As of December 31, 2017, the Company had $211.9 million available underthis ATM program.
Medium Term Notes (“MTN”) and Senior Notes
The Company’s supplemental indenture governing its senior notes contains the following covenants, all of which the Company is compliant with:
Covenant Must Be As of 12/31/17Consolidated Indebtedness to Total Assets <65% 39%Consolidated Secured Indebtedness to Total Assets <40% 6%Consolidated Income Available for Debt Service to Maximum Annual Service Charge >1.50x 4.9xUnencumbered Total Asset Value to Consolidated Unsecured Indebtedness >1.50x 2.6x For a full description of the various indenture covenants refer to the Indenture dated September 1, 1993; the First Supplemental Indenture dated August 4, 1994;
the Second Supplemental Indenture dated April 7, 1995; the Third Supplemental Indenture dated June 2, 2006; the Fourth Supplemental Indenture dated April 26, 2007;the Fifth Supplemental Indenture dated as of September 24, 2009; the Sixth Supplemental Indenture dated as of May 23, 2013; and the Seventh Supplemental Indenturedated as of April 24, 2014, each as filed with the SEC. See the Exhibits Index for specific filing information.
32

Table of Contents
During the year ended December 31, 2017, the Company issued the following Senior Unsecured Notes (dollars in millions):
Date Issued Maturity Date Amount Issued Interest Rate Aug-17 Feb-25 $ 500.0 3.30% Aug-17 Sep-47 $ 350.0 4.45% Mar-17 Apr-27 $ 400.0 3.80%
Interest on these senior unsecured notes is payable semi-annually in arrears. The Company used the net proceeds from these issuances, after the underwriting
discounts and related offering costs, for general corporate purposes, including to pre-fund near-term debt maturities or to reduce borrowings under the Company’sCredit Facility.
On August 1, 2017, the Company made a tender offer to purchase any and all of its $300.0 million 4.30% MTN notes outstanding. As a result, the Companyaccepted the tender of $211.0 million of its $300.0 million outstanding MTN notes on August 10, 2017. In connection with this tender offer, the Company recorded atender premium of $1.8 million resulting from the partial repayment of this note. In addition, in November 2017, the Company redeemed the remaining $89.0 million4.30% MTN notes outstanding.
Credit Facility In February 2017, the Company closed on a $2.25 billion unsecured revolving credit facility (the “Credit Facility”) with a group of banks, which is scheduled to
expire in March 2021, with two additional six-month options to extend the maturity date, at the Company’s discretion, to March 2022. This Credit Facility, whichaccrues interest at a rate of LIBOR plus 87.5 basis points (2.28% as of December 31, 2017), can be increased to $2.75 billion through an accordion feature. The CreditFacility replaced the Company’s $1.75 billion unsecured revolving credit facility that was scheduled to mature in March 2018. In addition, the Credit Facility includes a$500.0 million sub-limit which provides the Company the opportunity to borrow in alternative currencies including Canadian Dollars (“CAD”), British Pounds Sterling,Japanese Yen or Euros. Pursuant to the terms of the Credit Facility, the Company, among other things, is subject to covenants requiring the maintenance of (i)maximum leverage ratios on both unsecured and secured debt and (ii) minimum interest and fixed coverage ratios. As of December 31, 2017, the Credit Facility had abalance of CAD 10.0 million (USD $8.0 million) outstanding and $0.5 million appropriated for letters of credit.
Pursuant to the terms of the Credit Facility, the Company, among other things, is subject to maintenance of various covenants. The Company is currently in
compliance with these covenants. The financial covenants for the Credit Facility are as follows:
Covenant Must Be As of 12/31/17Total Indebtedness to Gross Asset Value (“GAV”) <60% 40%Total Priority Indebtedness to GAV <35% 5%Unencumbered Asset Net Operating Income to Total Unsecured Interest Expense >1.75x 4.4xFixed Charge Total Adjusted EBITDA to Total Debt Service >1.50x 2.8x
For a full description of the New Credit Facility’s covenants refer to the Amended and Restated Credit Agreement dated as of February 1, 2017, filed as Exhibit
10.1 to the Company’s Current Report on Form 8-K dated January 30, 2017.
Term Loan
The Company had a $650.0 million unsecured term loan (“Term Loan”) which was scheduled to mature in January 2017, with three one-year extension options atthe Company’s discretion. The Term Loan accrued interest at LIBOR plus 95 basis points. During November 2016, the Company repaid $400.0 million of borrowingsunder the Company’s Term Loan and in January 2017, the Company repaid the remaining $250.0 million balance and terminated the agreement.
Mortgages Payable
During 2017, the Company (i) assumed/consolidated $257.5 million of individual non-recourse mortgage debt (including a fair market value adjustment of $8.5million) related to two operating properties, (ii) paid off $692.9 million of mortgage debt (including fair market value adjustments of $5.8 million) that encumbered 27operating properties and (iii) obtained a $206.0 million non-recourse mortgage relating to one operating property.
In addition to the public equity and debt markets as capital sources, the Company may, from time-to-time, obtain mortgage financing on selected properties and
construction loans to partially fund the capital needs of its real estate under development projects. As of December 31, 2017, the Company had over 365unencumbered property interests in its portfolio.
33

Table of Contents
Dividends In connection with its intention to continue to qualify as a REIT for federal income tax purposes, the Company expects to continue paying regular dividends to its
stockholders. These dividends will be paid from operating cash flows. The Company’s Board of Directors will continue to evaluate the Company’s dividend policy ona quarterly basis as the Board of Directors monitors sources of capital and evaluates the impact of the economy and capital markets availability on operatingfundamentals. Since cash used to pay dividends reduces amounts available for capital investment, the Company generally intends to maintain a conservativedividend payout ratio, reserving such amounts as it considers necessary for the expansion and renovation of shopping centers in its portfolio, debt reduction, theacquisition of interests in new properties and other investments as suitable opportunities arise and such other factors as the Board of Directors considers appropriate. Cash dividends paid were $506.2 million in 2017, $474.0 million in 2016, and $455.8 million in 2015.
Although the Company receives substantially all of its rental payments on a monthly basis, it generally intends to continue paying dividends quarterly. Amounts
accumulated in advance of each quarterly distribution will be invested by the Company in short-term money market or other suitable instruments. On October 24, 2017,the Company’s Board of Directors declared an increased quarterly cash dividend of $0.28 per common share, an annualized increase of 3.7%, payable to shareholdersof record on January 2, 2018, which was paid on January 16, 2018. Additionally, on January 30, 2018, the Company’s Board of Directors declared a quarterly cashdividend of $0.28 per common share payable to shareholders of record on April 3, 2018, which is scheduled to be paid on April 16, 2018.
The Board of Directors also declared quarterly dividends with respect to the Company’s various classes of cumulative redeemable preferred shares (Class I, Class
J, Class K and Class L) and an initial dividend with respect to the Company’s Class M cumulative redeemable preferred shares, representing the period beginning onDecember 20, 2017. All dividends on the preferred shares are scheduled to be paid on April 16, 2018 to shareholders of record on April 3, 2018.
Hurricane Impact The impact of Hurricanes Harvey, which struck Texas on August 25, 2017, and Irma, which struck Florida on September 10, 2017, resulted in minimal damage to the
Company’s properties located in Texas and Florida, with the majority of the impact related to debris removal. On September 20, 2017, Hurricane Maria struck Puerto Rico as a Category 4 hurricane which resulted in widespread damage, flooding, and power outages. The
Company has interests in seven operating properties located throughout Puerto Rico, aggregating 2.2 million square feet of GLA, which were variously impacted bythe hurricane. The Company maintains a comprehensive property insurance policy on these properties with total coverage of up to $62.0 million, as well as businessinterruption insurance with coverage up to $39.3 million in the aggregate, subject to a collective deductible of $1.2 million.
As of December 31, 2017, the Company’s assessment of the damages sustained to its properties from Hurricane Maria resulted in a write-off to depreciation
expense of $16.0 million, representing the estimated net book value of damaged assets. The Company also recorded a corresponding receivable and credit todepreciation expense of $16.0 million for estimated property insurance recoveries related to the write-off. As such, there was no impact to net income during 2017resulting from these adjustments. The Company expects to collect property insurance proceeds (net of deductible) equal to the replacement cost of its damagedproperty, currently estimated to be approximately $26.0 million. As of December 31, 2017, the Company received property insurance proceeds of $4.0 million and has aremaining receivable balance of $12.0 million which is included in Other assets on the Company’s Consolidated Balance Sheets. The Company expects that the finalreplacement cost claim will exceed the amount written off due to property damage and that this excess amount will be recorded, net of the deductible, as income by theCompany upon full settlement and collection of the casualty insurance claim.
The Company’s business interruption insurance covers lost revenues as a result of the hurricane for a period of up to one year. After the expiration of one year
following the loss, the policy has 365 days of extended period of indemnity which provides business interruption coverage in the event the properties have not fullyrecovered from the storm. For the year ended December 31, 2017, the Company had a reduction in revenues from rental properties of $3.4 million related to lost tenantrevenue and rent abatements resulting from the impact of Hurricane Maria. During December 2017, the Company received $1.6 million from its insurance provider forbusiness interruption claims. The Company is still in the process of assessing current and future business interruption insurance losses and will submit insuranceclaims for its estimated losses under its business interruption insurance policy.
Income Taxes
On December 22, 2017, the Tax Cuts and Jobs Act was signed into law, making significant changes to taxation of corporations and individuals. Effective for tax
years beginning on January 1, 2018, this tax reform law reduces the federal statutory income tax rate from 35% to 21% for corporations and changed other certain taxprovisions and deductions. ASC 740, Income Taxes, requires the effects of changes in tax rates and laws on deferred tax balances to be recognized in the period inwhich the legislation is enacted. As a result, the Company remeasured its deferred tax assets and liabilities and recorded a tax provision of $1.1 million during 2017.
The Company is subject to taxes on its activities in Canada, Puerto Rico and Mexico. In general, under local country law applicable to the structures the
Company has in place and applicable treaties, the repatriation of cash to the Company from its subsidiaries and joint ventures in Canada, Puerto Rico and Mexicogenerally are not subject to withholding tax. The Company is subject to and also includes in its tax provision non-U.S. income taxes on certain investments located injurisdictions outside the U.S. These investments are held by the Company at the REIT level and not in the Company’s taxable REIT subsidiary. Accordingly, theCompany does not expect a U.S. income tax impact associated with the repatriation of undistributed earnings from the Company’s foreign subsidiaries.
34

Table of Contents
Contractual Obligations and Other Commitments The Company has debt obligations relating to its Credit Facility, unsecured senior notes and mortgages with maturities ranging from less than one year to 30
years. As of December 31, 2017, the Company’s total debt had a weighted average term to maturity of 10.7 years. In addition, the Company has non-cancelableoperating leases pertaining to its shopping center portfolio. As of December 31, 2017, the Company had 43 consolidated shopping center properties that are subject tolong-term ground leases where a third party owns and has leased the underlying land to the Company to construct and/or operate a shopping center. The followingtable summarizes the Company’s debt maturities (excluding extension options, unamortized debt issuance costs of $65.4 million and fair market value of debtadjustments aggregating $19.2 million) and obligations under non-cancelable operating leases as of December 31, 2017:
Payments due by period (in millions) Contractual Obligations: 2018 2019 2020 2021 2022 Thereafter Total Long-Term Debt- Principal (1) $ 98.4 $ 415.7 $ 136.4 $ 653.3 $ 640.6 $ 3,580.7 $ 5,525.1 Long-Term Debt- Interest (2) $ 209.0 $ 198.6 $ 180.7 $ 163.3 $ 145.3 $ 1,437.4 $ 2,334.3 Operating Leases:
Ground Leases (3) $ 9.1 $ 9.1 $ 8.6 $ 8.6 $ 8.5 $ 138.5 $ 182.5 (1) Maturities utilized do not reflect extension options, which range from one to three years. (2) For loans which have interest at floating rates, future interest expense was calculated using the rate as of December 31, 2017. (3) For leases which have inflationary increases, future ground rent expense was calculated using the rent as of December 31, 2017.
The Company has $73.0 million of secured debt scheduled to mature in 2018. The Company anticipates satisfying the remaining maturities with a combination ofoperating cash flows, its Credit Facility, exercise of extension options, where available, and new debt issuances. In addition, the Company has $12.4 million ofconsolidated debt related to one non-recourse mortgage that is currently in default for which the Company is working with the special servicers on a resolution.
The Company has issued letters of credit in connection with completion and repayment guarantees for loans encumbering certain of the Company’s development
and redevelopment projects and guarantee of payment related to the Company’s insurance program. As of December 31, 2017, these letters of credit aggregated $40.4million.
In connection with the construction of its development/redevelopment projects and related infrastructure, certain public agencies require posting of performance
and surety bonds to guarantee that the Company’s obligations are satisfied. These bonds expire upon the completion of the improvements and infrastructure. As ofDecember 31, 2017, the Company had $20.0 million in performance and surety bonds outstanding.
The Company has accrued $4.0 million of non-current uncertain tax positions and related interest under the provisions of the authoritative guidance that
addresses accounting for income taxes, which are included in Other liabilities on the Company’s Consolidated Balance Sheets at December 31, 2017. These amountsare not included in the table above because a reasonably reliable estimate regarding the timing of settlements with the relevant tax authorities, if any, cannot be made.
35

Table of Contents
Off-Balance Sheet Arrangements Unconsolidated Real Estate Joint Ventures The Company has investments in various unconsolidated real estate joint ventures with varying structures. These joint ventures primarily operate shopping
center properties. Such arrangements are generally with third-party institutional investors and individuals. The properties owned by the joint ventures are primarilyfinanced with individual non-recourse mortgage loans, however, the Company, on a selective basis, has obtained unsecured financing for certain joint ventures. As ofDecember 31, 2017, the Company did not guarantee any joint venture unsecured debt. Non-recourse mortgage debt is generally defined as debt whereby the lenders’sole recourse with respect to borrower defaults is limited to the value of the property collateralized by the mortgage. The lender generally does not have recourseagainst any other assets owned by the borrower or any of the constituent members of the borrower, except for certain specified exceptions listed in the particular loandocuments (see Footnote 7 of the Notes to Consolidated Financial Statements included in this Form 10-K). As of December 31, 2017, these investments include thefollowing joint ventures:
Venture
KimcoOwnership
Interest Number ofProperties
Non-RecourseMortgages
Payable(in millions)
Number ofEncumberedProperties
WeightedAverageInterest
Rate
WeightedAverage
Term(months)*
KimPru and KimPru II (a) 15.0% 46 $ 426.5 15 3.72% 67.7 KIR (b) 48.6% 42 $ 668.1 35 4.67% 47.0 CPP (c) 55.0% 4 $ 84.9 1 2.91% 4.0
* Average remaining term includes extensions
(a) Represents the Company’s joint ventures with Prudential Global Investment Management. As of December 31, 2017, KimPru also has an unsecured term loan
with an outstanding balance of $200.0 million (excluding deferred financing costs of $0.8 million), which is scheduled to mature in August 2019, with two one-year extension options at the joint venture’s discretion, and bears interest at a rate equal to LIBOR plus 1.75% (3.31% at December 31, 2017).
(b) Represents the Company’s joint ventures with certain institutional investors. As of December 31, 2017, KIR also has a $170.0 million unsecured revolvingcredit facility with an outstanding balance at December 31, 2017 of $34.4 million (excluding deferred financing costs of $0.5 million), which is scheduled tomature in September 2020, with two one-year extension options at the joint venture’s discretion, and bears interest at a rate equal to LIBOR plus 1.75% (3.31%at December 31, 2017).
(c) Represents the Company’s joint ventures with Canada Pension Plan Investment Board (CPPIB).
The Company has various other unconsolidated real estate joint ventures with varying structures. As of December 31, 2017, these other unconsolidated jointventures had individual non-recourse mortgage loans aggregating $287.6 million. The aggregate debt as of December 31, 2017, of all of the Company’s unconsolidatedreal estate joint ventures is $1.7 billion. As of December 31, 2017, these loans had scheduled maturities ranging from one month to nine years and bore interest at ratesranging from 2.91% to 7.25%. Approximately $203.7 million of the aggregate outstanding loan balance matures in 2018. These maturing loans are anticipated to berepaid with, operating cash flows, debt refinancing, unsecured credit facilities, proceeds from sales and partner capital contributions, as deemed appropriate (seeFootnote 7 of the Notes to Consolidated Financial Statements included in this Form 10-K).
Other Real Estate Investments The Company previously provided capital to owners and developers of real estate properties through its Preferred Equity Program. As of December 31, 2017, the
Company’s net investment under the Preferred Equity Program was $201.9 million relating to 357 properties, including 344 net leased properties. As of December 31,2017, these preferred equity investment properties had individual non-recourse mortgage loans aggregating $361.0 million. These loans have scheduled maturitiesranging from eight months to seven years and bear interest at rates ranging from 4.19% to 10.47%. Due to the Company’s preferred position in these investments, theCompany’s share of each investment is subject to fluctuation and is dependent upon property cash flows. The Company’s maximum exposure to losses associatedwith its preferred equity investments is limited to its invested capital.
Funds From Operations
Funds From Operations (“FFO”) is a supplemental non-GAAP financial measure utilized to evaluate the operating performance of real estate companies. The
National Association of Real Estate Investment Trusts (“NAREIT”) defines FFO as net income/(loss) available to the Company’s common shareholders computed inaccordance with generally accepted accounting principles in the United States (“GAAP”), excluding (i) gains or losses from sales of operating real estate assets andchange in control of interests, plus (ii) depreciation and amortization of operating properties and (iii) impairment of depreciable real estate and in substance real estateequity investments and (iv) after adjustments for unconsolidated partnerships and joint ventures calculated to reflect FFO on the same basis.
The Company presents FFO available to the Company’s common shareholders as it considers it an important supplemental measure of our operating performance
and believes it is frequently used by securities analysts, investors and other interested parties in the evaluation of REITs, many of which present FFO available to theCompany’s common shareholders when reporting results. Comparison of our presentation of FFO available to the Company’s common shareholders to similarly titledmeasures for other REITs may not necessarily be meaningful due to possible differences in the application of the NAREIT definition used by such REITs.
The Company also presents FFO available to the Company’s common shareholders as adjusted as an additional supplemental measure as it believes it is more
reflective of its core operating performance and provides investors and analysts an additional measure to compare the Company’s performance across reportingperiods on a consistent basis by excluding items that we do not believe are indicative of our core operating performance. FFO available to the Company’s commonshareholders as adjusted is generally calculated by the Company as FFO available to the Company’s common shareholders excluding certain transactional income andexpenses and non-operating impairments which management believes are not reflective of the results within the Company’s operating real estate portfolio.
36

Table of Contents
FFO is a supplemental non-GAAP financial measure of real estate companies’ operating performances, which does not represent cash generated from operatingactivities in accordance with GAAP and therefore should not be considered an alternative for net income as a measure of liquidity. Our method of calculating FFOavailable to the Company’s common shareholders and FFO available to the Company’s common shareholders as adjusted may be different from methods used byother REITs and, accordingly, may not be comparable to such other REITs.
The Company’s reconciliation of net income available to the Company’s common shareholders to FFO available to the Company’s common shareholders and FFO
available to the Company’s common shareholders as adjusted for the three months and years ended December 31, 2017 and 2016 is as follows (in thousands, exceptper share data):
Three Months Ended Year Ended December 31, December 31, 2017 2016 2017 2016 Net income available to the Company’s common shareholders $ 73,465 $ 66,718 $ 372,461 $ 332,630 Gain on disposition of operating properties (31,436) (10,950) (92,830) (92,824)Gain on disposition of joint venture operating properties and change in
control of interests (6,849) (14,880) (79,034) (217,819)Depreciation and amortization - real estate related 83,959 89,476 356,191 347,315 Depreciation and amortization - real estate joint ventures 9,835 9,477 39,248 45,098 Impairment of operating properties 32,854 24,125 65,148 101,928 (Benefit)/provision for income taxes (2) - (1,227) (39) 39,570 Noncontrolling interests (2) (1,688) 245 (5,583) (182)FFO available to the Company’s common shareholders 160,140 162,984 655,562 555,716 Transactional (income)/expense:
Profit participation from other real estate investments (379) (830) (34,952) (10,883)Gains from land sales (2,362) (1,255) (3,422) (3,607)Acquisition and demolition costs 3,589 1,133 4,686 5,023 Gain on forgiveness of debt (380) (7,357) (380) (7,357)Early extinguishment of debt charges - - 1,753 45,674 Severance costs 5,190 - 5,190 - Gain on liquidation of a foreign entity - - (14,822) - Impairments on other investments 423 5,300 11,766 6,358 Preferred stock redemption charge - - 7,014 - Other, net 170 62 494 (362)Provision for income taxes (3) - 257 8 38,433 Noncontrolling interests (3) - 125 11,338 410
Total transactional expense/(income), net 6,251 (2,565) (11,327) 73,689 FFO available to the Company’s common shareholders as adjusted $ 166,391 $ 160,419 $ 644,235 $ 629,405 Weighted average shares outstanding for FFO calculations: Basic 423,734 423,087 423,614 418,402
Units 961 841 852 853 Dilutive effect of equity awards 354 1,162 405 1,307
Diluted 425,049 (1) 425,090 (1) 424,871 (1) 420,562 (1) FFO per common share – basic $ 0.38 $ 0.39 $ 1.55 $ 1.33 FFO per common share – diluted $ 0.38 (1) $ 0.38 (1) $ 1.55 (1) $ 1.32 (1)FFO as adjusted per common share – basic $ 0.39 $ 0.38 $ 1.52 $ 1.50 FFO as adjusted per common share – diluted $ 0.39 (1) $ 0.38 (1) $ 1.52 (1) $ 1.50 (1) (1) Reflects the potential impact if certain units were converted to common stock at the beginning of the period, which would have a dilutive effect on FFO. FFO
would be increased by $274 and $229 for the three months ended December 31, 2017 and 2016, respectively, and $923 and $881 for the years ended December 31,2017 and 2016, respectively. The effect of other certain convertible units would have an anti-dilutive effect upon the calculation of Income from continuingoperations per share. Accordingly, the impact of such conversion has not been included in the determination of diluted earnings per share calculations.
(2) Related to gains, impairment and deprecation on operating properties, where applicable.(3) Related to transaction (income)/expense, where applicable.
Same Property Net Operating Income (“Same property NOI”)
Same property NOI is a supplemental non-GAAP financial measure of real estate companies’ operating performance and should not be considered an alternativeto net income in accordance with GAAP or as a measure of liquidity. The Company considers Same property NOI as an important operating performance measurebecause it is frequently used by securities analysts and investors to measure only the net operating income of properties that have been owned by the Company forthe entire current and prior year reporting periods. It excludes properties under redevelopment, development and pending stabilization; properties are deemedstabilized at the earlier of (i) reaching 90% leased or (ii) one year following a project’s inclusion in operating real estate. Same property NOI assists in eliminatingdisparities in net income due to the development, acquisition or disposition of properties during the particular period presented, and thus provides a more consistentperformance measure for the comparison of the Company's properties.
37

Table of Contents
Same property NOI is calculated using revenues from rental properties (excluding straight-line rent adjustments, lease termination fees and amortization ofabove/below market rents) less charges for bad debt, operating and maintenance expense, real estate taxes and rent expense plus the Company’s proportionate shareof Same property NOI from unconsolidated real estate joint ventures, calculated on the same basis. The Company’s method of calculating Same property NOIavailable to the Company’s common shareholders may differ from methods used by other REITs and, accordingly, may not be comparable to such other REITs.
The following is a reconciliation of Net income available to the Company’s common shareholders to Same property NOI (in thousands):
Three Months Ended
December 31, Year Ended
December 31, 2017 2016 2017 2016 Net income available to the Company’s common shareholders $ 73,465 $ 66,718 $ 372,461 $ 332,630 Adjustments:
Management and other fee income (4,593) (4,117) (17,049) (18,391)General and administrative 32,060 27,462 118,455 117,302 Impairment charges 33,051 25,140 67,331 93,266 Depreciation and amortization 85,024 90,884 360,811 355,320 Interest and other expense, net 53,380 40,818 191,150 232,798 Provision/(benefit) for income taxes, net 1,344 (747) (880) 72,545 Gain on change in control of interests - (4,290) (71,160) (57,386)Equity in income of other real estate investments, net (5,049) (5,241) (67,001) (27,773)Gain on sale of operating properties, net of tax (31,436) (10,850) (93,538) (86,785)Net (loss)/income attributable to noncontrolling interests (330) 2,413 13,596 7,288 Preferred stock redemption charge - - 7,014 - Preferred stock dividends 11,431 11,555 46,600 46,220 Non same property net operating income (27,390) (20,555) (85,681) (108,248)Non-operational expense/(income) from joint ventures, net 9,360 8,474 72,970 (58,563)
Same property NOI $ 230,317 $ 227,664 $ 915,079 $ 900,223
Same property NOI increased by $2.7 million or 1.2% for the three months ended December 31, 2017, as compared to the corresponding period in 2016. Thisincrease is primarily the result of (i) an increase of $3.0 million related to lease-up and rent commencements in the portfolio and (ii) an increase in other property incomeof $0.9 million, partially offset by (iii) an increase of $1.2 million of credit losses. The percentage increase in Same property NOI for the three months ended December31, 2017 was negatively impacted by 120 basis points due to the impact of Hurricane Maria on the Company’s Puerto Rico properties.
Same property NOI increased by $14.9 million or 1.7% for the year ended December 31, 2017, as compared to the corresponding period in 2016. This increase isprimarily the result of (i) an increase of $11.7 million related to lease-up and rent commencements in the portfolio, (ii) an increase in other property income of $1.8million and (iii) a decrease of $1.4 million of credit losses. The percentage increase in Same property NOI for the year ended December 31, 2017 was negativelyimpacted by 30 basis points due to the impact of Hurricane Maria on the Company’s Puerto Rico properties.
Effects of Inflation Many of the Company's long-term leases contain provisions designed to mitigate the adverse impact of inflation. Such provisions include clauses enabling the
Company to receive payment of additional rent calculated as a percentage of tenants' gross sales above pre-determined thresholds, which generally increase as pricesrise, and/or escalation clauses, which generally increase rental rates during the terms of the leases. Such escalation clauses often include increases based uponchanges in the consumer price index or similar inflation indices. In addition, many of the Company's leases are for terms of less than 10 years, which permits theCompany to seek to increase rents to market rates upon renewal. Most of the Company's leases include escalation clauses or require the tenant to pay an allocableshare of operating expenses, including common area maintenance costs, real estate taxes and insurance, thereby reducing the Company's exposure to increases incosts and operating expenses resulting from inflation. The Company periodically evaluates its exposure to short-term interest rates and foreign currency exchangerates and will, from time-to-time, enter into interest rate protection agreements and/or foreign currency hedge agreements which mitigate, but do not eliminate, theeffect of changes in interest rates on its floating-rate debt and fluctuations in foreign currency exchange rates.
New Accounting Pronouncements See Footnote 1 of the Notes to Consolidated Financial Statements included in this Form 10-K.
38

Table of Contents Item 7A. Quantitative and Qualitative Disclosures About Market Risk
The Company’s primary market risk exposures are interest rate risk and foreign currency exchange rate risk. The following table presents the Company’s
aggregate fixed rate and variable rate debt obligations outstanding, including fair market value adjustments and unamortized deferred financing costs, as of December31, 2017, with corresponding weighted-average interest rates sorted by maturity date. The table does not include extension options where available (amounts inmillions).
2018 2019 2020 2021 2022 Thereafter Total Fair Value Secured Debt Fixed Rate $ 85.4 $ 2.4 $ 136.9 $ 156.1 $ 155.6 $ 246.4 $ 782.8 $ 781.8 Average Interest Rate 5.63% 5.29% 5.31% 5.39% 4.05% 4.43% 4.83% Variable Rate $ - $ 100.0 $ - $ - $ - $ - $ 100.0 $ 99.6 Average Interest Rate - 2.60% - - - - 2.60% Unsecured Debt Fixed Rate $ - $ 299.5 $ - $ 497.6 $ 494.9 $ 3,302.4 $ 4,594.4 $ 4,599.6 Average Interest Rate - 6.88% - 3.20% 3.40% 3.54% 3.71% Variable Rate $ - $ - $ - $ 1.7 $ - $ 1.7 $ 1.9 Average Interest Rate - - - 2.28% - 2.28% Based on the Company’s variable-rate debt balances, interest expense would have increased by $1.0 million for the year ended December 31, 2017, if short-term
interest rates were 1.0% higher. The Company has not, and does not plan to, enter into any derivative financial instruments for trading or speculative purposes. The Company’s revenues and equity in income (including gains on sales and impairment losses) from its foreign investments in U.S. dollar equivalents and their
respective local currencies are as follows (in millions):
2017 2016 2015 Revenues from consolidated in USD:
Mexico $ 0.3 $ 0.6 $ 1.9 Chile $ - $ - $ 6.7
Revenues from consolidated in local currencies: Mexico (Mexican Pesos “MXN”) 5.7 11.3 28.2 Chile (Chilean Pesos “CLP”) - - 4,264.9
Equity in income/(loss) from unconsolidated joint ventures and preferred equity investments inUSD:
Canada (1) $ (1.3) $ 152.6 $ 409.1 Mexico (2) $ (0.3) $ (3.6) $ (1.6)Chile (3) $ - $ - $ 0.9
Equity in income/(loss) from unconsolidated joint ventures and preferred equity investments in localcurrencies:
Canada (CAD) (1) (1.7) 199.5 540.1 Mexico (MXN) (6.3) 29.2 (24.0)Chile (CLP) - - -
(1) Includes impairment charge of $3.4 million (CAD 4.3 million) related to the pending sale of a property for the year ended December 31, 2017. In addition,
includes gains of $141.9 million (CAD 185.9 million) and $373.8 million (CAD 439.9 million) on disposition of equity interests for the years ended December 31,2016 and 2015, respectively.
(2) Includes equity losses of $5.2 million and $0.8 million for the years ended December 31, 2016 and 2015, respectively, related to foreign investments for whichthe reporting currency is denominated in USD and not subject to foreign translation exposure.
(3) Included in the year ended December 31, 2015 is the release of CTA of $0.8 million in equity income. The following table presents the Company’s foreign investments in their respective local currencies and the U.S. dollar equivalents:
Foreign Investment (in millions) Country Local Currency U.S. Dollars
Mexican real estate investments (MXN) 53.4 $ 4.8 Canadian investments (CAD) 18.2 $ 14.6
Currency fluctuations between local currency and the U.S. dollar, for investments for which the Company had determined that the local currency was the
functional currency, for the period in which the Company held its investment resulted in a cumulative translation adjustment (“CTA”). This CTA was recorded as acomponent of Accumulated other comprehensive income (“AOCI”) on the Company’s Consolidated Balance Sheets. During the year ended December 31, 2017, theCompany substantially liquidated its investments in Canada and as such, recognized a net cumulative foreign currency translation gain of $10.0 million. The Companyhad previously substantially liquidated its investments in Mexico. As a result of the substantial liquidation of the Company’s foreign investments, any futurecurrency changes, which could have a favorable or unfavorable impact, will be recognized in Other (expense)/income, net in the Company’s Consolidated Statementsof Income.
39

Table of Contents Item 8. Financial Statements and Supplementary Data
The response to this Item 8 is included in our audited Consolidated Financial Statements and Notes to Consolidated Financial Statements, which are contained in
Part IV Item 15 of this Form 10-K.
Item 9. Changes in and Disagreements With Accountants on Accounting and Financial Disclosure None.
Item 9A. Controls and Procedures Evaluation of Disclosure Controls and Procedures The Company’s management, with the participation of the Company’s Chief Executive Officer and Chief Financial Officer, has evaluated the effectiveness of the
Company’s disclosure controls and procedures (as such term is defined in Rules 13a-15(e) and 15d-15(e) under the Securities Exchange Act of 1934, as amended (the"Exchange Act")) as of the end of the period covered by this report. Based on such evaluation, the Company’s Chief Executive Officer and Chief Financial Officerhave concluded that, as of the end of such period, the Company’s disclosure controls and procedures are effective.
Changes in Internal Control Over Financial Reporting There have not been any changes in the Company’s internal control over financial reporting (as such term is defined in Rules 13a-15(f) and 15d-15(f) under the
Exchange Act) during the fourth fiscal quarter ended December 31, 2017, that have materially affected, or are reasonably likely to materially affect, the Company’sinternal control over financial reporting.
Management’s Report on Internal Control Over Financial Reporting Our management is responsible for establishing and maintaining adequate internal control over financial reporting, as such term is defined in Exchange Act Rule
13a-15(f) and 15d-15(f). Under the supervision and with the participation of our management, including our Chief Executive Officer and Chief Financial Officer, weconducted an evaluation of the effectiveness of our internal control over financial reporting based on the framework in the Internal Control - Integrated Framework(2013) issued by the Committee of Sponsoring Organizations of the Treadway Commission. Based on our evaluation under the framework in Internal Control -Integrated Framework (2013), our management concluded that our internal control over financial reporting was effective as of December 31, 2017.
The effectiveness of our internal control over financial reporting as of December 31, 2017, has been audited by PricewaterhouseCoopers LLP, an independent
registered public accounting firm, as stated in their report which is included herein.
Item 9B. Other Information None.
PART III
Item 10. Directors, Executive Officers and Corporate Governance The information required by this item is incorporated by reference to “Proposal 1—Election of Directors,” “Corporate Governance,” “Committees of the
Board of Directors,” “Executive Officers” and “Other Matters” in our definitive proxy statement to be filed with respect to the Annual Meeting ofStockholders expected to be held on April 24, 2018 (“Proxy Statement”).
We have adopted a Code of Business Conduct and Ethics (the “Code of Ethics”). The Code of Ethics is available at the
Investors/Governance/Governance Documents section of our website at www.kimcorealty.com. A copy of the Code of Ethics is available in print, free ofcharge, to stockholders upon request to us at the address set forth in Item 1 of this Annual Report on Form 10-K under the section “Business - Background.”We intend to satisfy the disclosure requirements under the Securities and Exchange Act of 1934, as amended, regarding an amendment to or waiver from aprovision of our Code of Ethics by posting such information on our web-site.
Item 11. Executive Compensation
The information required by this item is incorporated by reference to “Compensation Discussion and Analysis,” “Executive Compensation Committee
Report,” “Compensation Tables,” “Compensation of Directors” and “Other Matters” in our Proxy Statement.
40

Table of Contents Item 12. Security Ownership of Certain Beneficial Owners and Management and Related Stockholder Matters
The information required by this item is incorporated by reference to “Security Ownership of Certain Beneficial Owners and Management” and
“Compensation Tables” in our Proxy Statement.
Item 13. Certain Relationships and Related Transactions, and Director Independence The information required by this item is incorporated by reference to “Certain Relationships and Related Transactions” and “Corporate Governance” in
our Proxy Statement.
Item 14. Principal Accounting Fees and Services The information required by this item is incorporated by reference to “Independent Registered Public Accountants” in our Proxy Statement.
41

Table of Contents
PART IV
Item 15. Exhibits, Financial Statement Schedules
(a) 1. Financial Statements –
The following consolidated financial information is included as a separate section of this annual report on Form 10-K.Form 10-K
ReportPage
Report of Independent Registered Public Accounting Firm 47 Consolidated Financial Statements Consolidated Balance Sheets as of December 31, 2017 and 2016 48 Consolidated Statements of Income for the years ended December 31, 2017, 2016 and 2015 49 Consolidated Statements of Comprehensive Income for the years ended December 31, 2017, 2016 and 2015 50 Consolidated Statements of Changes in Equity for the years ended December 31, 2017, 2016 and 2015 51 Consolidated Statements of Cash Flows for the years ended December 31, 2017, 2016 and 2015 52 Notes to Consolidated Financial Statements 53
2. Financial Statement Schedules - Schedule II - Valuation and Qualifying Accounts for the years ended December 31, 2017, 2016 and 2015 95 Schedule III - Real Estate and Accumulated Depreciation as of December 31, 2017 96 Schedule IV - Mortgage Loans on Real Estate as of December 31, 2017 98 All other schedules are omitted since the required information is not present or is not present in amounts sufficient to require
submission of the schedule.
3. Exhibits - The exhibits listed on the accompanying Index to Exhibits are filed as part of this report. 43
Item 16. Form 10-K Summary
None
42

Table of Contents
INDEX TO EXHIBITS Incorporated by Reference
ExhibitNumber Exhibit Description Form File No.
Date ofFiling
ExhibitNumber
Filed/Furnished Herewith
3.1(a) Articles of Restatement of Kimco Realty Corporation, dated January 14,2011
10-K 1-10899 02/28/11 3.1(a)
3.1(b) Amendment to Articles of Restatement of Kimco Realty Corporation,dated May 8, 2014
10-K 1-10899 02/27/17 3.1(b)
3.1(c) Articles Supplementary of Kimco Realty Corporation, dated November 8,2010
10-K 1-10899 02/28/11 3.1(b)
3.1(d) Articles Supplementary of Kimco Realty Corporation, dated March 12,2012 8-A12B 1-10899 03/13/12
3.2
3.1(e) Articles Supplementary of Kimco Realty Corporation, dated July 17, 2012 8-A12B 1-10899 07/18/12 3.2 3.1(f) Articles Supplementary of Kimco Realty Corporation, dated November 30,
2012 8-A12B 1-10899 12/03/12 3.2
3.1(g) Articles Supplementary of Kimco Realty Corporation, dated August 8,2017
8-A12B 1-10899 08/08/17 3.3
3.1(h) Articles Supplementary of Kimco Realty Corporation, dated December 12,2017
8-A12B 1-10899 12/12/17 3.3
3.2 Amended and Restated Bylaws of Kimco Realty Corporation, datedFebruary 25, 2009
10-K 1-10899 02/27/09 3.2
4.1 Agreement of Kimco Realty Corporation pursuant to Item 601(b)(4)(iii)(A)of Regulation S-K
S-11 333-42588 09/11/91 4.1
4.2 Indenture dated September 1, 1993, between Kimco Realty Corporationand Bank of New York (as successor to IBJ Schroder Bank and TrustCompany)
S-3 333-67552 09/10/93 4(a)
4.3 First Supplemental Indenture, dated August 4, 1994, between KimcoRealty Corporation and Bank of New York (as successor to IBJ SchroderBank and Trust Company)
10-K 1-10899 03/28/96 4.6
4.4 Second Supplemental Indenture, dated April 7, 1995, between KimcoRealty Corporation and Bank of New York (as successor to IBJ SchroderBank and Trust Company)
8-K 1-10899 04/07/95 4(a)
4.5 Third Supplemental Indenture, dated June 2, 2006, between Kimco RealtyCorporation and The Bank of New York, as trustee
8-K 1-10899 06/05/06 4.1
4.6 Fourth Supplemental Indenture, dated April 26, 2007, between KimcoRealty Corporation and The Bank of New York, as trustee
8-K 1-10899 04/26/07 1.3
4.7 Fifth Supplemental Indenture, dated September 24, 2009, between KimcoRealty Corporation and The Bank of New York Mellon, as trustee
8-K 1-10899 09/24/09 4.1
4.8 Sixth Supplemental Indenture, dated May 23, 2013, between Kimco RealtyCorporation and The Bank of New York Mellon, as trustee
8-K 1-10899 05/23/13 4.1
4.9 Seventh Supplemental Indenture, dated April 24, 2014, between KimcoRealty Corporation and The Bank of New York Mellon, as trustee
8-K 1-10899 04/24/14 4.1
10.1 Amended and Restated Stock Option Plan 10-K 1-10899 03/28/95 10.3 10.2 Second Amended and Restated 1998 Equity Participation Plan of Kimco
Realty Corporation (restated February 25, 2009)10-K 1-10899 02/27/09 10.9
10.3 Form of Indemnification Agreement 10-K 1-10899 02/27/09 99.1 10.4 Agency Agreement, dated July 17, 2013, by and among Kimco North
Trust III, Kimco Realty Corporation and Scotia Capital Inc., RBCDominion Securities Inc., CIBC World Markets Inc. and National BankFinancial Inc.
10-Q 1-10899 08/02/13 99.1
10.5 Kimco Realty Corporation Executive Severance Plan, dated March 15,2010
8-K 1-10899 03/19/10 10.5
10.6 Restated Kimco Realty Corporation 2010 Equity Participation Plan 10-K 1-10899 02/27/17 10.6 10.7 Amendment No. 1 to the Kimco Realty Corporation 2010 Equity
Participation Plan— — — — *
43

Table of Contents Incorporated by Reference
ExhibitNumber Exhibit Description Form File No.
Date ofFiling
ExhibitNumber
Filed/Furnished Herewith
10.8 Form of Performance Share Award Grant Notice and Performance ShareAward Agreement
8-K 1-10899 03/19/10 10.8
10.9 First Amendment to the Kimco Realty Corporation Executive SeverancePlan, dated March 20, 2012
10-Q 1-10899 05/10/12 10.3
10.10 $1.75 Billion Amended and Restated Credit Agreement, dated March 17,2014, among Kimco Realty Corporation, the subsidiaries of Kimco partythereto, the lenders party thereto, and JPMorgan Chase Bank, N.A., asadministrative agent
8-K 1-10899 03/20/14 10.1
10.11 $2.25 Billion Amended and Restated Credit Agreement, dated February 1,2017, among Kimco Realty Corporation, the subsidiaries of Kimco partythereto, the lenders party thereto, and JPMorgan Chase Bank, N.A., asadministrative agent
8-K 1-10899 02/02/17 10.1
10.12 Credit Agreement, dated January 30, 2015, among Kimco RealtyCorporation and each of the parties named therein
8-K 1-10899 02/05/15 10.1
10.13 Consulting Agreement, dated June 11, 2015, between Kimco RealtyCorporation and David B. Henry
8-K 1-10899 06/12/15 10.1
12.1 Computation of Ratio of Earnings to Fixed Charges — — — — *12.2 Computation of Ratio of Earnings to Combined Fixed Charges and
Preferred Stock Dividends— — — — *
21.1 Significant Subsidiaries of the Company — — — — *23.1 Consent of PricewaterhouseCoopers LLP — — — — *31.1 Certification of the Company’s Chief Executive Officer, Conor C. Flynn,
pursuant to Section 302 of the Sarbanes-Oxley Act of 2002— — — — *
31.2 Certification of the Company’s Chief Financial Officer, Glenn G. Cohen,pursuant to Section 302 of the Sarbanes-Oxley Act of 2002
— — — — *
32.1 Certification of the Company’s Chief Executive Officer, Conor C. Flynn,and the Company’s Chief Financial Officer, Glenn G. Cohen, pursuant toSection 906 of the Sarbanes-Oxley Act of 2002
— — — — *
99.1 Property Chart — — — — *101.INS XBRL Instance Document — — — — *101.SCH XBRL Taxonomy Extension Schema — — — — *101.CAL XBRL Taxonomy Extension Calculation Linkbase — — — — *101.DEF XBRL Taxonomy Extension Definition Linkbase — — — — *101.LAB XBRL Taxonomy Extension Label Linkbase — — — — *101.PRE XBRL Taxonomy Extension Presentation Linkbase — — — — * * Filed herewith** Furnished herewith
44

Table of Contents
SIGNATURES Pursuant to the requirements of Section 13 or 15(d) of the Securities Exchange Act of 1934, the registrant has duly caused this report to be signed on its behalf by
the undersigned, thereunto duly authorized.
KIMCO REALTY CORPORATION By: /s/ Conor C. Flynn Conor C. Flynn Chief Executive Officer
Dated: February 23, 2018 Pursuant to the requirements of the Securities Exchange Act of 1934, this report has been signed below by the following persons on behalf of the registrant and in
the capacities and on the dates indicated. Signature Title Date
/s/ Milton Cooper Executive Chairman of the Board of Directors February 23, 2018Milton Cooper
/s/ Conor C. Flynn Chief Executive Officer and Director February 23, 2018Conor C. Flynn
/s/ Richard G. Dooley Director February 23, 2018Richard G. Dooley
/s/ Joe Grills Director February 23, 2018Joe Grills
/s/ Frank Lourenso Director February 23, 2018Frank Lourenso
/s/ Richard Saltzman Director February 23, 2018Richard Saltzman
/s/ Philip Coviello Director February 23, 2018Philip Coviello
/s/ Colombe Nicholas Director February 23, 2018Colombe Nicholas
/s/ Mary Hogan Preusse Director February 23, 2018Mary Hogan Preusse
/s/ Glenn G. Cohen Executive Vice President - February 23, 2018Glenn G. Cohen Chief Financial Officer and Treasurer
/s/ Paul Westbrook Vice President - February 23, 2018Paul Westbrook Chief Accounting Officer
45

Table of Contents
ANNUAL REPORT ON FORM 10-K
ITEM 8, ITEM 15 (a) (1) and (2)
INDEX TO FINANCIAL STATEMENTS
AND
FINANCIAL STATEMENT SCHEDULES
Form 10-KPage
KIMCO REALTY CORPORATION AND SUBSIDIARIES Report of Independent Registered Public Accounting Firm 47
Consolidated Financial Statements and Financial Statement Schedules:
Consolidated Balance Sheets as of December 31, 2017 and 2016 48
Consolidated Statements of Income for the years ended December 31, 2017, 2016 and 2015 49
Consolidated Statements of Comprehensive Income for the years ended December 31, 2017, 2016 and 2015 50
Consolidated Statements of Changes in Equity for the years ended December 31, 2017, 2016 and 2015 51 Consolidated Statements of Cash Flows for the years ended December 31, 2017, 2016 and 2015 52
Notes to Consolidated Financial Statements 53 Financial Statement Schedules:
II. Valuation and Qualifying Accounts years ended December 31, 2017, 2016 and 2015 95III. Real Estate and Accumulated Depreciation as of December 31, 2017 96IV. Mortgage Loans on Real Estate as of December 31, 2017 98
46

Table of Contents
Report of Independent Registered Public Accounting Firm
To the Board of Directors and Stockholdersof Kimco Realty Corporation: Opinions on the Financial Statements and Internal Control over Financial Reporting We have audited the consolidated financial statements, including the related notes, as listed in the index appearing under Item 15(a)(1), and the financial statementschedules listed in the index appearing under Item 15(a)(2), of Kimco Realty Corporation and its subsidiaries (collectively referred to as the “consolidated financialstatements”). We also have audited the Company's internal control over financial reporting as of December 31, 2017, based on criteria established in Internal Control -Integrated Framework (2013) issued by the Committee of Sponsoring Organizations of the Treadway Commission (COSO). In our opinion, the consolidated financial statements referred to above present fairly, in all material respects, the financial position of the Company as of December 31,2017 and 2016, and the results of their operations and their cash flows for each of the three years in the period ended December 31, 2017 in conformity with accountingprinciples generally accepted in the United States of America. Also in our opinion, the Company maintained, in all material respects, effective internal control overfinancial reporting as of December 31, 2017 based on criteria established in Internal Control - Integrated Framework (2013) issued by the COSO. Basis for Opinions The Company's management is responsible for these consolidated financial statements, for maintaining effective internal control over financial reporting, and for itsassessment of the effectiveness of internal control over financial reporting, included in Management's Report on Internal Control over Financial Reporting appearingunder Item 9A. Our responsibility is to express opinions on the Company’s consolidated financial statements and on the Company's internal control over financialreporting based on our audits. We are a public accounting firm registered with the Public Company Accounting Oversight Board (United States) ("PCAOB") and arerequired to be independent with respect to the Company in accordance with the U.S. federal securities laws and the applicable rules and regulations of the Securitiesand Exchange Commission and the PCAOB. We conducted our audits in accordance with the standards of the PCAOB. Those standards require that we plan and perform the audits to obtain reasonableassurance about whether the consolidated financial statements are free of material misstatement, whether due to error or fraud, and whether effective internal controlover financial reporting was maintained in all material respects. Our audits of the consolidated financial statements included performing procedures to assess the risks of material misstatement of the consolidated financialstatements, whether due to error or fraud, and performing procedures that respond to those risks. Such procedures included examining, on a test basis, evidenceregarding the amounts and disclosures in the consolidated financial statements. Our audits also included evaluating the accounting principles used and significantestimates made by management, as well as evaluating the overall presentation of the consolidated financial statements. Our audit of internal control over financialreporting included obtaining an understanding of internal control over financial reporting, assessing the risk that a material weakness exists, and testing andevaluating the design and operating effectiveness of internal control based on the assessed risk. Our audits also included performing such other procedures as weconsidered necessary in the circumstances. We believe that our audits provide a reasonable basis for our opinions. Definition and Limitations of Internal Control over Financial Reporting A company’s internal control over financial reporting is a process designed to provide reasonable assurance regarding the reliability of financial reporting and thepreparation of financial statements for external purposes in accordance with generally accepted accounting principles. A company’s internal control over financialreporting includes those policies and procedures that (i) pertain to the maintenance of records that, in reasonable detail, accurately and fairly reflect the transactionsand dispositions of the assets of the company; (ii) provide reasonable assurance that transactions are recorded as necessary to permit preparation of financialstatements in accordance with generally accepted accounting principles, and that receipts and expenditures of the company are being made only in accordance withauthorizations of management and directors of the company; and (iii) provide reasonable assurance regarding prevention or timely detection of unauthorizedacquisition, use, or disposition of the company’s assets that could have a material effect on the financial statements. Because of its inherent limitations, internal control over financial reporting may not prevent or detect misstatements. Also, projections of any evaluation ofeffectiveness to future periods are subject to the risk that controls may become inadequate because of changes in conditions, or that the degree of compliance withthe policies or procedures may deteriorate. /s/PricewaterhouseCoopers LLPNew York, New YorkFebruary 23, 2018 We have served as the Company’s auditor since at least 1992. We have not determined the specific year we began serving as auditor of the Company.
47

Table of Contents
KIMCO REALTY CORPORATION AND SUBSIDIARIESCONSOLIDATED BALANCE SHEETS
(in thousands, except share information)
December 31, 2017 December 31, 2016 Assets:
Real Estate Rental property
Land $ 3,019,284 $ 2,845,186 Building and improvements 9,231,644 8,827,861
12,250,928 11,673,047 Less: accumulated depreciation and amortization (2,433,053) (2,278,292)
9,817,875 9,394,755 Real estate under development 402,518 335,028
Real estate, net 10,220,393 9,729,783
Investments in and advances in real estate joint ventures 483,861 504,209 Other real estate investments 217,584 209,146 Mortgages and other financing receivables 21,838 23,197 Cash and cash equivalents 238,513 142,486 Marketable securities 13,265 8,101 Accounts and notes receivable, net 189,757 181,823 Deferred charges and prepaid expenses 155,472 147,694 Other assets 223,043 284,161
Total assets (1) $ 11,763,726 $ 11,230,600 Liabilities:
Notes payable, net $ 4,596,140 $ 3,927,251 Mortgages payable, net 882,787 1,139,117 Accounts payable and accrued expenses 185,702 145,751 Dividends payable 128,892 124,517 Other liabilities 431,915 404,137
Total liabilities (2) 6,225,436 5,740,773 Redeemable noncontrolling interests 16,143 86,953 Commitments and Contingencies Stockholders' equity:
Preferred stock, $1.00 par value, authorized 5,996,240 and 6,029,100 shares, respectively, 41,200 and 32,000shares issued and outstanding (in series), respectively; Aggregate liquidation preference $1,030,000 and$800,000, respectively 41 32
Common stock, $.01 par value, authorized 750,000,000 shares issued and outstanding 425,646,380 and425,034,113 shares, respectively 4,256 4,250
Paid-in capital 6,152,764 5,922,958 Cumulative distributions in excess of net income (761,337) (676,867)Accumulated other comprehensive (loss)/income (1,480) 5,766
Total stockholders' equity 5,394,244 5,256,139 Noncontrolling interests 127,903 146,735
Total equity 5,522,147 5,402,874 Total liabilities and equity $ 11,763,726 $ 11,230,600 (1) Includes restricted assets of consolidated variable interest entities (“VIEs”) at December 31, 2017 and December 31, 2016 of $644,990 and $333,705, respectively.
See Footnote 9 of the Notes to Consolidated Financial Statements.(2) Includes non-recourse liabilities of consolidated VIEs at December 31, 2017 and December 31, 2016 of $417,688 and $176,216, respectively. See Footnote 9 of
the Notes to Consolidated Financial Statements.
The accompanying notes are an integral part of these consolidated financial statements.
48

Table of Contents
KIMCO REALTY CORPORATION AND SUBSIDIARIESCONSOLIDATED STATEMENTS OF INCOME
(in thousands, except per share data) Year Ended December 31, 2017 2016 2015 Revenues
Revenues from rental properties $ 1,183,785 $ 1,152,401 $ 1,144,474 Management and other fee income 17,049 18,391 22,295
Total revenues 1,200,834 1,170,792 1,166,769 Operating expenses
Rent 11,145 10,993 12,347 Real estate taxes 157,196 146,615 147,150 Operating and maintenance 142,787 140,910 144,980 General and administrative 118,455 117,302 122,735 Provision for doubtful accounts 5,630 5,563 6,075 Impairment charges 67,331 93,266 45,383 Depreciation and amortization 360,811 355,320 344,527
Total operating expenses 863,355 869,969 823,197 Operating income 337,479 300,823 343,572 Other income/(expense)
Interest, dividends and other investment income 2,809 1,478 39,061 Other (expense)/income, net (250) 3,947 5,174 Interest expense (191,956) (192,549) (218,891)Early extinguishment of debt charges (1,753) (45,674) -
Income from continuing operations before income taxes, net, equity in income of joint ventures, net, gain
on change in control of interests and equity in income from other real estate investments, net 146,329 68,025 168,916
Benefit/(provision) for income taxes, net 880 (72,545) (60,230)Equity in income of joint ventures, net 60,763 218,714 480,395 Gain on change in control of interests 71,160 57,386 149,234 Equity in income of other real estate investments, net 67,001 27,773 36,090
Income from continuing operations 346,133 299,353 774,405
Discontinued operations
Loss from discontinued operating properties, net of tax - - (15)Impairment/loss on operating properties, net of tax - - (60)Loss from discontinued operations - - (75)
Gain on sale of operating properties, net, net of tax 93,538 86,785 125,813
Net income 439,671 386,138 900,143
Net income attributable to noncontrolling interests (13,596) (7,288) (6,028)
Net income attributable to the Company 426,075 378,850 894,115
Preferred stock redemption charge (7,014) - (5,816)Preferred dividends (46,600) (46,220) (57,084)
Net income available to the Company's common shareholders $ 372,461 $ 332,630 $ 831,215
Per common share:
Income from continuing operations: -Basic $ 0.87 $ 0.79 $ 2.01 -Diluted $ 0.87 $ 0.79 $ 2.00
Net income available to the Company: -Basic $ 0.87 $ 0.79 $ 2.01 -Diluted $ 0.87 $ 0.79 $ 2.00
Weighted average shares:
-Basic 423,614 418,402 411,319 -Diluted 424,019 419,709 412,851
Amounts available to the Company's common shareholders:
Income from continuing operations $ 372,461 $ 332,630 $ 831,290 Loss from discontinued operations - - (75)Net income $ 372,461 $ 332,630 $ 831,215
The accompanying notes are an integral part of these consolidated financial statements.
49

Table of Contents
KIMCO REALTY CORPORATION AND SUBSIDIARIESCONSOLIDATED STATEMENTS OF COMPREHENSIVE INCOME
(in thousands)
Year Ended December 31, 2017 2016 2015 Net income $ 439,671 $ 386,138 $ 900,143 Other comprehensive income:
Change in unrealized gains/losses related to available-for-sale securities (1,542) 8 (45,799)Change in unrealized losses on interest rate swaps 631 451 (22)Change in foreign currency translation adjustments (6,335) (281) 6,287
Other comprehensive (loss)/income (7,246) 178 (39,534) Comprehensive income 432,425 386,316 860,609 Comprehensive income attributable to noncontrolling interests (13,596) (7,288) (6,028) Comprehensive income attributable to the Company $ 418,829 $ 379,028 $ 854,581
The accompanying notes are an integral part of these consolidated financial statements.
50
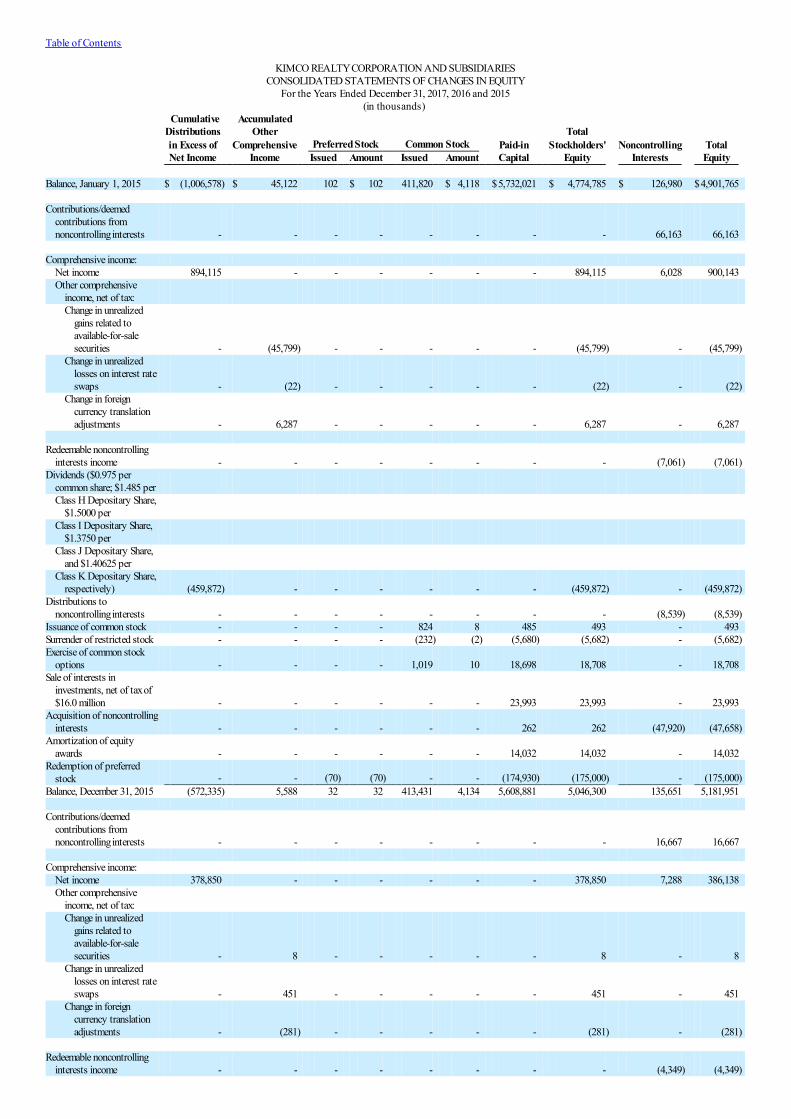
Table of Contents
KIMCO REALTY CORPORATION AND SUBSIDIARIESCONSOLIDATED STATEMENTS OF CHANGES IN EQUITY
For the Years Ended December 31, 2017, 2016 and 2015(in thousands)
Cumulative Accumulated Distributions Other Total in Excess of Comprehensive Preferred Stock Common Stock Paid-in Stockholders' Noncontrolling Total Net Income Income Issued Amount Issued Amount Capital Equity Interests Equity Balance, January 1, 2015 $ (1,006,578) $ 45,122 102 $ 102 411,820 $ 4,118 $5,732,021 $ 4,774,785 $ 126,980 $4,901,765 Contributions/deemed
contributions fromnoncontrolling interests - - - - - - - - 66,163 66,163
Comprehensive income:
Net income 894,115 - - - - - - 894,115 6,028 900,143 Other comprehensive
income, net of tax: Change in unrealized
gains related toavailable-for-salesecurities - (45,799) - - - - - (45,799) - (45,799)
Change in unrealizedlosses on interest rateswaps - (22) - - - - - (22) - (22)
Change in foreigncurrency translationadjustments - 6,287 - - - - - 6,287 - 6,287
Redeemable noncontrolling
interests income - - - - - - - - (7,061) (7,061)Dividends ($0.975 per
common share; $1.485 per Class H Depositary Share,
$1.5000 per Class I Depositary Share,
$1.3750 per Class J Depositary Share,
and $1.40625 per Class K Depositary Share,
respectively) (459,872) - - - - - - (459,872) - (459,872)Distributions to
noncontrolling interests - - - - - - - - (8,539) (8,539)Issuance of common stock - - - - 824 8 485 493 - 493 Surrender of restricted stock - - - - (232) (2) (5,680) (5,682) - (5,682)Exercise of common stock
options - - - - 1,019 10 18,698 18,708 - 18,708 Sale of interests in
investments, net of tax of$16.0 million - - - - - - 23,993 23,993 - 23,993
Acquisition of noncontrollinginterests - - - - - - 262 262 (47,920) (47,658)
Amortization of equityawards - - - - - - 14,032 14,032 - 14,032
Redemption of preferredstock - - (70) (70) - - (174,930) (175,000) - (175,000)
Balance, December 31, 2015 (572,335) 5,588 32 32 413,431 4,134 5,608,881 5,046,300 135,651 5,181,951 Contributions/deemed
contributions fromnoncontrolling interests - - - - - - - - 16,667 16,667
Comprehensive income:
Net income 378,850 - - - - - - 378,850 7,288 386,138 Other comprehensive
income, net of tax: Change in unrealized
gains related toavailable-for-salesecurities - 8 - - - - - 8 - 8
Change in unrealizedlosses on interest rateswaps - 451 - - - - - 451 - 451
Change in foreigncurrency translationadjustments - (281) - - - - - (281) - (281)
Redeemable noncontrolling
interests income - - - - - - - - (4,349) (4,349)

Dividends ($1.035 percommon share; $1.5000per Class I Depositary Share,
$1.3750 per Class J Depositary Share,
and $1.40625 per Class K Depositary Share,
respectively) (483,382) - - - - - - (483,382) - (483,382)Distributions to
noncontrolling interests - - - - - - - - (8,522) (8,522)Issuance of common stock - - - - 10,711 107 286,314 286,421 - 286,421 Surrender of restricted stock - - - - (276) (3) (7,005) (7,008) - (7,008)Exercise of common stock
options - - - - 1,168 12 21,048 21,060 - 21,060 Amortization of equity
awards - - - - - - 13,720 13,720 - 13,720 Balance, December 31, 2016 (676,867) 5,766 32 32 425,034 4,250 5,922,958 5,256,139 146,735 5,402,874 Contributions/deemed
contributions fromnoncontrolling interests - - - - - - - - 48,877 48,877
Comprehensive income:
Net income 426,075 - - - - - - 426,075 13,596 439,671 Other comprehensive
income, net of tax: Change in unrealized
gains/losses related toavailable-for-salesecurities - (1,542) - - - - - (1,542) - (1,542)
Change in unrealizedlosses on interest rateswaps - 631 - - - - - 631 - 631
Change in foreigncurrency translationadjustments - (6,335) - - - - - (6,335) - (6,335)
Redeemable noncontrolling
interests income - - - - - - - - (1,297) (1,297)Dividends ($1.09 per
common share; $1.5000per Class I Depositary Share,
$0.9625 per Class I Depositary Share
Redeemed, $1.3750 per Class J Depositary Share,
$1.40625 per Class K Depositary Share,
$0.48047 per Class L Depositary Share,
and $0.0401 per Class M Depositary Share,
respectively) (510,545) - - - - - - (510,545) - (510,545)Distributions to
noncontrolling interests - - - - - - - - (13,995) (13,995)Issuance of common stock - - - - 776 8 (8) - - - Issuance of preferred stock - - 18 18 - - 439,401 439,419 - 439,419 Surrender of restricted stock - - - - (248) (2) (5,697) (5,699) - (5,699)Exercise of common stock
options - - - - 84 - 1,526 1,526 - 1,526 Amortization of equity
awards - - - - - - 18,983 18,983 - 18,983 Redemption of preferred
stock - - (9) (9) - - (224,991) (225,000) - (225,000)Redemption/conversion of
noncontrolling interests - - - - - - 592 592 (66,013) (65,421)Balance, December 31, 2017 $ (761,337) $ (1,480) 41 $ 41 425,646 $ 4,256 $6,152,764 $ 5,394,244 $ 127,903 $5,522,147
The accompanying notes are an integral part of these consolidated financial statements.51

Table of Contents
KIMCO REALTY CORPORATION AND SUBSIDIARIESCONSOLIDATED STATEMENTS OF CASH FLOWS
(in thousands)
Year Ended December 31, 2017 2016 2015 Cash flow from operating activities:
Net income $ 439,671 $ 386,138 $ 900,143 Adjustments to reconcile net income to net cash provided by operating activities:
Depreciation and amortization 360,811 355,320 344,527 Impairment charges 67,331 93,266 45,464 Deferred taxes 807 55,068 4,498 Early extinguishment of debt charges 1,753 45,674 - Equity award expense 21,563 19,071 18,465 Gain on sale of operating properties, net, net of tax (93,538) (92,823) (132,907)Gain on sale of marketable securities - - (39,852)Gain on change in control of interests (71,160) (57,386) (149,234)Equity in income of joint ventures, net (60,763) (218,714) (480,395)Equity in income from other real estate investments, net (67,001) (27,773) (36,090)Distributions from joint ventures and other real estate investments 58,189 90,589 126,263 Change in accounts and notes receivable (7,934) (6,571) (2,867)Change in accounts payable and accrued expenses 4,417 (7,886) 164 Change in Canadian withholding tax receivable 12,996 23,571 (37,040)Change in other operating assets and liabilities (52,961) (65,448) (67,438)
Net cash flow provided by operating activities 614,181 592,096 493,701 Cash flow from investing activities:
Acquisition of operating real estate and other related net assets (153,854) (203,190) (661,423)Improvements to operating real estate (206,800) (143,489) (166,670)Acquisition of real estate under development (10,010) (51,588) (16,355)Improvements to real estate under development (160,257) (72,759) (16,861)Investment in marketable securities (9,822) (2,466) (257)Proceeds from sale/repayments of marketable securities 3,146 1,937 76,170 Investments in and advances to real estate joint ventures (35,291) (86,453) (91,609)Reimbursements of investments and advances to real estate joint ventures 55,839 71,656 94,053 Distributions from liquidation of real estate joint ventures - 138,475 373,833 Return of investment from liquidation of real estate joint ventures - 191,902 88,672 Investment in other real estate investments (666) (233) (641)Reimbursements of investments and advances to other real estate investments 40,709 11,019 40,556 Collection of mortgage loans receivable 1,405 921 55,145 Investment in other investments - - (190,278)Reimbursements of other investments - 500 - Proceeds from sale of operating properties 181,321 304,600 437,030 Proceeds from sale of development properties - 4,551 -
Net cash flow (used for)/provided by investing activities (294,280) 165,383 21,365 Cash flow from financing activities:
Principal payments on debt, excluding normal amortization of rental property debt (687,117) (700,853) (555,627)Principal payments on rental property debt (15,186) (19,039) (28,632)Proceeds from mortgage loan financings 206,000 - - (Repayments)/proceeds under the unsecured revolving credit facility, net (17,143) 26,445 (100,000)Proceeds from issuance of unsecured term loan/notes 1,250,000 1,400,000 1,500,030 Repayments under unsecured term loan/notes (550,000) (1,261,850) (750,000)Financing origination costs (23,305) (25,679) (19,017)Payment of early extinguishment of debt charges (2,631) (45,674) - Change in tenants' security deposits 911 1,367 2,116 Contributions from noncontrolling interests 1,422 - 106,154 Conversion/distribution of noncontrolling interests (96,599) (12,594) (55,753)Dividends paid (506,172) (474,045) (455,833)Proceeds from issuance of stock, net 440,946 307,395 18,708 Redemption of preferred stock (225,000) - (175,000)
Net cash flow used for financing activities (223,874) (804,527) (512,854) Net change in cash and cash equivalents 96,027 (47,048) 2,212 Cash and cash equivalents, beginning of year 142,486 189,534 187,322
Cash and cash equivalents, end of year $ 238,513 $ 142,486 $ 189,534 Interest paid during the year (net of capitalized interest of $14,480, $9,247 and $5,618, respectively) $ 192,155 $ 252,482 $ 232,950 Income taxes (received)/paid during the year (net of refunds received of $16,118, $113,934 and $0,
respectively) $ (14,456) $ 6,090 $ 100,366
The accompanying notes are an integral part of these consolidated financial statements.52

Table of Contents
KIMCO REALTY CORPORATION AND SUBSIDIARIES
NOTES TO CONSOLIDATED FINANCIAL STATEMENTS
Amounts relating to the number of buildings, square footage, tenant and occupancy data, joint venture debt average interest rates and terms and estimated projectcosts are unaudited.
1. Summary of Significant Accounting Policies:
Business and Organization Kimco Realty Corporation and its subsidiaries (the "Company" or "Kimco"), operate as a Real Estate Investment Trust (“REIT”) and are engaged principally inthe ownership, management, development and operation of open-air shopping centers, which are anchored generally by grocery stores, discount departmentstores or drugstores. Additionally, the Company provides complementary services that capitalize on the Company’s established retail real estate expertise. TheCompany evaluates performance on a property specific or transactional basis and does not distinguish its principal business or group its operations on ageographical basis for purposes of measuring performance. Accordingly, the Company believes it has a single reportable segment for disclosure purposes inaccordance with accounting principles generally accepted in the United States of America ("GAAP"). The Company has elected to be taxed as a REIT for federal income tax purposes under the Internal Revenue Code, as amended (the "Code"). The Company isorganized and operates in a manner that enables it to qualify as a REIT under the Code. Basis of Presentation The accompanying Consolidated Financial Statements include the accounts of the Company. The Company’s subsidiaries include subsidiaries which are wholly-owned or which the Company has a controlling interest, including where the Company has been determined to be a primary beneficiary of a variable interestentity (“VIE”) in accordance with the Consolidation guidance of the Financial Accounting Standards Board (“FASB”) Accounting Standards Codification(“ASC”). All inter-company balances and transactions have been eliminated in consolidation. Use of Estimates GAAP requires the Company's management to make estimates and assumptions that affect the reported amounts of assets and liabilities, the disclosure ofcontingent assets and liabilities and the reported amounts of revenues and expenses during a reporting period. The most significant assumptions and estimatesrelate to the valuation of real estate and related intangible assets and liabilities, equity method investments, other investments, including the assessment ofimpairments, as well as, depreciable lives, revenue recognition, the collectability of trade accounts receivable, realizability of deferred tax assets and theassessment of uncertain tax positions. Application of these assumptions requires the exercise of judgment as to future uncertainties, and, as a result, actualresults could differ from these estimates. Subsequent Events The Company has evaluated subsequent events and transactions for potential recognition or disclosure in its consolidated financial statements (see Footnotes 8and 16 of the Notes to Consolidated Financial Statements). Real Estate Real estate assets are stated at cost, less accumulated depreciation and amortization. Upon acquisition of real estate operating properties, the Company estimatesthe fair value of acquired tangible assets (consisting of land, building, building improvements and tenant improvements) and identified intangible assets andliabilities (consisting of above-market and below-market leases, in-place leases and tenant relationships, where applicable), assumed debt and redeemable unitsissued at the date of acquisition, based on evaluation of information and estimates available at that date. Fair value is determined based on a market approach,which contemplates the price that would be received to sell an asset or paid to transfer a liability in an orderly transaction between market participants at themeasurement date. Effective January 1, 2017, the Company early adopted Accounting Standard Update (“ASU”) 2017-01, Business Combinations (Topic 805):Clarifying the Definition of a Business, including its interim periods within the year, and applied the guidance to its asset acquisitions of operating properties,including the capitalization of acquisition costs, which was previously expensed prior to the adoption of this standard.
53
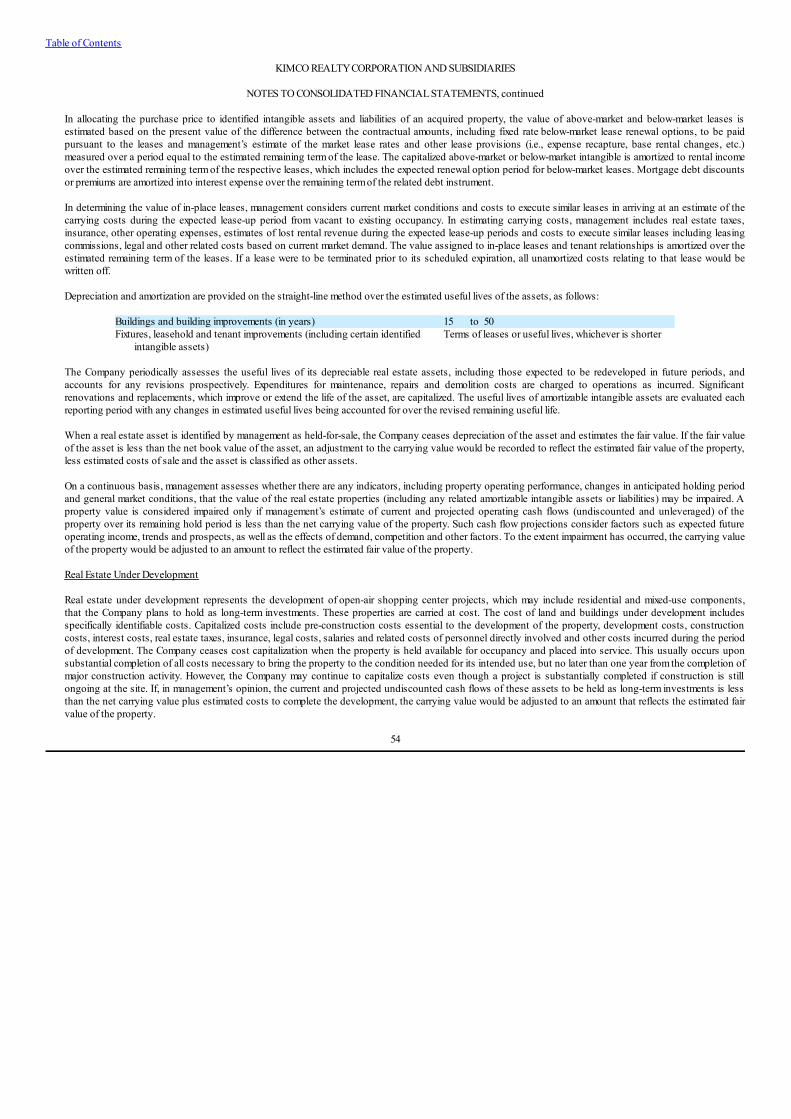
Table of Contents
KIMCO REALTY CORPORATION AND SUBSIDIARIES
NOTES TO CONSOLIDATED FINANCIAL STATEMENTS, continued
In allocating the purchase price to identified intangible assets and liabilities of an acquired property, the value of above-market and below-market leases isestimated based on the present value of the difference between the contractual amounts, including fixed rate below-market lease renewal options, to be paidpursuant to the leases and management’s estimate of the market lease rates and other lease provisions (i.e., expense recapture, base rental changes, etc.)measured over a period equal to the estimated remaining term of the lease. The capitalized above-market or below-market intangible is amortized to rental incomeover the estimated remaining term of the respective leases, which includes the expected renewal option period for below-market leases. Mortgage debt discountsor premiums are amortized into interest expense over the remaining term of the related debt instrument. In determining the value of in-place leases, management considers current market conditions and costs to execute similar leases in arriving at an estimate of thecarrying costs during the expected lease-up period from vacant to existing occupancy. In estimating carrying costs, management includes real estate taxes,insurance, other operating expenses, estimates of lost rental revenue during the expected lease-up periods and costs to execute similar leases including leasingcommissions, legal and other related costs based on current market demand. The value assigned to in-place leases and tenant relationships is amortized over theestimated remaining term of the leases. If a lease were to be terminated prior to its scheduled expiration, all unamortized costs relating to that lease would bewritten off. Depreciation and amortization are provided on the straight-line method over the estimated useful lives of the assets, as follows:
Buildings and building improvements (in years) 15 to 50Fixtures, leasehold and tenant improvements (including certain identified
intangible assets) Terms of leases or useful lives, whichever is shorter
The Company periodically assesses the useful lives of its depreciable real estate assets, including those expected to be redeveloped in future periods, andaccounts for any revisions prospectively. Expenditures for maintenance, repairs and demolition costs are charged to operations as incurred. Significantrenovations and replacements, which improve or extend the life of the asset, are capitalized. The useful lives of amortizable intangible assets are evaluated eachreporting period with any changes in estimated useful lives being accounted for over the revised remaining useful life. When a real estate asset is identified by management as held-for-sale, the Company ceases depreciation of the asset and estimates the fair value. If the fair valueof the asset is less than the net book value of the asset, an adjustment to the carrying value would be recorded to reflect the estimated fair value of the property,less estimated costs of sale and the asset is classified as other assets. On a continuous basis, management assesses whether there are any indicators, including property operating performance, changes in anticipated holding periodand general market conditions, that the value of the real estate properties (including any related amortizable intangible assets or liabilities) may be impaired. Aproperty value is considered impaired only if management’s estimate of current and projected operating cash flows (undiscounted and unleveraged) of theproperty over its remaining hold period is less than the net carrying value of the property. Such cash flow projections consider factors such as expected futureoperating income, trends and prospects, as well as the effects of demand, competition and other factors. To the extent impairment has occurred, the carrying valueof the property would be adjusted to an amount to reflect the estimated fair value of the property. Real Estate Under Development Real estate under development represents the development of open-air shopping center projects, which may include residential and mixed-use components,that the Company plans to hold as long-term investments. These properties are carried at cost. The cost of land and buildings under development includesspecifically identifiable costs. Capitalized costs include pre-construction costs essential to the development of the property, development costs, constructioncosts, interest costs, real estate taxes, insurance, legal costs, salaries and related costs of personnel directly involved and other costs incurred during the periodof development. The Company ceases cost capitalization when the property is held available for occupancy and placed into service. This usually occurs uponsubstantial completion of all costs necessary to bring the property to the condition needed for its intended use, but no later than one year from the completion ofmajor construction activity. However, the Company may continue to capitalize costs even though a project is substantially completed if construction is stillongoing at the site. If, in management’s opinion, the current and projected undiscounted cash flows of these assets to be held as long-term investments is lessthan the net carrying value plus estimated costs to complete the development, the carrying value would be adjusted to an amount that reflects the estimated fairvalue of the property.
54

Table of Contents
KIMCO REALTY CORPORATION AND SUBSIDIARIES
NOTES TO CONSOLIDATED FINANCIAL STATEMENTS, continued
Investments in Unconsolidated Joint Ventures The Company accounts for its investments in unconsolidated joint ventures under the equity method of accounting as the Company exercises significantinfluence, but does not control these entities. These investments are recorded initially at cost and subsequently adjusted for cash contributions, distributionsand our share of earnings and losses. Earnings or losses for each investment are recognized in accordance with each respective investment agreement and whereapplicable, based upon an allocation of the investment’s net assets at book value as if the investment was hypothetically liquidated at the end of each reportingperiod. The Company’s joint ventures and other real estate investments primarily consist of co-investments with institutional and other joint venture partners in open-airshopping center properties, consistent with its core business. These joint ventures typically obtain non-recourse third-party financing on their propertyinvestments, thus contractually limiting the Company’s exposure to losses primarily to the amount of its equity investment; and due to the lender’s exposure tolosses, a lender typically will require a minimum level of equity in order to mitigate its risk. The Company, on a limited selective basis, has obtained unsecuredfinancing for certain joint ventures. These unsecured financings may be guaranteed by the Company with guarantees from the joint venture partners for theirproportionate amounts of any guaranty payment the Company is obligated to make. As of December 31, 2017, the Company did not guaranty any unsecured jointventure debt. To recognize the character of distributions from equity investees within its consolidated statements of cash flows, all distributions received are presumed to bereturns on investment and classified as cash inflows from operating activities unless the Company’s cumulative distributions received less distributions receivedin prior periods that were determined to be returns of investment exceed its cumulative equity in earnings recognized by the investor (as adjusted for amortizationof basis differences). When such an excess occurs, the current-period distribution up to this excess is considered a return of investment and classified as cashinflows from investing. On a continuous basis, management assesses whether there are any indicators, including the underlying investment property operating performance and generalmarket conditions, that the value of the Company’s investments in unconsolidated joint ventures may be impaired. An investment’s value is impaired only ifmanagement’s estimate of the fair value of the investment is less than the carrying value of the investment and such difference is deemed to be other-than-temporary. To the extent impairment has occurred, the loss shall be measured as the excess of the carrying amount of the investment over the estimated fair valueof the investment. The Company’s estimated fair values are based upon a discounted cash flow model for each joint venture that includes all estimated cash inflows and outflowsover a specified holding period. Capitalization rates, discount rates and credit spreads utilized in these models are based upon rates that the Company believes tobe within a reasonable range of current market rates. Other Real Estate Investments Other real estate investments primarily consist of preferred equity investments for which the Company provides capital to owners and developers of real estate.The Company typically accounts for its preferred equity investments on the equity method of accounting, whereby earnings for each investment are recognizedin accordance with each respective investment agreement and based upon an allocation of the investment’s net assets at book value as if the investment washypothetically liquidated at the end of each reporting period. On a continuous basis, management assesses whether there are any indicators, including the underlying investment property operating performance and generalmarket conditions, that the value of the Company’s Other real estate investments may be impaired. An investment’s value is impaired only if management’sestimate of the fair value of the investment is less than the carrying value of the investment and such difference is deemed to be other-than-temporary. To theextent impairment has occurred, the loss shall be measured as the excess of the carrying amount of the investment over the estimated fair value of the investment.
55

Table of Contents
KIMCO REALTY CORPORATION AND SUBSIDIARIES
NOTES TO CONSOLIDATED FINANCIAL STATEMENTS, continued
The Company’s estimated fair values are based upon a discounted cash flow model for each investment that includes all estimated cash inflows and outflowsover a specified holding period and, where applicable, any estimated debt premiums. Capitalization rates, discount rates and credit spreads utilized in thesemodels are based upon rates that the Company believes to be within a reasonable range of current market rates. Mortgages and Other Financing Receivables Mortgages and other financing receivables consist of loans acquired and loans originated by the Company. Borrowers of these loans are primarily experiencedowners, operators or developers of commercial real estate. The Company’s loans are primarily mortgage loans that are collateralized by real estate. Mortgages andother financing receivables are recorded at stated principal amounts, net of any discount or premium or deferred loan origination costs or fees. The relateddiscounts or premiums on mortgages and other loans purchased are amortized or accreted over the life of the related loan receivable. The Company defers certainloan origination and commitment fees, net of certain origination costs and amortizes them as an adjustment of the loan’s yield over the term of the related loan. Ona quarterly basis, the Company reviews credit quality indicators such as (i) payment status to identify performing versus non-performing loans, (ii) changesaffecting the underlying real estate collateral and (iii) national and regional economic factors. Interest income on performing loans is accrued as earned. A non-performing loan is placed on non-accrual status when it is probable that the borrower may beunable to meet interest payments as they become due. Generally, loans 90 days or more past due are placed on non-accrual status unless there is sufficientcollateral to assure collectability of principal and interest. Upon the designation of non-accrual status, all unpaid accrued interest is reserved and charged againstcurrent income. Interest income on non-performing loans is generally recognized on a cash basis. Recognition of interest income on non-performing loans on anaccrual basis is resumed when it is probable that the Company will be able to collect amounts due according to the contractual terms. The Company has determined that it has one portfolio segment, primarily represented by loans collateralized by real estate, whereby it determines, as needed,reserves for loan losses on an asset-specific basis. The reserve for loan losses reflects management's estimate of loan losses as of the balance sheet date. Thereserve is increased through loan loss expense and is decreased by charge-offs when losses are confirmed through the receipt of assets such as cash or viaownership control of the underlying collateral in full satisfaction of the loan upon foreclosure or when significant collection efforts have ceased. The Company considers a loan to be impaired when, based upon current information and events, it is probable that the Company will be unable to collect allamounts due under the existing contractual terms. A reserve allowance is established for an impaired loan when the estimated fair value of the underlyingcollateral (for collateralized loans) or the present value of expected future cash flows is lower than the carrying value of the loan. An internal valuation isperformed generally using the income approach to estimate the fair value of the collateral at the time a loan is determined to be impaired. The model is updated ifcircumstances indicate a significant change in value has occurred. The Company does not provide for an additional allowance for loan losses based on thegrouping of loans as the Company believes the characteristics of the loans are not sufficiently similar to allow an evaluation of these loans as a group for apossible loan loss allowance. As such, all of the Company’s loans are evaluated individually for impairment purposes.
Cash and Cash Equivalents Cash and cash equivalents include demand deposits in banks, commercial paper and certificates of deposit with original maturities of three months or less. Cashand cash equivalent balances may, at a limited number of banks and financial institutions, exceed insurable amounts. The Company believes it mitigates risk byinvesting in or through major financial institutions and primarily in funds that are currently U.S. federal government insured up to applicable account limits.Recoverability of investments is dependent upon the performance of the issuers.
Marketable Securities The Company classifies its marketable equity securities as available-for-sale in accordance with the FASB’s Investments-Debt and Equity Securities guidance.These securities are carried at fair market value with unrealized gains and losses reported in stockholders’ equity as a component of Accumulated othercomprehensive income ("AOCI"). Effective January 1, 2018, in accordance with the adoption of ASU 2016-01, Financial Instruments —Overall (Subtopic 825-10):Recognition and Measurement of Financial Assets and Financial Liabilities, the Company will recognize changes in fair value of equity investments with readilydeterminable fair values in net income. Gains or losses on securities sold are based on the specific identification method and are recognized in Interest, dividendsand other investment income on the Company’s Consolidated Statements of Income.
56

Table of Contents
KIMCO REALTY CORPORATION AND SUBSIDIARIES
NOTES TO CONSOLIDATED FINANCIAL STATEMENTS, continued
All debt securities are generally classified as held-to-maturity because the Company has the positive intent and ability to hold the securities to maturity. It is morelikely than not that the Company will not be required to sell the debt security before its anticipated recovery and the Company expects to recover the security’sentire amortized cost basis even if the entity does not intend to sell. Held-to-maturity securities are stated at amortized cost, adjusted for amortization of premiumsand accretion of discounts to maturity. Debt securities which contain conversion features generally are classified as available-for-sale. On a continuous basis, management assesses whether there are any indicators that the value of the Company’s marketable securities may be impaired, whichincludes reviewing the underlying cause of any decline in value and the estimated recovery period, as well as the severity and duration of the decline. In theCompany’s evaluation, the Company considers its ability and intent to hold these investments for a reasonable period of time sufficient for the Company torecover its cost basis. A marketable security is impaired if the fair value of the security is less than the carrying value of the security and such difference isdeemed to be other-than-temporary. To the extent impairment has occurred, the loss shall be measured as the excess of the carrying amount of the security overthe estimated fair value in the security. Deferred Leasing Costs Costs incurred in obtaining tenant leases, included in deferred charges and prepaid expenses in the accompanying Consolidated Balance Sheets, are amortized ona straight-line basis, over the terms of the related leases, as applicable. Such capitalized costs include salaries, lease incentives and related costs of personneldirectly involved in successful leasing efforts. Deferred leasing costs are classified as operating activities on the Company’s Consolidated Statements of CashFlows. Software Development Costs Expenditures for major software purchases and software developed for internal use are capitalized and amortized on a straight-line basis generally over a three tofive-year period. The Company’s policy provides for the capitalization of external direct costs of materials and services associated with developing or obtaininginternal use computer software. In addition, the Company also capitalizes certain payroll and payroll-related costs for employees who are directly associated withinternal use computer software projects. The amount of payroll costs that can be capitalized with respect to these employees is limited to the time directly spenton such projects. Costs associated with preliminary project stage activities, training, maintenance and all other post-implementation stage activities are expensedas incurred. As of December 31, 2017 and 2016, the Company had unamortized software development costs of $6.2 million and $10.2 million, respectively, which isincluded in Other assets on the Company’s Consolidated Balance Sheets. The Company expensed $4.6 million, $8.0 million and $10.7 million in amortization ofsoftware development costs during the years ended December 31, 2017, 2016 and 2015, respectively. Deferred Financing Costs Costs incurred in obtaining long-term financing, included in Notes payable, net and Mortgages payable, net in the accompanying Consolidated Balance Sheets,are amortized on a straight-line basis, which approximates the effective interest method, over the terms of the related debt agreements, as applicable. Revenue, Gain Recognition and Accounts Receivable Base rental revenues from rental properties are recognized on a straight-line basis over the terms of the related leases. Certain of these leases also provide forpercentage rents based upon the level of sales achieved by the lessee. These percentage rents are recognized once the required sales level is achieved. Rentalincome may also include payments received in connection with lease termination agreements. In addition, leases typically provide for reimbursement to theCompany of common area maintenance costs, real estate taxes and other operating expenses. Operating expense reimbursements are recognized as earned. Management and other fee income consists of property management fees, leasing fees, property acquisition and disposition fees, development fees and assetmanagement fees. These fees arise from contractual agreements with third parties or with entities in which the Company has a noncontrolling interest.Management and other fee income, including acquisition and disposition fees, are recognized as earned under the respective agreements. Management and otherfee income related to partially owned entities are recognized to the extent attributable to the unaffiliated interest.
57
Table of Contents
KIMCO REALTY CORPORATION AND SUBSIDIARIES
NOTES TO CONSOLIDATED FINANCIAL STATEMENTS, continued
Gains and losses from the sale of depreciated operating property and real estate under development projects are recognized using the full accrual method inaccordance with the FASB’s real estate sales guidance, provided that various criteria relating to the terms of sale and subsequent involvement by the Companywith the properties are met. Gains and losses on transfers of operating properties result from the sale of a partial interest in properties to unconsolidated joint ventures and are recognizedusing the partial sale provisions of the FASB’s real estate sales guidance. The Company makes estimates of the uncollectable accounts receivables related to base rents, straight-line rent, expense reimbursements and other revenues.The Company analyzes accounts receivable and historical bad debt levels, customer credit worthiness and current economic trends when evaluating theadequacy of the allowance for doubtful accounts. In addition, tenants in bankruptcy are analyzed and estimates are made in connection with the expectedrecovery of pre-petition and post-petition claims. The Company’s reported net earnings are directly affected by management’s estimate of the collectability ofaccounts receivable. Accounts and notes receivable in the accompanying Consolidated Balance Sheets are net of estimated unrecoverable amounts of $9.2 million and $12.3 million ofbilled accounts receivable at December 31, 2017 and 2016, respectively. Additionally, Accounts and notes receivable in the accompanying Consolidated BalanceSheets are net of estimated unrecoverable amounts of $7.9 million and $11.9 million of straight-line rent receivable at December 31, 2017 and 2016, respectively. Income Taxes The Company elected status as a REIT for federal income tax purposes beginning in its taxable year January 1, 1992 and operates in a manner that enables theCompany to qualify and maintain its status as a REIT. Accordingly, the Company generally will not be subject to federal income tax, provided that distributions toits stockholders equal at least the amount of its REIT taxable income as defined under Section 856 through 860 of the Code. Most states, where the Companyholds investments in real estate, conform to the federal rules recognizing REITs. Additionally, in connection with the Tax Relief Extension Act of 1999 (the "RMA"), which became effective January 1, 2001, the Company is permitted toparticipate in activities which it was precluded from previously in order to maintain its qualification as a REIT, so long as these activities are conducted in entitieswhich elect to be treated as taxable REIT subsidiaries (“TRS”) under the Code, subject to certain limitations. Certain subsidiaries of the Company have made ajoint election with the Company to be treated as TRSs. A TRS is subject to federal and state income taxes on its income, and the Company includes a provisionfor taxes in its consolidated financial statements. As such, the Company, through its wholly-owned TRS, has been engaged in various retail real estate relatedopportunities including retail real estate management and disposition services which primarily focuses on leasing and disposition strategies of retail real estatecontrolled by both healthy and distressed and/or bankrupt retailers. The Company may consider other investments through its TRS should suitable opportunitiesarise. The Company is subject to and also includes in its tax provision non-U.S. income taxes on certain investments located in jurisdictions outside the U.S.These investments are held by the Company at the REIT level and not in the Company’s taxable REIT subsidiaries. Accordingly, the Company does not expect aU.S. income tax impact associated with the repatriation of undistributed earnings from the Company’s foreign subsidiaries. Income taxes are accounted for under the asset and liability method. Deferred tax assets and liabilities are recognized for the estimated future tax consequencesattributable to differences between the financial statement carrying amounts of existing assets and liabilities and their respective tax bases and operating loss andtax credit carry-forwards. Deferred tax assets and liabilities are measured using enacted tax rates in effect for the year in which those temporary differences areexpected to be recovered or settled. The Company provides a valuation allowance for deferred tax assets for which it does not consider realization of such assetsto be more likely than not. The Company reviews the need to establish a valuation allowance against deferred tax assets on a quarterly basis. The review includes an analysis of variousfactors, such as future reversals of existing taxable temporary differences, the capacity for the carryback or carryforward of any losses, the expected occurrence offuture income or loss and available tax planning strategies.
58

Table of Contents
KIMCO REALTY CORPORATION AND SUBSIDIARIES
NOTES TO CONSOLIDATED FINANCIAL STATEMENTS, continued
The Company applies the FASB’s guidance relating to uncertainty in income taxes recognized in a Company’s financial statements. Under this guidance theCompany may recognize the tax benefit from an uncertain tax position only if it is more likely than not that the tax position will be sustained on examination bytaxing authorities, based on the technical merits of the position. The tax benefits recognized in the financial statements from such a position are measured basedon the largest benefit that has a greater than fifty percent likelihood of being realized upon ultimate settlement. The guidance on accounting for uncertainty inincome taxes also provides guidance on de-recognition, classification, interest and penalties on income taxes, and accounting in interim periods. Foreign Currency Translation and Transactions Assets and liabilities of the Company’s foreign operations, where it has been determined that the local currency is the functional currency, are translated usingyear-end exchange rates, and revenues and expenses are translated using exchange rates as determined throughout the year. Gains or losses resulting fromtranslation are included in AOCI, as a separate component of the Company’s stockholders’ equity. Gains or losses resulting from foreign currency transactionsare translated to local currency at the rates of exchange prevailing at the dates of the transactions. The effect of the transaction’s gain or loss is included in thecaption Other (expense)/income, net in the Consolidated Statements of Income. The Company is required to release cumulative translation adjustment (“CTA”)balances into earnings when the Company has substantially liquidated its investment in a foreign entity. As of December 31, 2017, the Company has exited SouthAmerica and substantially liquidated its investments in Mexico and Canada. Derivative/Financial Instruments The Company is exposed to certain risks arising from both its business operations and economic conditions. The Company principally manages its exposures to awide variety of business and operational risk through management of its core business activities. The Company manages economic risks, including interest rate,liquidity, and credit risk primarily by managing the amount, sources, and duration of its debt funding and the use of derivative financial instruments. Specifically,the Company may use derivatives to manage exposures that arise from changes in interest rates, foreign currency exchange rate fluctuations and market valuefluctuations of equity securities. The Company limits these risks by following established risk management policies and procedures including the use ofderivatives. The Company measures its derivative instruments at fair value and records them in the Consolidated Balance Sheet as an asset or liability, depending on theCompany’s rights or obligations under the applicable derivative contract. The accounting for changes in the fair value of the derivatives depends on theintended use of the derivative, whether the Company has elected to designate a derivative in a hedging relationship and apply hedge accounting and whether thehedging relationship has satisfied the criteria necessary to apply hedge accounting. Derivatives designated and qualifying as a hedge of the exposure to changesin the fair value of an asset, liability, or firm commitment attributable to a particular risk, such as interest rate risk, are considered fair value hedges. Derivativesdesignated and qualifying as a hedge of the exposure to variability in expected future cash flows, or other types of forecasted transactions, are considered cashflow hedges. Derivatives may also be designated as hedges of the foreign currency exposure of a net investment in a foreign operation. Hedge accountinggenerally provides for the matching of the timing of gain or loss recognition on the hedging instrument with the recognition of the changes in the fair value of thehedged asset or liability that are attributable to the hedged risk in a fair value hedge or the earnings effect of the hedged forecasted transactions in a cash flowhedge. The Company may enter into derivative contracts that are intended to economically hedge certain of its risk, even though hedge accounting does notapply or the Company elects not to apply hedge accounting under the Derivatives and Hedging guidance issued by the FASB. The effective portion of the changes in fair value of derivatives designated and that qualify as cash flow hedges is recorded in AOCI and is subsequentlyreclassified into earnings in the period that the hedged forecasted transaction affects earnings. Any ineffective portion of the change in fair value of thederivatives is recognized directly in earnings. During 2017, 2016 and 2015, the Company had no hedge ineffectiveness. Noncontrolling Interests The Company accounts for noncontrolling interests in accordance with the Consolidation guidance and the Distinguishing Liabilities from Equity guidanceissued by the FASB. Noncontrolling interests represent the portion of equity that the Company does not own in those entities it consolidates. The Companyidentifies its noncontrolling interests separately within the equity section on the Company’s Consolidated Balance Sheets. The amounts of consolidated netearnings attributable to the Company and to the noncontrolling interests are presented separately on the Company’s Consolidated Statements of Income.
59

Table of Contents
KIMCO REALTY CORPORATION AND SUBSIDIARIES
NOTES TO CONSOLIDATED FINANCIAL STATEMENTS, continued
Noncontrolling interests also includes amounts related to partnership units issued by consolidated subsidiaries of the Company in connection with certainproperty acquisitions. These units have a stated redemption value or a defined redemption amount based upon the trading price of the Company’s common stockand provides the unit holders various rates of return during the holding period. The unit holders generally have the right to redeem their units for cash at any timeafter one year from issuance. For convertible units, the Company typically has the option to settle redemption amounts in cash or common stock. The Company evaluates the terms of the partnership units issued in accordance with the FASB’s Distinguishing Liabilities from Equity guidance. Units whichembody a conditional obligation requiring the Company to redeem the units for cash after a specified or determinable date (or dates) or upon the occurrence of anevent that is not solely within the control of the issuer are determined to be contingently redeemable under this guidance and are included as Redeemablenoncontrolling interest and classified within the mezzanine section between Total liabilities and Stockholders’ equity on the Company’s Consolidated BalanceSheets. Convertible units for which the Company has the option to settle redemption amounts in cash or common stock are included in the captionNoncontrolling interest within the equity section on the Company’s Consolidated Balance Sheets. Stock Compensation The Company maintains two equity participation plans, the Second Amended and Restated 1998 Equity Participation Plan (the “Prior Plan”) and the 2010 EquityParticipation Plan (the “2010 Plan”) (collectively, the “Plans”). The Prior Plan provides for a maximum of 47,000,000 shares of the Company’s common stock to beissued for qualified and non-qualified stock options and restricted stock grants. Effective May 1, 2012, the 2010 Plan provides for a maximum of 10,000,000 sharesof the Company’s common stock to be issued for qualified and non-qualified stock options and other awards, plus the number of shares of common stock whichare or become available for issuance under the Prior Plan and which are not thereafter issued under the Prior Plan, subject to certain conditions. Unless otherwisedetermined by the Board of Directors at its sole discretion, stock options granted under the Plans generally vest ratably over a range of three to five years, expireten years from the date of grant and are exercisable at the market price on the date of grant. Restricted stock grants generally vest (i) 100% on the fourth or fifthanniversary of the grant, (ii) ratably over three, four and five years or (iii) over ten years at 20% per year commencing after the fifth year. Performance shareawards, which vest over a period of one to three years, may provide a right to receive shares of the Company’s common stock or restricted stock based on theCompany’s performance relative to its peers, as defined, or based on other performance criteria as determined by the Board of Directors. In addition, the Plansprovide for the granting of certain stock options and restricted stock to each of the Company’s non-employee directors (the “Independent Directors”) and permitsuch Independent Directors to elect to receive deferred stock awards in lieu of directors’ fees. The Company accounts for equity awards in accordance with the FASB’s Stock Compensation guidance which requires that all share based payments toemployees, be recognized in the Statement of Income over the service period based on their fair values. Fair value is determined, depending on the type of award,using either the Black-Scholes option pricing formula or the Monte Carlo method, both of which are intended to estimate the fair value of the awards at the grantdate (see Footnote 20 of the Notes to Consolidated Financial Statements for additional disclosure on the assumptions and methodology).
60

Table of Contents
KIMCO REALTY CORPORATION AND SUBSIDIARIES
NOTES TO CONSOLIDATED FINANCIAL STATEMENTS, continued
New Accounting Pronouncements The following table represents ASUs to the FASB’s Accounting Standards Codification (“ASC”) that, as of the year ended December 31, 2017, are not yeteffective for the Company and for which the Company has not elected early adoption, where permitted:
ASU Description Effective
Date
Effect on the financialstatements or other significant
matters ASU 2017-09, Compensation
– Stock Compensation (Topic718): Scope of ModificationAccounting
The amendment provides guidance about which changes to theterms or conditions of a share-based payment award require an entity toapply modification accounting in Topic 718. Under the new guidance,modification accounting is required only if the fair value, the vestingconditions, or the classification of the award (as equity or liability)changes as a result of the change in terms or conditions. The newguidance will be applied prospectively to awards modified on or after theadoption date.
January 1,2018; Earlyadoptionpermitted
The adoption is not expected tohave a material effect on theCompany’s financial position and/orresults of operations.
ASU 2017-05, Other Income –Gains and Losses from theDerecognition ofNonfinancial Assets(“Subtopic 610-20”):Clarifying the Scope of AssetDerecognition Guidance andAccounting for Partial Salesof Nonfinancial Assets
The amendment clarifies that a financial asset is within the scope ofSubtopic 610-20 if it meets the definition of an in substance nonfinancialasset and defines the term in substance nonfinancial asset. ASU 2017-05also clarifies that nonfinancial assets within the scope of Subtopic 610-20may include nonfinancial assets transferred within a legal entity to acounterparty. Subtopic 610-20, which was issued in May 2014 as part ofASU 2014-09, discussed below, provides guidance for recognizing gainsand losses from the transfer of nonfinancial assets in contracts withnoncustomers. An entity is required to apply the amendments in ASU2017-05 at the same time it applies the amendments in ASU 2014-09discussed below. An entity may elect to apply the amendments in ASU2017-05 either retrospectively to each period presented in the financialstatements in accordance with the guidance on accounting changes inASC Topic 250, Accounting Changes and Error Corrections, paragraphs10-45-5 through 10-45-10 (i.e. the retrospective approach) orretrospectively with a cumulative-effect adjustment to retained earningsas of the beginning of the fiscal year of adoption (i.e. the modifiedretrospective approach). An entity may elect to apply all of theamendments in ASU 2017-05 and ASU 2014-09 using the same transitionmethod, or alternatively may elect to use different transition methods.
January 1,2018; Earlyadoption ispermitted if
adopted withASU 2014-09
The Company will adopt theprovisions of Subtopic 610-20 in thefirst quarter of fiscal 2018, using themodified retrospective approach.Upon adoption, the Company willappropriately apply the guidance toprospective disposals ofnonfinancial assets within the scopeof Subtopic 610-20.
ASU 2016-13, Financial
Instruments – Credit Losses(Topic 326): Measurement ofCredit Losses on FinancialInstruments
The new guidance introduces a new model for estimating credit lossesfor certain types of financial instruments, including loans receivable,held-to-maturity debt securities, and net investments in direct financingleases, amongst other financial instruments. ASU 2016-13 also modifiesthe impairment model for available-for-sale debt securities and expandsthe disclosure requirements regarding an entity’s assumptions, models,and methods for estimating the allowance for losses.
January 1,2020; Earlyadoptionpermitted
The Company is still assessingthe impact on its financial positionand/or results of operations.
61

Table of Contents ASU 2014-09, Revenue from
Contracts with Customers(Topic 606) ASU 2015-14, Revenue fromContracts with Customers(Topic 606): Deferral of theEffective Date ASU 2016-08, Revenue fromContracts with Customers(Topic 606): Principal versusAgent Considerations ASU 2016-10, Revenue fromContracts with Customers(Topic 606): Identifyingperformance obligations andlicensing ASU 2016-12, Revenue fromContracts with Customers(Topic 606): Narrow-scopeimprovements and practicalexpedients
ASU 2014-09 is a comprehensive new revenue recognition modelrequiring a company to recognize revenue to depict the transfer of goodsor services to a customer at an amount reflecting the consideration itexpects to receive in exchange for those goods or services. In adoptingASU 2014-09, companies may use either a full retrospective or a modifiedretrospective approach. ASU 2014-09 was anticipated to be effective forthe first interim period within annual reporting periods beginning afterDecember 15, 2016, and early adoption was not permitted. In August 2015, the FASB issued ASU 2015-14, which delayed theeffective date of ASU 2014-09 by one year making it effective for the firstinterim period within annual reporting periods beginning after December15, 2017. Subsequently, in March 2016, the FASB issued ASU 2016-08, whichfurther clarifies the implementation guidance on principal versus agentconsiderations, and in April 2016, the FASB issued ASU 2016-10, anupdate on identifying performance obligations and accounting forlicenses of intellectual property. Additionally, in May 2016, the FASB issued ASU 2016-12, whichincludes amendments for enhanced clarification of the guidance. Earlyadoption is permitted as of the original effective date.
January 1,2018; Earlyadoption
permitted as oforiginal
effective date,which wasJanuary 1,
2017
The Company’s revenue-producingcontracts are primarily leases thatare not within the scope of thisstandard, except for the leasecomponent relating to common areamaintenance (“CAM”)reimbursement revenue, which willbe within the scope of this standardupon the effective date of ASU2016-02, Leases (Topic 842)discussed below. The revenues which will be withinthe scope of this standard includeother ancillary income earnedthrough the Company’s operatingproperties as well as fees forservices performed at variousunconsolidated joint ventureswhich the Company manages.These fees primarily includeproperty and asset managementfees, leasing fees, development feesand propertyacquisition/disposition fees. Theserevenues representedapproximately 3% of the Company’sconsolidated revenue for both theyears ended December 31, 2017 and2016. The Company believes thetiming of recognition and amount ofthese revenues will be generallyconsistent with the currentrecognition and measurement. The Company plans to adopt thisstandard effective January 1,2018, using the modifiedretrospective approach, whichrequires a cumulative effectadjustment, if any, as of the date ofadoption. The Company hasdetermined that the adoption of thisstandard will not require anymaterial adjustments to theconsolidated financial statementsbut will result in additionaldisclosures related todisaggregation of revenue streamsbeginning in the first quarter of2018.
62

Table of Contents ASU 2016-02, Leases (Topic
842) This ASU sets out the principles for the recognition, measurement,
presentation and disclosure of leases for both parties to a contract (i.e.lessees and lessors). The new standard requires lessees to apply a dualapproach, classifying leases as either finance or operating leases basedon the principle of whether or not the lease is effectively a financedpurchase by the lessee. This classification will determine whether leaseexpense is recognized based on an effective interest method or on astraight-line basis over the term of the lease. A lessee is also required torecord a right-of-use asset and a lease liability for all leases with a term ofgreater than 12 months regardless of their classification. Leases with aterm of 12 months or less will be accounted for similar to existingguidance for operating leases today. The new standard requires lessorsto account for leases using an approach that is substantially equivalentto existing guidance for sales-type leases, direct financing leases andoperating leases. ASU 2016-02 supersedes the previous leases standard,Leases (Topic 840).
January 1,2019; Earlyadoptionpermitted
The Company continues to evaluatethe effect the adoption will have onthe Company’s financial positionand/or results of operations.However, the Company currentlybelieves that the adoption will nothave a material impact for operatingleases where it is a lessor and willcontinue to record revenues fromrental properties for its operatingleases on a straight-line basis.However, for leases where theCompany is a lessee, primarily forthe Company’s ground leases andadministrative office leases, theCompany will be required to recorda lease liability and a right of useasset on its Consolidated BalanceSheets at fair value upon adoption.In addition, direct internal leasingcosts will continue to be capitalized,however, indirect internal leasingcosts previously capitalized will beexpensed. Within the terms of theCompany’s leases where theCompany is the lessor, theCompany is entitled to receivereimbursement amounts fromtenants for operating expenses suchas real estate taxes, insurance andother CAM. Upon adoption of thisASU, CAM reimbursement revenuewill be accounted for in accordancewith ASU 2016-12 Revenue fromContracts with Customers (Topic606). The Company continues toevaluate the effect the adoption willhave on this source of revenue.However, the Company currentlydoes not believe the adoption willsignificantly affect the timing of therecognition of the Company’s CAMreimbursement revenue.
63

Table of Contents ASU 2016-01, Financial
Instruments—Overall(Subtopic 825-10):Recognition andMeasurement of FinancialAssets and FinancialLiabilities
The amendment addresses certain aspects of recognition, measurement,presentation and disclosure of financial instruments, including thefollowing: (i) Requires equity investments (excluding those investments accounted
for under the equity method of accounting or those that result inconsolidation of the investee) with readily determinable fair valuesto be measured at fair value with the changes in fair valuerecognized in net income; however, an entity may choose tomeasure equity investments that do not have readily determinablefair values at cost minus impairment, if any, plus or minus changesresulting from observable price changes in orderly transactions forthe identical or a similar investment of the same issuer.
(ii) Simplifies the impairment assessment of those equity investmentswithout readily determinable fair values by requiring a qualitativeassessment to identify impairment
(iii) Eliminates the disclosure of the method(s) and significantassumptions used to estimate the fair value for financialinstruments measured at amortized cost and changes the fair valuecalculation for those investments
(iv) Changes the disclosure in other comprehensive income forfinancial liabilities that are measured at fair value in accordance withthe fair value options for financial instruments
(v) Clarifies that a deferred asset related to available-for-sale securitiesshould be included in an entity's evaluation for a valuationallowance.
January 1,2018; Earlyadoption
permitted forcertain
disclosurerequirements
Currently, changes in fair value ofthese equity investments withreadily determinable fair values arerecognized in AOCI. This ASUstates that these changes will berecognized in net income. TheCompany anticipates theimplementation of this guidance willaffect how changes in the fair valueof available-for-sale marketablesecurities are presented in theCompany’s consolidated financialstatements. In addition, theCompany will record a cumulative-effect adjustment to beginningretained earnings in the year ofadoption (effective as of January 1,2018) to reclassify unrealized gainsand losses previously reported inAOCI for available-for-salemarketable securities. As ofDecember 31, 2017, the Companyhad unrealized losses related to itsavailable-for-sale marketablesecurities of $1.1 million.
64

Table of Contents
KIMCO REALTY CORPORATION AND SUBSIDIARIES
NOTES TO CONSOLIDATED FINANCIAL STATEMENTS, continued
The following ASUs to the FASB’s ASC have been adopted by the Company during the year ended December 31, 2017:
ASU Description Adoption
Date
Effect on the financialstatements or other significant
matters ASU 2017-01, Business
Combinations (Topic805): Clarifying theDefinition of a Business
The update clarifies the definition of a business with the objective ofadding guidance to assist entities with evaluating whether transactionsshould be accounted for as acquisitions (or disposals) of assets orbusinesses. The definition of a business affects many areas ofaccounting including acquisitions, disposals, goodwill, andconsolidation.
January 1, 2017;Elected early
adoption
The Company’s operatingproperty acquisitions during 2017qualified for asset acquisitiontreatment under ASC 360,Property, Plant, and Equipment,rather than business combinationtreatment under ASC 805 BusinessCombinations, and resulted in thecapitalization of asset acquisitioncosts rather than directlyexpensing these costs.
ASU 2016-09,Compensation – StockCompensation (Topic718): Improvements toEmployee Share-BasedPayment Accounting
The update simplifies several aspects of accounting for employee share-based payment transactions for both public and nonpublic entities,including the accounting for income taxes, forfeitures, and statutory taxwithholding requirements, as well as classification in the statement ofcash flows.
January 1, 2017 The adoption did not have amaterial effect on the Company’sfinancial position and/or results ofoperations.
2. Real Estate:
The Company’s components of Rental property consist of the following (in thousands):
December 31, 2017 2016 Land $ 2,971,020 $ 2,786,255 Undeveloped land 48,264 58,931 Buildings and improvements:
Buildings 6,047,413 5,790,681 Building improvements 1,653,581 1,562,439 Tenant improvements 753,501 733,993 Fixtures and leasehold improvements 45,795 47,199 Above-market leases 153,484 150,207 In-place leases and tenant relationships 577,870 543,342
12,250,928 11,673,047 Accumulated depreciation and amortization (1) (2,433,053) (2,278,292)
Total $ 9,817,875 $ 9,394,755
(1) At December 31, 2017 and 2016, the Company had accumulated amortization relating to in-place leases, tenant relationships and above-market leases
aggregating $459,211 and $409,062, respectively. In addition, at December 31, 2017 and 2016, the Company had intangible liabilities relating to below-market leases from property acquisitions of $329.3 million and$292.6 million, respectively, net of accumulated amortization of $184.5 million and $193.9 million, respectively. These amounts are included in the caption Otherliabilities on the Company’s Consolidated Balance Sheets. The Company’s amortization associated with above-market and below-market leases for the years ended December 31, 2017, 2016 and 2015, resulted in netincreases to revenue of $15.5 million, $21.4 million and $18.5 million, respectively. The Company’s amortization expense associated with in-place leases and tenantrelationships, which is included in depreciation and amortization, for the years ended December 31, 2017, 2016 and 2015 was $62.7 million, $66.6 million and $68.3million, respectively. The estimated net amortization income/(expense) associated with the Company’s above-market and below-market leases, tenant relationships and in-placeleases for the next five years are as follows (in millions):
2018 2019 2020 2021 2022 Above-market and below-market leases amortization, net $ 13.2 $ 14.0 $ 14.1 $ 14.3 $ 13.4 In-place leases and tenant relationships amortization $ (43.7) $ (34.6) $ (26.5) $ (20.7) $ (15.9)
65

Table of Contents
KIMCO REALTY CORPORATION AND SUBSIDIARIES
NOTES TO CONSOLIDATED FINANCIAL STATEMENTS, continued
3. Property Acquisitions, Developments and Other Investments:
Acquisition/Consolidation of Operating Properties During the year ended December 31, 2017, the Company acquired the following operating properties, in separate transactions, through direct asset purchases orconsolidation due to change in control resulting from the purchase of additional interests or obtaining control through the modification of a joint ventureinvestment:
Purchase Price (in thousands)
Property Name Location
MonthAcquired/
Consolidated Cash* Debt Other
Consideration** Total GLA*** Plantation Commons Plantation, FL (1) (3) Jan-17 $ - $ - $ 12,300 $ 12,300 60 Gordon Plaza Woodbridge, VA (1) (3) Jan-17 - - 3,100 3,100 184 Plaza del Prado Glenview, IL Jan-17 39,063 - - 39,063 142 Columbia Crossing Parcel Columbia Crossing, MD Jan-17 5,100 - - 5,100 25 The District at Tustin Legacy Tustin, CA (2) (3) Apr-17 - 206,000 98,698 304,698 688 Jantzen Beach Center Portland, OR Jul-17 131,927 - - 131,927 722 Del Monte Plaza Parcel Reno, NV Jul-17 24,152 - - 24,152 83 Gateway Station Phase II Burleson, TX Aug-17 15,355 - - 15,355 79 Jantzen Beach Center Parcel Portland, OR Sep-17 6,279 - - 6,279 25 Webster Square Outparcel Nashua, NH Sep-17 4,985 - - 4,985 22 Whittwood Town Center Whittier, CA Oct-17 80,397 43,000 - 123,397 783 123 Coulter Avenue Parcel Ardmore, PA Oct-17 4,808 - - 4,808 1 Fulton Marketplace Parcel Santa Rosa, CA Nov-17 13,162 - - 13,162 61 $ 325,228 $ 249,000 $ 114,098 $ 688,326 2,875 * The Company utilized an aggregate $162.4 million associated with Internal Revenue Code §1031 sales proceeds.** Includes the Company’s previously held equity interest investment.*** Gross leasable area ("GLA") (1) The Company acquired from its partners, their ownership interest in properties that were held in joint ventures in which the Company had noncontrolling
interests. The Company now has a controlling interest in these properties and has deemed these entities to be VIEs for which the Company is the primarybeneficiary and now consolidates these assets.
(2) Effective April 1, 2017, the Company and its partner amended its joint venture agreement relating to the Company’s investment in this property. As a result of thisamendment, the Company now controls the entity and consolidates the property. This entity is deemed to be a VIE for which the Company is the primarybeneficiary.
(3) The Company evaluated these transactions pursuant to the FASB’s Consolidation guidance and as a result, recognized gains on change in control of interestsresulting from the fair value adjustments associated with the Company’s previously held equity interests, which are included in the purchase price above in OtherConsideration. The Company’s current ownership interests and gains on change in control of interests recognized as a result of these transactions are as follows(in thousands):
Property Name
PreviousOwnership
Interest
Gain on changein control of
interests Plantation Commons 76.25% $ 9,793 Gordon Plaza 40.62% 395 The District at Tustin Legacy (a) 60,972 $ 71,160
(a) The Company’s share of this investment is subject to change and is based upon a cash flow waterfall provision within the partnership agreement (54.27%
as of date of consolidation).
66

Table of Contents
KIMCO REALTY CORPORATION AND SUBSIDIARIES
NOTES TO CONSOLIDATED FINANCIAL STATEMENTS, continued
During the year ended December 31, 2016, the Company acquired the following operating properties, in separate transactions:
Purchase Price (in thousands)
Property Name Location Month
Acquired Cash* Debt Other
Consideration ** Total GLA Jericho Atrium Jericho, NY Apr-16 $ 29,750 $ - $ - $ 29,750 147 Oakwood Plaza Hollywood, FL (1) Apr-16 53,412 100,000 61,588 215,000 899 Webster Square North Nashua, NH Jul-16 8,200 - - 8,200 21 Gateway Plaza Mill Creek, WA (1) Jul-16 493 17,500 - 17,993 97 Kentlands Market Square Gaithersburg, MD Aug-16 61,826 33,174 - 95,000 221 GEPT Portfolio (4 properties) Various (1) Sep-16 79,974 76,989 10,882 167,845 681 Coulter Avenue (2 parcels) Ardmore, PA Various 6,750 - - 6,750 20 KimPru Portfolio (2 properties) Various (1) Oct-16 15,505 35,700 3,218 54,423 234 Hamden Mart Hamden, CT (1) Nov-16 - 21,369 29,294 50,663 345 $ 255,910 $ 284,732 $ 104,982 $ 645,624 2,665 * The Company utilized an aggregate $66.0 million associated with Internal Revenue Code §1031 sales proceeds.** Includes the Company’s previously held equity interest investment. (1) The Company acquired from its partners their ownership interest in properties that were held in joint ventures in which the Company had noncontrolling interests.
The Company evaluated these transactions pursuant to the FASB’s Consolidation guidance and as a result, recognized gains on change in control of interestsresulting from the fair value adjustments associated with the Company’s previously held equity interests, which are included in the purchase price above in OtherConsideration. The Company’s previous ownership interests and gains on change in control of interests recognized as a result of these transactions are asfollows (in thousands):
Property Name
PreviousOwnership
Interest
Gain on changein control of
interests Oakwood Plaza 55.0% $ 46,512 Gateway Plaza 15.0% - GEPT Portfolio (4 properties) 15.0% 6,583 KimPru Portfolio (2 properties) 15.0% 832 Hamden Mart 47.95% 3,459 $ 57,386
Included in the Company’s Consolidated Statements of Income are $31.0 million, $23.8 million and $112.2 million in revenues from rental properties from the date ofacquisition through December 31, 2017, 2016 and 2015, respectively, for operating properties acquired during each of the respective years. Purchase Price Allocations
The Company adopted ASU 2017-01 effective January 1, 2017 and applied the guidance to its operating property acquisitions during the year ended December 31,2017. The purchase price for these acquisitions is allocated to real estate and related intangible assets acquired and liabilities assumed, as applicable, inaccordance with our accounting policies for asset acquisitions. The purchase price allocations for properties acquired/consolidated during the year endedDecember 31, 2017, are as follows (in thousands):
Allocation as of
December 31, 2017
Weighted-AverageAmortization Period
(in Years) Land $ 255,715 n/a Buildings 379,148 50.0 Building improvements 46,613 41.5 Tenant improvements 14,520 7.2 In-place leases 56,200 7.2 Above-market leases 12,197 7.8 Below-market leases (77,027) 29.5 Mortgage fair value adjustment (8,521) 1.3 Tax increment financing (TIF) contracts 8,342 19.0 Other assets 5,090 n/a Other liabilities (3,951) n/a Net assets acquired/consolidated $ 688,326
67

Table of Contents
KIMCO REALTY CORPORATION AND SUBSIDIARIES
NOTES TO CONSOLIDATED FINANCIAL STATEMENTS, continued
As of December 31, 2017, the allocation adjustments and revised allocations for properties accounted for as business combinations during the year endedDecember 31, 2016, are as follows (in thousands):
Allocation as of
December 31, 2016 Allocation
Adjustments Revised Allocation asof December 31, 2017
Weighted-AverageAmortization Period
(in Years) Land $ 179,150 $ (5,150) $ 174,000 n/a Buildings 309,493 (30,696) 278,797 50.0 Building improvements 124,105 41,895 166,000 45.0 Tenant improvements 12,788 (1,155) 11,633 7.1 In-place leases 44,094 (1,063) 43,031 6.4 Above-market leases 11,982 885 12,867 8.1 Below-market leases (31,903) (4,716) (36,619) 19.1 Mortgage fair value adjustment (4,292) - (4,292) 4.1 Other assets 234 - 234 n/a Other liabilities (27) - (27) n/a Net assets acquired $ 645,624 $ - $ 645,624
Hurricane Impact The impact of Hurricanes Harvey, which struck Texas on August 25, 2017, and Irma, which struck Florida on September 10, 2017, resulted in minimal damage to theCompany’s properties located in Texas and Florida, with the majority of the impact related to debris removal. On September 20, 2017, Hurricane Maria struck Puerto Rico as a Category 4 hurricane which resulted in widespread damage, flooding, and power outages. TheCompany has interests in seven operating properties located throughout Puerto Rico, aggregating 2.2 million square feet of GLA, which were variously impactedby the hurricane. The Company maintains a comprehensive property insurance policy on these properties with total coverage of up to $62.0 million, as well asbusiness interruption insurance with coverage up to $39.3 million in the aggregate, subject to a collective deductible of $1.2 million. As of December 31, 2017, the Company’s assessment of the damages sustained to its properties from Hurricane Maria resulted in a write-off to depreciationexpense of $16.0 million, representing the estimated net book value of damaged assets. The Company also recorded a corresponding receivable and credit todepreciation expense of $16.0 million for estimated property insurance recoveries related to the write-off. As such, there was no impact to net income during 2017resulting from these adjustments. The Company expects to collect property insurance proceeds (net of deductible) equal to the replacement cost of its damagedproperty, currently estimated to be approximately $26.0 million. As of December 31, 2017, the Company received property insurance proceeds of $4.0 million andhas a remaining receivable balance of $12.0 million which is included in Other assets on the Company’s Consolidated Balance Sheets. The Company’s business interruption insurance covers lost revenues as a result of the hurricane for a period of up one year. After the expiration of one yearfollowing the loss, the policy has 365 days of extended period of indemnity which provides business interruption coverage in the event the properties have notfully recovered from the storm. For the year ended December 31, 2017, the Company had a reduction in revenues from rental properties of $3.4 million related tolost tenant revenue and rent abatements resulting from the impact of Hurricane Maria. During December 2017, the Company received $1.6 million from itsinsurance provider for business interruption claims. The Company is still in the process of assessing current and future business interruption insurance lossesand will submit insurance claims for its estimated losses under its business interruption insurance policy.
68

Table of Contents
KIMCO REALTY CORPORATION AND SUBSIDIARIES
NOTES TO CONSOLIDATED FINANCIAL STATEMENTS, continued
4. Real Estate Under Development:
The Company is engaged in various real estate development projects for long-term investment. As of December 31, 2017, the Company had in progress a total offour real estate development projects and two additional projects held for future development. The costs incurred to date for these projects are as follows (inthousands):
December 31, Property Name Location 2017 2016 Grand Parkway Marketplace (1) Spring, TX $ 43,403 $ 94,841 Dania Pointe Dania Beach, FL 152,841 107,113 Mill Station Owings Mills, MD 34,347 25,119 Lincoln Square (2) Philadelphia, PA 90,479 - Avenues Walk (3) Jacksonville, FL 48,573 73,048 Promenade at Christiana (4) New Castle, DE 32,875 25,521 Staten Island Plaza (5) Staten Island, NY - 9,386 $ 402,518 $ 335,028
(1) During 2017, the Company sold a land parcel at this development project for a sales price of $2.9 million. Additionally, effective as of September 30, 2017,
certain aspects of this development project, aggregating $91.0 million, were placed in service and reclassified into Land and Building and improvements onthe Company’s Consolidated Balance Sheets. The remaining portion relates to the second phase of this project which is under development.
(2) During 2017, KIM Lincoln, LLC (“KIM Lincoln”), a wholly owned subsidiary of the Company, and Lincoln Square Property, LP (“Lincoln Member”) enteredinto a joint venture agreement wherein KIM Lincoln has a 90% controlling interest and Lincoln Member has a 10% noncontrolling interest. The joint ventureacquired land parcels in Philadelphia, PA to be held for development for a gross purchase price of $10.0 million. Based upon the Company ’s intent to developthe property, the Company allocated the gross purchase price to Real estate under development on the Company’s Consolidated Balance Sheets. This jointventure is accounted for as a consolidated VIE (see Footnote 9).
(3) Effective April 1, 2017, certain aspects of this development project, aggregating $24.5 million, were placed in service and reclassified into Land and Buildingand improvements on the Company’s Consolidated Balance Sheets. The remaining portion of the project consists of a mixed-use project to be developed inthe future.
(4) The Company is assessing the development model for this asset, which may include a mixed-use component, and anticipates a near term delay in the timingof development. As such, the Company considers this project as land held for future development effective December 31, 2017.
(5) During 2017, the Company reclassified this project to undeveloped land on the Company’s Consolidated Balance Sheets, as it is no longer anticipated to bedeveloped by the Company.
During the years ended December 31, 2017 and 2016, the Company capitalized (i) interest of $11.0 million and $6.9 million, (ii) real estate taxes, insurance and legalcosts of $5.7 million and $5.2 million and (iii) payroll of $3.3 million and $1.8 million, respectively, in connection with these real estate development projects. During 2016, the Company acquired from its partner the remaining ownership interest in Dania Pointe, which was held in a joint venture in which the Company hasa 55.0% noncontrolling interest for a gross purchase price of $84.2 million. The Company evaluated this transaction pursuant to the FASB’s Consolidationguidance and as a result, no gain on change in control of interest was recognized as there was no fair value adjustment associated with the Company’s previouslyheld equity interest. Based upon the Company’s intent to develop the property, the Company allocated the gross purchase price to Real estate underdevelopment on the Company’s Consolidated Balance Sheets. During 2016, the Company acquired, in separate transactions, three additional land parcels adjacent to two existing development projects for an aggregatepurchase price of $13.8 million.
5. Dispositions of Real Estate and Assets Held-for-Sale:
Operating Real Estate The table below summarizes the Company's disposition activity relating to consolidated operating properties and parcels, in separate transactions (dollars inmillions):
Year Ended December 31, 2017 2016 2015 Aggregate sales price $ 352.2 $ 378.7 $ 492.5 Gain on sale, net of tax $ 93.5 $ 86.8 $ 143.6 Impairment charges $ 17.1 $ 37.2 $ 10.2 Number of operating properties sold 25 30 89 Number of parcels/out-parcels sold 9 2 8
Additionally, during 2015, the Company disposed of its remaining operating property in Chile for a sales price of $51.3 million. This transaction resulted in therelease of a cumulative foreign currency translation loss of $19.6 million due to the Company’s liquidation of its investment in Chile, offset by a gain on sale of$1.8 million, after income tax expense.
69

Table of Contents
KIMCO REALTY CORPORATION AND SUBSIDIARIES
NOTES TO CONSOLIDATED FINANCIAL STATEMENTS, continued
Land Sales During 2016 and 2015, the Company sold six and 13 land parcels, respectively, for an aggregate sales price of $3.9 million and $31.5 million, respectively. Thesetransactions resulted in an aggregate gain of $1.9 million and $4.3 million, before income taxes expense and noncontrolling interest for the years ended December31, 2016 and 2015, respectively. The gains from these transactions are recorded as other income, which is included in Other (expense)/income, net, in theCompany’s Consolidated Statements of Income. Held-for-Sale At December 31, 2017, the Company had three consolidated properties classified as held-for-sale at an aggregate carrying amount of $22.4 million, net ofaccumulated depreciation of $16.8 million, which are included in Other assets on the Company’s Consolidated Balance Sheets. The Company’s determination ofthe fair value of the properties was based upon executed contracts of sale with third parties, which are in excess of the carrying values of the properties.
6. Impairments:
Management assesses on a continuous basis whether there are any indicators, including property operating performance, changes in anticipated holding periodand general market conditions, that the value of the Company’s assets (including any related amortizable intangible assets or liabilities) may be impaired. To theextent impairment has occurred, the carrying value of the asset would be adjusted to an amount to reflect the estimated fair value of the asset. The Company has an active capital recycling program which provides for the disposition of certain properties, typically of lesser quality assets in moreundesirable locations. The Company has adjusted the anticipated hold period for these properties and as a result the Company recognized impairment charges oncertain consolidated operating properties (see Footnote 15 of the Notes to Consolidated Financial Statements for fair value disclosure). The Company’s efforts to market certain assets and management’s assessment as to the likelihood and timing of such potential transactions and/or the propertyhold period resulted in the Company recognizing impairment charges for the years ended December 31, 2017, 2016 and 2015 as follows (in millions):
2017 2016 2015 Impairment of property carrying values* (1) (2) (3) $ 67.3 $ 93.3 $ 30.3 Impairment of investments in other real estate investments (4) - - 5.3 Impairment of marketable securities and other investments (5) - - 9.8
Total Impairment charges included in operating expenses 67.3 93.3 45.4 Impairment of property carrying values included in discontinued operations - - 0.1 Total gross impairment charges 67.3 93.3 45.5
Noncontrolling interests - (0.4) (5.6)Income tax benefit - (21.1) (9.0)
Total net impairment charges $ 67.3 $ 71.8 $ 30.9 * See Footnote 15 of the Notes to Consolidated Financial Statements for additional disclosure on fair value
(1) During 2017, the Company recognized aggregate impairment charges of $67.3 million. These impairment charges consist of (i) $34.0 million related to adjustmentsto property carrying values for properties which the Company has marketed for sale as part of its active capital recycling program and as such has adjusted theanticipated hold periods for such properties, (ii) $17.1 million related to the sale of certain operating properties (as discussed in Footnote 5 of the Notes toConsolidated Financial Statements) and (iii) $16.2 million related to a property for which the Company has re-evaluated its long-term plan for the property due tounfavorable local market conditions.
(2) During 2016, the Company recognized aggregate impairment charges of $93.3 million, before an income tax benefit of $21.1 million and noncontrolling interests of$0.4 million, primarily related to sale of certain operating properties, certain properties maintained in the Company’s TRS for which the hold period was re-evaluated in connection with the Merger (see Footnote 21 of the Notes to Consolidated Financial Statements for additional disclosure) and adjustments toproperty carrying values in connection with the Company’s efforts to market certain properties and management’s assessment as to the likelihood and timing ofsuch potential transactions and the anticipated hold period for such properties.
(3) During 2015, the Company recognized aggregate impairment charges of $30.3 million, before an income tax benefit of $5.4 million and noncontrolling interests of$5.6 million.
(4) Impairment charges were primarily based upon a review of residual values, sales prices and debt maturity status and the likelihood of foreclosure of certainunderlying properties within the Company’s preferred equity investments during 2015. The Company believed it would not recover its investment in certainpreferred equity investments and as such recorded full impairments on these investments.
(5) During 2015, the Company reviewed the underlying cause of the decline in value of certain cost method investments, as well as the severity and the duration ofthe decline and determined that the decline was other-than-temporary. Impairment charges were recognized based upon the calculation of the investments’estimated fair value.
In addition to the impairment charges above, the Company recognized pretax impairment charges during 2017, 2016 and 2015 of $4.8 million, $15.0 million, and$22.2 million, respectively, relating to certain properties held by various unconsolidated joint ventures in which the Company holds noncontrolling interests.These impairment charges are included in Equity in income of joint ventures, net in the Company’s Consolidated Statements of Income (see Footnote 7 of theNotes to Consolidated Financial Statements).
70

Table of Contents
KIMCO REALTY CORPORATION AND SUBSIDIARIES
NOTES TO CONSOLIDATED FINANCIAL STATEMENTS, continued
The Company will continue to assess the value of its assets on an on-going basis. Based on these assessments, the Company may determine that one or more ofits assets may be impaired and would therefore write-down its carrying basis accordingly.
7. Investment in and Advances to Real Estate Joint Ventures:
The Company and its subsidiaries have investments in and advances to various real estate joint ventures. These joint ventures are engaged primarily in theoperation of shopping centers which are either owned or held under long-term operating leases. The Company and the joint venture partners have joint approvalrights for major decisions, including those regarding property operations. As such, the Company holds noncontrolling interests in these joint ventures andaccounts for them under the equity method of accounting. The table below presents unconsolidated joint venture investments for which the Company held anownership interest at December 31, 2017 and 2016 (in millions, except number of properties):
December 31, 2017 December 31, 2016
Venture Ownership
Interest Number ofProperties
TheCompany'sInvestment
OwnershipInterest
Number ofProperties
TheCompany'sInvestment
Prudential Investment Program (“KimPru” and “KimPruII”) (1) (2) 15.0% 46 $ 179.5 15.0% 48 $ 182.5
Kimco Income Opportunity Portfolio (“KIR”) (2) 48.6% 42 154.1 48.6% 45 145.2 Canada Pension Plan Investment Board (“CPP”) (2) (3) 55.0% 4 105.0 55.0% 5 111.8 Other Joint Venture Programs Various 26 45.3 Various 37 64.7 Total* 118 $ 483.9 135 $ 504.2
* Representing 23.5 million and 26.2 million square feet of GLA as of December 31, 2017 and 2016, respectively. (1) Represents four separate joint ventures, with four separate accounts managed by Prudential Global Investment Management, three of these ventures are
collectively referred to as KimPru and the remaining venture is referred to as KimPru II.(2) The Company manages these joint venture investments and, where applicable, earns acquisition fees, leasing commissions, property management fees, asset
management fees and construction management fees.(3) During the year ended December 31, 2016, the CPP joint venture acquired a property interest adjacent to an existing operating property in Temecula, CA for a
gross purchase price of $27.5 million.
The table below presents the Company’s share of net income for these investments which is included in Equity in income of joint ventures, net on the Company’sConsolidated Statements of Income (in millions):
Year Ended December 31, 2017 2016 2015 KimPru and KimPru II $ 13.0 $ 16.4 $ 7.1 KIR 36.7 44.0 41.0 CPP 7.2 7.7 9.6 Other Joint Venture Programs (1) (2) 3.9 150.6 422.7 Total $ 60.8 $ 218.7 $ 480.4
(1) During the year ended December 31, 2017, the Company recognized a cumulative foreign currency translation loss of $4.8 million due to the substantial liquidation
of the Company’s investments in Canada during 2017.(2) During the year ended December 31, 2017, a joint venture recognized an impairment charge related to the pending sale of a property, of which the Company’s
share was $3.4 million. During the year ended December 31, 2017, the Company’s real estate joint ventures disposed of or transferred interest to joint venture partners in 13 operatingproperties and a portion of one property, in separate transactions, for an aggregate sales price of $180.8 million. These transactions resulted in an aggregate netgain to the Company of $7.5 million, before income taxes. In addition, during 2017, the Company acquired a controlling interest in three operating properties fromcertain joint ventures, in separate transactions, with an aggregate gross fair value of $320.1 million. See Footnote 3 of the Notes to Consolidated FinancialStatements for the operating properties acquired by the Company.
71

Table of Contents
KIMCO REALTY CORPORATION AND SUBSIDIARIES
NOTES TO CONSOLIDATED FINANCIAL STATEMENTS, continued
During the year ended December 31, 2016, the Company’s real estate joint ventures disposed of or transferred interest to joint venture partners in 45 operatingproperties and one land parcel, in separate transactions, for an aggregate sales price of $1.1 billion. These transactions resulted in an aggregate net gain to theCompany of $151.2 million, before income taxes. In addition, during 2016, the Company acquired a controlling interest in nine operating properties and onedevelopment project from certain joint ventures, in separate transactions, with an aggregate gross fair value of $590.1 million. See Footnotes 3 and 4 of the Notesto Consolidated Financial Statements for the operating properties and development projects acquired by the Company. During the year ended December 31, 2015, the Company’s real estate joint ventures disposed of or transferred interest to joint venture partners in 98 operatingproperties and 11 land parcels, in separate transactions, for an aggregate sales price of $1.8 billion. These transactions resulted in an aggregate net gain to theCompany of $380.6 million, before income taxes. In addition, during 2015, the Company acquired a controlling interest in 43 operating properties from certain jointventures, in separate transactions with an aggregate gross fair value of $1.6 billion.
The table below presents debt balances within the Company’s unconsolidated joint venture investments for which the Company held noncontrolling ownershipinterests at December 31, 2017 and 2016 (dollars in millions):
December 31, 2017 December 31, 2016
Venture
Mortgagesand
NotesPayable
WeightedAverageInterest
Rate
WeightedAverage
RemainingTerm
(months)*
Mortgagesand
NotesPayable
WeightedAverageInterest
Rate
WeightedAverage
RemainingTerm
(months)* KimPru and KimPru II $ 625.7 3.59% 59.8 $ 647.4 3.07% 67.5 KIR 702.0 4.60% 47.5 746.5 4.64% 54.9 CPP 84.9 2.91% 4.0 84.8 2.17% 16.0 Other Joint Venture Programs 287.6 4.41% 27.2 584.3 5.40% 23.4 Total $ 1,700.2 $ 2,063.0
* Average remaining term includes extensions Summarized financial information for the Company’s investment and advances in real estate joint ventures is as follows (in millions):
December 31, 2017 2016 Assets:
Real estate, net $ 3,402.1 $ 3,741.9 Other assets 208.9 224.6
$ 3,611.0 $ 3,966.5 Liabilities and Partners’/Members’ Capital:
Notes payable, net $ 233.1 $ 214.5 Mortgages payable, net 1,467.1 1,848.5 Other liabilities 52.5 82.3 Noncontrolling interests 15.5 15.9 Partners’/Members’ capital 1,842.8 1,805.3
$ 3,611.0 $ 3,966.5
Year Ended December 31, 2017 2016 2015 Revenues from rental properties $ 516.0 $ 597.5 $ 842.5
Operating expenses (150.7) (178.1) (265.9)Impairment charges (12.9) (38.6) (63.4)Depreciation and amortization (116.1) (138.1) (191.9)Interest expense (81.9) (117.3) (202.8)Other (expense)/income, net (3.0) 20.1 4.4
Income from continuing operations 151.4 145.5 122.9 Gain on sale of operating properties, net 26.0 296.2 1,166.7 Net income $ 177.4 $ 441.7 $ 1,289.6
72

Table of Contents
KIMCO REALTY CORPORATION AND SUBSIDIARIES
NOTES TO CONSOLIDATED FINANCIAL STATEMENTS, continued
Other liabilities included in the Company’s accompanying Consolidated Balance Sheets include accounts with certain real estate joint ventures totaling $2.1million and $11.0 million at December 31, 2017 and 2016, respectively. The Company and its subsidiaries have varying equity interests in these real estate jointventures, which may differ from their proportionate share of net income or loss recognized in accordance with GAAP. The Company’s maximum exposure to losses associated with its unconsolidated joint ventures is primarily limited to its carrying value in these investments.Generally, such investments contain operating properties and the Company has determined these entities do not contain the characteristics of a VIE. As ofDecember 31, 2017 and 2016, the Company’s carrying value in these investments was $483.9 million and $504.2 million, respectively.
8. Other Real Estate Investments and Other Assets:
Other Real Estate Investments Preferred Equity Capital-
The Company previously provided capital to owners and developers of real estate properties through its Preferred Equity program. The Company’s maximumexposure to losses associated with its preferred equity investments is primarily limited to its net investment. As of December 31, 2017, the Company’s netinvestment under the Preferred Equity program was $201.9 million relating to 357 properties, including 344 net leased properties which are accounted for as directfinancing leases. For the year ended December 31, 2017, the Company earned $32.2 million from its preferred equity investments, including $14.8 million ofcumulative foreign currency translation gain recognized as a result of the substantial liquidation of the Company’s investments in Canada during 2017. As ofDecember 31, 2016, the Company’s net investment under the Preferred Equity program was $193.7 million relating to 365 properties, including 346 net leasedproperties which are accounted for as direct financing leases. For the year ended December 31, 2016, the Company earned $27.5 million from its preferred equityinvestments, including $10.5 million in profit participation earned from five capital transactions. As of December 31, 2017, these preferred equity investment properties had non-recourse mortgage loans aggregating $361.0 million. These loans have scheduledmaturities ranging from eight months to seven years and bear interest at rates ranging from 4.19% to 10.47%. Due to the Company’s preferred position in theseinvestments, the Company’s share of each investment is subject to fluctuation and is dependent upon property cash flows. The Company’s maximum exposure tolosses associated with its preferred equity investments is limited to its invested capital. Summarized financial information relating to the Company’s preferred equity investments is as follows (in millions):
December 31, 2017 2016 Assets:
Real estate, net $ 142.3 $ 187.0 Other assets 581.2 587.1
$ 723.5 $ 774.1 Liabilities and Partners’/Members’ Capital:
Mortgages payable, net $ 381.9 $ 454.7 Other liabilities 6.0 8.3 Partners’/Members’ capital 335.6 311.1
$ 723.5 $ 774.1
Year Ended December 31, 2017 2016 2015 Revenues from rental properties $ 75.4 $ 102.6 $ 122.1
Operating expenses (14.7) (27.4) (35.6)Depreciation and amortization (4.6) (6.7) (11.4)Interest expense (20.4) (26.7) (35.7)Other expense, net (5.9) (11.5) (9.2)
Income from continuing operations 29.8 30.3 30.2 Gain on sale of properties, net 4.3 5.3 6.0 Net income $ 34.1 $ 35.6 $ 36.2
73

Table of Contents
KIMCO REALTY CORPORATION AND SUBSIDIARIES
NOTES TO CONSOLIDATED FINANCIAL STATEMENTS, continued
Other Assets Kimsouth (Albertsons) – Kimsouth Realty Inc. (“Kimsouth”) is a wholly-owned subsidiary of the Company. KRS AB Acquisition, LLC (the “ABS Venture”) was a subsidiary of Kimsouththat had a combined 14.35% noncontrolling interest (of which the Company held 9.8% and the two other noncontrolling members in the partnership, includingColony NorthStar, Inc. (“Colony NorthStar”) held a 4.3% ownership interest), in AB Acquisition, LLC (“AB Acquisition”). AB Acquisition was a joint venturewhich owned grocery operators Albertsons LLC (“Albertsons”), NAI Group Holdings Inc. (“NAI”) and Safeway Inc. (“Safeway”). The Company held acontrolling interest in the ABS Venture and consolidated this entity. Richard B. Saltzman, a member of the Board of Directors of the Company, is the chiefexecutive officer and president of Colony NorthStar. As of December 31, 2016, the ABS Venture was reflected on the Company ’s Consolidated Balance Sheets asa gross investment of $205.1 million which was included in Other assets and $64.9 million which was included in noncontrolling interest. During June 2017, the Company and ABS Venture received an aggregate cash distribution of $34.6 million from Albertsons, of which the Company ’s combinedshare was $23.7 million with the remaining $10.9 million distributed to the two noncontrolling interest members in the ABS Venture. This distribution exceeded theCompany’s carrying basis in its Albertson’s investment and as such was recognized as income and is included in Equity in income from other real estateinvestments, net on the Company’s Consolidated Statements of Income. During December 2017, Albertsons, NAI and Safeway were merged into a single corporate entity Albertsons Companies, Inc. (“ACI”). In addition, the Companyliquidated the ABS Venture, its consolidated partnership with Colony NorthStar and its other noncontrolling member, which held investments in Albertsons, NAIand Safeway. As a result of these transactions, the Company now owns 9.74% of the common stock of ACI through two newly formed wholly-ownedpartnerships and accounts for this investment on the cost method. The liquidation of the ABS Venture resulted in the elimination of the previous noncontrollingmember’s, including Colony NorthStar’s noncontrolling interest of $64.9 million, and a corresponding reduction in other assets to reflect the Company’s netinvestment in ACI of $140.2 million. The Company’s net investment in ACI is included in Other assets on the Company’s Consolidated Balance Sheets. Theprevious two noncontrolling members now own their respective interests in ACI directly and are no longer in a joint venture partnership with the Company. On February 20, 2018, ACI announced the execution of a definitive merger agreement under which ACI will acquire all the outstanding shares of Rite Aid Corp.(NYSE: RAD). This agreement is subject to customary closing conditions.
9. Variable Interest Entities (“VIE”):
Included within the Company’s consolidated operating properties at December 31, 2017, are 24 consolidated entities that are VIEs, for which the Company is theprimary beneficiary. These entities have been established to own and operate real estate property. The Company’s involvement with these entities is through itsmajority ownership and management of the properties. The entities were deemed VIEs primarily because the unrelated investors do not have substantive kick-outrights to remove the general or managing partner by a vote of a simple majority or less and they do not have substantive participating rights. The Companydetermined that it was the primary beneficiary of these VIEs as a result of its controlling financial interest. At December 31, 2017, total assets of these VIEs were$1.2 billion and total liabilities were $383.5 million. The majority of the operations of these VIEs are funded with cash flows generated from the properties. The Company has not provided financial support to any ofthese VIEs that it was not previously contractually required to provide, which consists primarily of funding any capital expenditures, including tenantimprovements, which are deemed necessary to continue to operate the entity and any operating cash shortfalls that the entity may experience. Additionally, included within the Company’s real estate development projects at December 31, 2017, are three consolidated entities that are VIEs, for which theCompany is the primary beneficiary. These entities have been established to develop real estate properties to hold as long-term investments. The Company’sinvolvement with these entities is through its majority ownership and management of the properties. These entities were deemed VIEs primarily because theequity investments at risk are not sufficient to permit the entities to finance their activities without additional financial support. The initial equity contributed tothese entities was not sufficient to fully finance the real estate construction as development costs are funded by the partners throughout the construction period.The Company determined that it was the primary beneficiary of these VIEs as a result of its controlling financial interest. At December 31, 2017, total assets ofthese real estate development VIEs were $307.9 million and total liabilities were $34.2 million. Substantially all the projected remaining development costs to be funded for these real estate development projects, aggregating $147.7 million, will be fundedwith capital contributions from the Company, when contractually obligated. The Company has not provided financial support to these VIEs that it was notpreviously contractually required to provide.
74

Table of Contents
KIMCO REALTY CORPORATION AND SUBSIDIARIES
NOTES TO CONSOLIDATED FINANCIAL STATEMENTS, continued
All liabilities of these VIEs are non-recourse to the Company (“VIE Liabilities”). Of the 27 total VIEs, 22 are unencumbered and the assets of these VIEs are notrestricted for use to settle only the obligations of these VIEs. The remaining five VIEs are encumbered by third party non-recourse mortgage debt. The assetsassociated with these encumbered VIEs (“Restricted Assets”) are collateral under the respective mortgages and are therefore restricted and can only be used tosettle the corresponding liabilities of the VIE. The classification of the Restricted Assets and VIE Liabilities on the Company’s Consolidated Balance Sheets are asfollows (in millions):
December 31, 2017 December 31, 2016 Restricted Assets:
Real estate, net $ 627.5 $ 326.9 Cash and cash equivalents 9.8 3.8 Accounts and notes receivable, net 3.2 1.6 Other assets 4.5 1.4
Total Restricted Assets $ 645.0 $ 333.7 VIE Liabilities:
Mortgages payable, net $ 340.9 $ 138.6 Other liabilities 76.8 37.6
Total VIE Liabilities $ 417.7 $ 176.2
10. Mortgages and Other Financing Receivables:
The Company has various mortgages and other financing receivables which consist of loans acquired and loans originated by the Company. For a completelisting of the Company’s mortgages and other financing receivables at December 31, 2017, see Financial Statement Schedule IV included in this annual report onForm 10-K. The following table reconciles mortgage loans and other financing receivables from January 1, 2015 to December 31, 2017 (in thousands):
2017 2016 2015 Balance at January 1, $ 23,197 $ 23,824 $ 74,013 Additions:
New mortgage loans - - 5,730 Foreign currency translation 385 397 - Amortization of loan discounts 112 112 112
Deductions: Loan repayments - - (53,646)Charge off/foreign currency translation (449) (213) (884)Collections of principal (1,405) (921) (1,499)Amortization of loan costs (2) (2) (2)
Balance at December 31, $ 21,838 $ 23,197 $ 23,824 The Company reviews payment status to identify performing versus non-performing loans. As of December 31, 2017, the Company had a total of 11 loans, all ofwhich were identified as performing loans.
75

Table of Contents
KIMCO REALTY CORPORATION AND SUBSIDIARIES
NOTES TO CONSOLIDATED FINANCIAL STATEMENTS, continued 11. Marketable Securities:
The amortized cost and gross unrealized gains/(losses) of securities available-for-sale and held-to-maturity at December 31, 2017 and 2016, are as follows (inthousands):
December 31, 2017
Amortized Cost Gross Unrealized
Losses Total Available-for-sale:
Equity securities $ 13,072 $ (1,136) $ 11,936 Held-to-maturity:
Debt securities 1,329 - 1,329 Total marketable securities $ 14,401 $ (1,136) $ 13,265
December 31, 2016
Amortized Cost Gross Unrealized
Gains Total Available-for-sale:
Equity securities $ 6,096 $ 406 $ 6,502 Held-to-maturity:
Debt securities 1,599 - 1,599 Total marketable securities $ 7,695 $ 406 $ 8,101
During 2017, the Company acquired available-for-sale marketable equity securities for an aggregate purchase price of $9.8 million. During 2015, the Company received $76.2 million in proceeds from the sale or redemption of certain marketable securities and recognized $39.9 million of realizablegains. As of December 31, 2017, the contractual maturities of debt securities classified as held-to-maturity are within the next five years. Actual maturities may differ fromcontractual maturities as issuers may have the right to prepay debt obligations with or without prepayment penalties.
12. Notes Payable:
As of December 31, 2017 and 2016 the Company’s Notes payable, net consisted of the following (dollars in millions):
Carrying Amount at
December 31, Interest Rate atDecember 31, Maturity Date at
2017 2016 2017 2016 December 31, 2017 Senior Unsecured Notes $ 4,650.0 $ 3,400.0 2.70% - 6.88% 2.70% - 6.88% Oct-2019 – Sep-2047 Credit Facility 8.0 25.0 (a) (a) Mar-2021 Medium Term Notes (“MTN”) - 300.0 - 4.30% n/a Term Loan - 250.0 - (b) n/a Deferred financing costs, net (61.9) (47.7) n/a n/a n/a $ 4,596.1 $ 3,927.3 3.70%* 3.58%* * Weighted-average interest rate(a) During February 2017, the Company repaid the outstanding balance on the Company’s $1.75 billion credit facility and terminated the agreement. Interest rate was
equal to LIBOR plus 0.925% (1.67% at December 31, 2016). The Company then closed on a $2.25 billion unsecured revolving credit facility which is scheduled tomature in March 2021, with two additional six-month options to extend the maturity date, and accrues interest at a rate of LIBOR plus 0.875% (2.28% at December31, 2017).
(b) During January 2017, the Company repaid the remaining $250.0 million balance and terminated the agreement. Interest rate was equal to LIBOR plus 0.95% (1.60%at December 31, 2016). During the years ended December 31, 2017 and 2016, the Company issued the following Senior Unsecured Notes (dollars in millions):
Date Issued Maturity Date Amount Issued Interest Rate Aug-17 Feb-25 $ 500.0 3.30% Aug-17 Sep-47 $ 350.0 4.45% Mar-17 Apr-27 $ 400.0 3.80% Nov-16 Mar-24 $ 400.0 2.70% Nov-16 Dec-46 $ 350.0 4.125% Aug-16 Oct-26 $ 500.0 2.80% May-16 Apr-45 $ 150.0 4.25%
76

Table of Contents
KIMCO REALTY CORPORATION AND SUBSIDIARIES
NOTES TO CONSOLIDATED FINANCIAL STATEMENTS, continued
During the years ended December 31, 2017 and 2016, the Company repaid the following notes (dollars in millions):
Type Date Paid Amount Repaid (USD) Interest Rate Maturity Date MTN (1) Aug-17 & Nov-17 $ 300.0 4.300% Feb-18
Term Loan Jan-17 $ 250.0 LIBOR + 0.95% Jan-17 Canadian Notes Payable (2) Aug-16 $ 270.9 (2) (2) Senior Unsecured Note (3) Aug-16 $ 290.9 5.700% May-17
MTN Mar-16 $ 300.0 5.783% Mar-16 (1) On August 1, 2017, the Company made a tender offer to purchase any and all of these MTN notes outstanding. As a result, the Company accepted the tender
of $211.0 million of its $300.0 million outstanding MTN notes on August 10, 2017. In connection with this tender offer, the Company recorded a tenderpremium of $1.8 million resulting from the partial repayment of the MTN notes. In addition, in November 2017, the Company redeemed the remaining $89.0million outstanding MTN notes.
(2) On August 26, 2016, the redemption date, the Company repaid (i) its Canadian denominated (“CAD”) $150.0 million 5.99% notes, which were scheduled tomature in April 2018 and (ii) its CAD $200.0 million 3.855% notes, which were scheduled to mature in August 2020. The Company recorded aggregate earlyextinguishment of debt charges of CAD $34.1 million (USD $26.3 million) resulting from the early repayment of these notes.
(3) The Company recorded an early extinguishment of debt charge of $10.2 million resulting from the early repayment of this note.
The scheduled maturities of all unsecured notes payable excluding unamortized debt issuance costs of $61.9 million, as of December 31, 2017, were as follows (inmillions): 2018 2019 2020 2021 2022 Thereafter Total Principal payments $ - $ 300.0 $ - $ 508.0 $ 500.0 $ 3,350.0 $ 4,658.0 The Company’s supplemental indentures governing its Senior Unsecured Notes contain covenants whereby the Company is subject to maintaining (a) certainmaximum leverage ratios on both unsecured senior corporate and secured debt, minimum debt service coverage ratios and minimum equity levels, (b) certain debtservice ratios and (c) certain asset to debt ratios. In addition, the Company is restricted from paying dividends in amounts that exceed by more than $26.0 millionthe funds from operations, as defined, generated through the end of the calendar quarter most recently completed prior to the declaration of such dividend;however, this dividend limitation does not apply to any distributions necessary to maintain the Company's qualification as a REIT providing the Company is incompliance with its total leverage limitations. The Company was in compliance with all of the covenants as of December 31, 2017.
Interest on the Company’s fixed-rate Senior Unsecured Notes is payable semi-annually in arrears. Proceeds from these issuances were primarily used for theacquisition of shopping centers, the expansion and improvement of properties in the Company’s portfolio and the repayment of certain debt obligations of theCompany. Credit Facility In February 2017, the Company closed on a $2.25 billion unsecured revolving credit facility (the “Credit Facility”) with a group of banks, which is scheduled toexpire in March 2021, with two additional six-month options to extend the maturity date, at the Company’s discretion, to March 2022. This Credit Facility, whichaccrues interest at a rate of LIBOR plus 87.5 basis points (2.28% as of December 31, 2017), can be increased to $2.75 billion through an accordion feature. TheCredit Facility replaced the Company’s $1.75 billion unsecured revolving credit facility that was scheduled to mature in March 2018. In addition, the Credit Facilityincludes a $500.0 million sub-limit which provides the Company the opportunity to borrow in alternative currencies including Canadian Dollars, British PoundsSterling, Japanese Yen or Euros. Pursuant to the terms of the Credit Facility, the Company, among other things, is subject to covenants requiring the maintenanceof (i) maximum leverage ratios on both unsecured and secured debt and (ii) minimum interest and fixed coverage ratios. As of December 31, 2017, the CreditFacility had a balance of CAD 10.0 million (USD $8.0 million) outstanding and $0.5 million appropriated for letters of credit.
77

Table of Contents
KIMCO REALTY CORPORATION AND SUBSIDIARIES
NOTES TO CONSOLIDATED FINANCIAL STATEMENTS, continued
Term Loan
The Company had a $650.0 million unsecured term loan (“Term Loan”) which was scheduled to mature in January 2017, with three one-year extension options atthe Company’s discretion. The Term Loan accrued interest at LIBOR plus 95 basis points. During November 2016, the Company repaid $400.0 million ofborrowings under the Company’s Term Loan and in January 2017, the Company repaid the remaining $250.0 million balance and terminated the agreement.
13. Mortgages Payable:
Mortgages payable, collateralized by certain shopping center properties (see Financial Statement Schedule III included in this annual report on Form 10-K) andrelated tenants' leases, are generally due in monthly installments of principal and/or interest. As of December 31, 2017 and 2016, the Company’s Mortgagespayable, net consisted of the following (in millions):
Carrying Amount at
December 31, Interest Rate atDecember 31, Maturity Date at
2017 2016 2017 2016 December 31, 2017 Mortgages payable $ 867.1 $ 1,114.4 2.60% - 9.75% 1.91% - 9.41% Jan-2018 – Aug-2031 Fair value debt adjustments, net 19.3 27.7 n/a n/a n/a Deferred financing costs, net (3.6) (3.0) n/a n/a n/a $ 882.8 $ 1,139.1 4.57%* 4.94%*
* Weighted-average interest rate
During 2017, the Company (i) assumed/consolidated $257.5 million of individual non-recourse mortgage debt (including a fair market value adjustment of $8.5million) related to two operating properties, (ii) paid off $692.9 million of mortgage debt (including fair market value adjustments of $5.8 million) that encumbered 27operating properties and (iii) obtained a $206.0 million non-recourse mortgage relating to one operating property. During 2016, the Company (i) assumed $289.0 million of individual non-recourse mortgage debt relating to the acquisition of 10 properties, including $4.3 millionassociated with fair value debt adjustments and (ii) paid off $703.0 million of mortgage debt (including fair market value adjustment of $2.1 million) thatencumbered 47 operating properties. In connection with the early prepayment of certain of these mortgages, the Company recorded an early extinguishment ofdebt charge of $9.2 million. Additionally, during 2016, the Company disposed of an encumbered property through foreclosure. This transaction resulted in a net decrease in mortgage debt of$25.6 million (including fair market value adjustment of $0.4 million) and a gain on forgiveness of debt of $3.1 million, which is included in Other (expense)/income,net in the Company’s Consolidated Statements of Income. The scheduled principal payments (excluding any extension options available to the Company) of all mortgages payable, excluding unamortized fair value debtadjustments and unamortized debt issuance costs, as of December 31, 2017, were as follows (in millions): 2018 2019 2020 2021 2022 Thereafter Total Principal payments $ 98.4 $ 115.7 $ 136.4 $ 145.4 $ 140.6 $ 230.6 $ 867.1
14. Noncontrolling Interests:
Noncontrolling interests represent the portion of equity that the Company does not own in those entities it consolidates as a result of having a controllinginterest or determined that the Company was the primary beneficiary of a VIE in accordance with the provisions of the FASB’s Consolidation guidance. TheCompany accounts and reports for noncontrolling interests in accordance with the Consolidation guidance and the Distinguishing Liabilities from Equityguidance issued by the FASB. The Company identifies its noncontrolling interests separately within the equity section on the Company’s Consolidated BalanceSheets. The amounts of consolidated net income attributable to the Company and to the noncontrolling interests are presented separately on the Company’sConsolidated Statements of Income. During the year ended December 31, 2017, there were various acquisitions and dispositions/liquidations of entities that hadan impact on noncontrolling interest. See Footnotes 3, 4, and 8 of the Notes to Consolidated Financial Statements for additional information regarding specifictransactions.
78

Table of Contents
KIMCO REALTY CORPORATION AND SUBSIDIARIES
NOTES TO CONSOLIDATED FINANCIAL STATEMENTS, continued
Included within noncontrolling interests are units that were determined to be contingently redeemable that are classified as Redeemable noncontrolling interestsand presented in the mezzanine section between Total liabilities and Stockholder’s equity on the Company’s Consolidated Balance Sheets. The following table presents the change in the redemption value of the Redeemable noncontrolling interests for the years ended December 31, 2017 and 2016 (inthousands):
2017 2016 Balance at January 1, $ 86,953 $ 86,709
Issuance of redeemable partnership interests (1) 10,000 - Income (2) 1,297 4,349 Redemption/conversion of redeemable units (3) (79,569) - Distributions (2,538) (4,105)
Balance at December 31, $ 16,143 $ 86,953
(1) During 2017, KIM Lincoln, a wholly owned subsidiary of the Company, and Lincoln Member entered into a joint venture agreement wherein KIM Lincoln hasa 90% controlling interest and Lincoln Member has a 10% noncontrolling interest (See Footnote 4 of the Notes to Consolidated Financial Statements).
(2) Includes $1.0 million in fair market value remeasurement for the year ended December 31, 2017.
(3) During 2017, the Company redeemed the remaining 79,642,697 Preferred A Units for a total redemption price of $79.9 million, including an accrued preferred
return of $0.4 million. These units, which had a par value of $1.00 and return per annum of 5.0%, were issued along with Puerto Rico shopping centeracquisitions discussed below.
The Company owns seven shopping center properties located throughout Puerto Rico. These properties were acquired partially through the issuance of $158.6million of non-convertible units and $45.8 million of convertible units. Noncontrolling interests related to these acquisitions totaled $233.0 million of units,including premiums of $13.5 million and a fair market value adjustment of $15.1 million (collectively, the "Units"). Noncontrolling interests relating to the remainingunits were $5.2 million and $86.2 million as of December 31, 2017 and 2016, respectively. The Units, related annual cash distribution rates and related conversionfeatures consisted of the following as of December 31, 2017:
Type Par ValuePer Unit
Number of UnitsRemaining Return Per Annum
Class B-1 Preferred Units (1) $ 10,000 189 7.0% Class B-2 Preferred Units (2) $ 10,000 42 7.0%
Class C DownReit Units (1) $ 30.52 52,797 Equal to the Company’s common stock
dividend
(1) These units are redeemable for cash by the holder or at the Company’s option, shares of the Company’s common stock, based upon the conversioncalculation as defined in the agreement. These units are included in Noncontrolling interests on the Company’s Consolidated Balance Sheets.
(2) These units are redeemable for cash by the holder or callable by the Company and are included in Redeemable noncontrolling interests on the Company’sConsolidated Balance Sheets.
The Company owns a shopping center located in Bay Shore, NY, which was acquired in 2006 with the issuance of 647,758 redeemable Class B Units at a par valueof $37.24 per unit. The units accrue a return equal to the Company’s common stock dividend and are redeemable for cash by the holder or at the Company’soption, shares of the Company’s common stock at a ratio of 1:1. These units are callable by the Company any time after April 3, 2026, and are included inNoncontrolling interests on the Company’s Consolidated Balance Sheets. During 2007, 30,000 units, or $1.1 million par value, of the Class B Units were redeemedand at the Company’s option settled in cash. In addition, during 2017, 25,000 units, or $0.9 million par value, of the Class B Units were redeemed and at theCompany’s option settled in cash. As of December 31, 2017 and 2016, noncontrolling interest relating to the remaining Class B Units was $25.4 million and $26.5million, respectively. Noncontrolling interests also includes 138,015 convertible units issued during 2006 by the Company, which were valued at $5.3 million, including a fair marketvalue adjustment of $0.3 million, related to an interest acquired in an office building located in Albany, NY. These units are currently redeemable at the option ofthe holder for cash or at the option of the Company for the Company’s common stock at a ratio of 1:1. The holder is entitled to a distribution equal to the dividendrate of the Company’s common stock. The Company was restricted from disposing of these assets, other than through a tax-free transaction, through January2017.
79

Table of Contents
KIMCO REALTY CORPORATION AND SUBSIDIARIES
NOTES TO CONSOLIDATED FINANCIAL STATEMENTS, continued 15. Fair Value Disclosure of Financial Instruments:
All financial instruments of the Company are reflected in the accompanying Consolidated Balance Sheets at amounts which, in management’s estimation, basedupon an interpretation of available market information and valuation methodologies, reasonably approximate their fair values except those listed below, for whichfair values are disclosed. The valuation method used to estimate fair value for fixed-rate and variable-rate debt is based on discounted cash flow analyses, withassumptions that include credit spreads, market yield curves, trading activity, loan amounts and debt maturities. The fair values for marketable securities arebased on published values, securities dealers’ estimated market values or comparable market sales. Such fair value estimates are not necessarily indicative of theamounts that would be realized upon disposition. As a basis for considering market participant assumptions in fair value measurements, the FASB’s Fair Value Measurements and Disclosures guidanceestablishes a fair value hierarchy that distinguishes between market participant assumptions based on market data obtained from sources independent of thereporting entity (observable inputs that are classified within Levels 1 and 2 of the hierarchy) and the reporting entity’s own assumptions about market participantassumptions (unobservable inputs classified within Level 3 of the hierarchy). The following are financial instruments for which the Company’s estimate of fair value differs from the carrying amounts (in thousands):
December 31, 2017 2016
CarryingAmounts
EstimatedFair Value
CarryingAmounts
EstimatedFair Value
Notes payable (1) $ 4,596,140 $ 4,601,479 $ 3,927,251 $ 3,890,797 Mortgages payable (2) $ 882,787 $ 881,427 $ 1,139,117 $ 1,141,047
(1) The Company determined that the valuation of its Senior Unsecured Notes and MTN notes were classified within Level 2 of the fair value hierarchy and itsTerm Loan and Credit Facility were classified within Level 3 of the fair value hierarchy. The estimated fair value amounts classified as Level 2 as of December31, 2017 and 2016, were $4.6 billion and $3.6 billion, respectively. The estimated fair value amounts classified as Level 3 as of December 31, 2017 and 2016,were $1.9 million and $272.5 million, respectively.
(2) The Company determined that its valuation of these Mortgages payable was classified within Level 3 of the fair value hierarchy. The Company has certain financial instruments that must be measured under the FASB’s Fair Value Measurements and Disclosures guidance, including availablefor sale securities. The Company currently does not have non-financial assets and non-financial liabilities that are required to be measured at fair value on arecurring basis. In instances where the determination of the fair value measurement is based on inputs from different levels of the fair value hierarchy, the level in the fair valuehierarchy within which the entire fair value measurement falls is based on the lowest level input that is significant to the fair value measurement in its entirety. TheCompany’s assessment of the significance of a particular input to the fair value measurement in its entirety requires judgment, and considers factors specific tothe asset or liability. The Company from time to time has used interest rate swaps to manage its interest rate risk. The fair values of interest rate swaps are determined using the marketstandard methodology of netting the discounted future fixed cash receipts (or payments) and the discounted expected variable cash payments (or receipts). Thevariable cash payments (or receipts) are based on an expectation of future interest rates (forward curves) derived from observable market interest rate curves. Based on these inputs, the Company has determined that interest rate swap valuations are classified within Level 2 of the fair value hierarchy.
80

Table of Contents
KIMCO REALTY CORPORATION AND SUBSIDIARIES
NOTES TO CONSOLIDATED FINANCIAL STATEMENTS, continued
The tables below present the Company’s financial assets and liabilities measured at fair value on a recurring basis as of December 31, 2017 and 2016, aggregatedby the level in the fair value hierarchy within which those measurements fall (in thousands):
Balance at
December 31, 2017 Level 1 Level 2 Level 3 Assets:
Marketable equity securities $ 11,936 $ 11,936 $ - $ - Liabilities:
Interest rate swaps $ 344 $ - $ 344 $ -
Balance at
December 31, 2016 Level 1 Level 2 Level 3 Assets:
Marketable equity securities $ 6,502 $ 6,502 $ - $ - Liabilities:
Interest rate swaps $ 975 $ - $ 975 $ - Assets measured at fair value on a non-recurring basis at December 31, 2017 and 2016 are as follows (in thousands):
Balance at
December 31, 2017 Level 1 Level 2 Level 3 Real estate $ 108,313 $ - $ - $ 108,313
Balance at
December 31, 2016 Level 1 Level 2 Level 3 Real estate $ 117,930 $ - $ - $ 117,930 During the year ended December 31, 2017, the Company recognized impairment charges related to adjustments to property carrying values of $67.3 million. TheCompany’s estimated fair values of these properties were primarily based upon estimated sales prices from (i) signed contracts or letters of intent from third partyoffers or (ii) discounted cash flow models. The Company does not have access to the unobservable inputs used to determine the estimated fair values of thirdparty offers. For the discounted cash flow models, the capitalization rates primarily range from 8.50% to 9.50% and discount rates primarily range from 9.00% to10.50% which were utilized in the models based upon unobservable rates that the Company believes to be within a reasonable range of current market rates foreach respective investment. Based on these inputs, the Company determined that its valuation of these investments was classified within Level 3 of the fair valuehierarchy. During the year ended December 31, 2016, the Company recognized impairment charges related to adjustments to property carrying values of $93.3 million. TheCompany’s estimated fair values were primarily based upon estimated sales prices from third party offers that were based on signed contracts, appraisals orletters of intent for which the Company does not have access to the unobservable inputs used to determine these estimated fair values. For the appraisals, thecapitalization rates primarily range from 7.75% to 9.00% and discount rates primarily range from 9.25% to 12.17% which were utilized in the models based uponunobservable rates that the Company believes to be within a reasonable range of current market rates for each respective investment. Based on these inputs, theCompany determined that its valuation of these investments was classified within Level 3 of the fair value hierarchy. The property carrying value impairment charges resulted from the Company’s efforts to market certain assets and management’s assessment as to the likelihoodand timing of such potential transactions.
81

Table of Contents
KIMCO REALTY CORPORATION AND SUBSIDIARIES
NOTES TO CONSOLIDATED FINANCIAL STATEMENTS, continued 16. Preferred Stock, Common Stock and Convertible Unit Transactions:
Preferred Stock The Company’s outstanding Preferred Stock is detailed below (in thousands, except share information and par values):
As of December 31, 2017
Class ofPreferred
Stock Shares
Authorized
SharesIssued and
Outstanding
LiquidationPreference
(in thousands) Dividend
Rate
AnnualDividend perDepositary
Share
Par
Value
OptionalRedemption
DateClass I 18,400 7,000 $ 175,000 6.000% $ 1.50000 $ 1.00 3/20/2017Class J 9,000 9,000 225,000 5.500% $ 1.37500 $ 1.00 7/25/2017Class K 8,050 7,000 175,000 5.625% $ 1.40625 $ 1.00 12/7/2017Class L 10,350 9,000 225,000 5.125% $ 1.28125 $ 1.00 8/16/2022Class M 10,580 9,200 230,000 5.250% $ 1.31250 $ 1.00 12/20/2022 41,200 $ 1,030,000
As of December 31, 2016
Class ofPreferred
Stock Shares
Authorized
SharesIssued and
Outstanding
LiquidationPreference
(in thousands) Dividend
Rate
AnnualDividend perDepositary
Share
Par
Value
OptionalRedemption
DateClass I 18,400 16,000 $ 400,000 6.000% $ 1.50000 $ 1.00 3/20/2017Class J 9,000 9,000 225,000 5.500% $ 1.37500 $ 1.00 7/25/2017Class K 8,050 7,000 175,000 5.625% $ 1.40625 $ 1.00 12/7/2017 32,000 $ 800,000
The following Preferred Stock classes were issued during the year ended December 31, 2017:
Class ofPreferred Stock
DateIssued
DepositarySharesIssued
FractionalInterest per
Share
Net Proceeds,Before Expenses
(in millions) Offering
Price Class L 8/16/2017 9,000,000 1/1000 $ 218.1 25.00 Class M 12/20/2017 9,200,000 1/1000 $ 222.8 25.00
During January 2018, the underwriting financial institutions for the Class M issuance elected to exercise the over-allotment option and as a result, the Companyissued an additional 1,380,000 Class M Depositary Shares, each representing a one-thousandth fractional interest in a share of the Company's 5.250% Class MCumulative Redeemable Preferred Stock, $1.00 par value per share. The Company received net proceeds before expenses of $33.4 million from this offering.
The following Preferred Stock classes were redeemed or partially redeemed during the years ended December 31, 2017, 2016 and 2015:
Classes ofPreferred Stock
RedemptionDate
DepositaryShares
Redeemed Redemption
Price
RedemptionAmount
(in millions)
RedemptionCharges (inmillions) (1)
Class I (2) 9/6/2017 9,000,000 $ 25.00 $ 225.0 $ 7.0 Class H 11/25/2015 7,000,000 $ 25.00 $ 175.0 $ 5.8
(1) Redemption charges resulting from the difference between the redemption amount and the carrying amount of the respective preferred stock class on the
Company’s Consolidated Balance Sheets are accounted for in accordance with the FASB’s guidance on Distinguishing Liabilities from Equity. These chargeswere subtracted from net income/(loss) attributable to the Company to arrive at net income/(loss) available to the Company’s common shareholders and used inthe calculation of earnings per share.
(2) The Company partially redeemed 9,000,000 depositary shares of its issued and outstanding Class I Preferred Stock, representing 56.25% of the issued andoutstanding Class I Preferred Stock. The Company’s Preferred Stock Depositary Shares for all classes are not convertible or exchangeable for any other property or securities of the Company. Voting Rights - The Class I, J, K, L and M Preferred Stock rank pari passu as to voting rights, priority for receiving dividends and liquidation preference as setforth below.
82

Table of Contents
KIMCO REALTY CORPORATION AND SUBSIDIARIES
NOTES TO CONSOLIDATED FINANCIAL STATEMENTS, continued
As to any matter on which the Class I, J, K, L or M Preferred Stock may vote, including any actions by written consent, each share of the Class I, J, K, L or MPreferred Stock shall be entitled to 1,000 votes, each of which 1,000 votes may be directed separately by the holder thereof. With respect to each share of Class I,J, K, L or M Preferred Stock, the holder thereof may designate up to 1,000 proxies, with each such proxy having the right to vote a whole number of votes (totaling1,000 votes per share of Class I, J, K, L, or M Preferred Stock). As a result, each Class I, J, K, L or M Depositary Share is entitled to one vote. Liquidation Rights In the event of any liquidation, dissolution or winding up of the affairs of the Company, preferred stock holders are entitled to be paid, out of the assets of theCompany legally available for distribution to its stockholders, a liquidation preference of $25,000.00 Class I Preferred Stock per share, $25,000.00 Class J PreferredStock per share, $25,000.00 Class K Preferred Stock per share, $25,000.00 Class L Preferred Stock per share and $25,000.00 Class M Preferred Stock per share($25.00 per each Class I, Class J, Class K, Class L and Class M Depositary Share), plus an amount equal to any accrued and unpaid dividends to the date ofpayment, before any distribution of assets is made to holders of the Company’s common stock or any other capital stock that ranks junior to the preferred stockas to liquidation rights. Common Stock During February 2018, the Company’s Board of Directors authorized a share repurchase program, pursuant to which the Company may repurchase shares of itscommon stock, par value $0.01 per share, with an aggregate gross purchase price of up to $300.0 million. During February 2015, the Company established an at the market continuous offering program (the “ATM program”), which is effective for a term of three years,pursuant to which the Company may offer and sell shares of its common stock, par value $0.01 per share, with an aggregate gross sales price of up to $500.0million through a consortium of banks acting as sales agents. Sales of the shares of common stock may be made, as needed, from time to time in “at the market”offerings as defined in Rule 415 of the Securities Act of 1933, including by means of ordinary brokers’ transactions on the New York Stock Exchange (the“NYSE”) or otherwise (i) at market prices prevailing at the time of sale, (ii) at prices related to prevailing market prices or (iii) as otherwise agreed to with theapplicable sales agent. During the year ended December 31, 2016, the Company issued 9,806,377 shares and received proceeds of $285.2 million, net ofcommissions and fees of $2.9 million. The Company did not offer for sale any shares of common stock under the ATM program during the year ended December31, 2017. As of December 31, 2017, the Company had $211.9 million available under this ATM program. The Company, from time to time, repurchases shares of its common stock in amounts that offset new issuances of common shares relating to the exercise of stockoptions or the issuance of restricted stock awards. These repurchases may occur in open market purchases, privately negotiated transactions or otherwisesubject to prevailing market conditions, the Company’s liquidity requirements, contractual restrictions and other factors. During 2017, 2016 and 2015, theCompany repurchased 232,304 shares, 257,477 shares and 179,696 shares, respectively, relating to common shares surrendered to the Company to satisfystatutory minimum tax withholding obligations relating to the vesting of restricted stock awards under the Company’s equity-based compensation plans. Convertible Units The Company has various types of convertible units that were issued in connection with the purchase of operating properties (see Footnote 14 of the Notes toConsolidated Financial Statements). The amount of consideration that would be paid to unaffiliated holders of units issued from the Company’s consolidatedsubsidiaries which are not mandatorily redeemable, as if the termination of these consolidated subsidiaries occurred on December 31, 2017, is $18.3 million. TheCompany has the option to settle such redemption in cash or shares of the Company’s common stock. If the Company exercised its right to settle in commonstock, the unit holders would receive 1.0 million shares of common stock.
83

Table of Contents
KIMCO REALTY CORPORATION AND SUBSIDIARIES
NOTES TO CONSOLIDATED FINANCIAL STATEMENTS, continued 17. Supplemental Schedule of Non-Cash Investing/Financing Activities:
The following schedule summarizes the non-cash investing and financing activities of the Company for the years ended December 31, 2017, 2016 and 2015 (inthousands): 2017 2016 2015 Acquisition of real estate interests by assumption of mortgage debt $ 45,299 $ 33,174 $ 84,699 Acquisition of real estate interests through proceeds held in escrow $ 162,396 $ 66,044 $ 89,504 Proceeds deposited in escrow through sale of real estate interests $ 162,396 $ 66,044 $ 71,623 Disposition of real estate interests by assignment of debt $ - $ - $ 47,742 Disposition of real estate interests through the issuance of mortgage receivable $ - $ - $ 5,730 Disposition of real estate interests by foreclosure of debt $ - $ 22,080 $ - Forgiveness of debt due to foreclosure $ - $ 26,000 $ - Capital expenditures accrual $ 74,123 $ 38,044 $ 22,967 Issuance of common stock $ - $ 85 $ 493 Surrender of restricted common stock $ (5,699) $ (7,008) $ (5,682)Declaration of dividends paid in succeeding period $ 128,892 $ 124,517 $ 115,182 Change in noncontrolling interest due to liquidation of partnership $ 64,948 $ - $ - Deemed contribution from noncontrolling interest $ 10,000 $ - $ - Consolidation of Joint Ventures:
Increase in real estate and other assets $ 325,981 $ 407,813 $ 1,039,335 Increase in mortgages payable, other liabilities and noncontrolling interests $ 258,626 $ 268,194 $ 750,135
18. Transactions with Related Parties:
The Company provides management services for shopping centers owned principally by affiliated entities and various real estate joint ventures in which certainstockholders of the Company have economic interests. Such services are performed pursuant to management agreements which provide for fees based upon apercentage of gross revenues from the properties and other direct costs incurred in connection with management of the centers. Substantially all of theManagement and other fee income on the Company’s Consolidated Statements of Income constitute fees earned from affiliated entities. Reference is made toFootnotes 3, 7 and 8 of the Notes to Consolidated Financial Statements for additional information regarding transactions with related parties. Ripco Ripco Real Estate Corp. (“Ripco”) business activities include serving as a leasing agent and representative for national and regional retailers including Target,Best Buy, Kohl’s and many others, providing real estate brokerage services and principal real estate investing. Todd Cooper, an officer and 50% shareholder ofRipco, is a son of Milton Cooper, Executive Chairman of the Board of Directors of the Company. During 2017, 2016 and 2015, the Company paid brokeragecommissions of $0.4 million, $0.2 million and $0.6 million, respectively, to Ripco for services rendered primarily as leasing agent for various national tenants inshopping center properties owned by the Company. ProHEALTH ProHEALTH is a multi-specialty physician group practice offering one-stop health care. ProHEALTH’s CEO, Dr. David Cooper, M.D. is a son of Milton Cooper,Executive Chairman of the Board of Directors of the Company, and the father of Ross Cooper, President and Chief Investment Officer of the Company. ProHEALTH and/or its affiliates (“ProHEALTH”) have leasing arrangements with the Company whereby two consolidated property locations are currently underlease. Total annual base rent for these properties leased to ProHEALTH for each of the years ended December 31, 2017, 2016 and 2015 aggregated to $0.4 million. Colony NorthStar During January 2015, Colony Capital, Inc. (predecessor to Colony NorthStar) and affiliates contributed $100.0 million, to the ABS Venture, which wassubsequently contributed to AB Acquisition to facilitate the acquisition of all of the outstanding shares of Safeway. The ABS Venture held a combined 14.35%interest in AB Acquisition, of which the Company held a combined 9.8% ownership interest, Colony NorthStar held a 4.3% ownership interest and an unrelatedthird party held a 0.25% ownership interest. Richard B. Saltzman, a member of the Board of Directors of the Company, is the chief executive officer and presidentof Colony NorthStar. During December 2017, the AB Acquisition structure was reorganized such that all interests in Albertsons, NAI and Safeway are owned by a single newcorporation, ACI. In connection with this transaction, the ABS Venture was dissolved and the equity interests were distributed to the owning entities. As such,the Company now owns 9.74% of the common stock of ACI through two newly formed, wholly-owned partnerships. The Company’s previous two noncontrollingmembers, including Colony NorthStar, now own their respective interests directly and are no longer in a joint venture with the Company (see Footnote 8 of theNotes to Consolidated Financial Statements).
84

Table of Contents
KIMCO REALTY CORPORATION AND SUBSIDIARIES
NOTES TO CONSOLIDATED FINANCIAL STATEMENTS, continued 19. Commitments and Contingencies:
Operations The Company and its subsidiaries are primarily engaged in the operation of shopping centers that are either owned or held under long-term leases that expire atvarious dates through 2109. The Company and its subsidiaries, in turn, lease premises in these centers to tenants pursuant to lease agreements which provide forterms ranging generally from 5 to 25 years and for annual minimum rentals plus incremental rents based on operating expense levels and tenants' sales volumes.Annual minimum rentals plus incremental rents based on operating expense levels and percentage rents comprised 98% of total revenues from rental propertiesfor each of the three years ended December 31, 2017, 2016 and 2015. The minimum revenues from rental properties under the terms of all non-cancelable tenant leases for future years, assuming no new or renegotiated leases areexecuted for such premises, are as follows (in millions): 2018 2019 2020 2021 2022 Thereafter Minimum revenues $ 875.5 $ 820.3 $ 735.4 $ 643.6 $ 536.3 $ 2,683.2 Base rental revenues from rental properties are recognized on a straight-line basis over the terms of the related leases. The difference between the amount ofrental income contracted through leases and rental income recognized on a straight-line basis before allowances for the years ended December 31, 2017, 2016 and2015 was $15.7 million, $16.5 million and $14.8 million, respectively. Minimum rental payments to be made by the Company under the terms of all non-cancelable operating ground leases for future years are as follows (in millions): 2018 2019 2020 2021 2022 Thereafter Minimum rental payments $ 9.1 $ 9.1 $ 8.6 $ 8.6 $ 8.5 $ 138.5
Letters of Credit The Company has issued letters of credit in connection with the completion and repayment guarantees for loans encumbering certain of the Company’sdevelopment and redevelopment projects and guaranty of payment related to the Company’s insurance program. At December 31, 2017, these letters of creditaggregated $40.4 million. Other In connection with the construction of its development and redevelopment projects and related infrastructure, certain public agencies require posting ofperformance and surety bonds to guarantee that the Company’s obligations are satisfied. These bonds expire upon the completion of the improvements andinfrastructure. As of December 31, 2017, there were $20.0 million in performance and surety bonds outstanding. The Company is subject to various other legal proceedings and claims that arise in the ordinary course of business. Management believes that the final outcomeof such matters will not have a material adverse effect on the financial position, results of operations or liquidity of the Company as of December 31, 2017.
20. Incentive Plans:
The Company accounts for equity awards in accordance with FASB’s Compensation – Stock Compensation guidance which requires that all share basedpayments to employees, including grants of employee stock options, restricted stock and performance shares, be recognized in the Statement of Income over theservice period based on their fair values. Fair value is determined, depending on the type of award, using either the Monte Carlo method for performance sharesor the Black-Scholes option pricing formula, both of which are intended to estimate the fair value of the awards at the grant date. Fair value of restricted shares iscalculated based on the price on the date of grant. The Company recognized expense associated with its equity awards of $21.6 million, $19.1 million and $18.5 million, for the years ended December 31, 2017, 2016and 2015, respectively. As of December 31, 2017, the Company had $27.5 million of total unrecognized compensation cost related to unvested stockcompensation granted under the Plans. That cost is expected to be recognized over a weighted-average period of 2.7 years. The Company had 10,410,343,10,015,040 and 9,095,416 shares of the Company’s common stock available for issuance under the Plans at December 31, 2017, 2016 and 2015, respectively.
85

Table of Contents
KIMCO REALTY CORPORATION AND SUBSIDIARIES
NOTES TO CONSOLIDATED FINANCIAL STATEMENTS, continued
Stock Options During 2017, 2016 and 2015, the Company did not grant any stock options. Information with respect to stock options outstanding under the Plan for the yearsended December 31, 2017, 2016 and 2015 are as follows:
Shares
Weighted-AverageExercise Price
Per Share
AggregateIntrinsic Value
(in millions) Options outstanding, January 1, 2015 11,893,761 $ 30.23 $ 29.8
Exercised (1,019,240) $ 18.36 $ 7.4 Forfeited (1,862,080) $ 32.55
Options outstanding, December 31, 2015 9,012,441 $ 31.09 $ 27.4 Exercised (1,167,819) $ 18.03 $ 12.4 Forfeited (1,830,893) $ 39.69
Options outstanding, December 31, 2016 6,013,729 $ 32.09 $ 12.1 Exercised (83,863) $ 18.20 $ 3.4 Forfeited (2,464,920) $ 35.91
Options outstanding, December 31, 2017 3,464,946 $ 27.81 $ - Options exercisable (fully vested) -
December 31, 2015 7,617,882 $ 32.90 $ 20.0 December 31, 2016 5,144,416 $ 32.56 $ 11.3 December 31, 2017 3,464,946 $ 27.81 $ 4.0
The exercise price per share for options outstanding as of December 31, 2017 ranges from $11.54 to $40.79. The Company estimates forfeitures based on historicaldata. The weighted-average remaining contractual life for options outstanding as of December 31, 2017 was 2.3 years. The weighted-average remainingcontractual term of options currently exercisable as of December 31, 2017, was 2.3 years. As of December 31, 2017, all of the Company’s outstanding options werevested. Cash received from options exercised under the Plan was $1.5 million, $21.1 million and $18.7 million for the years ended December 31, 2017, 2016 and 2015,respectively. Restricted Stock Information with respect to restricted stock under the Plan for the years ended December 31, 2017, 2016 and 2015 are as follows:
2017 2016 2015 Restricted stock outstanding as of January 1, 1,930,732 1,712,534 1,911,145 Granted (1) 646,142 756,530 729,160 Vested (783,872) (520,539) (875,202)Forfeited (15,573) (17,793) (52,569)Restricted stock outstanding as of December 31, 1,777,429 1,930,732 1,712,534
(1) The weighted-average grant date fair value for restricted stock issued during the years ended December 31, 2017, 2016 and 2015 were $25.04, $26.15 and $25.98,respectively.
Restricted shares have the same voting rights as the Company’s common stock and are entitled to a cash dividend per share equal to the Company’s commondividend which is taxable as ordinary income to the holder. For the years ended December 31, 2017, 2016 and 2015, the dividends paid on unvested restricted shareswere $2.4 million, $2.2 million, and $1.8 million, respectively.
86

Table of Contents
KIMCO REALTY CORPORATION AND SUBSIDIARIES
NOTES TO CONSOLIDATED FINANCIAL STATEMENTS, continued
Performance Shares Information with respect to performance share awards under the Plan for the years ended December 31, 2017, 2016 and 2015 are as follows:
2017 2016 2015Performance share award outstanding as of January 1, 197,249 202,754 114,268Granted (1) 135,780 100,170 145,620Vested (2) (97,079) (105,675) (57,134)Performance share award outstanding as of December 31, 235,950 197,249 202,754 (1) The weighted-average grant date fair value for performance shares issued during the years ended December 31, 2017, 2016 and 2015 were $23.35, $28.60 and$27.87, respectively.(2) For the years ended December 31, 2017, 2016 and 2015, the corresponding common stock equivalent of these vested awards were 0, 130,080 and 91,862,respectively.
The more significant assumptions underlying the determination of fair values for these awards granted during 2017, 2016 and 2015 were as follows:
2017 2016 2015 Stock price $ 24.91 $ 26.29 $ 26.83 Dividend yield (1) 0% 0% 0%Risk-free rate 1.45% 0.87% 0.98%Volatility (2) 18.93% 18.80% 16.81%Term of the award (years) 2.88 2.88 1.88, 2.88
(1) Total Shareholder Returns , as used in the performance share awards computation, are measured based on cumulative dividend stock prices, as such a zero
percent dividend yield is utilized.(2) Volatility is based on the annualized standard deviation of the daily logarithmic returns on dividend-adjusted closing prices over the look-back period based on
the term of the award.
Other The Company maintains a 401(k)-retirement plan covering substantially all officers and employees, which permits participants to defer up to the maximumallowable amount determined by the Internal Revenue Service of their eligible compensation. This deferred compensation, together with Company matchingcontributions, which generally equal employee deferrals up to a maximum of 5% of their eligible compensation, is fully vested and funded as of December 31, 2017.The Company’s contributions to the plan were $2.1 million, $2.0 million and $2.1 million for the years ended December 31, 2017, 2016 and 2015, respectively. The Company recognized severance costs associated with employee terminations during the years ended December 31, 2017, 2016 and 2015, of $5.5 million, $1.7million and $4.8 million, respectively.
21. Income Taxes:
The Company elected to qualify as a REIT in accordance with the Code commencing with its taxable year which began January 1, 1992. To qualify as a REIT, theCompany must meet several organizational and operational requirements, including a requirement that it currently distribute at least 90% of its REIT taxableincome to its stockholders. Management intends to adhere to these requirements and maintain the Company’s REIT status. As a REIT, the Company generallywill not be subject to corporate federal income tax, provided that dividends to its stockholders equal at least the amount of its REIT taxable income. If theCompany failed to qualify as a REIT in any taxable year, it would be subject to federal income taxes at regular corporate rates (including any applicable alternativeminimum tax) and may not be permitted to elect REIT status for four subsequent taxable years. Even if the Company qualifies for taxation as a REIT, the Companyis subject to certain state and local taxes on its income and property, and federal income and excise taxes on its undistributed taxable income. In addition, taxableincome from non-REIT activities managed through TRSs is subject to federal, state and local income taxes. The Company is also subject to local taxes on certainNon-U.S. investments.
87

Table of Contents
KIMCO REALTY CORPORATION AND SUBSIDIARIES
NOTES TO CONSOLIDATED FINANCIAL STATEMENTS, continued
Reconciliation between GAAP Net Income and Federal Taxable Income The following table reconciles GAAP net income to taxable income for the years ended December 31, 2017, 2016 and 2015 (in thousands): 2017 2016 2015 (Estimated) (Actual) (Actual) GAAP net income attributable to the Company $ 426,075 $ 378,850 $ 894,115 GAAP net (income)/loss attributable to TRSs (12,164) 12,708 (6,073)GAAP net income from REIT operations (a) 413,911 391,558 888,042 Net book depreciation in excess of tax depreciation 116,106 65,194 21,515 Capitalized leasing/legal commissions - (11,984) (14,246)Deferred/prepaid/above-market and below-market rents, net (30,303) (34,097) (32,848)Fair market value debt amortization (8,495) (15,901) (19,723)Book/tax differences from restricted stock 676 (4,490) (3,094)Book/tax differences from non-qualified stock options (172) (11,301) (4,786)Book/tax differences from investments in and advances to real estate joint ventures (15,196) (20,739) (294)Book/tax difference on sale of properties (85,856) (93,704) (64,270)Foreign income tax from capital gains - 3,976 5,873 Cumulative foreign currency translation adjustment and deferred tax adjustment (1,300) - - Book adjustment to property carrying values and marketable equity securities 53,893 11,161 4,484 Taxable currency exchange gains/(losses), net 221 (8,962) (47,297)Tangible property regulation deduction (b) (52,237) (28,954) (126,957)GAAP gain on change in control of interests (71,160) (57,385) (149,407)Valuation allowance against net deferred tax assets - 51,939 - Other book/tax differences, net (6,893) 542 (2,971)Adjusted REIT taxable income $ 313,195 $ 236,853 $ 454,021 Certain amounts in the prior periods have been reclassified to conform to the current year presentation, in the table above.
(a) All adjustments to "GAAP net income from REIT operations" are net of amounts attributable to noncontrolling interest and TRSs.
(b) In September 2013, the Internal Revenue Service released final Regulations governing when taxpayers must capitalize and depreciate costs for acquiring,maintaining, repairing and replacing tangible property and when taxpayers must deduct such costs as repairs. Pursuant to these Regulations the Companydeducted certain expenditures that would previously have been capitalized for tax purposes. The Regulations also allowed the Company to make an electionto immediately deduct certain amounts that were capitalized in previous years but qualify as repairs under the new Regulations. The Company made suchelection in 2015 and deducted approximately $85.9 million.
Characterization of Distributions The following characterizes distributions paid for tax purposes for the years ended December 31, 2017, 2016 and 2015, (amounts in thousands): 2017 2016 2015 Preferred H Dividends Ordinary income $ - - $ - - $ - - Capital gain - - - - 13,417 100% $ - - $ - - $ 13,417 100%Preferred I Dividends Ordinary income $ 21,636 96% $ 16,320 68% $ - - Capital gain 902 4% 7,680 32% 24,000 100% $ 22,538 100% $ 24,000 100% $ 24,000 100%Preferred J Dividends Ordinary income $ 11,880 96% $ 8,415 68% $ - - Capital gain 495 4% 3,960 32% 12,375 100% $ 12,375 100% $ 12,375 100% $ 12,375 100%Preferred K Dividends Ordinary income $ 9,450 96% $ 6,694 68% $ - - Capital gain 394 4% 3,150 32% 9,844 100% $ 9,844 100% $ 9,844 100% $ 9,844 100%Preferred L Dividends Ordinary income $ 1,814 96% $ - - $ - - Capital gain 76 4% - - - - $ 1,890 100% $ - - $ - - Common Dividends Ordinary income $ 260,573 57% $ 263,892 62% $ - - Capital gain 9,143 2% 127,689 30% 394,400 100%Return of capital 187,430 41% 34,050 8% - - $ 457,146 100% $ 425,631 100% $ 394,400 100%Total dividends distributed for tax purposes $ 503,793 $ 471,850 $ 454,036 For the years ended December 31, 2017, 2016 and 2015 cash dividends paid for tax purposes were equivalent to, or in excess of, the dividends paid deduction.
88

Table of Contents
KIMCO REALTY CORPORATION AND SUBSIDIARIES
NOTES TO CONSOLIDATED FINANCIAL STATEMENTS, continued
Taxable REIT Subsidiaries and Taxable Entities The Company is subject to federal, state and local income taxes on income reported through its TRS activities, which include wholly-owned subsidiaries of theCompany. The Company’s TRSs included KRS, FNC Realty Corporation, Kimco Insurance Company (collectively “KRS Consolidated”) and the consolidatedentity, Blue Ridge Real Estate Company/Big Boulder Corporation. As part of the Company’s overall strategy to simplify its business model, the Company mergedKRS, a TRS holding REIT-qualifying real estate and the Company’s investment in Albertsons, into a wholly-owned LLC and KRS was dissolved effective August1, 2016. Any non-REIT qualifying assets or activities received by the Company in the Merger were transferred to a newly formed TRS, Kimco Realty Services II,Inc. On December 22, 2017, the Tax Cuts and Jobs Act was signed into law, making significant changes to taxation of corporations and individuals. Effective for taxyears beginning on January 1, 2018, this tax reform law reduces the federal statutory income tax rate from 35% to 21% for corporations and changed other certaintax provisions and deductions. ASC 740, Income Taxes, requires the effects of changes in tax rates and laws on deferred tax balances to be recognized in theperiod in which the legislation is enacted. As a result, the Company remeasured its deferred tax assets and liabilities and recorded a tax provision of $1.1 millionduring 2017. The Company is also subject to local non-U.S. taxes on certain investments located outside the U.S. In general, under local country law applicable to the entityownership structures the Company has in place and applicable tax treaties, the repatriation of cash to the Company from its subsidiaries and joint ventures inCanada, Puerto Rico and Mexico generally is not subject to withholding tax. The Company is subject to and includes in its tax provision non-U.S. income taxes oncertain investments located in jurisdictions outside the U.S. These investments are primarily held by the Company at the REIT level and not in the Company’staxable REIT subsidiary. Accordingly, the Company does not expect a U.S. income tax impact associated with the repatriation of undistributed earnings from theCompany’s foreign subsidiaries. Income taxes have been provided for on the asset and liability method as required by the FASB’s Income Tax guidance. Under the asset and liability method,deferred income taxes are recognized for the temporary differences between the financial reporting basis and the tax basis of taxable assets and liabilities. The Company’s pre-tax book income/(loss) and (provision)/benefit for income taxes relating to the Company’s TRS and taxable entities which have beenconsolidated for accounting reporting purposes, for the years ended December 31, 2017, 2016 and 2015, are summarized as follows (in thousands):
2017 2016 2015 Income/(loss) before income taxes – U.S. $ 1,487 $ (23,810) $ 23,729 (Provision)/benefit for income taxes, net:
Federal: Current (704) 2,199 (638)Deferred (632) (45,097) (7,355)
Federal tax provision (1,336) (42,898) (7,993)State and local:
Current (66) 1,057 (2,535)Deferred (190) (8,812) (1,474)
State tax provision (256) (7,755) (4,009)Total tax provision – U.S. (1,592) (50,653) (12,002)Net (loss)/income from U.S. TRSs $ (105) $ (74,463) $ 11,727 (Loss)/income before taxes – Non-U.S. $ (11,483) $ 138,253 $ 381,999 Benefit/(provision) for Non-U.S. income taxes:
Current (1) $ 2,425 $ (24,393) $ (58,365)Deferred 47 (3,537) 4,331
Non-U.S. tax benefit/(provision) $ 2,472 $ (27,930) $ (54,034)
(1) The year ended December 31, 2016 includes $24.9 million, in expense related to the sale of interests in properties located in Canada.
89

Table of Contents
KIMCO REALTY CORPORATION AND SUBSIDIARIES
NOTES TO CONSOLIDATED FINANCIAL STATEMENTS, continued
Provision differs from the amounts computed by applying the statutory federal income tax rate to taxable income before income taxes as follows (in thousands):
2017 2016 2015 Federal provision at statutory tax rate (35%) (1) $ (520) $ (47,155) $ (8,304)State and local provision, net of federal benefit (2) (1,072) (3,498) (3,698)
Total tax provision – U.S. $ (1,592) $ (50,653) $ (12,002)
(1) The year ended December 31, 2016, includes a $55.6 million charge related to the recording of a deferred tax valuation allowance.(2) The year ended December 31, 2016, includes a $7.9 million charge related to the recording of a deferred tax valuation allowance.
Deferred Tax Assets, Liabilities and Valuation Allowances The Company’s deferred tax assets and liabilities at December 31, 2017 and 2016, were as follows (in thousands):
2017 2016 Deferred tax assets:
Tax/GAAP basis differences $ 35,839 $ 63,167 Net operating losses (1) 22,137 44,833
Tax credit carryforwards (2) 6,064 5,368 Capital loss carryforwards 4,648 3,659
Related party deferred losses 619 952 Charitable contribution carryforwards 23 35 Non-U.S. tax/GAAP basis differences - 513 Valuation allowance – U.S. (54,155) (95,126)
Total deferred tax assets 15,175 23,401 Deferred tax liabilities – U.S. (12,739) (19,599)Deferred tax liabilities – Non-U.S. - (559)Net deferred tax assets $ 2,436 $ 3,243
(1) Expiration dates ranging from 2021 to 2032. (2) Expiration dates ranging from 2027 to 2035 and includes alternative minimum tax credit carryovers of $3.5 million that do not expire.
The major differences between the GAAP basis of accounting and the basis of accounting used for federal and state income tax reporting consist of impairmentcharges recorded for GAAP purposes, but not recognized for tax purposes, depreciation and amortization, rental revenue recognized on the straight-line methodfor GAAP, reserves for doubtful accounts, above-market and below-market lease amortization, differences in GAAP and tax basis of assets sold, and the period inwhich certain gains were recognized for tax purposes, but not yet recognized under GAAP. Deferred tax assets and deferred tax liabilities are included in the captions Other assets and Other liabilities on the accompanying Consolidated Balance Sheets atDecember 31, 2017 and 2016. Operating losses and the valuation allowance are related primarily to the Company’s consolidation of its taxable REIT subsidiariesfor accounting and reporting purposes. For the tax year ended August 1, 2016, KRS Consolidated produced $8.1 million of taxable income and utilized $8.1 millionof its $44.0 million of available net operating loss carryovers. Under GAAP a reduction of the carrying amounts of deferred tax assets by a valuation allowance is required, if, based on the evidence available, it is more likelythan not (a likelihood of more than 50 percent) that some portion or all of the deferred tax assets will not be realized. The valuation allowance should be sufficientto reduce the deferred tax asset to the amount that is more likely than not to be realized. As a result of the Merger, the Company determined that the realization of$63.5 million of its net deferred tax assets was not deemed more likely than not and as such, the Company recorded a full valuation allowance against these netdeferred tax assets that existed at the time of the Merger. The Company prepared an analysis of the tax basis built-in tax gain or built-in loss inherent in each asset acquired from KRS in the Merger. Assets of a TRS thatbecome REIT assets in a merger transaction of the type entered into by the Company and KRS are subject to corporate tax on the aggregate net built-in gain(built-in gains in excess of built-in losses) during a recognition period. Accordingly, the Company is subject to corporate-level taxation on the aggregate net built-in gain from the sale of KRS assets within 60 months from the Merger date (the recognition period). The maximum taxable amount with respect to all merged assetsdisposed within 60 months of the Merger is limited to the aggregate net built-in gain at the Merger date. The Company compared fair value to tax basis for eachproperty or asset to determine its built-in gain (value over basis) or built-in loss (basis over value) which could be subject to corporate level taxes if the Companydisposed of the asset previously held by KRS during the 60 months following the Merger date. In the event that sales of KRS assets during the recognitionperiod result in corporate level tax, the unrecognized tax benefits reported as deferred tax assets from KRS will be utilized to reduce the corporate level tax forGAAP purposes.
90

Table of Contents
KIMCO REALTY CORPORATION AND SUBSIDIARIES
NOTES TO CONSOLIDATED FINANCIAL STATEMENTS, continued
Uncertain Tax Positions The Company is subject to income tax in certain jurisdictions outside the U.S., principally Canada and Mexico. The statute of limitations on assessment of taxvaries from three to seven years depending on the jurisdiction and tax issue. Tax returns filed in each jurisdiction are subject to examination by local taxauthorities. The Company is currently under audit by the Canadian Revenue Agency and Mexican Tax Authority . The resolution of these audits are not expectedto have a material effect on the Company’s financial statements. The Company does not believe that the total amount of unrecognized tax benefits as of December31, 2017, will significantly increase or decrease within the next 12 months. The liability for uncertain tax benefits principally consists of estimated foreign, federal and state income tax liabilities in years for which the statute of limitations isopen. Open years range from 2011 through 2017 and vary by jurisdiction and issue. The aggregate changes in the balance of unrecognized tax benefits for theyears ended December 31, 2017 and 2016 were as follows (in thousands):
2017 2016 Balance at January 1, $ 4,962 $ 4,263 Increases for tax positions related to current year (1) 339 41 Increase for tax position due to ASU 2013-11 - 4,930 Decreases relating to settlements with taxing authorities - (2,000)Reductions due to lapsed statute of limitations (1,310) (2,272)Balance at December 31, $ 3,991 $ 4,962
(1) Amounts relate to increases resulting from foreign currency translation adjustments.
The Company previously had unrecognized tax benefits reported as deferred tax assets primarily related to book to tax timing differences for depreciation expenseon its Canadian real estate operating properties. With respect to the Company’s uncertain tax positions in Canada and in accordance with ASU 2013-11 " IncomeTaxes (Topic 740): Presentation of an Unrecognized Tax Benefit When a Net Operating Loss Carryforward, a Similar Tax Loss, or a Tax Credit CarryforwardExists," (“ASU 2013-11”), the uncertain tax position liabilities in Canada were netted against these deferred tax assets. As of December 31, 2016, the Company,due to the sale of certain operating real estate properties in Canada, no longer had these related deferred tax assets to net against the related deferred tax liabilityand thus, the amount of its liability increased for uncertain tax positions associated with its Canadian operations. As of December 31, 2017 and 2016, theCompany’s Canadian uncertain tax positions aggregated $4.0 million and $5.0 million, respectively. The Company and its subsidiaries had been under audit by the U.S. Internal Revenue Service (“IRS”) with respect to taxable years 2004-2009. The IRS proposed,pursuant to Section 482 of the Code, to disallow a capital loss claimed by KRS on the disposition of common shares of Valad Property Ltd., an Australian publiclylisted company, and to assert a 100 percent “penalty” tax on the Company pursuant to Section 857(b)(7) of the Code in the amount of $40.9 million with respect toits 2009 taxable year. During 2016, the Company and its subsidiaries favorably settled all matters relating to the audit, agreeing to a net refund of $0.1 million, andin connection with this favorable settlement, the Company released its uncertain tax position liability of $2.0 million. During August 2016, the Mexican Tax Authority issued tax assessments for various wholly-owned entities of the Company that had previously held interests inoperating properties in Mexico. These assessments relate to certain interest expense and withholding tax items subject to the United States-Mexico Income TaxConvention (the “Treaty”). The assessments are for the 2010 tax year and include amounts for taxes aggregating $33.7 million, interest aggregating $16.5 millionand penalties aggregating $11.4 million. The Company believes that it has operated in accordance with the Treaty provisions and has therefore concluded that noamounts are payable with respect to this matter. The Company has submitted appeals for these assessments and the U.S. Competent Authority (Department ofTreasury) is representing the Company regarding this matter with the Mexican Competent Authority. The Company intends to vigorously defend its position andbelieves it will prevail, however this outcome cannot be assured.
91

Table of Contents
KIMCO REALTY CORPORATION AND SUBSIDIARIES
NOTES TO CONSOLIDATED FINANCIAL STATEMENTS, continued 22. Accumulated Other Comprehensive Income:
The following table displays the change in the components of AOCI for the years ended December 31, 2017 and 2016:
ForeignCurrency
TranslationAdjustments
UnrealizedGains/(Losses)
Related toAvailable-for-Sale
Securities
UnrealizedGains/(Losses)
on InterestRate Swaps Total
Balance as of January 1, 2016 $ 6,616 $ 398 $ (1,426) $ 5,588 Other comprehensive income before reclassifications (281) 8 451 178 Amounts reclassified from AOCI - - - - Net current-period other comprehensive income (281) 8 451 178 Balance as of December 31, 2016 $ 6,335 $ 406 $ (975) $ 5,766 Other comprehensive income before reclassifications 3,711 (1,542) 631 2,800 Amounts reclassified from AOCI (1) (10,046) - - (10,046)Net current-period other comprehensive income (6,335) (1,542) 631 (7,246)Balance as of December 31, 2017 $ - $ (1,136) $ (344) $ (1,480)
(1) During 2015, the Company began selling properties within its Canadian portfolio and has continued to liquidate its investments over the last two years. During
the year ended December 31, 2017, the Company was deemed to have substantially liquidated its investment in Canada, triggered primarily by the receipt ofvarious tax refunds, and as a result, recognized a net cumulative foreign currency translation gain. Amounts were reclassified to the Company’s ConsolidatedStatements of Income as follows (i) $14.8 million of gain was reclassified to Equity in income of other real estate investments, net, and (ii) $4.8 million of loss wasreclassified to Equity in income of joint ventures, net.
23. Earnings Per Share:
The following table sets forth the reconciliation of earnings and the weighted-average number of shares used in the calculation of basic and diluted earnings pershare (amounts presented in thousands, except per share data): For the Year Ended December 31, 2017 2016 2015 Computation of Basic and Diluted Earnings Per Share: Income from continuing operations $ 346,133 $ 299,353 $ 774,405 Gain on sale of operating properties, net, net of tax 93,538 86,785 125,813 Net income attributable to noncontrolling interests (13,596) (7,288) (6,028)Preferred stock redemption charge (7,014) - (5,816)Preferred dividends (46,600) (46,220) (57,084)Earnings attributable to participating securities (2,132) (2,018) (4,134)Income from continuing operations available to the Company’s common shareholders $ 370,329 $ 330,612 $ 827,156 Loss from discontinued operations available to the Company’s common shareholders - - (75)Net income available to the Company’s common shareholders for basic earnings per share $ 370,329 $ 330,612 827,081 Distributions on convertible units - - 192 Net income available to the Company’s common shareholders for diluted earnings per share $ 370,329 $ 330,612 $ 827,273 Weighted-average common shares outstanding – basic 423,614 418,402 411,319 Effect of dilutive securities (1):
Equity awards 405 1,307 1,414 Assumed conversion of convertible units - - 118
Weighted-average common shares outstanding – diluted 424,019 419,709 412,851 Basic Earnings Per Share:
Income from continuing operations $ 0.87 $ 0.79 $ 2.01 Net income available to the Company’s common shareholders $ 0.87 $ 0.79 $ 2.01
Diluted Earnings Per Share: Income from continuing operations $ 0.87 $ 0.79 $ 2.00 Net income available to the Company’s common shareholders $ 0.87 $ 0.79 $ 2.00
(1) The effect of the assumed conversion of certain convertible units had an anti-dilutive effect upon the calculation of Income from continuing operations per share.
Accordingly, the impact of such conversions has not been included in the determination of diluted earnings per share calculations. Additionally, there were3,082,106, 3,490,400 and 5,300,680 stock options that were not dilutive as of December 31, 2017, 2016 and 2015, respectively.
92

Table of Contents
KIMCO REALTY CORPORATION AND SUBSIDIARIES
NOTES TO CONSOLIDATED FINANCIAL STATEMENTS, continued
The Company's unvested restricted share awards contain non-forfeitable rights to distributions or distribution equivalents. The impact of the unvested restrictedshare awards on earnings per share has been calculated using the two-class method whereby earnings are allocated to the unvested restricted share awardsbased on dividends declared and the unvested restricted shares' participation rights in undistributed earnings.
24. Supplemental Financial Information (Unaudited):
The following represents the quarterly results of operations, expressed in thousands except per share amounts, for the years ended December 31, 2017 and 2016: 2017
First
Quarter SecondQuarter
ThirdQuarter
FourthQuarter
Revenues from rental properties $ 289,391 $ 292,843 $ 290,919 $ 310,632 Net income attributable to the Company $ 76,733 $ 143,416 $ 121,030 $ 84,566 Net income per common share:
Basic $ 0.15 $ 0.31 $ 0.24 $ 0.17 Diluted $ 0.15 $ 0.31 $ 0.24 $ 0.17
2016
First
Quarter SecondQuarter
ThirdQuarter
FourthQuarter
Revenues from rental properties $ 293,091 $ 287,115 $ 279,286 $ 292,909 Net income attributable to the Company $ 140,713 $ 203,409 $ (43,545) $ 78,273 Net income per common share:
Basic $ 0.31 $ 0.46 $ (0.13) $ 0.16 Diluted $ 0.31 $ 0.46 $ (0.13) $ 0.16
25. Captive Insurance Company:
In October 2007, the Company formed a wholly-owned captive insurance company, KIC, which provides general liability insurance coverage for all losses belowthe deductible under the Company’s third-party liability insurance policy. The Company created KIC as part of its overall risk management program and tostabilize its insurance costs, manage exposure and recoup expenses through the functions of the captive program. The Company capitalized KIC in accordancewith the applicable regulatory requirements. KIC established annual premiums based on projections derived from the past loss experience of the Company’sproperties. KIC has engaged an independent third party to perform an actuarial estimate of future projected claims, related deductibles and projected expensesnecessary to fund associated risk management programs. Premiums paid to KIC may be adjusted based on this estimate. Like premiums paid to third-partyinsurance companies, premiums paid to KIC may be reimbursed by tenants pursuant to specific lease terms. KIC assumes occurrence basis general liability coverage (not including casualty loss or business interruption) for the Company and its affiliates under the termsof a reinsurance agreement entered into by KIC and the reinsurance provider. From October 1, 2007 through October 1, 2018, KIC assumes 100% of the first $250,000 per occurrence risk layer. This coverage is subject to annual aggregatesranging between $7.8 million and $11.5 million per policy year. The annual aggregate is adjustable based on the amount of audited square footage of the insureds ’locations and can be adjusted for subsequent program years. Defense costs erode the stated policy limits. KIC is required to pay the reinsurance provider forunallocated loss adjustment expenses an amount ranging between 8.0% and 12.2% of incurred losses for the policy periods ending September 30, 2008 throughSeptember 30, 2018. These amounts do not erode the Company’s per occurrence or aggregate limits.
93

Table of Contents
KIMCO REALTY CORPORATION AND SUBSIDIARIES
NOTES TO CONSOLIDATED FINANCIAL STATEMENTS, continued
As of December 31, 2017 and 2016, the Company maintained a letter of credit in the amount of $23.0 million issued in favor of the reinsurance provider to providesecurity for the Company’s obligations under its agreement with the reinsurance provider. The letter of credit maintained as of December 31, 2017, has anexpiration date of February 15, 2018, with automatic renewals for one year. Activity in the liability for unpaid losses and loss adjustment expenses for the years ended December 31, 2017 and 2016, is summarized as follows (in thousands):
2017 2016 Balance at the beginning of the year $ 19,515 $ 20,046 Incurred related to:
Current year 5,915 6,247 Prior years (727) (67)
Total incurred 5,188 6,180 Paid related to:
Current year (742) (962)Prior years (4,996) (5,749)
Total paid (5,738) (6,711)Balance at the end of the year $ 18,965 $ 19,515
For the years ended December 31, 2017 and 2016, the changes in estimates in insured events in the prior years, incurred losses and loss adjustment expensesresulted in a decrease of $0.7 million and an increase of $0.1 million, respectively, which was primarily due to continued regular favorable loss development on thegeneral liability coverage assumed.
94

Table of Contents
KIMCO REALTY CORPORATION AND SUBSIDIARIES
SCHEDULE II – VALUATION AND QUALIFYING ACCOUNTS
For Years Ended December 31, 2017, 2016 and 2015(in thousands)
Balance atbeginning of
period Charged toexpenses
Adjustments tovaluationaccounts Deductions
Balance atend ofperiod
Year Ended December 31, 2017 Allowance for uncollectable accounts (1) $ 24,175 $ 6,641 $ - $ (13,750) $ 17,066 Allowance for deferred tax asset $ 95,126 $ - $ (40,971) $ - $ 54,155 Year Ended December 31, 2016 Allowance for uncollectable accounts (1) $ 31,820 $ 7,982 $ - $ (15,627) $ 24,175 Allowance for deferred tax asset $ 27,905 $ - $ 67,221 $ - $ 95,126 Year Ended December 31, 2015 Allowance for uncollectable accounts (1) $ 32,509 $ 11,174 $ - $ (11,863) $ 31,820 Allowance for deferred tax asset $ 34,302 $ - $ (6,397) $ - $ 27,905
(1) Includes allowances on accounts receivable and straight-line rents.
95

Table of Contents
KIMCO REALTY CORPORATION AND SUBSIDIARIES SCHEDULE III - REAL ESTATE AND ACCUMULATED DEPRECIATION
December 31, 2017 INITIAL COST COST
CAPTIALIZEDSUBSEQUENT TOTAL COST,
DESCRIPTION State LAND BUILDING AND
IMPROVEMENTS
TOACQUISITION
(1) LAND BUILDING AND
IMPROVEMENTS TOTAL ACCUMULATEDDEPRECIATION
NET OFACCUMULATEDDEPRECIATION
ENCUMBRANCES(2)
DATE OFACQUISITION(A)
DATE OFCONSTRUCTION(C)
SHOPPING CENTERS DISTRICT AT TUSTIN CA $106,128,741 $208,876,066 $724,025 $106,128,741 $209,600,091 $315,728,832 $8,983,313 $306,745,519 $204,468,426 2017 THE GROVE AL 18,951,763 6,403,809 3,070,025 6,793,454 21,632,143 28,425,597 6,959,991 21,465,606 - 2007 TALAVI TOWN CENTER AZ 8,046,677 17,291,542 (25,338,219) - - - - - - 2007 MESA PAVILIONS NORTH AZ 6,060,018 35,955,005 867,624 6,060,018 36,822,629 42,882,647 8,815,702 34,066,945 - 2009 MESA RIVERVIEW AZ 15,000,000 - 142,768,268 307,992 157,460,276 157,768,268 53,514,318 104,253,950 - 2005 MESA PAVILLIONS - SOUTH AZ - 148,508 100,577 - 249,085 249,085 118,929 130,156 - 2011 METRO SQUARE AZ 4,101,017 16,410,632 1,357,963 4,101,017 17,768,595 21,869,612 8,875,277 12,994,335 - 1998 HAYDEN PLAZA NORTH AZ 2,015,726 4,126,509 (5,588,937) 122,085 431,213 553,298 197,517 355,781 - 1998 PLAZA DEL SOL AZ 5,324,501 21,269,943 2,030,572 4,577,869 24,047,147 28,625,016 8,739,179 19,885,837 - 1998 PLAZA AT MOUNTAINSIDE AZ 2,450,341 9,802,046 2,092,808 2,450,341 11,894,854 14,345,195 6,103,826 8,241,369 - 1997 VILLAGE CROSSROADS AZ 5,662,554 24,981,223 688,411 5,662,554 25,669,634 31,332,188 4,876,413 26,455,775 - 2011 NORTH VALLEY AZ 6,861,564 18,200,901 6,384,423 3,861,272 27,585,616 31,446,888 4,969,361 26,477,527 - 2011 CHRISTOWN SPECTRUM AZ 33,831,348 91,004,070 15,350,895 76,638,511 63,547,802 140,186,313 8,849,280 131,337,033 61,850,278 2015 BELL CAMINO CENTER AZ 2,427,465 6,439,065 449,983 2,427,465 6,889,048 9,316,513 1,826,375 7,490,138 - 2012 COLLEGE PARK SHOPPING
CENTER AZ 3,276,951 7,741,323 1,112,006 3,276,951 8,853,329 12,130,280 2,316,908 9,813,372 - 2011 COSTCO PLAZA - 541 CA 4,995,639 19,982,557 534,161 4,995,639 20,516,718 25,512,357 10,476,795 15,035,562 - 1998 BROOKHURST CENTER CA 10,492,714 31,357,512 838,456 22,299,852 20,388,830 42,688,682 1,737,221 40,951,461 - 2016 LAKEWOOD PLAZA CA 1,294,176 3,669,266 50,291 - 5,013,733 5,013,733 1,686,188 3,327,545 - 2014 MADISON PLAZA CA 5,874,396 23,476,190 2,128,333 5,874,396 25,604,523 31,478,919 12,534,740 18,944,179 - 1998 BROADWAY PLAZA CA 6,460,743 25,863,153 12,142,497 6,460,743 38,005,650 44,466,393 16,786,365 27,680,028 - 1998 CORONA HILLS PLAZA CA 13,360,965 53,373,453 8,024,150 13,360,965 61,397,603 74,758,568 32,234,761 42,523,807 - 1998 280 METRO CENTER CA 38,734,566 94,903,403 1,922,348 38,734,566 96,825,751 135,560,317 10,563,254 124,997,063 - 2015 LABAND VILLAGE
SHOPPING CENTER CA 5,600,000 13,289,347 450,236 5,607,237 13,732,346 19,339,583 7,289,456 12,050,127 - 2008 CUPERTINO VILLAGE CA 19,886,099 46,534,919 24,291,806 19,886,099 70,826,725 90,712,824 19,498,273 71,214,551 - 2006 NORTH COUNTY PLAZA CA 10,205,305 28,934,219 (1,000,334) 20,894,811 17,244,379 38,139,190 3,159,099 34,980,091 - 2014 CHICO CROSSROADS CA 9,975,810 30,534,524 1,363,692 9,985,652 31,888,374 41,874,026 9,649,420 32,224,606 - 2008 CHICO EAST & ESPLANADE CA 2,508,716 12,886,184 (1,312,383) 2,508,716 11,573,801 14,082,517 1,046,152 13,036,365 3,544,259 2015 CORONA HILLS
MARKETPLACE CA 9,727,446 24,778,390 703,539 9,727,446 25,481,929 35,209,375 8,709,352 26,500,023 - 2007 CREEKSIDE CENTER CA 3,870,823 11,562,580 (477,027) 5,154,061 9,802,315 14,956,376 577,653 14,378,723 - 2016 GOLD COUNTRY CENTER CA 3,272,212 7,864,878 29,687 3,278,290 7,888,487 11,166,777 3,737,079 7,429,698 - 2008 LA MIRADA THEATRE
CENTER CA 8,816,741 35,259,965 (3,325,358) 6,888,680 33,862,668 40,751,348 15,984,250 24,767,098 - 1998 KENNETH HAHN PLAZA CA 4,114,863 7,660,855 1,478,281 4,114,863 9,139,136 13,253,999 3,158,669 10,095,330 - 2010 LA VERNE TOWN CENTER CA 8,414,328 23,856,418 10,759,800 16,362,169 26,668,377 43,030,546 3,263,071 39,767,475 - 2014 LINCOLN HILLS TOWN
CENTER CA 8,228,587 26,127,322 132,829 8,228,587 26,260,151 34,488,738 3,199,334 31,289,404 - 2015 NOVATO FAIR S.C. CA 9,259,778 15,599,790 997,511 9,259,778 16,597,301 25,857,079 6,336,610 19,520,469 - 2009 SOUTH NAPA MARKET
PLACE CA 1,100,000 22,159,086 20,615,121 23,119,071 20,755,136 43,874,207 10,843,098 33,031,109 - 2006 PLAZA DI NORTHRIDGE CA 12,900,000 40,574,842 1,665,373 12,900,000 42,240,215 55,140,215 15,177,905 39,962,310 - 2005 LINDA MAR SHPPING
CENTER CA 16,548,592 37,521,194 1,776,093 16,548,592 39,297,287 55,845,879 7,472,546 48,373,333 - 2014 POWAY CITY CENTRE CA 5,854,585 13,792,470 8,516,118 7,247,814 20,915,359 28,163,173 8,448,941 19,714,232 - 2005 REDWOOD CITY PLAZA CA 2,552,000 6,215,168 5,900,877 2,552,000 12,116,045 14,668,045 1,463,911 13,204,134 - 2009 STANFORD RANCH CA 10,583,764 30,007,231 3,430,053 9,982,626 34,038,422 44,021,048 3,539,167 40,481,881 14,191,062 2014 TYLER STREET PLAZA CA 3,020,883 7,811,339 83,425 3,200,516 7,715,131 10,915,647 2,746,206 8,169,441 - 2008 CROCKER RANCH CA 7,526,146 24,877,611 104,542 7,526,146 24,982,153 32,508,299 2,355,316 30,152,983 10,445,001 2015 HOME DEPOT PLAZA CA 4,592,364 18,345,257 - 4,592,364 18,345,257 22,937,621 9,354,408 13,583,213 - 1998 SANTEE TROLLEY SQUARE CA 40,208,683 62,963,757 292,910 40,208,683 63,256,667 103,465,350 15,500,852 87,964,498 - 2015 SAN/DIEGO CARMEL
MOUNTAIN CA 5,322,600 8,873,991 121,022 5,322,600 8,995,013 14,317,613 2,307,020 12,010,593 - 2009 FULTON MARKET PLACE CA 2,966,018 6,920,710 16,305,019 6,518,924 19,672,823 26,191,747 3,192,067 22,999,680 - 2005 BLACK MOUNTAIN VILLAGE CA 4,678,015 11,913,344 756,865 4,678,015 12,670,209 17,348,224 4,508,096 12,840,128 - 2007 RANCHO PENASQUITOS
TOWNE CTR I CA 14,851,595 20,342,165 247,359 14,851,595 20,589,524 35,441,119 2,374,587 33,066,532 13,884,779 2015 RANCHO PENASQUITOS TWN
CTR II CA 12,944,972 20,323,961 608,243 12,944,972 20,932,204 33,877,176 2,445,136 31,432,040 10,654,756 2015 CITY HEIGHTS CA 10,687,472 28,324,896 (732,313) 13,908,563 24,371,492 38,280,055 3,404,559 34,875,496 - 2012 TRUCKEE CROSSROADS CA 2,140,000 8,255,753 1,619,484 2,140,000 9,875,237 12,015,237 5,557,970 6,457,267 2,074,100 2006 GATEWAY AT DONNER PASS CA 4,515,688 8,318,667 237,945 4,515,688 8,556,612 13,072,300 1,156,392 11,915,908 2,356,820 2015 WESTLAKE SHOPPING
CENTER CA 16,174,307 64,818,562 100,795,455 16,174,307 165,614,017 181,788,324 52,777,883 129,010,441 - 2002 LAKEWOOD VILLAGE CA 8,597,100 24,374,615 (1,119,844) 11,683,364 20,168,507 31,851,871 3,499,437 28,352,434 - 2014 WHITTWOOD TOWN CENTER CA 57,135,695 105,814,560 79,752 57,137,989 105,892,018 163,030,007 1,408,261 161,621,746 45,117,369 2017 SAVI RANCH CA 7,295,646 29,752,511 (188,067) 7,295,646 29,564,444 36,860,090 5,529,067 31,331,023 - 2012 VILLAGE ON THE PARK CO 2,194,463 8,885,987 9,895,270 3,018,391 17,957,329 20,975,720 7,731,431 13,244,289 - 1998 QUINCY PLACE S.C. CO 1,148,317 4,608,249 1,645,217 1,148,317 6,253,466 7,401,783 3,132,940 4,268,843 - 1998 EAST BANK S.C. CO 1,500,568 6,180,103 2,359,399 1,500,568 8,539,502 10,040,070 3,945,851 6,094,219 - 1998 NORTHRIDGE SHOPPING
CENTER CO 4,932,690 16,496,175 1,865,017 8,934,385 14,359,497 23,293,882 2,274,998 21,018,884 - 2013 SPRING CREEK S.C. CO 1,423,260 5,718,813 (1,539,783) 592,896 5,009,394 5,602,290 3,734,127 1,868,163 - 1998 DENVER WEST 38TH STREET CO 161,167 646,983 41,853 161,167 688,836 850,003 330,384 519,619 - 1998 ENGLEWOOD PLAZA CO 805,837 3,232,650 564,167 805,837 3,796,817 4,602,654 1,925,245 2,677,409 - 1998 FORT COLLINS S.C. CO 1,253,497 7,625,278 1,599,608 1,253,497 9,224,886 10,478,383 3,882,582 6,595,801 - 2000 GREELEY COMMONS CO 3,313,095 20,069,559 104,137 3,313,095 20,173,696 23,486,791 4,108,294 19,378,497 - 2012 HIGHLANDS RANCH
VILLAGE S.C. CO 8,135,427 21,579,936 (544,584) 5,337,081 23,833,698 29,170,779 4,184,418 24,986,361 - 2011 VILLAGE CENTER WEST CO 2,010,519 8,361,084 203,885 2,010,519 8,564,969 10,575,488 1,448,222 9,127,266 - 2011 HIGHLANDS RANCH II CO 3,514,837 11,755,916 354,284 3,514,837 12,110,200 15,625,037 2,729,678 12,895,359 - 2013 VILLAGE CENTER -
HIGHLAND RANCH CO 1,140,000 2,660,000 277,159 1,140,000 2,937,159 4,077,159 184,584 3,892,575 - 2014 HERITAGE WEST S.C. CO 1,526,576 6,124,074 1,702,094 1,526,576 7,826,168 9,352,744 3,555,249 5,797,495 - 1998 MARKET AT SOUTHPARK CO 9,782,769 20,779,522 541,956 9,782,769 21,321,478 31,104,247 4,557,442 26,546,805 - 2011 NEWTOWN S.C. CT - 15,635,442 - - 15,635,442 15,635,442 1,763,731 13,871,711 7,889,936 2014 WEST FARM SHOPPING
CENTER CT 5,805,969 23,348,024 15,727,758 7,585,116 37,296,635 44,881,751 14,349,914 30,531,837 - 1998 HAMDEN MART CT 13,668,167 40,890,166 4,224,199 14,225,573 44,556,959 58,782,532 2,984,228 55,798,304 21,498,278 2016 HOME DEPOT PLAZA CT 7,704,968 30,797,640 3,061,389 7,704,968 33,859,029 41,563,997 14,718,770 26,845,227 - 1998 WILTON RIVER PARK
SHOPPING CTR CT 7,154,585 27,509,279 (56,109) 7,154,584 27,453,171 34,607,755 4,329,368 30,278,387 - 2012 BRIGHT HORIZONS CT 1,211,748 4,610,610 9,499 1,211,748 4,620,109 5,831,857 839,744 4,992,113 - 2012 WILTON CAMPUS CT 10,168,872 31,893,016 317,485 10,168,872 32,210,501 42,379,373 7,466,715 34,912,658 - 2013 CAMDEN SQUARE DE 122,741 66,738 4,502,409 3,024,375 1,667,513 4,691,888 181,042 4,510,846 - 2003 PROMENADE AT
CHRISTIANA (3) DE 14,371,686 - 18,503,592 32,875,278 - 32,875,278 - 32,875,278 - 2014 BRANDYWINE COMMONS DE - 36,057,487 1,823,593 - 37,881,080 37,881,080 4,486,979 33,394,101 - 2014 CAMINO SQUARE FL 573,875 2,295,501 2,714,483 733,875 4,849,984 5,583,859 3,872,616 1,711,243 - 1992 BONITA GRANDE CROSSINGS FL 3,370,941 8,179,481 234,356 3,370,941 8,413,837 11,784,778 993,508 10,791,270 - 2015 HOLLYWOOD VIDEO
BONITA GRANDE FL 341,958 771,935 - 341,958 771,935 1,113,893 93,941 1,019,952 - 2015 CORAL SQUARE PROMENADE FL 710,000 2,842,907 4,023,496 710,000 6,866,403 7,576,403 3,791,207 3,785,196 - 1994 MAPLEWOOD PLAZA FL 1,649,000 6,626,301 1,306,059 1,649,000 7,932,360 9,581,360 3,792,560 5,788,800 - 1997 CURLEW CROSSING
SHOPPING CTR FL 5,315,955 12,529,467 2,393,045 5,315,955 14,922,512 20,238,467 5,962,584 14,275,883 - 2005 SHOPS AT SANTA BARBARA
PHASE 1 FL 743,463 5,373,994 80,505 743,463 5,454,499 6,197,962 647,135 5,550,827 - 2015 SHOPS AT SANTA BARBARA
PHASE 2 FL 331,692 2,488,832 - 331,692 2,488,832 2,820,524 303,632 2,516,892 - 2015 SHOPS AT SANTA BARBARA
PHASE 3

FL 329,726 2,358,700 61,618 329,726 2,420,318 2,750,044 276,810 2,473,234 - 2015 CORAL POINTE S.C. FL 2,411,608 20,507,735 213,166 2,411,608 20,720,901 23,132,509 2,362,743 20,769,766 - 2015 PUBLIX AT ADDISON FL 3,211,156 6,747,895 - 3,211,156 6,747,895 9,959,051 533,669 9,425,382 - 2015 ADDISON CENTER
PROF.BUILDING FL 802,789 1,310,012 (61,362) 802,789 1,248,650 2,051,439 105,019 1,946,420 - 2015 DANIA POINTE (3) FL 105,113,024 - 47,727,558 152,840,582 - 152,840,582 - 152,840,582 - 2016 2016 FT.LAUDERDALE/CYPRESS
CREEK FL 14,258,760 28,042,390 1,982,805 14,258,760 30,025,195 44,283,955 9,170,634 35,113,321 - 2009 HOMESTEAD-WACHTEL
LAND LEASE FL 150,000 - - 150,000 - 150,000 - 150,000 - 2013 OAKWOOD PLAZA NORTH FL 35,300,961 141,731,019 162,764 35,300,961 141,893,783 177,194,744 9,869,863 167,324,881 100,000,000 2016 OAKWOOD PLAZA SOUTH FL 11,126,609 40,592,103 200,905 11,126,609 40,793,008 51,919,617 3,187,414 48,732,203 - 2016 OAKWOOD BUSINESS CTR-
BLDG 1 FL 6,792,500 18,662,565 3,065,679 6,792,500 21,728,244 28,520,744 6,216,521 22,304,223 - 2009 AMELIA CONCOURSE FL 7,600,000 - 2,279,068 498,680 9,380,388 9,879,068 3,063,630 6,815,438 - 2003 KIMCO AVENUES WALK, LLC
(3) FL 26,984,546 - 21,588,299 - 48,572,845 48,572,845 - 48,572,845 - 2005 AVENUES WALK FL 8,169,933 20,173,468 (18,870,745) 2,711,057 6,761,599 9,472,656 395,121 9,077,535 - 2017 DUVAL STATION S.C. FL 1,807,792 11,863,692 114,840 1,807,792 11,978,532 13,786,324 1,244,732 12,541,592 - 2015 RIVERPLACE SHOPPING CTR. FL 7,503,282 31,011,027 1,662,341 7,200,050 32,976,600 40,176,650 9,409,835 30,766,815 - 2010 MERCHANTS WALK FL 2,580,816 10,366,090 6,681,476 2,580,816 17,047,566 19,628,382 8,173,678 11,454,704 - 2001 CENTER AT MISSOURI
AVENUE FL 293,686 792,119 6,291,221 293,686 7,083,340 7,377,026 1,647,444 5,729,582 - 1968 TRI-CITY PLAZA FL 2,832,296 11,329,185 20,422,836 2,832,296 31,752,021 34,584,317 3,569,889 31,014,428 - 1992 FT LAUDERDALE #1, FL FL 1,002,733 2,602,415 13,141,950 1,774,443 14,972,655 16,747,098 9,967,674 6,779,424 - 1974 NASA PLAZA FL - 1,754,000 3,347,355 - 5,101,355 5,101,355 3,941,287 1,160,068 - 1968 GROVE GATE S.C. FL 365,893 1,049,172 792,700 365,893 1,841,872 2,207,765 1,567,731 640,034 - 1968 CHEVRON OUTPARCEL FL 530,570 1,253,410 - 530,570 1,253,410 1,783,980 356,499 1,427,481 - 2010 IVES DAIRY CROSSING FL 732,914 4,080,460 11,183,306 720,852 15,275,828 15,996,680 9,421,495 6,575,185 - 1985 MILLER ROAD S.C. FL 1,138,082 4,552,327 4,560,187 1,138,082 9,112,514 10,250,596 5,883,832 4,366,764 - 1986 TRI-CITIES SHOPPING PLAZA FL 1,011,000 4,062,890 3,202,734 1,011,000 7,265,624 8,276,624 796,633 7,479,991 - 1997 KENDALE LAKES PLAZA FL 18,491,461 28,496,001 (1,996,609) 15,362,227 29,628,626 44,990,853 7,300,120 37,690,733 - 2009 CENTRE OF MERRITT FL 1,806,275 9,592,435 - 1,806,275 9,592,435 11,398,710 939,539 10,459,171 - 2015 MILLER WEST PLAZA FL 6,725,660 10,661,419 228,663 6,725,660 10,890,082 17,615,742 1,159,951 16,455,791 - 2015 CORSICA SQUARE S.C. FL 7,225,100 10,757,386 129,489 7,225,100 10,886,875 18,111,975 1,263,335 16,848,640 - 2015 FLAGLER PARK FL 26,162,980 80,737,041 3,628,420 26,725,480 83,802,961 110,528,441 22,448,579 88,079,862 - 2007 PARK HILL PLAZA FL 10,763,612 19,264,248 262,118 10,763,612 19,526,366 30,289,978 4,215,691 26,074,287 - 2011 WINN DIXIE-MIAMI FL 2,989,640 9,410,360 (51,872) 3,544,297 8,803,831 12,348,128 896,776 11,451,352 - 2013 MARATHON SHOPPING
CENTER FL 2,412,929 8,069,450 1,045,327 1,514,731 10,012,975 11,527,706 1,505,904 10,021,802 - 2013 SODO S.C. FL - 68,139,271 8,516,523 142,195 76,513,599 76,655,794 18,774,702 57,881,092 - 2008 RENAISSANCE CENTER FL 9,104,379 36,540,873 14,919,342 9,122,758 51,441,836 60,564,594 18,762,491 41,802,103 - 1998 MILLENIA PLAZA PHASE II FL 7,711,000 20,702,992 1,506,264 7,698,200 22,222,056 29,920,256 8,248,249 21,672,007 - 2009 RIVERSIDE LANDINGS S.C. FL 3,512,202 14,439,668 276,235 3,512,202 14,715,903 18,228,105 1,495,774 16,732,331 - 2015 GRAND OAKS VILLAGE FL 7,409,319 19,653,869 (683,921) 5,846,339 20,532,928 26,379,267 3,936,281 22,442,986 - 2011 PLANTATION CROSSING FL 2,782,030 8,077,260 3,606,250 2,782,030 11,683,510 14,465,540 351,464 14,114,076 - 2017 POMPANO POINTE S.C. FL 10,516,500 14,078,456 530,900 10,516,500 14,609,356 25,125,856 726,848 24,399,008 - 2012 UNIVERSITY TOWN CENTER FL 5,515,265 13,041,400 477,832 5,515,265 13,519,232 19,034,497 2,831,595 16,202,902 - 2011 PALM BEACH GARDENS FL 2,764,953 11,059,812 826,309 2,764,953 11,886,121 14,651,074 1,776,729 12,874,345 - 2009 OAK TREE PLAZA FL - 917,360 1,562,194 - 2,479,554 2,479,554 1,345,760 1,133,794 - 1968 TUTTLEBEE PLAZA FL 254,961 828,465 1,676,908 254,961 2,505,373 2,760,334 1,805,032 955,302 - 2008 SOUTH MIAMI S.C. FL 1,280,440 5,133,825 3,452,430 1,280,440 8,586,255 9,866,695 4,492,631 5,374,064 - 1995 CARROLLWOOD COMMONS FL 5,220,445 16,884,228 2,855,466 5,220,445 19,739,694 24,960,139 9,563,475 15,396,664 - 1997 VILLAGE COMMONS
SHOPPING CENT. FL 2,192,331 8,774,158 4,605,195 2,192,331 13,379,353 15,571,684 5,647,685 9,923,999 - 1998 MISSION BELL SHOPPING
CENTER FL 5,056,426 11,843,119 8,681,231 5,067,033 20,513,743 25,580,776 6,924,869 18,655,907 - 2004 VILLAGE COMMONS S.C. FL 2,026,423 5,106,476 2,031,564 2,026,423 7,138,040 9,164,463 1,408,765 7,755,698 - 2013 BELMART PLAZA FL 1,656,097 3,394,420 5,648,437 1,656,097 9,042,857 10,698,954 665,211 10,033,743 - 2014 MARKET AT HAYNES BRIDGE GA 4,880,659 21,549,424 1,168,508 4,889,863 22,708,728 27,598,591 7,296,311 20,302,280 - 2008 EMBRY VILLAGE GA 18,147,054 33,009,514 1,143,200 18,160,525 34,139,243 52,299,768 24,236,617 28,063,151 - 2008 PERIMETER EXPO PROPERTY GA 14,770,275 44,295,457 (867,262) 16,142,152 42,056,318 58,198,470 2,323,047 55,875,423 - 2016 RIVERWALK MARKETPLACE GA 3,512,202 18,862,571 (25,121) 3,512,202 18,837,450 22,349,652 1,407,453 20,942,199 - 2015 VILLAGE SHOPPES-
FLOWERY BRANCH GA 4,444,148 10,510,657 361,219 4,444,148 10,871,876 15,316,024 2,865,087 12,450,937 - 2011 LAWRENCEVILLE MARKET GA 8,878,266 29,691,191 297,965 9,060,436 29,806,986 38,867,422 5,116,031 33,751,391 - 2013 FIVE FORKS CROSSING GA 2,363,848 7,906,257 391,047 2,363,848 8,297,304 10,661,152 1,801,564 8,859,588 - 2013 BRAELINN VILLAGE GA 7,314,719 20,738,792 1,684,923 6,342,926 23,395,508 29,738,434 2,948,266 26,790,168 - 2014 SAVANNAH CENTER GA 2,052,270 8,232,978 4,034,349 2,052,270 12,267,327 14,319,597 6,940,835 7,378,762 - 1993 CHATHAM PLAZA GA 13,390,238 35,115,882 969,942 13,403,262 36,072,800 49,476,062 12,411,308 37,064,754 - 2008 CLIVE PLAZA IA 500,525 2,002,101 - 500,525 2,002,101 2,502,626 1,125,113 1,377,513 - 1996 DUBUQUE CENTER IA - 2,152,476 239,217 - 2,391,693 2,391,693 1,778,184 613,509 - 1997 87TH STREET CENTER IL - 2,687,046 11,446,720 6,992,648 7,141,118 14,133,766 2,620,820 11,512,946 - 1997 ELSTON CHICAGO IL 1,010,374 5,692,212 498,828 1,010,374 6,191,040 7,201,414 2,930,108 4,271,306 - 1997 DOWNERS PARK PLAZA IL 2,510,455 10,164,494 2,025,382 2,510,455 12,189,876 14,700,331 5,738,993 8,961,338 - 1999 DOWNERS PARK PLAZA IL 811,778 4,322,956 3,475,523 811,778 7,798,479 8,610,257 3,908,642 4,701,615 - 1997 TOWN & COUNTRY S.C. IL 842,555 2,108,674 3,902,011 500,927 6,352,313 6,853,240 4,456,553 2,396,687 - 1972 FAIRVIEW CITY CENTRE IL - 11,866,880 16,189,869 1,900,000 26,156,749 28,056,749 2,424,561 25,632,188 - 1998 PLAZA DEL PRADO IL 10,203,960 28,409,786 1,032,958 10,203,960 29,442,744 39,646,704 2,027,639 37,619,065 - 2017 SHOPS AT KILDEER IL 5,259,542 28,141,501 2,673,272 5,259,542 30,814,773 36,074,315 5,575,517 30,498,798 - 2013 MOUNT PROSPECT CENTER IL 1,017,345 6,572,176 4,100,013 1,017,345 10,672,189 11,689,534 6,096,302 5,593,232 - 1997 MUNDELEIN SHOPPING
CENTER IL 1,127,720 5,826,129 (2,606,024) 366,184 3,981,641 4,347,825 2,954,890 1,392,935 - 1998 OAK LAWN CENTER IL 1,530,111 8,776,631 709,090 1,530,111 9,485,721 11,015,832 4,920,379 6,095,453 - 1997 22ND STREET PLAZA IL 1,527,188 8,679,108 4,880,654 1,527,188 13,559,762 15,086,950 5,954,279 9,132,671 - 1997 SKOKIE POINTE IL - 2,276,360 9,564,305 2,628,440 9,212,225 11,840,665 3,925,602 7,915,063 - 1997 HAWTHORN HILLS SQUARE IL 6,783,928 33,033,624 2,814,620 6,783,928 35,848,244 42,632,172 6,962,156 35,670,016 - 2012 WOODGROVE FESTIVAL IL 5,049,149 20,822,993 5,345,619 4,805,866 26,411,895 31,217,761 13,423,088 17,794,673 - 1998 GROVE PARCEL IL 907,291 2,240,810 134,130 907,291 2,374,940 3,282,231 307,428 2,974,803 - 2016 WOODRIDGE PAD IL 702,757 1,746,223 - 702,757 1,746,223 2,448,980 136,201 2,312,779 - 2016 GREENWOOD S.C. IN 423,371 1,883,421 12,488,773 1,640,748 13,154,817 14,795,565 7,376,514 7,419,051 - 1970 SOUTH PARK S.C. KY 1,675,031 6,848,209 6,546,359 1,551,079 13,518,520 15,069,599 8,250,684 6,818,915 - 1993 ABINGTON PLAZA MA 10,457,183 494,652 - 10,457,183 494,652 10,951,835 122,964 10,828,871 3,990,344 2014 WASHINGTON ST.PLAZA MA 11,007,593 5,652,368 8,961,280 12,957,593 12,663,648 25,621,241 1,482,715 24,138,526 5,733,076 2014 MEMORIAL PLAZA MA 16,411,388 27,553,908 743,083 16,411,388 28,296,991 44,708,379 3,059,584 41,648,795 15,809,216 2014 MAIN ST. PLAZA MA 555,898 2,139,494 - 555,898 2,139,494 2,695,392 296,143 2,399,249 1,324,212 2014 MORRISSEY PLAZA MA 4,097,251 3,751,068 - 4,097,251 3,751,068 7,848,319 695,001 7,153,318 3,033,988 2014 GLENDALE SQUARE MA 4,698,891 7,141,090 276,270 4,698,891 7,417,360 12,116,251 1,140,566 10,975,685 5,474,019 2014 FALMOUTH PLAZA MA 2,361,071 13,065,817 847,281 2,361,071 13,913,098 16,274,169 1,696,974 14,577,195 7,703,065 2014 WAVERLY PLAZA MA 1,215,005 3,622,911 60,809 1,203,205 3,695,520 4,898,725 611,406 4,287,319 2,231,974 2014 FESTIVAL OF HYANNIS S.C. MA 15,038,197 40,682,853 1,488,072 15,038,197 42,170,925 57,209,122 7,155,488 50,053,634 - 2014 FELLSWAY PLAZA MA 5,300,388 11,013,543 127,563 5,300,388 11,141,106 16,441,494 1,536,348 14,905,146 6,535,377 2014 DEL ALBA PLAZA MA 3,163,033 8,967,874 19,995 3,163,033 8,987,869 12,150,902 908,085 11,242,817 7,628,034 2014 NORTH QUINCY PLAZA MA 6,332,542 17,954,110 (991,929) 3,894,436 19,400,287 23,294,723 2,035,103 21,259,620 - 2014 ADAMS PLAZA MA 2,089,363 3,226,648 (40,155) 2,089,363 3,186,493 5,275,856 391,361 4,884,495 1,813,396 2014 BROADWAY PLAZA MA 6,485,065 343,422 - 6,485,065 343,422 6,828,487 92,703 6,735,784 2,782,925 2014 VINNIN SQUARE PLAZA MA 5,545,425 16,324,060 (150,434) 5,545,425 16,173,626 21,719,051 2,699,267 19,019,784 8,834,315 2014 PARADISE PLAZA MA 4,183,038 12,194,885 1,151,422 4,183,038 13,346,307 17,529,345 2,027,671 15,501,674 8,537,656 2014 BELMONT PLAZA MA 11,104,983 848,844 - 11,104,983 848,844 11,953,827 154,335 11,799,492 5,044,171 2014 VINNIN SQUARE IN-LINE MA 582,228 2,094,560 (38,716) 582,228 2,055,844 2,638,072 234,248 2,403,824 - 2014 LINDEN PLAZA MA 4,628,215 3,535,431 655,320 4,628,215 4,190,751 8,818,966 759,317 8,059,649 3,418,968 2014 NORTH AVE. PLAZA MA 1,163,875 1,194,673 15,933 1,163,875 1,210,606 2,374,481 205,892 2,168,589 869,967 2014 WASHINGTON ST. S.C. MA 7,380,918 9,987,119 1,786,055 7,380,918 11,773,174 19,154,092 1,233,520 17,920,572 6,053,938 2014 MILL ST. PLAZA MA 4,195,024 6,203,410 136,079 4,195,024 6,339,489 10,534,513 914,061 9,620,452 3,958,596 2014 FULLERTON PLAZA MD 14,237,901 6,743,980 524,940 14,237,901 7,268,920 21,506,821 1,006,841 20,499,980 - 2014 GREENBRIER S.C. MD 8,891,468 30,304,760 149,632 8,891,468 30,454,392 39,345,860 3,668,094 35,677,766 - 2014 INGLESIDE S.C. MD 10,416,726 17,889,235 (2,058) 10,416,726 17,887,177 28,303,903 2,712,912 25,590,991 - 2014 ROLLING ROAD PLAZA MD 2,510,395 11,930,217 (4,309,151) 1,694,305 8,437,156 10,131,461 1,239,336 8,892,125 - 2015 SECURITY SQUARE
SHOPPING CTR. MD 5,342,463 15,147,024 (3,326,568) 4,550,533 12,612,386 17,162,919 1,779,927 15,382,992 - 2014 WILKENS BELTWAY PLAZA MD 9,948,235 22,125,942 280,251 9,948,235 22,406,193 32,354,428 5,095,879 27,258,549 - 2014 YORK ROAD PLAZA MD 4,276,715 37,205,757 80,167 4,276,715 37,285,924 41,562,639 4,110,990 37,451,649 - 2014 PUTTY HILL PLAZA MD 4,192,152 11,112,111 555,260 4,192,152 11,667,371 15,859,523 2,728,389 13,131,134 - 2013 SNOWDEN SQUARE S.C. MD 1,929,402 4,557,934 5,155,349 3,326,422 8,316,263 11,642,685 1,577,155 10,065,530 - 2012 COLUMBIA CROSSING MD 3,612,550 34,344,509 336,277 3,612,550 34,680,786 38,293,336 3,391,814 34,901,522 - 2015 DORSEY'S SEARCH VILLAGE
CENTER MD 6,321,963 27,996,087 83,766 6,321,963 28,079,853 34,401,816 2,501,718 31,900,098 - 2015 HICKORY RIDGE MD 7,183,646 26,947,776 486,138 7,183,646 27,433,914 34,617,560 3,037,925 31,579,635 - 2015 HICKORY RIDGE (SUNOCO) MD 543,197 2,122,234 - 543,197 2,122,234 2,665,431 266,003 2,399,428 - 2015 KINGS CONTRIVANCE MD 9,308,349 31,759,940 503,400 9,308,349 32,263,340 41,571,689 3,907,886 37,663,803 - 2014 HARPER'S CHOICE MD 8,429,284 18,373,994 434,377 8,429,284 18,808,371 27,237,655 2,194,028 25,043,627 - 2015

WILDE LAKE MD 1,468,038 5,869,862 25,718,069 2,577,073 30,478,896 33,055,969 8,989,662 24,066,307 - 2002 RIVERHILL VILLAGE CENTER MD 16,825,496 23,282,222 171,904 16,825,496 23,454,126 40,279,622 4,064,952 36,214,670 - 2014 OLD BRANCH PLAZA MD 39,779 130,716 2,117,165 121,747 2,165,913 2,287,660 431,151 1,856,509 - 2003 COLUMBIA CROSSING
OUTPARCELS MD 1,279,200 2,870,800 19,241,721 6,147,248 17,244,473 23,391,721 2,576,298 20,815,423 - 2011 COLUMBIA CROSSING II
SHOP.CTR. MD 3,137,628 19,868,075 2,632,554 3,137,628 22,500,629 25,638,257 4,218,320 21,419,937 - 2013 SHOPS AT DISTRICT HEIGHTS MD 8,165,638 21,970,661 (1,272,892) 7,298,215 21,565,192 28,863,407 1,442,361 27,421,046 13,604,533 2015 ENCHANTED FOREST S.C. MD 20,123,946 34,345,102 400,985 20,123,946 34,746,087 54,870,033 5,046,478 49,823,555 - 2014 SHOPPES AT EASTON MD 6,523,713 16,402,204 (2,576,752) 5,687,500 14,661,665 20,349,165 2,061,372 18,287,793 - 2014 VILLAGES AT URBANA MD 3,190,074 6,067 18,075,503 4,828,774 16,442,870 21,271,644 1,717,904 19,553,740 - 2003 GAITHERSBURG S.C. MD 244,890 6,787,534 1,549,116 244,890 8,336,650 8,581,540 3,411,441 5,170,099 - 1999 KENTLANDS MARKET
SQUARE MD 20,167,048 84,615,052 359,626 20,167,048 84,974,678 105,141,726 6,980,403 98,161,323 33,484,213 2016 SHAWAN PLAZA MD 4,466,000 20,222,367 (571,103) 4,466,000 19,651,264 24,117,264 11,145,763 12,971,501 2,998,379 2008 LAUREL PLAZA MD 349,562 1,398,250 4,277,983 1,571,288 4,454,507 6,025,795 1,904,201 4,121,594 - 1995 LAUREL PLAZA MD 274,580 1,100,968 173,969 274,580 1,274,937 1,549,517 1,173,495 376,022 - 1972 MILL STATION
THEATER/RSTRNTS (3) MD 23,378,543 1,089,760 25,751,974 49,084,509 1,135,768 50,220,277 119,049 50,101,228 - 2015 2016 CENTRE COURT-
RETAIL/BANK MD 1,035,359 7,785,830 65,996 1,035,359 7,851,826 8,887,185 1,332,233 7,554,952 1,705,341 2011 CENTRE COURT-GIANT MD 3,854,099 12,769,628 - 3,854,099 12,769,628 16,623,727 2,396,262 14,227,465 5,827,854 2011 CENTRE COURT-OLD
COURT/COURTYD MD 2,279,177 5,284,577 (177) 2,279,177 5,284,400 7,563,577 1,037,897 6,525,680 - 2011 RADCLIFFE CENTER MD 12,042,713 21,187,946 - 12,042,713 21,187,946 33,230,659 2,746,518 30,484,141 - 2014 TIMONIUM CROSSING MD 2,525,377 14,862,817 540,195 2,525,377 15,403,012 17,928,389 2,144,459 15,783,930 - 2014 TIMONIUM SQUARE MD 6,000,000 24,282,998 14,432,527 7,331,195 37,384,330 44,715,525 15,963,855 28,751,670 - 2003 TOWSON PLACE MD 43,886,876 101,764,931 1,168,691 43,270,792 103,549,706 146,820,498 19,056,834 127,763,664 - 2012 WHITE LAKE COMMONS MI 2,300,050 9,249,607 2,569,183 2,300,050 11,818,790 14,118,840 6,805,501 7,313,339 - 1996 DOWNTOWN FARMINGTON
CENTER MI 1,098,426 4,525,723 5,620,128 1,098,426 10,145,851 11,244,277 3,285,643 7,958,634 - 1993 CENTURY PLAZA MI 178,785 925,818 893,501 178,785 1,819,319 1,998,104 1,391,481 606,623 - 1968 CROSS CREEK S.C. MI 1,451,397 5,806,263 653,261 1,451,397 6,459,524 7,910,921 3,862,120 4,048,801 - 1993 GREEN ORCHARD SHOPPING
CENTER MI 3,682,478 14,730,060 5,961,459 3,682,478 20,691,519 24,373,997 10,568,412 13,805,585 - 1993 THE FOUNTAINS AT ARBOR
LAKES MN 28,585,296 66,699,024 13,518,386 29,485,296 79,317,410 108,802,706 27,021,705 81,781,001 - 2006 ROSEVILLE PLAZA MN 132,842 957,340 9,881,853 1,675,667 9,296,368 10,972,035 1,826,063 9,145,972 - 2005 CREVE COUER SHOPPING
CENTER MO 1,044,598 5,475,623 1,095,602 960,814 6,655,009 7,615,823 3,135,156 4,480,667 - 1998 KIRKWOOD CROSSING MO - 9,704,005 14,520,796 - 24,224,801 24,224,801 15,172,754 9,052,047 - 1998 LEMAY S.C. MO 125,879 503,510 3,673,917 451,155 3,852,151 4,303,306 1,562,794 2,740,512 - 1974 GRAVOIS PLAZA MO 1,032,416 4,455,514 11,398,264 1,032,413 15,853,781 16,886,194 9,612,922 7,273,272 - 2008 PRIMROSE MARKET PLACE MO 2,745,595 10,985,778 8,738,775 2,904,022 19,566,126 22,470,148 10,835,691 11,634,457 - 1994 PRIMROSE MARKETPLACE MO 905,674 3,666,386 5,324,000 905,674 8,990,386 9,896,060 3,457,177 6,438,883 - 2002 CENTER POINT S.C. MO - 550,204 - - 550,204 550,204 423,712 126,492 - 1998 KINGS HIGHWAY S.C. MO 809,087 4,430,514 2,776,341 809,087 7,206,855 8,015,942 3,564,339 4,451,603 - 1998 OVERLAND CROSSING MO - 4,928,677 740,346 - 5,669,023 5,669,023 3,479,162 2,189,861 - 1997 CAVE SPRINGS S.C. MO 1,182,194 7,423,459 7,112,686 1,563,694 14,154,645 15,718,339 10,368,503 5,349,836 - 1997 WOODLAWN MARKETPLACE NC 919,251 3,570,981 2,740,450 919,251 6,311,431 7,230,682 3,476,390 3,754,292 - 2008 TYVOLA SQUARE NC - 4,736,345 7,612,562 - 12,348,907 12,348,907 9,299,343 3,049,564 - 1986 CROSSROADS PLAZA NC 767,864 3,098,881 1,233,350 767,864 4,332,231 5,100,095 1,744,160 3,355,935 - 2000 JETTON VILLAGE SHOPPES NC 3,875,224 10,292,231 444,020 2,143,695 12,467,780 14,611,475 2,121,243 12,490,232 - 2011 MOUNTAIN ISLAND
MARKETPLACE NC 3,318,587 7,331,413 749,369 3,818,587 7,580,782 11,399,369 1,452,069 9,947,300 - 2012 WOODLAWN SHOPPING
CENTER NC 2,010,725 5,833,626 1,691,133 2,010,725 7,524,759 9,535,484 1,204,350 8,331,134 - 2012 CROSSROADS PLAZA NC 13,405,529 86,455,763 (198,549) 13,405,529 86,257,214 99,662,743 13,895,239 85,767,504 - 2014 QUAIL CORNERS NC 7,318,321 26,675,644 1,361,806 7,318,321 28,037,450 35,355,771 3,168,511 32,187,260 16,323,912 2014 OAKCREEK VILLAGE NC 1,882,800 7,551,576 (9,434,376) - - - - - - 1996 DAVIDSON COMMONS NC 2,978,533 12,859,867 633,088 2,978,533 13,492,955 16,471,488 2,287,031 14,184,457 - 2012 PARK PLACE SC NC 5,461,478 16,163,494 (484,835) 5,469,809 15,670,328 21,140,137 6,444,538 14,695,599 - 2008 MOORESVILLE CROSSING NC 12,013,727 30,604,173 193,886 11,625,801 31,185,985 42,811,786 11,327,237 31,484,549 - 2007 PLEASANT VALLEY
PROMENADE NC 5,208,885 20,885,792 13,481,663 5,208,885 34,367,455 39,576,340 19,878,739 19,697,601 - 1993 BRENNAN STATION NC 7,749,751 20,556,891 (637,688) 6,321,923 21,347,031 27,668,954 5,245,854 22,423,100 - 2011 BRENNAN STATION
OUTPARCEL NC 627,906 1,665,576 (162,856) 450,232 1,680,394 2,130,626 333,323 1,797,303 - 2011 CLOVERDALE PLAZA NC 540,667 719,655 6,293,580 540,667 7,013,235 7,553,902 3,506,463 4,047,439 - 1969 WEBSTER SQUARE NH 11,683,145 41,708,383 5,103,293 11,683,145 46,811,676 58,494,821 6,511,086 51,983,735 - 2014 WEBSTER SQUARE - DSW NH 1,346,391 3,638,397 124,707 1,346,391 3,763,104 5,109,495 48,056 5,061,439 - 2017 WEBSTER SQUARE NORTH NH 2,163,138 6,511,424 3,574 2,163,138 6,514,998 8,678,136 577,393 8,100,743 - 2016 ROCKINGHAM PLAZA NH 2,660,915 10,643,660 15,108,605 3,148,715 25,264,465 28,413,180 12,080,600 16,332,580 - 2008 SHOP RITE PLAZA NJ 2,417,583 6,364,094 1,646,439 2,417,583 8,010,533 10,428,116 7,207,932 3,220,184 - 1985 MARLTON PLAZA NJ - 4,318,534 105,215 - 4,423,749 4,423,749 2,376,127 2,047,622 - 1996 HILLVIEW SHOPPING
CENTER NJ 16,007,647 32,607,423 (1,255,385) 16,007,647 31,352,038 47,359,685 4,765,750 42,593,935 - 2014 GARDEN STATE PAVILIONS NJ 7,530,709 10,801,949 20,648,695 12,203,841 26,777,512 38,981,353 6,391,860 32,589,493 - 2011 CLARK SHOPRITE 70
CENTRAL AVE NJ 3,496,673 11,693,769 994,829 13,959,593 2,225,678 16,185,271 678,560 15,506,711 - 2013 COMMERCE CENTER WEST NJ 385,760 1,290,080 160,534 793,595 1,042,779 1,836,374 236,451 1,599,923 - 2013 COMMERCE CENTER EAST NJ 1,518,930 5,079,690 1,753,865 7,235,196 1,117,289 8,352,485 355,825 7,996,660 - 2013 CENTRAL PLAZA NJ 3,170,465 10,602,845 (52,188) 5,145,167 8,575,955 13,721,122 1,835,056 11,886,066 - 2013 EAST WINDSOR VILLAGE NJ 9,335,011 23,777,978 112,050 9,335,011 23,890,028 33,225,039 6,110,077 27,114,962 - 2008 HOLMDEL TOWNE CENTER NJ 10,824,624 43,301,494 9,397,795 10,824,624 52,699,289 63,523,913 19,878,655 43,645,258 - 2002 COMMONS AT HOLMDEL NJ 16,537,556 38,759,952 3,475,560 16,537,556 42,235,512 58,773,068 16,945,466 41,827,602 - 2004 PLAZA AT HILLSDALE NJ 7,601,596 6,994,196 1,432,319 7,601,596 8,426,515 16,028,111 1,088,251 14,939,860 5,836,506 2014 MAPLE SHADE NJ - 9,957,611 (845,233) - 9,112,378 9,112,378 1,084,452 8,027,926 - 2009 PLAZA AT SHORT HILLS NJ 20,155,471 11,061,984 501,894 20,155,471 11,563,878 31,719,349 1,955,992 29,763,357 9,362,130 2014 NORTH BRUNSWICK PLAZA NJ 3,204,978 12,819,912 25,982,405 3,204,978 38,802,317 42,007,295 18,853,759 23,153,536 - 1994 PISCATAWAY TOWN CENTER NJ 3,851,839 15,410,851 1,251,418 3,851,839 16,662,269 20,514,108 8,445,408 12,068,700 - 1998 RIDGEWOOD S.C. NJ 450,000 2,106,566 1,124,923 450,000 3,231,489 3,681,489 1,737,901 1,943,588 - 1993 UNION CRESCENT III NJ 7,895,483 3,010,640 28,918,367 8,696,579 31,127,911 39,824,490 14,324,046 25,500,444 - 2007 WESTMONT PLAZA NJ 601,655 2,404,604 12,309,854 601,655 14,714,458 15,316,113 6,544,416 8,771,697 - 1994 WILLOWBROOK PLAZA NJ 15,320,436 40,996,874 5,392,418 15,320,436 46,389,292 61,709,728 6,087,587 55,622,141 - 2009 DEL MONTE PLAZA NV 2,489,429 5,590,415 624,647 2,210,000 6,494,491 8,704,491 3,368,154 5,336,337 2,303,167 2006 DEL MONTE PLAZA ANCHOR
PARCEL NV 6,512,745 17,599,602 43,051 6,520,017 17,635,381 24,155,398 306,920 23,848,478 - 2017 REDFIELD PROMENADE NV 4,415,339 32,035,192 216,060 4,415,339 32,251,252 36,666,591 4,692,954 31,973,637 - 2015 MCQUEEN CROSSINGS NV 5,017,431 20,779,024 230,274 5,017,431 21,009,298 26,026,729 3,063,391 22,963,338 - 2015 GALENA JUNCTION NV 8,931,027 17,503,387 130,381 8,931,027 17,633,768 26,564,795 2,425,512 24,139,283 - 2015 D'ANDREA MARKETPLACE NV 11,556,067 29,435,364 317,620 11,556,067 29,752,984 41,309,051 8,059,654 33,249,397 11,101,966 2007 SPARKS MERCANTILE NV 6,221,614 17,069,172 (118,794) 6,221,614 16,950,378 23,171,992 2,263,396 20,908,596 - 2015 BRIDGEHAMPTON
COMMONS-W&E SIDE NY 1,811,752 3,107,232 30,455,727 1,858,188 33,516,523 35,374,711 20,217,516 15,157,195 - 1972 OCEAN PLAZA NY 564,097 2,268,768 8,468 564,097 2,277,236 2,841,333 860,895 1,980,438 - 2003 KINGS HIGHWAY NY 2,743,820 6,811,268 1,841,513 2,743,820 8,652,781 11,396,601 3,442,272 7,954,329 - 2004 RALPH AVENUE PLAZA NY 4,414,466 11,339,857 3,659,611 4,414,467 14,999,467 19,413,934 5,210,918 14,203,016 - 2004 BELLMORE S.C. NY 1,272,269 3,183,547 1,590,605 1,272,269 4,774,152 6,046,421 1,723,088 4,323,333 - 2004 MARKET AT BAY SHORE NY 12,359,621 30,707,802 2,944,895 12,359,621 33,652,697 46,012,318 12,244,461 33,767,857 11,915,580 2006 KEY FOOD - ATLANTIC AVE NY 2,272,500 5,624,589 509,458 4,808,822 3,597,725 8,406,547 589,607 7,816,940 - 2012 VETERANS MEMORIAL
PLAZA NY 5,968,082 23,243,404 7,173,073 5,980,130 30,404,429 36,384,559 14,525,614 21,858,945 - 1998 BIRCHWOOD PLAZA
COMMACK NY 3,630,000 4,774,791 1,145,649 3,630,000 5,920,440 9,550,440 1,878,367 7,672,073 - 2007 ELMONT S.C. NY 3,011,658 7,606,066 5,972,835 3,011,658 13,578,901 16,590,559 3,517,433 13,073,126 - 2004 ELMONT PLAZA NY - 5,119,714 - - 5,119,714 5,119,714 574,489 4,545,225 - 2015 ELMSFORD CENTER 1 NY 4,134,273 1,193,084 - 4,134,273 1,193,084 5,327,357 153,946 5,173,411 - 2013 ELMSFORD CENTER 2 NY 4,076,403 15,598,504 949,902 4,076,403 16,548,406 20,624,809 2,454,445 18,170,364 - 2013 FRANKLIN SQUARE S.C. NY 1,078,541 2,516,581 3,937,137 1,078,541 6,453,718 7,532,259 2,455,482 5,076,777 - 2004 AIRPORT PLAZA NY 22,711,189 107,011,500 4,104,309 22,711,189 111,115,809 133,826,998 15,307,408 118,519,590 - 2015 KISSENA BOULEVARD
SHOPPING CTR NY 11,610,000 2,933,487 203,655 11,610,000 3,137,142 14,747,142 1,064,757 13,682,385 - 2007 HAMPTON BAYS PLAZA NY 1,495,105 5,979,320 3,267,379 1,495,105 9,246,699 10,741,804 7,108,782 3,633,022 - 1989 HICKSVILLE PLAZA NY 3,542,739 8,266,375 3,173,411 3,542,739 11,439,786 14,982,525 4,059,222 10,923,303 - 2004 WOODBURY CENTRE NY 4,314,991 32,585,508 2,118,687 4,314,991 34,704,195 39,019,186 4,055,102 34,964,084 - 2015 TURNPIKE PLAZA NY 2,471,832 5,839,416 569,888 2,471,832 6,409,304 8,881,136 1,823,043 7,058,093 - 2011 JERICHO COMMONS SOUTH NY 12,368,330 33,071,495 3,069,537 12,368,330 36,141,032 48,509,362 10,614,231 37,895,131 8,072,228 2007 501 NORTH BROADWAY NY - 1,175,543 228,522 - 1,404,065 1,404,065 696,458 707,607 - 2007 MILLERIDGE INN NY 7,500,330 481,316 11,226 7,500,000 492,872 7,992,872 23,088 7,969,784 - 2015 FAMILY DOLLAR UNION
TURNPIKE NY 909,000 2,249,775 258,033 1,056,709 2,360,099 3,416,808 461,119 2,955,689 - 2012

LITTLE NECK PLAZA NY 3,277,254 13,161,218 5,969,866 3,277,253 19,131,085 22,408,338 6,807,167 15,601,171 - 2003 KEY FOOD - 21ST STREET NY 1,090,800 2,699,730 (159,449) 1,669,153 1,961,928 3,631,081 262,759 3,368,322 - 2012 MANHASSET CENTER NY 4,567,003 19,165,808 29,319,555 3,471,939 49,580,427 53,052,366 23,360,482 29,691,884 - 1999 MANHASSET
CENTER(residential) NY 950,000 - - 950,000 - 950,000 - 950,000 - 2012 MASPETH QUEENS-DUANE
READE NY 1,872,013 4,827,940 1,036,886 1,872,013 5,864,826 7,736,839 2,060,806 5,676,033 1,698,785 2004 NORTH MASSAPEQUA S.C. NY 1,880,816 4,388,549 (895,655) 1,623,601 3,750,109 5,373,710 2,132,828 3,240,882 - 2004 MINEOLA CROSSINGS NY 4,150,000 7,520,692 213,964 4,150,000 7,734,656 11,884,656 2,188,151 9,696,505 - 2007 SMITHTOWN PLAZA NY 3,528,000 7,364,098 458,948 3,528,000 7,823,046 11,351,046 2,608,077 8,742,969 - 2009 MANETTO HILL PLAZA NY 263,693 584,031 10,728,178 263,693 11,312,209 11,575,902 6,444,252 5,131,650 - 1969 SYOSSET S.C. NY 106,655 76,197 2,068,924 106,655 2,145,121 2,251,776 1,093,703 1,158,073 - 1990 RICHMOND S.C. NY 2,280,000 9,027,951 19,898,449 2,280,000 28,926,400 31,206,400 12,926,031 18,280,369 - 1989 GREENRIDGE PLAZA NY 2,940,000 11,811,964 6,443,810 3,148,424 18,047,350 21,195,774 7,549,862 13,645,912 - 1997 THE BOULEVARDE NY 28,723,536 38,232,267 505,997 28,723,536 38,738,264 67,461,800 13,948,276 53,513,524 - 2006 FOREST AVENUE PLAZA NY 4,558,592 10,441,408 157,648 4,558,592 10,599,056 15,157,648 3,886,146 11,271,502 - 2005 INDEPENDENCE PLAZA NY 12,279,093 34,813,852 (2,029,722) 16,131,632 28,931,591 45,063,223 6,069,593 38,993,630 27,966,942 2014 KEY FOOD - CENTRAL AVE. NY 2,787,600 6,899,310 (394,910) 2,603,321 6,688,679 9,292,000 936,676 8,355,324 - 2012 WHITE PLAINS S.C. NY 1,777,775 4,453,894 2,469,097 1,777,775 6,922,991 8,700,766 2,400,611 6,300,155 - 2004 CHAMPION FOOD
SUPERMARKET NY 757,500 1,874,813 (24,388) 2,241,118 366,807 2,607,925 134,761 2,473,164 - 2012 SHOPRITE S.C. NY 871,977 3,487,909 - 871,977 3,487,909 4,359,886 2,236,943 2,122,943 - 1998 ROMAINE PLAZA NY 782,459 1,825,737 588,133 782,459 2,413,870 3,196,329 701,315 2,495,014 - 2005 OREGON TRAIL CENTER OR 5,802,422 12,622,879 596,890 5,802,422 13,219,769 19,022,191 5,044,777 13,977,414 - 2009 POWELL VALLEY JUNCTION OR 5,062,500 3,152,982 (2,508,712) 2,035,125 3,671,645 5,706,770 1,497,193 4,209,577 - 2009 JANTZEN BEACH CENTER OR 57,575,244 102,844,429 94,230 57,578,800 102,935,103 160,513,903 2,421,022 158,092,881 - 2017 SUBURBAN SQUARE PA 70,679,871 166,351,381 36,662,888 71,279,871 202,414,269 273,694,140 48,095,352 225,598,788 - 2007 CHIPPEWA PLAZA PA 2,881,525 11,526,101 (2,900,632) 1,917,139 9,589,855 11,506,994 5,435,992 6,071,002 - 2000 CARNEGIE PLAZA PA - 3,298,908 17,747 - 3,316,655 3,316,655 1,530,764 1,785,891 - 1999 CENTER SQUARE SHOPPING
CENTER PA 731,888 2,927,551 1,200,573 691,297 4,168,715 4,860,012 2,740,132 2,119,880 - 1996 WAYNE PLAZA PA 6,127,623 15,605,012 677,938 6,135,670 16,274,903 22,410,573 4,466,242 17,944,331 - 2008 DEVON VILLAGE PA 4,856,379 25,846,910 4,044,439 4,856,379 29,891,349 34,747,728 6,192,928 28,554,800 - 2012 POCONO PLAZA PA 1,050,000 2,372,628 1,539,736 1,050,000 3,912,364 4,962,364 3,219,610 1,742,754 - 1973 RIDGE PIKE PLAZA PA 1,525,337 4,251,732 (2,602,921) 914,299 2,259,849 3,174,148 1,002,912 2,171,236 - 2008 WHITELAND - HOBBY LOBBY PA 176,666 4,895,360 1,447,703 176,666 6,343,063 6,519,729 2,463,869 4,055,860 - 1999 WHITELAND TOWN CENTER PA 731,888 2,927,551 59,067 731,888 2,986,618 3,718,506 1,601,396 2,117,110 - 1996 HARRISBURG EAST
SHOPPING CTR. PA 452,888 6,665,238 10,257,296 3,002,888 14,372,534 17,375,422 7,041,882 10,333,540 - 2002 TOWNSHIP LINE S.C. PA 731,888 2,927,551 - 731,888 2,927,551 3,659,439 1,601,396 2,058,043 - 1996 HORSHAM POINT PA 3,813,247 18,189,450 133,911 3,813,247 18,323,361 22,136,608 1,704,650 20,431,958 - 2015 HOLIDAY CENTER PA 7,726,844 20,014,243 (4,612,312) 6,165,085 16,963,690 23,128,775 2,883,114 20,245,661 - 2015 NORRITON SQUARE PA 686,134 2,664,535 3,940,037 774,084 6,516,622 7,290,706 4,817,076 2,473,630 - 1984 NEW KENSINGTON S.C PA 521,945 2,548,322 862,730 521,945 3,411,052 3,932,997 3,169,521 763,476 - 1986 SEARS HARDWARE PA 10,000 - - 10,000 - 10,000 - 10,000 - 2015 FRANKFORD AVENUE S.C. PA 731,888 2,927,551 - 731,888 2,927,551 3,659,439 1,601,396 2,058,043 - 1996 WEXFORD PLAZA PA 6,413,635 9,774,600 10,074,686 6,299,299 19,963,622 26,262,921 4,282,319 21,980,602 - 2010 LINCOLN SQUARE (3) PA 90,478,522 - - 90,478,522 - 90,478,522 - 90,478,522 - 2017 2017 CRANBERRY TOWNSHIP-
PARCEL 1&2 PA 10,270,846 30,769,592 (905,158) 6,070,254 34,065,026 40,135,280 1,950,427 38,184,853 - 2016 CROSSROADS PLAZA PA 788,761 3,155,044 12,878,677 976,439 15,846,043 16,822,482 9,924,589 6,897,893 - 1986 SPRINGFIELD S.C. PA 919,998 4,981,589 12,875,672 920,000 17,857,259 18,777,259 9,743,110 9,034,149 - 1983 SHREWSBURY SQUARE S.C. PA 8,066,107 16,997,997 (1,696,030) 6,534,966 16,833,108 23,368,074 2,199,516 21,168,558 - 2014 WHITEHALL MALL PA - 5,195,577 - - 5,195,577 5,195,577 2,842,026 2,353,551 - 1996 WHOLE FOODS AT
WYNNEWOOD PA 15,042,165 - 11,770,283 13,772,394 13,040,054 26,812,448 326,435 26,486,013 - 2014 SHOPPES AT WYNNEWOOD PA 7,478,907 - 3,605,920 7,478,907 3,605,920 11,084,827 153,010 10,931,817 - 2015 WEST MARKET ST. PLAZA PA 188,562 1,158,307 41,712 188,562 1,200,019 1,388,581 1,173,254 215,327 - 1986 REXVILLE TOWN CENTER PR 24,872,982 48,688,161 7,302,027 25,678,064 55,185,106 80,863,170 33,091,221 47,771,949 - 2006 PLAZA CENTRO - COSTCO PR 3,627,973 10,752,213 1,564,471 3,866,206 12,078,451 15,944,657 6,657,483 9,287,174 - 2006 PLAZA CENTRO - MALL PR 19,873,263 58,719,179 5,962,924 19,408,112 65,147,254 84,555,366 34,622,838 49,932,528 - 2006 PLAZA CENTRO - RETAIL PR 5,935,566 16,509,748 480,595 6,026,070 16,899,839 22,925,909 9,827,855 13,098,054 - 2006 PLAZA CENTRO - SAM'S CLUB PR 6,643,224 20,224,758 2,375,805 6,520,090 22,723,697 29,243,787 21,967,992 7,275,795 - 2006 LOS COLOBOS - BUILDERS
SQUARE PR 4,404,593 9,627,903 1,387,483 4,461,145 10,958,834 15,419,979 9,669,563 5,750,416 - 2006 LOS COLOBOS - KMART PR 4,594,944 10,120,147 752,678 4,402,338 11,065,431 15,467,769 10,058,014 5,409,755 - 2006 LOS COLOBOS I PR 12,890,882 26,046,669 1,071,029 13,613,375 26,395,205 40,008,580 15,815,395 24,193,185 - 2006 LOS COLOBOS II PR 14,893,698 30,680,556 5,395,942 15,142,300 35,827,896 50,970,196 19,767,195 31,203,001 - 2006 WESTERN PLAZA -
MAYAQUEZ ONE PR 10,857,773 12,252,522 1,308,357 11,241,993 13,176,659 24,418,652 9,284,389 15,134,263 - 2006 WESTERN PLAZA -
MAYAGUEZ TWO PR 16,874,345 19,911,045 2,174,474 16,872,647 22,087,217 38,959,864 15,126,846 23,833,018 - 2006 MANATI VILLA MARIA SC PR 2,781,447 5,673,119 344,813 2,606,588 6,192,791 8,799,379 3,866,240 4,933,139 - 2006 PONCE TOWN CENTER PR 14,432,778 28,448,754 4,768,662 14,903,024 32,747,170 47,650,194 16,750,683 30,899,511 - 2006 TRUJILLO ALTO PLAZA PR 12,053,673 24,445,858 2,591,978 12,289,288 26,802,221 39,091,509 16,210,974 22,880,535 - 2006 ST. ANDREWS CENTER SC 730,164 3,132,092 19,199,359 730,164 22,331,451 23,061,615 10,681,625 12,379,990 - 1978 WESTWOOD PLAZA SC 1,744,430 6,986,094 9,204,220 1,726,833 16,207,911 17,934,744 4,720,254 13,214,490 - 1995 CHERRYDALE POINT SC 5,801,948 32,055,019 1,947,764 5,801,948 34,002,783 39,804,731 8,648,264 31,156,467 - 2009 WOODRUFF SHOPPING
CENTER SC 3,110,439 15,501,117 1,146,585 3,465,199 16,292,942 19,758,141 3,332,158 16,425,983 - 2010 FOREST PARK SC 1,920,241 9,544,875 214,354 1,920,241 9,759,229 11,679,470 1,693,776 9,985,694 - 2012 OLD TOWNE VILLAGE TN - 4,133,904 4,046,503 - 8,180,407 8,180,407 6,050,033 2,130,374 - 1978 CENTER OF THE HILLS TX 2,923,585 11,706,145 1,337,767 2,923,585 13,043,912 15,967,497 5,613,606 10,353,891 - 2008 DOWLEN TOWN CENTER-II TX 2,244,581 - (722,251) 484,828 1,037,502 1,522,330 194,761 1,327,569 - 2002 GATEWAY STATION TX 1,373,692 28,145,158 1,105,295 1,374,880 29,249,265 30,624,145 3,945,577 26,678,568 - 2011 LAS TIENDAS PLAZA TX 8,678,107 - 27,150,696 7,943,925 27,884,878 35,828,803 5,860,115 29,968,688 - 2005 GATEWAY STATION PHASE
II TX 4,140,176 12,020,460 75,694 4,143,385 12,092,945 16,236,330 130,258 16,106,072 - 2017 ISLAND GATE PLAZA TX - 944,562 1,903,963 - 2,848,525 2,848,525 1,124,081 1,724,444 - 1997 ISLAND GATE PLAZA TX 4,343,000 4,723,215 3,659,997 4,292,636 8,433,576 12,726,212 2,403,829 10,322,383 - 2011 CONROE MARKETPLACE TX 18,869,087 50,756,554 (2,993,250) 10,841,611 55,790,780 66,632,391 6,209,948 60,422,443 - 2015 MONTGOMERY PLAZA TX 10,739,067 63,065,333 (385,751) 10,738,796 62,679,853 73,418,649 8,479,431 64,939,218 28,105,799 2015 PRESTON LEBANON
CROSSING TX 13,552,180 - 26,071,137 12,163,694 27,459,623 39,623,317 6,909,545 32,713,772 - 2006 LAKE PRAIRIE TOWN
CROSSING TX 7,897,491 - 28,638,126 6,783,464 29,752,153 36,535,617 5,767,928 30,767,689 - 2006 CENTER AT BAYBROOK TX 6,941,017 27,727,491 10,958,643 6,928,120 38,699,031 45,627,151 16,641,823 28,985,328 - 1998 CYPRESS TOWNE CENTER TX 6,033,932 - 1,692,407 2,251,666 5,474,673 7,726,339 1,054,421 6,671,918 - 2003 CYPRESS TOWNE CENTER TX 12,329,195 36,836,381 1,247,724 8,644,145 41,769,155 50,413,300 2,253,375 48,159,925 - 2016 CYPRESS TOWNE CENTER
(PHASE II) TX 2,061,477 6,157,862 (1,361,233) 270,374 6,587,732 6,858,106 431,425 6,426,681 - 2016 THE CENTRE AT
COPPERFIELD TX 6,723,267 22,524,551 535,094 6,723,357 23,059,555 29,782,912 2,669,083 27,113,829 - 2015 COPPERWOOD VILLAGE TX 13,848,109 84,183,731 794,874 13,848,109 84,978,605 98,826,714 11,166,622 87,660,092 - 2015 ATASCOCITA COMMONS
SHOP.CTR. TX 16,322,636 54,587,066 625,724 16,099,004 55,436,422 71,535,426 8,061,999 63,473,427 28,528,637 2013 TOMBALL CROSSINGS TX 8,517,427 28,484,450 573,139 7,964,894 29,610,122 37,575,016 4,373,334 33,201,682 - 2013 COPPERFIELD VILLAGE
SHOP.CTR. TX 7,827,639 34,864,441 429,207 7,827,639 35,293,648 43,121,287 4,112,160 39,009,127 - 2015 SHOPS AT VISTA RIDGE TX 3,257,199 13,029,416 2,315,052 3,257,199 15,344,468 18,601,667 7,331,260 11,270,407 - 1998 VISTA RIDGE PLAZA TX 2,926,495 11,716,483 2,600,033 2,926,495 14,316,516 17,243,011 7,236,985 10,006,026 - 1998 VISTA RIDGE PLAZA TX 2,276,575 9,106,300 1,399,033 2,276,575 10,505,333 12,781,908 5,372,115 7,409,793 - 1998 KROGER PLAZA TX 520,340 2,081,356 1,444,953 520,340 3,526,309 4,046,649 1,898,157 2,148,492 - 1995 ACCENT PLAZA TX 500,414 2,830,835 - 500,414 2,830,835 3,331,249 1,537,166 1,794,083 - 1996 SOUTHLAKE OAKS PHASE II-
480 W. TX 3,011,260 7,703,844 103,968 3,016,617 7,802,455 10,819,072 2,779,262 8,039,810 - 2008 WOODBRIDGE SHOPPING
CENTER TX 2,568,705 6,813,716 107,746 2,568,705 6,921,462 9,490,167 1,374,785 8,115,382 - 2012 GRAND PARKWAY
MARKETPLACE TX 25,363,548 - 60,529,604 21,937,009 63,956,143 85,893,152 372,156 85,520,996 - 2014 GRAND PARKWAY MARKET
PLACE II (3) TX 13,436,447 - 29,966,997 43,403,444 - 43,403,444 - 43,403,444 - 2015 TEMPLE TOWNE CENTER TX 609,317 2,983,262 (89,332) 609,317 2,893,930 3,503,247 305,746 3,197,501 - 2015 TEMPLE TOWNE CENTER TX 4,909,857 25,882,414 (4,385,108) 4,105,739 22,301,424 26,407,163 4,017,296 22,389,867 - 2015 BURKE TOWN PLAZA VA - 43,240,068 83,175 - 43,323,243 43,323,243 6,042,467 37,280,776 - 2014 OLD TOWN PLAZA VA 4,500,000 41,569,735 (15,697,554) 3,052,800 27,319,381 30,372,181 5,498,436 24,873,745 - 2007 SKYLINE VILLAGE VA 10,145,283 28,764,045 225,352 10,573,875 28,560,805 39,134,680 3,390,576 35,744,104 - 2014 SUDLEY TOWNE PLAZA VA 4,114,293 15,988,465 (9,023,711) 2,204,943 8,874,104 11,079,047 1,317,102 9,761,945 - 2015 BURLINGTON COAT CENTER VA 670,500 2,751,375 2,661,127 670,500 5,412,502 6,083,002 1,784,315 4,298,687 - 1995 TOWNE SQUARE VA 8,499,373 24,302,141 1,908,469 8,858,432 25,851,551 34,709,983 3,137,543 31,572,440 - 2014 POTOMAC RUN PLAZA VA 27,369,515 48,451,209 (2,332,371) 27,369,515 46,118,838 73,488,353 13,090,432 60,397,921 - 2008 DULLES TOWN CROSSING VA 53,285,116 104,175,738 (355,523) 53,285,116 103,820,215 157,105,331 14,810,943 142,294,388 - 2015

DOCSTONE COMMONS VA 3,839,249 11,468,264 441,201 3,903,963 11,844,751 15,748,714 540,782 15,207,932 - 2016 DOCSTONE O/P - STAPLES VA 1,425,307 4,317,552 (883,709) 1,167,588 3,691,562 4,859,150 210,701 4,648,449 - 2016 STAFFORD MARKETPLACE VA 26,893,429 86,449,614 36,364 26,893,429 86,485,978 113,379,407 9,382,013 103,997,394 - 2015 GORDON PLAZA VA - 3,330,621 40,921 - 3,371,542 3,371,542 108,863 3,262,679 - 2017 AUBURN NORTH WA 7,785,841 18,157,625 7,542,304 7,785,841 25,699,929 33,485,770 7,113,252 26,372,518 - 2007 THE MARKETPLACE AT
FACTORIA WA 60,502,358 92,696,231 4,443,162 60,502,358 97,139,393 157,641,751 18,626,509 139,015,242 56,189,197 2013 FRONTIER VILLAGE
SHOPPING CTR. WA 10,750,863 35,671,801 96,299 10,750,863 35,768,100 46,518,963 6,231,338 40,287,625 - 2012 GATEWAY SHOPPING
CENTER WA 6,937,929 11,270,322 303,983 6,937,929 11,574,305 18,512,234 689,626 17,822,608 - 2016 OLYMPIA WEST OUTPARCEL WA 360,000 799,640 100,360 360,000 900,000 1,260,000 125,262 1,134,738 - 2012 FRANKLIN PARK COMMONS WA 5,418,825 11,988,657 1,031,639 5,418,825 13,020,296 18,439,121 1,691,466 16,747,655 - 2015 SILVERDALE PLAZA WA 3,875,013 32,894,027 86,051 3,755,613 33,099,478 36,855,091 5,485,432 31,369,659 - 2012
OTHER PROPERTY INTERESTS KEY BANK BUILDING NY 1,500,000 40,486,755 (11,999,846) 655,798 29,331,111 29,986,909 19,024,009 10,962,900 - 2006 EL MIRAGE AZ 6,786,441 503,987 130,064 6,786,441 634,051 7,420,492 86,961 7,333,531 - 2008 ASANTE RETAIL CENTER AZ 8,702,635 3,405,683 2,866,808 11,039,472 3,935,654 14,975,126 501,713 14,473,413 - 2004 SURPRISE SPECTRUM AZ 4,138,760 94,572 1,035 4,138,760 95,607 4,234,367 13,456 4,220,911 - 2008 LAKE WALES S.C. FL 601,052 - - 601,052 - 601,052 - 601,052 - 2009 PLANTATION CROSSING FL 7,524,800 - (5,516,183) 2,008,617 - 2,008,617 - 2,008,617 - 2005 MILTON, FL FL 1,275,593 - (423,450) 852,143 - 852,143 - 852,143 - 2007 LOWES S.C. FL 1,620,203 - (406,657) 507,530 706,016 1,213,546 706,016 507,530 - 2007 TREASURE VALLEY ID 6,501,240 - (4,426,611) 962,721 1,111,908 2,074,629 1,106,073 968,556 - 2005 TOWN & COUNTRY S.C. IL 315,387 422,905 (85,154) 230,233 422,905 653,138 386,014 267,124 - 1972 22ND STREET PLAZA
OUTPARCEL IL - 99,640 1,071,530 - 1,171,170 1,171,170 81,873 1,089,297 - 2001 MARKETPLACE OF
OAKLAWN IL - 678,668 108,483 - 787,151 787,151 748,798 38,353 - 1998 LINWOOD-INDIANAPOLIS IN 31,045 - - 31,045 - 31,045 - 31,045 - 1991 BAYOU WALK LA 4,586,895 10,836,007 (4,291,095) 2,993,728 8,138,079 11,131,807 2,830,013 8,301,794 12,414,563 2010 FLINT - VACANT LAND MI 101,424 - - 101,424 - 101,424 - 101,424 - 2012 CHARLOTTE SPORTS &
FITNESS CTR NC 500,754 1,858,643 479,046 500,754 2,337,689 2,838,443 1,760,102 1,078,341 - 1986 SENATE/HILLSBOROUGH
CROSSI NC 519,395 - - 519,395 - 519,395 - 519,395 - 2003 WAKEFIELD COMMONS III NC 6,506,450 - (5,397,400) 1,475,214 (366,164) 1,109,050 197,785 911,265 - 2001 WAKEFIELD CROSSINGS NC 3,413,932 - (3,017,959) 336,236 59,737 395,973 8,287 387,686 - 2001 HILLSBOROUGH
PROMENADE NJ 11,886,809 - (6,632,045) 5,006,054 248,710 5,254,764 30,796 5,223,968 - 2001 NORTHPORT LAND PARCEL NY - 14,460 49,179 - 63,639 63,639 - 63,639 - 2012 MERRY LANE (PARKING
LOT) NY 1,485,531 1,749 288,651 1,485,531 290,400 1,775,931 - 1,775,931 - 2007 JERICHO ATRIUM NY 10,624,099 20,065,496 364,026 10,624,099 20,429,522 31,053,621 3,284,297 27,769,324 - 2016 BIRCHWOOD PARK NY 3,507,162 4,126 (1,510,445) 2,000,000 843 2,000,843 843 2,000,000 - 2007 STATEN ISLAND PLAZA NY 5,600,744 6,788,460 (2,981,672) 9,407,532 - 9,407,532 - 9,407,532 - 2005 KENT CENTER OH 2,261,530 - (1,826,497) 435,033 - 435,033 - 435,033 - 1995 HIGH PARK CTR RETAIL OH 3,783,875 - (2,778,460) 921,704 83,711 1,005,415 37,907 967,508 - 2001 MCMINNVILLE PLAZA OR 4,062,327 - 991,482 4,062,327 991,482 5,053,809 96,213 4,957,596 - 2006 HOSPITAL GARAGE & MED.
OFFICE PA - 30,061,177 59,094 - 30,120,271 30,120,271 9,096,746 21,023,525 - 2004 COULTER AVE. PARCEL PA 577,630 1,348,019 11,877,439 13,444,154 358,934 13,803,088 10,436 13,792,652 - 2015 MORRISVILLE S.C. PA 340,000 1,360,000 (1,669,238) 30,762 - 30,762 - 30,762 - 1996 HICKORY RIDGE COMMONS TN 596,347 2,545,033 (2,457,560) 683,820 - 683,820 - 683,820 - 2000 BLUE RIDGE Various 12,346,900 71,529,796 (35,874,424) 6,069,109 41,933,163 48,002,272 20,764,707 27,237,565 6,595,242 2005 MICROPROPERTIES Various 528,534 1,090,980 - 528,534 1,090,980 1,619,514 211,709 1,407,805 - 2012 BALANCE OF PORTFOLIO (4) Various 1,907,182 65,127,208 (9,296,277) (99,898) 57,838,011 57,738,113 30,663,071 27,075,042 -
TOTALS $3,232,368,780 $7,876,947,274 $1,544,128,944 $3,366,655,421 $9,286,789,577 $12,653,444,998 $2,433,052,747 $10,220,392,251 $882,787,275 (1) The negative balance for costs capitalized subsequent to acquisition could include parcels/out-parcels sold, assets held-for-sale, provision for losses and/ordemolition of part of a property for redevelopment.(2) Includes fair market value of debt adjustments, net and deferred financing costs, net.(3) Shopping center includes active real estate under development project or land held for development.(4) Includes fixtures, leasehold improvements and other costs capitalized.
96

Table of Contents
KIMCO REALTY CORPORATION AND SUBSIDIARIES SCHEDULE III - REAL ESTATE AND ACCUMULATED DEPRECIATION
December 31, 2017 Depreciation and amortization are provided on the straight-line method over the estimated useful lives of the assets as follows: Buildings and building improvements (in years) 15 to 50 Fixtures, building and leasehold improvements (including certain
identified intangible assets) Terms of leases or useful lives, whichever is shorter
The aggregate cost for Federal income tax purposes was approximately $10.3 billion at December 31, 2017. The changes in total real estate assets for the years ended December 31, 2017, 2016 and 2015 are as follows:
2017 2016 2015 Balance, beginning of period $ 12,008,075,148 $ 11,568,809,126 $ 10,018,225,775 Additions during period:
Acquisitions 438,125,265 181,719,189 278,401,182 Improvements 414,955,609 217,668,292 191,662,698 Transfers from unconsolidated joint ventures 329,194,717 615,511,560 1,673,542,610 Change in exchange rate 1,035,816 598,744 -
Deductions during period: Sales (315,954,464) (391,758,149) (507,185,370)Assets held for sale (56,187,719) (12,608,829) (587,007)Adjustment of fully depreciated assets (107,660,366) (80,660,536) (56,774,522)Adjustment of property carrying values (58,139,008) (91,204,249) (18,432,226)Change in exchange rate - - (10,044,014)
Balance, end of period $ 12,653,444,998 $ 12,008,075,148 $ 11,568,809,126 The changes in accumulated depreciation for the years ended December 31, 2017, 2016 and 2015 are as follows:
2017 2016 2015 Balance, beginning of period $ 2,278,291,645 $ 2,115,319,888 $ 1,955,405,720 Additions during period:
Depreciation for year 368,919,387 344,179,201 333,948,605 Change in exchange rate - 366,068 -
Deductions during period: Sales (86,798,173) (97,888,608) (116,864,875)Assets held for sale (19,699,746) (3,482,974) - Adjustment of fully depreciated assets (107,660,366) (80,660,536) (56,774,522)Change in exchange rate - - (395,040)
Balance, end of period $ 2,433,052,747 $ 2,278,291,645 $ 2,115,319,888 Reclassifications:Certain Amounts in the Prior Period Have Been Reclassified in Order to Conform with the Current Period's Presentation.
97

Table of Contents
KIMCO REALTY CORPORATION AND SUBSIDIARIESSCHEDULE IV - MORTGAGE LOANS ON REAL ESTATE
As of December 31, 2017(in thousands)
Description Interest
Rate Final Maturity
Date
PeriodicPayment Terms
(a) Prior Liens
OriginalFace Amountof Mortgages
(b)
CarryingAmount ofMortgages
(b) (c)
Principal Amount ofLoans Subject to
Delinquent Principalor Interest
Mortgage Loans:
Retail Toronto, ON 7.00% May-18 P& I $ - $ 5,319 $ 5,058 $ - Westport, CT 6.50% Mar-33 I - 5,014 5,014 - Las Vegas, NV 12.00% May-33 I - 3,075 3,075 - Miami, FL 7.57% Jun-19 P& I - 3,966 1,919 - Miami, FL 7.57% Jun-19 P& I - 4,201 1,850 - Miami, FL 7.57% Jun-19 P& I - 3,678 1,775 -
Nonretail Oakbrook Terrace, IL 6.00% Dec-24 I - 1,950 1,950 - Individually < 3% (d) (e) (f) P&I - 2,475 828 -
$ - $ 29,678 $ 21,469 $ - Other Financing Loans:
Nonretail Individually < 3% 2.28% Apr-27 P&I $ - $ 600 $ 369 $ -
$ - $ 30,278 $ 21,838 $ - (a) I = Interest only; P&I = Principal & Interest.(b) The instruments actual cash flows are denominated in U.S. dollars and Canadian dollars as indicated by the geographic location above(c) The aggregate cost for Federal income tax purposes was approximately $21.8 million as of December 31, 2017.(d) Comprised of three separate loans with original loan amounts ranging from $0.1 million to $0.4 million.(e) Interest rates range from 6.88% to 7.41%.(f) Maturity dates range from October 2019 to December 2030. For a reconciliation of mortgage and other financing receivables from January 1, 2015 to December 31, 2017, see Footnote 10 of the Notes to Consolidated FinancialStatements included in this Form 10-K. The Company feels it is not practicable to estimate the fair value of each receivable as quoted market prices are not available. The cost of obtaining an independent valuation on these assets is deemed excessive considering the materiality of the total receivables.
98
(Back To Top)
Section 2: EX-10.7 (EXHIBIT 10.7)
Exhibit 10.7
AMENDMENT NO. 1 TO THEKIMCO REALTY CORPORATION
2010 EQUITY PARTICIPATION PLAN
THIS AMENDMENT NO. 1 TO THE KIMCO REALTY CORPORATION 2010 EQUITY PARTICIPATION PLAN (this “ Amendment”), is made and adopted asof February 20, 2018 (the “Effective Date”), by the Executive Compensation Committee (the “Committee”) of the Board of Directors (the “Board”) of Kimco RealtyCorporation (the “Company”). Capitalized terms used but not otherwise defined herein shall have the respective meanings ascribed to them in the Plan (as definedbelow).
WHEREAS, the Company maintains the Kimco Realty Corporation 2010 Equity Participation Plan (as it may be amended or restated from time to time, the“Plan”);
WHEREAS, pursuant to the Plan, the Plan may be amended by the Board or the Committee at any time or from time to time; and
WHEREAS, the Committee desires to amend the Plan as set forth herein.
NOW, THEREFORE, BE IT RESOLVED, that the Plan be and hereby is amended as follows:
1. With respect to Awards (as defined in the Plan) granted on or after the Effective Date, Section 2.45 of the Plan is hereby amended by deleting such section inits entirety and replacing it with the following:
“‘Retirement’ of a Holder shall mean his Termination of Service on or after his sixty-fifth (65th) birthday or his completion of thirty (30) full (notnecessarily consecutive) years of employment, consultancy or directorship, as the case may be, with the Company.”
2. This Amendment shall be and is hereby incorporated in and forms a part of the Plan.

3. Except as set forth herein, the Plan shall remain in full force and effect.
* * *Executed February 20, 2018.
KIMCO REALTY CORPORATION
By: /s/ Paul Westbrook Name: Paul WestbrookTitle: Vice President and Chief Accounting
Officer(Back To Top)
Section 3: EX-12.1 (EXHIBIT 12.1)
Exhibit 12.1
KIMCO REALTY CORPORATION AND SUBSIDIARIESCOMPUTATION OF RATIO OF EARNINGS TO FIXED CHARGES
For the year ended December 31, 2017(in thousands, except for ratio)
Pretax earnings from continuing operations before adjustment for noncontrolling interests or income loss from equity investees $ 239,867 Add:
Interest on indebtedness (excluding capitalized interest) 191,483 Amortization of debt premiums, discounts and capitalized expenses 8,118 Amortization of capitalized interest 5,208 Portion of rents representative of the interest factor 7,287
451,963 Distributed income from equity investees 58,189
Pretax earnings from continuing operations, as adjusted $ 510,152 Fixed charges -
Interest on indebtedness (excluding capitalized interest) $ 191,483 Capitalized interest 14,480 Amortization of debt premiums, discounts and capitalized expenses 8,118 Portion of rents representative of the interest factor 7,287
Fixed charges $ 221,368
Ratio of earnings to fixed charges 2.3 (Back To Top)
Section 4: EX-12.2 (EXHIBIT 12.2)
Exhibit 12.2
KIMCO REALTY CORPORATION AND SUBSIDIARIESCOMPUTATION OF RATIO OF EARNINGS TO COMBINED FIXED CHARGES AND PREFERRED STOCK DIVIDENDS
For the year ended December 31, 2017(in thousands, except for ratio)
Pretax earnings from continuing operations before adjustment for noncontrolling interests or income loss from equity investees $ 239,867 Add:
Interest on indebtedness (excluding capitalized interest) 191,483 Amortization of debt premiums, discounts and capitalized expenses 8,118 Amortization of capitalized interest 5,208 Portion of rents representative of the interest factor 7,287
451,963 Distributed income from equity investees 58,189
Pretax earnings from continuing operations, as adjusted $ 510,152 Combined fixed charges and preferred stock dividends -

Interest on indebtedness (excluding capitalized interest) $ 191,483 Capitalized interest 14,480 Preferred dividend factor 46,599 Amortization of debt premiums, discounts and capitalized expenses 8,118 Portion of rents representative of the interest factor 7,287
Combined fixed charges and preferred stock dividends $ 267,967
Ratio of Earnings to Combined Fixed Charges and Preferred Stock Dividends 1.9 (Back To Top)
Section 5: EX-21.1 (EXHIBIT 21.1)
Exhibit 21.1
SIGNIFICANT SUBSIDIARIES
None. (Back To Top)
Section 6: EX-23.1 (EXHIBIT 23.1)
Exhibit 23.1
CONSENT OF INDEPENDENT REGISTERED PUBLIC ACCOUNTING FIRM We hereby consent to the incorporation by reference in the Registration Statements on Form S-3 (No. 333-202389) and Form S-8 (Nos. 333-61323, 333-85659, 333-62626,333-135087, 333-167265, and 333-184776) of Kimco Realty Corporation of our report dated February 23, 2018 relating to the financial statements, financial statementschedules and the effectiveness of internal control over financial reporting, which appears in this Form 10-K. /s/ PricewaterhouseCoopers LLPNew York, New YorkFebruary 23, 2018(Back To Top)
Section 7: EX-31.1 (EXHIBIT 31.1)
Exhibit 31.1
CERTIFICATION PURSUANT TOSECTION 302 OF THE SARBANES-OXLEY ACT OF 2002
I, Conor C. Flynn, certify that: 1. I have reviewed this Annual Report on Form 10-K of Kimco Realty Corporation; 2. Based on my knowledge, this report does not contain any untrue statement of a material fact or omit to state a material fact necessary to make the statements made,in light of the circumstances under which such statements were made, not misleading with respect to the period covered by this report; 3. Based on my knowledge, the financial statements, and other financial information included in this report, fairly present in all material respects the financial condition,results of operations and cash flows of the registrant as of, and for, the periods presented in this report; 4. The registrant’s other certifying officer(s) and I are responsible for establishing and maintaining disclosure controls and procedures (as defined in Exchange ActRules 13a-15(e) and 15d-15(e)) and internal control over financial reporting (as defined in Exchange Act Rules 13a-15(f) and 15d-15(f)) for the registrant and have:
(a) Designed such disclosure controls and procedures, or caused such disclosure controls and procedures to be designed under our supervision, to ensurethat material information relating to the registrant, including its consolidated subsidiaries, is made known to us by others within those entities, particularlyduring the period in which this report is being prepared;
(b) Designed such internal control over financial reporting, or caused such internal control over financial reporting to be designed under our supervision, toprovide reasonable assurance regarding the reliability of financial reporting and the preparation of financial statements for external purposes in accordancewith generally accepted accounting principles;
(c) Evaluated the effectiveness of the registrant's disclosure controls and procedures and presented in this report our conclusions about the effectiveness ofthe disclosure controls and procedures, as of the end of the period covered by this report based on such evaluation; and
(d) Disclosed in this report any change in the registrant's internal control over financial reporting that occurred during the registrant's most recent fiscalquarter (the registrant's fourth fiscal quarter in the case of an annual report) that has materially affected, or is reasonably likely to materially affect, theregistrant's internal control over financial reporting; and
5. The registrant’s other certifying officer(s) and I have disclosed, based on our most recent evaluation of internal control over financial reporting, to the registrant’s

auditors and the audit committee of the registrant’s board of directors (or persons performing the equivalent functions):
(a) All significant deficiencies and material weaknesses in the design or operation of internal control over financial reporting which are reasonably likely toadversely affect the registrant’s ability to record, process, summarize and report financial information; and
(b) Any fraud, whether or not material, that involves management or other employees who have a significant role in the registrant’s internal control overfinancial reporting.
Date: February 23, 2018 /s/ Conor C. Flynn Conor C. Flynn Chief Executive Officer
(Back To Top)
Section 8: EX-31.2 (EXHIBIT 31.2)
Exhibit 31.2
CERTIFICATION PURSUANT TOSECTION 302 OF THE SARBANES-OXLEY ACT OF 2002
I, Glenn G. Cohen, certify that: 1. I have reviewed this Annual Report on Form 10-K of Kimco Realty Corporation; 2. Based on my knowledge, this report does not contain any untrue statement of a material fact or omit to state a material fact necessary to make the statements made,in light of the circumstances under which such statements were made, not misleading with respect to the period covered by this report; 3. Based on my knowledge, the financial statements, and other financial information included in this report, fairly present in all material respects the financial condition,results of operations and cash flows of the registrant as of, and for, the periods presented in this report; 4. The registrant’s other certifying officer(s) and I are responsible for establishing and maintaining disclosure controls and procedures (as defined in Exchange ActRules 13a-15(e) and 15d-15(e)) and internal control over financial reporting (as defined in Exchange Act Rules 13a-15(f) and 15d-15(f)) for the registrant and have:
(a) Designed such disclosure controls and procedures, or caused such disclosure controls and procedures to be designed under our supervision, to ensurethat material information relating to the registrant, including its consolidated subsidiaries, is made known to us by others within those entities, particularlyduring the period in which this report is being prepared;
(b) Designed such internal control over financial reporting, or caused such internal control over financial reporting to be designed under our supervision, toprovide reasonable assurance regarding the reliability of financial reporting and the preparation of financial statements for external purposes in accordancewith generally accepted accounting principles;
(c) Evaluated the effectiveness of the registrant's disclosure controls and procedures and presented in this report our conclusions about the effectiveness ofthe disclosure controls and procedures, as of the end of the period covered by this report based on such evaluation; and
(d) Disclosed in this report any change in the registrant's internal control over financial reporting that occurred during the registrant's most recent fiscalquarter (the registrant's fourth fiscal quarter in the case of an annual report) that has materially affected, or is reasonably likely to materially affect, theregistrant's internal control over financial reporting; and
5. The registrant’s other certifying officer(s) and I have disclosed, based on our most recent evaluation of internal control over financial reporting, to the registrant’sauditors and the audit committee of the registrant’s board of directors (or persons performing the equivalent functions):
(a) All significant deficiencies and material weaknesses in the design or operation of internal control over financial reporting which are reasonably likely toadversely affect the registrant’s ability to record, process, summarize and report financial information; and
(b) Any fraud, whether or not material, that involves management or other employees who have a significant role in the registrant’s internal control overfinancial reporting.
Date: February 23, 2018 /s/ Glenn G. Cohen Glenn G. Cohen Chief Financial Officer (Back To Top)
Section 9: EX-32.1 (EXHIBIT 32.1)
Exhibit 32.1
Section 1350 Certification Pursuant to 18 U.S.C. § 1350, as adopted pursuant to Section 906 of the Sarbanes-Oxley Act of 2002, each of the undersigned officers of Kimco Realty Corporation(the “Company”) hereby certifies, to such officer’s knowledge, that:

(i) the accompanying Annual Report on Form 10-K of the Company for the year ended December 31, 2017 (the “Report”) fully complies with the requirementsof Section 13(a) or 15(d) of the Securities Exchange Act of 1934; and
(ii) the information contained in the Report fairly presents, in all material respects, the financial condition and results of operations of the Company. Date: February 23, 2018 /s/ Conor C. Flynn Conor C. Flynn Chief Executive Officer Date: February 23, 2018 /s/ Glenn G. Cohen Glenn G. Cohen Chief Financial Officer (Back To Top)
Section 10: EX-99.1 (EXHIBIT 99.1)
Exhibit 99.1
YEAR MAJOR LEASES GROCER
DEVELOPEDOR
LEASABLEAREA
PERCENTLEASED
LOCATION PORTFOLIO ACQUIRED (SQ.FT.) (1) TENANT NAME GLA TENANT NAME GLA TENANT NAME GLAALABAMA HOOVER 2007 141,614 91.5 MARSHALLS 25,000 PETCO 15,000 TARGET (8) 191,814ARIZONA GLENDALE 2008 118,377 100.0 MOR FURNITURE FOR LESS 40,000 MICHAELS 17,500 WALMART 196,671
MESA 2009 227,627 99.4 FLOOR & DECOR 92,904 PETSMART 25,339 WINCO FOODS (8) 101,060
MESA 2005 1,104,912 95.8 BASS PRO SHOPS OUTDOORWORLD 170,000 HOME DEPOT 102,589 WALMART 208,000
MESA 2011 79,790 100.0 MOR FURNITURE FOR LESS 33,234 MICHAELS 25,520 TARGET (8) 128,972
PEORIA 2011 167,986 97.2 JCPENNEY 53,984 JO-ANN FABRICS 40,734 TARGET (8) 151,457
PHOENIX 1998 218,608 95.8 BURLINGTON 98,054 MICHAELS 23,190
PHOENIX 1998 7,250 100.0
PHOENIX 1998 229,707 95.2 COSTCO 141,659 FALLAS PAREDES 24,390 RANCH MARKET (8) 103,909
PHOENIX 1997 131,621 100.0 TRADER JOE'S 11,145 SAFEWAY 62,573
PHOENIX 2011 184,292 100.0 MICHAELS 25,666 WALMART 110,627
PHOENIX 2015 827,136 97.3 WALMART 251,361 JCPENNEY 98,000 COSTCO 154,809
SUN CITY 2012 62,559 100.0 CVS 24,519 SAFEWAY (8) 48,500
TEMPE 2011 62,285 98.6 WHOLE FOODS MARKET 32,306CALIFORNIA ALHAMBRA 1998 195,473 100.0 JO-ANN FABRICS 13,472 COSTCO 157,019
ANAHEIM PRU 2006 348,524 99.5 FOREVER 21 80,000 SMART & FINAL EXTRA! 30,000 EL SUPER 54,087
ANAHEIM 2016 154,043 100.0 RITE AID 18,235 BLINK FITNESS 16,310 RALPHS 45,000
ANAHEIM PRU 2006 105,338 94.5 HARBOR FREIGHT TOOLS 17,459 DOLLAR TREE 10,797 STATER BROTHERS 37,440
BELLFLOWER 2014 113,233 97.1 PLANET FITNESS 29,025 STATER BROTHERS 64,039
CARLSBAD (7) 2014 149,513 93.4 MARSHALLS 27,000 DOLLAR TREE 16,610
CARMICHAEL (7) 1998 200,499 100.0 HOME DEPOT 110,861 FALLAS PAREDES 21,890 WALMART NEIGHBORHOODMARKET 44,257
CHICO 2008 264,335 98.6 EVANS FURNITURE GALLERIES 57,635 BED BATH & BEYOND 25,002 FOOD MAXX 54,239
CHICO 2015 69,812 92.9 RALEY'S 62,098
CHINO (7) PRU 2006 315,957 81.2 LA CURACAO 104,465 ROSS DRESS FOR LESS 30,730 TARGET (8) 112,062
CHINO PRU 2006 168,264 98.1 DOLLAR TREE 25,060 PETSMART 24,225 ALBERTSONS (8) 43,440
CHINO HILLS 2008 73,352 97.6 STATER BROTHERS 43,235
CHULA VISTA 1998 356,335 100.0 WALMART 153,578 NAVCARE 14,580 COSTCO 154,569
COLMA 2015 227,941 81.9 MARSHALLS 32,000 ROSS DRESS FOR LESS 24,759
CORONA 1998 491,898 97.9 COSTCO 114,112 HOME DEPOT 100,000 99 RANCH MARKET (8) 42,630
CORONA 2007 146,005 100.0 PETSMART 24,515 HOWARD'S APPLIANCES, TV'S &M 15,120 VONS 55,650
COVINA KIR 2000 277,957 95.3 LOWE'S HOME CENTER 111,348 SKYZONE 25,608 ALDI 17,508
CUPERTINO (7) 2006 127,594 92.5 99 RANCH MARKET 29,657
DALY CITY (7) 2002 592,330 95.7 HOME DEPOT 109,000 BURLINGTON 55,000 SAFEWAY 57,817
DUBLIN PRU 2006 155,070 100.0 ORCHARD SUPPLY HARDWARE(6) 35,829 MARSHALLS 32,000
EL CAJON CPP 2010 98,316 98.6 RITE AID 27,642 ROSS DRESS FOR LESS 24,000
ELK GROVE PRU 2006 137,035 99.1 24 HOUR FITNESS 22,000 BEL AIR MARKET 56,435
ENCINITAS PRU 2006 118,804 100.0 KOHL'S 58,004 LAWRANCE FURNITURE 13,000
ESCONDIDO (7) PRU 2006 208,074 90.9 LA FITNESS 40,000 CVS 22,880 VONS 40,000
FAIR OAKS PRU 2006 98,625 84.8 RALEY'S 59,231
FREMONT (7) PRU 2007 496,924 91.1 BED BATH & BEYOND 39,830 MARSHALLS 30,028 SAFEWAY 54,741
FREMONT (7) PRU 2006 127,938 98.7 CVS 24,437 24 HOUR FITNESS 24,145 SAVE MART 48,000
GARDENA PRU 2006 65,987 100.0 DAISO JAPAN 19,300 99 RANCH MARKET 22,000
HAYWARD 2016 80,311 92.4 99 CENTS ONLY STORE 29,300 BIG LOTS 23,334
HUNTINGTON BEACH PRU 2006 148,805 96.8 CVS 20,120 CRUNCH FITNESS 16,609 VONS 40,800
JACKSON 2008 67,665 100.0 RALEY'S 62,625
LA MIRADA 1998 264,513 97.1 UFC GYMS 45,388 U.S. POSTAL SERVICE 26,577 ALBERTSONS (8) 47,199
LA VERNE 2014 226,872 92.5 MARSHALLS 27,764 STAPLES 15,661 TARGET 114,732
LINCOLN 2015 119,559 95.2 CVS 23,077 SAFEWAY 55,342
LIVERMORE PRU 2006 104,165 98.6 ROSS DRESS FOR LESS 24,000 DOLLAR TREE 12,061 TARGET (8) 112,739
LOS ANGELES (7) 2010 152,204 98.2 DD'S DISCOUNTS 22,224 RITE AID 18,160 RALPHS/FOOD 4 LESS 38,950

LOS ANGELES (7) PRU 2006 138,175 100.0 ROSS DRESS FOR LESS 29,356 CVS 25,487 SUPERIOR MARKETS 34,420
MONTEBELLO KIR 2000 251,489 100.0 SEARS 105,000 TOYS R US/BABIES R US 46,270
NAPA 2006 349,530 100.0 TARGET 116,000 HOME DEPOT 100,238 RALEY'S 60,890
NORTHRIDGE 2005 163,941 100.0 DSW SHOE WAREHOUSE 32,400 MONKEY SPORTS 24,053 SUPER KING MARKET 39,348

YEAR MAJOR LEASES GROCER
DEVELOPEDOR
LEASABLEAREA
PERCENTLEASED
LOCATION PORTFOLIO ACQUIRED (SQ.FT.) (1) TENANT NAME GLA TENANT NAME GLA TENANT NAME GLA NOVATO 2009 133,485 96.3 RITE AID 24,769 DOLLAR TREE 15,708 SAFEWAY 51,199
OCEANSIDE PRU 2006 353,004 97.4 SEARS OUTLET 38,902 ROSS DRESS FOR LESS 30,000
OCEANSIDE PRU 2006 93,786 96.8 LAMPS PLUS 11,000 TRADER JOE'S 12,881
PACIFICA 2014 168,231 93.3 ROSS DRESS FOR LESS 24,246 RITE AID 19,085 SAFEWAY 45,892
PACIFICA PRU 2006 102,982 96.4 RITE AID 23,064 SAFEWAY 31,781
POWAY 2005 121,512 90.4 STEIN MART 40,000 HOMEGOODS 26,210
REDWOOD CITY 2009 45,870 100.0 ORCHARD SUPPLY HARDWARE 42,509 COSTCO (8) 132,067
RIVERSIDE 2008 86,108 100.0 BURLINGTON 67,104
ROSEVILLE 2014 188,493 100.0 DICK'S SPORTING GOODS 55,377 ROSS DRESS FOR LESS 27,471 SPROUTS FARMERS MARKET 36,041
ROSEVILLE 2015 81,171 100.0 SAFEWAY 55,146
SAN DIEGO OJV 2007 225,919 100.0 NORDSTROM 225,919
SAN DIEGO KIR 2000 117,410 100.0 24 HOUR FITNESS 66,851 H MART 38,359
SAN DIEGO CPP 2010 412,674 100.0 PRICE SELF STORAGE 120,962 COSTCO REGIONAL OFFICE 50,000 COSTCO 153,095
SAN DIEGO 2009 35,000 100.0 CLAIM JUMPER 10,600 COSTCO (8) 133,087
SAN DIEGO PRU 2006 205,853 99.3 TJ MAXX 31,152 HOMEGOODS 30,619 SPROUTS FARMERS MARKET 19,225
SAN DIEGO 2007 48,169 100.0 NAMASTE PLAZA SUPERMARKET 10,439
SAN DIEGO 2015 116,794 93.8 VONS (8) 40,000
SAN DIEGO 2012 108,741 100.0 ALBERTSONS 66,284
SAN DIMAS PRU 2006 154,000 100.0 STEIN MART 30,000 ROSS DRESS FOR LESS 27,200 TRADER JOE'S 8,500
SAN JOSE (7) PRU 2006 117,147 84.9 LA FITNESS 35,467 DOLLAR TREE 14,000 FOOD MAXX (8) 48,971
SAN LEANDRO PRU 2006 95,255 90.8 ROSS DRESS FOR LESS 26,706 MICHAELS 19,020
SAN RAMON KIR 1999 45,938 88.5 ULTA 10,500 PETCO 10,000
SANTA ANA 1998 134,400 100.0 HOME DEPOT 134,400
SANTA ROSA 2005 102,478 98.1 ACE HARDWARE 12,100 RALEY'S 60,913
SANTEE 2015 312,698 97.6 24 HOUR FITNESS 36,000 BED BATH & BEYOND 30,000 TARGET (8) 126,587
TEMECULA KIR 1999 340,497 99.2 KMART 86,479 TRISTONE THEATRES 29,650 FOOD 4 LESS 52,640
TEMECULA CPP 2010 519,018 98.4 WALMART 221,639 KOHL'S 88,728 SPROUTS FARMERS MARKET 25,647
TORRANCE KIR 2000 270,546 99.4 BURLINGTON 43,595 UFC GYMS 42,575 TRADER JOE'S 10,004
TRUCKEE 2006 26,553 90.7 SAVE-MART (8) 29,572
TRUCKEE 2015 38,749 96.9 SAFEWAY (8) 38,794
TUSTIN 2017 687,590 97.9 TARGET 134,639 AMC THEATERS 68,159 WHOLE FOODS MARKET 60,550
TUSTIN PRU 2006 193,415 95.4 RITE AID 19,072 CRUNCH FITNESS 16,520 HAGGEN (6) 41,430
TUSTIN PRU 2006 137,899 89.5 MICHAELS 22,364 TRADER JOE'S 14,888 RALPHS 36,400
UPLAND PRU 2006 273,149 97.7 HOME DEPOT 98,064 HOBBY LOBBY 63,748
VALENCIA PRU 2006 143,070 98.0 CVS 25,500 RALPHS 45,579
VISTA PRU 2006 122,563 95.8 CVS 22,154 ALBERTSONS 46,819
WALNUT CREEK PRU 2006 114,627 100.0 CENTURY THEATRES 57,017 COST PLUS WORLD MARKET 19,044
WESTMINSTER PRU 2006 209,749 96.9 HOWARD'S APPLIANCES & FLATSCR 17,962 PAVILIONS 69,445
WHITTIER 2017 683,727 97.8 TARGET 141,900 SEARS 137,985 VONS 51,011
WINDSOR 2014 126,187 96.1 CVS 19,950 SAFEWAY 52,610
YORBA LINDA 2012 160,773 96.0 DICK'S SPORTING GOODS 50,000 BED BATH & BEYOND 43,000 COLORADO ARVADA 2013 144,315 84.4 RITE AID 56,674 TARGET (8) 128,000
AURORA (7) 1998 106,983 98.9 ROSS DRESS FOR LESS 30,187 TJ MAXX 28,140
AURORA 1998 42,977 91.4 KING SOOPERS (8) 56,959
AURORA 1998 141,275 92.2 ALBERTSONS 41,896 COLORADO FABRICS 40,421
COLORADO SPRINGS 1998 107,310 87.4 CAMERONS PRODUCTS 65,280 DOLLAR TREE 12,000
DENVER 1998 18,405 100.0 LOCAVORE 18,405
ENGLEWOOD 1998 80,330 100.0 HOBBY LOBBY 50,690 DART MANIA 10,000
FORT COLLINS 2000 115,862 100.0 KOHL'S 105,862 GUITAR CENTER 10,000 SAM'S CLUB (8) 104,972
GREELEY (7) 2012 130,253 100.0 BED BATH & BEYOND 27,974 MICHAELS 21,323 SPROUTS FARMERS MARKET 21,236
HIGHLANDS RANCH 2011 208,127 95.8 ACE HARDWARE 33,450 TJ MAXX 30,000
LAKEWOOD 1998 82,581 97.1 SAFEWAY 49,788
LITTLETON 2011 190,104 94.7 OFFICE DEPOT 25,267 TUESDAY MORNING 19,831 KING SOOPERS 64,532CONNECTICUT BRANFORD KIR 2000 190,738 98.0 KOHL'S 86,830 BIG Y 46,669
DANBURY 2014 136,209 100.0 WALMART 105,255 MARSHALLS 30,954

YEAR MAJOR LEASES GROCER
DEVELOPEDOR
LEASABLEAREA
PERCENTLEASED
LOCATION PORTFOLIO ACQUIRED (SQ.FT.) (1) TENANT NAME GLA TENANT NAME GLA TENANT NAME GLA ENFIELD KIR 2000 148,517 96.6 KOHL'S 88,000 BEST BUY 30,048
FARMINGTON 1998 210,372 99.2 BURLINGTON 51,240 NORDSTROM RACK 35,834
HAMDEN (7) 2016 322,720 100.0 WALMART 89,750 BOB'S STORES 49,133 ALDI 19,927
NORTH HAVEN 1998 338,716 99.2 HOME DEPOT 111,500 DICK'S SPORTING GOODS 48,265 BJ'S WHOLESALE CLUB 109,920
WILTON 2012 134,329 88.3 BOW TIE CINEMAS 14,248 STOP & SHOP 46,764DELAWARE DOVER 2003 4,835 100.0 NEWARK (2) 2014
WILMINGTON 2014 165,792 100.0 BURLINGTON 42,443 RAYMOUR & FLANIGANFURNITURE 36,000 SHOPRITE 58,236
FLORIDA ALTAMONTE SPRINGS 1998 192,128 99.4 PGA TOUR SUPERSTORE 38,292 DSW SHOE WAREHOUSE 23,990 WHOLE FOODS MARKET 40,000 BOCA RATON (7) 1967 BONITA SPRINGS 2015 79,676 98.2 PUBLIX 54,376
BOYNTON BEACH (7) KIR 1999 192,776 98.0 BEALLS 103,479 ALBERTSONS 51,195
BRANDON KIR 2001 143,785 100.0 BED BATH & BEYOND 40,000 ROSS DRESS FOR LESS 25,106 TARGET (8) 107,648
CAPE CORAL 2015 42,030 84.1
CAPE CORAL 2015 125,108 100.0 ROSS DRESS FOR LESS 32,265 STAPLES 20,347 PUBLIX 44,684
CLEARWATER 2005 212,388 99.0 HOME DEPOT 100,200 JO-ANN FABRICS 49,865
CORAL SPRINGS 1994 55,089 100.0 BIG LOTS 33,517
CORAL SPRINGS 1997 86,342 100.0 TJ MAXX 29,500 DISCOVERY CLOTHING CO. 15,000 DANIA BEACH (2) 2016 DELRAY BEACH 2015 50,906 97.6 PUBLIX 44,840
FORT LAUDERDALE 2009 229,034 88.7 REGAL CINEMAS 52,936 LA FITNESS 48,479
HOLLYWOOD 2016 898,913 99.8 HOME DEPOT 142,280 KMART 114,764 BJ'S WHOLESALE CLUB 120,251
HOMESTEAD OJV 1972 205,614 100.0 MARSHALLS 29,575 OFFICEMAX 23,500 PUBLIX 56,077
HOMESTEAD 1972 3,600 100.0 PUBLIX (8) 56,077
JACKSONVILLE 2015 72,840 98.1 PUBLIX 44,840
JACKSONVILLE 2010 256,980 98.6 STEIN MART 36,000 SEARS OUTLET 28,020
JACKSONVILLE (3) 2005 102,979 HAVERTY'S 44,916 CHUCK E CHEESE 14,500 Walmart (8) 203,000
KEY LARGO KIR 2000 207,365 95.6 KMART 108,842 PUBLIX 48,555
LAKELAND 2001 241,256 97.8 HOBBY LOBBY 53,271 STEIN MART 39,500
LARGO 1968 131,067 92.8 OLD TIME POTTERY 58,374 YOUFIT HEALTH CLUBS 25,121 ALDI 20,800
LARGO 1992 221,462 77.5 LA FITNESS 33,490 ROSS DRESS FOR LESS 24,895 PUBLIX 42,112
LAUDERHILL 1974 181,576 93.4 BABIES R US 44,450 STAPLES 23,500 PRESIDENTE SUPERMARKET 22,772
MARATHON 2013 106,398 89.5 KMART 52,571 WINN DIXIE 38,400
MELBOURNE 1968 168,737 82.8 RADIAL 69,900 WALGREENS 15,525
MERRITT ISLAND 2015 60,103 100.0 PUBLIX 44,840
MIAMI OJV 2003 87,305 100.0 ORCHARD SUPPLY HARDWARE 29,111 FRESCO Y MAS 55,944
MIAMI OJV 2016 1,615 100.0 FRESCO Y MAS (8) 55,944
MIAMI 1968 107,000 100.0 HOME DEPOT 105,154
MIAMI OJV 1965 74,810 100.0 BABIES R US 40,214 FRESCO Y MAS (8) 55,944
MIAMI 1986 87,069 100.0 WALGREENS 14,468 PUBLIX 46,810
MIAMI 2009 293,001 96.0 KMART 114,000 HOBBY LOBBY 40,000
MIAMI 2015 63,563 100.0 PUBLIX 44,271
MIAMI 2015 60,280 97.7 PUBLIX 45,600
MIAMI 2007 352,734 91.9 BUY BUY BABY 29,953 MICHAELS 24,000 PUBLIX 56,000
MIAMI 2011 112,423 100.0 LITTLE VILLAGE LEARNINGCENTER 10,000 WINN DIXIE 34,890
MIAMI 2013 61,837 100.0 WINN DIXIE 61,837
MIAMI 1995 64,007 100.0 PETCO 22,418 PARTY CITY 15,611
MOUNT DORA 1997 78,452 94.0 ROSS DRESS FOR LESS 25,500 TJ MAXX 23,000
NORTH MIAMI BEACH 1985 108,795 100.0 WALGREENS 15,930 PUBLIX 51,420
ORLANDO KIR 2000 184,362 98.2 FITNESS CF 56,000 PGA TOUR SUPERSTORE 50,239
ORLANDO 2008 179,074 88.4 24 HOUR FITNESS 49,875 TJ MAXX 26,843 TARGET (8) 184,782
ORLANDO 2009 154,356 86.9 MARSHALLS 30,027 HOMEGOODS 24,991 TARGET (8) 187,166
ORLANDO 2011 86,321 98.8 FRESH MARKET 18,400
OVIEDO 2015 78,093 98.2 PUBLIX 44,270
PENSACOLA 2011 101,377 98.6 PUBLIX 61,389

YEAR MAJOR LEASES GROCER
DEVELOPEDOR
LEASABLEAREA
PERCENTLEASED
LOCATION PORTFOLIO ACQUIRED (SQ.FT.) (1) TENANT NAME GLA TENANT NAME GLA TENANT NAME GLA PLANTATION 2017 60,414 95.9 LUCKY'S MARKET 41,440
POMPANO BEACH 2012 77,352 100.0 HOMEGOODS 20,280 ULTA 11,224 WHOLE FOODS MARKET 40,100
SAINT PETERSBURG 1968 118,574 78.9 YOUFIT HEALTH CLUBS 22,000 DOLLAR TREE 12,000 KASH N' KARRY (6) 45,871
SARASOTA 2008 100,237 90.0 TJ MAXX 29,825 OFFICEMAX 23,800
TALLAHASSEE 1998 188,996 98.4 STEIN MART 31,920 HOMEGOODS 24,471 THE FRESH MARKET 22,300
TAMPA KIR 2001 340,541 83.5 BEST BUY 46,121 JO-ANN FABRICS 45,965
TAMPA 1997 206,564 100.0 AMERICAN SIGNATURE 49,106 ROSS DRESS FOR LESS 26,250 SPROUTS FARMERS MARKET 27,000
TAMPA 2004 197,181 100.0 LOWE'S HOME CENTER 167,000
WEST PALM BEACH (7) 2009 23,350 100.0 FLORIDA SCHOOL FOR DANCEEDUCA 23,350
WEST PALM BEACH 2014 66,440 95.5 PUBLIX 28,800
WEST PALM BEACH 1997 3,787 100.0 PUBLIX (8) 28,800
WINTER HAVEN OJV 1973 91,160 96.9 BIG LOTS 41,200 JO-ANN FABRICS 12,375 SAVE-A-LOT (8) 16,102
YULEE 2003 59,426 84.5 PETCO 15,335 DOLLAR TREE 10,220 TARGET (8) 126,842GEORGIA ALPHARETTA 2008 130,407 97.2 KROGER 62,000
ATLANTA (7) 2008 160,384 95.5 PLANET FITNESS 19,838 MR. CUE'S BILLIARDS & BURGERS 14,870 KROGER 56,647
ATLANTA 2016 175,835 100.0 ONELIFE ATLANTA FITNESS 53,851 MARSHALLS 36,598
AUGUSTA KIR 2001 537,445 91.8 HOBBY LOBBY 65,864 BURLINGTON 44,118 TARGET (8) 123,000
DULUTH 2015 78,025 100.0 WHOLE FOODS MARKET 70,125
FLOWERY BRANCH 2011 92,985 98.9 PUBLIX 54,340
LAWRENCEVILLE 2013 285,656 100.0 HOBBY LOBBY 67,400 AMC THEATERS 65,442 TARGET (8) 116,400
LILBURN 2013 73,910 100.0 KROGER 62,000
PEACHTREE CITY 2014 266,045 96.4 KMART 86,479 KROGER 108,127
SAVANNAH 1993 186,526 97.6 BED BATH & BEYOND 35,005 TJ MAXX 33,067
SAVANNAH 2008 197,605 79.5 ROSS DRESS FOR LESS 30,187 COST PLUS WORLD MARKET 21,000
SNELLVILLE KIR 2001 311,093 96.8 KOHL'S 86,584 BELK 58,416 ILLINOIS BATAVIA KIR 2002 274,282 88.4 KOHL'S 86,584 HOBBY LOBBY 51,214 ALDI 17,330
CHAMPAIGN KIR 2001 111,720 100.0 BEST BUY 45,350 ROSS DRESS FOR LESS 30,247
CHICAGO 1997 125,499 88.4 BURLINGTON 75,623 RAINBOW SHOPS 13,770 JEWEL/OSCO (8) 67,648
CHICAGO 1997 86,894 100.0 SEAFOOD CITY 86,894
DOWNERS GROVE 1997 283,280 92.2 TJ MAXX 54,850 BEST BUY 54,400 SHOP N SAVE 42,610
ELGIN 1972 178,920 99.1 ELGIN MALL 81,550 AARON SALES & LEASEOWNERSHIP 10,000 ELGIN FARMERS PRODUCTS 31,358
FAIRVIEW HEIGHTS 1998 193,217 100.0 HOBBY LOBBY 55,089 DICK'S SPORTING GOODS 45,085 FRESH THYME FARMERS MARKET 28,194
GLENVIEW 2017 142,300 88.2 JEWEL/OSCO 59,171
KILDEER 2013 171,339 100.0 BED BATH & BEYOND 35,000 MICHAELS 31,578
MOUNT PROSPECT 1997 192,547 70.6 KOHL'S 101,097 TRUE VALUE 27,619
MUNDELEIN 1998 89,692 97.6 BURLINGTON 87,547 JEWEL/OSCO (8) 51,997
OAK LAWN 1997 183,893 100.0 KMART (6) 140,580 CHUCK E CHEESE 15,934
OAKBROOK TERRACE 1997 176,164 100.0 HOME DEPOT 121,903 BIG LOTS 30,000
SKOKIE 1997 58,455 100.0 MARSHALLS 30,406 OLD NAVY 28,049 JEWEL/OSCO (8) 70,630
VERNON HILLS 2012 192,624 96.4 DICK'S SPORTING GOODS 54,997 PETSMART 27,518
WOODRIDGE 1998 157,276 93.4 HOLLYWOOD BLVD CINEMA 48,118 SHOE CARNIVAL 15,000 INDIANA GREENWOOD 1970 186,036 100.0 TOYS R US 47,000 BABIES R US 40,556 FRESH THYME FARMERS MARKET 29,979
INDIANAPOLIS OJV 1964 165,255 78.1 CVS 12,800 DOLLAR GENERAL 10,686 KROGER 63,468IOWA CLIVE 1996 90,000 100.0 KMART 90,000
DUBUQUE 1997 82,979 100.0 SHOPKO 82,979 KENTUCKY LEXINGTON 1993 216,235 98.5 BEST BUY 45,750 BED BATH & BEYOND 43,072 MARYLAND BALTIMORE (7) 2014 124,422 90.0 SALVO AUTO PARTS 12,000 WEIS MARKETS 67,520
BALTIMORE 2014 114,045 100.0 RITE AID 11,868 DOLLAR TREE 10,000 SAFEWAY 54,200
BALTIMORE 2015 58,879 88.2 CORT FURNITURE RENTAL 14,856
BALTIMORE 2014 79,391 97.5 WEIS MARKETS 58,187
BALTIMORE 2014 81,777 97.4 GIANT FOOD 55,108

YEAR MAJOR LEASES GROCER
DEVELOPEDOR
LEASABLEAREA
PERCENTLEASED
LOCATION PORTFOLIO ACQUIRED (SQ.FT.) (1) TENANT NAME GLA TENANT NAME GLA TENANT NAME GLA BALTIMORE 2014 90,903 97.6 GIANT FOOD 56,892
BALTIMORE 2013 90,830 98.7 GIANT FOOD 43,136
BEL AIR 2014 130,193 92.6 CVS 10,125 DOLLAR TREE 10,000 SAFEWAY 55,032
CLARKSVILLE 2014 105,907 100.0 GIANT FOOD 62,943
CLINTON 2003 29,027 100.0 PLANET FITNESS 26,412
COLUMBIA 2012 75,000 100.0 MICHAELS 26,706 PETSMART 25,000 BJ'S WHOLESALE CLUB (8) 109,384
COLUMBIA 2015 298,387 99.2 TOYS R US/BABIES R US 63,062 NORDSTROM RACK 40,750 TARGET (8) 130,604
COLUMBIA (7) 2015 94,919 96.1 GIANT FOOD 57,994
COLUMBIA 2014 98,399 96.5 HARRIS TEETER 56,905
COLUMBIA 2015 91,165 95.7 SAFEWAY 55,164
COLUMBIA 2002 66,050 100.0 CVS 13,225 DAVID'S NATURAL MARKET 15,079
DISTRICT HEIGHTS 2015 90,929 100.0 GIANT FOOD 64,333
EASTON 2014 113,330 91.7 DOLLAR TREE 10,000 GIANT FOOD 64,885
ELLICOTT CITY (7) 2015 82,456 98.5 GIANT FOOD 55,000
ELLICOTT CITY 2014 139,898 97.7 PETCO 12,400 SAFEWAY 50,093
ELLICOTT CITY PRU 2007 433,467 100.0 TARGET 146,773 KOHL'S 106,889 SAFEWAY 55,164
FREDERICK 2003 105,891 100.0 GIANT FOOD 56,166
GAITHERSBURG 1999 88,277 93.2 FLOOR & DECOR 60,102 MATTRESS & FURNITURE MART 10,026
GAITHERSBURG (7) 2016 222,920 83.7 CINEPOLIS 34,052 MICHAELS 23,296 WHOLE FOODS MARKET 35,868
HUNT VALLEY 2008 94,653 91.5 GIANT FOOD 55,330
LAUREL (7) 1964 157,474 92.2 2ND AVE. VALUE STORES 81,550 PLANET FITNESS 21,000
OWINGS MILLS (4) 2015 101,297 93.1 AMC Theatres 67,700
PASADENA OJV 2003 38,766 90.7 DAVITA 10,496
PIKESVILLE 2011 105,223 96.8 GIANT FOOD 63,529
TIMONIUM 2014 59,799 92.6 AMERICAN RADIOLOGY 13,573
TIMONIUM 2003 191,561 94.9 STAPLES 15,000 GIANT FOOD 61,941
TOWSON 2014 88,405 100.0 AAA 11,500 CVS 10,125 SAFEWAY 59,180
TOWSON 2012 679,843 93.6 WALMART 154,828 TARGET 132,608 WEIS MARKETS 55,452MASSACHUSETTS ABINGTON 2014 102,000 100.0 LOWE'S HOME CENTER 102,000
BRIGHTON 2014 27,550 100.0 WHOLE FOODS MARKET 20,350
CAMBRIDGE 2014 62,555 100.0 MICRO CENTER 41,724 TRADER JOE'S 11,065
CHATHAM 2014 24,432 100.0 OCEAN STATE JOB LOT 24,432
DORCHESTER 2014 84,470 100.0 NATIONAL WHOLESALELIQUIDATORS 84,470
EVERETT 2014 41,278 100.0 WALGREENS 14,707
FALMOUTH 2014 85,544 92.7 STAPLES 24,652 PLANET FITNESS 12,368
FRAMINGHAM 2014 26,482 100.0 AJ SEABRA SUPERMARKET 9,615
HYANNIS 2014 231,546 98.8 TOYS R US/BABIES R US 46,932 HOMEGOODS 24,904 SHAW'S SUPERMARKET 54,712
MEDFORD 2014 56,215 100.0 OFF BROADWAY SHOE 22,478 ALDI 21,952
PITTSFIELD 2014 72,014 92.3 STOP & SHOP 61,935
QUINCY 2014 80,510 82.3 BIG Y 55,087
QUINCY 2014 24,469 100.0 WALGREENS 12,607
REVERE 2014 15,272 100.0 WALGREENS 15,272
SALEM 2014 48,587 95.8 STAPLES 17,001
SPRINGFIELD 2014 19,287 100.0 CVS 19,287
SWAMPSCOTT 2014 63,975 100.0 CVS 11,060 PETCO 10,250
WAKEFIELD 2014 15,984 100.0 MG FITNESS 15,984
WALTHAM 2014 24,284 100.0 PETCO 13,650
WOBURN 2014 123,878 100.0 KOHL'S 104,385 DOLLAR TREE 10,470
WORCESTER 2014 66,281 100.0 HARBOR FREIGHT TOOLS 18,859 DOLLAR TREE 10,541 99 ASIAN SUPERMARKET 21,521MICHIGAN CLARKSTON 1996 151,201 86.1 OFFICE DEPOT 19,605 FORT CLARKSTON 11,155 NEIMAN'S FAMILY MARKET 45,092
FARMINGTON 1993 96,194 100.0 TUESDAY MORNING 14,610 FITNESS 19 10,250 FRESH THYME FARMERS MARKET 26,086
LIVONIA 1968 33,121 67.1 CVS 13,810
TAYLOR 1993 141,468 95.4 KOHL'S 93,310 BABIES R US 37,459
WALKER 1993 387,210 100.0 RUBY-15-WALKER, LLC 156,366 KOHL'S 104,508

YEAR MAJOR LEASES GROCER
DEVELOPEDOR
LEASABLEAREA
PERCENTLEASED
LOCATION PORTFOLIO ACQUIRED (SQ.FT.) (1) TENANT NAME GLA TENANT NAME GLA TENANT NAME GLAMINNESOTA MAPLE GROVE KIR 2001 466,825 92.4 BEST BUY 45,953 JO-ANN FABRICS 45,940 BYERLY'S 55,043
MAPLE GROVE 2006 481,032 98.0 LOWE'S HOME CENTER 137,933 DICK'S SPORTING GOODS 51,182 COSTCO (8) 139,262
MINNETONKA KIR 1998 120,231 97.7 TOYS R US/BABIES R US 61,369 TOTAL WINE & MORE 25,775
ROSEVILLE 2005 108,213 38.8 PLANET FITNESS 32,283 MISSOURI KIRKWOOD 1990 251,775 92.4 HOBBY LOBBY 64,876 BURLINGTON 58,400
LEMAY 1974 79,747 98.0 DOLLAR GENERAL 10,500 SHOP N SAVE 56,198
MANCHESTER KIR 1998 89,305 100.0 KOHL'S 89,305
SAINT CHARLES 1998 84,460 100.0 KOHL'S 84,460
SAINT LOUIS 1998 113,781 100.0 KOHL'S 92,870 CLUB FITNESS 20,911
SAINT LOUIS 1972 129,093 95.7 SHOP N SAVE 68,307
SAINT LOUIS 1998 176,273 85.1 BURLINGTON 80,000 BIG LOTS 35,040
SAINT LOUIS 1997 169,982 100.0 HOME DEPOT 122,540 PLANET FITNESS 27,000
SAINT PETERS 1997 176,804 68.5 HOBBY LOBBY 57,028 OFFICE DEPOT 24,500
SPRINGFIELD 1994 367,748 100.0 BEST BUY 48,150 JCPENNEY 46,144 NEVADA RENO 2006 119,377 100.0 SIERRA TRADING POST 31,000 PIER 1 IMPORTS 10,542 WHOLE FOODS MARKET 51,758
RENO 2015 152,601 100.0 BED BATH & BEYOND 35,185 NORDSTROM RACK 31,000 WILD OATS MARKET (6) 28,788
RENO 2015 104,319 98.8 RALEY'S 65,519
RENO 2015 118,012 100.0 SHELL OIL 10,000 RALEY'S 61,570
SPARKS 2007 119,601 98.2 CVS 18,990 SAFEWAY 56,061
SPARKS 2015 113,759 93.5 RALEY'S 63,476NEW HAMPSHIRE NASHUA 2014 219,445 97.8 TJ MAXX 25,219 MICHAELS 24,300 TRADER JOE'S 13,800
SALEM 1994 346,201 100.0 KOHL'S 91,282 BOB'S STORES 43,905 SHAW'S SUPERMARKET (6) 51,507NEW JERSEY BRIDGEWATER KIR 2001 241,997 95.6 BED BATH & BEYOND 40,415 MARSHALLS 39,562 COSTCO (8) 136,570
CHERRY HILL (7) 1985 41,637 66.7 RETRO FITNESS 10,366
CHERRY HILL 1996 129,809 95.5 KOHL'S 96,629 PLANET FITNESS 22,320
CHERRY HILL 2014 209,035 100.0 KOHL'S 86,770 EDGE FITNESS CLUB 40,000 TARGET (8) 130,915
CHERRY HILL 2011 381,799 93.3 BURLINGTON 70,500 SEARS OUTLET 40,000 SHOPRITE 71,676
CLARK 2013 85,000 100.0 SHOPRITE 85,000
CLARK 2013 52,812 100.0 BRIXMORE 52,812
CLARK 2013 41,537 100.0 24 HOUR FITNESS 28,000 RITE AID 13,537
EAST WINDSOR 2008 248,727 100.0 TARGET 126,200 KOHL'S 30,257 PATEL BROTHERS 22,310
EDGEWATER (7) PRU 2007 413,998 100.0 TARGET 113,156 TJ MAXX 35,000 ACME 63,966
HILLSDALE 2014 60,432 100.0 WALGREENS 16,332 KING'S SUPER MARKET 30,811
HOLMDEL 2007 299,723 99.3 HOBBY LOBBY 56,021 MARSHALLS 48,833
HOLMDEL 2007 234,557 100.0 BEST BUY 30,109 MICHAELS 25,482 BEST MARKET 37,500
MILLBURN 2014 89,321 95.3 WALGREENS (6) 17,139 PET SUPPLIES PLUS 10,158 KING'S SUPER MARKET 40,024
MOORESTOWN 2009 201,351 90.4 LOWE'S HOME CENTER 135,198 SKYZONE 42,173
NORTH BRUNSWICK 1994 429,379 100.0 BURLINGTON 64,676 MARSHALLS 52,440 WALMART 134,202
PISCATAWAY 1998 97,348 96.2 SHOPRITE 54,100
RIDGEWOOD 1994 24,280 100.0 WHOLE FOODS MARKET 24,280
UNION 2007 98,193 100.0 BEST BUY 30,225 WHOLE FOODS MARKET 60,000
WAYNE 2009 351,574 98.9 FLOOR & DECOR 89,933 LIFE STORAGE LP 85,063
WESTMONT 1994 173,259 85.9 SUPER FITNESS 15,000 TUESDAY MORNING 13,271 TARGET 48,142NEW YORK AMHERST OJV 2009 101,066 100.0 TOPS SUPERMARKET 101,066
BAYSHORE 2006 176,831 100.0 BEST BUY 45,499 TOYS R US/BABIES R US 43,123 ALDI 18,635
BELLMORE 2004 15,445 100.0 PETSMART 12,052
BRIDGEHAMPTON 2009 287,507 96.2 KMART 89,935 TJ MAXX 33,800 KING KULLEN 61,892
BRONX OJV 2013 224,959 100.0 NATIONAL AMUSEMENTS 58,860 BLINK FITNESS 18,119 FOOD BAZAAR 51,680
BROOKLYN KIR 2000 80,708 100.0 HOME DEPOT 58,200 WALGREENS 11,050
BROOKLYN 2003 10,000 100.0 RITE AID 10,000
BROOKLYN 2004 29,671 100.0 CENTER FOR ALLIED HEALTHEDUCA 19,371 DUANE READE 10,300
BROOKLYN 2004 40,373 100.0 DUANE READE 15,638 PARTY CITY 13,424

YEAR MAJOR LEASES GROCER
DEVELOPEDOR
LEASABLEAREA
PERCENTLEASED
LOCATION PORTFOLIO ACQUIRED (SQ.FT.) (1) TENANT NAME GLA TENANT NAME GLA TENANT NAME GLA BROOKLYN HEIGHTS 2012 7,200 100.0 KEY FOOD 7,200
BUFFALO OJV 2009 141,466 100.0 PETSMART 20,165 CITI TRENDS 11,186 TOPS SUPERMARKET 84,000
CENTEREACH OJV 1993 381,241 97.1 BIG LOTS 33,600 MODELL'S 20,315 WALMART 151,067
COMMACK (7) 1998 246,454 100.0 TOYS R US/BABIES R US 63,296 HOBBY LOBBY 42,970 WHOLE FOODS MARKET 45,000
COMMACK 2007 24,617 100.0 DEAL$ 14,137
COPIAGUE KIR 1998 135,436 100.0 HOME DEPOT 112,000 TARGET (8) 130,417
ELMONT 2004 27,078 86.2 TJ MAXX 21,178
ELMONT 2015 12,900 100.0 CVS 12,900
ELMSFORD 2013 143,288 100.0 ELMSFORD 119 84,450 AUTONATION 58,838
FARMINGDALE 2015 437,105 98.4 HOME DEPOT 116,790 SUNRISE CREDIT SERVICES 34,821 STEW LEONARD'S 60,000
FLUSHING 2007 22,416 100.0 FRUIT VALLEY PRODUCE 17,300
FRANKLIN SQUARE 2004 17,789 100.0 PETCO 11,857
FREEPORT KIR 2000 13,905 100.0 WALGREENS 13,905
FREEPORT KIR 2000 173,002 100.0 VORNADO REALTY TRUST 37,328 MARSHALLS 27,540 TARGET 46,753
GLEN COVE KIR 2000 49,212 100.0 STAPLES 24,880 PETSMART 13,482
HAMPTON BAYS 1989 70,990 100.0 MACY'S 50,000 PETCO 11,890
HARRIMAN 2015 227,939 94.6 KOHL'S 86,584 MICHAELS 24,008
HICKSVILLE 2004 35,736 100.0 PETCO 12,919 DOLLAR TREE 10,481
HUNTINGTON STATION 2011 52,973 97.0 RITE AID 11,010 BEST MARKET 30,700
JERICHO 2007 171,180 100.0 MARSHALLS 33,600 MILLERIDGE 20,466 WHOLE FOODS MARKET 38,304
KEW GARDENS HILLS 2012 10,790 100.0
LATHAM KIR 1999 617,810 88.6 SAM'S CLUB 134,900 DICK'S SPORTING GOODS 116,097 HANNAFORD 63,664
LITTLE NECK 2003 48,275 100.0
LONG ISLAND CITY 2012 6,065 100.0 KEY FOOD 5,621
MANHASSET 1999 155,321 100.0 MARSHALLS 40,114 NORDSTROM RACK 34,257 KING KULLEN 37,570
MASPETH 2004 22,500 100.0 DUANE READE (6) 22,500
MERRICK KIR 2000 108,296 98.5 HOMEGOODS 24,836 ANNIE SEZ 15,038 BEST MARKET 44,478
MINEOLA 2007 26,747 79.4 NORTHSHORE FARMS 10,000
MUNSEY PARK KIR 2000 72,748 100.0 BED BATH & BEYOND 41,393 WHOLE FOODS MARKET 20,000
NESCONSET 2009 55,968 100.0 PETSMART 28,916 BOB'S DISCOUNT FURNITURE 27,052 COSTCO (8) 122,475
NORTH MASSAPEQUA 2004 29,599 100.0 EASY DAY 13,965
PLAINVIEW 1969 88,222 98.6 FAIRWAY STORES 55,162
SELDEN 2014 236,130 99.6 HOME DEPOT 102,220 RITE AID 14,673 TARGET 52,250
STATEN ISLAND (7) KIR 2000 177,179 95.0 TJ MAXX 34,798 LA FITNESS 34,000
STATEN ISLAND 1989 268,362 100.0 SI FURNITURE INC. 29,216 HOMEGOODS 26,375 TARGET 139,839
STATEN ISLAND 1997 100,977 99.2 LA FITNESS 33,180
STATEN ISLAND (7) 2006 73,217 100.0 CVS 13,044 MANDEE 11,146 SHOPRITE 68,107
STATEN ISLAND 2005 47,270 100.0 STAPLES 47,270
SYOSSET 1967 32,124 92.5 NEW YORK SPORTS CLUB 16,664
VALLEY STREAM 2012 27,924 100.0 KEY FOOD 27,924
WHITE PLAINS (7) 2004 17,649 100.0 DOLLAR TREE 14,450
WOODSIDE 2012 7,500 100.0 CHAMPION FOOD SUPERMARKET 7,500
YONKERS 1995 43,560 100.0 SHOPRITE 43,560
YONKERS 2005 10,329 100.0 ADVANCE AUTO PARTS 10,329 NORTH CAROLINA CARY KIR 2001 315,797 100.0 KOHL'S 86,584 PETSMART 26,040 BJ'S WHOLESALE CLUB 108,532
CARY 2000 581,668 95.8 DICK'S SPORTING GOODS 55,000 BEST BUY 51,259
CHARLOTTE 1968 241,235 88.6 HOME DEPOT 85,600 BURLINGTON 48,000
CHARLOTTE 1986 233,939 92.6 ROSS DRESS FOR LESS 32,003 K&G FASHION SUPERSTORE 31,577
CHARLOTTE 2012 73,174 100.0 HARRIS TEETER 50,627
CHARLOTTE 2014 114,179 100.0 HARRIS TEETER 51,486
CORNELIUS 2011 80,600 100.0 HARRIS TEETER 57,260
DAVIDSON 2012 82,055 100.0 HARRIS TEETER 48,000
DURHAM KIR 2002 408,065 100.0 BEST BUY 45,000 BUY BUY BABY 31,772 WALMART 149,929
DURHAM 1996 116,186 81.8 TJ MAXX 31,303 JO-ANN FABRICS 16,051
KNIGHTDALE OJV 2011 323,049 89.4 DICK'S SPORTING GOODS 45,000 ROSS DRESS FOR LESS 30,144 TARGET (8) 124,163
MOORESVILLE 2007 165,798 99.3 BEST BUY 30,000 BED BATH & BEYOND 28,000

YEAR MAJOR LEASES GROCER
DEVELOPEDOR
LEASABLEAREA
PERCENTLEASED
LOCATION PORTFOLIO ACQUIRED (SQ.FT.) (1) TENANT NAME GLA TENANT NAME GLA TENANT NAME GLA MORRISVILLE 2008 169,901 95.1 CARMIKE CINEMAS 60,124 O2 FITNESS CLUBS 36,000 FOOD LION 36,427
RALEIGH 1993 358,058 76.7 GOLF GALAXY 59,719 BED BATH & BEYOND 35,335
RALEIGH 2011 136,047 100.0 OFFICE DEPOT 22,391 02 FITNESS 20,006
WINSTON-SALEM 1969 132,190 100.0 DOLLAR TREE 14,849 HARRIS TEETER 60,279OREGON CLACKAMAS PRU 2007 236,641 95.8 NORDSTROM RACK 27,766 HOBBY LOBBY 45,121 TARGET (8) 125,923
GRESHAM PRU 2006 263,686 87.9 MADRONA WATUMULL 55,120 ROSS DRESS FOR LESS 26,832
GRESHAM 2009 208,276 89.4 MARSHALLS 27,500 OFFICE DEPOT 26,706
GRESHAM 2009 107,583 96.0 CASCADE ATHLETIC CLUB 21,633 WALMART NEIGHBORHOODMARKET 60,000
HILLSBORO PRU 2008 210,941 96.6 RITE AID 27,465 DSW SHOE WAREHOUSE 19,949 SAFEWAY 53,000
MILWAUKIE PRU 2007 185,760 93.8 RITE AID 31,472 JO-ANN FABRICS 13,775 HAGGEN (6) 42,630
PORTLAND PRU 2006 113,721 100.0 DOLLAR TREE 11,660 SAFEWAY 48,000
PORTLAND 2017 746,171 96.0 HOME DEPOT 106,500 BURLINGTON 70,501 TARGET 138,700PENNSYLVANIA ARDMORE 2007 314,158 87.5 LIFE TIME FITNESS 78,363 WEST ELM 10,543 TRADER JOE'S 12,548
BEAVER FALLS 2000 215,206 100.0 KMART (6) 107,806 HOME DEPOT 107,400 GIANT EAGLE (8) 66,640
BLUE BELL 1996 120,211 100.0 KOHL'S 93,444 HOMEGOODS 26,767 MCCAFFREY'S FOOD MARKETS (8) 88,842
CHAMBERSBURG 2008 131,623 93.6 WINE & SPIRITS SHOPPE 11,309 GIANT FOOD 67,521
DEVON 2012 68,935 100.0 WINE & SPIRITS SHOPPE 10,394 WHOLE FOODS MARKET 33,504
EAGLEVILLE 2008 59,536 37.2 DOLLAR TREE 10,263
EAST NORRITON 1984 131,794 98.5 RETRO FITNESS 18,025 JO-ANN FABRICS 12,250 SHOPRITE 66,506
EAST STROUDSBURG (7) 1973 99,662 97.7 GIANT FOOD 66,479
EXTON 1996 145,869 100.0 KOHL'S 85,184 HOBBY LOBBY 60,685
HARRISBURG (7) 1972 174,991 100.0 AMERICAN SIGNATURE 48,884 TOUCH OF COLOR FLOORING 25,606 GIANT FOOD 72,251
HAVERTOWN 1996 80,938 100.0 KOHL'S 80,938
HORSHAM 2015 71,737 100.0 GIANT FOOD 48,820
MONROEVILLE 2015 143,200 92.1 PETSMART 29,650 BED BATH & BEYOND 25,312
MONTGOMERYVILLE KIR 2002 256,951 97.4 BED BATH & BEYOND 32,037 GABE'S 28,892 GIANT FOOD 67,179
NEW KENSINGTON 1986 108,950 100.0 GIANT EAGLE 101,750
NORRISTOWN 2015 60,160 100.0 SEARS HARDWARE 60,160
PHILADELPHIA (7) OJV 1983 177,362 100.0 BURLINGTON 70,723 TOYS R US 33,000
PHILADELPHIA (7) OJV 1995 330,237 95.4 TARGET 137,000 PEP BOYS 20,800 ACME 66,703
PHILADELPHIA 1996 82,345 100.0 KOHL'S (6) 82,345
PHILADELPHIA OJV 2006 293,322 97.9 SEARS 237,151 ACME (8) 66,703 PHILADELPHIA (2) 2017 PITTSBURGH 2010 150,078 92.3 THE TILE SHOP 16,059 RITE AID 15,000 WHOLE FOODS MARKET 38,613
PITTSBURGH 2016 166,495 95.3 TJ MAXX 30,000 STAPLES 23,884 FRESH THYME FARMERS MARKET 31,296
RICHBORO 1986 111,982 100.0 ACME 55,537
SCOTT TOWNSHIP 1999 69,288 100.0 WALMART 69,288 SHOP N SAVE (8) 48,000
SHREWSBURY 2014 94,706 97.9 GIANT FOOD 54,785
SPRINGFIELD 1983 171,277 97.5 STAPLES 26,535 EMPIRE BEAUTY SCHOOL 11,472 GIANT FOOD 66,825
WHITEHALL 1996 84,524 100.0 KOHL'S 84,524
WYNNEWOOD 2014 55,911 100.0 WHOLE FOODS MARKET 45,453
YORK 1986 35,500 14.1 PUERTO RICO BAYAMON 2006 186,421 96.8 PLANET FITNESS 18,100 CHUCK E CHEESE 13,600 AMIGO SUPERMARKET 35,588
CAGUAS 2006 599,681 95.1 COSTCO 134,881 JCPENNEY 98,348 SAM'S CLUB 138,622
CAROLINA 2006 570,621 90.6 KMART 118,242 HOME DEPOT 109,800 ECONO RIAL 56,372
MANATI 2006 69,640 88.9 PLANET FITNESS 20,350 FARMACIA SAVIA 11,525
MAYAGUEZ 2006 354,830 97.2 HOME DEPOT 109,800 CARIBBEAN CINEMA 45,126 SAM'S CLUB 100,408
PONCE 2006 191,680 96.1 2000 CINEMA CORP. 60,000 PETSMART 13,279 SUPERMERCADOS MAXIMO 35,651
TRUJILLO ALTO 2006 198,815 99.7 KMART 80,100 FARMACIA SAVIA 11,895 PUEBLO SUPERMARKET 26,869SOUTH CAROLINA CHARLESTON 1978 189,554 100.0 STEIN MART 37,000 PETCO 15,314 HARRIS TEETER 52,334
CHARLESTON (7) 1995 149,007 96.8 BARNES & NOBLE 25,389 TJ MAXX 25,240 HARRIS TEETER 53,000
GREENVILLE 2009 294,336 96.1 GOLD'S GYM 35,000 TJ MAXX 30,300 INGLES 65,000
GREENVILLE 2010 118,452 97.7 ACADEMY SPORTS & OUTDOORS 89,510 TRADER JOE'S 12,836
GREENVILLE 2012 51,672 87.6 THE FRESH MARKET 20,550

YEAR MAJOR LEASES GROCER
DEVELOPEDOR
LEASABLEAREA
PERCENTLEASED
LOCATION PORTFOLIO ACQUIRED (SQ.FT.) (1) TENANT NAME GLA TENANT NAME GLA TENANT NAME GLATENNESSEE
MADISON 1978 175,593 96.6 OLD TIME POTTERY 99,400 WALMART NEIGHBORHOODMARKET 39,687
TEXAS AMARILLO KIR 1997 486,522 99.1 HOME DEPOT 109,800 KOHL'S 94,680
AUSTIN OJV 2011 54,651 100.0 PLANET FITNESS 16,650 BUFFET KING 10,000
AUSTIN OJV 2011 88,829 90.9 BARNES & NOBLE 24,685 PETCO 12,350
AUSTIN OJV 2011 131,039 99.1 GATTI LAND EATER-TAINMENT 31,094 24 HOUR FITNESS 29,678
AUSTIN OJV 2011 207,614 100.0 ACADEMY SPORTS & OUTDOORS 61,452 PACIFIC RESOURCES ASSOCIATES 46,690
AUSTIN KIR 1998 191,760 99.2 TOYS R US/BABIES R US 55,000 BED BATH & BEYOND 44,846
AUSTIN 1998 145,337 94.0 PETCO 13,108 HEB GROCERY 64,310
AUSTIN PRU 2007 213,274 97.7 BED BATH & BEYOND 42,098 BUY BUY BABY 28,730
BEAUMONT 2005 9,600 100.0
BROWNSVILLE 2005 238,683 96.7 BURLINGTON 80,274 TJ MAXX 28,460
BURLESON 2011 367,552 98.0 KOHL'S 86,584 ROSS DRESS FOR LESS 30,187 ALBERTSONS (8) 54,340
CONROE 2015 289,322 100.0 ASHLEY FURNITURE HOMESTORE 48,000 TJ MAXX 32,000
CORPUS CHRISTI 1997 159,329 98.7 BEST BUY 47,616 ROSS DRESS FOR LESS 34,000
DALLAS KIR 1998 83,926 100.0 ROSS DRESS FOR LESS 28,160 OFFICEMAX 23,500 TARGET (8) 130,715
DALLAS PRU 2007 171,143 87.8 CVS 16,799 ULTA 10,800 VITAMIN COTTAGE NATURALFOOD 11,110
FORT WORTH 2015 286,737 93.8 MARSHALLS 38,032 ROSS DRESS FOR LESS 30,079 TARGET (8) 173,890
FRISCO 2006 239,197 98.5 HOBBY LOBBY 81,392 HEMISPHERES 50,000 SPROUTS FARMERS MARKET 26,043
GEORGETOWN OJV 2011 114,598 83.4 DOLLAR TREE 13,250 CVS 10,080
GRAND PRAIRIE 2006 243,900 94.4 24 HOUR FITNESS 30,000 ROSS DRESS FOR LESS 29,931 TARGET (8) 173,890
HOUSTON 2005 279,210 100.0 TJ MAXX 32,000 ROSS DRESS FOR LESS 30,187 TARGET (8) 125,400
HOUSTON 2015 144,055 100.0 BEST BUY 35,317 HOMEGOODS 31,620
HOUSTON 2015 350,836 88.2 MARSHALLS 30,382 BED BATH & BEYOND 26,535 FOOD TOWN (8) 57,539
HOUSTON 2013 149,065 95.3 ROSS DRESS FOR LESS 30,176 OLD NAVY 19,222
HOUSTON 2015 165,268 97.8 ROSS DRESS FOR LESS 26,000 TOTAL WINE & MORE 23,608 SPROUTS FARMERS MARKET 29,582
HUMBLE 2013 316,624 98.0 KOHL'S 88,827 TJ MAXX 50,035 TARGET (8) 180,000
LEWISVILLE 1998 292,065 96.5 BABIES R US 42,420 BED BATH & BEYOND 34,030
MESQUITE 1974 79,550 93.5 KROGER 51,000
PASADENA KIR 1999 410,071 99.5 BEST BUY 36,896 ROSS DRESS FOR LESS 30,187
PLANO 1996 100,598 100.0 HOME DEPOT EXPO (6) 97,798
SOUTHLAKE 2008 37,447 77.3
SPRING (5) 2015 536,444 ACADEMY SPORTS & OUTDOORS 63,182 HOBBY LOBBY 55,000 TARGET (8) 126,844
SUGAR LAND 2012 96,623 91.2 KROGER 64,842
TEMPLE 2015 262,799 93.2 HOBBY LOBBY 56,125 ROSS DRESS FOR LESS 30,187
WEBSTER 2006 363,830 100.0 HOBBY LOBBY 100,086 BEL FURNITURE 58,842 VIRGINIA BURKE 2014 124,148 96.5 CVS 12380 SAFEWAY 53,495
FAIRFAX KIR 1998 341,727 100.0 HOME DEPOT 126,290 24 HOUR FITNESS 42,837 COSTCO 139,658
FAIRFAX PRU 2007 101,332 98.5 WALGREENS 40,000 TJ MAXX 27,888
FAIRFAX 2007 52,946 70.1
HARRISONBURG 2014 190,484 98.5 KOHL'S 88,248 MARTIN'S 73,396
LEESBURG PRU 2007 318,775 97.8 DICK'S SPORTING GOODS 43,149 BIG LOTS 36,958
MANASSAS 2015 107,233 100.0 BURLINGTON 69,960 ELITE FURNITURE ANDMATTRESS 10,852
PENTAGON CITY CPP 2010 328,957 100.0 MARSHALLS 42,142 BEST BUY 36,532 COSTCO 171,286
RICHMOND 1995 128,144 100.0 BURLINGTON 75,831 OFFICEMAX 24,975 ALDI 20,276
ROANOKE 2014 302,134 96.4 MICHAELS 40,002 MARSHALLS 35,134 SAM'S CLUB (8) 102,570
STAFFORD 2016 101,042 98.8 STAPLES 23,942 PETCO 12,000 GIANT FOOD 61,500
STAFFORD 2015 331,139 98.4 TJ MAXX 30,545 ROSS DRESS FOR LESS 30,179 SHOPPERS FOOD 67,995
STERLING 2008 361,110 90.1 TOYS R US 45,210 MICHAELS 35,333 TARGET (8) 125,204
STERLING 2015 808,442 99.6 WALMART 209,613 LOWE'S HOME CENTER 135,197 SAM'S CLUB 135,193
WOODBRIDGE (7) 2017 148,293 98.3 REGENCY FURNITURE 73882 THE SALVATION ARMY 17,070 ALDI 16,530
WOODBRIDGE KIR 1998 499,288 99.3 HOBBY LOBBY 63,971 DICK'S SPORTING GOODS 57,437

YEAR MAJOR LEASES GROCER
DEVELOPEDOR
LEASABLEAREA
PERCENTLEASED
LOCATION PORTFOLIO ACQUIRED (SQ.FT.) (1) TENANT NAME GLA TENANT NAME GLA TENANT NAME GLAWASHINGTON AUBURN 2007 174,470 82.2 LA FITNESS 34,500 OFFICE DEPOT 23,070
BELLEVUE 2013 507,849 93.2 TARGET 101,495 WALMART 76,207 SAFEWAY 36,992
BELLINGHAM KIR 1998 188,885 93.6 MACY'S FURNITURE 40,000 BEST BUY 30,000 COSTCO (8) 120,507
BELLINGHAM PRU 2007 378,621 95.0 KMART 103,950 GOODWILL INDUSTRIES 35,735 SAFEWAY 67,070
FEDERAL WAY KIR 2000 199,642 100.0 JO-ANN FABRICS 43,506 BARNES & NOBLE 24,987 H MART 55,069
KENT PRU 2006 86,909 82.4 ROSS DRESS FOR LESS 27,200 TARGET (8) 115,900
LAKE STEVENS (7) 2012 129,924 99.2 BARTELL DRUGS 17,622 SAFEWAY 61,000
MILL CREEK 2016 96,671 93.2 PLANET FITNESS 25,333 SPROUTS FARMERS MARKET 29,942
OLYMPIA PRU 2006 69,212 100.0 BARNES & NOBLE 20,779 PETCO 16,459 TRADER JOE'S 12,593
OLYMPIA 2012 6,243 100.0 TRADER JOE'S (8) 12,593
SEATTLE PRU 2006 86,060 93.1 BARTELL DRUGS 13,327 SAFEWAY 39,556
SILVERDALE 2012 170,406 94.0 JO-ANN FABRICS 29,903 RITE AID 23,470 SAFEWAY 55,003
SILVERDALE PRU 2006 67,287 96.4 ROSS DRESS FOR LESS 29,020
SPOKANE 2015 113,464 81.0 BED BATH & BEYOND 36,692 ROSS DRESS FOR LESS 25,000 TRADER JOE'S 12,052
TACOMA PRU 2006 111,611 98.9 TJ MAXX 25,160 OFFICE DEPOT 22,880 TARGET (8) 124,042
TUKWILA KIR 2003 468,857 100.0 DICK'S SPORTING GOODS 53,545 MACY'S FURNITURE 48,670 CANADA
ONTARIO BROCKVILLE UJV 2010 279,580 GALAXY 20,000 SHOPPERS DRUG MART 18,040 TOTAL 499 SHOPPING CENTER PROPERTY INTERESTS (9) 83,822,364
(1) Percent leased information as of December 31, 2017. (2) Denotes ground-up development project. (3) Denotes ground-up development project. The square footage shown represents completed leaseable area pending stabilization. (4) Denotes ground-up development project. The square footage shown represents completed leaseable area included in occupancy. (5) Denotes ground-up development project. The square footage shown represents completed leaseable area, of which approximately 311,000 square feet is pending stabilization (6) Denotes tenants who are Dark & Paying. (7) Denotes projects which exclude GLA of units being held for redevelopment. (8) Denotes tenants who are Shadow Anchors. (9) Does not include 366 properties, primarily through the Company’s preferred equity investments, other real estate investments and non-retail properties, totaling approximately 5.2 million square feet of GLA. CPP Denotes property interest in Canada Pension Plan. KIR Denotes property interest in Kimco Income REIT. OJV Denotes property interest in Other US Joint Ventures. PRU Denotes property interest in Prudential Investment Program. UJV Denotes property interest in Unconsolidated Joint Venture. (Back To Top)