Deep Object Pose Estimation for Semantic Robotic ... - arXiv

Do virus-resistant plants pose a threat to non-targetecosystems? I. Evidence from an Australian pathosystembased on glasshouse challenge experiments
ROBERT C. GODFREE,* MATTHEW J. WOODS, AUGUSTO BECERRALOPEZ-LAVALLE, LINDA M. BROADHURST, PETER H. THRALL ANDANDREW G. YOUNGCSIRO Plant Industry, GPO Box 1600, Canberra, ACT 2601, Australia (Email:[email protected])
Abstract One key environmental risk associated with the release of novel disease-resistant plants is the potentialfor non-target host populations to acquire resistance genes and undergo enemy release, leading to damage toassociated native plant populations in high conservation-value ecosystems. Unfortunately, the dynamics of mostnatural pathosystems are poorly understood, and risk assessment of disease-resistant plants remains a challenge.Here we describe the first stage of a multi-tiered risk assessment strategy aimed at quantifying potential ecologicalrelease in a model pathosystem (the weedy pasture species Trifolium repens infected with Clover yellow vein virus;ClYVV) in order to assess the level of risk posed by genetically modified and conventionally bred disease-resistanthost genotypes to non-target plant communities in south-eastern Australia. Glasshouse inoculation and growthexperiments using 14 ClYVV isolates and 20 wild T. repens lines collected from high conservation-value montanegrassland and woodland communities show that viral infection reduces the survival and growth of host plants byon average 10–50%. However, T. repens lines exhibited variable levels of resistance and tolerance to virus infectionand ClYVV isolates differed in infectivity and aggressiveness, with grassland isolates having a greater pathogeniceffect on associated host plants than woodland isolates.We conclude that ClYVV potentially plays an important rolein limiting the size of T. repens populations in some at-risk non-target ecosystems and that second-tier fieldexperiments are required to adequately quantify the risk associated with the commercial release of V-R T. repensgenotypes in Australia.
Key words: enemy release, genetically modified, host-pathogen, non-target ecosystem, tiered risk assessment.
INTRODUCTION
Over the past several decades there has been growingrecognition that pathogens and parasites significantlyimpact on the fitness, life-history strategies andmetapopulation dynamics of host plant species innatural or non-agricultural settings (Clay 1984; Jarosz& Burdon 1992; Yahara & Oyama 1993; Kelley 1994;Bendel et al. 2006). Some of the best-known examplesinvolve novel pathogens that have been introduced intoevolutionarily naive host populations (those with noprior exposure to a disease), often with devastatingconsequences (e.g. Dickman 1992; Dobson & Crawley1994; Davelos & Jarosz 2004). Emerging links betweenthe success of invasive species and release from thesuppressive effects of disease (the enemy releasehypothesis; Mitchell & Power 2003) and the crucialrole of biological control of weed species in both
agricultural and natural plant communities (Rosskopfet al. 1999) also indicate the importance of under-standing host-pathogen (H–P) dynamics at the speciesto community level.
The pervasive role of disease in natural systemshighlights the importance of ensuring the biosafety ofnovel disease-resistant plant genotypes that targetH–P systems for agricultural improvement. Twooften-cited risks are that fitness-enhancing (trans-)genes coding for pathogen resistance may move intowild host relatives, or that pathogen-resistant (P-R)genotypes themselves may invade new habitats (Hails2000; Snow et al. 2005). Both scenarios representa significant ecological risk as expanding host pop-ulations may threaten community associates innon-target environments. In recent years, advances ingenetic engineering have greatly increased thenumber of H–P systems targeted by disease-resistantplants (Jauhar 2006), with new crop and pasture cul-tivars expressing resistance to viruses, nematodes andfungi now under trial or commercial release in anumber of different countries.
*Corresponding author.Accepted for publication August 2008.
Austral Ecology (2009) 34, 508–524
© 2009 CSIRO doi:10.1111/j.1442-9993.2009.01957.xJournal compilation © 2009 Ecological Society of Australia

Unfortunately, assessment of the potential invasive-ness of novel P-R plants remains difficult, due primarilyto the lack of comprehensive case studies in which theimpact of diseases on host demography has been quan-tified (Roy et al. 2000).This is especially true of viruses(Kelley 1994; Tepfer 2002) and for entire groups ofplants that are often invasive in natural systems, such aspasture species (Lonsdale 1994; Godfree et al. 2004b).Indeed, despite the existence of an extensive theoreticalliterature describing the response of H–P systems toincreased levels of host disease resistance or tolerance,predicting the response of individual pathosystemswithin an explicitly community-level context remainsdifficult (Thrall et al. 2007). Furthermore, potentialrisks associated with gene flow from virus-resistant(V-R) transgenic plants have been studied in only a fewH–P systems; the best examples include assessmentsfor Cucurbita spp. (Arriaga et al. 2006), Beta vulgaris(Bartsch et al. 2001) and Brassica spp. (Maskell et al.1999; Pallett et al. 2002).There is therefore a clear needfor further detailed investigation into the role of patho-gens in different H–P systems over a range of ecologicalsettings and the means by which the magnitude ofenemy release in target and non-target environmentsmay be experimentally quantified as part of a compre-hensive risk assessment protocol.
In this series of papers we address these questions byusing a tiered risk assessment strategy (Wilkinson et al.2003) to quantify the effect of the aphid-borne poty-virus Clover yellow vein virus (ClYVV: Potyviridae;Hollings & Nariani 1965) on the fitness of wild popu-lations of the perennial pasture plant Trifolium repens L.and the level of risk posed byV-R T. repens genotypes tonon-target native plant communities in south-eastern(SE) Australia. This model pathosystem (described inGodfree et al. 2004a, 2006) has immediate relevance ina range of countries where transgenic T.repens lines havebeen developed to reduce the agronomical impact ofvirus infestation (e.g. Dudas et al. 1998; Kalla et al.2001), especially given the track record of T. repens as aweedy species (Holm et al. 1991), its global significanceas a pasture species (Abberton & Marshall 2005), andthe documented impact of viral diseases on T. repensgrowth, nodulation rate and yield (Gibson et al. 1981,1982). In Australia, the presence of invasive popula-tions of T. repens in a range of high conservation-valueplant communities (e.g. Godfree et al. 2004a, 2006)and the prevalence of viruses in T. repens populationsacross the continent (Norton & Johnstone 1998;Godfree et al. 2004a) suggest that viruses may limit T.repens populations in non-target native plant commu-nities and that the potential ecological risk posed byV-Rlines could be substantial. For example, Godfree et al.(2004a) showed that ClYVV occurs in around 80% ofT. repens populations and 18% of plants surveyed in themontane and subalpine zone of New South Wales andthe Australian Capital Territory, with infection rates
exceeding 50% at some sites. The T. repens-ClYVVpathosystem also has broad relevance for understand-ing risks associated with release of disease-resistantplants in general, given the concern of many regulatorygovernmental bodies (e.g. the Office of the GeneTech-nology Regulator, http://www.ogtr.gov.au) that one ofthe most significant environmental risks associated withthe release of P-R crops worldwide is the potentialecological release of non-target host populations fromnatural pathogen suppression.
In this and the following paper, we develop andconduct a multi-tiered risk assessment approach topredict the magnitude of enemy release that wouldoccur if ClYVV-resistant trans(genes) or genotypeswere to spread into non-target T. repens populations.Tiered risk assessment strategies are structured aroundinitial identification of hazard to the environment basedon laboratory and glasshouse studies (tier 1) followedby risk quantification derived from large-scale semi-field and field experiments (second and third tiers;Wilkinson et al. 2003). In the present paper, we usetier-1 glasshouse trials based on a series of H–P line-isolate combination arrays to (i) describe the infectivityof ClYVV isolates and resistance if T. repens lines toinfection; and (ii) to determine the impact of ClYVV onT. repens growth, survival and morphology.
METHODS
Establishment of experimental H–P system
Study area
All experiments were conducted using T. repens linesand ClYVV isolates collected from a 9-km2 study arealocated at Grassy Creek (148°57′E, 36°52′S) in south-ern Namadgi National Park, ACT, Australia (seeFig. 1; Godfree et al. 2006), except for one line of thecommercially grown cultivar ‘Sustain’. This area con-tains invasive wild populations of T. repens infectedwith ClYVV and is representative of the montane zoneof SE Australia (el. 1200–1400 m; winter max 7 to11°C, min -2 to -4°C; summer max 23 to 27°C, min6 to 8°C). Annual precipitation averages about800 mm, some of which falls as snow. The vegetationat the study area consists of treeless frost hollowsdominated by native tussock grasses (Poa spp.) andEucalyptus-dominated woodland and forest communi-ties on higher ground. The site contains areas of thenationally endangered natural temperate grassland ofthe southern tablelands of NSW (Kirkpatrick et al.1995), which now occupies only around 0.5% of itspre-European extent. Details of the relationshipsbetween T. repens and other community associates inthe study area are provided in Godfree et al. (2006).
RISK ASSESSMENT OF AN AUSTRALIAN PATHOSYSTEM 509
© 2009 CSIRO doi:10.1111/j.1442-9993.2009.01957.xJournal compilation © 2009 Ecological Society of Australia

Collection and establishment of clover lines
In August 2002, we collected stolons from 100 ran-domly selected white clover plants (minimum 5 mapart) from within each of two different representative1-km2 plant community sites (one woodland and onegrassland) inside the study area (Fig. 1). Stolons wereplaced in individual bags, transported to the lab on ice,and planted into 5-cm pots containing sterilized soil.Pots were placed in sealed plastic containers filled withwater to a depth of 3 cm and then maintained at14–16°C with permanent lighting to promote rootdevelopment. After 2–3 weeks, these were moved to aglasshouse (14/23°C night/day temperature) and trans-planted into 10-cm pots. One seed-derived glasshouse-grown line of the white clover cultivar ‘Sustain’ (S1) wasalso generated from stolon material in the samemanner. Sanitary precautions were taken to preventcross-contamination of virus infections among T.repensstolons.
Detection of viruses using host-indicator andmolecular assays
After 2 months of growth in the glasshouse, all plantswere assayed for the presence of ClYVV, Alfalfa mosaicvirus (AMV) and White clover mosaic virus (WClMV)
(all found in the montane and subalpine regions ofSE Australia) using inoculation of leaf sap onto theindicator plants Vigna unguiculata L. (Walp.) subsp.unguiculata cv. California blackeye (cowpea) andChenopodium amaranticolor Coste & Raynier (hereafterreferred to as the bioassay procedure, described indetail in Godfree et al. (2004a)). Briefly, severalmature leaves from each T. repens plant were crushed inpH 7.4 phosphate buffer solution containing the abra-sive agent celite and then inoculated onto young leavesof Chenopodium and cotyledons of cowpea. Based onsymptom development (see Godfree et al. 2004a)seven white clover lines from the grassland collection(termed GA–GG) and seven from the woodland col-lection (lines WA–WG) were identified as beinginfected with ClYVV; all remaining plants were free ofAMV, ClYVV and WClMV and showed no symptomsof other known viruses or diseases. We then randomlyselected 10 of the ClYVV-free lines from grassland andwoodland communities (lines C1–C10 and C11–C20,respectively), and these, along with line S1, were col-lectively used to develop T. repens-ClYVV H–P arraysfor use in experimental work.
The presence or absence of ClYVV, AMV andWClMV were confirmed in all 35 lines (14 ClYVV-positive (ClYVV+), 20 ClYVV-negative (ClYVV-), cv.‘Sustain’) by specific amplification of the viral coatprotein region using reverse-transcriptase-polymerase
Fig. 1. Collection of Trifolium repens lines and Clover yellow vein virus (ClYVV) isolates and design of glasshouse experiments.Initially, 10 ClYVV-free and 7 ClYVV+ T. repens plants were separately collected from grassland and woodland communities inthe study area (step 1; centred on E 148°57′, S 36°52′). Clonal cuttings were taken from each of the ClYVV-free lines along withthe cultivar ‘Sustain’ (S1) and inoculated in a factorial design with 8 ClYVV treatments (7 ClYVV+, A-G; 1 ClYVV-) (step 2).Glasshouse growth studies (step 3) used full host-pathogen arrays except for cv. Sustain line S1, which were excluded (but usedin later field trials). Glasshouse experiments were arranged in a randomised complete block design (step 4) with each ClYVVisolate-T. repens line combination occurring once in each block and replicated across 6 blocks. A total of 540 plants were usedin each glasshouse study. Hatched areas indicate Eucalyptus-dominated woodland communities while non-hatched areas indicatePoa-dominated grassland communities.
510 R. C. GODFREE ET AL.
© 2009 CSIROdoi:10.1111/j.1442-9993.2009.01957.xJournal compilation © 2009 Ecological Society of Australia

chain reaction (RT-PCR). Genetic variability amongClYVV coat protein sequences obtained was investi-gated using a PCR-based RFLP method.
Total RNA extraction and cDNA synthesis
For RT-PCR, total RNA was extracted from ~50 mg offrozen leaf tissue ground in liquid nitrogen with amortar and pestle and the powdered leaf materialwas added to a micro-centrifuge tube containing200 mL TNE (50 mmol L-1 Tris Acetate (pH 7.6),10 mmol L-1 Na Acetate, 200 mmol L-1 EDTA (pH8.0) ) and homogenized using a sterile epi-pestle.Then 200 mL of TNE and 4% SDS were added toeach micro-centrifuge tube and mixed gently. Onevolume of phenol/chloroform: isoamyl alcohol (24:1)was added and mixed for 10 min, and the tube wascentrifuged at 13 000 rpm for 2 min.The supernatantfluid was transferred to a fresh tube and 1/10 vol. of3 M sodium acetate (pH 5.2) and 2.5 vol. of 100%ethanol were added.The tube was placed at -20°C forapprox. 30 min and centrifuged at 13 000 rpm for10–20 min at 4°C and the pellet washed with 70%cold ethanol then re-dissolved in 30 mL sterile Milli-QH2O. RNA was quantified with a GeneQuant® IIDNA/RNA calculator (Pharmacia Biotech, UK). Thefirst strand cDNA was synthesized using Mu-MLVreverse transcriptase (MBI Fermentas RevertAid) andbuffers according to the manufacturer in a finalvolume of 20 mL. From the total RNA extraction solu-tion, 5 mL were taken (~500 ng mL-1) and mixed with2 mL of 1 mmol L-1 oligo dT and 4 mL of DEPC-treated H2O incubated at 70°C for 5 min andquenched at 4°C using a Hybaid-PCR express thermalcycler (Hybaid, UK). Immediately after, the followingcomponents were added: 4 mL of 5X Mu-MLV Reac-tion buffer (250 mmol L-1 Tris-HCl (pH 8.3), 0.1 MNaCl, 1 mmol L-1 EDTA, 5 mmol L-1 DTT, 0.1%Triton X-100 and 50% glycerol), 4 mL of 5 mmol L-1
dNTPs, and 0.5 mL of RNAsin (Promega, USA) togive a reaction volume of 19.5 mL incubated at 37°Cfor 5 min and quenched at 4°C. Mu-MLV reversetranscriptase (0.5 mL) was added to all other compo-nents and incubated for 60 min at 42°C followed by10 min incubation at 70°C to denature the enzyme.
ClYVV-specific PCR amplification
Polymerase chain reaction amplification was con-ducted in a Hybaid-PCR express thermal cycler(Hybaid, UK). Cycling conditions of PCR were opti-mized to an initial denaturing at 95 (5 min) and 30subsequent cycles at 95°C (1 min), 50°C (1 min) and72°C (1 min), with 10 mmol L-1 each of the coatprotein primers: for ClYVV, (ClYVVCON-F
(5′GGATCCGGATCCACAATGGACAAAGAGAAGTTGAATGCTGG3′) and ClYVVCON-R (5′GTCGACGTCGACCTAGAATCGTCGTCCAGCAATG3′)), AMV (AMV5-F (5′CGTCAGCTTTCGTCGAACA′) and AMV3-R (5′GCCGTCGCGCATGGTAAT′)) and WClMV (WCMV-F (5′CCTAACCAACAACCCCTAC3′) and WCMV-R (5′GATTTGGGGAAAGAGCAC3′)). Reactions containedGeneAmp 1X PCR buffer II (100 mmol L-1 Tris-HCl(pH 8.3), 500 mmol L-1 KCl), 0.2 mmol L-1 of eachdNTP (Astral Scientific, AU), 1.5 mmol L-1 MgCl2,one unit of AmpliTaq DNA polymerase (Applied Bio-systems, USA) and 5 mL of first strand synthesisproduct to a final reaction volume of 50 mL.
RT-PCR-based RFLP analysis of coat protein gene
Full-length RT-PCR products of the coat protein genefor ClYVV (~750 bp), AMV (~300 bp) and WClMV(~750 bp) were obtained. Restriction endonucleasedigestion of amplified ClYVV coat protein PCR frag-ments was performed with one unit of the restrictionendonuclease MseI (NEB, USA), 1¥ supplied restric-tion buffer, 10 mL of ds ClYVV PCR product andsterile Milli-Q H2O in a final volume of 20 mL. Reac-tions were incubated at 37°C for 2 h. Restrictiondigestion products were resolved by electrophoresis in2% agarose gels in TBE buffer at 50 V for 5 h, stainedwith ethidium bromide and viewed under ultravioletlight. Gel images were captured with a NovaLine geldocumentation system (NovaLine Inc, Glendale, CA,USA).
Inoculation study and development of ClYVV- andClYVV+ clone lines
Molecular tests for the presence of the coat proteinregions of ClYVV, AMV and WClMV and host-indicator plant bioassays showed that all 14 ClYVV+lines (GA–GG, WA–WG) contained ClYVV but noAMV or WClMV; all other plants (C1–C20, S1) werefree of these viruses. In November 2002 stolon cut-tings were taken from lines C1 to C20 and S1 andestablished as described above. In June 2003, theseplants were used to develop ClYVV- and ClYVV+clones for each of the original ClYVV- T. repens lines(C1–C20, S1) by mechanical inoculation of sap frominfected T. repens plants onto virus-free clones. Inocu-lations were performed in a factorial design with eachClYVV- line being separately inoculated with sapfrom each ClYVV+ line collected in the same commu-nity (grassland or woodland; Fig. 1). Inoculum of eachClYVV isolate was inoculated onto four geneticallyidentical cuttings from each ClYVV- line; one cuttingwas also inoculated with clover material known to be
RISK ASSESSMENT OF AN AUSTRALIAN PATHOSYSTEM 511
© 2009 CSIRO doi:10.1111/j.1442-9993.2009.01957.xJournal compilation © 2009 Ecological Society of Australia

virus free (grown from seed) which served as the virus-free control. All cuttings were tested for ClYVV usingindicator plant bioassays 4 weeks after inoculation(July 2003) and then again 4 weeks later. PositiveClYVV infection was recorded for all inoculation com-binations, and so one infected cutting was randomlyselected as the ClYVV+ line for each treatment com-bination, and the ClYVV- control was selected as theClYVV- line. T. repens line-ClYVV isolate combina-tions derived from grassland and woodland communi-ties (80 combinations each) are hereafter referred to asgrassland and woodland series, respectively.
Glasshouse growth trial
In August 2003, we initiated a glasshouse trialdesigned to determine the impact of ClYVV on thegrowth and development of wild T. repens plants. Six5-cm-long stolons were taken from all 80 plants inboth H–P series (Fig. 1), and, following root establish-ment, were planted into 15-cm plastic pots containing50/50 sand-perlite mix and placed in a glasshouse in arandomized complete block design with each H–Pcombination replicated once in each of six blocks.Experiments involving woodland and grassland serieswere conducted in separate glasshouses and consistedof 480 plants (432 ClYVV+ and 48 ClYVV-) in total.Pots were initially fertilized with 0.5 g L-1 Aquasol(Yates Ltd) to stimulate growth and inoculated with anappropriate rhizobial strain to ensure nodulation, andthereafter fertilized weekly and watered daily in winterand twice-daily in summer for the duration of theexperiment. Glasshouses had a 12 h/12 h day/nightregime with maximum/minimum temperatures of26°C/14°C respectively and humidity levels averaging60–70%. Growth and morphological data were col-lected on four census dates, each 2 months apart,beginning in Oct 2003. Variables for which data werecollected are provided in Tables 1 and 2: maximumstolon length was determined as the length of thelongest stolon while stolon number was determined asthe number of stolons greater than 20 mm in length.Only mature flower heads and leaves (leaves fullyopen) were counted in each census. During the secondand third censuses, above-ground dry weight of allplants was determined by clipping and drying at 90°Cfor 7 days all leaf and stolon material. By the time ofthe April 2004 census plant growth had slowedbecause of a lack of growing space and root crowding,and so two plants from each clover-virus treatmentwere then re-potted into 20 cm pots filled with sand-perlite mix, fertilized with 1.0 g L-1 aquasol, and thenplaced in a fully randomized manner onto six benchesin the glasshouse. Further growth and morphologicaldata were collected in June 2004, and the trial was
completed in September 2004 when all plants wereremoved from their pots, washed thoroughly, driedand weighed.
Data analysis
Inoculation study
The effects of clover line and virus isolate on infectionfrequency were tested using logistic regression analysisusing infection status as the binary dependent variable.Individual contingency tables classified by infectionstatus and either clover line or virus isolate were alsoconstructed and tested for row–column dependenceusing the likelihood ratio test G (Sokal & Rohlf 1981).Woodland and grassland series were tested separatelyin both analyses.
Glasshouse growth trial
Data from October 2003 to February 2004 censuseswere separately analysed using linear mixed modelanalysis with T. repens line (10 lines), ClYVV treatment(seven ClYVV+, one ClYVV- treatments) and theassociated two-way interaction term as fixed modeleffects and bench (n = 6) as the random effect. Least-square means were calculated for all virus line – T.repens line treatment combinations; group differenceswere tested using the Tukey–Kramer adjustment formultiple testing.The direct contrast between means ofall virus free (CYVV-) plants and infected (ClYVV+)plants was also tested to determine the overall collec-tive effect of ClYVV on T. repens growth andperformance. Variables were transformed where nec-essary to improve model assumptions. Most plantdeaths occurred early in the trial, so the impact ofClYVV on survival was assessed with data collectedduring the October 2003 census using contingencyanalysis with alive/dead as the dependent variable andclover line or virus line as blocking variables. For allanalyses performed on grassland series data, apartfrom those conducted on data collected in October2003, T. repens line C9 was excluded from mixedmodels as high death rates in this group resulted inseverely unbalanced models. Several individualClYVV- plants were excluded from the grasslandseries data during the experiment because theybecame infected with ClYVV. Clover line C13 wasremoved from the April 2004 woodland series data setbecause of missing data for this line. For data collectedbetween April and September 2004, analyses onlyincluded fixed effects as the associated experimentaldesign was fully randomized and contained no randombench variable. Variables were transformed and
512 R. C. GODFREE ET AL.
© 2009 CSIROdoi:10.1111/j.1442-9993.2009.01957.xJournal compilation © 2009 Ecological Society of Australia

Tab
le1.
Res
ults
oflin
ear
mix
edm
odel
anal
ysis
ofim
pact
ofC
love
rye
llow
vein
viru
s(C
lYV
V)
onth
egr
owth
,mor
phol
ogy,
fecu
ndit
yan
ddr
yw
eigh
tof
gras
slan
d-de
rive
dlin
esof
Trifo
lium
repe
nsun
der
glas
shou
seco
ndit
ions
Cen
sus
date
Mod
elef
fect
T.re
pens
line
ClY
VV
trea
tmen
tT.
repe
ns¥
ClY
VV
V+/
V-
cont
rast
Mea
ns
FF
FF
ClY
VV
-C
lYV
V+
dV+‡
Oct
ober
2003
Max
stol
onle
ngth
(mm
)†50
.0**
*(9
.364
)34
.4**
*(7
.364
)2.
5***
(63.
364)
191.
0***
(1.3
64)
89.5
(3.8
)46
.8(2
.6)
-48
Sto
lon
num
ber
18.6
***
(9.3
64)
25.1
***
(7.3
64)
2.3*
**(6
3.36
4)14
9.6*
**(1
.364
)1.
2(0
.08)
0.4
(0.0
5)-6
7L
eaf
num
ber†
48.5
***
(9.3
64)
24.7
***
(7.3
64)
2.0*
**(6
3.36
4)13
7.5*
**(1
.364
)17
.9(0
.77)
10.6
(0.5
8)-4
1D
ecem
ber
2004
Max
stol
onle
ngth
(mm
)65
.6**
*(8
.342
)3.
47**
(7.3
42)
2.4*
**(5
6.34
2)2.
4(1
.342
)26
0.4
(8.2
)25
0.3
(4.6
)-4
Sto
lon
num
ber
8.3*
**(8
.342
)8.
3***
(7.3
42)
1.3*
***
(56.
342)
26.6
***
(1.3
42)
20.1
(1.1
1)16
.7(0
.93)
-17
Aer
ial
dry
wei
ght
(g)§
27.4
***
(9.3
42)
33.8
***
(7.3
42)
2.0*
**(5
6.34
2)18
5.9*
**(1
.342
)4.
3(0
.13)
3.0
(0.1
0)-3
0F
ebru
ary
2004
Flo
wer
head
s51
.2**
*(8
.333
)1.
6(7
.333
)1.
3***
*(5
6.33
3)2.
4***
*(1
.342
)19
.0(0
.8)
20.1
(0.5
)6
Aer
ial
dry
wei
ght
(g)
9.3*
**(8
.334
)6.
4***
(7.3
34)
1.2
(56.
334)
5.27
*(1
.334
)4.
1(0
.12)
3.9
(0.1
0)-5
Apr
il20
04A
eria
ldr
yw
eigh
t(g
)3.
6***
(8.6
8)0.
3(7
.68)
0.7
(56.
68)
0.8
(1.6
8)2.
9(0
.13)
3.1
(0.1
0)7
June
2004
Max
stol
onle
ngth
(mm
)†6.
7***
(8.6
1)6.
7***
(7.6
1)1.
6(5
6.61
)38
.8**
*(1
.61)
8.2
(0.3
)6.
7(0
.1)
-34
Lea
flet
leng
th(m
m)
6.6*
**(8
.60)
12.9
***
(7.6
0)1.
6*(5
6.60
)83
.4**
*(1
.60)
10.3
(0.2
)8.
6(0
.1)
-17
Aer
ial
dry
wei
ght
(g)
2.9*
*(8
.61)
5.73
***
(7.6
1)1.
8*(5
6.61
)26
.5**
*(1
.61)
2.3
(0.1
4)1.
6(0
.05)
-30
Sep
tem
ber
2004
Tot
aldr
yw
eigh
t(g
)2.
9**
(8.6
3)4.
4***
(7.6
3)1.
0(5
6.63
)20
.2**
*(1
.63)
11.8
(0.7
)8.
4(0
.2)
-29
*P<
0.05
,**
P<
0.01
,**
*P<
0.00
1,**
**P
<0.
10.V
alue
spr
ovid
edar
eF
(DF
)ex
cept
for
trea
tmen
tle
ast-
squa
rem
eans
whe
rest
anda
rder
rors
are
inpa
rent
hese
s.F
orda
taco
llect
edat
the
first
thre
ece
nsus
date
s,m
odel
sco
ntai
ned
T.re
pens
line
(10
lines
),C
lYV
Vtr
eatm
ent
(7V
+,1
V-
trea
tmen
ts)
and
the
two-
way
inte
ract
ion
term
asfix
edpr
edic
tor
vari
able
san
dbl
ock
(n=
6)as
the
rand
omva
riab
le.F
orda
taco
llect
eddu
ring
the
latt
erth
ree
cens
usda
tes
nobl
ock
effe
ctw
asin
clud
ed(s
eete
xtfo
rde
tails
).T
heV
+/V
-co
ntra
stis
the
dire
ctte
stfo
ra
mea
ndi
ffer
ence
betw
een
viru
sfr
ee(V
-)pl
ants
and
the
aver
age
ofal
lin
fect
ed(V
+)pl
ants
.L
east
-squ
are
mea
nsan
dst
anda
rder
rors
are
base
don
untr
ansf
orm
edda
ta.d
V+,
the
rela
tive
viru
sef
fect
,is
the
mea
npe
rcen
tage
redu
ctio
nin
agi
ven
para
met
erca
used
bypr
esen
ceof
ClY
VV.
† Squ
are-
root
tran
sfor
med
.‡ dV+,
the
rela
tive
viru
sef
fect
,de
fined
as10
0%¥
((V
+/V
-)-
1).
§ Aer
ial
dry
wei
ght,
dry
wei
ght
ofab
ove-
grou
ndst
olon
and
leaf
mat
eria
l.
RISK ASSESSMENT OF AN AUSTRALIAN PATHOSYSTEM 513
© 2009 CSIRO doi:10.1111/j.1442-9993.2009.01957.xJournal compilation © 2009 Ecological Society of Australia
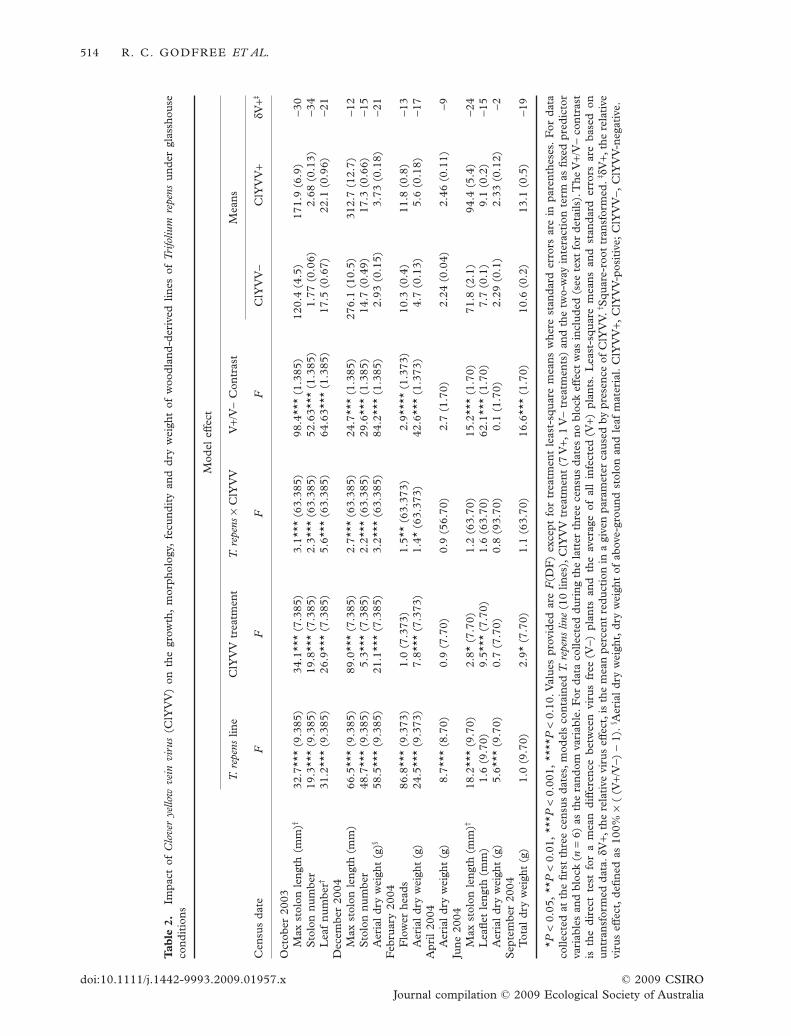
Tab
le2.
Impa
ctof
Clo
ver
yello
wve
invi
rus
(ClY
VV
)on
the
grow
th,
mor
phol
ogy,
fecu
ndit
yan
ddr
yw
eigh
tof
woo
dlan
d-de
rive
dlin
esof
Trifo
lium
repe
nsun
der
glas
shou
seco
ndit
ions
Cen
sus
date
Mod
elef
fect
T.re
pens
line
ClY
VV
trea
tmen
tT.
repe
ns¥
ClY
VV
V+/
V-
Con
tras
tM
eans
FF
FF
ClY
VV
-C
lYV
V+
dV+‡
Oct
ober
2003
Max
stol
onle
ngth
(mm
)†32
.7**
*(9
.385
)34
.1**
*(7
.385
)3.
1***
(63.
385)
98.4
***
(1.3
85)
120.
4(4
.5)
171.
9(6
.9)
-30
Sto
lon
num
ber
19.3
***
(9.3
85)
19.8
***
(7.3
85)
2.3*
**(6
3.38
5)52
.63*
**(1
.385
)1.
77(0
.06)
2.68
(0.1
3)-3
4L
eaf
num
ber†
31.2
***
(9.3
85)
26.9
***
(7.3
85)
5.6*
**(6
3.38
5)64
.63*
**(1
.385
)17
.5(0
.67)
22.1
(0.9
6)-2
1D
ecem
ber
2004
Max
stol
onle
ngth
(mm
)66
.5**
*(9
.385
)89
.0**
*(7
.385
)2.
7***
(63.
385)
24.7
***
(1.3
85)
276.
1(1
0.5)
312.
7(1
2.7)
-12
Sto
lon
num
ber
48.7
***
(9.3
85)
5.3*
**(7
.385
)2.
2***
(63.
385)
29.6
***
(1.3
85)
14.7
(0.4
9)17
.3(0
.66)
-15
Aer
ial
dry
wei
ght
(g)§
58.5
***
(9.3
85)
21.1
***
(7.3
85)
3.2*
**(6
3.38
5)84
.2**
*(1
.385
)2.
93(0
.15)
3.73
(0.1
8)-2
1F
ebru
ary
2004
Flo
wer
head
s86
.8**
*(9
.373
)1.
0(7
.373
)1.
5**
(63.
373)
2.9*
***
(1.3
73)
10.3
(0.4
)11
.8(0
.8)
-13
Aer
ial
dry
wei
ght
(g)
24.5
***
(9.3
73)
7.8*
**(7
.373
)1.
4*(6
3.37
3)42
.6**
*(1
.373
)4.
7(0
.13)
5.6
(0.1
8)-1
7A
pril
2004
Aer
ial
dry
wei
ght
(g)
8.7*
**(8
.70)
0.9
(7.7
0)0.
9(5
6.70
)2.
7(1
.70)
2.24
(0.0
4)2.
46(0
.11)
-9Ju
ne20
04M
axst
olon
leng
th(m
m)†
18.2
***
(9.7
0)2.
8*(7
.70)
1.2
(63.
70)
15.2
***
(1.7
0)71
.8(2
.1)
94.4
(5.4
)-2
4L
eafle
tle
ngth
(mm
)1.
6(9
.70)
9.5*
**(7
.70)
1.6
(63.
70)
62.1
***
(1.7
0)7.
7(0
.1)
9.1
(0.2
)-1
5A
eria
ldr
yw
eigh
t(g
)5.
6***
(9.7
0)0.
7(7
.70)
0.8
(93.
70)
0.1
(1.7
0)2.
29(0
.1)
2.33
(0.1
2)-2
Sep
tem
ber
2004
Tot
aldr
yw
eigh
t(g
)1.
0(9
.70)
2.9*
(7.7
0)1.
1(6
3.70
)16
.6**
*(1
.70)
10.6
(0.2
)13
.1(0
.5)
-19
*P<
0.05
,**
P<
0.01
,**
*P<
0.00
1,**
**P
<0.
10.V
alue
spr
ovid
edar
eF
(DF
)ex
cept
for
trea
tmen
tle
ast-
squa
rem
eans
whe
rest
anda
rder
rors
are
inpa
rent
hese
s.F
orda
taco
llect
edat
the
first
thre
ece
nsus
date
s,m
odel
sco
ntai
ned
T.re
pens
line
(10
lines
),C
lYV
Vtr
eatm
ent
(7V
+,1
V-
trea
tmen
ts)
and
the
two-
way
inte
ract
ion
term
asfix
edpr
edic
tor
vari
able
san
dbl
ock
(n=
6)as
the
rand
omva
riab
le.F
orda
taco
llect
eddu
ring
the
latt
erth
ree
cens
usda
tes
nobl
ock
effe
ctw
asin
clud
ed(s
eete
xtfo
rde
tails
).T
heV
+/V
-co
ntra
stis
the
dire
ctte
stfo
ra
mea
ndi
ffer
ence
betw
een
viru
sfr
ee(V
-)pl
ants
and
the
aver
age
ofal
lin
fect
ed(V
+)pl
ants
.L
east
-squ
are
mea
nsan
dst
anda
rder
rors
are
base
don
untr
ansf
orm
edda
ta.d
V+,
the
rela
tive
viru
sef
fect
,is
the
mea
npe
rcen
tre
duct
ion
ina
give
npa
ram
eter
caus
edby
pres
ence
ofC
lYV
V.† S
quar
e-ro
ottr
ansf
orm
ed.‡ dV
+,th
ere
lati
vevi
rus
effe
ct,
defin
edas
100%
¥(
(V+/
V-)
-1)
.§ A
eria
ldr
yw
eigh
t,dr
yw
eigh
tof
abov
e-gr
ound
stol
onan
dle
afm
ater
ial.
ClY
VV
+,C
lYV
V-p
osit
ive;
ClY
VV
-,C
lYV
V-n
egat
ive.
514 R. C. GODFREE ET AL.
© 2009 CSIROdoi:10.1111/j.1442-9993.2009.01957.xJournal compilation © 2009 Ecological Society of Australia
extreme outliers removed from the data set wherenecessary.
The relative virus effect (dV+) was calculated as:
δV + ( ) = × +−
−⎛⎝
⎞⎠% 100 1
VV
where V- is the mean of ClYVV- treatments and V+ isthe mean of ClYVV+ treatment(s). dV+ is a measure ofthe percentage reduction or increase of a parameter forClYVV+ plants compared with ClYVV-free plants.
Finally, we tested for evidence of a fitness costassociated with disease tolerance in T. repens lines bycomparing the growth performance of virus-free andvirus-infected T. repens lines. If there is a fitness costassociated with expression of viral resistance, we wouldexpect to see proportionately greater losses in growthin the fastest-growing or most productive host lineswhen infected with ClYVV. In this case, we wouldexpect a negative relationship to occur between Y/Xand X, where Y = the performance of infected plantsand X = performance of virus-free plants.We tested fora negative relationship between Y/X and X for stolonnumber, stolon length and leaf number after 2 monthsof growth using data separately from grassland andwoodland T. repens lines.
All statistical tests were performed using SASversion 8.2 (SAS Institute Inc., Cary, NC, USA).
RESULTS
Presence of ClYVV haplotypes in wildT. repens plants
Reverse-transcriptase-PCR-based RFLP analysis ofthe coat protein ds cDNA fragment using the restric-tion endonuclease MseI revealed the presence of fivediscrete ClYVV haplotypes (sensu García-Arenal et al.2001) among the 14 ClYVV+ lines collected from thestudy area. Among ClYVV isolates, 79% of all isolatesconsisted of one dominant haplotype, while theremaining four haplotypes were represented by 8% orless of the remaining isolates.
Inoculation study
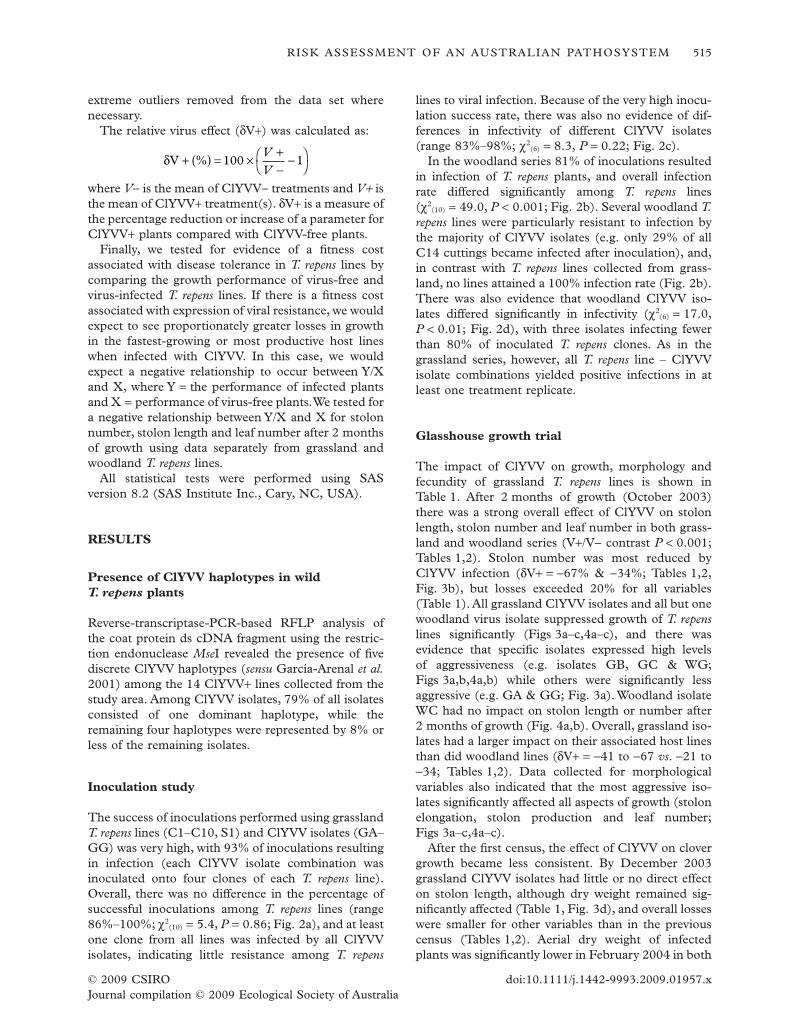
The success of inoculations performed using grasslandT. repens lines (C1–C10, S1) and ClYVV isolates (GA–GG) was very high, with 93% of inoculations resultingin infection (each ClYVV isolate combination wasinoculated onto four clones of each T. repens line).Overall, there was no difference in the percentage ofsuccessful inoculations among T. repens lines (range86%–100%; c2
(10) = 5.4, P = 0.86; Fig. 2a), and at leastone clone from all lines was infected by all ClYVVisolates, indicating little resistance among T. repens
lines to viral infection. Because of the very high inocu-lation success rate, there was also no evidence of dif-ferences in infectivity of different ClYVV isolates(range 83%–98%; c2
(6) = 8.3, P = 0.22; Fig. 2c).In the woodland series 81% of inoculations resulted
in infection of T. repens plants, and overall infectionrate differed significantly among T. repens lines(c2
(10) = 49.0, P < 0.001; Fig. 2b). Several woodland T.repens lines were particularly resistant to infection bythe majority of ClYVV isolates (e.g. only 29% of allC14 cuttings became infected after inoculation), and,in contrast with T. repens lines collected from grass-land, no lines attained a 100% infection rate (Fig. 2b).There was also evidence that woodland ClYVV iso-lates differed significantly in infectivity (c2
(6) = 17.0,P < 0.01; Fig. 2d), with three isolates infecting fewerthan 80% of inoculated T. repens clones. As in thegrassland series, however, all T. repens line – ClYVVisolate combinations yielded positive infections in atleast one treatment replicate.
Glasshouse growth trial
The impact of ClYVV on growth, morphology andfecundity of grassland T. repens lines is shown inTable 1. After 2 months of growth (October 2003)there was a strong overall effect of ClYVV on stolonlength, stolon number and leaf number in both grass-land and woodland series (V+/V- contrast P < 0.001;Tables 1,2). Stolon number was most reduced byClYVV infection (dV+ = -67% & -34%; Tables 1,2,Fig. 3b), but losses exceeded 20% for all variables(Table 1). All grassland ClYVV isolates and all but onewoodland virus isolate suppressed growth of T. repenslines significantly (Figs 3a–c,4a–c), and there wasevidence that specific isolates expressed high levelsof aggressiveness (e.g. isolates GB, GC & WG;Figs 3a,b,4a,b) while others were significantly lessaggressive (e.g. GA & GG; Fig. 3a). Woodland isolateWC had no impact on stolon length or number after2 months of growth (Fig. 4a,b). Overall, grassland iso-lates had a larger impact on their associated host linesthan did woodland lines (dV+ = -41 to -67 vs. -21 to-34; Tables 1,2). Data collected for morphologicalvariables also indicated that the most aggressive iso-lates significantly affected all aspects of growth (stolonelongation, stolon production and leaf number;Figs 3a–c,4a–c).
After the first census, the effect of ClYVV on clovergrowth became less consistent. By December 2003grassland ClYVV isolates had little or no direct effecton stolon length, although dry weight remained sig-nificantly affected (Table 1, Fig. 3d), and overall losseswere smaller for other variables than in the previouscensus (Tables 1,2). Aerial dry weight of infectedplants was significantly lower in February 2004 in both
RISK ASSESSMENT OF AN AUSTRALIAN PATHOSYSTEM 515
© 2009 CSIRO doi:10.1111/j.1442-9993.2009.01957.xJournal compilation © 2009 Ecological Society of Australia
grassland (Table 1) and woodland (Table 2) series, butnot in April 2004.The impact of woodland and grass-land isolates on T. repens flower production in February2004 was only marginally significant and inconsistentin direction (Tables 1,2). Following transplantationinto larger pots (Table 1), the effects of ClYVVre-emerged, with significant reductions observed inleaflet size (Figs 3e,4e) and total plant dry weight(Figs 3f,4f). This suggests that over time the impactof reduced growing space makes it more difficult todetect not only the impact of ClYVV on T. repensin general but also differences in aggressiveness ofClYVV isolates. Interestingly, by the end of the glass-house trial, all isolates had similar effects on leaflet sizeand total plant weight, especially in the grassland series(Figs 3e,f,4e,f).
Host line ¥ ClYVV treatment interactions, while sig-nificant, were relatively weak in comparison to themain effects of virus treatment and T. repens line(Tables 1,2), suggesting that different ClYVV isolatesgenerally affect a given T. repens line in a similar waybut that T. repens lines have different levels of toleranceto infection by ClYVV. Evidence for this conclusion isprovided in Fig. 5, where the majority of isolates gen-
erally exhibited the same relative suppressive effect onthe stolon elongation of different T. repens lines. Forexample, host lines C1, C2 and C11 appeared stronglytolerant of infection by virtually all associated isolates,while lines C7, C9 and C17 were always intolerant ofinfection (grassland T. repens line C9 suffered lossesin stolon growth of 90% or more). In the case ofthe woodland series, however, a stronger T. repens ¥ClYVV isolate interaction was present (Table 2; Fig.5), with several lines such as C18 and C19 exhibitingvariable responses to infection by different ClYVVisolates (Fig. 5g,h). Overall, however, tolerance toClYVV infection among wild T. repens lines appearedto be approximately unimodally distributed, with mostClYVV-T. repens combinations showing relative viruseffects of around -20% to -70%. Finally, ClYVV-T.repens interactions were not significant at latter stagesin the trial, and model explanatory power was alsogenerally lower (Tables 1,2).
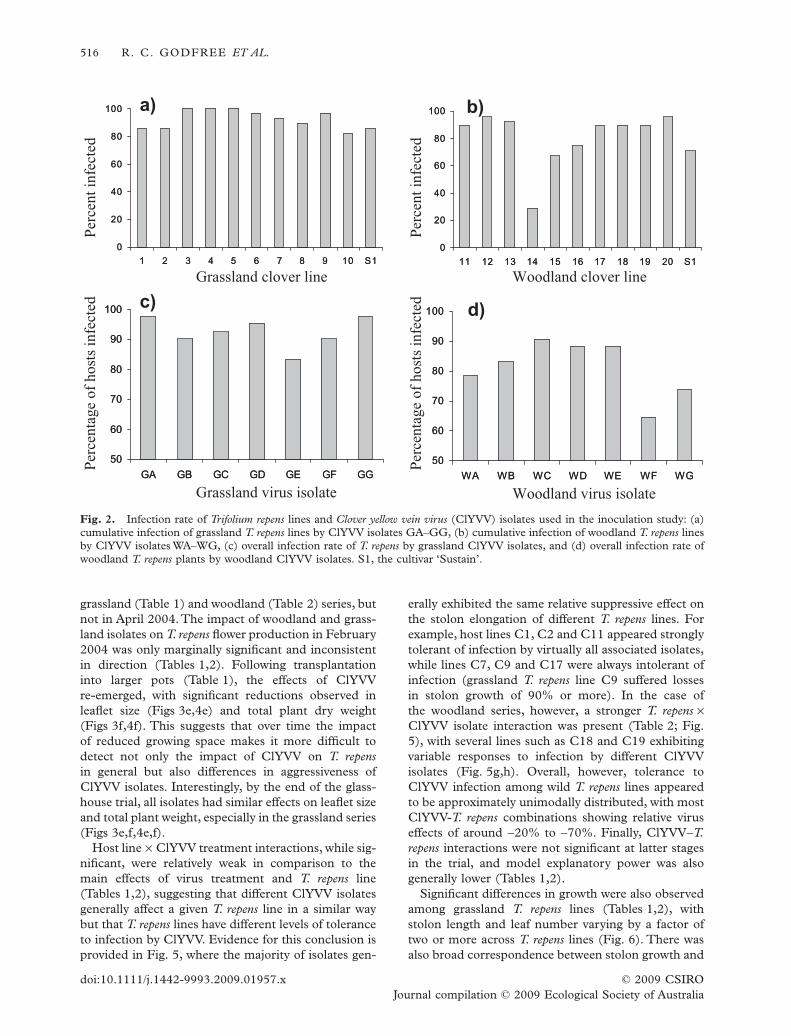
Significant differences in growth were also observedamong grassland T. repens lines (Tables 1,2), withstolon length and leaf number varying by a factor oftwo or more across T. repens lines (Fig. 6). There wasalso broad correspondence between stolon growth and
c)
b)
d)
a)
0
20
40
60
80
100
1 2 3 4 5 6 7 8 9 10 S1
0
20
40
60
80
100
11 12 13 14 15 16 17 18 19 20 S1
50
60
70
80
90
100
GA GB GC GD GE GF GG50
60
70
80
90
100
WA WB WC WD WE WF WG
0
20
40
60
80
100
1 2 3 4 5 6 7 8 9 10 S1
0
20
40
60
80
100
11 12 13 14 15 16 17 18 19 20 S1
50
60
70
80
90
100
GA GB GC GD GE GF GG50
60
70
80
90
100
WA WB WC WD WE WF WG
Grassland virus isolate
Grassland clover line
Woodland virus isolate
Woodland clover line
Per
cent
infe
cted
P
erce
ntag
e of
hos
ts in
fect
ed
Per
cent
infe
cted
P
erce
ntag
e of
hos
ts in
fect
ed
Fig. 2. Infection rate of Trifolium repens lines and Clover yellow vein virus (ClYVV) isolates used in the inoculation study: (a)cumulative infection of grassland T. repens lines by ClYVV isolates GA–GG, (b) cumulative infection of woodland T. repens linesby ClYVV isolates WA–WG, (c) overall infection rate of T. repens by grassland ClYVV isolates, and (d) overall infection rate ofwoodland T. repens plants by woodland ClYVV isolates. S1, the cultivar ‘Sustain’.
516 R. C. GODFREE ET AL.
© 2009 CSIROdoi:10.1111/j.1442-9993.2009.01957.xJournal compilation © 2009 Ecological Society of Australia

leaf production across grassland clover lines (cf. C10and C1; Fig. 6a,c) but not woodland lines (Fig. 6b–d).However, we found little evidence of a host fitnesstrade-off associated with viral tolerance or resistance;correlations between the ratio of performance of
ClYVV+ and ClYVV- plants and performance ofClYVV- plants were weak and non-significant forstolon length (r = -0.41, P = 0.24 and r = -0.38,P = 0.28 for grassland and woodland series, respec-tively), stolon number (r = -0.29, P = 0.41 and r =
V- GA GB GC GD GE GF GG V- GA GB GC GD GE GF GG
V- GA GB GC GD GE GF GG V- GA GB GC GD GE GF GG
V- GA GB GC GD GE GF GG V- GA GB GC GD GE GF GG
a) b)
c) d)
e) f)
a
b
d cdbc b bc b
80
60
40
100
20
1.00
1.50
0.75
1.25
0.50
0.25
0
16
20
12
8
4
0
4
3
2
5
1
0
9
6
3
12
0
9
6
3
12
0
15
bc
cd
cd cdcd
d
dbcbc bc
bcdbcd bcd
b
b b bbcd de e
c
aa
a ab b b b b b b
bb b
bab ab
ab
Sto
lon
leng
th (
mm
)
Sto
lon
num
ber
Lea
f nu
mbe
r
Dry
wei
ght (
g)
Lea
flet
leng
th (
mm
)
Dry
wei
ght (
g)
a
Fig. 3. Impact of Clover yellow vein virus (ClYVV) on growth and morphology of grassland Trifolium repens lines based onglasshouse data. (a) maximum stolon length in Oct 2003 census (after 2 months of growth); (b) number of stolons >20 mm longin Oct 2003; (c) number of mature leaves in Oct 2003; (d) above-ground dry weight in Dec 2003; (e) mean length of centralleaflet in Jun 2004; and (f) total plant dry weight in Sep 2004.Values shown are least-square means (one standard error) averagedover all T. repens plants infected with each ClYVV isolate based on linear mixed model analysis; means sharing the same letterare not significantly different.
RISK ASSESSMENT OF AN AUSTRALIAN PATHOSYSTEM 517
© 2009 CSIRO doi:10.1111/j.1442-9993.2009.01957.xJournal compilation © 2009 Ecological Society of Australia

-0.38, P = 0.30) and leaf number (r = 0.48, P = 0.16and r = -0.12, P = 0.75). However, there was someevidence of a trade-off between pathogen infectivityand aggressiveness. The most infective isolates (i.e.
those with the highest transmission rates (GA, GG &WC; Fig. 2)) also caused the smallest reductionsin host growth relative to the virus-free controls(Figs 3,4), a pattern which occurred for stolon length,
0
1
2
3
4
5
0
0.5
1
1.5
2
2.5
3
1 2 3 4 5 6 7 8V- V- WA WB WC WD WE WF WG
V- WA WB WC WD WE WF WG V- WA WB WC WD WE WF WG
V- WA WB WC WD WE WF WG V- WA WB WC WD WE WF WG
a) b)
c) d)
e) f)
a
cdb
a
bcd d
e
160
120
80
200
40
0
2.0
3.0
1.5
2.5
1.0
0.5
0
20
15
10
25
5
0
100
4
3
2
5
1
0
9
6
3
12
0
9
6
3
12
0
15
bc b
cd d
a
a
a
bb
c
bcc
bc
d
c c cb
b bc
a
a
aa
b b b b b b bb b b
bb b b
WA WB WC WD WE WF WG
a
Stol
onle
ngth
(m
m)
Stol
onnu
mbe
r
Lea
f nu
mbe
r
Dry
wei
ght (
g)
Lea
flet
leng
th (
mm
)
Dry
wei
ght (
g)
Fig. 4. Impact of Clover yellow vein virus (ClYVV) on growth and morphology of woodland Trifolium repens lines based onglasshouse data. (a) maximum stolon length in Oct 2003 census (after 2 months of growth); (b) number of stolons >20 mm longin Oct 2003; (c) number of mature leaves in Oct 2003; (d) above-ground dry weight in Dec 2003; (e) mean length of centralleaflet in Jun 2004; and (f) total plant dry weight in Sep 2004.Values shown are least-square means (one standard error) averagedover all T. repens plants infected with each ClYVV isolate based on linear mixed model analysis; means sharing the same letterare not significantly different.
518 R. C. GODFREE ET AL.
© 2009 CSIROdoi:10.1111/j.1442-9993.2009.01957.xJournal compilation © 2009 Ecological Society of Australia

stolon number, leaf number and dry weight(Fig 3a–c,f).
Overall, plant survival in the glasshouse trial washigh, with only a small number of deaths recorded atearly stages in the trial.After 2 months, 7% of grasslandplants and 2% of woodland plants had died, all of whichwere infected with ClYVV. Infected plants were signifi-cantly more likely to die than virus-free ones (G(1) = 8.6,P = 0.003) in the grassland trial and marginally so inthe woodland series (G(1) = 2.7, P = 0.10). However,the majority of plants suffering mortality were from T.repens lines C9 and C18, both of which where more
likely to die than other associated lines (G(9) = 87.7,P < 0.001 and G(9) = 31.0, P < 0.001, respectively.Interestingly, virus-free clones of line C18 had thehighest growth rate among woodland T. repens lines.
DISCUSSION
Impact of ClYVV isolates on wild T. repens lines
The results of our glasshouse trials provide clear evi-dence that ClYVV is a potentially important pathogen
-100
-50
0
50
100C1
-100
-50
0
50
100
-100
-50
0
50
100C7
-100
-50
0
50
100 C9
-100
-50
0
50
100
-100
-50
0
50
100
-100
-50
0
50
100
-100
-50
0
50
100
C2
δV+av = +13 δV+av = -21
δV+av = -63 δV+av = -98
71C11C
δV+av = -8 δV+av = -61
C18
δV+av = -34
C19
δV+av = -32
)b)a
c) d)
)f)e
)h)g
*
****
*** *** *** *** *** *****
*** *** *** *** *** *** ***
******
*** *** *** *** ***
*********
** ***
*
*******
GA GB GC GD GE GF GG GA GB GC GD GE GF GG
WA WB WC WD WE WF WG WA WB WC WD WE WF WG
Clover yellow vein isolate
Rel
ativ
e vi
rus
effe
ct
Fig. 5. Impact of Clover yellow vein virus isolates on Trifolium repens plants collected from grassland (C1,C2, C7, C9) andwoodland communities (C11, C17, C18, C19) based on maximum stolon length after 2 months of growth (October 2003).ClYVV isolates GA–GG andWA–WG were collected from grassland and woodland environments respectively.The relative viruseffect (dV+) is the percentage reduction in a given variable caused by pathogenic effects of ClYVV.Where performance of infectedplants is greater, dV+ is positive. dV+ values were determined based on least-square means for each T. repens–ClYVV combinationdetermined by linear mixed model analysis (see text). Within each T. repens line, significance levels refer to the mean differencebetween virus-free plants and those infected with a particular ClYVV isolate. *P < 0.05, **P < 0.01, ***P < 0.001.
RISK ASSESSMENT OF AN AUSTRALIAN PATHOSYSTEM 519
© 2009 CSIRO doi:10.1111/j.1442-9993.2009.01957.xJournal compilation © 2009 Ecological Society of Australia
of T. repens populations typical of montane and subal-pine environments in SE Australia. Isolates from bothgrassland and woodland environments reduced T.repens stolon size, stolon number, leaf number andaerial and total plant dry matter, with losses in stolonproduction being most severe (-34% to -67%). Viralinfection also reduced dry weight, leaflet size and totaldry weight by at least 10–30% (Tables 1,2), andcaused significant mortality of several T. repens lines,indicating that ClYVV inhibits a range of importantgrowth, demographic and morphological hostparameters. However, the most severe pathogeniceffects of ClYVV occurred in the first 2 months of theexperiment, suggesting that ClYVV has the largesteffects on host plants exhibiting unrestricted growth inrelatively stress-free conditions.
These results are consistent with those reported inprevious experiments in which the impact of ClYVVon yield and growth of commercial T. repens lines hasbeen investigated. Gibson et al. (1981) reported thatClVYV infection reduced at least nine separate growthcomponents of T. repens cv. Ladino (e.g. length ofprimary and secondary stolons, number of stolonrooting nodes, stolon dry weight) by 10–41%, notingthat overall stunting was primarily caused by reduc-
tions in both stolon node growth rate and the effec-tiveness of nodulation. In an outdoor experimentconducted in filtered air enclosures, Gibson et al.(1982) showed that ClYVV-reduced yield of Ladinowhite clover by an average of 15%, with losses beinggreatest in autumn (-26%) and least in winter andspring (-9%). ClYVV is also known to reduce T. repensgrowth when occurring in mixed infections with otherviruses (Kreitlow et al. 1957; Kreitlow & Hunt 1958).These effects appear to be less severe than thoseobserved for some viruses, such as AMV and Peanutstunt virus, where reductions in growth of T. repens canbe in the 50–94% range (Gibson et al. 1981), butcomparable with others, such asWClMV (Dudas et al.1998).This suggests that the risk posed to native non-target plant communities byV-R T. repens is likely to behighly virus-specific.
Collectively, these data show that the ClYVV sup-presses T. repens growth by ~10–40% under controlledconditions and that relative virus effects of more than-50% are rarely observed for any growth parameters.If we take tier-1 glasshouse experiments as represent-ing a ‘worst case’ scenario, the mean reduction instolon number of -67% observed in the grasslandseries (Table 1) may be the upper limit observable for
150
125
100
75
50
25
0
200
150
100
50
0
250
Sto
lon
leng
th (
mm
)
C1 C2 C3 C4 C5 C6 C7 C8 C9 C10 C11 C12 C13 C14 C15 C16 C17 C18 C19 C20
a
d
bc
cd
bc bc bc
cdcd
ab
cde bcde
ef
ab
f
def
aabc bcd bcd
a) b)
C1 C2 C3 C4 C5 C6 C7 C8 C9 C10
30
25
20
15
10
5
0
Lea
f nu
mbe
r (m
m) 30
25
20
15
10
5
0
35c) d)
cbc
aba
c cbc bc
d
a
bc
d
a
cdbc c
cd
abcab
cd
C11 C12 C13 C14 C15 C16 C17 C18 C19 C20
Fig. 6. Performance of Trifolium repens lines used in glasshouse experiments. (a) stolon length of virus-free grassland T. repenslines after 2 months of growth; (b) stolon length of virus-free woodland T. repens lines after 2 months of growth; (c) leaf numberof virus-free grassland T. repens lines after 2 months of growth; and (d) leaf number of virus-free woodland T. repens lines after2 months of growth. Means of lines sharing the same letter were not significantly different at the 0.05 confidence level.
520 R. C. GODFREE ET AL.
© 2009 CSIROdoi:10.1111/j.1442-9993.2009.01957.xJournal compilation © 2009 Ecological Society of Australia

most growth variables in tier-2 experiments involvingthis ClYVV-T. repens pathosystem (field and glass-house data are compared in the following paper).
Characteristics of the ClYVV-T. repenspathosystem
Results obtained from the inoculation and glasshousegrowth experiments indicate that ClYVV exhibitssignificant variability in both infectivity andaggressiveness. For example, infectivity of individualgrassland and woodland ClYVV isolates ranged from64% to 100%, and, at the larger scale, woodland iso-lates were less infective than grassland isolates on asso-ciated T. repens lines (81% vs. 93%). Similarly, theaggressiveness of ClYVV isolates varied from severe(>50% reduction in growth; isolates GB & GC inFig. 3a,b) to mild, with at least one woodland isolatehaving no significant impact on most growth-relatedvariables (isolate WC; Fig. 4a–c). From a virologicalstandpoint, variability in pathogenicity of ClYVV isnot surprising, as plant RNA viruses typically havehigh mutation rates (Drake & Holland 1999; García-Arenal et al. 2001), frequently exhibit recombinationor pseudorecombination (MacFarlane 1997; García-Arenal et al. 2001) and suffer population bottlenecksand genetic drift during transmission (García-Arenalet al. 2001). In the case of ClYVV, Barnett et al.(1987) demonstrated considerable variability in patho-genicity among closely related Australian isolates,while Sasaya et al. (1997) demonstrated the presenceof significant sequence heterogeneity among isolatescollected from Japan, which is consistent with theresults reported here.
Interestingly, genetic analyses generally show thatmost virus populations exhibit low genetic diversity(García-Arenal et al. 2001) with a small number ofhaplotypes often representing the majority of thevirus isolates (e.g. Keese et al. 1989; McNeil et al.1996). Previous studies suggest that AustralianClYVV isolates appear to be closely related (Barnettet al. 1987), which is consistent with our RT-PCR-based RFLP analysis of the ds cDNA fragmentamplified from the coat protein gene of ClYVV iso-lates from across the study site, where 79% of allrecorded ClYVV isolates consisted of one haplotype.Furthermore, dominant haplotypes present at thestudy site also appear to be common at larger spatialscales across SE Australia (R. Godfree, unpub. data2005). It has been convincingly argued thatpopulation-level temporal genetic stability is typicalof natural populations of plant viruses (e.g. Keeseet al. 1989; García-Arenal et al. 2001), and ClYVVappears to be no exception, with viral populationslikely dominated by a small number of widespreadprimary, stable haplotypes that express significant
variability in aggressiveness and infectivity. However,although genetic variability at the coat protein genelevel appears to be low, it is possible that sequenceanalysis of other regions of the ClYVV genome couldreveal greater levels of variability.
Some evidence also suggests that T. repens lines oftenvary strongly in terms of resistance and tolerance toClYVV infection (Barnett & Gibson 1975; Gibsonet al. 1989). However, in contrast to previous studiesin which T. repens lines expressed resistance to as muchas 100% of ClYVV inoculations (Barnett & Gibson1975), our data show that wild T. repens lines inmontane SE Australia have generally low resistance toinfection, although several lines did exhibit enhancedresistance to many ClYVV isolates (e.g. line C14, Fig.2). Once infected, however, host lines exhibited signifi-cant (but highly variable) levels of tolerance to infec-tion, with several lines suffering heavy growthreductions by all experimental virus lines. Apparenttolerance to infection by ClYVV and other viruses hasbeen observed in T. repens previously (Cope et al.1978), which supports our results.
Collectively, these data indicate that the ClYVV-T.repens system is characterized by highly infectious andaggressive viral isolates which are capable of infectingand reducing the growth of most extant T. repens lines.This agrees with theoretical considerations indicatingthat a range of biological features of the ClYVV-T.repens system should favour the development of highpathogen aggressiveness and virulence, including reli-ance of the virus on horizontal transmission by aphidvectors (Lipsitch et al. 1996) and large ClYVV popu-lation size (and hence high reproductive rates; Power1992; Roy et al. 2000). We did not explicitly testthe genetic nature of T. repens tolerance to ClYVV inour H–P arrays, but the relative weakness of viralisolate ¥ T. repens line interaction effects in mostmodels (Tables 1,2) and the largely unimodal distri-bution of ClYVV impact on T. repens growth suggestthat tolerance may be polygenic rather than a simplegene-for-gene system. This is consistent with the sig-nificant role that general combining ability plays in thegenetics of resistance of T. repens to ClYVV (Pederson& McLaughlin 1994) and with the polygenic nature ofresistance to other viruses exhibited by Trifoliumspecies (e.g. T. pratense L.; Martin et al. 1997). Overall,the evidence suggests that the ClYVV-T. repens systemis a highly co-evolved H–P system, with a complexaggressiveness-resistance/tolerance structure.
Our data do not provide empirical evidence that theClYVV-T. repens interaction is characterized by thepresence of a fitness cost associated with host expres-sion of tolerance or resistance to viral infection, as hasbeen observed in other plant–pathogen systems (Tianet al. 2003), although there was a tendency for thefastest growing host lines to be most impacted byinfection (five of six relationships were negative in
RISK ASSESSMENT OF AN AUSTRALIAN PATHOSYSTEM 521
© 2009 CSIRO doi:10.1111/j.1442-9993.2009.01957.xJournal compilation © 2009 Ecological Society of Australia

sign). On the other hand, the most infective ClYVVisolates (i.e. GA, GG, WC; Fig. 2) were also the leastaggressive (Figs 3,4), indicating that a trade-off mayexist between infectivity and aggressiveness in ClYVVpopulations. Similar results have been shown for theinteraction between the native flax Linum marginaleand an associated rust pathogen Melampsora lini(Thrall & Burdon 2003), where a trade-off betweenspore production (aggressiveness) and infectivitymediates pathogen population structure. Trade-offsare commonly assumed in theoretical models of H–Psystems (e.g. Lenski & May 1994; Alizon & van Baalen2005; Miller et al. 2005), and model results indicatethat the evolutionary and epidemiological outcomes ofH–P interactions depend explicitly on such assump-tions (Salvaudon et al. 2005). Overall, fitness costsassociated with disease resistance and the nature ofgenetic interactions between host and pathogen iso-lates are likely to be an important consideration incharacterizing the long-term environmental risks asso-ciated with H–P systems targeted by resistance genes.Our data therefore also highlight the importance ofinvestigating interactions between host and pathogensin the glasshouse or laboratory as part of a broader riskassessment strategy using a diverse range of host andpathogen genotypes (Pallett et al. 2002; Salvaudonet al. 2005).
Implications for risk assessment
Our data show that under controlled experimentalconditions ClYVV is highly infective and reduces T.repens survival, growth and morphology. Stolon densityand vegetative survival are often strongly linked topersistence and competitiveness of T. repens popula-tions (Dudas et al. 1998; Jahufer et al. 2002; Boutonet al. 2005), and so we cannot exclude the possibilitythat ClYVV may limit the size of extant T. repens popu-lations in SE Australia, especially given the fact thatClYVV infests up to 80% of T. repens populations inthis region (Godfree et al. 2004a). Therefore, we con-clude that enemy release following introduction ofV-Rgenes is a significant potential hazard in associatednon-target communities that needs to be further inves-tigated via use of second-tier field experiments con-ducted in representative at-risk plant communities.
From a practical standpoint, the significant variabil-ity in infectivity and aggressiveness of ClYVV isolates,variation in resistance and tolerance of different T.repens lines and the possible presence of pathosystemtrade-offs render it essential that multiple viral isolatesand clover lines be utilized in second-tier fieldexperiments. Furthermore, given the different fitnessimpacts of H–P combinations obtained from adjacentgrassland and woodland communities and the highvariability in growth rate and dry matter yield
exhibited by individual T. repens lines (cf. Turkington& Harper 1979), it is clear that field experimentsinvestigating the impact of ClYVV on host populationswill also need to be conducted using not onlyenvironment-specific host and pathogen genotypes butalso commercial cultivars and potential hybrid geno-types in non-target settings. Collectively, the incor-poration of genotypic and environmental variabilityinto field experiments aimed at resolving H–P dynam-ics in natural systems are likely to result in very largeand demanding experimental designs (see followingpaper). Accounting for phenotypic variability in bothhost and pathogen populations (Pallett et al. 2002)along with associated resistance/tolerance structuresand fitness costs are all likely to be vital elements of therisk assessment process for most P-R plants, especiallythose that are derived from long-term co-evolutionarypathosystems.
Finally, our results highlight two important consid-erations for interpreting the results of tier-1 glass-house experiments. First, disease effects may bedetectable in some growth variables but not others(Tables 1,2) and so failure to measure a range ofdemographically important parameters may bias therisk assessment process (Maskell et al. 1999). Indeed,many diseases target specific host organs (e.g. foliarvs. stem rusts) or specific stages in their hosts’ lifecycle (e.g. floral smuts, Thrall et al. 1993; damping-off diseases, Augspurger 1983). Furthermore, otheraspects of the H–P interaction that often influencepathogen persistence and aggressiveness (e.g. trans-mission mode, host longevity; Thrall and Burdon(2004) may also need to be considered. Second,disease effects may also vary according to experimen-tal conditions and timing of measurements (Maskellet al. 1999), even under glasshouse conditions. Thus,repeated measurements of host plants taken underboth stressed and favourable growing conditions maybe used to avoid this problem in cases where it isdifficult to target growing condition-dependentdisease effects a priori. Collectively, however, it is vir-tually certain that both glasshouse and field experi-ments conducted under realistic scenarios will benecessary to adequately quantify characteristics ofnatural pathosystems within an environmental riskframework.
ACKNOWLEDGEMENTS
We thank Paul Chu for providing PCR protocols, ACTDepartment of Territory and Municipal Services forproviding access to field sites and Dairy Australia forproviding support for this research. Paul Chu andRoger Barlow also provided valuable comments ondrafts of the manuscript.
522 R. C. GODFREE ET AL.
© 2009 CSIROdoi:10.1111/j.1442-9993.2009.01957.xJournal compilation © 2009 Ecological Society of Australia

REFERENCES
Abberton M. T. & Marshall A. H. (2005) Progress in breedingperennial clovers for temperate agriculture. J. Agric. Sci.143, 117–35.
Alizon S. & van Baalen M. (2005) Emergence of a convextrade-off between transmission and virulence. Am. Nat. 165,E155–67.
Arriaga L., Huerta E., Lira-Saade R., Moreno E. & Alarcón J.(2006) Assessing the risk of releasing transgenic Cucurbitaspp. in Mexico. Agric. Ecosyst. Environ. 112, 291–9.
Augspurger C. K. (1983) Seed dispersal of the tropical tree,Platypodium elegans, and the escape of its seedlings fromfungal pathogens. J. Ecol. 71, 759–71.
Barnett O. W. & Gibson P. B. (1975) Identification and preva-lence of white clover viruses and the resistance of Trifoliumspecies to these viruses. Crop Sci. 15, 32–7.
Barnett O. W., Randles J. W. & Burrows P. M. (1987) Relation-ships among Australian and North American Isolates of thebean yellow mosaic potyvirus subgroup. Phytopathology 77,791–9.
Bartsch D., Brand U., Morak C., Pohl-Orf M., Schuphan I. &Ellstrand N. C. (2001) Biosafety of hybrids between trans-genic virus-resistant sugar beet and swiss chard. Ecol. Appl.2001, 142–7.
Bendel M., Kienast F., Rigling D. & Bugmann H. (2006) Impactof root-rot pathogens on forest succession in unmanagedPinus mugo stands in the Central Alps. Can. J. For. Res. 36,2666–74.
Bouton J. H., Woodfield D. R., Hoveland C. S., McCann M. A.& Caradus J. R. (2005) Enhanced survival and animal per-formance from ecotype derived white clover cultivars. CropSci. 45, 1596–602.
Clay K. (1984) The effect of the fungus Atkinsonia hypoxylon(Clavicipitaceae) on the reproductive system and demogra-phy of the grass Danthonia spicata. New Phytol. 98, 165–75.
Cope W. A., Walker S. K. & Lucas L. T. (1978) Evaluation ofselected white clover clones for resistance to viruses in thefield. Plant Dis. Rep. 62, 267–70.
Davelos A. L. & Jarosz A. M. (2004) Demography of Americanchestnut populations: effects of a pathogen and ahyperparasite. J. Ecol. 92, 675–85.
Dickman A. (1992) Plant pathogens and long-term ecosystemchanges. In: The Fungal Community: Its Organisation and Rolein the Ecosystem (eds G. C. Carroll & D. T. Wicklow)pp. 499–520. Marcel Dekker, New York.
Dobson A. & Crawley M. (1994) Pathogens and the structure ofplant communities. Trends Ecol. Evol. 9, 393–8.
Drake J. W. & Holland J. J. (1999) Mutation rates among RNAviruses. Proc. Natl. Acad. Sci. USA 90, 4171–5.
Dudas B., Woodfield D. R., Tong P. M. et al. (1998) Estimatingthe agronomic impact of white clover mosaic virus on whiteclover performance in the North Island of New Zealand. N.Z. J. Agric. Res. 41, 171–8.
García-Arenal F., Frail A. & Malpica J. M. (2001) Variability andgenetic structure of plant virus populations. Annu. Rev.Phytopathol. 39, 157–86.
Gibson P. B., Barnett O.W., Skipper H. D. & McLaughlin M. R.(1981) Effects of three viruses on growth of white clover.Plant Dis. 65, 50–1.
Gibson P. B., Barnett O.W., Burrows P. M. & King F. D. (1982)Filtered-air enclosures exclude vectors and enable measure-ment of effects of viruses on white clover in the field. PlantDis. 66, 142–4.
Gibson P. B., Barnett G. A., Pederson G. A. et al. (1989) Regis-tration of southern regional virus resistant white clovergermplasm. Crop Sci. 29, 241–2.
Godfree R. C., Chu P.W. G. & Woods M. J. (2004a) White clover(Trifolium repens) and associated viruses in the subalpineregion of south-eastern Australia: implications for GMOrisk assessment. Aust. J. Bot. 52, 321–31.
Godfree R. C., Young A. G., Lonsdale W. M., Woods M. J. &Burdon J. J. (2004b) Ecological risk assessment of trans-genic pasture plants: a community modelling approach.Ecol. Lett. 7, 1077–89.
Godfree R. C., Vivian L. M. & Lepschi B. J. (2006) Risk assess-ment of transgenic virus-resistant white clover: non-targetplant community characterisation and implications for fieldtrial design. Biol. Invasions 8, 1159–78.
Hails R. S. (2000) Genetically modified plants – the debatecontinues. Trends Ecol. Evol. 15, 14–8.
Hollings M. & Nariani T. K. (1965) Some properties of cloveryellow vein, a virus from Trifolium repens L. Ann. Appl. Biol.56, 99–109.
Holm L. G., Pancho J. V., Herberger J. P. & Plucknett D. L.(1991) A Geographical Atlas ofWorldWeeds. Krieger Publish-ing, Malabar.
Jahufer M. Z. Z., Cooper M., Ayres J. F. & Bray R. A. (2002)Identification of research strategies for white clover in Aus-tralia – a review. Aust. J. Agric. Res. 53, 239–57.
Jarosz A. M. & Burdon J. J. (1992) Host-pathogen interactions innatural populations of Linum marginale and Melampsora lini.III. Influence of pathogen dynamics on host survivorshipand flower production. Oecologia 89, 52–61.
Jauhar P. P. (2006) Modern biotechnology as an integral supple-ment to conventional plant breeding: the prospects andchallenges. Crop Sci. 46, 1841–59.
Kalla R., Chu P. & Spangenberg G. (2001) Molecular breedingof forage legumes for virus resistance. In: Molecular Breedingof Forage Crops (ed. G. Spangenberg) pp. 219–37. KluwerAcademic Publishers, Dordrecht.
Keese P., Mackenzie A. & Gibbs A. J. (1989) Nucleotidesequence of the genome of an Australian isolate of turnipyellow mosaic tymovirus. Virology 172, 536–46.
Kelley S. E. (1994) Viral pathogens and the advantage of sex inthe perennial grass Anthoxanthum odoratum. Philos. Trans.R. Soc. London B 346, 295–302.
Kirkpatrick J. B., McDougall K. & Hyde M. (1995) Australia’sMost Threatened Ecosystem:The Southeastern Lowland NativeGrasslands. Surrey Beatty and Sons, Chipping Norton,NSW.
Kreitlow K.W. & Hunt O. J. (1958) Effect of Alfalfa mosaic andBean yellow mosaic viruses on flowering and seed produc-tion of Ladino white clover. Phytopathology 48, 320–1.
Kreitlow K.W., Hunt O. J. & Wilkins H. L. (1957) The effect ofvirus infection on yield and chemical composition of Ladinoclover. Phytopathology 47, 390–4.
Lenski R. E. & May R. M. (1994) The evolution of virulence inparasites and pathogens: reconciliation between two com-peting hypotheses. J.Theor. Biol. 169, 253–65.
Lipsitch M., Siller S. & Nowak M. A. (1996) The evolution ofvirulence in pathogens with vertical and horizontaltransmission. Evolution 50, 1729–41.
Lonsdale W. M. (1994) Inviting trouble: introduced pasturespecies in northern Australia. Aust. J. Ecol. 19, 345–54.
MacFarlane S. (1997) Natural recombination among plant virusgenomes: evidence from tobraviruses. Semin.Virol. 8, 25–31.
McNeil J. E., French R., Hein G. L., Baezinger P. S. & EskridgeK. M. (1996) Characterisation of genetic variability among
RISK ASSESSMENT OF AN AUSTRALIAN PATHOSYSTEM 523
© 2009 CSIRO doi:10.1111/j.1442-9993.2009.01957.xJournal compilation © 2009 Ecological Society of Australia
natural populations of wheat streak mosaic virus. Phytopa-thology 86, 1222–7.
Martin P. H., Coulman B. E. & Peterson J. F. (1997) Genetics ofresistance to alfalfa mosaic virus in red clover. Can. J. PlantSci. 77, 601–5.
Maskell L. C., Raybould A. F., Cooper J. I., Edwards M.-L. &Gray A. J. (1999) Effects of turnip mosaic virus and turnipyellow mosaic virus on the survival, growth and reproduc-tion of wild cabbage (Brassica oleracea). Ann.Appl. Biol. 135,401–7.
Miller M. R., White A. & Boots M. (2005) The evolution of hostresistance: tolerance and control as distinct strategies. J.Theor. Biol. 236, 198–207.
Mitchell C. E. & Power A. G. (2003) Release of invasive plantsfrom fungal and viral pathogens. Nature 421, 625–7.
Norton M. R. & Johnstone G. R. (1998) Occurrence of alfalfamosaic, clover yellow vein, subterranean clover red leaf andwhite clover mosaic viruses in white clover throughoutAustralia. Aust. J. Agric. Res. 49, 723–8.
Pallett D.W., Thurston M. I., Cortina-Borja M. et al. (2002) Theincidence of viruses in wild Brassica rapa ssp. sylvestris insouthern England. Ann. Appl. Biol. 141, 163–70.
Pederson G. A. & McLaughlin M. R. (1994) Genetics of resis-tance to peanut stunt, clover yellow vein, and alfalfa mosaicviruses in white clover. Crop Science 34, 896–900.
Power A. G. (1992) Patterns of virulence and benevolence ininsect-borne pathogens of plants. Crit. Rev. Plant Sci. 1,351–72.
Rosskopf E. N., Charudattan R. & Kadir J. B. (1999) Biologicalcontrol of weeds with plant pathogens. In: Handbook ofBiological Control (eds T. Bellows & T. Fisher) pp. 891–918.Academic Press, San Diego.
Roy B. A., Kirchner J. W., Christian C. E. & Rose L. E. (2000)High disease incidence and apparent disease tolerance in aNorth American Great Basin plant community. Evol. Ecol.14, 421–38.
Salvaudon L., Héraudet V. & Shykoff J. A. (2005) Parasite-hostfitness trade-offs change with parasite identity: interactionsin a plant-pathogen system. Evolution 59, 2518–24.
Sasaya T., Shimizu T., Nozu Y., Nishiguchi M., Inouye N. &Koganezawa H. (1997) Biological, serological and molecu-lar variabilities of clover yellow vein virus. Phytopathology 87,1014–9.
Snow A. A., Andow D. A., Gepts P. et al. (2005) Geneticallymodified organisms and the environment: current status andrecommendations. Ecol. Appl. 15, 377–404.
Sokal R. R. & Rohlf F. J. (1981) Biometry. W. H. Freeman andCompany, New York.
Tepfer M. (2002) Risk assessment of virus-resistant transgenicplants. Annu. Rev. Phytopathol. 40, 467–91.
Thrall P. H. & Burdon J. J. (2003) Evolution of virulence in aplant host-pathogen metapopulation. Science 299, 1735–7.
Thrall P. H. & Burdon J. J. (2004) Host-pathogen life-historyinteractions affect the success of biological control. WeedTechnol. 18, S1269–S1274.
Thrall P. H., Biere A. & Antonovics J. (1993) Plant life-historyand disease susceptibility: the occurrence of Ustilago viola-cea on different species within the Caryophyllaceae. J. Ecol.81, 489–98.
Thrall P. H., Hochberg M. E., Burdon J. J. & Bever J. (2007)Coevolution of symbiotic mutualists and parasites in a com-munity context. Trends Ecol. Evol. 22, 120–6.
Tian D., Traw M. B., Chen J. Q., Kreitman M. & Bergelson J.(2003) Fitness costs of R-gene-mediated resistance in Ara-bidopsis thaliana. Nature 423, 74–7.
Turkington R. & Harper J. L. (1979) The growth, distributionand neighbour relationships of Trifolium repens in permanentpasture. IV. Fine-scale biotic differentiation. J.Ecol. 67, 245–54.
Wilkinson M. J., Sweet J. & Poppy G. M. (2003) Risk assessmentof GM plants: avoiding gridlock? Trends Plant Sci. 8, 208–12.
Yahara T. & Oyama K. (1993) Effects of virus infection ondemographic traits of an agamospermous population ofEupatorium chinense (Asteraceae). Oecologia 96, 310–5.
524 R. C. GODFREE ET AL.
© 2009 CSIROdoi:10.1111/j.1442-9993.2009.01957.xJournal compilation © 2009 Ecological Society of Australia
Copyright © 2022 FDOKUMEN