Which newborn infants are too expensive to treat? Camosy and rationing in intensive care
Do Firm-Bank ‘Odd Couples’Exacerbate Credit
Rationing?∗
Giovanni Ferria, Pierluigi Murroa†
aLUMSA University, Department of Economic and Political Sciences
Abstract
This paper tests the impact of an imperfect firm-bank type match on firms’
financial constraints using a dataset of about 4,500 Italian manufacturing firms.
Considering an optimal match of opaque (transparent) borrowing firms with rela-
tional (transactional) lending main banks, the possibility arises of firm-bank "odd
couples" where opaque firms end up matched with transactional main banks. We
show that the probability of credit rationing increases when the mismatch be-
tween firms and banks widens. Our conjecture is that "odd couples" emerge
either because of organizational changes in the credit market or since firms ob-
serve only imperfectly banks’lending technology.
JEL Codes: G21, D82, G30
Keywords: Bank-Firm Relationships, Asymmetric Information, Credit Ra-
tioning.
∗We are particularly indebted to the Editor and two anonymous referees for important insight. Wethank Paola Bongini and Andrea Presbitero for letting us use the data on, respectively, bank M&Asand functional distance. We also thank Giuseppe Coco, Hans Degryse, Xavier Freixas, Steven Ongena,Rajdeep Sengupta, Emanuele Tarantino and Valerio Vacca, and seminar and conference participantsat Barcelona Banking Summer School, Financial Intermediation Research Society (Minneapolis), MBFInternational Conference (Rome), University of Ancona, University of Bari and LUISS University. Allremaining errors are ours.†Corresponding author. Phone: +39 0685225724; Address: LUMSA University, Department of
Economic and Political Sciences, Via Pompeo Magno 22, 00192 Roma, Italy. E-mail addresses:[email protected] (G. Ferri), [email protected] (P. Murro)
1
1 Introduction
In the past decades, the banking system of many industrial countries experienced pro-
found structural change due to both consolidation and a significant advance in informa-
tion processing and communication technology (ICT). The empirical banking literature
finds that banking consolidation and ICT advances reduce credit availability, especially
for small and medium-sized firms (SMEs; Sapienza, 2002; Degryse and Ongena, 2005;
Berger and Frame, 2007). One channel through which these changes may curtail the
credit supply is by weakening firm-bank relationships. Organizational change, loan offi -
cer turnover and branch downsizing may impair knowledge accumulated within banks,
changing the nature of bank—firm relationships (Bonaccorsi di Patti and Gobbi, 2007).
This paper posits that an imperfect firm-type/bank-type match could result in more
severe financial constraints for borrowing firms. If the business technology employed
by the bank turns out to be inappropriate to the needs of the borrower, then the
asymmetries of information might be amplified by that imperfect match. Organiza-
tional changes could induce the bank to change business focus (Bonaccorsi di Patti
and Gobbi, 2007). The literature (Rajan, 1992; Elyasani and Goldberg, 2004) high-
lights two specific lending technologies for SMEs: the transaction lending technology
—typically based (only) on "hard" information (e.g. borrowers’balance sheets and/or
collateral guarantees) — vs. the relationship lending technology — based instead on
"soft" information (obtained via personal interaction and diffi cult to codify). This
suggests that the transaction lending technology is more desirable for informationally
transparent firms, while the relationship lending technology is more appropriate for
2
opaque firms (suffering more intense asymmetries of information). Moreover, large
banks are believed to have comparative advantages in hard technologies because of
economies of scale in the processing and transmission of hard information. By con-
trast, these large organizations may be disadvantaged in processing and transmitting
soft information through their communication channels (Stein, 2002; Berger and Black,
2011).
To our knowledge, until now, no researcher has investigated the causes and the
consequences of an imperfect match, i.e. a situation in which the information charac-
teristics of the firms and the lending technology of its bank are not aligned. In a perfect
capital market, events that create a mismatch would be immaterial, since it could be
immediately unwound. However, transaction and information costs could make it dif-
ficult to change the banking partner, and the firm might end stuck (for a while) with
the "wrong" bank, thereby possibly suffering more credit rationing than would have
resulted from a perfect match.
Aiming to help fill this gap, we shed light on whether an imperfect match raises
the probability that firms will suffer credit rationing. We identify an imperfect match
as a situation in which the ex ante lending technology criteria picked by the firm to
select its main bank are not satisfied ex post by the chosen bank. To address this issue,
we use 2006 data from the Tenth Survey of Italian Manufacturing Enterprises run by
UniCredit Group, an ideal testing ground for three reasons. First, this wave of the
survey introduced new questions on the lending technology criteria each firm selected
ex ante for its main bank and also whether the firm found out ex post that, indeed, the
3
selected bank practices those expected lending technologies. Second, small business
size and central role of banks as external finance providers make Italy an ideal setting
to study firm-main bank relationships. Third, the survey reports a direct measure of
credit rationing (if the firm demanded more credit than it received) and detailed data
on firm features, allowing us to control for other determinants of credit rationing, such
as productivity, size, age, capital intensity, and cash flow.
Controlling for firm attributes that may affect credit rationing, we estimate that the
probability of rationing rises with the intensity of the mismatch with the main bank.
The marginal contribution of mismatch to the likelihood of rationing drops as the
intensity of mismatch grows. Credit rationing seems especially sensitive to mismatch
for firms in traditional industries and in those without scale economies. We then study
the mechanisms through which a mismatch affects credit rationing. According to the
theoretical literature, when a bank interacts with an opaque firm using transactional
technologies, it could have too little information on the firm. Actually, controlling
for firm, bank and surrounding socio-economic features, mismatch heightens credit
rationing less for the firms with audited financial statements. Also, the coeffi cient of
mismatch is larger for younger businesses, and raises the probability of rationing only
when the length of the credit relationship with the main bank is suffi ciently large. Thus,
organizational changes could affect firm-bank relationships and then the probability of
rationing. This hypothesis is corroborated considering the characteristics of the main
bank. Mismatch has a larger impact on credit rationing at banks with loan offi cer
turnover. Finally, our result holds regardless of whether the bank is local or national.
4
The above results are robust to different estimation methods. In particular, because
mismatch might be endogenous we instrument it employing also banks’ functional
distance and the number of M&As in local banking markets. The IV results confirm
that mismatch raises credit rationing.
The paper is organized as follows. Section 2 discusses the literature on the ways that
SMEs obtain external finance and on credit rationing as well as the determinants and
effects of mismatch. Section 3 describes our data, the methods used to construct our
variables, as well as our econometric strategy. In Sections 4 and 5, we show our main
results. Section 6 presents additional tests on the endogeneity of mismatch. Section 7
concludes the paper.
2 Survey of the Literature and Theoretical Predic-
tions
Credit rationing has been the focus of much theoretical and empirical research. Jaf-
fee and Stiglitz (1989) underlines that credit markets differ from standard markets
in that the latter involve a number of agents that are buying or selling a homoge-
nous commodity. In contrast, credit received today by a borrower is exchanged for a
"promise" of repayment in the future. But a specific borrower’s "promise" is not as
good as that by another borrower and there may be no objective way to determine
the likelihood that the "promise" will be kept. Moral hazard and adverse selection
affect the likelihood of loan repayment whence asymmetric information and incentive
5
(principal-agent) problems may lead credit rationing to persist in equilibrium (Jaffee
and Russell, 1976; Stiglitz and Weiss, 1981). Banks, through adequate screening and
monitoring procedures, can overcome asymmetric information and incentive problems
and reduce firms’credit constraints (Diamond, 1984; Rajan, 1992; Bhattacharya and
Thakor, 1993). Thus, (the production and use of) information is crucial for avoiding
credit rationing.
The extent to which a bank succeeds in overcoming this information asymmetry
and in providing the appropriate incentive for borrowers to avoid opportunistic be-
havior depends on its lending technology. The literature on bank lending generally
distinguishes two ways in which SMEs are financed based on the type of information
exchanged between the firm and the bank. A transaction lending technology refers
to a firm-bank relation in which the bank obtains from the borrowing firm "hard"
information that is quantitative and easily transferable. Alternatively, a relationship
lending technology hinges on "soft" information, which is qualitative information nor-
mally obtained via long-term informal interaction and is, therefore, much more diffi cult
to transfer (Berger and Udell, 2006). These two lending technologies correspond to the
two types of credit contracts banks typically offer to their corporate customers: loans
characterized by inside information vs. arm’s-length debt for which banks compete on
a much more equal informational footing (Broecker, 1990; Inderst and Mueller, 2006;
Hauswald and Marquez, 2006).
Both the theoretical and empirical literatures have mainly focused on the character-
istics and advantages/disadvantages of relationship lending. Such lending is considered
6
most appropriate for firms with significant information asymmetries, as a tighter firm-
bank rapport helps overcome those asymmetries, bettering the effi ciency of banks’
loan allocation. Boot (2000) defines relationship lending as "the provision of finan-
cial services by a financial intermediary that: i. invests in obtaining customer-specific
information, often proprietary in nature; and ii. evaluates the profitability of these
investments through multiple interactions with the same customer over time and/or
across products". The definition turns on two key aspects: eliciting the release of
proprietary information from the client to the bank and the presence of multiple inter-
actions between the two.
Some theoretical papers have modeled this firm-bank relationship. Rajan (1992)
stresses the widely-recognized advantages of bank financing. Due to banks’ ability
to reduce adverse selection problems (owing to better information) and to lower moral
hazard (by controlling borrowing firms investment decisions), banks can offer the SMEs
"informed" external funds that will be cheaper than "less informed" funds obtained
from transactional lenders. Diamond (1991) highlights that the firm-bank relationship
by itself can mitigate moral hazard by firms, since the reputation cumulated through
a good past track record dampens the risk of adverse selection. But, the rose of
relationship lending also has its thorns, and some authors stress its costs (e.g. Sharpe,
1990; Rajan, 1992; Weinstein and Yafeh, 1998). Indeed, due to its informational
advantage, the bank might extract surplus from borrowing firms in the form of higher
future loan rates. Consequently, some firms may prefer a transactional financier in
order to avoid being locked-in to a long-term relationship.
7
Empirical research has tried to test these theoretical implications. In particular,
many papers have analyzed —in various countries —the impact relationship lending has
on SME financing. For the US, Petersen and Rajan (1994) find that firms obtaining
loans from fewer banks enjoy easier access to credit and pay lower borrowing rates, while
longer firm-bank relationships raise availability of finance. Berger and Udell (1995)
show that longer firm-bank relationships lower the cost of credit and the requirements
of collateral guarantees. Using data for Italy, Angelini et al. (1998) find that the
intensity of relationship lending reduces the probability that borrowing firms will be
rationed, even though the loan rates charged by the banks tend to rise as the firm-bank
relationship lengthens. For Belgian firms, Degryse and Van Cayseele (2000) detect a
dual impact: borrowing rates increase as firm-bank relationships lengthen, while the
rates lessen when the scope of the relationship, defined as the purchase of additional
information intensive, non-loan services, intensifies.
Instead, there has been little research on the determinants and features of trans-
action lending. Often, this label refers to any loan based on information that is easily
verifiable by the public, as it is typical of the largest, most transparent firms. On
one hand, institutional frictions may make it diffi cult for loan offi cers to communicate
soft information within large banks without significantly diluting its content (Stein,
2002; Liberti and Mian, 2009). Thus, large banks’organizational hierarchy may build
a disadvantage in lending to opaque SMEs.1 Instead, small banks appear to have a
comparative advantage in relationship lending (Berger and Black, 2011).
1See, e.g., Berger et al. (2005), Boot (2000), Ongena and Smith (2000), and Elyasiani and Goldberg(2004).
8
At the same time, it is useful to distinguish the firms based on the intensity of their
information opaqueness, possibly separating (relatively transparent) large-sized firms
from (relatively opaque) SMEs. The latter can suffer more intense credit rationing
because of being more opaque (Berger and Udell, 2006; Beck et al., 2008). Firms’
opaqueness depends also on whether their statements are audited and/or they offer
real assets as collateral guarantees on the loans they obtain (Berger and Frame, 2007;
Klapper, 2006). Thus, the existence of an optimal firm type/bank type match is often
posited, where the "optimal couples" are opaque firms/relationship banks and trans-
parent firms/transactional banks. The chosen mode of firm-bank interaction should
therefore affect lending (and so the likelihood of credit rationing) through the nature
of the disclosed information, public vs. private and "hard" vs. "soft", and the lender’s
ability to benefit from it (Petersen, 2004).
In turn, Berger and Udell (2006) criticize this over-simplification, stressing that
many large banks lend to opaque SMEs via differing transaction technologies. In those
occasions, large banks often use other "hard" collateral-based information to assess the
firm credit risk.2 In line with that, de la Torre et al. (2010) show that SME lending
is becoming strategic for most banks, including large and foreign banks, increasingly
employing different transaction technologies. Also Berger and Udell’s intuition that
banks may use various lending technologies together in SME financing received empir-
ical support for both Japan (Uchida et al., 2006) and Italy (Murro, 2010). However,
this raises two questions. Is there a “primary”one among the technologies a bank uses
2E.g., large banks can assess: the assets pledged as collateral by highly asset-based firms; thequality of the loans purchased by factoring companies; the fixed assets owned by leasing companies.
9
concurrently to lend to SMEs? And, if so, is credit rationing lowered when the primary
technology is relationship lending? Bartoli et al. (2013) show that when the primary
technology is relationship lending, even if coupled with transaction technologies, more
soft information is produced and SME rationing is lessened.
We posit that banks and firms may become mismatched due to two chief causes.
First, in recent years, the organization of local credit markets has changed considerably
as a result of technological innovation, and especially following the many M&As among
banks. Figure 1 shows that the use of credit scoring by Italian banks over 2000-2006
increased from 10% to 88% of total banks, reaching 66% also for the small banks and
42% for the tiny mutual cooperative banks. In unison consolidation of the banking
system has raised banks’average size, modifying the organizational model of the lending
process and often centralizing decision-making powers (Bonaccorsi di Patti and Gobbi,
2007). Figure 2 shows that the number of bank M&As ranged between 10 and 60
for each macro-area of Italy, involving on average close to 26% of the extant banks.
These phenomena may explain why firms with longer banking relationships might find
themselves mismatched.
Second, "odd couples" could be due to the presence of double-sided information
asymmetry. As in the previous literature, a bank doesn’t know exactly the type of
borrowing applicant. However, in addition, the firm may know only imperfectly which
bank type it is selecting. In other words, it could be diffi cult for a firm to tell apart
relationship from transactional lenders if this intrinsic feature depends on internal
10
organization/technology choices that are hardly visible to outsiders.3
Odd couples are ineffi cient contractual arrangements that should raise credit ra-
tioning for opaque firms. Relationship lending applications impose costs on firms in
terms not only of time and effort but also of informational capture (Rajan, 1992) and
spillover from revealing privileged information4 (Bhattacharya and Chiesa, 1995). In
addition, lenders follow up on such intelligence by verifying and interpreting it, which
amounts to costly information certification. Hence, one can view the decision to dis-
close confidential information via relationship lending as the attempt by borrowers to
provide a certified signal of creditworthiness (Okuno-Fujiwara et al., 1990; Shavell,
1994).
But, if the bank is unable (or unwilling) to verify this information, the firm may be
rationed. By contrast, a transparent firm matching with a relationship bank shouldn’t
lead to rationing, but raises costs because the bank is using an ineffi cient screen-
ing/monitoring technology for this firm. In this case the bank may just have redundant
information. For these reasons, in our empirical analyses we expect that the probability
that the mismatch leads to rationing should increase in the difference between a firm’s
opaqueness and its bank’s transactional lending technology, if positive. On the con-
trary, the probability of rationing should not increase if the difference is negative (i.e.,
3Moreover, if the objective of the bank is to maximize the number of "good" firms in their borrowingpool and the bank is unable to perfectly identify ex-ante the quality of the new firms applying forcredit, it may have an incentive not to disclose its type so as to maximize its number of customers.Only later on, will the bank try to discriminate among the various customers by means of its lendingtechnology.
4Herrera and Minetti (2007) suggest that a bank’s information can affect the expected return ofnew investment. For example, when a firm engages in an R&D race for patentable innovations, thebank can disclose information to the firm’s rivals and so erode the value of innovations.
11
a relatively transparent firm having a bank with a relationship lending technology).
Finally, we can ask why rationing persists. Time can have two effects on the impact
of a bad match on rationing. If the capital market were perfect, the odd firm-bank
couples would have no consequence. When a firm realizes it has engaged with a "wrong"
type bank it could migrate to a proper bank. In contrast, credit markets are imperfect
because of switching costs due to the new bank being uncertain whether the firm was
rejected for a loan renewal by its original bank and/or to the existence of fixed initial
screening costs (Barone et al., 2011; Boot, 2000). Thus, more often than not the firm
will be stuck with the “wrong”bank, continuing to suffer heightened rationing.
3 Data and Empirical Strategy
3.1 The Empirical Model and Data Description
In our empirical analysis, we test whether an "odd couple" affects the probability that
the firm will suffer credit rationing. Consider the following empirical model. Denote
ydi as firm i’s desired amount of credit and yai as the actual amount of credit given
to firm i, the firm is rationed any time y∗i =(ydi − yai
)> 0. Thus, we can model the
probability of rationing as:
yi =
1 if y∗i > 0
0 otherwise
(1)
y∗i = axi + zid+ ui, (2)
12
with i = 1; . . . ;n and where yi is our measure of credit rationing for firm i, xi is a
proxy of the difference between firm i’s opaqueness and its bank’s transactional lending
technology, zi is a vector of control variables, and ui is the residual. We estimate the
model by maximum likelihood probit regressions.
Our main data source is the Tenth Survey on Italian Manufacturing Firms (SIMF),
run by the UniCredit banking group for 2006. Every three years this survey gathers
data on a sample of Italian manufacturing firms having more than 10 employees. The
2006 wave consists of 5,137 firms. All the firms with more than 500 employees are
included, while those having 11 to 500 employees are sampled according to a stratified
selection procedure based on their size, sector, and geographic localization. The main
strength of this database is its very detailed data on individual firms.5 The 2006
wave featured information on the firm’s: a) ownership structure; b) number and skill
degree of employees; c) attitude to invest in R&D and whether it has made innovations;
d) extent of internationalization and export; e) quality of financial management and
relationships with banks. The data covers a three year span: 2004 to 2006. The firms
in the sample are approximately 9% of the reference universe in terms of employees
and 10% in terms of value added. Thanks to its stratification, the sample is highly
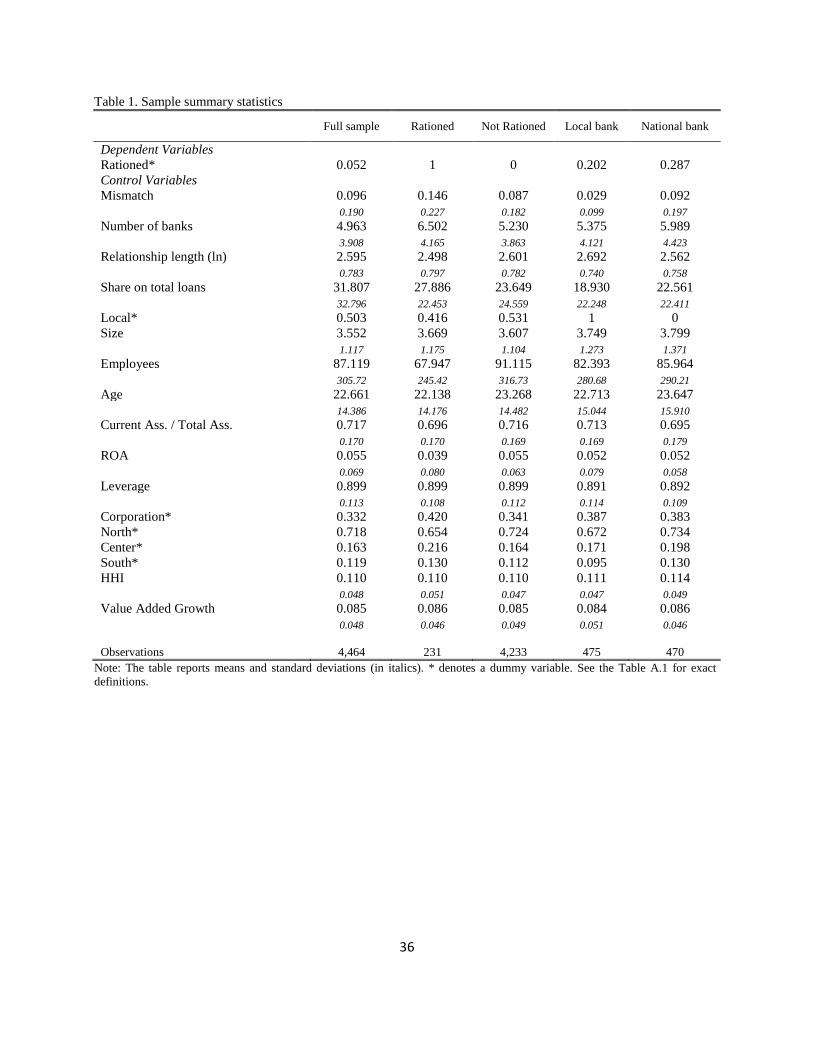
representative of Italy’s manufacturing. Table 1 displays summary statistics. The
surveyed firms have been in business on average 22 years; 60% of them have fewer
than 50 employees (less than 4% have more than 500 employees); 71% are based in
5Firms self-report their data which may raise concerns about reliability. We do not believe thatthis is a problem. First, firms should have no incentive to lie about their performance in order toestablish a record as appealing borrowers, because the Italian law on the treatment of personal data(675/1996) forbids using them for objectives other than compiling statistical tables. Second, firms’responses went through multiple checks by highly qualified personnel.
13

the North. Only 1% are listed on the Stock Exchange, while 37% have balance sheets
certified by external auditors. As to sector specialization, almost half of the firms
belong to traditional sectors, according to Pavitt’s taxonomy (Pavitt, 1984), while
only 5% are in the high tech sectors.
Regarding their banking relationships, the average length of the relationship with
the main bank is 17 years; 48% of the firms have a national bank as their main banking
partner, 10% entrust a banca popolare (larger-sized cooperative banks), 7% team up
with a savings bank, 5% entrust a banca di credito cooperativo (smaller-sized mutual
cooperative banks), while 28% of the firms have another type of bank as their main
bank. Finally, there is extensive multiple banking: on average firms have five banks
and the share of loans obtained from the main bank is 32% of total bank loans received.
Particularly relevant for our analysis, the 2006 survey featured a new set of ques-
tions expressly tailored to investigate the relationship between the firm and its main
bank.6 We will focus on two questions where the firm was asked to state which of the
characteristics, choosing from a given list, were important in the firm’s selection of its
main bank, as well as stating which characteristics, in the firm’s view, best describe
the way its main bank grants credit. Since it required dedication, only one third of the
total number of surveyed firms (exactly 1,541 firms) answered this section of the sur-
vey. We cannot rule out self-selection: it is possible that a firm’s choice to answer this
part of the questionnaire was not random. However, we think that self-selection would
bias the results only if it were systematically related to one or more of the explanatory
6Questions were partly inspired by an analogous SME financing survey run in Japan by the ResearchInstitute of Economy, Trade, and Industry (Uchida et al., 2012).
14
variables.7
We also use data from other sources (see Table A.1 for details on the variables), in-
cluding Bank of Italy data on the presence of banks in local markets and data provided
by the Italian National Statistics Offi ce (ISTAT) on the value added and population
of the provinces.
3.2 Credit Rationing
An agent is said to be rationed if she demands more credit than she can obtain on
the market, at the going lending rate as appropriate to her risk class. The extent of
credit rationing might be measured as the (positive) gap between the marginal return
of the firm on its capital investment and the going market lending rate applicable to
that firm. We employ a direct measure of credit rationing.8 This method directly asks
borrowers whether they would have liked to borrow more at the prevailing loan rate. If
so, respondents are classified as credit constrained. The same applies to non-borrowers
who respond that they could not get credit although they liked to. In particular, our
measure of credit rationing is based on firms’responses to the question "In 2006, would
your firm have liked to obtain more credit at the market interest rate?". We build a
dummy variable taking value one if the firm replies yes, and zero otherwise.9 As shown
7The firms that answered these questions are slightly larger than the sample mean, while they aresimilar to the other firms regarding further characteristics, such as main bank type, industry or age.
8The methodology of direct measurement of rationing has been extensively used in the literature.For example, Guiso (1998) uses it to verify whether access to credit is more diffi cult for high-techfirms than for those undertaking traditional investment projects. Minetti and Zhu (2011), using thesame survey (and methodology) employed in this paper, estimated the impact of credit rationing onItalian firms’export.
9In the case of positive answers, two additional questions are asked: "In 2006, did the firm demandmore credit than it actually obtained?" and "To obtain more credit, were you willing to pay a higher
15
in Table 1, based on our measure, 5.2% of firms are rationed. In addition, rationed
firms tend to be younger and smaller (with fewer employees) than non-rationed ones.
Finally, firms in Northern provinces are less likely rationed. These figures are in the
range of those found by papers on rationing of households and SMEs in Italy. Using
data from the Bank of Italy, Guiso et al. (2004) find that in 1989—1998 about 1%
of Italian households were turned down when they applied for credit while 2% were
discouraged from borrowing. Their measure of rationing combines these two groups
of households. For firms, Albareto and Finaldi Russo (2012), using the Survey of
Industrial and Service Firms, find that about 4% of firms were denied credit during
the 2004-2006 period. They also estimate that this figure rises for firms in the South
of Italy and for firms with fewer than 50 employees.
3.3 “Odd Couples”
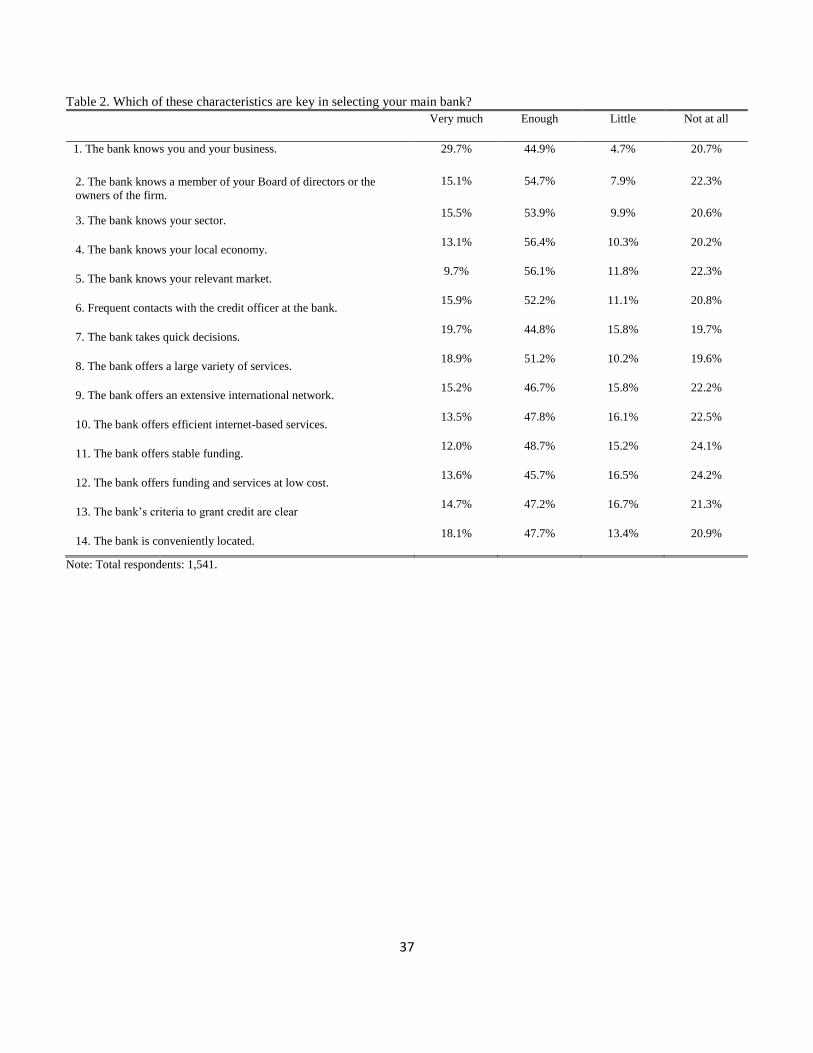
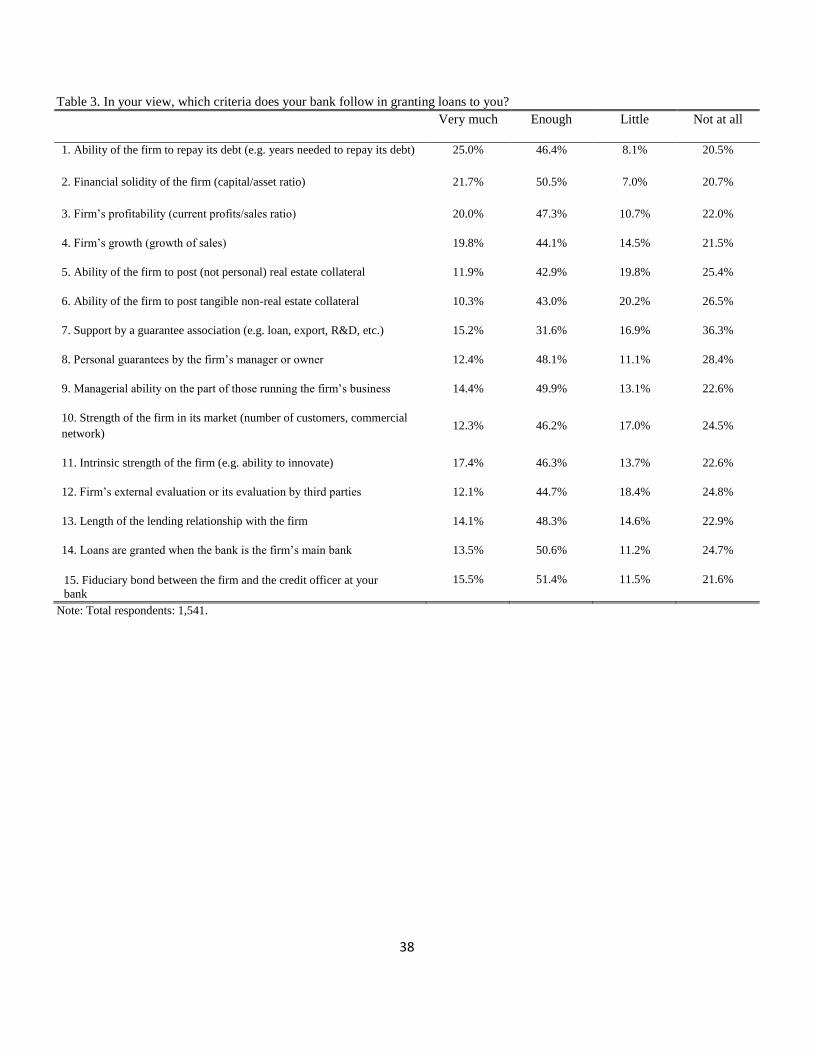
Tables 2 and 3 report, respectively, firms’answers to the question “Which of these char-
acteristics are key in selecting your main bank?”(bank type sought ex ante) and to the
question “In your view, which criteria does your bank follow in granting loans to you?”
(bank type got ex post). Our measure of mismatch uses the weights (in descending
order, from 1, very much, to 4, nil) a firm gave to each listed characteristic/criterion.
From the answers to the first (second) question we construct an index of the relation-
ship intensity sought for ex ante by the firm (of the relationship intensity found ex
interest rate?". Using the answers to these questions we perform some robustness checks of our results.In practice, we build a new dummy variable equal to one when the firm has answered yes to at least oneof the two additional rationing questions, zero otherwise. Alas this variable has only few observations.This endangers our control (results are available upon request).
16
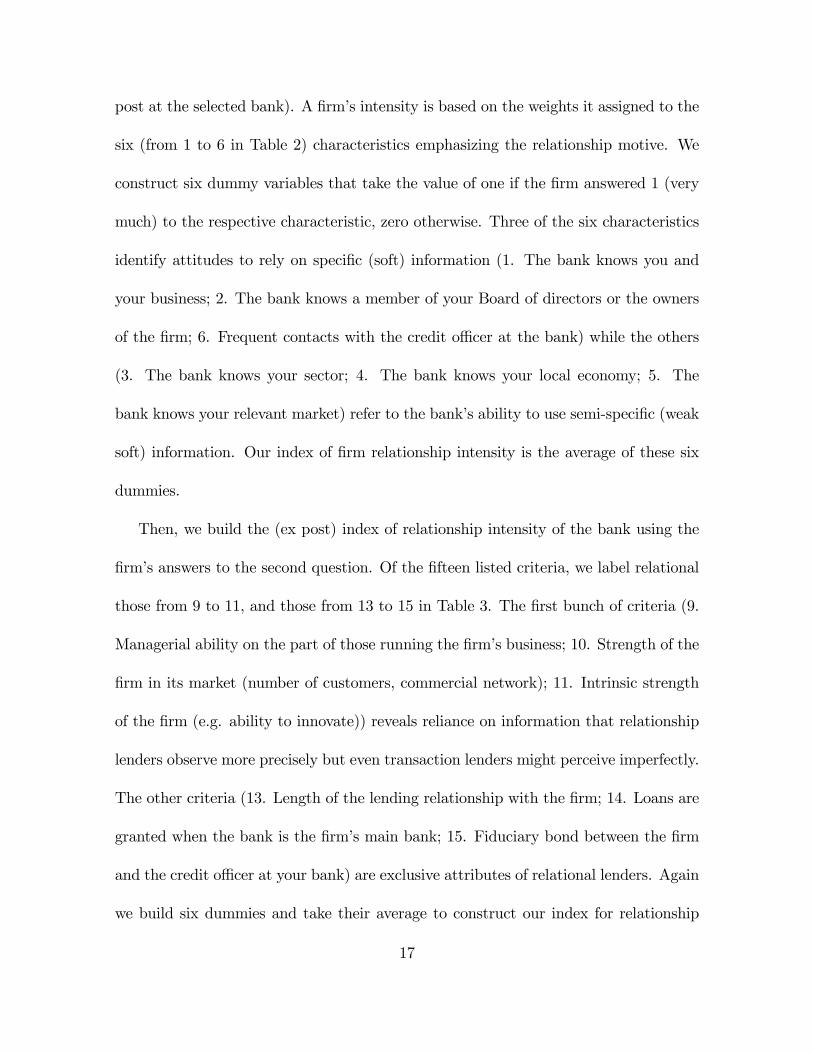
post at the selected bank). A firm’s intensity is based on the weights it assigned to the
six (from 1 to 6 in Table 2) characteristics emphasizing the relationship motive. We
construct six dummy variables that take the value of one if the firm answered 1 (very
much) to the respective characteristic, zero otherwise. Three of the six characteristics
identify attitudes to rely on specific (soft) information (1. The bank knows you and
your business; 2. The bank knows a member of your Board of directors or the owners
of the firm; 6. Frequent contacts with the credit offi cer at the bank) while the others
(3. The bank knows your sector; 4. The bank knows your local economy; 5. The
bank knows your relevant market) refer to the bank’s ability to use semi-specific (weak
soft) information. Our index of firm relationship intensity is the average of these six
dummies.
Then, we build the (ex post) index of relationship intensity of the bank using the
firm’s answers to the second question. Of the fifteen listed criteria, we label relational
those from 9 to 11, and those from 13 to 15 in Table 3. The first bunch of criteria (9.
Managerial ability on the part of those running the firm’s business; 10. Strength of the
firm in its market (number of customers, commercial network); 11. Intrinsic strength
of the firm (e.g. ability to innovate)) reveals reliance on information that relationship
lenders observe more precisely but even transaction lenders might perceive imperfectly.
The other criteria (13. Length of the lending relationship with the firm; 14. Loans are
granted when the bank is the firm’s main bank; 15. Fiduciary bond between the firm
and the credit offi cer at your bank) are exclusive attributes of relational lenders. Again
we build six dummies and take their average to construct our index for relationship
17
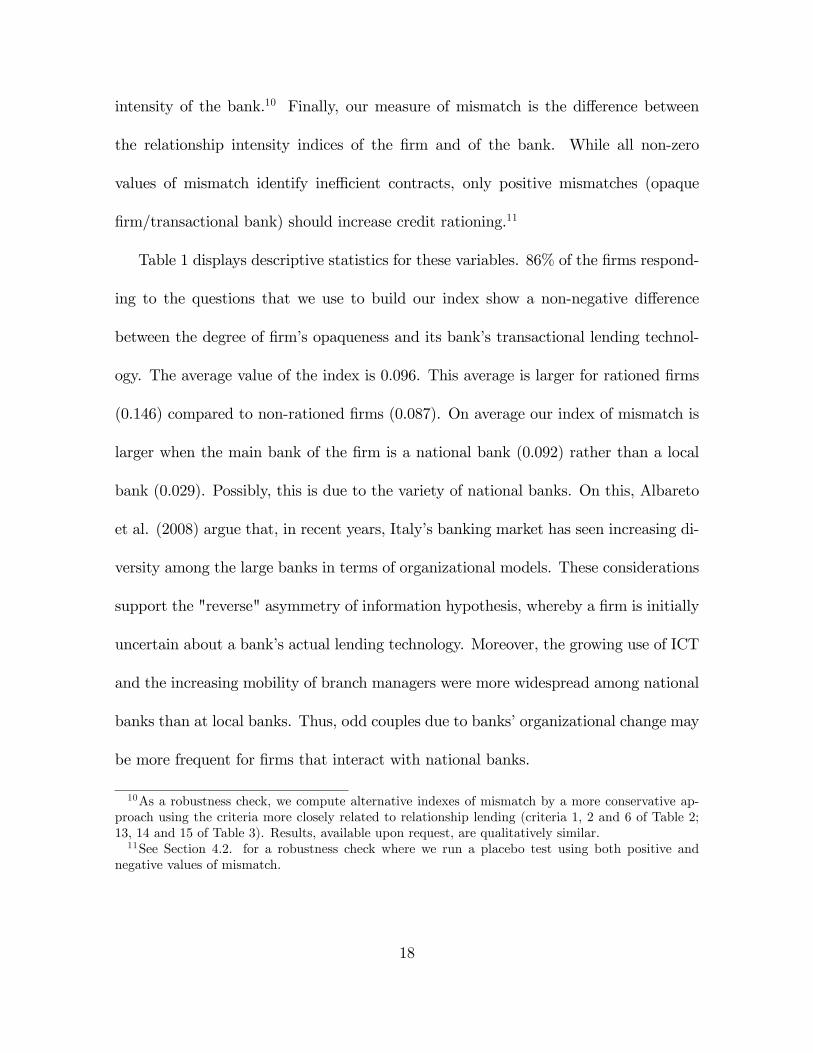
intensity of the bank.10 Finally, our measure of mismatch is the difference between
the relationship intensity indices of the firm and of the bank. While all non-zero
values of mismatch identify ineffi cient contracts, only positive mismatches (opaque
firm/transactional bank) should increase credit rationing.11
Table 1 displays descriptive statistics for these variables. 86% of the firms respond-
ing to the questions that we use to build our index show a non-negative difference
between the degree of firm’s opaqueness and its bank’s transactional lending technol-
ogy. The average value of the index is 0.096. This average is larger for rationed firms
(0.146) compared to non-rationed firms (0.087). On average our index of mismatch is
larger when the main bank of the firm is a national bank (0.092) rather than a local
bank (0.029). Possibly, this is due to the variety of national banks. On this, Albareto
et al. (2008) argue that, in recent years, Italy’s banking market has seen increasing di-
versity among the large banks in terms of organizational models. These considerations
support the "reverse" asymmetry of information hypothesis, whereby a firm is initially
uncertain about a bank’s actual lending technology. Moreover, the growing use of ICT
and the increasing mobility of branch managers were more widespread among national
banks than at local banks. Thus, odd couples due to banks’organizational change may
be more frequent for firms that interact with national banks.
10As a robustness check, we compute alternative indexes of mismatch by a more conservative ap-proach using the criteria more closely related to relationship lending (criteria 1, 2 and 6 of Table 2;13, 14 and 15 of Table 3). Results, available upon request, are qualitatively similar.11See Section 4.2. for a robustness check where we run a placebo test using both positive and
negative values of mismatch.
18
3.4 Control Variables
The control variables used in our regressions may be grouped into three clusters: those
referring to firm features, those measuring firm-bank(s) relationships, and those relating
to features external to the firm. Among firm features, we will first control for those
associated with firm opaqueness, such as firms’age, size and asset liquidity. Young
firms tend to be less informationally transparent than older ones because they lack
an established track record (Guiso and Minetti, 2010). Thus, we include the natural
logarithm of age, where age is measured from a firm’s inception. SMEs also tend to
be less informationally transparent because they are not monitored by the financial
press (Petersen and Rajan, 1994; Berger and Udell, 1998). We measure size by the
logarithm of the number of employees12 and the pledgeability of a firm’s assets by the
ratio of current to total assets. Moreover, a dummy indicates whether the firm is a
public limited company. Finally, among the firm’s features we consider leverage and
return on assets (ROA). Higher financial leverage, given by the ratio of total liabilities
to total assets, raises firm risk and the likelihood of rationing (Jensen and Meckling,
1976). In contrast, firms enjoying higher profitability are less likely to be rationed.
As to the variables on a firm’s relationships with banks, we include the number of
banks it borrows from, to capture the incidence of a possible moral hazard (hold-up) by
the lender (Rajan, 1992; Petersen and Rajan, 1994). Moreover, as a robustness check,
we introduce other measures of the intensity of the firm/main bank relationship: the
share of total loans obtained from the main bank and the length of the relationship,
12Results with total assets (available upon request) are virtually identical.
19
measured by the logarithm of the number of years the firm has being doing business
with its current main bank. Higher loan shares provided by the main bank and longer
durations of the credit relationship are often regarded as good indicators of a strong
rapport. A bank can accumulate information over time by observing a firm’s compli-
ance with its contractual obligations and covenants (Petersen and Rajan, 1994). The
impact of the duration of the relationship is studied in Petersen and Rajan (1994,
1995), Berger and Udell (1995), Ongena and Smith (2001) and Herrera and Minetti
(2007), among others. They find that longer relationships boost credit availability
(Petersen and Rajan, 1994, 1995) and lower funding costs (Berger and Udell, 1995),
confirming that the length of the relationship is a good proxy for its strength.
We also control for the institutional classification of the main bank with a dummy
variable that takes value one if the main bank is either a saving bank, or a cooperative
bank, or a mutual bank, and zero otherwise. Angelini et al. (1998) show a significant
role of mutual cooperative banks on Italian firms’cost and availability of credit. In
addition, we control for a firm’s geographical location with dummies for whether it
operates in the Center or in the South of Italy. We also include sector dummies
according to the two-digit ATECO classification. Finally, we control for the average
growth rate of province value added in 1991-1998 and for the average of the Herfindahl-
Hirschman Index on total bank lending in the province from 1990 to 2006. Dinc (2000)
and Carbo-Valverde et al. (2009) underline the importance of local credit market
competition on banks’behavior.
20

4 Results
4.1 “Odd Couples”and credit rationing
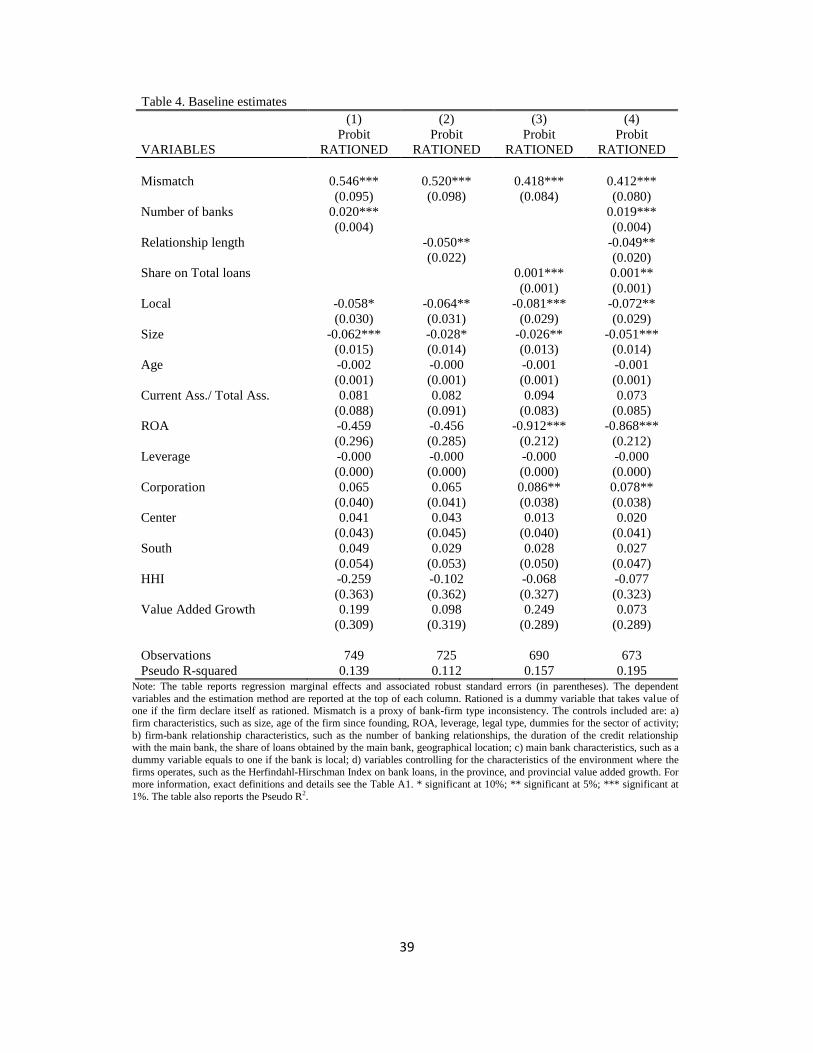
Table 4 reports the estimates of the likelihood of credit rationing. We find that the
difference between a firm’s opaqueness and its bank’s lending technology (i.e. the
phenomenon of the "odd couples") raises the probability of credit rationing in all the
regressions. The coeffi cient of our measure of inconsistency is always significant at the
1% level. These results are achieved controlling for the firm’s opaqueness, as well as
for the features of its relationship with the banks.13
With a marginal effect equal to 0.546 the positive impact on credit rationing is
economically sizable: keeping the other variables at the mean, a one standard devia-
tion increase in mismatch raises the probability of rationing by 10.4%. Our findings
for firm-specific controls are generally consistent with the empirical literature. As
regards informational opaqueness, firm size associates with significantly lower proba-
bility of rationing. Similarly, a one percent increase in ROA reduces that probability by
4.6%. Among the variables capturing credit conditions and relationships with banks, a
stronger relationship with the main bank lowers the probability of rationing (Ongena
and Smith, 2001; Degryse and van Cayseele, 2000). The likelihood of rationing signifi-
cantly grows in the number of firm’s lenders14 and lowers in the duration of the credit
relationship with the main bank (column 2). Thus, the strength of the relationship
13The list of controls is described in the previous section. Henceforth, we provide comments on theestimates in column 1. The estimates in the other columns are qualitatively similar.14The positive correlation between mismatch and the number of lending banks is weak (0.04),
downplaying the risk of endogeneity.
21
with the main bank seems well proxied by a firm’s duration of the rapport and number
of lenders (Petersen and Rajan, 1994; Ongena and Smith, 2001; Guiso and Minetti,
2010). The positive coeffi cient estimated for the share of the main bank on total loans
(column 3) is suggestive of lenders’moral hazard (hold-up) in credit rationing (Rajan,
1992; Petersen and Rajan, 1994). Finally, including all the variables capturing the
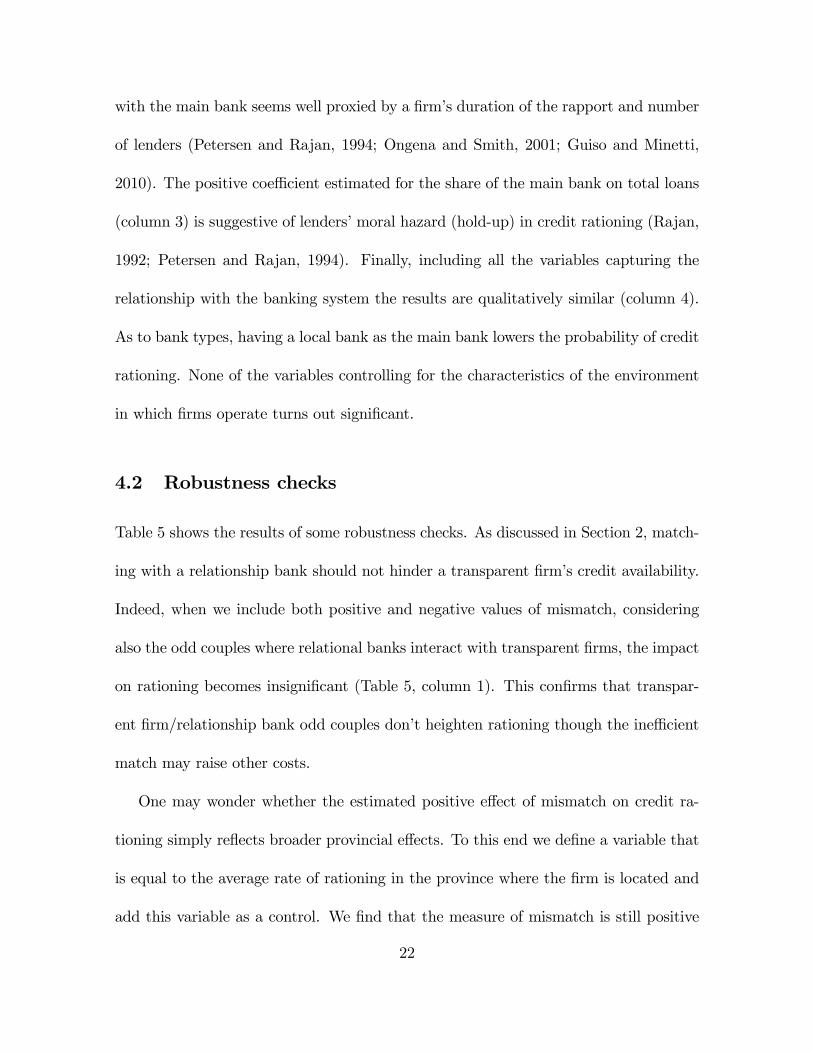
relationship with the banking system the results are qualitatively similar (column 4).
As to bank types, having a local bank as the main bank lowers the probability of credit
rationing. None of the variables controlling for the characteristics of the environment
in which firms operate turns out significant.
4.2 Robustness checks
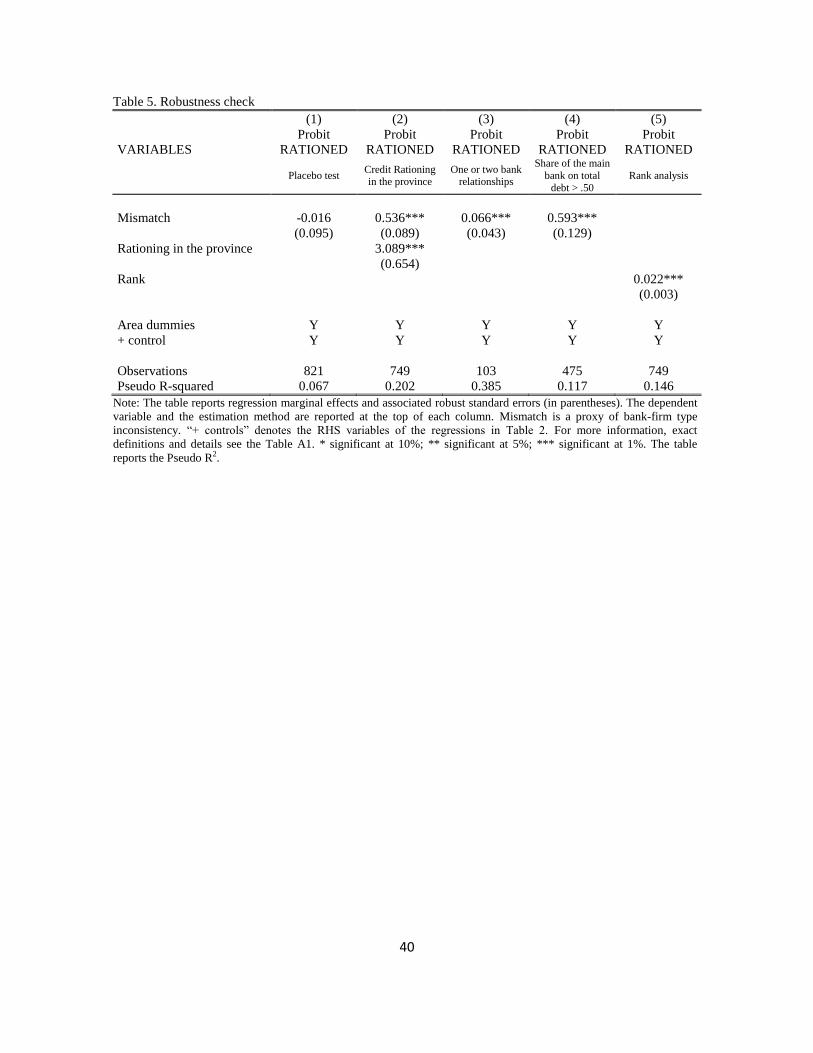
Table 5 shows the results of some robustness checks. As discussed in Section 2, match-
ing with a relationship bank should not hinder a transparent firm’s credit availability.
Indeed, when we include both positive and negative values of mismatch, considering
also the odd couples where relational banks interact with transparent firms, the impact
on rationing becomes insignificant (Table 5, column 1). This confirms that transpar-
ent firm/relationship bank odd couples don’t heighten rationing though the ineffi cient
match may raise other costs.
One may wonder whether the estimated positive effect of mismatch on credit ra-
tioning simply reflects broader provincial effects. To this end we define a variable that
is equal to the average rate of rationing in the province where the firm is located and
add this variable as a control. We find that the measure of mismatch is still positive
22
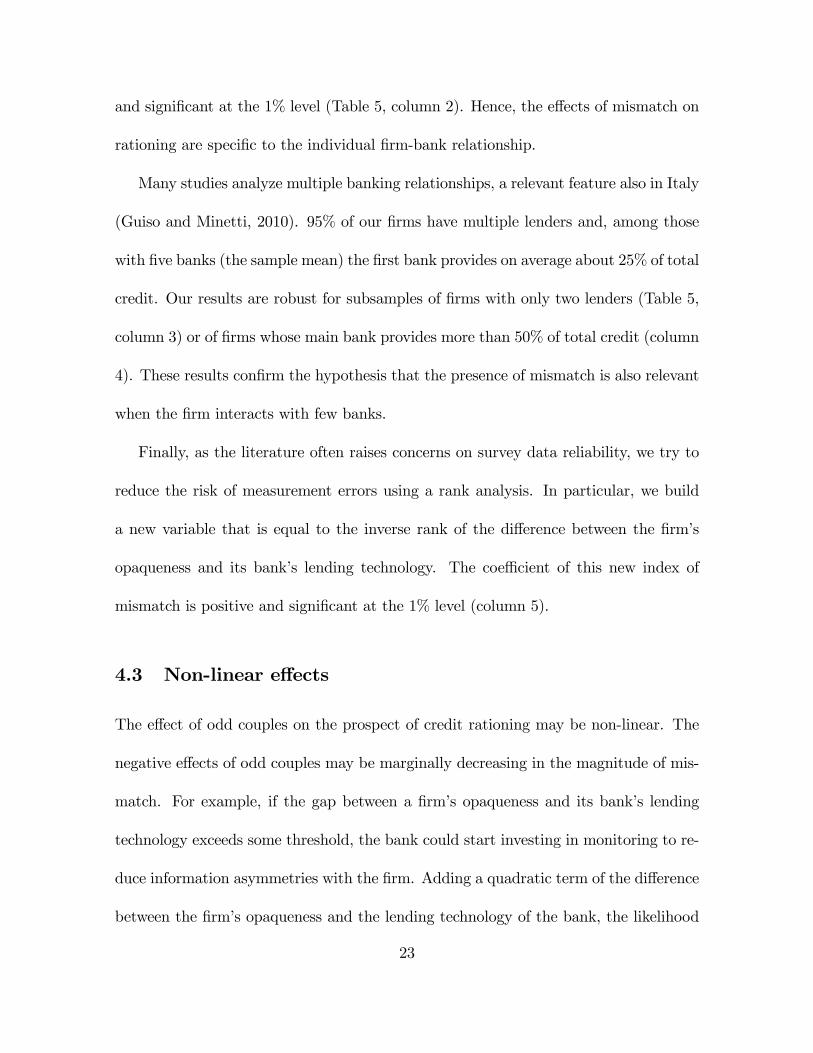
and significant at the 1% level (Table 5, column 2). Hence, the effects of mismatch on
rationing are specific to the individual firm-bank relationship.
Many studies analyze multiple banking relationships, a relevant feature also in Italy
(Guiso and Minetti, 2010). 95% of our firms have multiple lenders and, among those
with five banks (the sample mean) the first bank provides on average about 25% of total
credit. Our results are robust for subsamples of firms with only two lenders (Table 5,
column 3) or of firms whose main bank provides more than 50% of total credit (column
4). These results confirm the hypothesis that the presence of mismatch is also relevant
when the firm interacts with few banks.
Finally, as the literature often raises concerns on survey data reliability, we try to
reduce the risk of measurement errors using a rank analysis. In particular, we build
a new variable that is equal to the inverse rank of the difference between the firm’s
opaqueness and its bank’s lending technology. The coeffi cient of this new index of
mismatch is positive and significant at the 1% level (column 5).
4.3 Non-linear effects
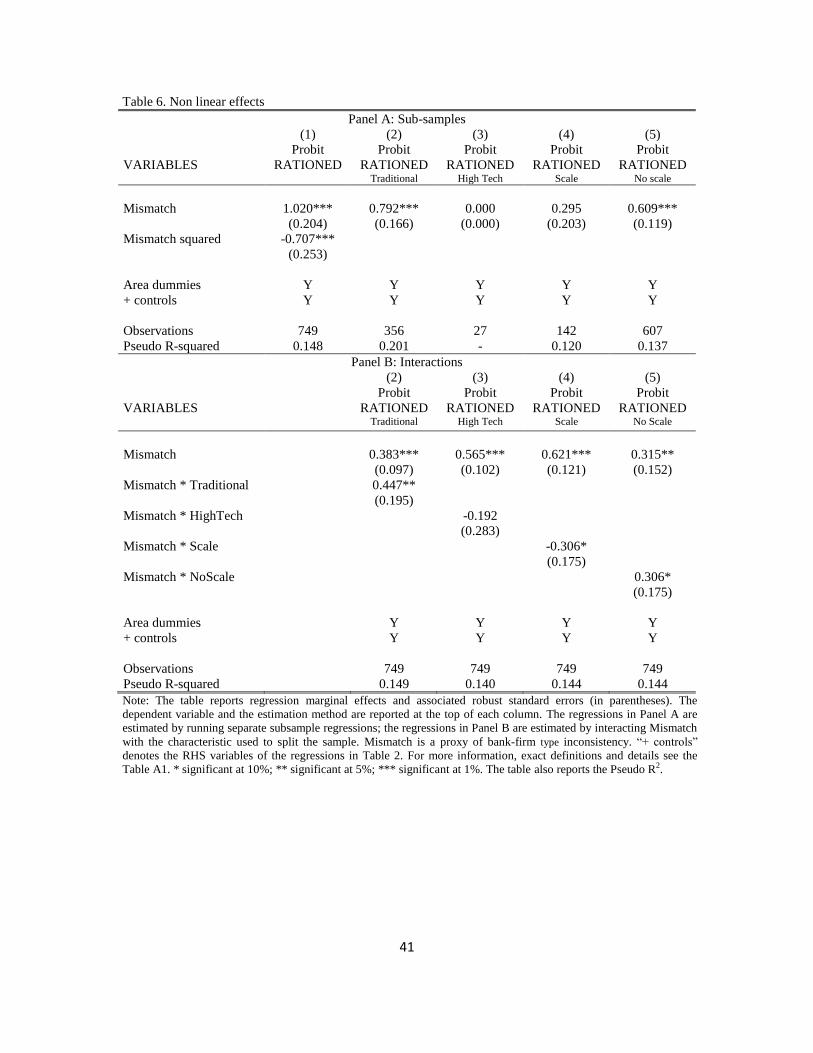
The effect of odd couples on the prospect of credit rationing may be non-linear. The
negative effects of odd couples may be marginally decreasing in the magnitude of mis-
match. For example, if the gap between a firm’s opaqueness and its bank’s lending
technology exceeds some threshold, the bank could start investing in monitoring to re-
duce information asymmetries with the firm. Adding a quadratic term of the difference
between the firm’s opaqueness and the lending technology of the bank, the likelihood
23
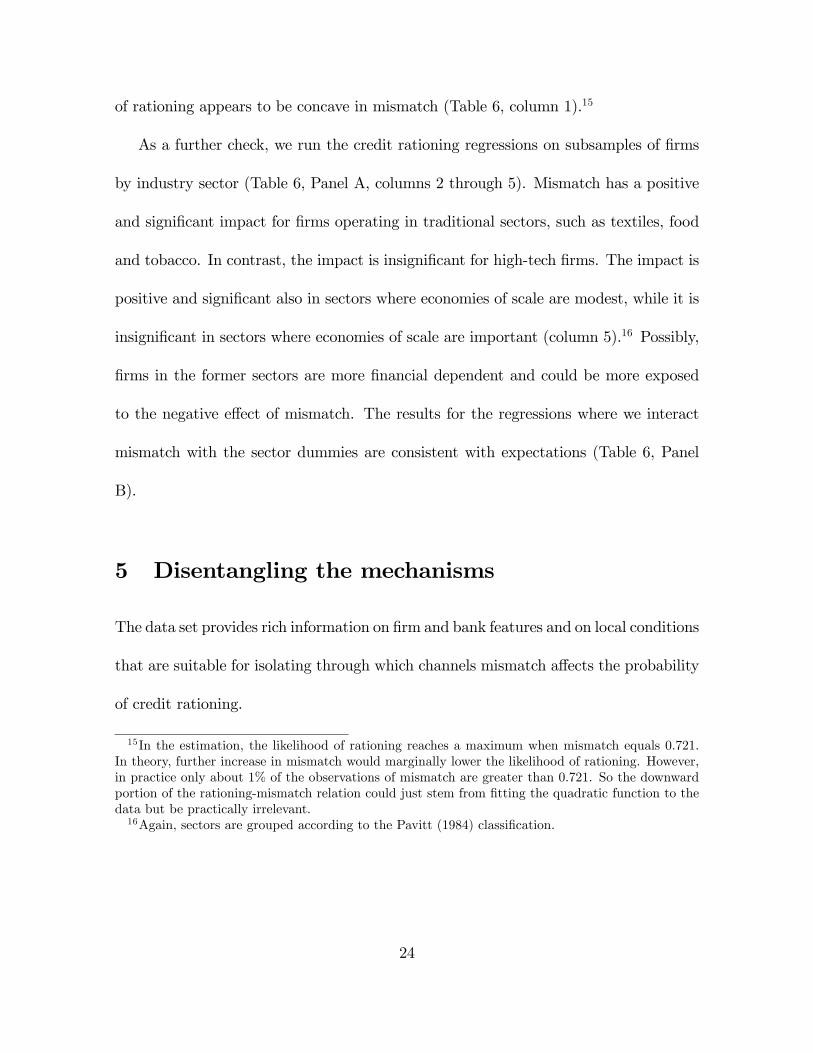
of rationing appears to be concave in mismatch (Table 6, column 1).15
As a further check, we run the credit rationing regressions on subsamples of firms
by industry sector (Table 6, Panel A, columns 2 through 5). Mismatch has a positive
and significant impact for firms operating in traditional sectors, such as textiles, food
and tobacco. In contrast, the impact is insignificant for high-tech firms. The impact is
positive and significant also in sectors where economies of scale are modest, while it is
insignificant in sectors where economies of scale are important (column 5).16 Possibly,
firms in the former sectors are more financial dependent and could be more exposed
to the negative effect of mismatch. The results for the regressions where we interact
mismatch with the sector dummies are consistent with expectations (Table 6, Panel
B).
5 Disentangling the mechanisms
The data set provides rich information on firm and bank features and on local conditions
that are suitable for isolating through which channels mismatch affects the probability
of credit rationing.
15In the estimation, the likelihood of rationing reaches a maximum when mismatch equals 0.721.In theory, further increase in mismatch would marginally lower the likelihood of rationing. However,in practice only about 1% of the observations of mismatch are greater than 0.721. So the downwardportion of the rationing-mismatch relation could just stem from fitting the quadratic function to thedata but be practically irrelevant.16Again, sectors are grouped according to the Pavitt (1984) classification.
24
5.1 Firm characteristics
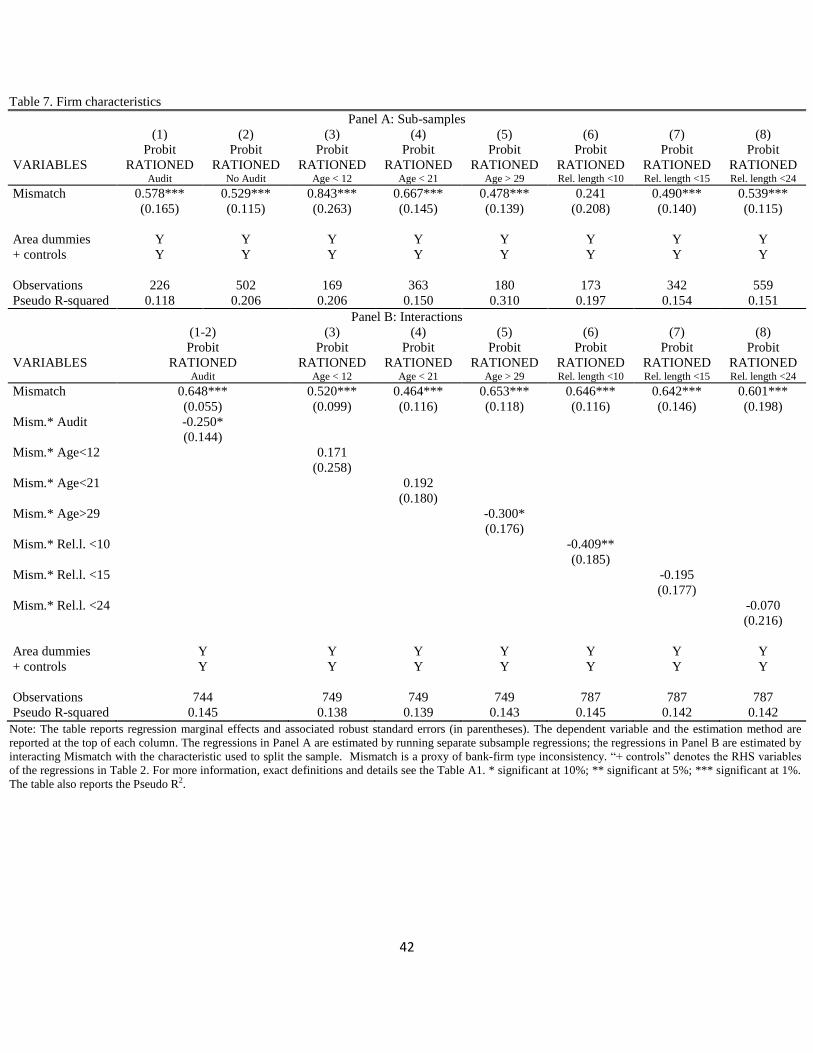
We verify whether mismatch heightens rationing more for firms that are opaque and/or
entangled with switching costs by inspecting subsamples based, respectively, on the
presence of audited balance sheets and firm age, and on the length of its rapport with
the main bank. It is possible that, irrespective of the type of main bank, transparent
firms are less likely rationed. When coming from audited statements "hard" informa-
tion makes the firm more transparent to banks, allowing for the effi cient use of lending
technologies based on accounting information only (Berger et al., 2005; Berger and
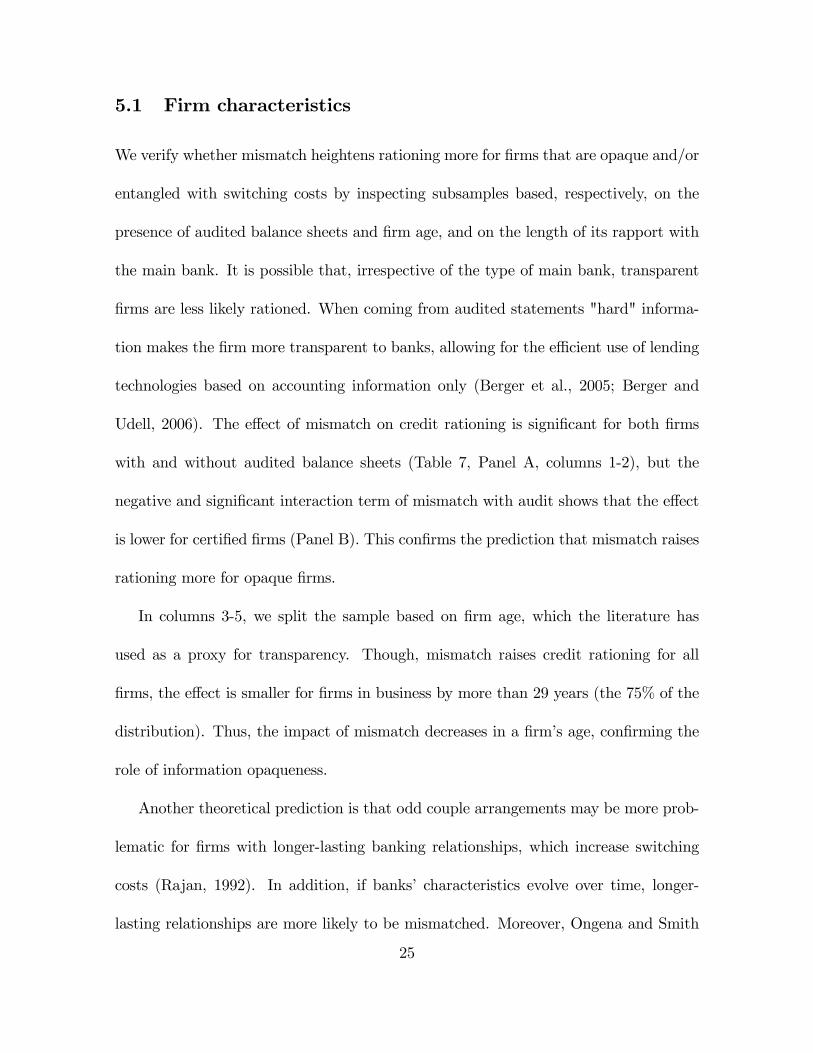
Udell, 2006). The effect of mismatch on credit rationing is significant for both firms
with and without audited balance sheets (Table 7, Panel A, columns 1-2), but the
negative and significant interaction term of mismatch with audit shows that the effect
is lower for certified firms (Panel B). This confirms the prediction that mismatch raises
rationing more for opaque firms.
In columns 3-5, we split the sample based on firm age, which the literature has
used as a proxy for transparency. Though, mismatch raises credit rationing for all
firms, the effect is smaller for firms in business by more than 29 years (the 75% of the
distribution). Thus, the impact of mismatch decreases in a firm’s age, confirming the
role of information opaqueness.
Another theoretical prediction is that odd couple arrangements may be more prob-
lematic for firms with longer-lasting banking relationships, which increase switching
costs (Rajan, 1992). In addition, if banks’ characteristics evolve over time, longer-
lasting relationships are more likely to be mismatched. Moreover, Ongena and Smith
25
(2001) find that the value of relationships declines over time. To test these effects, we
split the sample with respect to the length of the firm-main bank relationship. The im-
pact of mismatch on the likelihood of credit rationing is positive and significant (at the
1% level) only for the firms with credit relationships over 10 years (Table 7, columns
6-8). These findings are confirmed by the regressions with the interaction terms.
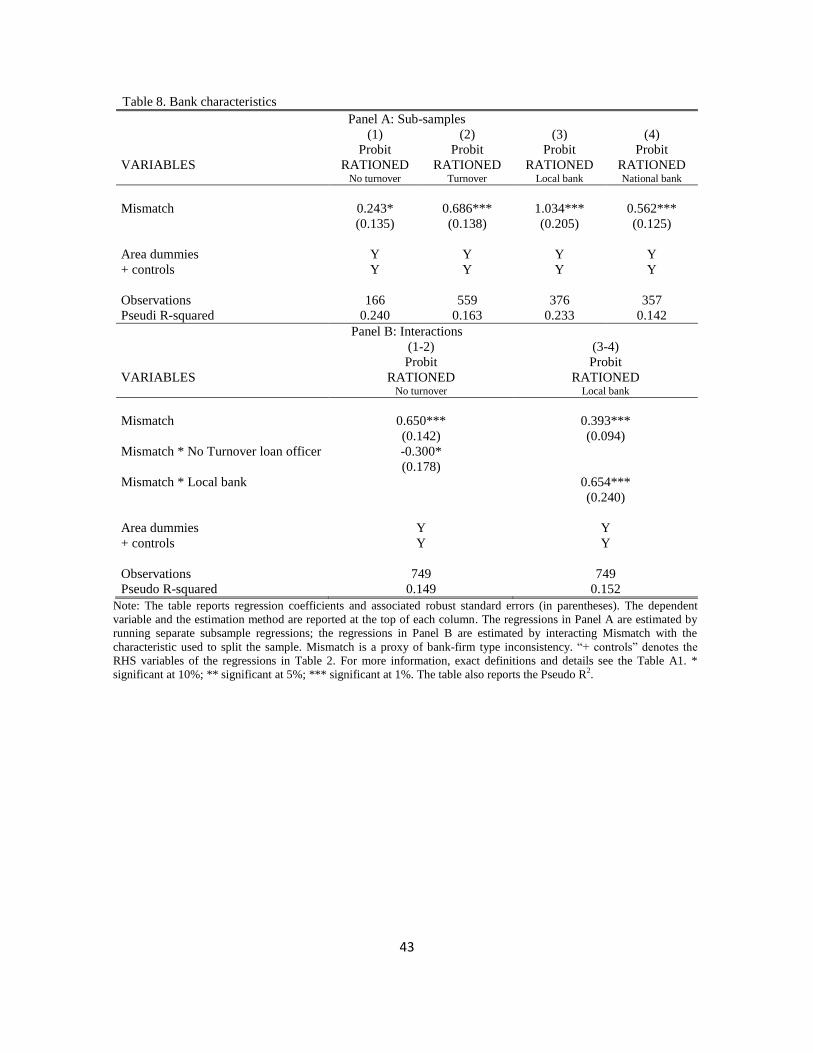
5.2 Bank characteristics
Theory suggests that banks can avoid diluting soft information by delegating lending
authority to the same agent that collects it, the loan offi cer (Stein, 2002; Berger and
Udell, 2002; Liberti and Mian, 2009). Thus, mismatch and rationing conditional on
mismatch may be less likely for banks with infrequent loan offi cers’turnover. Validating
the theoretical prediction, the probability of rationing is lowered by the significant and
negative interaction term of mismatch with the dummy for banks that didn’t change
their loan offi cer in the previous five years (Table 8, columns 1 and 2).
Table 1 shows that the degree of mismatch is larger for the firms with a national
bank as a main bank (0.092 vs. 0.029 when the main bank is a local bank). Figure
1 reveals that national banks —here included in “large banks”—more likely adopted
credit scoring and relied on “hard”information than local banks —here represented by
small banks and cooperative banks. Thus, we split the sample by main bank type as
an additional robustness check. The impact of odd couples is positive and significant
for firms with a national main bank but the same applies to firms with a local main
bank (columns 3 and 4). However, as the positive and significant interaction term of
26
mismatch with the local main bank dummy reveals, the impact of mismatch is larger
when the main bank is local. This seems to prove the negative role of switching costs
because on average the firms with a local main bank have fewer lenders and longer
relationships with their main banks.
5.3 Local socio-economic conditions
Local market conditions may also affect the link between mismatch and credit rationing
because factors relevant for the exchange of information between banks and firms could
differ across areas of Italy. These factors may include judicial effi ciency, social capital,
and infrastructure. Thus, we split the sample based on whether firms are located in
the North or in the Center and South of Italy. The impact of mismatch on credit
rationing is larger for firms located in the Center and South of Italy (Table 9, columns
1-2). As the North of Italy is the most affl uent area, this result suggests that the role
of mismatch declines with the level of economic development.
Credit rationing could be affected by the verifiability of a firm’s output, which,
in turn, depends on the effi ciency of the court system beside the firm’s informational
opaqueness. To capture court effi ciency, we control for the number of civil suits pending
per 1,000 inhabitants in each of the 27 judicial districts of Italy. A high number of
pending suits could reflect an ineffi cient enforcement system (Bianco et al., 2005). This
variable is imputed to the firms according to the judicial district of their headquarter.
The results for the most and the least effi cient quartiles suggest that the impact of
mismatch on rationing is stronger in the least effi cient judicial districts (columns 3-4).
27
However, the results for the subsamples are not confirmed by the regressions with the
interaction terms.
6 Endogeneity of mismatch
Our estimates might be affected by reverse causality. Credit rationing may trigger
changes in the relationship between a firm and its main bank. Also, there is the
possibility of adverse “soft” information. For example, bad credit risk firms or firms
with a manager that has poor moral character that could jeopardize the firm’s ability
to repay its loan may strategically self select into arm’s-length debt to decrease the
probability of being uncovered. However, the bank may recognize that the firm is
opaque and is likely hiding something, even though the transactional bank cannot
discover it. Hence, this firm is more likely to be credit rationed. Finally, although
our specifications control for various aspects that may shape credit rationing decisions,
unobserved factors might concurrently affect the probability of mismatch and rationing.
The direction of this bias is unclear a priori. To deal with the possible endogeneity,
this section uses an instrumental variable approach.
6.1 IV Estimates
We use as instrumental variables: an index of self-confidence of the firm, the average of
mismatch in the province, the number of bank M&As in the province over 2002-2006,
and the average banks’functional distance between hierarchical levels in the province
over 2000-2005, as measured in Alessandrini et al. (2010).28
We define an index of self-confidence of the firm as the average of the dummies
constructed on the characteristics 7, 8, 9, 10, 11, 12 and 14 from the questions in Table
3. These characteristics measure the importance that a firm places on the ex-ante
transactional features of its main bank. A high value of this index identifies firms
that value effi cient and convenient banking services, as they perceive themselves to be
transparent. High self-confidence leads firms to search less for its needed type of main
bank, thus ending up more easily mismatched. This index exhibits a relatively high
correlation with the explanatory variable mismatch and is almost uncorrelated with
the dependent variable. Moreover, as additional instrument, we use the average level
of the mismatch for the firms in the same province. This index follows the strategy
proposed in Caprio et al. (2007), and further used in Laeven and Levine (2009), to
capture local factors affecting the value of mismatch.
As explained in Section 2, in recent years local credit markets in Italy have changed
considerably due to many M&As among banks. These increased the average size of
banks, modifying the lending organizational model and often centralizing decision-
making powers. These aspects may help explain why firms find themselves mismatched.
Our last instrument is the functional distance between hierarchical levels for the banks
in the same province of the firm. This variable is computed as the number of branches
operating in the province, each weighted by the logarithm of one plus the kilometric
distance between the capital of that province and the capitals of provinces where parent
banks are headquartered (Alessandrini et al., 2010). The rationale for this instrument
is that incentive problems and the deterioration of soft information transmission within
29
an organization increase with the functional distance between hierarchical levels, in-
creasing the probability of mismatch.
Column 1 of Table 10 report the estimates of the baseline specification. In column
2, we report the 2SLS estimates of the linear probability model. To conserve space, the
bottom of column 2 only reports the coeffi cients of the instrumental variables from the
first-stage regression. Consistent with our expectation, the level of mismatch rises in
the index of firms’self-confidence, in the average level of mismatch in the province, and
in functional distance. By contrast, mismatch decreases in the number of bank M&As
in the province (but this coeffi cient is not significant). Further, column 2 shows that in
the second-stage regression, mismatch has a positive and statistically significant impact
on credit rationing. Since the linear probability model does not account for the fact
that credit rationing is a binary variable, we take an alternative approach and estimate
a two-stage conditional maximum likelihood model (2SCML). Like the 2SLS estimate,
the estimated coeffi cient on mismatch is significantly positive (column 3). These results
confirm the positive effect of mismatch on credit rationing when we account for the
possible endogeneity of mismatch.
7 Conclusion
The merger wave observed in the last couple of decades and significant advance in ICT
are changing the structure of the banking system of many countries raising a number of
important questions, including the effects on firm-main bank relationships. This paper
studied the possibility that the matching between a firm and its main bank may not30

be optimal: a firm may end up with a type of bank different from the one it needed
and thought it had. This could pose a problem because switching costs could cause
firms to remain in a suboptimal firm-bank “odd”couple.
We employed a large sample of Italian manufacturing firms to test whether an odd
couple relationship raises the probability that a firm will be rationed for credit, as the
firm itself reports in the survey. The results support our conjecture and survive when
we account for possible endogeneity of mismatch by using an instrumental variable
approach. Also, because the effect of odd couples on rationing is larger for firms with
longer relationships with their main banks, switching costs appear to be important.
Furthermore, some evidence shows that the impact of mismatch on rationing declines
with the level of economic development and with the degree of judicial effi ciency.
Our findings might warrant some policy measures that increase the transparency of
a bank’s lending technology and that lower switching costs. Such policies would help
reduce the probability that odd couples form and, when they do, that they last.
References
Albareto, G., Benvenuti, M., Mocetti, S., Pagnini, M., Rossi, P., 2008. L’organizzazionedell’attività creditizia e l’utilizzo di tecniche di scoring nel sistema bancario italiano:risultati di un’indagine campionaria. Occasional Papers 12, Bank of Italy.
Albareto, G., Finaldi Russo, P., 2012. Fragilità finanziaria e prospettive di crescita: ilrazionamento del credito alle imprese durante la crisi. Occasional Papers 127, Bankof Italy.
Alessandrini, P., Presbitero, A., Zazzaro, A., 2010. Bank size or distance: what hampersinnovation adoption by SMEs? J. Econ. Geogr. 10, 845-881.
Angelini, P., Di Salvo, R., Ferri, G., 1998. Availability and cost of credit for smallbusinesses: customer relationships and credit cooperatives. J. Banking Finance 22(6-8), 925-54.
31
Barone, G., Felici, R., Pagnini, M., 2011. Switching costs in local credit markets. Int.J. Ind. Organ. 29, 694-704.
Bartoli, F., Ferri, G., Murro, P., Rotondi, Z., 2013. SME financing and the choiceof lending technology in Italy: complementarity or substitutability? J. BankingFinance 37(12), 5476-5485.
Beck, T., Demirguc-Kunt, A., Maksimovic, V., 2008. Financing patterns around theworld: Are small firms different. J. Finan. Econ. 89, 467-487.
Berger, A. N., Black, L.K., 2011. Bank size, lending technologies, and small businessfinance. J. Banking Finance 35, 724—735.
Berger, A.N., Frame, W.S., 2007. Small Business Credit Scoring and Credit Availabil-ity. J. Small Bus. Manage. 45 (1), 5-22.
Berger, A.N., Miller, N.H., Petersen, M.A., Rajan, R.G., Stein, J.C., 2005. Does func-tion follow organizational form? Evidence from the lending practices of large andsmall banks. J. Finan. Econ. 76 (2), 237—269.
Berger, A.N., Udell, G.F., 1995. Relationship lending and lines of credit in small firmfinance. J. Bus. 68, 351-81.
Berger, A. N., Udell, G.F., 1998. The Economics of Small Business Finance: The Rolesof Private Equity and Debt Markets in the Financial Growth Cycle. J. BankingFinance 22, 613—673.
Berger, A. N., Udell, G.F., 2002. Small Business Credit Availability and RelationshipLending: The Importance of Bank Organisational Structure. Econ. J. 112, F32-F53.
Berger, A. N., Udell, G.F., 2006. A more complete conceptual framework for SMEfinance. J. Banking Finance 30, 2945—2966.
Bhattacharya, S., Chiesa, G., 1995. Proprietary Information, Financial Intermediation,and Research Incentives. J. Finan. Intermediation 4 (4), 328-357.
Bhattacharya, S., Thakor, A.V., 1993. Contemporary banking theory. J. Finan. Inter-mediation 3, 2-50.
Bianco, M., Jappelli, T., Pagano, M., 2005. Courts and banks: Effect of judicial costson credit market performance. J. Money, Credit, Banking 37 (2), 223-244.
Bonaccorsi Di Patti, E., Gobbi, G., 2007. Winners or Losers? The Effects of BankingConsolidation on Corporate Borrowers. J. Finance 62 (2), 669-695.
Boot, A.W.A., 2000. Relationship banking: what do we know? J. Finan. Intermedia-tion 9 (1), 7—25.
Broecker, T., 1990. Credit-Worthiness Tests and Interbank Competition. Econometrica58 (2), 429-452.
32
Caprio, G., Laeven, L., Levine, R., 2007. Bank valuation and corporate governance. JFinan. Intermediation 1 (4), 584-617.
Carbo-Valverde, S., Rodriguez-Fernandez, F., Udell, G.F., 2009. Bank market powerand sme financing constraints. Rev. Finance 13 (2), 309—340.
Degryse, H., Ongena, S., 2005. Distance, Lending Relationships and Competition. J.Finance 60 (1), 231-266.
Degryse, H., Van Cayseele, P.J.G., 2000. Relationship lending within a bank-basedsystem: evidence from European small business data. J. Finan. Intermediation 9(1), 90-109.
de la Torre, A., Martinez Peria, M.S., Schmukler, S.L., 2010. Bank involvement withSMEs: Beyond relationship lending. J. Banking Finance 34, 2280-2293.
Diamond, D.W., 1984. Financial intermediation and delegated monitoring. Rev. Econ.Stud. 51, 393-414.
Diamond, D.W., 1991. Monitoring and reputation: The choice between bank loans anddirectly placed debt. J. Polit. Economy 99, 689-721.
Dinc, I.S., 2000. Bank reputation, bank commitment, and the effects of competition incredit markets. Rev. Finan. Stud. 13 (5), 781—812.
Elyasani, E., Goldberg, L.G., 2004. Relationship lending: A survey of the literature. J.Econ. Bus. 56, 315-330.
Guiso, L., 1998. High-tech firms and credit rationing. J. Econ. Behav. Organ. 35, 39-59.
Guiso, L., Minetti, R., 2010. The Structure of Multiple Credit Relationships: Evidencefrom US Firms. J. Money, Credit, Banking 42 (6), 1037-1071.
Guiso, L., Sapienza, P., Zingales, L., 2004. Does Local Financial Development Matter?Quart. J. Econ. 119, 929.69.
Hauswald, R., Marquez, R., 2006. Competition and Strategic Information Acquisitionin Credit Markets. Rev. Finan. Stud. 19 (3), 967-1000.
Herrera, A., Minetti, R., 2007. Informed Finance and Technological Change: Evidencefrom Credit Relationships. J. Finan. Econ. 83, 223-269.
Inderst, R., Mueller, H., 2006. Informed lending and security design. J. Finance 61,2137-2162.
Jaffee, D., Russell, T., 1976. Imperfect Information, Uncertainty, and Credit Rationing.Quart. J. Econ. 90 (4), 651-666.
Jaffee, D., Stiglitz, J.E., 1989. Credit Rationing. The Macmillan Press Ltd.33
Jensen, M.C., Meckling, W.H., 1976. Theory of the firm: Managerial behavior, agencycosts and ownership structure. J. Finan. Econ. 3 (4), 305-360.
Klapper, L., 2006. The role of factoring for financing small and medium enterprises. J.Banking Finance 30, 3111-3130.
Laeven, L., Levine, R., 2009. Bank governance, regulation, and risk-taking. J Finan.Econ. 93 (2), 259-275.
Liberti, J., Mian, A., 2009. Estimating the Effect of Hierarchies on Information Use.Rev. Finan. Stud. 22, 4057-4090.
Minetti, R., Zhu, S.C., 2011. Credit constraints and firm export: Microeconomic evi-dence from Italy. J. Int. Econ. 83, 109-125.
Murro, P., 2010. Lending Technologies in Italy: an Example of Hardening of SoftInformation. Rivista Bancaria 4/2010, 7-32.
Okuno-Fujiwara, M., Postlewaite, A., Suzumura, K., 1990. Strategic Information Rev-elation. Rev. Econ. Stud. 57, 25-47.
Ongena, S., Smith, D.C., 2000. Bank relationships: A review, in: Harker, P.T., Zenios,S.A. (Eds.), Performance of Financial Institutions. Cambridge University Press.
Ongena, S., Smith, D.C., 2001. The duration of bank relationships. J. Finan. Econ. 61,449-475.
Pavitt, K., 1984. Sectoral patterns of technical change: Towards a taxonomy and atheory. Res. Policy 13, 343-373.
Petersen, M.A., 2004. Information: Hard and Soft. Unpublished working paper, North-western University.
Petersen, M.A., Rajan, R.G., 1994. The benefits of lending relationships: evidencefrom small business data. J. Finance 49, 3-37.
Petersen, M.A., Rajan, R.G., 1995. The effect of credit market competition on lendingrelationships. Quart. J. Econ.110, 407-442.
Rajan, R.G., 1992. Insiders and outsiders: The choice between informed and arm’slength debt. J. Finance 47, 1367-1400.
Sapienza, P., 2002. The Effects of Banking Mergers on Loan Contracts. J. Finance 57(1), 329-367.
Sharpe, S., 1990. Asymmetric information, bank lending, and implicit contracts: Astylized model of customer relationships. J. Finance 45, 1069-1087.
Shavell, S., 1994. Acquisition and disclosure of information prior to sale. RAND J.Econ. 25 (1), 20-36.
34
Stein, J.C., 2002. Information Production and Capital Allocation: Decentralized versusHierarchical Firms. J. Finance 57, 1891-1921.
Stiglitz, J.E., Weiss, A., 1981. Credit rationing in markets with imperfect information.Amer. Econ. Rev. 71, 393-410.
Uchida, H., Udell, G. F., Yamori, N., 2006. SME financing and the choice of lendingtechnology. RIETI Discussion Paper Series.
Uchida, H., Udell, G. F., Yamori, N., 2012. Loan offi cer and relationship lending toSMEs. J. Finan. Intermediation 21, 97-122.
Weinstein, D.E., Yafeh, Y., 1998. On the Cost of a Bank Centered Financial System:Evidence from the Changing Main Bank Relations in Japan. J. Finance 53, 635-672.
35
36
Table 1. Sample summary statistics
Full sample Rationed Not Rationed Local bank National bank
Dependent Variables
Rationed* 0.052 1 0 0.202 0.287
Control Variables
Mismatch 0.096 0.146 0.087 0.029 0.092
0.190 0.227 0.182 0.099 0.197
Number of banks 4.963 6.502 5.230 5.375 5.989
3.908 4.165 3.863 4.121 4.423
Relationship length (ln) 2.595 2.498 2.601 2.692 2.562
0.783 0.797 0.782 0.740 0.758
Share on total loans 31.807 27.886 23.649 18.930 22.561
32.796 22.453 24.559 22.248 22.411
Local* 0.503 0.416 0.531 1 0
Size 3.552 3.669 3.607 3.749 3.799
1.117 1.175 1.104 1.273 1.371
Employees 87.119 67.947 91.115 82.393 85.964
305.72 245.42 316.73 280.68 290.21
Age 22.661 22.138 23.268 22.713 23.647
14.386 14.176 14.482 15.044 15.910
Current Ass. / Total Ass. 0.717 0.696 0.716 0.713 0.695
0.170 0.170 0.169 0.169 0.179
ROA 0.055 0.039 0.055 0.052 0.052
0.069 0.080 0.063 0.079 0.058
Leverage 0.899 0.899 0.899 0.891 0.892
0.113 0.108 0.112 0.114 0.109
Corporation* 0.332 0.420 0.341 0.387 0.383
North* 0.718 0.654 0.724 0.672 0.734
Center* 0.163 0.216 0.164 0.171 0.198
South* 0.119 0.130 0.112 0.095 0.130
HHI 0.110 0.110 0.110 0.111 0.114
0.048 0.051 0.047 0.047 0.049
Value Added Growth 0.085 0.086 0.085 0.084 0.086
0.048 0.046 0.049 0.051 0.046
Observations 4,464 231 4,233 475 470
Note: The table reports means and standard deviations (in italics). * denotes a dummy variable. See the Table A.1 for exact
definitions.
37
Table 2. Which of these characteristics are key in selecting your main bank?
Very much Enough Little Not at all
1. The bank knows you and your business. 29.7% 44.9% 4.7% 20.7%
2. The bank knows a member of your Board of directors or the
owners of the firm.
15.1% 54.7% 7.9% 22.3%
3. The bank knows your sector. 15.5% 53.9% 9.9% 20.6%
4. The bank knows your local economy. 13.1% 56.4% 10.3% 20.2%
5. The bank knows your relevant market. 9.7% 56.1% 11.8% 22.3%
6. Frequent contacts with the credit officer at the bank. 15.9% 52.2% 11.1% 20.8%
7. The bank takes quick decisions. 19.7% 44.8% 15.8% 19.7%
8. The bank offers a large variety of services. 18.9% 51.2% 10.2% 19.6%
9. The bank offers an extensive international network. 15.2% 46.7% 15.8% 22.2%
10. The bank offers efficient internet-based services. 13.5% 47.8% 16.1% 22.5%
11. The bank offers stable funding. 12.0% 48.7% 15.2% 24.1%
12. The bank offers funding and services at low cost. 13.6% 45.7% 16.5% 24.2%
13. The bank’s criteria to grant credit are clear 14.7% 47.2% 16.7% 21.3%
14. The bank is conveniently located. 18.1% 47.7% 13.4% 20.9%
Note: Total respondents: 1,541.
38
Table 3. In your view, which criteria does your bank follow in granting loans to you?
Very much Enough Little Not at all
1. Ability of the firm to repay its debt (e.g. years needed to repay its debt) 25.0% 46.4% 8.1% 20.5%
2. Financial solidity of the firm (capital/asset ratio) 21.7% 50.5% 7.0% 20.7%
3. Firm’s profitability (current profits/sales ratio) 20.0% 47.3% 10.7% 22.0%
4. Firm’s growth (growth of sales) 19.8% 44.1% 14.5% 21.5%
5. Ability of the firm to post (not personal) real estate collateral 11.9% 42.9% 19.8% 25.4%
6. Ability of the firm to post tangible non-real estate collateral 10.3% 43.0% 20.2% 26.5%
7. Support by a guarantee association (e.g. loan, export, R&D, etc.) 15.2% 31.6% 16.9% 36.3%
8. Personal guarantees by the firm’s manager or owner 12.4% 48.1% 11.1% 28.4%
9. Managerial ability on the part of those running the firm’s business 14.4% 49.9% 13.1% 22.6%
10. Strength of the firm in its market (number of customers, commercial
network) 12.3% 46.2% 17.0% 24.5%
11. Intrinsic strength of the firm (e.g. ability to innovate) 17.4% 46.3% 13.7% 22.6%
12. Firm’s external evaluation or its evaluation by third parties 12.1% 44.7% 18.4% 24.8%
13. Length of the lending relationship with the firm 14.1% 48.3% 14.6% 22.9%
14. Loans are granted when the bank is the firm’s main bank 13.5% 50.6% 11.2% 24.7%
15. Fiduciary bond between the firm and the credit officer at your
bank
15.5% 51.4% 11.5% 21.6%
Note: Total respondents: 1,541.
39
Table 4. Baseline estimates
(1) (2) (3) (4)
Probit Probit Probit Probit
VARIABLES RATIONED RATIONED RATIONED RATIONED
Mismatch 0.546*** 0.520*** 0.418*** 0.412***
(0.095) (0.098) (0.084) (0.080)
Number of banks 0.020*** 0.019***
(0.004) (0.004)
Relationship length -0.050** -0.049**
(0.022) (0.020)
Share on Total loans 0.001*** 0.001**
(0.001) (0.001)
Local -0.058* -0.064** -0.081*** -0.072**
(0.030) (0.031) (0.029) (0.029)
Size -0.062*** -0.028* -0.026** -0.051***
(0.015) (0.014) (0.013) (0.014)
Age -0.002 -0.000 -0.001 -0.001
(0.001) (0.001) (0.001) (0.001)
Current Ass./ Total Ass. 0.081 0.082 0.094 0.073
(0.088) (0.091) (0.083) (0.085)
ROA -0.459 -0.456 -0.912*** -0.868***
(0.296) (0.285) (0.212) (0.212)
Leverage -0.000 -0.000 -0.000 -0.000
(0.000) (0.000) (0.000) (0.000)
Corporation 0.065 0.065 0.086** 0.078**
(0.040) (0.041) (0.038) (0.038)
Center 0.041 0.043 0.013 0.020
(0.043) (0.045) (0.040) (0.041)
South 0.049 0.029 0.028 0.027
(0.054) (0.053) (0.050) (0.047)
HHI -0.259 -0.102 -0.068 -0.077
(0.363) (0.362) (0.327) (0.323)
Value Added Growth 0.199 0.098 0.249 0.073
(0.309) (0.319) (0.289) (0.289)
Observations 749 725 690 673
Pseudo R-squared 0.139 0.112 0.157 0.195 Note: The table reports regression marginal effects and associated robust standard errors (in parentheses). The dependent
variables and the estimation method are reported at the top of each column. Rationed is a dummy variable that takes value of one if the firm declare itself as rationed. Mismatch is a proxy of bank-firm type inconsistency. The controls included are: a)
firm characteristics, such as size, age of the firm since founding, ROA, leverage, legal type, dummies for the sector of activity;
b) firm-bank relationship characteristics, such as the number of banking relationships, the duration of the credit relationship with the main bank, the share of loans obtained by the main bank, geographical location; c) main bank characteristics, such as a
dummy variable equals to one if the bank is local; d) variables controlling for the characteristics of the environment where the
firms operates, such as the Herfindahl-Hirschman Index on bank loans, in the province, and provincial value added growth. For more information, exact definitions and details see the Table A1. * significant at 10%; ** significant at 5%; *** significant at
1%. The table also reports the Pseudo R2.
40
Table 5. Robustness check
(1) (2) (3) (4) (5)
Probit Probit Probit Probit Probit
VARIABLES RATIONED RATIONED RATIONED RATIONED RATIONED
Placebo test Credit Rationing in the province
One or two bank relationships
Share of the main
bank on total
debt > .50
Rank analysis
Mismatch -0.016 0.536*** 0.066*** 0.593***
(0.095) (0.089) (0.043) (0.129)
Rationing in the province 3.089***
(0.654)
Rank 0.022***
(0.003)
Area dummies Y Y Y Y Y
+ control Y Y Y Y Y
Observations 821 749 103 475 749
Pseudo R-squared 0.067 0.202 0.385 0.117 0.146
Note: The table reports regression marginal effects and associated robust standard errors (in parentheses). The dependent
variable and the estimation method are reported at the top of each column. Mismatch is a proxy of bank-firm type
inconsistency. “+ controls” denotes the RHS variables of the regressions in Table 2. For more information, exact
definitions and details see the Table A1. * significant at 10%; ** significant at 5%; *** significant at 1%. The table
reports the Pseudo R2.
41
Table 6. Non linear effects
Panel A: Sub-samples
(1) (2) (3) (4) (5)
Probit Probit Probit Probit Probit
VARIABLES RATIONED RATIONED RATIONED RATIONED RATIONED Traditional High Tech Scale No scale
Mismatch 1.020*** 0.792*** 0.000 0.295 0.609***
(0.204) (0.166) (0.000) (0.203) (0.119)
Mismatch squared -0.707***
(0.253)
Area dummies Y Y Y Y Y
+ controls Y Y Y Y Y
Observations 749 356 27 142 607
Pseudo R-squared 0.148 0.201 - 0.120 0.137
Panel B: Interactions
(2) (3) (4) (5)
Probit Probit Probit Probit
VARIABLES RATIONED RATIONED RATIONED RATIONED
Traditional High Tech Scale No Scale
Mismatch 0.383*** 0.565*** 0.621*** 0.315**
(0.097) (0.102) (0.121) (0.152)
Mismatch * Traditional 0.447**
(0.195)
Mismatch * HighTech -0.192
(0.283)
Mismatch * Scale -0.306*
(0.175)
Mismatch * NoScale 0.306*
(0.175)
Area dummies Y Y Y Y
+ controls Y Y Y Y
Observations 749 749 749 749
Pseudo R-squared 0.149 0.140 0.144 0.144
Note: The table reports regression marginal effects and associated robust standard errors (in parentheses). The
dependent variable and the estimation method are reported at the top of each column. The regressions in Panel A are
estimated by running separate subsample regressions; the regressions in Panel B are estimated by interacting Mismatch
with the characteristic used to split the sample. Mismatch is a proxy of bank-firm type inconsistency. “+ controls”
denotes the RHS variables of the regressions in Table 2. For more information, exact definitions and details see the
Table A1. * significant at 10%; ** significant at 5%; *** significant at 1%. The table also reports the Pseudo R2.
42
Table 7. Firm characteristics
Panel A: Sub-samples
(1) (2) (3) (4) (5) (6) (7) (8)
Probit Probit Probit Probit Probit Probit Probit Probit
VARIABLES RATIONED RATIONED RATIONED RATIONED RATIONED RATIONED RATIONED RATIONED Audit No Audit Age < 12 Age < 21 Age > 29 Rel. length <10 Rel. length <15 Rel. length <24
Mismatch 0.578*** 0.529*** 0.843*** 0.667*** 0.478*** 0.241 0.490*** 0.539***
(0.165) (0.115) (0.263) (0.145) (0.139) (0.208) (0.140) (0.115)
Area dummies Y Y Y Y Y Y Y Y
+ controls Y Y Y Y Y Y Y Y
Observations 226 502 169 363 180 173 342 559
Pseudo R-squared 0.118 0.206 0.206 0.150 0.310 0.197 0.154 0.151
Panel B: Interactions
(1-2) (3) (4) (5) (6) (7) (8)
Probit Probit Probit Probit Probit Probit Probit
VARIABLES RATIONED RATIONED RATIONED RATIONED RATIONED RATIONED RATIONED Audit Age < 12 Age < 21 Age > 29 Rel. length <10 Rel. length <15 Rel. length <24
Mismatch 0.648*** 0.520*** 0.464*** 0.653*** 0.646*** 0.642*** 0.601***
(0.055) (0.099) (0.116) (0.118) (0.116) (0.146) (0.198)
Mism.* Audit -0.250*
(0.144)
Mism.* Age<12 0.171
(0.258)
Mism.* Age<21 0.192
(0.180)
Mism.* Age>29 -0.300*
(0.176)
Mism.* Rel.l. <10 -0.409**
(0.185)
Mism.* Rel.l. <15 -0.195
(0.177)
Mism.* Rel.l. <24 -0.070
(0.216)
Area dummies Y Y Y Y Y Y Y
+ controls Y Y Y Y Y Y Y
Observations 744 749 749 749 787 787 787
Pseudo R-squared 0.145 0.138 0.139 0.143 0.145 0.142 0.142
Note: The table reports regression marginal effects and associated robust standard errors (in parentheses). The dependent variable and the estimation method are
reported at the top of each column. The regressions in Panel A are estimated by running separate subsample regressions; the regressions in Panel B are estimated by
interacting Mismatch with the characteristic used to split the sample. Mismatch is a proxy of bank-firm type inconsistency. “+ controls” denotes the RHS variables
of the regressions in Table 2. For more information, exact definitions and details see the Table A1. * significant at 10%; ** significant at 5%; *** significant at 1%.
The table also reports the Pseudo R2.
43
Table 8. Bank characteristics
Panel A: Sub-samples
(1) (2) (3) (4)
Probit Probit Probit Probit
VARIABLES RATIONED RATIONED RATIONED RATIONED No turnover Turnover Local bank National bank
Mismatch 0.243* 0.686*** 1.034*** 0.562***
(0.135) (0.138) (0.205) (0.125)
Area dummies Y Y Y Y
+ controls Y Y Y Y
Observations 166 559 376 357
Pseudi R-squared 0.240 0.163 0.233 0.142
Panel B: Interactions
(1-2) (3-4)
Probit Probit
VARIABLES RATIONED RATIONED No turnover Local bank
Mismatch 0.650*** 0.393***
(0.142) (0.094)
Mismatch * No Turnover loan officer -0.300*
(0.178)
Mismatch * Local bank 0.654***
(0.240)
Area dummies Y Y
+ controls Y Y
Observations 749 749
Pseudo R-squared 0.149 0.152
Note: The table reports regression coefficients and associated robust standard errors (in parentheses). The dependent
variable and the estimation method are reported at the top of each column. The regressions in Panel A are estimated by
running separate subsample regressions; the regressions in Panel B are estimated by interacting Mismatch with the
characteristic used to split the sample. Mismatch is a proxy of bank-firm type inconsistency. “+ controls” denotes the
RHS variables of the regressions in Table 2. For more information, exact definitions and details see the Table A1. *
significant at 10%; ** significant at 5%; *** significant at 1%. The table also reports the Pseudo R2.
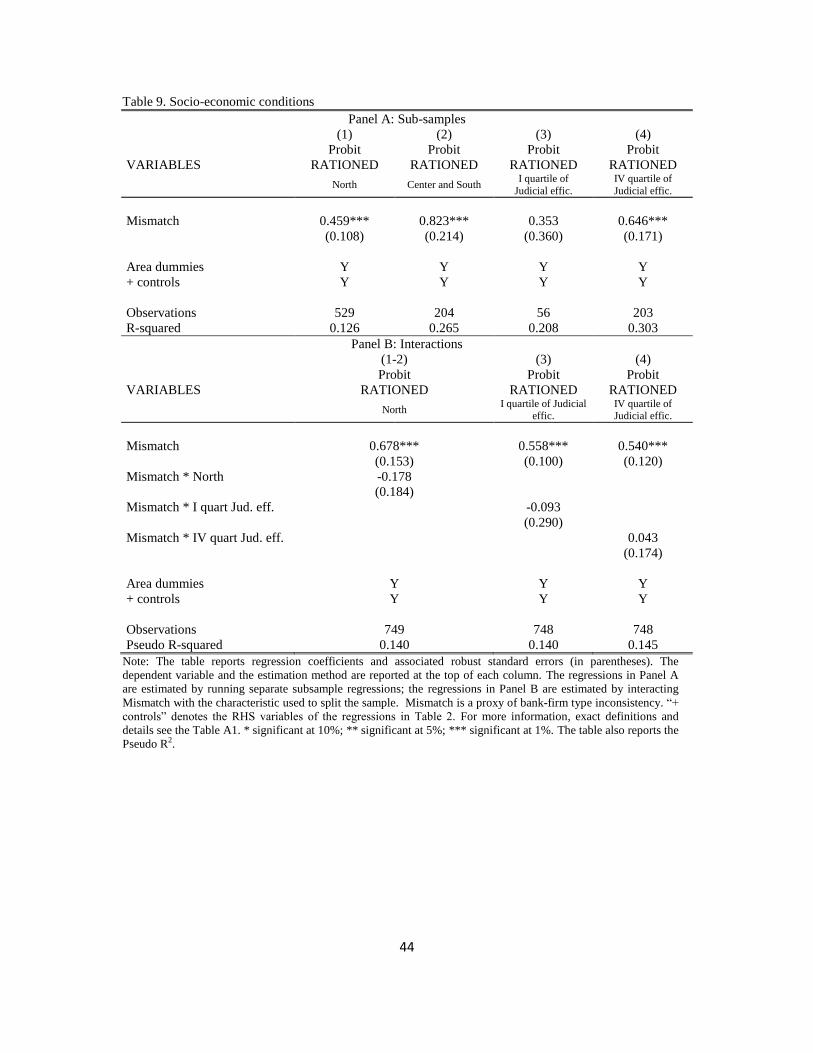
44
Table 9. Socio-economic conditions
Panel A: Sub-samples
(1) (2) (3) (4)
Probit Probit Probit Probit
VARIABLES RATIONED RATIONED RATIONED RATIONED
North Center and South I quartile of
Judicial effic.
IV quartile of
Judicial effic.
Mismatch 0.459*** 0.823*** 0.353 0.646***
(0.108) (0.214) (0.360) (0.171)
Area dummies Y Y Y Y
+ controls Y Y Y Y
Observations 529 204 56 203
R-squared 0.126 0.265 0.208 0.303
Panel B: Interactions
(1-2) (3) (4)
Probit Probit Probit
VARIABLES RATIONED RATIONED RATIONED
North I quartile of Judicial
effic. IV quartile of Judicial effic.
Mismatch 0.678*** 0.558*** 0.540***
(0.153) (0.100) (0.120)
Mismatch * North -0.178
(0.184)
Mismatch * I quart Jud. eff. -0.093
(0.290)
Mismatch * IV quart Jud. eff. 0.043
(0.174)
Area dummies Y Y Y
+ controls Y Y Y
Observations 749 748 748
Pseudo R-squared 0.140 0.140 0.145
Note: The table reports regression coefficients and associated robust standard errors (in parentheses). The
dependent variable and the estimation method are reported at the top of each column. The regressions in Panel A
are estimated by running separate subsample regressions; the regressions in Panel B are estimated by interacting
Mismatch with the characteristic used to split the sample. Mismatch is a proxy of bank-firm type inconsistency. “+
controls” denotes the RHS variables of the regressions in Table 2. For more information, exact definitions and
details see the Table A1. * significant at 10%; ** significant at 5%; *** significant at 1%. The table also reports the
Pseudo R2.
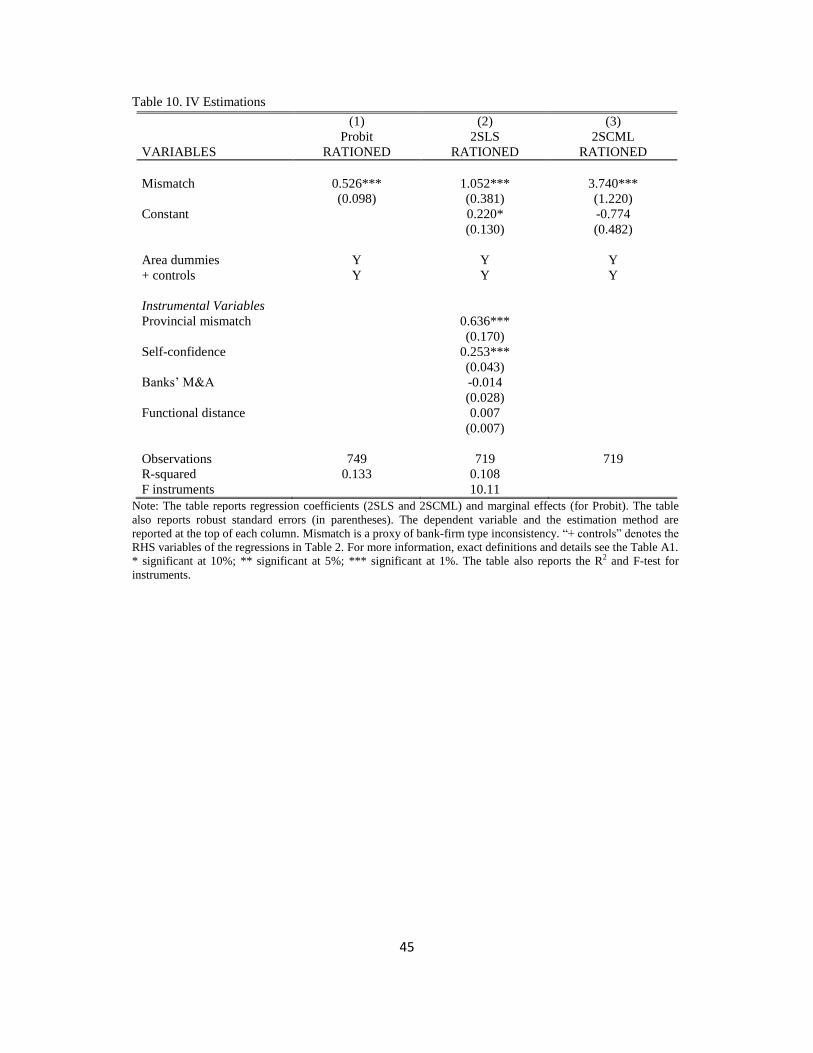
45
Table 10. IV Estimations
(1) (2) (3)
Probit 2SLS 2SCML
VARIABLES RATIONED RATIONED RATIONED
Mismatch 0.526*** 1.052*** 3.740***
(0.098) (0.381) (1.220)
Constant 0.220* -0.774
(0.130) (0.482)
Area dummies Y Y Y
+ controls Y Y Y
Instrumental Variables
Provincial mismatch 0.636***
(0.170)
Self-confidence 0.253***
(0.043)
Banks’ M&A -0.014
(0.028)
Functional distance 0.007
(0.007)
Observations 749 719 719
R-squared 0.133 0.108
F instruments 10.11
Note: The table reports regression coefficients (2SLS and 2SCML) and marginal effects (for Probit). The table
also reports robust standard errors (in parentheses). The dependent variable and the estimation method are
reported at the top of each column. Mismatch is a proxy of bank-firm type inconsistency. “+ controls” denotes the
RHS variables of the regressions in Table 2. For more information, exact definitions and details see the Table A1.
* significant at 10%; ** significant at 5%; *** significant at 1%. The table also reports the R2 and F-test for
instruments.
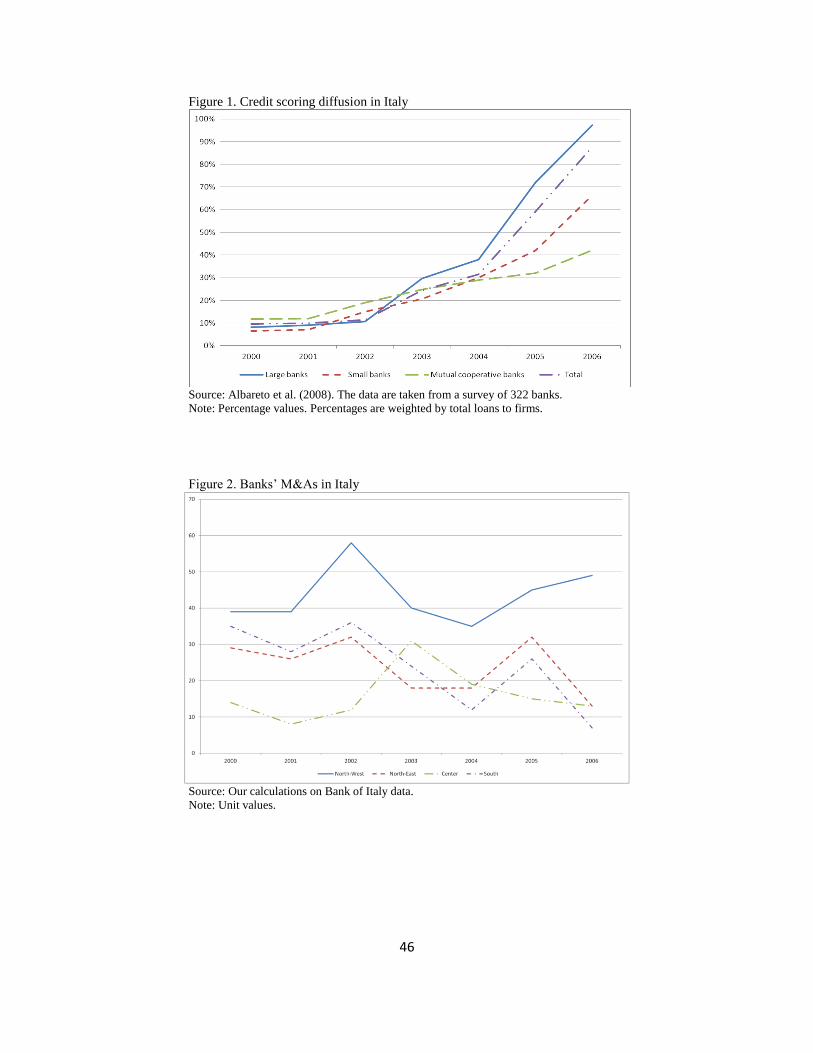
46
Figure 1. Credit scoring diffusion in Italy
Source: Albareto et al. (2008). The data are taken from a survey of 322 banks.
Note: Percentage values. Percentages are weighted by total loans to firms.
Figure 2. Banks’ M&As in Italy
Source: Our calculations on Bank of Italy data.
Note: Unit values.
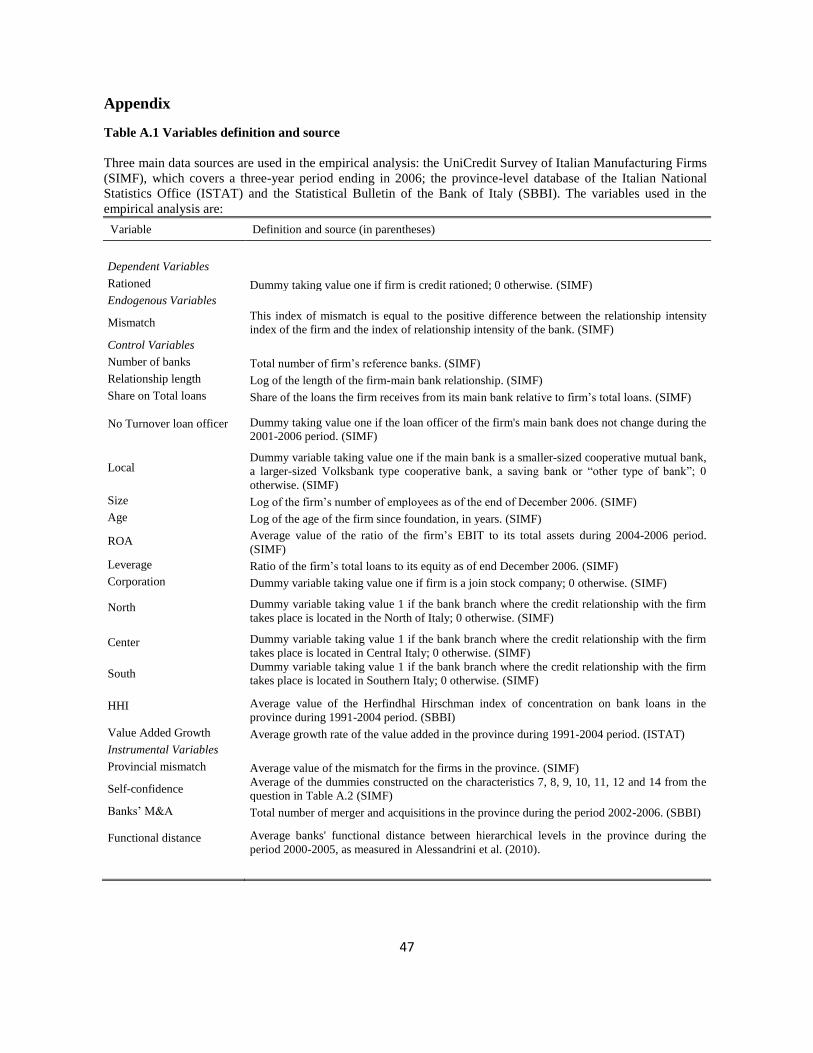
47
Appendix
Table A.1 Variables definition and source
Three main data sources are used in the empirical analysis: the UniCredit Survey of Italian Manufacturing Firms
(SIMF), which covers a three-year period ending in 2006; the province-level database of the Italian National
Statistics Office (ISTAT) and the Statistical Bulletin of the Bank of Italy (SBBI). The variables used in the
empirical analysis are:
Variable Definition and source (in parentheses)
Dependent Variables
Rationed Dummy taking value one if firm is credit rationed; 0 otherwise. (SIMF)
Endogenous Variables
Mismatch This index of mismatch is equal to the positive difference between the relationship intensity
index of the firm and the index of relationship intensity of the bank. (SIMF)
Control Variables
Number of banks Total number of firm’s reference banks. (SIMF)
Relationship length Log of the length of the firm-main bank relationship. (SIMF)
Share on Total loans Share of the loans the firm receives from its main bank relative to firm’s total loans. (SIMF)
No Turnover loan officer Dummy taking value one if the loan officer of the firm's main bank does not change during the
2001-2006 period. (SIMF)
Local Dummy variable taking value one if the main bank is a smaller-sized cooperative mutual bank,
a larger-sized Volksbank type cooperative bank, a saving bank or “other type of bank”; 0
otherwise. (SIMF)
Size Log of the firm’s number of employees as of the end of December 2006. (SIMF)
Age Log of the age of the firm since foundation, in years. (SIMF)
ROA Average value of the ratio of the firm’s EBIT to its total assets during 2004-2006 period.
(SIMF)
Leverage Ratio of the firm’s total loans to its equity as of end December 2006. (SIMF)
Corporation Dummy variable taking value one if firm is a join stock company; 0 otherwise. (SIMF)
North Dummy variable taking value 1 if the bank branch where the credit relationship with the firm
takes place is located in the North of Italy; 0 otherwise. (SIMF)
Center Dummy variable taking value 1 if the bank branch where the credit relationship with the firm
takes place is located in Central Italy; 0 otherwise. (SIMF)
South Dummy variable taking value 1 if the bank branch where the credit relationship with the firm
takes place is located in Southern Italy; 0 otherwise. (SIMF)
HHI Average value of the Herfindhal Hirschman index of concentration on bank loans in the
province during 1991-2004 period. (SBBI)
Value Added Growth Average growth rate of the value added in the province during 1991-2004 period. (ISTAT)
Instrumental Variables
Provincial mismatch Average value of the mismatch for the firms in the province. (SIMF)
Self-confidence Average of the dummies constructed on the characteristics 7, 8, 9, 10, 11, 12 and 14 from the
question in Table A.2 (SIMF)
Banks’ M&A Total number of merger and acquisitions in the province during the period 2002-2006. (SBBI)
Functional distance Average banks' functional distance between hierarchical levels in the province during the
period 2000-2005, as measured in Alessandrini et al. (2010).
Copyright © 2022 FDOKUMEN