Do Fans Impact the Results of English Premier League - Elon ...
22
Issues in Political Economy, Vol 30(2), 2021, 46-67 46 Mythical Influence: Do Fans Impact the Results of English Premier League Soccer Matches? Michael McShane, Stonehill College “Football is nothing without fans” – Sir Matt Busby. Manchester United and Football Legend Fans are the lifeblood of the sports industry. Their demand for sports keeps the industry afloat. Sports allow people to escape from their day-to-day lives and become part of something bigger. Fans tend to have a relationship with the team they support. Fans are the consumers that drive the sports market while teams provide fans with a meaningful connection to something, they hold dear. 1 The COVID-19 pandemic posed an interesting natural experiment that economists will study extensively in the years to come. The pandemic altered almost all aspects of life. Nations across the globe closed restaurants, shops, and banned large gatherings of people. One industry that was affected by this change was sports. 2 Fans were banned from stadiums across the globe. Does a ban on attendance impact home-field advantage? Since fans are such passionate and loyal consumers, many believe that their presence at a sporting event has profound effects on game outcomes. English soccer fans are known as some of the most passionate fans in the world. 3 Pundits and experts of English soccer unanimously argue that fans play a role in the environment of a match, including the ability to influence the result of a soccer game. These pundits believe that fans can create an environment that aids the home team through encouragement and support while hindering the away side through hostile behavior. 4 Hostile fan behavior also can impact referee decisions. This paper examines whether fans can alter team performance and referee decisions. The pandemic provides a unique natural experiment for determining whether fans have a noticeable impact on home-field advantage. In a sports competition, teams are in a market for wins. More specifically, in an English Premier League (EPL) match, two teams compete for points. The number of points a club earns over the course of a season determine their league position. Where teams finish in the league ultimately decides the prize money that gets added to their transfer and wage budget. 5 The EPL resumed their competition during Project Restart and played games without fans in attendance. English soccer’s best-known pundits inferred that without fans, home-field advantage was significantly lower. They argued that stronger sides seemed to win more games at away grounds because home-field advantage was less without fans. 6 1 DeSarbo, Wayne, and Robert Madrigal. 2012. "Exploring the Demand Aspects of Sports Consumption and Fan Avidity." Pages 199-203. 2 Ames, Nick. 2020. " Premier League Project Restart: the key questions answered." 3 Kuper, Simon, and Stefan Szymanski. 2018. Soccernomics. 4 Ames, Nick. 2020. " Premier League Project Restart: the key questions answered." 5 Kuper, Simon, and Stefan Szymanski. 2018. Soccernomics. 6 Mustoe, Robbie, and Robbie Earle. 2020. The 2 Robbies.
-
Upload
khangminh22 -
Category
Documents
-
view
1 -
download
0
Transcript of Do Fans Impact the Results of English Premier League - Elon ...

Issues in Political Economy, Vol 30(2), 2021, 46-67
46
Mythical Influence: Do Fans Impact the Results of English Premier League Soccer
Matches?
Michael McShane, Stonehill College
“Football is nothing without fans” – Sir Matt Busby. Manchester United and Football Legend
Fans are the lifeblood of the sports industry. Their demand for sports keeps the industry afloat.
Sports allow people to escape from their day-to-day lives and become part of something bigger.
Fans tend to have a relationship with the team they support. Fans are the consumers that drive the
sports market while teams provide fans with a meaningful connection to something, they hold
dear.1
The COVID-19 pandemic posed an interesting natural experiment that economists will study
extensively in the years to come. The pandemic altered almost all aspects of life. Nations across
the globe closed restaurants, shops, and banned large gatherings of people. One industry that was
affected by this change was sports.2 Fans were banned from stadiums across the globe. Does a
ban on attendance impact home-field advantage?
Since fans are such passionate and loyal consumers, many believe that their presence at a
sporting event has profound effects on game outcomes. English soccer fans are known as some
of the most passionate fans in the world.3 Pundits and experts of English soccer unanimously
argue that fans play a role in the environment of a match, including the ability to influence the
result of a soccer game. These pundits believe that fans can create an environment that aids the
home team through encouragement and support while hindering the away side through hostile
behavior.4 Hostile fan behavior also can impact referee decisions. This paper examines whether
fans can alter team performance and referee decisions.
The pandemic provides a unique natural experiment for determining whether fans have a
noticeable impact on home-field advantage. In a sports competition, teams are in a market for
wins. More specifically, in an English Premier League (EPL) match, two teams compete for
points. The number of points a club earns over the course of a season determine their league
position. Where teams finish in the league ultimately decides the prize money that gets added to
their transfer and wage budget.5
The EPL resumed their competition during Project Restart and played games without fans in
attendance. English soccer’s best-known pundits inferred that without fans, home-field
advantage was significantly lower. They argued that stronger sides seemed to win more games at
away grounds because home-field advantage was less without fans.6
1 DeSarbo, Wayne, and Robert Madrigal. 2012. "Exploring the Demand Aspects of Sports Consumption and Fan
Avidity." Pages 199-203. 2 Ames, Nick. 2020. " Premier League Project Restart: the key questions answered." 3 Kuper, Simon, and Stefan Szymanski. 2018. Soccernomics. 4 Ames, Nick. 2020. " Premier League Project Restart: the key questions answered." 5 Kuper, Simon, and Stefan Szymanski. 2018. Soccernomics. 6 Mustoe, Robbie, and Robbie Earle. 2020. The 2 Robbies.

Issues in Political Economy, 2021
47
To answer this question, this paper examines numerous factors that determine the outcome of
soccer matches. Beyond looking at in-game events, I control for other factors including
differences in team quality, and of course, variables that measure attendance. In this paper,
home-field advantage is quantified by the goal differential of the home team. The outcome of a
soccer match for a home team is determined by what happens on the field and external
advantages such as better players, coaches, and home field advantage effects. Using this logic,
the broad theoretical model is as follows:
𝐻𝑜𝑚𝑒 𝑀𝑎𝑡𝑐ℎ 𝑂𝑢𝑡𝑐𝑜𝑚𝑒 = 𝐹(𝑀𝑎𝑡𝑐ℎ 𝐸𝑣𝑒𝑛𝑡𝑠, 𝐸𝑥𝑡𝑒𝑟𝑛𝑎𝑙 𝐴𝑑𝑣𝑎𝑛𝑡𝑎𝑔𝑒𝑠)
I expect fans to be a key component of home-field advantage. England is a relatively small
country geographically and most of the country has a similar climate7. Because of these factors, I
theorize that home-field advantage in the English Premier League is determined largely by the
effect fans have on fixtures. This paper measures fans using attendance and the natural log of
attendance. I expect home goal differential to be significantly lower when games are played in
front of fewer fans. As was apparent in Anders and Rotthoff (2014), I expect fans to contribute to
home-field advantage.8
This paper also includes two extensions of my initial research. The first extension examines the
impact Project Restart had on referee behavior. I expect that the decisions referees make in
games without fans have a larger impact on goal differential than games played with fans
present, due to pressure from fans affects referee decision making. The second extension looks at
the Pythagorean Expectation applied to soccer. The Pythagorean Expectation converts goals for
and goals against into expected points per game. I expect the average points per game for home
teams will be significantly lower when games are played without fans because prior research
finds that fans contribute to home-field advantage.
II. LITERATURE REVIEW
Topic sentences about each piece and how it fits into your overview can help. An article
published in Current Directions in Psychological Science titled “The “Home Advantage” in
Athletic Competitions by Mark S. Allen and Mark V. Jones argues that “game location has a
powerful influence on performance outcomes in sport. This article examines the psychological
factors behind home-field advantage and how these factors contribute to outcomes of sporting
events.
Allen and Jones break down home-field advantage into three components. They conclude that
game-location factors, not including fans, alter an athlete’s psychological state. They find that
“home-effects remain large” even in the absence of fans due to various other factors including
“travel fatigue, familiarity with the home venue, and competition rules that favor the home
7 In the United States, climate, travel distance, and time zones vary greatly across the country. This challenges
professional sports teams to adapt to various conditions that greatly affect games. England’s geography and climate
are relatively consistent across the country. Weather, elevation, and other geographical factors play a much smaller
role in the EPL than America’s major sports. 8 Anders, Anne, and Kurt William Rotthoff. 2014. "Is home-field advantage driven by the fans" Pages 1165-1168
Fans Impact on English Premier League Soccer
48
team”.9 Some teams face travel fatigue when they need to fly out of the country to play in
European competitions such as the UEFA Champions League and the UEFA Europa League
during the middle of a week. Not all teams play in European competition. The data in this paper
(McShane 2021) does not count for those travel effects. Travel distances between EPL clubs is
significantly smaller than teams in North American sports leagues, and therefore, make testing
travel effects less meaningful for this study.
Allen and Jones found the second factor behind home-field advantage to be one’s “natural
protective response to territorial incursion”.10 Their study found that elite Jr. Hockey Players had
a significantly higher level of testosterone in home matches as opposed to away matches. Allen
and Jones believe that the origin of this is because people are naturally territorial over what they
perceive as theirs. They argue that players are protective over their home field and this instinct
helps players of a home team become more motivated before a match than an away team.11 This
component of home-field advantage matters regardless of fans being present at the match.
The final component they cite is the involuntary responses that players have to spectators present
at the match.12 Their research finds that home teams are more successful in the presence of large
encouraging audiences. They argue that fan structure and behavior play a role in determining
home-field advantage.13 They also consider the possibility that fans may be the source of a
disadvantage of the home team by explaining that the added pressure of playing in front of home
fans may increase the probability of choking.14 Their research suggests, the home-advantage or
home-disadvantage effects of fans should only be apparent in games played in front of fans.
Erin E. Smith and Jon D. Groetzinger examine how fans affect home-field advantage in baseball
in their article “Do Fans Matter? The Effect of Attendance on the Outcomes of Major League
Baseball Games”. Although baseball and soccer are completely different sports, this paper
utilizes a sound model that can be adapted to other sports. They use a two-stage model where
performance is a function of %Attendance and other controls.15 Smith and Groetzinger find that
there are four layers to fan’s impact on home-field advantage. First, they “quantify” fan impact
on home-field advantage, by demonstrating that a one standard deviation increase in the number
of fans increases the likelihood of a home win by 5.4%.16 They then “show how attendance
impacts relevant performance statistics”.17 Through these first two results, they determine that
the advantage that arises from home fans is “generated by superior performance of the home
team and not from fan-generated umpire bias”.18
The article “Is home-field advantage driven by the fans? Evidence from across the ocean” by
Anne Anders and Kurt William Rotthoff follows a similar model to that of Smith and
Groetzinger (2009). Anders and Rotthoff utilize their model to determine fan effects on the
9 Allen, Mark S., and Mark V. Jones. 2014. "The "Home Advantage". Page 48 10 Allen, Mark S., and Mark V. Jones. 2014. "The "Home Advantage". Page 49 11 Allen, Mark S., and Mark V. Jones. 2014. "The "Home Advantage". Pages 48-50 12 Allen, Mark S., and Mark V. Jones. 2014. "The "Home Advantage". Page 51 13 Allen, Mark S., and Mark V. Jones. 2014. "The "Home Advantage". Pages 49-50 14 Allen, Mark S., and Mark V. Jones. 2014. "The "Home Advantage". Page 48 15 Smith, Erin E., and John D. Groetzinger. 2010. "Do Fans Matter?". Pages 8-10 16 Smith, Erin E., and John D. Groetzinger. 2010. "Do Fans Matter?". Pages 12-13 17 Smith, Erin E., and John D. Groetzinger. 2010. "Do Fans Matter?". Page 3 18 Smith, Erin E., and John D. Groetzinger. 2010. "Do Fans Matter?". Page 4

Issues in Political Economy, 2021
49
Bundesliga and Major League Soccer (MLS). Their paper also builds off the research in Dohmen
(2008). Through their summary statistics, they identify that home-field bias is apparent in both
the Bundesliga and the MLS. The home team wins 46% and 48% of the time in each league
respectively. Those numbers are both higher than the percentage of games lost by home teams.19
In soccer, some games end in ties. That is why the percentage of home team wins is less than
50% but still greater than the percentage of home team losses. Anders and Rotthoff use a binary
Probit Model that follows Anders and Rotthoff (2011) and analyze the effects of different kinds
of fouls, shots, and attendance on match outcome.
Anders and Rotthoff (2011) examine the effects of attendance, attendance squared (to control for
any curve possibilities), and the natural log of attendance (to see if it is a percentage change in
attendance that impacts the possibility of the home team winning the match. They use separate
models when examining attendance effects. The first model they use examines fan effects
through attendance and attendance squared. The second model they use examines fan effects
through the natural log of attendance.20
They find that the home team’s probability of winning in the Bundesliga increases by 9% when
there is a 1% increase in attendance. They also find that there is no evidence that matters in the
MLS. Through their results, they conclude that the social pressure on the referee by the fans
attending the game can lead to bias decision-making in the Bundesliga. They also conclude that
the social influences of fans are driven by the size of the fan base.21 This tells a deeper story on
the influence of fans and the conclusions from Anders and Rothoff (2014) regarding fans'
influence on referee decisions are a key reason why I examine fan effects on Premier League
referees.
Their results can be divided into interpreting the effects of referee decisions and the effects of
attendance. Anders and Rotthoff find that the probability of the home team winning decreases by
6%. significant at the one percent significance level, if the home team receives a yellow card in
the Bundesliga, unlike the MLS where there is no statistical impact of receiving a red card.
Yellow cards and red cards discipline players due to misconduct during the game. Yellow cards
signify that a player has been cautioned due to foul play. Red cards signify that a player is being
sent off for accumulating two yellow cards or committing a serious foul offence. When a player
receives a red card, that team must finish the game with one less player. In the Bundesliga, the
probability of the home team winning decreases 42% when they receive a straight red card and
decreases by 21% when they receive a second yellow card that leads to a red card. In MLS, they
find that a red card is statistically significant in determining game outcome and decreases the
probability the home team will win by 14%.22 They also find that home team fouls increase the
probability the home team will win by 6% in the Bundesliga and 10% in the MLS, suggesting
that teams should adopt a “playing hard strategy, but not to the point of receiving cards”.23 They
find the effects of fouls and cards are essentially the same no matter how they measure fans.
19 Professional soccer games can end in a draw. Anders and Rotthoff find that home teams win or draw roughly 55%
and 53% in the Bundesliga and MLS respectively. 20 Anders, Anne, and Kurt William Rotthoff. 2014. "Is home-field advantage driven by the fans" Page 1166 21 Anders, Anne, and Kurt William Rotthoff. 2014. "Is home-field advantage driven by the fans" Pages 1167-1168 22 Anders, Anne, and Kurt William Rotthoff. 2014. "Is home-field advantage driven by the fans" Page 1168 23 Anders, Anne, and Kurt William Rotthoff. 2014. "Is home-field advantage driven by the fans" Page 1168

Fans Impact on English Premier League Soccer
50
The English Premier League resembles the Bundesliga in that both are among the world’s elite
soccer competitions. I expect my results to be similar to the results of the Bundesliga from
Anders and Rotthoff (2014).
III. MODEL AND THEORY
I developed a basic theoretical model to guide my empirical research. I integrated prior
knowledge of soccer, econometrics, and the Premier League to develop this model. The initial
theoretical model I used was:
Home Match Outcome = F(In Game Factors, Home Quality Advantages, Fan Impact)
With this framework in mind, I looked to see if prior research followed a more specific version
of my general model.
The model I follow uses OLS and regression analysis to determine the effects of independent
variables, including attendance, on HomeGD and HomexGD. I expand on previous literature and
the model in Anders and Rotthoff (2014) by examining the effect home quality advantage has on
match outcome, by measuring game outcome as having a wider range than a simple Probit
Model, and by analyzing a league not included in their prior research.24 As discussed earlier,
team performance in a soccer match is not binary. Therefore, HomeGD and HomexGD are the
best dependent variables available for this model.
The primary model for this paper is the model in Section VI. This model accounts for in game
events, home quality advantages, as well as any impact attendance may have. The other models
provide valuable insight to more specific areas of fan impact. However, the model in Section VI.
does not operate under any assumptions that exclude important independent variables.
IV. DATA EXPLANATION I – DATA GENERATION AND METHOD
Data for this empirical study on the English Premier League is widely available. Soccer was one
of the last sports realize the benefit of statistical analysis.25 Soccer, especially English soccer, has
been plagued by a lack of willingness to adapt, innovate, and embrace, the science sport. Many
involved in soccer view statistics as a threat rather than a tool. That belief has been changing.
Today, clubs across Europe are hiring data departments to formulate strategy and maintain
competitive edge.
The primary focus of soccer statistics is on in-game statistics; including goals, chances created,
shots, fouls, yellow cards, red cards, possession, and many more. These statistics are used to
develop tactics, recruit players, and manage the club. Clubs are disclosing more information and
data on factors that do not occur on the during matches including salary and match attendance.
24 Anders, Anne, and Kurt William Rotthoff. 2014. "Is home-field advantage driven by the fans" Pages 1165-1168 25 Kuper, Simon, and Stefan Szymanski. 2018. Soccernomics.

Issues in Political Economy, 2021
51
Most of my primary data is from Fbref.com and Football-data.co.uk. Fbref.com provided me
with data on match results, expected match results, and attendance information. Football-
data.co.uk provided me with data on shots, fouls, yellow cards, and red cards. I supplemented
this primary data with information from club websites, the Premier League Website, and
Statista.com to source information on maximum stadium capacity and average salary per team.
The data in this study was cross checked by referring to the Premier League Website as well as
official club websites. The data includes all matches played during the 2018/19 season, and the
2019/20 season. The 2018/19 season was scheduled and played normally. The 2019/20 season
followed an original schedule until the COVID-19 pandemic interrupted the season before it
could resume in June.26
The Premier League has 20 teams that play each other home and away during a season. This dual
fixture schedule leads to each team playing 38 games a year for a total of 380 league matches
throughout the entire season. My analysis looks at the results of two Premier League seasons
factoring in data for 760 matches. Each season, the bottom three teams in the league are
relegated to the EFL Championship (Second Division) and the three top teams in the EFL
Championship are promoted to the Premier League. In total, the data looks at the 23 teams that
play in the 2018/19 and 2019/20 Premier League seasons. Three teams, Huddersfield, Cardiff,
and Fulham were relegated after the 2018/19 Premier League season. Three teams, Norwich,
Aston Villa, and Sheffield United, were promoted after the 2018/19 season to the Premier
League for 2019/20. These 6 teams only played in 38 fixtures in the data set. The remaining 17
teams played in 76 fixtures in the data set. Every team in the dataset played half of their games
home and half of their games away.27
I selected the dependent variables for my analysis based on the theory that match results
extend beyond simply looking at whether a team won, draw, or lost. In terms of team
performance, a 5-0 home team win is a more dominant performance than a 5-4 home team win.
The best way to measure home-team performance in any given match is to observe the team’s
goal differential. The first dependent variable in my study is Home Goal Differential (HomeGD).
Home Goal Differential is the difference between the number of goals the home team scored less
the number of goals the away team scored. The second dependent variable I observe is Expected
Home Goal Differential (HomexGD). Expected goals are the sum of the probabilities that a shot
will result in a goal based on various game characteristics. The factors that are used in
calculating expected goals include, location of the shooter, what body part was used, how the
shooter took the shot, and what the nature of the overall attack was.28 Expected Home Goal
Differential is simply the home team’s expected goals less the away team’s expected goals.
V. DATA EXPLANATION II – SUMMARY STATISTICS
Table 1 contains the summary statistics of dependent variables. The maximum Home Goal
Differential and Expected Home Goal Differential represents an 8-0 win by Manchester City
26 Ames, Nick. 2020. " Premier League Project Restart: the key questions answered." 27 FBRef.com. 2018-2019 Premier League Season, 2019-2020 Premier League Season. Premier League Stats 28 FBRef.com. 2018-2019 Premier League Season, 2019-2020 Premier League Season. Premier League Stats 28 Anders, Anne, and Kurt William Rotthoff. 2014. "Is home-field advantage driven by the fans" Pages 1166-1168

Fans Impact on English Premier League Soccer
52
over Watford. The minimum Home Goal Differential represents Southampton’s historic 9-0 loss
to Leicester City. The minimum Expected Home Goal Differential represents Brighton’s 5-0 loss
to Manchester City.
Table 1. Summary Statistics of Dependent Variables
Variable Obs Mean Std. Dev. Min Max
HomexGD 760 0.2302632 1.218243 -5 5.5
HomeGD 760 0.3131579 1.919825 -9 8
It is important to note that the standard deviation of Expected Home Goal Differential is less than
the standard deviation of Home Goal Differential. This is due to the difference in how the two
are measured. Expected Home Goal Differential measures each goal-scoring chance in a match
as having a different probability. For example, a chance that leads to a goal 30% of the time will
be valued at 0.3 goals. Expected Home Goal Differential does not measure every chance at a
value of less than 100% or 1.0 goals. On the other hand, Home Goal Differential is measured
completely in integers. For example, a chance that leads to a goal 30% of the time is either
counted as 0 or 1 depending on if a goal is scored. The standard deviation for Home Goal
Differential is higher than the standard deviation of Expected Home Goal Differential. The
difference between a chance that yields a goal and does not yield a goal is 1 when observing
Home Goal Differential. The difference between a chance that yields a goal and does not yield a
goal is the difference between two decimals less than one and greater than 0 which will always
yield a number less than 1. The higher variance in Home Goal Differential is subject to a lot of
randomness that does not always even out in a single match. Expected Home Goal Differential is
a measurement that effectively removes that randomness. Therefore, the variance and thus the
standard deviation of Expected Home Goal Differential is less than Home Goal Differential. This
is a very significant difference and is not a surprising result. Some events make each game
unique. These unique events in games, such as an impressive individual performance by a star
player, is why Home Goal Differential can be significantly higher or lower than Expected Home
Goal Differential.
In my model, I include home and away yellow cards, home and away red cards, home and away
fouls, home and away shots, and various measures of attendance.29 I measure the effects of fans
in three ways. Attendance refers to the number of fans present at a match. The first way I
measure fan impact is the natural log of attendance. The second way I measure fan impact is
attendance at a match. The final way I measure fan impact is through a dummy variable known
as FanDummy. For games with fans in attendance, the value is 1. For games without fans in
attendance during Project Restart, the value is 0.
The final part of my data included finding a statistic to control for the home team quality. The
first statistic I intended to use for this was the difference between the average number of points
the home and away team earned over the course of the season. However, that variable was highly
29 Football-Data.co.uk. Premier League Season 2018/2019, Premier League Season 2019/2020. Data Files:
England.
Issues in Political Economy, 2021
53
correlated with the dependent variables due to endogeneity bias.30 Therefore, I decided to use
salary as a measure of player quality. To capture variations of player quality, I calculated the
difference between the average salary of home and away teams. Ultimately, the variable chosen
was the natural log of the difference between home and away salary used to capture percentage
effects. In theory, the better the player, the higher the salary. Thus, teams with a higher average
salary tend to have better players.
Justification for the use of salary difference as a measure of the difference between home and
away quality comes from the work of Soccernomics by Simon Kuper and Stefan Szymanski.
Soccernomics utilizes data analysis, psychology, and economics to answer unique questions
about the game of soccer. Soccernomics analyzes the driving forces behind club performance in
league competitions. Kuper and Szymanski find that player salary has the strongest impact on
league position when compared to all other measures of club quality.31 Although salary variables
have their limitations when it comes to measuring team quality, it has the theoretical and
empirical support of reliable literature.
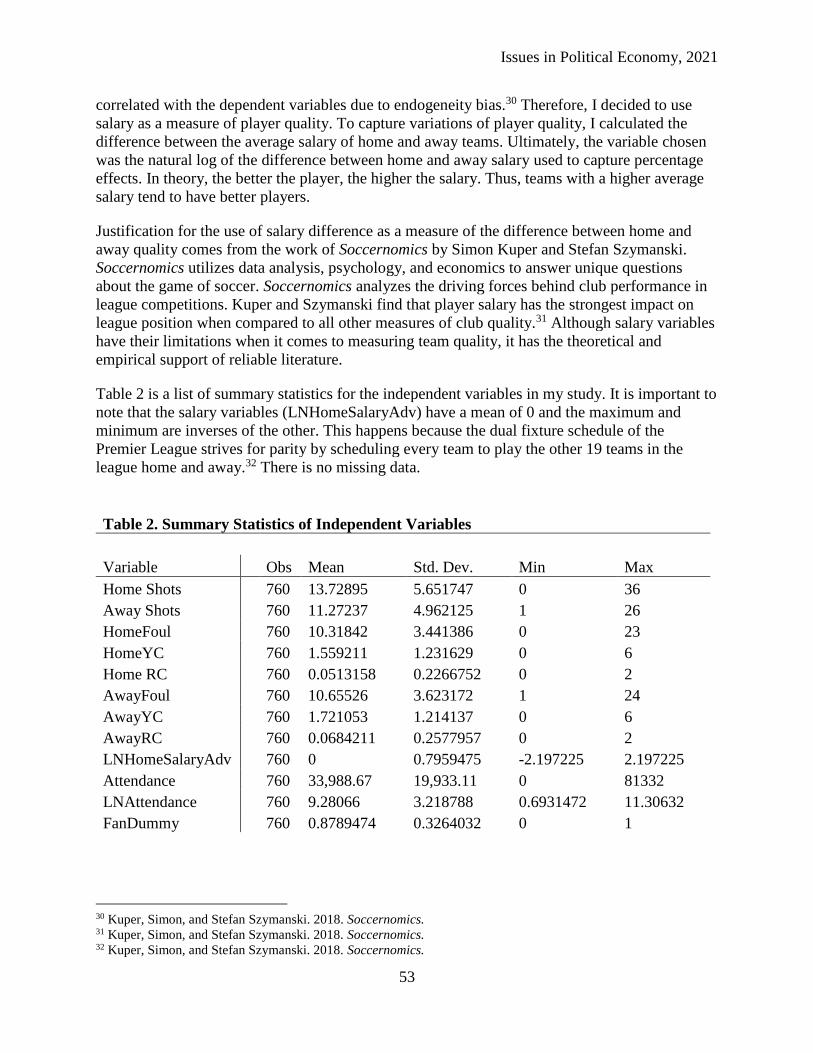
Table 2 is a list of summary statistics for the independent variables in my study. It is important to
note that the salary variables (LNHomeSalaryAdv) have a mean of 0 and the maximum and
minimum are inverses of the other. This happens because the dual fixture schedule of the
Premier League strives for parity by scheduling every team to play the other 19 teams in the
league home and away.32 There is no missing data.
Table 2. Summary Statistics of Independent Variables
Variable Obs Mean Std. Dev. Min Max
Home Shots 760 13.72895 5.651747 0 36
Away Shots 760 11.27237 4.962125 1 26
HomeFoul 760 10.31842 3.441386 0 23
HomeYC 760 1.559211 1.231629 0 6
Home RC 760 0.0513158 0.2266752 0 2
AwayFoul 760 10.65526 3.623172 1 24
AwayYC 760 1.721053 1.214137 0 6
AwayRC 760 0.0684211 0.2577957 0 2
LNHomeSalaryAdv 760 0 0.7959475 -2.197225 2.197225
Attendance 760 33,988.67 19,933.11 0 81332
LNAttendance 760 9.28066 3.218788 0.6931472 11.30632
FanDummy 760 0.8789474 0.3264032 0 1
30 Kuper, Simon, and Stefan Szymanski. 2018. Soccernomics. 31 Kuper, Simon, and Stefan Szymanski. 2018. Soccernomics. 32 Kuper, Simon, and Stefan Szymanski. 2018. Soccernomics.

Fans Impact on English Premier League Soccer
54
Below are empirical models I test through an OLS regression. Focusing on home-team results, I
regress the match-specific variables on the outcome of the match following two different
approaches.
VI. MODEL AND RESULTS I – CONTROLLING FOR HOME QUALITY
ADVANTAGE
This first model is the strongest empirical model in my analysis because it controls for home
quality. Focusing on home-team results, I regress the match-specific variables on the outcome of
the match following two different approaches. The first set of models accounts for home quality
advantage as a dependent variable measured by LN(HomeSalaryAdv):
1. 𝐻𝑜𝑚𝑒𝐺𝐷 = 𝛽1𝐻𝑆ℎ𝑜𝑡𝑠 + 𝛽2𝐴𝑆ℎ𝑜𝑡𝑠 + 𝛽3𝐻𝐹𝑜𝑢𝑙 + 𝛽4𝐻𝑌𝐶 + 𝛽5𝐻𝑅𝐶 + 𝛽6𝐴𝐹𝑜𝑢𝑙 + 𝛽7𝐴𝑌𝐶 + 𝛽8𝐴𝑅𝐶 + 𝛽9𝐿𝑁(𝐻𝑆𝑎𝑙𝑎𝑟𝑦𝐴𝑑𝑣) + 𝛽10𝐿𝑛(𝐴𝑡𝑡𝑒𝑛𝑑𝑎𝑛𝑐𝑒) + ℰ
2. 𝐻𝑜𝑚𝑒𝑥𝐺𝐷 = 𝛽1𝐻𝑆ℎ𝑜𝑡𝑠 + 𝛽2𝐴𝑆ℎ𝑜𝑡𝑠 + 𝛽3𝐻𝐹𝑜𝑢𝑙 + 𝛽4𝐻𝑌𝐶 + 𝛽5𝐻𝑅𝐶 + 𝛽6𝐴𝐹𝑜𝑢𝑙 + 𝛽7𝐴𝑌𝐶 + 𝛽8𝐴𝑅𝐶 + 𝛽9𝐿𝑁(𝐻𝑆𝑎𝑙𝑎𝑟𝑦𝐴𝑑𝑣) + 𝛽10𝐿𝑛(𝐴𝑡𝑡𝑒𝑛𝑑𝑎𝑛𝑐𝑒) + ℰ
3. 𝐻𝑜𝑚𝑒𝐺𝐷 = 𝛽1𝐻𝑆ℎ𝑜𝑡𝑠 + 𝛽2𝐴𝑆ℎ𝑜𝑡𝑠 + 𝛽3𝐻𝐹𝑜𝑢𝑙 + 𝛽4𝐻𝑌𝐶 + 𝛽5𝐻𝑅𝐶 + 𝛽6𝐴𝐹𝑜𝑢𝑙 + 𝛽7𝐴𝑌𝐶 + 𝛽8𝐴𝑅𝐶 + 𝛽9𝐿𝑁(𝐻𝑆𝑎𝑙𝑎𝑟𝑦𝐴𝑑𝑣) + 𝛽10𝐴𝑡𝑡𝑒𝑛𝑑𝑎𝑛𝑐𝑒 + ℰ
4. 𝐻𝑜𝑚𝑒𝑥𝐺𝐷 = 𝛽1𝐻𝑆ℎ𝑜𝑡𝑠 + 𝛽2𝐴𝑆ℎ𝑜𝑡𝑠 + 𝛽3𝐻𝐹𝑜𝑢𝑙 + 𝛽4𝐻𝑌𝐶 + 𝛽5𝐻𝑅𝐶 + 𝛽6𝐴𝐹𝑜𝑢𝑙 + 𝛽7𝐴𝑌𝐶 + 𝛽8𝐴𝑅𝐶 + 𝛽9𝐿𝑁(𝐻𝑆𝑎𝑙𝑎𝑟𝑦𝐴𝑑𝑣) + 𝛽10𝐴𝑡𝑡𝑒𝑛𝑑𝑎𝑛𝑐𝑒 + ℰ
The first two columns in Table 5 are measure attendance using the natural log of attendance the
last two columns measure attendance simply by looking at the sheer number of people in
attendance. When controlling for differences in club quality, all measures of attendance had
insignificant impacts on Home Goal Differential and Expected Home Goal Differential.
The effects of salary are statistically significant and pose real economic significance. This is in
line with Kuper and Syzmanski’s results where salary was a key driver of league position.33
Quality 1 and Quality 3 indicate that if LN(HomeSalaryAdvantage) increases by one, which is
about 1.25? standard deviations, Home Goal Differential increases by about 0.8. The effects of
salary on Home Goal Differential were higher than the effects of salary on Expected Home Goal
Differential, therefore demonstrating the randomness of actual versus expected goal differential.
Salary is a good indicator of match success. Better players demand higher salaries are paid to
better players. Having better players is a massive advantage in a soccer match.
Home Shots and Away Shots are statistically significant for both Home Goal Differential and
Expected Home Goal Differential. The results from Quality 1 and Quality 3 show that Home
Goal Differential increases by one when the home team takes an extra 29 to 31 shots. These
results also show that Home Goal Differential falls by one when the away team takes 16 extra
shots. The results from Quality 2 and Quality 4 show that Expected Home Goal Differential
increases by one when Home Shots increases by about 11 to 12 shots. Quality 2 and Quality 4
also show that Expected Home Goal Differential decreases by one when Away Shots increases
by about 10 to 11 shots.
33 Kuper, Simon, and Stefan Szymanski. 2018. Soccernomics.
Issues in Political Economy, 2021
55
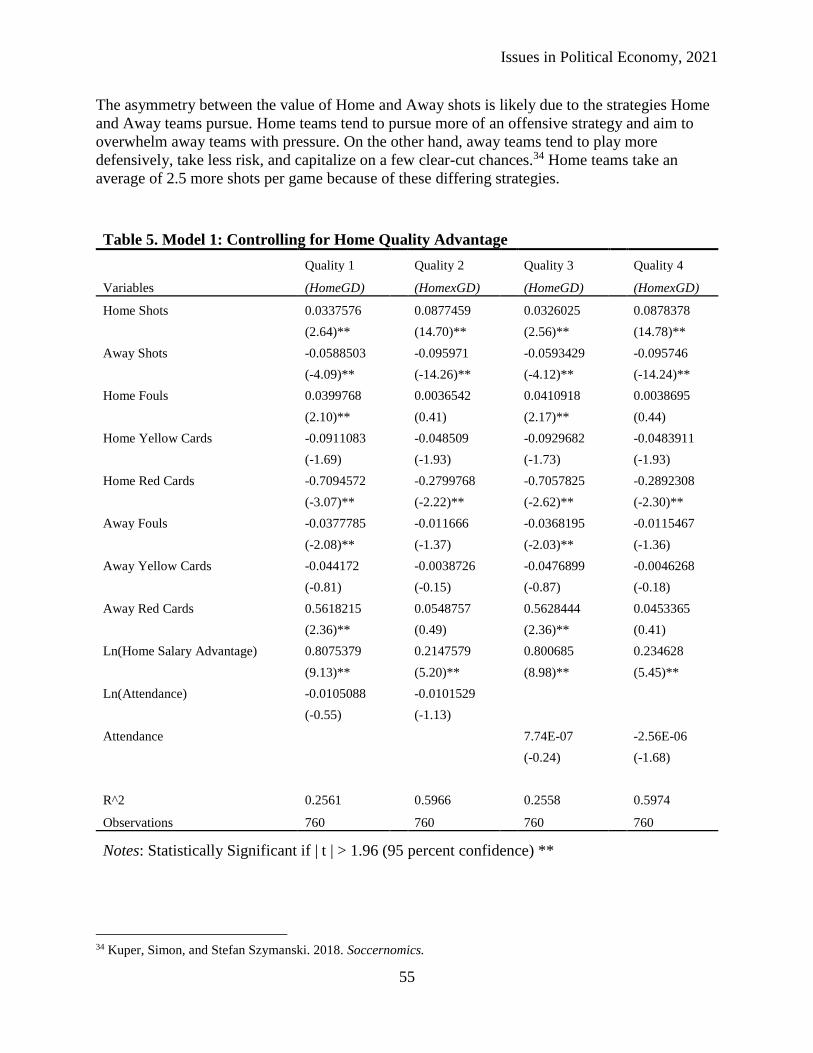
The asymmetry between the value of Home and Away shots is likely due to the strategies Home
and Away teams pursue. Home teams tend to pursue more of an offensive strategy and aim to
overwhelm away teams with pressure. On the other hand, away teams tend to play more
defensively, take less risk, and capitalize on a few clear-cut chances.34 Home teams take an
average of 2.5 more shots per game because of these differing strategies.
Table 5. Model 1: Controlling for Home Quality Advantage
Quality 1 Quality 2 Quality 3 Quality 4
Variables (HomeGD) (HomexGD) (HomeGD) (HomexGD)
Home Shots 0.0337576 0.0877459 0.0326025 0.0878378
(2.64)** (14.70)** (2.56)** (14.78)**
Away Shots -0.0588503 -0.095971 -0.0593429 -0.095746
(-4.09)** (-14.26)** (-4.12)** (-14.24)**
Home Fouls 0.0399768 0.0036542 0.0410918 0.0038695
(2.10)** (0.41) (2.17)** (0.44)
Home Yellow Cards -0.0911083 -0.048509 -0.0929682 -0.0483911
(-1.69) (-1.93) (-1.73) (-1.93)
Home Red Cards -0.7094572 -0.2799768 -0.7057825 -0.2892308
(-3.07)** (-2.22)** (-2.62)** (-2.30)**
Away Fouls -0.0377785 -0.011666 -0.0368195 -0.0115467
(-2.08)** (-1.37) (-2.03)** (-1.36)
Away Yellow Cards -0.044172 -0.0038726 -0.0476899 -0.0046268
(-0.81) (-0.15) (-0.87) (-0.18)
Away Red Cards 0.5618215 0.0548757 0.5628444 0.0453365
(2.36)** (0.49) (2.36)** (0.41)
Ln(Home Salary Advantage) 0.8075379 0.2147579 0.800685 0.234628
(9.13)** (5.20)** (8.98)** (5.45)**
Ln(Attendance) -0.0105088 -0.0101529
(-0.55) (-1.13)
Attendance 7.74E-07 -2.56E-06
(-0.24) (-1.68)
R^2 0.2561 0.5966 0.2558 0.5974
Observations 760 760 760 760
Notes: Statistically Significant if | t | > 1.96 (95 percent confidence) **
34 Kuper, Simon, and Stefan Szymanski. 2018. Soccernomics.
Fans Impact on English Premier League Soccer
56
Home Fouls and Away Fouls have a significant impact on Home Goal Differential. The impact
of an extra Home Foul is offset by the impact of an extra Away Foul. Yellow Cards only have a
statistically significant impact on Expected Home Goal Differential. Yellow Cards yield no
statistically significant results. This is most likely because Yellow Cards are also counted in total
fouls. This is probably due to the varying nature of yellow cards. While some yellow cards harm
the team committing the foul because it places a player in danger of being sent off, other yellow
cards are given for what is known as a tactical foul. Tactical fouls are fouls that prevent the
opposing team from creating a likely scoring chance, and thus, benefit the team committing the
foul.35 Home Red Cards and Away Red Cards provide economically significant results. If the
home team commits a red card offense, their goal differential falls by just under one. However, if
the away team receives a red card, Home Goal Differential only increases by approximately half
a goal.
VII. MODEL AND RESULTS II – ON ANY GIVEN MATCHDAY
The second set of models does not control for home salary advantage and thus follows the model
in Anders and Rotthoff (2014). This is a viable approach when analyzing the results of a large
number of fixtures. When looking at a large number of fixtures, they believe that team quality
effects even out over the course of the season. Their research prior to their paper in 2014 argues
that in a single match the home team wins, draws, or loses. Their model is based on the belief
that since any team can win any game, there is no need to control for the external factor of team
quality in this kind of analysis. However, I remove the attendance squared variable they use
because I want to see if there is a relationship between the sheer number of people in attendance
and the dependent variables. The models that exclude the effects of LN(HomeSalaryAdvantage)
are:
1. 𝐻𝑜𝑚𝑒𝐺𝐷 = 𝛽1𝐻𝑆ℎ𝑜𝑡𝑠 + 𝛽2𝐴𝑆ℎ𝑜𝑡𝑠 + 𝛽3𝐻𝐹𝑜𝑢𝑙 + 𝛽4𝐻𝑌𝐶 + 𝛽5𝐻𝑅𝐶 + 𝛽6𝐴𝐹𝑜𝑢𝑙 + 𝛽7𝐴𝑌𝐶 + 𝛽8𝐴𝑅𝐶 + 𝛽9𝐿𝑛(𝐴𝑡𝑡𝑒𝑛𝑑𝑎𝑛𝑐𝑒) + ℰ
2. 𝐻𝑜𝑚𝑒𝑥𝐺𝐷 = 𝛽1𝐻𝑆ℎ𝑜𝑡𝑠 + 𝛽2𝐴𝑆ℎ𝑜𝑡𝑠 + 𝛽3𝐻𝐹𝑜𝑢𝑙 + 𝛽4𝐻𝑌𝐶 + 𝛽5𝐻𝑅𝐶 + 𝛽6𝐴𝐹𝑜𝑢𝑙 + 𝛽7𝐴𝑌𝐶 + 𝛽8𝐴𝑅𝐶 + 𝛽9𝐿𝑛(𝐴𝑡𝑡𝑒𝑛𝑑𝑎𝑛𝑐𝑒) + ℰ
3. 𝐻𝑜𝑚𝑒𝐺𝐷 = 𝛽1𝐻𝑆ℎ𝑜𝑡𝑠 + 𝛽2𝐴𝑆ℎ𝑜𝑡𝑠 + 𝛽3𝐻𝐹𝑜𝑢𝑙 + 𝛽4𝐻𝑌𝐶 + 𝛽5𝐻𝑅𝐶 + 𝛽6𝐴𝐹𝑜𝑢𝑙 + 𝛽7𝐴𝑌𝐶 + 𝛽8𝐴𝑅𝐶 + +𝛽9𝐴𝑡𝑡𝑒𝑛𝑑𝑎𝑛𝑐𝑒 + ℰ
4. 𝐻𝑜𝑚𝑒𝑥𝐺𝐷 = 𝛽1𝐻𝑆ℎ𝑜𝑡𝑠 + 𝛽2𝐴𝑆ℎ𝑜𝑡𝑠 + 𝛽3𝐻𝐹𝑜𝑢𝑙 + 𝛽4𝐻𝑌𝐶 + 𝛽5𝐻𝑅𝐶 + 𝛽6𝐴𝐹𝑜𝑢𝑙 + 𝛽7𝐴𝑌𝐶 + 𝛽8𝐴𝑅𝐶 + 𝛽9𝐴𝑡𝑡𝑒𝑛𝑑𝑎𝑛𝑐𝑒 + ℰ
The first two columns of Table 6 measure attendance using the natural log of attendance and the
last two columns measure attendance simply by looking at the sheer number of people in
attendance. Table 6 is on page 23.
Attendance proved to be statistically significant in this model. However, it is difficult to argue
any real economic significance behind these results. The coefficient for Attendance in Matchday
3 demonstrates that an increase in attendance by 56,625 increases Home Goal Differential by
0.5. The coefficient on Attendance is so small, thus, demonstrating again that fans have minimal,
35 Anders, Anne, and Kurt William Rotthoff. 2014. "Is home-field advantage driven by the fans" Page 1167

Issues in Political Economy, 2021
57
if any, effect on the results of a Premier League match. This coefficient may have taken on the
role of the salary advantage. Teams with larger stadiums can afford higher salaries. The impact
of attendance in this model may be considering the same factors that salary does in the prior
model. Ultimately, these results do not show an economically significant relationship between
fans and home-field advantage.
Similar to the previous model, these results also demonstrate that the negative impact of an
Away Shot is stronger than the positive impact of a Home Shot on goal differential. These results
find that Home Goal Differential increases by one if Home Shots increases by about 14 to 16.
Conversely, results from Matchday 1 and Matchday 3 show that Home Goal Differential
decreases by one if Away Shots increases by about 10 to 11. Matchday 2 and Matchday 8 show
that Expected Home Goal Differential increases by 1 if Home Shots increases by 10 to 11.
Matchday 2 and Matchday 4 also show that Expected Home Goal Differential falls by 1 if Away
Shots increases by 9 to 10.
Unlike the results of Anders and Rothoff (2014), these results found Home Fouls, Away Fouls,
Away Yellow Cards, and Away Red Cards all to be insignificant.36 Home Yellow Cards was
significant in its impact on both Home Goal Differential and Expected Home Goal Differential.
Home Goal Differential fell by 1 when the home team received 8 to 9 yellow cards. Expected
Home Goal Differential fell by about 0.5 when the home team received 8 to 9 yellow cards. The
impact of Home Red Cards on Home Goal Differential and Expected Home Goal Differential
was considerably less than the results from the previous model. Matchday 1 and Matchday 3
show that a Home Red Cards decreases Home Goal Differential by just over 0.6 and decreases
Expected Home Goal Differential by about 0.02.
36 Anders, Anne, and Kurt William Rotthoff. 2014. "Is home-field advantage driven by the fans" Pages 1165-1168

Fans Impact on English Premier League Soccer
58
Table 6. Model 2: On Any Given Matchday (No Salary Effects)
Matchday 1 Matchday 2 Matchday 3 Matchday 4
Variables (HomeGD) (HomexGD) (HomeGD) (HomexGD)
Home Shots 0.0679308 0.096834 0.0610061 0.0961611
(5.28)** (16.68)** (4.73)** (16.43)**
Away Shots -0.0948336 -0.1055405 -0.0937919 -0.1058407
(-6.50)** (-16.03)** (-6.46)** (-16.07*)*
Home Fouls 0.0335069 0.0019336 0.0370998 0.0026997
(1.67) (0.21) (1.87) (0.30)
Home Yellow Cards -0.1190612 -0.0559428 -0.1228232 -0.0571396
(-2.10)** (-2.19)** (-2.18)** (-2.24)**
Home Red Cards -0.6415072 -0.2619061 -0.6128081 -0.2619862
(-2.26)** (-2.05)** (-2.17)** (-2.04)**
Away Fouls -0.0252148 -0.0083248 -0.0235591 -0.0076609
(-1.32) (-0.97) (-1.24) (-0.89)
Away Yellow Cards -0.0670683 -0.0099617 -0.0744008 -0.012454
(-1.16) (-0.38) (-1.30) (-0.48)
Away Red Cards 0.2837799 -0.0190672 0.3352217 -0.0213647
(1.14) (-0.17) (1.35) (-0.19)
Ln(Attendance) -0.0081153 -0.0095164
(-0.40) (-1.04)
Attendance 8.83E-06 -2.02E-07
(2.69)** (-0.14)
R^2 0.1732 0.5821 0.1809 0.5815
Observations 760 760 760 760
Notes: Statistically Significant if | t | > 1.96 (95 percent confidence)**
VIII. IMPLICATIONS FOR CLUB MANAGERS
The results of these regressions provide some information regarding the optimal strategy when
approaching matches. Following these implications does not guarantee long-term success, but
rather it provides insight into approaches that can assist a team to be more successful on a match-
by-match basis.
The difference between the impact home shots and away shots have on expected goal differential
is minimal. However, Away Shots have a considerably larger impact on Home Goal Differential
than Home Shots. This suggests that preventing the away team from scoring is the most effective
way for the home team to maximize its goal differential. Home teams may be caught off guard

Issues in Political Economy, 2021
59
when an away team attacks, making those shots more effective. This potentially suggests that
home teams should put more focus on preventing goals and away teams should focus more on
scoring goals.
Another explanation for this is that away teams are more efficient at capitalizing on their chances
than their home team. The home team has the advantage of playing in a familiar environment.
Home teams tend to dominate play and enter games believing they will create numerous chances.
They are more likely to take offensive risks and leave themselves defensively exposed.37 Away
teams often approach the game with a more defensive game plan and try to capitalize on a few
key chances. The difference between how home and away teams allocate their resources to
attack and defend impacts the efficiency of a home or away shot. In general, away teams set up
more defensively, making it harder for a home team to score. Home teams tend to control the
match but leave themselves vulnerable to counterattacks. Allowing for the quality of an away
shot opportunity to be much higher.
Another key result from these implications is the effect of fouls and cards. Fouls positively
contribute to a team’s goal differential. A Home Foul increases Home Goal Differential while an
Away Foul decreases Home Goal Differential. Yellow cards prove to be insignificant throughout
most of the regressions I ran. However, Home Yellow Cards did have a negative impact on
Home Goal Differential and Expected Home Goal Differential in second model. Red cards had a
significant impact on Home Goal Differential and Expected Home Goal Differential. These
results support the “play hard but not to the point of getting cards” strategy outlined in Anders
and Rotthoff (2014).38 Teams should play hard on the field and accept getting fouls as part of the
game. However, teams should avoid risking and having players sent off as that is detrimental to
their goal differential. The results in this paper demonstrate that it is more important that teams
avoid red cards because some yellow cards may be beneficial.
Also, it is important to be aware of the differences in R^2. In the first model, the R^2 of
regressions with Home Goal Differential differed with the regressions with Expected Home Goal
Differential by about 34 percentage points. In the second model, the R^2 of regressions with
Home Goal Differential differed with the regressions of Expected Home Goal Differential by
about 40 percentage points. This demonstrates how much easier it is to model what is expected
scores rather than actual scores.
Soccer is a fluid sport and there are numerous formations, strategies, and principles that teams
can implement creating various styles of play. Every style of play can be successful if applied
correctly. The model I used in my analysis was broad as to not favor one style of play over
another. However, statistics in soccer are not advanced enough to account for numerous
spectacular moments that make the game so exciting. Spectacular moments in matches are the
reason why the range of Home Goal Differential is much larger than the range of Expected
Home Goal Differential. It comes as no surprise that these models provide an explanation that
fits Expected Home Goal Differential more than Home Goal Differential.
37 Mustoe, Robbie, and Robbie Earle. 2020. The 2 Robbies. 38 Anders, Anne, and Kurt William Rotthoff. 2014. "Is home-field advantage driven by the fans" Pages 1165-1168

Fans Impact on English Premier League Soccer
60
Fans do not determine the result of Premier League matches. A reason why attendance may not
impact home-field advantage in the Premier League is that these players are professionals.
Players in the Premier League are some of the best-trained athletes in the entire world. To
succeed at that level, players need to be psychologically strong. It is not surprising that athletes
of this caliber can perform regardless of how the crowd is treating them.
Although these results show fans have a minimal impact on Expected Home Goal Differential
and Home Goal Differential, whether or not fans are present may impact Premier League
matches in another way. To answer this question, I followed two potential extensions for my
research. The first extension looks at Project Restart’s impact on referee decision making. The
second extension looks at the differences in points home teams would expect to earn in a season
without fans compared to a season with fans.
IX. FANS AND REFEREES
Anders and Rotthoff (2014) found that fan attendance in “hostile” leagues influenced the
outcomes in matches potentially due to referee bias.39 The Premier League is similar to the
Bundesliga, the “hostile” league in their study, and thus it is reasonable to infer that there may
also be signs of referee bias in the Premier League.40
To identify potentially important referee bias. I generated the variable titled Home Foul
Difference (HomeFoulDiff). Home Foul Difference is the number of fouls the home team
committed less the number of fouls the away team committed. If both the home and away team
committed the same number of fouls, Home Foul Difference would be 0. This number captures
the impact of fouls as an aggregate and provides a great measure of the impact that fouls have.
Not all fouls are equal in their impact on a game. Some fouls yield great scoring opportunities
such as a penalty kick and others do not generate a scoring opportunity at all. Comparing
coefficients of Home Foul Difference will demonstrate whether the impact of referee decisions
vary based on whether fans are present.
I generated the interactive variable FanDummy*HomeFDiff by multiplying Home Foul
Difference by the FanDummy. Following this step, I ran a Chow test to see if the coefficients on
foul difference were significantly different between games before and after fans were banned
from the stadium.41
Referee 1 and Referee 10 serve as controls without the dummy or interactive variables. They
follow a similar framework to Model 2. Referee 3 and Referee 4 include the interactive variable
that captures the difference between referee decisions with and without fans. Referee 1 and
Referee 3 have Home Goal Differential as the dependent variable. Referee 2 and Referee 4 have
Expected Home Goal Differential as the dependent variable and were simply included for
39 Anders, Anne, and Kurt William Rotthoff. 2014. "Is home-field advantage driven by the fans" Page 1168 40 Anders, Anne, and Kurt William Rotthoff. 2014. "Is home-field advantage driven by the fans" Pages 1166-1168 41 Chow tests determine if a structural break in the data set leads to a difference in coefficients on the dependent
variables. Chow tests in this paper test if coefficients of independent variables are different between games played
with and without fans.

Issues in Political Economy, 2021
61
reference. For this analysis, we will focus on Referee 3 and Referee 4 although my prior results
show that fouls did not have a significant impact on Expected Home Goal Differential.
Results from Referee 1 show that coefficient on Home Foul Difference is positive. This follows
logically from my prior results. Fouls have a positive effect on goal differential; therefore, Home
Goal Differential rises when the difference between home and away fouls increases. Home Foul
Difference also has a positive coefficient in Referee 3, thus supporting my prior results as well as
the results from Anders and Rotthoff (2014).42
Table 7. Model 3: Fans and Referee Bias
Referee 1 Referee 2 Referee 3 Referee 4
Variables (HomeGD) (HomexGD) (HomeGD) (HomexGD)
Home Shots 0.0622957 0.0972964 0.0625124 0.0971527
(4.83)** (16.67)** (4.90)** (16.71)**
Away Shots -0.0998393 -0.1079288 -0.094872 -0.1069587
(-6.92)** (-16.51)** (-6.60)** (-16.35)**
Home Foul Difference 0.0288096 0.0035961 0.1126936 0.0509398
(2.09)** (0.58) (2.53)** (2.52)**
FanDummy -0.8904831 -0.0164044
(-3.54)** (-1.43)
FanDummy*HomeFDiff -0.0928699 -0.0523083
(-1.99)** (-2.46)**
Attendance 8.48E-06 -7.52E-08 0.0000177 1.58E-06
(2.58)** (-0.05) (4.22)** (0.83)
Prob > F = 0.0003*** 0.0191***
R^2 0.1658 0.5752 0.1800 0.5784
Observations 760 760 760 760
Notes: Statistically Significant if | t | > 1.96 (95 percent confidence)**
Prob > F significant if value < 0.05***
The results from Referee 3 tell an important story. Interestingly, the coefficient on
FanDummy*HomeFDiff is negative. As stated earlier, FanDummy = 1 when fans are in
attendance, and FanDummy = 0 when fans are banned from the stadium. The Chow test Prob > F
statistic of whether fan presence affects home foul differential is significant. When fans are in
attendance, if Home Foul Difference increases by 1, then Home Goal Differential increases by
0.020 and Expected Home Goal Differential falls by 0.001. When games are played without fans,
42 Anders, Anne, and Kurt William Rotthoff. 2014. "Is home-field advantage driven by the fans" Pages 1165-1168

Fans Impact on English Premier League Soccer
62
if Home Foul Difference increases by 1, Home Goal Differential increases by 0.113, and
Expected Home Goal Differential increases by 0.051.
This demonstrates that the marginal foul called in a game without fans has a larger impact on
home goal differential than fouls called in games with fans. This is an extremely important factor
for managers and clubs to be aware of. In general, fans in attendance make it difficult for
referees. Players, pundits, coaches, and fans “hate it when a referee decides a game”.43 This
sentiment combined with a hostile environment created by players, coaches, and fans, could
cause refs to second guess making decisions that could upset the crowd and take away from the
crowds’ enjoyment of a match. It is reasonable to infer that referees are inclined to call more
fouls that directly increase the likelihood of a team scoring, including penalty kicks or free kicks
that are within shooting range, when fans are not present. The coefficient on Expected Home
Goal Differential demonstrates that the quality of opportunities that result from foul decisions is
much higher for games played without fans. The coefficient on Home Goal Differential confirms
that home teams capitalize more on the better opportunities they get from fouls called without
fans in the stadium. These results are consistent with the prior research done by Anders and
Rotthoff (2014) that “social pressures from the fans drive referee bias”.44 As fans are slowly
allowed back into the stadium, it will be interesting to see if referees start to avoid calling game-
changing fouls or if an extended period without fans changed their decision-making behavior
completely.
X. The Pythagorean Expectation of Project Restart
Throughout the entirety of the paper, I examine the impact of various in-game factors on goal
differential and expected goal differential. However, goal differential is not a perfect way to
measure team success. In the 2019/2020 Premier League Season, Liverpool ended their 30-year
title drought and won the league even though their goal differential was 15 less than runners-up
Manchester City. Having the highest goal differential does not necessarily guarantee more wins
and ultimately, finishing top of the league. Ultimately, the main goal for Premier League clubs is
to earn as many points as possible.
Bill James, a pioneer in baseball stats, found that you could estimate a baseball team’s winning
percentage where you could draw a right triangle with the shorter sides equaling the number of
runs scored, side A, and the number of runs allowed B. From there, he found that the team’s
winning percentage would roughly be the square of the ratio between the number of runs scored
and the third side of the triangle, C.45 This created the Pythagorean Expectation formula that has
been further adapted to other sports. Soccer poses a unique challenge in calculating its
Pythagorean Expectation because some games end in a tie. Since there are three possible
outcomes for a soccer match, it is more difficult to calculate expected points for a soccer club
than the win percentage of a baseball club.46
43 Mustoe, Robbie, and Robbie Earle. 2020. The 2 Robbies. 44 Anders, Anne, and Kurt William Rotthoff. 2014. "Is home-field advantage driven by the fans" Pages 1165-1168 45 Bialik, Carl. 2014. "Why the Best Scoring Margin Doesn’t Guarantee a Championship in European Soccer." 46 Zheng, Sihan. 2014. "Understanding the relationship between goals and points."

Issues in Political Economy, 2021
63
The Pythagorean Expectation formula used in this paper comes from Nikhil Mehta and Michael
Berman. The formula they used is below:47
𝐸𝑥𝑝𝑒𝑐𝑡𝑒𝑑 𝑃𝑜𝑖𝑛𝑡𝑠 𝑃𝑒𝑟 𝐺𝑎𝑚𝑒 = 1.7 [𝐺𝑜𝑎𝑙𝑠 𝑆𝑐𝑜𝑟𝑒𝑑 − 𝐺𝑜𝑎𝑙𝑠 𝐴𝑙𝑙𝑜𝑤𝑒𝑑
𝐺𝑜𝑎𝑙𝑠 𝑆𝑐𝑜𝑟𝑒𝑑 + 𝐺𝑜𝑎𝑙𝑠 𝐴𝑙𝑙𝑜𝑤𝑒𝑑] + 1.35
I then adapted this formula to measure home points per game:
𝐸𝑥𝑝𝑒𝑐𝑡𝑒𝑑 𝐻𝑜𝑚𝑒 𝑃𝑜𝑖𝑛𝑡𝑠 𝑃𝑒𝑟 𝐺𝑎𝑚𝑒 (𝐸𝐻𝑃𝑃𝐺) = 1.7 [𝐻𝑜𝑚𝑒 𝐺𝑜𝑎𝑙𝑠 − 𝐴𝑤𝑎𝑦 𝐺𝑜𝑎𝑙𝑠
𝐻𝑜𝑚𝑒 𝐺𝑜𝑎𝑙𝑠 + 𝐴𝑤𝑎𝑦 𝐺𝑜𝑎𝑙𝑠] + 1.35
Home points are the number of points a team wins in the games they play at their home stadium.
EHPPS is the expected home points a team should earn over the course of a season. EHPPG is
the expected home points a team theoretically should earn on a per game basis. In other words, if
team played an infinite number of games while maintaining the same goals scored goals allowed
ratio, their actual points per game would equal the expected points per game. The value of
Expected Home Points Per Game and Expected Home Points Per Season in this study is that it
provides the data to test whether or not there is a significant difference in home performance in
games where fans are present as opposed to when fans are not present.
There are numerous formulas that researchers have used when applying Pythagorean Expectation
to soccer. However, there are some key conclusions that these formulas must reach to be an
effective model for predicting points per game. The first of which is that an extra goal scored is
not as valuable as preventing a goal from being scored. This makes intuitive sense because
scoring alone does not ensure a win. Teams need to defend and maintain a lead when they have
one.48 Also, if a team prevents their opponent from scoring, they guarantee that they will not
lose. For example, in the 2004/2005 Premier League Season, Jose Mourinho’s Chelsea conceded
only 15 goals over the course of the entire season. They only lost one game the entire season and
are regarded as one of the best teams in Premier League history. They received criticism for
playing too defensively, but their defense made them unbeatable.
The other conclusion that Pythagorean Expectation formulas for soccer reach is that the ratio of
goals scored, and goals allowed is a better measure of team quality than goal differential.49 A
goal scored is less valuable than a goal prevented. For example, Manchester United’s 2002/2003
title-winning side that scored 74 goals and conceded 34 goals was relatively stronger than
Manchester United’s prolific 2012/2013 title winning team that scored 86 goals and conceded 43
goals. Based on their ratio of goals scored and goals allowed, the Pythagorean Expectation
formula predicts that Manchester United’s 2002/2003 squad would win one more game than
Manchester United’s 2012/2013 squad even though the 2012/2013 squad had a better goal
differential.
Before conducting a regression analysis, I used the Pythagorean Expectation formula to calculate
the Expected Home Points Per Game for the entire data set, the games with fans, and the games
without fans. I then converted the Expected Home Points Per Game into the number of home
47 Mehta, Nikhil, and Michael Berman. 2017. "Applying the “Pythagorean Expectation” to Soccer." 48 Zheng, Sihan. 2014. "Understanding the relationship between goals and points." 49 Zheng, Sihan. 2014. "Understanding the relationship between goals and points."

Fans Impact on English Premier League Soccer
64
points a team would expect to win over the course of a season by multiplying Expected Home
Points Per Game by 19, the number of home matches each team plays in a season.
Table 8: Pythagorean Expectation Calculations
Goals For Goals Against EHPPG EHPPS Percent
Total 1,172 934 1.542117759 29.30023742 51.4
Fans 1,030 826 1.536853448 29.20021552 51.2
No Fans 142 108 1.5812 30.0428 52.7
Looking at these results, there seems to be minimal difference between the results of fans and no
fans. When comparing these results, Expected Home Points Per Game increases by only 0.04
without fans resulting in only 0.74 more points earned at home over the course of the season.
Since these differences are so small, they are probably due to chance and random events. The
sample size of games played without fans is significantly smaller than games played with fans,
so it is likely that as more games are played without fans, the average Expected Home Points Per
Game of No Fans will approach the average Expected Home Points Per Game of Fans.
To confirm that these differences are the result of random events, I ran some regressions and
Chow tests. For these regressions, home points per game was used as the dependent variable
(HomePTS). This number has three potential values. HomePTS is 3 if the home team won,
HomePTS if the home team drew, and HomePTS is 0 if the home team lost. I chose to leave out
the independent variables that measured events that happened during a specific game including
shots, fouls, and cards. This was done because the Pythagorean Expectation accounts for in-game
events in its calculation that arrives at EHPPG. I included LN(HomeSalaryAdvantage) and
Attendance in some of the regressions to control for team quality as well as differences in the
number of fans present at the match. The model used for these regressions and the results are
below:
1. 𝐻𝑜𝑚𝑒𝑃𝑇𝑆 = 𝛽1𝐸𝐻𝑃𝑃𝐺 + 𝛽2𝐴𝐹𝑎𝑛𝐷𝑢𝑚𝑚𝑦 + 𝛽3𝐹𝑎𝑛𝐷𝑢𝑚𝑚𝑦𝐸𝐻𝑃𝑃𝐺 + ℰ
2. 𝐻𝑜𝑚𝑒𝑃𝑇𝑆 = 𝛽1𝐸𝐻𝑃𝑃𝐺 + 𝛽2𝐴𝐹𝑎𝑛𝐷𝑢𝑚𝑚𝑦 + 𝛽3𝐹𝑎𝑛𝐷𝑢𝑚𝑚𝑦𝐸𝐻𝑃𝑃𝐺 + 𝛽4𝐿𝑁(𝐻𝑆𝑎𝑙𝑎𝑟𝑦𝐴𝑑𝑣) + ℰ
3. 𝐻𝑜𝑚𝑒𝑃𝑇𝑆 = 𝛽1𝐸𝐻𝑃𝑃𝐺 + 𝛽2𝐴𝐹𝑎𝑛𝐷𝑢𝑚𝑚𝑦 + 𝛽3𝐹𝑎𝑛𝐷𝑢𝑚𝑚𝑦𝐸𝐻𝑃𝑃𝐺 + 𝛽4𝐴𝑡𝑡𝑒𝑛𝑑𝑎𝑛𝑐𝑒 + ℰ
4. 𝐻𝑜𝑚𝑒𝑃𝑇𝑆 = 𝛽1𝐸𝐻𝑃𝑃𝐺 + 𝛽2𝐴𝐹𝑎𝑛𝐷𝑢𝑚𝑚𝑦 + 𝛽3𝐹𝑎𝑛𝐷𝑢𝑚𝑚𝑦𝐸𝐻𝑃𝑃𝐺 + 𝛽4𝐿𝑁(𝐻𝑆𝑎𝑙𝑎𝑟𝑦𝐴𝑑𝑣) + 𝛽5𝐴𝑡𝑡𝑒𝑛𝑑𝑎𝑛𝑐𝑒 + 𝛽6𝐴𝐹𝑜𝑢𝑙 + ℰ
Issues in Political Economy, 2021
65
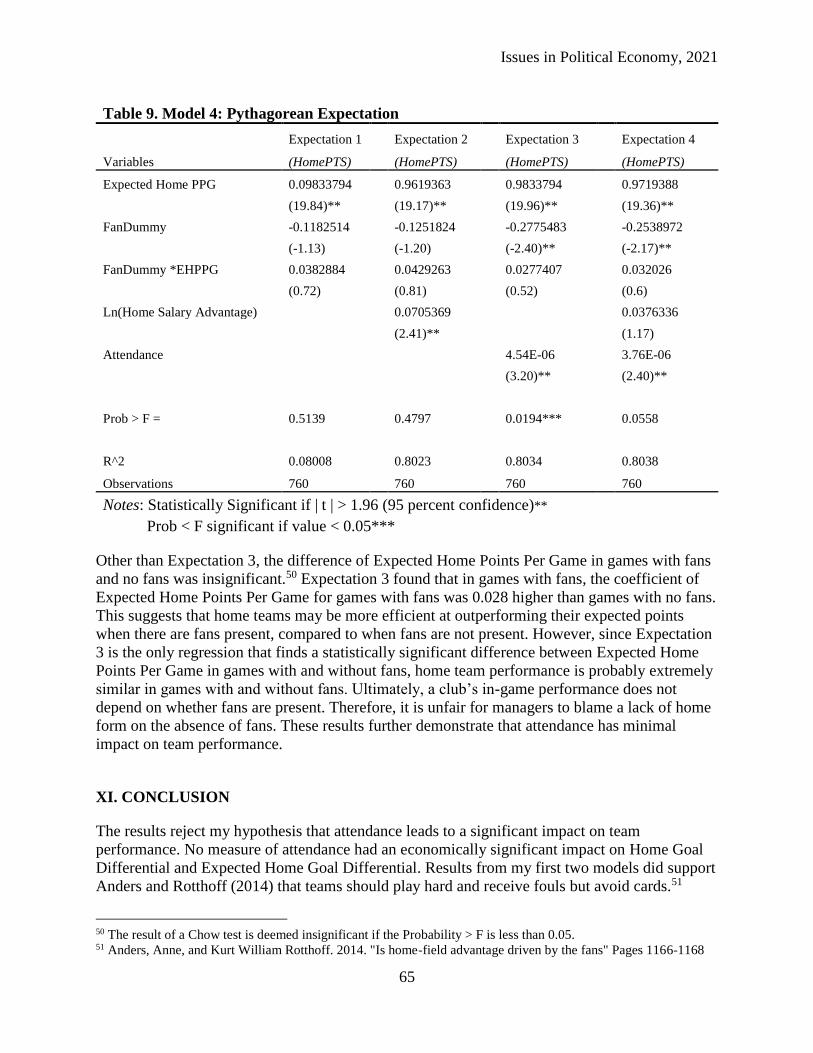
Table 9. Model 4: Pythagorean Expectation
Expectation 1 Expectation 2 Expectation 3 Expectation 4
Variables (HomePTS) (HomePTS) (HomePTS) (HomePTS)
Expected Home PPG 0.09833794 0.9619363 0.9833794 0.9719388
(19.84)** (19.17)** (19.96)** (19.36)**
FanDummy -0.1182514 -0.1251824 -0.2775483 -0.2538972
(-1.13) (-1.20) (-2.40)** (-2.17)**
FanDummy *EHPPG 0.0382884 0.0429263 0.0277407 0.032026
(0.72) (0.81) (0.52) (0.6)
Ln(Home Salary Advantage) 0.0705369 0.0376336
(2.41)** (1.17)
Attendance 4.54E-06 3.76E-06
(3.20)** (2.40)**
Prob > F = 0.5139 0.4797 0.0194*** 0.0558
R^2 0.08008 0.8023 0.8034 0.8038
Observations 760 760 760 760
Notes: Statistically Significant if | t | > 1.96 (95 percent confidence)**
Prob < F significant if value < 0.05***
Other than Expectation 3, the difference of Expected Home Points Per Game in games with fans
and no fans was insignificant.50 Expectation 3 found that in games with fans, the coefficient of
Expected Home Points Per Game for games with fans was 0.028 higher than games with no fans.
This suggests that home teams may be more efficient at outperforming their expected points
when there are fans present, compared to when fans are not present. However, since Expectation
3 is the only regression that finds a statistically significant difference between Expected Home
Points Per Game in games with and without fans, home team performance is probably extremely
similar in games with and without fans. Ultimately, a club’s in-game performance does not
depend on whether fans are present. Therefore, it is unfair for managers to blame a lack of home
form on the absence of fans. These results further demonstrate that attendance has minimal
impact on team performance.
XI. CONCLUSION
The results reject my hypothesis that attendance leads to a significant impact on team
performance. No measure of attendance had an economically significant impact on Home Goal
Differential and Expected Home Goal Differential. Results from my first two models did support
Anders and Rotthoff (2014) that teams should play hard and receive fouls but avoid cards.51
50 The result of a Chow test is deemed insignificant if the Probability > F is less than 0.05. 51 Anders, Anne, and Kurt William Rotthoff. 2014. "Is home-field advantage driven by the fans" Pages 1166-1168

Fans Impact on English Premier League Soccer
66
Shots were also a key determinant in Home Goal Differential and Expected Home Goal
Differential. Teams that play well tend to create more shooting opportunities. The more shots a
team takes, the more likely it is that team will score. My results support that intuition. The results
from applying the Pythagorean Expectation to the matches I analyzed also rejected my
hypothesis and showed that there is little to no difference between a season played with fans or
without fans.
Even though attendance has an insignificant impact on the outcome of matches, my results
demonstrate that referee behavior changes when fans are not present. The average foul in a game
without fans has a significantly larger impact on the outcome of the match than the average foul
in a game with fans. When fans are present, referees may avoid making game-changing decisions
that could upset the crowd. The results imply that referees are more reluctant to call fouls that
have a larger impact on goal differential when fans are present.
There are a few reasons why the results do not support my hypothesis. The first is that with the
rise of televised games, streaming services, and social media, players know that they are always
being watched by the fans. Soccer games entertain countless fans, whether or not these fans are
present in the stadium. Although my results indicate that attendance did not impact in-game
performance, fans may provide a source motivation for players that cannot be measured by the
number of fans in the stadium.
Another potential explanation behind this is that the players, managers, and clubs of the Premier
League do an excellent job adapting to different circumstances. All 20 teams are playing under
similar adversity and circumstances due to COVID-19 protocol. Players and managers in the
Premier League are at the pinnacle of the world’s most popular sport. As trained professionals, it
comes to no surprise that these players and managers perform at a consistent level, regardless of
the circumstances.
As England lifts restrictions, post COVID-19, the Premier League will allow fans back into the
stadium and match results will remain unchanged. While the break in the 2019/2020 Premier
League Season posed unprecedented challenges for clubs, these clubs adapted throughout this
historic season and gave fans a season to remember. Although fans may not impact the results of
a match, the sport is lacking in their absence. Fans provide soccer matches with passion,
charisma, and love. Although these factors do not drive team performance, they are a key reason
why soccer is the world’s Beautiful Game.
XII. WORKS CITED
Allen, Mark S., and Mark V. Jones. 2014. "The "Home Advantage" in Athletic Competitions."
Current Directions in Psychological Science, February: 48-53.
Ames, Nick. 2020. " Premier League Project Restart: the key questions answered." The
Guardian.com. June 11. https://www.theguardian.com/football/2020/jun/11/premier-league-
project-restart-the-key-questions-answered.

Issues in Political Economy, 2021
67
Anders, Anne, and Kurt William Rotthoff. 2014. "Is home-field advantage driven by the fans?
Evidence from across the ocean." Applied Economics Letters, 1165-1168.
Bialik, Carl. 2014. "Why the Best Scoring Margin Doesn’t Guarantee a Championship in
European Soccer." FiveThirtyEight.com. May 7. https://fivethirtyeight.com/features/why-
scoring-goals-doesnt-guarantee-a-championship-in-european-soccer/.
DeSarbo, Wayne, and Robert Madrigal. 2012. "Exploring the Demand Aspects of Sports
Consumption and Fan Avidity." Interfaces, March-April: 199-212.
FBRef.com. 2018-2019 Premier League Season, 2019-2020 Premier League Season. Premier
League Stats. https://fbref.com/en/comps/9/Premier-League-Stats.
Football-Data.co.uk. Premier League Season 2018/2019, Premier League Season 2019/2020.
Data Files: England. https://www.football-data.co.uk/englandm.php.
Kuper, Simon, and Stefan Szymanski. 2018. Soccernomics. New York: Nation Books.
Mehta, Nikhil, and Michael Berman. 2017. "Applying the “Pythagorean Expectation” to Soccer."
Simple Soccer Stats.com. October 25.
http://www.simplesoccerstats.com/blog/2017/10/25/applying-the-pythagorean-expectation-to-
soccer/.
Mustoe, Robbie, and Robbie Earle. 2020. The 2 Robbies. Comp. NBCSN.
Sandomir, Richard. 2015. "NBC Retains Rights to Premier League in Six-Year Deal." The New
York Times.com. August 10. https://www.nytimes.com/2015/08/11/sports/soccer/nbc-retains-
rights-to-premier-league-in-six-year-deal.html.
Smith, Erin E., and John D. Groetzinger. 2010. "Do Fans Matter? The Effect of Attendance on
the Outcomes of Major League Baseball Games." Journal of Quantitative Analysis in Sports,
January 1: 1-25.
2020. "VAR." Premier League.com. June 1.
https://www.premierleague.com/VAR#:~:text=The%202019%2F20%20Premier%20League,201
8%20to%20introduce%20the%20system.
Zheng, Sihan. 2014. "Understanding the relationship between goals and points." The Top
Flight.com. May 20. https://thetopflight.com/2014/05/20/understanding-relationship-between-
goals-
points/#:~:text=In%20the%20Premier%20League%2C%20the,are%20awarded%20for%20each
%20win.
“Some people think football is a matter of life and death. I don’t like that attitude. I can assure
them it is much more serious than that.” – Bill Shankly, Former Scottish Footballer and
Legendary Manager of Liverpool F.C.