Do anti-takeover devices affect the takeover likelihood or the takeover premium
41
Do anti-takeover devices affect the takeover likelihood or the takeover premium?* MARTIN HOLMÉN a , EUGENE NIVOROZHKIN b and RAKESH RANA c Forthcoming European Journal of Finance Abstract In this paper we use Heckman selection models to analyse the relation between the likelihood of the firm becoming a takeover target, the takeover premium, and the use of anti-takeover devices. Ordinary least squares regressions suggest that anti-takeover devices, especially dual class shares, are associated with a higher takeover premium. However, we also document that anti-takeover devices reduce the likelihood that the firm will be taken over. When we control for the fact that takeover targets are selected, we do not find a significant relation between the takeover premium and dual class shares. Hence, our results suggest that the takeover premium is indeed influenced by private information about the likelihood of takeover. Keywords: takeover likelihood, takeover premium, Heckman selection, anti-takeover devices, dual class shares JEL Classification: G34; G32 * We appreciate the generosity of The Jan Wallander and Tom Hedelius Foundation, and VINNOVA (grant 2010-02449). We would like to thank two anonymous referees, Björn Hansson, David Smith and seminar participants at FIRS 2009, SNEE 2010, the University of Innsbruck and the Ratio Institute for valuable comments. a Centre for Finance, University of Gothenburg, Box 640, 405 30 Gothenburg, Sweden, and Department of Finance and Statistics, Hanken School of Economics, Arkadiagatan 22, 00101 Helsinki, Finland. E-mail: [email protected] b Corresponding author. SSEES, University College London, Gower Street, London WC1E 6BT, UK. E-mail: [email protected] c Centre for Finance, University of Gothenburg, Box 640, 405 30 Gothenburg, Sweden. E-mail: [email protected]
-
Upload
independent -
Category
Documents
-
view
1 -
download
0
Transcript of Do anti-takeover devices affect the takeover likelihood or the takeover premium
Do anti-takeover devices affect the takeover likelihood or the
takeover premium?*
MARTIN HOLMÉNa, EUGENE NIVOROZHKINb and RAKESH RANAc
Forthcoming European Journal of Finance
Abstract
In this paper we use Heckman selection models to analyse the relation between the likelihood of the firm becoming a takeover target, the takeover premium, and the use of anti-takeover devices. Ordinary least squares regressions suggest that anti-takeover devices, especially dual class shares, are associated with a higher takeover premium. However, we also document that anti-takeover devices reduce the likelihood that the firm will be taken over. When we control for the fact that takeover targets are selected, we do not find a significant relation between the takeover premium and dual class shares. Hence, our results suggest that the takeover premium is indeed influenced by private information about the likelihood of takeover.
Keywords: takeover likelihood, takeover premium, Heckman selection, anti-takeover devices, dual class shares JEL Classification: G34; G32
* We appreciate the generosity of The Jan Wallander and Tom Hedelius Foundation, and VINNOVA (grant 2010-02449). We would like to thank two anonymous referees, Björn Hansson, David Smith and seminar participants at FIRS 2009, SNEE 2010, the University of Innsbruck and the Ratio Institute for valuable comments. a Centre for Finance, University of Gothenburg, Box 640, 405 30 Gothenburg, Sweden, and Department of Finance and Statistics, Hanken School of Economics, Arkadiagatan 22, 00101 Helsinki, Finland. E-mail: [email protected] b Corresponding author. SSEES, University College London, Gower Street, London WC1E 6BT, UK. E-mail: [email protected] c Centre for Finance, University of Gothenburg, Box 640, 405 30 Gothenburg, Sweden. E-mail: [email protected]
1
Do anti-takeover devices affect the takeover likelihood or the
takeover premium?
Abstract
In this paper we use Heckman selection models to analyse the relation between the likelihood of the firm becoming a takeover target, the takeover premium, and the use of anti-takeover devices. Ordinary least squares regressions suggest that anti-takeover devices, especially dual class shares, are associated with a higher takeover premium. However, we also document that anti-takeover devices reduce the likelihood that the firm will be taken over. When we control for the fact that takeover targets are selected, we do not find a significant relation between the takeover premium and dual class shares. Hence, our results suggest that the takeover premium is indeed influenced by private information about the likelihood of takeover.
Keywords: takeover likelihood, takeover premium, Heckman selection, anti-takeover devices, dual class shares JEL Classification: G34; G32
1
Introduction
In this paper we use Heckman selection models to analyse the relation between the likelihood
of the firm becoming a takeover target, the takeover premium, and the use of anti-takeover
devices. If firms were taken over randomly, we could ignore the fact that takeover premiums
are not observed for all firms and use ordinary regressions. However, such a random
occurrence of a corporate takeover is unlikely, i.e. takeovers do not happen randomly. Firms
that experience a takeover event are selected. Our empirical analysis also documents i) that
the determinants of the takeover premium change significantly when we control for the
private information explaining the likelihood of a takeover and ii) that the likelihood of a
takeover and the magnitude of the takeover premium indeed are not independent. Our results
have general implications for the analysis of abnormal returns related to corporate events
since cross-sectional tests of abnormal returns may be influenced by sample selection bias.1
A recent survey of the empirical corporate takeover literature by Betton, Eckbo and
Thorburn (2008) acknowledges that “there are unresolved econometric issues of endogeneity
and self-selection” in most of the existing studies. Furthermore, the authors argue that even if
corrections for self-selection are often discussed in the literature, actual corrections are rarely
implemented in empirical tests. Ahern (2009) uses simulations to analyse how asset pricing
anomalies and selection bias may produce erroneous results in event studies.
A number of papers have analysed the likelihood that a firm will become a takeover
target.2 Others have analysed the determinants of the takeover premium in corporate
takeovers.3 Only a few papers have simultaneously analysed the likelihood of a takeover and
the takeover premium, yet without controlling for potential selection problems.4 Sokolyk
1 For a discussion of the event study methodology in financial economics, see MacKinlay (1997). 2 See e.g. Morck et al. (1989), Dickerson et al. (2002) and Betton, Eckbo, and Thorburn (2008) and references therein. 3 See e.g. Bradley et al. (1988), Franks and Harris (1989), Stulz et al. (1990) and Betton, Eckbo, and Thorburn (2008) and references therein . 4 See e.g. Song and Walkling (1993).
2
(2011) investigates whether anti-takeover provisions affect both the likelihood that a firm will
become a takeover target and the takeover premium. However, to our knowledge, the author
does not control for the potential selection problem when analyzing the determinants of the
takeover premium.
The selection likelihood of the takeover target and the size of the takeover premium
are both likely to be affected by the reservation price for the target firm’s equity. The
magnitude of the reservation price could be affected, e.g. by the ownership type and structure,
and implicit private benefits of control of large shareholders. Shareholders and owner-
managers in firms that would receive relatively low takeover premiums may be less inclined
to negotiate and accept the terms of a tender offer or merger. It is also possible that
shareholders and owner-managers who choose not to negotiate and accept an offer would be
offered relatively higher takeover premiums than shareholders in other firms who choose to
accept an offer. The reason is that the former group might have a relatively higher reservation
offer price level.
We analyse the Swedish market for control.5 Analysing Swedish data provides some
advantages given the research issue at hand. First, due to Swedish corporate law, the terms of
most tender offers are negotiated between the bidder and the large shareholders in the target
before they are made public. Once the large shareholders in the target have accepted the
terms, the offer is made public and extended to all shareholders. Thus, if the bidder and the
blockholders in the target do not reach an agreement, we do not observe a tender offer in the
data, and this is precisely the selection bias we are interested in.
Second, a majority of the firms in our sample use dual class shares. Grossman and
Hart (1988) show theoretically how dual class shares may make takeovers more costly for the
bidder. Dual class shares facilitate for the incumbent in the target firm to demand
5 We run robustness tests based on a U.S. sample.
3
compensation for the loss of private benefits of control. And since all private benefits are not
necessarily transferable to the bidder, dual class shares may work as an anti-takeover device.
Thus, our focus on dual class shares when testing how the potential selection bias affects the
inference from cross-sectional analysis of the takeover premium has sound theoretical
underpinnings, and the Swedish market environment facilitates the empirical analysis.
Third, Swedish firms also use alternative types of anti-takeover defences. Therefore,
our study allows comparison of the effect of dual class shares and other anti-takeover
measures on the takeover premium and takeover likelihood, respectively. Various anti-
takeover defences are common in the U.S., while dual class shares and other mechanisms to
separate voting rights from cash flow rights to secure the incumbent’s control are more
common outside the U.S. Comment and Schwert’s (1995) find that poison pills do not prevent
takeovers in the U.S. and that they are associated with higher takeover premiums.
The Anglo-Saxon corporate governance model is often criticized for being myopic
and placing too much emphasis on short-term profits. Gaspar et al. (2005) also document that
firms with more short-term shareholders are more likely to be taken over and receive lower
takeover premiums. It has been argued that dual class shares and other anti-takeover devices
increase the incentives for controlling shareholders and owner-managers to invest in firm-
specific managerial capital and adopt a longer time perspective for a company (Taylor and
Whittred, 1998). Thus, anti-takeover devices may reduce myopia and short-term behaviour.
On the other hand, anti-takeover devices may lead to negative entrenchment effects (see e.g.
Claessens et al., 2002). Our empirical analysis explores whether anti-takeover devices are
associated with higher takeover premiums (reduced myopia) or with just a reduced likelihood
that the target shareholders will receive a takeover premium (entrenchment).
Our data consists of an unbalanced panel with the largest listed non-financial firms on
the Stockholm Stock Exchange 1985-2005. There are 2158 firm years for 208 firms. Eighty-
4
seven firms were subject to a non-partial tender offer during our sample period.6 The average
takeover premium is roughly 24 percent.
We first document that in a traditional approach without selection control, the use of
dual class shares and anti-takeover devices is associated with a higher takeover premium.7
Second, the use of dual class shares and anti-takeover devices are also associated with a
reduced likelihood of a non-partial takeover. And when we control for the reduced likelihood
of a non-partial takeover in the two-stage selection model, we no longer find a significant
relation between the takeover premium and the use of dual class shares and anti-takeover
devices, respectively. Thus, anti-takeover devices and dual class shares appear to have
negative entrenchment effects but no positive effects in terms of reduced myopia.
Comment and Schwert (1995) analyse how the predicted and unpredicted likelihoods
that the firm will introduce a poison pill are related to both the probability of a takeover and
the takeover premium. They find that predicted (unpredicted) poison pills are associated with
a decreased (increased) takeover likelihood. They also document that the unpredicted
likelihood that the firm will introduce a poison pill increases the takeover premium. Thus,
Comment and Schwert (1995) control for the fact that firms that introduce poison pills are
selected. However, they do not directly control for takeover selection, i.e. firms that are taken
over are selected.
Eckbo et al. (1990) use limited dependent variable techniques to construct consistent
ML estimators that control for the fact that private information truncates the residual term.
Their results suggest that managers of bidders, but not targets, have valuable private
information about the potential synergies from proposed mergers. The data we use is different
in that it contains information on companies that did not experience a takeover event. Our
methodology allows to model non-specific information and not just the information specific
6 At negotiated block trades (partial takeovers), we do not observe the takeover premium paid by the bidder and the involved parties do not have to disclose the price at which the block was traded. 7 The results for anti-takeover devices other than dual class shares are statistically weak though.
5
to the gains from mergers modelled by Eckbo et al. (1990). Our results suggest that target
managers and/or large shareholders indeed have private information and that this influences
the takeover premium.
Gaspar et al.’s (2005) methodology is very similar to ours. They study how
shareholders’ investment horizons are related to the market for corporate control. First, OLS
regressions are estimated with the takeover premium as dependent variable. The results show
that firms with more short-term shareholders receive lower takeover premiums. They then
estimate Heckman selection models and find that firms with more short-term shareholders are
also more likely to be taken over. Sample selection is statistically relevant yet does not change
their main empirical results, i.e. controlling for sample selection does not change the negative
relation between short-term shareholders and the takeover premium. Their results suggest that
even if private information is relevant, it is not related to their proxy for short-term
shareholders
Our results suggest that anti-takeover devices and dual class shares, chosen as proxies
for long-term shareholdings, reduce the likelihood of a takeover but have no effect on the
takeover premium once the self-selection is controlled for in the model. Thus, since the
relations between dual class shares and anti-takeover provisions, respectively, and the
takeover premium change when we control for private information, private information
should be related to the use of dual class shares and anti-takeover provisions.
The next section presents our econometric methodology. The data used in the
empirical tests as well as our model specification are presented in Section 3. The empirical
results are reported in Section 4. Section 5 summarizes and concludes the paper.
2. Methodology
6
The issue of selection bias has received a fair amount of attention in the empirical corporate
finance literature. Accounting for selectivity serves a dual purpose: as a potential remedy
against the bias in estimated parameters of a model and, in our context, as a way of
incorporating and controlling for unobservable private information possessed by firms and
investors. Researchers have long been aware of the fact that corporate finance decisions are
not arbitrary and typically reflect premeditated decisions of firm managers and owners to
‘self-select into their preferred choices’ (Li and Prabhala, 2007). In the context of our model,
this self-selection is likely to be affected by the magnitude of the private benefits of control,
which are pecuniary and non-pecuniary benefits that accrue to the controlling shareholder of a
firm. Non-pecuniary benefits of a controlling shareholder, in particular, are largely private
information yet are very likely to have a significant effect on the likelihood of a firm to be
selected as a takeover target and on the probability of a successful takeover. Gaspar et al.
(2005) use the same methodology as we do in their robustness tests in a study of the market
for corporate control, while Bilinski and Strong (2010) apply this methodology in the analysis
of the long-run performance of seasoned equity offers (SEOs).
Following Heckman (1979), we adopt a baseline selection model, which is the most
popular modelling choice in corporate finance. In our context, accounting for self-selection
consists of two steps. First, we have to specify a model for self-selection, using finance theory
to model why some firms are taken over while others are not. In the second stage, we link the
random variables driving firms’selection to the magnitude of the takeover premium.
We start with a population regression in which the takeover premium P is a function
of some variables X. This regression must be estimated using a sub-sample of firms that were
subject to successful takeovers, i.e. the firms that self-select into choice S (sell) as opposed to
not sell (NS). Selection, C, is specified using a probit model in which firm i chooses S if the
7
net benefit from doing so, a scalar Wi, is positive. Writing the selection variable Wi as a
function of explanatory variables Zi, we obtain the system
C = S Wi = Zi γ + ηi > 0 (1)
C = NS Wi = Zi γ + ηi 0 (2)
Pi = Xiβ + εi (3)
where Zi denotes publicly known information influencing a firm’s choice, γ is a vector of
probit coefficients, and ηi is orthogonal to public variables Zi. Assuming that ηi and εi are
bivariate normal, we can derive the likelihood function and the maximum likelihood
estimators for (1)-(3).
In the above framework, selection can be interpreted as an omitted variable problem,
while the omitted variable itself can serve as a proxy for unobserved private information (Li
and Prabhala, 2007).
Equations (1) and (2), ηi is the part of Wi that is not explained by public variables Zi.
Thus, ηi can be interpreted as the private information driving the takeover event. The ex-ante
expectation of ηi should be zero. Ex-post, or after firm i decides whether to accept the
takeover bid (C=S) or not (C=NS), the expectations of ηi can be updated. The revised
expectation, E(ηi | C), is thus an updated estimate of the firm’s private information. To test
whether the private information in a firm’s acceptance of the takeover bid affected the
magnitude of the takeover premium, we would regress outcome P on E(ηi | C). But E(ηi | C)
=λC(.) is the inverse Mills ratio term, which is exactly what is used in the model to adjust for
self-selection (Heckman, 1979).
Testing the statistical significance of the inverse Mills ratio can be viewed as a test of
the effect of private information affecting a firm’s selection as a takeover target and whether
8
private information possessed by a firm explains the ex-post magnitude of a takeover
premium (Li and Prabhala, 2007).
Given the research question at hand, we interpret the private information as
knowledge about the magnitude of non-transferable private benefits of control. Since private
benefits of control by definition are private, their magnitude is not public knowledge. The
average size of pecuniary private benefits as a percentage of a firm’s market capitalization is
only 1% in Sweden, compared to 4.5% for the Anglo-Saxon countries (Nenova, 2003). Based
on premiums in block transactions, Dyck and Zingales (2002) construct a gauge of pecuniary
private benefits of control. They also find a lower value of private benefits in Scandinavia
compared to the Anglo-Saxon countries. Yet La Porta et al. (1999) report that in 45% (60%)
of large (medium sized) listed firms in Sweden, a family owns a controlling block (>20%).
This is consistent with large non-pecuniary benefits of control, especially for families
(Zingales, 1994).
Högfeldt (2005) and Holmén and Högfeldt (2009) argue that the non-pecuniary
private benefits in Sweden to a large extent stem from political influence and support from the
ruling Social Democrats (in power for all except three years of our 20-year sample period).
The connections with the Social Democrats result in e.g. smooth relations with the powerful
labour unions. Other non-pecuniary private benefits stem from the status and prestige derived
from controlling a large listed firm.
3. Data and Model Specification
3.1. Sample Selection
We start with an unbalanced panel dataset containing accounting and stock market data for
the largest non-financial Swedish firms listed on the Stockholm Stock Exchange 1985-2005.
The accounting data is collected from the Findata Trust database. The sample contains the
9
vast majority of the largest non-financial public firms in this time period. Some large firms
that were only listed for one or two years before delisting are not included in the sample.
The accounting data is combined with ownership data from Sundqvist (1985-1993),
Sundin and Sundqvist (1994-2002), Fristedt, Sundin, and Sundqvist (2003) and Fristedt and
Sundqvist (2004-2006).8 These sources report the 25 largest owners in all listed firms as of
January each year. Sundin and Sundqvist provide detailed information on coalition structures
and families in a wide sense. Thus, if two families are known to cooperate, their
shareholdings are aggregated by Sundqvist et al. We have followed their definitions of
ownership coalitions. After the collection of ownership data, the sample consists of 208 firms
and 2158 firm years.
A first rough estimate of non-partial takeover activity is also collected from the
publications by Sundqvist et al., since they report all delistings. In Sweden, almost all non-
partial takeovers are preceded by a public tender offer (Bergström and Rydqvist, 1989).
According to Swedish corporate law, any shareholder or group of shareholders in the target
that has 10% of the shares or votes can block a legal merger. Therefore, the terms of the
tender offer are often negotiated between the bidder and the large shareholders in the target
before the public announcement. When the large blockholders have accepted the terms of the
bid, a public tender offer is made for all target shares, including the blockholders’ shares
(Rydqvist, 1993). Most bids are non-partial and contingent on 90% of the shareholders
accepting the offer. To separate other delistings from actual non-partial takeovers, we use
daily newspapers.9 Our final takeover sample consists of 87 successful non-partial tender
offers.
The fact that we only look at successful takeovers suggests that all blockholders
ultimately accepted the offer, sometimes after a revision of the offer. Some non-partial
8 These publications are referred to as Sundqvist et al. below. 9 Part of this data was provided by Kristian Rydqvist.
10
takeovers start with a hostile tender offer, i.e. an offer that has not been discussed with the
blockholders in the target. The bidder then negotiates with the blockholders in the target and
then potentially revises the offer. If a rival bidder offers a higher price, the blockholders in the
target are not forced to sell to the initial bidder even if they have agreed on the terms of the
initial offer. However, since the terms of most tender offers are negotiated between the bidder
and the blockholders in the target before they are made public, we do not observe many failed
bids. On the other hand, failed negotiations are common, i.e. the bidder and the blockholders
in the target start negotiations but do not reach an agreement and then we do not observe a
tender offer. Furthermore, blockholders in potential target firms may negotiate with several
potential bidders before reaching an acceptable offer or deciding not to sell.
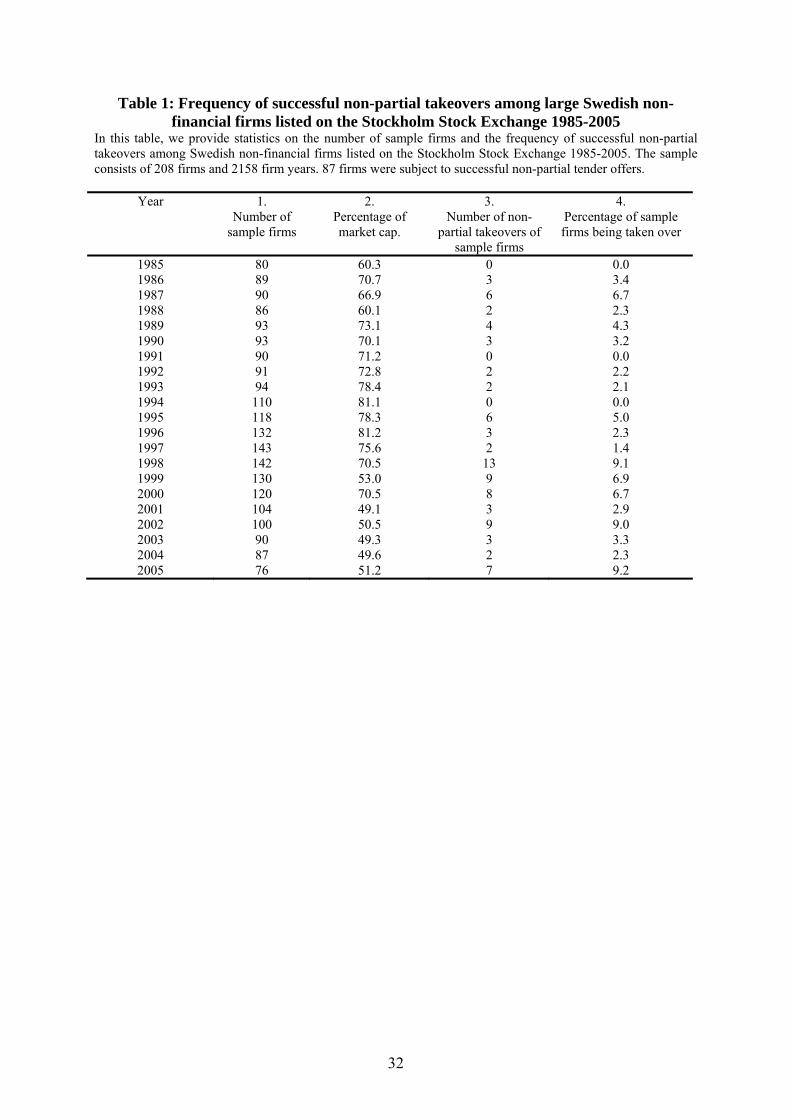
Table 1 panel A summarizes our sample. On average, our sample roughly contains
100 firms each year and roughly comprises 70 percent of the Swedish stock market
capitalization. On average, four firms are taken over each year.
3.2. Descriptive Statistics
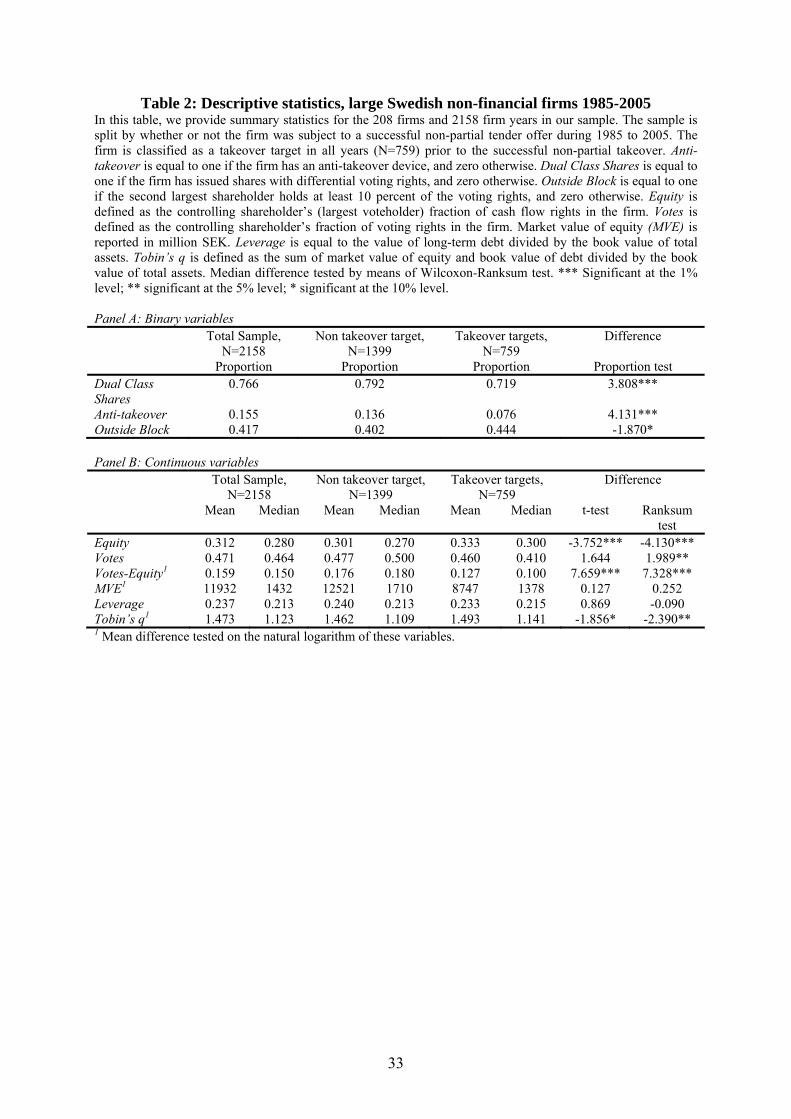
In Table 2, we provide descriptive statistics for the 208 firms and 2158 firm years in
our sample. In panel A, we report statistics for three binary variables. Almost 77 percent of
the firms have Dual Class Shares. Typically, high-voting A-shares carry 10 votes, while low-
voting B-shares are one share/one vote. Anti-takeover devices are present in 15.5 percent of
the firms. The anti-takeover devices typically consist of various shareholder agreements and
rights of pre-emption. The shareholder agreements consist of agreements between large
shareholders regarding how to vote (voting pacts) and restrictions on a coalition member’s
sale of high-voting stock to a third party. Rights of pre-emption means that owners of high-
voting stock have the right to buy back non-traded high-voting stock sold by a coalition
11
member to a third party.10 In 41.7 percent of the firms, the second largest shareholder holds at
least 10 percent of the voting rights (Outside Block).
The sample is split by whether the firm was a takeover target in 1985-2005. The firm
is classified as a takeover target all years prior to the successful non-partial takeover. Anti-
takeover devices are significantly more common among firms that are not taken over. Dual
class shares decrease the probability that the firm will be a takeover target while firms with an
outside blockholder are more likely to be taken over. In Panel B, we report statistics for
continuous variables. The largest block of equity contains 31 percent of the firm’s cash flow
rights on average (Equity). The average controlling owner holds 47 percent of the voting
rights (Votes). The difference between Equity and Votes is due to the high frequency of dual
class shares. The median controlling shareholder has almost 16 percent more voting rights
than cash flow rights (Votes-Equity). The median firm has a market value of equity of 1432
million SEK (MVE), has financed 21.3 percent of the total assets with long-term debt
(Leverage), and has a Tobin’s q of 1.123. Tobin’s q is defined as the sum of the market value
of equity and the book value of total debt divided by the book value of total assets.
The mean and the median difference tests suggest that the controlling owners in
takeover targets have more cash flow rights, yet the median difference test suggests that they
have slightly less voting rights. The separation between votes and capital is smaller in
takeover targets.11 The average and median target firm has a higher Tobin’s q than the non-
target firms.
10 We do not include non-traded high-voting stock and voting restrictions when constructing our indicator variable for anti-takeover devices. Non-traded high-voting stock is conditional on dual class shares and highly correlated with our Votes-Equity variable (correlation coefficient=0.52), and we want to separate the potential different effects of the use of dual class shares and other anti-takeover provisions. However, we report several robustness tests on the effect of non-listed high-voting stock below. The effect of voting restrictions as an anti-takeover device is ambiguous since it depends on the ownership structure of the firm. Including it when constructing an alternative anti-takeover variable generates similar but statistically weaker results compared to the results reported below. In general, we find a lower frequency of anti-takeover devices in our sample than Cronqvist and Nilsson (2003). We focus on the largest firms while they look at all listed firms. Anti-takeover provisions are more common among small firms. 11 Note that mean differences are tested on the natural logarithm of Votes-Equity, Firm Size, and Tobin’s q.
12
In our sample, there are no firms with both anti-takeover devices and one share/one
vote arrangements. The correlation coefficient between Votes-Equity and the Anti-takeover
dummy is 0.15. The dual class firms with additional anti-takeover devices are significantly
smaller and are less likely to have a large outside blockholder (Outside Block). Additionally,
in dual class firms with additional takeover devices, the controlling shareholder coalition
holds more cash flow rights and more voting rights – probably as a result of shareholder
agreements and rights of pre-emption. The difference between voting rights and cash flow
rights (Votes-Equity) is smaller in firms with additional anti-takeover devices. However, in a
regression with Votes-Equity as dependent variable and the Anti-takeover dummy as
independent variable, and where firm size (MVE) and industry effects are controlled for, the
Anti-takeover dummy is insignificant. Cesares-Field and Karpoff (2002) report that firms with
dual class firms in the U.S. do not use any other anti-takeover devices, while firms using one
share/one vote systems often use an arsenal of such measures. This result suggests that dual-
class shares are the single most effective anti-takeover measure.
Ikäheimo et al. (2011) examine the use of anti-takeover devices in Nordic firms. They
document that anti-takeover devices are negatively related to firm value and that this negative
relation mainly stems from the use of dual class shares. Maury and Pajuste (2011) also
document that dual class share unifications in Europe lead to increased firm value.
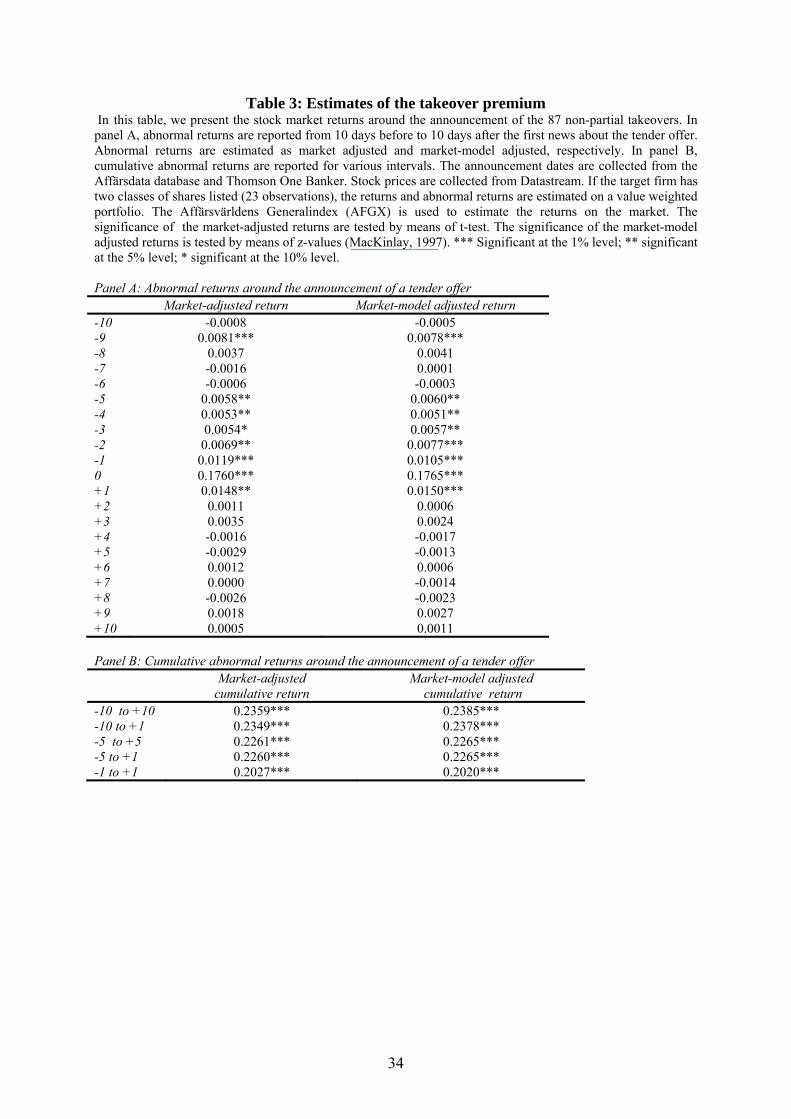
3.3. Takeover Premium Estimates
In order to estimate the takeover premium, we collect stock prices for the firms subject to
successful non-partial tender offers. The announcement dates are collected from the
Affärsdata database12 and Thomson One Banker. Stock prices are collected from Datastream.
We estimate the takeover premium as the market-adjusted returns and the market-model
12 The Affärsvärlden database contains all newspaper articles from the Swedish business press. We search for the first day the press mentions the tender offer and define the day before as the day of the announcement.
13
adjusted returns (MacKinlay, 1997; Khotari and Warner, 2007).13 Affärsvärldens
Generalindex (AFGX) is used as a proxy for the market. This index is value weighted and
comprises roughly 99 percent of the Swedish stock market. The market-model parameters are
estimated from 240 to 21 days before the offer.14
Among the 87 takeover targets, 59 firms have dual class shares and 23 firms have both
classes of shares listed. If the takeover target has dual class shares but only one class is listed,
the premium on the listed shares is used as a proxy for the premium on the non-listed shares.
If the takeover target has two classes of shares listed, the returns and abnormal returns are
estimated on a value-weighted portfolio. Twelve bids differentiate between A- and B-shares,
i.e. the offer price is higher for the A-shares.15 Among these twelve bids, the average voting
premium is 11.5 percent. The correlation between the voting premium in the offer and the
voting premium on the stock market in the month before the offer is 84 percent (calculated for
the 23 observations with dual class shares listed), i.e. it appears as if the voting premium in
the offer reflects different market prices before the offer. However, the causality between
these two premiums is of course ambiguous. Rydqvist (1996) shows that the voting premium
dramatically increases at control contests. It is likely that the voting premium would increase
if a public tender offer were anticipated, especially if the tender offer is expected to include a
voting premium.
The average abnormal returns from ten days before the offer to ten days after the offer
are reported in Table 3 panel A. Both measures of abnormal returns show significant returns
on day -9 and on days -5 to +1. A significant price run-up the week before the tender offer
has also been detected in earlier studies and is typically interpreted as informed agents trading
in the market (see e.g. Schwert, 1996; Conrad and Niden, 1992; and Farinos et al., 2005).
13 It is not possible to calculate the takeover premium based on the offered price since some of the non-cash offers include convertibles and warrants for which we do not have complete information. 14 There are no failed bids during the estimation periods. 15 According to Swedish law, the bidder can differentiate the offer price between A- and B-shares. Nevertheless, the bidder cannot differentiate the offer price within the groups of A and B shareholders.
14
However, the significant abnormal returns on day -9 are puzzling. We identify five
target firms with large (>5%) abnormal returns on day -9 and search the news database for
these firms.16 We find news around day -9 for four of these five firms. The news consisted of
i) a report of increased sales, ii) a major new contract, iii) layoffs in one plant, and iv) a block
trade (without any information about expectations of a tender offer).17 We re-ran all tests
without these five firms. The results remained virtually unchanged.
None of the returns after day +1 are significant. Furthermore, we examined the
average abnormal returns from day -20 to day -11, but found no significant returns. The
significant average abnormal returns the days before the announcement vary from 0.5 percent
the days before the tender offer to almost 18 percent on the day of the offer. The highest one-
day return at the tender offer is roughly 65 percent, while the lowest is zero.
In panel B, we report cumulative abnormal returns for various intervals. The average
market-adjusted returns and the average market-model adjusted returns from ten days before
the tender offer to the day after the tender offer is almost 24 percent. The adjusted returns
from the day before to the day after the tender offer are roughly 20 percent. These numbers
are similar to the takeover premiums at tender offers in the U.S. reported by e.g. Jensen and
Ruback (1983).
3.4. Model Specification
We first focus on the relation between the anti-takeover devices and the takeover premium.
Anti-takeover devices are captured by an indicator variable (Anti-takeover). Inspired by
Grossman and Hart (1988), we also focus on the relation between the use of dual class shares
and the takeover premium. We estimate the use of dual class shares as the difference between
16 Without these five firms, the abnormal returns on day -9 are insignificant. 17 In the process of initial data collection, we searched for the relevant news and rumors in the financial press prior to the official takeover announcements. We found no news or rumors combining the target firm and the bidding firm with an expected takeover.
15
the largest shareholder’s fraction of the firm’s voting rights minus his/her fraction of the
firm’s cash flow rights, i.e. as Votes-Equity. However, the implication of Votes-Equity being
0.1 might be different when Votes is 0.5 and Equity 0.4 compared to a situation when Votes is
0.15 and Equity 0.05. We therefore include Equity per se in the regression model as well. A
certain monetary premium would result in a different takeover premium measured in
percentage of firm value. We therefore include the market value of equity (MVE) as an
explanatory variable. There should be less potential value creation when a well performing
firm is acquired. Tobin’s q is included in the model to capture this effect. Finally, a large
outside blockholder might influence the price at which a bidder is able to take over the firm.
Outside Block, which is equal to one if the second largest shareholder holds more than 10
percent of the voting rights in the firm, and zero otherwise, is therefore included as an
explanatory variable.
The MVE and Tobin’s q variables are similar to control variables used by e.g. Cai and
Vijh (2007) in regressions with the takeover premium as dependent variable. Cai and Vijh
(2007) include variables for relative size of the bidder and target firms and the target firms’
book-to-market ratio. They also include variables for i) the market value of holdings of the
CEO in the bidder, ii) method of payment (cash dummy), iii) the acquirer’s book-to-market
ratio, iv) industry relatedness between the target and the bidder, and v) side payments to the
target CEO. We cannot include information about the bidder or the tender offer in our system
of equations since this information is not known prior to the tender offer, i.e. we cannot
predict a tender offer by the characteristics of the bidder or the tender offer. However, we do
test the impact of the method of payment on the takeover premium in OLS regression in the
robustness section below.
We use the same variables as explanatory variables when estimating the likelihood
that the firm will be taken over. However, we need to add at least one variable in order to
16
meet the identification criteria. Stulz (1988) shows how managers can increase their voting
power by increasing firm leverage. The managers thereby entrench themselves from the
market for corporate control. Leverage is therefore added to the selection equation.18 Whether
anti-takeover devices and dual class shares influence the takeover premium, the likelihood of
a takeover or both is an empirical question. We therefore include Anti-takeover and Votes-
Equity in the takeover probability models. Equity per se is also included. Given wealth
constraints, there should be fewer potential bidders for a larger firm, ceteris paribus. Market
value of equity (MVE) is therefore included in the takeover probability model as well.
Furthermore, a large outside blockholder might also influence the likelihood of a takeover. In
fact, it is not uncommon that it is the second largest shareholder that makes a non-partial
takeover of the firm. Hence, we include Outside Block in the takeover probability model. We
also include a variable for duration dependence. Duration dependence exists when the
takeover probability is affected by the length of time during which we observe firms, and thus
we would expect to observe a positive (or non-negative) duration dependency. In other words,
we hypothesize that the chances of observing takeover are likely to increase the longer we
observe a firm. Each year the variable ldur is equal to the natural logarithm of the number of
years a specific firm has been observed in the dataset up to that point.
Takeover activity is typically clustered in different industries. Furthermore, the
magnitude of private benefits of control most likely varies between industries (see e.g.
Demsetz and Lehn, 1985). And the magnitude of private benefits of control might influence
the probability of a successful tender offer (Grossman and Hart, 1988). We therefore include
nine industry dummies in the regressions. The industry dummies are defined based on the first
digit in the SIC code.
We end up estimating the following system of equations:
18 Leverage may therefore influence the takeover premium as well. However, in our data there is no such significant relationship.
17
1543210 ')(Premium ublockOutsideqsTobinMVEDeviceerAntitakeovEquity
and Premium is observed if
0
')(
2
17
87
6543210
uIndustryldur
blockOutsideqsTobinMVEDeviceerAntitakeovEquityLeverage
ii
,
where u1 ~ N(0, σ), u2 ~ N(0, 1), and corr(u1, u2) = ρ .
Anti-takeover Device is either equal to i) the indicator variable for the existence of anti-
takeover devices (Anti-takeover) or to ii) the Votes-Equity variable19.
The model is estimated by maximum likelihood. Regression estimates using the non-
selection hazard (Heckman, 1979) provide starting values for the maximum likelihood
estimation. In unreported tests, we also estimated the model using Heckman’s (1979) two-step
procedure. The two-step parameter estimates are obtained by augmenting the regression
equation with the non-selection hazard computed using Probit estimates of the selection
equation. The results from the two-step procedure are similar but marginally statistically
weaker than the results reported below.
4. Empirical Results
4.1. Ordinary Regressions
We use the market-model adjusted return over the 12-day window (day -10 to +1) in the
empirical analysis. The results for the market-adjusted return and other event windows are
similar to the ones reported.
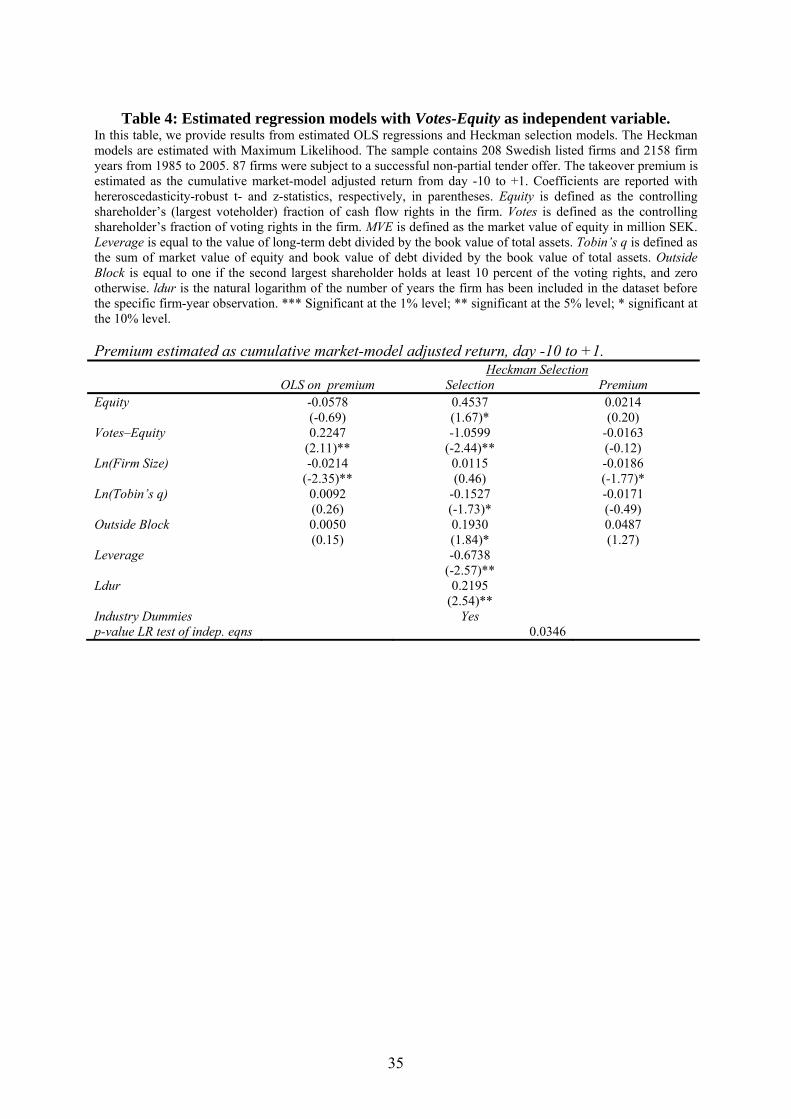
We begin our empirical analysis by running OLS regressions with estimates of the
takeover premium as dependent variable and the Votes-Equity variable and control variables
19 The model in Table 7 uses both variables.
18
as independent variables. The results are reported in the first columns in Table 4. The use of
dual class shares (Votes-Equity) is significantly positive at the 5 percent level in the OLS
model. The market value of equity (MVE) is negatively significant at the 5 percent level. The
other variables (Equity, Tobin’s q and Outside Block) are insignificant.
In Table 5, we substitute the use of dual class shares with the Anti-takeover indicator
variable. Again, OLS regressions with the same estimates of the takeover premium are
reported in the first column. The use of Anti-takeover devices is positive and significant at the
10 percent level. Market value of equity (MVE) is again negatively significant at the 5 percent
level. The other variables are insignificant.
In Table 6 we include both Votes-Equity and Anti-takeover as independent variables.
Votes-Equity is positively significant at the 10 percent level. Anti-takeover is insignificant.
Market value of equity is negatively significant at the 5 percent level. Otherwise the control
variables are insignificant. Thus, generally the OLS results in Tables 4-6 suggest that the use
of dual class shares, captured by Votes-Equity, is associated with higher takeover premiums.
The coefficients on other Anti-takeover devices are also positive but less significant.
4.2. Heckman Selection Models
We now turn to Heckman selection models where we first estimate the likelihood that the
firm will be taken over. The results are reported in the second and third columns of Tables 4-
6. In Table 4, the use of dual class shares (Votes-Equity) is negatively significant (at the 5
percent level) in the selection equation, i.e. separation of voting rights from cash flow rights
by vote-differentiated shares reduces the likelihood that the firm will be taken over. This
result is consistent with Grossman and Hart’s (1988) argument that shares with differentiated
voting rights will reduce the likelihood of takeovers if some of the incumbent’s private
benefits are not transferable to the bidder.
19
In Table 5 Anti-takeover is also significantly negative at the 5 percent level. Thus,
anti-takeover devices indeed reduce the likelihood that the firm will be taken over.
In Table 6, both Anti-takeover and Votes-Equity are included as independent variables
in the selection equation. They are both negatively significant at the 5 percent level. Thus,
even if the two variables are positively correlated, it appears as if they capture two separate
effects of reduced takeover likelihood.
In terms of the other variables in the selection equation, Equity is significantly positive
in all tables (at the 5 or 10 percent level), i.e. the more cash flow rights the largest shareholder
holds, the more likely a takeover is to occur. This result is consistent with Shleifer and Vishny
(1986), who argue that a large shareholder (cash flow rights) can facilitate a takeover by
reducing the free rider problem (Grossman and Hart, 1980). Consistent with Stulz’ (1988)
argument, the likelihood of a takeover is negatively related to Leverage at the 1 or 5 percent
significance level in the estimated models. Managers and controlling shareholders can
insulate themselves from the market for corporate control by increasing firm leverage since it
increases their voting power in the firm, ceteris paribus. The presence of a large outside
blockholder also increases the likelihood of a takeover – significant at the 5 or 10 percent
level. Firm performance (Tobin’s q) significantly reduces the likelihood of a takeover (at the
10 percent level) in Table 4. The likelihood of a takeover exhibits positive duration
dependence in all models.
In the third columns in Tables 4-6, we report estimated premium equations where we
control for private information about the likelihood of a takeover. The coefficient on Votes-
Equity is now insignificant in the estimated models in Tables 4 and 6. Thus, when we control
for the fact that we do not observe a takeover premium for all firms, there is no significant
relation between the use of dual class shares and the takeover premium. Similarly, Anti-
takeover goes from being positively significant at the 10 percent level to insignificant in Table
20
5. Thus, there are no indications that dual class shares and anti-takeover devices are
associated with higher takeover premiums.
The other coefficients are similar in the OLS and Heckman premium models. Thus,
private information does not appear to be related to Equity, Tobin’s q and Outside Block. The
results for market value of equity (MVE) are roughly the same in the OLS and the Heckman
premium models, although they become somewhat less significant.
The likelihood ratio tests reject the hypothesis that the selection equation and the
takeover equation are independent in Tables 4 and 6 – at the 5 percent level. Thus, the OLS
results in the first columns in these tables are biased. The likelihood ratio test does not reject
the hypothesis that the selection equation and the takeover premium equation are independent
in Table 5 where Votes-Equity is not included. Thus, it appears as if the selection problem is
more pronounced for the use of dual class shares than for the use of other anti-takeover
devices.
The difference between the OLS results and the Heckman results where we control for
private information suggests that private information is correlated with the use of dual class
shares. The use of dual class shares is probably related to the magnitude of private benefits of
control, and the magnitude of private benefits is per definition private information.20 Thus,
one interpretation of our results is that the private information consists of private knowledge
about the magnitude of the private benefits of control.
4.3. Robustness and Extensions
Leverage: We first test whether Leverage indeed is unrelated to the takeover premium. The
results are reported in Table 7 panel A and Leverage is insignificant. Thus, Leverage appears
to significantly decrease the likelihood of a takeover but does not appear to be related to the
20 Bebchuk (1999) argues that “the decision to adopt dual-class equity in conjunction with a concentrated ownership structure can only be explained by the existence of private benefits of control.”
21
takeover premium. In unreported tests, we also included Leverage in the premium equation
and used other variables to identify the system of equations. The results did not change, i.e.
Leverage was negatively significant in the selection equation and insignificant in the premium
equation.
Method of Payment: Several papers have documented that cash tender offers are associated
with higher takeover premiums.21 We include a cash dummy in our premium equation. The
cash dummy is positive but insignificant in the estimated OLS models in Table 7 panel B.
Furthermore, including the cash dummy does not change the other results compared to the
reported models in Tables 4-6. We have also tested the correlation between the cash dummy
and the Mill’s ratio from the Heckman model. The correlation is insignificantly negative, i.e.
the non-selection hazard rate of a takeover is not significantly related to the method of
payment. The insignificant correlation suggests that the private information proxied by the
Mill's ratio is not revealed in the method of payment. Thus, the dependence of the premium
and selection equations appears not to be driven by the fact that we cannot include a method
of payment variable in the selection equation.
Other independent variables: We have also included other variables in the selection equation
and the premium equation. Including firm liquidity (tangible assets/total assets), return on
assets (EBITD/ total assets) or firm age does not change our main results. And including these
variables in the OLS regression with the takeover premium as dependent variable does not
change the relation between takeover premium and the use of dual class shares and anti-
takeover devices, respectively.
Industry dummies in the premium equation: Including industry dummies also in the premium
equation does not change the results for the Votes-Equity tests substantially. However, the
21 Another variable that has been found to be significantly related to the takeover premium is the relative size of the target and bidder. It is not possible to include this variable in the system of equations since it includes information about the bidding firms. We could include it in the OLS regressions. However, collecting the size of private and foreign bidders is difficult, especially for the takeovers in the 1980s.
22
results for the Anti-takeover tests do change. Without industry dummies in the premium
equation, the OLS and the Heckman results are substantially different. With industry
dummies in both the selection equation and the premium equation, the OLS and Heckman
results are more similar.
Unlisted A-shares: One potential issue with our estimates of the takeover premium is that we
do not observe the market price on unlisted A-shares (36 observations) before the tender
offer. In the reported tests above, we approximated the takeover premium on unlisted A-
shares with the takeover premium on the listed B-shares. We perform a series of tests to
explore whether this approximation affects our results. First we insert a dummy equal to one
if the firm has unlisted A-shares in both the selection equation and the premium equation. The
dummy is insignificant in all estimated models and the other results are virtually unchanged.
Second, we adjust the estimated premium for the four target firms that have non-listed A-
shares and receive a tender offer that price-differentiates between A- and B-shares. The
adjustment of the premium is done by adding the product of the extra premium on the A-
shares in the tender offer and the fraction of A-shares of total shares in the firm. This
adjustment assumes that the prices of the A- and B-shares are the same before the tender
offer. Using the adjusted premium in the estimated models does not change the results.
However, in unreported tests the estimated takeover premium is significantly higher
for the dual class firms without listed A-shares compared to the dual class firms with listed A-
shares. Thus, either a dual class firm with non-listed A-shares receives a higher takeover bid
than a dual class firm with listed A-shares, ceteris paribus, or using the takeover premium on
the listed B-shares as a proxy for the takeover premium on the unlisted A-shares
overestimates the takeover premium on the non-listed A-shares. We think the former
alternative is more plausible. Listed A-shares means per definition that the A-shares are more
or less dispersed. When the A-shares are not listed, it usually means that the controlling
23
owner holds all of them in one block. And if the incumbent controls all A-shares, he/she can
maximize the proceeds from the sale of control rights and receive a higher takeover premium
(Zingales, 1995).
Furthermore, among the acquired firms, Vote-Equity is not statistically different if the
dual class firm has listed A-shares compared to dual class firms with unlisted A-shares
(unreported). And the statistically significant positive relation between Vote-Equity and the
takeover premium in the OLS regressions remains even if we only include the 23 firms with
listed A-shares in the estimation. Thus, the positive OLS relation between Votes-Equity and
the takeover premium does not appear to be driven by the firms for which we have
approximated the takeover premium on the A-shares.
The bidder differentiated between A- and B-shares in 12 of the 59 tender offers for
dual class firms (28 targets were single class firms).22 We define a variable Bid A/Bid B as the
offer price for A-shares divided by the offer price for B-shares minus 1. Thus, if the offer
price is the same for A- and B-shares, the variable equals zero. The variable also equals zero
for single class firms. Bid A/Bid B is negatively significant in M2 in panel B, Table 7. This
result suggests that the total takeover premium is reduced when the bidder price differs
between A- and B-shares. This result remains roughly the same if we only include the 59
targets with dual class shares in the estimation, i.e. only the firms where a differentiated bid is
actually possible.
In M3, we insert a variable capturing the different market prices of A- and B-shares in
the month before the tender offer (Price A/Price B). The variable capturing different offer
prices for A- and B-shares (Bid A/Bid B) then becomes insignificant. The variable for
22 In the majority of the tender offers, the blockholders, who typically hold A-shares, do not get preferential treatment. This result is consistent with the small control block premium in Sweden documented by Dyck and Zingales (2002). Many blockholders of A-shares also hold large blocks of B-shares and might therefore be compensated by a relatively high price on the B-shares. In fact, our results suggest that if the blockholder does not also hold a large block of B-shares, i.e. Votes-Equity is high, they might not reach an agreement with the bidder and hence the takeover likelihood decreases.
24
different market prices before the tender offer is on the other hand negatively significant.
Again, the results remain roughly the same if we only include the 59 dual class firms in the
estimation. It appears as if a larger voting premium on the A-shares in the month before the
tender offer reduces the total takeover premium. We interpret this result in terms of a run-up
in especially the A-shares in anticipation of a takeover. The mark-up (potentially a higher bid
on the A-shares) on the A-shares is then reduced at the tender offer, and this is reflected in a
lower total takeover premium. For the 23 observations with listed dual class shares, the
correlation between the price difference between A- and B-shares on the market before the
tender offer and at the time of the tender offer is 84 percent.
The results in M2 and M3 in panel B should be interpreted with caution since we do
not observe the market prices of the A-shares in the dual class firms where the A-shares are
not listed. The estimations assume that the market-voting premium is zero for these firms. If
we only include the 23 firms with dual class shares listed in panel C, Bid A/Bid B and Price
A/Price B are still negative but become insignificant in M2 and M3, respectively.
Alternative measure of Votes-Equity: We tried alternative definitions of the difference
between the largest shareholders’ ownership of voting rights and cash flow rights. First, all
tests were run replacing the difference between voting fraction and equity fraction with the
ratio of the voting fraction and the equity fraction. The results were virtually unchanged. We
also used the log of the ratio. Again, the results were virtually unchanged. However, when we
instead included a dummy variable for the existence of dual class shares, the dummy variable
was insignificant in all tests. Thus, it is not the existence of dual class shares that is related to
takeover likelihood. It is only when dual class shares are used to drive a substantial wedge
between the controlling shareholder’s voting and the cash flow rights, that we observe a
negative relation between takeover likelihood and dual class shares.
25
Longer event window: For the reported results, we used a 12-day event window to estimate
the takeover premium. Using shorter event windows does not change the main results.
However, if we increase the length of the event window to 22 days, i.e. day -20 to day +1, the
results are somewhat different. The OLS results for the premium are roughly the same but the
Heckman results are not substantially different from the OLS results.23
Results for the U.S.: In order to investigate to what extent our Swedish results can be
generalized to other countries, we collect a U.S. sample consisting of S&P1500 firms 2004-
2010 (1866 firms and 8872 firm year observations). We collect market and accounting data
from Thomson’s Datastream, takeover information from Bureau van Dijk’s Zephyr database,
and the anti-takeover score from the corporate governance quotient (CGQ)24.
For the 284 takeovers among S&P1500 firms identified in Zephyr, we use the takeover
premium provided in Zephyr instead of estimating the market-model adjusted returns. There
are not many firms with dual class shares among the S&P1500 firms, and none of them were
taken over 2004-2010. Thus, we cannot analyse the relation between dual class shares and
takeover likelihood in the U.S. sample. Instead we use the anti-takeover sub-score provided in
CGQ.
We collect market value of equity (MVE) and define Tobin’s q as above. However, we
are not able to collect the equity fraction of the largest shareholder. Instead we use a dummy
variable available in CGQ that is equal to one if insider ownership is between one percent and
30 percent, and zero otherwise. We are not able to collect a variable for outside block
23 In some previous studies, the cross-sectional results also change depending on how the takeover premium is estimated; see e.g. Bargeron et al. (2008). 24 CGQ is a corporate governance rating system provided by Institutional Shareholder Services (ISS) on over 8000 companies worldwide. It evaluates the strengths, deficiencies, and risks of a company's corporate governance practices and board of directors. CGQ uses underlying data points for up to 67 corporate governance variables, categorized into four areas of focus: 1) board of directors, 2) audit, 3) anti-takeover provisions, and 4) executive and director compensation. In addition to the overall index, CGQ provides sub-scores for each focus area. A firm’s sub-score represents quintile (5=top quintile) rankings in terms of shareholder-friendly policies within each sub-category compared to the firm’s market index and its industry group. We report results for the index ranking. The results for the industry ranking are similar. We take the inverse of the quintile ranking in order to make the U.S. results more easily comparable to the Swedish results.
26
holdings. For the selection equation, we collect and define Leverage, duration dependence
(ldur) and industry dummies as above.
The results are reported in Table 8. In the OLS regression with the takeover premium
as dependent variable, the CGQ Anti-takeover Score is positively significant. However, after
controlling for selection, it is insignificant. These results corroborate the Swedish results.25
The likelihood ratio test also strongly rejects the hypothesis that the selection equation and the
takeover equation are independent. Thus, the OLS results are biased.
5. Summary and Conclusion
In this paper, we have explored the relation between the likelihood of the firm becoming a
takeover target, the takeover premium, and the use of anti-takeover devices . Focus has
mainly been on how the cross-sectional relation between the use of anti-takeover devices and
dual class shares, respectively, and the takeover premium changes when we control for the
fact that the use of anti-takeover devices and dual class shares also influence the likelihood of
a takeover. Dual class shares are positively and significantly related to the takeover premium
and negatively and significantly related to the likelihood of a takeover. When we control for
private information about the likelihood of a takeover, the relation between dual class shares
and the takeover premium becomes insignificant. The results for anti-takeover devices are
similar but statistically weaker. Generally, our results suggest that the takeover premium and
likelihood of a takeover are not independent.
We believe that our results have two implications. First, ordinary cross-sectional
analysis of abnormal returns related to corporate events may be influenced by selection bias
and therefore lead to flawed conclusions. Second, dual class shares and anti-takeover devices
appear to be associated with negative entrenchment effects in terms of lower probability of
25 Compared to the Swedish results, the CGQ Anti-takeover Score is not significant in the selection equation, whereas duration dependence is negatively significant.

27
receiving a takeover premium. Dual class shares and anti-takeover devices do not appear to be
associated with positive effects in terms of higher takeover premiums as a result of reduced
myopic behaviour of controlling shareholders and owner-managers.
28
References
Ahern, K. (2009) Sample selection and event study estimation, Journal of Empirical Finance, 16, 466-482. Bargeron. L. L., F. P. Schlingemann, R. M. Stulz, and C. J. Sutter (2008) Why do private acquirers pay so little compared to public acquirers? Journal of Financial Economics, 89, 375-390. Bebchuk, L. A. (1999) A rent-protection theory of corporate ownership and control, John M. Olin Center for Law, Economics, and Business, Harvard University, Working Paper 260. Bergström, C. and K. Rydqvist (1989) Stock price reactions to tender offers in Sweden, SNS Occational Papers No. 11. Betton, S., E. Eckbo, and K. Thorburn, 2008, Corporate takeovers, in E. Eckbo (ed.), Handbook of Corporate Finance: Empirical Corporate Finance, Vol. 2. Ch. 15, Elsevier. Bilinski, P. and N. Strong (2010) Managers’ private information, investor underreaction and long-run SEO performance, working paper, Manchester Business School. Bradley, M., A. Desai, and E. H. Kim (1988) Synergistic gains from corporate acquisitions and their division between the stockholders of target and acquiring firms, Journal of Financial Economics, 21, 3-40. Cai, J. and A. Vijh (2007) Incentive effects of stock and option holdings of target and acquirer CEOs, Journal of Finance, 62, 1891-1933. Casares-Field, L., and J. M. Karpoff (2002) Takeover defences in IPO firms, Journal of Finance, 57, 1857-1889. Claessens, S., S. Djankov, J. Fan, and L. H. P. Lang (2002) Disentangling the incentive and entrenchment effects of large shareholdings, Journal of Finance 57, 2741-2771. Comment, R., and G. W. Schwert (1995) Poison or placebo? Evidence on the deterrence and wealth effects of anti-takeover measures, Journal of Financial Economics, 39, 3-43. Conrad. J. and C. M. Niden (1992) Order flow, trading costs and corporate acquisition announcements, Financial Management, winter, 22-31. Cronqvist, H. and M. Nilsson (2003) Agency costs of controlling minority shareholders, Journal of Financial and Quantitative Analysis, 38, 695-719. Demsetz, H. and K. Lehn (1985) The structure of corporate ownership: Causes and consequences, Journal of Political Economy, 93, 1155-1177.
29
Dickerson, A. P., H. D. Gibson, and E. Tsakalatos (2002) Takeover risk and the market for corporate control: The experience of British firms in the 1970s and 1980s, International Journal of Industrial Organization, 20, 1167-95. Dyck, A. and L. Zingales (2002) Private benefits of control: An international comparison, Journal of Finance, 57, 537-600. Eckbo, E. V. Maksimovic, and J. Williams (1990) Consistent estimation of cross-sectional models in event studies, Review of Financial Studies, 3, 343-365. Farinos, J. E., C. J. Garcia, and A. M. Ibanez (2005) Insider trading and market behavior around takeover announcements in the Spanish market, Review of Financial Markets, 7, 31-53. Franks, J. and R. S. Harris (1989) Shareholder wealth effects of corporate takeovers: The UK experience 1955-1985, Journal of Financial Economics, 23, 225-249. Fristedt, D., A. Sundin, and S. I. Sundqvist (2003) Owners and Power in Sweden’s Listed Companies, Dagens Nyheter, Stockholm. Fristedt, D., and S. I. Sundqvist (2004-2006) Owners and Power in Sweden’s Listed Companies, Dagens Nyheter, Stockholm. Gaspar, J.-M., M. Massa, and P. Matos (2005) Shareholder investment horizons and the market for corporate control, Journal of Financial Economics, 76, 135-165. Grossman, S. and O. Hart (1980) Takeover bids, the free rider problem, and the theory of the corporation, Bell Journal of Economics, 11, 42-64. Grossman, S. and O. Hart (1988) One share - one vote and the market for corporate control, Journal of Financial Economics, 20, 175-202. Heckman, J. (1979) Sample selection as a specification error, Econometrica, 47, 153-161. Holmén, M. and P. Högfeldt (2009) Pyramidal discounts: Tunneling or overinvestment? International Review of Finance, 9, 133-175. Högfeldt, P. (2005) The history and politics of corporate ownership in Sweden, in R. Morck (ed), A History of Corporate Governance Around the World: Family Business Groups to Professional Managers. NBER. Chicago: University of Chicago Press, 517–80. Ikäheimo, S., V. Puttonen, and T. Ratilainen (2011) External corporate governance and performance – Evidence from the Nordic countries, European Journal of Finance, 17, 427-450. Kothari. S. P. and J. B. Warner (2007) Econometrics of event studies, in E. Eckbo (ed.), Handbook of Corporate Finance: Empirical Corporate Finance, Vol. 1. Ch. 1, Elsevier.
30
La Porta,R., F. Lopez-de-Silanes, and A. Shleifer (1999) Corporate ownership around the world, Journal of Finance, 54, 471-517. Li, K. and N. R. Prabhala, (2007) Self-selection models in corporate finance, in E. Eckbo (ed.), Handbook of Corporate Finance: Empirical Corporate Finance, Vol. 1. Ch. 2, Elsevier. MacKinlay, A. C. (1997) Event studies in economics and finance, Journal of Economic Literature, 35, 13-39. Maury, B. and A. Pajuste (2011) Private benefits of control and dual class share unifications, Managerial and Decision Economics, 32, 355-369.
Morck, R,, A. Shleifer, and R. Vishny (1989) Alternative mechanisms for corporate control, American Economic Review, 79, 842-852.
Nenova, T. (2003) The value of corporate votes and control benefits, Journal of Financial Economics, 68
Rydqvist, K. (1993) The division of takeover gains in Sweden, CEPR working papers No. 31. Rydqvist, K. (1996) Takeover bids and the relative prices of shares that differ in their voting rights, Journal of Banking and Finance, 20, 1407-1425. Schwert, G. W. (1996) Markup pricing in mergers and acquisitions, Journal of Financial Economics, 41, 153-192. Shleifer, A. And R. Vishny (1986) Large shareholders and corporate control, Journal of Political Economy, 94, 461-488. Sokolyk, T., (2011) The effects of anti-takeover provisions on acquisition targets, Journal of Corporate Finance, 17, 612-627. Song, M. and R. Walkling (1993) The impact of managerial ownership on acquisition attempts and target shareholder wealth, Journal of Financial and Quantitative Analysis, 28, 439-457. Stulz, R. (1988) Managerial control of voting rights: Financing and the market for corporate control, Journal of Financial Economics, 20, 25-54. Stulz, R., R. Walkling, and M. Song (1990) The distribution of target ownership and the division of gains in successful takeovers, Journal of Finance, 45, 817-33. Sundqvist, S. I., (1985-1993) Owners and Power in Sweden’s Listed Companies, Dagens Nyheter, Stockholm. Sundin, A., and S. I. Sundqvist (1994-2002) Owners and Power in Sweden’s Listed Companies, Dagens Nyheter, Stockholm.

31
Taylor, S. and G. Whittred (1998) Security design and the allocation of voting rights: Evidence from the Australian IPO market, Journal of Corporate Finance, 4, 107-131 Walkling, R. (1985) Predicting tender offer success: A logistic anlysis, Journal of Financial and Quantitative Analysis, 20, 461-478 Zingales, L. (1994) The value of voting rights: A study of the Milan Stock Exchange experience, Review of Financial Studies, 7, 125-148. Zingales, L. (1995) Insider ownership and the decision to go public, Review of Economic Studies, 62, 425-448.
32
Table 1: Frequency of successful non-partial takeovers among large Swedish non-financial firms listed on the Stockholm Stock Exchange 1985-2005
In this table, we provide statistics on the number of sample firms and the frequency of successful non-partial takeovers among Swedish non-financial firms listed on the Stockholm Stock Exchange 1985-2005. The sample consists of 208 firms and 2158 firm years. 87 firms were subject to successful non-partial tender offers.
Year 1. Number of
sample firms
2. Percentage of market cap.
3. Number of non-
partial takeovers of sample firms
4. Percentage of sample firms being taken over
1985 80 60.3 0 0.0 1986 89 70.7 3 3.4 1987 90 66.9 6 6.7 1988 86 60.1 2 2.3 1989 93 73.1 4 4.3 1990 93 70.1 3 3.2 1991 90 71.2 0 0.0 1992 91 72.8 2 2.2 1993 94 78.4 2 2.1 1994 110 81.1 0 0.0 1995 118 78.3 6 5.0 1996 132 81.2 3 2.3 1997 143 75.6 2 1.4 1998 142 70.5 13 9.1 1999 130 53.0 9 6.9 2000 120 70.5 8 6.7 2001 104 49.1 3 2.9 2002 100 50.5 9 9.0 2003 90 49.3 3 3.3 2004 87 49.6 2 2.3 2005 76 51.2 7 9.2
33
Table 2: Descriptive statistics, large Swedish non-financial firms 1985-2005 In this table, we provide summary statistics for the 208 firms and 2158 firm years in our sample. The sample is split by whether or not the firm was subject to a successful non-partial tender offer during 1985 to 2005. The firm is classified as a takeover target in all years (N=759) prior to the successful non-partial takeover. Anti-takeover is equal to one if the firm has an anti-takeover device, and zero otherwise. Dual Class Shares is equal to one if the firm has issued shares with differential voting rights, and zero otherwise. Outside Block is equal to one if the second largest shareholder holds at least 10 percent of the voting rights, and zero otherwise. Equity is defined as the controlling shareholder’s (largest voteholder) fraction of cash flow rights in the firm. Votes is defined as the controlling shareholder’s fraction of voting rights in the firm. Market value of equity (MVE) is reported in million SEK. Leverage is equal to the value of long-term debt divided by the book value of total assets. Tobin’s q is defined as the sum of market value of equity and book value of debt divided by the book value of total assets. Median difference tested by means of Wilcoxon-Ranksum test. *** Significant at the 1% level; ** significant at the 5% level; * significant at the 10% level. Panel A: Binary variables Total Sample,
N=2158 Non takeover target,
N=1399 Takeover targets,
N=759 Difference
Proportion Proportion Proportion Proportion test Dual Class Shares
0.766 0.792 0.719 3.808***
Anti-takeover 0.155 0.136 0.076 4.131*** Outside Block 0.417 0.402 0.444 -1.870* Panel B: Continuous variables Total Sample,
N=2158 Non takeover target,
N=1399 Takeover targets,
N=759 Difference
Mean Median Mean Median Mean Median t-test Ranksum test
Equity 0.312 0.280 0.301 0.270 0.333 0.300 -3.752*** -4.130*** Votes 0.471 0.464 0.477 0.500 0.460 0.410 1.644 1.989** Votes-Equity1 0.159 0.150 0.176 0.180 0.127 0.100 7.659*** 7.328*** MVE1 11932 1432 12521 1710 8747 1378 0.127 0.252 Leverage 0.237 0.213 0.240 0.213 0.233 0.215 0.869 -0.090 Tobin’s q1 1.473 1.123 1.462 1.109 1.493 1.141 -1.856* -2.390** 1 Mean difference tested on the natural logarithm of these variables.
34
Table 3: Estimates of the takeover premium In this table, we present the stock market returns around the announcement of the 87 non-partial takeovers. In panel A, abnormal returns are reported from 10 days before to 10 days after the first news about the tender offer. Abnormal returns are estimated as market adjusted and market-model adjusted, respectively. In panel B, cumulative abnormal returns are reported for various intervals. The announcement dates are collected from the Affärsdata database and Thomson One Banker. Stock prices are collected from Datastream. If the target firm has two classes of shares listed (23 observations), the returns and abnormal returns are estimated on a value weighted portfolio. The Affärsvärldens Generalindex (AFGX) is used to estimate the returns on the market. The significance of the market-adjusted returns are tested by means of t-test. The significance of the market-model adjusted returns is tested by means of z-values (MacKinlay, 1997). *** Significant at the 1% level; ** significant at the 5% level; * significant at the 10% level. Panel A: Abnormal returns around the announcement of a tender offer Market-adjusted return Market-model adjusted return -10 -0.0008 -0.0005 -9 0.0081*** 0.0078*** -8 0.0037 0.0041 -7 -0.0016 0.0001 -6 -0.0006 -0.0003 -5 0.0058** 0.0060** -4 0.0053** 0.0051** -3 0.0054* 0.0057** -2 0.0069** 0.0077*** -1 0.0119*** 0.0105*** 0 0.1760*** 0.1765*** +1 0.0148** 0.0150*** +2 0.0011 0.0006 +3 0.0035 0.0024 +4 -0.0016 -0.0017 +5 -0.0029 -0.0013 +6 0.0012 0.0006 +7 0.0000 -0.0014 +8 -0.0026 -0.0023 +9 0.0018 0.0027 +10 0.0005 0.0011 Panel B: Cumulative abnormal returns around the announcement of a tender offer Market-adjusted
cumulative return Market-model adjusted
cumulative return -10 to +10 0.2359*** 0.2385*** -10 to +1 0.2349*** 0.2378*** -5 to +5 0.2261*** 0.2265*** -5 to +1 0.2260*** 0.2265*** -1 to +1 0.2027*** 0.2020***
35
Table 4: Estimated regression models with Votes-Equity as independent variable.
In this table, we provide results from estimated OLS regressions and Heckman selection models. The Heckman models are estimated with Maximum Likelihood. The sample contains 208 Swedish listed firms and 2158 firm years from 1985 to 2005. 87 firms were subject to a successful non-partial tender offer. The takeover premium is estimated as the cumulative market-model adjusted return from day -10 to +1. Coefficients are reported with hereroscedasticity-robust t- and z-statistics, respectively, in parentheses. Equity is defined as the controlling shareholder’s (largest voteholder) fraction of cash flow rights in the firm. Votes is defined as the controlling shareholder’s fraction of voting rights in the firm. MVE is defined as the market value of equity in million SEK. Leverage is equal to the value of long-term debt divided by the book value of total assets. Tobin’s q is defined as the sum of market value of equity and book value of debt divided by the book value of total assets. Outside Block is equal to one if the second largest shareholder holds at least 10 percent of the voting rights, and zero otherwise. ldur is the natural logarithm of the number of years the firm has been included in the dataset before the specific firm-year observation. *** Significant at the 1% level; ** significant at the 5% level; * significant at the 10% level. Premium estimated as cumulative market-model adjusted return, day -10 to +1. Heckman Selection OLS on premium Selection Premium Equity -0.0578
(-0.69) 0.4537 (1.67)*
0.0214 (0.20)
Votes–Equity 0.2247 (2.11)**
-1.0599 (-2.44)**
-0.0163 (-0.12)
Ln(Firm Size) -0.0214 (-2.35)**
0.0115 (0.46)
-0.0186 (-1.77)*
Ln(Tobin’s q) 0.0092 (0.26)
-0.1527 (-1.73)*
-0.0171 (-0.49)
Outside Block 0.0050 (0.15)
0.1930 (1.84)*
0.0487 (1.27)
Leverage -0.6738 (-2.57)**
Ldur 0.2195 (2.54)**
Industry Dummies Yes p-value LR test of indep. eqns 0.0346
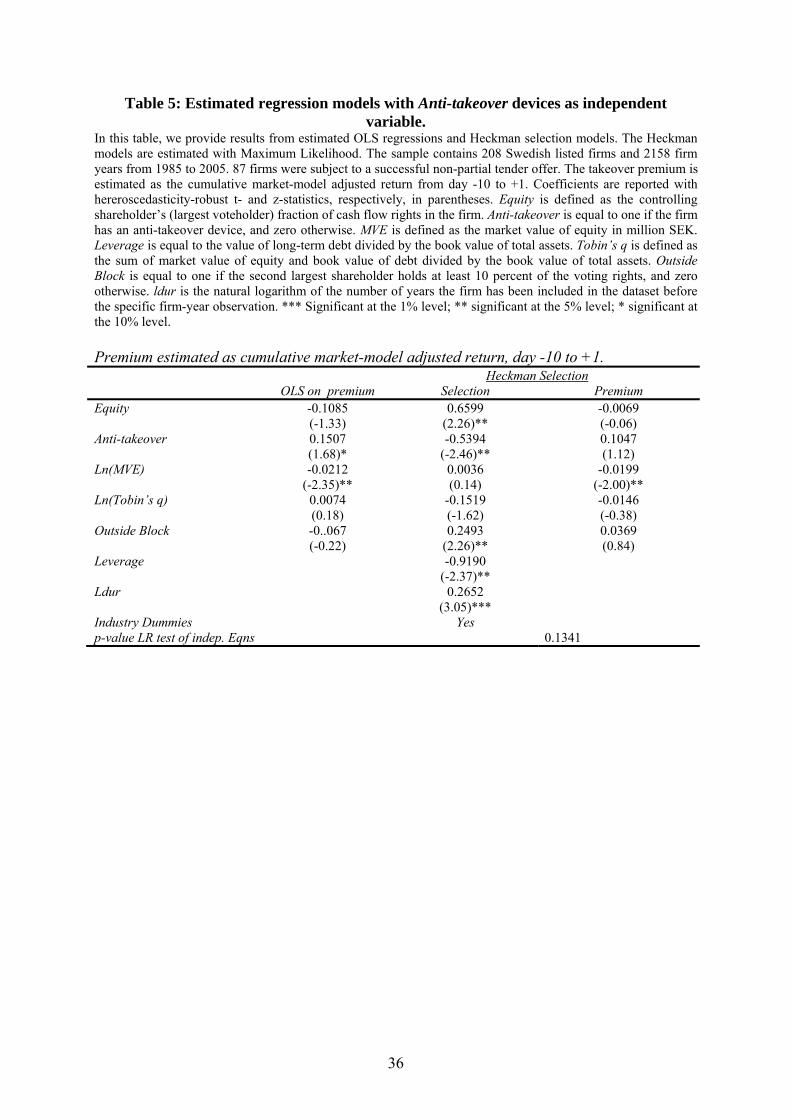
36
Table 5: Estimated regression models with Anti-takeover devices as independent variable.
In this table, we provide results from estimated OLS regressions and Heckman selection models. The Heckman models are estimated with Maximum Likelihood. The sample contains 208 Swedish listed firms and 2158 firm years from 1985 to 2005. 87 firms were subject to a successful non-partial tender offer. The takeover premium is estimated as the cumulative market-model adjusted return from day -10 to +1. Coefficients are reported with hereroscedasticity-robust t- and z-statistics, respectively, in parentheses. Equity is defined as the controlling shareholder’s (largest voteholder) fraction of cash flow rights in the firm. Anti-takeover is equal to one if the firm has an anti-takeover device, and zero otherwise. MVE is defined as the market value of equity in million SEK. Leverage is equal to the value of long-term debt divided by the book value of total assets. Tobin’s q is defined as the sum of market value of equity and book value of debt divided by the book value of total assets. Outside Block is equal to one if the second largest shareholder holds at least 10 percent of the voting rights, and zero otherwise. ldur is the natural logarithm of the number of years the firm has been included in the dataset before the specific firm-year observation. *** Significant at the 1% level; ** significant at the 5% level; * significant at the 10% level. Premium estimated as cumulative market-model adjusted return, day -10 to +1. Heckman Selection OLS on premium Selection Premium Equity -0.1085
(-1.33) 0.6599
(2.26)** -0.0069 (-0.06)
Anti-takeover 0.1507 (1.68)*
-0.5394 (-2.46)**
0.1047 (1.12)
Ln(MVE) -0.0212 (-2.35)**
0.0036 (0.14)
-0.0199 (-2.00)**
Ln(Tobin’s q) 0.0074 (0.18)
-0.1519 (-1.62)
-0.0146 (-0.38)
Outside Block -0..067 (-0.22)
0.2493 (2.26)**
0.0369 (0.84)
Leverage -0.9190 (-2.37)**
Ldur 0.2652 (3.05)***
Industry Dummies Yes p-value LR test of indep. Eqns 0.1341
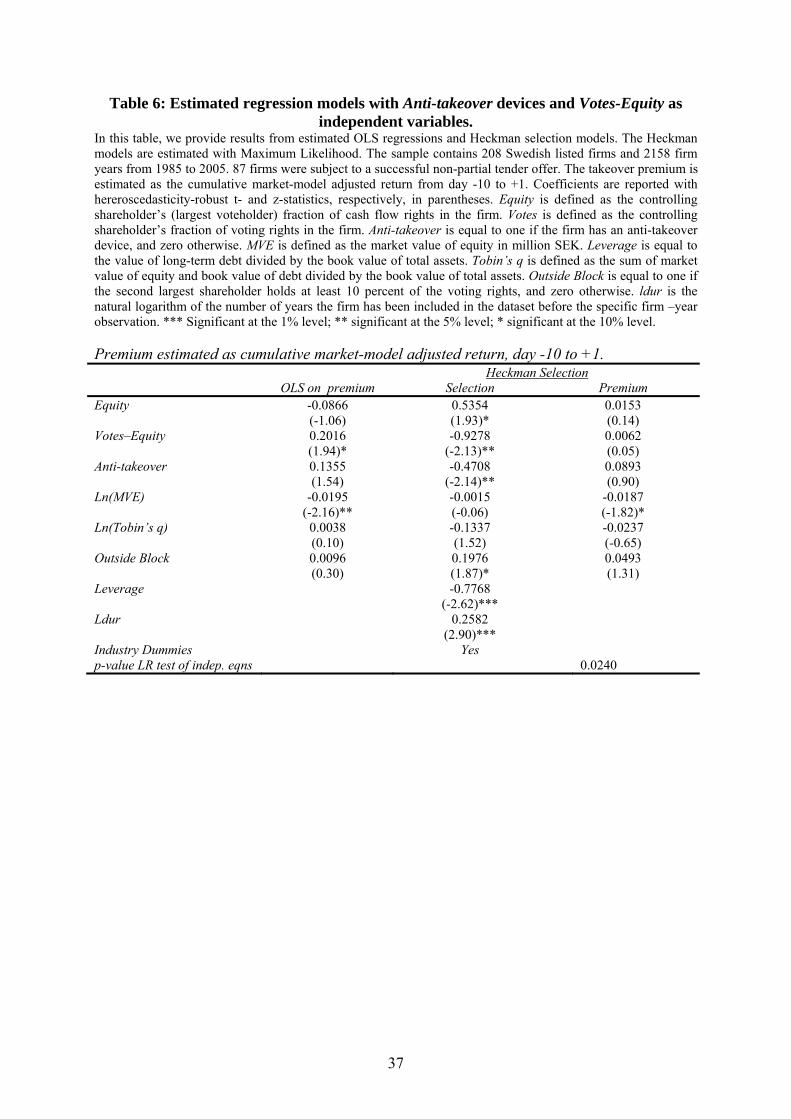
37
Table 6: Estimated regression models with Anti-takeover devices and Votes-Equity as independent variables.
In this table, we provide results from estimated OLS regressions and Heckman selection models. The Heckman models are estimated with Maximum Likelihood. The sample contains 208 Swedish listed firms and 2158 firm years from 1985 to 2005. 87 firms were subject to a successful non-partial tender offer. The takeover premium is estimated as the cumulative market-model adjusted return from day -10 to +1. Coefficients are reported with hereroscedasticity-robust t- and z-statistics, respectively, in parentheses. Equity is defined as the controlling shareholder’s (largest voteholder) fraction of cash flow rights in the firm. Votes is defined as the controlling shareholder’s fraction of voting rights in the firm. Anti-takeover is equal to one if the firm has an anti-takeover device, and zero otherwise. MVE is defined as the market value of equity in million SEK. Leverage is equal to the value of long-term debt divided by the book value of total assets. Tobin’s q is defined as the sum of market value of equity and book value of debt divided by the book value of total assets. Outside Block is equal to one if the second largest shareholder holds at least 10 percent of the voting rights, and zero otherwise. ldur is the natural logarithm of the number of years the firm has been included in the dataset before the specific firm –year observation. *** Significant at the 1% level; ** significant at the 5% level; * significant at the 10% level. Premium estimated as cumulative market-model adjusted return, day -10 to +1. Heckman Selection OLS on premium Selection Premium Equity -0.0866
(-1.06) 0.5354 (1.93)*
0.0153 (0.14)
Votes–Equity 0.2016 (1.94)*
-0.9278 (-2.13)**
0.0062 (0.05)
Anti-takeover 0.1355 (1.54)
-0.4708 (-2.14)**
0.0893 (0.90)
Ln(MVE) -0.0195 (-2.16)**
-0.0015 (-0.06)
-0.0187 (-1.82)*
Ln(Tobin’s q) 0.0038 (0.10)
-0.1337 (1.52)
-0.0237 (-0.65)
Outside Block 0.0096 (0.30)
0.1976 (1.87)*
0.0493 (1.31)
Leverage -0.7768 (-2.62)***
Ldur 0.2582 (2.90)***
Industry Dummies Yes p-value LR test of indep. eqns 0.0240
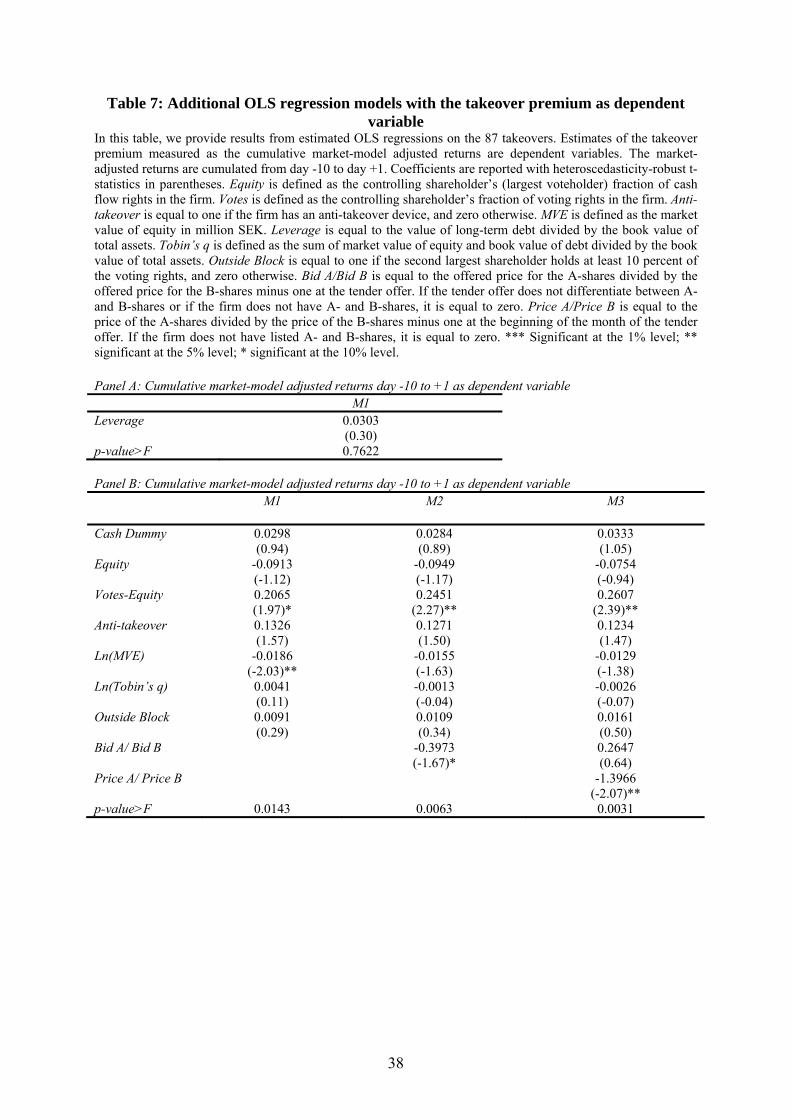
38
Table 7: Additional OLS regression models with the takeover premium as dependent variable
In this table, we provide results from estimated OLS regressions on the 87 takeovers. Estimates of the takeover premium measured as the cumulative market-model adjusted returns are dependent variables. The market-adjusted returns are cumulated from day -10 to day +1. Coefficients are reported with heteroscedasticity-robust t-statistics in parentheses. Equity is defined as the controlling shareholder’s (largest voteholder) fraction of cash flow rights in the firm. Votes is defined as the controlling shareholder’s fraction of voting rights in the firm. Anti-takeover is equal to one if the firm has an anti-takeover device, and zero otherwise. MVE is defined as the market value of equity in million SEK. Leverage is equal to the value of long-term debt divided by the book value of total assets. Tobin’s q is defined as the sum of market value of equity and book value of debt divided by the book value of total assets. Outside Block is equal to one if the second largest shareholder holds at least 10 percent of the voting rights, and zero otherwise. Bid A/Bid B is equal to the offered price for the A-shares divided by the offered price for the B-shares minus one at the tender offer. If the tender offer does not differentiate between A- and B-shares or if the firm does not have A- and B-shares, it is equal to zero. Price A/Price B is equal to the price of the A-shares divided by the price of the B-shares minus one at the beginning of the month of the tender offer. If the firm does not have listed A- and B-shares, it is equal to zero. *** Significant at the 1% level; ** significant at the 5% level; * significant at the 10% level. Panel A: Cumulative market-model adjusted returns day -10 to +1 as dependent variable M1 Leverage 0.0303
(0.30) p-value>F 0.7622 Panel B: Cumulative market-model adjusted returns day -10 to +1 as dependent variable M1
M2 M3
Cash Dummy 0.0298 (0.94)
0.0284 (0.89)
0.0333 (1.05)
Equity -0.0913 (-1.12)
-0.0949 (-1.17)
-0.0754 (-0.94)
Votes-Equity 0.2065 (1.97)*
0.2451 (2.27)**
0.2607 (2.39)**
Anti-takeover 0.1326 (1.57)
0.1271 (1.50)
0.1234 (1.47)
Ln(MVE) -0.0186 (-2.03)**
-0.0155 (-1.63)
-0.0129 (-1.38)
Ln(Tobin’s q) 0.0041 (0.11)
-0.0013 (-0.04)
-0.0026 (-0.07)
Outside Block 0.0091 (0.29)
0.0109 (0.34)
0.0161 (0.50)
Bid A/ Bid B -0.3973 (-1.67)*
0.2647 (0.64)
Price A/ Price B -1.3966 (-2.07)**
p-value>F 0.0143 0.0063 0.0031
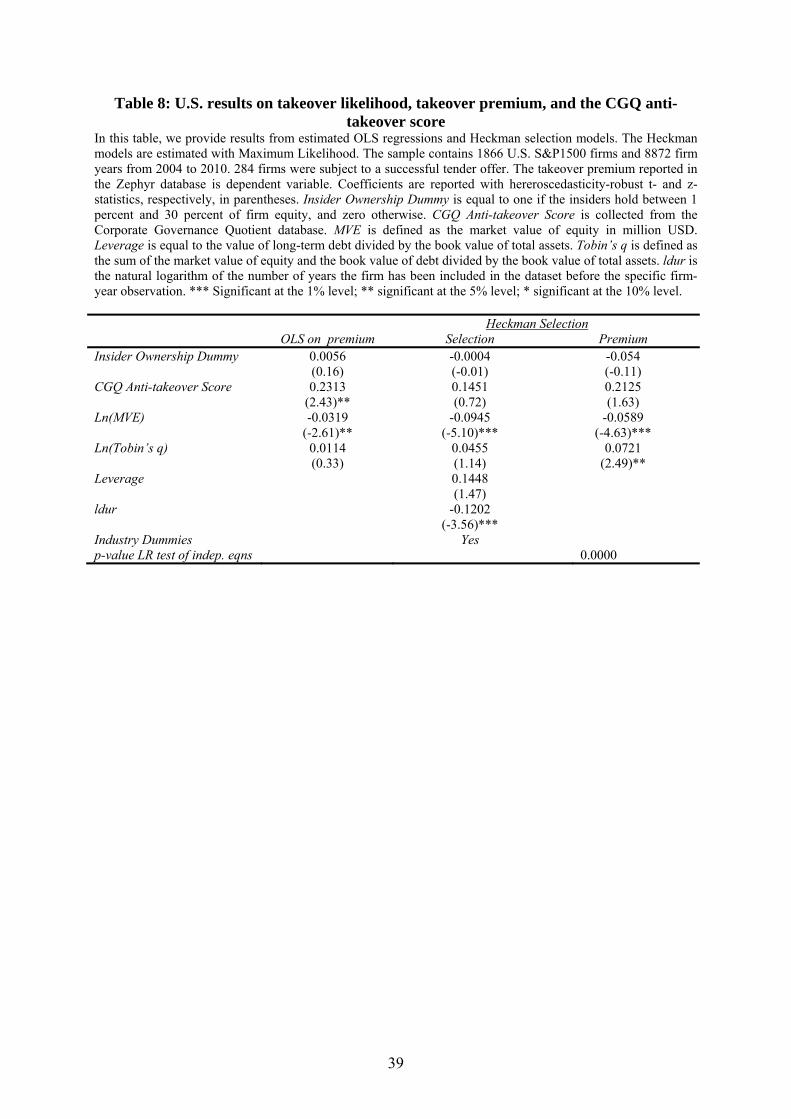
39
Table 8: U.S. results on takeover likelihood, takeover premium, and the CGQ anti-takeover score
In this table, we provide results from estimated OLS regressions and Heckman selection models. The Heckman models are estimated with Maximum Likelihood. The sample contains 1866 U.S. S&P1500 firms and 8872 firm years from 2004 to 2010. 284 firms were subject to a successful tender offer. The takeover premium reported in the Zephyr database is dependent variable. Coefficients are reported with hereroscedasticity-robust t- and z-statistics, respectively, in parentheses. Insider Ownership Dummy is equal to one if the insiders hold between 1 percent and 30 percent of firm equity, and zero otherwise. CGQ Anti-takeover Score is collected from the Corporate Governance Quotient database. MVE is defined as the market value of equity in million USD. Leverage is equal to the value of long-term debt divided by the book value of total assets. Tobin’s q is defined as the sum of the market value of equity and the book value of debt divided by the book value of total assets. ldur is the natural logarithm of the number of years the firm has been included in the dataset before the specific firm-year observation. *** Significant at the 1% level; ** significant at the 5% level; * significant at the 10% level. Heckman Selection OLS on premium Selection Premium Insider Ownership Dummy 0.0056
(0.16) -0.0004 (-0.01)
-0.054 (-0.11)
CGQ Anti-takeover Score 0.2313 (2.43)**
0.1451 (0.72)
0.2125 (1.63)
Ln(MVE) -0.0319 (-2.61)**
-0.0945 (-5.10)***
-0.0589 (-4.63)***
Ln(Tobin’s q) 0.0114 (0.33)
0.0455 (1.14)
0.0721 (2.49)**
Leverage 0.1448 (1.47)
ldur -0.1202 (-3.56)***
Industry Dummies Yes p-value LR test of indep. eqns 0.0000