
Do accounting standards matter to financial analysts? An empirical analysis of the effect of...
30
Do accounting standards matter to financial analysts? An empirical analysis of the effect of cross-listing from different accounting standards regimes on analyst following and forecast error Abed AL-Nasser Abdallah a , Wissam Abdallah b, ⁎ , Ahmad Ismail c a American University of Sharjah, School of Business and Management, United Arab Emirates b Cardiff University, Cardiff Business School, United Kingdom c United Arab Emirates University, United Arab Emirates Received 23 December 2008 Abstract This paper explores whether the effects of cross-listing on analyst following and forecast error differ among firms with different accounting standards. The results reveal a higher increase in the number of analysts for cross-listed firms that follow their home country's GAAP prior to cross-listing and reconcile or switch to IAS/US GAAP or UK GAAP after cross-listing, compared to those that adopt IAS or US GAAP prior to cross-listing. We find that firms that switch to IAS/US GAAP have a higher increase in analyst following after cross-listing compared to firms that reconcile to IAS/US GAAP. In addition, we find a higher increase in analyst following after cross-listing for firms from low-level accounting standards environments compared to firms from high-level accounting standards environments. Our results show evidence of an increase in the magnitude of analysts’ forecast error after cross-listing for firms that follow their home country's GAAP pre-cross-listing but reconcile post-cross-listing to IAS/US GAAP or UK GAAP. On the other hand, we report a decrease in forecast error for firms that switch to IAS/US GAAP. © 2012 University of Illinois. All rights reserved. Keywords: Cross-listing; Information disclosure; Accounting standards; Analyst following; Forecast error JEL classification: G14; G15; G18; G34 ⁎ Corresponding author. E-mail address: [email protected] (W. Abdallah). 0020-7063/$ - see front matter © 2012 University of Illinois. All rights reserved. doi:10.1016/j.intacc.2012.03.002 Available online at www.sciencedirect.com The International Journal of Accounting 47 (2012) 168 – 197
-
Upload
independent -
Category
Documents
-
view
0 -
download
0
Transcript of Do accounting standards matter to financial analysts? An empirical analysis of the effect of...
Available online at www.sciencedirect.com
Do accounting standards matter to financial analysts?An empirical analysis of the effect of cross-listingfrom different accounting standards regimes on
analyst following and forecast error
Abed AL-Nasser Abdallah a, Wissam Abdallah b,⁎, Ahmad Ismail c
a American University of Sharjah, School of Business and Management, United Arab Emiratesb Cardiff University, Cardiff Business School, United Kingdom
c United Arab Emirates University, United Arab Emirates
Received 23 December 2008
The International Journal of Accounting 47 (2012) 168–197
Abstract
This paper explores whether the effects of cross-listing on analyst following and forecast error differamong firms with different accounting standards. The results reveal a higher increase in the number ofanalysts for cross-listed firms that follow their home country's GAAP prior to cross-listing and reconcileor switch to IAS/US GAAP or UK GAAP after cross-listing, compared to those that adopt IAS or USGAAP prior to cross-listing. We find that firms that switch to IAS/US GAAP have a higher increase inanalyst following after cross-listing compared tofirms that reconcile to IAS/USGAAP. In addition, we finda higher increase in analyst following after cross-listing for firms from low-level accounting standardsenvironments compared to firms from high-level accounting standards environments. Our results showevidence of an increase in the magnitude of analysts’ forecast error after cross-listing for firms that followtheir home country's GAAP pre-cross-listing but reconcile post-cross-listing to IAS/US GAAP or UKGAAP. On the other hand, we report a decrease in forecast error for firms that switch to IAS/US GAAP.© 2012 University of Illinois. All rights reserved.
Keywords: Cross-listing; Information disclosure; Accounting standards; Analyst following; Forecast errorJEL classification: G14; G15; G18; G34
⁎ Corresponding author.E-mail address: [email protected] (W. Abdallah).
0020-7063/$ - see front matter © 2012 University of Illinois. All rights reserved.doi:10.1016/j.intacc.2012.03.002
169A.A.L.-N. Abdallah et al. / The International Journal of Accounting 47 (2012) 168–197
1. Introduction
This paper explores whether the effects of cross-listing on analyst following and forecasterror differ among firms with different accounting standards. Financial analysts are an importantsource of information because they gather public and private information and use it to issuebuy/sell recommendations to investors; hence, their role as information providers is seen asan important vehicle for capital market development (Healy & Palepu, 2001). Financial analystscan reduce information asymmetry risk as well as adverse selection costs through their access toprivate information, and incorporate more timely information on share prices as well (Brennan& Subrahmanyam, 1995; Healy & Palepu, 2001). They can also widen the investor base andincrease a firm's visibility by disseminating information about it to a large number of investors.1
All these factors decrease the cost of external financing and encourage investors to trade,consequently improving the efficiency of the capital market and enhancing its development.
Analysts are usually more interested in firms with better information disclosure, as thisreduces the cost of gathering information and enhances analysts’ ability to better predict theearnings of the firm. Therefore, cross-listing on exchanges with stringent disclosure require-ments is expected to increase the number of analysts following the firm and impact analysts’forecast error. Cross-listing on US- and UK-regulated exchanges can be used as a means to im-prove the information environment of firms, as they are required to reconcile their account toUS/UK GAAP or to the International Accounting Standards (IAS).2 When reconciling, firmsneed to adjust their earnings and balance sheet items to reflect any material variation betweentheir home country's GAAP and US/UK GAAP or IAS. However, firms may voluntarilychoose to switch to US/UK GAAP or IAS in order to avoid the cost of dual reporting.
Using analysts’ following and forecast accuracy as proxies for the quality of information en-vironment, Lang, Lins, andMiller (2003) report that cross-listed firms in the United States havegreater analyst coverage and increased forecast accuracy than those that do not cross-list. On theother hand, Leuz (2003a) reports an increase in analyst following for Canadian firms cross-listedin the United States but finds no change in forecast accuracy after cross-listing. However, thesetwo studies do not provide evidence of the relation between analyst following and forecast errorand the change in accounting standards that follows cross-listing. Nevertheless, another strandof literature finds that the quality of accounting standards matters; for instance, reconciliationfrom foreign GAAP (not UK) to US GAAP by firms listing on the US markets (e.g., Barth &Clinch, 1996; Pope & Rees, 1992) or reporting under IAS or US GAAP by foreign firms listingon the London Stock Exchange (LSE) (Ashbaugh & Davis-Friday, 2002), is found to be valuerelevant for investors and produces more transparent financial information.
The main objective of our study is to be the nexus between the aforementioned two streamsof research. In other words, we aim to examine the change in the number of analysts and theirforecast accuracy when firms improve their accounting disclosure; that is, when they switch orreconcile their accounts from pre-cross-listing GAAP to post-cross-listing GAAP.
1 Merton's (1987) and Duarte, Han, Harford, and Young's (2008) return models use the number of analysts as aproxy for the number of informed traders and firms’ information dissemination, respectively.2 IAS are now referred to as International Financial Reporting Standards (IFRS), developed by the International Account-
ing Standard Board (IASB), the successor of the International Accounting Standards Committee, which developed IAS.
170 A.A.L.-N. Abdallah et al. / The International Journal of Accounting 47 (2012) 168–197
On the other hand, firms moving from a low-level to a high-level accounting standards en-vironment are expected to increase their level of information disclosure (Leuz & Verrecchia,2000). Lang et al. (2003) only control for whether the cross-listed firm is from a civil-law orcommon-law country. However, it is yet to be comprehensively examined how the level ofaccounting standards (low versus high) is related to analyst following and forecast error.
Additionally, the issue of the quality of accounting standards is becoming very important inmany countries, especially in light of recent financial catastrophes, starting with the Enron scan-dal (in 2001) and including the global financial crisis and the long-standing competition thatexisted across stock exchanges to attract foreign investments. This all creates an urgent needto enforce more stringent as well as harmonized accounting standards that ensure comparabilityand transparency across countries and firms. In this regard, all European companies have beenrequired to follow IFRS since 2005. In addition, effective since 2007, the US Securities and Ex-change Commission (SEC) permitted all foreign companies using IFRS as issued by Interna-tional Accounting Standards Board (IASB) and seeking listing in the United States to reporttheir financial information to US investors using IFRS without the need to reconcile to USGAAP.3 This creates a huge cost saving for these firms, as they do not have to adopt a dual-reporting strategy, one for the home and another for the USmarket. Despite decades of researchon which accounting standards are better, and the valuation properties of the accounting vari-ables using these standards, it is still an intriguing question how the adoption of qualityGAAPs affects analysts’ coverage of firms, particularly in an international context. This is avery important issue given the role of analysts in the marketability of firms, which is due totheir vital role in the stock market.
In this paper, we contribute to this line of research by examining the relation between ac-counting standards and analysts’ activity around cross-listing and how it differs across firmsthat follow different GAAPs and between firms in countries with low- versus high-level ac-counting standards. We use a sample of 495 firms from 43 countries that have cross-listed inthe US and the UK between 1986 and 2000. Our sample consists of regulated (AMEX,NASDAQ, NYSE, and LSE), and unregulated (OTC and PROTAL) exchanges’ cross-listings.4 We include cross-listed firms on unregulated exchanges as a benchmark for firmsthat cross-list on regulated exchanges, given the difference in reporting requirements andregulations between the two types of exchanges. Firms that cross-list on OTC and PORTALcan report their accounts using their home country GAAPs without reconciling them to USGAAP or IAS.
Our results show that firms that reconciled their home country GAAP to IAS/US GAAP orUK GAAP, and those that switched to IAS/US GAAP during and after cross-listing, experi-enced a increase in the number of analysts compared to firms that already followed IAS/USGAAP before cross-listing. Comparing SWITCHED with other firms in the sample, we reporta greater increase in the number of analysts for the former, for both regulated and unregulated
3 See SEC release 33-8879 Acceptance from foreign private issuers of financial statements prepared in accor-dance with IFRS without reconciliation to US GAAP (http://www.sec.gov/rules/final/2007/33-8879.pdf).4 The OTC (over-the-counter) market is operated by broker–dealers using an inter-dealer quotation system. The
National Quotation Bureau compiles and distributes dealers’ quotes of equities traded in the OTC market, calledthe “Pink Sheet.” PORTAL (Private Offerings, Resales and Trading through Automated Linkages) is NASDAQ'squotation system, a private market that is operated by Qualified Institutional Buyers (QIBs).
171A.A.L.-N. Abdallah et al. / The International Journal of Accounting 47 (2012) 168–197
exchanges, indicating the importance of adopting a quality GAAP over the listing location.Moreover, we find that the increase in analyst following is higher for firms cross-listing fromcountries with low-level accounting standards compared to those with high-level accountingstandards. As for forecast error, our evidence shows that the increase in the magnitude of ana-lysts’ forecast errors is greater for firms that reconciled or switched to IAS/USGAAP comparedto those that already followed IAS/US GAAP before cross-listing.We correlate that with the in-crease in analysts’ dispersion. We find a statistically significant positive relation between ana-lysts’ forecast errors and disagreement among analysts as measured by the dispersion ofearnings forecasts. On the other hand, we find a decrease in the magnitude of forecast errorafter cross-listing for firms that switched to IAS/US GAAP compared to those that reconciledto IAS/US GAAP or UK GAAP.
Our research contributes to the analyst, information disclosure, and cross-listing literatureand has two main implications. First, the paper provides evidence that motivates firms toadopt a quality reporting strategy, such as IFRS, given its positive effects on analysts’ activities.The results reveal that switching to a stricter GAAP is more value relevant than reconciliation.This is consistent with the view of the majority of commenters,5 cited in SEC release number33-8879, who advocate eliminating US GAAP reconciliation and adopting IFRS to improvethe information quality of the cross-listed firms. They consider the reconciliation items to behighly technical and not widely understood. Nevertheless, Brown and Tarca (2008) argue thatsome countries may not adopt IFRS if their national interest is violated. In this context, our re-sults emphasize the importance of consistent interpretation and implementation of IFRS acrosscountries to maintain comparability of financial statements across industries and countries. Alaliand Cao (2010) argue that such comparability is crucial to the goal of improving the quality offinancial reporting globally. Second, the evidence from this study suggests that firms, especiallythose from countries with low-level accounting standards, can use cross-listing as a means ofenhancing their level of information dissemination/visibility through more analyst following.This may increase the liquidity of their shares and reduce the cost of external financing (seeMerton, 1987). Our results are of interest to academics and market regulators as well as existingand potential cross-listed firms.
The rest of the paper proceeds as follows. Section 2 reviews the literature and develops thehypotheses. Section 3 explains the research design. Sections 4 and 5 present the empirical resultsfrom univariate and multivariate analysis, respectively. Section 6 discusses robustness checks,and Section 7 concludes.
2. Literature review and hypotheses development
2.1. Disclosure and reporting requirements of cross-listing in the US and the UK
Foreign listing on the US-regulated exchanges (AMEX, NYSE, and NASDAQ) can be inthe form of ordinary shares, as Canadian firms usually issue, or indirectly throughAmerican De-positary Receipts (ADRs), which represent themajority of US foreign listing. The type of ADRs
5 Including foreign private issuers, accounting firms, legal firms, foreign standards setters, analysts, and interna-tional investors.
172 A.A.L.-N. Abdallah et al. / The International Journal of Accounting 47 (2012) 168–197
that are acceptable to be listed on the US-regulated exchanges are levels 2 and 3, in which theforeign firm is required to register with the SEC using Form F6 and also to reconcile its homefinancial information to US GAAP using Form 20-F (1934 Exchange Act). In addition, asADRs level 3 allows foreign firms to issue capital in the United States, the firmmust completeForm F-1 (offering prospectus for the shares).6 The other types of ADRs are ADR level 1 andRule 144A private offering, which can only be listed and traded on unregulated US ex-changes, such as OTC and PORTAL, respectively. Accordingly, these unregulated ADRs’firms are exempted, under rule 12g3-2(b) of the 1934 Exchange Act, from reporting underUS GAAP—that is, they do not have to fill out Form 20-F, as these firms can report usingtheir home country's GAAPs.
Similarly, foreign firms that list ordinary shares on the LSE, which represent the majority ofUK foreign listings, are required to reconcile their accounts to IAS, US, or UKGAAP (see LSEpublication, 2004).7 ,8 However, as a result of IFRS adoption in Europe, since 2005 foreignfirms listing ordinary shares on the LSE have had to prepare their financial statements in accor-dance with IFRS or its equivalent. Nonetheless, foreign firms listing depositary receipts (DR) inLondon can use their home country's GAAP, but the firm must contact the UK Listing Author-ity (UKLA) to ensure that the proposed standards are satisfactory.
2.2. The relation between a firm's level of disclosure, analyst following, and earningsforecast error
Theoretically, Bhushan (1989) shows that the number of analysts following a firm is deter-mined by the demand and supply of analysts’ services. An increase in information disclosurewill reduce the cost of gathering information, which increases the supply of analysts’ services.On the other hand, an increase in information disclosure may increase or decrease the demandfor analysts’ services, depending on whether analysts are mainly information intermediarieswho gather information from firms and transmit it to investors or whether they are competitorswith firms that provide disclosure directly to investors. If analysts are information providers, anincrease in disclosure will reduce the demand for analysts, as firm-provided disclosure will be asubstitute for their services (Lang & Lundholm, 1996). If analysts function as information inter-mediaries, an increase in disclosure will provide more information to analysts and make theirreports more valuable to investors.
Empirically, Lang and Lundholm (1996), Hope (2003a), Frankel, Kothari, and Weber(2006), and Eng and Teo (2000), among others, find that improving the quality of disclosureby providing more information will increase the number of analysts following a firm. In partic-ular, Hope (2003a) finds a strong and positive relation between footnotes disclosure and analyst
6 Firms that list as ADR level 2 reconcile to US GAAP using item 17 of Form 20-F, whereas those that list asADR level 3, because they issue shares in the United States, must reconcile to US GAAP using item 18 of Form20-F, which requires more financial disclosure compared to level 2. See SEC Release No. 33-8900 [http://www.sec.gov/rules/proposed/2008/33-8900.pdf]. Nonetheless, since 2007 the SEC has adopted an amendment to items17 and 18 of Form 20-F removing the reconciliation requirements to US GAAP for firms using IFRS.7 LSE publication, 2004, titled: “Welcome to London the Heart of Global Finance.”8 It is worth noting that ordinary shares represent 73% of foreign listings, followed by DRs (25%), and then
warrants/fixed interest (2%). This is based on the foreign firms listed on the LSE at the end of 2008.
173A.A.L.-N. Abdallah et al. / The International Journal of Accounting 47 (2012) 168–197
following, while Frankel et al. (2006) report evidence that supports the reliability of using ana-lyst following as a proxy for a firm's information production. Collectively, previous empiricalresearch suggests that analysts follow firms with more informative disclosure; therefore, firmscan attract analysts by increasing their level of disclosure. This supports the argument that ana-lysts function as information intermediaries.
Increasing the level of disclosure is also expected to reduce analysts’ earnings forecast errors.Lang and Lundholm (1996) and Hope (2003b) contend that analysts’ forecast accuracy will in-crease with informative disclosure provided by the firm. Empirically, Gilson, Healy, Noe, andPalepu (2001) attribute the 30% to 50% improvement in analysts’ forecast accuracy to addition-al disclosure, while Acker, Horton, and Tonks (2002) find that the additional information pro-vided by FRS3 reduces analysts’ forecast errors. Other empirical studies also document asignificant and positive relationship between level of disclosure and earnings forecast accuracy(Bhat, Hope, & Kang, 2006; Eng & Teo, 2000; Hope, 2003b; Lang & Lundholm, 1996;Vanstraelen, Zarzeski, & Robb, 2003; Yu, 2010).9
2.3. Home country GAAP versus IAS and US GAAP
Cross-listing on US- and UK-regulated exchanges requires foreign firms to reconcile theirhome country GAAPs to US GAAP (if listed in the United States) or IAS/US GAAP or UKGAAP (if listed in the United Kingdom). Thus, firms following their home country's GAAPprior to cross-listing need to adopt a dual-reporting strategy when listing in the United Statesor the United Kingdom. However, some firms may choose to switch to IAS/US GAAP orUK GAAP to avoid the cost of dual reporting.
Studies that explore reconciliation from foreign GAAP to US GAAP using Form 20-F (e.g.,Amir, Harris, & Venuti, 1993; Barth & Clinch, 1996; Pope & Rees, 1992) find that it is valuerelevant and contains useful information for US investors. Ashbaugh and Davis-Friday (2002)find that foreign firms that list on the LSE and report under IAS or US GAAP produce moretransparent financial information. On the other hand, studies that examine the reconciliationfrom IAS to US GAAP (e.g., Harris, 1995; Harris & Muller, 1999; Street, Nicholas, & Gray,2000) or compare IAS with US GAAP (e.g., Leuz, 2003b) show that both standards are ofsimilar quality. Examining UK foreign listing and the quality of US GAAP, Ashbaugh andOlsson's (2002) results indicate that the valuation properties of accounting variables betweenUK foreign firms reporting under US GAAP and US firms are the same.
Therefore, to the extent that cross-listed firms on US- and UK-regulated exchanges mustcomply with additional disclosure requirements, cross-listing on such exchanges is expectedto increase the number of analysts following the firm. According to Lang et al. (2003), theexpected explicit and implicit (due to pressure from investors and international listing require-ments) increase in the quantity of information reduces the cost of gathering information and,
9 Nonetheless, Lang and Lundholm (1996) argue that more disclosure may lead to more disagreement amonganalysts with respect to the future earnings of firms, particularly if analysts use different forecast models and relymore on private information. Similar interpretation is also reported by Bamber and Cheon (1995). This impliesthat more disagreement among analysts will increase the average forecast error for the firm. However, the empir-ical findings of the above cited studies support the negative relationship between analysts’ forecast errors and thelevel of information disclosure.
174 A.A.L.-N. Abdallah et al. / The International Journal of Accounting 47 (2012) 168–197
hence, attracts more analysts. The authors report a greater number of analysts and an improve-ment in their forecast accuracy subsequent to cross-listing on the US-regulated exchanges,associating this with the improvement in the quality of firms’ information environment. Leuz(2003a), on the other hand, reports similar results with respect to the number of analysts butfinds no change in the analysts’ forecast accuracy.
Based on previous arguments about the relationship between analyst following and informa-tion disclosure, and the importance of IAS/US/UK GAAP, it can be said that the impact ofcross-listing on analyst following will differ based on the improvement in accounting disclosureby cross-listed firms. Firms that follow their home country's GAAP before cross-listing willexperience an increase in the level of information if they reconcile or switch to IAS/USGAAP or UK GAAP after cross-listing. Nevertheless, firms that already follow US GAAP orIAS prior to cross-listing will experience no change in the level of information. Therefore, wedevelop the following hypothesis:
H1. The increase in the number of analysts after the cross-listing year will be greater for firmsthat report under their home country's GAAP prior to cross-listing but reconcile to IAS/USGAAP/UK GAAP or switch to IAS/US GAAP during and after cross-listing compared tofirms that followUSGAAP or IAS prior to cross-listing and continue to do so after cross-listing.
Some firms may choose to switch to IAS/US GAAP or UK GAAP rather than reconciletheir accounts. The former group will provide more information than the latter group.Therefore, we test the following hypothesis:
H2. The increase in the number of analysts after the cross-listing year will be greater for firmsthat switch to US GAAP or IAS during and after cross-listing compared to firms that reconciletheir accounts to IAS/US GAAP or UK GAAP.
On the other hand, with regard to the extent to which cross-listing on US- and UK-regulatedexchanges increases the amount of information by cross-listed firms, we expect a reduction inforecast error after the cross-listing, since analysts would be able to more accurately predict theearnings of these firms. Therefore, following previous literature (Eng & Teo, 2000; Hope,2003a; Lang & Lundholm, 1996) that finds the level of disclosure is positively associatedwith better forecast accuracy, we hypothesize the following:
H3. The decrease in the magnitude of analysts’ forecast errors after the cross-listing year willbe greater for firms that report under their home country's GAAP prior to cross-listing butreconcile to IAS/US GAAP or UK GAAP, or switch to IAS/US GAAP, compared to firms thatfollow US GAAP or IAS prior to cross-listing and continue to do so after cross-listing.
H4. The decrease in the magnitude of analysts’ forecast errors after the cross-listing year will begreater for firms that switch to US GAAP or IAS during and after cross-listing compared to firmsthat reconcile their accounts to IAS/US GAAP or UK GAAP.
2.4. Low-level versus high-level accounting standards environments
Moving from a low-level accounting standards environment to a high-level accounting stan-dards environment will obligate firms to increase their level of information disclosure (Lang et
175A.A.L.-N. Abdallah et al. / The International Journal of Accounting 47 (2012) 168–197
al., 2003; Leuz&Verrecchia, 2000). Leuz andVerrecchia (2000) explore the effect of Form 20-F reconciliation by comparing German firms (from a low-level accounting standards environ-ment) that reconciled to US GAAP to their domestic counterparts that did not. They findthe former group to have a better information environment after cross-listing, as evi-denced by a lower bid-ask spread and a higher share turnover, than firms using Ger-man GAAP.10 Therefore, foreign firms from countries with low-level accountingstandards that cross-list on US/UK-regulated exchanges and commit themselves to in-creasing their level of disclosure will have a greater increase in the number of analystsand greater decrease in the magnitude of analysts’ forecast errors after cross-listingcompared to those from countries with high-level accounting standards. Cross-listedfirms from low-level accounting environment regimes will face more pressure fromUS and UK investors to release more information because of more stringent listingand reporting requirements. These firms will try to show a high level of transparencyin order to win the US/UK listing case and compete internationally, particularly withcross-listed firms from high-level accounting standards environments.
Moreover, the effect of foreign GAAP reconciliation should be greater for cross-listed firmsfrom low-level accounting standards countries than for cross-listed firms from high-levelaccounting standards countries. Hope, Kang, and Zang (2007), examining whether disclosurerequirements for foreign firms affect their listing decision in the United States, argue thatfirms that cross-list in the United States and complete Form 20-F have to disclose sensitivecorporate governance-related information,11 which is usually less frequently disclosed incountries with low-level accounting standards. This is consistent with the public valuebenefits hypothesis discussed in Hope et al. (2007), which suggests that the amount ofdisclosure and the benefits from it are likely to be larger (smaller) for firms from low-(high-) disclosure regimes.
Therefore, we develop the following hypotheses:
H5. The increase in the number of analysts after the cross-listing year will be greaterfor firms from low-level accounting standards countries that have cross-listed on US-and UK-regulated exchanges compared to cross-listed firms from high-level account-ing standards countries.
H6. The decrease in the magnitude of analysts’ forecast errors after the cross-listingyear will be greater for firms from low-level accounting standards countries comparedto cross-listed firms from high-level accounting standards countries.
10 Leuz and Verrecchia's (2000) study examines the effect of Form 20-F reconciliation for German firms and didnot address the issue of reconciliation of firms from low-level accounting standards countries versus high-levelaccounting standards countries.11 Such sensitive governance information could include aggregate remuneration, related party transactions, stockoption-related information, and the names of shareholders with more than 5% of shares with voting rights. Yu(2010) and Bhat et al. (2006) find that governance disclosure is positively related to number of analysts and fore-cast accuracy.
176 A.A.L.-N. Abdallah et al. / The International Journal of Accounting 47 (2012) 168–197
3. Methodology and sample description
3.1. Methodology, variables, and data sources
We conduct univariate and multivariate analyses. In the univariate analysis, we group thesample firms based on the GAAP followed by the firms. We compare the number of analystsand analysts’ forecast errors before cross-listing to their levels after cross-listing. In themultivariate analysis, we first replicate the analysis of Lang et al. (2003) and Leuz (2003a)using Eq. (1) below, to show the effects of cross-listing per se on analyst following andforecast error. Then we focus our analysis on the change in our information variables (AFand FE) by estimating (Eq. 2) to test H1 and H2, whereas we use (Eq. 3) to test H3 and H5,and (Eq. 4) to test H5 and H6.12 We estimate the following regression models:
INFORMATION VARIABLESit ¼ α0 þ β1PCLit þ β2RETURNit þ β3SIZEit þ β4RETSTDitþβ5INDAFit=FEit
ð1Þ%CHANGEININFORMATION VARIABLESi ¼ α0 þ β1GAAPi þ β2SIZEi þ β3RETSTDi þ β4AFi
þβ5INDAFi=FEi þ β6DISPi
ð2Þ%CHANGEININFORMATION VARIABLESi ¼ α0 þ β1SWITCHi þ β2SIZEi þ β3RETSTDi
þβ4AFi þ β5INDAFi=FEi þ β6DISPið3Þ
%CHANGEININFORMATION VARIABLESi ¼ α0 þ β1LOWi þ β2SIZEi þ β3RETSTDi þ β4AFiþβ5INDAFi=FEi þ β6DISPi
ð4Þwhere:
INFORMATION VARIABLES number of analysts (AF), and analysts’ forecast error (FE) forthe year before (PRE) and after cross-listing (POST). AF is the number of I/B/E/Sanalysts, and FE is the average forecast error for all analysts following a firm. FEis calculated as the absolute value of the difference between the forecasted earningsper share and actual earnings per share, scaled by current price, which is defined asshare price at the date of the forecast.13
%CHANGE IN INFORMATION VARIABLES the difference between AF (FE) pre-cross-listing and AF (FE) post-cross-listing divided by AF (FE) in the year before thecross-listing year (i.e., (AFt+1−AFt−1) /AFt−1; (FEt+1−FEt−1) /FEt−1).
12 In Eqs. (2), (3), and (4), we use the percentage change rather than the change in order to benchmark it with thepre–cross-listing observations, since the percentage change is more representative of the increase/decrease in eachdependent variable across firms; for instance, consider two companies A and B having 5 and 10 analysts beforecross-listing but 7 and 12 analysts after cross-listing, respectively. Although the increase in the number of analysts,which is two analysts, is the same for A and B, the percentage effect on each is not the same. The percentage in-crease in the number of analysts for firm A is 40% (2/5), which is double the 20% percentage increase for B.13 Different from Lang et al. (2003a) and Leuz (2003a), we use the last forecast instead of month 11 because thelast forecast contains the most up-to-date information, since analysts always revise expectations when new infor-mation regarding the firm of interest is received.
177A.A.L.-N. Abdallah et al. / The International Journal of Accounting 47 (2012) 168–197
PCL a dummy variable that takes the value of 1 in the post-cross-listing year, and0 otherwise.
GAAP a dummy variable that takes the value of 1 if the firm follows home country GAAPprior to cross-listing and reconciles or switches to IAS/US/UK GAAP during andafter cross-listing, and 0 otherwise.
SWITCH a dummy variable that takes the value of 1 if the firm switches to USGAAP or IASduring and after cross-listing, and 0 if the firm reconciles its accounts to IAS/USGAAP or UK GAAP.14
LOW a dummy variable that takes the value of 1 if the firm is from a low-level accountingstandards country, and 0 otherwise.
SIZE the natural logarithm of the market value of the firm's equity in millions of US dollars.RETSTD the standard deviation of monthly returns over the fiscal year to control for the firm's
risk.RETURN the annual compounded stock return.AF the number of analysts following the firm to be included in the FE regressions only.IND AF/FE the average number of analysts (AF) and the average analysts’ forecast errors
(FE) in the firm's industry.DISP the standard deviation, or dispersion, of analysts’ earnings forecasts—to be included
in the forecast error regressions only.
We estimate our equations using the sample firms that cross-list on regulated exchanges. Wealso estimate the above equations for firms that cross-list on OTC and PORTAL when we ex-amine the effect of GAAP followed on AF/FE across exchanges. Our variables of interest areGAAP, SWITCH, and LOW.We control for firm size, since previous studies document a pos-itive (negative) relation between number of analysts (forecast error) and firm size (Bricker,Grant, Fogarty, & Previts, 1999; Hope, 2003a; Lang & Lundholm, 1996; Lang et al., 2003;Leuz, 2003a). We use the market value of equity as a proxy for firm size, instead of total assets,because the use of total assets reported under different GAAPs may introduce bias into theregression.15 In addition, we control for a firm's risk, as Lang et al. (2003) find it to be negative-ly (positively) related to the number of analysts (forecast error). Moreover, we include the pre-vious year's stock return (one year before cross-listing), as Lang et al. (2003) report a negativerelation between analyst following and previous year return and argue that analysts might bedrawn to the previous year's stock return. We include the number of analysts following thefirm (AF) in the FE regressions, since prior research (Capstaff, Paudyal, & Rees, 1999;Sinha, Brown, & Das, 1997) documents that forecast errors are smaller for firms that are fol-lowed by more analysts. We control for disagreements among analysts (DISP), followingBeckers, Steliaros, and Thomson (2004), who find that analyst forecast error increases withan increase in earnings’ forecast dispersion across analysts. Finally, Hope (2003a) argues that
14 It is worth noting that by tracking the accounting standards followed by firms that have switched, we find thatfirms that have cross-listed on the US-regulated markets switched to US GAAP and those that have cross-listed onthe LSE switched to IAS. We do separate analysis for each group later in the paper, where we explore the stockexchange effects.15 In similar regressions, Lang and Lundholm (1996), Bricker et al. (1999), and Frankel et al. (2006) use the mar-ket value of the firm instead of total assets as a control for size. However, Lang et al. (2003) report that using totalassets or market value provides similar results.
178 A.A.L.-N. Abdallah et al. / The International Journal of Accounting 47 (2012) 168–197
some industries may have greater growth than others and thus attract more analysts. Further-more, analysts are specialized by industry, and some are associated with a higher level of infor-mation than others, due to segment disclosure. Gilson et al. (2001) find that industry-specializedanalysts provide more accurate forecasts than non-specialized analysts. We use the industry'saverage number of analysts (INDAF, in the AF regressions) and the industry's average forecasterrors (IND FE, in the FE regressions) to account for the variation in the number of analysts andforecast errors across industries. All independent variables are measured in the year beforecross-listing.
The number of analysts, forecasted earnings per share, actual earnings per share, dispersionof earnings forecast, stock price, and the number of shares outstanding are from I/B/E/Sinternational and US summary files.16 Stock returns are collected from DataStream. We usethe accounting standards index as reported in La Porta, Lopez-de-Silanes, Shleifer, and Vishny(1998). The index measures the quality of accounting in each country, which is obtained byrating the 1990 companies’ annual reports on their omission or inclusion of 90 items.17
3.2. Sample and data description
The initial sample includes 2,406 foreign firms from 49 countries, which have cross-listed onthe AMEX, NASDAQ, NYSE, LSE, OTC, and PORTAL between 1976 and 2000. The finalsample consists of 495 firms from 43 countries, which cross-listed in the United States andthe United Kingdom between 1986 and 2000. The large decrease in the sample size is due tothe following refinement criteria: first, the I/B/E/S coverage for some firms and their countryof origin starts after the date of cross-listing18; second, we require firms to have AF and FE vari-ables in the year before the cross-listing (PRE) and the year after the cross-listing (POST); third,we eliminate 1% of the top and bottom data of the forecast error variable in order to reduce theeffect of outliers. Our refinement procedure significantly decreases the sample size, but ensureshigh-quality data.
Table 1 shows the distribution of the final sample across countries. A country is consid-ered a high-level (low-level) accounting standards country if its accounting standards indexis above (below) an average of 62.56 for all countries included in the sample.19 Table 1shows that 341 (or 69%) of the 495 cross-listed firms are from countries with high account-ing standards, which suggests that firms from these countries are more inclined to cross-list
16 I/B/E/S adjusts actual earnings to be comparable with the definition of earnings used by analysts when makingearnings forecasts. The definition of earnings is “earnings after discontinued operations, extra-ordinary charges,and other non-operating items.”17 These items cover seven categories: general information, income statements, balance sheets, funds flow state-ment, accounting policies, share data, and special items.18 For example, I/B/E/S coverage for the United Kingdom starts from 01/87, which forces us to lose 21 firms.The same can be said about other countries. In addition, analysts do not cover the same set of firms every year;they may add new firms while dropping others.19 The classification of China, the Czech Republic, Hungary, Poland, and Russia is based on the Kurtzman et al.(2004) Opacity Index, which refers to five risk factors that affect country growth and foreign direct investment,including: business and government corruption, an ineffective legal system, deleterious economic policy, inade-quate accounting and governance policy, and detrimental regulatory structures. According to the Opacity Index,these countries have high levels of corruption and inadequate accounting and governance policies compared toother countries such as the United States, the United Kingdom, and other European countries.
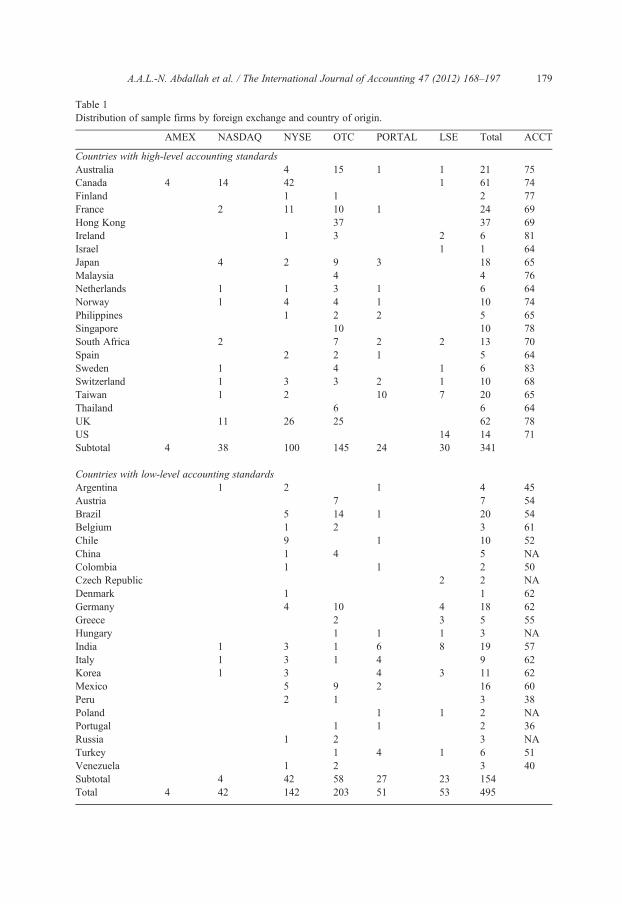
Table 1Distribution of sample firms by foreign exchange and country of origin.
AMEX NASDAQ NYSE OTC PORTAL LSE Total ACCT
Countries with high-level accounting standardsAustralia 4 15 1 1 21 75Canada 4 14 42 1 61 74Finland 1 1 2 77France 2 11 10 1 24 69Hong Kong 37 37 69Ireland 1 3 2 6 81Israel 1 1 64Japan 4 2 9 3 18 65Malaysia 4 4 76Netherlands 1 1 3 1 6 64Norway 1 4 4 1 10 74Philippines 1 2 2 5 65Singapore 10 10 78South Africa 2 7 2 2 13 70Spain 2 2 1 5 64Sweden 1 4 1 6 83Switzerland 1 3 3 2 1 10 68Taiwan 1 2 10 7 20 65Thailand 6 6 64UK 11 26 25 62 78US 14 14 71Subtotal 4 38 100 145 24 30 341
Countries with low-level accounting standardsArgentina 1 2 1 4 45Austria 7 7 54Brazil 5 14 1 20 54Belgium 1 2 3 61Chile 9 1 10 52China 1 4 5 NAColombia 1 1 2 50Czech Republic 2 2 NADenmark 1 1 62Germany 4 10 4 18 62Greece 2 3 5 55Hungary 1 1 1 3 NAIndia 1 3 1 6 8 19 57Italy 1 3 1 4 9 62Korea 1 3 4 3 11 62Mexico 5 9 2 16 60Peru 2 1 3 38Poland 1 1 2 NAPortugal 1 1 2 36Russia 1 2 3 NATurkey 1 4 1 6 51Venezuela 1 2 3 40Subtotal 4 42 58 27 23 154Total 4 42 142 203 51 53 495
179A.A.L.-N. Abdallah et al. / The International Journal of Accounting 47 (2012) 168–197
180 A.A.L.-N. Abdallah et al. / The International Journal of Accounting 47 (2012) 168–197
in a country with a similar level of accounting standards. Also, Table 1 reveals that OTCattracts more foreign listings (203 firms) compared to regulated exchanges, such asNYSE (142 firms), LSE (53 firms), NASDAQ (42 firms), and AMEX (4 firms).
Panel A of Table 2 displays the mean values of each variable included in this studyby country of origin. Similar to Lang et al. (2003) and Hope (2003a, 2003b), there is a widevariation in the number of analysts and analysts’ forecast errors across cross-listed firms fromdifferent countries. Firms from Germany and the Netherlands have the highest number of an-alysts (27 analysts), whereas firms from Colombia have the lowest number (3 analysts).As for analysts’ forecast errors, firms from Spain have the lowest forecast error (0.027),whereas those from Russia have the highest forecast error (0.4285). Russian firms, however,are the most risky firms in the sample (0.3944), whereas Danish firms are the least risky(0.0459). Turkish firms have the highest stock return (2.446) compared to the lowest(0.0294) for Japanese firms. The UK firms, on average, are the largest firms in the sample($420.46 million), while Hungarian firms are the smallest ($0.117654 million).
Based on the country characteristics, Panel A of Table 2 reveals that firms from countrieswith high-level accounting standards have, on average, more analyst following (14.76), alower forecast error (0.0302) and stock return (0.3958), are less risky (0.1167), much larger($27.53 million), and have less earnings forecast dispersion (0.8244) compared to firmsfrom countries with low-level accounting standards, which have 12.36 analysts, a forecasterror of 0.0357, a stock return of 0.4515, a risk of 0.1456, a firm size of $24.27 million, anda much larger earnings forecast dispersion of 44.6861.
Panel B provides summary statistics for all variables used in themultivariate analysis, basedon two years of data (pre- and post-cross-listing). Firms from countries with high-level ac-counting standards are much larger and have more analysts, lower forecast error, less return,less earnings forecast dispersion among analysts, and are less risky than firms from countrieswith low-level accounting standards.
4. Results of the univariate analysis
4.1. Home country versus US GAAP and IAS
Table 3 presents the results of the univariate analysis for analyst following (AF) and forecasterror (FE). Panel A of Table 3 displays the results based on the GAAP followed by the firm, andshows the results for firms cross-listed on regulated and unregulated exchanges.
4.1.1. Firms cross-listed on regulated exchangesFor firms that cross-listed on regulated exchanges, we divide our sample firms into
three groups. Firms that reconciled to IAS/US GAAP/UK GAAP (i.e., RECONCILEDfirms) are those that followed their home country's GAAP before cross-listing and
Notes to Table 1The final sample consists of 495 firms that have cross-listed between 1986 and 2000 for which there are observationsfor the three years around cross-listing (−1, 0, +1). Low-level and high-level accounting standards countries are thosethat are below or above the average accounting standards index (62.56) of all countries included in the sample, respec-tively. However, when a country classification is missing, the Kurtzman, Yago, and Phumiwasana's (2004) OpacityIndex is used as a proxy for the high/low-level classification.
181A.A.L.-N. Abdallah et al. / The International Journal of Accounting 47 (2012) 168–197
reconciled their accounts to IAS/US GAAP or UK GAAP during and after cross-listing.IAS/US GAAP firms are firms that followed IAS/US GAAP before cross-listing andcontinued to do so during and after cross-listing.20 SWITCHED firms are those that fol-lowed their home country's GAAP before cross-listing and switched to IAS/US GAAPduring and after cross-listing. Panel A shows that IAS/US GAAP firms were followedby more analysts prior to and after cross-listing, and thus enjoyed greater benefits of in-formation dissemination and visibility compared to other groups of firms. All firms expe-rienced an increase in the number of analysts after cross-listing, which is similar to research byLang et al. (2003) and Leuz (2003a). The percentage change in AF is higher forRECONCILED firms (27%) compared to SWITCHED firms (20%) and IAS/US GAAP firms(14%). This is consistent with H1. However, by comparing firms that reconciled to IAS/USGAAP/UKGAAPwith those that switched to IAS/USGAAP, Table 3 shows that the percentageincrease in the number of analysts is higher for the former (27%). A possible explanation for thehigher percentage increase in analysts for RECONCILED firms is that the increase could be driv-en by firms that raise capital during the cross-listing period, which attracts more analysts com-pared to their pre-cross-listing period (Rajan & Servaes, 1997). Panel A shows thatRECONCILED firms issuing ADR level 3 experienced an increase of 37% in their analyst fol-lowing after the cross-listing, which is highest across all groups. On the other hand, thepercentage increase in the number of analysts for firms that reconciled to IAS/US/UK GAAP,excluding ADR level 3 firms, is 24%, whereas there is a 20% increase in analyst following forfirms that switched to IAS/US GAAP. Nevertheless, we find that SWITCHED firms on regulat-ed and unregulated exchanges experienced a 25%21 increase in their analyst following post-cross-listing, which is higher than for reconciled firms without ADR 3. This indicates the impor-tance of switching to a quality GAAP, irrespective of the listing location. The differences acrossall groups are significant according to Kruskal–Wallis (KW–x2) statistics.
Although IAS/US GAAP firms and SWITCHED firms experienced a percentage increase intheir analyst following, the univariate analysis reveals that the quality of their analysts’ earningsforecasts does not seem to have changed following cross-listing, as the percentage change in theforecast error is not statistically significant. On the other hand, the forecast error significantly in-creases by 89% for RECONCILED firms; this is consistent with the literature discussed above,which suggests that pre-disclosure (private) information increases the number of analysts andtheir level of disagreement regarding the future earnings of firms they follow. Given its impor-tance, it is possible that cross-listing provides managers with an incentive to voluntarily discloseprivate information in response to their commitment to increase the level of disclosure aftercross-listing. Appendix 1 shows that the dispersion (disagreement) of analysts’ earnings fore-casts for RECONCILED firms increases from 16 before cross-listing to 36 after cross-listing,an increase of 121%. This is the highest, compared to 9% for IAS/US GAAP firms, and−79% for SWITCHED firms. The lower dispersion of IAS/US firms indicates that earningsof these cross-listed firms that followed IAS/US GAAP were much less volatile due to theirhigh level of disclosure before cross-listing, which did not change after cross-listing. On the
20 It should be noted that the IAS/US GAAP firms group is different from the GAAP variable used in Eq. (2)since the former refers only to firms that use US GAAP before, during, and after cross-listing.21 The figure is not reported in tabular form.
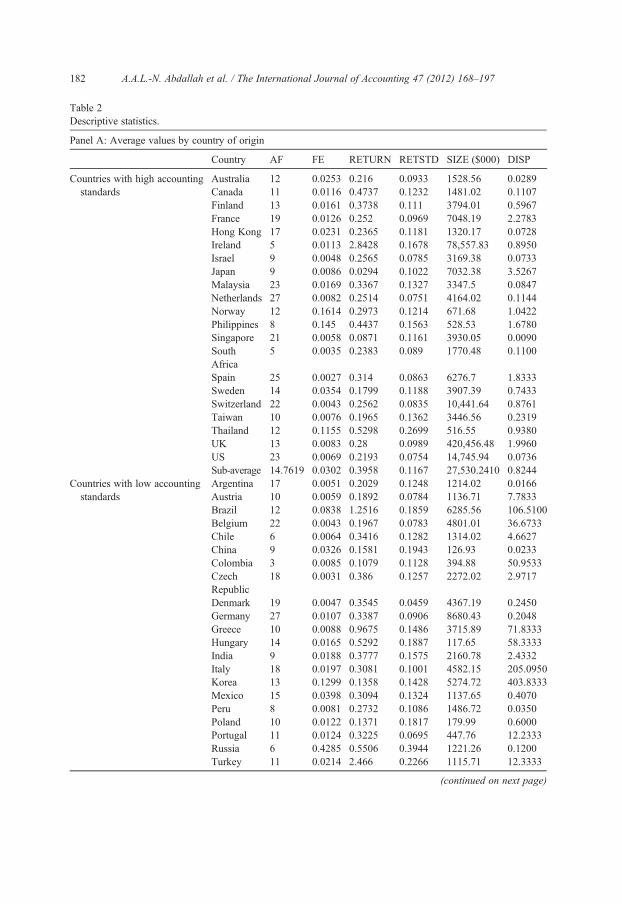
Table 2Descriptive statistics.
Panel A: Average values by country of origin
Country AF FE RETURN RETSTD SIZE ($000) DISP
Countries with high accountingstandards
Australia 12 0.0253 0.216 0.0933 1528.56 0.0289Canada 11 0.0116 0.4737 0.1232 1481.02 0.1107Finland 13 0.0161 0.3738 0.111 3794.01 0.5967France 19 0.0126 0.252 0.0969 7048.19 2.2783Hong Kong 17 0.0231 0.2365 0.1181 1320.17 0.0728Ireland 5 0.0113 2.8428 0.1678 78,557.83 0.8950Israel 9 0.0048 0.2565 0.0785 3169.38 0.0733Japan 9 0.0086 0.0294 0.1022 7032.38 3.5267Malaysia 23 0.0169 0.3367 0.1327 3347.5 0.0847Netherlands 27 0.0082 0.2514 0.0751 4164.02 0.1144Norway 12 0.1614 0.2973 0.1214 671.68 1.0422Philippines 8 0.145 0.4437 0.1563 528.53 1.6780Singapore 21 0.0058 0.0871 0.1161 3930.05 0.0090SouthAfrica
5 0.0035 0.2383 0.089 1770.48 0.1100
Spain 25 0.0027 0.314 0.0863 6276.7 1.8333Sweden 14 0.0354 0.1799 0.1188 3907.39 0.7433Switzerland 22 0.0043 0.2562 0.0835 10,441.64 0.8761Taiwan 10 0.0076 0.1965 0.1362 3446.56 0.2319Thailand 12 0.1155 0.5298 0.2699 516.55 0.9380UK 13 0.0083 0.28 0.0989 420,456.48 1.9960US 23 0.0069 0.2193 0.0754 14,745.94 0.0736Sub-average 14.7619 0.0302 0.3958 0.1167 27,530.2410 0.8244
Countries with low accountingstandards
Argentina 17 0.0051 0.2029 0.1248 1214.02 0.0166Austria 10 0.0059 0.1892 0.0784 1136.71 7.7833Brazil 12 0.0838 1.2516 0.1859 6285.56 106.5100Belgium 22 0.0043 0.1967 0.0783 4801.01 36.6733Chile 6 0.0064 0.3416 0.1282 1314.02 4.6627China 9 0.0326 0.1581 0.1943 126.93 0.0233Colombia 3 0.0085 0.1079 0.1128 394.88 50.9533CzechRepublic
18 0.0031 0.386 0.1257 2272.02 2.9717
Denmark 19 0.0047 0.3545 0.0459 4367.19 0.2450Germany 27 0.0107 0.3387 0.0906 8680.43 0.2048Greece 10 0.0088 0.9675 0.1486 3715.89 71.8333Hungary 14 0.0165 0.5292 0.1887 117.65 58.3333India 9 0.0188 0.3777 0.1575 2160.78 2.4332Italy 18 0.0197 0.3081 0.1001 4582.15 205.0950Korea 13 0.1299 0.1358 0.1428 5274.72 403.8333Mexico 15 0.0398 0.3094 0.1324 1137.65 0.4070Peru 8 0.0081 0.2732 0.1086 1486.72 0.0350Poland 10 0.0122 0.1371 0.1817 179.99 0.6000Portugal 11 0.0124 0.3225 0.0695 447.76 12.2333Russia 6 0.4285 0.5506 0.3944 1221.26 0.1200Turkey 11 0.0214 2.466 0.2266 1115.71 12.3333
(continued on next page)
182 A.A.L.-N. Abdallah et al. / The International Journal of Accounting 47 (2012) 168–197
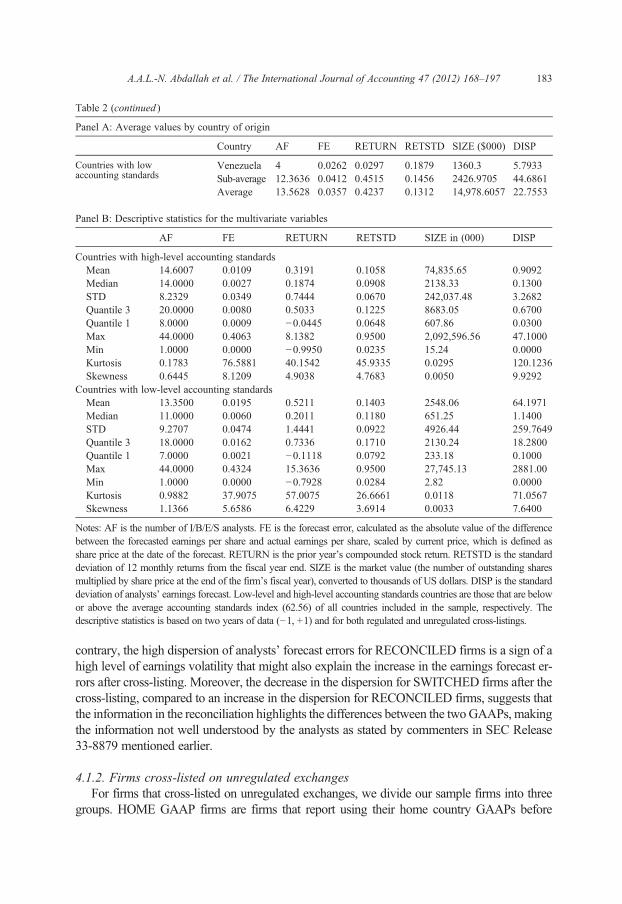
Table 2 (continued )
Panel A: Average values by country of origin
Country AF FE RETURN RETSTD SIZE ($000) DISP
Venezuela 4 0.0262 0.0297 0.1879 1360.3 5.7933Sub-average 12.3636 0.0412 0.4515 0.1456 2426.9705 44.6861Average 13.5628 0.0357 0.4237 0.1312 14,978.6057 22.7553
Panel B: Descriptive statistics for the multivariate variables
AF FE RETURN RETSTD SIZE in (000) DISP
Countries with high-level accounting standardsMean 14.6007 0.0109 0.3191 0.1058 74,835.65 0.9092Median 14.0000 0.0027 0.1874 0.0908 2138.33 0.1300STD 8.2329 0.0349 0.7444 0.0670 242,037.48 3.2682Quantile 3 20.0000 0.0080 0.5033 0.1225 8683.05 0.6700Quantile 1 8.0000 0.0009 −0.0445 0.0648 607.86 0.0300Max 44.0000 0.4063 8.1382 0.9500 2,092,596.56 47.1000Min 1.0000 0.0000 −0.9950 0.0235 15.24 0.0000Kurtosis 0.1783 76.5881 40.1542 45.9335 0.0295 120.1236Skewness 0.6445 8.1209 4.9038 4.7683 0.0050 9.9292
Countries with low-level accounting standardsMean 13.3500 0.0195 0.5211 0.1403 2548.06 64.1971Median 11.0000 0.0060 0.2011 0.1180 651.25 1.1400STD 9.2707 0.0474 1.4441 0.0922 4926.44 259.7649Quantile 3 18.0000 0.0162 0.7336 0.1710 2130.24 18.2800Quantile 1 7.0000 0.0021 −0.1118 0.0792 233.18 0.1000Max 44.0000 0.4324 15.3636 0.9500 27,745.13 2881.00Min 1.0000 0.0000 −0.7928 0.0284 2.82 0.0000Kurtosis 0.9882 37.9075 57.0075 26.6661 0.0118 71.0567Skewness 1.1366 5.6586 6.4229 3.6914 0.0033 7.6400
Notes: AF is the number of I/B/E/S analysts. FE is the forecast error, calculated as the absolute value of the differencebetween the forecasted earnings per share and actual earnings per share, scaled by current price, which is defined ashare price at the date of the forecast. RETURN is the prior year's compounded stock return. RETSTD is the standarddeviation of 12 monthly returns from the fiscal year end. SIZE is the market value (the number of outstanding sharemultiplied by share price at the end of the firm's fiscal year), converted to thousands of US dollars. DISP is the standarddeviation of analysts’ earnings forecast. Low-level and high-level accounting standards countries are those that are belowor above the average accounting standards index (62.56) of all countries included in the sample, respectively. Thedescriptive statistics is based on two years of data (−1, +1) and for both regulated and unregulated cross-listings.
Countries with lowaccounting standards
183A.A.L.-N. Abdallah et al. / The International Journal of Accounting 47 (2012) 168–197
s
s
contrary, the high dispersion of analysts’ forecast errors for RECONCILED firms is a sign of ahigh level of earnings volatility that might also explain the increase in the earnings forecast er-rors after cross-listing. Moreover, the decrease in the dispersion for SWITCHED firms after thecross-listing, compared to an increase in the dispersion for RECONCILED firms, suggests thatthe information in the reconciliation highlights the differences between the twoGAAPs, makingthe information not well understood by the analysts as stated by commenters in SEC Release33-8879 mentioned earlier.
4.1.2. Firms cross-listed on unregulated exchangesFor firms that cross-listed on unregulated exchanges, we divide our sample firms into three
groups. HOME GAAP firms are firms that report using their home country GAAPs before
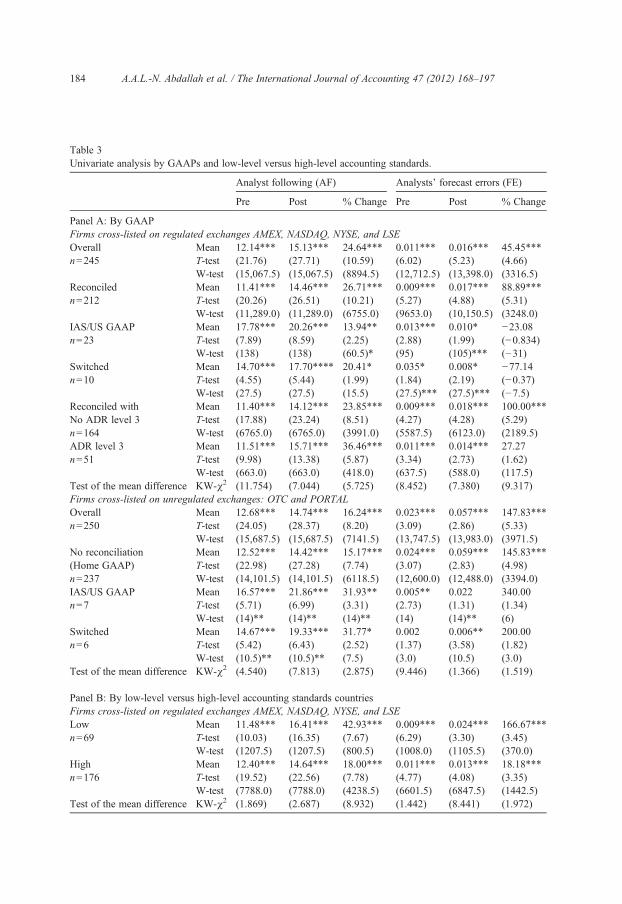
Table 3Univariate analysis by GAAPs and low-level versus high-level accounting standards.
Analyst following (AF) Analysts' forecast errors (FE)
Pre Post % Change Pre Post % Change
Panel A: By GAAPFirms cross-listed on regulated exchanges AMEX, NASDAQ, NYSE, and LSEOverall Mean 12.14*** 15.13*** 24.64*** 0.011*** 0.016*** 45.45***n=245 T-test (21.76) (27.71) (10.59) (6.02) (5.23) (4.66)
W-test (15,067.5) (15,067.5) (8894.5) (12,712.5) (13,398.0) (3316.5)Reconciled Mean 11.41*** 14.46*** 26.71*** 0.009*** 0.017*** 88.89***n=212 T-test (20.26) (26.51) (10.21) (5.27) (4.88) (5.31)
W-test (11,289.0) (11,289.0) (6755.0) (9653.0) (10,150.5) (3248.0)IAS/US GAAP Mean 17.78*** 20.26*** 13.94** 0.013*** 0.010* −23.08n=23 T-test (7.89) (8.59) (2.25) (2.88) (1.99) (−0.834)
W-test (138) (138) (60.5)* (95) (105)*** (−31)Switched Mean 14.70*** 17.70**** 20.41* 0.035* 0.008* −77.14n=10 T-test (4.55) (5.44) (1.99) (1.84) (2.19) (−0.37)
W-test (27.5) (27.5) (15.5) (27.5)*** (27.5)*** (−7.5)Reconciled with Mean 11.40*** 14.12*** 23.85*** 0.009*** 0.018*** 100.00***No ADR level 3 T-test (17.88) (23.24) (8.51) (4.27) (4.28) (5.29)n=164 W-test (6765.0) (6765.0) (3991.0) (5587.5) (6123.0) (2189.5)ADR level 3 Mean 11.51*** 15.71*** 36.46*** 0.011*** 0.014*** 27.27n=51 T-test (9.98) (13.38) (5.87) (3.34) (2.73) (1.62)
W-test (663.0) (663.0) (418.0) (637.5) (588.0) (117.5)Test of the mean difference KW-χ2 (11.754) (7.044) (5.725) (8.452) (7.380) (9.317)Firms cross-listed on unregulated exchanges: OTC and PORTALOverall Mean 12.68*** 14.74*** 16.24*** 0.023*** 0.057*** 147.83***n=250 T-test (24.05) (28.37) (8.20) (3.09) (2.86) (5.33)
W-test (15,687.5) (15,687.5) (7141.5) (13,747.5) (13,983.0) (3971.5)No reconciliation Mean 12.52*** 14.42*** 15.17*** 0.024*** 0.059*** 145.83***(Home GAAP) T-test (22.98) (27.28) (7.74) (3.07) (2.83) (4.98)n=237 W-test (14,101.5) (14,101.5) (6118.5) (12,600.0) (12,488.0) (3394.0)IAS/US GAAP Mean 16.57*** 21.86*** 31.93** 0.005** 0.022 340.00n=7 T-test (5.71) (6.99) (3.31) (2.73) (1.31) (1.34)
W-test (14)** (14)** (14)** (14) (14)** (6)Switched Mean 14.67*** 19.33*** 31.77* 0.002 0.006** 200.00n=6 T-test (5.42) (6.43) (2.52) (1.37) (3.58) (1.82)
W-test (10.5)** (10.5)** (7.5) (3.0) (10.5) (3.0)Test of the mean difference KW-χ2 (4.540) (7.813) (2.875) (9.446) (1.366) (1.519)
Panel B: By low-level versus high-level accounting standards countriesFirms cross-listed on regulated exchanges AMEX, NASDAQ, NYSE, and LSELow Mean 11.48*** 16.41*** 42.93*** 0.009*** 0.024*** 166.67***n=69 T-test (10.03) (16.35) (7.67) (6.29) (3.30) (3.45)
W-test (1207.5) (1207.5) (800.5) (1008.0) (1105.5) (370.0)High Mean 12.40*** 14.64*** 18.00*** 0.011*** 0.013*** 18.18***n=176 T-test (19.52) (22.56) (7.78) (4.77) (4.08) (3.35)
W-test (7788.0) (7788.0) (4238.5) (6601.5) (6847.5) (1442.5)Test of the mean difference KW-χ2 (1.869) (2.687) (8.932) (1.442) (8.441) (1.972)
184 A.A.L.-N. Abdallah et al. / The International Journal of Accounting 47 (2012) 168–197
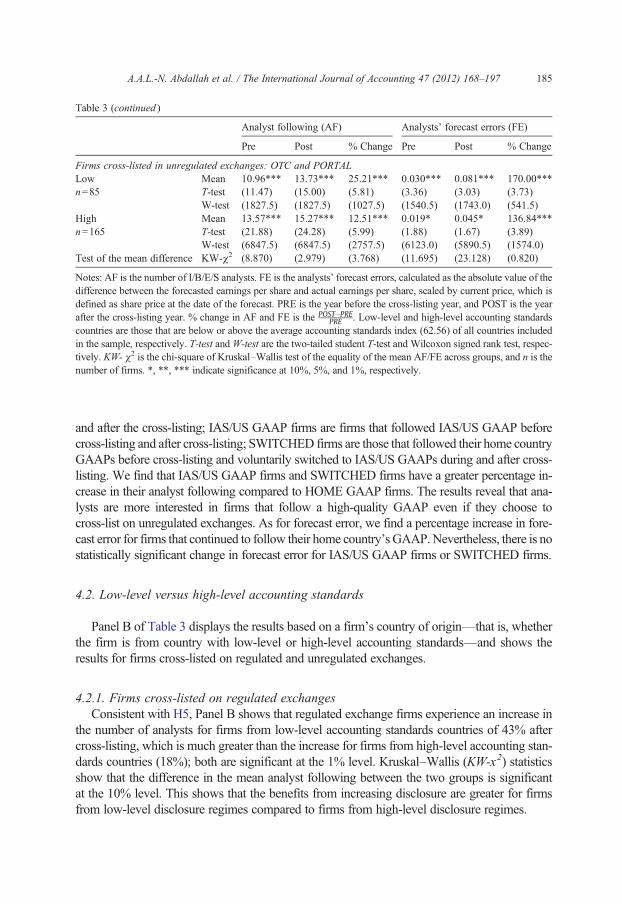
Table 3 (continued )
Analyst following (AF) Analysts' forecast errors (FE)
Pre Post % Change Pre Post % Change
Firms cross-listed in unregulated exchanges: OTC and PORTALLow Mean 10.96*** 13.73*** 25.21*** 0.030*** 0.081*** 170.00***n=85 T-test (11.47) (15.00) (5.81) (3.36) (3.03) (3.73)
W-test (1827.5) (1827.5) (1027.5) (1540.5) (1743.0) (541.5)High Mean 13.57*** 15.27*** 12.51*** 0.019* 0.045* 136.84***n=165 T-test (21.88) (24.28) (5.99) (1.88) (1.67) (3.89)
W-test (6847.5) (6847.5) (2757.5) (6123.0) (5890.5) (1574.0)Test of the mean difference KW-χ2 (8.870) (2.979) (3.768) (11.695) (23.128) (0.820)
Notes: AF is the number of I/B/E/S analysts. FE is the analysts’ forecast errors, calculated as the absolute value of thedifference between the forecasted earnings per share and actual earnings per share, scaled by current price, which idefined as share price at the date of the forecast. PRE is the year before the cross-listing year, and POST is the yeaafter the cross-listing year. % change in AF and FE is the POST−PRE
PRE . Low-level and high-level accounting standardcountries are those that are below or above the average accounting standards index (62.56) of all countries includedin the sample, respectively. T-test and W-test are the two-tailed student T-test and Wilcoxon signed rank test, respectively. KW- χ2 is the chi-square of Kruskal–Wallis test of the equality of the mean AF/FE across groups, and n is thenumber of firms. *, **, *** indicate significance at 10%, 5%, and 1%, respectively.
185A.A.L.-N. Abdallah et al. / The International Journal of Accounting 47 (2012) 168–197
srs
-
and after the cross-listing; IAS/US GAAP firms are firms that followed IAS/US GAAP beforecross-listing and after cross-listing; SWITCHED firms are those that followed their home countryGAAPs before cross-listing and voluntarily switched to IAS/US GAAPs during and after cross-listing. We find that IAS/US GAAP firms and SWITCHED firms have a greater percentage in-crease in their analyst following compared to HOME GAAP firms. The results reveal that ana-lysts are more interested in firms that follow a high-quality GAAP even if they choose tocross-list on unregulated exchanges. As for forecast error, we find a percentage increase in fore-cast error for firms that continued to follow their home country's GAAP.Nevertheless, there is nostatistically significant change in forecast error for IAS/US GAAP firms or SWITCHED firms.
4.2. Low-level versus high-level accounting standards
Panel B of Table 3 displays the results based on a firm's country of origin—that is, whetherthe firm is from country with low-level or high-level accounting standards—and shows theresults for firms cross-listed on regulated and unregulated exchanges.
4.2.1. Firms cross-listed on regulated exchangesConsistent with H5, Panel B shows that regulated exchange firms experience an increase in
the number of analysts for firms from low-level accounting standards countries of 43% aftercross-listing, which is much greater than the increase for firms from high-level accounting stan-dards countries (18%); both are significant at the 1% level. Kruskal–Wallis (KW-x2) statisticsshow that the difference in the mean analyst following between the two groups is significantat the 10% level. This shows that the benefits from increasing disclosure are greater for firmsfrom low-level disclosure regimes compared to firms from high-level disclosure regimes.

Table 4Multivariate analysis for analyst following (AF) and forecast error (FE) of cross-listed firms on the US- andUK-regulated exchanges.
Dependent ANN ANN+LSE ANN+LSE
AF FE AF FE AF FE FE
Model 1 Model 2 Model 3 Model 4 Model 5 Model 6 Model 7
Intercept 10.129*** 0.0136 9.974*** 0.0134 −8.542 0.2893*** 0.2943***(3.55) (0.54) (3.72) (0.48) (−1.05) (3.61) (3.11)
PCL 2.019*** 0.0019 2.292*** 0.0046 2.216*** 0.0114** 0.0094*(4.09) (0.44) (3.96) (1.08) (3.48) (2.42) (1.96)
RETURN −0.469 0.0026 −0.407 −0.0061*(−0.28) (0.87) (−1.42) (−1.92)
SIZE 1.124** −0.0205*** −0.0186***(2.52) (−3.38) (−4.16)
RETSTD −3.491 0.0734 0.0659(−0.73) (1.43) (1.27)
INDAF 0.406(0.56)
INDFE 0.2945** 0.3292**(2.13) (2.38)
AF −0.0004 −0.0003(−0.54) (−0.48)
DISP 0.00006***(3.11)
Adj.R2 0.9027 0.5204 0.9208 0.5185 0.9224 0.5786 0.5834NOBS 292 292 388 388 388 388 380
Notes: The table presents regressions for analyst following and forecast error for cross-listed firms on regulated exchangesthat follow home country's GAAP and reconcile or switch to IAS/ US GAAP/ UK GAAP during and after the cross-listing. The dependent variables are AF and FE. AF is the number of I/B/E/S analysts. FE is the forecast error, calculatedas the absolute value of the difference between the forecasted earnings per share and actual earnings per share, scaled bycurrent price, defined as share price at the date of the forecast. The independent variables are as follows: PCL is a dummyvariable that takes the value of 1 in the year after the cross-listing, and 0 otherwise; RETURN is the previous year totalreturn; RETSTD is the standard deviation of monthly returns over the fiscal year; SIZE is the natural logarithm of the mar-ket value in millions of US dollars; INDAF (INDFE) is the average number of analysts (forecast errors of all analysts) inthe firm's industry; DISP is the standard deviation of analysts’ earnings forecast; ANN stands for AMEX, NASDAQ, andNYSE; the p-value of the two-tailed t-test is reported in parentheses. *, **, *** indicate significance at 10%, 5%, and 1%,respectively. NOBS is the number of firm-year observations. All regressions were estimated with firms’ fixed effects,which allows the intercept to vary across firms and years.
186 A.A.L.-N. Abdallah et al. / The International Journal of Accounting 47 (2012) 168–197
In addition, we find that the magnitude of analysts’ forecast errors for firms from countrieswith low-level accounting standards increases from 0.009 before to 0.024 after cross-listing,which is an increase of 0.015 (or 167%). This is much larger than the 18% for firms from coun-tries with high-level accounting standards. In line with the previous discussion and as reportedin Appendix 1, the dispersion of analysts’ earnings forecasts for firms from countries with low-level accounting standards increases by about 122%, from 49.04 before to 108.87 followingcross-listing, compared to a decrease of 8.16% for firms from countries with high-level account-ing standards. This means that the earnings of the former are highly volatile, which provides
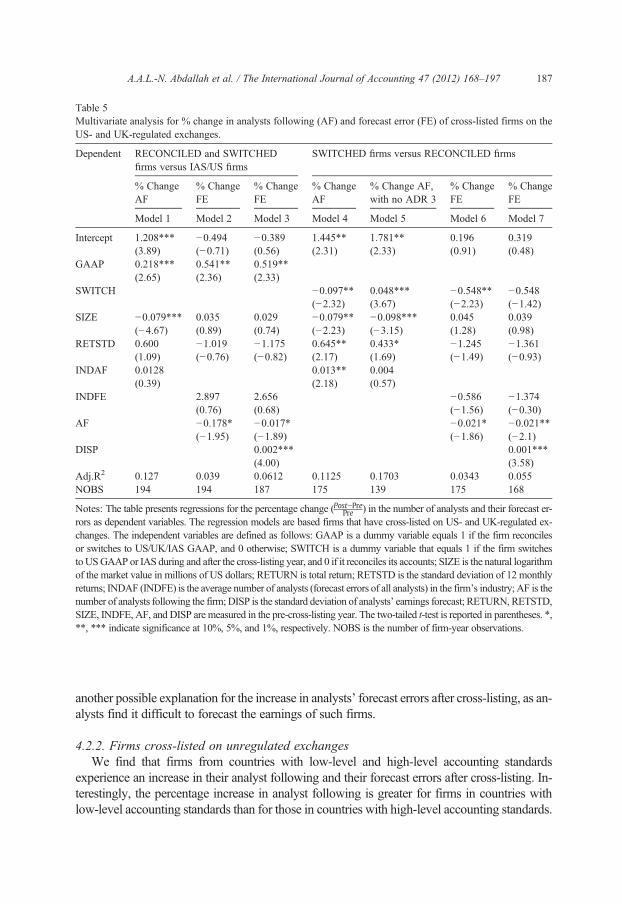
Table 5Multivariate analysis for % change in analysts following (AF) and forecast error (FE) of cross-listed firms on theUS- and UK-regulated exchanges.
Dependent RECONCILED and SWITCHEDfirms versus IAS/US firms
SWITCHED firms versus RECONCILED firms
% ChangeAF
% ChangeFE
% ChangeFE
% ChangeAF
% Change AF,with no ADR 3
% ChangeFE
% ChangeFE
Model 1 Model 2 Model 3 Model 4 Model 5 Model 6 Model 7
Intercept 1.208*** −0.494 −0.389 1.445** 1.781** 0.196 0.319(3.89) (−0.71) (0.56) (2.31) (2.33) (0.91) (0.48)
GAAP 0.218*** 0.541** 0.519**(2.65) (2.36) (2.33)
SWITCH −0.097** 0.048*** −0.548** −0.548(−2.32) (3.67) (−2.23) (−1.42)
SIZE −0.079*** 0.035 0.029 −0.079** −0.098*** 0.045 0.039(−4.67) (0.89) (0.74) (−2.23) (−3.15) (1.28) (0.98)
RETSTD 0.600 −1.019 −1.175 0.645** 0.433* −1.245 −1.361(1.09) (−0.76) (−0.82) (2.17) (1.69) (−1.49) (−0.93)
INDAF 0.0128 0.013** 0.004(0.39) (2.18) (0.57)
INDFE 2.897 2.656 −0.586 −1.374(0.76) (0.68) (−1.56) (−0.30)
AF −0.178* −0.017* −0.021* −0.021**(−1.95) (−1.89) (−1.86) (−2.1)
DISP 0.002*** 0.001***(4.00) (3.58)
Adj.R2 0.127 0.039 0.0612 0.1125 0.1703 0.0343 0.055NOBS 194 194 187 175 139 175 168
Notes: The table presents regressions for the percentage change (Post−PrePre ) in the number of analysts and their forecast errors as dependent variables. The regression models are based firms that have cross-listed on US- and UK-regulated exchanges. The independent variables are defined as follows: GAAP is a dummy variable equals 1 if the firm reconcileor switches to US/UK/IAS GAAP, and 0 otherwise; SWITCH is a dummy variable that equals 1 if the firm switchetoUSGAAP or IAS during and after the cross-listing year, and 0 if it reconciles its accounts; SIZE is the natural logarithmof the market value in millions of US dollars; RETURN is total return; RETSTD is the standard deviation of 12 monthlyreturns; INDAF (INDFE) is the average number of analysts (forecast errors of all analysts) in the firm's industry; AF is thenumber of analysts following the firm; DISP is the standard deviation of analysts’ earnings forecast; RETURN, RETSTDSIZE, INDFE, AF, and DISP are measured in the pre-cross-listing year. The two-tailed t-test is reported in parentheses. ***, *** indicate significance at 10%, 5%, and 1%, respectively. NOBS is the number of firm-year observations.
187A.A.L.-N. Abdallah et al. / The International Journal of Accounting 47 (2012) 168–197
--ss
,,
another possible explanation for the increase in analysts’ forecast errors after cross-listing, as an-alysts find it difficult to forecast the earnings of such firms.
4.2.2. Firms cross-listed on unregulated exchangesWe find that firms from countries with low-level and high-level accounting standards
experience an increase in their analyst following and their forecast errors after cross-listing. In-terestingly, the percentage increase in analyst following is greater for firms in countries withlow-level accounting standards than for those in countries with high-level accounting standards.
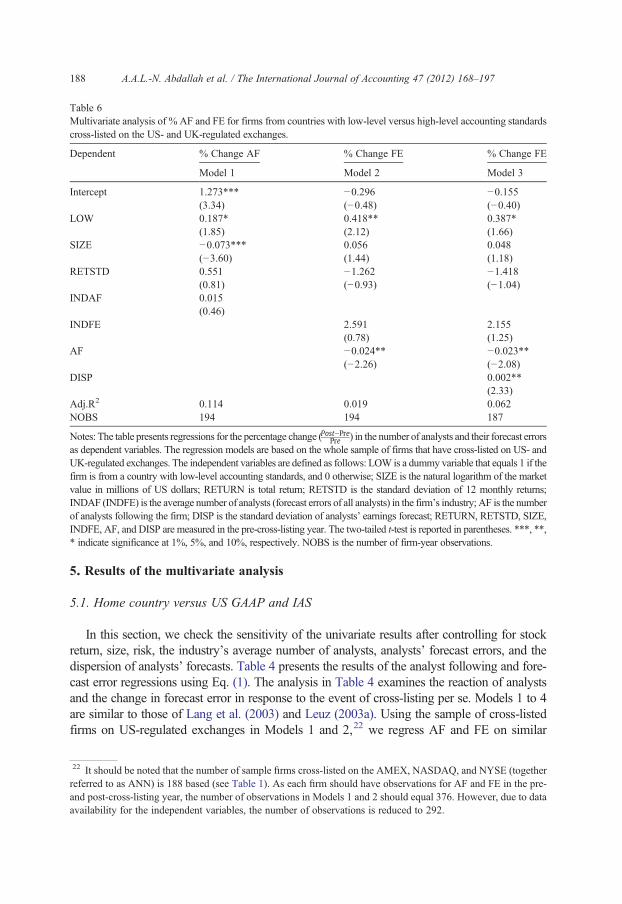
Table 6Multivariate analysis of % AF and FE for firms from countries with low-level versus high-level accounting standardscross-listed on the US- and UK-regulated exchanges.
Dependent % Change AF % Change FE % Change FE
Model 1 Model 2 Model 3
Intercept 1.273*** −0.296 −0.155(3.34) (−0.48) (−0.40)
LOW 0.187* 0.418** 0.387*(1.85) (2.12) (1.66)
SIZE −0.073*** 0.056 0.048(−3.60) (1.44) (1.18)
RETSTD 0.551 −1.262 −1.418(0.81) (−0.93) (−1.04)
INDAF 0.015(0.46)
INDFE 2.591 2.155(0.78) (1.25)
AF −0.024** −0.023**(−2.26) (−2.08)
DISP 0.002**(2.33)
Adj.R2 0.114 0.019 0.062NOBS 194 194 187
Notes: The table presents regressions for the percentage change (Post−PrePre ) in the number of analysts and their forecast errorsas dependent variables. The regression models are based on the whole sample of firms that have cross-listed on US- andUK-regulated exchanges. The independent variables are defined as follows: LOW is a dummy variable that equals 1 if thefirm is from a country with low-level accounting standards, and 0 otherwise; SIZE is the natural logarithm of the marketvalue in millions of US dollars; RETURN is total return; RETSTD is the standard deviation of 12 monthly returns;INDAF (INDFE) is the average number of analysts (forecast errors of all analysts) in the firm's industry; AF is the numberof analysts following the firm; DISP is the standard deviation of analysts’ earnings forecast; RETURN, RETSTD, SIZE,INDFE, AF, and DISP are measured in the pre-cross-listing year. The two-tailed t-test is reported in parentheses. ***, **,* indicate significance at 1%, 5%, and 10%, respectively. NOBS is the number of firm-year observations.
188 A.A.L.-N. Abdallah et al. / The International Journal of Accounting 47 (2012) 168–197
5. Results of the multivariate analysis
5.1. Home country versus US GAAP and IAS
In this section, we check the sensitivity of the univariate results after controlling for stockreturn, size, risk, the industry's average number of analysts, analysts’ forecast errors, and thedispersion of analysts’ forecasts. Table 4 presents the results of the analyst following and fore-cast error regressions using Eq. (1). The analysis in Table 4 examines the reaction of analystsand the change in forecast error in response to the event of cross-listing per se. Models 1 to 4are similar to those of Lang et al. (2003) and Leuz (2003a). Using the sample of cross-listedfirms on US-regulated exchanges in Models 1 and 2,22 we regress AF and FE on similar
22 It should be noted that the number of sample firms cross-listed on the AMEX, NASDAQ, and NYSE (togetherreferred to as ANN) is 188 based (see Table 1). As each firm should have observations for AF and FE in the pre-and post-cross-listing year, the number of observations in Models 1 and 2 should equal 376. However, due to dataavailability for the independent variables, the number of observations is reduced to 292.
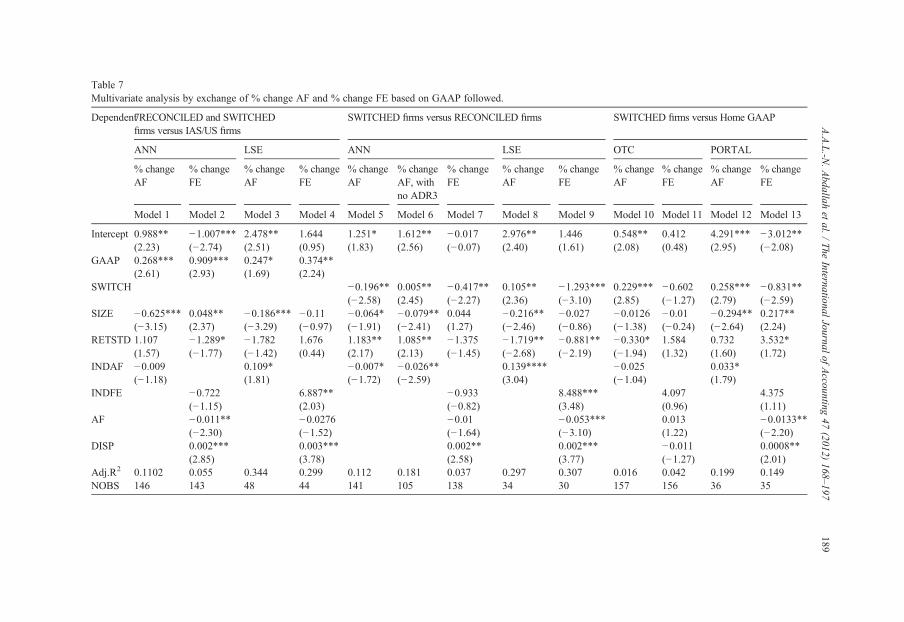
Table 7Multivariate analysis by exchange of % change AF and % change FE based on GAAP followed.
Dependent7RECONCILED and SWITCHEDfirms versus IAS/US firms
SWITCHED firms versus RECONCILED firms SWITCHED firms versus Home GAAP
ANN LSE ANN LSE OTC PORTAL
% changeAF
% changeFE
% changeAF
% changeFE
% changeAF
% changeAF, withno ADR3
% changeFE
% changeAF
% changeFE
% changeAF
% changeFE
% changeAF
% changeFE
Model 1 Model 2 Model 3 Model 4 Model 5 Model 6 Model 7 Model 8 Model 9 Model 10 Model 11 Model 12 Model 13
Intercept 0.988** −1.007*** 2.478** 1.644 1.251* 1.612** −0.017 2.976** 1.446 0.548** 0.412 4.291*** −3.012**(2.23) (−2.74) (2.51) (0.95) (1.83) (2.56) (−0.07) (2.40) (1.61) (2.08) (0.48) (2.95) (−2.08)
GAAP 0.268*** 0.909*** 0.247* 0.374**(2.61) (2.93) (1.69) (2.24)
SWITCH −0.196** 0.005** −0.417** 0.105** −1.293*** 0.229*** −0.602 0.258*** −0.831**(−2.58) (2.45) (−2.27) (2.36) (−3.10) (2.85) (−1.27) (2.79) (−2.59)
SIZE −0.625*** 0.048** −0.186*** −0.11 −0.064* −0.079** 0.044 −0.216** −0.027 −0.0126 −0.01 −0.294** 0.217**(−3.15) (2.37) (−3.29) (−0.97) (−1.91) (−2.41) (1.27) (−2.46) (−0.86) (−1.38) (−0.24) (−2.64) (2.24)
RETSTD 1.107 −1.289* −1.782 1.676 1.183** 1.085** −1.375 −1.719** −0.881** −0.330* 1.584 0.732 3.532*(1.57) (−1.77) (−1.42) (0.44) (2.17) (2.13) (−1.45) (−2.68) (−2.19) (−1.94) (1.32) (1.60) (1.72)
INDAF −0.009 0.109* −0.007* −0.026** 0.139**** −0.025 0.033*(−1.18) (1.81) (−1.72) (−2.59) (3.04) (−1.04) (1.79)
INDFE −0.722 6.887** −0.933 8.488*** 4.097 4.375(−1.15) (2.03) (−0.82) (3.48) (0.96) (1.11)
AF −0.011** −0.0276 −0.01 −0.053*** 0.013 −0.0133**(−2.30) (−1.52) (−1.64) (−3.10) (1.22) (−2.20)
DISP 0.002*** 0.003*** 0.002** 0.002*** −0.011 0.0008**(2.85) (3.78) (2.58) (3.77) (−1.27) (2.01)
Adj.R2 0.1102 0.055 0.344 0.299 0.112 0.181 0.037 0.297 0.307 0.016 0.042 0.199 0.149NOBS 146 143 48 44 141 105 138 34 30 157 156 36 35
189A.A.L.-N
.Abdallah
etal./
The
InternationalJournal
ofAccounting
47(2012)
168–197
190 A.A.L.-N. Abdallah et al. / The International Journal of Accounting 47 (2012) 168–197
independent variables to those used in Lang et al. (2003), that is, PCL and RETURN. InModels 3 and 4 we add the LSE cross-listing before including additional control vari-ables in Models 5, 6, and 7. Consistent with Lang et al. (2003) and Leuz (2003a), theresults show that the post-cross-listing (PCL) dummy is positive and significant in AFregressions, suggesting a positive effect of the cross-listing event on the number of an-alysts. Nevertheless, we report no significant change in the magnitude of analysts’ forecast er-rors (FE) after cross-listing. The coefficient on the PCL in Models 2 and 4 is positive but notsignificant. The finding contradicts that of Lang et al. (2003) but supports that of Leuz (2003a),who also finds no significant change in FE following cross-listing. However, Model 6 showsthat the PCL becomes significant with the inclusion of more control variables, such as size,risk, INDFE (the average forecast errors in the firm's industry), and AF (the average numberof analysts following the firm). The increase of FE in the post-cross-listing year might bedue to the increase in (private pre-disclosure) accounting announcements around cross-listing that increase analysts’ earnings forecasts dispersion and, hence, forecast errors (seeAtiase & Bamber, 1994; Bamber & Cheon, 1995; Dontoh & Ronen, 1993; Kross, Ha, &Heflin, 1994). Model 7 supports this statement by showing a positive relation between ana-lysts’ forecast errors and dispersion of earnings forecast (DISP), indicating that the higherthe dispersion, the higher the forecast error.
Table 4 does not directly test our hypotheses about the change in the number of analystsand their forecast errors following cross-listing, but rather it examines the level of thesevariables in the post-cross-listing year. Therefore, Table 5 reports the results of the percentagechange in our dependent variables (AF and FE).
Models 1, 2, and 3 in Table 5 include the GAAP variable, which is a dummy variable thatequals 1 if the firm reconciles (RECONCILED firm) or switches (SWITCHED firm) to IAS/US GAAP/UK GAAP during and after cross-listing, and 0 otherwise. Consistent with the uni-variate analysis and supporting H1, the coefficient on GAAP in Model 1, for AF, is positiveand significant at the 1% level. This suggests that the percentage change in the number of an-alysts is greater for firms that reconciled or switched to IAS/US GAAP/UK GAAP comparedto those that followed IAS/US GAAP before cross-listing and continued to do so after cross-listing. Despite the increase in analyst following, Model 2, for FE, reports positive and statis-tically significant coefficients on GAAP, indicating an increase in FE after cross-listing forfirms that reconciled or switched to IAS/US GAAP/UK GAAP compared to firms that alreadyfollowed IAS/US GAAP prior to cross-listing. Although this is not consistent with H3, Model
Notes to Table 7The table presents regressions for the percentage change in the number of analysts and their forecast errors as depen-dent variables. The independent variables are defined as follows: GAAP is a dummy variable that equals 1 if the firmreconciles or switches to US/UK/IAS GAAP, and 0 otherwise; SWITCH is a dummy variable that equals 1 if the firmswitches to US GAAP or IAS during and after the cross-listing year, and 0 if the firm reconciles its accounts (for un-regulated exchanges—Models 10 to 13—SWITCH is a dummy variable that equals 1 if the firm switches to USGAAP or IAS during and after the cross-listing, and 0 otherwise); SIZE is the natural logarithm of the market valuein millions of US dollars; RETURN is total return; RETSTD is the standard deviation of 12 monthly returns; INDAF(INDFE) is the average number of analysts (forecast errors of all analysts) in the firm's industry; AF is the number ofanalysts following the firm; DISP is the standard deviation of analysts’ earnings forecast; RETURN, RETSTD, SIZE,INDFE, AF, andDISP aremeasured in the pre-cross-listing year; ANN stands for AMEX, NASDAQ, andNYSE. Thetwo-tailed t-test is reported in parentheses. ***, **,* indicate significance at 1%, 5%, and 10%, respectively. NOBS isthe number of firm-year observations.
191A.A.L.-N. Abdallah et al. / The International Journal of Accounting 47 (2012) 168–197
3 provides supportive explanation for this inconsistency as it shows that the increase in forecasterror is positively related to the increase in the dispersion of analysts’ earnings forecast.
In Model 4 in Table 5 we test H2 using Eq. (3). SWITCH takes the value of 1 if the firmswitched to IAS/US GAAP during and after the cross-listing, and 0 if the firm reconciled toIAS/US GAAP/UK GAAP. Consistent with the univariate analysis, the coefficient onSWITCH is negative and significant, which suggests that firms that switched to US GAAP/IAS after cross-listing received less coverage from analysts compared to those that reconciledto IAS/US GAAP/UK GAAP. The higher number of analysts for RECONCILED firms com-pared to SWITCHED firms is mainly due to firms that raise capital during cross-listing,which attracts more analysts.23 To disentangle the effect of firms involved in capital issuancethrough ADRs level 3 on analysts’ following, in Model 5 we re-run Model 4 after excludingthe firms that raise capital. The results of Model 5 support our argument and show that switchedfirms have a higher increase in analyst following compared to firms that reconciled their ac-counts, which is consistent with H2.24
As for forecast error, and consistent with H4, Model 6 shows that firms that switched have agreater decrease in forecast error compared to those that reconciled to IAS/US GAAP/UKGAAP. The coefficient on SWITCH is negative and significant. The finding reveals better qualitydisclosure for firms that switch to IAS/USGAAP,which allows analysts to better predict the earn-ingsof these firmscompared to firms that reconcile their accounts to IAS/USGAAPorUKGAAP.
As for other independent variables, we find that the number of analysts following the firmand the dispersion of analysts’ earnings forecasts are major determinants of FE. The sign ofthe AF is negative and significant across all FE regressions, suggesting that the greater thenumber of analysts that follow a firm, the greater the decrease in forecast error. However,the forecast error increases with more disagreement among analysts. Models 3 and 7 showthat dispersion in analysts’ earnings forecasts is positively related to forecast errors.
5.2. Low-level versus high-level accounting standards
Table 6 presents the results for low-level versus high-level accounting standards environ-ments. In line with the univariate analysis and supporting H5, Model 1 in Table 6 shows thatthere is a greater increase in the number of analysts following firms from countries with low-level accounting standards compared to firms from countries with high-level accounting stan-dards. The coefficient on LOW is positive and significant and indicates that the benefits of in-creasing disclosure are greater for firms from low-level accounting regimes than those fromhigh-level accounting regimes. Apparently, withmore analysts following them, firms from coun-tries with low-level accounting standards are able to increase the dissemination of information toa larger number of investors, thus increasing their visibility. As for the analysts’ forecast errors,Models 2 and 3 reveal that firms from countries with low-level accounting standards experience a
23 None of our SWITCHED firms that cross-list on US/UK markets raised capital during cross-listing.24 We also run two separate regressions, one to test ADR 3 versus RECONCILED firms and the other to exploreADR 3's firms versus SWITCHED firms. The results are similar to those reported in the univariate analysis, withADR 3's firms having a greater percentage increase in the number of analysts after cross-listing, although the co-efficient that captures the difference in the number of analysts is not statistically significant in the two regressions.
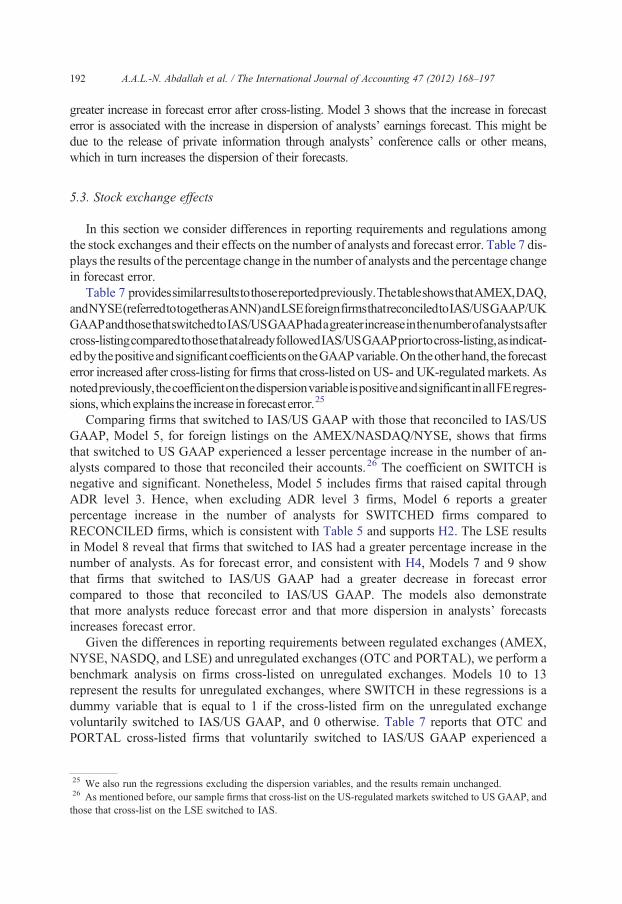
192 A.A.L.-N. Abdallah et al. / The International Journal of Accounting 47 (2012) 168–197
greater increase in forecast error after cross-listing. Model 3 shows that the increase in forecasterror is associated with the increase in dispersion of analysts’ earnings forecast. This might bedue to the release of private information through analysts’ conference calls or other means,which in turn increases the dispersion of their forecasts.
5.3. Stock exchange effects
In this section we consider differences in reporting requirements and regulations amongthe stock exchanges and their effects on the number of analysts and forecast error. Table 7 dis-plays the results of the percentage change in the number of analysts and the percentage changein forecast error.
Table 7 providessimilarresultstothosereportedpreviously.ThetableshowsthatAMEX,DAQ,andNYSE(referredtotogetherasANN)andLSEforeignfirmsthatreconciledtoIAS/USGAAP/UKGAAPandthosethatswitchedtoIAS/USGAAPhadagreaterincreaseinthenumberofanalystsaftercross-listingcomparedtothosethatalreadyfollowedIAS/USGAAPpriortocross-listing,asindicat-edby thepositiveandsignificantcoefficientson theGAAPvariable.Ontheotherhand, the forecasterror increased after cross-listing for firms that cross-listed on US- and UK-regulated markets. Asnotedpreviously,thecoefficientonthedispersionvariableispositiveandsignificantinallFEregres-sions,whichexplains the increase in forecast error.25
Comparing firms that switched to IAS/US GAAP with those that reconciled to IAS/USGAAP, Model 5, for foreign listings on the AMEX/NASDAQ/NYSE, shows that firmsthat switched to US GAAP experienced a lesser percentage increase in the number of an-alysts compared to those that reconciled their accounts.26 The coefficient on SWITCH isnegative and significant. Nonetheless, Model 5 includes firms that raised capital throughADR level 3. Hence, when excluding ADR level 3 firms, Model 6 reports a greaterpercentage increase in the number of analysts for SWITCHED firms compared toRECONCILED firms, which is consistent with Table 5 and supports H2. The LSE resultsin Model 8 reveal that firms that switched to IAS had a greater percentage increase in thenumber of analysts. As for forecast error, and consistent with H4, Models 7 and 9 showthat firms that switched to IAS/US GAAP had a greater decrease in forecast errorcompared to those that reconciled to IAS/US GAAP. The models also demonstratethat more analysts reduce forecast error and that more dispersion in analysts’ forecastsincreases forecast error.
Given the differences in reporting requirements between regulated exchanges (AMEX,NYSE, NASDQ, and LSE) and unregulated exchanges (OTC and PORTAL), we perform abenchmark analysis on firms cross-listed on unregulated exchanges. Models 10 to 13represent the results for unregulated exchanges, where SWITCH in these regressions is adummy variable that is equal to 1 if the cross-listed firm on the unregulated exchangevoluntarily switched to IAS/US GAAP, and 0 otherwise. Table 7 reports that OTC andPORTAL cross-listed firms that voluntarily switched to IAS/US GAAP experienced a
25 We also run the regressions excluding the dispersion variables, and the results remain unchanged.26 As mentioned before, our sample firms that cross-list on the US-regulated markets switched to US GAAP, andthose that cross-list on the LSE switched to IAS.
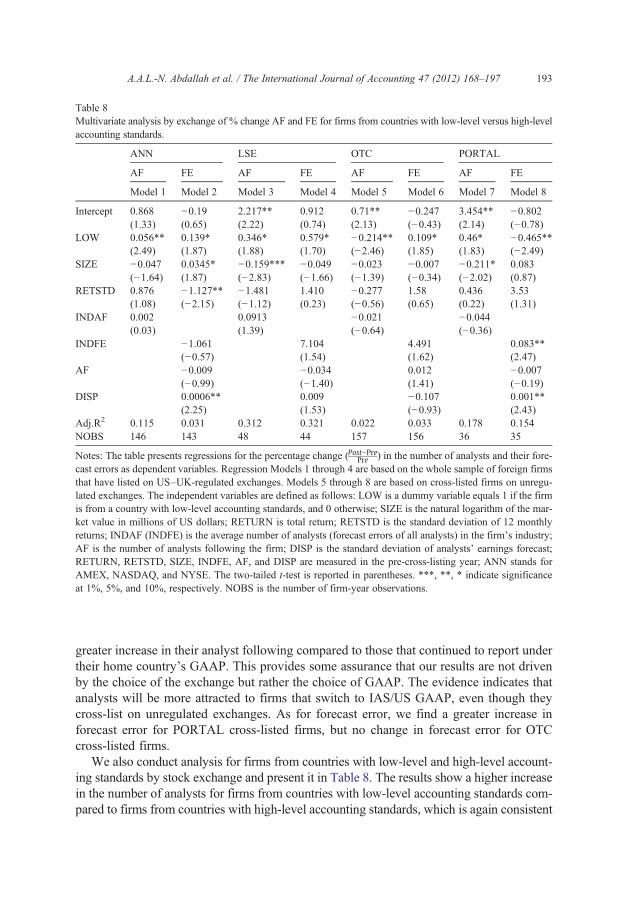
Table 8Multivariate analysis by exchange of % change AF and FE for firms from countries with low-level versus high-leveaccounting standards.
ANN LSE OTC PORTAL
AF FE AF FE AF FE AF FE
Model 1 Model 2 Model 3 Model 4 Model 5 Model 6 Model 7 Model 8
Intercept 0.868 −0.19 2.217** 0.912 0.71** −0.247 3.454** −0.802(1.33) (0.65) (2.22) (0.74) (2.13) (−0.43) (2.14) (−0.78)
LOW 0.056** 0.139* 0.346* 0.579* −0.214** 0.109* 0.46* −0.465**(2.49) (1.87) (1.88) (1.70) (−2.46) (1.85) (1.83) (−2.49)
SIZE −0.047 0.0345* −0.159*** −0.049 −0.023 −0.007 −0.211* 0.083(−1.64) (1.87) (−2.83) (−1.66) (−1.39) (−0.34) (−2.02) (0.87)
RETSTD 0.876 −1.127** −1.481 1.410 −0.277 1.58 0.436 3.53(1.08) (−2.15) (−1.12) (0.23) (−0.56) (0.65) (0.22) (1.31)
INDAF 0.002 0.0913 −0.021 −0.044(0.03) (1.39) (−0.64) (−0.36)
INDFE −1.061 7.104 4.491 0.083**(−0.57) (1.54) (1.62) (2.47)
AF −0.009 −0.034 0.012 −0.007(−0.99) (−1.40) (1.41) (−0.19)
DISP 0.0006** 0.009 −0.107 0.001**(2.25) (1.53) (−0.93) (2.43)
Adj.R2 0.115 0.031 0.312 0.321 0.022 0.033 0.178 0.154NOBS 146 143 48 44 157 156 36 35
Notes: The table presents regressions for the percentage change (Post−PrePre ) in the number of analysts and their forecast errors as dependent variables. Regression Models 1 through 4 are based on the whole sample of foreign firmthat have listed on US–UK-regulated exchanges. Models 5 through 8 are based on cross-listed firms on unregulated exchanges. The independent variables are defined as follows: LOW is a dummy variable equals 1 if the firmis from a country with low-level accounting standards, and 0 otherwise; SIZE is the natural logarithm of the market value in millions of US dollars; RETURN is total return; RETSTD is the standard deviation of 12 monthlyreturns; INDAF (INDFE) is the average number of analysts (forecast errors of all analysts) in the firm's industryAF is the number of analysts following the firm; DISP is the standard deviation of analysts’ earnings forecastRETURN, RETSTD, SIZE, INDFE, AF, and DISP are measured in the pre-cross-listing year; ANN stands foAMEX, NASDAQ, and NYSE. The two-tailed t-test is reported in parentheses. ***, **, * indicate significanceat 1%, 5%, and 10%, respectively. NOBS is the number of firm-year observations.
193A.A.L.-N. Abdallah et al. / The International Journal of Accounting 47 (2012) 168–197
l
-s-
-
;;r
greater increase in their analyst following compared to those that continued to report undertheir home country's GAAP. This provides some assurance that our results are not drivenby the choice of the exchange but rather the choice of GAAP. The evidence indicates thatanalysts will be more attracted to firms that switch to IAS/US GAAP, even though theycross-list on unregulated exchanges. As for forecast error, we find a greater increase inforecast error for PORTAL cross-listed firms, but no change in forecast error for OTCcross-listed firms.
We also conduct analysis for firms from countries with low-level and high-level account-ing standards by stock exchange and present it in Table 8. The results show a higher increasein the number of analysts for firms from countries with low-level accounting standards com-pared to firms from countries with high-level accounting standards, which is again consistent
194 A.A.L.-N. Abdallah et al. / The International Journal of Accounting 47 (2012) 168–197
with H5. We also find a greater increase in analysts’ forecast errors after cross-listing on reg-ulated exchanges by firms from countries with low-level accounting standards. The results forthe unregulated exchanges demonstrate that firms from countries with low-level accountingstandards will have a greater increase in number of analysts if they cross-list on PORTAL,but they will see a decrease if they cross-list on OTC. Consistent with Leuz's (2003a)argument, the greater increase in analyst following for PORTAL firms from countrieswith low-level accounting standards is an indication of the demand for analysts’ servicesby qualified institutional investors, which also explains the decrease in their forecast error.The coefficient on FE is negative and significant in Model 8.
6. Robustness tests
We conduct several robustness checks. We use the median forecast error instead of themean forecast error. Furthermore, instead of deflating by current price, we use two otherdifferent deflators, sales per share and lag price. Also, we use forecast error from month11 of the I/B/E/S data instead of the last forecast. The results do not generally change.27
In order to test whether the results differ between civil-law and common-law countries,we conduct an analysis similar to that in Table 6, after dividing the sample betweencivil-law and common-law countries, and report similar results. Also, we run time seriesregressions by GAAP for the number of analysts and forecast error and also document sim-ilar findings to those reported previously. We also used La Porta et al.'s (1998) average ac-counting standards of 60.93 and report similar results to those when using our sampleaverage of 62.56. Moreover, we perform our analysis using the bootstrapping techniqueto address the normality issue, and the results do not change. We run the analysis usingthe difference in the independent variables and obtain similar results. Also, we use a logof the percentage change in AF and FE and arrive at the same conclusion. We also runthe analysis with heteroscedasticity correction and obtain similar results to those reportedearlier. We also conduct analysis of Table 5 by matching firms by size and arrive at thesame results. We also estimate a Heckman two-equation maximum likelihood model totest for the selectivity bias and find that our results still hold even after controlling for po-tential selection bias.
7. Conclusion
The paper explores whether the effects of cross-listing on analyst following and forecasterror differ between firms with different accounting standards environments. We find agreater increase in the number of analysts for firms that followed their home country'sGAAP prior to cross-listing but reconciled or switched to IAS/US GAAP or UK GAAPduring and after cross-listing, compared to firms adopting US GAAP/IAS before cross-listing. After controlling for firms that are involved in capital issue, we find that firmsthat switched to IAS/US GAAP have a greater increase in analysts than firms that recon-ciled to IAS/US GAAP or UK GAAP. The results are the same for both regulated and
27 Results of the robustness tests are available upon request.
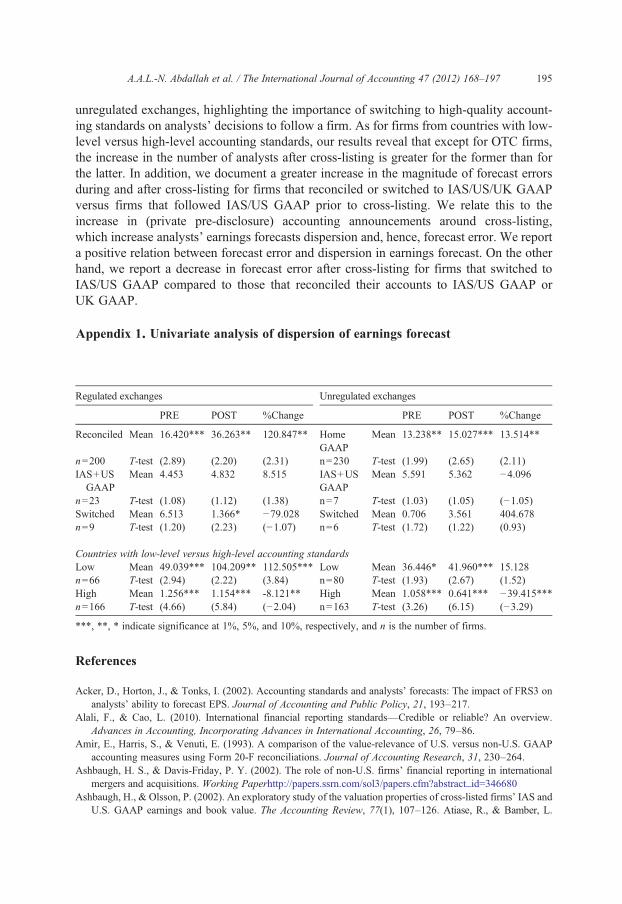
195A.A.L.-N. Abdallah et al. / The International Journal of Accounting 47 (2012) 168–197
unregulated exchanges, highlighting the importance of switching to high-quality account-ing standards on analysts’ decisions to follow a firm. As for firms from countries with low-level versus high-level accounting standards, our results reveal that except for OTC firms,the increase in the number of analysts after cross-listing is greater for the former than forthe latter. In addition, we document a greater increase in the magnitude of forecast errorsduring and after cross-listing for firms that reconciled or switched to IAS/US/UK GAAPversus firms that followed IAS/US GAAP prior to cross-listing. We relate this to theincrease in (private pre-disclosure) accounting announcements around cross-listing,which increase analysts’ earnings forecasts dispersion and, hence, forecast error. We reporta positive relation between forecast error and dispersion in earnings forecast. On the otherhand, we report a decrease in forecast error after cross-listing for firms that switched toIAS/US GAAP compared to those that reconciled their accounts to IAS/US GAAP orUK GAAP.
Appendix 1. Univariate analysis of dispersion of earnings forecast
Regulated exchanges
Unregulated exchangesPRE
POST %Change PRE POST %ChangeReconciled
Mean 16.420*** 36.263** 120.847** HomeGAAPMean
13.238** 15.027*** 13.514**n=200
T-test (2.89) (2.20) (2.31) n=230 T-test (1.99) (2.65) (2.11) IAS+USGAAP
Mean 4.453 4.832 8.515 IAS+USGAAP
Mean 5.591 5.362 −4.096n=23
T-test (1.08) (1.12) (1.38) n=7 T-test (1.03) (1.05) (−1.05) Switched Mean 6.513 1.366* −79.028 Switched Mean 0.706 3.561 404.678 n=9 T-test (1.20) (2.23) (−1.07) n=6 T-test (1.72) (1.22) (0.93)Countries with low-level versus high-level accounting standards
Low Mean 49.039*** 104.209** 112.505*** Low Mean 36.446* 41.960*** 15.128 n=66 T-test (2.94) (2.22) (3.84) n=80 T-test (1.93) (2.67) (1.52) High Mean 1.256*** 1.154*** -8.121** High Mean 1.058*** 0.641*** −39.415*** n=166 T-test (4.66) (5.84) (−2.04) n=163 T-test (3.26) (6.15) (−3.29)***, **, * indicate significance at 1%, 5%, and 10%, respectively, and n is the number of firms.
References
Acker, D., Horton, J., & Tonks, I. (2002). Accounting standards and analysts’ forecasts: The impact of FRS3 onanalysts’ ability to forecast EPS. Journal of Accounting and Public Policy, 21, 193–217.
Alali, F., & Cao, L. (2010). International financial reporting standards—Credible or reliable? An overview.Advances in Accounting, Incorporating Advances in International Accounting, 26, 79–86.
Amir, E., Harris, S., & Venuti, E. (1993). A comparison of the value-relevance of U.S. versus non-U.S. GAAPaccounting measures using Form 20-F reconciliations. Journal of Accounting Research, 31, 230–264.
Ashbaugh, H. S., & Davis-Friday, P. Y. (2002). The role of non-U.S. firms’ financial reporting in internationalmergers and acquisitions. Working Paperhttp://papers.ssrn.com/sol3/papers.cfm?abstract_id=346680
Ashbaugh, H., & Olsson, P. (2002). An exploratory study of the valuation properties of cross-listed firms’ IAS andU.S. GAAP earnings and book value. The Accounting Review, 77(1), 107–126. Atiase, R., & Bamber, L.
196 A.A.L.-N. Abdallah et al. / The International Journal of Accounting 47 (2012) 168–197
(1994, May). Trading volume reactions to annual accounting earnings announcements: The incremental role ofpredisclosure information asymmetry. Journal of Accounting and Economics, 17, 309–329.
Bamber, L. S., & Cheon, Y. S. (1995). Differential price and volume reactions to accounting earnings announcements.The Accounting Review, 70(3), 417–441.
Barth, M. E., & Clinch, G. (1996). International accounting differences and their relation to share prices: Evidencefrom U.K., Australian, and Canadian firms. Contemporary Accounting Research, 13(1), 135–170.
Beckers, S., Steliaros, M., & Thomson, A. (2004). Bias in European analysts earnings forecast. Financial AnalystsJournal, 60(2), 74–85.
Bhat, G., Hope, O., & Kang, T. (2006). Does corporate governance transparency affect the accuracy of analystforecasts? Accounting and Finance, 46, 715–732.
Bhushan, R. (1989, July). Firm characteristics and analyst following. Journal of Accounting and Economics, 11, 255–274.Brennan, M., & Subrahmanyam, A. (1995). Investment analysis and price formation in securities markets. Journal
of Financial Economics, 38(3), 361–381.Bricker, R., Grant, J., Fogarty, T., & Previts, G. (1999). Determinants of analyst following. Journal of Corporate
Communications, 1, 1–29.Brown, P., & Tarca, A. (2008). Achieving high quality, comparable financial reporting: A review of independent
enforcement bodies in Australia and the United Kingdom. BACUS, 43(4), 438–473.Capstaff, J., Paudyal, K., & Rees, W. (1999). The relative forecast accuracy of UK brokers. Accounting and Business
Research, 30(1), 3–16.Dontoh, A., & Ronen, J. (1993). Information content of accounting announcements. The Accounting Review,
88(4), 857–869.Duarte, J., Han, X., Harford, J., & Young, L. (2008). Information asymmetry, information dissemination and the
effect of regulation FD on the cost of capital. Journal of Financial Economics, 87, 24–44.Eng, L., & Teo, H. (2000). The relation between annual report disclosures, analysts’ earnings forecasts and analyst
following: Evidence from Singapore. Pacific Accounting Review, 11, 219–239.Frankel, R., Kothari, S., & Weber, J. (2006). Determinants of the informativeness of analyst research. Journal of
Accounting and Economics, 41, 29–54.Gilson, S., Healy, P., Noe, C., & Palepu, K. (2001). Analyst specialization and conglomerate stock breakups.
Journal of Accounting Research, 39(3), 565–582.Harris, T. S. (1995). International accounting standards Versus US-GAAP reporting: Empirical evidence based
on case studies. Cincinnati, OH: South-Western College Publishing.Harris, M. S., & Muller, K. A., III (1999). The market valuation of IAS versus US-GAAP accounting measures
using Form 20-F reconciliations. Journal of Accounting and Economics, 26, 285–312.Healy, P., & Palepu, K. (2001). Information asymmetry, corporate disclosure, and the capital markets: A review of
the empirical disclosure literature. Journal of Accounting and Economics, 31(1–3), 405–440.Hope, O. (2003). Analyst following and the influence of disclosure components, IPOs and ownership concentration.
Asia-Pacific Journal of Accounting and Economics, 10, 117–141.Hope, O. (2003). Disclosure practices, enforcement of accounting standards and analysts forecasts accuracy. Journal
of Accounting Research, 41(2), 235–272.Hope, O. K., Kang, T., & Zang, Y. (2007). Bonding to the improved disclosure environment in the United States
and the capital market consequences. Journal of Contemporary Accounting and Economics, 3(1), 631–654.Kross, W., Ha, G., & Heflin, F. (1994, July). A test of risk clientele effects via an examination of trading volume
response to earnings announcements. Journal of Accounting and Economics, 18, 67–87.Kurtzman, J., Yago, G., & Phumiwasana, T. (2004). The costs of opacity.MIT SloanManagement Review, 46(1), 38–44.La Porta, R., Lopez-de-Silanes, F., Shleifer, A., & Vishny, R. (1998). Law and finance. Journal of Political Economy,
106, 1113–1155.Lang, M., Lins, K. V., & Miller, D. (2003). ADRs, analysts and accuracy: Does cross listing in the U.S. improve a
firm's information environment and increase market value? Journal of Accounting Research, 41(2), 317–345.Lang, M., & Lundholm, R. (1996). Corporate disclosure policy and analyst behaviour. The Accounting Review,
71(4), 467–492.Leuz, C. (2003). Discussion of ADRs, analysts and accuracy: Does cross listing in the U.S. improve a firm's
information environment and increase market value? Journal of Accounting Research, 41(2), 347–362.Leuz, C. (2003). IAS versus US GAAP: Information asymmetry-based evidence from Germany's new market.
Journal of Accounting Research, 41(3), 445–472.
197A.A.L.-N. Abdallah et al. / The International Journal of Accounting 47 (2012) 168–197
Leuz, C., & Verrecchia, R. E. (2000). The economic consequences of increased disclosure. Journal of AccountingResearch, Supplement, 38, 91–124.
Merton, R. C. (1987). A simple model of capital market equilibriumwith incomplete information. Journal of Finance,42(3), 483–510.
Pope, F. P., &Rees,W. P. (1992). International differences in GAAP and the pricing of earnings. Journal of InternationalFinancial Management and Accounting, 4(3), 190–219.
Rajan, R., & Servaes, H. (1997). Analyst following of initial public offerings. Journal of Finance, 52(2), 507–529.Sinha, P., Brown, L. D., & Das, S. (1997). A re-examination of financial analysts' differential earnings forecast
accuracy. Contemporary Accounting Research, 14(1), 1–42.Street, D. L., Nicholas, N. B., & Gray, S. J. (2000). Assessing the acceptability of International Accounting Standards
in the US: An empirical study of the materiality of US GAAP reconciliation by non-US companies complyingwith IASC standards. The International Journal of Accounting, 35(1), 27–63.
Vanstraelen, A., Zarzeski, M., & Robb, S. (2003). Corporate nonfinancial disclosure practices and financial analystforecast ability across three European countries. Journal of International Financial Management and Accounting,14, 249–278.
Yu, M. (2010). Analyst forecast properties, analyst following and governance disclosure: A governance perspective.Journal of International Accounting, Auditing and Taxation, 19(1), 1–15.