District SDG Scorecard– Khyber Pakhtunkhwa
95
District SDG Scorecard– Khyber Pakhtunkhwa: Comparative Analysis Planning and Development Department Government of Khyber Pakhtunkhwa Sustainable Development Goals Support Unit The purpose of the District SDGs Scorecard is to provide a high-level overview of district wise performance on district relevant SDGs indicators. The scorecard will be helpful in portraying district wise performance and identifying areas of improvement.
-
Upload
khangminh22 -
Category
Documents
-
view
0 -
download
0
Transcript of District SDG Scorecard– Khyber Pakhtunkhwa
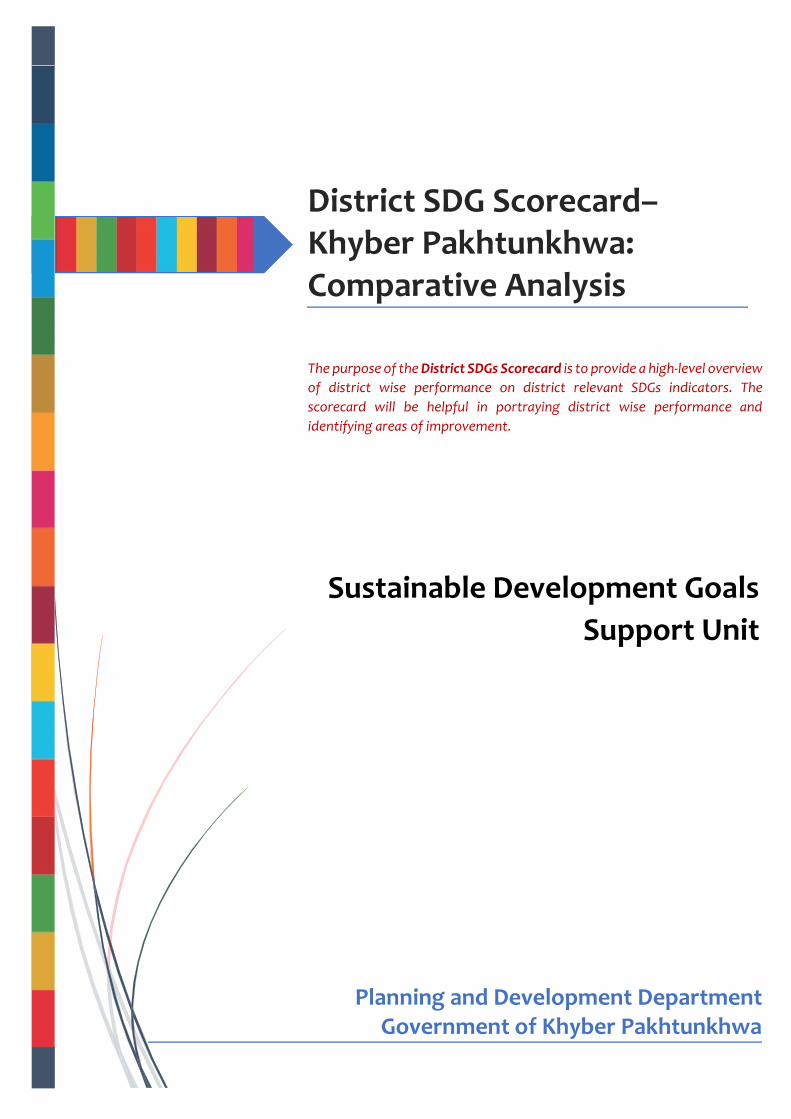
District SDG Scorecard– Khyber Pakhtunkhwa: Comparative Analysis
Planning and Development Department
Government of Khyber Pakhtunkhwa
Sustainable Development Goals
Support Unit
Sustainable Development Unit
The purpose of the District SDGs Scorecard is to provide a high-level overview
of district wise performance on district relevant SDGs indicators. The
scorecard will be helpful in portraying district wise performance and
identifying areas of improvement.
District SDG Scorecard– Khyber Pakhtunkhwa: Comparative Analysis
1 | P a g e
District SDG Scorecard
1. Introduction:
Among others, one of the significant lessons learnt from the sluggish progress on MDGs was its
centrality at state level and the absence of effort for localization. With the adoption of SDGs by
Government of Pakistan, efforts were made on the onset to take the SDGs agenda to
provincial/regional levels. This process of localization is the key to achieve Sustainable Development
Goals.
The localization process makes it imperative to formulate effective policies, design plans and allocate
resources optimally for achieving SDGs. This, however, requires identifying challenges, potential
comparative advantages, and the accelerators at the lowest possible administrative level i.e.
Province/District/Tehsil/Village Council.
This in view, the SDGs Support Unit undertook the exercise of mapping the standing of Districts on
SDGs indicators to the extent data permitted with the objectives to:
I. Use data and discover development challenges and support informed policy decisions making.
II. Monitor the progress on SDGs to inform further actions at district level.
III. Comparative analysis of districts to identify district-wise socio-economic disparities.
IV. Support optimal resource allocation.
The methodology adopted included:
I. Collection of District Level data on all available SDG indicators from official data sources
covering surveys like PSLM and MICS, and administrative data around the base year for SDGs
i.e. 2015
II. Decomposing different variables of the data sources for estimation and computation of
indicators, considering the SDG metadata
2. Outcome of the process:
The process resulted in establishing the district SDGs scorecard reflecting on individual district
standing on 33 SDGs indicators.
3. Possible Usages:
The District SDGs Scorecard can be used to:
• Identify challenges, opportunities, strengths, and weaknesses at District and regional level
• Address the root causes of situation around specific SDGs indicators.
• Inform policy decisions and resource allocation for the uplift of Districts through adoption of
the scorecard by District administration, Chiefs of Section – P&D Department and the Planning
Cells of line Departments as a base document for the preparation of ADP.

District SDG Scorecard– Khyber Pakhtunkhwa: Comparative Analysis
2 | P a g e
• Address several anomalies in data collection and data reporting system identified during the
development of the scorecard.
• Address regional socio-economic disparities, for example, southern, northern and central
regions.
• Identify best practices from districts performing well on various SDGs indicators and
replicate/customize the same approach for implementation in other districts.
• Reshape district level plans and policies to identify and shortlist priority areas of future
interventions

District SDG Scorecard– Khyber Pakhtunkhwa: Comparative Analysis
3 | P a g e
4. Comparative Analysis of District Wise Performance on SDGs indicators:
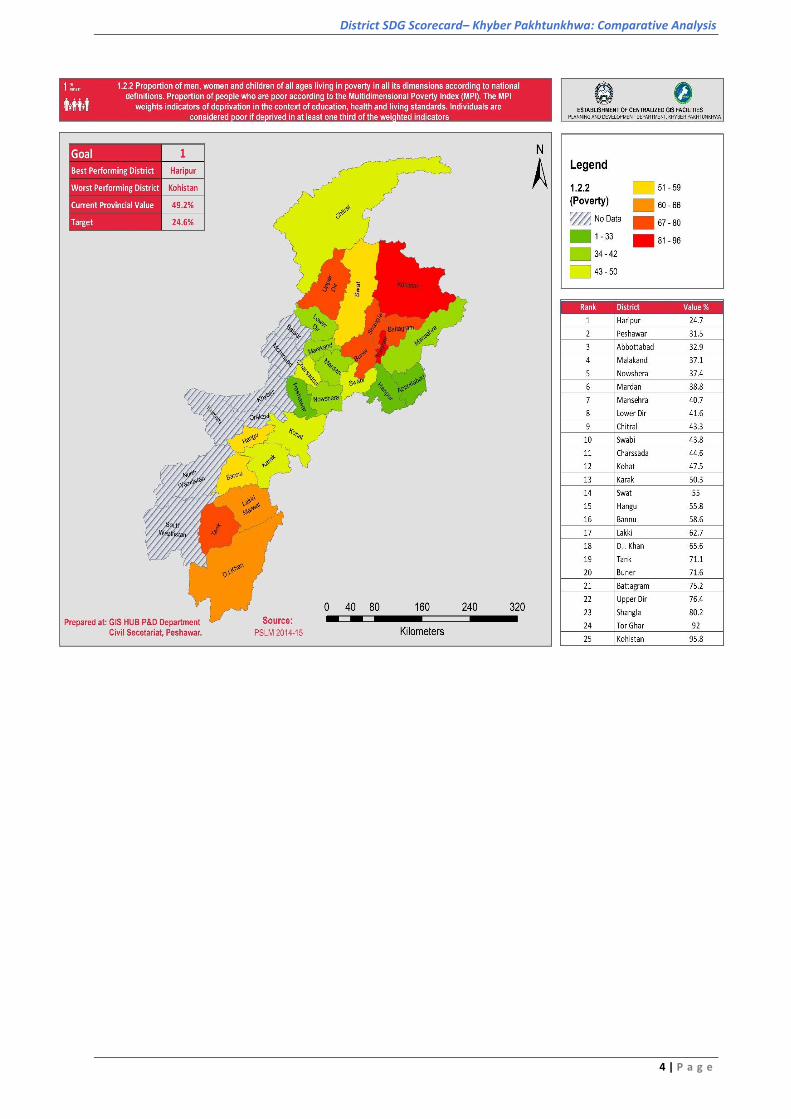
Goal-1: End poverty in all its forms everywhere
Target 1.2: By 2030, reduce at least by half the proportion of men, women and children of
all ages living in poverty in all its dimensions according to national definitions.
Indicator 1.2.2: Proportion of men, women and children of all ages living in poverty in all its
dimensions according to national definitions.
Indicator
Definition
The MPI weighs ten indicators of deprivation in the context of education, health
and living standards. Individuals are considered poor if deprived in at least one
third of the weighted indicators
Better-Off &
Worse-Off
Districts/regions
District Haripur stood first in the ranking in the entire Province, where 24.7 % of
the people living in the district are MPI Poor (Multi-Dimensional Poverty Index).
District Kohistan of the region is the worse-off district in the entire province and
placed at rank No. 25, where 95.8 % people are MPI Poor.
Kohat in the Southern region is the Better-Off district owing rank 12 in the
province with 47.5 %, whereas District Tank is the Worse-Off district in the region
having rank 19 and 71.1% MPI Poor. In the Central region, District Peshawar and
Charssada are placed at rank No. 2 with 31.5 % and 11 with 44.6 % MPI poor,
respectively. District Malakand, having rank 4 with 37.1 % MPI poor leads the
Northern region and Shangla is the worse-off district, placed at rank No. 23 with
80.2 % statistic.
Source: PSLM 2014-15
District SDG Scorecard– Khyber Pakhtunkhwa: Comparative Analysis
4 | P a g e

District SDG Scorecard– Khyber Pakhtunkhwa: Comparative Analysis
5 | P a g e
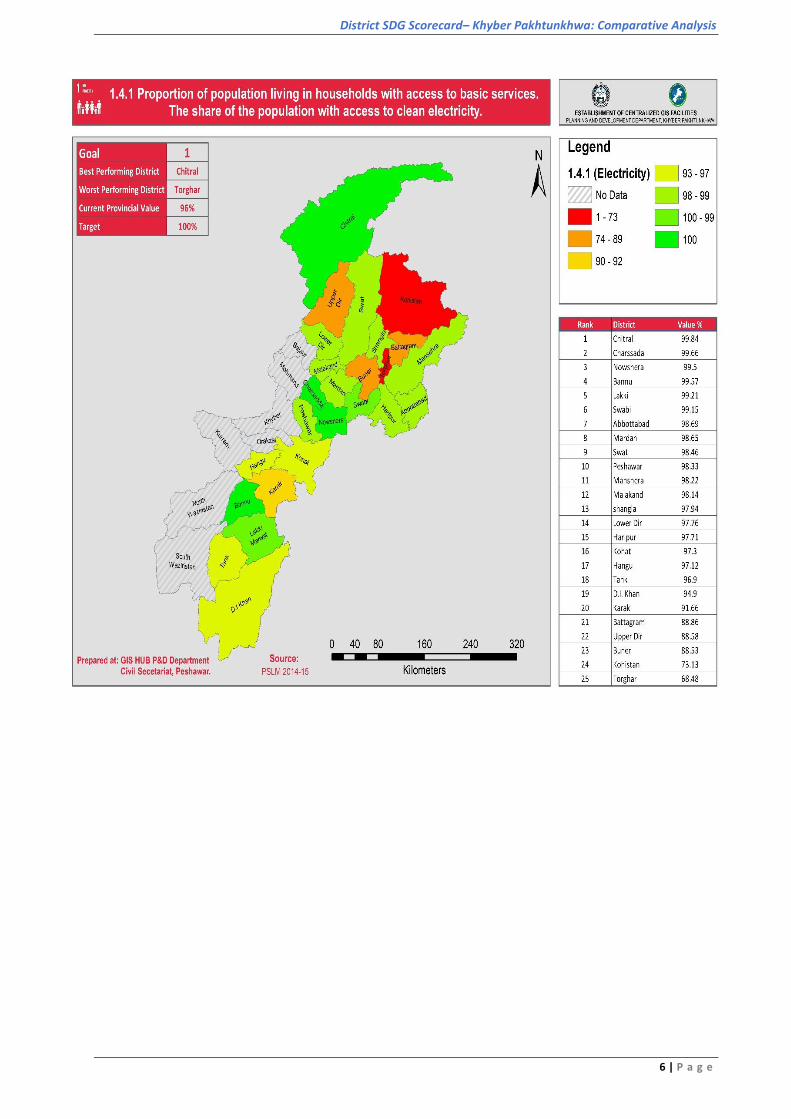
Goal-1: End poverty in all its forms everywhere
Target 1.4:
By 2030, ensure that all men and women, in particular the poor and the
vulnerable, have equal rights to economic resources, as well as access to basic
services, ownership and control over land and other forms of property,
inheritance, natural resources, appropriate new technology and financial
services, including microfinance.
Indicator 1.4.1: Proportion of population living in households with access to basic services.
“The share of the population with access to clean electricity”
Indicator Definition The term Basic services include improved drinking water, sanitation,
electricity, and clean cooking fuels. Here share of electricity is reported.
Better-Off &
Worse-Off
Districts/regions
District Chitral of the Northern region leads the region vis-à-vis province,
placed at Rank No. 1, where 99.8% and District Buner having rank 23 with 88.5%
of the people possess access to clean electricity and is the Worse-Off district
in the region. District Torghar of the Hazara is the Worse-Off district in the
entire province and placed at rank No. 25 with 68.48 % statistic, whereas
District Abbottabad with 98.69% owns rank 7.
Bannu in the Southern region is the Better-Off district owing rank 4 in the
province with 99.57 %, whereas District Karak is the Worse-Off district having
rank 20 with 91.6%. In the Central region, District Charssada and Peshawar are
placed at rank No. 2 with 99.6 % and 10 with 98.3 %, respectively.
Source: PSLM 2014-15
District SDG Scorecard– Khyber Pakhtunkhwa: Comparative Analysis
6 | P a g e
District SDG Scorecard– Khyber Pakhtunkhwa: Comparative Analysis
7 | P a g e
Goal-1: End poverty in all its forms everywhere
Target 1.4:
By 2030, ensure that all men and women, in particular the poor and the
vulnerable, have equal rights to economic resources, as well as access to basic
services, ownership and control over land and other forms of property,
inheritance, natural resources, appropriate new technology and financial
services, including microfinance.
Indicator 1.4.1: Proportion of population living in households with access to basic services.
“The share of the population with access to improved sanitation facilities”
Indicator Definition
By adequate sanitation services means population using a basic sanitation
facility which is not shared with other households and where excreta are
safely disposed in situ or treated off-site. Handwashing facilities consist of a
device to contain or regulate water flow to facilitate handwashing with soap.
Better-Off & Worse-
Off Districts/regions
District Chitral of the Northern belt leads the region, placed at Rank No. 3,
where 88 % and District Buner having rank 21 with 56% of the people possess
access to improved sanitation facilities and is the Worse-Off district in the
region. District Kohistan of the Hazara is the Worse-Off district in the entire
province and placed at rank No. 25 with 44% statistic, whereas District Haripur
with 90% is the Better-Off district in the entire province.
Bannu in the Southern region is the Better-Off district owing rank 15 in the
province with 70%, whereas District Tank is the Worse-Off district having rank
23 with 44%. In the Central region, District Peshawar and Charssada are placed
at rank No. 4 with 88% and 13 with 75%, respectively.
Source: PSLM 2014-15

District SDG Scorecard– Khyber Pakhtunkhwa: Comparative Analysis
8 | P a g e
District SDG Scorecard– Khyber Pakhtunkhwa: Comparative Analysis
9 | P a g e
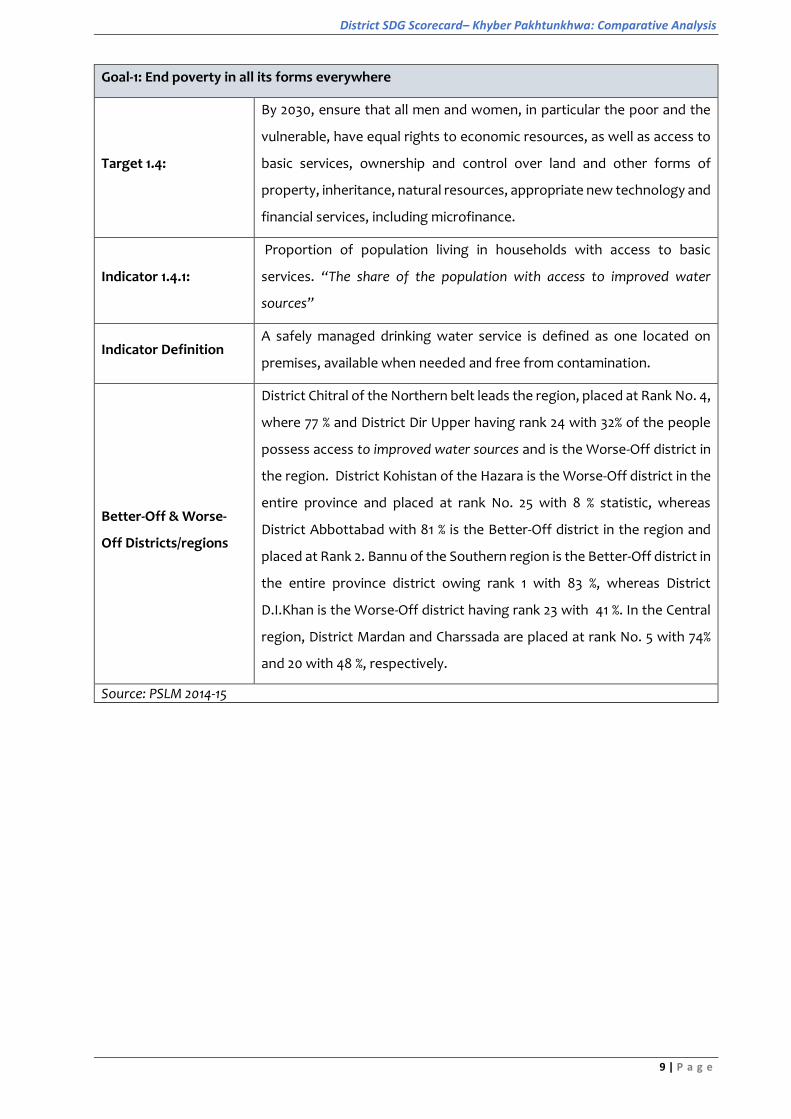
Goal-1: End poverty in all its forms everywhere
Target 1.4:
By 2030, ensure that all men and women, in particular the poor and the
vulnerable, have equal rights to economic resources, as well as access to
basic services, ownership and control over land and other forms of
property, inheritance, natural resources, appropriate new technology and
financial services, including microfinance.
Indicator 1.4.1:
Proportion of population living in households with access to basic
services. “The share of the population with access to improved water
sources”
Indicator Definition A safely managed drinking water service is defined as one located on
premises, available when needed and free from contamination.
Better-Off & Worse-
Off Districts/regions
District Chitral of the Northern belt leads the region, placed at Rank No. 4,
where 77 % and District Dir Upper having rank 24 with 32% of the people
possess access to improved water sources and is the Worse-Off district in
the region. District Kohistan of the Hazara is the Worse-Off district in the
entire province and placed at rank No. 25 with 8 % statistic, whereas
District Abbottabad with 81 % is the Better-Off district in the region and
placed at Rank 2. Bannu of the Southern region is the Better-Off district in
the entire province district owing rank 1 with 83 %, whereas District
D.I.Khan is the Worse-Off district having rank 23 with 41 %. In the Central
region, District Mardan and Charssada are placed at rank No. 5 with 74%
and 20 with 48 %, respectively.
Source: PSLM 2014-15

District SDG Scorecard– Khyber Pakhtunkhwa: Comparative Analysis
10 | P a g e
District SDG Scorecard– Khyber Pakhtunkhwa: Comparative Analysis
11 | P a g e
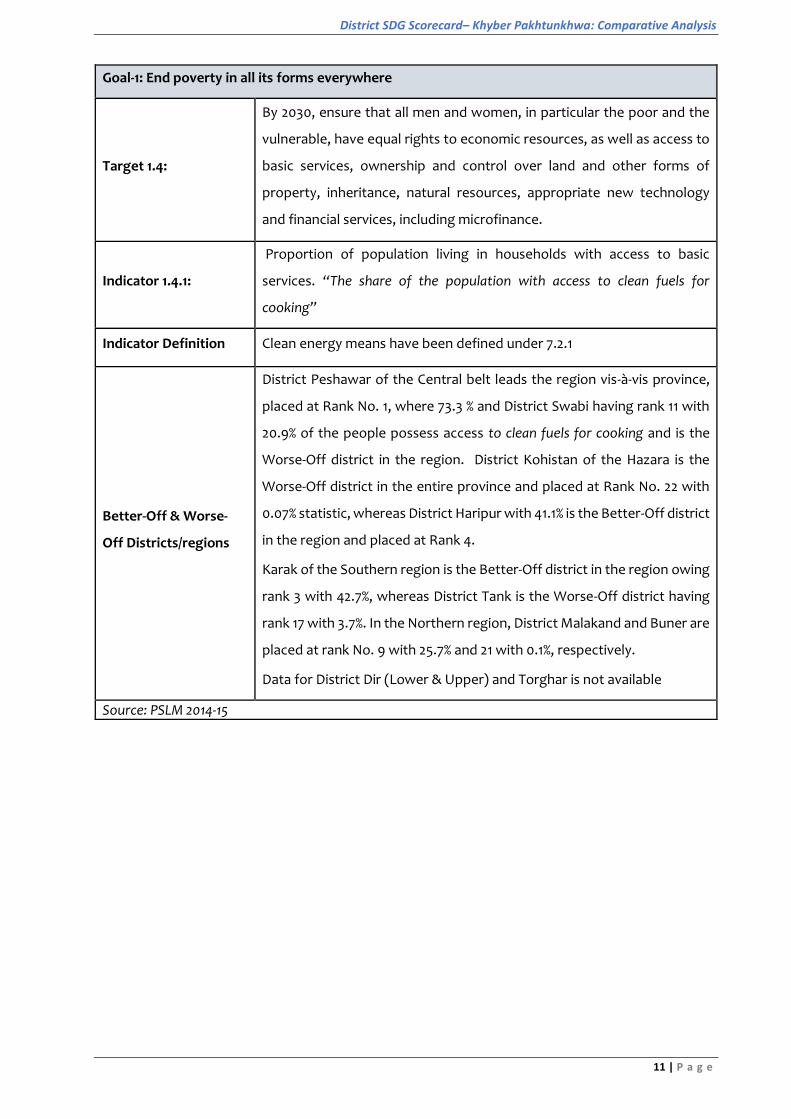
Goal-1: End poverty in all its forms everywhere
Target 1.4:
By 2030, ensure that all men and women, in particular the poor and the
vulnerable, have equal rights to economic resources, as well as access to
basic services, ownership and control over land and other forms of
property, inheritance, natural resources, appropriate new technology
and financial services, including microfinance.
Indicator 1.4.1:
Proportion of population living in households with access to basic
services. “The share of the population with access to clean fuels for
cooking”
Indicator Definition Clean energy means have been defined under 7.2.1
Better-Off & Worse-
Off Districts/regions
District Peshawar of the Central belt leads the region vis-à-vis province,
placed at Rank No. 1, where 73.3 % and District Swabi having rank 11 with
20.9% of the people possess access to clean fuels for cooking and is the
Worse-Off district in the region. District Kohistan of the Hazara is the
Worse-Off district in the entire province and placed at Rank No. 22 with
0.07% statistic, whereas District Haripur with 41.1% is the Better-Off district
in the region and placed at Rank 4.
Karak of the Southern region is the Better-Off district in the region owing
rank 3 with 42.7%, whereas District Tank is the Worse-Off district having
rank 17 with 3.7%. In the Northern region, District Malakand and Buner are
placed at rank No. 9 with 25.7% and 21 with 0.1%, respectively.
Data for District Dir (Lower & Upper) and Torghar is not available
Source: PSLM 2014-15

District SDG Scorecard– Khyber Pakhtunkhwa: Comparative Analysis
12 | P a g e

District SDG Scorecard– Khyber Pakhtunkhwa: Comparative Analysis
13 | P a g e
Goal-1: End poverty in all its forms everywhere
Target 1.4:
By 2030, ensure that all men and women, in particular the poor and the
vulnerable, have equal rights to economic resources, as well as access to
basic services, ownership and control over land and other forms of
property, inheritance, natural resources, appropriate new technology
and financial services, including microfinance.
Indicator 1.4.2:
Proportion of total adult population with secure tenure rights to land,
with legally recognized documentation and who perceive their rights to
land as secure, by sex and by type of tenure.
Indicator Definition
All segments of the society have equal rights to economic resources, as
well as access to ownership of and control over land and other forms
property, resources, and inheritance.
Better-Off & Worse-
Off Districts/regions
District Chitral leads the province with a value of 97.53% followed by
District Karak with 96.6%. District Peshawar is worst performing district
both in the province as well in the division with only 73.62% population
having secure tenure rights to land. Among the worst performing districts
the second in row is Buner with a value of 78.98%. In Peshawar division
the best forming district is Nowshera where 89.87% population has access
to secure tenure to land. District Swabi leads the Mardan Division with a
value of 92.5% and ranks 7th in the province. District Battagram is the
worst performing district in the Hazara Division and is placed at Rank No.
18 provincially with 84.39 %, whereas District Torghar with 95.68 % is the
Better-Off district in the Division and placed at Rank 3 in the province.
D.I.Khan with a score of 93.85% is placed at 6th position and is the best
performing district in the Division.
Source: PSLM 2014-15

District SDG Scorecard– Khyber Pakhtunkhwa: Comparative Analysis
14 | P a g e

District SDG Scorecard– Khyber Pakhtunkhwa: Comparative Analysis
15 | P a g e
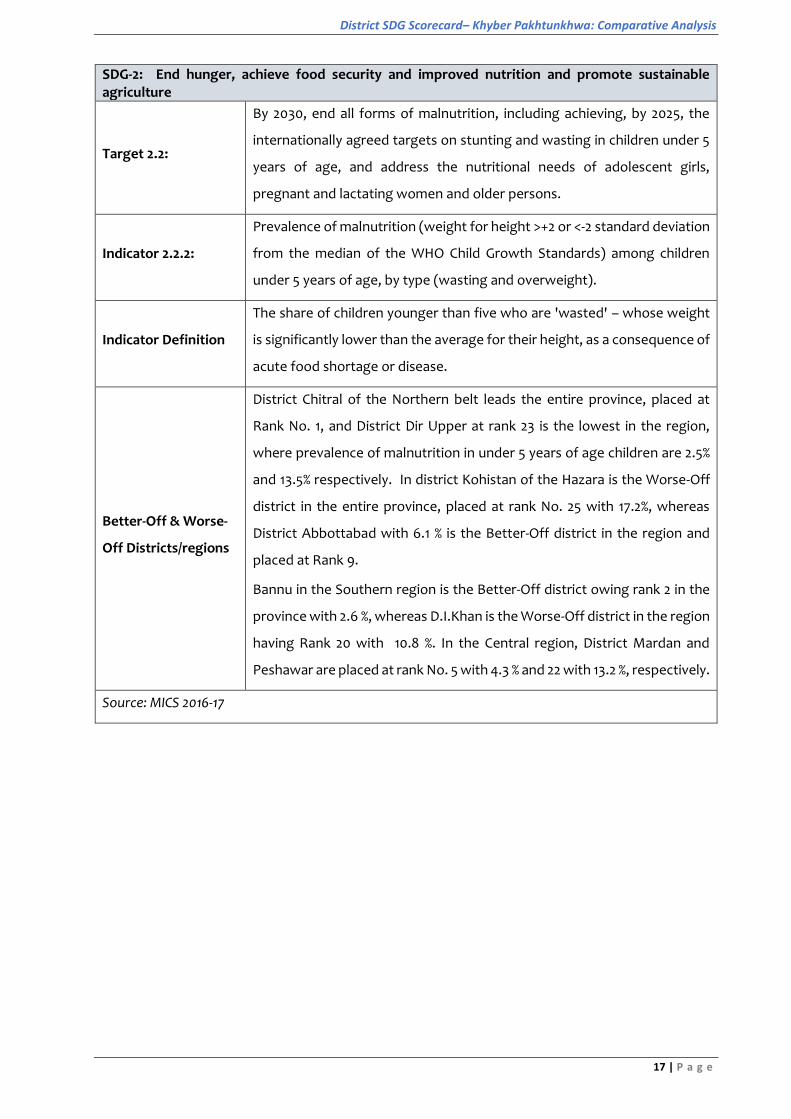
SDG-2: End hunger, achieve food security and improved nutrition and promote sustainable agriculture
Target 2.2:
By 2030, end all forms of malnutrition, including achieving, by 2025, the
internationally agreed targets on stunting and wasting in children under 5
years of age, and address the nutritional needs of adolescent girls,
pregnant and lactating women and older persons.
Indicator 2.2.1:
Prevalence of stunting (height for age <-2 standard deviation from the
median of the World Health Organization (WHO) Child Growth Standards)
among children under 5 years of age.
Indicator Definition
Prevalence of stunting (height-for-age <-2 standard deviation from the
median of the World Health Organization (WHO) Child Growth Standards)
among children under 5 years of age.
Better-Off & Worse-
Off Districts/regions
District Haripur stood first in the entire Province, where the prevalence of
stunting in the under 5-year age children is 24.1 %. District Kohistan of the
Hazara region is placed at rank No. 24(2nd last Worse-Off), where data
against the indicator is 59.4.8 %.Kohat in the Southern region is the Better-
Off district and rank 4 in the province with 35.6 %, whereas D.I.Khan is the
Worse-Off district in the region having Rank 18 with 45.8 %. In the Central
region, District Mardan and Nowshera are placed at rank No. 2 with 34.3 %
and 16 with 45.3 %, respectively. District Swat, having rank 8 with 36.9 %
leads the Northern region and Shangla is the Worse-Off district in the entire
province, placed at rank No. 25 with 78.7 % statistic.
Source: MICS 2016-17

District SDG Scorecard– Khyber Pakhtunkhwa: Comparative Analysis
16 | P a g e
District SDG Scorecard– Khyber Pakhtunkhwa: Comparative Analysis
17 | P a g e
SDG-2: End hunger, achieve food security and improved nutrition and promote sustainable agriculture
Target 2.2:
By 2030, end all forms of malnutrition, including achieving, by 2025, the
internationally agreed targets on stunting and wasting in children under 5
years of age, and address the nutritional needs of adolescent girls,
pregnant and lactating women and older persons.
Indicator 2.2.2:
Prevalence of malnutrition (weight for height >+2 or <-2 standard deviation
from the median of the WHO Child Growth Standards) among children
under 5 years of age, by type (wasting and overweight).
Indicator Definition
The share of children younger than five who are 'wasted' – whose weight
is significantly lower than the average for their height, as a consequence of
acute food shortage or disease.
Better-Off & Worse-
Off Districts/regions
District Chitral of the Northern belt leads the entire province, placed at
Rank No. 1, and District Dir Upper at rank 23 is the lowest in the region,
where prevalence of malnutrition in under 5 years of age children are 2.5%
and 13.5% respectively. In district Kohistan of the Hazara is the Worse-Off
district in the entire province, placed at rank No. 25 with 17.2%, whereas
District Abbottabad with 6.1 % is the Better-Off district in the region and
placed at Rank 9.
Bannu in the Southern region is the Better-Off district owing rank 2 in the
province with 2.6 %, whereas D.I.Khan is the Worse-Off district in the region
having Rank 20 with 10.8 %. In the Central region, District Mardan and
Peshawar are placed at rank No. 5 with 4.3 % and 22 with 13.2 %, respectively.
Source: MICS 2016-17

District SDG Scorecard– Khyber Pakhtunkhwa: Comparative Analysis
18 | P a g e

District SDG Scorecard– Khyber Pakhtunkhwa: Comparative Analysis
19 | P a g e
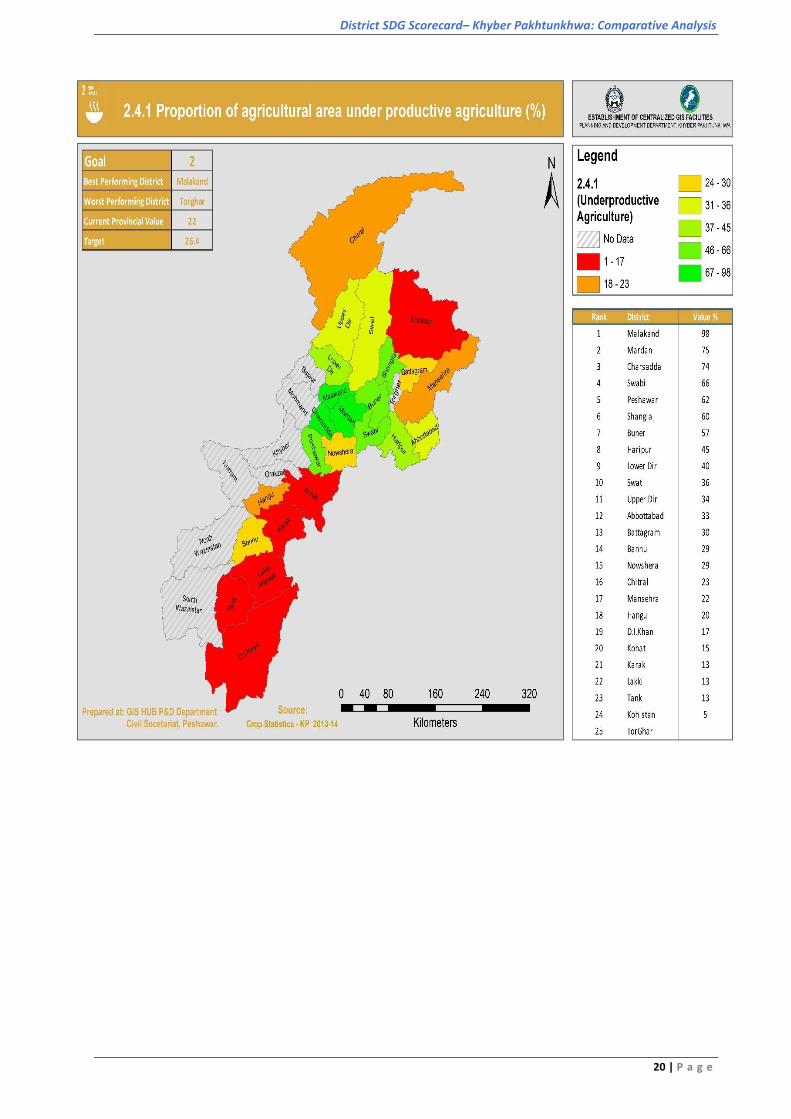
SDG-2: End hunger, achieve food security and improved nutrition and promote sustainable
agriculture
Target 2.4:
By 2030, ensure sustainable food production systems and implement
resilient agricultural practices that increase productivity and production,
that help maintain ecosystems, that strengthen capacity for adaptation to
climate change, extreme weather, drought, flooding and other disasters
and that progressively improve land and soil quality.
Indicator 2.4.1: Proportion of agricultural area under productive and sustainable
agriculture.
Indicator Definition
The indicator is not well defined. However, rough definition of the
indicator is agricultural land area of the farms that satisfy sustainability
criteria across all three dimensions. i.e., Environment, Economic and Social
Better-Off & Worse-
Off Districts/regions
District Malakand of the Northern belt leads the entire province, placed at
Rank No. 1 with 98% area under productive agriculture, followed by Mardan
District with 75%. By region District Chitral is the worse-off district in the
northern region where agriculture area under productive agriculture is
only 23%.
Kohistan of Hazara Division is the worst performing district only 5% area
under productive agriculture followed by Tank as second worst
performing district with 13%. District Haripur with 45 % is the Better-Off
district in Hazara Division and placed at Rank.
In the southern region Bannu is the Better-Off district and rank 14 in the
province with 29 %, whereas Tank is the Worse-Off district in the region
ranking at 23 with 13 %.
Source: Crop Statistics Khyber Pakhtunkhwa 2013-14
District SDG Scorecard– Khyber Pakhtunkhwa: Comparative Analysis
20 | P a g e

District SDG Scorecard– Khyber Pakhtunkhwa: Comparative Analysis
21 | P a g e
SDG-3: Ensure healthy lives and promote well-being for all at all ages.
Target: 3.1: By 2030, reduce the global maternal mortality ratio to less than 70
per 100,000 live births
Indicator: 3.1.1: Maternal mortality ratio
Indicator Definition
The maternal mortality ratio (MMR) is defined as the number of
maternal deaths during a given time period per 100,000 live births
during the same time period.
Better-Off & Worse-Off
Districts/regions
In terms of Maternal Mortality Ratio, the best performing district is
Bannu where MMR is 24 per 100,000 compared to provincial figure
of 167/100,000 population. Haripur district is the worst performing
district with MMR value of 330.
Among the best performing districts, Nowshera ranks 2nd with a
score of 37. Division wise, Banu again tops the list. Kohat Division
ranks second among best performing divisions with average score
of 67 MMR/100,000. Hazara division with average MMR of 262 is the
worst performing Division. Battagram in Hazara Division is the best
performing District with MMR of 83. In Kohat Division District Kohat
with MMR 50 ranks to the top. In Malakand Division district upper
Dir is the best performing district with MMR of 71 while Chitral
District is the worst performing district with MMR of 190. Charsada
with MMR of 71 is the best performing district of Peshawar Division,
while Mardan ranks to the top in the Mardan Division. In D.I.Khan
leads the division with MMR of 81, while the worst performing
district in the D.I.Khan Division is Tank where the MMR stands at 273.
Source: DHIS 2015

District SDG Scorecard– Khyber Pakhtunkhwa: Comparative Analysis
22 | P a g e
District SDG Scorecard– Khyber Pakhtunkhwa: Comparative Analysis
23 | P a g e
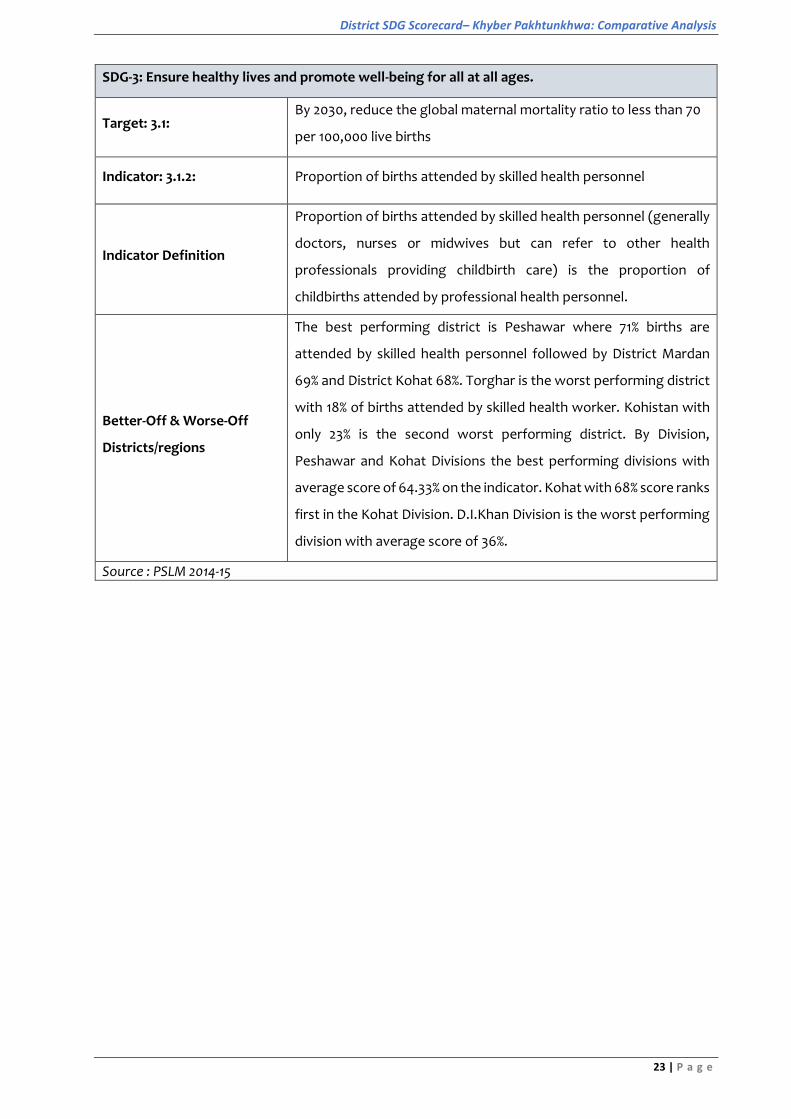
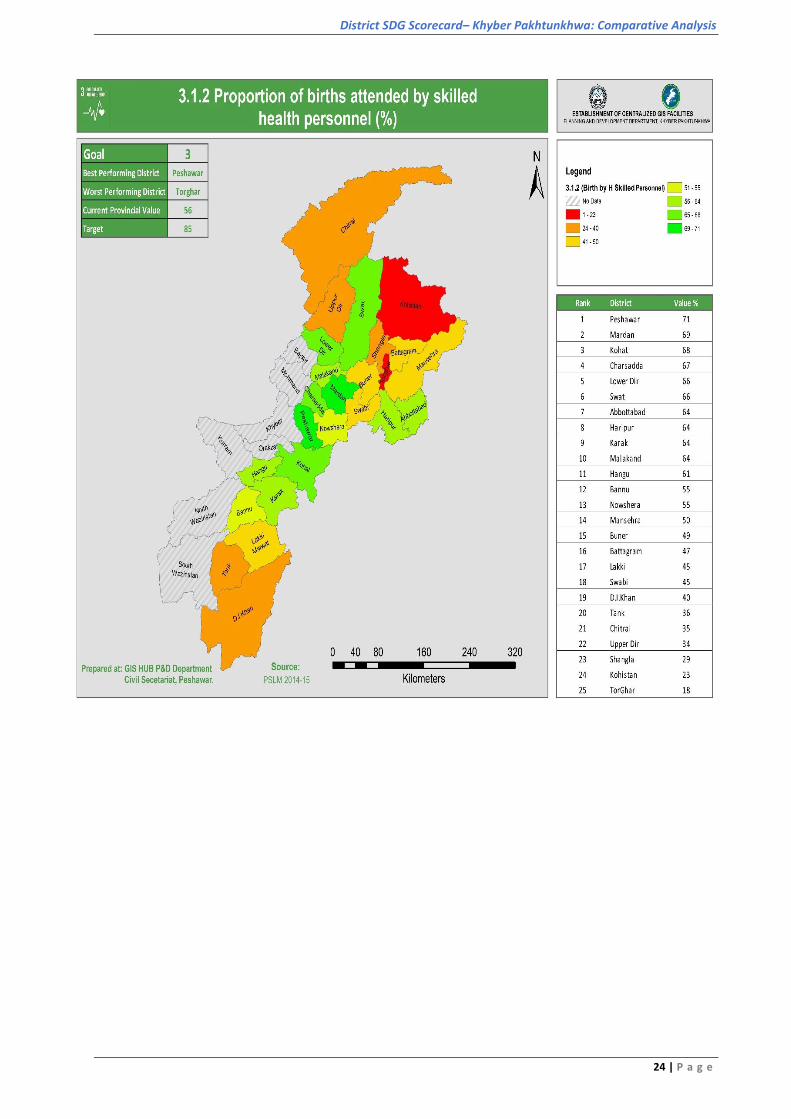
SDG-3: Ensure healthy lives and promote well-being for all at all ages.
Target: 3.1: By 2030, reduce the global maternal mortality ratio to less than 70
per 100,000 live births
Indicator: 3.1.2: Proportion of births attended by skilled health personnel
Indicator Definition
Proportion of births attended by skilled health personnel (generally
doctors, nurses or midwives but can refer to other health
professionals providing childbirth care) is the proportion of
childbirths attended by professional health personnel.
Better-Off & Worse-Off
Districts/regions
The best performing district is Peshawar where 71% births are
attended by skilled health personnel followed by District Mardan
69% and District Kohat 68%. Torghar is the worst performing district
with 18% of births attended by skilled health worker. Kohistan with
only 23% is the second worst performing district. By Division,
Peshawar and Kohat Divisions the best performing divisions with
average score of 64.33% on the indicator. Kohat with 68% score ranks
first in the Kohat Division. D.I.Khan Division is the worst performing
division with average score of 36%.
Source : PSLM 2014-15
District SDG Scorecard– Khyber Pakhtunkhwa: Comparative Analysis
24 | P a g e

District SDG Scorecard– Khyber Pakhtunkhwa: Comparative Analysis
25 | P a g e
SDG-3: Ensure healthy lives and promote well-being for all at all ages.
Target: 3.2:
By 2030, end preventable deaths of newborns and children under 5 years
of age, with all countries aiming to reduce neonatal mortality to at least as
low as 12 per 1,000 live births and under-5 mortality to at least as low as 25
per 1,000 live births
Indicator: 3.2.1: Under-five mortality rate
Indicator Definition
Under-five mortality is the probability of a child born in a specific year or
period dying before reaching the age of 5 years, if subject to age specific
mortality rates of that period, expressed per 1000 live births.
Better-Off & Worst-
Off Districts/regions
District Abbottabad is the best performing one with regard to under-five
mortality with a value of 38 deaths per 1000 followed by District Chitral 43%.
The worst performing district is Battagram with a value of 146 per 1000.
Among Divisions, the best performing division is Peshawar with average
value of 54.3 followed by Malakand with 65 per 1000 under Five Mortality
rate. Bannu with 98.5 under Five Mortality Rate per 1000 is the worst
performing Division followed by Hazara Division 97.6.
Source: MICS 2016-17

District SDG Scorecard– Khyber Pakhtunkhwa: Comparative Analysis
26 | P a g e

District SDG Scorecard– Khyber Pakhtunkhwa: Comparative Analysis
27 | P a g e
SDG-3: Ensure healthy lives and promote well-being for all at all ages.
Target: 3.2:
By 2030, end preventable deaths of newborns and children under
5 years of age, with all countries aiming to reduce neonatal mortality
to at least as low as 12 per 1,000 live births and under-5 mortality to
at least as low as 25 per 1,000 live births
Indicator: 3.2.2: Neonatal mortality rate
Indicator Definition
The neonatal mortality rate is the probability that a child born in a
specific year or period will die during the first 28 completed days of
life if subject to age-specific mortality rates of that period, expressed
per 1000 live births.
Better-Off & Worse-Off
Districts/regions
Peshawar, Tank and Shangla are the best performing districts with
neonatal mortality rate (NMR) of 1 per 1000 live births. Second in the
row are districts of Banu, Charsada, Chitral, Haripur, Malakand and
Swabi with neonatal mortality of 2 for each. Among the worst
performing district Kohat ranks to the top with NMR of 71 per 1000.
By Division, Banu is the best performing division with average score
of 2 followed by D.I.Khan Division with 2.5. Kohat is the worst
performing division with 40 NMR/1,000 followed by Malakand with
2nd highest NMR of 14.6/1,000.
Source: DHIS 2015

District SDG Scorecard– Khyber Pakhtunkhwa: Comparative Analysis
28 | P a g e

District SDG Scorecard– Khyber Pakhtunkhwa: Comparative Analysis
29 | P a g e
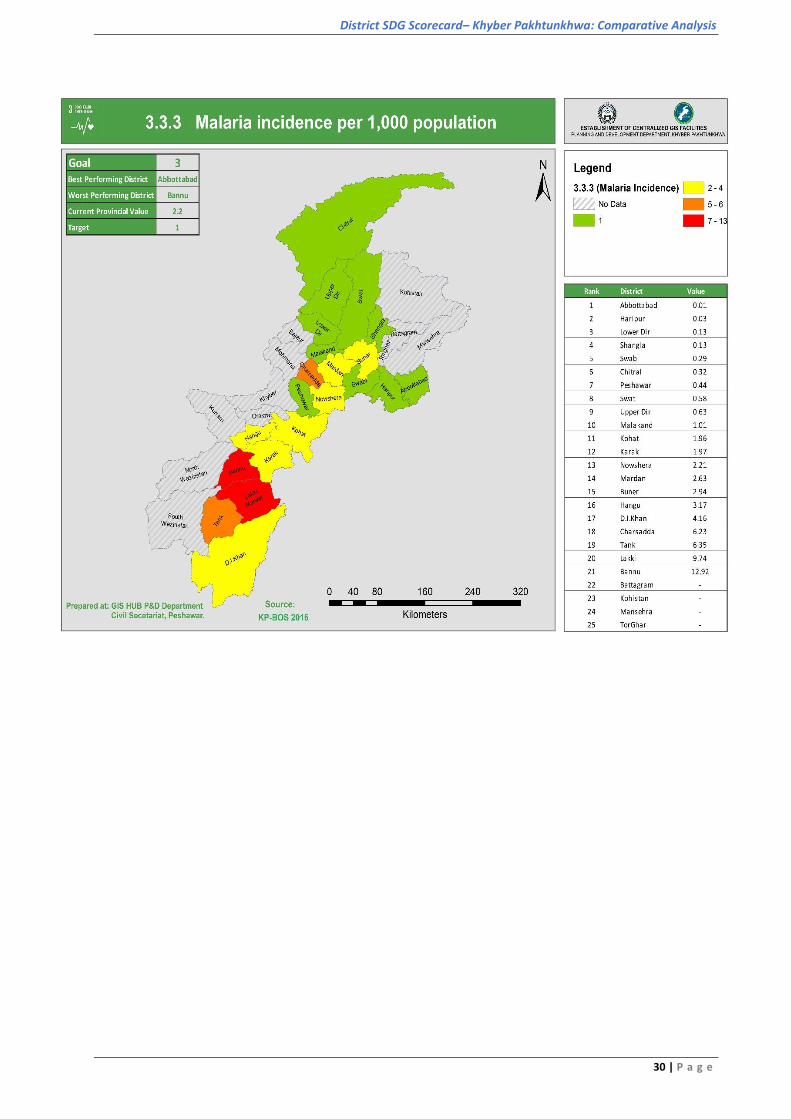
SDG-3: Ensure healthy lives and promote well-being for all at all ages.
Target: 3.3:
By 2030, end the epidemics of AIDS, tuberculosis, malaria and
neglected tropical diseases and combat hepatitis, water-borne
diseases, and other communicable diseases
Indicator: 3.3.3: Malaria incidence per 1,000 population
Indicator Definition Incidence of malaria is defined as the number of new cases of
malaria per 1,000 people at risk each year.
Better-Off & Worse-Off
Districts/regions
The best performing district is Abbottabad where Malaria
Incidence (MI) cases are 0.01 per 1000 population followed by
Haripur with 0.03. The highest Malaria incidences are reported
from District Bannu where this value is 12.92 per 1000 population.
Division wise, the best performing Division is Hazara with
aggregate score of 0.02 Malaria Incidence per 1,000 people
followed by Malakand Division with 0.86. Banu with MI value of
8.04 is the worst performing Division followed by D.I.Khan with 5.2
MI.
Source: KP BOS 2015
District SDG Scorecard– Khyber Pakhtunkhwa: Comparative Analysis
30 | P a g e

District SDG Scorecard– Khyber Pakhtunkhwa: Comparative Analysis
31 | P a g e
SDG-3: Ensure healthy lives and promote well-being for all at all ages.
Target: 3.7:
By 2030, ensure universal access to sexual and reproductive health-
care services, including for family planning, information and
education, and the integration of reproductive health into national
strategies and programmes
Indicator: 3.7.1: Proportion of women of reproductive age (aged 15–49 years) who
have their need for family planning satisfied with modern methods
Indicator Definition
The percentage of women of reproductive age (15-49 years)
currently using a modern method of contraception among those
who desire either to have no (additional) children or to postpone
the next pregnancy.
Better-Off & Worse-Off
Districts/regions
District Chitral is the best performing district where 37.4% of women
in reproductive age are satisfied with modern methods of family
planning. Chitral is followed by Peshawar District where 36.4% are
satisfied with family planning methods. Kohistan is the worst
performing district where this rate is 0.9%. When it comes to
Divisions, the best performing Division is Peshawar with average
30.3% people satisfied with modern methods of family planning
followed by Mardan Division with 28.3%. The worst performing
Division is Hazara where only 17.4% are satisfied followed by D.I.Khan
Division with 17.8%
Source: MICS 2016-17

District SDG Scorecard– Khyber Pakhtunkhwa: Comparative Analysis
32 | P a g e

District SDG Scorecard– Khyber Pakhtunkhwa: Comparative Analysis
33 | P a g e
SDG-3: Ensure healthy lives and promote well-being for all at all ages.
Target: 3.7:
By 2030, ensure universal access to sexual and reproductive health-
care services, including for family planning, information and
education, and the integration of reproductive health into national
strategies and programmes
Indicator: 3.7.2: Adolescent birth rate (aged 10–14 years; aged 15–19 years) per 1,000
women in that age group
Indicator Definition Annual number of births to females aged 10-14 or 15-19 years per 1,000
females in the respective age group.
Better-Off & Worse-Off
Districts/regions
Abbottabad is best performing district with a lowest adolescent birth
rate of 13.5 per 1000 females, followed by Haripur and Lakki Marwat
districts with 33 per 1,000 females each. The adolescent birth rate is
highest for D.I.Khan district with a birth of 102 per 1000 females. The
second highest adolescent birth rate is recorded for district Buner
with 92 per 1,000 females. By Division, Hazara Division with 50
adolescent birth rate (ABR) is the best performing Division followed
by Peshawar Division with 53.3 ABR. Malakand with ABR of 86 is the
worst performing Division followed by D.I.Khan with 72.6. In
Malakand Division the best performing district Chitral with 58 ABR
and Buner with 95 ABR is the worst performing District.
Source: MICS 2016-17

District SDG Scorecard– Khyber Pakhtunkhwa: Comparative Analysis
34 | P a g e
District SDG Scorecard– Khyber Pakhtunkhwa: Comparative Analysis
35 | P a g e
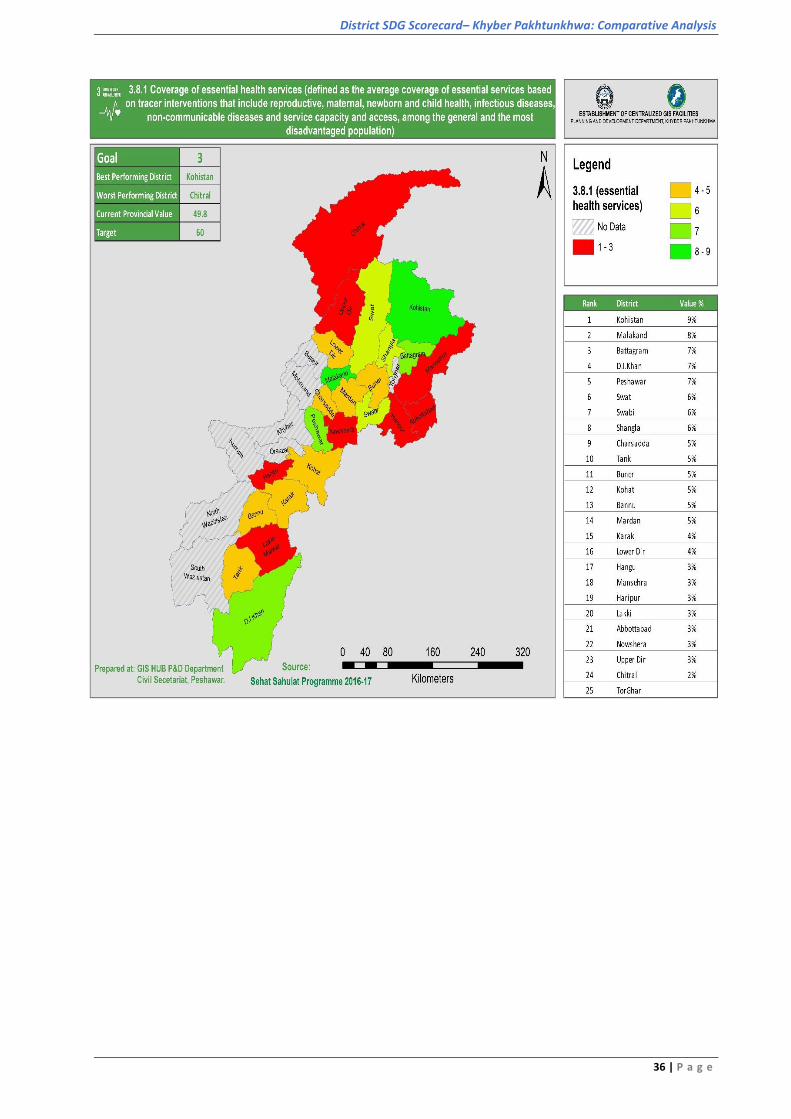
SDG-3: Ensure healthy lives and promote well-being for all at all ages.
Target: 3.8:
Achieve universal health coverage, including financial risk
protection, access to quality essential health-care services and
access to safe, effective, quality and affordable essential medicines
and vaccines for all
Indicator: 3.8.1 Coverage of essential health services
Indicator Definition
Coverage of essential health services (defined as the average
coverage of essential services based on tracer interventions that
include reproductive, maternal, newborn and child health, infectious
diseases, non-communicable diseases and service capacity and
access, among the general and the most disadvantaged population).
Better-Off & Worst-Off
Districts/regions
District Kohistan is the better-off district with 9% of coverage of
essential health services whereas Chitral is the worse-off with 2%
coverage. District Chitral and Upper Dir worst performing districts in
Malakand Division with 2% and 3% health services coverage
respectively. In Hazara Division Haipur, Mansehra and Abbottabad
are the worst-off district 3% coverage each. The District of Nowshera
with 3% is the worst-off while Peshawar District with 7% value is
better-off District in Peshawar Division. District D.I.Khan stands tall
in the Division with 7% coverage while Lakki is the worst-off with only
3% coverage. In Kohat Division District Kohat Ranks first with 5%
score while Hangu is left behind District with only 3% coverage.
Source: Sehat Sahulat Programme 2016-17
District SDG Scorecard– Khyber Pakhtunkhwa: Comparative Analysis
36 | P a g e

District SDG Scorecard– Khyber Pakhtunkhwa: Comparative Analysis
37 | P a g e
SDG-3: Ensure healthy lives and promote well-being for all at all ages.
Target: 3.8:
Achieve universal health coverage, including financial risk
protection, access to quality essential health-care services and
access to safe, effective, quality and affordable essential medicines
and vaccines for all
Indicator: 3.8.2: Proportion of population with large household expenditures on
health as a share of total household expenditure or income
Indicator Definition Proportion of the population with large household expenditure on
health as a share of total household expenditure or income.
Better-Off & Worse-Off
Districts/regions
Inter-districts comparative analysis indicates that the highest health
coverage constituting 92.2% of the total population is provided to
District Kohistan. While the lowest coverage encompassing 22.9 % of
the entire population, is in district Chitral
Source Sehat Sahulat Programme 2016-17
District SDG Scorecard– Khyber Pakhtunkhwa: Comparative Analysis
38 | P a g e

District SDG Scorecard– Khyber Pakhtunkhwa: Comparative Analysis
39 | P a g e
SDG-3: Ensure healthy lives and promote well-being for all at all ages.
Target: 3.b:
Support the research and development of vaccines and medicines for the
communicable and non-communicable diseases that primarily affect
developing countries,
Indicator: 3.b.1: Proportion of the population with access to affordable medicines and
vaccines on a sustainable basis.
Indicator Definition
This indicator aims to measure access to vaccines. Vaccines include
Coverage of DTP containing vaccine (3rd dose), Coverage of Measles
containing vaccine (2nd dose), Coverage of Pneumococcal conjugate
vaccine, and Coverage of HPV vaccine
Better-Off & Worse-
Off Districts/regions
Vaccination coverage in the province, overall, stands at 58%. Among
districts, Abbottabad and Lower Dir has the highest percentage of
population covered under vaccination with 77% coverage, each. Torghar
and Kohistan has the lowest vaccination coverage with only 2% and 7%
respectively. For districts of Peshawar, Hangu and Karak data is not
available for 2014-15. There is a huge gap between the best performing and
worst performing districts – Abbottabad (77%) and Torghar (2%). The
percentage is also comparatively low for southern districts of Bannu and
Laki with 22% and 21% coverage respectively
Source: PSLM 2014-15

District SDG Scorecard– Khyber Pakhtunkhwa: Comparative Analysis
40 | P a g e
District SDG Scorecard– Khyber Pakhtunkhwa: Comparative Analysis
41 | P a g e
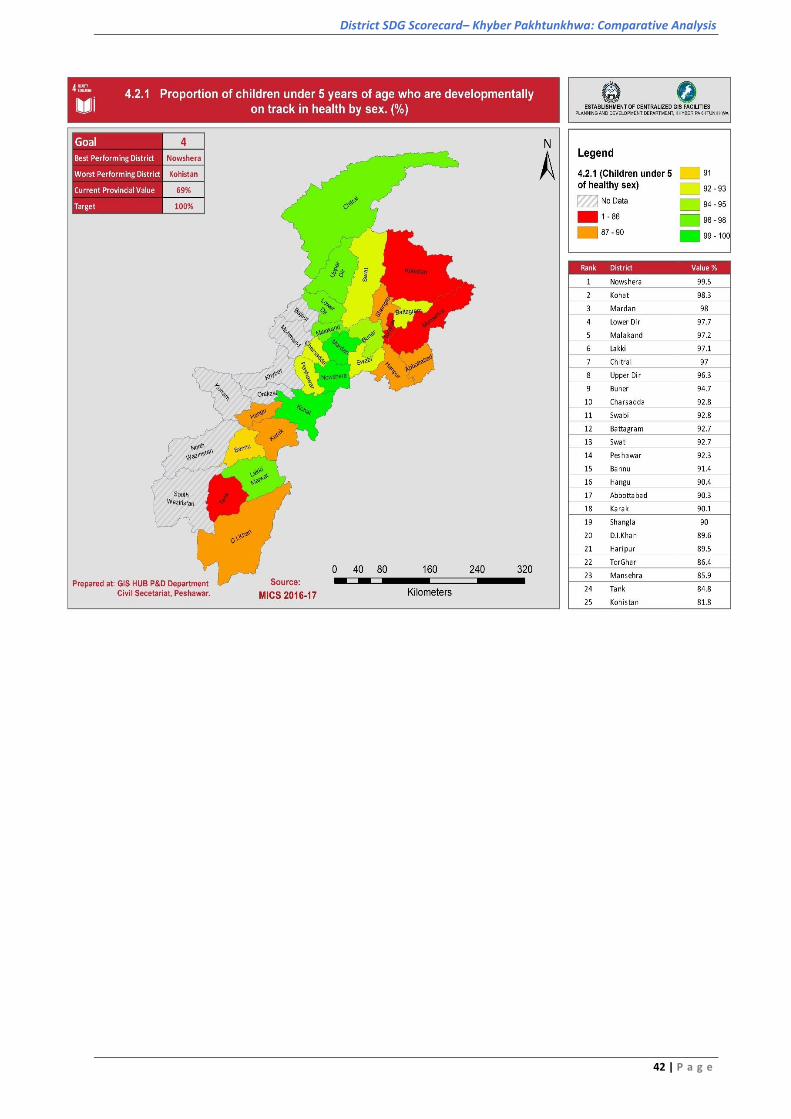
SDG-4: Ensure inclusive and quality education for all and promote lifelong learning:
Target: 4.2:
By 2030, ensure that all girls and boys have access to quality early childhood
development, care and pre-primary education so that they are ready for
primary education.
Indicator: 4.2.1: Proportion of children under 5 years of age who are developmentally on
track in health, learning and psychosocial well-being, by sex.
Indicator Definition There are multiple aspects of this indicator. The health aspect is reported in
this section.
Better-Off & Worse-
Off Districts/regions
The numbers on this indicator are relatively better with the worst
performing district still reporting 82% of the children being developmentally
on track. The best performing district (Nowshehra) reports 99.5% of the
children under 5 years as on track followed by the Districts of Kohat (98.3%)
and Mardan (98%). The provincial Capital, District Peshawar is ranked at 14
position with 92.3%.
Twenty of the total twenty-five districts reports more than 90% of the
children as developmentally on track on physical health. The Worse
performing Districts include the districts of Kohistan (81.8%), Tank (84.8%),
Mansehra (85.9%), Torghar (86.4%), Haripur (89.5%), D.I.Khan (89.6%) and
Shangla (90%).
Source: MICS 2016-17
District SDG Scorecard– Khyber Pakhtunkhwa: Comparative Analysis
42 | P a g e
District SDG Scorecard– Khyber Pakhtunkhwa: Comparative Analysis
43 | P a g e
SDG-4: Ensure inclusive and quality education for all and promote lifelong learning:
Target: 4.3:
By 2030, ensure that all girls and boys have access to quality early
childhood development, care and pre-primary education so that they are
ready for primary education.
Indicator: 4.2.1: Proportion of children under 5 years of age who are developmentally on
track in health, learning and psychosocial well-being, by sex.
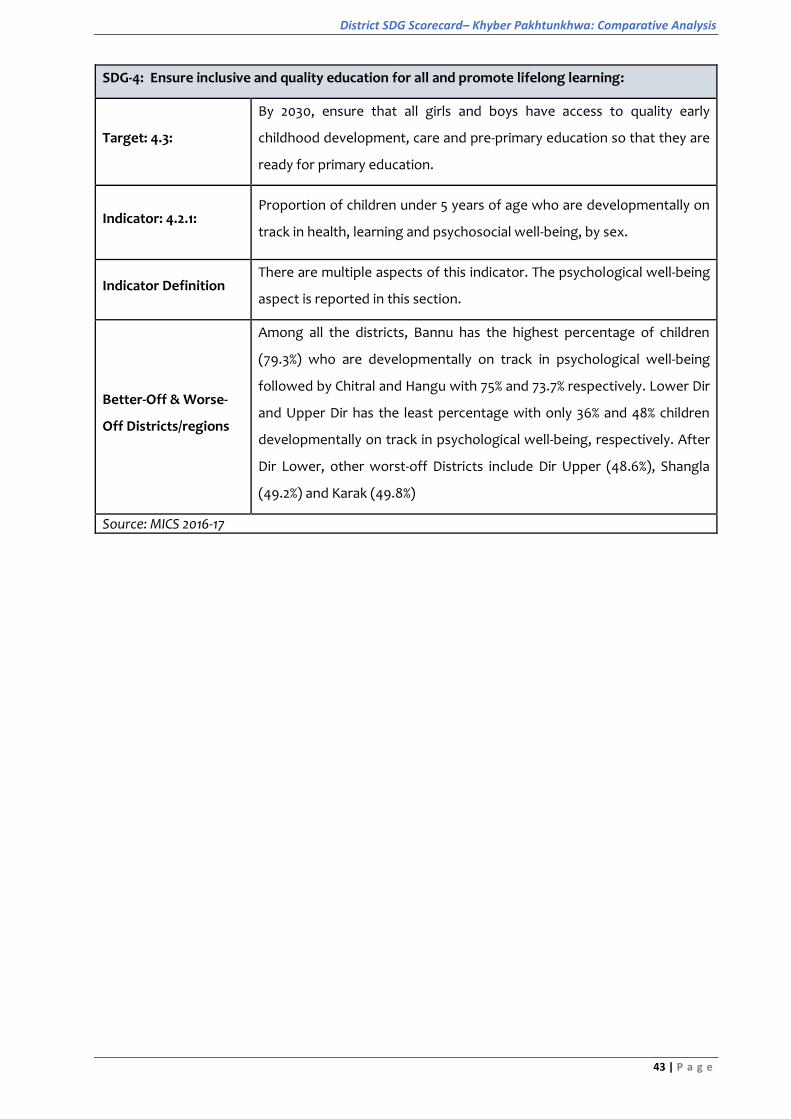
Indicator Definition There are multiple aspects of this indicator. The psychological well-being
aspect is reported in this section.
Better-Off & Worse-
Off Districts/regions
Among all the districts, Bannu has the highest percentage of children
(79.3%) who are developmentally on track in psychological well-being
followed by Chitral and Hangu with 75% and 73.7% respectively. Lower Dir
and Upper Dir has the least percentage with only 36% and 48% children
developmentally on track in psychological well-being, respectively. After
Dir Lower, other worst-off Districts include Dir Upper (48.6%), Shangla
(49.2%) and Karak (49.8%)
Source: MICS 2016-17

District SDG Scorecard– Khyber Pakhtunkhwa: Comparative Analysis
44 | P a g e
District SDG Scorecard– Khyber Pakhtunkhwa: Comparative Analysis
45 | P a g e
SDG-4: Ensure inclusive and quality education for all and promote lifelong learning:
Target: 4.2:
By 2030, ensure that all girls and boys have access to quality early
childhood development, care and pre-primary education so that they are
ready for primary education.
Indicator: 4.2.1: Proportion of children under 5 years of age who are developmentally on
track in health, learning and psychosocial well-being, by sex.
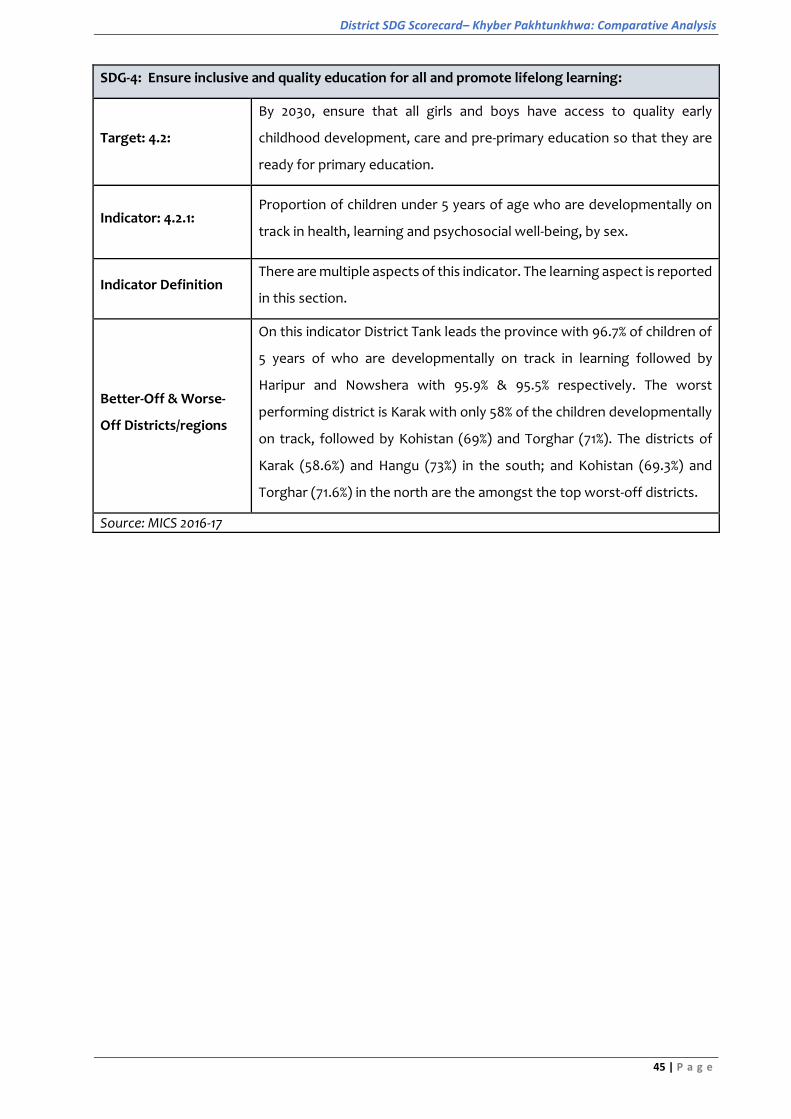
Indicator Definition There are multiple aspects of this indicator. The learning aspect is reported
in this section.
Better-Off & Worse-
Off Districts/regions
On this indicator District Tank leads the province with 96.7% of children of
5 years of who are developmentally on track in learning followed by
Haripur and Nowshera with 95.9% & 95.5% respectively. The worst
performing district is Karak with only 58% of the children developmentally
on track, followed by Kohistan (69%) and Torghar (71%). The districts of
Karak (58.6%) and Hangu (73%) in the south; and Kohistan (69.3%) and
Torghar (71.6%) in the north are the amongst the top worst-off districts.
Source: MICS 2016-17

District SDG Scorecard– Khyber Pakhtunkhwa: Comparative Analysis
46 | P a g e

District SDG Scorecard– Khyber Pakhtunkhwa: Comparative Analysis
47 | P a g e
SDG-4: Ensure inclusive and quality education for all and promote lifelong learning:
Target: 4.4:
By 2030, substantially increase the number of youth and adults who have
relevant skills, including technical and vocational skills, for employment,
decent jobs and entrepreneurship
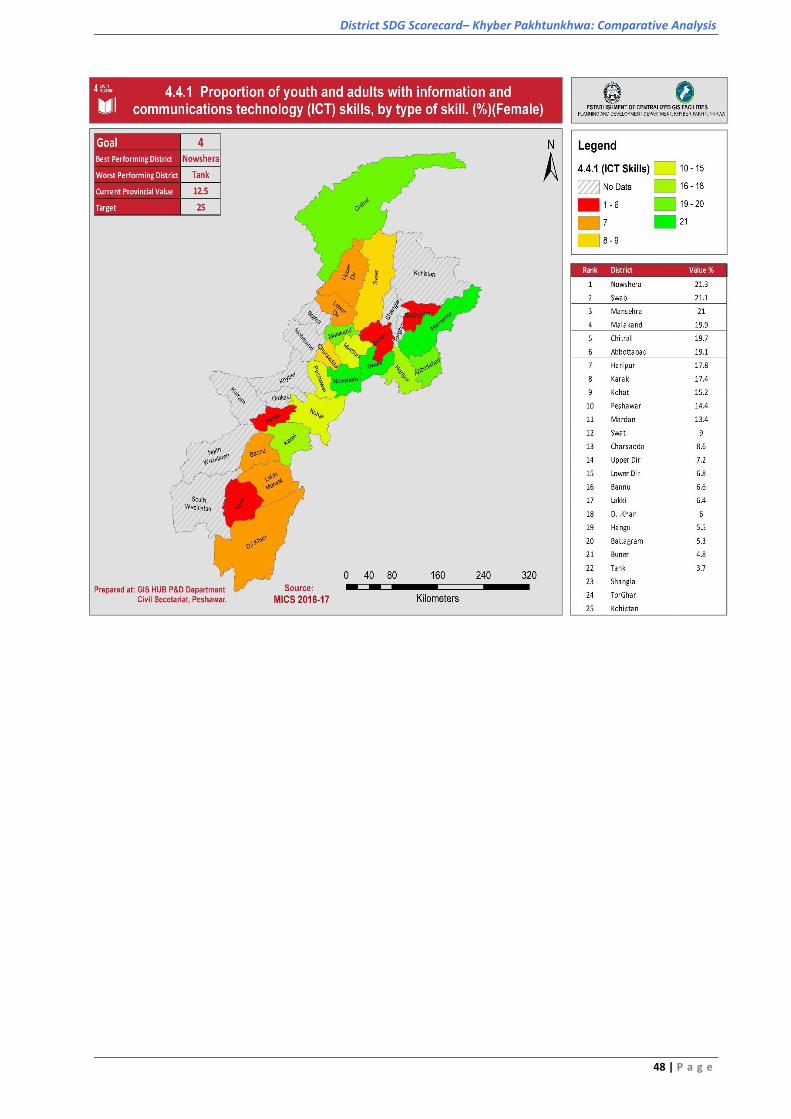
Indicator: 4.4.1: Proportion of youth and adults with information and communications
technology (ICT) skills, by type of skill. (Female)
Indicator Definition
The proportion of youth and adults with information and communications
technology (ICT) skills, by type of skill as defined as the percentage of
individuals that have undertaken certain -ICT-related activities in the last 3
months. The indicator is expressed as a percentage.
Better-Off & Worse-
Off Districts/regions
District Nowshera and Swabi have the highest percentage of female with
ICT skills with more than 21% of total female population skilled in
information and technology. Tank and Buner are the worst performing
districts with 3.7% and 4.8% values. Hazara and the central regions are more
better off than the rest of the province. Data on Shangla, Torghar and
Kohistan is not available. Generally, gender parity is relatively worse off in
Southern Districts as compared to other regions.
Buner (4.8%) and Battagram (5.3%) in the north while Hangu (5.5%) and
Tank (3.7%) in the south are the top 4 worst-off districts.
Source: MICS 2016-17
District SDG Scorecard– Khyber Pakhtunkhwa: Comparative Analysis
48 | P a g e
District SDG Scorecard– Khyber Pakhtunkhwa: Comparative Analysis
49 | P a g e
SDG-4: Ensure inclusive and quality education for all and promote lifelong learning:
Target: 4.5:
By 2030, eliminate gender disparities in education and ensure equal access
to all levels of education and vocational training for the vulnerable,
including persons with disabilities, indigenous peoples, and children in
vulnerable situations.
Indicator: 4.5.1: Parity indices (female/ male) for all education indicators on this list that
can be disaggregated.
Indicator Definition
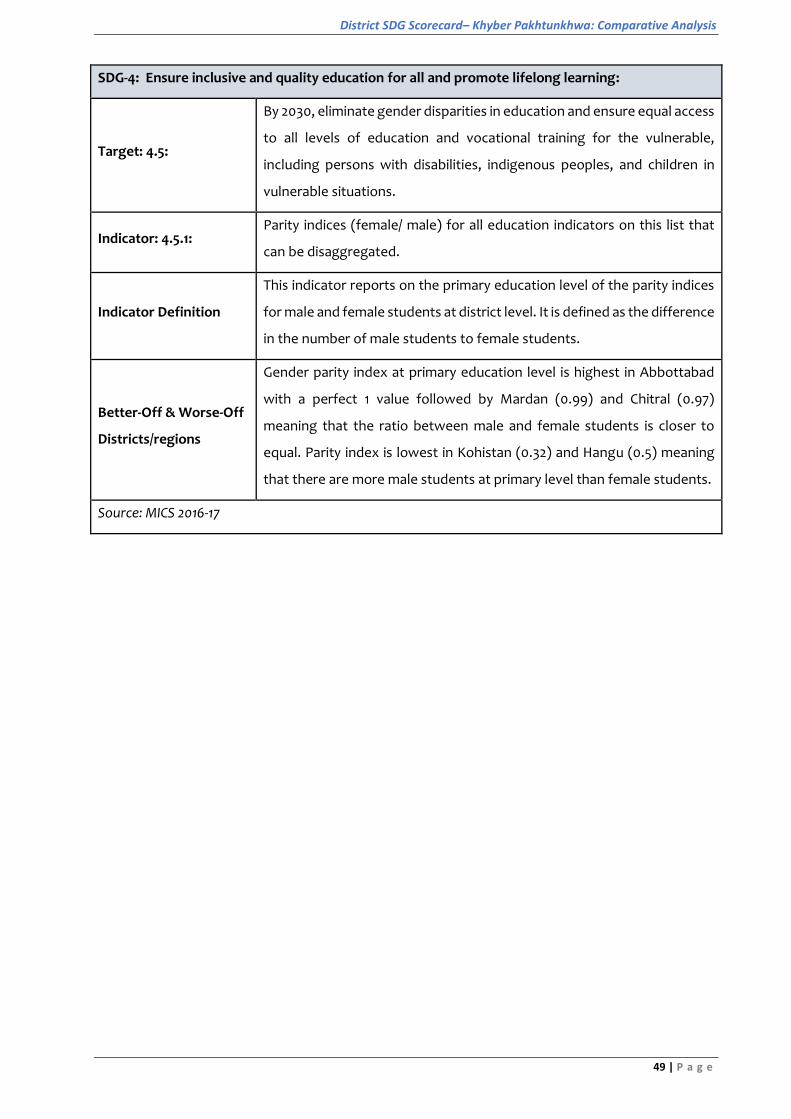
This indicator reports on the primary education level of the parity indices
for male and female students at district level. It is defined as the difference
in the number of male students to female students.
Better-Off & Worse-Off
Districts/regions
Gender parity index at primary education level is highest in Abbottabad
with a perfect 1 value followed by Mardan (0.99) and Chitral (0.97)
meaning that the ratio between male and female students is closer to
equal. Parity index is lowest in Kohistan (0.32) and Hangu (0.5) meaning
that there are more male students at primary level than female students.
Source: MICS 2016-17
District SDG Scorecard– Khyber Pakhtunkhwa: Comparative Analysis
50 | P a g e
District SDG Scorecard– Khyber Pakhtunkhwa: Comparative Analysis
51 | P a g e
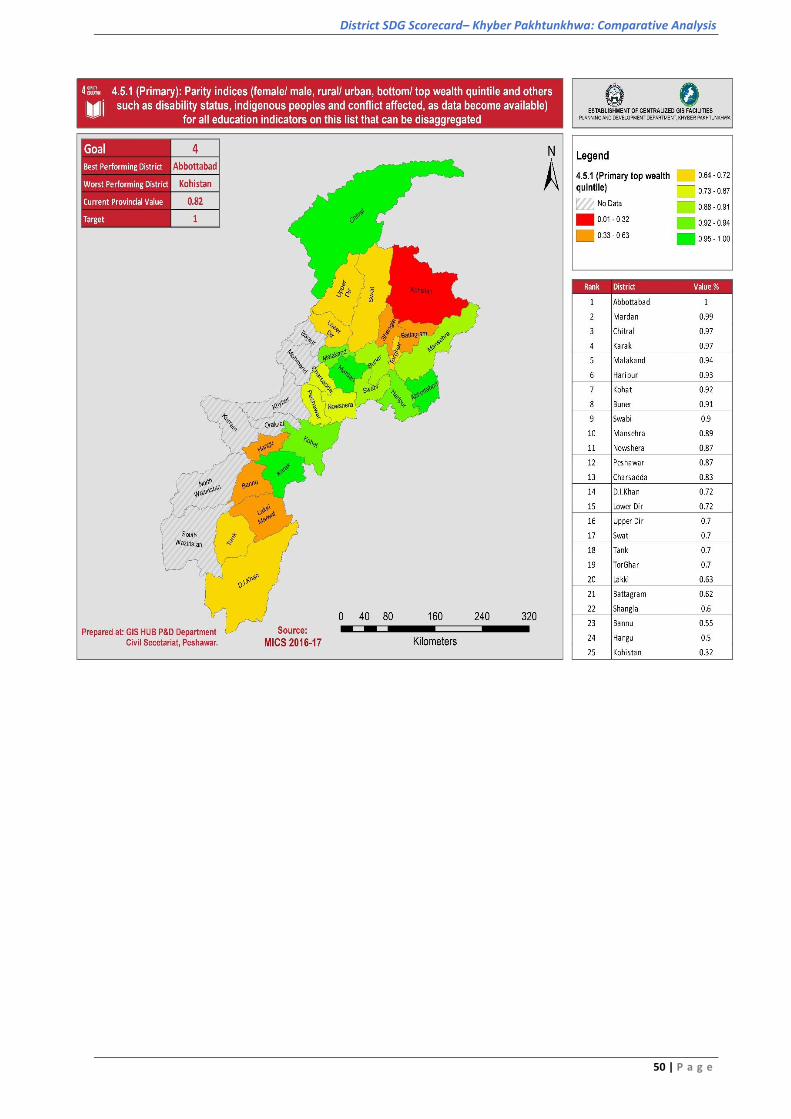
SDG-4: Ensure inclusive and quality education for all and promote lifelong learning:
Target: 4.5:
By 2030, eliminate gender disparities in education and ensure equal access
to all levels of education and vocational training for the vulnerable,
including persons with disabilities, indigenous peoples and children in
vulnerable situations.
Indicator: 4.5.2: Parity indices (female/ male) for all education indicators on this list that
can be disaggregated.
Indicator Definition
This indicator reports on the Secondary education level of the parity
indices for male and female students at district level. It is defined as the
difference in the number of male students to female students.
Better-Off & Worse-
Off Districts/regions
The Parity index (the difference between male and female ratio) at
secondary education level is minimal in Abbottabad with similar number
of male and female students enrolled at secondary level followed by
Chitral and Haripur. The highest difference (parity) is seen in districts
Kohistan (0.04), Torghar (0.1) and Battagram (0.17). Among the regions,
the cluster of Kohistan, Battagram, Torghar, Shangla and Buner have a
higher cluster of difference. Similarly, the Southern region districts also
have a relatively higher difference.
Source: MICS 2016-17

District SDG Scorecard– Khyber Pakhtunkhwa: Comparative Analysis
52 | P a g e

District SDG Scorecard– Khyber Pakhtunkhwa: Comparative Analysis
53 | P a g e
SDG-4: Ensure inclusive and quality education for all and promote lifelong learning:
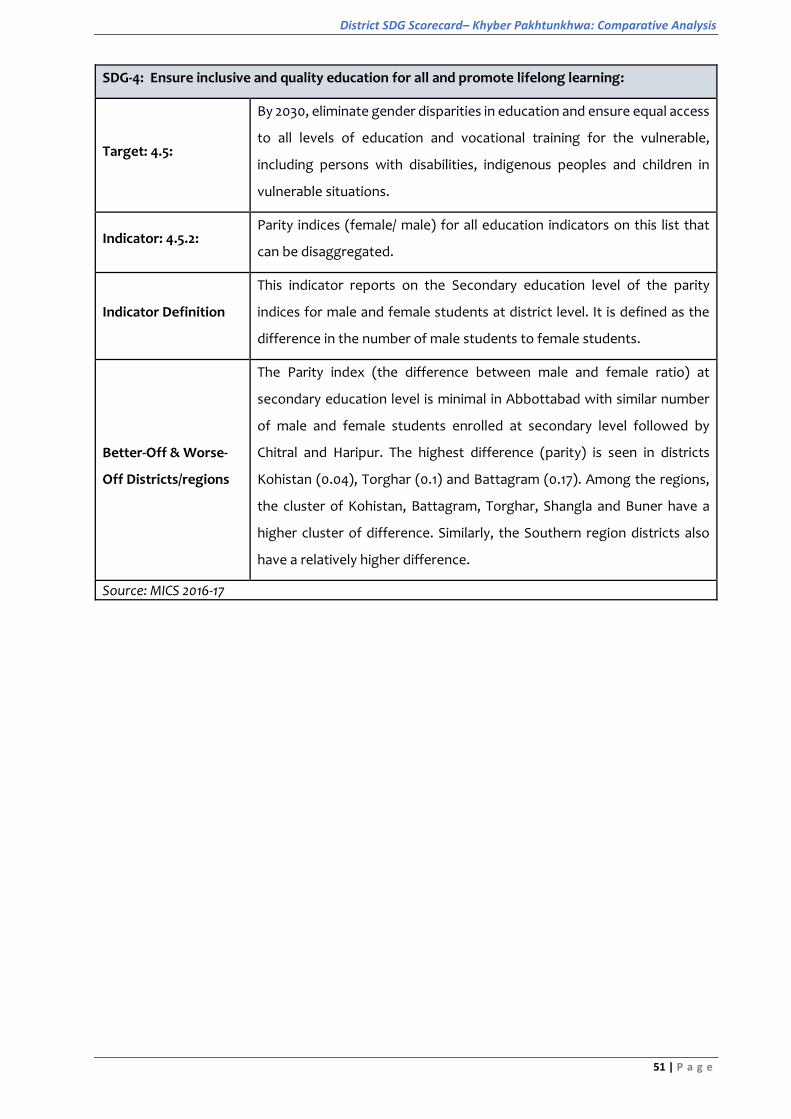
Target: 4.6: By 2030, ensure that all youth and a substantial proportion of adults, both
men and women, achieve literacy and numeracy.
Indicator: 4.6.1: Percentage of population in a given age group achieving at least a fixed
level of proficiency in functional (a) literacy and (b) numeracy skills, by sex.
Indicator Definition This indicator measures the literacy and numeracy skills of the population.
The following portrays literacy numbers only.
Better-Off & Worse-
Off Districts/regions
Literacy is highest in Abbottabad and Haripur district with 69% of the total
population in those districts qualifying as literate. The least literacy rate is
recorded in Torghar (23%) and Kohistan (24%) followed by Battagram (33%),
Shangla (36%) and Buner (38%) making a cluster of least literate districts. It
is noteworthy that these northern districts are in proximity with each other
having similar geo-demographic features.
Source: PSLM 2014-15
District SDG Scorecard– Khyber Pakhtunkhwa: Comparative Analysis
54 | P a g e

District SDG Scorecard– Khyber Pakhtunkhwa: Comparative Analysis
55 | P a g e
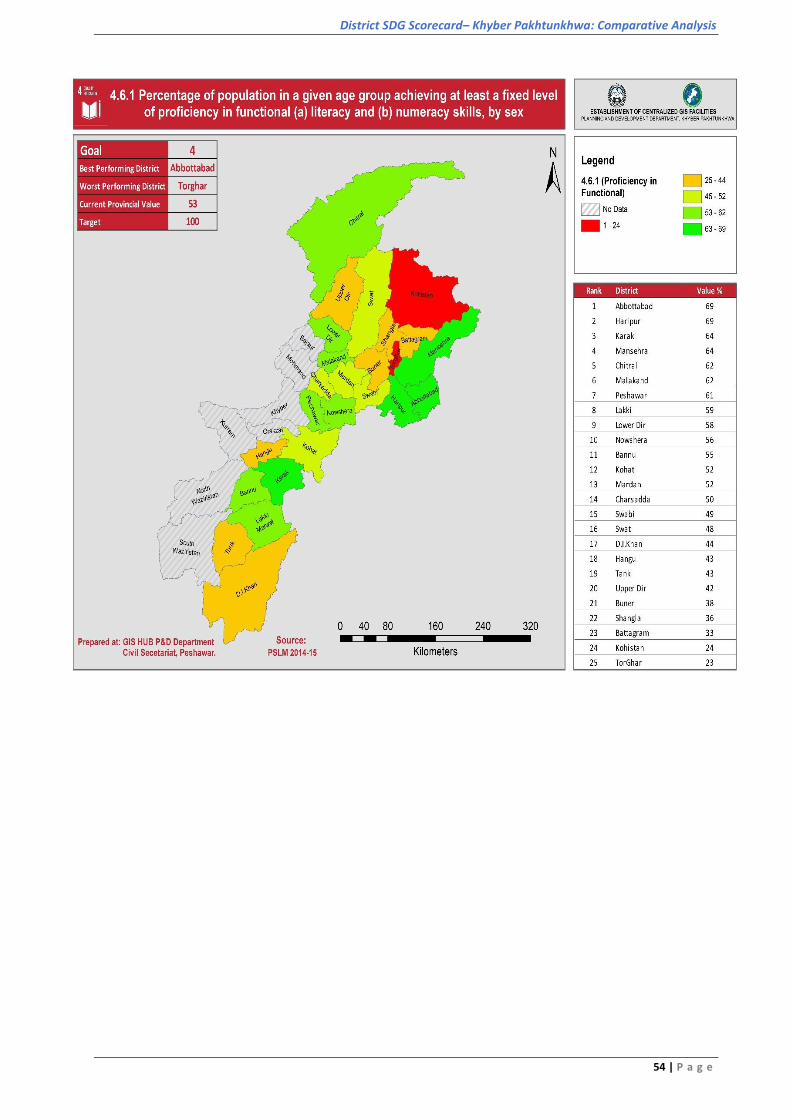
SDG-5: Achieve gender equality and empower all women and girls
Target: 5.3: Eliminate all harmful practices, such as child, early and forced marriage
and female genital mutilation.
Indicator: 5.3.1: Proportion of women aged 20-24 years who were married or in a union
before age 15 and before age 18.
Indicator Definition The indicator captures the share of women aged 20-24 years old who were
married before the age of 15
Better-Off & Worse-
Off Districts/regions
The highest number of early child marriages are reported in Kohistan
(62%), Shangla (47.8%), Swat (45%) and Battagram (43%). Districts with
least percentage of child marriages are Abbottabad (16.6) and Haripur
(16.6). The northernly located rural mountainous districts compared to
central and southern city areas (except Kohat) have a clearly higher
percentage of early child marriages. The average value on the indicator for
rural mountain districts (Torghar, Kohistan, Mansehra, Chitral, Batagram,
Swat and Dir Upper) is 42.8% while for central and southern city districts
(urban and urban-rural) (Abbottabad, Haripur, Mansehra, Mardan,
Charsada, Peshawar, Swabi, D.I.Khan, tank and Banu) it is almost half i.e.,
24.37%.
Source: PSLM 2014-15
District SDG Scorecard– Khyber Pakhtunkhwa: Comparative Analysis
56 | P a g e

District SDG Scorecard– Khyber Pakhtunkhwa: Comparative Analysis
57 | P a g e
SDG-5: Achieve gender equality and empower all women and girls
Target-5.b: Enhance the use of enabling technology, in particular information and
communications technology, to promote the empowerment of women
Indicator-5.b.1: Proportion of individuals who own a mobile telephone, by sex (female)
Indicator Description
The indicator is defined as the ‘proportion of individuals who own a mobile
telephone, by sex’ (Male & Female). BY owning a mobile cellular phone
means mobile cellular phone device with at least one active SIM card for
personal use.
Better-Off & Worse-
Off Districts/regions
Mansehra leads the province where 16% of total female population owns
a mobile phone with at least one SIM card followed by Haripur district with
15.5%. The worst performing district is Tank with only 2.3% of its entire
female population owning mobile phone followed by Dir Lower District
with a value of 2.6%. By division, Hazara with an average score of 12.5% is
the best performing division while D.I.Khan Division with 2.7% score is the
worst performing. Data not available for Kohistan, Shangla and Torghar
Source: MICS, 2016-17

District SDG Scorecard– Khyber Pakhtunkhwa: Comparative Analysis
58 | P a g e

District SDG Scorecard– Khyber Pakhtunkhwa: Comparative Analysis
59 | P a g e
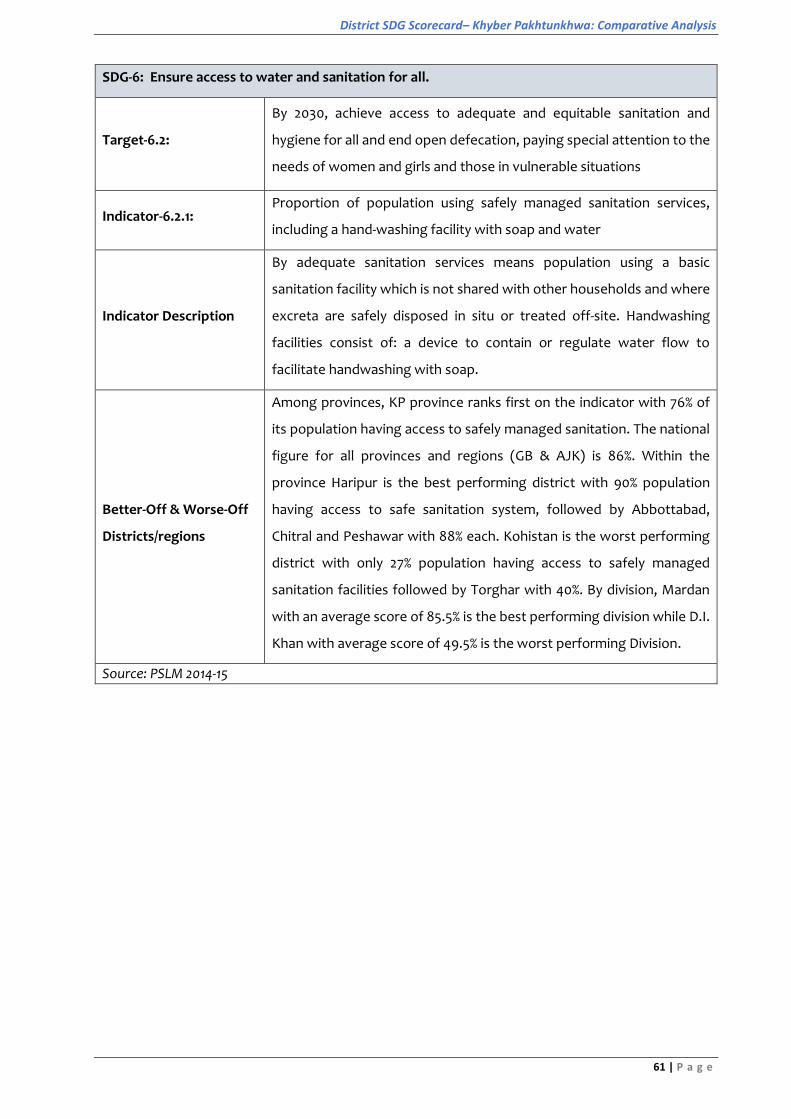
SDG-6: Ensure access to water and sanitation for all.
Target-6.1: By 2030, achieve universal and equitable access to safe and affordable
drinking water for all.
Indicator-6.1.1: Proportion of population using safely managed drinking water services.
Indicator Description A safely managed drinking water service is defined as one located on
premises, available when needed and free from contamination.
Better-Off & Worse-
Off Districts/regions
Despite having rich water resources only 73% (94% Urban & 69% Rural) of
population in Khyber Pakhtunkhwa has access to safely managed drinking
water compared to national average of 84% (PSLM 2014-15). Rural-Urban
disparities in access to clean drinking water is also high. The southernly
located Bannu district with 83% of its population having access to clean
drinking water is the best performing district in the province followed by
Abbottabad and Haripur with 81% each. While northernly located Kohistan
district is the worst performing district with only 8% population having
access to clean drinking water. Region wise, the northern region
(Malakand division) is worst performing region with 55% coverage, while
the central region, Peshawar and Marden divisions, is the best performing
region with 65% coverage.
Source: PSLM 2014-15

District SDG Scorecard– Khyber Pakhtunkhwa: Comparative Analysis
60 | P a g e
District SDG Scorecard– Khyber Pakhtunkhwa: Comparative Analysis
61 | P a g e
SDG-6: Ensure access to water and sanitation for all.
Target-6.2:
By 2030, achieve access to adequate and equitable sanitation and
hygiene for all and end open defecation, paying special attention to the
needs of women and girls and those in vulnerable situations
Indicator-6.2.1: Proportion of population using safely managed sanitation services,
including a hand-washing facility with soap and water
Indicator Description
By adequate sanitation services means population using a basic
sanitation facility which is not shared with other households and where
excreta are safely disposed in situ or treated off-site. Handwashing
facilities consist of: a device to contain or regulate water flow to
facilitate handwashing with soap.
Better-Off & Worse-Off
Districts/regions
Among provinces, KP province ranks first on the indicator with 76% of
its population having access to safely managed sanitation. The national
figure for all provinces and regions (GB & AJK) is 86%. Within the
province Haripur is the best performing district with 90% population
having access to safe sanitation system, followed by Abbottabad,
Chitral and Peshawar with 88% each. Kohistan is the worst performing
district with only 27% population having access to safely managed
sanitation facilities followed by Torghar with 40%. By division, Mardan
with an average score of 85.5% is the best performing division while D.I.
Khan with average score of 49.5% is the worst performing Division.
Source: PSLM 2014-15
District SDG Scorecard– Khyber Pakhtunkhwa: Comparative Analysis
62 | P a g e

District SDG Scorecard– Khyber Pakhtunkhwa: Comparative Analysis
63 | P a g e
SDG-7: Ensure access to affordable, reliable, sustainable, and modern energy for all
Target-7.1: By 2030, ensure universal access to affordable, reliable and modern
energy services
Indicator-7.1.1: Proportion of population with access to electricity
Indicator Description Electricity access in this scenario refers to the proportion of population
in given area that has access to consistent sources of electricity
Better-Off & Worse-Off
Districts/regions
Among the provinces, Khyber Pakhtunkhwa takes leads with highest
percentage of its population (96.2%) having access to electricity against
the national value of 93%. Chitral is the best performing district with
almost 100% (99.8%) population having consistent access to electricity.
Second in the best performing row is Charsada with 99.66% value. The
worst performing district is Torghar with only 68.4% of its population
having access to electricity. Among divisions, Banu is the best
performing division with 99.35% of its population having access to
electricity. While the worst performing division is Hazara with 85.3%
population having access to electricity.
Source: PSLM 2014-15

District SDG Scorecard– Khyber Pakhtunkhwa: Comparative Analysis
64 | P a g e

District SDG Scorecard– Khyber Pakhtunkhwa: Comparative Analysis
65 | P a g e
SDG-7: Ensure access to affordable, reliable, sustainable, and modern energy for all
Target-7.1: By 2030, increase substantially the share of renewable energy in the
global energy mix
Indicator-7.1.2: Renewable energy share in the total final energy consumption (clean
fuel and electricity)
Indicator Description
Renewable energy consumption includes consumption of energy
derived from: hydro, wind, solar, solid biofuels, liquid biofuels, biogas,
natural gas, geothermal, marine and renewable waste.
Better-Off & Worse-Off
Districts/regions
Peshawar is the best performing district with 73.3% energy derived
from clean fuel (gas & electricity) and access to clean technology
followed by Nowshera (54.9%) and Karak (42.76%) districts. Kohistan is
the worst performing district with 0.07% followed by Buner(0.1%). In
general share of clean energy and technology in urban and rural-Urban
areas in Peshawar, Mardan, Kohat and Hazara Division is significantly
high (40.02%) compared to rural-mountain areas in the north (5.6%).
Data not available on Upper Dir and Torghar Districts
Source: PSLM 2014-15
District SDG Scorecard– Khyber Pakhtunkhwa: Comparative Analysis
66 | P a g e
District SDG Scorecard– Khyber Pakhtunkhwa: Comparative Analysis
67 | P a g e
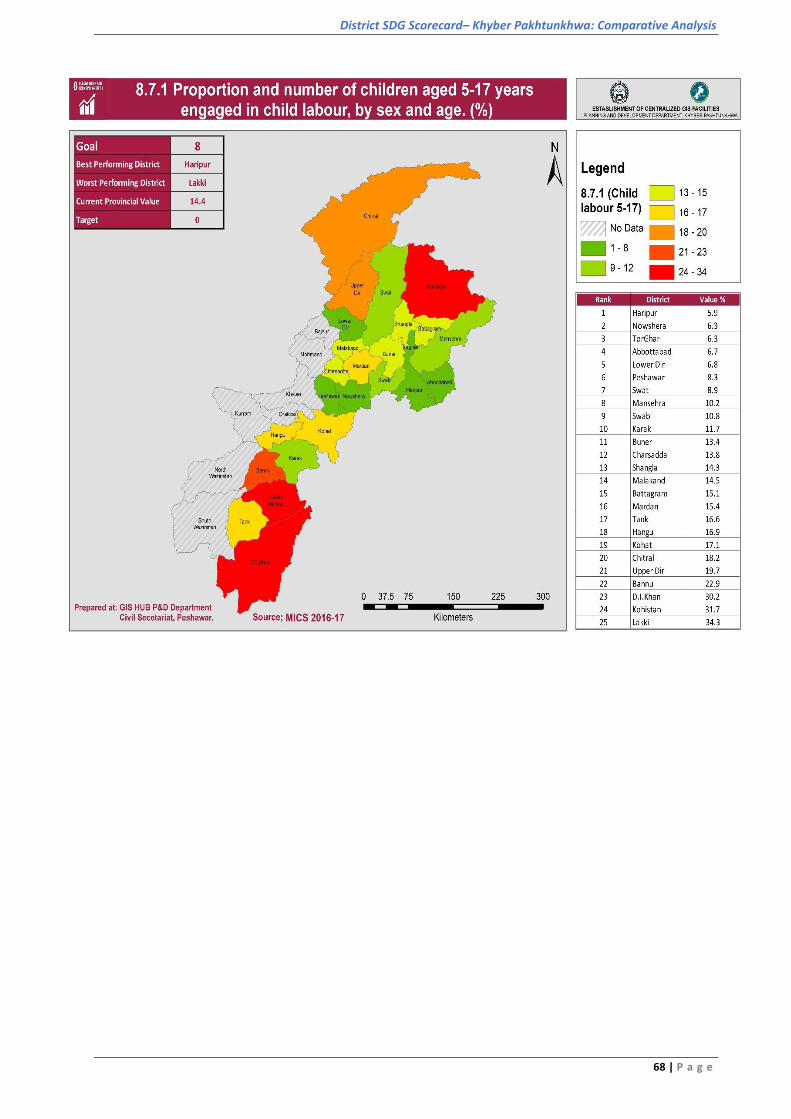
SDG-8: Promote inclusive and sustainable economic growth, employment and decent work for all
Target-8.7:
Take immediate and effective measures to eradicate forced labor, end
modern slavery and human trafficking and secure the prohibition and
elimination of the worst forms of child labor, including recruitment and use
of child soldiers, and by 2025 end child labor in all its forms
Indicator-8.7.1: Proportion and number of children aged 5-17 years engaged in child labor,
by sex and age
Indicator Description
The proportion of children in child labor is calculated as the number of
children in child labor divided by the total number of children in the
population in the given age cohort.
Better-Off & Worse-
Off Districts/regions
Haripur is the best performing district with lowest percentage (5.9%) of
child engaged in labor followed by Nowshera and Torghar with 6.3% each.
The worst performing district is Laki Marwat where 34.3% child are
engaged in Child labor followed by Kohistan 31.7%. In KP the proportion of
child labor is 14.4% against the national figure of 9.6%.
Source: MICS 2016-17
District SDG Scorecard– Khyber Pakhtunkhwa: Comparative Analysis
68 | P a g e

District SDG Scorecard– Khyber Pakhtunkhwa: Comparative Analysis
69 | P a g e
SDG-15: Sustainably manage forests, combat desertification, halt and reverse land degradation, halt biodiversity loss
Target-15.1:
By 2020, ensure the conservation, restoration and sustainable use of
terrestrial and inland freshwater ecosystems and their services, in
particular forests, wetlands, mountains, and drylands, in line with
obligations under international agreements
Indicator-15.1.1: Forest area as a proportion of total land area
Indicator Description Forest area as a proportion of total land area
Better-Off & Worse-Off
Districts/regions
Almost 40% of country’s forests are located in KP. 17% of the total land area
in KP is under forest. Forest cover is highest for northern districts and
lowest in southern districts. Highest forest cover is found in District Upper
Dir with where 33% of total land cover is under forest followed by Shangla
with 32.5%. Forest cover in District Charsada is lowest with only 0.2% land
cover under forest followed by Mardan with only 0.4% forest cover. The
central and extreme southern district of Peshawar, Mardan, D.I.Khan and
Bannu Divisions are very poor in forest cover. Among worst performing
Divisions Bannu takes the lead with 0.5% forest cover followed by D.I.Khan
0.6%, Mardan 1.1% and Peshawar 4.%. Hazara Division with a forest of cover
of 23.48% is the best performing Division followed by Malakand with 20.8%
forest cover.
Source: Crop statistics of KP, 2013-14

District SDG Scorecard– Khyber Pakhtunkhwa: Comparative Analysis
70 | P a g e

District SDG Scorecard– Khyber Pakhtunkhwa: Comparative Analysis
71 | P a g e
SDG-15: Sustainably manage forests, combat desertification, halt and reverse land degradation, halt biodiversity loss
Target-15.1:
By 2020, ensure the conservation, restoration and sustainable use of
terrestrial and inland freshwater ecosystems and their services, in particular
forests, wetlands, mountains, and drylands, in line with obligations under
international agreements
Indicator-15.1.2: Proportion of important sites for terrestrial and freshwater biodiversity that
are covered by protected areas, by ecosystem type.
Indicator
Description
Protected areas, as defined by the IUCN, are clearly defined geographical
spaces, recognized, dedicated, and managed, through legal or other
effective means, to achieve the long-term conservation of nature with
associated ecosystem services and cultural values.
Better-Off & Worse-
Off Districts/regions
Of the total land area 13.4% is under designated Protected Areas of different
categories in Khyber Pakhtunkhwa Province. Kohat with 46% of its total area
under PAs is the best performing district followed by District Chitral with 35%
of its area under PAs. The proportion is lowest for Kohistan where only 1.2%
area is under PAs followed by Tank district with 2%. By Divisions, Malakand is
the best performing with 22% of its total area under Protected Areas
followed by Kohat Division with 19.7%. Bannu is the worst performing
Division with only 4.5% of its land area covered by PAs. Data not available for
Battagram, Charsada, Upper Dir, Peshawar, Shangla & Torghar.
Source: Khyber Pakhtunkhwa Wildlife Department, 2014-15

District SDG Scorecard– Khyber Pakhtunkhwa: Comparative Analysis
72 | P a g e
District SDG Scorecard– Khyber Pakhtunkhwa: Comparative Analysis
73 | P a g e
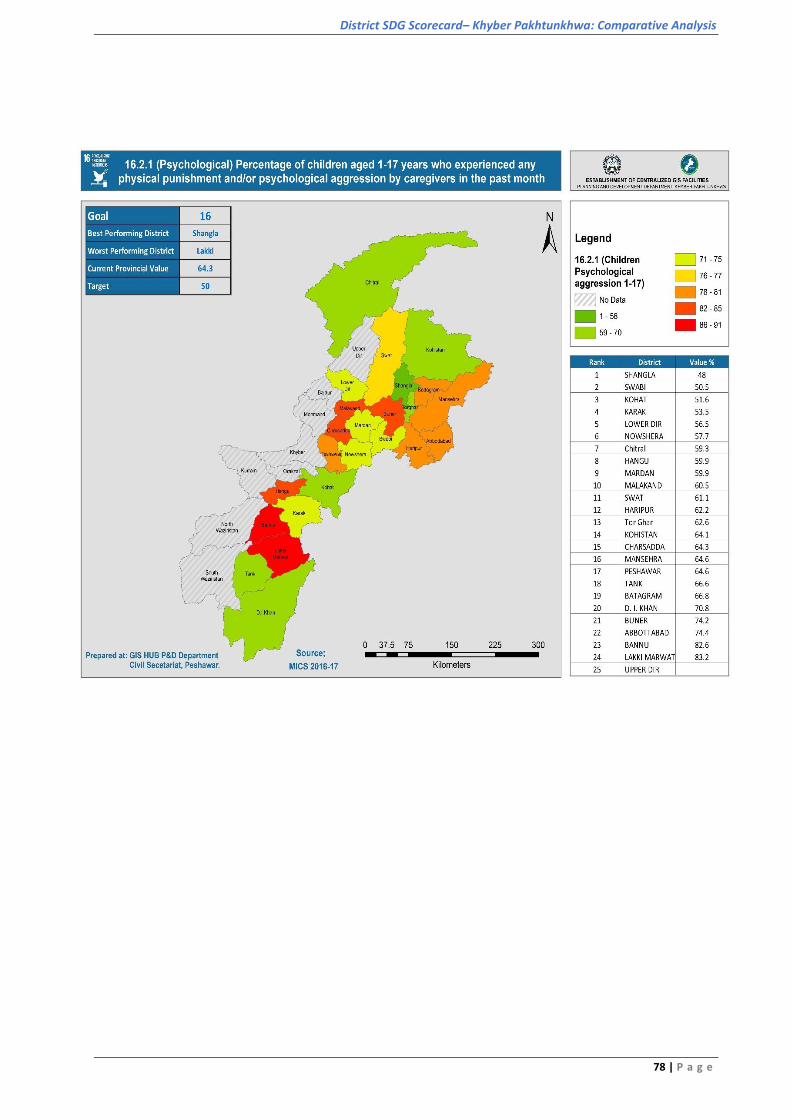
SDG-16: Promote just, peaceful and inclusive societies
Target: 16.2: End abuse, exploitations, trafficking and all forms of violence against
and torture of children
Indicator: 16.2.1:
Percentage of children aged 1-17 years who experienced any physical
punishment and/or psychological aggression by caregivers in the
past month
Indicator Definition
Percentage of children aged 2–14 who according to self-reports by
caregivers, experienced psychological aggression at home in the
past month. In Multiple Indicator Cluster Surveys (MICS),
psychological aggression refers to the action of shouting, yelling, or
screaming at a child, as well as calling a child offensive names, such
as ‘dumb’ or ‘lazy’.
Better-Off & Worse-Off
Districts/regions
District Shangla is at the best performing end on the indicator with
48% followed by Swabi and Kohat with score of 50.5% and 51.6%
respectively while, Lakki and Bannu presents a bleak picture at the
opposite end with 83.2% and 82.6%. No data is available for Dir Upper.
Source: MICS 2016-17
District SDG Scorecard– Khyber Pakhtunkhwa: Comparative Analysis
74 | P a g e
District SDG Scorecard– Khyber Pakhtunkhwa: Comparative Analysis
75 | P a g e
SDG-16: Promote just, peaceful and inclusive societies
Target: 16.2: End abuse, exploitations, trafficking and all forms of violence against
and torture of children
Indicator: 16.2.1:
Percentage of children aged 1-17 years who experienced any physical
punishment and/or psychological aggression by caregivers in the past
month
Indicator Definition
Percentage of children aged 2–14 who according to self-reports by
caregivers, experienced physical Punishment at home in the past
month. In Multiple Indicator Cluster Surveys (MICS), Physical (or
corporal) punishment is an action intended to cause physical pain or
discomfort, but not injuries.
Better-Off & Worse-Off
Districts/regions
District Shangla is at the best performing district in the province with
48% followed by Swabi and Kohat respectively at 50.5% and 51.6%
while, Lakki and Bannu presents the worst performing district with
83.2% and 82.6% respectively. No data is available for Dir Upper.
Source: MICS 2016-17

District SDG Scorecard– Khyber Pakhtunkhwa: Comparative Analysis
76 | P a g e

District SDG Scorecard– Khyber Pakhtunkhwa: Comparative Analysis
77 | P a g e
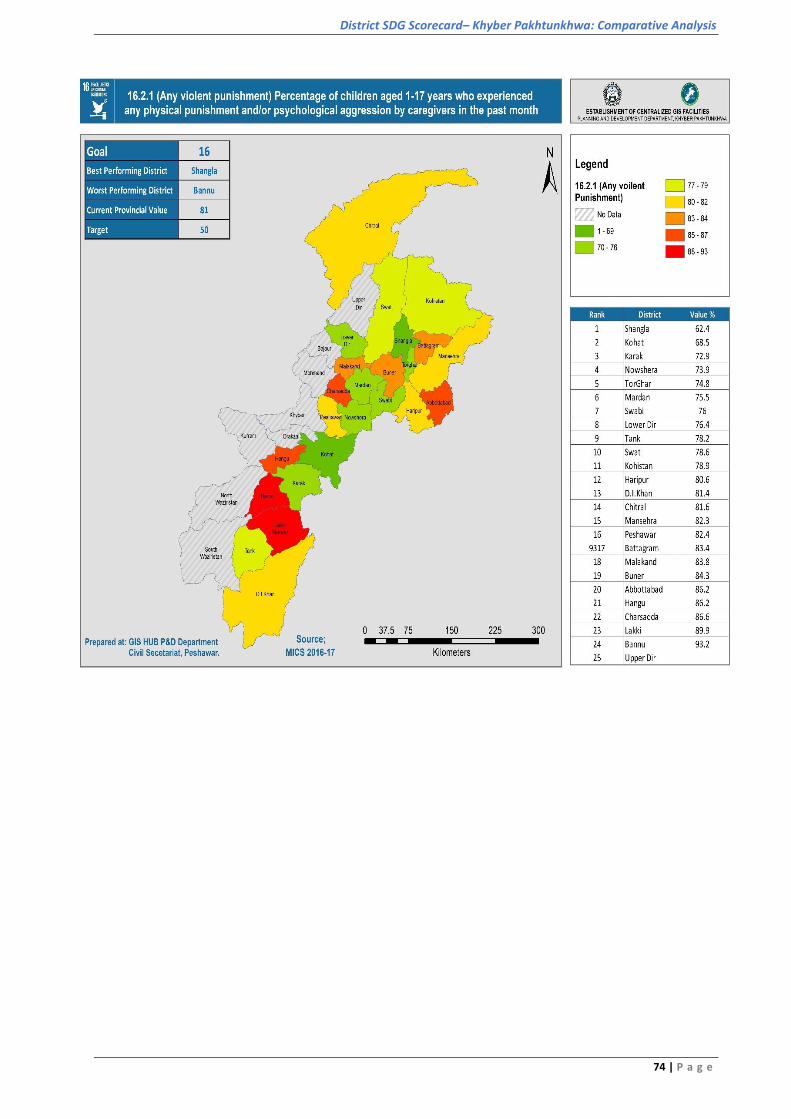
SDG-16: Promote just, peaceful and inclusive societies
Target: 16.2: End abuse, exploitations, trafficking and all forms of violence against
and torture of children
Indicator: 16.2.1:
Percentage of children aged 1-17 years who experienced any physical
punishment and/or psychological aggression by caregivers in the past
month
Indicator Definition
Percentage of children aged 2–14 who according to self-reports by
caregivers, experienced violent punishment at home in the past
month. In Multiple Indicator Cluster Surveys (MICS), Physical violent
punishment is an action intended to cause injuries alongside physical
pain or discomfort.
Better-Off & Worse-Off
Districts/regions
District Shangla in the one with better off data at 62.4% followed by
Kohat and Karak 68.5% and 72.9% respectively while, Bannu and Lakki
are at the worse-off end with 93.2 and 89.9 %. No data is available for
Dir Upper.
Source: MICS 2016-17
District SDG Scorecard– Khyber Pakhtunkhwa: Comparative Analysis
78 | P a g e

District SDG Scorecard– Khyber Pakhtunkhwa: Comparative Analysis
79 | P a g e
SDG-16: Promote just, peaceful and inclusive societies
Target: 16.6: Develop effective, accountable, and transparent institutions at all
levels
Indicator: 16.6.2: Proportion of the population satisfied with their last experience of
public services
Indicator Definition
SDG indicator 16.6.2 aims to generate globally comparable data on
satisfaction with public services. To this end, SDG 16.6.2 focuses on
respondent’s experiences of encountering delivery services at public
office dealing with agriculture sector.
Better-Off & Worse-Off
Districts/regions
100% respondents from Abbottabad and Peshawar who had
experience of encountering delivery services at public office dealing
with agriculture sector are satisfied while, Mardan stands at third with
93.95% satisfied respondents. In case of non-satisfied or least satisfied
respondents Upper Dir tops the list with 14.13% and 20.4% respectively.
No Data Exists for Shangla.
Source: PSLM 2014-15

District SDG Scorecard– Khyber Pakhtunkhwa: Comparative Analysis
80 | P a g e

District SDG Scorecard– Khyber Pakhtunkhwa: Comparative Analysis
81 | P a g e
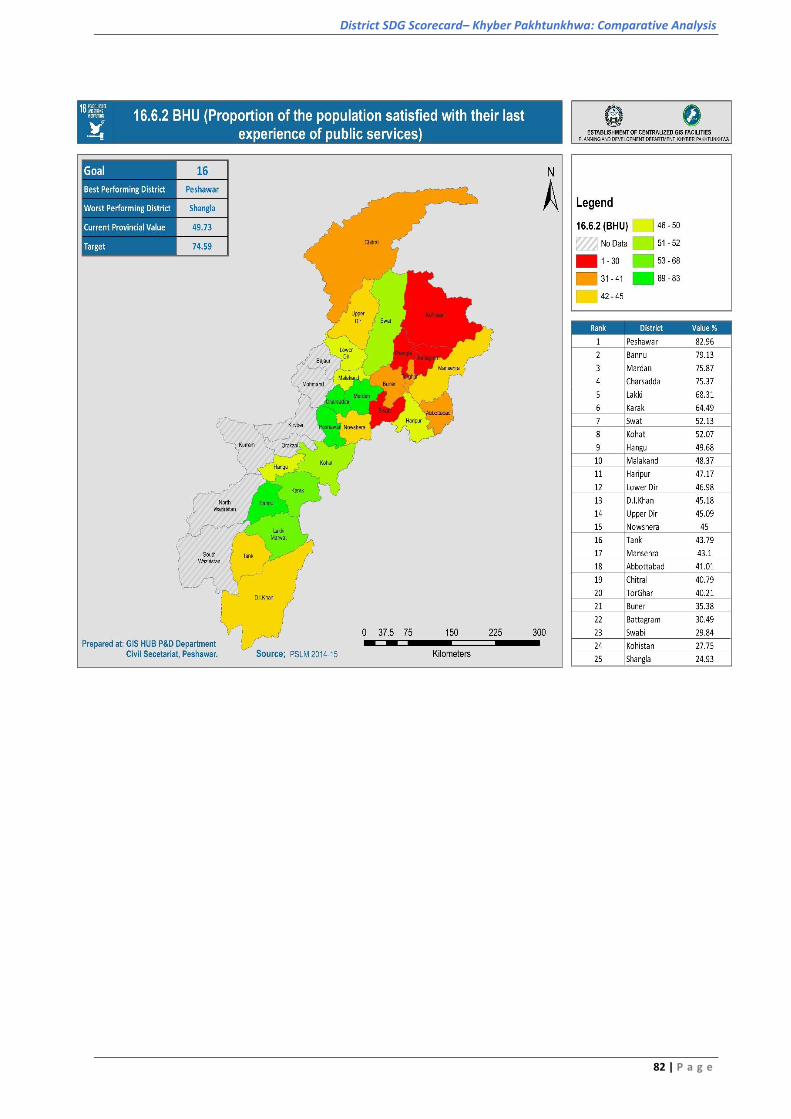
SDG-16: Promote just, peaceful and inclusive societies
Target: 16.6: Develop effective, accountable and transparent institutions at all
levels
Indicator: 16.6.2: Proportion of the population satisfied with their last experience of
public services
Indicator Definition
SDG indicator 16.6.2 aims to generate globally comparable data on
satisfaction with public services. To this end, SDG 16.6.2 focuses
global reporting on service areas of healthcare especially BHU’s.
Better-Off & Worse-Off
Districts/regions
People/population from Peshawar District, Bannu and Mardan
respectively are amongst the most satisfied in terms of service
delivery at BHU at 82.96%, 79.13% and 75.87% while, Shangla, Kohistan
and Swabi starts the list from bottom end 24.93%, 27.75% and 29.84%
respectively.
Source: PSLM 2014-15
District SDG Scorecard– Khyber Pakhtunkhwa: Comparative Analysis
82 | P a g e

District SDG Scorecard– Khyber Pakhtunkhwa: Comparative Analysis
83 | P a g e
SDG-16: Promote just, peaceful and inclusive societies
Target: 16.6: Develop effective, accountable and transparent institutions at all levels
Indicator: 16.6.2: Proportion of the population satisfied with their last experience of
public services
Indicator Definition
SDG indicator 16.6.2 aims to generate globally comparable data on
satisfaction with public services. To this end, SDG 16.6.2 focuses global
reporting on services delivered in context of Family Planning.
Better-Off & Worse-Off
Districts/regions
97.24%, 96.32% and 95.68% respondents from Kohat, Lower Dir and
Mardan who had interacted with public offices for services related to
family planning felt satisfied. In case of non-satisfied or least satisfied
respondents Swabi, Shangla and Tank lies at the bottom extreme with
56.39%, 45.61% and 43.22% respectively.
Source: PSLM 2014-15

District SDG Scorecard– Khyber Pakhtunkhwa: Comparative Analysis
84 | P a g e

District SDG Scorecard– Khyber Pakhtunkhwa: Comparative Analysis
85 | P a g e
SDG-16: Promote just, peaceful and inclusive societies
Target: 16.6: Develop effective, accountable and transparent institutions at all
levels
Indicator: 16.6.2: Proportion of the population satisfied with their last experience of
public services
Indicator Definition
SDG indicator 16.6.2 aims to generate globally comparable data on
satisfaction with public services. To this end, SDG 16.6.2 focuses on
respondents’ experience with the public-school system over the past
12 months.
Better-Off & Worse-Off
Districts/regions
100% respondents from Nowshera and Peshawar who had experience
with Public school system are satisfied while, Mardan stands at third
with 99.75% satisfied respondents. In case of non-satisfied or least
satisfied respondents Kohistan tops the list with 74.22% followed by
Tor Ghar and Dir Upper at 75.17 and 77.39% respectively.
Source: PSLM 2014-15

District SDG Scorecard– Khyber Pakhtunkhwa: Comparative Analysis
86 | P a g e
District SDG Scorecard– Khyber Pakhtunkhwa: Comparative Analysis
87 | P a g e
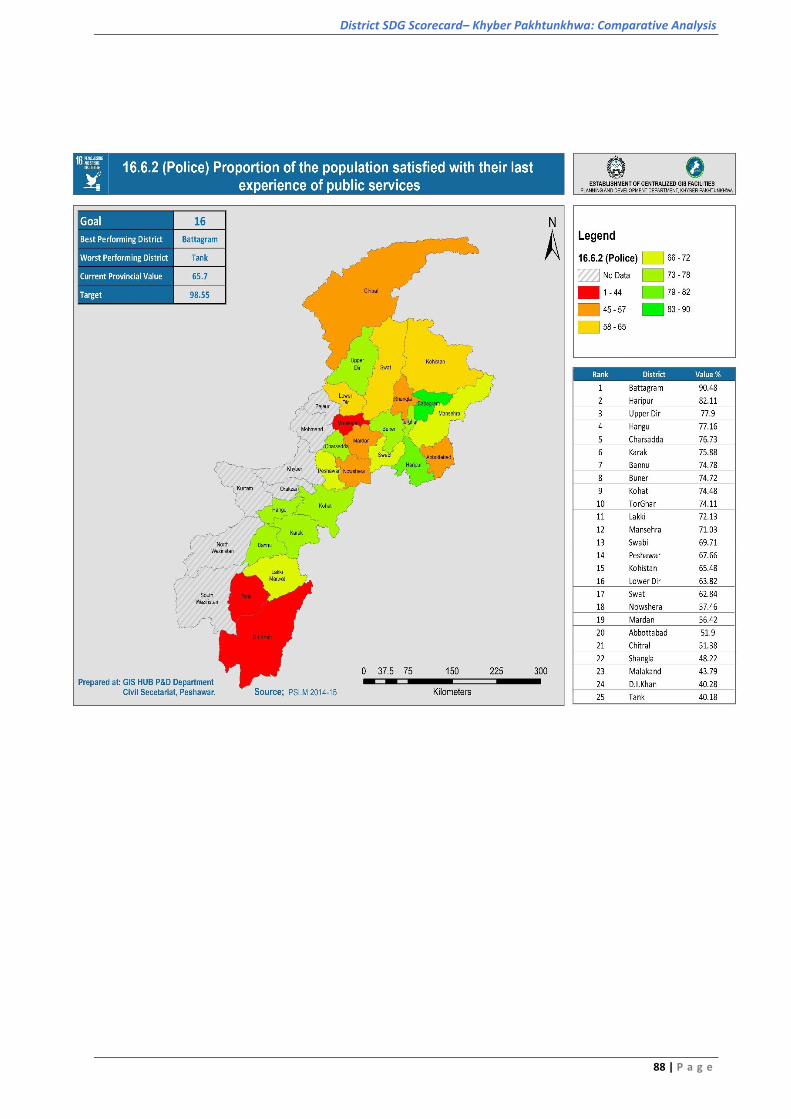
SDG-16: Promote just, peaceful and inclusive societies
Target: 16.6: Develop effective, accountable and transparent institutions at all
levels
Indicator: 16.6.2: Proportion of the population satisfied with their last experience of
public services
Indicator Definition
SDG indicator 16.6.2 aims to generate globally comparable data on
satisfaction with public services. To this end, SDG 16.6.2 focuses global
reporting on services delivered at Police Stations.
Better-Off & Worse-Off
Districts/regions
90.48%, 82.11% and 77.9% respondents from Battagram, Haripur and Dir
Upper respectively who came into interaction with police felt satisfied.
In case of non-satisfied or least satisfied respondents Tank is at top
with 40.18%, followed by D.I. Khan at 40.28% and Malakand at 43.79%.
Source: PSLM 2014-15
District SDG Scorecard– Khyber Pakhtunkhwa: Comparative Analysis
88 | P a g e
District SDG Scorecard– Khyber Pakhtunkhwa: Comparative Analysis
89 | P a g e
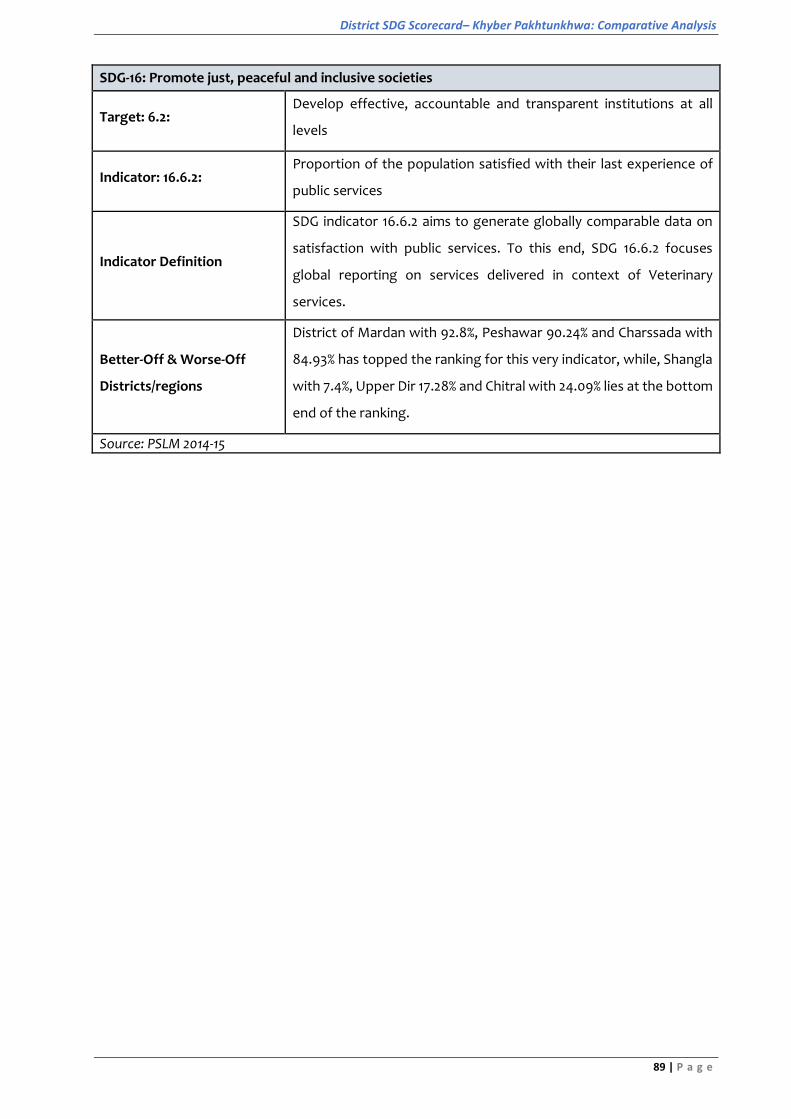
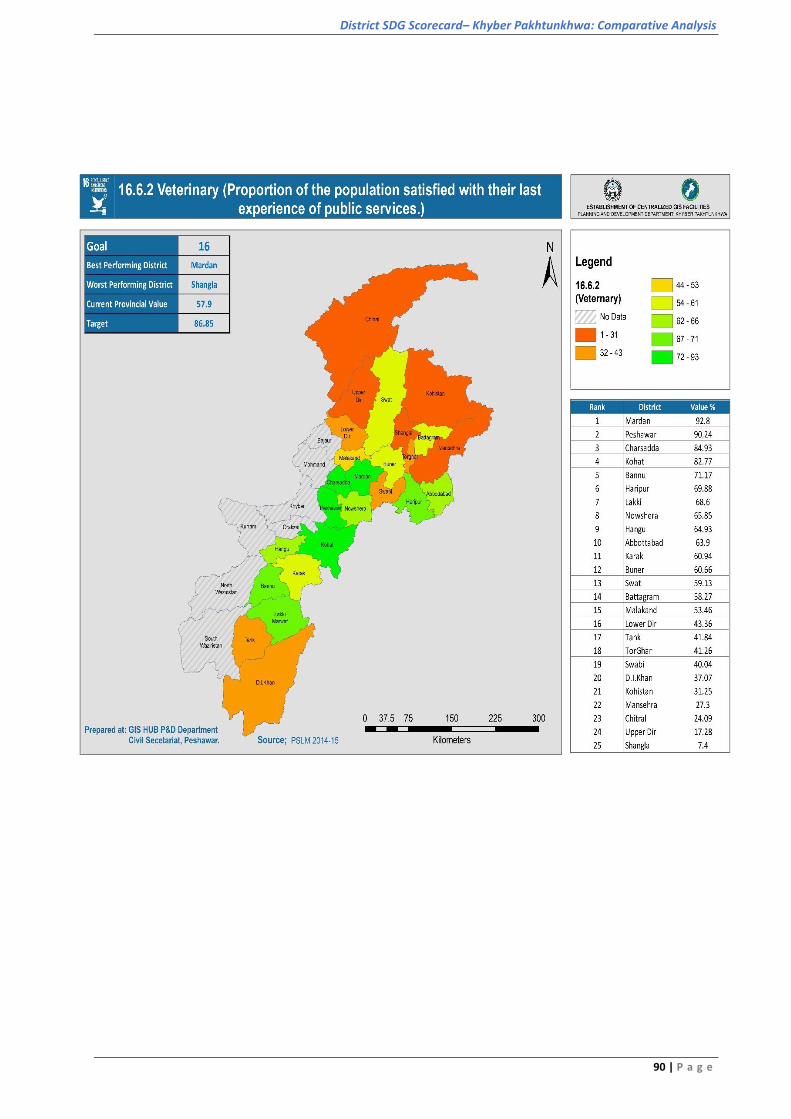
SDG-16: Promote just, peaceful and inclusive societies
Target: 6.2: Develop effective, accountable and transparent institutions at all
levels
Indicator: 16.6.2: Proportion of the population satisfied with their last experience of
public services
Indicator Definition
SDG indicator 16.6.2 aims to generate globally comparable data on
satisfaction with public services. To this end, SDG 16.6.2 focuses
global reporting on services delivered in context of Veterinary
services.
Better-Off & Worse-Off
Districts/regions
District of Mardan with 92.8%, Peshawar 90.24% and Charssada with
84.93% has topped the ranking for this very indicator, while, Shangla
with 7.4%, Upper Dir 17.28% and Chitral with 24.09% lies at the bottom
end of the ranking.
Source: PSLM 2014-15
District SDG Scorecard– Khyber Pakhtunkhwa: Comparative Analysis
90 | P a g e

District SDG Scorecard– Khyber Pakhtunkhwa: Comparative Analysis
91 | P a g e
SDG-16: Promote just, peaceful and inclusive societies
Target: 16.9: By 2030, provide legal identity for all, including birth registration
Indicator: 16.9.1: Proportion of children under 5 years of age whose births have been
registered with a civil authority, by age
Indicator Definition
Birth registration is defined as ‘the continuous, permanent and
universal recording, within the civil registry, of the occurrence and
characteristics of births in accordance with the legal requirements of
a country.
Better-Off & Worse-Off
Districts/regions
Haripur has topped the list of districts with 54.1% of children registered
before attaining the age of five followed by Kohat with 45.3% and
Abbottabad with 42%. Kohistan is district which is on lowest side
where only 1.5% of children are registered before 5 years of age
followed by Shangla with 2.4 % and Upper Dir with 3.5%.
Source: MICS 2016-17

District SDG Scorecard– Khyber Pakhtunkhwa: Comparative Analysis
92 | P a g e

District SDG Scorecard– Khyber Pakhtunkhwa: Comparative Analysis
93 | P a g e
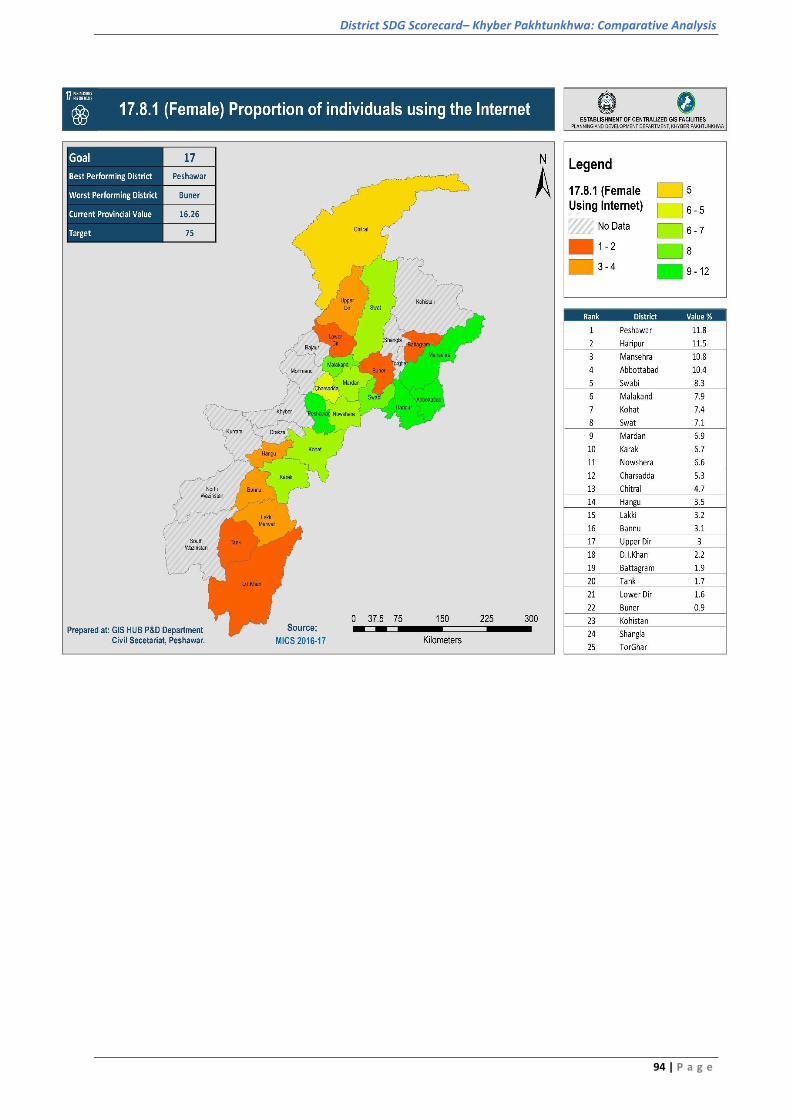
SDG-17: Revitalize the global partnership for sustainable development
Target: 17.8:
Fully operationalize the technology bank and science, technology
and innovation capacity-building mechanism for least developed
countries by 2017 and enhance the use of enabling technology, in
particular information and communications technology
Indicator: 17.8.1: Proportion of individuals using the Internet
Indicator Definition
The indicator proportion of Female individuals using the Internet is
defined as the proportion of individuals who used the Internet from
any location in the last three months.
Better-Off & Worse-Off
Districts/regions
The better off district where female Individuals use the internet in
terms of ranking from the top are Peshawar 11.8%, Haripur 11.5% and
Manshera 10.8% while the district with least usage of Internet
amongst the female individuals are Bannu 0.9%, Lower Dir 1.6% and
Tank 1.7%.
Source: MICS 2016-17
District SDG Scorecard– Khyber Pakhtunkhwa: Comparative Analysis
94 | P a g e