A Guidebook for Assessing SDG Investment Needs - United ...
131
A Guidebook for Assessing SDG Investment Needs
-
Upload
khangminh22 -
Category
Documents
-
view
1 -
download
0
Transcript of A Guidebook for Assessing SDG Investment Needs - United ...

A Guidebook for Assessing SDG Investment Needs
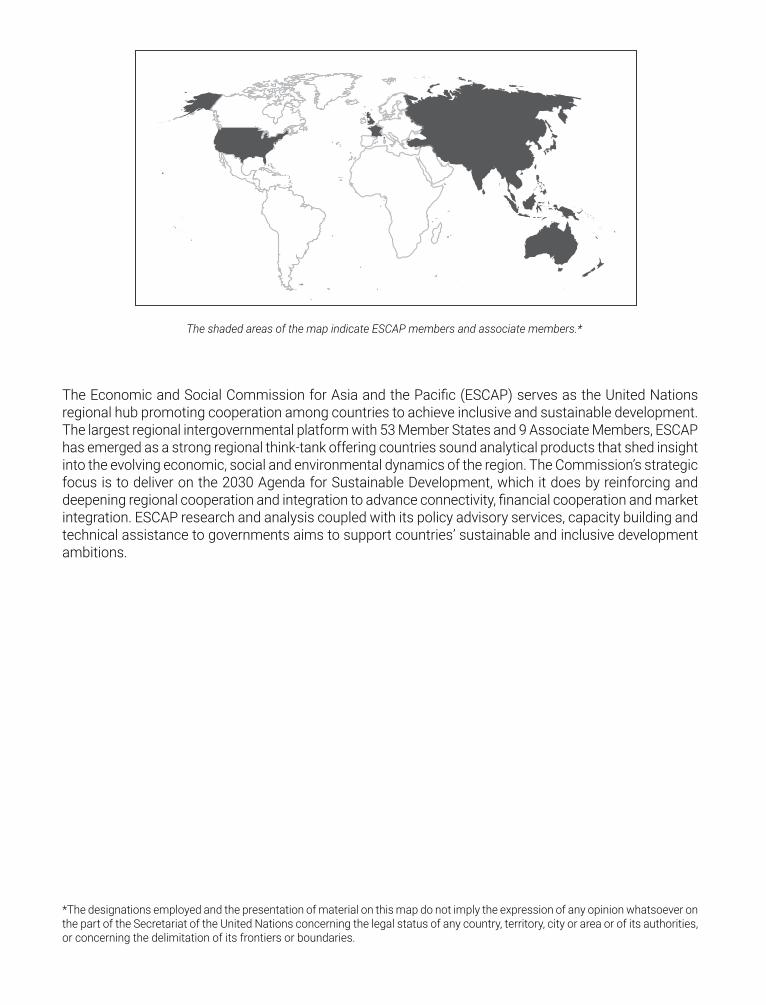
The shaded areas of the map indicate ESCAP members and associate members.*
The Economic and Social Commission for Asia and the Pacific (ESCAP) serves as the United Nations regional hub promoting cooperation among countries to achieve inclusive and sustainable development. The largest regional intergovernmental platform with 53 Member States and 9 Associate Members, ESCAP has emerged as a strong regional think-tank offering countries sound analytical products that shed insight into the evolving economic, social and environmental dynamics of the region. The Commission’s strategic focus is to deliver on the 2030 Agenda for Sustainable Development, which it does by reinforcing and deepening regional cooperation and integration to advance connectivity, financial cooperation and market integration. ESCAP research and analysis coupled with its policy advisory services, capacity building and technical assistance to governments aims to support countries’ sustainable and inclusive development ambitions.
*The designations employed and the presentation of material on this map do not imply the expression of any opinion whatsoever on the part of the Secretariat of the United Nations concerning the legal status of any country, territory, city or area or of its authorities, or concerning the delimitation of its frontiers or boundaries.

A Guidebook for Assessing SDG
Investment Needs

United Nations publicationCopyright © United Nations 2020All rights reservedST/ESCAP/2914
Photo credits: Cover: IStockphoto.com/ RomoloTavani; Chapter 1: Pexels.com/ Long-Exposure Shot Of Buildings And Train by Benjamin Cruz; Section B: Thanakorn.P/Shutterstock.com; Chapter 2: Goal 1: hadynyah/iStockphoto.com; Goal 2: Rawpixel.com/Shutterstock.com; Goal 3: Anna Shvets/Person With a Face Mask and Latex Gloves Holding a Globe/Pexels.com; Goal 4: Stephane Bidouze/Shutterstock.com; Goal 5: John Isaac/UN Photos; Goal 6: Romana/UN Photos; Goal 7: Pom669/iStockphoto.com; Goal 9: ipopba/iStockphoto.com; Goal 12: johny007pan/iStockphoto.com; Goal 13: leolintang/iStockphoto.com; Goal 14&15: LFPuntel/iStockphoto.com; Goal 16: PeopleImages/iStockphoto.comGraphic design layout by Adrianne Shreves.
This publication may be reproduced in whole or in part for educational or non-profit purposes without special permission from the copyright holder, provided that the source is acknowledged. The ESCAP Publications Office would appreciate receiving a copy of any publication that uses this publication as a source.
No use may be made of this publication for resale or any other commercial purpose whatsoever without prior permission. Applications for such permission, with a statement of the purpose and extent of reproduction, should be addressed to the Secretary of the Publications Board, United Nations, New York.
A Guidebook for Assessing SDG Investment Needs


A Guidebook for Assessing SDG Investment Needs
About the Guidebook
While much progress has been made in mainstreaming the Sustainable Development Goals into national development plans and strategies, what is often lacking is an assessment of the financial resources required to implement them.
As we embark on the Decade of Action, this Guidebook aims to provide practical guidance for policy makers and other stakeholders on how to estimate the investment needs for achieving the Goals. It builds on the analytical framework used in ESCAP’s Economic and Social Survey of Asia and the Pacific 2019: Ambitions beyond Growth, which estimated that an additional investment of $1.5 trillion per year would enable Asia-Pacific developing countries to achieve the Goals by 2030. The Guidebook has benefited from valuable insights shared by experts and policy makers at two regional workshops in 2018 and 2019. It comes with an online dashboard on SDG investment trends.
This Guidebook aims to support countries in their implementation of the Integrated National Financing Frameworks (INFFs), an initiative led by the Inter-Agency Task Force on Financing for Development (IATF), chaired by the Under-Secretary-General of UN-DESA and of which ESCAP is a member. The IATF is leading work on the development of global guidance materials for the implementation of INFFs, including a module on costing national sustainable development priorities.
UNDP’s upcoming Guidance Note on SDG costing is complementary to this work, providing countries with guidance on various approaches to costing given varying capacities and different contexts; a review of approaches and the ways that these have been incorporated into national policy cycles and for supporting more effective SDG financing and policymaking; and examples from governments across Asia-Pacific for how they are estimating the costs of achieving the SDGs, national plans and COVID19 recovery.
Acknowledgements
This Guidebook has been prepared by ESCAP’s Macroeconomic Policy and Financing for Development Division under the guidance of Hamza Ali Malik, Director, and Sweta C. Saxena, Section Chief. The core team was led by Daniel Jeong-Dae Lee and included Nixie Abarquez, Goksu Aslan, Kiatkanid Pongpanich and Zakaria Zoundi. Colleagues who contributed to earlier drafts or provided new inputs include: Shuvojit Banerjee, Jyoti Bisbey, Zhenqian Huang, Zheng Jian, Vatcharin Sirimaneetham, and Yusuke Tateno. Arman Bidarbakhtnia and Dayyan Shanyani of ESCAP’s Statistics Division shared the findings on SDG progress assessment. The Guidebook benefited from a broad research collaboration, with experts from various UN agencies and other international organizations sharing inputs to and reviewing earlier drafts; please see the list of contributors to the ESCAP Survey 2019; additional inputs were shared by Satoko Yano and Santosh Khatri of UNESCO and Cecilia Caio of UN-DESA. For further information, please contact ESCAP’s Macroeconomic Policy and Financing for Development at email [email protected]

Page ContentsChapter 1. Overview 1
Section A. Costing rationale, scope and experiences 2
Are we on track to achieve the Goals? 2
How can costing help accelerate SDG progress? 2
How is SDG costing different from other types of costing? 3
What are some conceptual and practical challenges? 4
Which government entities are typically involved? 4
What do global and regional estimates tell us? 5
How do current investments compare to the total needs to achieve the SDGs? 7
Which countries have conducted SDG costing? 7
Section B. Costing steps and approaches 9
What are the typical steps in costing? 9
What are the different methodologies? 11
How can the unit cost approach be applied to different contexts? 13
How do we establish the baseline investment level? 18
How do we move from costing to financing? 19
How to mainstream SDGs into national budgetary process and fiscal policy? 22
What role for the financial sector and private investment? 25

Goal 1 End poverty in all its forms everywhere 29
Goal 2 End hunger, achieve food security and improved nutrition and promote sustainable agriculture 37
Goal 3 Ensure healthy lives and promote well-being for all at all ages 43
Goal 4 Ensure inclusive and equitable quality education and promote lifelong learning opportunities for all 49
Goal 5 Achieve gender equality and empower all women and girls 57
Goal 6 Ensure availability and sustainable management of water and sanitation for all 63
Goal 7 Ensure access to affordable, reliable, sustainable and modern energy for all 71
Goal 9 Build resilient infrastructure, promote inclusive and sustainable industrialization and foster innovation 77
Goal 12 Ensure sustainable consumption and production patterns 87
Goal 13 Take urgent action to combat climate change and its impacts 93
Goals
14 & 15Biodiversity and ecosystems 99
Goal 16Promote peaceful and inclusive societies for sustainable development, provide access to justice for all and build effective, accountable and inclusive institutions at all levels
105
Annex 1 Selected literature review 111
Annex 2 Stakeholder questionnaire 113
Annex 3 Expert group meeting on SDG costing 118
Page
Chapter 2. Goal by Goal 29

A GUIDEBOOK FOR ASSESSING SDG INVESTMENT NEEDS 1
As we embark on the Decade of Action to deliver on the Sustainable Development Goals, there are many chal-lenges. The COVID-19 pandemic poses a severe threat to people’s health and livelihoods. Public health systems are coming under intense pressure and millions are fall-ing back into extreme poverty and hunger. At the same time, in order to meet human needs within the planetary boundaries, there is a great urgency for the world to shift towards sustainable lifestyles and cleaner production technologies.
Addressing such challenges require not only financial resources but also effective planning and sound diagno-sis. Otherwise, we risk placing scarce resources towards low-priority, low-impact areas. At the same time, while many countries have mainstreamed the Global Goals
Figure 1. Building blocks of the Integrated national Financing Frameworks
Source: UN DESA.
CHAPTER 1.OVERVIEW

A GUIDEBOOK FOR ASSESSING SDG INVESTMENT NEEDS2
Are we on track to achieve the Goals?
Based on current trends, the Asia-Pacific region is likely to miss all 17 Goals by 2030 (figure 2). In particular, the region needs to accelerate progress on reduced inequalities (Goal 10) and reverse trends on responsi-ble consumption and production (Goal 12) and climate action (Goal 13) where the region is going backwards. The SDG progress assessment is also available at the target level and for different sub-regions, from the SDG Gateway, a regional platform for data and analysis on the SDGs.
How can costing help accelerate SDG progress?
Accelerating SDG progress requires various inter-ventions, some of which entail significant financial resources (e.g. investments in renewable energy and climate-resilient infrastructure). Understanding the size and composition of the investment needs could help governments develop an ambitious yet realistic financing strategy. It helps match the needs with the right type of public or private financing. Costing can also help channel development assistance to countries and sectors most in need.
Even for Goals whose achievement depends pri-marily on non-monetary factors such as institutional and legislative changes, costing is needed for their implementation; for instance, implementing a new law
on gender equality (Goal 5) may require additional human resources and programmes (e.g. surveys for gender-disaggregated data), with budget implications.
There could be indirect benefits as well. The process of identifying the interventions to be costed, their intended beneficiaries and the responsible service pro-viders could result in improved policy design and imple-mentation. For instance, as SDG-related interventions often cut across the mandates of multiple government ministries and agencies as well as subnational govern-ments, costing could help clarify responsibilities and improve coordination. At the same time, establishing a clear linkage between the resources committed and the expected outcomes could enhance transparency and accountability.
The rationale for SDG costing can be articulated in different ways. For instance, Schmidt-Traub (2015) lays out four points (figure 3). Similarly, the IATF module argues that financing needs assessments can support countries to: strengthen planning, including by serv-ing as a realism check; inform resource mobilization strategies; prioritize allocation of public finance and identify priority areas for private sector investment; enhance engagement and coordination with develop-ment partners and other non-state actors; and provide insight on bottlenecks to progress and misalignment between financing allocations or investments and national development priorities.
COSTING RATIONALE, SCOPE AND EXPERIENCESSECTION A
into their national development plans and strategies, what is often lacking is an assessment of the financial resources required to implement them.
Costing should therefore be viewed as an integral part of effective planning which could also help countries develop an ambitious yet realistic financing strategy. This is recognized in the Integrated National Financing Frameworks. In Figure 1, estimation of the financing needs, together with assessment of the financing landscape, constitutes the core of “assessment and
diagnostics”, which is followed by “financing strategy.” (See the IATF modules on INFF for more details).
This overview chapter starts with key questions on how ‘costing’ could help accelerate SDG progress, and what has been the experience to date. It then highlights gen-eral steps in costing, and the methodologies often used, with a particular focus on how unit cost approach can be applied to SDG priorities such as social protection, education, infrastructure and climate action.

A GUIDEBOOK FOR ASSESSING SDG INVESTMENT NEEDS 3
How is SDG costing different from other types of costing?
The main difference lies in what is costed, and less so in the costing methodology per se. As the 2030 Agenda emphasizes universal access and leaving no one behind, it is important that these are reflected in the targets, scenarios and interventions which are costed. For instance, for Goal 1, social protection costing would look at existing coverage among different population groups and interventions needed to expand coverage, including to those in informal employment. This is in contrast to simply scaling up total social protection
expenditures to a certain level.
Similarly, disaster resilience and environmental sus-tainability could be mainstreamed to areas such as infrastructure development. For instance, for Goal 9, costing for new roads and bridges could account for extreme weather events and sea level rise. Goal 7 cost-ing would look at the existing energy mix and apply unit costs for renewables (rather than fossil fuel-based power) in meeting future demand.
From a systemic perspective, SDG costing needs to consider the interlinkages across the Goals. Health
Identification of knowledge gaps, feasibility and scalability of the Goals
Efficient design of public and private contributions to investment needs
Quality measurement of public expenditure needs and tracking of investment gaps
Identification of external official financing needs to close the gap
Figure 3. Rationale for SDG costing
Source: Schmidt-Traub (2015)
Figure 2. Asia-Pacific region is not on track to achieve the SDGs by 2030
Source: ESCAP SDG Gateway.
Note: The length of each bar shows the progress of the country since 2000. If a bar reaches or crosses the 2019 line, the country has made the expected progress to date. However, whether a Goal can be achieved by 2030 depends not only on the distance traveled so far, but also on the pace of progress going forward.

A GUIDEBOOK FOR ASSESSING SDG INVESTMENT NEEDS4
outcomes (Goal 3), for instance, depend not only on healthcare services but also on nutrition (Goal 2), water and sanitation (Goal 6) and air quality (targets 7.2 and 11.6). Investing in these areas could deliver health co-benefits and in turn reduce health spending needs. At the same time, unless countries ensure that progress in one area does not come at the expense of another, overall investment needs to achieve the SDGs may increase.
What are some conceptual and practical challenges?
Some Goals do not have clear numerical targets, leav-ing room for subjective judgement (e.g. “nationally appropriate” social protection systems in target 1.3 or “improve progressively” global resource efficiency in 8.3, as compared with “eradicate” extreme poverty in 1.1 or “ensure universal access” to modern energy ser-
vices in 7.1). In some cases, even the optimum level is unclear: How many more roads are needed? These are often addressed through peer benchmarking. For social protection, “nationally appropriate” can be interpreted as applying national poverty lines for benefit levels, rather than the $1.90 per day international threshold.
Establishing a clear baseline is challenging for some sectors, whether in terms of how much countries are investing today or will invest through 2030 under a business-as-usual scenario. For infrastructure sec-tors, most studies rely on gross fixed capital formation, which includes non-infrastructure investments, and for many countries the amount is not disaggregated across sectors. This also calls for better classification and monitoring of SDGs-related investments.
Aggregating investment needs across sectors should consider overlaps and inconsistencies. Given that some Goals share common targets, some overlaps can be addressed in a relatively straightforward manner. An example of how Bangladesh uses the ‘synchronization’ process is highlighted in the UNDP guidance note. To ensure consistency, costing across different sectors could use a common reference year and common pro-jections for key variables such as GDP, population and urbanization.
Quality dimensions of investment cannot be precisely or fully captured in costing. The returns to high-qual-ity, but more expensive, technologies could increase over time and result in lower net costs. There is also significant uncertainty over the future price of such technologies. For such sectors as ICT and water and
sanitation, Chapter 2 shows how developing low- and high-cost scenarios can help reflect different technol-ogy options and unit costs.
Which government entities are typically involved?
SDG costing can be conducted at different levels of planning and implementation, with the involvement of different actors. Typically, the ministry of planning and economy is responsible for estimating the overall finan-cial resources needed for implementing medium-term national development plans and strategies, and within that context the SDGs as well. This is often based on extensive consultations with sectoral ministries and draws on medium-term sectoral plans and strategies (e.g. education roadmap), which may be aligned with the SDGs to varying degrees. Such medium-term national development plans and sectoral plans are often linked to the budgetary process through medi-um-term expenditure frameworks and other fiscal plan-ning mechanisms managed by the ministry of finance and budget.
At the same time, sectoral ministries are often respon-sible for bottom-up costing of specific SDG-related programmes, activities and projects, to assess the cost-effectiveness of different options and to request for budgetary allocation. The ministry of finance and budget provides guidance and support to sectoral min-istries through budget circulars, standardized unit costs and other relevant information. It could also provide technical assistance to sectoral ministries on costing and budgeting.
In other words, the range of stakeholders involved depends much on the scope of the costing exercise. As highlighted in the IATF module, the needs assessment can be undertaken at various levels and in relation to different timeframes (figure 4). If the focus is on entire development plans and on developing a full INFF then the scope of the exercise should extend to all sources of finance – from those governments directly control (domestic public finance) to those that they can influ-ence through policy (international public finance both on- and off-budget; private finance, both domestic and international). If the focus is narrower, for example on a single sector or intervention, a more limited range of financing sources may suffice in order to assess poten-tial investment gaps and so governments may choose to limit the exercise to a narrower set of resources (e.g. only domestic public). Similarly, with regard to timeframes, governments seeking to cost entire devel-opment plans will have to consider financing needs

A GUIDEBOOK FOR ASSESSING SDG INVESTMENT NEEDS 5
along a longer timeframe compared to those wishing to identify investment gaps to inform annual government budgets or public investment plans.
What do global and regional estimates tell us?
Existing estimates, although they vary in scope and methodology, all point to the need for a considerable boost to future investment to achieve the SDGs, par-ticularly in least developed countries.
Globally, UNCTAD (2014) found that a total of $5-7 tril-lion is needed per year to implement the Goals, with the investment gap being $2.5 trillion for developing
countries. For the world’s low-income and lower mid-dle-income countries, Schmidt-Traub (2015) estimated total investment needs of $1.4 trillion. More recently, Gasper et al. (2019) found that delivering on the SDG agenda will require additional investment in 2030 of $0.5 trillion for low-income developing countries and $2.1 trillion for emerging market economies; Sachs et al. (2019) provided similar estimates for low income developing countries. In terms of the minimum public spending for SDGs, Kharas and McArthur (2019) pro-vided estimates by sector and income group (table 1).
For the Asia-Pacific region, prior to the adoption of SDGs, ESCAP (2013) estimated total investment needs of $0.5-0.8 trillion per year for achieving social
Table 1. SDG investment needs, by sector and income groupper person per year, in US$
Income GroupSector Low Lower-middle Upper-middle All DevelopingAgriculture & rural development
44 28 195 97
Health 91 124 289 186
Education 57 139 525 284
Social spending 67 78 799 367Energy 10 65 327 164Flood protection 6 11 32 19Transportation 26 62 248 133Water and sanitation 21 18 68 39Biodiversity conservation 6 6 7 6Access to justice 15 54 70 56TOTAL 344 583 2559 1349
Source: Kharas and McArthur (2019)
Figure 4. Possible scope of the costing exercise
All typesof finance
Domestic public finance
Short-term financing needs
Long-term financing needs
Major projects (e.g.
infrastructure)
Single sector or thematic plans
Public investment plans
Annual government
budget
Entire national development
plans
Source: UN DESA.

A GUIDEBOOK FOR ASSESSING SDG INVESTMENT NEEDS6
protection, health, education and energy related tar-gets. On the occasion of the adoption of the Addis Ababa Action Agenda, ESCAP (2015), based on exist-ing studies, provided an upper-level estimate of total investment needs of $2.1-2.5 trillion per year. For the Decade of Action, ESCAP (2019) provided the most detailed and comprehensive estimate to date, of addi-tional investment needs of $1.5 trillion per year (figure 5). In line with the 2030 Agenda, the investment package
places a strong emphasis on people and planet, thus covering social protection as well as health and edu-cation and going beyond electricity access to explicitly cost an ambitious shift from fossil fuels to renewables and enhancements in energy efficiency. The study also shows that the size and composition of investment needs vary considerably across sub-regions and coun-try groups.
Figure 5. Annual average investment needs to achieve the SDGs, 2016-2030: Asia-Pacific region
(billions of US dollars in 2016 price)
Percentage of GDP in 2018
Source: ESCAP (2019)
Note: The bottom panel does not show Pacific islands and small island developing States, where costing could be done only partially. Biodiversity investments also are not shown, as geographically disaggregated results are not available.

A GUIDEBOOK FOR ASSESSING SDG INVESTMENT NEEDS 7
How do current investments compare to the total needs to achieve the SDGs?
Globally, UNCTAD (2019) found that current public and private investment flows fall short of the total invest-ment needs for achieving the SDGs, albeit with some variations across sectors. Globally, investment has been increasing in recent years in food and agricul-ture, health, telecommunications, transport infrastruc-ture, climate change mitigation, and biodiversity, but stagnant in power and climate change adaption and declining in education and WASH.
Similarly, Kharas and McArthur (2019) estimated that governments around the world were already spend-ing $21 trillion per year on SDG-related sectors in 2015. However, most of this took place in high-in-come countries, where per capita SDG spending was $12,753, relative to only $115 in low income countries, $267 in lower-middle income countries and $2,220 in upper-middle income countries. While this reflects differences in income levels, per capita SDG public investment is below the estimated minimum require-ment in low income countries and lower-middle income countries.
For each Goal, Chapter 2 contains preliminary assess-ment of current investment trends as well as total needs for countries where data is readily available.
Which countries have conducted SDG costing?
In November 2018, ESCAP sent a questionnaire to national focal points for the Asia-Pacific Forum on Sustainable Development. Out of 44 countries which responded, only four indicated that an assessment of incremental financing needs for all Goals had been conducted, while 17 indicated the availability of assess-ments covering some of the Goals. Ten countries indi-cated that they plan to conduct an assessment (see Annex for details).
Bangladesh published its SDG financing strategy in 2017, which included a needs assessment for all 17 Goals. The total additional cost for the period 2017‒2030 would be the equivalent of about $928 billion, with the largest share accounted for energy, economy and infra-structure related Goals (figure 6). The largest source of financing (42 percent) would come from the private sector, followed by the public sector (34 percent) and other sources. Public finance would primarily target Goals 1, 2, 3, 4, 14, 16 and 17 while private contributions would be key for Goals 7, 8, 9, 11 and 12 and external
financing for Goals 13 and 17. The UNDP guidance note contains more information on how the Bangladesh costing exercise was conducted.
Nepal published its SDG needs assessment and financ-ing strategy in 2017, which consolidated an existing long-term needs assessment and costing work done at the sectoral levels (figure 7). Nepal has also mapped the Goals with the functional classification of the national budget as a way to track SDG-related investments. The DESA module contains more information on how the Nepal costing exercise was conducted.
Figure 6. SDG investment needs: Bangladesh
Source: Government of Bangladesh, SDG Financing Strategy: Bangladesh Perspective, 2017.
Source: Government of Nepal, National Planning Commission, Needs Assessment, Costing and Financing Strategy for SDGs in Nepal, 2018.
Figure 7. SDG investment needs: Nepal

A GUIDEBOOK FOR ASSESSING SDG INVESTMENT NEEDS8
Figure 8. SDG investment needs: IndonesiaSDG investment needs: Intervention scenario Infrastructure investment needs
Source: Government of Indonesia, Roadmap of SDGs Indonesia: Towards 2030; and World Bank, Infrastructure sector assessment program, June 2018.
Indonesia published its SDG national roadmap in 2019, which provided the baseline and intervention scenarios through 2030 for each Goal, and the investment needs estimate for reaching the intervention scenario. Total investment needs would rise to about $400 billion in 2030 under the baseline scenario, and to about $760 billion under the intervention scenario, with educa-tion, health and social protection accounting for more
than half of total needs and infrastructure for nearly a third (figure 8). Separately, detailed infrastructure cost-ing was conducted for the national development plan, which suggests that transport infrastructure accounts for about 40 percent of total needs, followed by energy (27 percent), water and sanitation (16 percent) and housing (10 percent).
Among countries which have conducted a partial assessment of SDG investment needs, Fiji published its climate vulnerability assessment in 2017, which iden-tified 125 measures across five priority areas to build
resilience. An estimated FJ$9.3 billion (about US$4.5 billion) over 10 years is required to finance these inter-ventions (figure 9), in addition to maintenance and operation costs and social protection systems.
Source: World Bank, Climate vulnerability assessment: making Fiji climate resilient, 2017.
Figure 9. Investment needs for climate resilience: Fiji(Total needs over 10 years, FJ$ millions)

A GUIDEBOOK FOR ASSESSING SDG INVESTMENT NEEDS 9
COSTING STEPS AND APPROACHES
Set out the scope of the costing exercise
Choose the appropriate costing methodology
Identify capacity, resource and data requirements
Calculate costs considering different policy scenarios and risks, leaving no one behind and cross-sec-toral synergies
Establish financing gaps and consider the potential role of dif-ferent types of finance to fill them
Figure 10. Steps in costing
Source: UN DESA.
What are the typical steps in costing?
Goal-specific steps are explained in Chapter 2, but here we highlight general steps in costing. There could be different articulations. The IATF module suggests broad steps, with a focus on calculating cost estimates with consideration for different policy scenarios and risks, leaving no one behind, and synergies across outcome areas, sectors or activities (figure 10).
Another example comes from Stenberg and Rajan (2016), whose guidance on health costing is adapted here into general SDG context. It comes in 20 practi-cal steps.
1. Early engagement. Bring up the topic of costing at
the initial stages of planning. In a context where those who are costing are part of the planning pro-cess from the beginning, they will be privy to and have access to the situation analysis data and dis-cussions to get a sense of the key interventions that need to be costed. Initiate a discussion around the resource implications of the various overall policies considered and whether these would fit within the anticipated resource envelope.
2. Prepare. Identify the scope of the costing and the expected outputs, the intended audience (primary users of the cost estimates) and the time frame, in relation to the overall strategic planning pro-cess. Note the deadline: by when do you need the
SECTION B

A GUIDEBOOK FOR ASSESSING SDG INVESTMENT NEEDS10
estimates in a preliminary format and in a final format?
3. Team formation. Set up a coordinating team (typi-cally two to ten people). The team size will depend on the scope of the costing, the anticipated detail of analysis and the time given to complete the work. All members do not necessarily need prior cost-ing experience but there should be at least two or three members who have experience of costing and understand the data requirements. Ensure that the coordinating team will have, within the period of the costing exercise, access to key experts within the different departments of the relevant govern-ment ministries.
4. Budget envelope. Gather information on likely trends in available financing and financial “ceilings” over the planning period (including projections for macroeconomic growth and allocations by sector).
5. Review current bottlenecks. Map and consider planned reforms that may impact the cost struc-ture (e.g. civil servant reforms, service provider payment reforms). What alternate strategies are being considered to address bottlenecks, increase efficiency of current spending, and to make prog-ress toward attaining the concerned SDG targets? Based on discussions to date, what alternative sce-narios could be considered for the plan itself and the related costs?
6. Get buy-in. Conduct an initial briefing to explain the process to decisionmakers and planners (e.g. department heads, district managers, MoF, parlia-mentarians, private sector representatives, donors) in order to gain their buy-in. Present findings of the budget envelope analysis. Discuss and get agree-ment on the directions for the costing and how it relates to the plan, including if possible, several sce-narios to discuss the financial implications of differ-ent policies within the plan. Discuss the importance of investments and how to address existing service delivery bottlenecks.
7. Develop a data collection plan for making the cost projections. A mapping of relevant documents and resource persons should be undertaken upfront. It is helpful to indicate which team members will be responsible for retrieving each data source. In a decentralized setting, reporting systems may be set up such that data are mostly to be managed at the subnational level, with few facilities reporting to the central government. In such case, it may be
necessary to collect at the subnational level.
8. Gather specific inputs from various technical plan-ning units regarding their planned activities and objectives. Where relevant, these discussions should consider possible scenarios that link the programme-specific investment plans to the over-all investment strategies for the concerned SDG. The focus is on getting the assumptions right for cost drivers such as human resources (salaries and other costs), and investments in infrastructure and logistics.
9. Analyse the resource implications of the planned activities and assess overall financial needs. This is the time to assess the potential scope for syner-gies and increased coordination and/or integration between specific programmes and departments, and likely constraints.
10. Modelling impact. When modelling the expected impact of the costed interventions, review the expected outcomes. If a limited impact is projected, discuss with programme experts and consider how investments could be geared towards more effec-tive interventions.
11. First-round. Finalize the first-round analysis of costs, identify the main cost drivers and cross-check the validity of the data relating to cost drivers.
12. Refine fiscal space projections. Obtain and/or develop projections for economic growth and sec-toral allocations, in order to project fiscal space and overall financial space for the duration of the plan (the term “financial space” is used here to define the broader financing context, to include not just the government’s expenditure but also that of the private sector and development partners). This step would be done in collaboration with the MoF.
13. Conduct a mid-term consultation to discuss first-round results, various scenarios for adjusting policies and plans, and assumptions on likely effec-tiveness of strategies in addressing bottlenecks. Brainstorm on cross-cutting issues – e.g. overcom-ing potential workforce shortages; the role of the private sector in service delivery. Discuss the need for prioritization in view of anticipated resource constraints. This could be a three- or four-day workshop involving a broader group of stakehold-ers in order to get buy-in and involvement, and to further discuss the production of implementation scenarios.

A GUIDEBOOK FOR ASSESSING SDG INVESTMENT NEEDS 11
14. Prioritization. Following the workshop, adjust the cost projection as needed, given the discussions on prioritization.
15. Data validation. Engage in overall quality control processes, including subjecting the cost projec-tions to peer review. Organize a data validation workshop to validate the coverage, inputs and outputs for the scenarios with technical counter-parts. Fine-tune the projected costs with inputs from planning units.
16. Map costs to various presentation frameworks, including the country budget formats, to inform future budget allocation discussions.
17. Write a report to document the assumptions, pro-cess and results.
18. Organize a consultation workshop with a broader set of stakeholders (technical and policy) and dis-cuss the SDG-related objectives and the costs at
the same time – along with scenarios for priori-ty-setting in different contexts of growth and/or financial austerity.
19. Update the estimated resource projections as may be needed post the consultation workshop. Undertake updates to the estimates as needed within a dynamic planning environment, and link these processes to midterm reviews and annual plans.
20. Support institutionalization of the above processes.
What are the different methodologies?
Several quantitative approaches have been used to estimate the required financial cost of MDGs and SDGs. There is no consensus on which methodology works best. Partly, this is because there is a trade-off between the ease and rigor of different models. As expected, the methods that are considered easier to implement (such as intervention-based needs assessments and
Table 2. Pros and cons of different costing approaches
Approach Brief description Advantage Disadvantage
Incremental capital-output ratio (ICOR) and other growth models
Estimate the size of fixed investment that is required to achieve a target per capita GDP growth rate, which would in turn reduce poverty to a target level (based on growth-poverty elasticities)
Simple to calculate – Simply extrapolate the past into the future
– Obtaining ICORs is prone to error as it is based on cross-country regressions
– Cannot yield investment needs at a disaggregated level
Simple unit cost estimates or input-output elasticities
Growth regressions on infrastructure to project future infrastructure needs, then compare to current infrastructure stock, and apply a unit cost.
– Simple to calculate – Can be applied to a large group of countries
– Simply extrapolate the past into the future
– Results are sensitive to unit costs
– Cannot take into account synergies, trade-offs and economy-wide effect of SDG investment
Intervention-based needs assessment
Specify interventions (e.g. provision of goods, services or infrastructure) that are required to achieve certain SDGs, then apply relevant unit costs.
– Simple to calculate – Can be highly disaggregated (e.g. rural/urban populations)
– Cannot take into account synergies, trade-offs and economy-wide effect of SDG investment
Computable General Equilibrium
Changes are introduced to CGE model to estimate investment needs for different policy options
– Take into account synergies, trade-offs and economy-wide effect of SDG investment
– Computational complexity – Data requirements
Source: Compiled from Schmidt-Traub (2015).

A GUIDEBOOK FOR ASSESSING SDG INVESTMENT NEEDS12
unit costs) cannot capture some desirable technical aspects of integrated models. In contrast, the methods that can potentially capture spillover effects are rela-tively difficult to calculate and interpret. Table 2 high-lights some of the pros and cons of different costing approaches used in the literature.
Unit cost. Unit cost is the most commonly used approach. It can be applied in most situations. For example, Sachs et al. (2019) applied a series of unit costs to all SDG sectors in estimating the investment needs for low-income developing countries (table 3).
ESCAP’s Survey 2019 used the unit cost approach to estimate the investment needs for several sectors including education, water and sanitation, and ICT. Unit cost is simply the cost incurred to produce a single unit of output; for instance, the cost per fully vacci-nated child, the cost of clean sanitation per house-hold. It takes the total cost to deliver a service and divides it by the number of units (population, house-holds). The advantage of this approach lies in its sim-plicity and capacity to be applied in many situations. However, results depend on good quality data com-piled through cost studies, which could be challenging
Table 3. Unit cost estimates applied in Sachs et al. (2019)
Low-income Countries Lower-middle Income Countries
Sector Per Capita Cost (US$ 2019 prices)
% of GDP (2019)
Per Capita Cost (US$ 2019 prices)
% of GDP (2019)
Health 85.7 10.8 136.9 7.6
Education 122.4 15.8 167.5 9.5
Infrastructure Energy* 30.4 3.9 30.4 1.7
Flood protection* 9.4 1.2 9.4 0.5
Irrigation* 4.1 0.5 4.1 0.2
Transport* 46.0 5.9 46.0 2.6
WASH* 21.2 2.7 21.2 1.2
Telecommunications 5.8 0.8 10.1 0.6
Biodiversity 4.9 0.6 4.9 0.3
Agriculture 9.5 1.2 9.5 0.5
Social protection Child and Orphan Benefits
18.1 2.4 23.0 1.3
Maternity 5.4 0.7 6.5 0.4
Disability 8.1 1.1 13.3 0.8
Pension 12.9 1.7 28.5 1.6
Justice 20.0 2.6 20.0 1.1
Humanitarian 9.3 1.2 9.3 0.5
Data 0.7 0.1 0.7 0.0
Sub-total SDG outlays 414.3 53.3 541.3 30.7
Non-SDG public Expenditures
45.4 5.9 103.1 5.9
Total fiscal expenditures
459.8 59.1 644.4 36.5

A GUIDEBOOK FOR ASSESSING SDG INVESTMENT NEEDS 13
resources-wise. For further discussion, see Chapter 2 section on Goal 5.
Intervention-based needs assessment. The method refers to the cost of specific interventions; for exam-ple, provision of fertilizers to farmers, retrofitting roads and bridges to enhance climate resilience. As can be observed, the approach applies unit costs for each of the specific interventions and therefore has similar pros and cons.
Incremental capital-output ratio (ICOR). The model estimates the size of fixed investment required to achieve a target per capita GDP growth rate, which would, in turn, reduce poverty to a target level. It is derived from cross-sectoral regressions of outputs to investments. ICORs are simple to estimate but their high reliance on extrapolation limits their consider-ation of structural changes. For further discussion, see Chapter 2 section on Goal 1.
Computable General Equilibrium (CGE). CGE uses the underlying behavioral relationship characterized by cost minimization by firms and utility maximization by households to incorporate links between the sector of assessment and the rest of the economy. Including these agents provides information on the extent to which policy measures affect costs, products, and allocation of resources. Therefore, CGE model can be used to estimate investment needs for different policy options. The downside is the data requirement and
computational complexity.1
Impact costing. Impact costing considers calculat-ing the cost of the socio-economic impact of a given problem or intervention. It shows the costs or adverse impacts of taking or not carrying out specific actions to address an issue. As highlighted in Chapter 2 section on Goal 5, this approach is comprehensive and useful in raising awareness of the society on such issues as violence against women.
In SDGs areas several costing tools have been devel-oped by the UN specialized agencies and other orga-nizations. Many of them are derived from the above methods. Table 4 lists examples by Goal. See Chapter 2 for more details.
How can the unit cost approach be applied to different contexts?
The examples below illustrate how unit costs can be applied to selected SDG areas. The first example of social protection also shows how coverage rates can be expanded gradually towards the desired target cov-erage within a given timeframe, and how additional
1 For example, CGE requires social accounting matrices, which are the representation of all transactions and transfers between different production activities, factors of production, and households, corporate sector, and government, within the economy and with respect to the rest of the world.
Table 4. Costing methods: examples of application to the SDGs
Goal What is included in the estimates
Reference/ Name of the model
Logic of the model
Goal 1: No Poverty
Targeted cash transfer (Target 1.1)
Using PovcalNet dataset
A targeted transfer to close the gap between earned incomes and the poverty line.
Social protection floor (Target 1.2 and 1.3)
ILO Social protection floor calculator
A social protection floor to provide: (a) allowances for all children and all orphans; (b) maternity benefits for all women with newborns (4 months); (c) benefits for all persons with severe disabilities; and (d) universal old-age (65+) pensions. The benefit level is set at the national poverty threshold.
Goal 2: Zero Hunger
Nutrition-specific interventions (Target 2.2)
Scaling Up Nutrition (SUN) method
Unit cost × number of people × incremental coverage assumed Nutrition specific interventions include: (a) reduced stunting in children under 5; (b) reducing anaemia in women; (c) increasing the prevalence of exclusive breastfeeding among infants; (d) mitigating impacts of wasting among young children.
Agricultural productivity (Target 2.3)
FAO model The additional investment required is the difference between investments required under the zero-hunger scenario and the business-as-usual scenario developed by FAO.
Source: ESCAP Survey 2019 technical appendix.

A GUIDEBOOK FOR ASSESSING SDG INVESTMENT NEEDS14
Table 4. Costing methods: examples of application to the SDGs
Goal What is included in the estimates
Reference/ Name of the model
Logic of the model
Goal 3: Good Health and Well-being
Universal health coverage (Target 3.8)
WHO, using OneHealth Tool
Quantities x price The framework scales up investment to strengthen health system to reach universal health coverage (UHC).
Goal 4: Quality Education
Universal access to quality education (Target 4.3 and 4.4)
UNESCO model
Unit cost × increased enrolled students Unit cost includes (a) teachers’ salaries (number of teachers are based on teacher to student ratio); (b) non-salary recurrent expenditures; (c) infrastructure and facilities, etc. Quality of education is reflected by teacher to student ratio; drop-out rate; repetition rate, etc.
Goal 6: Clean Water and Sanitation
Universal access to safe and affordable drinking water and ending open defecation (Target 6.1 and 6.2)
Hutton Unit cost × total demand - current spending High and low-cost scenarios are applied. The low-cost scenario refers to the basic level of service where an improved water source is within a 30-minute round trip; the high-cost scenario refers to the “safely managed level” level of service where water and sanitation infrastructure is within the premises.
Goal 7: Affordable and Clean Energy
Universal access to affordable, reliable, and modern electricity(Target 7.1)
IEA World Energy Model
Unit costs × new energy infrastructure demand.
New energy infrastructure demand is based on the projected total energy demand minus existing energy infrastructure.Demand for different type of renewable energies (including solar, wind, hydro, bioenergy etc.) is based on scenarios. Significantly
increase renewable energy’s share in the energy mix (Target 7.2)Universal access to clean cooking solutions (Target 7.1)
Similar method. Different clean cooking solutions include: natural gas, liquefied petroleum gas (LPG), electricity and biogas, or technologies such as improved biomass cookstoves.
Double the rate of improvement in energy efficiency (Target 7.3)
The investment is defined by the additional amount that consumers have to pay for higher energy efficiency. It is the amount that is spent to procure equipment that is more efficient than a baseline, including taxes, freight costs and labour costs that are directly related to an installation. Energy efficiency in industry, buildings and transport sectors are included.
Goal 9: Industry, Innovation and Infrastructure
Significantly increase access to information and communications technology (Target 9.c)
Projection of future demand, and unit costs based on ITU and others
Unit cost × total demand - current spending Total demand is calculated by estimating the total investment required to provide the ICT infrastructure stock needed to meet future demand based on assumptions of urbanization ratio, economic growth for fixed broadband with additions of access to electricity power and power consumption for mobile broadband, second by estimating maintenance and climate change mitigation costs, and third by estimating the current investment levels to derive the investment gap. Country‐level unit costs provided by International Telecommunication Union (ITU).
Goal 11: Sustainable Cities and Communities
Universal access to safe, affordable, accessible and sustainable transport (Target 11.2)
Projection of future demand, following Fay (2003) and others
Unit cost × total demand - current spending Transport includes: (a) paved roads; (b) unpaved roads; and (c) railway. Ports and airports are not included.
Source: ESCAP Survey 2019 technical appendix.

A GUIDEBOOK FOR ASSESSING SDG INVESTMENT NEEDS 15
Table 4. Costing methods: examples of application to the SDGs
Goal What is included in the estimates
Reference/ Name of the model
Logic of the model
Goal 12: Responsible Consumption and Production
Reduce waste generation through prevention, reduction, recycling and reuse (Target 12.5)
Estimate the cost for implementing waste management centers at municipality levels. Each center is a small-scale facility with a processing capacity of 2 to 20 tons of waste per day.
Goal 13: Climate Action
Climate adaptation Mark-ups It uses a mark-up approach based on the investment needs estimated to meet the infrastructure demand, including capital cost, maintenance cost and replacement costs
Climate mitigation IEA World Energy Model
The estimate is the difference between costing for SDG 7 under Sustainable Development Scenario and a business-as-usual scenario, i.e. how much extra investment is needed to meet the 2 degrees target.
Goal 14: Life Below Water
Strategic Plan for Biodiversity 2011-2020 and associated Aichi targets
CBD, BIOFIN Based on the 20 Aichi targets, and the Financing for Nature (UNDP, 2018) with interventions ranging from those aimed at addressing the drivers of biodiversity loss, such as reducing pollution, to protected areas (terrestrial and marine) and reducing habitat loss (forests and wetlands).
Goal 15: Life on LandSource: ESCAP Survey 2019 technical appendix.
versus incremental needs differ. The second exam-ple of infrastructure development shows that different unit costs are needed for capital investment versus operations and maintenance, and that in the absence of a clear numerical target, service demand could be projected using cross-country regressions. Variations of these two examples could be applied to specific Goals in specific contexts. We also highlight additional insights gained from health, education, water and san-itation, and energy costing.
Example 1. Universal social protection floor
This example is based on Duran-Valverde et al. (2019). First, we calculate the cost of a universal social protec-tion floor (SPF), which represents the optimal situation of universal coverage at the desired level of benefits.
Costi,j,t= PCPi,j,t * Benefiti,j,t + Admini,j,t
where:
Costi,j,t stands for the cost in monetary terms of the universal benefit.
PCPi,j,t is the potential covered population (100% for universal coverage)
Benefiti,j,t is the desired average benefit amount
Admini,j,t represents the administrative costs of running the programme.
Sub-index i corresponds to the specific pro-gramme (e.g. child benefit, disability benefit,
social pension), j stands for geographical region, and t stands for time.
Second, we calculate the additional investment need, defined as the difference between the total cost of a universal SPF and the current total expenditure on social assistance, which serves as the baseline expen-diture (BEj,t).
FORMULAS
Section 2 P 22 & 23 EXAMPLE 1
𝐴𝐴𝐴𝐴𝐴𝐴𝐴𝐴𝐴𝐴𝐴𝐴𝐴𝐴𝐴𝐴𝐴𝐴𝐴𝐴𝑗𝑗,𝑡𝑡 = ∑ 𝐶𝐶𝐴𝐴𝐶𝐶𝐴𝐴𝑖𝑖,𝑗𝑗,𝑡𝑡𝑖𝑖
− 𝐵𝐵𝐵𝐵𝑗𝑗,𝑡𝑡
𝐵𝐵𝐵𝐵𝑗𝑗,𝑡𝑡 = 𝐵𝐵𝐵𝐵𝑗𝑗,𝑡𝑡0 ∗ (1 + 𝑝𝑝𝑝𝑝𝑝𝑝̅̅ ̅̅ ̅)𝑡𝑡−𝑡𝑡0
𝐼𝐼𝐴𝐴𝐼𝐼𝑝𝑝𝐼𝐼𝐼𝐼𝐼𝐼𝐴𝐴𝐴𝐴𝐴𝐴𝐴𝐴𝑗𝑗,𝑡𝑡 = ∑ 𝐼𝐼𝐵𝐵𝑖𝑖,𝑗𝑗,𝑡𝑡𝑖𝑖
− 𝐵𝐵𝐵𝐵𝑗𝑗,𝑡𝑡
𝜃𝜃𝑖𝑖,𝑗𝑗 =100% − 𝐼𝐼𝐴𝐴𝑐𝑐𝑖𝑖,𝑗𝑗,𝑡𝑡𝑎𝑎
(2030 − 𝐴𝐴𝑎𝑎)
P 25 EXAMPLE 2 Infrastructure
𝐹𝐹𝑖𝑖,𝑡𝑡 = ∑ 𝐹𝐹𝑖𝑖,𝑡𝑡𝑗𝑗 and
𝑗𝑗
𝐹𝐹𝑖𝑖,𝑡𝑡𝑗𝑗 = max (
𝐼𝐼𝑖𝑖,𝑇𝑇𝑗𝑗 − 𝐼𝐼𝑖𝑖,𝑡𝑡
𝑗𝑗
𝑇𝑇 − 𝐴𝐴 , 0) × 𝐼𝐼𝑖𝑖𝑗𝑗 + 𝐼𝐼𝑖𝑖,𝑡𝑡
𝑗𝑗 × 𝐼𝐼𝑖𝑖𝑗𝑗
𝐼𝐼𝑖𝑖,𝑡𝑡𝑗𝑗 = 𝛼𝛼0
𝑗𝑗 + 𝛼𝛼1𝑗𝑗𝐼𝐼𝑖𝑖,𝑡𝑡−1
𝑗𝑗 + 𝛼𝛼2𝑗𝑗𝑦𝑦𝑖𝑖,𝑡𝑡 + 𝛼𝛼3
𝑗𝑗𝐴𝐴𝑖𝑖,𝑡𝑡 + 𝛼𝛼4𝑗𝑗𝑀𝑀𝑖𝑖,𝑡𝑡 + 𝛼𝛼5
𝑗𝑗𝑈𝑈𝑖𝑖,𝑡𝑡 + 𝛼𝛼6𝑗𝑗𝑃𝑃𝑖𝑖,𝑡𝑡 + 𝛼𝛼7
𝑗𝑗𝐷𝐷𝑖𝑖𝑗𝑗 + 𝛼𝛼8
𝑗𝑗𝐴𝐴,
Goal 5 P 92
𝐶𝐶𝐴𝐴𝐶𝐶𝐴𝐴𝐺𝐺𝐺𝐺 = ∑ {∑ 𝐺𝐺𝐼𝐼𝐴𝐴𝐺𝐺𝑝𝑝𝐼𝐼𝐼𝐼𝑖𝑖,𝑡𝑡 + ∑ 𝐺𝐺𝐼𝐼𝐴𝐴𝑀𝑀𝐴𝐴𝐴𝐴𝐴𝐴𝑗𝑗,𝑡𝑡 𝑞𝑞
𝑗𝑗=1
𝑝𝑝
𝑖𝑖=1}
2030
𝑡𝑡=2016
𝐶𝐶𝐴𝐴𝐶𝐶𝐴𝐴𝑁𝑁𝑇𝑇𝐺𝐺𝐺𝐺 = ∑ ∑ 𝛼𝛼𝑘𝑘,𝑡𝑡𝑁𝑁𝑇𝑇𝐺𝐺𝐵𝐵𝑘𝑘,𝑡𝑡𝑠𝑠
𝑘𝑘=1
2030
𝑡𝑡=2016
Goal 9 P 125
𝐹𝐹𝑖𝑖,𝑡𝑡 = ∑ 𝐹𝐹𝑖𝑖,𝑡𝑡𝑗𝑗 and
𝑗𝑗
𝐹𝐹𝑖𝑖,𝑡𝑡𝑗𝑗 = max (
𝐼𝐼𝑖𝑖,𝑇𝑇𝑗𝑗 − 𝐼𝐼𝑖𝑖,𝑡𝑡
𝑗𝑗
𝑇𝑇 − 𝐴𝐴 , 0) × 𝐼𝐼𝑖𝑖𝑗𝑗 + 𝐼𝐼𝑖𝑖,𝑡𝑡
𝑗𝑗 × 𝐼𝐼𝑖𝑖𝑗𝑗 + max (
𝑈𝑈𝑗𝑗 − 𝐼𝐼𝑖𝑖,𝑇𝑇𝑗𝑗
𝑇𝑇 − 𝐴𝐴 , 0) × 𝐼𝐼𝑖𝑖𝑗𝑗
P 126
𝐼𝐼𝑖𝑖,𝑡𝑡𝑗𝑗 = 𝛼𝛼0
𝑗𝑗 + 𝛼𝛼1𝑗𝑗𝐼𝐼𝑖𝑖,𝑡𝑡−1
𝑗𝑗 + 𝛼𝛼2𝑗𝑗𝑦𝑦𝑖𝑖,𝑡𝑡 + 𝛼𝛼3
𝑗𝑗𝐴𝐴𝑖𝑖,𝑡𝑡 + 𝛼𝛼4𝑗𝑗𝑀𝑀𝑖𝑖,𝑡𝑡 + 𝛼𝛼5
𝑗𝑗𝑈𝑈𝑖𝑖,𝑡𝑡 + 𝛼𝛼6𝑗𝑗𝑃𝑃𝑖𝑖,𝑡𝑡 + 𝛼𝛼7
𝑗𝑗𝐷𝐷𝑖𝑖𝑗𝑗 + 𝛼𝛼8
𝑗𝑗𝐴𝐴,
𝐼𝐼𝑖𝑖,𝑡𝑡𝑗𝑗 = 𝛼𝛼0
𝑗𝑗 + 𝛼𝛼1𝑗𝑗𝐼𝐼𝑖𝑖,𝑡𝑡−1
𝑗𝑗 + 𝛼𝛼2𝑗𝑗𝑦𝑦𝑖𝑖,𝑡𝑡 + 𝛼𝛼3
𝑗𝑗𝐴𝐴𝑖𝑖,𝑡𝑡 + 𝛼𝛼4𝑗𝑗𝑀𝑀𝑖𝑖,𝑡𝑡 + 𝛼𝛼5
𝑗𝑗𝑈𝑈𝑖𝑖,𝑡𝑡 + 𝛼𝛼6𝑗𝑗𝑃𝑃𝑖𝑖,𝑡𝑡 + 𝛼𝛼7
𝑗𝑗𝐷𝐷𝑖𝑖𝑗𝑗 + 𝛼𝛼8
𝑗𝑗𝐴𝐴 + 𝛼𝛼9𝑗𝑗𝐵𝐵𝑝𝑝𝑖𝑖,𝑡𝑡
𝑗𝑗
+ 𝛼𝛼10𝑗𝑗 𝐵𝐵𝐸𝐸𝑖𝑖,𝑡𝑡
𝑗𝑗 + 𝛼𝛼11𝑗𝑗 𝑃𝑃𝐼𝐼𝑖𝑖,𝑡𝑡
𝑗𝑗

A GUIDEBOOK FOR ASSESSING SDG INVESTMENT NEEDS16
Source: Supplementary appendix (Stenberg and others, 2017)
Figure 11. Example of health service scale-up curves
Example 2. Infrastructure
Unlike universal social protection and health coverage, where the beneficiary is identified at the individual or household level, infrastructure services (e.g. transport) are demanded by the general population, both as con-sumption goods by many individuals and as inputs into the production process by firms. The optimum level is also unclear: how many more roads are needed? The SDGs do not provide any numerical targets in this regard. Moreover, providing the services requires a certain level of capital stock and entails operation and maintenance cost. Capital depreciation over time and any damages from natural disasters require replace-ment. All of these aspects need to be considered in estimating investment needs for infrastructure.
A conventional ‘top-down’ approach to forecast infra-structure financing needs is used whereby unit capital costs and unit maintenance costs are applied to pro-jected changes of physical infrastructure stock and to existing stock, respectively. It is assumed that the annual financing needs by 2030 are decomposed and expressed as follows:
FORMULAS
Section 2 P 22 & 23 EXAMPLE 1
𝐴𝐴𝐴𝐴𝐴𝐴𝐴𝐴𝐴𝐴𝐴𝐴𝐴𝐴𝐴𝐴𝐴𝐴𝐴𝐴𝐴𝐴𝐴𝐴𝐴𝐴𝐴𝐴𝐴𝐴𝐴𝐴𝐴𝐴𝐴𝐴𝐴𝐴𝐴𝐴𝑗𝑗𝑗𝑗,𝑡𝑡𝑡𝑡 = �𝐶𝐶𝐶𝐶𝐴𝐴𝐴𝐴𝐶𝐶𝐶𝐶𝐴𝐴𝐴𝐴𝑖𝑖𝑖𝑖,𝑗𝑗𝑗𝑗,𝑡𝑡𝑡𝑡𝑖𝑖𝑖𝑖
− 𝐵𝐵𝐵𝐵𝐵𝐵𝐵𝐵𝑗𝑗𝑗𝑗,𝑡𝑡𝑡𝑡
𝐵𝐵𝐵𝐵𝐵𝐵𝐵𝐵𝑗𝑗𝑗𝑗,𝑡𝑡𝑡𝑡 = 𝐵𝐵𝐵𝐵𝐵𝐵𝐵𝐵𝑗𝑗𝑗𝑗,𝑡𝑡𝑡𝑡0 ∗ (1 + 𝑝𝑝𝑝𝑝𝑝𝑝𝑝𝑝𝑝𝑝𝑝𝑝�����)𝑡𝑡𝑡𝑡−𝑡𝑡𝑡𝑡0
𝐼𝐼𝐼𝐼𝐴𝐴𝐴𝐴𝐼𝐼𝐼𝐼𝑝𝑝𝑝𝑝𝐼𝐼𝐼𝐼𝐼𝐼𝐼𝐼𝐼𝐼𝐼𝐼𝐴𝐴𝐴𝐴𝐴𝐴𝐴𝐴𝐴𝐴𝐴𝐴𝐴𝐴𝐴𝐴𝑗𝑗𝑗𝑗,𝑡𝑡𝑡𝑡 = �𝐼𝐼𝐼𝐼𝐵𝐵𝐵𝐵𝑖𝑖𝑖𝑖,𝑗𝑗𝑗𝑗,𝑡𝑡𝑡𝑡𝑖𝑖𝑖𝑖
− 𝐵𝐵𝐵𝐵𝐵𝐵𝐵𝐵𝑗𝑗𝑗𝑗,𝑡𝑡𝑡𝑡
𝜃𝜃𝜃𝜃𝑖𝑖𝑖𝑖,𝑗𝑗𝑗𝑗 =100% − 𝐼𝐼𝐼𝐼𝐴𝐴𝐴𝐴𝑐𝑐𝑐𝑐𝑖𝑖𝑖𝑖,𝑗𝑗𝑗𝑗,𝑡𝑡𝑡𝑡𝑎𝑎𝑎𝑎
(2030 − 𝐴𝐴𝐴𝐴𝑎𝑎𝑎𝑎)
P 25 EXAMPLE 2 Infrastructure
𝐹𝐹𝐹𝐹𝑖𝑖𝑖𝑖,𝑡𝑡𝑡𝑡 = �𝐹𝐹𝐹𝐹𝑖𝑖𝑖𝑖,𝑡𝑡𝑡𝑡𝑗𝑗𝑗𝑗 and
𝑗𝑗𝑗𝑗
𝐹𝐹𝐹𝐹𝑖𝑖𝑖𝑖,𝑡𝑡𝑡𝑡𝑗𝑗𝑗𝑗 = max�
𝐼𝐼𝐼𝐼𝑖𝑖𝑖𝑖,𝑇𝑇𝑇𝑇𝑗𝑗𝑗𝑗 − 𝐼𝐼𝐼𝐼𝑖𝑖𝑖𝑖,𝑡𝑡𝑡𝑡
𝑗𝑗𝑗𝑗
𝑇𝑇𝑇𝑇 − 𝐴𝐴𝐴𝐴, 0� × 𝐼𝐼𝐼𝐼𝑖𝑖𝑖𝑖
𝑗𝑗𝑗𝑗 + 𝐼𝐼𝐼𝐼𝑖𝑖𝑖𝑖,𝑡𝑡𝑡𝑡𝑗𝑗𝑗𝑗 × 𝐼𝐼𝐼𝐼𝑖𝑖𝑖𝑖
𝑗𝑗𝑗𝑗
𝐼𝐼𝐼𝐼𝑖𝑖𝑖𝑖,𝑡𝑡𝑡𝑡𝑗𝑗𝑗𝑗 = 𝛼𝛼𝛼𝛼0
𝑗𝑗𝑗𝑗 + 𝛼𝛼𝛼𝛼1𝑗𝑗𝑗𝑗𝐼𝐼𝐼𝐼𝑖𝑖𝑖𝑖,𝑡𝑡𝑡𝑡−1𝑗𝑗𝑗𝑗 + 𝛼𝛼𝛼𝛼2
𝑗𝑗𝑗𝑗𝑦𝑦𝑦𝑦𝑖𝑖𝑖𝑖,𝑡𝑡𝑡𝑡 + 𝛼𝛼𝛼𝛼3𝑗𝑗𝑗𝑗𝐴𝐴𝐴𝐴𝑖𝑖𝑖𝑖,𝑡𝑡𝑡𝑡 + 𝛼𝛼𝛼𝛼4
𝑗𝑗𝑗𝑗𝑀𝑀𝑀𝑀𝑖𝑖𝑖𝑖,𝑡𝑡𝑡𝑡 + 𝛼𝛼𝛼𝛼5𝑗𝑗𝑗𝑗𝑈𝑈𝑈𝑈𝑖𝑖𝑖𝑖,𝑡𝑡𝑡𝑡 + 𝛼𝛼𝛼𝛼6
𝑗𝑗𝑗𝑗𝑃𝑃𝑃𝑃𝑖𝑖𝑖𝑖,𝑡𝑡𝑡𝑡 + 𝛼𝛼𝛼𝛼7𝑗𝑗𝑗𝑗𝐷𝐷𝐷𝐷𝑖𝑖𝑖𝑖
𝑗𝑗𝑗𝑗 + 𝛼𝛼𝛼𝛼8𝑗𝑗𝑗𝑗𝐴𝐴𝐴𝐴,
Goal 5 P 92
𝐶𝐶𝐶𝐶𝐴𝐴𝐴𝐴𝐶𝐶𝐶𝐶𝐴𝐴𝐴𝐴𝐺𝐺𝐺𝐺𝐺𝐺𝐺𝐺 = � �� 𝐺𝐺𝐺𝐺𝐼𝐼𝐼𝐼𝐴𝐴𝐴𝐴𝐺𝐺𝐺𝐺𝑝𝑝𝑝𝑝𝐼𝐼𝐼𝐼𝐼𝐼𝐼𝐼𝑖𝑖𝑖𝑖,𝑡𝑡𝑡𝑡 + � 𝐺𝐺𝐺𝐺𝐼𝐼𝐼𝐼𝐴𝐴𝐴𝐴𝑀𝑀𝑀𝑀𝐴𝐴𝐴𝐴𝐴𝐴𝐴𝐴𝐴𝐴𝐴𝐴𝑗𝑗𝑗𝑗,𝑡𝑡𝑡𝑡 𝑞𝑞𝑞𝑞
𝑗𝑗𝑗𝑗=1
𝑝𝑝𝑝𝑝
𝑖𝑖𝑖𝑖=1�
2030
𝑡𝑡𝑡𝑡=2016
𝐶𝐶𝐶𝐶𝐴𝐴𝐴𝐴𝐶𝐶𝐶𝐶𝐴𝐴𝐴𝐴𝑁𝑁𝑁𝑁𝑇𝑇𝑇𝑇𝐺𝐺𝐺𝐺𝐺𝐺𝐺𝐺 = � � 𝛼𝛼𝛼𝛼𝑘𝑘𝑘𝑘,𝑡𝑡𝑡𝑡𝑁𝑁𝑁𝑁𝑇𝑇𝑇𝑇𝐺𝐺𝐺𝐺𝐵𝐵𝐵𝐵𝑘𝑘𝑘𝑘,𝑡𝑡𝑡𝑡
𝑠𝑠𝑠𝑠
𝑘𝑘𝑘𝑘=1
2030
𝑡𝑡𝑡𝑡=2016
Goal 9 P 125
𝐹𝐹𝐹𝐹𝑖𝑖𝑖𝑖,𝑡𝑡𝑡𝑡 = �𝐹𝐹𝐹𝐹𝑖𝑖𝑖𝑖,𝑡𝑡𝑡𝑡𝑗𝑗𝑗𝑗 and
𝑗𝑗𝑗𝑗
𝐹𝐹𝐹𝐹𝑖𝑖𝑖𝑖,𝑡𝑡𝑡𝑡𝑗𝑗𝑗𝑗 = max�
𝐼𝐼𝐼𝐼𝑖𝑖𝑖𝑖,𝑇𝑇𝑇𝑇𝑗𝑗𝑗𝑗 − 𝐼𝐼𝐼𝐼𝑖𝑖𝑖𝑖,𝑡𝑡𝑡𝑡
𝑗𝑗𝑗𝑗
𝑇𝑇𝑇𝑇 − 𝐴𝐴𝐴𝐴, 0� × 𝐼𝐼𝐼𝐼𝑖𝑖𝑖𝑖
𝑗𝑗𝑗𝑗 + 𝐼𝐼𝐼𝐼𝑖𝑖𝑖𝑖,𝑡𝑡𝑡𝑡𝑗𝑗𝑗𝑗 × 𝐼𝐼𝐼𝐼𝑖𝑖𝑖𝑖
𝑗𝑗𝑗𝑗 + max�𝑈𝑈𝑈𝑈𝑗𝑗𝑗𝑗 − 𝐼𝐼𝐼𝐼𝑖𝑖𝑖𝑖,𝑇𝑇𝑇𝑇
𝑗𝑗𝑗𝑗
𝑇𝑇𝑇𝑇 − 𝐴𝐴𝐴𝐴, 0� × 𝐼𝐼𝐼𝐼𝑖𝑖𝑖𝑖
𝑗𝑗𝑗𝑗
P 126
𝐼𝐼𝐼𝐼𝑖𝑖𝑖𝑖,𝑡𝑡𝑡𝑡𝑗𝑗𝑗𝑗 = 𝛼𝛼𝛼𝛼0
𝑗𝑗𝑗𝑗 + 𝛼𝛼𝛼𝛼1𝑗𝑗𝑗𝑗𝐼𝐼𝐼𝐼𝑖𝑖𝑖𝑖,𝑡𝑡𝑡𝑡−1𝑗𝑗𝑗𝑗 + 𝛼𝛼𝛼𝛼2
𝑗𝑗𝑗𝑗𝑦𝑦𝑦𝑦𝑖𝑖𝑖𝑖,𝑡𝑡𝑡𝑡 + 𝛼𝛼𝛼𝛼3𝑗𝑗𝑗𝑗𝐴𝐴𝐴𝐴𝑖𝑖𝑖𝑖,𝑡𝑡𝑡𝑡 + 𝛼𝛼𝛼𝛼4
𝑗𝑗𝑗𝑗𝑀𝑀𝑀𝑀𝑖𝑖𝑖𝑖,𝑡𝑡𝑡𝑡 + 𝛼𝛼𝛼𝛼5𝑗𝑗𝑗𝑗𝑈𝑈𝑈𝑈𝑖𝑖𝑖𝑖,𝑡𝑡𝑡𝑡 + 𝛼𝛼𝛼𝛼6
𝑗𝑗𝑗𝑗𝑃𝑃𝑃𝑃𝑖𝑖𝑖𝑖,𝑡𝑡𝑡𝑡 + 𝛼𝛼𝛼𝛼7𝑗𝑗𝑗𝑗𝐷𝐷𝐷𝐷𝑖𝑖𝑖𝑖
𝑗𝑗𝑗𝑗 + 𝛼𝛼𝛼𝛼8𝑗𝑗𝑗𝑗𝐴𝐴𝐴𝐴,
𝐼𝐼𝐼𝐼𝑖𝑖𝑖𝑖,𝑡𝑡𝑡𝑡𝑗𝑗𝑗𝑗 = 𝛼𝛼𝛼𝛼0
𝑗𝑗𝑗𝑗 + 𝛼𝛼𝛼𝛼1𝑗𝑗𝑗𝑗𝐼𝐼𝐼𝐼𝑖𝑖𝑖𝑖,𝑡𝑡𝑡𝑡−1𝑗𝑗𝑗𝑗 + 𝛼𝛼𝛼𝛼2
𝑗𝑗𝑗𝑗𝑦𝑦𝑦𝑦𝑖𝑖𝑖𝑖,𝑡𝑡𝑡𝑡 + 𝛼𝛼𝛼𝛼3𝑗𝑗𝑗𝑗𝐴𝐴𝐴𝐴𝑖𝑖𝑖𝑖,𝑡𝑡𝑡𝑡 + 𝛼𝛼𝛼𝛼4
𝑗𝑗𝑗𝑗𝑀𝑀𝑀𝑀𝑖𝑖𝑖𝑖,𝑡𝑡𝑡𝑡 + 𝛼𝛼𝛼𝛼5𝑗𝑗𝑗𝑗𝑈𝑈𝑈𝑈𝑖𝑖𝑖𝑖,𝑡𝑡𝑡𝑡 + 𝛼𝛼𝛼𝛼6
𝑗𝑗𝑗𝑗𝑃𝑃𝑃𝑃𝑖𝑖𝑖𝑖,𝑡𝑡𝑡𝑡 + 𝛼𝛼𝛼𝛼7𝑗𝑗𝑗𝑗𝐷𝐷𝐷𝐷𝑖𝑖𝑖𝑖
𝑗𝑗𝑗𝑗 + 𝛼𝛼𝛼𝛼8𝑗𝑗𝑗𝑗𝐴𝐴𝐴𝐴 + 𝛼𝛼𝛼𝛼9
𝑗𝑗𝑗𝑗𝐵𝐵𝐵𝐵𝑝𝑝𝑝𝑝𝑖𝑖𝑖𝑖,𝑡𝑡𝑡𝑡𝑗𝑗𝑗𝑗
+ 𝛼𝛼𝛼𝛼10𝑗𝑗𝑗𝑗 𝐵𝐵𝐵𝐵𝐸𝐸𝐸𝐸𝑖𝑖𝑖𝑖,𝑡𝑡𝑡𝑡
𝑗𝑗𝑗𝑗 + 𝛼𝛼𝛼𝛼11𝑗𝑗𝑗𝑗 𝑃𝑃𝑃𝑃𝐼𝐼𝐼𝐼𝑖𝑖𝑖𝑖,𝑡𝑡𝑡𝑡
𝑗𝑗𝑗𝑗
where Fi,t represents the total annual financing needs for country i at time t; Fj
i,t indicates financing needs for infrastructure type j. The first term indicates the costs induced by the construction of infrastructure stock to
where the baseline is adjusted every year in relation to the average population growth rate (pgr) of the period in order to keep its value in per capita terms.
FORMULAS
Section 2 P 22 & 23 EXAMPLE 1
𝐴𝐴𝐴𝐴𝐴𝐴𝐴𝐴𝐴𝐴𝐴𝐴𝐴𝐴𝐴𝐴𝐴𝐴𝐴𝐴𝐴𝐴𝐴𝐴𝐴𝐴𝐴𝐴𝐴𝐴𝐴𝐴𝐴𝐴𝐴𝐴𝐴𝐴𝐴𝐴𝑗𝑗𝑗𝑗,𝑡𝑡𝑡𝑡 = �𝐶𝐶𝐶𝐶𝐴𝐴𝐴𝐴𝐶𝐶𝐶𝐶𝐴𝐴𝐴𝐴𝑖𝑖𝑖𝑖,𝑗𝑗𝑗𝑗,𝑡𝑡𝑡𝑡𝑖𝑖𝑖𝑖
− 𝐵𝐵𝐵𝐵𝐵𝐵𝐵𝐵𝑗𝑗𝑗𝑗,𝑡𝑡𝑡𝑡
𝐵𝐵𝐵𝐵𝐵𝐵𝐵𝐵𝑗𝑗𝑗𝑗,𝑡𝑡𝑡𝑡 = 𝐵𝐵𝐵𝐵𝐵𝐵𝐵𝐵𝑗𝑗𝑗𝑗,𝑡𝑡𝑡𝑡0 ∗ (1 + 𝑝𝑝𝑝𝑝𝑝𝑝𝑝𝑝𝑝𝑝𝑝𝑝�����)𝑡𝑡𝑡𝑡−𝑡𝑡𝑡𝑡0
𝐼𝐼𝐼𝐼𝐴𝐴𝐴𝐴𝐼𝐼𝐼𝐼𝑝𝑝𝑝𝑝𝐼𝐼𝐼𝐼𝐼𝐼𝐼𝐼𝐼𝐼𝐼𝐼𝐴𝐴𝐴𝐴𝐴𝐴𝐴𝐴𝐴𝐴𝐴𝐴𝐴𝐴𝐴𝐴𝑗𝑗𝑗𝑗,𝑡𝑡𝑡𝑡 = �𝐼𝐼𝐼𝐼𝐵𝐵𝐵𝐵𝑖𝑖𝑖𝑖,𝑗𝑗𝑗𝑗,𝑡𝑡𝑡𝑡𝑖𝑖𝑖𝑖
− 𝐵𝐵𝐵𝐵𝐵𝐵𝐵𝐵𝑗𝑗𝑗𝑗,𝑡𝑡𝑡𝑡
𝜃𝜃𝜃𝜃𝑖𝑖𝑖𝑖,𝑗𝑗𝑗𝑗 =100% − 𝐼𝐼𝐼𝐼𝐴𝐴𝐴𝐴𝑐𝑐𝑐𝑐𝑖𝑖𝑖𝑖,𝑗𝑗𝑗𝑗,𝑡𝑡𝑡𝑡𝑎𝑎𝑎𝑎
(2030 − 𝐴𝐴𝐴𝐴𝑎𝑎𝑎𝑎)
P 25 EXAMPLE 2 Infrastructure
𝐹𝐹𝐹𝐹𝑖𝑖𝑖𝑖,𝑡𝑡𝑡𝑡 = �𝐹𝐹𝐹𝐹𝑖𝑖𝑖𝑖,𝑡𝑡𝑡𝑡𝑗𝑗𝑗𝑗 and
𝑗𝑗𝑗𝑗
𝐹𝐹𝐹𝐹𝑖𝑖𝑖𝑖,𝑡𝑡𝑡𝑡𝑗𝑗𝑗𝑗 = max�
𝐼𝐼𝐼𝐼𝑖𝑖𝑖𝑖,𝑇𝑇𝑇𝑇𝑗𝑗𝑗𝑗 − 𝐼𝐼𝐼𝐼𝑖𝑖𝑖𝑖,𝑡𝑡𝑡𝑡
𝑗𝑗𝑗𝑗
𝑇𝑇𝑇𝑇 − 𝐴𝐴𝐴𝐴, 0� × 𝐼𝐼𝐼𝐼𝑖𝑖𝑖𝑖
𝑗𝑗𝑗𝑗 + 𝐼𝐼𝐼𝐼𝑖𝑖𝑖𝑖,𝑡𝑡𝑡𝑡𝑗𝑗𝑗𝑗 × 𝐼𝐼𝐼𝐼𝑖𝑖𝑖𝑖
𝑗𝑗𝑗𝑗
𝐼𝐼𝐼𝐼𝑖𝑖𝑖𝑖,𝑡𝑡𝑡𝑡𝑗𝑗𝑗𝑗 = 𝛼𝛼𝛼𝛼0
𝑗𝑗𝑗𝑗 + 𝛼𝛼𝛼𝛼1𝑗𝑗𝑗𝑗𝐼𝐼𝐼𝐼𝑖𝑖𝑖𝑖,𝑡𝑡𝑡𝑡−1𝑗𝑗𝑗𝑗 + 𝛼𝛼𝛼𝛼2
𝑗𝑗𝑗𝑗𝑦𝑦𝑦𝑦𝑖𝑖𝑖𝑖,𝑡𝑡𝑡𝑡 + 𝛼𝛼𝛼𝛼3𝑗𝑗𝑗𝑗𝐴𝐴𝐴𝐴𝑖𝑖𝑖𝑖,𝑡𝑡𝑡𝑡 + 𝛼𝛼𝛼𝛼4
𝑗𝑗𝑗𝑗𝑀𝑀𝑀𝑀𝑖𝑖𝑖𝑖,𝑡𝑡𝑡𝑡 + 𝛼𝛼𝛼𝛼5𝑗𝑗𝑗𝑗𝑈𝑈𝑈𝑈𝑖𝑖𝑖𝑖,𝑡𝑡𝑡𝑡 + 𝛼𝛼𝛼𝛼6
𝑗𝑗𝑗𝑗𝑃𝑃𝑃𝑃𝑖𝑖𝑖𝑖,𝑡𝑡𝑡𝑡 + 𝛼𝛼𝛼𝛼7𝑗𝑗𝑗𝑗𝐷𝐷𝐷𝐷𝑖𝑖𝑖𝑖
𝑗𝑗𝑗𝑗 + 𝛼𝛼𝛼𝛼8𝑗𝑗𝑗𝑗𝐴𝐴𝐴𝐴,
Goal 5 P 92
𝐶𝐶𝐶𝐶𝐴𝐴𝐴𝐴𝐶𝐶𝐶𝐶𝐴𝐴𝐴𝐴𝐺𝐺𝐺𝐺𝐺𝐺𝐺𝐺 = � �� 𝐺𝐺𝐺𝐺𝐼𝐼𝐼𝐼𝐴𝐴𝐴𝐴𝐺𝐺𝐺𝐺𝑝𝑝𝑝𝑝𝐼𝐼𝐼𝐼𝐼𝐼𝐼𝐼𝑖𝑖𝑖𝑖,𝑡𝑡𝑡𝑡 + � 𝐺𝐺𝐺𝐺𝐼𝐼𝐼𝐼𝐴𝐴𝐴𝐴𝑀𝑀𝑀𝑀𝐴𝐴𝐴𝐴𝐴𝐴𝐴𝐴𝐴𝐴𝐴𝐴𝑗𝑗𝑗𝑗,𝑡𝑡𝑡𝑡 𝑞𝑞𝑞𝑞
𝑗𝑗𝑗𝑗=1
𝑝𝑝𝑝𝑝
𝑖𝑖𝑖𝑖=1�
2030
𝑡𝑡𝑡𝑡=2016
𝐶𝐶𝐶𝐶𝐴𝐴𝐴𝐴𝐶𝐶𝐶𝐶𝐴𝐴𝐴𝐴𝑁𝑁𝑁𝑁𝑇𝑇𝑇𝑇𝐺𝐺𝐺𝐺𝐺𝐺𝐺𝐺 = � � 𝛼𝛼𝛼𝛼𝑘𝑘𝑘𝑘,𝑡𝑡𝑡𝑡𝑁𝑁𝑁𝑁𝑇𝑇𝑇𝑇𝐺𝐺𝐺𝐺𝐵𝐵𝐵𝐵𝑘𝑘𝑘𝑘,𝑡𝑡𝑡𝑡
𝑠𝑠𝑠𝑠
𝑘𝑘𝑘𝑘=1
2030
𝑡𝑡𝑡𝑡=2016
Goal 9 P 125
𝐹𝐹𝐹𝐹𝑖𝑖𝑖𝑖,𝑡𝑡𝑡𝑡 = �𝐹𝐹𝐹𝐹𝑖𝑖𝑖𝑖,𝑡𝑡𝑡𝑡𝑗𝑗𝑗𝑗 and
𝑗𝑗𝑗𝑗
𝐹𝐹𝐹𝐹𝑖𝑖𝑖𝑖,𝑡𝑡𝑡𝑡𝑗𝑗𝑗𝑗 = max�
𝐼𝐼𝐼𝐼𝑖𝑖𝑖𝑖,𝑇𝑇𝑇𝑇𝑗𝑗𝑗𝑗 − 𝐼𝐼𝐼𝐼𝑖𝑖𝑖𝑖,𝑡𝑡𝑡𝑡
𝑗𝑗𝑗𝑗
𝑇𝑇𝑇𝑇 − 𝐴𝐴𝐴𝐴, 0� × 𝐼𝐼𝐼𝐼𝑖𝑖𝑖𝑖
𝑗𝑗𝑗𝑗 + 𝐼𝐼𝐼𝐼𝑖𝑖𝑖𝑖,𝑡𝑡𝑡𝑡𝑗𝑗𝑗𝑗 × 𝐼𝐼𝐼𝐼𝑖𝑖𝑖𝑖
𝑗𝑗𝑗𝑗 + max�𝑈𝑈𝑈𝑈𝑗𝑗𝑗𝑗 − 𝐼𝐼𝐼𝐼𝑖𝑖𝑖𝑖,𝑇𝑇𝑇𝑇
𝑗𝑗𝑗𝑗
𝑇𝑇𝑇𝑇 − 𝐴𝐴𝐴𝐴, 0� × 𝐼𝐼𝐼𝐼𝑖𝑖𝑖𝑖
𝑗𝑗𝑗𝑗
P 126
𝐼𝐼𝐼𝐼𝑖𝑖𝑖𝑖,𝑡𝑡𝑡𝑡𝑗𝑗𝑗𝑗 = 𝛼𝛼𝛼𝛼0
𝑗𝑗𝑗𝑗 + 𝛼𝛼𝛼𝛼1𝑗𝑗𝑗𝑗𝐼𝐼𝐼𝐼𝑖𝑖𝑖𝑖,𝑡𝑡𝑡𝑡−1𝑗𝑗𝑗𝑗 + 𝛼𝛼𝛼𝛼2
𝑗𝑗𝑗𝑗𝑦𝑦𝑦𝑦𝑖𝑖𝑖𝑖,𝑡𝑡𝑡𝑡 + 𝛼𝛼𝛼𝛼3𝑗𝑗𝑗𝑗𝐴𝐴𝐴𝐴𝑖𝑖𝑖𝑖,𝑡𝑡𝑡𝑡 + 𝛼𝛼𝛼𝛼4
𝑗𝑗𝑗𝑗𝑀𝑀𝑀𝑀𝑖𝑖𝑖𝑖,𝑡𝑡𝑡𝑡 + 𝛼𝛼𝛼𝛼5𝑗𝑗𝑗𝑗𝑈𝑈𝑈𝑈𝑖𝑖𝑖𝑖,𝑡𝑡𝑡𝑡 + 𝛼𝛼𝛼𝛼6
𝑗𝑗𝑗𝑗𝑃𝑃𝑃𝑃𝑖𝑖𝑖𝑖,𝑡𝑡𝑡𝑡 + 𝛼𝛼𝛼𝛼7𝑗𝑗𝑗𝑗𝐷𝐷𝐷𝐷𝑖𝑖𝑖𝑖
𝑗𝑗𝑗𝑗 + 𝛼𝛼𝛼𝛼8𝑗𝑗𝑗𝑗𝐴𝐴𝐴𝐴,
𝐼𝐼𝐼𝐼𝑖𝑖𝑖𝑖,𝑡𝑡𝑡𝑡𝑗𝑗𝑗𝑗 = 𝛼𝛼𝛼𝛼0
𝑗𝑗𝑗𝑗 + 𝛼𝛼𝛼𝛼1𝑗𝑗𝑗𝑗𝐼𝐼𝐼𝐼𝑖𝑖𝑖𝑖,𝑡𝑡𝑡𝑡−1𝑗𝑗𝑗𝑗 + 𝛼𝛼𝛼𝛼2
𝑗𝑗𝑗𝑗𝑦𝑦𝑦𝑦𝑖𝑖𝑖𝑖,𝑡𝑡𝑡𝑡 + 𝛼𝛼𝛼𝛼3𝑗𝑗𝑗𝑗𝐴𝐴𝐴𝐴𝑖𝑖𝑖𝑖,𝑡𝑡𝑡𝑡 + 𝛼𝛼𝛼𝛼4
𝑗𝑗𝑗𝑗𝑀𝑀𝑀𝑀𝑖𝑖𝑖𝑖,𝑡𝑡𝑡𝑡 + 𝛼𝛼𝛼𝛼5𝑗𝑗𝑗𝑗𝑈𝑈𝑈𝑈𝑖𝑖𝑖𝑖,𝑡𝑡𝑡𝑡 + 𝛼𝛼𝛼𝛼6
𝑗𝑗𝑗𝑗𝑃𝑃𝑃𝑃𝑖𝑖𝑖𝑖,𝑡𝑡𝑡𝑡 + 𝛼𝛼𝛼𝛼7𝑗𝑗𝑗𝑗𝐷𝐷𝐷𝐷𝑖𝑖𝑖𝑖
𝑗𝑗𝑗𝑗 + 𝛼𝛼𝛼𝛼8𝑗𝑗𝑗𝑗𝐴𝐴𝐴𝐴 + 𝛼𝛼𝛼𝛼9
𝑗𝑗𝑗𝑗𝐵𝐵𝐵𝐵𝑝𝑝𝑝𝑝𝑖𝑖𝑖𝑖,𝑡𝑡𝑡𝑡𝑗𝑗𝑗𝑗
+ 𝛼𝛼𝛼𝛼10𝑗𝑗𝑗𝑗 𝐵𝐵𝐵𝐵𝐸𝐸𝐸𝐸𝑖𝑖𝑖𝑖,𝑡𝑡𝑡𝑡
𝑗𝑗𝑗𝑗 + 𝛼𝛼𝛼𝛼11𝑗𝑗𝑗𝑗 𝑃𝑃𝑃𝑃𝐼𝐼𝐼𝐼𝑖𝑖𝑖𝑖,𝑡𝑡𝑡𝑡
𝑗𝑗𝑗𝑗
Third, we calculate the incremental investment need to move from current level of coverage to that needed for achieving universal coverage in 2030 by subtract-ing the baseline expenditure from the projection of the incremental expenditure (IEi,j,t) associated with the desired target coverage rate (tcovi,j,t) in each year.
FORMULAS
Section 2 P 22 & 23 EXAMPLE 1
𝐴𝐴𝐴𝐴𝐴𝐴𝐴𝐴𝐴𝐴𝐴𝐴𝐴𝐴𝐴𝐴𝐴𝐴𝐴𝐴𝐴𝐴𝐴𝐴𝐴𝐴𝐴𝐴𝐴𝐴𝐴𝐴𝐴𝐴𝐴𝐴𝐴𝐴𝐴𝐴𝑗𝑗𝑗𝑗,𝑡𝑡𝑡𝑡 = �𝐶𝐶𝐶𝐶𝐴𝐴𝐴𝐴𝐶𝐶𝐶𝐶𝐴𝐴𝐴𝐴𝑖𝑖𝑖𝑖,𝑗𝑗𝑗𝑗,𝑡𝑡𝑡𝑡𝑖𝑖𝑖𝑖
− 𝐵𝐵𝐵𝐵𝐵𝐵𝐵𝐵𝑗𝑗𝑗𝑗,𝑡𝑡𝑡𝑡
𝐵𝐵𝐵𝐵𝐵𝐵𝐵𝐵𝑗𝑗𝑗𝑗,𝑡𝑡𝑡𝑡 = 𝐵𝐵𝐵𝐵𝐵𝐵𝐵𝐵𝑗𝑗𝑗𝑗,𝑡𝑡𝑡𝑡0 ∗ (1 + 𝑝𝑝𝑝𝑝𝑝𝑝𝑝𝑝𝑝𝑝𝑝𝑝�����)𝑡𝑡𝑡𝑡−𝑡𝑡𝑡𝑡0
𝐼𝐼𝐼𝐼𝐴𝐴𝐴𝐴𝐼𝐼𝐼𝐼𝑝𝑝𝑝𝑝𝐼𝐼𝐼𝐼𝐼𝐼𝐼𝐼𝐼𝐼𝐼𝐼𝐴𝐴𝐴𝐴𝐴𝐴𝐴𝐴𝐴𝐴𝐴𝐴𝐴𝐴𝐴𝐴𝑗𝑗𝑗𝑗,𝑡𝑡𝑡𝑡 = �𝐼𝐼𝐼𝐼𝐵𝐵𝐵𝐵𝑖𝑖𝑖𝑖,𝑗𝑗𝑗𝑗,𝑡𝑡𝑡𝑡𝑖𝑖𝑖𝑖
− 𝐵𝐵𝐵𝐵𝐵𝐵𝐵𝐵𝑗𝑗𝑗𝑗,𝑡𝑡𝑡𝑡
𝜃𝜃𝜃𝜃𝑖𝑖𝑖𝑖,𝑗𝑗𝑗𝑗 =100% − 𝐼𝐼𝐼𝐼𝐴𝐴𝐴𝐴𝑐𝑐𝑐𝑐𝑖𝑖𝑖𝑖,𝑗𝑗𝑗𝑗,𝑡𝑡𝑡𝑡𝑎𝑎𝑎𝑎
(2030 − 𝐴𝐴𝐴𝐴𝑎𝑎𝑎𝑎)
P 25 EXAMPLE 2 Infrastructure
𝐹𝐹𝐹𝐹𝑖𝑖𝑖𝑖,𝑡𝑡𝑡𝑡 = �𝐹𝐹𝐹𝐹𝑖𝑖𝑖𝑖,𝑡𝑡𝑡𝑡𝑗𝑗𝑗𝑗 and
𝑗𝑗𝑗𝑗
𝐹𝐹𝐹𝐹𝑖𝑖𝑖𝑖,𝑡𝑡𝑡𝑡𝑗𝑗𝑗𝑗 = max�
𝐼𝐼𝐼𝐼𝑖𝑖𝑖𝑖,𝑇𝑇𝑇𝑇𝑗𝑗𝑗𝑗 − 𝐼𝐼𝐼𝐼𝑖𝑖𝑖𝑖,𝑡𝑡𝑡𝑡
𝑗𝑗𝑗𝑗
𝑇𝑇𝑇𝑇 − 𝐴𝐴𝐴𝐴, 0� × 𝐼𝐼𝐼𝐼𝑖𝑖𝑖𝑖
𝑗𝑗𝑗𝑗 + 𝐼𝐼𝐼𝐼𝑖𝑖𝑖𝑖,𝑡𝑡𝑡𝑡𝑗𝑗𝑗𝑗 × 𝐼𝐼𝐼𝐼𝑖𝑖𝑖𝑖
𝑗𝑗𝑗𝑗
𝐼𝐼𝐼𝐼𝑖𝑖𝑖𝑖,𝑡𝑡𝑡𝑡𝑗𝑗𝑗𝑗 = 𝛼𝛼𝛼𝛼0
𝑗𝑗𝑗𝑗 + 𝛼𝛼𝛼𝛼1𝑗𝑗𝑗𝑗𝐼𝐼𝐼𝐼𝑖𝑖𝑖𝑖,𝑡𝑡𝑡𝑡−1𝑗𝑗𝑗𝑗 + 𝛼𝛼𝛼𝛼2
𝑗𝑗𝑗𝑗𝑦𝑦𝑦𝑦𝑖𝑖𝑖𝑖,𝑡𝑡𝑡𝑡 + 𝛼𝛼𝛼𝛼3𝑗𝑗𝑗𝑗𝐴𝐴𝐴𝐴𝑖𝑖𝑖𝑖,𝑡𝑡𝑡𝑡 + 𝛼𝛼𝛼𝛼4
𝑗𝑗𝑗𝑗𝑀𝑀𝑀𝑀𝑖𝑖𝑖𝑖,𝑡𝑡𝑡𝑡 + 𝛼𝛼𝛼𝛼5𝑗𝑗𝑗𝑗𝑈𝑈𝑈𝑈𝑖𝑖𝑖𝑖,𝑡𝑡𝑡𝑡 + 𝛼𝛼𝛼𝛼6
𝑗𝑗𝑗𝑗𝑃𝑃𝑃𝑃𝑖𝑖𝑖𝑖,𝑡𝑡𝑡𝑡 + 𝛼𝛼𝛼𝛼7𝑗𝑗𝑗𝑗𝐷𝐷𝐷𝐷𝑖𝑖𝑖𝑖
𝑗𝑗𝑗𝑗 + 𝛼𝛼𝛼𝛼8𝑗𝑗𝑗𝑗𝐴𝐴𝐴𝐴,
Goal 5 P 92
𝐶𝐶𝐶𝐶𝐴𝐴𝐴𝐴𝐶𝐶𝐶𝐶𝐴𝐴𝐴𝐴𝐺𝐺𝐺𝐺𝐺𝐺𝐺𝐺 = � �� 𝐺𝐺𝐺𝐺𝐼𝐼𝐼𝐼𝐴𝐴𝐴𝐴𝐺𝐺𝐺𝐺𝑝𝑝𝑝𝑝𝐼𝐼𝐼𝐼𝐼𝐼𝐼𝐼𝑖𝑖𝑖𝑖,𝑡𝑡𝑡𝑡 + � 𝐺𝐺𝐺𝐺𝐼𝐼𝐼𝐼𝐴𝐴𝐴𝐴𝑀𝑀𝑀𝑀𝐴𝐴𝐴𝐴𝐴𝐴𝐴𝐴𝐴𝐴𝐴𝐴𝑗𝑗𝑗𝑗,𝑡𝑡𝑡𝑡 𝑞𝑞𝑞𝑞
𝑗𝑗𝑗𝑗=1
𝑝𝑝𝑝𝑝
𝑖𝑖𝑖𝑖=1�
2030
𝑡𝑡𝑡𝑡=2016
𝐶𝐶𝐶𝐶𝐴𝐴𝐴𝐴𝐶𝐶𝐶𝐶𝐴𝐴𝐴𝐴𝑁𝑁𝑁𝑁𝑇𝑇𝑇𝑇𝐺𝐺𝐺𝐺𝐺𝐺𝐺𝐺 = � � 𝛼𝛼𝛼𝛼𝑘𝑘𝑘𝑘,𝑡𝑡𝑡𝑡𝑁𝑁𝑁𝑁𝑇𝑇𝑇𝑇𝐺𝐺𝐺𝐺𝐵𝐵𝐵𝐵𝑘𝑘𝑘𝑘,𝑡𝑡𝑡𝑡
𝑠𝑠𝑠𝑠
𝑘𝑘𝑘𝑘=1
2030
𝑡𝑡𝑡𝑡=2016
Goal 9 P 125
𝐹𝐹𝐹𝐹𝑖𝑖𝑖𝑖,𝑡𝑡𝑡𝑡 = �𝐹𝐹𝐹𝐹𝑖𝑖𝑖𝑖,𝑡𝑡𝑡𝑡𝑗𝑗𝑗𝑗 and
𝑗𝑗𝑗𝑗
𝐹𝐹𝐹𝐹𝑖𝑖𝑖𝑖,𝑡𝑡𝑡𝑡𝑗𝑗𝑗𝑗 = max�
𝐼𝐼𝐼𝐼𝑖𝑖𝑖𝑖,𝑇𝑇𝑇𝑇𝑗𝑗𝑗𝑗 − 𝐼𝐼𝐼𝐼𝑖𝑖𝑖𝑖,𝑡𝑡𝑡𝑡
𝑗𝑗𝑗𝑗
𝑇𝑇𝑇𝑇 − 𝐴𝐴𝐴𝐴, 0� × 𝐼𝐼𝐼𝐼𝑖𝑖𝑖𝑖
𝑗𝑗𝑗𝑗 + 𝐼𝐼𝐼𝐼𝑖𝑖𝑖𝑖,𝑡𝑡𝑡𝑡𝑗𝑗𝑗𝑗 × 𝐼𝐼𝐼𝐼𝑖𝑖𝑖𝑖
𝑗𝑗𝑗𝑗 + max�𝑈𝑈𝑈𝑈𝑗𝑗𝑗𝑗 − 𝐼𝐼𝐼𝐼𝑖𝑖𝑖𝑖,𝑇𝑇𝑇𝑇
𝑗𝑗𝑗𝑗
𝑇𝑇𝑇𝑇 − 𝐴𝐴𝐴𝐴, 0� × 𝐼𝐼𝐼𝐼𝑖𝑖𝑖𝑖
𝑗𝑗𝑗𝑗
P 126
𝐼𝐼𝐼𝐼𝑖𝑖𝑖𝑖,𝑡𝑡𝑡𝑡𝑗𝑗𝑗𝑗 = 𝛼𝛼𝛼𝛼0
𝑗𝑗𝑗𝑗 + 𝛼𝛼𝛼𝛼1𝑗𝑗𝑗𝑗𝐼𝐼𝐼𝐼𝑖𝑖𝑖𝑖,𝑡𝑡𝑡𝑡−1𝑗𝑗𝑗𝑗 + 𝛼𝛼𝛼𝛼2
𝑗𝑗𝑗𝑗𝑦𝑦𝑦𝑦𝑖𝑖𝑖𝑖,𝑡𝑡𝑡𝑡 + 𝛼𝛼𝛼𝛼3𝑗𝑗𝑗𝑗𝐴𝐴𝐴𝐴𝑖𝑖𝑖𝑖,𝑡𝑡𝑡𝑡 + 𝛼𝛼𝛼𝛼4
𝑗𝑗𝑗𝑗𝑀𝑀𝑀𝑀𝑖𝑖𝑖𝑖,𝑡𝑡𝑡𝑡 + 𝛼𝛼𝛼𝛼5𝑗𝑗𝑗𝑗𝑈𝑈𝑈𝑈𝑖𝑖𝑖𝑖,𝑡𝑡𝑡𝑡 + 𝛼𝛼𝛼𝛼6
𝑗𝑗𝑗𝑗𝑃𝑃𝑃𝑃𝑖𝑖𝑖𝑖,𝑡𝑡𝑡𝑡 + 𝛼𝛼𝛼𝛼7𝑗𝑗𝑗𝑗𝐷𝐷𝐷𝐷𝑖𝑖𝑖𝑖
𝑗𝑗𝑗𝑗 + 𝛼𝛼𝛼𝛼8𝑗𝑗𝑗𝑗𝐴𝐴𝐴𝐴,
𝐼𝐼𝐼𝐼𝑖𝑖𝑖𝑖,𝑡𝑡𝑡𝑡𝑗𝑗𝑗𝑗 = 𝛼𝛼𝛼𝛼0
𝑗𝑗𝑗𝑗 + 𝛼𝛼𝛼𝛼1𝑗𝑗𝑗𝑗𝐼𝐼𝐼𝐼𝑖𝑖𝑖𝑖,𝑡𝑡𝑡𝑡−1𝑗𝑗𝑗𝑗 + 𝛼𝛼𝛼𝛼2
𝑗𝑗𝑗𝑗𝑦𝑦𝑦𝑦𝑖𝑖𝑖𝑖,𝑡𝑡𝑡𝑡 + 𝛼𝛼𝛼𝛼3𝑗𝑗𝑗𝑗𝐴𝐴𝐴𝐴𝑖𝑖𝑖𝑖,𝑡𝑡𝑡𝑡 + 𝛼𝛼𝛼𝛼4
𝑗𝑗𝑗𝑗𝑀𝑀𝑀𝑀𝑖𝑖𝑖𝑖,𝑡𝑡𝑡𝑡 + 𝛼𝛼𝛼𝛼5𝑗𝑗𝑗𝑗𝑈𝑈𝑈𝑈𝑖𝑖𝑖𝑖,𝑡𝑡𝑡𝑡 + 𝛼𝛼𝛼𝛼6
𝑗𝑗𝑗𝑗𝑃𝑃𝑃𝑃𝑖𝑖𝑖𝑖,𝑡𝑡𝑡𝑡 + 𝛼𝛼𝛼𝛼7𝑗𝑗𝑗𝑗𝐷𝐷𝐷𝐷𝑖𝑖𝑖𝑖
𝑗𝑗𝑗𝑗 + 𝛼𝛼𝛼𝛼8𝑗𝑗𝑗𝑗𝐴𝐴𝐴𝐴 + 𝛼𝛼𝛼𝛼9
𝑗𝑗𝑗𝑗𝐵𝐵𝐵𝐵𝑝𝑝𝑝𝑝𝑖𝑖𝑖𝑖,𝑡𝑡𝑡𝑡𝑗𝑗𝑗𝑗
+ 𝛼𝛼𝛼𝛼10𝑗𝑗𝑗𝑗 𝐵𝐵𝐵𝐵𝐸𝐸𝐸𝐸𝑖𝑖𝑖𝑖,𝑡𝑡𝑡𝑡
𝑗𝑗𝑗𝑗 + 𝛼𝛼𝛼𝛼11𝑗𝑗𝑗𝑗 𝑃𝑃𝑃𝑃𝐼𝐼𝐼𝐼𝑖𝑖𝑖𝑖,𝑡𝑡𝑡𝑡
𝑗𝑗𝑗𝑗
where IEi,j,t = PCPi,j,t * tcovi,j,t * Benefiti,j,t + Admini,j,t
To achieve universal coverage by 2030, the coverage rate would need to be annual adjusted by
FORMULAS
Section 2 P 22 & 23 EXAMPLE 1
𝐴𝐴𝐴𝐴𝐴𝐴𝐴𝐴𝐴𝐴𝐴𝐴𝐴𝐴𝐴𝐴𝐴𝐴𝐴𝐴𝐴𝐴𝐴𝐴𝐴𝐴𝐴𝐴𝐴𝐴𝐴𝐴𝐴𝐴𝐴𝐴𝐴𝐴𝐴𝐴𝑗𝑗𝑗𝑗,𝑡𝑡𝑡𝑡 = �𝐶𝐶𝐶𝐶𝐴𝐴𝐴𝐴𝐶𝐶𝐶𝐶𝐴𝐴𝐴𝐴𝑖𝑖𝑖𝑖,𝑗𝑗𝑗𝑗,𝑡𝑡𝑡𝑡𝑖𝑖𝑖𝑖
− 𝐵𝐵𝐵𝐵𝐵𝐵𝐵𝐵𝑗𝑗𝑗𝑗,𝑡𝑡𝑡𝑡
𝐵𝐵𝐵𝐵𝐵𝐵𝐵𝐵𝑗𝑗𝑗𝑗,𝑡𝑡𝑡𝑡 = 𝐵𝐵𝐵𝐵𝐵𝐵𝐵𝐵𝑗𝑗𝑗𝑗,𝑡𝑡𝑡𝑡0 ∗ (1 + 𝑝𝑝𝑝𝑝𝑝𝑝𝑝𝑝𝑝𝑝𝑝𝑝�����)𝑡𝑡𝑡𝑡−𝑡𝑡𝑡𝑡0
𝐼𝐼𝐼𝐼𝐴𝐴𝐴𝐴𝐼𝐼𝐼𝐼𝑝𝑝𝑝𝑝𝐼𝐼𝐼𝐼𝐼𝐼𝐼𝐼𝐼𝐼𝐼𝐼𝐴𝐴𝐴𝐴𝐴𝐴𝐴𝐴𝐴𝐴𝐴𝐴𝐴𝐴𝐴𝐴𝑗𝑗𝑗𝑗,𝑡𝑡𝑡𝑡 = �𝐼𝐼𝐼𝐼𝐵𝐵𝐵𝐵𝑖𝑖𝑖𝑖,𝑗𝑗𝑗𝑗,𝑡𝑡𝑡𝑡𝑖𝑖𝑖𝑖
− 𝐵𝐵𝐵𝐵𝐵𝐵𝐵𝐵𝑗𝑗𝑗𝑗,𝑡𝑡𝑡𝑡
𝜃𝜃𝜃𝜃𝑖𝑖𝑖𝑖,𝑗𝑗𝑗𝑗 =100% − 𝐼𝐼𝐼𝐼𝐴𝐴𝐴𝐴𝑐𝑐𝑐𝑐𝑖𝑖𝑖𝑖,𝑗𝑗𝑗𝑗,𝑡𝑡𝑡𝑡𝑎𝑎𝑎𝑎
(2030 − 𝐴𝐴𝐴𝐴𝑎𝑎𝑎𝑎)
P 25 EXAMPLE 2 Infrastructure
𝐹𝐹𝐹𝐹𝑖𝑖𝑖𝑖,𝑡𝑡𝑡𝑡 = �𝐹𝐹𝐹𝐹𝑖𝑖𝑖𝑖,𝑡𝑡𝑡𝑡𝑗𝑗𝑗𝑗 and
𝑗𝑗𝑗𝑗
𝐹𝐹𝐹𝐹𝑖𝑖𝑖𝑖,𝑡𝑡𝑡𝑡𝑗𝑗𝑗𝑗 = max�
𝐼𝐼𝐼𝐼𝑖𝑖𝑖𝑖,𝑇𝑇𝑇𝑇𝑗𝑗𝑗𝑗 − 𝐼𝐼𝐼𝐼𝑖𝑖𝑖𝑖,𝑡𝑡𝑡𝑡
𝑗𝑗𝑗𝑗
𝑇𝑇𝑇𝑇 − 𝐴𝐴𝐴𝐴, 0� × 𝐼𝐼𝐼𝐼𝑖𝑖𝑖𝑖
𝑗𝑗𝑗𝑗 + 𝐼𝐼𝐼𝐼𝑖𝑖𝑖𝑖,𝑡𝑡𝑡𝑡𝑗𝑗𝑗𝑗 × 𝐼𝐼𝐼𝐼𝑖𝑖𝑖𝑖
𝑗𝑗𝑗𝑗
𝐼𝐼𝐼𝐼𝑖𝑖𝑖𝑖,𝑡𝑡𝑡𝑡𝑗𝑗𝑗𝑗 = 𝛼𝛼𝛼𝛼0
𝑗𝑗𝑗𝑗 + 𝛼𝛼𝛼𝛼1𝑗𝑗𝑗𝑗𝐼𝐼𝐼𝐼𝑖𝑖𝑖𝑖,𝑡𝑡𝑡𝑡−1𝑗𝑗𝑗𝑗 + 𝛼𝛼𝛼𝛼2
𝑗𝑗𝑗𝑗𝑦𝑦𝑦𝑦𝑖𝑖𝑖𝑖,𝑡𝑡𝑡𝑡 + 𝛼𝛼𝛼𝛼3𝑗𝑗𝑗𝑗𝐴𝐴𝐴𝐴𝑖𝑖𝑖𝑖,𝑡𝑡𝑡𝑡 + 𝛼𝛼𝛼𝛼4
𝑗𝑗𝑗𝑗𝑀𝑀𝑀𝑀𝑖𝑖𝑖𝑖,𝑡𝑡𝑡𝑡 + 𝛼𝛼𝛼𝛼5𝑗𝑗𝑗𝑗𝑈𝑈𝑈𝑈𝑖𝑖𝑖𝑖,𝑡𝑡𝑡𝑡 + 𝛼𝛼𝛼𝛼6
𝑗𝑗𝑗𝑗𝑃𝑃𝑃𝑃𝑖𝑖𝑖𝑖,𝑡𝑡𝑡𝑡 + 𝛼𝛼𝛼𝛼7𝑗𝑗𝑗𝑗𝐷𝐷𝐷𝐷𝑖𝑖𝑖𝑖
𝑗𝑗𝑗𝑗 + 𝛼𝛼𝛼𝛼8𝑗𝑗𝑗𝑗𝐴𝐴𝐴𝐴,
Goal 5 P 92
𝐶𝐶𝐶𝐶𝐴𝐴𝐴𝐴𝐶𝐶𝐶𝐶𝐴𝐴𝐴𝐴𝐺𝐺𝐺𝐺𝐺𝐺𝐺𝐺 = � �� 𝐺𝐺𝐺𝐺𝐼𝐼𝐼𝐼𝐴𝐴𝐴𝐴𝐺𝐺𝐺𝐺𝑝𝑝𝑝𝑝𝐼𝐼𝐼𝐼𝐼𝐼𝐼𝐼𝑖𝑖𝑖𝑖,𝑡𝑡𝑡𝑡 + � 𝐺𝐺𝐺𝐺𝐼𝐼𝐼𝐼𝐴𝐴𝐴𝐴𝑀𝑀𝑀𝑀𝐴𝐴𝐴𝐴𝐴𝐴𝐴𝐴𝐴𝐴𝐴𝐴𝑗𝑗𝑗𝑗,𝑡𝑡𝑡𝑡 𝑞𝑞𝑞𝑞
𝑗𝑗𝑗𝑗=1
𝑝𝑝𝑝𝑝
𝑖𝑖𝑖𝑖=1�
2030
𝑡𝑡𝑡𝑡=2016
𝐶𝐶𝐶𝐶𝐴𝐴𝐴𝐴𝐶𝐶𝐶𝐶𝐴𝐴𝐴𝐴𝑁𝑁𝑁𝑁𝑇𝑇𝑇𝑇𝐺𝐺𝐺𝐺𝐺𝐺𝐺𝐺 = � � 𝛼𝛼𝛼𝛼𝑘𝑘𝑘𝑘,𝑡𝑡𝑡𝑡𝑁𝑁𝑁𝑁𝑇𝑇𝑇𝑇𝐺𝐺𝐺𝐺𝐵𝐵𝐵𝐵𝑘𝑘𝑘𝑘,𝑡𝑡𝑡𝑡
𝑠𝑠𝑠𝑠
𝑘𝑘𝑘𝑘=1
2030
𝑡𝑡𝑡𝑡=2016
Goal 9 P 125
𝐹𝐹𝐹𝐹𝑖𝑖𝑖𝑖,𝑡𝑡𝑡𝑡 = �𝐹𝐹𝐹𝐹𝑖𝑖𝑖𝑖,𝑡𝑡𝑡𝑡𝑗𝑗𝑗𝑗 and
𝑗𝑗𝑗𝑗
𝐹𝐹𝐹𝐹𝑖𝑖𝑖𝑖,𝑡𝑡𝑡𝑡𝑗𝑗𝑗𝑗 = max�
𝐼𝐼𝐼𝐼𝑖𝑖𝑖𝑖,𝑇𝑇𝑇𝑇𝑗𝑗𝑗𝑗 − 𝐼𝐼𝐼𝐼𝑖𝑖𝑖𝑖,𝑡𝑡𝑡𝑡
𝑗𝑗𝑗𝑗
𝑇𝑇𝑇𝑇 − 𝐴𝐴𝐴𝐴, 0� × 𝐼𝐼𝐼𝐼𝑖𝑖𝑖𝑖
𝑗𝑗𝑗𝑗 + 𝐼𝐼𝐼𝐼𝑖𝑖𝑖𝑖,𝑡𝑡𝑡𝑡𝑗𝑗𝑗𝑗 × 𝐼𝐼𝐼𝐼𝑖𝑖𝑖𝑖
𝑗𝑗𝑗𝑗 + max�𝑈𝑈𝑈𝑈𝑗𝑗𝑗𝑗 − 𝐼𝐼𝐼𝐼𝑖𝑖𝑖𝑖,𝑇𝑇𝑇𝑇
𝑗𝑗𝑗𝑗
𝑇𝑇𝑇𝑇 − 𝐴𝐴𝐴𝐴, 0� × 𝐼𝐼𝐼𝐼𝑖𝑖𝑖𝑖
𝑗𝑗𝑗𝑗
P 126
𝐼𝐼𝐼𝐼𝑖𝑖𝑖𝑖,𝑡𝑡𝑡𝑡𝑗𝑗𝑗𝑗 = 𝛼𝛼𝛼𝛼0
𝑗𝑗𝑗𝑗 + 𝛼𝛼𝛼𝛼1𝑗𝑗𝑗𝑗𝐼𝐼𝐼𝐼𝑖𝑖𝑖𝑖,𝑡𝑡𝑡𝑡−1𝑗𝑗𝑗𝑗 + 𝛼𝛼𝛼𝛼2
𝑗𝑗𝑗𝑗𝑦𝑦𝑦𝑦𝑖𝑖𝑖𝑖,𝑡𝑡𝑡𝑡 + 𝛼𝛼𝛼𝛼3𝑗𝑗𝑗𝑗𝐴𝐴𝐴𝐴𝑖𝑖𝑖𝑖,𝑡𝑡𝑡𝑡 + 𝛼𝛼𝛼𝛼4
𝑗𝑗𝑗𝑗𝑀𝑀𝑀𝑀𝑖𝑖𝑖𝑖,𝑡𝑡𝑡𝑡 + 𝛼𝛼𝛼𝛼5𝑗𝑗𝑗𝑗𝑈𝑈𝑈𝑈𝑖𝑖𝑖𝑖,𝑡𝑡𝑡𝑡 + 𝛼𝛼𝛼𝛼6
𝑗𝑗𝑗𝑗𝑃𝑃𝑃𝑃𝑖𝑖𝑖𝑖,𝑡𝑡𝑡𝑡 + 𝛼𝛼𝛼𝛼7𝑗𝑗𝑗𝑗𝐷𝐷𝐷𝐷𝑖𝑖𝑖𝑖
𝑗𝑗𝑗𝑗 + 𝛼𝛼𝛼𝛼8𝑗𝑗𝑗𝑗𝐴𝐴𝐴𝐴,
𝐼𝐼𝐼𝐼𝑖𝑖𝑖𝑖,𝑡𝑡𝑡𝑡𝑗𝑗𝑗𝑗 = 𝛼𝛼𝛼𝛼0
𝑗𝑗𝑗𝑗 + 𝛼𝛼𝛼𝛼1𝑗𝑗𝑗𝑗𝐼𝐼𝐼𝐼𝑖𝑖𝑖𝑖,𝑡𝑡𝑡𝑡−1𝑗𝑗𝑗𝑗 + 𝛼𝛼𝛼𝛼2
𝑗𝑗𝑗𝑗𝑦𝑦𝑦𝑦𝑖𝑖𝑖𝑖,𝑡𝑡𝑡𝑡 + 𝛼𝛼𝛼𝛼3𝑗𝑗𝑗𝑗𝐴𝐴𝐴𝐴𝑖𝑖𝑖𝑖,𝑡𝑡𝑡𝑡 + 𝛼𝛼𝛼𝛼4
𝑗𝑗𝑗𝑗𝑀𝑀𝑀𝑀𝑖𝑖𝑖𝑖,𝑡𝑡𝑡𝑡 + 𝛼𝛼𝛼𝛼5𝑗𝑗𝑗𝑗𝑈𝑈𝑈𝑈𝑖𝑖𝑖𝑖,𝑡𝑡𝑡𝑡 + 𝛼𝛼𝛼𝛼6
𝑗𝑗𝑗𝑗𝑃𝑃𝑃𝑃𝑖𝑖𝑖𝑖,𝑡𝑡𝑡𝑡 + 𝛼𝛼𝛼𝛼7𝑗𝑗𝑗𝑗𝐷𝐷𝐷𝐷𝑖𝑖𝑖𝑖
𝑗𝑗𝑗𝑗 + 𝛼𝛼𝛼𝛼8𝑗𝑗𝑗𝑗𝐴𝐴𝐴𝐴 + 𝛼𝛼𝛼𝛼9
𝑗𝑗𝑗𝑗𝐵𝐵𝐵𝐵𝑝𝑝𝑝𝑝𝑖𝑖𝑖𝑖,𝑡𝑡𝑡𝑡𝑗𝑗𝑗𝑗
+ 𝛼𝛼𝛼𝛼10𝑗𝑗𝑗𝑗 𝐵𝐵𝐵𝐵𝐸𝐸𝐸𝐸𝑖𝑖𝑖𝑖,𝑡𝑡𝑡𝑡
𝑗𝑗𝑗𝑗 + 𝛼𝛼𝛼𝛼11𝑗𝑗𝑗𝑗 𝑃𝑃𝑃𝑃𝐼𝐼𝐼𝐼𝑖𝑖𝑖𝑖,𝑡𝑡𝑡𝑡
𝑗𝑗𝑗𝑗
where θi,j is the level of annual adjustment in percent-age points; and ta refers to the year for which latest data on effective coverage is available, which is consid-ered as the start year for the projections for universal coverage.
Additional insights from health and education costing
The above example assumed a linear expansion of the social protection coverage. However, alternative scale-up curves could be assessed to examine the impact on SDG attainment as well as the financial costs (figure 11). As highlighted in Chapter 2 section on SDG3, the 2017 WHO study on health financing applied differ-ent scale-up curves to different country groups based on factors such as readiness/capacity to scale up and the available fiscal space.
Expansion of coverage also depends on whether there are any prerequisite steps. For instance, in education, universal enrolment in upper-secondary first requires universal enrolment in lower-secondary. Students are projected by grade that takes account of pupil progress through grades over time, based on promotion and repetition rates. Figure 12 illustrates the logical flow of education costing.

A GUIDEBOOK FOR ASSESSING SDG INVESTMENT NEEDS 17
Figure 12. Logical flow of education costing
Source: ESCAP Survey 2019 technical appendix.
Costs
Costs
Costs
Costs
Costs
Teacher salaries
Non-salary costs
Teacher salaries
Non-salary costs
Teacher salaries
Non-salary costs
Teacher salaries
Non-salary costs
Unit cost of post-secondary
Pupils enrolled
Pupils by grade
Pupils by grade
Pupils by grade
Pupils by grade
Gross Enrolment to Pre-primary
Transition between Grades
Transition between Grades
Transition between Grades
Transition between Grades
Pre-primary
Primary
Lower Secondary
Upper Secondary
Post-secondary
Gross Enrolment to Primary 1
Gross Enrolment to Lower Secondary 1
Gross Enrolment to Upper Secondary
Gross Enrolment to Post-secondary
Completion of Primary
Completion of Lower Secondary
Completion of Upper Secondary
Completion of Post-secondary{
{
{
{

A GUIDEBOOK FOR ASSESSING SDG INVESTMENT NEEDS18
meet the rising demand driven by demographic evolu-tion, economic growth and urbanization by 2030, and the second term represents the maintenance cost of the existing stock of infrastructure. Specifically, Ii
j,t is
the infrastructure stock of type j in country i at time t; ci
j and mij are the annual unit capital costs and unit
maintenance costs of infrastructure of type j in country i; and T is a targeted time period by which universal access should be provided.
Projection of infrastructure indicators by 2030
The projection of each infrastructure indicator to 2030 is performed using an OLS regression with fixed effects on a specific sample of countries. The future infrastruc-ture demand is described by the following process:
FORMULAS
Section 2 P 22 & 23 EXAMPLE 1
𝐴𝐴𝐴𝐴𝐴𝐴𝐴𝐴𝐴𝐴𝐴𝐴𝐴𝐴𝐴𝐴𝐴𝐴𝐴𝐴𝐴𝐴𝐴𝐴𝐴𝐴𝐴𝐴𝐴𝐴𝐴𝐴𝐴𝐴𝐴𝐴𝐴𝐴𝐴𝐴𝑗𝑗𝑗𝑗,𝑡𝑡𝑡𝑡 = �𝐶𝐶𝐶𝐶𝐴𝐴𝐴𝐴𝐶𝐶𝐶𝐶𝐴𝐴𝐴𝐴𝑖𝑖𝑖𝑖,𝑗𝑗𝑗𝑗,𝑡𝑡𝑡𝑡𝑖𝑖𝑖𝑖
− 𝐵𝐵𝐵𝐵𝐵𝐵𝐵𝐵𝑗𝑗𝑗𝑗,𝑡𝑡𝑡𝑡
𝐵𝐵𝐵𝐵𝐵𝐵𝐵𝐵𝑗𝑗𝑗𝑗,𝑡𝑡𝑡𝑡 = 𝐵𝐵𝐵𝐵𝐵𝐵𝐵𝐵𝑗𝑗𝑗𝑗,𝑡𝑡𝑡𝑡0 ∗ (1 + 𝑝𝑝𝑝𝑝𝑝𝑝𝑝𝑝𝑝𝑝𝑝𝑝�����)𝑡𝑡𝑡𝑡−𝑡𝑡𝑡𝑡0
𝐼𝐼𝐼𝐼𝐴𝐴𝐴𝐴𝐼𝐼𝐼𝐼𝑝𝑝𝑝𝑝𝐼𝐼𝐼𝐼𝐼𝐼𝐼𝐼𝐼𝐼𝐼𝐼𝐴𝐴𝐴𝐴𝐴𝐴𝐴𝐴𝐴𝐴𝐴𝐴𝐴𝐴𝐴𝐴𝑗𝑗𝑗𝑗,𝑡𝑡𝑡𝑡 = �𝐼𝐼𝐼𝐼𝐵𝐵𝐵𝐵𝑖𝑖𝑖𝑖,𝑗𝑗𝑗𝑗,𝑡𝑡𝑡𝑡𝑖𝑖𝑖𝑖
− 𝐵𝐵𝐵𝐵𝐵𝐵𝐵𝐵𝑗𝑗𝑗𝑗,𝑡𝑡𝑡𝑡
𝜃𝜃𝜃𝜃𝑖𝑖𝑖𝑖,𝑗𝑗𝑗𝑗 =100% − 𝐼𝐼𝐼𝐼𝐴𝐴𝐴𝐴𝑐𝑐𝑐𝑐𝑖𝑖𝑖𝑖,𝑗𝑗𝑗𝑗,𝑡𝑡𝑡𝑡𝑎𝑎𝑎𝑎
(2030 − 𝐴𝐴𝐴𝐴𝑎𝑎𝑎𝑎)
P 25 EXAMPLE 2 Infrastructure
𝐹𝐹𝐹𝐹𝑖𝑖𝑖𝑖,𝑡𝑡𝑡𝑡 = �𝐹𝐹𝐹𝐹𝑖𝑖𝑖𝑖,𝑡𝑡𝑡𝑡𝑗𝑗𝑗𝑗 and
𝑗𝑗𝑗𝑗
𝐹𝐹𝐹𝐹𝑖𝑖𝑖𝑖,𝑡𝑡𝑡𝑡𝑗𝑗𝑗𝑗 = max�
𝐼𝐼𝐼𝐼𝑖𝑖𝑖𝑖,𝑇𝑇𝑇𝑇𝑗𝑗𝑗𝑗 − 𝐼𝐼𝐼𝐼𝑖𝑖𝑖𝑖,𝑡𝑡𝑡𝑡
𝑗𝑗𝑗𝑗
𝑇𝑇𝑇𝑇 − 𝐴𝐴𝐴𝐴, 0� × 𝐼𝐼𝐼𝐼𝑖𝑖𝑖𝑖
𝑗𝑗𝑗𝑗 + 𝐼𝐼𝐼𝐼𝑖𝑖𝑖𝑖,𝑡𝑡𝑡𝑡𝑗𝑗𝑗𝑗 × 𝐼𝐼𝐼𝐼𝑖𝑖𝑖𝑖
𝑗𝑗𝑗𝑗
𝐼𝐼𝐼𝐼𝑖𝑖𝑖𝑖,𝑡𝑡𝑡𝑡𝑗𝑗𝑗𝑗 = 𝛼𝛼𝛼𝛼0
𝑗𝑗𝑗𝑗 + 𝛼𝛼𝛼𝛼1𝑗𝑗𝑗𝑗𝐼𝐼𝐼𝐼𝑖𝑖𝑖𝑖,𝑡𝑡𝑡𝑡−1𝑗𝑗𝑗𝑗 + 𝛼𝛼𝛼𝛼2
𝑗𝑗𝑗𝑗𝑦𝑦𝑦𝑦𝑖𝑖𝑖𝑖,𝑡𝑡𝑡𝑡 + 𝛼𝛼𝛼𝛼3𝑗𝑗𝑗𝑗𝐴𝐴𝐴𝐴𝑖𝑖𝑖𝑖,𝑡𝑡𝑡𝑡 + 𝛼𝛼𝛼𝛼4
𝑗𝑗𝑗𝑗𝑀𝑀𝑀𝑀𝑖𝑖𝑖𝑖,𝑡𝑡𝑡𝑡 + 𝛼𝛼𝛼𝛼5𝑗𝑗𝑗𝑗𝑈𝑈𝑈𝑈𝑖𝑖𝑖𝑖,𝑡𝑡𝑡𝑡 + 𝛼𝛼𝛼𝛼6
𝑗𝑗𝑗𝑗𝑃𝑃𝑃𝑃𝑖𝑖𝑖𝑖,𝑡𝑡𝑡𝑡 + 𝛼𝛼𝛼𝛼7𝑗𝑗𝑗𝑗𝐷𝐷𝐷𝐷𝑖𝑖𝑖𝑖
𝑗𝑗𝑗𝑗 + 𝛼𝛼𝛼𝛼8𝑗𝑗𝑗𝑗𝐴𝐴𝐴𝐴,
Goal 5 P 92
𝐶𝐶𝐶𝐶𝐴𝐴𝐴𝐴𝐶𝐶𝐶𝐶𝐴𝐴𝐴𝐴𝐺𝐺𝐺𝐺𝐺𝐺𝐺𝐺 = � �� 𝐺𝐺𝐺𝐺𝐼𝐼𝐼𝐼𝐴𝐴𝐴𝐴𝐺𝐺𝐺𝐺𝑝𝑝𝑝𝑝𝐼𝐼𝐼𝐼𝐼𝐼𝐼𝐼𝑖𝑖𝑖𝑖,𝑡𝑡𝑡𝑡 + � 𝐺𝐺𝐺𝐺𝐼𝐼𝐼𝐼𝐴𝐴𝐴𝐴𝑀𝑀𝑀𝑀𝐴𝐴𝐴𝐴𝐴𝐴𝐴𝐴𝐴𝐴𝐴𝐴𝑗𝑗𝑗𝑗,𝑡𝑡𝑡𝑡 𝑞𝑞𝑞𝑞
𝑗𝑗𝑗𝑗=1
𝑝𝑝𝑝𝑝
𝑖𝑖𝑖𝑖=1�
2030
𝑡𝑡𝑡𝑡=2016
𝐶𝐶𝐶𝐶𝐴𝐴𝐴𝐴𝐶𝐶𝐶𝐶𝐴𝐴𝐴𝐴𝑁𝑁𝑁𝑁𝑇𝑇𝑇𝑇𝐺𝐺𝐺𝐺𝐺𝐺𝐺𝐺 = � � 𝛼𝛼𝛼𝛼𝑘𝑘𝑘𝑘,𝑡𝑡𝑡𝑡𝑁𝑁𝑁𝑁𝑇𝑇𝑇𝑇𝐺𝐺𝐺𝐺𝐵𝐵𝐵𝐵𝑘𝑘𝑘𝑘,𝑡𝑡𝑡𝑡
𝑠𝑠𝑠𝑠
𝑘𝑘𝑘𝑘=1
2030
𝑡𝑡𝑡𝑡=2016
Goal 9 P 125
𝐹𝐹𝐹𝐹𝑖𝑖𝑖𝑖,𝑡𝑡𝑡𝑡 = �𝐹𝐹𝐹𝐹𝑖𝑖𝑖𝑖,𝑡𝑡𝑡𝑡𝑗𝑗𝑗𝑗 and
𝑗𝑗𝑗𝑗
𝐹𝐹𝐹𝐹𝑖𝑖𝑖𝑖,𝑡𝑡𝑡𝑡𝑗𝑗𝑗𝑗 = max�
𝐼𝐼𝐼𝐼𝑖𝑖𝑖𝑖,𝑇𝑇𝑇𝑇𝑗𝑗𝑗𝑗 − 𝐼𝐼𝐼𝐼𝑖𝑖𝑖𝑖,𝑡𝑡𝑡𝑡
𝑗𝑗𝑗𝑗
𝑇𝑇𝑇𝑇 − 𝐴𝐴𝐴𝐴, 0� × 𝐼𝐼𝐼𝐼𝑖𝑖𝑖𝑖
𝑗𝑗𝑗𝑗 + 𝐼𝐼𝐼𝐼𝑖𝑖𝑖𝑖,𝑡𝑡𝑡𝑡𝑗𝑗𝑗𝑗 × 𝐼𝐼𝐼𝐼𝑖𝑖𝑖𝑖
𝑗𝑗𝑗𝑗 + max�𝑈𝑈𝑈𝑈𝑗𝑗𝑗𝑗 − 𝐼𝐼𝐼𝐼𝑖𝑖𝑖𝑖,𝑇𝑇𝑇𝑇
𝑗𝑗𝑗𝑗
𝑇𝑇𝑇𝑇 − 𝐴𝐴𝐴𝐴, 0� × 𝐼𝐼𝐼𝐼𝑖𝑖𝑖𝑖
𝑗𝑗𝑗𝑗
P 126
𝐼𝐼𝐼𝐼𝑖𝑖𝑖𝑖,𝑡𝑡𝑡𝑡𝑗𝑗𝑗𝑗 = 𝛼𝛼𝛼𝛼0
𝑗𝑗𝑗𝑗 + 𝛼𝛼𝛼𝛼1𝑗𝑗𝑗𝑗𝐼𝐼𝐼𝐼𝑖𝑖𝑖𝑖,𝑡𝑡𝑡𝑡−1𝑗𝑗𝑗𝑗 + 𝛼𝛼𝛼𝛼2
𝑗𝑗𝑗𝑗𝑦𝑦𝑦𝑦𝑖𝑖𝑖𝑖,𝑡𝑡𝑡𝑡 + 𝛼𝛼𝛼𝛼3𝑗𝑗𝑗𝑗𝐴𝐴𝐴𝐴𝑖𝑖𝑖𝑖,𝑡𝑡𝑡𝑡 + 𝛼𝛼𝛼𝛼4
𝑗𝑗𝑗𝑗𝑀𝑀𝑀𝑀𝑖𝑖𝑖𝑖,𝑡𝑡𝑡𝑡 + 𝛼𝛼𝛼𝛼5𝑗𝑗𝑗𝑗𝑈𝑈𝑈𝑈𝑖𝑖𝑖𝑖,𝑡𝑡𝑡𝑡 + 𝛼𝛼𝛼𝛼6
𝑗𝑗𝑗𝑗𝑃𝑃𝑃𝑃𝑖𝑖𝑖𝑖,𝑡𝑡𝑡𝑡 + 𝛼𝛼𝛼𝛼7𝑗𝑗𝑗𝑗𝐷𝐷𝐷𝐷𝑖𝑖𝑖𝑖
𝑗𝑗𝑗𝑗 + 𝛼𝛼𝛼𝛼8𝑗𝑗𝑗𝑗𝐴𝐴𝐴𝐴,
𝐼𝐼𝐼𝐼𝑖𝑖𝑖𝑖,𝑡𝑡𝑡𝑡𝑗𝑗𝑗𝑗 = 𝛼𝛼𝛼𝛼0
𝑗𝑗𝑗𝑗 + 𝛼𝛼𝛼𝛼1𝑗𝑗𝑗𝑗𝐼𝐼𝐼𝐼𝑖𝑖𝑖𝑖,𝑡𝑡𝑡𝑡−1𝑗𝑗𝑗𝑗 + 𝛼𝛼𝛼𝛼2
𝑗𝑗𝑗𝑗𝑦𝑦𝑦𝑦𝑖𝑖𝑖𝑖,𝑡𝑡𝑡𝑡 + 𝛼𝛼𝛼𝛼3𝑗𝑗𝑗𝑗𝐴𝐴𝐴𝐴𝑖𝑖𝑖𝑖,𝑡𝑡𝑡𝑡 + 𝛼𝛼𝛼𝛼4
𝑗𝑗𝑗𝑗𝑀𝑀𝑀𝑀𝑖𝑖𝑖𝑖,𝑡𝑡𝑡𝑡 + 𝛼𝛼𝛼𝛼5𝑗𝑗𝑗𝑗𝑈𝑈𝑈𝑈𝑖𝑖𝑖𝑖,𝑡𝑡𝑡𝑡 + 𝛼𝛼𝛼𝛼6
𝑗𝑗𝑗𝑗𝑃𝑃𝑃𝑃𝑖𝑖𝑖𝑖,𝑡𝑡𝑡𝑡 + 𝛼𝛼𝛼𝛼7𝑗𝑗𝑗𝑗𝐷𝐷𝐷𝐷𝑖𝑖𝑖𝑖
𝑗𝑗𝑗𝑗 + 𝛼𝛼𝛼𝛼8𝑗𝑗𝑗𝑗𝐴𝐴𝐴𝐴 + 𝛼𝛼𝛼𝛼9
𝑗𝑗𝑗𝑗𝐵𝐵𝐵𝐵𝑝𝑝𝑝𝑝𝑖𝑖𝑖𝑖,𝑡𝑡𝑡𝑡𝑗𝑗𝑗𝑗
+ 𝛼𝛼𝛼𝛼10𝑗𝑗𝑗𝑗 𝐵𝐵𝐵𝐵𝐸𝐸𝐸𝐸𝑖𝑖𝑖𝑖,𝑡𝑡𝑡𝑡
𝑗𝑗𝑗𝑗 + 𝛼𝛼𝛼𝛼11𝑗𝑗𝑗𝑗 𝑃𝑃𝑃𝑃𝐼𝐼𝐼𝐼𝑖𝑖𝑖𝑖,𝑡𝑡𝑡𝑡
𝑗𝑗𝑗𝑗
where Iij,t is the infrastructure stock of type j needed
in country i at time t; yi,t, Ai,t and Mi,t represent, respec-tively, the GDP per capita and shares of agriculture and manufacture value added in GDP; Ui,t and Pi,t stand for the urbanization rate and the population density; Di
j is the country fixed effect; and t a time trend, used to capture time effect. All the variables in the equation are expressed in natural logarithm to linearize the model.
Integration of climate change in the financing needs
It is assumed that climate proofing will increase capital and maintenance costs of providing infrastructure. For instance, ESCAP’s Survey 2019 assumed that at least 5% of total capital investment is required as the cost of protecting infrastructure against changes in rain-fall and temperature; but for Small Island Developing States, a higher cost of 20% of total capital investment is required given their higher vulnerability to natural disasters. Furthermore, an additional 0.5 percentage points of maintenance cost for new and existing infra-structure is imposed for all countries. Again, for SIDS, we assumed an additional 5% replacement cost to incorporate costs of protecting infrastructure in SIDS from increased tropical cyclone wind intensity.
While sea level rise, coastal erosion, and sea and river flooding induced by climate change do require a huge amount of investment to mitigate losses, a comprehen-sive estimation of related costs would require a close examination of various engineering solutions such as building sea walls and beach nourishment. Thus, in the above standard approach, the actual financing require-ments especially in SIDS concerning climate resilience
could have been underestimated.
Additional insights from water and sanitation and energy costing
Key variables determining cost results can be subject to different levels of uncertainty (table 5). For instance, the unit cost data itself could be subject to some uncer-tainty, especially when it comes to the cost of delivering services to the “last mile” population. Several other vari-ables used, for instance, to project future demand for infrastructure services, could also be subject to uncer-tainty. Finally, the technologies used to provide the services would depend on country context and other factors, including possible change in the relative prices of those technologies. Therefore, ESCAP’s Survey 2019
used different unit costs, such as low- and high-cost options, for water and sanitation and ICT. It also exam-ines different scenarios, for instance in energy cost-ing (table 6). This is important because future energy demand could be met either using more fossil fuels or by switching to renewable energy sources, but only the latter would be consistent with the 2030 Agenda for Sustainable Development.
How do we establish the baseline investment level?
As earlier noted, establishing a clear baseline is chal-lenging for some sectors, whether in terms of how much countries are investing today or will invest through 2030 under a business-as-usual scenario. To begin with, there is no agreed classification of what constitutes an expenditure or investment towards the SDGs. There are data availability challenges as well. For instance, many countries do not have gross fixed cap-ital formation (GFCF) broken down into infrastructure and non-infrastructure investments, public, private and business investment, and investment across sectors such as transport, energy and ICT.
Many countries are still working towards reliable accounting systems to enable them to track public expenditures on specific programmes or policy objec-tives in a detailed way. Of 115 countries surveyed, 67 percent used a functional classification system and only 44 percent used one based on international stan-dards. The number of governments that were able to track expenditures over multi-year periods and across levels of government was even lower.
A GUIDEBOOK FOR ASSESSING SDG INVESTMENT NEEDS 19
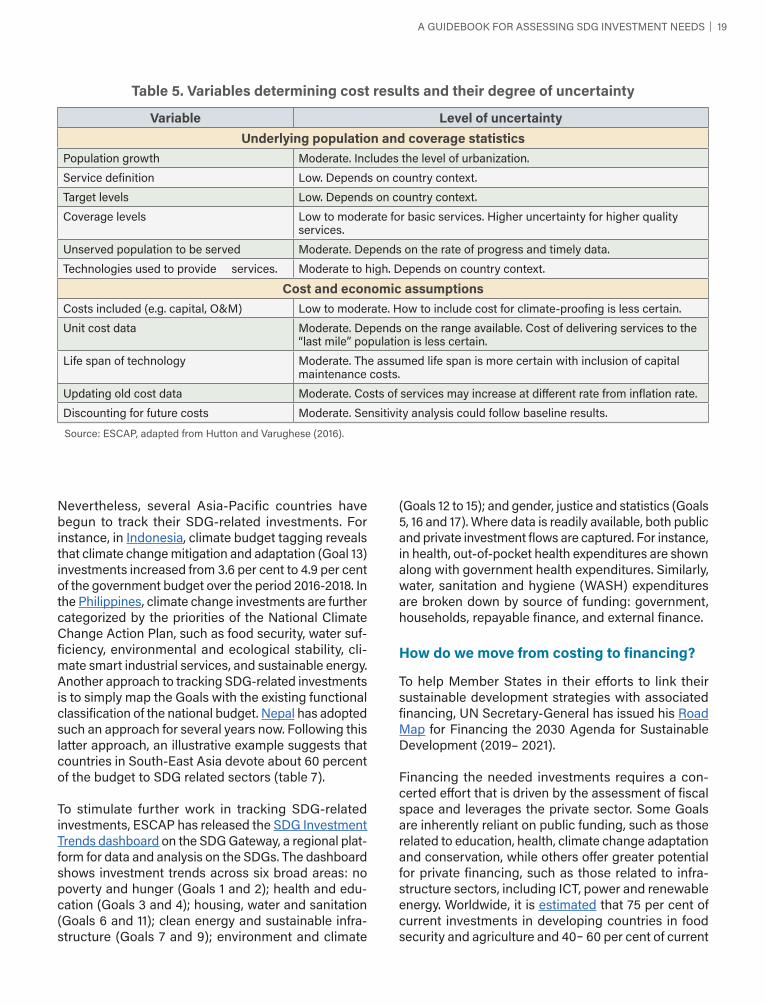
Table 5. Variables determining cost results and their degree of uncertainty
Variable Level of uncertaintyUnderlying population and coverage statistics
Population growth Moderate. Includes the level of urbanization. Service definition Low. Depends on country context. Target levels Low. Depends on country context.Coverage levels Low to moderate for basic services. Higher uncertainty for higher quality
services. Unserved population to be served Moderate. Depends on the rate of progress and timely data. Technologies used to provide services. Moderate to high. Depends on country context.
Cost and economic assumptionsCosts included (e.g. capital, O&M) Low to moderate. How to include cost for climate-proofing is less certain. Unit cost data Moderate. Depends on the range available. Cost of delivering services to the
“last mile” population is less certain. Life span of technology Moderate. The assumed life span is more certain with inclusion of capital
maintenance costs. Updating old cost data Moderate. Costs of services may increase at different rate from inflation rate. Discounting for future costs Moderate. Sensitivity analysis could follow baseline results.
Source: ESCAP, adapted from Hutton and Varughese (2016).
Nevertheless, several Asia-Pacific countries have begun to track their SDG-related investments. For instance, in Indonesia, climate budget tagging reveals that climate change mitigation and adaptation (Goal 13) investments increased from 3.6 per cent to 4.9 per cent of the government budget over the period 2016-2018. In the Philippines, climate change investments are further categorized by the priorities of the National Climate Change Action Plan, such as food security, water suf-ficiency, environmental and ecological stability, cli-mate smart industrial services, and sustainable energy. Another approach to tracking SDG-related investments is to simply map the Goals with the existing functional classification of the national budget. Nepal has adopted such an approach for several years now. Following this latter approach, an illustrative example suggests that countries in South-East Asia devote about 60 percent of the budget to SDG related sectors (table 7).
To stimulate further work in tracking SDG-related investments, ESCAP has released the SDG Investment Trends dashboard on the SDG Gateway, a regional plat-form for data and analysis on the SDGs. The dashboard shows investment trends across six broad areas: no poverty and hunger (Goals 1 and 2); health and edu-cation (Goals 3 and 4); housing, water and sanitation (Goals 6 and 11); clean energy and sustainable infra-structure (Goals 7 and 9); environment and climate
(Goals 12 to 15); and gender, justice and statistics (Goals 5, 16 and 17). Where data is readily available, both public and private investment flows are captured. For instance, in health, out-of-pocket health expenditures are shown along with government health expenditures. Similarly, water, sanitation and hygiene (WASH) expenditures are broken down by source of funding: government, households, repayable finance, and external finance.
How do we move from costing to financing?
To help Member States in their efforts to link their sustainable development strategies with associated financing, UN Secretary-General has issued his Road Map for Financing the 2030 Agenda for Sustainable Development (2019– 2021).
Financing the needed investments requires a con-certed effort that is driven by the assessment of fiscal space and leverages the private sector. Some Goals are inherently reliant on public funding, such as those related to education, health, climate change adaptation and conservation, while others offer greater potential for private financing, such as those related to infra-structure sectors, including ICT, power and renewable energy. Worldwide, it is estimated that 75 per cent of current investments in developing countries in food security and agriculture and 40‒ 60 per cent of current

A GUIDEBOOK FOR ASSESSING SDG INVESTMENT NEEDS20
Table 6. Energy scenarios
Current Policies Scenario
Stated Policies Scenario Sustainable Development Scenario
Definitions Government policies that had been enacted or adopted by mid-2019 continue unchanged.
Existing policies and recently announced commitments and plans, including those yet to be formally adopted, are implemented in a cautious manner.
An integrated scenario specifying a pathway aiming at: ensuring universal access to affordable, reliable, sustainable and modern energy services by 2030 (SDG 7); substantially reducing air pollution (SDG 3.9); and taking effective action to combat climate change (SDG 13).
Objectives To provide a baseline that shows how energy markets would evolve if underlying trends in energy demand and supply are not changed.
To provide a benchmark to assess the potential achievements (and limitations) of recent developments in energy and climate policy.
To demonstrate a plausible path to concurrently achieve universal energy access, set a path towards meeting the objectives of the Paris Agreement on climate change and significantly reduce air pollution.
Source: IEA.
investments in telecommunications, power, and climate change mitigation come from the private sector. In most sectors, developed countries enjoy a higher share of private sector contributions, indicating that there may be room for developing countries to converge towards those levels over time.
The flow of funds involves various sources of funds (public/private and domestic/international) and inter-mediaries that channel available funds to promote sustainable development through a wide range of instruments (figure 13). The magnitude of assets and funds held by private companies, banks and mone-tary authorities in the Asia-Pacific region is very large. The two panels of Figure 14 depict selected indicators on available financing on a stock and flow basis. As shown in panel A, the combined value of international reserves, excluding gold; market capitalization of listed companies; and assets held by financial institutions, insurance companies and mutual, pension and sover-eign wealth funds in developing Asia-Pacific econo-mies is estimated at about $56.2 trillion. This is about 2.6 times the combined GDP values of developing countries in the region in 2016. Similarly, panel B shows that the region exhibits sizeable domestic savings. The combined GDP value after deducting total consump-tion and gross capital formation stood at about $470 billion in 2016.
Part of assets and funds under management by the private sector could potentially be mobilized for devel-opment purposes. For example, an appropriate policy
environment could increase the investments made by institutional investors, such as pension funds and insurance companies, into long-term infrastructure projects. Similarly, listed firms and commercial banks could directly support social inclusiveness and envi-ronmental sustainability through initiatives, such as impact investment and corporate social responsibility.
Given the Government’s prominent role, an important avenue is effective use of available fiscal resources and enhancing the fiscal space. Total spending by general governments amounted to $6.1 trillion in 27 developing Asia-Pacific economies in 2016, which exceeded gov-ernment revenues, resulting in a fiscal deficit of $672 billion. While overall public debt positions seem to be sustainable, the situation may change as Governments step up their efforts to implement the 2030 Agenda and also respond to the impacts of COVID-19 pan-demic. Apart from revenue enhancement, additional public financial resources may be achieved through more effective expenditure management so that greater development impacts could be attained for the same, or an even smaller, amount of fiscal resources. One example is to ensure that public investment in non-fi-nancial assets, which stood at almost $170 billion in 2016 is adequately allocated to development objectives.
In addition to a general assessment of the financial landscape, moving from costing to financing requires examination of specific financing options for specific interventions to achieve specific Goals and targets (table 8). Chapter 2 discusses this in greater detail.

A GUIDEBOOK FOR ASSESSING SDG INVESTMENT NEEDS 21
Domestic and international-enabling environment and policy framework
Domestic publicsources
s Tax revenues Non-tax revenues Public borrowing
Economic dimension
(e.g. transport, energy and ICT infrastructure)
Public entitiess Governmentss National development bankss Aid agenciess International financial institutions
Public entitiess Government spending
s Grants and subsidies
s Concessional and non-concessional loans
Domestic privatesources
s Business earnings Labour incomes Workers’ remittancess Capital gains
International public sources
International private sources
Private entitiess Short-term investors (e.g.
commercial banks, mutual funds, hedge funds)
s Long-term investors (e.g. pension funds, insurance firms, sovereign wealth funds)
s Business companiess Social enterprisess Households
Private and blended entities
s Bank loans s Bondss Equitiess Derivativess Business investments Philanthropys State guarantees
Blended entitiess Special-purpose vehicles for
public-private partnerships s Global development partnerships
Social dimension
(e.g. poverty and inequality)
Environmental dimension
(e.g. climate change adaptation and
mitigation)
SOURCES OF FUNDSINTERMEDIARIES AND INVESTORS
INSTRUMENTS USES AND GOALS
Figure 13. Illustrative flow of funds for development finance in a given country
Source: ESCAP (2018).
Source: ESCAP (2018)
Note: Figures in parentheses indicate the number of Asia-Pacific developing countries on which calculations are based. The data period for most indicators is either 2015 or 2016.
Figure 14. Available financing in Asia-Pacific regionA. Variables presented on a stock basis B. Variables presented on a flow basis

A GUIDEBOOK FOR ASSESSING SDG INVESTMENT NEEDS22
Table 7. SDG related government expenditure (% of GDP)
Relevant SDG Expenditure by function Indonesia Malaysia Philippines Singapore Thailand
General public services 4.88 6.67 7.67 1.18 7.03
Defense 0.86 1.18 0.85 3.21 1.32
16 Public order & safety 1.08 1.13 1.44 1.18 1.15
Economic affairs of which:
2.79 2.84 3.66 2.99 3.44
2 Agriculture, fishing, forestry 0.49 0.80 0.05 1.29
7 Fuel & energy 0.02 0.00 0.31
9 Transport 1.22 2.58 1.66 1.35
9 Communication 0.02 0.04 0.04 0.02
12 to 15 Environment protection 0.19 0.05 0.33 0.04
6, 11 Housing & community amenities 1.36 1.02 0.09 1.23 0.47
3 Health 1.39 1.89 1.03 2.28 1.20
Recreation, culture, & religion 0.16 0.04 0.57 0.30
4 Education 2.67 4.47 4.16 2.92 3.36
1 Social protection 1.19 1.97 1.04 2.90
Total government expenditure of which:
16.57 19.21 20.97 16.92 21.21
SDG related expenditure 9.97 10.25 12.19 10.73 12.09
SDG related, % of total 60% 53% 58% 63% 57%
Source: ESCAP, based on IMF GFS data (accessed: 1 July 2019)
Note: This is only an illustrative estimate, as there is no agreed upon budget classification for SDGs. For Indonesia, it is assumed that expenditures on agriculture, energy, transport and communication make up 75% of expenditures on economic affairs, based on the average ratio of other countries.
How to mainstream SDGs into national budgetary process and fiscal policy?
An increasing number of countries are considering integrating the SDGs into their national budgeting pro-cesses. Of the 64 voluntary national reviews (VNRs) presented at the 2016 and 2017 sessions of the high-level political forum on sustainable development, 23 mentioned ongoing measures to link the Goals to the national budget or that such action had been consid-ered, although these reports are not particularly clear about how and why these measures would be carried out. In addition, an analysis of the 46 VNRs presented in 2018 shows that more than half of the reports (25) contain no information on the inclusion of the Goals in national budgets or budgeting processes. Ten coun-tries, including the Lao People’s Democratic Republic and Sri Lanka, indicated plans to do so. Only six coun-tries, including Viet Nam, reported incorporating the Goals into their budget processes in some fashion. One positive example among the 42 VNRs presented in
2019 was the Philippines, where the decision was taken to create a subgroup focused on the Goals under the national budget coordination committee, consisting of the ministers of planning, finance and budget.
The Goals could be mainstreamed into the different steps in the budget cycle. Budgetary processes vary widely from country to country, and yet they can be defined by four main steps involving different actors. Budget planning and formulation, typically coordinated by finance ministries, occur upstream. The legislature then reviews and amends the budget for approval. The budget is subsequently executed and implemented by various ministries and agencies. The final step, evaluation and oversight, may involve supreme audit institutions.
Countries have taken various approaches to inte-grating the Goals into their budget processes. One approach is the inclusion of qualitative elements of

A GUIDEBOOK FOR ASSESSING SDG INVESTMENT NEEDS 23
Goal achievement in the budget documents submitted to the parliament. In some countries, each ministry is asked to include a short paragraph for each budget proposal on how sustainable development would be reflected in their sectoral policies during the fiscal year. The use of performance indicators based on the Goals in the budget process is another practice. For example, in New Zealand, indicators related to well-being were recently included in the budget process. Some coun-tries comprehensively report on a limited number of cross-cutting priorities, rather than on individual Goals.
Instead of inventing and applying a new fully fledged budget classification, a simpler coding or tagging system could be a good starting point for countries where codes relevant to the Goals have not been integrated into financial management information systems. For instance, in several countries, including India, Indonesia and Thailand, budgeting that is gender responsive or child oriented has been introduced.
Climate or environment budget-tagging systems have also been introduced to monitor and track relevant expenditures. The average proportion of each national budget that is classified as being aligned with climate objectives is between 5 and 10 per cent, though it varies from country to country.
A challenge to consider while introducing this kind of budget coding is that the budget system can become overcrowded with various classifications. To address this matter, one alternative is mapping the Goals to the functional classification of the national budget, as is done in Nepal. Another approach is exemplified in the SDG Action Plan of Japan for 2019, in which the national budget is divided into priority areas which are then linked to relevant Goals.
Efforts to link the budget process with the Goals occur within the context of long-term reforms in public admin-istration and public financial management systems.
Table 8. From costing to financing
Investment area
Targets Interventions Financing options
Other policy considerations
Social protection Universal basic income security throughout the life cycle
Child, orphan and maternity benefits, public works, disability and old-age benefits
Mix of contributory and non-contributory schemes
Protection for those in vulnerable employment; social consensus
Health Universal health coverage
More doctors and nurses, hospitals and clinics, stronger supply chain and information system, equitable access to health care services
Mix of contributory and non-contributory schemes; sin tax
Population-wide preventive outreach; early screening; interventions in non-health sectors
Education Universal pre-primary to upper-secondary education of quality and equity
Higher enrolment, more and better-paid teachers, support for marginalized students
National budget Effective teaching methods and school management
Higher post-secondary education enrolment
National budget and household spending
Water and sanitation
Universal coverage of water and sanitation services
Piped and treated household connection to water supply in rural and urban areas; provision of septic tank in rural area, sewerage with treatment in urban area
Taxes and transfers; service provider tariffs; user investment in self-provision; vendor or supplier finance; microfinance, commercial loans, bonds, equity, blended finance
Participation of local governments and women in WASH management; behavioural change to sustain hygienic practice
Source: ESCAP Survey 2019 technical appendix.

A GUIDEBOOK FOR ASSESSING SDG INVESTMENT NEEDS24
Table 8. From costing to financing
Investment area
Targets Interventions Financing options
Other policy considerations
Energy Universal access to electricity and significant increase in share of renewables
Power generation and distribution; investment in renewables
National budget; leveraging private investment through PPP, loan guarantees, public equity co-investments; renewable energy auction
Long-term and clear energy targets and purchasing policies; preferential tax for renewables; fossil fuel subsidy reformUniversal access to
clean cookingPurchase of clean cooking stoves
Transport Equitable access to urban and rural roads and railways
More paved roads and railways
National budget; PPPs; ODA; project funding (e.g. MDBs)
Urban mobility and cross-border transport; transport safety; climate-resilience
ICT Universal access to fixed and mobile broadband
Increased broadband investment and subscriptions
National budget; PPPs; Universal Access and Services Fund
Regulatory reforms and pricing policy; non-infrastructure measures to close digital divide (e.g. education, business models)
Resources efficiency Lower material input and consumption per GDP unit
Selected interventions in housing, mobility, food and energy
Shifts in consumption behaviours
Climate action Mitigation Additional investment to increase the share of renewable energy in total energy mix, and to procure energy efficient equipment in industry, buildings and transport sectors
National budget; carbon pricing, including carbon tax, emission trading schemes; green bond
Clear policy framework and signals; embed climate change risks in financial regulations; regional cooperation
Adaptation A mark-up based on investment needs to build climate resilience into infrastructure
National budget, PPPs; ODA; project funding (e.g. MDBs)
Biodiversity and ecosystems
Reducing pressure on biodiversity, safeguarding ecosystems
Various actions envisioned under the Strategic Plan for Biodiversity and forest and oceans agreements
National budget; Global Environment Facility
Source: ESCAP Survey 2019 technical appendix.
For instance, programme and performance budgeting and medium-term expenditure frameworks could help strengthen the linkages between policy priorities and the budget. Fiscal transparency and open budget initia-tives could also support the mainstreaming of the Goals and the principles of good governance advocated in Goal 16 into the budget process. At the same time, reforms to implement Goal budgeting should be part of broader reflection on how to best integrate the Goals into national governance systems. For instance, in addi-tion to the national planning and other institutional
arrangements for achieving the Goals, national statis-tical offices and supreme audit institutions have begun to monitor Goal progress and evaluate relevant public interventions.
Fiscal policies could have a significant impact on all the Goals, not only through budget allocation but also through fiscal incentives and corrective taxes (table 9). These can bring about behavioural change and innovation, which are particularly relevant if coun-tries are to reverse negative trends, such as in the
(continued)

A GUIDEBOOK FOR ASSESSING SDG INVESTMENT NEEDS 25
environment-related Goals, as well as accelerate pos-itive trends. At the same time, reducing inequalities will require careful designing of the fiscal system, with redistributive policies that take into account the effects of taxes (by identifying who bears the burden) and expenditures (by identifying who benefits).
What role for the financial sector and private investment?
Achieving the Goals also requires major changes in the financial system. In his Road Map for Financing the 2030 Agenda, the UN Secretary-General calls upon policymakers and regulators to (a) price externalities into the economic and financial system; (b) integrate environmental, social and governance issues into the concept of fiduciary duty; and (c) put in place policies and regulations that create incentives for long-term market investment in climate-resilient infrastructure and for divestment from carbon-intensive technologies.
A global stocktaking reveals that policy and regula-tory action to align the financial system with sustain-able development accelerated significantly in recent years, in an increasing number of countries and cut-ting across wide asset classes. Measures in devel-oping countries, including in the Asia-Pacific region, are focused on the banking, insurance and securities sectors, whereas measures in developed countries are highly concentrated in the investment and securities sectors, reflecting an early development of respon-sible investing markets. Several countries have also introduced system-level actions, such as national road maps and strategies and prudential risk assessments, which have an impact on more than one asset class.
In the banking sector, which still dominates the finan-cial system in most developing countries in the region, there are several examples of measures to align finan-cial systems with sustainable development. In China, the Green Credit Guidelines have had a significant impact on the flow of capital to high-polluting indus-tries. In India, priority sector lending requirements are now being updated to include capital for renewable energy investment. In Indonesia, a road map has been
developed to create a green banking framework aimed at developing capacities for environmental risk assess-ment and green lending with compulsory elements. In Bangladesh, the banking sector is a key focus for fiscal support schemes to reduce barriers to financing green assets, such as preferable refinancing rates.
Nevertheless, there is a need for a more fundamental shift away from making the business case for sustain-ability and towards making the sustainability case for business. Whereas the former advocates that the finan-cial sector only address sustainability issues that con-tribute to its financial bottom lines, the latter is based on the idea that the financial sector should start using the main sustainability issues as its starting point, then develop products and services that can address those issues and that are financially attractive at the same time. Table 10 illustrates products and services that may be relevant to various Goals. For instance, while it is true that for biodiversity- and ecosystem- related financing (Goals 14 and 15), public finance still plays the central role, conservation investment, or intention-ally investing in companies, funds and organizations with a view to generating both a financial return and a measurable environmental result, is growing rapidly.
At the same time, it is important that countries main-stream the SDGs in investment policies. UNCTAD analysis finds that while many national strategies on sustainable development highlight the need for addi-tional financial resources, very few contain concrete road maps for the promotion of investment in the SDGs. There is, however, much scope for improvement. A variety of investment policy instruments in both host and home economies apply to SDG sectors. These instruments include in particular, investment incen-tives, investment facilitation and outward investment promotion. Other policy tools regulate or restrict the entry of investment in any sector judged potentially harmful to sustainable development. Entry rules may also limit access for foreign investors to certain SDG sectors or subject them to a national security-related screening mechanism. In addition to policies taken at the national level, there is also a role for international investment agreements (table 11).

A GUIDEBOOK FOR ASSESSING SDG INVESTMENT NEEDS26
Table 9. How fiscal policies can support SDG progress
Goal 1: No Poverty 9 Fiscal policies can reduce poverty through direct and indirect channels, the latter including growth-enhancing spending (e.g. education and infrastructure) and macroeconomic stabilization (e.g. stimulus measures to minimize job loss during downturns). 9 The former includes budgetary allocation to poverty alleviation programmes such as cash transfers, food or other in-kind transfers, public workfare, and fee waivers for health services. To be cost-effective, however, better coordination and targeting are needed.
Goal 2: Zero Hunger 9While the bulk of investment in agriculture is carried out by private agents, especially by farmers themselves, provision of certain goods and services require public investment; for instance, there are natural monopolies such as irrigation systems. 9 Fiscal policies can help end hunger and malnutrition through budgetary allocations for nutrition-specific interventions, which are known for high benefit-cost ratios. At the same time, taxing less healthy foods could create a financial incentive for consumers to avoid them.
Goal 3: Good Health and Well-Being 9 Public spending on health is central to universal health coverage. Countries with limited financial resources can first expand primary health services (e.g. contraceptives, basic vaccination). Co-payment can also help limit unnecessary services or overutilization. 9 Fiscal policies can also influence public health outcomes through taxes on tobacco, alcohol and sugar. Budgetary support to other sectors such as nutrition and water, sanitation and hygiene infrastructure could also have positive impacts on health.
Goal 4: Quality Education 9National budgets account for about 80 percent of education spending globally, especially for pre-primary, primary and secondary education. For equity in education, support for the marginalized groups will be critical. 9 To improve learning outcomes, spending on teacher training, curriculums and textbooks matter as much as teacher salaries. Fiscal support is also needed for vocational training and scholarships in higher education.
Goal 5: Gender Equality 9Gender-responsive budgeting is not about creating separate budgets for women, or solely increasing spending on women’s programs. Rather, it seeks to ensure that public finances contribute to advancing gender equality and women’s empowerment. 9 Taxing individual rather than family income could encourage women to join the labour force.
Goal 6: Clean Water and Sanitation 9 Fiscal reforms (e.g. taxes on water abstraction, regulatory levies, subsidies) and water pricing policies (e.g. water supply and sanitation tariffs) can improve water quality (6.3), increase water-use efficiency (6.4) and generate revenues to improve access (6.1). 9 Budget reforms (i.e. subsidies, tax exemptions) in other sectors (e.g. agriculture, energy) can increase the effectiveness of water-related public expenditure, supporting SDG6.
Goal 7: Affordable and Clean Energy 9 Fiscal policies (e.g. energy taxes, carbon pricing mechanisms, incentives for renewables) can support renewable energy generation (7.2), improve energy efficiency (7.3), generate revenues to improve access (7.1), and stimulate private investment in energy infrastructure and clean energy technology (7.a). 9 Budget reforms (i.e. subsidies, tax exemptions) in the energy sector can level the playing field for clean energy, supporting SDG7 and SDG12.

A GUIDEBOOK FOR ASSESSING SDG INVESTMENT NEEDS 27
Table 9. How fiscal policies can support SDG progress
Goal 8: Decent Work and Economic Growth 9 Fiscal policies can catalyse innovation in efficient technologies and generate higher levels of economic productivity (8.2). 9 Fiscal policies can improve global resource efficiency in consumption and production (8.4). 9 Fiscal policies can enable a reduction in more distorting taxes (e.g. on labour) which could increase incentives for employment and support full employment (8.5).
Goal 9: Industry, Innovation and Infrastructure 9 Fiscal policies can generate resources and create incentives for private investment in R&D for green technologies, support infrastructure upgrades, stimulate adoption of clean and environmentally sound technologies and industrial processes (9.4).
Goal 10: Reduced Inequalities 9 Revenues from fiscal reforms can be used to compensate low-income households, mitigate social impacts or support clean technology adoption (i.e. insulation, low-energy light bulbs), thus supporting social protection and greater equality (10.4). 9 Reforming fossil fuel subsidies (12.c) can reduce inequalities as these subsidies mainly benefit prosperous firms and consumers, supporting SDG10.
Goal 11: Sustainable Cities and Communities 9 Fiscal policies (e.g. landfill taxes, incineration taxes, air pollution charges, congestion charges, vehicle taxes) can improve air quality, municipal and other waste management and reduce adverse per capita environmental impacts of cities (11.6).
Goal 12: Responsible Consumption and Production 9 Fiscal policies (e.g. taxes/fees on forestry and fisheries, material taxes, waste taxes, product taxes, air pollution charges) can incentivize sustainable management and efficient use of natural resources (12.2), reduce the release of chemicals (12.4), food waste (12.3) and waste generation (12.5). 9 Restructuring taxes and phasing out harmful fossil fuel subsidies can reduce wasteful consumption (12.c) and enhance the effectiveness of public spending.
Goal 13: Climate Action 9 Revenues from fiscal instruments can support investments to strengthen resilience and adaptive capacities (13.1), contribute to climate financing pledges (13.a) and build capacities (13.b). 9 Fiscal incentives (e.g. vehicle taxes) can shift consumer behaviour towards low-carbon choices, complementing efforts to improve education and raise awareness on climate change (13.3).
Goal 14: Life Below Water 9 Fiscal policies (e.g. plastic bag taxes, charges on ship-emissions, levies on marine aggregates) can help prevent and reduce marine pollution (14.1) and support sustainable management and protection of marine and coastal ecosystems (14.2). 9 Eliminating fisheries subsidies (14.6) will support SDG14.
Goal 17: Partnerships for the Goals 9 Fiscal policies strengthen domestic resource mobilization (17.1) 9 Fiscal policies can help mobilize other sources of financing, including from the private sector (17.3) 9 Fiscal restructuring or reform optimizes state revenues, controls budget deficits and reduces debt-to GDP ratios, and can contribute to long-term debt sustainability (17.4.) 9 Fiscal incentives for clean technologies can stimulate the development, transfer, dissemination and diffusion of environmentally sound technologies (17.7).
Source: ESCAP (2019).
(continued)

A GUIDEBOOK FOR ASSESSING SDG INVESTMENT NEEDS28
Table 10. Financial products and services addressing the SDGs
Sustainable Development Goal Products and Services
1 No poverty Private international development finance through impact investing 2 Zero hunger Microfinance for smallholder farmers3 Good health and well-being Health-care investments4 Quality education Philanthropy donations to schools5 Gender equality Microfinance and lending to women and female entrepreneurs 6 Clean water and sanitation Socially responsible mutual funds investing in water 7 Affordable and clean energy Renewable energy investment 8 Decent work and economic growth General investments into the real economy
9 Industry, innovation and infrastructure Project finance and commercial lending integrating social and environmental criteria for lending decisions
10 Reduced inequalities Fair payment of financial sector employees 11 Sustainable cities and communities Mortgage lending
12 Responsible consumption and production Socially responsible investing
13 Climate action Climate finance14 Life below water
Financing ecological services15 Life on land16 Peace, justice and strong institutions Lending to public institutions
Source: Olaf Weber, “The financial sector and the SDGs: Interconnections and future directions,” CIGI.
Table 11. Policy instruments concerning investments in the SDGs
National policies for promoting investment in SDG sectorsInvestment incentives of host countries
• Incentives to attract SDG-related projects• Conditioning incentives on SDG-related investor performances • SEZs focusing on SDGs
Investment targeting, facilitation and aftercare
• Specific targeting of SDG-related investment• Preparation of SDG project pipelines • Image-building (advertising host economy as an SDG champion)• Priority treatment by local IPAs in the establishment process of SDG investment • Aftercare services after establishment of SDG investors
Investment guarantees and loans for outward investments related to the SDGs
• Conditioning investment guarantees and loans to prior environmental and social impact assessment
• Liking guarantees and loans to SDG-related investor performance • Providing guarantees and loans exclusively for investments in SDG sectors
National policies for regulating the entry of investment for SDG purposes or in SDG sectorsRules regarding entry and admission of foreign investment
• SDG-related approval requirements for investment • Full or partial entry restrictions in SDG-relevant sectors • National security-related FDI screening mechanism covering SDG-relevant sectors
International investment agreementsPromotes and protects foreign investment
• Flag SDGs as a core treaty objective • Confirm contracting parties’ right to regulate• Prohibit lowering of environmental and social standards as a means for attracting
investment
Source: UNCTAD (2020).

A GUIDEBOOK FOR ASSESSING SDG INVESTMENT NEEDS 29
END POVERTY IN ALL ITS FORMS EVERYWHERE
Where we stand
Relatively good progress but not on track at the Asia-Pacific regional level. Least developed countries have made minimal progress. Indicators related to income pov-erty are on track, but those related to social protection coverage, water and sanitation and natural disasters are off track (figure 1).
Social protection expenditures range from about 15 per-cent of GDP in Kyrgyzstan to less than 1 percent in Lao PDR (figure 2). But most of these are social insurance, pri-marily pension for public sector and formal private sector employees. Social assistance spending remains very low, with large segments of society not covered by any scheme.
Going forward, countries can enhance poverty gap trans-fers; preliminary estimates suggest that such transfers can be implemented with relatively little resources and primarily targeted to rural populations (figure 3). However, given the expected poverty impact of the COVID-19 shock, the cost of implementing poverty gap transfers may now be higher than previously (figure 4). Establishing a uni-versal social protection floor as per SDG target 1.3 would require more resources; preliminary estimates based on national poverty lines (table 1) suggest that countries such as Afghanistan, Bangladesh and Myanmar would require more than 6 percent of GDP per year but most middle-in-come countries would require less (figure 3).
Overview of costing approaches
Putting a price tag on Goal 1 is difficult because pov-erty is an outcome of various factors such as average improvements in standards of living, distribution of income and opportunities, and protection from shocks. Here we highlight two broad approaches. The first approach is to improve average standards of living, which may be par-ticularly relevant for least developed countries and others with high incidence of poverty. The second, and comple-mentary, approach is to enhance social protection through
CHAPTER 2.GOAL BY GOAL

A GUIDEBOOK FOR ASSESSING SDG INVESTMENT NEEDS30
1.1.1 International poverty
1.2.1 National poverty
1.3.1 Social protection
1.4.1 Access to basic water and sanitation services
1.5.1 Deaths/missing/affected from disasters
1.5.2 Economic loss from disasters
1.a.2 Government spending on education and health
20192000 Target 2030
Figure 1. Progress at the indicator level
Figure 3. Investment needs
Figure 2. Investment trends
Note: Figure 3 shows poverty gap transfer based on $1.25 PPP threshold. See FAO, IFAD and WFP (2015) for details.

A GUIDEBOOK FOR ASSESSING SDG INVESTMENT NEEDS 31
Table 1. Menu of policy options
Tem
pora
ry a
djus
tmen
ts o
f exi
stin
g sc
hem
es
1.1 Coverage extension to new beneficiaries Indonesia: The government has injected 1.5 trillion rupiah (US$104 million) into its subsidized housing program which is expected to cover financing for a further 175,000 new households. 800 billion rupiah (US$55 million) will be used to cover interest payments with the rest going to paying for subsidies.
1.2 Increase of the current benefit levels
1.2.1 Temporary increase of the minimum benefit
Turkey: Lowest retirement pension to be increased to 1,500 lira ($232) and holiday bonus for retirees to be paid in April.
1.2.2 Temporary flat increase to all beneficiaries
Argentina: The National Social Security Administration (ANSES) will disburse a special lump sum benefit of up to 3,000 pesos ($47), or for an amount equivalent to the monthly non-contributory benefit for more than 9 million beneficiaries. The latter include retired persons, contributory and non-contributory pensioners, children benefiting from child benefits (Asignación Universal por Hijo (AUH) – and pregnant women (those benefiting from Asignación Universal por Embarazo).
Colombia: additional grants will be made to all the beneficiaries of the Familias en Acción, Jóvenes en Acción, y Adulto Mayor.
Trinidad and Tobago: Additional financial support to recipients of the Public Assistance and Disability Assistance Grants (including the DAG for children), a top up equivalent to the sum of the full three (3) months, depending on the size of the family, to be paid by April 15 2020. Payment for the full three months to be made, $150.00, $300.00 or $450.00 depending on the size of the household.
1.3 Temporary subsidy for employer liability benefits
Sweden: The decision means that workers will get sickness benefits from the moment they have to be absent from work due to illness (instead of the second day), and the state rather than employers will foot the bill for the cost of the first day.
Tem
pora
ry a
djus
tmen
ts o
f exi
stin
g sc
hem
es
1.4 Introduction of a new benefit for existing contributors
1.4.1 Temporary flat benefit for contributors
Australia: About 6.5 million Australians will get a one off $750 payment as part of the Government’s response to coronavirus (COVID-19).
1.4.2 Temporary salary subsidy for contributors
Bahrain: A total of 100,000 Bahraini private sector employees, registered with the Social Insurance Organisation, will have their April, May and June salaries covered by the fund at a cost of BD 215 million, with a monthly average surpassing BD 70 million.
1.5 Adjustments to unemployment schemes
1.5.1 Special financial support for unemployment scheme members
Spain: Laid off workers will likewise be able to access unemployment benefits.
1.5.2 Reduction in working time paid by unemployment insurance (partial unemployment benefit)
Netherlands: Employers can apply for a permit for a reduction in working time (werktijdverkorting) at the Ministry of Social Affairs and Employment, i.e., employees will temporarily work on a reduced schedule. Employees can receive a temporary unemployment benefit for hours not worked, while they remain fully employed. The permit is valid for a period of a maximum of 6 weeks and can be extended for a maximum total period of 24 weeks. Employers must meet the following conditions: (i) the company has been affected by a situation that does not fall under the ordinary business risks (such as COVID-19); (ii) during a period of 2 to 24 weeks sales are at least 20% lower than normal
1.6 Adjustments to sickness benefit schemes
1.6.1 Waving of the waiting period for sick leave benefit
United Kingdom: ensuring that people receive Statutory Sick Pay (SSP) from the first day that they are off work
Canada: The usual one-week waiting period will be waived for people who are in quarantine or have been directed to self-isolate and are claiming for Employment Insurance (EI) sickness benefits (estimated cost of $5M). Eligible workers with no or limited paid-leave benefits through their employers can apply for up to 15 weeks of employment insurance if they cannot work for medical reasons such as cancer, a broken leg, or in this case, being quarantined in a public-health threat. The current EI payment is 55 percent of earnings up to a maximum of $573 a week

A GUIDEBOOK FOR ASSESSING SDG INVESTMENT NEEDS32
Table 1. Menu of policy options
Intro
duct
ion
of n
ew b
enef
it pr
ogra
mm
es
2.1 New universal lump sum benefit Hong Kong: HK $ 10,000 (approximately NT $ 39,000) will be issued to Hong Kong permanent residents over 18 years of age. The measures are expected to benefit about 7 million people and require a budget of about 71 billion yuan
2.2 Focused lump sum benefit to:
2.2.1 Self employed Spain: All self-employed workers with severe losses will be able to access a special benefit
2.2.2 Older persons Armenia: Lonely elderly people will be provided with food baskets for one month.
2.2.3 Specific vulnerable groups
Philippines: Around 18 million low-income households belonging to the informal sector should be targeted to receive monthly emergency subsidies amounting to P5,000 to P8,000 for two months.
Intro
duct
ion
of n
ew b
enef
it pr
ogra
mm
es
2.3 Prophylactic paid leave
2.3.1 As a flat benefitSouth Korea: allocated a nearly 20 trillion won support package to respond to the COVID-19 outbreak. This includes giving parent employees up to 5 days of childcare leave along with the pay of 50,000 won per day, respectively
2.3.2 As a salary replacement benefit
Portugal: Announced plans on 13 March 2020, to provide exceptional financial support for employees who have to stay at home to accompany their children up to 12 years old in the amount of 66% of the basic remuneration (33% paid by the employer, 33% paid by Social Security)
2.4 Temporary wage subsidy (for job protection)
Denmark: Under the three-month aid period that will last until June 9, the state offers to pay 75% of employees’ salaries at a maximum of 23,000 Danish crowns ($3,418) per month, while the companies pay the remaining 25%.
Bulgaria: The measures include increasing the capital of state-owned Bulgarian Development Bank (BDB) to help businesses affected by the COVID-19 pandemic, government-backed payment of 60% of the salaries of employees who might otherwise be fired
Australia: The Government is providing up to $100,000 to eligible small and medium sized businesses, and not for-profits (including charities) that employ people, with a minimum payment of $20,000

A GUIDEBOOK FOR ASSESSING SDG INVESTMENT NEEDS 33
means-tested or universal benefits. Other channels of reducing poverty such as rural development and equi-table access to healthcare and education are discussed under other Goals. To address poverty in all its forms, a comprehensive approach is needed, one which prior-itizes leaving no one behind (LNOB) in all investment decisions.
Growth-induced poverty reduction
Devarajan et al. (2002) estimated the costs of reaching the MDG poverty-reduction goal by first calculating the GDP growth needed to reduce poverty in each country by applying an estimated growth elasticity of poverty, and then calculating the investment needed to achieve the growth using a fixed incremental capi-tal-output ratio. Neither poverty reduction nor growth follows these linear patterns. Nevertheless, this could be a simple way of quantifying economy-wide invest-ment needed to reduce income poverty. Given that poverty rates vary within countries as well (e.g. between rich and poor provinces), it may be applied to calcu-late investment needed for geographically equitable growth. As discussed later, this approach is also appli-cable to Goal 2 nutrition target and Goal 8 GDP growth target for least developed countries.2
Poverty gap transfers
Here we take the poverty rate as a given, and calcu-late the amount of transfers needed to close the gap between earned incomes and the poverty line. This approach accounts for the fact that economic growth will continue to lift many, but not all, out of poverty. It also accounts for the fact that people will often fall back into poverty due to shocks such as natural disasters. FAO, IFAD and WFP (2015) applied an international poverty line of $1.25 PPP a day to define the beneficiary population. However, the benefit level was 40 percent higher, at $1.75 PPP a day to deal with real income shocks, unforeseen expenditure needs or price spikes. The total cost also includes a 20 percent markup for administrative costs and leakages.
2 For instance, based on similar insights but using macroeconomic modelling, UN-OHRLLS (2017) estimated that in order to achieve an average rate of GDP growth of 7 percent per annum, the average rate of investment growth in the least developed countries as a whole would need to increase to about 10 percent per annum over the period 2016-2020, which entails an increase of about 2.4 percentage points, relatively to the baseline period (2011-2015).
Figure 4 shows preliminary estimates by ESCAP for selected least developed countries, based on Povcal data and assuming a 10 percent contraction in household income or consumption due to the COVID-19 shock.
ESCAP (forthcoming) assesses the short-term impact of the COVID-19 pandemic on monetary poverty in Asia-Pacific least developed coun-tries using survey-based income distribution data obtained from the World Bank’s PovcalNet dataset. It finds that under the scenario of 10 per cent income contraction, 11.3 million and 24.3 mil-lion people would fall into poverty based on the $1.90 and $3.20 poverty line, respectively, in these countries. As a result, the the poverty rates would increase from the pre-pandemic level of 12.3% to 16.7% in 2020 based on the $1.90 poverty line and from 34.5% to 42.4% based on the $3.20 poverty line.
If Asia-Pacific least developed countries were to “fill” these poverty gaps by direct cash trans-fers (following the SDG costing framework of the Economic and Social Survey of Asia and the Pacific 2019), these countries would need to mobilize $500 million in 2020 to close the poverty gap with the $1.90 poverty line, which is more than twice the estimate before the pandemic. If the $3.20 poverty line is used - a more suitable poverty line for lower middle-income countries - $20.1 billion would be needed. This amount is equivalent to 1.7% of the aggregated GDP and $7.8 billion greater than the pre-pandemic requirement. In least developed countries, where no adequate unemployment insurance is typically in place, these direct cash transfers would be necessary to avoid people from falling into poverty.
Figure 4 Poverty gap transfer with COVID-19 shock
(based on $3.20 PPP threshold; Percentage of GDP)
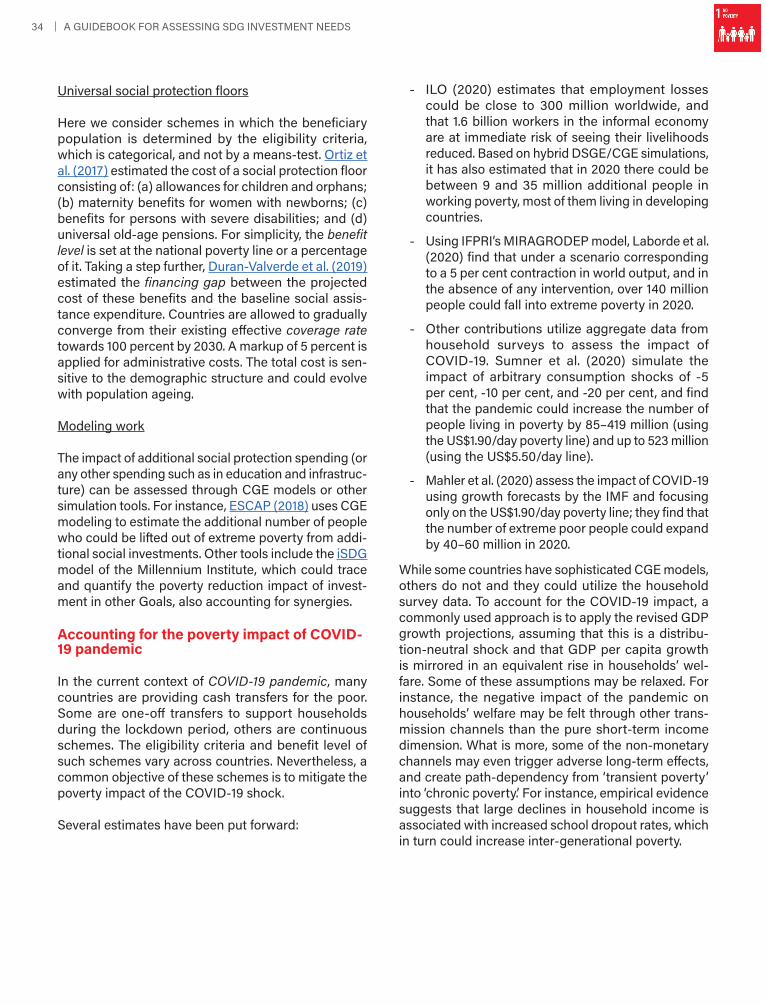
A GUIDEBOOK FOR ASSESSING SDG INVESTMENT NEEDS34
Universal social protection floors
Here we consider schemes in which the beneficiary population is determined by the eligibility criteria, which is categorical, and not by a means-test. Ortiz et al. (2017) estimated the cost of a social protection floor consisting of: (a) allowances for children and orphans; (b) maternity benefits for women with newborns; (c) benefits for persons with severe disabilities; and (d) universal old-age pensions. For simplicity, the benefit level is set at the national poverty line or a percentage of it. Taking a step further, Duran-Valverde et al. (2019) estimated the financing gap between the projected cost of these benefits and the baseline social assis-tance expenditure. Countries are allowed to gradually converge from their existing effective coverage rate towards 100 percent by 2030. A markup of 5 percent is applied for administrative costs. The total cost is sen-sitive to the demographic structure and could evolve with population ageing.
Modeling work
The impact of additional social protection spending (or any other spending such as in education and infrastruc-ture) can be assessed through CGE models or other simulation tools. For instance, ESCAP (2018) uses CGE modeling to estimate the additional number of people who could be lifted out of extreme poverty from addi-tional social investments. Other tools include the iSDG model of the Millennium Institute, which could trace and quantify the poverty reduction impact of invest-ment in other Goals, also accounting for synergies.
Accounting for the poverty impact of COVID-19 pandemic
In the current context of COVID-19 pandemic, many countries are providing cash transfers for the poor. Some are one-off transfers to support households during the lockdown period, others are continuous schemes. The eligibility criteria and benefit level of such schemes vary across countries. Nevertheless, a common objective of these schemes is to mitigate the poverty impact of the COVID-19 shock.
Several estimates have been put forward:
- ILO (2020) estimates that employment losses could be close to 300 million worldwide, and that 1.6 billion workers in the informal economy are at immediate risk of seeing their livelihoods reduced. Based on hybrid DSGE/CGE simulations, it has also estimated that in 2020 there could be between 9 and 35 million additional people in working poverty, most of them living in developing countries.
- Using IFPRI’s MIRAGRODEP model, Laborde et al. (2020) find that under a scenario corresponding to a 5 per cent contraction in world output, and in the absence of any intervention, over 140 million people could fall into extreme poverty in 2020.
- Other contributions utilize aggregate data from household surveys to assess the impact of COVID-19. Sumner et al. (2020) simulate the impact of arbitrary consumption shocks of -5 per cent, -10 per cent, and -20 per cent, and find that the pandemic could increase the number of people living in poverty by 85–419 million (using the US$1.90/day poverty line) and up to 523 million (using the US$5.50/day line).
- Mahler et al. (2020) assess the impact of COVID-19 using growth forecasts by the IMF and focusing only on the US$1.90/day poverty line; they find that the number of extreme poor people could expand by 40–60 million in 2020.
While some countries have sophisticated CGE models, others do not and they could utilize the household survey data. To account for the COVID-19 impact, a commonly used approach is to apply the revised GDP growth projections, assuming that this is a distribu-tion-neutral shock and that GDP per capita growth is mirrored in an equivalent rise in households’ wel-fare. Some of these assumptions may be relaxed. For instance, the negative impact of the pandemic on households’ welfare may be felt through other trans-mission channels than the pure short-term income dimension. What is more, some of the non-monetary channels may even trigger adverse long-term effects, and create path-dependency from ‘transient poverty’ into ‘chronic poverty.’ For instance, empirical evidence suggests that large declines in household income is associated with increased school dropout rates, which in turn could increase inter-generational poverty.

A GUIDEBOOK FOR ASSESSING SDG INVESTMENT NEEDS 35
Policy and financing options
Establishing a nationally appropriate social protection system, including floors (target 1.3), requires sufficient national dialogue. Coordination across government ministries and between national and subnational levels would be important to ensure coherent delivery of enti-tlements and to avoid fragmentation, exclusion and overlaps. Successful country experiences show that universal schemes can be affordable, through such measures as reprioritization of budgets and reduc-ing leakage through such schemes as direct benefit transfer.
Expanding coverage to the large informal sector remains a challenge, although countries such as China and Thailand have been able to establish universal healthcare and pension schemes through a combina-tion of contributory and non-contributory approaches. There are innovative approaches to expand coverage, such as employment injury insurance in Bangladesh and Malaysia and the rural employment guarantee in India.
Tools
ILO’s Social Protection Floor Calculator
ILO launched in 2017 an easy-to-use online tool to esti-mate the cost of a social protection floor consisting of: (a) allowances for children and orphans; (b) maternity benefits for women with newborns; (c) benefits for per-sons with severe disabilities; (d) universal old-age pen-sions; and (e ) public works / unemployment benefit. The tool allows the user to make certain adjustments.
For instance, for children allowances, different age groups can be selected (0-4, 5-9 and 10-14) and it could be universal or directed to the poor. The benefit level could be set at the national poverty line or a percentage of it, the minimum salary or the international poverty threshold. For pensions, the tool also allows one to subtract existing provisions.
Most recently, ILO also released a spreadsheet model to support countries to make rapid adjustments to existing social protection systems in response to the COVID-19 crisis. Users can download the model and take the following steps:
1. Complete the parameters: nominal GDP, govern-ment expenditures, monthly poverty line, and total population. This information is used to calculate a basic set of output indicators useful for decision making.
2. Go to the main menu, which lists possible policy response measures, with examples of actions taken by countries. The user can select the measures that most closely match the scenario to be assessed (see below table). The measures are classified in two main groups: (i) extensions of existing benefit schemes, and (ii) introduction of new benefits/ programmes.
3. Once a particular policy option is decided, go to the corresponding excel sheet and enter the policy parameters that are required. Then enter the sup-porting data required to make the calculations.

A GUIDEBOOK FOR ASSESSING SDG INVESTMENT NEEDS36
Table 2. National poverty lines and GDP per capita
Country National poverty line per year (in LCU)
GDP per capita (in LCU)
Ratio
East and North-East Asia China 9,984 43,745 0.23
South-East Asia Cambodia 1,763,131 5,193,484 0.34 Indonesia 4,276,296 45,728,103 0.09 Lao PDR 2,614,712 13,025,267 0.20 Malaysia 13,606 36,644 0.37 Philippines 10,969 128,890 0.09 Thailand 23,522 217,410 0.11 Viet Nam 9,544,290 44,078,168 0.22
South and South-West Asia Afghanistan 23,932 38,034 0.63 Bangladesh 33,230 78,065 0.43 Bhutan 23,458 147,749 0.16 India 18,898 70,729 0.27 Nepal 24,275 68,763 0.35 Pakistan 30,453 167,520 0.18 Sri Lanka 48,403 500,441 0.10 Turkey 6,692 26,684 0.25
North and Central Asia Armenia 500,033 1,561,933 0.32 Azerbaijan 1,657 7,320 0.23 Georgia 1,762 8,039 0.22 Kazakhstan 153,128 2,281,037 0.07
Kyrgyzstan 32,256 70,035 0.46
Source: Calculation done by Ortiz et al. (2018) based on UN World Population Prospects, IMF World Economic Outlook, ILO World Social Protection Database, OECD, national sources.
Note: The national poverty lines in this table refer to absolute poverty lines reflect poverty lines used in official national reports; in local currency units (LCU) per adult, per year, updated to the year 2015, using the respective CPI change. Absolute poverty lines are aimed to all basic needs, meaning they are different (higher) than the food poverty line. Except for China, Japan, India, and Turkey, the national poverty lines refer to relative poverty lines which correspond to 50 per cent of the median equivalent disposable income.

A GUIDEBOOK FOR ASSESSING SDG INVESTMENT NEEDS 37
Where we stand
Despite progress, not on track at the Asia-Pacific regional level. Indicators related to undernourishment and stunting are on track, but those related to food insecurity, malnu-trition, and sustainable agriculture (e.g. cereal yield, GHG emissions, AOI) are off track.
Globally, investment in agriculture, forestry and fishing has increased slightly, to about $240 billion in 2015-2016. While the bulk of investment in agriculture is carried out by private agents, especially by farmers themselves, provision of certain goods and services such as irrigation systems require public investment. However, in the Asia-Pacific region, the agriculture sector receives a lower share of government spending relative to its economic value, as shown by the Agricultural Orientation Index being less than 1 in all developing countries (figure 1).
Going forward, ESCAP’s Survey 2019 estimated that addi-tional investment of some $20.6 billion per year is needed to boost agricultural productivity and boost incomes of small-scale food producers, with much of this need con-centrated in South Asia (figure 2). At the same time, with more than 400 million people undernourished in the Asia-Pacific region, nutrition-specific interventions, including those targeting the first 1,000 days of a child’s life, are needed. Survey 2019 estimated that $3.5 billion per year is needed for basic nutrition interventions (figure 3).
Costing methodology
Investments to achieve Goal 2 need to address the chal-lenges of existing nutritional deficits, expanding popu-lations, changing diets, the impact of climate change, competing use of land and land degradation, among others. The literature provides a wide range of cost estimates for ending hunger. Here we explain costing approaches for investments in agriculture and other sectors to end hunger and nutrition-specific interventions.
Growth-induced hunger reduction
Building on earlier FAO studies, Schmidhuber and Bruinsma (2011) estimated the incremental annual public investment needed to eradicate hunger, by examining pri-ority areas such as rural infrastructure and markets, natural resource conservation, R&D and extension, and building
END HUNGER, ACHIEVE FOOD SECURITY AND IMPROVED NUTRITION AND PROMOTE SUSTAINABLE AGRICULTURE

A GUIDEBOOK FOR ASSESSING SDG INVESTMENT NEEDS38
2.1.1 Prevalence of undernourishment
2.1.2 Moderate or severe food insecurity in the population
2.2.1 Prevalence of stunting
2.2.2 Prevalence of malnutrition
2.3.P1 Cereal yield
2.4.P1 Greenhouse gas (GHG) emissions from agriculture
2.a.1 Agriculture orientation index
2.a.2 Flows to agriculture sector (LDCs)
20192000 Target 2030
Figure 1. Progress at the indicator level
Figure 2. Investment trendsAgricultural Orientation Index (AOI), 2015-2017 average
rural institutions. FAO, IFAD, and WFP (2015) took a similar approach but applying the food consumption projections obtained using the Global Agriculture Perspectives System (GAPS) model. This model is built with a causal relationship that investment in agriculture and other sectors is expected to increase GDP and per capita income, which in turn increases per capita con-sumption and hence an average dietary energy con-sumption (DEC) of undernourished people, which then results in change in prevalence of undernourishment.
It assumes that:
Hunger is mainly caused by poverty or lack of purchasing power.
Variability in the distribution of DEC across the national population is captured by an estimate of the coefficient of variation (CV) of the distribution.
The minimum threshold of undernourishment, below which it is not possible to go simply by

A GUIDEBOOK FOR ASSESSING SDG INVESTMENT NEEDS 39
means of growth or GDP expansion, is set to be 5 percent of the population.
The additional investment required to achieve the additional GDP is then calculated assuming a plausible set of gross incremental capital output ratios (ICORs).
The general approach to assessing investment needs to end hunger is as follows:
Estimate the average DEC required by 2030 so that there is less than 5 percent of under-nourishment.
Calculate how much per capita income is required to meet the average DEC, using the FAO GAPS model. This model also accounts for price increases of agricultural goods as a result of higher demand.
Calculate how much investment is required to achieve that level of GDP. The gross ICOR for the base year is set differently for countries with different per capita GDP.
Calculate the investment in agriculture as a proportion of this investment, using the share of agricultural value added in GDP.
The additional investment is complemented with a transfer to cover the food deficit as the model assumes that the indigent 5 percent of the population is not going to benefit from the additional investment for various reasons, such as personal disability, health and socio-economic conditions, among others.
Agricultural investments and hunger
Other studies focus more explicitly on agricultural investments and their impact on hunger. A recent study is IFPRI and ADB (2019), which uses the International Model for Policy Analysis of Agricultural Commodities and Trade (IMPACT) to assess the impact of different agricultural investments on agricultural production, prices, income and hunger.
These are:
Investment in agricultural R&D, including in advanced breeding technologies;
Investment in improved water management through irrigation and basin-level water use efficiency; and
Investment in rural infrastructure to reduce marketing costs and post-harvest losses.
The study accounts for the negative effects of climate change on agriculture. Reduced yields and production would induce price increases and thereby lower food consumption by the poor, resulting in a higher number of hungry people compared to a ‘no climate change’ scenario.
Nutrition-specific interventions
Nutrition-specific interventions are those that address the immediate determinants of child nutrition, such as adequate food and nutrition intake, feeding and care-giving practices, and treatment of disease. Examples include promotion of good infant and young child nutri-tion, micronutrient supplementation, and deworming.
Figure 3. Investment needsAgricultural investment, additional needs per
year; and expected share of public funding
US $ billions
Share of public investment (%)
Primary agriculture and natural resources
4.48
Soil conservation 0.50 30Water conservation/improved irrigation 1.96 30
Preservation/improvement of: Crop 0.19 30 Animal 0.15 30 Fish 0.43 30 Forest 0.18 30Mechanization 1.07 10Agroprocessing operations 4.02Cold and dry storage 0.74 20Rural and wholesale market facilities 1.18 50First-stage processing 2.10 10Infrastructure 6.00Rural roads 4.00 90Rural electrification 2.00 80Institutional frameworks 2.74Land titling, tenure secutiry 0.34 90Rural finance 1.99 50Food safety regulated regulations 0.40 90R&D and extension 3.35Research and development 1.34 90Extension 2.01 90
Total 20.6 64

A GUIDEBOOK FOR ASSESSING SDG INVESTMENT NEEDS40
They are primarily delivered within the health sector, supported by nutrition-sensitive interventions delivered through other sectors.3
Shekar et al. (2017) estimates the additional invest-ment needed to achieve the global targets for stunt-ing, anemia in women, exclusive breastfeeding and the scaling up of the treatment of severe wasting. It builds on earlier studies, including the 2010 World Bank report Scaling Up Nutrition and the 2013 Lancet Series on Maternal and Child Nutrition. There are also sev-eral country-level costing studies. In the Philippines, the National Nutrition Intervention Scenario program would cost $113 million per year, with a return of $12 for every dollar invested.
The general approach to assessing the cost and impacts of nutrition-specific interventions is summa-rized in Figure 4. Once the right interventions needed to achieve nutrition targets are identified, then the total financing needs for each intervention is the unit cost times incremental coverage assumed times the pop-ulation targeted:
FNy=UC * ICy * Popy
where, FNy is the annual financial need for a given inter-vention, UC is the unit cost of that intervention, ICy is the incremental coverage assumed for year y, and Popy is the total target population in year y. This calculation
3 Through budget analysis, countries often also estimate the cost of nutrition-sensitive interventions, which have an indirect impact on nutrition and are delivered through sectors other than health, such as the agriculture; education; and water, sanitation, and hygiene sectors. Examples include biofortification of food crops, conditional cash transfers, and water and sanitation infrastructure improvements.
requires data on baseline intervention coverage data, which, for cross-country analysis, can be drawn from Demographic and Health Surveys or from Multiple Indicator Cluster Surveys, as well as population pro-jections. Beyond costing, the last two steps in Figure 4 concern the returns to investment.
Policy and financing options
Investment in agriculture should enhance sustainable agricultural practices, including soil and water con-servation, improved irrigation systems, greater water efficiency and preservation of biodiversity, as well as genetic improvements in agriculture, fisheries and for-estry (FAO, IFAD and WFP, 2015). Mechanization may also be required to increase agricultural productivity. While the bulk of investment in agriculture is carried out by private agents, especially by farmers themselves, provision of certain goods and services require public investment; for instance, there are natural monopolies, such as irrigation systems, where only one network is desirable for efficiency reasons.
Investments in nutrition will come through a mix of domestic budget allocations combined with ODA, newly emerging innovative financing mechanisms, as well as household contributions. They could leverage cost-effective interventions, such as antenatal micro-nutrient supplements which prevent stunting as well as anaemia in pregnant women. At the same time, greater focus can be given towards healthy diets for all age groups, keeping in mind rural and urban settings, and exposure to cheap and convenient unhealthy pro-cessed foods, which are leading to a “double burden” of malnutrition as evident with undernourished and overweight children living in the same communities or even occurring in the same child.
Nutrition-specific interventions, additional needs per year

A GUIDEBOOK FOR ASSESSING SDG INVESTMENT NEEDS 41
Figure 4. General approach to assessing cost and impact of nutrition-specific interventions
Estimating unit costs on the basis on program experience
Select the most recent unit cost. If a range is available, start with the average. If none is available, apply unit cost estimates from other countries with appropriate adjustments.
Assumptions on the pace of scale-up
A basic scenario is to scale up at a constant rate in the first five years to reach 100 percent coverage, followed by a subsequent five-year maintenance phase with steady 100 percent coverage to allow for the full accrual of the benefits.
Estimating total financing needs for each target
For each intervention, multiply the unit cost by incremental coverage assumed and the population targeterd. Sum up the cost for all interventions. Add markups to account for capacity development, M&E, policy development, etc.
Estimating impacts
Ideally this is done with modeling such as Lives Saved Tool (LiST), and epidemiological model for maternal and child health that allows users to estimate the impact of expanding the coverage of nutrition interventions.
Benefit-cost analyses
Translate mortality averted into expected earnings gains over adult working lives. Also factor in improvements in cognitive development. Apply a discount rate of 3 percent for both costs and benefits, and then consider lower
or higher rates.
Evidence-based interventions and delivery platform
Which interventions have a strong evidence base? Are they relevant to your country context?
Source: Adapted from Shekar et al. (2017).

A GUIDEBOOK FOR ASSESSING SDG INVESTMENT NEEDS42
Case study
National and sub-national insights from India
Menon et al. (2016) aims to estimate the implementation costs of the specific nutrition actions, building on Scaling Up Nutrition: What Will It Cost? (SUN) methodology, namely program experience approach to costing. The study updates previous multi-country study estimates with the most recent demographic data and provides state specific costs. Also, it uses local costing data based on programmatic experience compiled from various sources includ-ing the Ministry of Women and Child Development, the National Rural Health Mission, UNICEF-India, Alive and Thrive, the Micronutrient Initiative in India. Finally, the study attempts to compare at scale costs estimates with current expenditure incurred for a sub-set of the India Plus Interventions, using government reported unit cost distributions to estimate target population specific intervention expenditure estimates.
It estimates that about $4.2 billion would be needed to deliver at scale the SUN interventions in India, based on the SUN unit costs and India-specific target populations but that $5.9 billion would be needed based on a more expanded set of interventions and unit costs tailored to the Indian and/or South Asian context, such as: counsel-ling during pregnancy, for breastfeeding, and for complementary feeding and handwashing; supplementation for children 6-36 months of age, for pregnant and lactating women, and for severely malnourished children; micro-nutrient and deworming including iron-folic acid (IFA) supplements for pregnant and breastfeeding women, IFA supplements and deworming for adolescents, iron supplements for children 6-36 months of age, vitamin A sup-plementation, oral rehydration therapy (ORS) and therapeutic zinc supplements for treatment of diarrhoea, and deworming; health including treatment of severe acute malnutrition and insecticide treated nets for pregnant women in malaria-endemic areas; and finally cash transfers to women in the first 6 months after delivery. State-specific costs are driven by population size and the levels of undernutrition in each state, such that Uttar Pradesh, Maharashtra, Rajasthan have the highest costs respectively.
The study highlights that costs are unequally spread across India and that current coverage levels are far behind levels as per the expenditure analyses. Particularly, highly populated states with high burden of malnutrition require further focus on fiscal action.
A GUIDEBOOK FOR ASSESSING SDG INVESTMENT NEEDS42

A GUIDEBOOK FOR ASSESSING SDG INVESTMENT NEEDS 43
Where we stand
Despite progress, not on track at the Asia-Pacific regional level. Indicators related to maternal and under-five mor-tality, births attended by skilled health personnel, and population covered by vaccines are on track, but those related to HIV infections, tuberculosis, NCDs, harmful use of alcohol, household expenditures on health, and health worker density are off track (figure 1). The COVID-19 pan-demic has put to test the health capacities and emergency preparedness of countries.
Global spending on health rose to some $7.8 trillion in 2017, or about 10 percent of GDP and $1,080 per capita. Middle income countries exhibited some convergence towards higher levels of spending, but across low income coun-tries, the average health spending was only $41 per person, compared to $2,937 in high income countries. In the Asia-Pacific region, current health expenditures ranged from more than 10 percent of GDP in some of the Pacific island countries to just above 2 percent in Bangladesh (figure 2).
Going forward, additional health investments are needed to enable countries to achieve SDG3. The 2017 WHO study is discussed below in detail. For the 19 Asian countries covered in this study, an additional investment of $158 billion per year, or $38 per person, would be needed on average during the period 2016-2030. Figure 3 shows the breakdown by components for ASEAN and SAARC countries.
WHO’s 2017 study on SDG3 investment needs
There have been several health needs assessments, dating back to at least the 2001 study by the Commission on Macroeconomics and Health, which estimated a set of essential interventions that would cost $34 per person per year. In the context of SDGs, Stenberg et al. (2017) estimated additional resources needed to strengthen comprehensive health service delivery towards attaining health goals and achieving universal coverage by 2030 in 67 developing countries. Under two scenarios the addi-tional spending required per year ranges from $41 to $58 per person by the final years of scale-up.
A major component of the costing framework (see figure 4) is health systems, which consists of health inputs
ENSURE HEALTHY LIVES AND PROMOTE WELL-BEING FOR ALL AT ALL AGES

A GUIDEBOOK FOR ASSESSING SDG INVESTMENT NEEDS44
Figure 1. Progress at the indicator level
3.1.1 Maternal mortality
3.1.2 Births attended by skilled health personnel
3.2.1 Under-five mortality
3.2.2 Neonatal mortality
3.3.1 HIV infections
3.3.2 Tuberculosis
3.3.3 Malaria
3.4.1 Cardiovascular disease, cancer, diabetes or chronic respiratory disease
3.4.2 Suicides
3.5.2 Harmful use of alcohol
3.6.1 Road traffic deaths
3.7.1 Family planning satisfied with modern methods
3.7.2 Adolescent births
3.8.2 Household expenditures on health
3.9.3 Unintentional poisoning
3.a.1 Tobacco use
3.b.1 Population covered by all vaccines in national programme
3.c.1 Health worker density
3.d.1 Health capacity and emergency preparedness
20192000 Target 2030
Figure 3. Investment needsAdditional investment needs through 2030: ASEAN and SAARC
Figure 2. Investment trendsCurrent health expenditure in 2017

A GUIDEBOOK FOR ASSESSING SDG INVESTMENT NEEDS 45
needed for service delivery4 including infrastructure, health workforce, supply chain, and health information system; and those related to institutions - health financ-ing policy and governance.5 Another large component is the 187 specific interventions grouped under four service delivery platforms representing varied modes of service provisions.6 Other components of the frame-work include prevention and management of risk and emergencies and cross-sectoral interventions indi-rectly influencing health outcomes.
The general approach is a bottom-up costing, where costs to close the gap between current coverage and reaching set benchmarks are multiplied by coun-try-specific prices from WHO-CHOICE database or other publicly available sources. Global health system
4 Some examples of health service delivery inputs: infrastructure (health centres, equipment, ambulances); health workforce (health workers, doctors, nurses, training); supply chain (transporting of commodities, medicines, equipment, warehouses, trucks, buffer stocks cold chain); health information system (unified underlying information system including surveillance).
5 Health financing refers to investments in unified and transparent financial management system, procurement, secure and transparent financial flows; governance includes local health governance systems, district health management, community engagement.
6 These platforms are: (1) policy and population wide interventions (deliverable en masse at low cost such as reduce tobacco use campaign, promotive exercise, mosquito nets); (2) periodic schedulable and outreach services (such as mass distribution of deworming drugs, iodine supplementation); (3) first level clinical services (delivered through primary level facilities, more individualized interventions specific to patients’ needs such as TB treatment, diabetes); and (4) specialized care (delivered by highly skilled health personnel on highly individualized manner, relying on sound diagnostic and referral systems).
benchmarks are used, based on WHO intervention guidelines and recommended practices.7 For dis-ease-specific interventions, costs are modelled using the OneHealth tool (OHT) which estimates cost assumptions around health workforce inputs, demo-graphic and epidemiological data.8 Interventions not included in the OHT are supplemented through an excel-based model.
Scaling up is modelled under two scenarios, the pro-gressive scenario – where countries’ advancement towards UHC is constrained by their health system’s assumed absorptive capacity or distress, but progress can still be made; and the ambitious scenario – where most countries attain the global targets and the full package of services is expanded towards 95 percent coverage. Approximately 70 percent of the additional cost would be spent on health systems under the two scenarios. The main drivers of cost are infrastructure
7 Some examples are a ratio of 4.45 health workers per 1,000 population based on the Global Strategy on Human Resources for Health - the model will estimate the costs related to additional health workers needed to be employed; costs related to health centres built per population density; cost of delivering medicines, construction cold-chain required to store vaccines and stocks. Numerous sources were employed for compiling the global benchmarks including but not limited to the Global Health Observatory data, WHO frameworks country review meetings, grant proposals, survey or census results, World Bank’s Country Policy and Institutional Assessment (CPIA), humanitarian response plans, other expert opinions.
8 OHT includes pre-populated country profiles including demographic and epidemiological data by country, and also cost assumptions around consumables, health workforce inputs. The OHT incorporates a variety of impact estimation models such as the Lives Saved (LiST) tool, FamPlan model, and many NCD models to help project the costs and health impacts of scaling up specific interventions and activities in a country.
Figure 4. Conceptual framework
Source: Stenberg et al. (2017)

A GUIDEBOOK FOR ASSESSING SDG INVESTMENT NEEDS46
and health workforce (figure 5). Substantial investments are needed in infrastructure in the initial years to increase coverage of service delivery to peak in 2029. Health workforce costs are higher in the latter stage of the scale up as coverage increases and health targets are achieved. Globally, the additional investments to scale up health systems and disease-specific interventions could save up to 97 million lives while increasing life expectancy by 3.1 to 8.4 years.
Costing approaches
According to Stenberg and Rajan (2016), estimating the cost of national health policy, strategy or plan (NHPSP) requires deciding on the objectives and expected out-comes, which in turn determines the scope, level of detail and information of the analysis.
By the policy reforms envisioned, there are three NHPSP costing approaches:
Goal-oriented projection. Identify strategies to attain policy goals. Carefully examine related activities with their associated cost.
Resource driving costing. Maximize returns for a given budget. Consider reforms that can help in achieving policy goals within a constrained fixed budget.
Bottleneck analysis. Identify the bottlenecks in the system and how to reduce them so as to improve the health system.
With regard to assessment and allocation, costing meth-ods could be two:
Bottom up costing uses on inputs, quantities and prices. It could be informed by either unit costing or a more detailed input-based approach (see Table 1).
Historical allocation is based on the previous budget, and thus not useful for costing a strategy that is intended to change the status quo.
Costing steps
General steps for costing national health policy, strategy or plan (NHPSP) as suggested in Stenberg and Rajan (2016) have been adapted in the overview section of this guidebook. Here we explain the steps which were taken in the above 2017 study by WHO:
4. Understanding the country context, for instance, in terms of (i) conflict/fragility; (ii) resource availabil-ity as measured by per capita income; (iii) health system capacity as measured by the current den-sity of health workers as a proxy for service delivery readiness, and (iv) current health system perfor-mance as measured through skilled birth attendance coverage.
5. More generally, consider country-specific demo-graphic and epidemiological context and coverage – including population growth, reduced mortal-ity, reduced incidence or prevalence as coverage increased, projected urbanization, current health system structure and country-specific prices of inputs.
Figure 5. Composition of additional health spending needs in 2016 and 2030
Source: ESCAP, based on Stenberg et al. (2017)

A GUIDEBOOK FOR ASSESSING SDG INVESTMENT NEEDS 47
6. Defining the service delivery platforms and their characteristics in terms of their approaches towards patients and defining essential interven-tions organised into these platforms (see figure 4).
7. Building the health service scale-up curves to determine the pathways to SDGs and ability to strengthen the health systems. For instance, scal-ing up could take the form of heavy or minor front-load, liner, S-shaped, slow initial or exponential.
8. Setting targets consistent with SDG 2030 global targets on the basis of global best practices includ-ing globally accepted health system benchmarks and WHO intervention guidelines and recom-mended practices.9
9. Estimating the investments to reach minimum required levels of inputs to the health system.
10. Modelling the three most resource-intensive health system components which are interlinked and closely related to the scope of services provided.
11. Considering health system investments than those referred in previous steps, such as health infor-mation systems, emergency risk management, governance and health financing need. Consider resources needed for such interventions as iron and folic acid for pregnant people, and outreach services to high-risk populations for HIV/AIDS.
12. Considering the links to other sectors through the costs (and when possible the associated effect) of increasing access to water, sanitation, hygiene, clean fuels for cooking, and cash-trans-fer programmes that benefit poor households. Interventions that have direct effects on health but the costs of which would not be borne mainly by the health sector.
13. Estimating the share of costs for the cross-sectoral investments mentioned in the previous step that would be attributed to, and financed by, the health
9 Health systems vary among countries, but global benchmarks would be applicable for all countries: i) Health workforce: 4.45 doctors, nurses and midwives and 2.15 “other” health workers per 1000 people, with an additional 2 “other” workers per 1000 rural population, ii) Health infrastructure: 1 urban health center per 12,000 people, 1 rural health center per 6,000 people, 1 urban district hospital per 100,000 people, 1 rural district hospital per 50,000 people, and 1 provincial hospital per 1 million people. iii) Emergency Risk Management: benchmarks for laboratory density, hazard pay, core capacities of the International Health Regulations and so on.
sector as opposed to other sectors.
Tools
OneHealth Tool (OHT) and other tools applied in the 2017 WHO study
OHT is a software tool launched in 2012 and designed to provide national policy makers with a framework for scenario analysis, costing, health impact analysis, bud-geting and financing of strategies for all major diseases and health system components, starting from a sector wide national strategic plans and policies. An output of the Tool would inform policy makers in terms of the health system resources needed for implementation, the cost of the plan by year and by input, the estimated health impact, and the comparison with estimated available financing. Overseen by the UN InterAgency Working Group on Costing (IAWG-Costing), WHO pro-vides technical oversight to the development of the tool, facilitates capacity building and provides technical support to policy makers.
Direct intervention-related costs and effects: Spectrum-based OneHealth tool, which takes an integrated approach to the assessment of costs and health ben-efits and it incorporates interlinked epidemiological reference models. Targets were aligned with pub-lished disease-specific costs in terms of priority health interventions and 2030 targets and combined within a system-wide perspective. The estimated need is com-puted for health services dynamically over time, taking into account population growth, reduced mortality, and reduced incidence or prevalence of disorders as coverage of interventions (preventive and curative) increased. Analysis with the OneHealth tool was com-plemented by Excel-based models, when needed, and system-specific components were excluded from dis-ease-specific costs to avoid double counting. A bot-tom-up, inputs-based costing approach (quantities times price), is used taking into account a steady clos-ing of the gap between current and target investments year by year. Inputs were multiplied by country-specific prices from the WHO-CHOICE database and other publicly available sources.
Projection of health outcomes: Health outcomes includ-ing life expectancy, Tuberculosis, neglected tropical diseases as well as a second summary effect measure (the increase in healthy years lived), in line with the SDG indicator framework and include improved nutri-tion, reduced disease prevalence and age-specific mor-tality rates on the basis of OneHealth tool projections and Spectrum outputs.
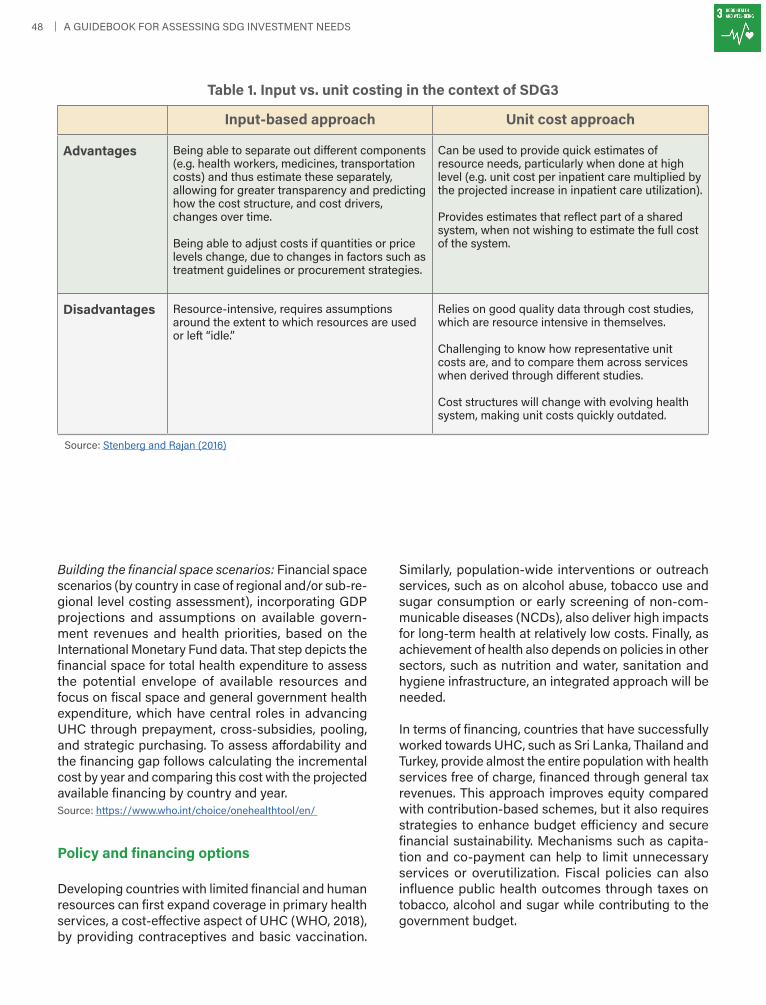
A GUIDEBOOK FOR ASSESSING SDG INVESTMENT NEEDS48
Building the financial space scenarios: Financial space scenarios (by country in case of regional and/or sub-re-gional level costing assessment), incorporating GDP projections and assumptions on available govern-ment revenues and health priorities, based on the International Monetary Fund data. That step depicts the financial space for total health expenditure to assess the potential envelope of available resources and focus on fiscal space and general government health expenditure, which have central roles in advancing UHC through prepayment, cross-subsidies, pooling, and strategic purchasing. To assess affordability and the financing gap follows calculating the incremental cost by year and comparing this cost with the projected available financing by country and year.Source: https://www.who.int/choice/onehealthtool/en/
Policy and financing options
Developing countries with limited financial and human resources can first expand coverage in primary health services, a cost-effective aspect of UHC (WHO, 2018), by providing contraceptives and basic vaccination.
Similarly, population-wide interventions or outreach services, such as on alcohol abuse, tobacco use and sugar consumption or early screening of non-com-municable diseases (NCDs), also deliver high impacts for long-term health at relatively low costs. Finally, as achievement of health also depends on policies in other sectors, such as nutrition and water, sanitation and hygiene infrastructure, an integrated approach will be needed.
In terms of financing, countries that have successfully worked towards UHC, such as Sri Lanka, Thailand and Turkey, provide almost the entire population with health services free of charge, financed through general tax revenues. This approach improves equity compared with contribution-based schemes, but it also requires strategies to enhance budget efficiency and secure financial sustainability. Mechanisms such as capita-tion and co-payment can help to limit unnecessary services or overutilization. Fiscal policies can also influence public health outcomes through taxes on tobacco, alcohol and sugar while contributing to the government budget.
Table 1. Input vs. unit costing in the context of SDG3
Input-based approach Unit cost approach
Advantages Being able to separate out different components (e.g. health workers, medicines, transportation costs) and thus estimate these separately, allowing for greater transparency and predicting how the cost structure, and cost drivers, changes over time.
Being able to adjust costs if quantities or price levels change, due to changes in factors such as treatment guidelines or procurement strategies.
Can be used to provide quick estimates of resource needs, particularly when done at high level (e.g. unit cost per inpatient care multiplied by the projected increase in inpatient care utilization).
Provides estimates that reflect part of a shared system, when not wishing to estimate the full cost of the system.
Disadvantages Resource-intensive, requires assumptions around the extent to which resources are used or left “idle.”
Relies on good quality data through cost studies, which are resource intensive in themselves.
Challenging to know how representative unit costs are, and to compare them across services when derived through different studies.
Cost structures will change with evolving health system, making unit costs quickly outdated.
Source: Stenberg and Rajan (2016)

A GUIDEBOOK FOR ASSESSING SDG INVESTMENT NEEDS 49
Where we stand
Relatively good progress but not on track at the Asia-Pacific regional level. Indicators related to enrollment (e.g. gross intake ratio) are generally on track or nearly on track, but some indicators related to learning (e.g. minimum proficiency in reading and math) are off track (figure 1).
Annual global spending on education is approximately $4.7 trillion, of which 65 percent in spent in high income countries and only 0.5 percent in low income countries. In 2017, median public education spending was 4.4% of GDP and 14.1 percent of total public spending. Globally, governments account for 79 percent of total spending, households for 20 percent and donors for 0.3 percent (but 12 percent in low income countries). In the Asia-Pacific region, government expenditures in education ranged from 6.6 percent of GDP in Bhutan to 1.9 percent in Papua New Guinea, with the average of 35 countries with avail-able data at 3.9 percent (figure 2).
Going forward, ESCAP’s Survey 2019 estimated that for low- and middle-income countries in Asia-Pacific region, total education expenditures from pre-primary to upper-secondary should increase from about $642 billion in 2015 to an annual average of $780 billion during the period 2016-2030 in order to provide quality education with equitable access to all boys and girls (figure 3).
Costing methodology
SDG4 presents a significant broadening of the education agenda compared with that of the MDGs; it is aimed at universal enrolment, from pre-primary to upper-secondary levels (rather than just primary) and emphasizes learning outcomes. At the same time, it calls for equity in education opportunities, through additional support for marginalized children. The costing approach should reflect these quality and equity dimensions as much as possible.
We provide a detailed explanation of an education costing tool used in recent ESCAP analysis, followed by a brief introduction to a more detailed education planning and costing tool.
ENSURE INCLUSIVE AND EQUITABLE QUALITY EDUCATION AND PROMOTE LIFELONG LEARNING OPPORTUNITIES FOR ALL

A GUIDEBOOK FOR ASSESSING SDG INVESTMENT NEEDS50
Figure 2. Investment trendsGovernment expenditures on education in 2018 or latest year
Figure 3. Investment needsAdditional needs by education level, annual average for 2016-2030
4.1.1 Minimum proficiency in reading and maths
4.1.P1 Net enrolment in primary education
4.1.P2 Out-of-school children
4.1.P3 Gross intake ratio
4.2.2 Organised learning before primary entry age
4.3.1 Formal and non-formal education and training
4.4.P1 Adults who completed primary or secondary education
4.5.1 Inequality indices for education indicators
4.6.P1 Adult literacy
4.b.1 ODA for scholarships (LDCs)
4.c.1 Organized teacher training
20192000 Target 2030
Figure 1. Progress at the indicator level

A GUIDEBOOK FOR ASSESSING SDG INVESTMENT NEEDS 51
Modified UNESCO (2015) model
A spreadsheet education costing model developed by UNESCO (2015) and applied with some modifica-tions in ESCAP (2019) allows the user to adjust specific parameters to run different scenarios. This projection model incorporates a basic expenditure function cov-ering two types of expenditures, namely recurrent (salary and non-salary) and infrastructure, applied to an expansion rate based on population trend, gross enrolment ratios and transition rates.
1. The expansion rate
The logic flow is illustrated Figure A.3. Preschool stu-dents in the base year are the product of “school access in the year before primary” (NER1P) as provided by UIS, and the population of children, aged one year younger than official primary school entry. For future years, NER1P is projected linearly, from the most recent year to the target level by the target year. For SDG costing, the target level is 100 percent access and the target year is 2030. For simplicity, the model computes one year of full-time preschool access; however, countries can consider this to be equivalent to two years of half-time access without changes to the overall costs.
For primary through secondary, students are pro-jected by grade using a common spreadsheet method. Incoming first grade pupils are determined by the gross intake rate and the school entry-age population. Pupils progress through grades over time, based on promo-tion rate and repetition rate. The model computes the intake, promotion and repetition rates by grade over time such that the target level of completion of upper secondary is reached exactly by the target year. The completion of upper-secondary is the number of non-repeating entrants into the last grade of upper-sec-ondary, divided by the population of the official age of completing upper-secondary school. In the model, the projections include students in general secondary and vocational secondary school. They also include public and private students.
The primary stream of post-secondary is considered to be tertiary education, with access to two other streams of post-secondary - post-secondary non-tertiary and online certification – also included. Access to tertiary, or the tertiary entry rate (GIRT) in the base year is approximated by the tertiary gross enrollment rate. For future years, GIRT is assumed to increase linearly to a target level set by the user. This is because there is currently no internationally agreed-upon target for this level. The post-secondary non-tertiary entry rate
is computed as a ratio of tertiary entry, and similarly for students who pursue online education.
2. The expenditure function
For recurrent cost, its main component is teacher sal-aries, which are the product of the number of teachers and the average teacher salary. We compare histori-cal data on teacher salary as a multiple of per capita income for countries with available data, and allow teacher salary in all countries to converge towards those of better performers in learning assessments. The salaries for teachers in lower-secondary are assumed to be 50 percent higher than those of primary teach-ers, and upper-secondary teachers another 20 percent higher.
The number of teachers depends on the class size, expressed as pupil-to-teacher ratio. Evidence on the negative impact of very large class sizes is strong, so the model assumes that average class size in devel-oping countries will be reduced – in preschool to an average of 20 children per teacher; in primary to an average of 40; and in secondary to an average of 35. However, the user can adjust these benchmarks, and also allow countries with even smaller class size to either converge upwards or maintain current class size.
Non-salary recurrent spending on items such as high-quality learning materials, in-service training, teaching support programs, special education pro-grams, management improvement, and other programs is projected to rise substantially in most countries. The model assumes that non-salary recurrent spending will rise to 35 percent of total costs. At the same time, to account for equity, the model allocates 20-40 percent of recurrent costs to help marginalized children start and stay in school, in the form of a means-tested sub-sidy based on a poverty threshold.
The cost of classroom construction can vary widely, depending on the procurement method and who builds the classrooms. The model assumes that there is one classroom for every teacher and that these need to be furnished adequately, maintained annually, and incur recurrent utility costs. It assumes a construction period of 5 years and lifetime of 60 years for classroom. Benchmark cost vary by education level, based on var-ious country studies.
Note that we only apply the basic expenditure function to calculate the budgetary needs for pre-primary to upper secondary education; for post-secondary educa-tion, we apply unit cost estimates instead, which could

A GUIDEBOOK FOR ASSESSING SDG INVESTMENT NEEDS52
vary between tertiary, post-secondary non-tertiary and online certification. While this approach is perhaps too simplistic, it was felt that including post-secondary education in total education costs would be important. Indeed, post-secondary enrolment is expanding rap-idly in the Asia-Pacific region and is vital for achieving Goal 8 on productivity growth and decent jobs as well as in supplying professionals, such as teachers, doc-tors, nurses and environmental engineers, needed for achieving various Goals.
3. Financing
The model assumes two domestic sources of educa-tion finance – the government and households. If the balance of contribution from these two sources is not sufficient to cover the costs, then there is a finance gap, for which other, external funding is needed. In the modified UNESCO model applied in ESCAP (2019), government expenditures are not divided over edu-cation levels because of with inclusion of household there is considerable fungibility of finance streams
over different education levels depending on govern-ment and household priorities. The user could set the maximum percent of cost covered by households for different education levels (e.g. 10 percent for primary and secondary, and 50 percent for post-secondary).
4. Alternative scenarios
In addition to the above base scenario, we can esti-mate various alternative scenarios, including different avenues and costs for post-secondary education, and different assumptions about class size, two of the main cost drivers of education costing. For testing alterna-tive scenarios, we apply comparative statics by firstly changing only one factor in the targets of indicators and holding all else unchanged as in the base scenario, and then study how the variables of interest (e.g. total public cost, external finance gap, etc.) behave accordingly. A description of these alternative scenarios is summa-rized below. In ESCAP (2019), these alternative sce-narios lower the total cost of achieving SDG4 targets.
Table 1. Description of alternative scenarios
Scenario Description
1. Within-income-group tertiary gross enrollment rate (GER) targeting scenario
All targets are the same as in the base scenario (Table A.1), except for target tertiary GERs, which is now based on the average tertiary GER in the same income group of Asia-Pacific countries, instead of the income group above its current status. Hence the targets for LICs, LMICs and UMICs are 23, 28 and 55 percent respectively.
2. Online provision of post-secondary education scenario
All targets are the same as in the base scenario, except for the percentage of pupils who receive post-secondary education online, which is now targeted to 25 percent.
3. Alternative pupil-teacher ratio (PTR) targeting scenario
All targets are the same as in the base scenario, except for target PTRs for pre-primary to secondary education. Higher target PTRs for pre-primary, primary, and secondary education of 25/50/45 is considered, compared to 20/40/35 in the base scenario.
Figure 4. Determining a target for teacher salaries

A GUIDEBOOK FOR ASSESSING SDG INVESTMENT NEEDS 53
UNESCO’s Simulation for Education model
Countries often embark upon major education reforms in order to improve their education system. They may include increasing teacher salaries, universalizing basic education, enhancing use of ICT in education, making schools accessible, and improve multi-lingual educa-tion. Their commitment to SDG 4 is also driving coun-tries to focus on quality, equity, and inclusion at all levels of education. However, often the results of the reforms fall short of the expectation. There are many reasons, but unrealistic target setting and insufficient financial and human resources are often among the major factors behind non-implementation or under-im-plementation of the education reforms. While all should aspire to have the best education and learning oppor-tunities for all, it is essential to ensure that education policies and plans are grounded on the economic and demographic realities so that they can be achieved, one step at a time.
UNESCO has a long history of supporting the Member States to estimate the resources associated with implementation of their education policies and plans through introducing simulation modelling in education policy and planning processes. In July 2019, UNESCO launched a new education simulation model, Simulation for Education (SimuED), an Excel-based education sec-tor-wide simulation model covering every sub-sector in education. The model can be fully configured to reflect the country contexts. It also allows users to project the selected the key SDG 4 indicators to facilitate national planning exercise. SimuED can also easily integrate the
key concepts of equity, such as rights to education, inclusive education, and gender, where the data exist.
SimuED, like any education simulation model, can be used throughout the policy and planning process. At the same time, it is best to be introduced when an edu-cation sector review/analysis starts. It can be then used to identify the priorities and the key policy sequences by analysing the potential impact on financial and human resources over time. To use SimuED, a small group of education statistics, planning, and finance specialists can be established at the Ministry of Education to work with the UNESCO experts and configure the model to reflect the country specifications and requirements. With UNESCO’s support, the national team collect the baseline data, articulate the policy targets, and calcu-late the simulation results using SimuED.
SimuED is not only used to calculate how much educa-tion policies and plans cost. Rather, it is a tool that can accompany and facilitate the national policy dialogues and support the countries to make evidence-informed decisions by presenting possible impacts of education policies (for example changes in number of schools and students, teacher salaries, and IT equipment). When used coherently with Education Management and Information Systems (EMISs) and Monitoring and Evaluation (M&E) systems, SimuED can be a power-ful tool to ensure the strategic approach to education reforms to ensure their feasibility and sustainability. Since its launch, SimuED is being piloted in various countries with the support of UNESCO.
Case study
Cambodia’s Education Roadmap Towards the 2030 Agenda
The Ministry of Education, Youth and Sport (MoEYS) implemented the Education Strategic Plan (ESP) 2014-2018 along with policies and priority reforms for education. Building on its success, it launched the ESP 2019-2023, with an estimate of the overall resource requirements for its implementation. MoEYS is working closely with the Ministry of Economy and Finance and the Ministry of Civil Service to ensure that the medium-term expenditure planning for education is consistent with broader planning and aligning with public financial management reform and Public Administration Reform.

A GUIDEBOOK FOR ASSESSING SDG INVESTMENT NEEDS54
Budgetary forecast for the education sector (in million riels)
2019 2020 2021 2022 2023
GDP 108,590,444 119,033,548 130,915,822 144,168,348 158,884,368Real GDP growth rate 7.10% 6.50% 7.00% 7.00% 7.00%GDP per capita 6.8 7.4 7.9 8.7 9.5Government expenditure on education 3,229,604 3,577,655 3,975,988 4,423,847 4,925,415Recurrent 3,219,604 3,567,655 3,965,988 4,413,847 4,915,415Capital 10,000 10,000 10,000 10,000 10,000As % of GDP 2.97% 3.01% 3.04% 3.07% 3.10%Education budget as % of government
expenditure
18.40% 18.60% 18.80% 18.90% 19.10%
Financing needs by sub-sector (in million riels)
2019 2020 2021 2022 2023
ECE 246,751 274,242 296,261 306,947 336,673Primary 1,969,502 2,110,046 2,216,636 2,355,779 2,499,724Secondary 1,093,630 1,189,415 1,362,979 1,500,752 1,662,184Higher education 367,496 438,722 481,005 524,736 585,418NFE 42,016 57,009 61,157 73,773 81,142Youth 26,596 32,273 34,776 35,367 38,058Sport 71,894 73,496 76,535 80,484 86,563Total 3,817,885 4,175,203 4,529,349 4,877,838 5,289,762Recurrent 3,537,885 3,660,823 3,977,425 4,285,962 4,655,400Capital 280,000 514,380 551,924 591,876 634,362
Financing gap (in million riels)
2019 2020 2021 2022 2023
Government education expenditure 3,229,604 3,577,655 3,975,988 4,423,847 4,925,415
External fund (PIP) 553,640 583,371 492,561 402,562 330,806
Total available resources 3,783,380 4,161,026 4,468,549 4,826,409 5,256,222
In million USD 933.25 1,026.40 1,102.26 1,190.53 1,296.55
ESP financing requirement 3,817,885 4,175,203 4,529,349 4,877,838 5,289,762
In million USD 941.76 1,029.90 1,117.25 1,203.22 1,304.83
Gap -34,505 -14,177 -60,800 -51,429 -33,540
In million USD -8.51 -3.5 -15 -12.69 -8.27
Percentage of gap -0.91 -0.34 -1.36 -1.07 -0.64Source:
https://www.globalpartnership.org/sites/default/files/2019-10-education_sector_plan-cambodia.pdf
Table 3. Budgetary forecasts, financing needs and gaps
A GUIDEBOOK FOR ASSESSING SDG INVESTMENT NEEDS54

A GUIDEBOOK FOR ASSESSING SDG INVESTMENT NEEDS 55
Table 2. Main assumptions on key parameters (which could be adjusted in the model)
Measurable targets Target value
1. Pre-primary education
a. Pre-primary gross enrolment ratio (GER) 100%
2. Primary and secondary education
a. Transition rate to primary 100%
b. Primary completion rate 100%
c. Lower secondary completion rate 100%
d. Upper secondary completion rate 100%
e. Repetition rate 5%
3. Post-secondary education
a. Post-secondary tertiary GER LICs 28%1
LMICs 55% 1
UMICs 74% 1
b. Post-secondary non-tertiary GER LICs 10% 2
LMICs 20% 2
UMICs 27% 2
c. Post-secondary tertiary completion rate 80%
d. Post-secondary non-tertiary completion rate 80%
4. Quality of education
a. Percentage of publicly funded pupils Pre-primary 90%
Primary 90%
Lower secondary 90%
Upper secondary 90%
Post-secondary 20%
b. Pupil-teacher ratio (PTR) Pre-primary 20
Primary 40
Lower secondary 35
Upper secondary 35
c. Teacher salaries (as multiples of GDP per capita)
Function of income, rising to the top 50% of salaries (relative to income) by 2030
d. Share of non-salary recurrent costs 35%
e. Post-secondary unit cost (as % of GDP per capita) 3
Post-secondary tertiary 100%
Post-secondary non-tertiary 100%
5. Equity of education
a. Mark-up of per student costs to attract marginalised children (living on < US$2/day)
Pre-primary/primary 20%
Lower secondary 30%
Upper secondary 40%
6. Financing of education
a. Max. household contribution to basic education (pre-primary to upper secondary)
LICs 10%
LMICs 10%
UMICs 10%
b. Max. household contribution to post-secondary education
LICs 25%
LMICs 50%
UMICs 50%1 The target tertiary GER for each country group is based on the average tertiary GER in the next higher income group of ESCAP countries in 2015. For instance, for LICs, the target tertiary GER is based on the average tertiary GER in lower-middle income ESCAP countries in 2015. For LMICs, the target tertiary GER is based on the average tertiary GER in upper-middle income ESCAP countries in 2015.
2 The target post-secondary non-tertiary GER is calculated based on the empirical evidence that the proportions of high school graduates enrolled into tertiary and non-tertiary education are 73% and 27% respectively for low and middle income ESCAP countries in 2015.
3 Given that data are mostly unavailable for post-secondary education (e.g. PTR, teacher salaries, etc), we assume the unit cost for post-sec-ondary education is 100% of GDP per capita by 2030. This approximately reflects the post-secondary unit cost in UMICs and HICs.

A GUIDEBOOK FOR ASSESSING SDG INVESTMENT NEEDS56
Policy and financing options
The efficiency of monetary investment can be enhanced through numerous non-monetary initiatives in the edu-cation system, such as child-oriented teaching methods focused on skill formation, using languages that pupils understand, teachers making full use of class time and not shirking, and responsible and responsive school management. For instance, in India attendance-mon-itoring using tablets and mobile-based applications resulted in a lower teacher absenteeism rate and improved outcomes in student performance (Kedia, 2018). Such factors will prove to be vital for monetary investment to contribute to achieving good-quality and equitable education for all.
In general, countries already spending 6 per cent of GDP or more on education could absorb the additional needs within the existing education budget, but others would need to meet the gap through budgetary real-location from other sectors and/or overall increase in the government budget backed by higher tax reve-nues. The above model places a cap on government and household expenditures, such that the residual becomes an external finance gap. Whereas the gap is only 0.4 per cent of the total education spending for the region as a whole, it is much higher in the Pacific islands at 11 per cent.

A GUIDEBOOK FOR ASSESSING SDG INVESTMENT NEEDS 57
Where we stand
Despite progress, not on track at the Asia-Pacific regional level. Indicators related to gender parity in years of school-ing and women researchers are on track, but those related to gender wage gap, gender parity in labour force partic-ipation, and seats in parliament, government, and mana-gerial positions are off track (figure 1).
Precise estimation of SDG5 related investment is diffi-cult. Globally, a 2017 survey found that 23 countries had prominent gender budgeting initiative and another 37 countries had other gender budgeting initiative. In the Asia-Pacific region, countries in more advanced stage of gender-responsive budgeting included Bangladesh, India, Indonesia, Nepal, Philippines and the Republic of Korea, and those in early stage included Afghanistan, Bhutan, Cambodia, China, Cook Islands, Fiji, Kiribati, Lao PDR, Malaysia, Maldives, Myanmar, Pakistan, Papua New Guinea, Samoa, Solomon Islands, Sri Lanka, Thailand, Timor-Leste, Vanuatu and Viet Nam. And while many countries conduct gender budget tagging, there is no cross-country database of how much of the government budget is gender-related.
Globally, members of the OECD Development Assistance Committee (DAC) targeted an average of $44.8 billion per year in 2016-2017, corresponding to 38 percent of their bilateral allocable aid, towards gender equality and wom-en’s equality as either a primary or secondary objective (4 percent primary, 34 percent secondary). The remain-ing 62 percent, however, was gender blind. In the Asia-Pacific region, DAC aid targeted at ending violence against women and girls stood at $267 million in 2016-2018 with Afghanistan being the largest recipient ($56 million), and those targeted at women’s rights organization and move-ments and government institutions was at $410 million over the same period, with Indonesia being the largest recipient ($72 million).
Towards a comprehensive needs assessment
While governments have made commitments to action on gender equality, the lack of data on the costs of translat-ing policy commitments into resources and investments limits the effectiveness and impact of their interventions (UN WOMEN 2015). However, estimating the resource needs for achieving SDG5 is difficult. Gender outcomes
ACHIEVE GENDER EQUALITY AND EMPOWER ALL WOMEN AND GIRLS

A GUIDEBOOK FOR ASSESSING SDG INVESTMENT NEEDS58
Figure 1. Progress at the indicator level
5.1.P1 Gender wage gap
5.1.P2 Gender parity in labour force participation
5.1.P3 Ratio of female to male mean years of schooling
5.1.P4 Gender parity in youth labour force
5.5.1 Seats held by women in national parliaments and local governments
5.5.2 Proportion of women in managerial positions
5.5.P1 Women researchers
20192000 Target 2030
are not easily derived from production functions that can be parameterized. Moreover, economic growth does not automatically translate into reductions in gender equalities or improvements in women’s well-being. Because gender inequality is both multi-dimen-sional and multi-sectoral, actions to achieve gender equality cut across many different areas, raising the possibility of double counting. And yet such compre-hensive assessments are needed to pursue a holistic SDG5 strategy. Most of the existing studies focus only on specific targets such as achieving gender parity in education or universal access to sexual and repro-ductive health services. The cost methodology dis-cussed below aims to bring these different elements together. Of course, even such comprehensive needs assessment could be implemented successfully only if accompanied by necessary changes in legislation, administrative rules, social attitudes and norms.
We identify three types of interventions (figure 2). The first two explicitly aim to reduce gender inequality or empower women, and is referred to as “GE (gender equality)” interventions. Gender-specific interventions
have an explicit gender focus and are primarily imple-mented through the ministry of women’s affairs or jointly with a relevant line ministry. These include: legal, mediation and rehabilitation services for violence against women; community/school-based awareness campaigns for reproductive health and rights; sensiti-zation programs for public officials (e.g. judges, bureau-crats, police force, land registration officials); legal aid services to help women claim their rights; and training for women candidates standing for elections and sup-port to women elected representatives.
Gender mainstreaming interventions largely fall out-side of SDG5 but nevertheless have an explicit gender focus; for instance, in agriculture (SDG2), special efforts to recruit and train women extension workers can help ensure that the national extension services reach female farmers to the same extent as it does male farmers. In health (SDG3), skilled birth attendants and clean delivery as well as contraception and family planning services would have direct impact on women. In education (SDG4), increasing retention of girls in school may require special subsidies on the demand
Figure 2. Three types of interventions
Source: Adapted from UN Millennium Project (2004, 2005) and Grown et al. (2006).
Gender-specific interventions
Gender mainstreaming interventions
Interventions that do not specifically aim at gender equality

A GUIDEBOOK FOR ASSESSING SDG INVESTMENT NEEDS 59
side, and special facilities such as toilets for girls on the supply side. Also included in gender mainstream-ing interventions are investments that strengthen the capacity of the sector (and the ministry) to achieve gender equality, for instance, the costs of gender focal points in each line ministry, the costs of gender training for line ministry staff, the costs of gender-disaggre-gated research, and so forth.
The third type of intervention is designed primarily for the achievement of other SDGs and yet can promote gender equality, and is referred to as “NTGE (non-tar-geted GE)” interventions. To estimate the financial resources that contribute to promoting gender equal-ity through interventions that do not specifically aim at gender equality, we need to estimate that share of the cost of the intervention that goes toward reduc-ing the gender gap and maintaining female access to that service. The relevant gender gap in the education, health, and rural development sectors is in utilization of services. For instance, utilization in education can be captured by sex-disaggregated enrollment rates; utilization of rural credit programs can be captured by sex-disaggregated borrower rates, and so forth. At the same time, infrastructure interventions, such as water, sanitation, and energy services benefit all members of the households that receive them but they also address an important gender gap—the gap in time spent col-lecting water and fuel. Public or private sector provi-sioning is replacing household provisioning, or in other words, reducing the unpaid labor of those household members (typically women and girls) who fetch the water and gather the firewood.
The cost for implementing the above three types of interventions through the year 2030 can be summa-rized as follows (Grown et al, 2006). The costs at time t of interventions specifically designed to promote gen-der-specific and gender mainstreaming interventions, where there are p and q of each intervention, can be expressed formally as:
FORMULAS
Section 2 P 22 & 23 EXAMPLE 1
𝐴𝐴𝐴𝐴𝐴𝐴𝐴𝐴𝐴𝐴𝐴𝐴𝐴𝐴𝐴𝐴𝐴𝐴𝐴𝐴𝐴𝐴𝐴𝐴𝐴𝐴𝐴𝐴𝐴𝐴𝐴𝐴𝐴𝐴𝐴𝐴𝐴𝐴𝐴𝐴𝑗𝑗𝑗𝑗,𝑡𝑡𝑡𝑡 = �𝐶𝐶𝐶𝐶𝐴𝐴𝐴𝐴𝐶𝐶𝐶𝐶𝐴𝐴𝐴𝐴𝑖𝑖𝑖𝑖,𝑗𝑗𝑗𝑗,𝑡𝑡𝑡𝑡𝑖𝑖𝑖𝑖
− 𝐵𝐵𝐵𝐵𝐵𝐵𝐵𝐵𝑗𝑗𝑗𝑗,𝑡𝑡𝑡𝑡
𝐵𝐵𝐵𝐵𝐵𝐵𝐵𝐵𝑗𝑗𝑗𝑗,𝑡𝑡𝑡𝑡 = 𝐵𝐵𝐵𝐵𝐵𝐵𝐵𝐵𝑗𝑗𝑗𝑗,𝑡𝑡𝑡𝑡0 ∗ (1 + 𝑝𝑝𝑝𝑝𝑝𝑝𝑝𝑝𝑝𝑝𝑝𝑝�����)𝑡𝑡𝑡𝑡−𝑡𝑡𝑡𝑡0
𝐼𝐼𝐼𝐼𝐴𝐴𝐴𝐴𝐼𝐼𝐼𝐼𝑝𝑝𝑝𝑝𝐼𝐼𝐼𝐼𝐼𝐼𝐼𝐼𝐼𝐼𝐼𝐼𝐴𝐴𝐴𝐴𝐴𝐴𝐴𝐴𝐴𝐴𝐴𝐴𝐴𝐴𝐴𝐴𝑗𝑗𝑗𝑗,𝑡𝑡𝑡𝑡 = �𝐼𝐼𝐼𝐼𝐵𝐵𝐵𝐵𝑖𝑖𝑖𝑖,𝑗𝑗𝑗𝑗,𝑡𝑡𝑡𝑡𝑖𝑖𝑖𝑖
− 𝐵𝐵𝐵𝐵𝐵𝐵𝐵𝐵𝑗𝑗𝑗𝑗,𝑡𝑡𝑡𝑡
𝜃𝜃𝜃𝜃𝑖𝑖𝑖𝑖,𝑗𝑗𝑗𝑗 =100% − 𝐼𝐼𝐼𝐼𝐴𝐴𝐴𝐴𝑐𝑐𝑐𝑐𝑖𝑖𝑖𝑖,𝑗𝑗𝑗𝑗,𝑡𝑡𝑡𝑡𝑎𝑎𝑎𝑎
(2030 − 𝐴𝐴𝐴𝐴𝑎𝑎𝑎𝑎)
P 25 EXAMPLE 2 Infrastructure
𝐹𝐹𝐹𝐹𝑖𝑖𝑖𝑖,𝑡𝑡𝑡𝑡 = �𝐹𝐹𝐹𝐹𝑖𝑖𝑖𝑖,𝑡𝑡𝑡𝑡𝑗𝑗𝑗𝑗 and
𝑗𝑗𝑗𝑗
𝐹𝐹𝐹𝐹𝑖𝑖𝑖𝑖,𝑡𝑡𝑡𝑡𝑗𝑗𝑗𝑗 = max�
𝐼𝐼𝐼𝐼𝑖𝑖𝑖𝑖,𝑇𝑇𝑇𝑇𝑗𝑗𝑗𝑗 − 𝐼𝐼𝐼𝐼𝑖𝑖𝑖𝑖,𝑡𝑡𝑡𝑡
𝑗𝑗𝑗𝑗
𝑇𝑇𝑇𝑇 − 𝐴𝐴𝐴𝐴, 0� × 𝐼𝐼𝐼𝐼𝑖𝑖𝑖𝑖
𝑗𝑗𝑗𝑗 + 𝐼𝐼𝐼𝐼𝑖𝑖𝑖𝑖,𝑡𝑡𝑡𝑡𝑗𝑗𝑗𝑗 × 𝐼𝐼𝐼𝐼𝑖𝑖𝑖𝑖
𝑗𝑗𝑗𝑗
𝐼𝐼𝐼𝐼𝑖𝑖𝑖𝑖,𝑡𝑡𝑡𝑡𝑗𝑗𝑗𝑗 = 𝛼𝛼𝛼𝛼0
𝑗𝑗𝑗𝑗 + 𝛼𝛼𝛼𝛼1𝑗𝑗𝑗𝑗𝐼𝐼𝐼𝐼𝑖𝑖𝑖𝑖,𝑡𝑡𝑡𝑡−1𝑗𝑗𝑗𝑗 + 𝛼𝛼𝛼𝛼2
𝑗𝑗𝑗𝑗𝑦𝑦𝑦𝑦𝑖𝑖𝑖𝑖,𝑡𝑡𝑡𝑡 + 𝛼𝛼𝛼𝛼3𝑗𝑗𝑗𝑗𝐴𝐴𝐴𝐴𝑖𝑖𝑖𝑖,𝑡𝑡𝑡𝑡 + 𝛼𝛼𝛼𝛼4
𝑗𝑗𝑗𝑗𝑀𝑀𝑀𝑀𝑖𝑖𝑖𝑖,𝑡𝑡𝑡𝑡 + 𝛼𝛼𝛼𝛼5𝑗𝑗𝑗𝑗𝑈𝑈𝑈𝑈𝑖𝑖𝑖𝑖,𝑡𝑡𝑡𝑡 + 𝛼𝛼𝛼𝛼6
𝑗𝑗𝑗𝑗𝑃𝑃𝑃𝑃𝑖𝑖𝑖𝑖,𝑡𝑡𝑡𝑡 + 𝛼𝛼𝛼𝛼7𝑗𝑗𝑗𝑗𝐷𝐷𝐷𝐷𝑖𝑖𝑖𝑖
𝑗𝑗𝑗𝑗 + 𝛼𝛼𝛼𝛼8𝑗𝑗𝑗𝑗𝐴𝐴𝐴𝐴,
Goal 5 P 92
𝐶𝐶𝐶𝐶𝐴𝐴𝐴𝐴𝐶𝐶𝐶𝐶𝐴𝐴𝐴𝐴𝐺𝐺𝐺𝐺𝐺𝐺𝐺𝐺 = � �� 𝐺𝐺𝐺𝐺𝐼𝐼𝐼𝐼𝐴𝐴𝐴𝐴𝐺𝐺𝐺𝐺𝑝𝑝𝑝𝑝𝐼𝐼𝐼𝐼𝐼𝐼𝐼𝐼𝑖𝑖𝑖𝑖,𝑡𝑡𝑡𝑡 + � 𝐺𝐺𝐺𝐺𝐼𝐼𝐼𝐼𝐴𝐴𝐴𝐴𝑀𝑀𝑀𝑀𝐴𝐴𝐴𝐴𝐴𝐴𝐴𝐴𝐴𝐴𝐴𝐴𝑗𝑗𝑗𝑗,𝑡𝑡𝑡𝑡 𝑞𝑞𝑞𝑞
𝑗𝑗𝑗𝑗=1
𝑝𝑝𝑝𝑝
𝑖𝑖𝑖𝑖=1�
2030
𝑡𝑡𝑡𝑡=2016
𝐶𝐶𝐶𝐶𝐴𝐴𝐴𝐴𝐶𝐶𝐶𝐶𝐴𝐴𝐴𝐴𝑁𝑁𝑁𝑁𝑇𝑇𝑇𝑇𝐺𝐺𝐺𝐺𝐺𝐺𝐺𝐺 = � � 𝛼𝛼𝛼𝛼𝑘𝑘𝑘𝑘,𝑡𝑡𝑡𝑡𝑁𝑁𝑁𝑁𝑇𝑇𝑇𝑇𝐺𝐺𝐺𝐺𝐵𝐵𝐵𝐵𝑘𝑘𝑘𝑘,𝑡𝑡𝑡𝑡
𝑠𝑠𝑠𝑠
𝑘𝑘𝑘𝑘=1
2030
𝑡𝑡𝑡𝑡=2016
Goal 9 P 125
𝐹𝐹𝐹𝐹𝑖𝑖𝑖𝑖,𝑡𝑡𝑡𝑡 = �𝐹𝐹𝐹𝐹𝑖𝑖𝑖𝑖,𝑡𝑡𝑡𝑡𝑗𝑗𝑗𝑗 and
𝑗𝑗𝑗𝑗
𝐹𝐹𝐹𝐹𝑖𝑖𝑖𝑖,𝑡𝑡𝑡𝑡𝑗𝑗𝑗𝑗 = max�
𝐼𝐼𝐼𝐼𝑖𝑖𝑖𝑖,𝑇𝑇𝑇𝑇𝑗𝑗𝑗𝑗 − 𝐼𝐼𝐼𝐼𝑖𝑖𝑖𝑖,𝑡𝑡𝑡𝑡
𝑗𝑗𝑗𝑗
𝑇𝑇𝑇𝑇 − 𝐴𝐴𝐴𝐴, 0� × 𝐼𝐼𝐼𝐼𝑖𝑖𝑖𝑖
𝑗𝑗𝑗𝑗 + 𝐼𝐼𝐼𝐼𝑖𝑖𝑖𝑖,𝑡𝑡𝑡𝑡𝑗𝑗𝑗𝑗 × 𝐼𝐼𝐼𝐼𝑖𝑖𝑖𝑖
𝑗𝑗𝑗𝑗 + max�𝑈𝑈𝑈𝑈𝑗𝑗𝑗𝑗 − 𝐼𝐼𝐼𝐼𝑖𝑖𝑖𝑖,𝑇𝑇𝑇𝑇
𝑗𝑗𝑗𝑗
𝑇𝑇𝑇𝑇 − 𝐴𝐴𝐴𝐴, 0� × 𝐼𝐼𝐼𝐼𝑖𝑖𝑖𝑖
𝑗𝑗𝑗𝑗
P 126
𝐼𝐼𝐼𝐼𝑖𝑖𝑖𝑖,𝑡𝑡𝑡𝑡𝑗𝑗𝑗𝑗 = 𝛼𝛼𝛼𝛼0
𝑗𝑗𝑗𝑗 + 𝛼𝛼𝛼𝛼1𝑗𝑗𝑗𝑗𝐼𝐼𝐼𝐼𝑖𝑖𝑖𝑖,𝑡𝑡𝑡𝑡−1𝑗𝑗𝑗𝑗 + 𝛼𝛼𝛼𝛼2
𝑗𝑗𝑗𝑗𝑦𝑦𝑦𝑦𝑖𝑖𝑖𝑖,𝑡𝑡𝑡𝑡 + 𝛼𝛼𝛼𝛼3𝑗𝑗𝑗𝑗𝐴𝐴𝐴𝐴𝑖𝑖𝑖𝑖,𝑡𝑡𝑡𝑡 + 𝛼𝛼𝛼𝛼4
𝑗𝑗𝑗𝑗𝑀𝑀𝑀𝑀𝑖𝑖𝑖𝑖,𝑡𝑡𝑡𝑡 + 𝛼𝛼𝛼𝛼5𝑗𝑗𝑗𝑗𝑈𝑈𝑈𝑈𝑖𝑖𝑖𝑖,𝑡𝑡𝑡𝑡 + 𝛼𝛼𝛼𝛼6
𝑗𝑗𝑗𝑗𝑃𝑃𝑃𝑃𝑖𝑖𝑖𝑖,𝑡𝑡𝑡𝑡 + 𝛼𝛼𝛼𝛼7𝑗𝑗𝑗𝑗𝐷𝐷𝐷𝐷𝑖𝑖𝑖𝑖
𝑗𝑗𝑗𝑗 + 𝛼𝛼𝛼𝛼8𝑗𝑗𝑗𝑗𝐴𝐴𝐴𝐴,
𝐼𝐼𝐼𝐼𝑖𝑖𝑖𝑖,𝑡𝑡𝑡𝑡𝑗𝑗𝑗𝑗 = 𝛼𝛼𝛼𝛼0
𝑗𝑗𝑗𝑗 + 𝛼𝛼𝛼𝛼1𝑗𝑗𝑗𝑗𝐼𝐼𝐼𝐼𝑖𝑖𝑖𝑖,𝑡𝑡𝑡𝑡−1𝑗𝑗𝑗𝑗 + 𝛼𝛼𝛼𝛼2
𝑗𝑗𝑗𝑗𝑦𝑦𝑦𝑦𝑖𝑖𝑖𝑖,𝑡𝑡𝑡𝑡 + 𝛼𝛼𝛼𝛼3𝑗𝑗𝑗𝑗𝐴𝐴𝐴𝐴𝑖𝑖𝑖𝑖,𝑡𝑡𝑡𝑡 + 𝛼𝛼𝛼𝛼4
𝑗𝑗𝑗𝑗𝑀𝑀𝑀𝑀𝑖𝑖𝑖𝑖,𝑡𝑡𝑡𝑡 + 𝛼𝛼𝛼𝛼5𝑗𝑗𝑗𝑗𝑈𝑈𝑈𝑈𝑖𝑖𝑖𝑖,𝑡𝑡𝑡𝑡 + 𝛼𝛼𝛼𝛼6
𝑗𝑗𝑗𝑗𝑃𝑃𝑃𝑃𝑖𝑖𝑖𝑖,𝑡𝑡𝑡𝑡 + 𝛼𝛼𝛼𝛼7𝑗𝑗𝑗𝑗𝐷𝐷𝐷𝐷𝑖𝑖𝑖𝑖
𝑗𝑗𝑗𝑗 + 𝛼𝛼𝛼𝛼8𝑗𝑗𝑗𝑗𝐴𝐴𝐴𝐴 + 𝛼𝛼𝛼𝛼9
𝑗𝑗𝑗𝑗𝐵𝐵𝐵𝐵𝑝𝑝𝑝𝑝𝑖𝑖𝑖𝑖,𝑡𝑡𝑡𝑡𝑗𝑗𝑗𝑗
+ 𝛼𝛼𝛼𝛼10𝑗𝑗𝑗𝑗 𝐵𝐵𝐵𝐵𝐸𝐸𝐸𝐸𝑖𝑖𝑖𝑖,𝑡𝑡𝑡𝑡
𝑗𝑗𝑗𝑗 + 𝛼𝛼𝛼𝛼11𝑗𝑗𝑗𝑗 𝑃𝑃𝑃𝑃𝐼𝐼𝐼𝐼𝑖𝑖𝑖𝑖,𝑡𝑡𝑡𝑡
𝑗𝑗𝑗𝑗
where GenSpecit is the cost of an gender-specific inter-vention i at time t and GenMainjt is the cost of a gender mainstreaming intervention j at time t.
NTGEk,t is the cost at time t of non-targeted sector interventions that have a gender equality benefit, where there are s non-targeted interventions. Let ak,t be the proportion of the costs of these interventions that can be attributed to promoting gender equality at
time t. The total cost of non-targeted interventions is therefore:
FORMULAS
Section 2 P 22 & 23 EXAMPLE 1
𝐴𝐴𝐴𝐴𝐴𝐴𝐴𝐴𝐴𝐴𝐴𝐴𝐴𝐴𝐴𝐴𝐴𝐴𝐴𝐴𝐴𝐴𝐴𝐴𝐴𝐴𝐴𝐴𝐴𝐴𝐴𝐴𝐴𝐴𝐴𝐴𝐴𝐴𝐴𝐴𝑗𝑗𝑗𝑗,𝑡𝑡𝑡𝑡 = �𝐶𝐶𝐶𝐶𝐴𝐴𝐴𝐴𝐶𝐶𝐶𝐶𝐴𝐴𝐴𝐴𝑖𝑖𝑖𝑖,𝑗𝑗𝑗𝑗,𝑡𝑡𝑡𝑡𝑖𝑖𝑖𝑖
− 𝐵𝐵𝐵𝐵𝐵𝐵𝐵𝐵𝑗𝑗𝑗𝑗,𝑡𝑡𝑡𝑡
𝐵𝐵𝐵𝐵𝐵𝐵𝐵𝐵𝑗𝑗𝑗𝑗,𝑡𝑡𝑡𝑡 = 𝐵𝐵𝐵𝐵𝐵𝐵𝐵𝐵𝑗𝑗𝑗𝑗,𝑡𝑡𝑡𝑡0 ∗ (1 + 𝑝𝑝𝑝𝑝𝑝𝑝𝑝𝑝𝑝𝑝𝑝𝑝�����)𝑡𝑡𝑡𝑡−𝑡𝑡𝑡𝑡0
𝐼𝐼𝐼𝐼𝐴𝐴𝐴𝐴𝐼𝐼𝐼𝐼𝑝𝑝𝑝𝑝𝐼𝐼𝐼𝐼𝐼𝐼𝐼𝐼𝐼𝐼𝐼𝐼𝐴𝐴𝐴𝐴𝐴𝐴𝐴𝐴𝐴𝐴𝐴𝐴𝐴𝐴𝐴𝐴𝑗𝑗𝑗𝑗,𝑡𝑡𝑡𝑡 = �𝐼𝐼𝐼𝐼𝐵𝐵𝐵𝐵𝑖𝑖𝑖𝑖,𝑗𝑗𝑗𝑗,𝑡𝑡𝑡𝑡𝑖𝑖𝑖𝑖
− 𝐵𝐵𝐵𝐵𝐵𝐵𝐵𝐵𝑗𝑗𝑗𝑗,𝑡𝑡𝑡𝑡
𝜃𝜃𝜃𝜃𝑖𝑖𝑖𝑖,𝑗𝑗𝑗𝑗 =100% − 𝐼𝐼𝐼𝐼𝐴𝐴𝐴𝐴𝑐𝑐𝑐𝑐𝑖𝑖𝑖𝑖,𝑗𝑗𝑗𝑗,𝑡𝑡𝑡𝑡𝑎𝑎𝑎𝑎
(2030 − 𝐴𝐴𝐴𝐴𝑎𝑎𝑎𝑎)
P 25 EXAMPLE 2 Infrastructure
𝐹𝐹𝐹𝐹𝑖𝑖𝑖𝑖,𝑡𝑡𝑡𝑡 = �𝐹𝐹𝐹𝐹𝑖𝑖𝑖𝑖,𝑡𝑡𝑡𝑡𝑗𝑗𝑗𝑗 and
𝑗𝑗𝑗𝑗
𝐹𝐹𝐹𝐹𝑖𝑖𝑖𝑖,𝑡𝑡𝑡𝑡𝑗𝑗𝑗𝑗 = max�
𝐼𝐼𝐼𝐼𝑖𝑖𝑖𝑖,𝑇𝑇𝑇𝑇𝑗𝑗𝑗𝑗 − 𝐼𝐼𝐼𝐼𝑖𝑖𝑖𝑖,𝑡𝑡𝑡𝑡
𝑗𝑗𝑗𝑗
𝑇𝑇𝑇𝑇 − 𝐴𝐴𝐴𝐴, 0� × 𝐼𝐼𝐼𝐼𝑖𝑖𝑖𝑖
𝑗𝑗𝑗𝑗 + 𝐼𝐼𝐼𝐼𝑖𝑖𝑖𝑖,𝑡𝑡𝑡𝑡𝑗𝑗𝑗𝑗 × 𝐼𝐼𝐼𝐼𝑖𝑖𝑖𝑖
𝑗𝑗𝑗𝑗
𝐼𝐼𝐼𝐼𝑖𝑖𝑖𝑖,𝑡𝑡𝑡𝑡𝑗𝑗𝑗𝑗 = 𝛼𝛼𝛼𝛼0
𝑗𝑗𝑗𝑗 + 𝛼𝛼𝛼𝛼1𝑗𝑗𝑗𝑗𝐼𝐼𝐼𝐼𝑖𝑖𝑖𝑖,𝑡𝑡𝑡𝑡−1𝑗𝑗𝑗𝑗 + 𝛼𝛼𝛼𝛼2
𝑗𝑗𝑗𝑗𝑦𝑦𝑦𝑦𝑖𝑖𝑖𝑖,𝑡𝑡𝑡𝑡 + 𝛼𝛼𝛼𝛼3𝑗𝑗𝑗𝑗𝐴𝐴𝐴𝐴𝑖𝑖𝑖𝑖,𝑡𝑡𝑡𝑡 + 𝛼𝛼𝛼𝛼4
𝑗𝑗𝑗𝑗𝑀𝑀𝑀𝑀𝑖𝑖𝑖𝑖,𝑡𝑡𝑡𝑡 + 𝛼𝛼𝛼𝛼5𝑗𝑗𝑗𝑗𝑈𝑈𝑈𝑈𝑖𝑖𝑖𝑖,𝑡𝑡𝑡𝑡 + 𝛼𝛼𝛼𝛼6
𝑗𝑗𝑗𝑗𝑃𝑃𝑃𝑃𝑖𝑖𝑖𝑖,𝑡𝑡𝑡𝑡 + 𝛼𝛼𝛼𝛼7𝑗𝑗𝑗𝑗𝐷𝐷𝐷𝐷𝑖𝑖𝑖𝑖
𝑗𝑗𝑗𝑗 + 𝛼𝛼𝛼𝛼8𝑗𝑗𝑗𝑗𝐴𝐴𝐴𝐴,
Goal 5 P 92
𝐶𝐶𝐶𝐶𝐴𝐴𝐴𝐴𝐶𝐶𝐶𝐶𝐴𝐴𝐴𝐴𝐺𝐺𝐺𝐺𝐺𝐺𝐺𝐺 = � �� 𝐺𝐺𝐺𝐺𝐼𝐼𝐼𝐼𝐴𝐴𝐴𝐴𝐺𝐺𝐺𝐺𝑝𝑝𝑝𝑝𝐼𝐼𝐼𝐼𝐼𝐼𝐼𝐼𝑖𝑖𝑖𝑖,𝑡𝑡𝑡𝑡 + � 𝐺𝐺𝐺𝐺𝐼𝐼𝐼𝐼𝐴𝐴𝐴𝐴𝑀𝑀𝑀𝑀𝐴𝐴𝐴𝐴𝐴𝐴𝐴𝐴𝐴𝐴𝐴𝐴𝑗𝑗𝑗𝑗,𝑡𝑡𝑡𝑡 𝑞𝑞𝑞𝑞
𝑗𝑗𝑗𝑗=1
𝑝𝑝𝑝𝑝
𝑖𝑖𝑖𝑖=1�
2030
𝑡𝑡𝑡𝑡=2016
𝐶𝐶𝐶𝐶𝐴𝐴𝐴𝐴𝐶𝐶𝐶𝐶𝐴𝐴𝐴𝐴𝑁𝑁𝑁𝑁𝑇𝑇𝑇𝑇𝐺𝐺𝐺𝐺𝐺𝐺𝐺𝐺 = � � 𝛼𝛼𝛼𝛼𝑘𝑘𝑘𝑘,𝑡𝑡𝑡𝑡𝑁𝑁𝑁𝑁𝑇𝑇𝑇𝑇𝐺𝐺𝐺𝐺𝐵𝐵𝐵𝐵𝑘𝑘𝑘𝑘,𝑡𝑡𝑡𝑡
𝑠𝑠𝑠𝑠
𝑘𝑘𝑘𝑘=1
2030
𝑡𝑡𝑡𝑡=2016
Goal 9 P 125
𝐹𝐹𝐹𝐹𝑖𝑖𝑖𝑖,𝑡𝑡𝑡𝑡 = �𝐹𝐹𝐹𝐹𝑖𝑖𝑖𝑖,𝑡𝑡𝑡𝑡𝑗𝑗𝑗𝑗 and
𝑗𝑗𝑗𝑗
𝐹𝐹𝐹𝐹𝑖𝑖𝑖𝑖,𝑡𝑡𝑡𝑡𝑗𝑗𝑗𝑗 = max�
𝐼𝐼𝐼𝐼𝑖𝑖𝑖𝑖,𝑇𝑇𝑇𝑇𝑗𝑗𝑗𝑗 − 𝐼𝐼𝐼𝐼𝑖𝑖𝑖𝑖,𝑡𝑡𝑡𝑡
𝑗𝑗𝑗𝑗
𝑇𝑇𝑇𝑇 − 𝐴𝐴𝐴𝐴, 0� × 𝐼𝐼𝐼𝐼𝑖𝑖𝑖𝑖
𝑗𝑗𝑗𝑗 + 𝐼𝐼𝐼𝐼𝑖𝑖𝑖𝑖,𝑡𝑡𝑡𝑡𝑗𝑗𝑗𝑗 × 𝐼𝐼𝐼𝐼𝑖𝑖𝑖𝑖
𝑗𝑗𝑗𝑗 + max�𝑈𝑈𝑈𝑈𝑗𝑗𝑗𝑗 − 𝐼𝐼𝐼𝐼𝑖𝑖𝑖𝑖,𝑇𝑇𝑇𝑇
𝑗𝑗𝑗𝑗
𝑇𝑇𝑇𝑇 − 𝐴𝐴𝐴𝐴, 0� × 𝐼𝐼𝐼𝐼𝑖𝑖𝑖𝑖
𝑗𝑗𝑗𝑗
P 126
𝐼𝐼𝐼𝐼𝑖𝑖𝑖𝑖,𝑡𝑡𝑡𝑡𝑗𝑗𝑗𝑗 = 𝛼𝛼𝛼𝛼0
𝑗𝑗𝑗𝑗 + 𝛼𝛼𝛼𝛼1𝑗𝑗𝑗𝑗𝐼𝐼𝐼𝐼𝑖𝑖𝑖𝑖,𝑡𝑡𝑡𝑡−1𝑗𝑗𝑗𝑗 + 𝛼𝛼𝛼𝛼2
𝑗𝑗𝑗𝑗𝑦𝑦𝑦𝑦𝑖𝑖𝑖𝑖,𝑡𝑡𝑡𝑡 + 𝛼𝛼𝛼𝛼3𝑗𝑗𝑗𝑗𝐴𝐴𝐴𝐴𝑖𝑖𝑖𝑖,𝑡𝑡𝑡𝑡 + 𝛼𝛼𝛼𝛼4
𝑗𝑗𝑗𝑗𝑀𝑀𝑀𝑀𝑖𝑖𝑖𝑖,𝑡𝑡𝑡𝑡 + 𝛼𝛼𝛼𝛼5𝑗𝑗𝑗𝑗𝑈𝑈𝑈𝑈𝑖𝑖𝑖𝑖,𝑡𝑡𝑡𝑡 + 𝛼𝛼𝛼𝛼6
𝑗𝑗𝑗𝑗𝑃𝑃𝑃𝑃𝑖𝑖𝑖𝑖,𝑡𝑡𝑡𝑡 + 𝛼𝛼𝛼𝛼7𝑗𝑗𝑗𝑗𝐷𝐷𝐷𝐷𝑖𝑖𝑖𝑖
𝑗𝑗𝑗𝑗 + 𝛼𝛼𝛼𝛼8𝑗𝑗𝑗𝑗𝐴𝐴𝐴𝐴,
𝐼𝐼𝐼𝐼𝑖𝑖𝑖𝑖,𝑡𝑡𝑡𝑡𝑗𝑗𝑗𝑗 = 𝛼𝛼𝛼𝛼0
𝑗𝑗𝑗𝑗 + 𝛼𝛼𝛼𝛼1𝑗𝑗𝑗𝑗𝐼𝐼𝐼𝐼𝑖𝑖𝑖𝑖,𝑡𝑡𝑡𝑡−1𝑗𝑗𝑗𝑗 + 𝛼𝛼𝛼𝛼2
𝑗𝑗𝑗𝑗𝑦𝑦𝑦𝑦𝑖𝑖𝑖𝑖,𝑡𝑡𝑡𝑡 + 𝛼𝛼𝛼𝛼3𝑗𝑗𝑗𝑗𝐴𝐴𝐴𝐴𝑖𝑖𝑖𝑖,𝑡𝑡𝑡𝑡 + 𝛼𝛼𝛼𝛼4
𝑗𝑗𝑗𝑗𝑀𝑀𝑀𝑀𝑖𝑖𝑖𝑖,𝑡𝑡𝑡𝑡 + 𝛼𝛼𝛼𝛼5𝑗𝑗𝑗𝑗𝑈𝑈𝑈𝑈𝑖𝑖𝑖𝑖,𝑡𝑡𝑡𝑡 + 𝛼𝛼𝛼𝛼6
𝑗𝑗𝑗𝑗𝑃𝑃𝑃𝑃𝑖𝑖𝑖𝑖,𝑡𝑡𝑡𝑡 + 𝛼𝛼𝛼𝛼7𝑗𝑗𝑗𝑗𝐷𝐷𝐷𝐷𝑖𝑖𝑖𝑖
𝑗𝑗𝑗𝑗 + 𝛼𝛼𝛼𝛼8𝑗𝑗𝑗𝑗𝐴𝐴𝐴𝐴 + 𝛼𝛼𝛼𝛼9
𝑗𝑗𝑗𝑗𝐵𝐵𝐵𝐵𝑝𝑝𝑝𝑝𝑖𝑖𝑖𝑖,𝑡𝑡𝑡𝑡𝑗𝑗𝑗𝑗
+ 𝛼𝛼𝛼𝛼10𝑗𝑗𝑗𝑗 𝐵𝐵𝐵𝐵𝐸𝐸𝐸𝐸𝑖𝑖𝑖𝑖,𝑡𝑡𝑡𝑡
𝑗𝑗𝑗𝑗 + 𝛼𝛼𝛼𝛼11𝑗𝑗𝑗𝑗 𝑃𝑃𝑃𝑃𝐼𝐼𝐼𝐼𝑖𝑖𝑖𝑖,𝑡𝑡𝑡𝑡
𝑗𝑗𝑗𝑗
where ak,t is estimated separately for each intervention.
Taken together, the total estimated cost of interven-tions to promote gender equality is the sum of all gen-der-equality promoting interventions and the share of the costs of non-targeted sectoral interventions that can be attributed to the promotion of gender equality.
Types of costing approaches
UN-WOMEN (2015) explains how unit costing and impact costing can be applied to SDG5 as well as cost-ing for gender-responsive budgets.
Unit costing approach can be applied at different levels, for instance, to achieve a development goal; to imple-ment a policy or intervention; or to deliver a service. In terms of gender equality, a unit may be providing a scheme, for example scholarships or subsidies for girls of school age or addressing a gender discrimination case. The unit cost is calculated as dividing the total cost of a service/product/policy by the population it covers. In addressing violence against women (VAW), unit costing would require information on which VAW-related services and/or activities are ongoing, how often they are being used (number of units consumed) and the costs per unit of those services. However, using current expenditures to calculate the unit cost has its caveats. For instance, it does not consider the time dynamics of the product or service. Change in price, and demand for the product or service and target groups are also overlooked.
Impact costing approach calculates the cost of the socio-economic impact of a given problem or inter-vention. Compared to the unit costing, impact costing could be very comprehensive and useful for compar-ing the cost of inaction with the resources needed for action. For instance, direct and indirect, tangible and intangible costs of VAW to survivors, their families, the community and society at large, out-of-pocket expenses (fees for support services, transport or shel-ter), loss of earnings and the value of missed paid or unpaid work due to VAW, could all be considered. The data required to conduct this approach include national prevalence statistics, the unit costs of different services accessed by survivors, information on the severity of

A GUIDEBOOK FOR ASSESSING SDG INVESTMENT NEEDS60
effects, how different aspects of the survivor’s life are affected would ideally be available, the identification of main agents bearing costs and some knowledge of public budgets.
Costing for gender-responsive budgets is an approach which estimates the financial needs of gender equality interventions under the wider planning and budget-ing practice. This approach estimates gender gaps in plans and budgets and the costs of required actions and ensures resource is allocated to gender-respon-sive programs. For instance, it may consider: gaps in VAW laws and policies; amount of resources allocated to different VAW-related services; and adequacy and sources of funding. Data required would include infor-mation on which VAW-related services are planned or available, current VAW laws and policies and relevant budgetary data.
Costing steps
UN WOMEN (2015) recommends the following steps:
1. Designing the costing exercise
This step involves determining the suitability of a cost-ing exercise within the context, purpose of the exer-cise, what will be included in costing, the constraints of the exercise such as time and resources, defining the appropriate methodology, and strategic partners to work with.
2. Identifying needed intervention
This step involves determining the current situation about available services and interventions and their service providers, defining the gaps and needed ser-vices, and their providers. Furthermore, needed ser-vices and interventions should be prioritize in order to take action. Once selected, coverage and consistent targets should be defined.
3. Collecting data
This step involves examining and collecting the data and information required to conduct the costing exer-cise (table 1).
4. Calculating needed resources
Costs may be calculated by incremental or total cost-ing approached. While incremental costing calculates the additional financing required to implement new interventions, the latter calculates the total cost of all interventions needed.
Total cost is calculated as the product of population size, per cent of population reached, number of inter-ventions per person, and unit cost of the intervention. A unit cost is the cost of a single unit of an interven-tion, service, or item. For example, salary, transporta-tion, supplies, administrative and overhead costs are among the types of costs forming part of a single unit of an intervention.
5. Integrating into planning/budgeting
This step takes the results from the previous steps and use them to affect budget allocations. The estimates from the previous steps are to be classified into national budget in terms of function (for example education, health, and so on), programme (for example technical education, a vaccination programme, and so on), activ-ity and/or project, and line item (for example supplies, salaries, and so on).
6. Sharing advocate monitor
The last step involves designing an appropriate and effective advocacy strategy to transform the findings to effective policies. This would require defining the advo-cacy objectives, effective actors, strategy to influence, advocacy messages, key entry points and opportunities in the budget frameworks, and strategic partnerships.

A GUIDEBOOK FOR ASSESSING SDG INVESTMENT NEEDS 61
Tools
UN WOMEN (2015) reports the main costing models used by UN WOMEN to cost gender priorities as below:
Table 1. Data needs for gender equality costing exercises
Type of data Specific data neededData on the issue Situation of women in the sector/issue under study, including information on key
indicators and gender gaps
Scale of the issue/problem In the case of VAW: Prevalence/incidence data Cases reported Rates of service use
Information on how the government is addressing the issue
Legal frameworks and policies to address the issue Programme data: what services are provided and planned, where they are available (geographic coverage), and for which target groups; programme monitoring and evaluation information Information on which level of government is responsible for delivering the services (national, provincial, local)
Government funding for issue Budgetary information: allocations, expenditures and revenues for services/issue
Cost data Unit costs of services (including administrative costs)Salary data for different levels of officials in different ministries Price lists for administrative costs, transport costs, etc.
Information on the planning and budgeting processes, systems and tools
Annual budget documents Main planning and budgeting systems and tools used Call circulars Budget submission forms to the Ministry of Finance
Information on how the issue affects women, families, the state and companies (relevant for impact costing)
Information on how different aspects of women’s lives are affected by the issue and the severity of effects Information on who bears the costs (individual, family, state, companies, etc.)
Source: UN WOMEN (2015)
Table 2. Tools for costing gender equality
Methodology/Tool Purposes
Gender Needs Assessment tool Guide to Use the Gender Needs Assessment Model and Tool Matrix (ENG)
Tool for Costing Gender Equality/Equal Opportunities in Bolivia
User’s Manual “Tool for Costing Gender Equality / Equal Opportunities.” UN Women. Bolivia (SP)
Methodology for Costing the Second Gender Equality and Equity Plan of Honduras (PIEGH II)
Guide for Budget Costing with a Gender Perspective. Second Gender Equality and Equity Plan of Honduras. (SP)
Methodology for Costing multi-disciplinary service packages to assist women and girls who are victims of violence.
Manual for costing packages of multi-disciplinary services regarding violence against women and girls. UN Women (ENG)
Source: UN WOMEN (2015)
Note: Adapted from: Raquel Coello-Cremades. Costing policies and interventions for gender equality. Concepts, methodologies and expe-riences. UNDP and UN Women. La Paz. September, 2013. Available athttp://www.gobernabilidad.org.bo/costeo-genero
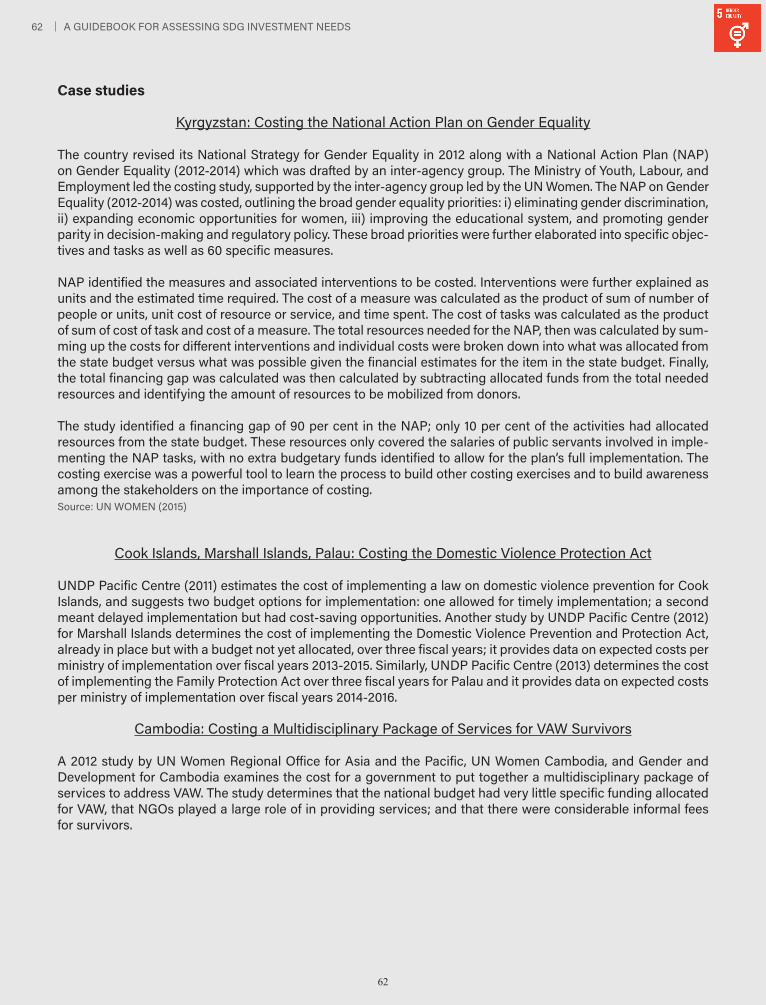
A GUIDEBOOK FOR ASSESSING SDG INVESTMENT NEEDS62
62
Case studies
Kyrgyzstan: Costing the National Action Plan on Gender Equality
The country revised its National Strategy for Gender Equality in 2012 along with a National Action Plan (NAP) on Gender Equality (2012-2014) which was drafted by an inter-agency group. The Ministry of Youth, Labour, and Employment led the costing study, supported by the inter-agency group led by the UN Women. The NAP on Gender Equality (2012-2014) was costed, outlining the broad gender equality priorities: i) eliminating gender discrimination, ii) expanding economic opportunities for women, iii) improving the educational system, and promoting gender parity in decision-making and regulatory policy. These broad priorities were further elaborated into specific objec-tives and tasks as well as 60 specific measures.
NAP identified the measures and associated interventions to be costed. Interventions were further explained as units and the estimated time required. The cost of a measure was calculated as the product of sum of number of people or units, unit cost of resource or service, and time spent. The cost of tasks was calculated as the product of sum of cost of task and cost of a measure. The total resources needed for the NAP, then was calculated by sum-ming up the costs for different interventions and individual costs were broken down into what was allocated from the state budget versus what was possible given the financial estimates for the item in the state budget. Finally, the total financing gap was calculated was then calculated by subtracting allocated funds from the total needed resources and identifying the amount of resources to be mobilized from donors.
The study identified a financing gap of 90 per cent in the NAP; only 10 per cent of the activities had allocated resources from the state budget. These resources only covered the salaries of public servants involved in imple-menting the NAP tasks, with no extra budgetary funds identified to allow for the plan’s full implementation. The costing exercise was a powerful tool to learn the process to build other costing exercises and to build awareness among the stakeholders on the importance of costing.Source: UN WOMEN (2015)
Cook Islands, Marshall Islands, Palau: Costing the Domestic Violence Protection Act
UNDP Pacific Centre (2011) estimates the cost of implementing a law on domestic violence prevention for Cook Islands, and suggests two budget options for implementation: one allowed for timely implementation; a second meant delayed implementation but had cost-saving opportunities. Another study by UNDP Pacific Centre (2012) for Marshall Islands determines the cost of implementing the Domestic Violence Prevention and Protection Act, already in place but with a budget not yet allocated, over three fiscal years; it provides data on expected costs per ministry of implementation over fiscal years 2013-2015. Similarly, UNDP Pacific Centre (2013) determines the cost of implementing the Family Protection Act over three fiscal years for Palau and it provides data on expected costs per ministry of implementation over fiscal years 2014-2016.
Cambodia: Costing a Multidisciplinary Package of Services for VAW Survivors
A 2012 study by UN Women Regional Office for Asia and the Pacific, UN Women Cambodia, and Gender and Development for Cambodia examines the cost for a government to put together a multidisciplinary package of services to address VAW. The study determines that the national budget had very little specific funding allocated for VAW, that NGOs played a large role of in providing services; and that there were considerable informal fees for survivors.
A GUIDEBOOK FOR ASSESSING SDG INVESTMENT NEEDS62

A GUIDEBOOK FOR ASSESSING SDG INVESTMENT NEEDS 63
Where we stand
Despite progress, not on track at the Asia-Pacific regional level. The indicator on policies and procedures for par-ticipatory water and sanitation management is on track, but indicators related to access to safe and affordable drinking water and ending open defecation are mildly off track while the indicator on water stress is severely off track (figure 1).
Globally, some 54 countries reported total water, sanita-tion and hygiene (WASH) expenditures of $60 billion in 2018/2019, with an average $31 per capita. Data from 35 countries show that households contribute two-thirds of total WASH expenditures. In the Asia-Pacific region, total WASH expenditures from all sources (government, house-hold, repayable, external) range from 3.4 percent of GDP in Maldives to 0.25 percent in the Philippines (figure 2).
Globally, over 75 percent of countries reported the exis-tence of financing plans for WASH, but more than half of these plans are insufficiently implemented. Cost estimates from 20 countries and territories reveal a funding gap of 61 percent between identified needs and available fund-ing to reach national targets. For the Asia-Pacific region, ESCAP’s Survey 2019 estimated annual average additional investments to be $83 billion. Total needs are as high as 2.5 percent of GDP in Afghanistan; these estimates are reported by subsector and component – universal access, new demand, maintenance, and climate change (figure 3).
Costing methodology
In Hutton and Varughese (2016), to estimate the costs of meeting the WASH targets in the SDGs, the study com-bined the unit costs per capita of WASH services with the populations remaining to be served with different service levels. The total population to be served from 2015 to 2030 was broken down into 15 equal annual tranches to allow estimation of a time series of capital investment as well as operations and maintenance (O&M) needs. Population estimates took into account population growth as well as rural-urban migration until the year 2030.
To achieve universal coverage of basic or safely man-aged services, populations will be able to choose from different hardware options or technologies. However, it is not possible to predict exactly which technologies will be chosen by governments and service providers, or by
ENSURE AVAILABILITY AND SUSTAINABLE MANAGEMENT OF WATER AND SANITATION FOR ALL

A GUIDEBOOK FOR ASSESSING SDG INVESTMENT NEEDS64
Figure 1. Progress at the indicator level
6.1.1 Safely managed drinking water services
6.2.1 Open defecation practice
6.4.2 Water stress
6.6.1 Permanent water body extent
6.a.1 ODA to water and sanitation (LDCs)
6.b.1 Policies and procedures for participative water and sanitation management
20192000 Target 2030
Figure 2. Investment trendsUN-Water and WHO (2019) estimates of current expenditures
the households they serve. Thus, a mix of lower-cost technology options could be selected for basic WASH. These include community wells for water supply, improved latrines for sanitation, and a basin with water and soap for practicing hand washing. Higher-cost options such as piped water and sewerage are included as options under safely managed services.
The costs of meeting the WASH-related SDG tar-gets by 2030 will depend on the pathway for scaling up services. Realistically, many households will first become open defecation–free with an unimproved toilet facility and only later upgrade to a latrine that safely isolates waste. However, not all households will pass through a lower service level— for example, in India the major share of households are likely to receive an improved toilet under the national govern-ment Swachh Bharat Abiyan (Clean India Mission).
Similarly, many households, especially in rural areas, are likely to receive an improved water supply from a community source before being upgraded to a house-hold water supply (for example, piped supply or an on-plot well). Thus, the results are presented under lower- and upper-cost scenarios, and in the baseline 50 percent of households are assumed to go straight to a higher level of service, while the remaining 50 percent pass through unimproved sanitation or basic water before a higher-level service is attained.
The total intervention cost consists of all the resources required to put in place, operate, and maintain WASH services. A distinction is made between upfront invest-ment or capital costs (“CapEx”), major capital mainte-nance costs (“CapManEx”) and regular recurrent costs (“OpEx”) (Fonseca et al. 2010).

A GUIDEBOOK FOR ASSESSING SDG INVESTMENT NEEDS 65
� CapEx includes planning and supervision, hard-ware, construction and house alteration, protec-tion of water sources, education, and behavioral change.
� CapManEx includes maintenance of hardware and replacement of parts and renovation or reha-bilitation when required to extend the life of the hardware to its expected life span.
� OpEx includes the operating materials needed to provide a service, regulation, ongoing protection, and monitoring of water sources, water treat-ment and distribution, and continuous education activities.
Scenarios
The costing exercise requires distinct interventions in rural and urban settings. Except for hygiene (captured
by hand-washing services) every intervention applies two types of scenarios:
� A low-cost scenario that uses basic technologies, easy to implement and not financially demand-ing; and
� A high-cost scenario with innovative and improved technologies, and higher market prices. Many of these technologies consume electricity and might not be suitable in remote areas where electrifica-tion (whether from renewable or non-renewable sources) has not been addressed yet.
Low-cost approach can be favoured in areas with no facilities, while high-cost approach can be prioritized in areas that already have water and sanitation facilities based on low-cost technologies. Table 1 outlines the technology options and associated costs.
Figure 3. Investment needsESCAP Survey 2019: by subsector and component; annual average needs, 2016-2030

A GUIDEBOOK FOR ASSESSING SDG INVESTMENT NEEDS66
Assumptions
Assumptions on cost drivers play a central role in the projection of costs, and their financing strategies. They should cover all resources required to set up, operate and maintain WASH services. Three types of costs should be distinguished (see Fonseca and others, 2010):
� Capital or upfront investment include cost of plan-ning and supervision, hardware, construction and house alteration, protection of water sources, awareness, education, and behavioural changes.
� Maintenance costs refer to hardware mainte-nance, replacement of parts and renovation or rehabilitation in order to extend the life of the hardware to its expected life span.
� Recurrent or operational costs which encompass the costs for operating materials required to pro-vide a service, the sets of regulation, protection, and monitoring of water sources, water treatment and distribution, as well as activities related to education, awareness and behavioral changes.
Cost estimation for water
The target performance in this sector is full access to improved water sources for all populations. The cost estimation is set up for urban and rural populations, dis-tinctively. Countries can assess their current conditions from two indicators, among others: the percentages of rural and urban populations (out of all rural and urban populations, respectively) that have access to improved water sources.
Step 1: unit costs. The estimation begins by computing the cost per capita split by capital investment, capital maintenance and operations costs. The estimation is disaggregated (rural and urban). Depending on the service level, two approaches/scenarios are explored:
� Low-cost scenario (basic water) refers to the cost for setting protected community borehole, tube well, dug well in premises (i.e 30 minutes or less for a round-trip, including queuing).
� High-cost scenario (safely managed water) refers to the cost for setting piped water supply in premises.
Table 1. Technology options modelled under baseline and associated costs
Service Baseline technology assumption
ScenariosLow-cost High-cost
Basic water – 50 per cent protected community borehole/ tube well
– 50 per cent protected dug well
100 per cent protected dug well
Safely managed water – Piped water supply on-plot
Open defecation–free, rural
– Simple or traditional latrines
Basic sanitation, urban – 50 per cent flush toilet to septic tank – 50 per cent any type of pit latrine
100 per cent any type of pit latrine
100 per cent flush toilet to septic tank
Basic sanitation, rural – 50 per cent pour-flush pit latrine – 50 per cent dry pit latrine
100 per cent dry pit latrine
100 per cent pour-flush pit latrine
Safely managed sanitation
– 50 per cent sewerage with treatment – 50 per cent FSM with treatment
100 per cent FSM with treatment
100 per cent sewerage with treatment
Hand washing – 100 per cent with mix of hand-washing basin options (varying by region)
Source: Hutton and Varughese (2016). Note: FSM = fecal sludge management

A GUIDEBOOK FOR ASSESSING SDG INVESTMENT NEEDS 67
In other words, there are four types of unit costs split by capital investment, capital maintenance and oper-ations costs.
� Basic water supply in rural areas
� Basic water supply in urban areas
� Safely managed water supply in rural areas
� Safely managed water supply in urban areas
Step 2: total cost. Total cost is obtained by multiplying the population to be covered by the cost per capita for each of the four in unit costs above, split by capital investment, capital maintenance and operation costs.
Step 3: projection. To project the total cost:
� Estimate the total population size in urban and rural areas per year till 2030 Adjustments can be made to the population growth depending on the dynamics of the country.
� Compute the population to be served with new services according to services and service levels. This number can be obtained based on the pop-ulation size, current coverage, target year and target coverage.
� Project unit costs per year to reach to meet the 2030 Agenda. To the extent possible the projec-tion can consider cost drivers such as hardware lifetime, migration, interest rate, overuse of water resources due to climate effects, technological progress, discount rate for future costs, national water policy vision and strategy.
Countries lacking enough data can extrapolate the costs from neighbouring countries that have similar economic characteristics and adjusting for purchasing power parity.
Cost estimation for sanitation
The approach is similar to that of water. The target per-formance in this sector is access to improved sanitation
Table 2. Assumptions for cost
Service Life span of capital
items (years)
Time until capital
maintenance (years)
Software (as % of
hardware)
Capital maintenance
(as % of initial capital)
Operating costs (as
% of initial capital)
Water supplySafe household piped 20 10 10% 30% NR
Basic household piped 20 10 5% 30% NR
Borehole or tube well 20 10 5% 30% NR
Dug well 10 5 5% 30% NR
SanitationSeptic tank, sewerage, treatment facilities
20 10 10% 30% NR
Urban basic pit latrine 8 4 10% 30% 5%
Rural basic pit latrine 8 4 20% 30% 5%
Rural traditional pit latrine (for ODF)
2 5% of cost of a basic pit latrine
0% 5% of cost of a basic pit latrine
HygieneHand washing 1~5* Half life span Estimated
separately30% NR
Source: Hutton and Varughese (2016).
Note: NR = no assumption required because data are largely available on these items, ODF = open defecation–free. * Variable, depending on type of hardware chosen.

A GUIDEBOOK FOR ASSESSING SDG INVESTMENT NEEDS68
for urban and rural populations.
Step 1: unit costs. Costs per capita in urban and rural areas are split by capital investment, capital maintenance and operations costs. There are also two approaches:
� Low cost scenario (basic sanitation): cost for setting flush toilet, pour-flush pit latrine (dry pit latrines for rural areas)
� High cost scenario (safely sanitation): cost for sewerage with treatments, and fecal sludge
And are four types of unit costs:
� Basic sanitation in rural areas
� Basic sanitation in urban areas
� Safely managed sanitation in rural areas
� Safely managed sanitation in urban areas
Step 2: total cost. As in water, the total cost is obtained by multiplying the population to be covered by the cost per capita, with clear distinction between rural and urban areas, service coverage level and types of costs.
Step 3: projection. The projection method also follows a similar approach as water with attention to cost drivers such as hardware lifetime, migration, interest rate, overuse of water resources due to climate effects, technological progress, discount rate for future costs, national sanitation policy vision and strategy.
Cost estimation for hygiene
Hygiene is one of the most challenging data-wise, yet it is the lowest-cost service. The indicator to consider can be the percentage of population using hand-wash-ing facilities with soap and water at home or other cleaning material. It is available in the Joint Monitoring Programme for Water Supply and Sanitation (UNICEF and WHO) database10 or a limited number of countries. The costing method is similar to that of water and san-itation, except that there is no distinction between high and low-cost scenarios.
Tools
The WHO/UNICEF Joint Monitoring Program for water
10 https://washdata.org
and sanitation provides country level data at the house-hold, schools and health facilities levels, by different quality grades (including limited, basic, and safely man-aged), and by income quintiles.
Hutton and Varughese (2016) can serve as good ref-erence manual. The appendix outlines the steps, and provides the estimated data derived from these steps.
World Bank Water and Sanitation Program (WSP) aims at reproducing successful approaches and sup-port reforms that contribute to enhancing sustainable investments in water and sanitation. It has produced several country case studies in Asia and the Pacific.
UN-Water support countries for more sustainable water and sanitation through dentification of emerging issues and developing effective and collaborative responses; and publication of data and information on key water trends and management issues.
Policy and financing options
For policy and financing considerations, it is important to make distinctions between water and sanitation ser-vices as well as rural and urban settings. Within urban settings, improving management of billing, fee collec-tion, fixing leakage and making routine maintenance can help improve efficiency of funds and the reliability of water supply services (World Bank and UNICEF, 2017). Within rural settings, lack of community owner-ship and lack of incentives for households to invest in sanitation are some examples of why water and sanita-tion targets are not reached. Raising awareness on the risks to health posed by open defecation and investing in behaviour change related to hygienic practices have proven to be more effective than subsidies in incentiv-izing households to invest in latrines. Making latrines cheaper or providing “toilet loans”, such as in India, have also raised household demand for latrines.
Unlike other sectors, such as telecommunications where access can be funded through user fees, water and sanitation in urban and rural settings requires dif-ferent considerations. In the urban setting, service pro-vider tariffs can play a larger role while in rural settings, more investments may be needed by the public sector in transitioning to piped systems. Furthermore, financ-ing capital versus operational expenditures can often be from different sources, while households also have a large role to play in self-provision or self-investments.

A GUIDEBOOK FOR ASSESSING SDG INVESTMENT NEEDS 69
Case study
Urban Infrastructure Services in India
Within the framework of the High-Powered Expert Committee (HPEC) set up by the Ministry of Urban Development, India conducted cost estimation of infrastructure services critical for urbanization such as water supply, sewerage, and sanitation (figure 4). Sanitation was mainly addressed through improved sewerage system for both water supply and toilets. The exercise covered the period 2012-2031. The estimates include additional demand over the next 20 years, the unmet demand for the current population as well as cost for replacement.
Figure 4. Need assessment of water supply and sewerage in India
Source: High-Powered Expert Committee (HPEC), Ministry of Urban Development (2011).
Definition of service norms and population size class. The Committee used service norms from the Ministry of Urban Development. For water supply, 100% individual piped water supply for all households including informal settlements for all cities; continuity of supply; and per capita consumption of 135 litres per day. For sewerage, underground system for all cities and 100% collection and treatment of waste water. The Committee notes that the spatial pattern of urbanization is one of the key drivers of the unit cost of service provision. On a per capita basis, providing piped water services to low-density and small urban settlements is more expensive than metropolitan and high-density areas.
A GUIDEBOOK FOR ASSESSING SDG INVESTMENT NEEDS 69

A GUIDEBOOK FOR ASSESSING SDG INVESTMENT NEEDS70
Assumptions. The estimation uses number of assumptions seen as crucial determinants of the quality of the esti-mates. For water supply:
� On average, 80% of distribution network pipes are to be replaced for delivering continuous water supply for all city size classes;
� For cities with population above 500,000, industrial water production would account for 20% of the total water production and demand would grow at 7% per annum;
� For industrial and commercial water demand, estimates are made only for water production;
� Storage requirement is 45 lpcd, equivalent to a third of the daily water demand;
� Cost of connection and metering per household is Rs. 2,500
� Surface water is considered as the source of water;
� Service life of assets is 30 years; and
� 2001 is taken as the base year. Production coverage is 10 percentage points lower in 1991 and another 10 percentage points lower in 1981.
For sewerage:
� Sewage generated is at 80% of per capita water consumption, and 5% sewage generation is assumed for infiltration from groundwater (113 lpcd);
� Investment requirements and operation and management costs are calculated for domestic waste water;
� Operation and management costs for treatment is up to secondary treatment;
� There is no excess treatment capacity in the existing sewerage treatment plants; and
� Service life of the assets is 30 years.
Unit costs and computation of the service backlog. Using the underlying assumptions, norms and types of costs, unit costs per operation and maintenance are computed. They were derived from: unit cost from project data; production volume for each sector; and population covered. Service backlog for water supply and sewerage was computed using Cities Development Plans. For example, in water supply, to estimate the production requirements, the share of urban population with production allocation below 168 litre per capita per day in 2011 is used.
Projections. Information on current investment in water and sewerage is obtained from different sources including Urban Local Bodies and Urban Development Authorities; and the investment needs were computed from unit costs. To project the cost until 2031, the study used UN Population Division projection, but with some adjustment as the available data were less disaggregated than the Committee’ population size classification.
A GUIDEBOOK FOR ASSESSING SDG INVESTMENT NEEDS70

A GUIDEBOOK FOR ASSESSING SDG INVESTMENT NEEDS 71
Where we stand
Relatively good progress but not on track at the Asia-Pacific regional level. Indicators related to access to electricity and clean cooking are on track, but those related to renewable energy share and energy intensity are off track (figure 1).
Globally, total energy investment stood at $1.9 trillion in 2019, of which the power sector accounted for $760 billion – generation $480 billion (renewables $311 billion, coal $60 billion) and electricity networks $273 billion. In the Asia-Pacific region, total energy investment was $690 billion in 2019, of which the power sector accounted for $352 billion – generation $236 billion (renewables $162 billion, coal $40 billion) and networks $115 billion. Figure 2 shows country level investment trends by renewable energy sources – wind, solar, biofuels, biomass and waste, geothermal, small hydro, and marine.
Going forward, it is projected that global power invest-ment will increase to an annual average of $1.3 trillion over the period 2019-2050, under a sustainable devel-opment scenario. Not only is this 25 percent higher from the baseline scenario, but the composition of power generation investment shifts further towards renewables ($607 billion) and away from fossil fuels. Investment in electricity networks also increase significantly to $575 billion. For the Asia-Pacific region, ESCAP’s Survey 2019 estimated that an average new investment of $434 bil-lion per year would be needed to achieve Goal 7, includ-ing $10 billion in universal access to electricity, $2 billion in clean cooking solutions, $242 billion in renewable energy, and $180 billion in energy efficiency. Figure 3 shows the breakdown for China, India and South-East Asian countries.
Energy scenarios
ESCAP Survey 2019 used the International Energy Agency’s World Energy Model to estimate the capital costs to achieve three major targets under Goal 7:
� universal access to electricity and clean cooking;
� substantially increase the share of renewable energy in the energy mix; and
� double the rate of improvement in energy effi-ciency (in transport, industry and building)
The IEA model presents three scenarios, of which only
ENSURE ACCESS TO AFFORDABLE, RELIABLE, AND SUSTAINABLE AND MODERN ENERGY FOR ALL

A GUIDEBOOK FOR ASSESSING SDG INVESTMENT NEEDS72
Figure 1. Progress at the indicator level
7.1.1 Access to electricity
7.1.2 Reliance on clean energy
7.2.1 Renewable energy share
7.3.1 Energy intensity
7.a.1 International support for clean and renewable energy (LDCs)
7.b.P1 Renewable electricity capacity
20192000 Target 2030
Figure 2. Investment trendsInvestment in renewable energy; US$ millions (based on BNEF data)
Figure 3. Investment needsPower generation investments in the sustainable development scenario,
2017-2030, US$ billions
Source: ESCAP, based on IEA World Energy Outlook 2018

A GUIDEBOOK FOR ASSESSING SDG INVESTMENT NEEDS 73
the sustainable development scenario is consistent with Goals 7 and 13 and offers considerable health co-benefits (chapter 1, table 6). Under the other sce-narios, although the number of people without access to electricity or clean cooking declines, carbon emis-sions increase through 2030 and persistent reliance on fossil fuel and limited progress on clean cooking continue to cause several million premature deaths through air pollution.
Although many parts of the costing exercise tackle the supply side of energy, the demand for energy plays a crucial role in determining the matching between supply and demand. Forecasting demand for energy can be obtained by regressing historical energy con-sumption data on historical data on factors such as GDP growth/productivity, energy prices, subsides, taxes, population growth, technology changes etc.
Cost estimation for electricity
Step 1: requirements. Access to electricity is closely linked with the reliability or quality of energy services. Access to electricity is typically defined as the average household having access to electricity powering four lightbulbs to operate at five hours per day, one refrigerator, a fan to operate 6 hours per day, a mobile phone charger and a television to operate 4 hours per day, which equates to an annual electricity consumption of 1,250 kWh per household with standard appliances, and 420 kWh with efficient appliances. This is a similar level to Tier 2 access as defined by World Bank’s Multi-Tiered Framework (2015).
Step 2: unit costs. Compute the unit costs for each household appliance. Distinction should be made between rural and urban. Unit costs are also derived from electricity generation plants, operation and maintenance. Wherever applicable, electricity cost must include yearly capital cost of electricity generation plants, operation and maintenance costs of electricity plants and fuel prices and, CO2 cost of generation plants’ output.
Step 3: investment need. The calculation entails multiplying the capital cost ($/kW) for each generating technology by the corresponding capacity additions to reach the target performance, as shown below:
Additional investment needed = incremen-tal capacity needs × unit capital cost
For example, if 1,000 rural households do not have
access to electricity, and the unit cost per kWh for efficient appliances is $10, the additional investment need is 1000 households x $10 = $10,000. A similar approach is undertaken for electricity generation plants. However, distinction should be made between capital, operation and maintenance costs.
Step 4: projection: Assumptions should be made on cost drivers which are important for the projection. Factors include subsidies and taxes to the energy sector (renewable, electricity, fossil fuels) as well as population, productivity, macroeconomic conditions and technological changes.
Cost estimation for clean cooking
Access to clean cooking refers to the primary reliance on modern fuels and technologies in cooking, including fuels such as natural gas, LPG, electricity and biogas, or technologies such as improved biomass cookstoves. The demand for clean cooking facilities is based on the outlook for the number of people relying primarily on the traditional use of biomass, which is projected by an econometric panel model based on a historical time series. Like electricity, a four-step approach can be taken. Key difference lies in Step 2, where the unit cost of different clean cooking tools or technologies are estimated.
Cost estimation for renewables and energy mix
Step 1: identification. First, determine the available renewable sources in the country, and the long-term realizable potential. These sources include bioenergy, hydropower, photovoltaics, wind, solar power, geothermal electricity, and marine. At the same time, Carbon Capture Utilisation and Storage (CCUS) technologies can support faster decarbonization.
The starting point for deriving future deployment of renewables is the assessment of long-term realizable potentials for each type of renewable. The assessment is based on a review of the existing literature and on the refinement of available data. It includes the follow-ing steps:
� General physical parameters are taken into account to determine the theoretical upper limit of what can be produced from a particular energy, based on current scientific knowledge.
� The technical potential can be derived from an

A GUIDEBOOK FOR ASSESSING SDG INVESTMENT NEEDS74
observation of such boundary conditions as the efficiency of conversion technologies and the available land area to install wind turbines. For most resources, technical potential is a changing factor. With increased R&D, conversion technolo-gies might be improved and the technical poten-tial increased.
� Long-term realizable potential is the fraction of the overall technical potential that can be actually realized in the long term. To estimate it, over-all constraints like technical feasibility, social acceptance, planning requirements and indus-trial growth are taken into consideration.
Step 2: costs and investment need. For each of the renewable sources identified as well as the CCUS technologies, several types of costs should be considered, including:
� Capital, maintenance and operation calculated distinctively;
� Cost of learning new technologies; and
� Cost of incentives for usage of renewables sources.
The investment need is the investment required to meet the country’s capacity needs.
Step 3: projection. Based on the identified country potential, yearly total investment needs are determined and projected till 2030, by paying attentions to potential costs drivers.
Cost estimation for energy efficiencyInvestment in energy efficiency is defined as the addi-tional amount that consumers have to pay for higher energy efficiency.
Step 1: baseline. First, calculate the baseline cost, which is the cost (including taxes and freights) that consumers have to pay for the current and most commonly used basic products with low efficiency.
Step 2: unit costs. Obtain the list of products that have higher efficiencies than the baseline, and their final price (including taxes and freights).
Step 3: investment needs. The investment needed is obtained by computing the additional amount that consumers have to spend to procure more energy-efficient products. This amount includes taxes, freights, and labour costs that are directly
related to their installation.
Step 4: projection. Similar to electricity, major cost drivers in the projected period should be considered.
For investment needed for efficient energy equipment in industry, transport and buildings, a similar approach is undertaken. The approach also takes into consider-ation potential stock turnovers and economic returns.
Policy and financing options
Energy investment is expected to decline significantly in 2020 due to the COVID-19 shock. IEA analysis sug-gests that countries in full lockdown are experiencing an average 25 percent decline in energy demand rela-tive to typical levels and countries in partial lockdown an average 18 percent decline. Oil is bearing the brunt of this shock because of the curtailment in mobility and aviation, which represent nearly 60% of global oil demand. At the same time, coal demand could decline by 8 percent, reflecting lower electricity demand. The recovery of coal demand for industry and electric-ity generation in China, however, could offset larger declines elsewhere.
For the year as a whole, output from renewable sources is expected to increase because of low oper-ating costs and preferential access to many power systems. Investment in solar PV and wind has held up, even as costs have come down. But spending on other aspects of a secure and sustainable system – grids, storage, flexibility – are lagging behind. Decisions to move ahead with new coal plants have fallen by 80 percent since 2015, but approvals in Q1 2020 – mostly in Asia – were at twice the rate seen in 2019: overall, the global coal fleet continues to grow. Developing coun-tries rely much more heavily on state-backed spend-ing, while developed countries have a broad range of financing options, including from capital markets and institutional investors.
Going forward, achieving SDG7 will require not only higher investment but also a decisive shift towards a cleaner energy mix. Under a sustainable develop-ment scenario, the largest increase in supply invest-ment would come from renewables-based power. The other major shift is towards the demand side, to take advantage of the huge potential for energy efficiency. This means additional spending on more efficient build-ings, industrial processes and transport, as well as new demand-side infrastructure such as EV recharging.
For energy financing, both demand- and supply-side

A GUIDEBOOK FOR ASSESSING SDG INVESTMENT NEEDS 75
Case study
Afghanistan: Power Sector Master Plan and renewable power distribution
Afghanistan’s Power Sector Master Plan (2012- 2032) aims to identify the priorities, timeframe and costs associated with power sector development goals. It gives importance to electricity distribution from renew-able sources; there existed no centralized power plant which utilized renewable energies such as solar, wind, biomass or geothermal in the country. Solutions for the distribution of renewable electricity sources in the country were proposed in a way that can be applied to different circumstances, considering the realities of remote areas of the country.
Identification. Among the various renewable sources, priorities have been given to solar and wind, which represent the most promising sources for the country. Two strategies are adopted: solar distribution across the whole country and wind distribution, which is more local based.
Assumptions and costs. The assumptions made on interventions areas, prices and facilities requirements are the following:
� Consider small (50 houses) large (200 houses) villages
� Each household has about 10 people
� Average annual electricity consumption per person is 100 kWh/a, which is set at a higher level than the current one due to expected increases in consumption
� Each household requires an electricity meter (unit cost $110) and a 50 meter-length cable ($12 per meter). Capital expenditure for local distribution is therefore ($12 x 50) + 110 = $710 per household.
� Diesel price: $1.3 per litre (transportation cost incorporated)
� Discount rate: 12%
� Loan duration: 10 years
Analysis. The most common option for electricity generation in remote areas that are not con-nected to a grid is diesel generator. For solar energy, solar home system and hybrid system (pho-tovoltaic and diesel) are considered. For wind energy, hybrid system of wind turbine and diesel generator are considered. For each of these options, the average electricity generation cost is estimated at the level of end-user.
A GUIDEBOOK FOR ASSESSING SDG INVESTMENT NEEDS 75

A GUIDEBOOK FOR ASSESSING SDG INVESTMENT NEEDS76
Table 1. Electricity generation costs of different systems for remote areas
Small village Large village
Source: Gmbh and Kg (2013)
The results shown in Table 1 suggest the following: A solar option is still the most expensive. A combination of diesel and renewable energy (wind or solar) helps to save money. Cost-wise, wind appears to be the most promising renewable energy source. The preferred option should be a hybrid system with wind and diesel. The use of solar PV as a diesel fuel saver can be an alternative. Every project site should prioritize either wind or solar energy.
interventions are needed. Given the key role of the pri-vate sector, the primary function of the government is to work on risk-return components of investment opportunities through policy and financial de-risking instruments and direct financial incentives.11 Other actions include energy taxes, tax exemptions, carbon pricing mechanisms and incentives for renewable. On the supply-side, the main objective is to align the finan-cial system to the SDGs, through new low-cost asset classes such as green bonds and impact investment. Cross-cutting interventions are needed, for instance, to explore the way the private sector can make use of digitalization, and fin-tech solutions for energy-efficient businesses.
11 Policy de-risking instruments. Policies, regulations, and initiatives that reduce the potential risk of investing in low-carbon energy by the private sector. Financial de-risking instruments. Financial tools aiming to transfer to the public sector possible risk stemming from the private sector’s investment opportunities. Direct financial incentives. Compensation of the private sector efforts through financial transfer or subsidies to low-carbon energy investments. It can also take the form of carbon pricing and cut in harmful fossil-fuel subsidies.
A GUIDEBOOK FOR ASSESSING SDG INVESTMENT NEEDS76

A GUIDEBOOK FOR ASSESSING SDG INVESTMENT NEEDS 77
Where we stand
This brief discusses costing of transport and ICT infra-structure, which cut across several Goals including 9 and 11. Costing of other aspects of Goal 9 – industrialization and innovation – are not addressed.
Despite progress, not on track at the Asia-Pacific regional level. Indicator related to population covered by a mobile network is on track, but all other indicators including those related to air transport and railway transport are off track (figure 1).
Transport
Global investment in transport infrastructure was esti-mated at $1.1 trillion in 2017, although there are data avail-ability limitations especially in developing countries. The value announced, under construction and completed transport infrastructure projects in developing and transi-tion economies increased from $258 billion (2012-14 aver-age) to $361 billion (2015-18 average).12 ESCAP Survey 2019 estimated that Asia-Pacific developing countries invested just below 1 percent of GDP in transport infrastructure, but with a wide range across countries (figure 2).
The transport sector is notorious in terms of estimating future investment needs, especially in the context of SDGs, which inter alia calls for universal access for all (target 11.2). McKinsey estimated that the world needs to invest some $1.3 trillion per year through 2030 in roads ($0.8 trillion), rail ($0.3 trillion), ports and airports ($0.1 trillion each). In Asia-Pacific region, ADB estimated that $557 billion would be needed per year through 2030. ESCAP Survey 2019 used similar demand projection methods, and more country-specific unit costs and climate-proofing mark ups to estimated that Asia-Pacific developing countries need to invest $442 billion in transport infrastructure, but only covering roads and railways (figure 3).
ICT
Global telecommunications investment stood at $332 billion in 2017, of which $180 billion was in developing
BUILD RESILIENT INFRASTRUCTURE, PROMOTE INCLUSIVE AND SUSTAINABLE INDUSTRIALIZATION AND FOSTER INNOVATION

A GUIDEBOOK FOR ASSESSING SDG INVESTMENT NEEDS78
Figure 1. Progress at the indicator level
9.1.2 Air transport passengers carried
9.1.P1 Railway transportation of goods and passengers
9.2.1 Manufacturing value added
9.2.2 Manufacturing employment
9.3.2 Small-scale industries with a loan or line of credit
9.4.1 CO2 emission intensity
9.5.1 Research and development expenditure
9.5.2 Number of researchers
9.b.1 Medium and high-tech industry value added
9.c.1 Population covered by a mobile network
20192000 Target 2030
Figure 2. Investment trendsCurrent levels of investment in transport (left) and ICT (right) infrastructure
Figure 3. Investment needsInvestment needs in transport (left) and ICT (right) infrastructure,
2016-2030 annual average

A GUIDEBOOK FOR ASSESSING SDG INVESTMENT NEEDS 79
countries and $7 billion in least developed countries.12 Despite rapid growth in broadband subscriptions in developing countries, digital divide remains wide. Investment in mobile business is expected to become increasingly concentrated in economies launching 5G. ESCAP Survey 2019 estimated that Asia-Pacific devel-oping countries invested just below 0.1 percent of GDP in ICT infrastructure (figure 5).
In terms of total needs, McKinsey estimated that the world needs to invest some $0.5 trillion per year through 2030 in telecommunication infrastructure. In the Asia-Pacific region, ADB estimated that $152 bil-lion would be needed per year through 2030. ESCAP Survey 2019 used country-specific unit costs from ITU to estimated that Asia-Pacific developing countries need to invest $288 billion in ICT infrastructure under a ‘high-cost’ scenario (figure 1). This scenario seems more consistent with the transition to a digital econ-omy, which is expected to accelerate in light of the COVID-19 pandemic.
Costing methodology overview
A conventional ‘top-down’ approach to forecast infra-structure financing needs is to apply unit capital costs and unit maintenance costs to projected changes of physical infrastructure stock and to existing stock, respectively. However, as noted in ESCAP’s Countries with Special Needs Development Report 2017, numer-ous developing Asia-Pacific countries currently lack basic infrastructure and will incur climate-related costs. Thus, the methodology should take into account these additional costs of addressing exiting deficits and adapting to climate change (figure 4). It is assumed that the annual financing needs by 2030 are decom-posed and expressed as follows:
FORMULAS
Section 2 P 22 & 23 EXAMPLE 1
𝐴𝐴𝐴𝐴𝐴𝐴𝐴𝐴𝐴𝐴𝐴𝐴𝐴𝐴𝐴𝐴𝐴𝐴𝐴𝐴𝐴𝐴𝐴𝐴𝐴𝐴𝐴𝐴𝐴𝐴𝐴𝐴𝐴𝐴𝐴𝐴𝐴𝐴𝐴𝐴𝑗𝑗𝑗𝑗,𝑡𝑡𝑡𝑡 = �𝐶𝐶𝐶𝐶𝐴𝐴𝐴𝐴𝐶𝐶𝐶𝐶𝐴𝐴𝐴𝐴𝑖𝑖𝑖𝑖,𝑗𝑗𝑗𝑗,𝑡𝑡𝑡𝑡𝑖𝑖𝑖𝑖
− 𝐵𝐵𝐵𝐵𝐵𝐵𝐵𝐵𝑗𝑗𝑗𝑗,𝑡𝑡𝑡𝑡
𝐵𝐵𝐵𝐵𝐵𝐵𝐵𝐵𝑗𝑗𝑗𝑗,𝑡𝑡𝑡𝑡 = 𝐵𝐵𝐵𝐵𝐵𝐵𝐵𝐵𝑗𝑗𝑗𝑗,𝑡𝑡𝑡𝑡0 ∗ (1 + 𝑝𝑝𝑝𝑝𝑝𝑝𝑝𝑝𝑝𝑝𝑝𝑝�����)𝑡𝑡𝑡𝑡−𝑡𝑡𝑡𝑡0
𝐼𝐼𝐼𝐼𝐴𝐴𝐴𝐴𝐼𝐼𝐼𝐼𝑝𝑝𝑝𝑝𝐼𝐼𝐼𝐼𝐼𝐼𝐼𝐼𝐼𝐼𝐼𝐼𝐴𝐴𝐴𝐴𝐴𝐴𝐴𝐴𝐴𝐴𝐴𝐴𝐴𝐴𝐴𝐴𝑗𝑗𝑗𝑗,𝑡𝑡𝑡𝑡 = �𝐼𝐼𝐼𝐼𝐵𝐵𝐵𝐵𝑖𝑖𝑖𝑖,𝑗𝑗𝑗𝑗,𝑡𝑡𝑡𝑡𝑖𝑖𝑖𝑖
− 𝐵𝐵𝐵𝐵𝐵𝐵𝐵𝐵𝑗𝑗𝑗𝑗,𝑡𝑡𝑡𝑡
𝜃𝜃𝜃𝜃𝑖𝑖𝑖𝑖,𝑗𝑗𝑗𝑗 =100% − 𝐼𝐼𝐼𝐼𝐴𝐴𝐴𝐴𝑐𝑐𝑐𝑐𝑖𝑖𝑖𝑖,𝑗𝑗𝑗𝑗,𝑡𝑡𝑡𝑡𝑎𝑎𝑎𝑎
(2030 − 𝐴𝐴𝐴𝐴𝑎𝑎𝑎𝑎)
P 25 EXAMPLE 2 Infrastructure
𝐹𝐹𝐹𝐹𝑖𝑖𝑖𝑖,𝑡𝑡𝑡𝑡 = �𝐹𝐹𝐹𝐹𝑖𝑖𝑖𝑖,𝑡𝑡𝑡𝑡𝑗𝑗𝑗𝑗 and
𝑗𝑗𝑗𝑗
𝐹𝐹𝐹𝐹𝑖𝑖𝑖𝑖,𝑡𝑡𝑡𝑡𝑗𝑗𝑗𝑗 = max�
𝐼𝐼𝐼𝐼𝑖𝑖𝑖𝑖,𝑇𝑇𝑇𝑇𝑗𝑗𝑗𝑗 − 𝐼𝐼𝐼𝐼𝑖𝑖𝑖𝑖,𝑡𝑡𝑡𝑡
𝑗𝑗𝑗𝑗
𝑇𝑇𝑇𝑇 − 𝐴𝐴𝐴𝐴, 0� × 𝐼𝐼𝐼𝐼𝑖𝑖𝑖𝑖
𝑗𝑗𝑗𝑗 + 𝐼𝐼𝐼𝐼𝑖𝑖𝑖𝑖,𝑡𝑡𝑡𝑡𝑗𝑗𝑗𝑗 × 𝐼𝐼𝐼𝐼𝑖𝑖𝑖𝑖
𝑗𝑗𝑗𝑗
𝐼𝐼𝐼𝐼𝑖𝑖𝑖𝑖,𝑡𝑡𝑡𝑡𝑗𝑗𝑗𝑗 = 𝛼𝛼𝛼𝛼0
𝑗𝑗𝑗𝑗 + 𝛼𝛼𝛼𝛼1𝑗𝑗𝑗𝑗𝐼𝐼𝐼𝐼𝑖𝑖𝑖𝑖,𝑡𝑡𝑡𝑡−1𝑗𝑗𝑗𝑗 + 𝛼𝛼𝛼𝛼2
𝑗𝑗𝑗𝑗𝑦𝑦𝑦𝑦𝑖𝑖𝑖𝑖,𝑡𝑡𝑡𝑡 + 𝛼𝛼𝛼𝛼3𝑗𝑗𝑗𝑗𝐴𝐴𝐴𝐴𝑖𝑖𝑖𝑖,𝑡𝑡𝑡𝑡 + 𝛼𝛼𝛼𝛼4
𝑗𝑗𝑗𝑗𝑀𝑀𝑀𝑀𝑖𝑖𝑖𝑖,𝑡𝑡𝑡𝑡 + 𝛼𝛼𝛼𝛼5𝑗𝑗𝑗𝑗𝑈𝑈𝑈𝑈𝑖𝑖𝑖𝑖,𝑡𝑡𝑡𝑡 + 𝛼𝛼𝛼𝛼6
𝑗𝑗𝑗𝑗𝑃𝑃𝑃𝑃𝑖𝑖𝑖𝑖,𝑡𝑡𝑡𝑡 + 𝛼𝛼𝛼𝛼7𝑗𝑗𝑗𝑗𝐷𝐷𝐷𝐷𝑖𝑖𝑖𝑖
𝑗𝑗𝑗𝑗 + 𝛼𝛼𝛼𝛼8𝑗𝑗𝑗𝑗𝐴𝐴𝐴𝐴,
Goal 5 P 92
𝐶𝐶𝐶𝐶𝐴𝐴𝐴𝐴𝐶𝐶𝐶𝐶𝐴𝐴𝐴𝐴𝐺𝐺𝐺𝐺𝐺𝐺𝐺𝐺 = � �� 𝐺𝐺𝐺𝐺𝐼𝐼𝐼𝐼𝐴𝐴𝐴𝐴𝐺𝐺𝐺𝐺𝑝𝑝𝑝𝑝𝐼𝐼𝐼𝐼𝐼𝐼𝐼𝐼𝑖𝑖𝑖𝑖,𝑡𝑡𝑡𝑡 + � 𝐺𝐺𝐺𝐺𝐼𝐼𝐼𝐼𝐴𝐴𝐴𝐴𝑀𝑀𝑀𝑀𝐴𝐴𝐴𝐴𝐴𝐴𝐴𝐴𝐴𝐴𝐴𝐴𝑗𝑗𝑗𝑗,𝑡𝑡𝑡𝑡 𝑞𝑞𝑞𝑞
𝑗𝑗𝑗𝑗=1
𝑝𝑝𝑝𝑝
𝑖𝑖𝑖𝑖=1�
2030
𝑡𝑡𝑡𝑡=2016
𝐶𝐶𝐶𝐶𝐴𝐴𝐴𝐴𝐶𝐶𝐶𝐶𝐴𝐴𝐴𝐴𝑁𝑁𝑁𝑁𝑇𝑇𝑇𝑇𝐺𝐺𝐺𝐺𝐺𝐺𝐺𝐺 = � � 𝛼𝛼𝛼𝛼𝑘𝑘𝑘𝑘,𝑡𝑡𝑡𝑡𝑁𝑁𝑁𝑁𝑇𝑇𝑇𝑇𝐺𝐺𝐺𝐺𝐵𝐵𝐵𝐵𝑘𝑘𝑘𝑘,𝑡𝑡𝑡𝑡
𝑠𝑠𝑠𝑠
𝑘𝑘𝑘𝑘=1
2030
𝑡𝑡𝑡𝑡=2016
Goal 9 P 125
𝐹𝐹𝐹𝐹𝑖𝑖𝑖𝑖,𝑡𝑡𝑡𝑡 = �𝐹𝐹𝐹𝐹𝑖𝑖𝑖𝑖,𝑡𝑡𝑡𝑡𝑗𝑗𝑗𝑗 and
𝑗𝑗𝑗𝑗
𝐹𝐹𝐹𝐹𝑖𝑖𝑖𝑖,𝑡𝑡𝑡𝑡𝑗𝑗𝑗𝑗 = max�
𝐼𝐼𝐼𝐼𝑖𝑖𝑖𝑖,𝑇𝑇𝑇𝑇𝑗𝑗𝑗𝑗 − 𝐼𝐼𝐼𝐼𝑖𝑖𝑖𝑖,𝑡𝑡𝑡𝑡
𝑗𝑗𝑗𝑗
𝑇𝑇𝑇𝑇 − 𝐴𝐴𝐴𝐴, 0� × 𝐼𝐼𝐼𝐼𝑖𝑖𝑖𝑖
𝑗𝑗𝑗𝑗 + 𝐼𝐼𝐼𝐼𝑖𝑖𝑖𝑖,𝑡𝑡𝑡𝑡𝑗𝑗𝑗𝑗 × 𝐼𝐼𝐼𝐼𝑖𝑖𝑖𝑖
𝑗𝑗𝑗𝑗 + max�𝑈𝑈𝑈𝑈𝑗𝑗𝑗𝑗 − 𝐼𝐼𝐼𝐼𝑖𝑖𝑖𝑖,𝑇𝑇𝑇𝑇
𝑗𝑗𝑗𝑗
𝑇𝑇𝑇𝑇 − 𝐴𝐴𝐴𝐴, 0� × 𝐼𝐼𝐼𝐼𝑖𝑖𝑖𝑖
𝑗𝑗𝑗𝑗
P 126
𝐼𝐼𝐼𝐼𝑖𝑖𝑖𝑖,𝑡𝑡𝑡𝑡𝑗𝑗𝑗𝑗 = 𝛼𝛼𝛼𝛼0
𝑗𝑗𝑗𝑗 + 𝛼𝛼𝛼𝛼1𝑗𝑗𝑗𝑗𝐼𝐼𝐼𝐼𝑖𝑖𝑖𝑖,𝑡𝑡𝑡𝑡−1𝑗𝑗𝑗𝑗 + 𝛼𝛼𝛼𝛼2
𝑗𝑗𝑗𝑗𝑦𝑦𝑦𝑦𝑖𝑖𝑖𝑖,𝑡𝑡𝑡𝑡 + 𝛼𝛼𝛼𝛼3𝑗𝑗𝑗𝑗𝐴𝐴𝐴𝐴𝑖𝑖𝑖𝑖,𝑡𝑡𝑡𝑡 + 𝛼𝛼𝛼𝛼4
𝑗𝑗𝑗𝑗𝑀𝑀𝑀𝑀𝑖𝑖𝑖𝑖,𝑡𝑡𝑡𝑡 + 𝛼𝛼𝛼𝛼5𝑗𝑗𝑗𝑗𝑈𝑈𝑈𝑈𝑖𝑖𝑖𝑖,𝑡𝑡𝑡𝑡 + 𝛼𝛼𝛼𝛼6
𝑗𝑗𝑗𝑗𝑃𝑃𝑃𝑃𝑖𝑖𝑖𝑖,𝑡𝑡𝑡𝑡 + 𝛼𝛼𝛼𝛼7𝑗𝑗𝑗𝑗𝐷𝐷𝐷𝐷𝑖𝑖𝑖𝑖
𝑗𝑗𝑗𝑗 + 𝛼𝛼𝛼𝛼8𝑗𝑗𝑗𝑗𝐴𝐴𝐴𝐴,
𝐼𝐼𝐼𝐼𝑖𝑖𝑖𝑖,𝑡𝑡𝑡𝑡𝑗𝑗𝑗𝑗 = 𝛼𝛼𝛼𝛼0
𝑗𝑗𝑗𝑗 + 𝛼𝛼𝛼𝛼1𝑗𝑗𝑗𝑗𝐼𝐼𝐼𝐼𝑖𝑖𝑖𝑖,𝑡𝑡𝑡𝑡−1𝑗𝑗𝑗𝑗 + 𝛼𝛼𝛼𝛼2
𝑗𝑗𝑗𝑗𝑦𝑦𝑦𝑦𝑖𝑖𝑖𝑖,𝑡𝑡𝑡𝑡 + 𝛼𝛼𝛼𝛼3𝑗𝑗𝑗𝑗𝐴𝐴𝐴𝐴𝑖𝑖𝑖𝑖,𝑡𝑡𝑡𝑡 + 𝛼𝛼𝛼𝛼4
𝑗𝑗𝑗𝑗𝑀𝑀𝑀𝑀𝑖𝑖𝑖𝑖,𝑡𝑡𝑡𝑡 + 𝛼𝛼𝛼𝛼5𝑗𝑗𝑗𝑗𝑈𝑈𝑈𝑈𝑖𝑖𝑖𝑖,𝑡𝑡𝑡𝑡 + 𝛼𝛼𝛼𝛼6
𝑗𝑗𝑗𝑗𝑃𝑃𝑃𝑃𝑖𝑖𝑖𝑖,𝑡𝑡𝑡𝑡 + 𝛼𝛼𝛼𝛼7𝑗𝑗𝑗𝑗𝐷𝐷𝐷𝐷𝑖𝑖𝑖𝑖
𝑗𝑗𝑗𝑗 + 𝛼𝛼𝛼𝛼8𝑗𝑗𝑗𝑗𝐴𝐴𝐴𝐴 + 𝛼𝛼𝛼𝛼9
𝑗𝑗𝑗𝑗𝐵𝐵𝐵𝐵𝑝𝑝𝑝𝑝𝑖𝑖𝑖𝑖,𝑡𝑡𝑡𝑡𝑗𝑗𝑗𝑗
+ 𝛼𝛼𝛼𝛼10𝑗𝑗𝑗𝑗 𝐵𝐵𝐵𝐵𝐸𝐸𝐸𝐸𝑖𝑖𝑖𝑖,𝑡𝑡𝑡𝑡
𝑗𝑗𝑗𝑗 + 𝛼𝛼𝛼𝛼11𝑗𝑗𝑗𝑗 𝑃𝑃𝑃𝑃𝐼𝐼𝐼𝐼𝑖𝑖𝑖𝑖,𝑡𝑡𝑡𝑡
𝑗𝑗𝑗𝑗
where Fi,t represents the total annual financing needs
13 Based on the ITU definition, which does not include operational expenditures associate with running networks: “investment during the financial year made by entities providing telecommunication networks and/or services (including fixed, mobile and Internet services, as well as the transmission of TV signals) for acquiring or upgrading fixed assets (usually referred to as capex), less disinvestment owing to disposals of fixed assets.”
for country i at time t; Fij,t indicates financing needs
for infrastructure type j; Iij,t is the infrastructure stock
of type j in country i at time t; U j denotes the infra-structure stock of type j required to provide universal access; ci
j and mij are the annual unit capital costs and
unit maintenance costs of infrastructure of type j in country i; and T is a targeted time period by which universal access should be provided.
The three terms of Fij,t represent the first three com-
ponents of annual financing needs, respectively: the first term indicates the costs induced by the construc-tion of infrastructure stock to meet the rising demand driven by demographic evolution, economic growth and urbanization by 2030; the second term represents the maintenance cost of the existing stock of infrastruc-ture; and the third term signifies the additional finan-cial cost required to palliate the existing infrastructure shortages by 2030. The fourth component of annual financing needs, which is associated with additional costs required for climate change mitigation and adap-tation, will be factored in into each of the three terms of Fi
j,t through the annual unit capital cost and unit
maintenance cost mij.
The indicators range from 1990 to 2017, except for that covering mobile phone and fixed broadband subscrip-tions which only starts in 2004 and 2000, respectively. Due to limited availability of data, three-year averages have been used instead of yearly data. This transfor-mation also captures the fact that infrastructure devel-opment is a slow process. Linear intra/extrapolations have been performed to fill in the missing values and thus obtained a balanced data panel.
Projection of infrastructure indicators by 2030
The methodology first estimates the component of financing needs that corresponds to the growing demand for new infrastructure based on the ‘top-down’ approach described above. This is done by project-ing the demand for infrastructure to 2030 under the

A GUIDEBOOK FOR ASSESSING SDG INVESTMENT NEEDS80
Figure 4. Explanatory scheme of the financing components estimated
Note: O&M represents operating and maintenance costs, and CC the climate change adaptation and mitigation related component.
assumption that infrastructure services are both demanded as consumption goods by individuals and as inputs into the production process by firms, in accordance with the work of Fay (2000), Fay and Yepes (2003), Bhattacharyay (2012), Ruiz-Nunez and Wei (2015) and ECLAC (2017). Once the new demand is projected to 2030, financing needs can be calculated by applying it to a set of unit cost estimates.
The projection of each indicator to 2030 is performed using an OLS13 regression with fixed effects on a sample of 108 economies14 of which 47 are Asia-Pacific countries. For the transport, energy, and water and sanitation sec-tors, as well as for the indicator accounting for broadband subscriptions of the ICT sector the future infrastructure demand is described by the following process:
FORMULAS
Section 2 P 22 & 23 EXAMPLE 1
𝐴𝐴𝐴𝐴𝐴𝐴𝐴𝐴𝐴𝐴𝐴𝐴𝐴𝐴𝐴𝐴𝐴𝐴𝐴𝐴𝐴𝐴𝐴𝐴𝐴𝐴𝐴𝐴𝐴𝐴𝐴𝐴𝐴𝐴𝐴𝐴𝐴𝐴𝐴𝐴𝑗𝑗𝑗𝑗,𝑡𝑡𝑡𝑡 = �𝐶𝐶𝐶𝐶𝐴𝐴𝐴𝐴𝐶𝐶𝐶𝐶𝐴𝐴𝐴𝐴𝑖𝑖𝑖𝑖,𝑗𝑗𝑗𝑗,𝑡𝑡𝑡𝑡𝑖𝑖𝑖𝑖
− 𝐵𝐵𝐵𝐵𝐵𝐵𝐵𝐵𝑗𝑗𝑗𝑗,𝑡𝑡𝑡𝑡
𝐵𝐵𝐵𝐵𝐵𝐵𝐵𝐵𝑗𝑗𝑗𝑗,𝑡𝑡𝑡𝑡 = 𝐵𝐵𝐵𝐵𝐵𝐵𝐵𝐵𝑗𝑗𝑗𝑗,𝑡𝑡𝑡𝑡0 ∗ (1 + 𝑝𝑝𝑝𝑝𝑝𝑝𝑝𝑝𝑝𝑝𝑝𝑝�����)𝑡𝑡𝑡𝑡−𝑡𝑡𝑡𝑡0
𝐼𝐼𝐼𝐼𝐴𝐴𝐴𝐴𝐼𝐼𝐼𝐼𝑝𝑝𝑝𝑝𝐼𝐼𝐼𝐼𝐼𝐼𝐼𝐼𝐼𝐼𝐼𝐼𝐴𝐴𝐴𝐴𝐴𝐴𝐴𝐴𝐴𝐴𝐴𝐴𝐴𝐴𝐴𝐴𝑗𝑗𝑗𝑗,𝑡𝑡𝑡𝑡 = �𝐼𝐼𝐼𝐼𝐵𝐵𝐵𝐵𝑖𝑖𝑖𝑖,𝑗𝑗𝑗𝑗,𝑡𝑡𝑡𝑡𝑖𝑖𝑖𝑖
− 𝐵𝐵𝐵𝐵𝐵𝐵𝐵𝐵𝑗𝑗𝑗𝑗,𝑡𝑡𝑡𝑡
𝜃𝜃𝜃𝜃𝑖𝑖𝑖𝑖,𝑗𝑗𝑗𝑗 =100% − 𝐼𝐼𝐼𝐼𝐴𝐴𝐴𝐴𝑐𝑐𝑐𝑐𝑖𝑖𝑖𝑖,𝑗𝑗𝑗𝑗,𝑡𝑡𝑡𝑡𝑎𝑎𝑎𝑎
(2030 − 𝐴𝐴𝐴𝐴𝑎𝑎𝑎𝑎)
P 25 EXAMPLE 2 Infrastructure
𝐹𝐹𝐹𝐹𝑖𝑖𝑖𝑖,𝑡𝑡𝑡𝑡 = �𝐹𝐹𝐹𝐹𝑖𝑖𝑖𝑖,𝑡𝑡𝑡𝑡𝑗𝑗𝑗𝑗 and
𝑗𝑗𝑗𝑗
𝐹𝐹𝐹𝐹𝑖𝑖𝑖𝑖,𝑡𝑡𝑡𝑡𝑗𝑗𝑗𝑗 = max�
𝐼𝐼𝐼𝐼𝑖𝑖𝑖𝑖,𝑇𝑇𝑇𝑇𝑗𝑗𝑗𝑗 − 𝐼𝐼𝐼𝐼𝑖𝑖𝑖𝑖,𝑡𝑡𝑡𝑡
𝑗𝑗𝑗𝑗
𝑇𝑇𝑇𝑇 − 𝐴𝐴𝐴𝐴, 0� × 𝐼𝐼𝐼𝐼𝑖𝑖𝑖𝑖
𝑗𝑗𝑗𝑗 + 𝐼𝐼𝐼𝐼𝑖𝑖𝑖𝑖,𝑡𝑡𝑡𝑡𝑗𝑗𝑗𝑗 × 𝐼𝐼𝐼𝐼𝑖𝑖𝑖𝑖
𝑗𝑗𝑗𝑗
𝐼𝐼𝐼𝐼𝑖𝑖𝑖𝑖,𝑡𝑡𝑡𝑡𝑗𝑗𝑗𝑗 = 𝛼𝛼𝛼𝛼0
𝑗𝑗𝑗𝑗 + 𝛼𝛼𝛼𝛼1𝑗𝑗𝑗𝑗𝐼𝐼𝐼𝐼𝑖𝑖𝑖𝑖,𝑡𝑡𝑡𝑡−1𝑗𝑗𝑗𝑗 + 𝛼𝛼𝛼𝛼2
𝑗𝑗𝑗𝑗𝑦𝑦𝑦𝑦𝑖𝑖𝑖𝑖,𝑡𝑡𝑡𝑡 + 𝛼𝛼𝛼𝛼3𝑗𝑗𝑗𝑗𝐴𝐴𝐴𝐴𝑖𝑖𝑖𝑖,𝑡𝑡𝑡𝑡 + 𝛼𝛼𝛼𝛼4
𝑗𝑗𝑗𝑗𝑀𝑀𝑀𝑀𝑖𝑖𝑖𝑖,𝑡𝑡𝑡𝑡 + 𝛼𝛼𝛼𝛼5𝑗𝑗𝑗𝑗𝑈𝑈𝑈𝑈𝑖𝑖𝑖𝑖,𝑡𝑡𝑡𝑡 + 𝛼𝛼𝛼𝛼6
𝑗𝑗𝑗𝑗𝑃𝑃𝑃𝑃𝑖𝑖𝑖𝑖,𝑡𝑡𝑡𝑡 + 𝛼𝛼𝛼𝛼7𝑗𝑗𝑗𝑗𝐷𝐷𝐷𝐷𝑖𝑖𝑖𝑖
𝑗𝑗𝑗𝑗 + 𝛼𝛼𝛼𝛼8𝑗𝑗𝑗𝑗𝐴𝐴𝐴𝐴,
Goal 5 P 92
𝐶𝐶𝐶𝐶𝐴𝐴𝐴𝐴𝐶𝐶𝐶𝐶𝐴𝐴𝐴𝐴𝐺𝐺𝐺𝐺𝐺𝐺𝐺𝐺 = � �� 𝐺𝐺𝐺𝐺𝐼𝐼𝐼𝐼𝐴𝐴𝐴𝐴𝐺𝐺𝐺𝐺𝑝𝑝𝑝𝑝𝐼𝐼𝐼𝐼𝐼𝐼𝐼𝐼𝑖𝑖𝑖𝑖,𝑡𝑡𝑡𝑡 + � 𝐺𝐺𝐺𝐺𝐼𝐼𝐼𝐼𝐴𝐴𝐴𝐴𝑀𝑀𝑀𝑀𝐴𝐴𝐴𝐴𝐴𝐴𝐴𝐴𝐴𝐴𝐴𝐴𝑗𝑗𝑗𝑗,𝑡𝑡𝑡𝑡 𝑞𝑞𝑞𝑞
𝑗𝑗𝑗𝑗=1
𝑝𝑝𝑝𝑝
𝑖𝑖𝑖𝑖=1�
2030
𝑡𝑡𝑡𝑡=2016
𝐶𝐶𝐶𝐶𝐴𝐴𝐴𝐴𝐶𝐶𝐶𝐶𝐴𝐴𝐴𝐴𝑁𝑁𝑁𝑁𝑇𝑇𝑇𝑇𝐺𝐺𝐺𝐺𝐺𝐺𝐺𝐺 = � � 𝛼𝛼𝛼𝛼𝑘𝑘𝑘𝑘,𝑡𝑡𝑡𝑡𝑁𝑁𝑁𝑁𝑇𝑇𝑇𝑇𝐺𝐺𝐺𝐺𝐵𝐵𝐵𝐵𝑘𝑘𝑘𝑘,𝑡𝑡𝑡𝑡
𝑠𝑠𝑠𝑠
𝑘𝑘𝑘𝑘=1
2030
𝑡𝑡𝑡𝑡=2016
Goal 9 P 125
𝐹𝐹𝐹𝐹𝑖𝑖𝑖𝑖,𝑡𝑡𝑡𝑡 = �𝐹𝐹𝐹𝐹𝑖𝑖𝑖𝑖,𝑡𝑡𝑡𝑡𝑗𝑗𝑗𝑗 and
𝑗𝑗𝑗𝑗
𝐹𝐹𝐹𝐹𝑖𝑖𝑖𝑖,𝑡𝑡𝑡𝑡𝑗𝑗𝑗𝑗 = max�
𝐼𝐼𝐼𝐼𝑖𝑖𝑖𝑖,𝑇𝑇𝑇𝑇𝑗𝑗𝑗𝑗 − 𝐼𝐼𝐼𝐼𝑖𝑖𝑖𝑖,𝑡𝑡𝑡𝑡
𝑗𝑗𝑗𝑗
𝑇𝑇𝑇𝑇 − 𝐴𝐴𝐴𝐴, 0� × 𝐼𝐼𝐼𝐼𝑖𝑖𝑖𝑖
𝑗𝑗𝑗𝑗 + 𝐼𝐼𝐼𝐼𝑖𝑖𝑖𝑖,𝑡𝑡𝑡𝑡𝑗𝑗𝑗𝑗 × 𝐼𝐼𝐼𝐼𝑖𝑖𝑖𝑖
𝑗𝑗𝑗𝑗 + max�𝑈𝑈𝑈𝑈𝑗𝑗𝑗𝑗 − 𝐼𝐼𝐼𝐼𝑖𝑖𝑖𝑖,𝑇𝑇𝑇𝑇
𝑗𝑗𝑗𝑗
𝑇𝑇𝑇𝑇 − 𝐴𝐴𝐴𝐴, 0� × 𝐼𝐼𝐼𝐼𝑖𝑖𝑖𝑖
𝑗𝑗𝑗𝑗
P 126
𝐼𝐼𝐼𝐼𝑖𝑖𝑖𝑖,𝑡𝑡𝑡𝑡𝑗𝑗𝑗𝑗 = 𝛼𝛼𝛼𝛼0
𝑗𝑗𝑗𝑗 + 𝛼𝛼𝛼𝛼1𝑗𝑗𝑗𝑗𝐼𝐼𝐼𝐼𝑖𝑖𝑖𝑖,𝑡𝑡𝑡𝑡−1𝑗𝑗𝑗𝑗 + 𝛼𝛼𝛼𝛼2
𝑗𝑗𝑗𝑗𝑦𝑦𝑦𝑦𝑖𝑖𝑖𝑖,𝑡𝑡𝑡𝑡 + 𝛼𝛼𝛼𝛼3𝑗𝑗𝑗𝑗𝐴𝐴𝐴𝐴𝑖𝑖𝑖𝑖,𝑡𝑡𝑡𝑡 + 𝛼𝛼𝛼𝛼4
𝑗𝑗𝑗𝑗𝑀𝑀𝑀𝑀𝑖𝑖𝑖𝑖,𝑡𝑡𝑡𝑡 + 𝛼𝛼𝛼𝛼5𝑗𝑗𝑗𝑗𝑈𝑈𝑈𝑈𝑖𝑖𝑖𝑖,𝑡𝑡𝑡𝑡 + 𝛼𝛼𝛼𝛼6
𝑗𝑗𝑗𝑗𝑃𝑃𝑃𝑃𝑖𝑖𝑖𝑖,𝑡𝑡𝑡𝑡 + 𝛼𝛼𝛼𝛼7𝑗𝑗𝑗𝑗𝐷𝐷𝐷𝐷𝑖𝑖𝑖𝑖
𝑗𝑗𝑗𝑗 + 𝛼𝛼𝛼𝛼8𝑗𝑗𝑗𝑗𝐴𝐴𝐴𝐴,
𝐼𝐼𝐼𝐼𝑖𝑖𝑖𝑖,𝑡𝑡𝑡𝑡𝑗𝑗𝑗𝑗 = 𝛼𝛼𝛼𝛼0
𝑗𝑗𝑗𝑗 + 𝛼𝛼𝛼𝛼1𝑗𝑗𝑗𝑗𝐼𝐼𝐼𝐼𝑖𝑖𝑖𝑖,𝑡𝑡𝑡𝑡−1𝑗𝑗𝑗𝑗 + 𝛼𝛼𝛼𝛼2
𝑗𝑗𝑗𝑗𝑦𝑦𝑦𝑦𝑖𝑖𝑖𝑖,𝑡𝑡𝑡𝑡 + 𝛼𝛼𝛼𝛼3𝑗𝑗𝑗𝑗𝐴𝐴𝐴𝐴𝑖𝑖𝑖𝑖,𝑡𝑡𝑡𝑡 + 𝛼𝛼𝛼𝛼4
𝑗𝑗𝑗𝑗𝑀𝑀𝑀𝑀𝑖𝑖𝑖𝑖,𝑡𝑡𝑡𝑡 + 𝛼𝛼𝛼𝛼5𝑗𝑗𝑗𝑗𝑈𝑈𝑈𝑈𝑖𝑖𝑖𝑖,𝑡𝑡𝑡𝑡 + 𝛼𝛼𝛼𝛼6
𝑗𝑗𝑗𝑗𝑃𝑃𝑃𝑃𝑖𝑖𝑖𝑖,𝑡𝑡𝑡𝑡 + 𝛼𝛼𝛼𝛼7𝑗𝑗𝑗𝑗𝐷𝐷𝐷𝐷𝑖𝑖𝑖𝑖
𝑗𝑗𝑗𝑗 + 𝛼𝛼𝛼𝛼8𝑗𝑗𝑗𝑗𝐴𝐴𝐴𝐴 + 𝛼𝛼𝛼𝛼9
𝑗𝑗𝑗𝑗𝐵𝐵𝐵𝐵𝑝𝑝𝑝𝑝𝑖𝑖𝑖𝑖,𝑡𝑡𝑡𝑡𝑗𝑗𝑗𝑗
+ 𝛼𝛼𝛼𝛼10𝑗𝑗𝑗𝑗 𝐵𝐵𝐵𝐵𝐸𝐸𝐸𝐸𝑖𝑖𝑖𝑖,𝑡𝑡𝑡𝑡
𝑗𝑗𝑗𝑗 + 𝛼𝛼𝛼𝛼11𝑗𝑗𝑗𝑗 𝑃𝑃𝑃𝑃𝐼𝐼𝐼𝐼𝑖𝑖𝑖𝑖,𝑡𝑡𝑡𝑡
𝑗𝑗𝑗𝑗 where Ii
j,t is the infrastructure stock of type j needed in country i at time t; yi,t , Ai,t and Mi,t represent, respectively,
the GDP per capita and shares of agriculture and manufacture value added in GDP15; Ui,t and Pi,t stand for the urbanization rate and the population density; Di
j is the country fixed effect; and t a time trend, used to capture time effect. All the variables in the equation are expressed in natural logarithm to linearize the model.
For the “mobile phone subscription per 100 people” indicator, access to electricity for rural and urban population as well as power consumption per capita were included in the model as independent variables based on the methodology developed by Ofa (2018). For this indicator the model therefore becomes:
FORMULAS
Section 2 P 22 & 23 EXAMPLE 1
𝐴𝐴𝐴𝐴𝐴𝐴𝐴𝐴𝐴𝐴𝐴𝐴𝐴𝐴𝐴𝐴𝐴𝐴𝐴𝐴𝐴𝐴𝐴𝐴𝐴𝐴𝐴𝐴𝐴𝐴𝐴𝐴𝐴𝐴𝐴𝐴𝐴𝐴𝐴𝐴𝑗𝑗𝑗𝑗,𝑡𝑡𝑡𝑡 = �𝐶𝐶𝐶𝐶𝐴𝐴𝐴𝐴𝐶𝐶𝐶𝐶𝐴𝐴𝐴𝐴𝑖𝑖𝑖𝑖,𝑗𝑗𝑗𝑗,𝑡𝑡𝑡𝑡𝑖𝑖𝑖𝑖
− 𝐵𝐵𝐵𝐵𝐵𝐵𝐵𝐵𝑗𝑗𝑗𝑗,𝑡𝑡𝑡𝑡
𝐵𝐵𝐵𝐵𝐵𝐵𝐵𝐵𝑗𝑗𝑗𝑗,𝑡𝑡𝑡𝑡 = 𝐵𝐵𝐵𝐵𝐵𝐵𝐵𝐵𝑗𝑗𝑗𝑗,𝑡𝑡𝑡𝑡0 ∗ (1 + 𝑝𝑝𝑝𝑝𝑝𝑝𝑝𝑝𝑝𝑝𝑝𝑝�����)𝑡𝑡𝑡𝑡−𝑡𝑡𝑡𝑡0
𝐼𝐼𝐼𝐼𝐴𝐴𝐴𝐴𝐼𝐼𝐼𝐼𝑝𝑝𝑝𝑝𝐼𝐼𝐼𝐼𝐼𝐼𝐼𝐼𝐼𝐼𝐼𝐼𝐴𝐴𝐴𝐴𝐴𝐴𝐴𝐴𝐴𝐴𝐴𝐴𝐴𝐴𝐴𝐴𝑗𝑗𝑗𝑗,𝑡𝑡𝑡𝑡 = �𝐼𝐼𝐼𝐼𝐵𝐵𝐵𝐵𝑖𝑖𝑖𝑖,𝑗𝑗𝑗𝑗,𝑡𝑡𝑡𝑡𝑖𝑖𝑖𝑖
− 𝐵𝐵𝐵𝐵𝐵𝐵𝐵𝐵𝑗𝑗𝑗𝑗,𝑡𝑡𝑡𝑡
𝜃𝜃𝜃𝜃𝑖𝑖𝑖𝑖,𝑗𝑗𝑗𝑗 =100% − 𝐼𝐼𝐼𝐼𝐴𝐴𝐴𝐴𝑐𝑐𝑐𝑐𝑖𝑖𝑖𝑖,𝑗𝑗𝑗𝑗,𝑡𝑡𝑡𝑡𝑎𝑎𝑎𝑎
(2030 − 𝐴𝐴𝐴𝐴𝑎𝑎𝑎𝑎)
P 25 EXAMPLE 2 Infrastructure
𝐹𝐹𝐹𝐹𝑖𝑖𝑖𝑖,𝑡𝑡𝑡𝑡 = �𝐹𝐹𝐹𝐹𝑖𝑖𝑖𝑖,𝑡𝑡𝑡𝑡𝑗𝑗𝑗𝑗 and
𝑗𝑗𝑗𝑗
𝐹𝐹𝐹𝐹𝑖𝑖𝑖𝑖,𝑡𝑡𝑡𝑡𝑗𝑗𝑗𝑗 = max�
𝐼𝐼𝐼𝐼𝑖𝑖𝑖𝑖,𝑇𝑇𝑇𝑇𝑗𝑗𝑗𝑗 − 𝐼𝐼𝐼𝐼𝑖𝑖𝑖𝑖,𝑡𝑡𝑡𝑡
𝑗𝑗𝑗𝑗
𝑇𝑇𝑇𝑇 − 𝐴𝐴𝐴𝐴, 0� × 𝐼𝐼𝐼𝐼𝑖𝑖𝑖𝑖
𝑗𝑗𝑗𝑗 + 𝐼𝐼𝐼𝐼𝑖𝑖𝑖𝑖,𝑡𝑡𝑡𝑡𝑗𝑗𝑗𝑗 × 𝐼𝐼𝐼𝐼𝑖𝑖𝑖𝑖
𝑗𝑗𝑗𝑗
𝐼𝐼𝐼𝐼𝑖𝑖𝑖𝑖,𝑡𝑡𝑡𝑡𝑗𝑗𝑗𝑗 = 𝛼𝛼𝛼𝛼0
𝑗𝑗𝑗𝑗 + 𝛼𝛼𝛼𝛼1𝑗𝑗𝑗𝑗𝐼𝐼𝐼𝐼𝑖𝑖𝑖𝑖,𝑡𝑡𝑡𝑡−1𝑗𝑗𝑗𝑗 + 𝛼𝛼𝛼𝛼2
𝑗𝑗𝑗𝑗𝑦𝑦𝑦𝑦𝑖𝑖𝑖𝑖,𝑡𝑡𝑡𝑡 + 𝛼𝛼𝛼𝛼3𝑗𝑗𝑗𝑗𝐴𝐴𝐴𝐴𝑖𝑖𝑖𝑖,𝑡𝑡𝑡𝑡 + 𝛼𝛼𝛼𝛼4
𝑗𝑗𝑗𝑗𝑀𝑀𝑀𝑀𝑖𝑖𝑖𝑖,𝑡𝑡𝑡𝑡 + 𝛼𝛼𝛼𝛼5𝑗𝑗𝑗𝑗𝑈𝑈𝑈𝑈𝑖𝑖𝑖𝑖,𝑡𝑡𝑡𝑡 + 𝛼𝛼𝛼𝛼6
𝑗𝑗𝑗𝑗𝑃𝑃𝑃𝑃𝑖𝑖𝑖𝑖,𝑡𝑡𝑡𝑡 + 𝛼𝛼𝛼𝛼7𝑗𝑗𝑗𝑗𝐷𝐷𝐷𝐷𝑖𝑖𝑖𝑖
𝑗𝑗𝑗𝑗 + 𝛼𝛼𝛼𝛼8𝑗𝑗𝑗𝑗𝐴𝐴𝐴𝐴,
Goal 5 P 92
𝐶𝐶𝐶𝐶𝐴𝐴𝐴𝐴𝐶𝐶𝐶𝐶𝐴𝐴𝐴𝐴𝐺𝐺𝐺𝐺𝐺𝐺𝐺𝐺 = � �� 𝐺𝐺𝐺𝐺𝐼𝐼𝐼𝐼𝐴𝐴𝐴𝐴𝐺𝐺𝐺𝐺𝑝𝑝𝑝𝑝𝐼𝐼𝐼𝐼𝐼𝐼𝐼𝐼𝑖𝑖𝑖𝑖,𝑡𝑡𝑡𝑡 + � 𝐺𝐺𝐺𝐺𝐼𝐼𝐼𝐼𝐴𝐴𝐴𝐴𝑀𝑀𝑀𝑀𝐴𝐴𝐴𝐴𝐴𝐴𝐴𝐴𝐴𝐴𝐴𝐴𝑗𝑗𝑗𝑗,𝑡𝑡𝑡𝑡 𝑞𝑞𝑞𝑞
𝑗𝑗𝑗𝑗=1
𝑝𝑝𝑝𝑝
𝑖𝑖𝑖𝑖=1�
2030
𝑡𝑡𝑡𝑡=2016
𝐶𝐶𝐶𝐶𝐴𝐴𝐴𝐴𝐶𝐶𝐶𝐶𝐴𝐴𝐴𝐴𝑁𝑁𝑁𝑁𝑇𝑇𝑇𝑇𝐺𝐺𝐺𝐺𝐺𝐺𝐺𝐺 = � � 𝛼𝛼𝛼𝛼𝑘𝑘𝑘𝑘,𝑡𝑡𝑡𝑡𝑁𝑁𝑁𝑁𝑇𝑇𝑇𝑇𝐺𝐺𝐺𝐺𝐵𝐵𝐵𝐵𝑘𝑘𝑘𝑘,𝑡𝑡𝑡𝑡
𝑠𝑠𝑠𝑠
𝑘𝑘𝑘𝑘=1
2030
𝑡𝑡𝑡𝑡=2016
Goal 9 P 125
𝐹𝐹𝐹𝐹𝑖𝑖𝑖𝑖,𝑡𝑡𝑡𝑡 = �𝐹𝐹𝐹𝐹𝑖𝑖𝑖𝑖,𝑡𝑡𝑡𝑡𝑗𝑗𝑗𝑗 and
𝑗𝑗𝑗𝑗
𝐹𝐹𝐹𝐹𝑖𝑖𝑖𝑖,𝑡𝑡𝑡𝑡𝑗𝑗𝑗𝑗 = max�
𝐼𝐼𝐼𝐼𝑖𝑖𝑖𝑖,𝑇𝑇𝑇𝑇𝑗𝑗𝑗𝑗 − 𝐼𝐼𝐼𝐼𝑖𝑖𝑖𝑖,𝑡𝑡𝑡𝑡
𝑗𝑗𝑗𝑗
𝑇𝑇𝑇𝑇 − 𝐴𝐴𝐴𝐴, 0� × 𝐼𝐼𝐼𝐼𝑖𝑖𝑖𝑖
𝑗𝑗𝑗𝑗 + 𝐼𝐼𝐼𝐼𝑖𝑖𝑖𝑖,𝑡𝑡𝑡𝑡𝑗𝑗𝑗𝑗 × 𝐼𝐼𝐼𝐼𝑖𝑖𝑖𝑖
𝑗𝑗𝑗𝑗 + max�𝑈𝑈𝑈𝑈𝑗𝑗𝑗𝑗 − 𝐼𝐼𝐼𝐼𝑖𝑖𝑖𝑖,𝑇𝑇𝑇𝑇
𝑗𝑗𝑗𝑗
𝑇𝑇𝑇𝑇 − 𝐴𝐴𝐴𝐴, 0� × 𝐼𝐼𝐼𝐼𝑖𝑖𝑖𝑖
𝑗𝑗𝑗𝑗
P 126
𝐼𝐼𝐼𝐼𝑖𝑖𝑖𝑖,𝑡𝑡𝑡𝑡𝑗𝑗𝑗𝑗 = 𝛼𝛼𝛼𝛼0
𝑗𝑗𝑗𝑗 + 𝛼𝛼𝛼𝛼1𝑗𝑗𝑗𝑗𝐼𝐼𝐼𝐼𝑖𝑖𝑖𝑖,𝑡𝑡𝑡𝑡−1𝑗𝑗𝑗𝑗 + 𝛼𝛼𝛼𝛼2
𝑗𝑗𝑗𝑗𝑦𝑦𝑦𝑦𝑖𝑖𝑖𝑖,𝑡𝑡𝑡𝑡 + 𝛼𝛼𝛼𝛼3𝑗𝑗𝑗𝑗𝐴𝐴𝐴𝐴𝑖𝑖𝑖𝑖,𝑡𝑡𝑡𝑡 + 𝛼𝛼𝛼𝛼4
𝑗𝑗𝑗𝑗𝑀𝑀𝑀𝑀𝑖𝑖𝑖𝑖,𝑡𝑡𝑡𝑡 + 𝛼𝛼𝛼𝛼5𝑗𝑗𝑗𝑗𝑈𝑈𝑈𝑈𝑖𝑖𝑖𝑖,𝑡𝑡𝑡𝑡 + 𝛼𝛼𝛼𝛼6
𝑗𝑗𝑗𝑗𝑃𝑃𝑃𝑃𝑖𝑖𝑖𝑖,𝑡𝑡𝑡𝑡 + 𝛼𝛼𝛼𝛼7𝑗𝑗𝑗𝑗𝐷𝐷𝐷𝐷𝑖𝑖𝑖𝑖
𝑗𝑗𝑗𝑗 + 𝛼𝛼𝛼𝛼8𝑗𝑗𝑗𝑗𝐴𝐴𝐴𝐴,
𝐼𝐼𝐼𝐼𝑖𝑖𝑖𝑖,𝑡𝑡𝑡𝑡𝑗𝑗𝑗𝑗 = 𝛼𝛼𝛼𝛼0
𝑗𝑗𝑗𝑗 + 𝛼𝛼𝛼𝛼1𝑗𝑗𝑗𝑗𝐼𝐼𝐼𝐼𝑖𝑖𝑖𝑖,𝑡𝑡𝑡𝑡−1𝑗𝑗𝑗𝑗 + 𝛼𝛼𝛼𝛼2
𝑗𝑗𝑗𝑗𝑦𝑦𝑦𝑦𝑖𝑖𝑖𝑖,𝑡𝑡𝑡𝑡 + 𝛼𝛼𝛼𝛼3𝑗𝑗𝑗𝑗𝐴𝐴𝐴𝐴𝑖𝑖𝑖𝑖,𝑡𝑡𝑡𝑡 + 𝛼𝛼𝛼𝛼4
𝑗𝑗𝑗𝑗𝑀𝑀𝑀𝑀𝑖𝑖𝑖𝑖,𝑡𝑡𝑡𝑡 + 𝛼𝛼𝛼𝛼5𝑗𝑗𝑗𝑗𝑈𝑈𝑈𝑈𝑖𝑖𝑖𝑖,𝑡𝑡𝑡𝑡 + 𝛼𝛼𝛼𝛼6
𝑗𝑗𝑗𝑗𝑃𝑃𝑃𝑃𝑖𝑖𝑖𝑖,𝑡𝑡𝑡𝑡 + 𝛼𝛼𝛼𝛼7𝑗𝑗𝑗𝑗𝐷𝐷𝐷𝐷𝑖𝑖𝑖𝑖
𝑗𝑗𝑗𝑗 + 𝛼𝛼𝛼𝛼8𝑗𝑗𝑗𝑗𝐴𝐴𝐴𝐴 + 𝛼𝛼𝛼𝛼9
𝑗𝑗𝑗𝑗𝐵𝐵𝐵𝐵𝑝𝑝𝑝𝑝𝑖𝑖𝑖𝑖,𝑡𝑡𝑡𝑡𝑗𝑗𝑗𝑗
+ 𝛼𝛼𝛼𝛼10𝑗𝑗𝑗𝑗 𝐵𝐵𝐵𝐵𝐸𝐸𝐸𝐸𝑖𝑖𝑖𝑖,𝑡𝑡𝑡𝑡
𝑗𝑗𝑗𝑗 + 𝛼𝛼𝛼𝛼11𝑗𝑗𝑗𝑗 𝑃𝑃𝑃𝑃𝐼𝐼𝐼𝐼𝑖𝑖𝑖𝑖,𝑡𝑡𝑡𝑡
𝑗𝑗𝑗𝑗
where Erij,t and Eui
j,t represent access to electricity for rural and urban population, respectively, and Pci
j,t
accounts for the power consumption per capita.
13 In theory, the use of GMM-IV estimator would be more applicable than OLS given the presence of the lagged variable in the model. However, ADB (2017) found that its explanatory power was actually lower than OLS and that the performance in out-of-sample forecasting was uneven and unsatisfactory.
14 For the “Broadband per 100 people” indicator of the ICT sector, developed countries were taken out of the panel data due to inconsistencies found in the projected indicator.
15 Due to the absence of future estimations for GDP composition, the shares of agriculture and manufacture value added in GDP have been projected using basic linear extrapolations.

A GUIDEBOOK FOR ASSESSING SDG INVESTMENT NEEDS 81
The definitions and data sources of the independent variables and their projections, unit costs for physical infrastructure, and the regression results can be found in the Annex.
Income level benchmarking
While the literature on projecting and estimating the financing needs required to meet the infrastructure stock needs induced by the new demand driven by eco-nomic and demographic evolutions is widely available, most of the studies do not account for the financing needs required to fill the current gap of infrastructure occurring across most of the developing economies.
If estimating the additional financing requirements to meet universal access to water and sanitation and elec-tricity has already started to be mainstreamed, for the ICT and transport sectors, the ESCAP (2017) report is the only one that fully integrates the financing needs to fill current infrastructure shortages in its estimates. This could be explained by the fact that indicators used to represent the level of access to infrastructure across countries is expressed in terms of percentage of pop-ulation for the WSS and electricity sectors while it is expressed in terms of number of infrastructure stock units per capita for the ICT and transport sectors. This differentiation results from a lack of available compa-rable indicators expressed in percentage of population for these two sectors. Indeed, the methodology used to project future demand in infrastructure requires a balance panel data across several years (and even decades) which imposes heavy limitations on the choice of indicators to represent the level of access to infrastructure in these two sectors.
To overcome these limitations, the number of infra-structure stock unit per capita is used as a proxy to represent access of the population to the said infra-structure. This restriction presents two major limita-tions for the exercise of estimating financing needs required to meet the targets of the 2030 Agenda:
(i.) These indicators, while being widely used as a proxy for level of access to infrastructure across countries in the literature, do not capture the actual distribution of access to infrastructure across all population clusters. This is especially true in regards of the rural/urban divide. Rural populations face greater challenges in accessing infrastructure as the financial and economic rates of returns of cost-benefit analyses to undertake such construction works are much lower than
in urban areas. This is particularly critical for the ICT sector where the private sector is tradition-ally expected to play a major role in infrastructure development.
(ii.) As opposed to indicators expressed directly in terms of percentage of population, these indica-tors do not allow to set up straightforward and accurate universal access targets. Indeed, there is no definition of an optimal level of infrastruc-ture stock per capita that can be used across countries as some face extremely different geo-graphical features (Bhutan and SIDS for instance) and demographic feature (Mongolia and India or Indonesia for instance), among other factors, that will directly impact the number of infrastructure units and the density of the infrastructure network in the country.
While the first limitation is not addressed in this report, an additional income level-based benchmarking com-ponent has been established in this methodology for which income level-based targets of infrastructure stock per capita have been defined in an attempt to capture, at least partially, the needs associated to fill current infrastructure shortages in the ICT and trans-port sectors in developing economies.
Targets for the ICT and infrastructure sectors have been established based on the World Bank income country classification. Average number of infrastructure units per capita has been calculated for each indicator and country group. Each country is then expected to meet by 2030 the current level of infrastructure stock per capita of the next income group. Detailed steps for the case of mobile phones subscriptions in Afghanistan is detailed below:
In Afghanistan, classified as a low-income economy, the current number of mobile phone subscriptions is of 65 per 100 people.
1. In a first step, the number of additional subscrip-tions to be established to meet new demand will be calculated by projecting the current number of mobile phone subscriptions per 100 people to 2030 using the OLS regression detailed in the first sec-tion of this appendix. The number of additional sub-scriptions that will need to be established to meet new demand can then be obtained by multiplying this projected number of mobile phone subscrip-tions per 100 people by the projected population in 2030 and by withdrawing the number of people

A GUIDEBOOK FOR ASSESSING SDG INVESTMENT NEEDS82
currently having access to mobile phones.
2. The additional number of subscriptions required to fill current infrastructure shortages will then be calculated as follows:
a. The projected number of mobile phone sub-scriptions per 100 people in 2030 is compared to the current average number of mobile phone subscriptions in lower-middle income countries of the region (next income country group).
b. The difference will then be multiplied by the projected population in 2030 thus giving the
number of additional subscriptions that need to be provided to meet the income level-based target.
c. The financing needs associated to the income level-based benchmarking component can then be obtained by multiplying this additional number of subscriptions by the unit cost to pro-vide one mobile phone subscription.
The choice of income level groups to set up targets to fill current shortages is based on the strong positive correlation between the level of economic development and the level of infrastructure development (figure 5).
Figure 5: Relationship between GDP per capita and ICT infrastructure development
Note: The index scores have been calculated by normalizing and adding the five indicators used in this report to capture transport and ICT infrastructure: number of paved and unpaved roads per 1,000 people, number of km of rail lines per 1,000,000 people, number of mobile and broadband subscriptions per 100 people. Panel data includes 102 developed and developing economies.
Note: Figures 1 and 5 are ESCAP Survey 2019 estimates based on public and private investments and development assistance. While country-level estimates are shown to illustrate the wide range, country names are not shown given uncertainty with existing available data.

A GUIDEBOOK FOR ASSESSING SDG INVESTMENT NEEDS 83
Integration of climate change in the financing needs
The first element is associated with the needs to inte-grate climate resilience into infrastructure. It is assumed that climate proofing will increase capital and mainte-nance costs of providing infrastructure. Following ADB (2014), ESCAP Survey assumes that at least 5% of total capital investment is required as cost of protecting infrastructure against changes in rainfall and tempera-ture. ESCAP estimates that Small Island Developing States and Pacific islands would face higher costs climbing up to 20% of total expenditures. Besides, additional 0.5 percentage points of maintenance cost for new and existing infrastructure is also employed
for all countries. Finally, the third element is to incor-porate costs of protecting infrastructure in SIDS from increased tropical cyclone wind intensity. Following the World Bank (2016), an additional 5% replacement cost is assumed. While sea level rise, coastal erosion, sea and river flooding induced by climate change do require huge amount of investment to mitigate losses, the estimation of related costs would be beyond the scope of this study, since the various engineering solu-tions such as sea walls building and beach nourish-ment cannot be incorporated into the discussion of four infrastructure sectors. Thus, the actual financing requirements in SIDS concerning climate resilience would be much higher.
Unit costs for of physical infrastructure
For paved roads, country level unit costs were retrieved from procurement plans and project documents of development projects funded by ADB, the World Bank and the ERDB in the region (figure 6). For countries for which data were not available, the average unit costs of the countries with available data could be applied
($915,350 per km). Similar approach was taken for rail-ways (average unit costs of countries with available data was $ 2,792,308 per km of rail line).
For fixed broadband per subscription, country level unit costs were drawn from the ITU database. For mobile telephone per subscription, $100 in urban area and $160 in rural area was applied across the board.
Figure 6. Unit cost for paved roads, per km for a 6-7 meters wide road (two lanes)

A GUIDEBOOK FOR ASSESSING SDG INVESTMENT NEEDS84
Table 1. Infrastructure indicators sources and definitions
Type of physical infrastructure
Name of indicator Definition Sources
Transport
Paved roads (total route km per 1000 people)
Paved roads are those surfaced with crushed stone (macadam) and hydrocarbon binder or bituminized agents with concrete or with cobblestones.
World Bank Development Indicators, ADB, CIA FactbookUnpaved roads (total
route km per 1000 people)
Total road network excluding the paved road network. Total road network includes motorways highways and main or national roads secondary or regional roads and all other roads in a country.
Rail lines (total route km per 1 000 000 people)
Rail line is the length of railway route available for train service, irrespective of the number of parallel tracks.
World Bank, Transportation, Water, and Information and Communications Technologies Department, Transport Division.
ICT
Fixed broadband subscriptions per 100 people
Fixed broadband subscriptions refers to fixed subscriptions to high-speed access to the public Internet (a TCP/IP connection), at downstream speeds equal to, or greater than, 256 kbit/s. This includes cable modem, DSL, fiber-to-the-home/building, other fixed (wired)-broadband subscriptions, satellite broadband and terrestrial fixed wireless broadband.
International Telecommunication Union, World Telecommunication/ICT Development Report and database.
Mobile telephone subscriptions per 100 people
Refers to the subscriptions to a public mobile telephone service and provides access to Public Switched Telephone Network (PSTN) using cellular technology, including number of pre-paid SIM cards active during the past three months. This includes both analogue and digital cellular systems (IMT-2000 (Third Generation, 3G) and 4G subscriptions, but excludes mobile broadband subscriptions via data cards or USB modems. Subscriptions to public mobile data services, private trunked mobile radio, telepoint or radio paging, and telemetry services should also be excluded. This should include all mobile cellular subscriptions that offer voice communications.

A GUIDEBOOK FOR ASSESSING SDG INVESTMENT NEEDS 85
Table 2. Definitions and sources of the independent variables
Name of indicator Definition Sources
GDP per capita (constant 2010 US$)
GDP per capita is gross domestic product divided by midyear population. GDP is the sum of gross value added by all resident producers in the economy plus any product taxes and minus any subsidies not included in the value of the products. It is calculated without making deductions for depreciation of fabricated assets or for depletion and degradation of natural resources. Data are in constant 2010 U.S. dollars.
United Nations Department of Economic and Social Affairs
Agriculture, value added (% of GDP)
Agriculture corresponds to ISIC divisions 1-5 and includes forestry, hunting, and fishing, as well as cultivation of crops and livestock production. Value added is the net output of a sector after adding up all outputs and subtracting intermediate inputs. It is calculated without making deductions for depreciation of fabricated assets or depletion and degradation of natural resources. The origin of value added is determined by the International Standard Industrial Classification (ISIC), revision 3. Note: For VAB countries, gross value added at factor cost is used as the denominator.
World Bank Development Indicators
Manufacturing, value added (% of GDP)
Manufacturing refers to industries belonging to ISIC divisions 15-37. Value added is the net output of a sector after adding up all outputs and subtracting intermediate inputs. It is calculated without making deductions for depreciation of fabricated assets or depletion and degradation of natural resources. The origin of value added is determined by the International Standard Industrial Classification (ISIC), revision 3. Note: For VAB countries, gross value added at factor cost is used as the denominator.
Urban population (% of total)
Urban population refers to people living in urban areas as defined by national statistical offices. It is calculated using World Bank population estimates and urban ratios from the United Nations World Urbanization Prospects.
Population density (people per sq. km of land area)
Population density is midyear population divided by land area in square kilometers. Population is based on the de facto definition of population, which counts all residents regardless of legal status or citizenship--except for refugees not permanently settled in the country of asylum, who are generally considered part of the population of their country of origin. Land area is a country’s total area, excluding area under inland water bodies, national claims to continental shelf, and exclusive economic zones. In most cases the definition of inland water bodies includes major rivers and lakes.

A GUIDEBOOK FOR ASSESSING SDG INVESTMENT NEEDS86
Table 3. Definitions and sources of the projected independent variables
Name of indicator Sources
Urban population (% total population) United Nations, World Urbanization Prospects
Population density
Population United Nations, Department of Economic and Social Affairs
GDP per capita (2010 USD)
Table 4. Sources for investment flows in infrastructure
Type of investment
Methodology Sources
Public investment
Public investments were calculated the following way:First, total public investment data at country level were primarily taken from the World Bank (2019) study. When data for a country was missing, the IMF Expenditures by functions of governments database and the ADB (2017) report were used in lieu. However, as outlaid in World Bank (2019) the IMF database captures public investments that might be broader than investments in infrastructure only. To overcome this issue, IMF estimates were adjusted based on the average ratio of World Bank estimates/IMF estimates for countries where both data were available. In a second step, total public investments were broken down by infrastructure sector using the following method: the IMF database was used as the primary source of data for public investments broken down by sectors (ICT, energy and transport). Public investment in WSS data were taken from the GLAAS 2017 report from WHO. As those two sources capture public investments that may go beyond infrastructure only, the share for each sector was calculated and then applied to the World Bank (2019) estimates.
World Bank (2019), International Monetary Fund (2018), ADB (2017), WHO (2017)
Private investmentGreenfield FDIs from the FDI market website and the private participation in PPPs in infrastructure made available for the World Bank were added to for this component.
FDI Markets (2019), World Bank PPI database (2019)
Development Assistance
The QWIDS database of OECD was used to retrieve ODA by sector in the different countries. The following sectors could be differentiated: “energy”, “water and sanitation” and “transport & ICT”. Since the breakdown at the country level wasn’t available for the transport and ICT sector, the average repartition of ODA in these two sub-sectors, available for the total in all developing countries, was used to break down these two sub-sectors at the country level.
OECD (2018)

A GUIDEBOOK FOR ASSESSING SDG INVESTMENT NEEDS 87
Where we stand
Clearly not on track at the Asia-Pacific regional level. None of the indicators are on track. Indicator on phasing out of fossil fuel subsidies have made negligible progress, while indicators related to use of natural resources and waste generation have actually regressed (Goal 6, figure 4).
Overview
A significant part of the investment for Goal 12 is embodied in other areas of the SDGs such as climate, clean energy, and infrastructure in general. For instance, investments to address food loss and waste are usually targeted towards the components of the food supply chain such as infra-structure, transportation, storage, and cooling systems. It is estimated that reducing Post-harvest Food Losses (PHL) by 5 percent would require around $730 billion investment in electricity, paved roads, rail, and road capacity in Asia (table 1). In addition to these investments, correction of market failure that result in food loss along the produc-tion channel is necessary for high impact. Such correc-tions include food safety services, food loss prevention campaigns, farmers organizations, marketing boards and government quota purchases/sales.
Globally, it is estimated that solid wate management costs would increase from $205 billion in 2010 to $375 billion in 2025 (table 2). Compared to their current spending levels, low income countries would see a five-fold increase, LMICs four-fold, UMICs three-fold and HICs less than double. Along with these investments, change in con-sumption habits, especially among the highest income percentile of the population will contribute to considerably reduce wastes. Corporates and industries should adopt social responsibility norms and regulation for cleaner production. Additionally, advocacy, education and policy change to internalize the social-environmental costs of irresponsible consumption or production into market price has a key role to play.
Costing of Integrated Resource Recovery Center
IRRC is a decentralized and small-scale facility of waste with a processing capacity of 2 to 20 tons of waste per day. Wastes such as organic, recyclables, used cooking
ENSURE SUSTAINABLE CONSUMPTION AND PRODUCTION PATTERNS

A GUIDEBOOK FOR ASSESSING SDG INVESTMENT NEEDS88
12.2.1 Material Footprint
12.2.2 Domestic material consumption
12.4.2 Hazardous waste generated/treated
12.4.P1 Sulphur dioxide (SO2) emissions
12.c.P1 Fossil-fuel subsidies
20192000 Target 2030
Figure 1. Progress at the indicator level
Table 1. Investment requirements in infrastructure to reduce PHL by 5 percent (US$)
Region Electricity Paved roads Rail capacity Road capacity
Africa 10,493,751,296 7,027,633,152 57,907,712 6,256,584,192
Asia 80,715,096,064 209,079,418,880 35,974,656,000 403,101,483,008
LAC 32,002,551,808 14,760,436,736 3,956,525,824 22,900,320,256
Source: Rosegrant and others (2015)
Note: Rail capacity refers to investments to increase the millions of tons per km capacity of goods transported by rail by 98 percent. Road capacity refers to investments to increase the millions of tons per km capacity of goods transported by road by 95 percent.
Table 2. Solid waste management costs in 2010 and 2025 (US$ billions)
Country Income Group 2010 2025
Low-income countries 1.5 7.7
Lower-middle income countries 20.1 84.1
Upper-middle income countries 24.5 63.5
High-income countries 159.3 220.2
Total global cost 205.4 375
Source: World Bank (2012)
oil, waste with high calorific values and faecal sludge are transformed into compost, biogas, plastics, paper, glass, biofuels and electricity. IRRC provides various social, economic and environmental benefits.16 IRRC uses a simple low-cost and non-mechanized process (figure 2).
The implementation requires a series of activities, and the cost of each activity depends on the type of model implemented: i) IRRC with composting and recovery of recyclables; and ii) IRRC with composting, anaerobic digestion (biogas), faecal sludge management, and recovery of recyclables. Estimated cost of each model is shown in table 3.
17 Social benefits: creates green jobs and provides steady source of income for urban poor and waste pickers; reduces the spread of vectors, diseases and odours; provides good hygiene and improved urban environment; and increases the awareness of the community on sustainable solid waste management. Economic benefits: produces good quality compost and biogas; promotes sustainable consumption and production through closed loop material cycles; and saves fuel costs as waste need not be transported to the landfill which are usually far from the city. Environmental benefits: reduces leachate water and CO2 emission; re-establishes soil fertility by returning matter to soil; source of valuable nutrients and minerals to the plants; improves soil structure by creating a better plant root environment; and improves the water holding capacity of soil in drought prone areas.
Costing of food loss along the supply chain
The most critical cost driver is the percentage loss. For this reason, the costing exercise requires a clear measurement of the percentage of food loss by major commodity baskets, over time and along the chain. The measurement of food loss percentage at each step of the supply chain has the double advantage of capturing inefficiencies and estimating the cost of reducing these inefficiencies. The following assumptions are made:

A GUIDEBOOK FOR ASSESSING SDG INVESTMENT NEEDS 89
Figure 2. IRRC material flows, processes and merits
Source: Waste Concern (2017)
The food types to consider correspond to primary and basic food groups and dietary needs of the country.
The percentage loss is similar within each food type (e.g. grains, fruits and vegetables, fish), but different across types.
The supply chain is similar for all food types.
Losses at each point of the supply chain are independent
of each other.
The methodology used for FAO’s Global Food Loss Index serves as a tool for countries to assess the per-centage of food loss at each point of the supply chain. Reducing food loss implies subsequent investments targeted towards each point of the supply chain where these losses occur or are significant.
The costing step of food loss reduction can be
Table 3. Integrated Resource Recovery Centers: cost estimation
Activity/Item IRRC with composting and recovery of recyclables
IRRC with composting, anaerobic digestion (biogas), faecal sludge management, and recovery of recyclables
Land requirement 150-200 m2 per ton of waste 400-500 m2 per ton of waste
Waste required High quality organic waste required; cost of segregation
High quality organic waste required; cost of segregation
Technical training & capacity building for establishing policies and programmes
USD 5,000 to USD 10,000 per 1 to 2 tons of waste
USD 5,000 to USD 10,000 per 1 to 2 tons of waste
Community awareness building, & waste separation advocacy programmes
USD 5,000 to USD 10,000 per 1 to 2 tons of waste
USD 5,000 to USD 10,000 per 1 to 2 tons of waste
Permits, surveys, assessments USD 10,000 to USD 15,000 USD 10,000 to USD 15,000
Establishment of IRRC (capital expenditure)
USD 20,000 to USD 30,000 per ton of waste
USD 30,000 to USD 40,000 per ton of waste
Operation of IRRC (electricity, waste, staff, maintenance)
5% to 10% of the capital expenditure
5% to 10% of the capital expenditure
Source: Waste Concern (2017)

A GUIDEBOOK FOR ASSESSING SDG INVESTMENT NEEDS90
Table 4. Maize loss percentages along the supply chain
summarized as follows:
Step 1: commodity groups. Define the major basic categories of commodities in the country. These categories can be grains (e.g. maize, rice, millet), vegetables (e.g. tomato, cabbage, carrot), roots and tubers (e.g. yam, potato, cassava), etc.
Step 2: supply chain. Identify the most common supply chain of commodities in the country. Supply chains vary between countries, but generally follow these stages: farm transport storage wholesale processing. The farm component can be broken into preharvest harvest post-harvest.
Step 3: loss computation. Estimation relies on good data and an understanding of food supply chains. The required data is related to food loss at each stage of the supply chain for the most dominant commodities. Several approaches can be envisaged to compile such data including:
Preliminary assessments to identify the critical loss points
� Agricultural /harvest/production/ transportation surveys
� Qualitative approaches (such as focus groups) to have better understanding of the socio-eco-nomic dynamics underpinning post-harvest
management practices
� National surveys etc.
The estimation can follow the above FAO methodology of percentage of food loss calculation at national level.
The example of maize is presented below:
Step 4: identify the stage(s) with the highest loss, for urgent intervention. In the example of maize above, the highest loss occurs at the farming and storage steps. The estimation of food loss helps to quantify the wasted food and to identify the point of the supply chain where the highest loss occurs.
Step 5: cost estimation. Once the loss has been estimated and stages of loss identified, an evaluation of costs to reduce these losses at these points can follow. For instance, if high loss is identified at the transportation stage, this implies that improving road infrastructure, and transport services is urgent. If high loss is identified at the farming stage, subsequent investment is needed to improve harvesting methods. The total amount for reducing food loss is the sum of all investments needed at each stage of the supply chain where the losses occur.
Accounting for imports and exports. Import and export can enter at different stage of the supply chain. For some countries import enters in the processing, or

A GUIDEBOOK FOR ASSESSING SDG INVESTMENT NEEDS 91
Case studies
IRRCs in Cambodia, Sri Lanka and Viet Nam
To help reduce wastes, recover the value generated by wastes, and provide additional livelihood opportunities to the urban poor, ESCAP and Waste Concern supported cities in setting up waste management centers in line with the principles of 3R (reduce, reuse and recycle). The case studies cover Matale (Sri Lanka), Quy Nhon (Vietnam) and Kampot (Cambodia). In these cities, the implementation of IRRC was based on a series of surveys aimed at measuring the waste generation rate and composition (table 5). The approach used Waste Concern costing method, framework and tools. The economic, social and environmental benefits of IRRCs contributed to the success of their implementation. The major difference between countries were the policy strategies and partnership arrangements.
Table 5. Waste generation rates and waste compositionin cities where IRRCs are operational
City, Country
City Clasification
Population Total Waste Generated
Waste Generated / Capita
Organic Waste
Recyclables Others / Inert
Matale, Sri Lanka
Small town 40,674 21 ton 0.51 kg 75% 18% 7%
Quy Nhon, Vietnam
Secondary city 271,248 195 ton 0.71 kg 72% 13% 15%
Kampot, Cambodia
Small town 34,000 18 ton 0.53 kg 65% 23% 12%
Source: Donovan and others (2013)
Fresh food supplies in the Philippines
Like in most developing countries, production of fruits and vegetable in the Philippines is generally carried out by small farmers who lack adequate resources for quality production and supply. This often results in high losses. One of the critical roots of these losses was the packing system. In response, FAO and the Government of the Philippines have estimated the cost of packaging fruits and vegetables into containers. In addition to reducing losses, good packaging i) is easy to handle and good for marketing; ii) protects from all forms of injury and damage caused by rough handling (during loading, unloading and transport), moisture loss and heat; and iii) communicates information about the product, such as product name, content/ weight, producer name, etc.
Commodities and supply chain. Three commodities were selected: tomato, mango and lettuce. The supply generally follows this channel: production harvesting packaging transport storage wholesaling retailing.
Packaging options. As the cost of packaging depends on factors such as type, reusability, size, design, number of unit purchased, transport and import costs, assembly cost (in the case of carton boxes) and possible need of packaging accessories such as liners and pads, four packaging options were considered: bamboo baskets, carton boxes, plastic crates, and polyethylene (PE) bags. For each option, costs and benefits were analysed.
Estimation. Based on the assumptions (table 6), the cost of each option was estimated.
A GUIDEBOOK FOR ASSESSING SDG INVESTMENT NEEDS 91

A GUIDEBOOK FOR ASSESSING SDG INVESTMENT NEEDS92
Table 6. Cost estimation: assumptions for mangoes, tomatoes and lettuce
Mangoes Tomatoes LettuceTransport facility
Elf truck (1.73 m X 3.383 m X 1.42 m)
Elf truck (1.73 m X 3.383 m X 1.42 m)
Elf truck (1.73 m X 3.383 m X 1.42 m)
Route Pangasinan to Manila Pangasinan to Manila Benguet (farm) to Manila
Size of plastic crates
52.1 cm X 36.4 cm X 30.5 cm 50 cm X 30 cm X 30 cm 52 cm X 35 cm X 27 cm
Layering 3 layers and 34 crates per layer
3 layers and 39 crates per layer; dimension of wooden box approximately the same as plastic crates
3 layers and 34 crates per layer
Size of carton box
48.3 cm X 33 cm X 21.6 cm
Utilization 30 days per year 60 days per year (Two seasons) 60 days per year
Size of bamboo baskets
18" X 18" X 18"
Source: Constructed from Rapusas and Rolle (2009)
wholesale stage as value added and finished products. Export does not often enter the wholesale or storage stage. Thus, the cost estimation should consider pos-sible loss stemming from export and import channels.
Costing tools
To nurture changes in consumption behavior, FAO has developed an approach to estimate food wastage foot-print (FAO, 2014). The estimation can help to deter-mine the environmental and development costs of food waste, to trigger awareness, changes in consumption habits and structural reforms in the food supply.
One Planet Network is a hub for knowledge and expe-rience sharing on SDG12. The Global SCP Initiatives Database contains large number of initiatives and projects aiming at enhancing the Goal and all closely related ones.
Waste Concern Model provides tools and approach to sustainable actions such as waste management.
UN-Habitat’s Global Municipal Database contains statistics on public spending in areas such as waste management, water and energy for over 100 cities in the world.
Food loss computation method can be drawn for FAO technical publications.
Financing options
� Crowdfunding by projects and startups and entrepreneurs advocating for sustainable con-sumption and production.
� Easiness of remittance procedures as most expa-triates have their parents in farming sectors.
� Domestic and international climate financing.
� Countries’ Nationally Appropriate Mitigation Actions (NAMAs) can provide opportunities for carbon trading, which could help to finance IRCC.
� Philanthropist, local governments and civil soci-ety, and NGO can also play important roles.
� Taxes or fees on forestry and fisheries, material taxes, waste taxes, product taxes, and air pol-lution charges, phasing out harmful fossil fuel subsidies.
A GUIDEBOOK FOR ASSESSING SDG INVESTMENT NEEDS92

A GUIDEBOOK FOR ASSESSING SDG INVESTMENT NEEDS 93
Where we stand
Clearly not on track at the Asia-Pacific regional level. Indicators related to carbon dioxide and greenhouse gas emissions are regressing (figure 1).
Globally, annual tracked climate finance in 2017 and 2018 crossed the USD half-trillion mark for the first time. Annual flows rose to $579 billion, on average, over the two-year period of 2017/2018, representing a $116 billion (25%) increase from 2015/2016. Mitigation finance accounted for 93 percent of total flows, adaptation finance 5 percent, and finance with both mitigation and adaptation benefits 2.1 percent.17 Asia-Pacific region accounted for nearly half of total flows ($280 billion). However, better estimates of climate finance are needed, including through climate budget tagging. For instance, in Indonesia, climate tagging reveals that climate change mitigation and adaptation expenditures increased from 3.6 percent to 4.9 percent of the government budget between 2016 and 2018.
Despite progress, action still falls far short of what is needed under a 1.5˚C scenario. Estimates of the invest-ment required to achieve the low-carbon transition range from USD 1.6 trillion to USD 3.8 trillion annually between 2016 and 2050, for supply-side energy system invest-ments alone (IPCC 2018), while the Global Commission
17 For mitigation, financing for low-carbon transport ($94 billion) is followed by renewable energy ($58 billion), energy efficiency ($33 billion), and agriculture, forestry, and other land-use (AFOLU) ($11 billion). Major adaptation sectors were water and wastewater management ($9 billion), AFOLU and disaster risk management (each $7 billion). Public actors contributed $253 billion and private actors $326 billion to total flows. Most climate finance (76%) is still invested in the same country in which it is sourced. OECD countries account for about 40% and non-OECD countries 60% of total flows.
TAKE URGENT ACTION TO COMBAT CLIMATE CHANGE AND ITS IMPACTS

A GUIDEBOOK FOR ASSESSING SDG INVESTMENT NEEDS94
13.1.1 Deaths/missing/affected from disasters
13.2.P1 Carbon dioxide (CO2) emissions from fuel combustion
13.2.P2 Greenhouse gas (GHG) emissions
20192000 Target 2030
Figure 1. Progress at the indicator level
on Adaptation estimates adaptation costs of USD 180 billion annually from 2020 to 2030. In addition to scaling up climate finance, it is also necessary to drastically reduce new fossil fuel investments. In the Asia-Pacific region, ESCAP Survey 2019 estimated that about $373 billion of additional investments are needed per year for climate action, half of which is for mitigation through energy transition and the other half for adaptation through climate-resilient infrastructure.
Considerations in costing
Climate action costing encompasses adaptation and mitigation. While adaptation seeks to adjust to actual and expected climate effects, mitigation aims at limit-ing the long-term impacts of global warming as well as its magnitude. Both adaption and mitigation should be costed, and the estimation methods lie on number of considerations:
The cross-cutting dimension of the approaches.
Climate action is embodied in a spectrum of vulnerable sectors that require holistic identification approaches based on past experiences, country cases, and anal-yses of specialized agencies. These sectors include agriculture, transport, coastal and marines’ resources, energy, health, and water. Consequently, the cross-cut-ting dimension of climate action requires a multidis-ciplinary team in the costing exercise. In general, enhancing infrastructure services in all relevant sec-tors and furthering clean energy policies contribute to fostering both mitigation and adaptation (approach followed by the Asia and the Pacific 2019 survey).
The variability of the approaches and related cost drivers.
The costing exercise requires the identification of risks and vulnerability in each sector, the identification of options for adaptation and mitigation actions and their related costs, as well as the mainstreaming of these
actions into policy and budgeting frameworks. In this regard, the variability of estimation methods will play an important role in identifying options for mitigation and adaptation. Each option is linked to specific costs and the most efficient one (high impact and low cost) is selected for the investment need assessment.
Scenarios.
The assessment can take stock of baseline scenarios to analyze the costs of different options, such as tech-nologies, life span of infrastructures, risk levels, finan-cial resources implications, different CO2 emissions levels etc. The baseline helps capture distance from target. It can be derived from a status quo or a projected baseline based on business-as-usual or do-nothing scenario.
Mitigation and Goal 7.
As mitigation refers to efforts to reduce and prevent greenhouse gases, the bulk of the costing exercise is addressed in Goal 7 (Affordable and Clean Energy), to avoid double costing. The similar approach was also used in the 2019 Asia Pacific Survey. The objective is to transform the energy sector through renewables and improve energy efficiency of end-users in building, industry and transport sectors.
Steps in costing
As mitigation is embodied in Goal 7, the costing exer-cise covers adaptation. Three common approaches used by the UNFCCC are summarized. The choice of the method depends on several factors including the existing facilities, types of mitigation measures and assumptions.
Cost-Benefit Analysis (CBA) is suitable when the there is a clear objective for the mitigation measure to implement, when impacts are measurable and benefits in monetary terms.

A GUIDEBOOK FOR ASSESSING SDG INVESTMENT NEEDS 95
Case study
Costs and benefits of change adaptation options in Fiji
To counter the rising risks of floods in Fiji, USAID and other members of the Pacific Cost-Benefit Initiative assessed the costs and benefits of investing in different flood risk reduction measures. The steps are summarized below.
Objectives and adaptation options. The committee identified the impacts of cyclones and floods as the main issues to address. These natural disasters often damage key areas of the Central, Western and Northern Divisions of the main island of Viti Levu. Agriculture, housing, commercial properties and infrastructure are the most exposed.
The project had the following objectives: i) to reduce the threat caused by flooding to the agricultural sector, private homes, commercial properties and infrastructure; ii) to promote sustainable development in the various sectors; iii) and to remove the threat of a flood-induced disease outbreak.
Three adaption options perceived as the causes of the problem have been identified: a) river dredging; b) re-de-sign and installation of a new drainage system; c) and afforestation along the river bank.
Identifying costs and benefits. Table 1 outlines the costs and benefits for the baseline and for each of the adapta-tion options. This approach also known as with and without analysis. Note that not all cost and benefits identified involve monetary transactions.
Measuring and valuing the costs and benefits. After identifying the costs and benefits, the committee proceeded by determining how they will be quantified and the information that is required to do so. See Table 2 for river dredging (adaptation option 1)
Aggregating costs and benefits. After estimating the costs and benefits of different adaptation options overtime, the discount rate of 12 per cent has been determined using Fiji Ministry of Agriculture’s projects. All benefits and costs have been approximated to their present values and the Net Present Value (difference between benefits and costs) was used to select the best project option.
Sensitivity analysis. Given the number of uncertainty issues that can arise from, for example, the river dredging adaptation option, a sensitivity analysis is carried out on number of factors such as:
� Number of floods that may occur
� Useful life of dredging works and their impact on flooding
� Volume of sand/gravel extracted from the river and available for sale
For each of these parameters, data and information has been consulted to determine the possible lowest and highest values.
Equity and distributional implications. Prior to completing the costing exercise, the committee studied inequality issues and the capacity of the adaptation benefits to be distributed equitably across the society. The committee also identified which stakeholders are burdened or benefitted by the major costs and benefits. For example, on benefit 2 (extraction of sand and gravel could provide jobs/ income) the industrial sector was found on the front-line; on cost 3 (environment) tourism, individuals and households were the most exposed.
Finalizing the cost-benefit analysis. The final task was to draw lessons, and information from each level of analysis and share the document with decision-makers.
A GUIDEBOOK FOR ASSESSING SDG INVESTMENT NEEDS 95

A GUIDEBOOK FOR ASSESSING SDG INVESTMENT NEEDS96
Further case studies
UNFCCC approaches and examples
https://unfccc.int/resource/docs/publications/pub_nwp_costs_benefits_adaptation.pdf
Cost-benefit analysis in the agriculture sector
http://www.fao.org/3/I8905EN/i8905en.pdf
Costing resilience through infrastructure investment in the Pacific
http://pubdocs.worldbank.org/en/720371469614841726/PACIFIC-POSSIBLE-Climate.pdf
Costs and benefits of unilateral and regional actions on climate change adaptation in six South Asia countries: Bangladesh, Bhutan, India, the Maldives, Nepal, and Sri Lanka
https://www.adb.org/sites/default/files/publication/42811/assessing-costs-climate-change-and-adaptation-south-asia.pdf
Cost of climate change mitigation in Central and West Asia
https://www.adb.org/sites/default/files/publication/223731/economics-climatechange-cwa.pdf
A GUIDEBOOK FOR ASSESSING SDG INVESTMENT NEEDS96
Table 1. With and without analysis: flood disaster risk reduction options
Baseline Dredging Improvements to Drainage System
Afforestation
Impacts Costs � Heavy rainfall would
cause flooding, incurring vast damage to various sectors
� Post-disaster rehabilitation works.
� Outbreak of diseases (sicknesses, medical costs, loss of labor hours, etc.).
� Anxiety and tension caused to people when floods occur.
� Savings of financial costs linked to undertaking projects.
� No potential harm to fresh water organisms and their habitats.
� Saving of time spent on planning for projects.
� Contractors: labor, equipment and other related capital costs.
� Administration: legal fees, tendering process, pre-consultations with all related parties, traveling expenses.
� Environment: potential harm to wildlife such as fish, flora and their habitats.
� Recurring cost of future dredging.
� Contractors: labor, equipment, land compenstation and other related capital costs.
� Expert consultations to assist in the reform of the drainage system in towns.
� Administration: legal fees, tendering pricess, pre-consultations with all related parties, traveling expenses.
� Recurring costs of future maintenance � Traffic congestion during construction
� Raw materials: seeds, plants and fertilizer.
� Labor.
Benefits � River will be deeper; can hold
larger volumes of water during heavy rainfall.
� Reduced damage to land, houses, infrastructure and commercial buildings.
� Reduced income loss and cleanup costs.
� The sand and gravel extracted from riverbed could be sold, providing further income and business opportunities.
� Improved drainage systems with capacity to support larger volumes of water during heavy rainfall; risk of flooding reduced.
� Reduced damage to land, houses, infrastructures, and commercial buildings.
� Reduced income loss and cleanup costs.
� Less soil erosion and reduced risk of flooding.
� Reduced damage to land, houses, infrastructure and commercial buildings.
� Reduced income loss and cleanup costs.
� Promote a greener and healthier environment.
Source USAID (2016)

A GUIDEBOOK FOR ASSESSING SDG INVESTMENT NEEDS 97
Cost-Effectiveness Analysis is applied when benefits using CBA are not in monetary terms.
Multi-Criteria Analysis is used when there are sev-eral objectives/criteria or when impacts are difficult to quantify.
Steps for Cost-Benefit Analysis
Step 1. Adaptation objective and options. Establish clear objective and options for adaptation measures, as well as their monetary implication.
Example: reducing the risks of floods to a certain standard.
Step 2. Establish a baseline. Define the situation without the adaptation measure (baseline), as well as the situation with successful implementation of the project to determine the costs and benefits from the two situations.
Step 3. Quantify the costs. Compute and aggregate the costs of interventions over the life-cycle of each option. Depending on the types of interventions, costs can include direct costs such as capital
Table 2. Valuation methods and required data for the costs and benefits of river dredging
Cost/Benefit Valuation Method Data Required Source of DataCost 1Labor and capital
Use quotations from contractors to estimate the contract amount, including capital and labor costs.
Contract amount for project period
Contract amount for project period
Cost 2 Administration
Use current market price data or figures from previous projects.
Legal fees. Use current market price data or figures from previous projects.
Record of administrative expenses from previous projects or an estimation based on market prices.
Cost 3Environment: harm to wildlife, such as fish and flora, and their habitats
Use the market price of fish and other freshwater organisms sold by vendors to estimate unit value.Use a specific environmental impact assessment (EIA), or expert consultation, to estimate the reduction in wildlife catch. This could also come from previous studies.Use a contingent valuation survey or the travel cost method to estimate the aesthetic value of pristine rivers.
Short market survey to estimate the value of river catches.Estimates of potential losses in river catch.
Information provided by market vendors.Information provided by EIA, expert judgment or similar studies.
Benefit 1River would be deeper, could hold larger volumes of water and the risk of flooding during heavy rainfall would be lower Benefit
Estimate expected average value of losses by multiplying (historical disaster loss assessment data) x (future frequency of flash foods as estimated by climate predictions). Decrease in losses due to the new dredging system can be estimated by engineers.
Dollar value of losses incurred by various sectors during previous floods.Number of floods. Climate predictions for likelihood of floods.Dollar value of decreased damage.
Disaster loss assessment report of relevant government agencies (i.e. Rural and Maritime Development and National Disaster Management).Climate predictions held by Ministry of Foreign Affairs and Climate Change.
Benefit 2The extraction of sandand gravel could provide jobs/income
Calculate as: (market price of gravel and/ or sand) x (expected tons of extraction).
Market price of gravel/ sand.Estimated quantity of sand/ gravel to be extracted.
Existing companies that extract and sell gravel/sand in the area of the project.
Benefit 3Induce economic activity such as creation of employment opportunities
Compute the cost of labor for the entire contract work.Estimate the income activities that can be generated and derived from the project.
Cost of labor from dredging companies.Quoted charge for dredging works by companies.
Quotations. Information provided by dredging companies.
Source: USAID (2016)
A GUIDEBOOK FOR ASSESSING SDG INVESTMENT NEEDS 97
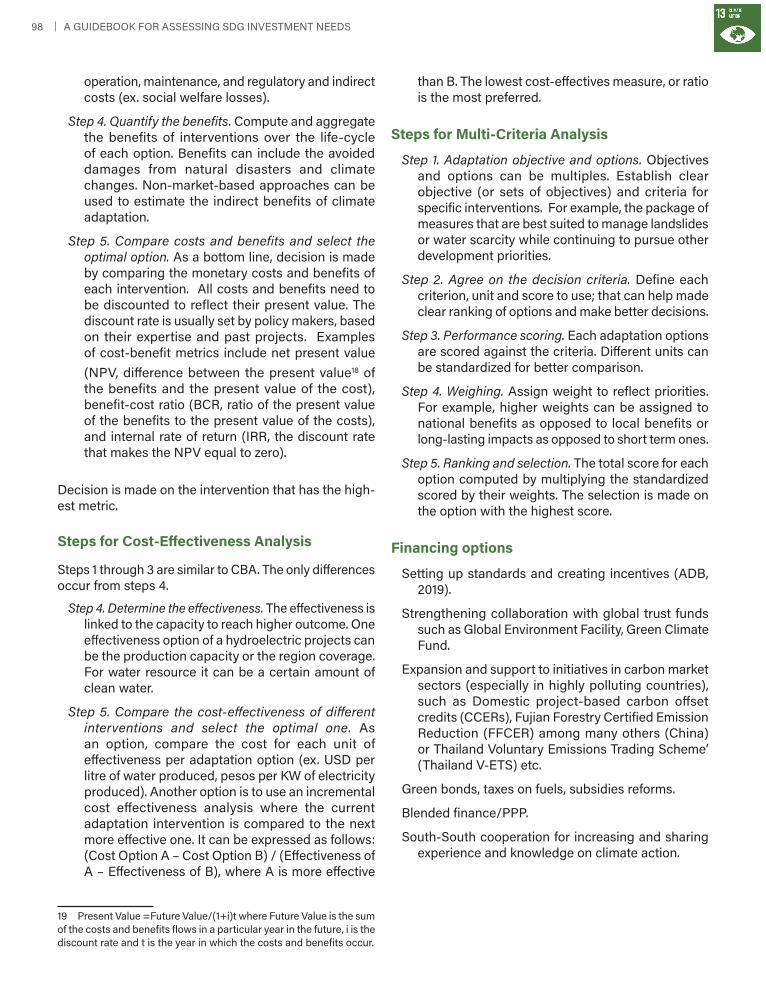
A GUIDEBOOK FOR ASSESSING SDG INVESTMENT NEEDS98
operation, maintenance, and regulatory and indirect costs (ex. social welfare losses).
Step 4. Quantify the benefits. Compute and aggregate the benefits of interventions over the life-cycle of each option. Benefits can include the avoided damages from natural disasters and climate changes. Non-market-based approaches can be used to estimate the indirect benefits of climate adaptation.
Step 5. Compare costs and benefits and select the optimal option. As a bottom line, decision is made by comparing the monetary costs and benefits of each intervention. All costs and benefits need to be discounted to reflect their present value. The discount rate is usually set by policy makers, based on their expertise and past projects. Examples of cost-benefit metrics include net present value (NPV, difference between the present value18 of the benefits and the present value of the cost), benefit-cost ratio (BCR, ratio of the present value of the benefits to the present value of the costs), and internal rate of return (IRR, the discount rate that makes the NPV equal to zero).
Decision is made on the intervention that has the high-est metric.
Steps for Cost-Effectiveness Analysis
Steps 1 through 3 are similar to CBA. The only differences occur from steps 4.
Step 4. Determine the effectiveness. The effectiveness is linked to the capacity to reach higher outcome. One effectiveness option of a hydroelectric projects can be the production capacity or the region coverage. For water resource it can be a certain amount of clean water.
Step 5. Compare the cost-effectiveness of different interventions and select the optimal one. As an option, compare the cost for each unit of effectiveness per adaptation option (ex. USD per litre of water produced, pesos per KW of electricity produced). Another option is to use an incremental cost effectiveness analysis where the current adaptation intervention is compared to the next more effective one. It can be expressed as follows: (Cost Option A – Cost Option B) / (Effectiveness of A – Effectiveness of B), where A is more effective
19 Present Value =Future Value/(1+i)t where Future Value is the sum of the costs and benefits flows in a particular year in the future, i is the discount rate and t is the year in which the costs and benefits occur.
than B. The lowest cost-effectives measure, or ratio is the most preferred.
Steps for Multi-Criteria Analysis
Step 1. Adaptation objective and options. Objectives and options can be multiples. Establish clear objective (or sets of objectives) and criteria for specific interventions. For example, the package of measures that are best suited to manage landslides or water scarcity while continuing to pursue other development priorities.
Step 2. Agree on the decision criteria. Define each criterion, unit and score to use; that can help made clear ranking of options and make better decisions.
Step 3. Performance scoring. Each adaptation options are scored against the criteria. Different units can be standardized for better comparison.
Step 4. Weighing. Assign weight to reflect priorities. For example, higher weights can be assigned to national benefits as opposed to local benefits or long-lasting impacts as opposed to short term ones.
Step 5. Ranking and selection. The total score for each option computed by multiplying the standardized scored by their weights. The selection is made on the option with the highest score.
Financing options
Setting up standards and creating incentives (ADB, 2019).
Strengthening collaboration with global trust funds such as Global Environment Facility, Green Climate Fund.
Expansion and support to initiatives in carbon market sectors (especially in highly polluting countries), such as Domestic project-based carbon offset credits (CCERs), Fujian Forestry Certified Emission Reduction (FFCER) among many others (China) or Thailand Voluntary Emissions Trading Scheme’ (Thailand V-ETS) etc.
Green bonds, taxes on fuels, subsidies reforms.
Blended finance/PPP.
South-South cooperation for increasing and sharing experience and knowledge on climate action.

A GUIDEBOOK FOR ASSESSING SDG INVESTMENT NEEDS 99
Goal 14 – Conserve and sustainably use the oceans, seas and marine resources for sustainable development
Goal 15 – Protect, restore and promote sustainable use of terrestrial ecosystems, sustainably manage forests, combat desertification, and halt and reverse land deg-radation and halt biodiversity loss
Where we stand
Clearly not on track at the Asia-Pacific regional level, but data availability is low, especially for Goal 14. Goal 14 indi-cators on Ocean Health Index and protected marine areas are off track, and so as Goal 15 indicators on forest area, forest management, and sites for terrestrial and freshwater biodiversity and mountain biodiversity (figure 1).
Biodiversity finance refers to expenditures that contributes (or intends to contribute) to the conservation, sustainable use and restoration of biodiversity. Globally, biodiversity finance is estimated to be $78 - 91 billion per year, com-prising domestic public expenditure ($67.8 billion), inter-national public expenditures ($3.9 - 9.3 billion) and private expenditures ($6.6 - 13.6 billion) (figure 2).
In terms of needs, the Convention on Biological Diversity (CBD) estimated that meeting the 20 Aichi targets (global targets for 2010-2020) would require incremental invest-ments of $153 - 436 billion per year. With global biodiver-sity targets through 2030 to be decided soon, CBD plans to produce new, updated estimates of investment needs. Based on the earlier CBD study, ESCAP’s Survey 2019 estimated that in Asia-Pacific region, significant additional investment should be targeted towards the reduction of pollution ($46 billion), the protection of marine and terres-trial areas ($25 billion) and the reduction of habitat loss ($24 billion) (figure 3).
Costing overview
Biodiversity has several indirect costs that are either dif-ficult to capture or embodied in other areas of the SDGs. The most indirect cost stems from human activities that degrade natural ecosystems. Climate change fastens the deterioration of the ecosystem. Biodiversity investment needs can be under- or over-estimated depending on actions to address such issues.
Many key biodiversity areas overlap with the ancestral
BIODIVERSITY AND ECOSYSTEMS
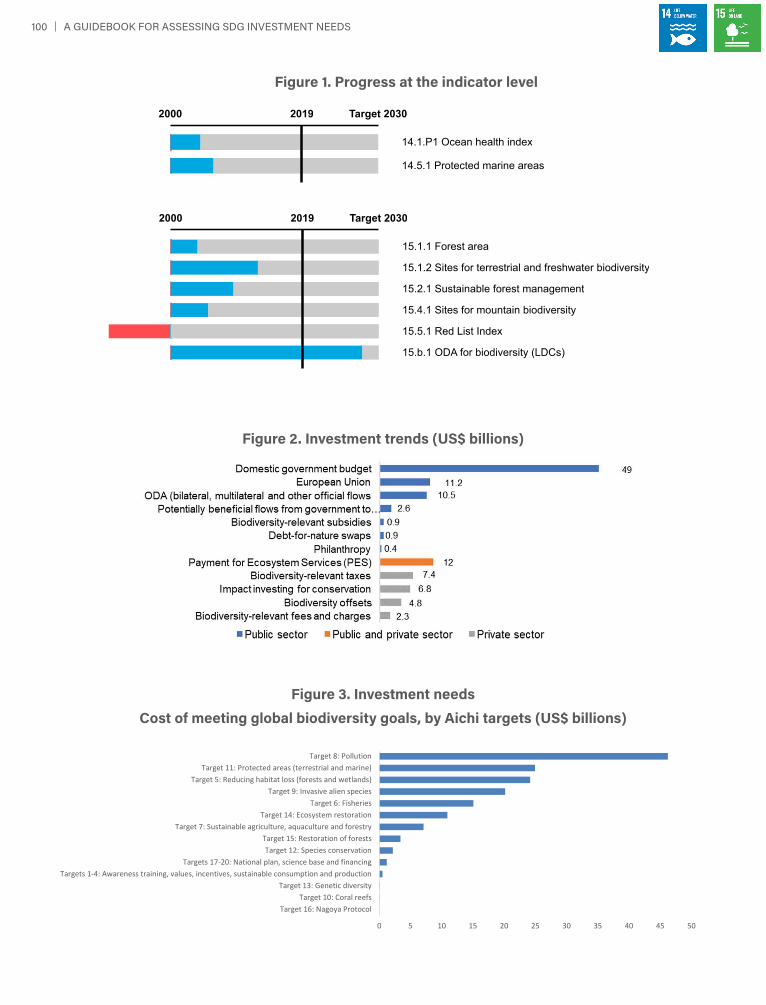
A GUIDEBOOK FOR ASSESSING SDG INVESTMENT NEEDS100
14.1.P1 Ocean health index
14.5.1 Protected marine areas
20192000 Target 2030
Figure 1. Progress at the indicator level
15.1.1 Forest area
15.1.2 Sites for terrestrial and freshwater biodiversity
15.2.1 Sustainable forest management
15.4.1 Sites for mountain biodiversity
15.5.1 Red List Index
15.b.1 ODA for biodiversity (LDCs)
20192000 Target 2030
Figure 2. Investment trends (US$ billions)
0 5 10 15 20 25 30 35 40 45 50
Target 16: Nagoya ProtocolTarget 10: Coral reefs
Target 13: Genetic diversityTargets 1-4: Awareness training, values, incentives, sustainable consumption and production
Targets 17-20: National plan, science base and financingTarget 12: Species conservation
Target 15: Restoration of forestsTarget 7: Sustainable agriculture, aquaculture and forestry
Target 14: Ecosystem restorationTarget 6: Fisheries
Target 9: Invasive alien speciesTarget 5: Reducing habitat loss (forests and wetlands)
Target 11: Protected areas (terrestrial and marine)Target 8: Pollution
Figure 3. Investment needsCost of meeting global biodiversity goals, by Aichi targets (US$ billions)

A GUIDEBOOK FOR ASSESSING SDG INVESTMENT NEEDS 101
lands of local communities and indigenous groups. Biodiversity activities should gain their consents and pay close attention to their rights, in line with the UN Declaration on the Rights of Indigenous Peoples. Likewise, attention is needed to potential impacts of biodiversity activities on areas where indigenous pop-ulations and vulnerable groups live. Consultation with local communities and adaptation to relevant cultural aspects and language are recommended.
Steps in costing
The costing method uses BIOFIN financial needs assessment and is derived from countries’ current progress in investment for conservation and resto-ration of ecosystems and biodiversity. The BIOFIN methodology is flexible and can be adapted by each country. It counts expenditures that has biodiversity as its primary or secondary/joint objective, with the latter weighted according to an estimate of the percentage of money spent that targeted biodiversity specifically. Biodiversity expenditure reviews have been conducted for some 18 countries.
Step 1: preparation. Identify relevant experts, stakeholders, and decision makers who will be evaluating the results of the assessments. These actors should have the capacity to link the cost estimation to the country’s fiscal management and policy. As such, primary actors should include ministries of finance and planning. Other relevant ministries, organization, and agencies should also be considered. In addition to the identification of relevant actors, several actions can be explored in the preparation phase, including:
� Creation of a group of experts who will work in tandem with the national BIOFIN team
� Exploration of lessons from other countries
� Elaboration of a work plan including a timeline and stakeholder consultations.
� Examination of potential data sources.
Step 2: clarify biodiversity specific targets, results, strategies, and actions. Scope and clarify diversity targets, national strategies, and specific actions, including the National Biodiversity Strategy and Action Plan (NBSAP) following three activities. First, select the most relevant scope for the need assessment based on the comprehensiveness and quality of the NBSAP, the most significant biodiversity impact potential and the interest
of important decision makers. Second, actions should use clear and quantifiable logical structures, written in proper languages such as accounting or finance. Third, initial pre-costing should be prioritized during and after the process of refining the NBSAP actions by giving higher importance to activities that are: i) the most likely to deliver results; and ii) the most important for achieving biodiversity goals and that reflect the country’s vision.
Step 3: implement initial costing based on desktop studies. This step aims at setting initial costs for each of the goals/targets. It is composed of two actions. The first action is the identification of budget units and standard unit costs. The identification of budget units aims at linking biodiversity costing into government budgeting processes, units or codes (line items, budget categories, or budget accounts depending on the terminology used by each country). Standard unit costs can be explored from a range of sources, including:
� Previous budgets and budgeting processes
� Standard government cost scales (salary scales, budget guidance notes, and other official and semi-official sources on services, salaries, mate-rials, operations, capital purchases, consultant days, miles travelled, etc.)
� Historical costs
� Cost modelling
The second action is the construction of cost tables. Cost tables can be divided into recurring or operating costs and capital expenditures or investments. They are linked to specific organizations or actors to which they can be earmarked.
Step 4: review the costs with support from individual expert consultations. After finalizing the initial estimation, series of consultations with experts, and workshops can be used to refine the assessment, select the most cost-effective alternative actions that deliver biodiversity results, and update the cost tables. For cross-comparison and additional analysis purposes, all actions can be tagged to the extent possible to categories such as:
� Aichi commitments
� National biodiversity targets

A GUIDEBOOK FOR ASSESSING SDG INVESTMENT NEEDS102
� Nine BIOFIN categories19
� SDGs (for the above targets that are not included in Goals 14 and 15)
� Sectors such as agriculture, forestry, fisheries, and extractives
Step 5: evaluate the results obtained from cost estimations. After deriving the cost estimation, annual projections should be summarized for each actor based on their organization, and segment/interest across BIOFIN and national categories. Next, a detailed analysis of the cost estimation should be carried out with a clear link established between costs and desired results.
¾ Costing results can be summarized or projected for different groups of actions (e.g. costs over different budget cycles, and for different biodi-versity results), for any of the tags listed in step 4, or for different levels of biodiversity strategies/actions. Alternative approaches to achieving the same results can also be explored.
¾ Biodiversity results can be organized (focusing on specific results) according to biodiversity pri-orities. Then link the costs to each priority level. Finally, identify higher biodiversity priorities that are relatively less costly, as they are the most cost-effective ways to reach biodiversity goals.
¾ Similarly, a sensitive analysis can be envisaged. Assumptions and key indicators can be changed to assess different outcomes and costs. The approach with the highest impact and lowest cost should be prioritized.
Step 6: estimate unmet finance needs. Following the cost estimation and the evaluation of the results, a straightforward question helps to identify unmet direct finance needs for each target or each activity under each target: “How much of this target is currently covered and how much do we need to raise?”. Each activity can be reviewed, and existing funding sources identified and quantified. The gap is categorized for each activity and the total derived at the end of the exercise.
This approach helps determine a baseline measurement
20 1) Biodiversity awareness and knowledge, 2) Green economy, 3) Pollution management, 4) Sustainable use, 5) Biosafety, 6) Protected areas and other conservation measures, 7) Restoration, 8) Access and benefit sharing, 9) Biodiversity and development planning and finance.
for a NBSAP and does not necessarily reflect true national biodiversity finance needs calculation, as many other factors should be taken into account. For example, indirect costs arising from human activities that degrade or decrease natural ecosystems can increase the financing needs. Some of these actions are financed by donors, philanthropists, private com-panies, central/local government, or NGOs. Also, for cases where Biodiversity Expenditure Reviews (BER) is implemented, coordination of BER projections with financing need assessments should be reconciled to avoid misleading estimations of financing gaps.
Policy and financing options
In most cases, the rationale for investing in biodiversity and ecosystems has been derived from the enormous benefits which they deliver rather than on financing gap considerations. Thus, there are many more valuation exercises and studies on natural wealth accounting. For 47 countries in the Asia-Pacific region, Kubiszewski and others (2016) estimated the benefits provided by ter-restrial ecosystem services to be worth approximately $14 trillion per year, and that a scenario wherein the Goals are met would lead to an increase in the value of ecosystem services worth $3.3 trillion by 2050, com-pared with a loss in value of $4.7 trillion if historical trends continue.
However, ecosystems and biodiversity values are not internalized by markets, nor are the costs of biodiver-sity and ecosystem loss reflected in prices. Similarly, public budgets often overlook the economic poten-tial and negative risks associated with underfunding biodiversity and conservation. Average biodiversity expenditures as a share of total government expen-ditures range from as low as 0.16 per cent to 1.8 per-cent (UNDP, 2018).20 In going forward, while scaling up public finance for biodiversity, including through such worldwide initiatives as the Global Environment Facility, another priority will be to engage the private sector. Based on a survey of private investors, “conservation investment” – intentional investments in companies, funds and organizations with the goal of generating both a financial return and a measurable environmental result – is growing rapidly (Hamrick, 2016).
20 For more details, see the UNDP Biodiversity Finance Initiative (http://biodiversityfinance.net/) website on financing solutions for sustainable development (www.sdfinance.undp.org/content/sdfinance/en/home/sdg/goal-15--life-on-land.html).

A GUIDEBOOK FOR ASSESSING SDG INVESTMENT NEEDS 103
Case studies
The Biodiversity Financial Needs Assessment in Thailand
Following the BIOFIN approach, Thailand has evaluated the investment needed to reach its biodiversity targets. As an inception, the NBSAP was consulted and used as a reference since it is the main instrument of biodiversity policy implementation. The assessment covers the period 2016-2021. The approach of the NBSAP can be sum-marized as follows:
Identification of strategies. Reference is made to the list of activities in NBSAP for 2015-2016 and the NBSAP for 2017-2021 (table 1).
Cost estimation. A bottom-up approach is used to evaluate the investment need and find alternative estimates, due to potential uncertainties. Each activity was estimated and projected until 2021.
Needs assessment under different scenarios.
� Scenario A: business-as-usual that assumes no changes in the rate of increase in annual budget allocation
� Scenario B: financial needs with unit costs to implement selected measures in NBSAP
� Scenario C: financial needs without NBSAP budget estimates
Thailand utilized a bottom-up approach whereby key line agencies are identified, and their strategies and planned activities included in the calculation. Thus, biodiversity goals are those identified in the NBSAP, the Ministry of Natural Resources and the Environment’s 20-Year Strategic Plan, and items in the key line agencies’ strategies and plans that are not included in the NBSAP budget (NBSAP plus activities). The latter items are identified and costed in close consultation with key line agencies.
The financing gap is estimated to be THB 31,978 million (USD 942 million) for the remaining period of current NBSAP (2019 – 2021) for three major departments – Department of National Parks, Wildlife and Plant Conservation; Royal Forest Department; and Department of Marine and Coastal Resource. This is more than twice the estimated biodiversity budget in 2015 (THB 11,110 million).
Inland Wetlands Rehabilitation in the Philippines
Under the NBSAP, the costing process of the Action “rehabilitate priority inland wetlands including peatlands” followed the following steps:
Identification of areas. Several intervention sites were selected such as Lake Lanao; Lake Naujan; Lake Malasi; Seven Lakes; Mangyaw; Taal & Pansipit; Lake Mainit; Lake Danao; Caimpugan Peat Swamp; Lalaguna Marsh; Cagayan River System (Upstream, midstream, coastal); Ilog Hinabangan; Pasig River; Rinconada Lakes and 22 marshes.
Suggested activities. The list of action identified cover: i) the design and implementation of strategy to manage human settlements in wetlands; ii) restoration of forest; iii) soil conservation; and iv) identification of degraded marshlands.
Unit costs. The number of personnel needed was estimated and corresponding unit cost computed. Also, unit costs were calculated for maintenance and operation in reforestation, assessment of marshes, monitoring of soil quality and management facilities.
Capital outlay. Unit cost and quantity of capital outlay was estimated at 10 billion Peso per facility for six wastewater management facilities.
A GUIDEBOOK FOR ASSESSING SDG INVESTMENT NEEDS 103

A GUIDEBOOK FOR ASSESSING SDG INVESTMENT NEEDS104
CDB financial reporting framework
Under the framework, 74 countries (or 40% of the Parties) have reported domestic biodiversity expenditures to CBD at least once, of which 49 provided data for 2015 or more recent years. It also asks about funding needs, gaps and priorities. Of the 44 countries which responded:
China has undertaken a preliminary assessment of funding needs, including funding needs of some central government departments from the GEF during its seventh replenishment period (June 2018-June 2022) for the implementation of the Convention and its Protocols.
While India is working towards estimating available funding for biodiversity, it is not possible at this stage, to indicate with some level of confidence, the funding needs, and therefore also the estimated funding gap. India has however, initiated steps to assess the amount of funding required for implementation of the action points in the NBSAP and achievement of the 12 National Biodiversity Targets. This exercise is being pursued under the BIOFIN, which India joined in 2015. It is expected that under this project, the funds needed, as well as the funding gap would be worked out, and a resource mobilisation strategy for biodiversity developed.
Maldives: Funding needs are estimated for NBSAP 2016-2025. Estimated available resources are taken from the expected government budget allocations and from confirmed donor funded projects.
Table 1. NBSAP estimates for the period 2015-2021
Strategy
2015-2016 2017-2021
Million THB
Million USD
Million THB
Million USD
Strategy 1: Integrating the value and management of biodiversity resources involving stakeholders at all levels through participatory processes. Increase awareness and provide knowledge about biodiversity resources Integrate and promote participation in the management of biodiversity resources
890 26 1,088 32
Strategy 2: Conservation and restoration of biodiversity resources. (i) Conserve, restore and protect biodiversity (ii) Reduce the pressure and ensuring sustainable use of biodiversity resources (iii) Management of wetlands (iv) Management of alien invasive species (v) Biosafety
7,539 222 8,637 254
Strategy 3: Protecting the national rights in terms of access and benefit sharing that is consistent with the concept of Green Economy. (i) Protect genetic resources (ii) R&D to create market values for biodiversity
2,078 61 288 8
Strategy 4: Developing the knowledge and standardized database on biodiversity resources so that it is consistent with international standards. (i) Knowledge management and database. (ii) Protect local and traditional knowledge about biodiversity
542 16 2,622 77
Total 11,049 326 12,634 372
Sources: UNDP Thailand (2018)
A GUIDEBOOK FOR ASSESSING SDG INVESTMENT NEEDS104

A GUIDEBOOK FOR ASSESSING SDG INVESTMENT NEEDS 105
Where we stand
Despite progress, not on track at the Asia-Pacific regional level. Indicators related to homicides, human trafficking and bribery are progressing but not fast enough, whereas the indicator on unsentenced detainees as a proportion of overall prison population (a measure of progress on target 16.3 on equal access to justice for all) is regressing (figure 1).
Goal 16 investments are hard to define and monitor. Globally, a comprehensive but outdated study found that in 1997, global criminal justice expenditure was $362 billion, of which 62 percent was allocated to policing, 3 percent to prosecutions, 18 percent to courts, and 17 percent to prisons.
For recent years, government expenditures on public order and safety ranged from nearly 5 percent of GDP in Afghanistan to about 1 percent in Sri Lanka in the Asia-Pacific region (figure 2). While law enforcement structures differ significantly from country to country, a compari-son of the criminal justice system reveals that in terms of personnel (whose salaries and benefits is a major cost driver), Thailand and Timor-Leste had the highest number of police relative to their populations, and Mongolia had the highest number of prosecutors and judges (figure 2).
ODA targeted to legal and judicial services (including police and prisons) accounted for less than 2 percent of all aid flows on average in the past 10 years, and was on a declining trend. Such ODA does not cover more than 1 percent of basic justice costs in low income countries, with few exceptions such as Afghanistan. On average, 3 percent of such ODA goes to conflict-affected states.
In terms of needs, a recent study by ODI estimates that provision of universal basic justice (SDG target 16.3) would cost $20 per person a year in a low-income country, $64 in a middle-income country and $190 in a high-income country (table 1). Another study, building on various data sources including programme data on unit costs, mac-ro-level data, national budget publications, and interviews with stakeholders including donors and implementers, estimates the costs for scaling up basic legal services to provide national coverage ranging from $0.1 to $1.3 per capita in selected developing countries and $3 to $6 in selected developed countries.
PROMOTE PEACEFUL AND INCLUSIVE SOCIETIES FOR SUSTAINABLE DEVELOPMENT, PROVIDE ACCESS TO JUSTICE FOR ALL AND BUILD EFFECTIVE, ACCOUNTABLE AND INCLUSIVE INSTITUTIONS AT ALL LEVELS
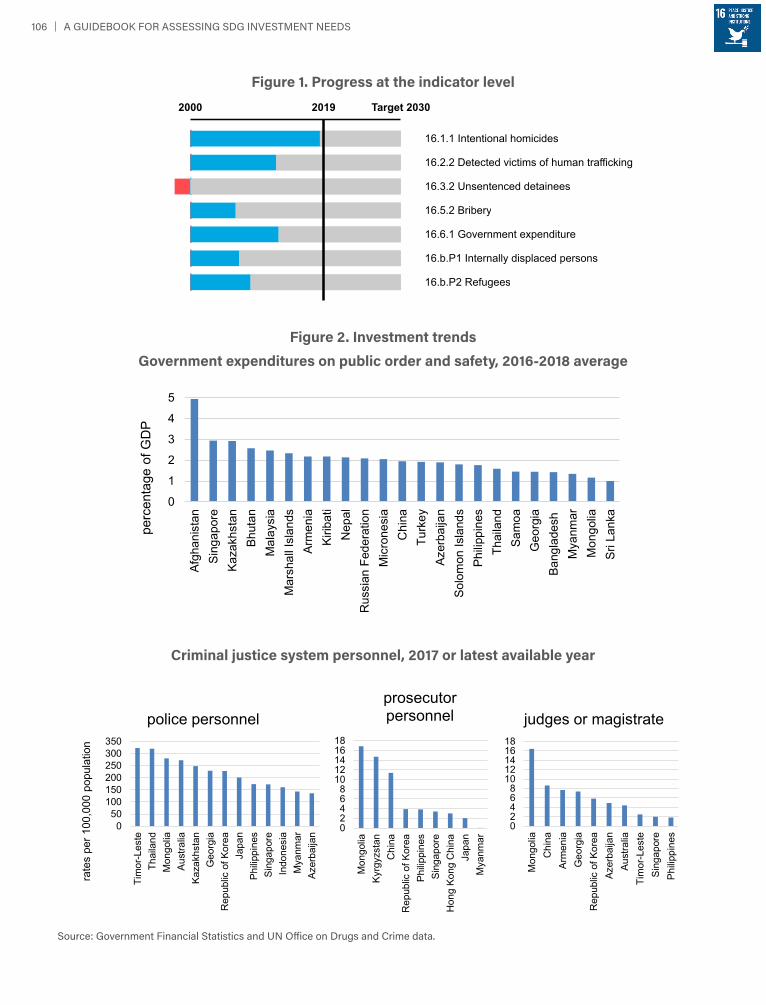
A GUIDEBOOK FOR ASSESSING SDG INVESTMENT NEEDS106
16.1.1 Intentional homicides
16.2.2 Detected victims of human trafficking
16.3.2 Unsentenced detainees
16.5.2 Bribery
16.6.1 Government expenditure
16.b.P1 Internally displaced persons
16.b.P2 Refugees
20192000 Target 2030
Figure 1. Progress at the indicator level
Figure 2. Investment trendsGovernment expenditures on public order and safety, 2016-2018 average
Source: Government Financial Statistics and UN Office on Drugs and Crime data.
050
100150200250300350
Tim
or-L
este
Thai
land
Mon
golia
Aust
ralia
Kaza
khst
anG
eorg
iaR
epub
lic o
f Kor
eaJa
pan
Philip
pine
sSi
ngap
ore
Indo
nesi
aM
yanm
arAz
erba
ijan
rate
s pe
r 100
,000
pop
ulat
ion
police personnel
02468
1012141618
Mon
golia
Kyrg
yzst
anC
hina
Rep
ublic
of K
orea
Philip
pine
sSi
ngap
ore
Hon
g Ko
ng C
hina
Japa
nM
yanm
ar
prosecutor personnel
02468
1012141618
Mon
golia
Chi
naAr
men
iaG
eorg
iaR
epub
lic o
f Kor
eaAz
erba
ijan
Aust
ralia
Tim
or-L
este
Sing
apor
ePh
ilippi
nes
judges or magistrate
Criminal justice system personnel, 2017 or latest available year
0
1
2
3
4
5
Afgh
anis
tan
Sing
apor
eKa
zakh
stan
Bhut
anM
alay
sia
Mar
shal
l Isl
ands
Arm
enia
Kirib
ati
Nep
alR
ussi
an F
eder
atio
nM
icro
nesi
aC
hina
Turk
eyAz
erba
ijan
Solo
mon
Isla
nds
Philip
pine
sTh
aila
ndSa
moa
Geo
rgia
Bang
lade
shM
yanm
arM
ongo
liaSr
i Lan
ka
perc
enta
ge o
f GD
P

A GUIDEBOOK FOR ASSESSING SDG INVESTMENT NEEDS 107
A people-centred approach to costing
The approach to the costing exercise was people-cen-tred, focusing on the justice needs of individuals at the community level. There is a growing body of global evidence on the extent of people’s unmet justice needs. On the incidence of the proportion of the population who have justice needs, a recent estimate based on extensive survey evidence from the HiiL is that each year one billion people or 13% of the world’s population face a new and serious conflict. Research also high-lights the scale and the nature of the justice gap – the extent to which these legal needs are unmet. The Task Force on Justice has recently estimated that globally 5 billion people (over half the world’s population) do not have meaningful access to justice. Another way to look at the challenge is that, in some countries, up to half of justice problems go unresolved.
ODI (2019) defines the components of universal basic justice as follows, and estimates their costs as shown in table 1.
Community-level legal advice, assistance and empow-erment. For instance, a cost-effective model is a broad frontline of non-lawyers partnering with and referring cases to lawyers where appropriate. Mobile phone and online platforms could also help broaden and deepen service delivery.
Relatively informal mechanisms to resolve legal prob-lems, conflicts, disputes and, grievances. There is a wide
spectrum here – ranging from free advice and support from friends and family to state-recognised and funded dispute resolution institutions such as (in some cases) local, traditional and religious leaders.
Formal ‘state’ institutions to resolve legal problems, conflicts, disputes and grievances. While only a small minority (5-7%) of cases are resolved through formal courts or tribunals, these formal ‘state’ institutions are a key element in basic justice provision. Among others, the costing focuses on front line policing in communi-ties, including crime prevention. This pillar also includes public prosecutors, probation/rehabilitation/correc-tional services and mechanisms, including specialized services dealing with children.
Improving accountability. The justice sector can be a source of injustice. Corruption is often a challenge. Thus, the costing exercise includes estimates for formal statutory oversight, accountability and complaints mechanisms, and also more innovative and commu-nity-based initiatives. Importantly, the costing exer-cise assumes that there is the political will for reforms, including those involving anti-corruption measures for juridical independence or reorientation of the police to be more accountable.
‘Out-of-pocket’ expenses (paid by individuals for the top-five legal needs). It is important to capture the costs currently paid by individuals to access both informal and formal justice services. This is discussed in greater detail later.
Source: UNODC
Figure 3. Decision points in the criminal justice process

A GUIDEBOOK FOR ASSESSING SDG INVESTMENT NEEDS108
Police, prosecution services, courts, and corrections
On formal ‘state’ institutions, which account for the bulk of total cost of access to justice in table 1, a closer look is needed at the criminal justice system and how it delivers justice services. While the police, prosecu-tion service, criminal courts, and corrections are the core agencies of the institutional framework that most countries have adopted to respond to crime, a range of other entities deliver important criminal justice services that have to be funded from the government’s budget. Legal aid and criminal defense services are among the more costly of these services—and they often remain underfunded, with serious consequences for individual rights and justice system operations. While there is no standard institutional typology, the UN Office on Drugs and Crime (UNODC) provides a useful graphic that offers some guidance as to the range of institutions in the criminal justice chain (figure 1).
In particular, half or more of total costs in table 1 con-cerns police. Aside from their salaries, the quality of services delivered would depend on recruitment and training standards, which is where one of the biggest differences between police agencies across the world lies. Developing Asian countries typically require some high school education for new recruits, and train them for under one year, compared to two plus years in New Zealand and one plus year in Australia and Japan. An important caveat is the absence of rigorous data on the substance of police training—how much training is devoted to legal questions, to police skills of various kinds (including interviewing witnesses, victim sup-port), and to physical fitness. Attention is also required to policies governing the recruitment of police officers from the racial, ethnic, and language groups that are to be policed.
‘Out-of-pocket’ expenses paid by individuals
Goal 16 costing could examine government budgets allocated to the criminal justice system. An alternative approach is to estimate average costs of justice per person based legal needs surveys of individuals, as have been widely conducted by the Hague Institute for Innovation Law (HiiL), for more than 70,000 people around the world. This section briefly explains this cost-ing approach.
How legal problems are resolved. The surveys show how people currently try to get their legal problems resolved and categorize them into the following strategies:
direct negotiation with the other party with information and advice (7%→35%);
mediation or arbitration (4%→35%);
court ruling (5%→5%); and
rule/resolution from an informal justice provider (11%→25%).
Associated out-of-pocket spending. The survey also col-lects data on how much, on average, a person spends in the procedure, by type of resolution and category of problem. To estimate the cost of justice, the number of cases per resolution type is multiplied by average cost of each procedure.
Market shares, current and future. Based on the survey responses, we calculate the ‘market share’ of each strategy of the disputes that occurred in a year. The results of the global survey are shown in parentheses; for instance, only 5% of the respondents pursued court ruling. Then it is assumed that if there were full access to justice, the different resolution types would increase their market share, resolving all problems. Revised shares are shown in the parentheses with the arrow.
Original average cost multiplied by assumed future market shares. The cost of full access to justice per person is then estimated by multiplying the actual out-of-pocket spending with the assumed market share of each strategy under the scenario of full access to justice.
This proposal has the advantage of being anchored in actual data and behaviours obtained in several coun-tries around the world. It also takes into account the different paths to resolution: the formal (public) sector, informal (traditional) sector, negotiation, etc. This reflects the fact that there is no single actor monopo-lising access to justice. At the same time, this method uses survey data on costs, which people cannot always recall in a reliable way. Moreover, the assumptions related to market share under full access to justice have to be tested.
General steps in costing
Based on the above discussions, this section explains a general three-step approach to costing target 16.3.
1. Identifying the incidence of the proportion of people with justice needs.
For instance, the Task Force on Justice (2019) identifies three types of people who lack meaningful access to

A GUIDEBOOK FOR ASSESSING SDG INVESTMENT NEEDS 109
justice: i) people living in extreme conditions of injus-tice, ii) people who cannot resolve their justice prob-lems (e.g. victims of unreported violence or crime; denial of a public service); and iii) people who are excluded from the opportunities the law provides (e.g. lack of legal identity, proof of housing or land tenure, which makes them vulnerable to abuse and exploita-tion). Women, children, poor people, people with dis-abilities, and ethnic minorities are persistently affected from lack of access to justice. Problems relating to land and legal identity and documentation are much more spread in low income countries.
2. Identifying required institutions and mechanisms
Once justice needs are identified, required institu-tions and mechanisms may be clarified. For example, addressing and resolving legal problems, providing access to legal advice along with formal mechanisms including police, courts, and prisons. The detail of what an appropriate institutional framework to deliver jus-tice looks like will be context specific. For example, in low-income countries, traditional and informal dispute resolution mechanisms tend to have more legitimacy than the formal system. The scope of the problems with the current institutional framework differs across countries too: in many countries, a simple legal action
involves complex procedures and disproportionate cost, making justice inaccessible for many. If existing institutional framework allows to allocate more justice delivery virtually, for example through virtual courts, this would also lower the costs.
3. Identifying unit costs for salary, non-salary, and out-of-pocket costs
Assumptions need to be made about staffing ratios needed to provide basic justice as well as what justice sector staff should be paid. For example, in a costing case, salaries were assumed to be paid in line with the requirement of education, skills and responsibility, whereas in another case, frontline community police were assumed to be paid on the same salary scale as teachers. Along with salary costs, non-salary recurrent costs (such as uniforms) and capital expenses (such as cars, computers, radios) should be considered. Finally, out-of-pocket expenses (costs paid by individuals for legal needs) should be considered. While basic justice must be taken as universally accessible to all, it may not be universally free to access as it may involve fees such as court or lawyer fees. Therefore, user fees to access requires attention especially in low income countries where the fees would be less affordable.

A GUIDEBOOK FOR ASSESSING SDG INVESTMENT NEEDS110
Table 1. Investment needsUniversal basic justice – Cost per person per year, US$
Low-income countries
Middle-income
countries
High-income countries
Community-level legal advice, assistance and empowermentBasic legal assistance (paralegal support) 0.4 2.5 5
Less formal legal problems and dispute resolution mechanismsTraditional/religious/nonformal dispute resolution mechanism 0.5 2 6
Formal ‘state’institutionsof which: 12.5 48 151
Primary courts (lowest tier civil and criminal courts) 0.5 2 6Police (community-oriented) 10 38 120Public prosecutors 0.5 2 7Probation/juvenile/family justice services requires further researchPrisons 1.5 6 18Improving accountability of formal state institutionsof which: 1.5 1.5 2.5
Statutory police oversight mechanism 1.5 1.5 2.5Community monitoring of police, prosecution and lowest tier judges 1.5 1.5 1.5Programme to improve judicial accountability requires further researchOut-of-pocket expenses(Currently paid by individuals for top-five legal needs) 5.4 10.1 20
Land 1.7 2.2Family 0.9 1.7Neighbour 0.5 2Employment 0.4 2.3Criminal justice 1.9 1.9Total cost of universal basic justice 20.3 64.1 184.5
Source: ODI 2019

A GUIDEBOOK FOR ASSESSING SDG INVESTMENT NEEDS 111
ANNEX 1: SELECTED LITERATURE REVIEW Several previous studies have estimated the investment requirements to achieve international development goals. The table below summarizes the main findings and the methodology of selected studies with relatively broad coverage of SDGs. These estimates vary in scope, baselines, targets and other assumptions and are therefore not directly comparable.
Table A.1. Selected literature review on SDG costing
SECTORAL COVERAGE MAIN FINDINGS METHODOLOGY
Comprehensive SDG coverage, regionalESCAP (2013) 4 sectors including education,
health, social protection – consisting of employment guarantee, social pension and disability benefits – and electricity
For 10 Asia-Pacific developing countries, total investment of $500-800 billion is needed per year, with required investment as percentage of GDP rising gradually through 2030; investment needs are relatively low in China and Russia, and high in Bangladesh and Fiji
Country-level costing based on a simplified sectoral costing model; applies global benchmarks or regional good practices
ESCAP (2015) Based on studies which address education, health, social protection, infrastructure, climate action; but does not provide sectoral breakdown
For Asia-Pacific region, total investment of $2.1-2.5 trillion is needed per year through 2030
Aggregation of existing multi-sector cost estimates – ESCAP (2013), ADB (2009) and others; no geographic breakdown
Comprehensive SDG coverage, globalUNCTAD (2014)
10 sectors including power, transport, telecommunications, water and sanitation, food security and agriculture, climate change mitigation, climate change adaptation, biodiversity, health, and education
Globally, total investment of $5-7 trillion is needed per year to implement the Goals, with an annual average investment gap of $2.5 trillion for developing countries over 2016-2030
Aggregation of existing sectoral cost estimates, with few modifications; no geographic breakdown
SDSN (2015) Similar to UNCTAD (2014) but climate change is mainstreamed into other sectors rather than explicitly costed; additional elements are data for SDGs and humanitarian work; social protection is discussed but not costed
Globally, an annual average investment gap of $1.4 trillion per year, or 11.5 percent of GDP, for low income countries and lower-middle income countries
Aggregation of existing sectoral cost estimates, with few modifications; no geographic breakdown
IMF (2019) 5 sectors including education, health, roads, electricity, water and sanitation; does not cover environmental dimension
Globally, an additional $2.6 trillion for developing countries in 2030 (no annual average reported) – including $2.1 trillion for 73 emerging market economies and $0.5 trillion for 49 low income developing countries
Country-level costing based on a simplified sectoral costing model; applies peer benchmarking based on SDSN’s SDG index

A GUIDEBOOK FOR ASSESSING SDG INVESTMENT NEEDS112
Table A.1. Selected literature review on SDG costing
SECTORAL COVERAGE MAIN FINDINGS METHODOLOGY
Sustainable infrastructure, regional and globalADB (2017) 4 infrastructure sectors – electricity,
transport, ICT and water and sanitation – with climate proofing
For developing Asia, infrastructure investment need of $1.7 trillion per year during 2016-2030; and for a smaller set of countries, an annual investment gap of $460 billion or 2.4 percent of GDP during 2016-2020
Future infrastructure demand projection (based on panel regression) and application of unit costs; mark-ups to account for climate change
ESCAP (2017) The above 4 infrastructure sectors with climate proofing
Investment need of 10.5 percent of GDP during 2016-2030, compared to current spending of 4.0-7.5 percent, in 26 Asia-Pacific least developed countries, landlocked developing countries, and small island developing States
Similar to ADB (2017); additional element is convergence of capital stock to the regional average, given wide infrastructure deficits in these countries
IEA (2018) Power sector, plus efficiency gains in transport, building and industry sectors; provides energy scenarios which are consistent with the Paris climate agreement
Globally, total investment of $2.6 trillion is needed per year to meet growing energy demand through 2040; a sustainable development scenario requires 15 percent higher investment, with marked difference in capital allocation
Future energy demand projection (based on model scenarios) and application of unit costs; energy efficiency investment is defined by the additional amount that consumers have to pay
WB (2019) 3 infrastructure sectors – electricity, transport and water and sanitation – plus flood protection and irrigation
Globally, investments of 4.5 percent of GDP will enable developing countries to achieve infrastructure-related SDGs and stay on track on climate goals; provides a cost range of 2-8 percent of GDP depending on the quality and quantity of service targeted and the spending efficiency
Future infrastructure demand projection (based on model scenarios) and application of unit costs; greater attention to operation and maintenance costs

A GUIDEBOOK FOR ASSESSING SDG INVESTMENT NEEDS 113
0 1 2 3 4 5 6 7
SDG 2: Zero Hunger
SDG 4: Quality Education
SDG 16: Peace, Justice and Strong Institutions
SDG 1: No Poverty
SDG 10: Reduced Inequalities
SDG 6: Clean Water and Sanitation
SDG 9: Industry, Innovation and Infrastructure
SDG 13: Climate Action
SDG 11: Sustainable Cities and Communities
China (2) Hong Kong, China (2) Japan (3) Mongolia (2) Republic of Korea (the) (3)
To complement the technical analysis, a questionnaire was sent to policymakers and other stakeholders in the region; almost 300 responses from 44 countries were received.
Figure 3.3 in Survey 2019 summarizes the responses at the regional level; below are the sub-regional breakdowns.
1. East and North-East Asia Level of optimism on whether adequate financing is in place to ensure effective implementation of the 2030 Agenda
What do you view as the most financially challenging SDG?
Has your country conducted a quantitative assessment of financing needs for SDGs?
30%
13%27%
23%
7%Neutral
Not confident
Positive
Somewhat confident
Very positive
ANNEX 2: STAKEHOLDER QUESTIONNAIRE
0 1 2 3
No and it is not planned
No but it is planned
Yes, and it covers all the SDGs
Yes, and it covers some of the SDGs

A GUIDEBOOK FOR ASSESSING SDG INVESTMENT NEEDS114
2. South-East Asia Level of optimism on whether adequate financing is in place to ensure effective implementation of the 2030 Agenda
What do you view as the most financially challenging SDG?
Has your country conducted a quantitative assessment of financing needs for SDGs?
0 5 10 15 20 25 30
SDG 17: Partnership for the Goals
SDG 15: Life on Land
SDG 16: Peace, Justice and Strong Institutions
SDG 11: Sustainable Cities and Communities
SDG 12: Responsible Consumption and Production
SDG 7: Affordable and Clean Energy
SDG 3: Good Health and Well-being
SDG 13: Climate Action
SDG 1: No Poverty
Cambodia (2) Indonesia (5)
Lao People's Democratic Republic (the) (7) Malaysia (3)
Myanmar (3) Philippines (the) (8)
Singapore (3) Thailand (5)
Viet Nam (5)
0 1 2 3 4 5 6 7 8
No and it is not planned
No but it is planned
Yes, and it covers all the SDGs
Yes, and it covers some of the SDGs
33%
22%
28%
17%Neutral
Not confident
Positive
Somewhat confident

A GUIDEBOOK FOR ASSESSING SDG INVESTMENT NEEDS 115
3. South and South-West Asia
Level of optimism on whether adequate financing is in place to ensure effective implementation of the 2030 Agenda
What do you view as the most financially challenging SDG?
Has your country conducted a quantitative assessment of financing needs for SDGs?
0 0.5 1 1.5 2 2.5 3 3.5 4 4.5
No and it is not planned
Yes, and it covers all the SDGs
No but it is planned
Yes, and it covers some of the SDGs
0 5 10 15 20 25 30
SDG 14: Life Below WaterSDG 17: Partnership for the Goals
SDG 15: Life on LandSDG 11: Sustainable Cities and Communities
SDG 12: Responsible Consumption and ProductionSDG 5: Gender Equality
SDG 16: Peace, Justice and Strong InstitutionsSDG 10: Reduced Inequalities
SDG 6: Clean Water and SanitationSDG 7: Affordable and Clean Energy
SDG 9: Industry, Innovation and InfrastructureSDG 8: Decent Work and Economic Growth
SDG 2: Zero HungerSDG 3: Good Health and Well-being
SDG 13: Climate ActionSDG 4: Quality Education
SDG 1: No Poverty
Afghanistan (2) Bangladesh (9) Bhutan (3) India (8) Maldives (1)
Nepal (6) Pakistan (8) Sri Lanka (5) Turkey (1)
19%
23%
29%
27%
2%
Neutral
Not confident
Positive
Somewhat confident
Very positive

A GUIDEBOOK FOR ASSESSING SDG INVESTMENT NEEDS116
4. North and Central Asia
Level of optimism on whether adequate financing is in place to ensure effective implementation of the 2030 Agenda
What do you view as the most financially challenging SDG?
Has your country conducted a quantitative assessment of financing needs for SDGs?
26%
5%
21%
37%
11%
Neutral
Not confident
Positive
Somewhat confident
Very positive
0 1 2 3 4 5 6 7 8 9
SDG 15: Life on Land
SDG 17: Partnership for the Goals
SDG 10: Reduced Inequalities
SDG 3: Good Health and Well-being
SDG 7: Affordable and Clean Energy
SDG 14: Life Below Water
SDG 2: Zero Hunger
SDG 8: Decent Work and Economic Growth
SDG 4: Quality Education
Armenia (6) Azerbaijan (6) Georgia (3) Kyrgyzstan (3) Uzbekistan (1)
0 1 2 3
No but it is planned
Yes, and it covers some of the SDGs

A GUIDEBOOK FOR ASSESSING SDG INVESTMENT NEEDS 117
5. Pacific
Level of optimism on whether adequate financing is in place to ensure effective implementation of the 2030 Agenda
What do you view as the most financially challenging SDG?
Has your country conducted a quantitative assessment of financing needs for SDGs?
23%
23%
23%
31%Neutral
Not confident
Positive
Somewhat confident
0 0.5 1 1.5 2 2.5 3 3.5
SDG 14: Life Below Water
SDG 6: Clean Water and Sanitation
SDG 8: Decent Work and Economic Growth
SDG 12: Responsible Consumption and…
SDG 16: Peace, Justice and Strong…
SDG 1: No Poverty
SDG 3: Good Health and Well-being
SDG 11: Sustainable Cities and Communities
SDG 13: Climate Action
Fiji (1) Australia (2) New Zealand (2)
0 0.5 1 1.5 2 2.5 3
No but it is planned
Yes, and it covers all the SDGs
No and it is not planned
Yes, and it covers some of the SDGs

A GUIDEBOOK FOR ASSESSING SDG INVESTMENT NEEDS118
On 14-15 November 2018, more than 40 experts from 26 organizations, including national think-tanks, regional organizations, UN agencies and IFIs par-ticipated in the expert group meeting “How much do ambitions cost? Investment needs for achiev-ing Sustainable Development Goals in Asia and the Pacific”, the theme of the forthcoming Economic and Social Survey of Asia and the Pacific 2019. The experts presented their own research as well as gave feedback on the preliminary findings shared by ESCAP.22
The EGM addressed SDG investment needs through three substantive sessions focused on social, infra-structure, and environmental dimensions respectively. Additionally, there was a session on synergies and economy-wide impacts, and another on subregional and country case studies.
Overall key messages:
1. Based on current trends, Asia Pacific is expected to achieve only few SDG targets by 2030. As coun-tries conduct Voluntary National Reviews and seek to accelerate progress, knowing the investment requirements can help better plan, budget and mobilize resources.
2. Preliminary results for the 2019 Survey suggest that from now to 2030, Asia Pacific would need to invest an additional $1-2 trillion per year in areas ranging from education, health and social protec-tion to infrastructure, climate action and environ-mental conservation.
3. The general methodology is to (i) establish baseline and alternative scenarios or targets, (ii) identify the interventions needed, and (iii) estimate the asso-ciated resource requirements. For SDGs without a clear target value, one could benchmark best-per-forming or higher-income peers.
4. However, countries may pursue different pathways to achieving SDG targets, depending on their read-iness to scale up investment (e.g. due to conflict or limited fiscal space) and preference (e.g. rapid expansion of coverage vs. more gradual but bet-ter-quality option).
5. As SDGs envision changes to consumption and production patterns, projections based on past trend may over-estimate demand, for instance, for traditional infrastructure. At the same time, unit costs depend on technology options, which are evolving rapidly (e.g. online education, renewables).
6. In assessing investment needs and their financial costs, it is important to keep things in perspective by also highlighting the benefits (returns) or the cost of inaction. This applies to social or environ-mental interventions as well as capital investment in infrastructure.
7. Accounting for synergies and co-benefits could help countries maximize the returns to their invest-ments, if not reduce overall financing needs. There are few simulation tools (e.g. iSDG) and integrated assessment models (e.g. in the IRP) which could illustrate complex feedback loops.
8. Rather than rigid planning, a multi-stakeholder approach to investment is needed. Governments must create markets for SDGs and attract private investment through well-functioning incentives and regulatory environment. A change in mindset and reallocation of capital could go in parallel.
9. Investment takes place in a specific policy
22 The EGM programme with links to presentations is available from www.unescap.org/events/expert-group-meeting-how-much-do-ambitions-cost-investment-needs-achieving-sustainable
ANNEX 3: EXPERT GROUP MEETING ON SDG COSTING

A GUIDEBOOK FOR ASSESSING SDG INVESTMENT NEEDS 119
environment and in the context of structural trans-formation. Misaligned or poor-quality investment would bring short-lived returns and higher debt, and prompt cutbacks. But effective investments could deliver high multiplier effects.
10. Countries could look at the overall financial resources available in the economy, and through tax reforms, public-private partnerships and other initiatives meet the investment needs. Enhanced development partnership can support least devel-oped countries which lack the resources.
11. Regional cooperation is critical for cross-border investments, including in infrastructure. Cross-sectoral initiatives such as co-deployment of fiber-optic cables along the Asian Highway could reduce financial costs. Knowledge sharing could help identify innovative, cost-effective solutions.
Investment needs in social dimensions
Key messages:
� Poverty reduction requires a multifaceted approach and investing in human capital through improved education, health and social protection will enhance development outcomes
� The conduct of a costing exercise in key areas of the SDGs is a useful and timely undertaking to assess targets and available resources needed to address challenges to economic and societal change.
� Fiscal and capacity constraints in many coun-tries in the region could impede investment in key development areas, however, governments can consider prioritizing investments. Prioritization can be guided through assessing cost-benefits and cost-effectiveness of investments that allows governments to see the returns on investments. When prioritizing investments, governments must be mindful of tradeoffs when sacrificing invest-ment in one area for another.
� In the face of fiscal or capacity constraints, more modest targets could also be explored, while external financing could be one option to fill in the financing gap, though this would imply addi-tional debt serving costs.
� Some key areas need to be addressed in improv-ing health outcomes include strengthening local community or primary healthcare units, decen-tralizing health services, and identifying health-care problems particularly those related to NCDs. Moreover, investment in raising awareness, pre-vention and improving environmental aspects can help reduce healthcare costs.
� In costing social outcomes, consideration should be given to the need for improved data to assist in setting country relevant targets and acknowledg-ing that different countries may have progressed at different paces, require different scale up needs and have different unit costs.
� While regional estimates may help to raise awareness, country level studies can improve understanding of the local context and improve identification and operationalizing of interventions.
� Enhancing effectiveness of social services should take into account improved coordination and implementation design to address different needs and accessibility.
� To emphasize the importance of investment in social development and human capital, social spending should be seen as “social investment”, and “households” should be viewed as a social institution.
� On the regional front, ESCAP has a vital role in disseminating information on resource needs, prioritization, and financing to available SDG focal units within countries to help drive the SDG achievement.
Investment needs in economic infrastructure
Key messages:
� SDGs have led to a change in the mindset of policymakers and development institutions in approaching infrastructure costs. Now instead of looking at meeting infrastructure demand, the thinking has changed towards meeting develop-ment goals. Also, there is greater acknowledge-ment of the central role infrastructure plays in achieving social and environmental goals.

A GUIDEBOOK FOR ASSESSING SDG INVESTMENT NEEDS120
� A bottom-down approach is best when trying to estimate infrastructure costs for the SDGs. This is because a top-down approach looks only at infrastructure demand, not at satisfying par-ticular goals. However, bottom-down approach is clearly more challenging because it is more data-intensive.
� Taking account of operational and maintenance costs is critical. It can account for up to one-third of costs of initial investment. Often such costs are considered as an afterthought.
� In the end, there are many approaches and tradeoffs involved in infrastructure cost calcula-tions, which will result in a range of estimates. But what is important is understanding the process of calculating such costs, with relation to the differ-ent calculation methods. Such an understanding will guide policymakers in making their infrastruc-ture investment decisions.
� Infrastructure investment should be undertaken carefully and with a realization that it can have a detrimental effect on some SDGs such as inequality (eg. Rural-urban divide) and poverty (eg. population displacement). It is also important to consider the impact of infrastructure invest-ment, as some investment can be unnecessary.
� The mix of private and public sector financing will depend on the type of infrastructure sector. Some sectors such as ICT are both financially and economically viable, then the private sector can take the lead. However, there are other proj-ects which are economically viable but not finan-cially viable such as Water and Sanitation in some cases, where the public sector will need to take the lead. Other sectors are inbetween and are thus appropriate for public-private partnerships (PPPs).
� Policies and regulations will also have an import-ant impact on private sector involvement. The private sector will only be more involved in infra-structure projects when infrastructure investment climate improves through better policies and regulations.
� Beyond extra public and private financing, improving public sector spending efficiency can greatly increase actual infrastructure investment.
It has been calculated that one-third of the poten-tial impact of investment is being lost due to inefficiency.
Investment needs in environmental dimension
Key messages:
� It is difficult to estimate the investment costs to achieve environment and ecosystem related SDGs, as they lack clear quantifiable targets, e.g. resources efficiency targets. Among the SDGs with clear targets, Asia Pacific region is progress-ing either slowly or backwards, e.g. carbon inten-sity and biodiversity. Some existing targets are not consistent with the timeframe of the 2030 Agenda, e.g. biodiversity. Therefore, the estimated investment costs will be robust but not reliable.
� Environment and ecosystem related SDGs are widely interlinked and linked with other SDGs.
� Urgent actions are required to combat climate and environmental risks. If actions are delayed, the related costs will be much higher.
� Power sector transition is key to achieve sus-tainable development goals, as the majority of investment goes in to the sector. A marked shift in capital allocation is needed for power sector and to improve energy efficiency.
� Governments have a big role to play to give clear policy messages and price signals to direct the markets to move towards low-carbon, resource efficient and ecosystem-friendly development. Local governments or communities need to be engaged.
� Policy makers could consider various policy instruments (e.g. regulatory incentives) and eco-nomic toolkits (e.g. carbon pricing) to mobilize financial resources. Reform of energy subsidies is important. Prices of renewable energy could be more competitive through market mechanisms.
However, not all countries can easily mobilize finance. For example, Pacific countries are constrained by their debt levels. Institutional investors such as pension funds could be potential financial source.

A GUIDEBOOK FOR ASSESSING SDG INVESTMENT NEEDS 121
Synergies, financing and economy-wide impacts
Key messages:
� Governments need to take synergies into account when implementing SDGs, given their limited financial resources. More targets could be achieved with the same amount of financial resources in an integrated way.
� Governments need to spend more time to get robust investment estimates, understand the difficulties in implementation, and assess policy choices for different sectors.
� Various modelling work has been undertaken globally to assess synergies and integrated investment needs, as well as economic-wide impacts:
o The iSDG Model is a systematic dynamic model. It models synergies and trade-offs among policies within or across sectors. The model provides investment costs as a share of GDP in a no policy change scenario and a SDG scenario. Policy makers can choose the policy mix to maximize positive synergies and min-imize trade-offs.
o The Development Financing Assessment (DFA) model is a reiterative model. It pro-vides an overview of the current financing arrangements, recognizes new financing needs and ways maximize the investment impacts to achieve SDGs, and suggests mechanisms to engage multi-stakehold-ers. However, the DFA model does not fully align with the SDGs.
o The IMF is developing a new model to assess fiscal space for sustainable public finance. Based on production functions, the model identifies main cost drivers from education, health, infrastructure, electric-ity, and water and sanitation sectors. By comparing with high investment perform-ers, the model assesses how much needs to be spent on SDGs if all countries were to follow the high performers.
o UNCTAD has revised the IMF’s Debt Sustainability Analysis (DSA) model to assess debt sustainability and public
expenditure composition based on an assumption of achieving SDGs.
o Another UNCTAD model has analysed private sector’s role to supplement public investment. The results suggest that pri-vate investment can focus on the invest-ment areas that public finance and official development assistance (ODA) do not cover (public finance and ODA usually cover the infrastructure sector).
� Although additional borrowing for developing countries might be difficult, the financing gap could be largely reduced if investment efficiency is improved. Improving investment efficiency should be a focus; however, policy discussion usually focuses on finding new resources.
National financial frameworks, and case studies from across Asia Pacific
Key messages:
� The progress towards the SDG has been uneven across and within different sub-regions, and in each sub-region there are priority areas where urgent and effective policy actions are required to reverse the regressing trend and accelerate progress.
� Many Asia-Pacific developing countries have taken actions to mainstream SDGs into their national development agenda, but only a few countries (e.g. Bangladesh, Nepal) have con-ducted needs assessments. This has some-what limited the scope for integrating SDGs into national budgets.
� To avoid inefficiency and enable spillovers on a national level, broad-based platforms among dif-ferent line ministries are necessary. For account-ability, one single institution needs to be assigned the leadership role in this process. There also needs to be a formal structure for interaction with non-state partners/stakeholders.
� An integrated financing strategy would consist of: local needs assessment; tangible measures of success; dynamic analysis of the financing landscape (e.g. upcoming LDC graduation, gen-eral macroeconomic risks); actions/ policies; and monitoring.

A GUIDEBOOK FOR ASSESSING SDG INVESTMENT NEEDS122
� Localizing SDG implementation in a bottom-up approach and further mainstreaming SDGs not only at the national level but also at the sub-na-tional level has been experimented with in Northeast Asia. However, how to effective coordi-nate the national and sub-national efforts remains a question.
� Expenditure expansion requires more prudence in spending efficiency and budget allocation. It was highlighted that the expenditure expan-sion on infrastructure has crowded-out essential social spending in some cases, and the short-term GDP boost of infrastructure investment may have also distorted political incentives in deci-sion making. Past lessons suggest that without efficiency in public expenditure and investment, the increased financing is unlikely to generate long-lasting benefits.
� To effectively engage the private sector in SDG financing, correct incentives need to be put in place. Despite the challenges, it is worth noticing that private sector participation, in the examples of PPPs, impact investment and green bonds, has been growing at an impressive rate. It would be essential for the public sector to optimize their strategies in engaging the private sector for SDG financing, by working with the private sector as true partners.

20-0
0588