Series of SDG Webinars for the Arab Region: ILO ... - ESCWA
47
1 Series of SDG Webinars for the Arab Region: ILO SDGs 1.3.1, 8.3.1, 8.5.1, 8.6.1, 8.7.1 and 8.8.1 Interagency and Experts Collaboration to Improve the Production and Dissemination of SDG Indicators from Official National Sources 26-27 October 2021 Report of the meeting
-
Upload
khangminh22 -
Category
Documents
-
view
1 -
download
0
Transcript of Series of SDG Webinars for the Arab Region: ILO ... - ESCWA

1
Series of SDG Webinars for the Arab Region:
ILO
SDGs 1.3.1, 8.3.1, 8.5.1, 8.6.1, 8.7.1 and 8.8.1
Interagency and Experts Collaboration to Improve the Production and
Dissemination of SDG Indicators from Official National Sources
26-27 October 2021
Report of the meeting

2
Contents
BACKGROUND ............................................................................................................................................... 3
OBJECTIVE- Why? .......................................................................................................................................... 4
TARGET AUDIENCE - WHO? .......................................................................................................................... 4
SCHEDULE AND LANGUAGE– PLATFORM? ................................................................................................... 4
OUTCOME- FINDINGS AND RECOMMENDATIONS ....................................................................................... 4
ATTENDANCE AND EVALUATION ................................................................................................................ 16
TRAINING CERTIFICATION ........................................................................................................................... 17
GROUP PHOTOS .......................................................................................................................................... 17
LIST OF ANNEXES ........................................................................................................................................ 18
Annex 1: AGENDA ................................................................................................................................... 19
Annex 2: LIST OF ORGANIZERS & PARTICIPANTS .................................................................................... 19
Annex 3: RESOURCES .............................................................................................................................. 25
Annex 4: Q & A ....................................................................................................................................... 26
Annex 5: METADATA ............................................................................................................................... 29

3
BACKGROUND
The need to improve the production and dissemination of reliable comparable and timely data on SDG
In September 2015, the United Nations General Assembly adopted by consensus Resolution 70/1:
Transforming our world: the 2030 Agenda for Sustainable Development (the 2030 Agenda). The
Resolution reaffirms the need for the strengthening of national data systems through “collaboration
between national statistical systems and the relevant international and regional organizations to enhance
data reporting channels and ensure the harmonization and consistency of data and statistics for the
indicators used to follow up and review the Sustainable Development Goals and targets”.
The resolution also urges countries, the specialized agencies, the regional commissions, and the Bretton
Woods institutions among others “to intensify their support for strengthening data collection and
statistical capacity-building, including capacity-building that strengthens coordination among national
statistical offices”. Moreover, the resolution “Urges international organizations to base the global review
on data produced by national statistical systems and, if specific country data are not available for reliable
estimation, to consult with concerned countries to produce and validate modelled estimates before
publication, urges that communication and coordination among international organizations be enhanced
in order to avoid duplicate reports, ensure consistency of data and reduce response burdens on countries,
and urges international organizations to provide the methodologies used to harmonize country data for
international comparability and produce estimates through transparent mechanisms;”
Five years after the adoption of the 2030 Agenda several countries are facing considerable challenges in
monitoring targets in many policy areas. The current COVID-19 pandemic highlights the value of
measuring and monitoring: no strategy can be developed, and no measure can be implemented without
a proper monitoring and evaluation system.
Many countries in the Arab region are reporting on SDG indicators, however, reporting on progress on
many of the SDG indicators, remains limited in the region. Insufficient availability and quality of statistical
information on SDG indicators hamper the capacity of policymakers to generate evidence-based and
effective policy responses and implement the 2030 Agenda.
Translating these recommendations and resolutions into tangible results is imperative and will require
intensive collaboration at the national, regional and global levels. Regional Commissions’ Statistical bodies
“are the nexus between the Statistical Commission at the global level and the implementation at the
national level of the norms endorsed by the Commission. In the context of the 2030 Agenda, the support
provided by the regional commissions to assist Member States in adapting, implementing and measuring
progress towards the implementation of national development plans is of particular significance as it
influences the quality of statistics and methodologies used, as well as the use of new and innovative
methodologies and sources of data, known as the transformative agenda for official statistics. The regional
commissions carry out activities to strengthen the capacity of Member States to produce, use and

4
dissemination official statistics and also provide a regional platform for sharing experiences and practices
in statistics work1.”
Interagency and Experts Collaboration- ESCWA & ILO
In this context, the Economic and Social Commission for Western Asia (ESCWA) implemented an
assessment on availability of country data in the UNSD SDG Global database to identify those less reported
by countries and/or less understood by national statistical offices (NSOs), and more estimated by UN
Agencies or not reported on. Based on the assessment results, ESCWA in collaboration with relevant
custodian agencies will organize virtual capacity development workshops on selected indicators for Arab
countries to improve the production and dissemination of SDG indicators from official national source.
ESCWA and ILO discussed the organization of a joint webinar to build capacities of Arab countries to
produce and use data for four SDG indicators.
OBJECTIVE- Why?
ESCWA, in collaboration with ILO, organized a series of webinars on selected SDG indicators to support a
common understanding among data producers on how to collect, measure and disseminate SDG
indicators to increase data production and enhance national data flow to policy makers, other users and
custodian agencies.
The main objectives of the regional training are:
• Enhancing understanding of metadata and nature of data in the UNSD SDG database.
• Improving statistical capacities to stimulate production and use of comparable SDG indicators.
• Strengthening inter-institutional coordination to stimulate production of SDG indicators and data
flow.
• Sharing and discussing country challenges in measuring SDG indicators
TARGET AUDIENCE - WHO?
The meeting was attended by 76 representatives from 22 countries namely: Algeria, Bahrain, Egypt, Iraq,
Jordan, Kuwait, Lebanon, Libya, Mauritania, Morocco, State of Palestine, Qatar, Saudi Arabia, Somalia,
Sudan, Tunisia, United Arab Emirates and Yemen and one representative from OHCHR.
SCHEDULE AND LANGUAGE– PLATFORM?
The regional training was held on Zoom from 26 to 27 October from 10:00 A.M. to 12:30 P.M. Beirut
time respectively. (see Agenda).
OUTCOME- FINDINGS AND RECOMMENDATIONS
The participants from NSOs and other relevant stakeholders were familiarized with concepts, methods
including data flow and dissemination channels. The webinar encouraged interactive dialogue and
1 Source: Relevance and effectiveness of the statistical work of regional commissions - thematic evaluation of regional
commissions, Committee for Programme and Coordination, 57th session, April 2017 (E/AC.51/2017/8)
5
participants were invited to share national experiences in data collection and dissemination including
challenges and concerns. Presentations to the meetings were made available in the Arabic and English
languages. A record of the discussions is provided in Annex on Q&A of this report. The full webinar
proceedings were recorded to develop training material.
Interagency and Experts Collaboration- ESCWA & ILO
In this context, ESCWA implemented an assessment of data disseminated through the UNSD SDG Global
database and those in national SDG official sources to identify those less produced, disseminated, or less
understood by NSOs, and are more available in UN Agencies’ and UNSD databases.
Based on the assessment results, ESCWA in collaboration with ILO discussed the organization of a joint
webinar to build capacities of Arab countries to produce and disseminate selected SDG indicators.
1.3.1 Proportion of population covered by social protection floors/systems, by sex, distinguishing children,
unemployed persons, older persons, persons with disabilities, pregnant women, newborns, work-injury
victims and the poor and the vulnerable
Access to at least a basic level of social protection throughout the life cycle is a human right. The principle
of universality of social protection evidences the importance of social protection systems in guaranteeing
decent living conditions to the whole population, throughout their lives. SDG 1.3.1, the proportion of the
population covered by social protection systems/floors provides an indication of the extent to which
universality is accomplished, and thus, how secure are the population's living conditions. Measurements
of effective coverage should reflect how in reality legal provisions are implemented and inform
policymakers about relevant options to fill the gaps. It refers to the percentage of people actually receiving
benefits of contributory and non-contributory social protection programmes, plus the number of persons
actively contributing to social insurance schemes.
For the purpose of monitoring the social security coverage, SDG 1.3.1 is composed of nine components.
Each country may prioritize some of these components depending on the following:
• Total population covered by social protection systems/floors
• Share of children/households receiving social protection benefits
• Share of women giving birth receiving maternity benefits
• Share of older persons receiving old-age pensions
• Share of persons with disabilities receiving benefits
• Share of the unemployed receiving unemployment benefits
• Share of people employed by employment injury schemes
• Share of the poor covered by social protection systems
• Share of the vulnerable covered by social protection systems
The resolution concerning the development of social security statistics covering all these 9 components,
provides guidelines and definition about the main types of data to be collected i.e. participants,

6
beneficiaries, benefits levels, expenditure and income. It defines as well the steps for mapping the social
protection system:
- Step 1: Inventory of existing programmes/schemes and define/characterise each of them
- Step 2: For each scheme/programme: identification of benefits provided
Measuring social protection coverage should follow the following set of principles:
Principle 1: on coverage indicators by contingency or social security function: each risk should be
measured separately for the population.
Principle 2: the coverage by social security schemes against specific social risks and contingencies can be
done either by potential coverage measured by the number of persons protected if a given contingency
occurs or by actual coverage for the population receiving benefits at a certain point of time.
Principle 3 on double counting of beneficiaries relevant in the case of administrative data.
National data for this indicator are collected through:
1) Social Security Inquiry (SSI) sent in April every year to be filled by the focal point from the
institutions administering social security schemes/programmes such as the Ministries of Labour,
Ministries of Health, Ministries of Social Welfare, Ministries of Finance and Planning or the NSOs
2) Household Surveys to cover the population that are not covered by social protection schemes and
avoid double counting
In addition to the above-mentioned sources, ILO uses external and internal sources of data. This data will
then be disseminated after being validated with the relevant national institutions in the UNSD SDG
Database in February and stored in ILO’s internal database, World Social Protection Database.
7
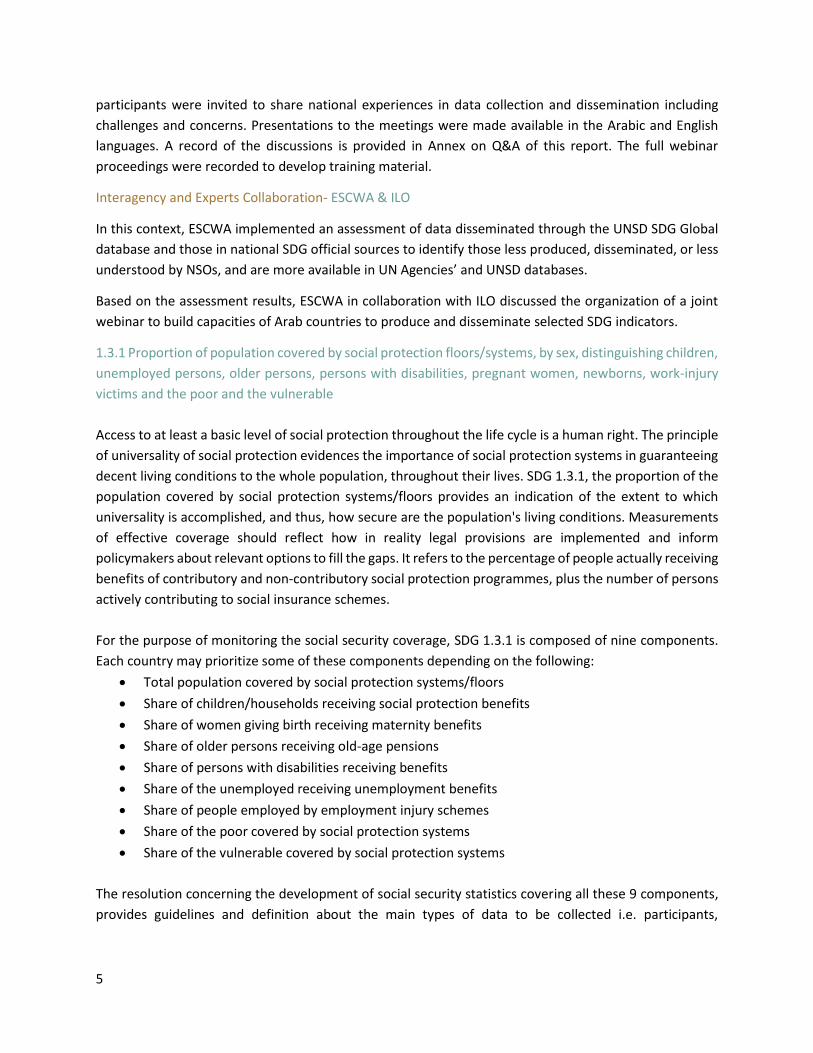
46.9 percent of the global population are effectively covered by at least one social protection benefit and
40 percent are covered in the Arab States as defined by ILO. Quantity of compiled indicators has
considerably increased to 90 percent in 2020 in the region.
13 Arab countries are reporting on this indicator and the ILO estimates data for cash benefits only for 20
countries based on information collected directly from national governments. Iraq has disseminated
national data that are discrepant from the country data disseminated in the UNSD SDG Database.
Indicators UNSD database
(C-CA)
UNSD database
(E-M-N-NA-G)
SDG in national
report
1.3.1 Proportion of population covered by
social protection floors/systems, by sex,
distinguishing children, unemployed persons,
older persons, persons with disabilities,
pregnant women, newborns, work-injury
victims and the poor and the vulnerable
13 (CA): Comoros, Djibouti, Egypt,
Iraq, Jordan, Lebanon, Mauritania,
Morocco, Palestine, Sudan, Syrian
Arab Republic, Tunisia, Yemen
20 (E) Lebanon, Libya,
Qatar, Bahrain,
Somalia
≠ Iraq
C: country data, CA: country adjusted data, E: estimated data, G: global monitoring data, M: modeled data, N: non-relevant data, NA: data
nature not available. = : National data same as Country data, ≈: National data nearly same as Country data, ≠: National data is not equal to
Country data. * ILO estimates based on information collected directly from national governments.
Recommendations for Countries:
- Countries to ensure close coordination between social security institutions and the NSOs to have
complete set of data.
- Countries are encouraged to include the questions related to this indicator (As shown in the
annex) in any on-going household survey to provide information on the population that have not
been covered
- Countries are encouraged to refer back to ILO regarding methodology of data collection and
computation
- Countries are encouraged to provide disaggregated data for the components of the indicator.
- Countries to nominate one focal point responsible for the overall monitoring and reporting on
this indicator.
- Countries to use the already reported data to UNSD SDG Database for monitoring and
disseminating at the national level and in their VNR and SDG reports.
Recommendations for ILO/ESCWA:
- ILO to provide additional capacity development workshops on the methodology of data collection
and computation.
- ESCWA to follow up with countries to nominate the experts in the field on this indicator.

8
8.3.1 Proportion of informal employment in total employment, by sector and sex
The indicator presents the share of employment which is classified as informal employment in the total
economy, and separately in agriculture and in non-agriculture sectors to inform policymakers seeking to
improve labour market access and working conditions. Informal employment includes all workers in the
informal sector and all workers holding informal jobs in the formal sector i.e. own-account workers,
employers and members of producers’ cooperatives in the informal sector, own account workers
producing for own final use, all contributing family workers in the formal and informal sector and
employees with informal jobs (if their employment relationship is, in law or in practice, not subject to
national labour legislation, income taxation, social protection or entitlement to certain employment
benefits (advance notice of dismissal, severance pay, paid annual or sick leave, etc.))
For the purpose of classifying persons into formal or informal employment for this indicator, only the
characteristics of the main job are considered. An enterprise belongs to the informal sector if it fulfils the
three following conditions:
- It is an unincorporated enterprise (it is not constituted as a legal entity separate from its owners,
and it is owned and controlled by one or more members of one or more households, and it is not
a quasicorporation: it does not have a complete set of accounts, including balance sheets)
- The enterprise size in term of employment is below a certain threshold determined by the
country. For international reporting, it is defined as less than 5 employees.
- The enterprise is not registered. This is the recommended condition by ILO to consider the
enterprise as part of the informal sector.
As per the conceptual framework for informality, the grid below defines:
- Informal employment as the sum of cells 1 to 6 and 8 to 10
- Employment in the informal sector as the sum of cells 3 to 8
- Informal employment outside the informal sector as the sum of cells 1, 2, 9 and 10

9
New standards are under way.
The preferred source of data for this indicator is a labour force survey, with sufficient questions to
determine the informal nature of jobs and whether the establishment where the person works in belongs
to the formal or the informal sector.
This indicator has been reported by nine Arab countries to ILO. Lebanon used the same data in their
VNR/SDG report. Yemen and the State of Palestine, however, reported different data in their VNR/SDG
report than those reported to ILO because ILO uses a standardized approach and uses only microdata to
publish these figures and then send them to UNSD.
Indicators UNSD database
(C-CA)
UNSD database
(E-M-N-NA-G)
SDG in national report
8.3.1 Proportion of informal employment in
non-agriculture employment, by sex
9 (C): Comoros, Djibouti,
Egypt, Jordan, Lebanon,
Mauritania, State of
Palestine, Sudan, Yemen
0 Algeria, Egypt, Qatar, Morocco,
Comoros, Tunisia
≈ Lebanon
≠ Yemen, State of Palestine
C: country data, CA: country adjusted data, E: estimated data, G: global monitoring data, M: modeled data, N: non-relevant data, NA: data nature
not available. = : National data same as Country data, ≈: National data nearly same as Country data, ≠: National data is not equal to Country data.
Recommendations for Countries:
- Countries are encouraged to collect data and report data to ILO.
- Countries to use the already reported data to UNSD SDG Database for monitoring and
disseminating at the national level and in their VNR and SDG reports.
- Countries to request additional training for the methodology of this indicator, if needed.
Recommendations for ILO/ESCWA:
- ILO to assess the national data collected by Algeria, Qatar and Tunisia.
8.5.1 Average hourly earnings of employees, by sex, age, occupation and persons with disabilities
The indicator provides information on the arithmetic average of the hourly earnings from paid
employment of employees by sex, occupation, age and disability status. Earnings are a key factor of quality
of employment and living conditions giving an indication of the workers’ purchasing power.
For the purpose of this indicator, earnings refer to the gross remuneration in cash or in kind paid to
employees in local currency, as a rule at regular intervals, for time worked or work done together with
remuneration for time not worked, such as annual vacation, other type of paid leave or holidays. Earnings
exclude employers’ contributions in respect of their employees paid to social security and pension

10
schemes and also the benefits received by employees under these schemes. Earnings also exclude
severance and termination pay. For international comparability purposes, statistics of earnings used
relate to the total before any deductions are made by the employer in respect of taxes, contributions of
employees to social security and pension schemes, life insurance premiums, union dues and other
obligations of employees.
SDG indicator 8.5.1 provides information as well on the gender pay gap. Both are calculated as follows:
Main data sources are Labour Force Survey and Establishment Survey. The variety of possible sources
represents a challenge such as the comparability due to the differences in methods used, operational
criteria used, definitions, reference periods, coverage, as well as accuracy.
This indicator has been reported by two Arab countries to ILO. Jordan used data for different years in their
VNR/SDG report.
Indicators UNSD database
(C-CA)
UNSD database
(E-M-N-NA-G)
SDG in national
report
8.5.1 Average hourly earnings of female and male employees, by
occupation, age and persons with disabilities
2 (C): Jordan,
Lebanon
0 Egypt, Jordan,
Qatar, Saudi
Arabia, State of
Palestine
C: country data, CA: country adjusted data, E: estimated data, G: global monitoring data, M: modeled data, N: non-relevant data, NA: data nature
not available
Recommendations for Countries:
- Countries are encouraged to report on this indicator to the ILO.
- Countries are encouraged to consult ILO on the calculation of this indicator especially the ones
with data not being reported to ILO.
Recommendations for ILO/ESCWA:
- ILO to provide capacity building on the calculation of this indicator

11
8.6.1 Proportion of youth (aged 15–24 years) not in education, employment or training (Youth NEET Rate)
The Youth NEET rate conveys the proportion of youth (aged 15-24 years) not in education, employment
or training. It is used as a measure of youth labour underutilization and to informs policymakers on the
youth not gaining professional experience in employment and not furthering their skills in education, thus
at risk of labour market and social exclusion.
The rationale of this indicator is based on four concepts:
- Youth is defined as all persons between the ages of 15 and 24
- Education is defined as organized and sustained communication designed to bring about learning
including formal and non-formal education but excluding informal education
- Training is defined as non-academic learning activity to acquire specific skills intended for
vocational or technical jobs
- Employment is defined as all persons of working age who, during a short reference period (one
week), were engaged in any activity to produce goods or provide services for pay or profit.
The youth NEET Rate is calculated as follows:
A high NEET rate may suggest engagement in household chores, care activities and/or strong institutional
barriers to access employment.
Labour force survey or any other household survey with integrated module on employment are the
preferred data sources for this indicator. It is strongly advisable that the data should be at least
disaggregated by sex. It is recommended that the data is disaggregated by age groups (15-19) and (20-24)
as well as disability, migratory status and geographic location.
This indicator has been reported by 13 Arab countries to ILO. Egypt, Iraq, Sudan, State of Palestine and
Yemen used the same data in their VNR/SDG report. Algeria and Lebanon, however, reported different
data in their VNR/SDG report than those reported to ILO.
Indicators UNSD database
(C-CA)
UNSD
database
(E-M-N-NA-G)
SDG in national report
8.6.1 Proportion of youth (aged 15-24
years) not in education, employment or
training
13 (C): Algeria, Comoros, Egypt,
Iraq, Jordan, Lebanon,
Mauritania, Qatar, Saudi Arabia,
0 ≠ Algeria, Lebanon
= Egypt, Iraq,

12
State of Palestine, Sudan, Tunisia,
Yemen
Sudan, Yemen, State of Palestine
Oman, Qatar, Morocco, Jordan
C: country data, CA: country adjusted data, E: estimated data, G: global monitoring data, M: modeled data, N: non-relevant data, NA: data nature
not available. = : National data same as Country data, ≈: National data nearly same as Country data, ≠: National data is not equal to Country data.
Recommendations for Countries:
- Countries to use the already reported data to UNSD SDG Database for monitoring and
disseminating at the national level and in their VNR and SDG reports.
- Countries are encouraged to consult ILO on the calculation of this indicator especially the ones
with data not being reported to ILO.
Recommendations for ILO/ESCWA:
- ILO to provide capacity building on the calculation of this indicator
8.7.1 Proportion and number of children aged 5–17 years engaged in child labour, by sex and age
Three principal international legal instruments – ILO Convention No. 138 (Minimum Age) (C138), United
Nations Convention on the Rights of the Child (CRC), ILO Convention No. 182 (Worst Forms) (C182)
together set the legal boundaries for child labour and provide the legal basis for national and international
actions against it. In accordance to these instruments, child labour refers to work for which children are
either too young or that may be physically or psychologically injurious to their health and well-being.
The resolutions adopted at the 18th International Conference of Labour Statisticians (ICLS)2 provides the
basis for translating the legal standards governing the concept of child labour into statistical terms for the
purpose of child labour measurement as follows:
2 18th International Conference of Labour Statisticians Geneva, 24 November - 5 December 2008

13
The ICLS Resolution extends the frame of reference of this indicator to include not only economic activity
but as well unpaid household services, that is, the production of domestic and personal services by a
household member for consumption within their own household, commonly called “household chores”.
The definition of child labour is also in line with the standard set by the latest 20th International Conference
of Labour Statisticians. Resolution to amend the 18th ICLS Resolution concerning statistics of child labour
(ILO. Geneva, October 2019). And therefore, SDG indicator 8.7.1 is composed into two sub-indicators for
the purpose of SDG reporting:
- Sub-indicator 1: Proportion and number of children aged 5-17 years engaged in economic
activities at or above age-specific hourly thresholds:
• Child labour for the 5 to 11 age range: children working at least 1 hour per week in
economic activity
• Child labour for the 12 to 14 age range: children working for at least 14 hours per week in
economic activity
• Child labour for the 15 to 17 age range: children working for more than 43 hours per week
in economic activity.
- Sub-indicator 2: Proportion and number of children aged 5-17 years engaged in economic
activities and household chores at or above age-specific hourly thresholds:
• Child labour for the 5 to 11 age range: children working at least 1 hour per week in
economic activity and/or involved in unpaid household services for more than 21 hours
per week
• Child labour for the 12 to 14 age range: children working for at least 14 hours per week
in economic activity and/or involved in unpaid household services for more than 21 hours
per week

14
• Child labour for the 15 to 17 age range: children working for more than 43 hours per
week in economic activity
The overall indicator is calculated as number of children in child labour divided by total number of children
in population, multiplied by 100.
Main data sources include household surveys such as National Child Labour Surveys, National Labour
Force Surveys, National Multipurpose Household Surveys, MICS, DHS, SIMPOC and LSMS. Data collection
is based on a consultative process which solicits feedback directly from National Statistical Offices, as well
as other government agencies responsible for official statistics.
Data in the region for this indicator is available for nine countries. Five out of these nine countries are
disseminating country data in national VNR/SDG dashboards that are discrepant from country adjusted
data reported to ILO and UNICEF as shown below.
Indicators UNSD database
(C-CA)
UNSD database
(E-M-N-NA-G)
SDG in national
report
8.7.1 Proportion and number of children aged 5-17 years
engaged in child labour, by sex and age
9 (CA): Algeria,
Comoros, Egypt,
Iraq, Jordan,
Mauritania, State
of Palestine,
Sudan, Tunisia
0 Lebanon, Libya,
Qatar, Somalia,
Yemen, State of
Palestine, Morocco
≠ Algeria, Egypt,
Iraq, Jordan, Sudan
C: country data, CA: country adjusted data, E: estimated data, G: global monitoring data, M: modeled data, N: non-relevant data, NA: data nature
not available. . = : National data same as Country data, ≈: National data nearly same as Country data, ≠: National data is not equal to Country
data.
Recommendations for Countries:
- Countries to review the method of computation before disseminating the data
- Countries are encouraged to include the set of questions related to this indicator in any of the
ongoing household survey mentioned above and report on this indicator.
- Countries to use the already reported data to UNSD SDG Database for monitoring and
disseminating at the national level and in their VNR and SDG reports.
Recommendations for ILO/ESCWA:
- ILO to review method of computation for those countries reporting: Lebanon, Libya, Morocco,
Qatar, Somalia, State of Palestine and Yemen

15
8.8.1 Fatal and non-fatal occupational injuries per 100,000 workers, by sex and migrant status
This indicator measures the likelihood or risk of having a fatal or a non-fatal occupational injury for each
worker in the reference group. It is essential for planning preventive measures and providing information
on the progress or deterioration in occupational safety and health, revealing the effectiveness of
prevention measures and the eventual need for further regulation.
SDG indicator 8.8.1 is built on various concepts and terms derived from the 16th International Conference
for Labour Statisticians:
- Occupational accident: an unexpected and unplanned occurrence, including acts of violence,
arising out of or in connection with work which results in one or more workers incurring a personal
injury, disease or death
- Occupational injury: Any personal injury, disease or death resulting from an occupational
accident. An occupational injury is different from an occupational disease, which comes as a result
of an exposure over a period of time to risk factors linked to the work activity.
For the computation of this indicator, the frequency rates of fatal and non-fatal occupational injuries will
be calculated separately:
Although the indicator title of SDG global framework indicator 8.8.1 calls for the compilation of frequency
rates, national practices point towards a more widespread use of incidence rates:
The indicators require disaggregation by sex and migrant status and also it is recommended to
disaggregate it by economic activity, occupation and region, if possible.
Sources for occupational injuries are administrative records such as a corresponding national system for
notification such as labour inspectorate records; or compensation such as insurance records, Ministry of
Labour. Other possible data sources can also include household surveys and establishment surveys. The
fact that data on fatal and non-fatal occupational injuries are likely to be derived from different sources,
can hinder international comparison.
This indicator has been reported by seven Arab countries to ILO. Bahrain, Egypt and Qatar disseminated
data for different years in their VNR/SDG report.

16
Indicators UNSD database
(C-CA)
UNSD database
(E-M-N-NA-G)
SDG in national
report
8.8.1 Frequency rates of fatal and non-fatal occupational injuries,
by sex and migrant status
7 (C): Algeria,
Bahrain, Egypt,
Jordan, Qatar,
State of Palestine,
Tunisia
0 Bahrain, Egypt,
Iraq, Qatar, Saudi
Arabia
C: country data, CA: country adjusted data, E: estimated data, G: global monitoring data, M: modeled data, N: non-relevant data, NA: data nature
not available
Recommendations for Countries:
- Countries to identify focal points from the Ministry of Labour or NSOs providing data on this
indicator.
- Countries are encouraged to collect data on this indicator by ensuring collaboration between the
different stakeholders.
- Countries are encouraged to include the questions related to this indicator in a household survey
to cover informal sector enterprises and the self-employed.
- Countries to use the already reported data to UNSD SDG Database for monitoring and
disseminating at the national level and in their VNR and SDG reports.
Recommendations for ILO/ESCWA:
- ILO to connect with Ministries of Labour and NSOs covering the variety of data sources to ensure
international comparability of data.
- ESCWA to follow up with countries to nominate the experts in the field on this indicator.
ATTENDANCE AND EVALUATION
An electronic evaluation was completed during the 2 days webinar. The results were as follows:
An electronic evaluation was completed by 19 participants during the webinar. The results were as
follows:
• 58 per cent of respondents rated the overall quality of the webinar as “Excellent” and 37 per
cent as “Good” and 5 per cent as “fair”
• 53 per cent indicated that the webinar was successful in reaching its intended objectives as
“Excellent”, 47 per cent as “good”.
• 63 per cent rated the inputs provided by presenters in reaching the intended outcome of the
webinar as “Excellent”, 37 per cent as “Good”.
• 79 per cent rated the overall organization and logistics of the webinar as “Excellent” and 21 per
cent assessed it as “Good”.

17
TRAINING CERTIFICATION
Participants who successfully attended the ESCWA SDG webinar were awarded a training certificate by
the organizers.
GROUP PHOTOS

18
LIST OF ANNEXES
Annex 1: AGENDA
Annex 2: LIST OF ORGANIZERS & PARTICIPANTS
Annex 3: RESOURCES
Annex 4: Q & A
Annex 5: METADATA

19
Annex 1: AGENDA
Day 1: 26 October Speakers
10:00 A.M. – 10:15 A.M.
Introduction to the Webinar (objective, speakers, and content)
ESCWA – Neda Jafar
10:15 A.M. – 11:45 A.M.
1.3.1 Proportion of population covered by social protection floors/systems, by sex, distinguishing children, unemployed persons, older persons, persons with disabilities, pregnant women, newborns, work-injury victims and the poor and the vulnerable
ILO – Valeriia Nesterenko
Discussion – Q&A
11:45 A.M. – 12:30 P.M.
8.3.1 Proportion of informal employment in non-agriculture employment, by sex
ILO – Yves Perardel
Discussion – Q&A
Day 2: 27 October
10:00 A.M. – 10:30 A.M.
8.5.1 Average hourly earnings of female and male employees, by occupation, age and persons with disabilities
ILO – Marie-Claire Sodergren
Discussion – Q&A
10:30 A.M. – 11:00 A.M.
8.6.1 Proportion of youth (aged 15-24 years) not in education, employment or training
ILO – Yves Perardel
Discussion – Q&A
11:00 A.M. – 11:30 A.M.
8.7.1 Proportion and number of children aged 5-17 years engaged in child labour, by sex and age
ILO – Lorenzo Guarcello
Discussion – Q&A
11:30 A.M. – 12:15 P.M.
8.8.1 Frequency rates of fatal and non-fatal occupational injuries, by sex and migrant status
ILO - Marie-Claire Sodergren
Discussion – Q&A
12:15 P.M. – 12:30 P.M.
Way Forward and Conclusion ESCWA – Neda Jafar ILO - Hakki Ozel & Grace Eid
Annex 2: LIST OF ORGANIZERS & PARTICIPANTS
LIST OF ORGANIZERS
ESCWA ILO
Neda Jafar Head, Statistical Policies and Coordination Unit Statistics and Information Technology Cluster UN House, Beirut, Lebanon [email protected] T. +961 1 978 344
Marie-Claire Sodergren Senior Statistician ILO Department of Statistics [email protected] Yves Perardel Senior Statistician

20
Joelle Atallah Statistics assistant [email protected] T.+961 1 978 731
ILO Department of Statistics [email protected] Valeria Nesterenko Data Officer on Social Protection [email protected] Lorenzo Guarcello Project Manager Fundamentals Department [email protected] Hakki Ozel Regional Statistical Consultant ILO Regional Office for Arab States [email protected] Grace Eid National Project Officer ILO Regional Office for Arab States [email protected]

21
LIST OF PARTICIPANTS
Country Name Job Title Organization Email Phone
Algeria Abderrahmane Ikene
Responsable du pole incubation
ACSE [email protected] '+213782352115
Algeria Djamel Rahim Conseiller au près de la ministre de la solidarité
Ministère de la solidarité de la famille et la condition de la femme
[email protected] 00213 5
56621055
Algeria Hafida Chelabi Chargée de programme statistique
ONS [email protected] 667471039
Algeria Hamza Doghmani ingénieur en statistiques Office national des statistiques [email protected] '+213770507630
Algeria Lina Bounab cadre à l'agence de developpement social algerie
agence de developpement social
[email protected] 213552726836
Algeria Nabila Mdj Fonctionnaire Publique [email protected] 793172776
Algeria Nawel Bounedjoum
sous directrice ministère de la solidarité nationale de la famille
[email protected] 550965988
Algeria O.Regueb
Sous Directrice des Conventions internationales de sécurité sociale
ministère du travail de l'emploi et de la sécurité sociale
[email protected] 552556366
Algeria R.A ALGÉRIE Chef de services ADS [email protected] 213541688750
Algeria Rouane Chef de services ADS [email protected] 213541688750
Algeria Samira Bahloul INGENIEUR D'ETAT EN STATISTIQUE
ONS [email protected] 552435232
Bahrain Amina Alaqal Chief of labour statistics Information & eGovernment Authority
[email protected] '+97366303160
Bahrain Fatema Salem Statistician Information & eGovernment Authority
[email protected] '+97317878237
Egypt Nora Abd El-khalek Mohamed
Statistician Egypt Capmas [email protected] 1011440317

22
Egypt Paul Hector Advisor for Communication & infromation
UNESCO [email protected] '+201007961274
Egypt Waleed Mohammed
statistcian CAPMAS [email protected] 1159070742
Iraq Alyaa Ismail Director of operational policies department
Mop [email protected] 7703489928
Iraq Safaa Lazim Coordination Officer UN RCO/DSO [email protected] 99647901719177
Jordan Alaa Abu Jamal head of GIS Department of statistcs [email protected] 962777883316
Jordan Ayman Elholoul System engineer DOS [email protected] 799730280
Jordan Dema Arabyat Economic Empowerment Programs Coordinator
The Jordanian national commission for women
[email protected] 962772157984
Jordan Hussam Abu Shukor
Head of electronic dissemination
DOS [email protected] '+96265300700
Jordan Jwan ALQudah GIS Engineer Department Of Statistic [email protected] 799445345
Jordan Manal Sweidan Program analyst/ Gender Statistics
UN Women [email protected] 962797194154
Jordan Maram AL_malkawi
technical gis DOS [email protected] 9620776971880
Jordan Nehaya Obeidat Labour force department of statistics [email protected] 799054873
Jordan Suhad Haddad Specialize GIS Department of statistics [email protected] 962799717915
Jordan Tamam Yassin Eng. Statistical DOS/ SDU [email protected] 962796963931
Kuwait Shohreh Mirzaei Data Management Officer United Nations [email protected] 8105
Lebanon Haifa Husseini Economist Central administration of statistics
[email protected] 3200239
Lebanon Maria Geagea Program Coordinator National Commission for Lebanese Women
[email protected] '+96171767475
Lebanon Marie Noelle Esta Project Coordinator National Commission for Lebanese Women
[email protected] '+9613740021
Lebanon Ola Sidani SDGs expert PCM [email protected] '+9613981797
Lebanon Zeina Maalouf Gender Mainstreaming Training &Reporting Coordinator
National Commission for Lebanese Women
[email protected] '+9613399462

23
Lebanon OLA SIDANI SDGs expert PCM [email protected] 3981797
Libya Faraj Almuhaleb computer engineer Bureau of Statistics and Census Libya
[email protected] 218914724546
Mauritania Nah Cheikh Demographer reasercher ANSADE [email protected] 22241748179
Morocco Bouchra Msallak Ingénieure statisticienne Hcp [email protected] 655543322
Morocco Assia Nijari Staisticienne HCP [email protected] 2126116902
Morocco Meryem Bhija chef de service femme et enfant
HCP [email protected] 06 73 70 32 83
Morocco Najwa Mouhmal cadre à la division de la coopération internationale
Ministère de solidarité de l’intégration sociale et de la famille
[email protected] 212 650787738
Morocco Noureddine Ibnoussina
chef de service des activités socio-éduactives
HCP [email protected] 212660102145
Palestine Rasha Masoud Statisian PCBS [email protected] 972597638661
Qatar Aisha Al Mansoori First Statistics Specialist Planning and Statistics Authority
[email protected] '+974 4958363
Qatar Khaled Alshatarat environment expert Planning and Statistics Authority
[email protected] '+97444958491
Qatar Khulood AlGanehi GIS Planning and Statistics Authority
[email protected] 55554796
Qatar Monica Suppo Researcher Planning and Statistics Authority
[email protected] 97466867222
Qatar Roba Qougazeh technical assistant Planning and Statistics Authority
[email protected] 55290231
Qatar Shaikha Salem head section of envi. Planning and Statistics Authority
[email protected] 44958364
Qatar Joveriya Tahir Technical assistant and researcher
PSA [email protected] 33051886
Saudi Arabia Abdulrahman Ramadan
Statistical researcher GASTAT [email protected] 966500022985
Saudi Arabia Aljoharh Aldayel Statistics specialist General Authority for Statistics [email protected] '+966506690753
Saudi Arabia Almudaifer LCS GASTAT [email protected] 966555537393
Saudi Arabia Ashwaq Alsarieei Statistical researcher GASTAT [email protected] 966507048090

24
Saudi Arabia Maimoonah Khalil Director National Observatory for Women
[email protected] 555546620
Saudi Arabia Manar Ibrahem Data Analyst National Observatory for Women
[email protected] 506878853
Saudi Arabia Mariam Hamidaddin
National Human Rights Offier
UN OHCHR [email protected] 966555094084
Saudi Arabia Raja Altaf International Relations Manager
The General Authority for Statistics
[email protected] '+966546400989
Saudi Arabia Sumayyah alsawadi
statistician general authority for statistics [email protected] '+966550903364
Saudi Arabia Wejdan Alhedyani
International Relations Specialist
General Authority for Statistics [email protected] 595554014
Somalia Abdirahman Ali Statistician SNBS [email protected] '+252615205205
Somalia Ahmed Ahmed statistician Somali National Bureau of Statistics
[email protected] 634434984
Somalia Hussein Elmi Gure Director SNBS [email protected] '+252615511043
Somalia Zahir Mohamed Omar
Economist Somali National Bureau of Statistics
[email protected] '+252619600390
Sudan Afkar Eltaib Awad Elkrim Alla
sustainable development management
CBS [email protected] 122972975
Sudan Magda Elgaali Head of SDG Section & National Focal Point
Central Bureau of Statistics/Sudan
[email protected] 122221832
Tunisia Arbia Ferchichi Sous directeur Institut National de la Statistique
[email protected] '+21693430876
Tunisia Jamel Tahar Chef service Éducation [email protected] 21620515395
Tunisia Mbarka Taleb DIRECTRICE GENERALE MINISTERE ECONOMIE PLANUFICATION
[email protected] 58156061
Tunisia Moufida Zoug Administrateur conseiller INS [email protected] 21695119502
Tunisia Nabiha Miskini Gestionnaire conseiller Institut national de la statistique
[email protected] (+216) 94 866 163
Tunisia Nadia Touihri Head of départment INS [email protected] 52851350
United Arab Emirates
Maryam Shamsi had of statistics department
General Women Union [email protected] '+971508802002

25
United Arab Emirates
Raidan Alsaqqaf Economist UNRCO [email protected] 562882109
United Arab Emirates
Zeinab Ali Data Management Officer UNRCO [email protected] '+971562212735
United States
Dimah Alsagri Human Rights Officer OHCHR [email protected] 504466866
Yemen Tareq Alkebsi Deputy Assistant for Population and Socio Statistics
Central Statistical Organisation [email protected] 0096777753453o
Annex 3: RESOURCES
SDG 1.3.1:
➢ Social Protection Platform: https://www.social-protection.org/
➢ Quantitative Platform on Social Security, and ILO/SSI: https://qpss.ilo.org/
➢ World Social Protection Database & Dashboards: https://wspdb.social-protection.org/
➢ World Social Protection Report 2020–22 (figures and annexes): https://wspr.social-protection.org/
➢ Social Protection Monitor: https://www.social-protection.org/gimi/ShowWiki.action?id=3426
➢ ILO Guidebook on SDG Labour Market Indicators (https://www.ilo.org/stat/Publications/WCMS_647109/lang--en/index.htm)
➢ ILOSTAT database (www.ilostat.ilo.org)
➢ Sustainable Development Goals and Targets (http://www.un.org/sustainabledevelopment/sustainable-development-goals/)
➢ Manual on Decent Work Indicators (http://www.ilo.org/stat/Publications/WCMS_223121/lang--en/index.htm)

26
Annex 4: Q & A
Country /Name Questions Answers
Indicator 1.3.1
Lebanon – Zeina
Maalouf
Do you have any new indicators
created due to covid?
For the SDG 1.3.1, we are mainly focusing of the data collection received in 2020 and which refers
to 2019. This data does not have the influence of covid and therefore no new indicators were
created. However, ILO is looking at the additional number of people that were covered by the
temporarily measures established by the countries in the response to covid. This data is available
on social protection responses to covid crisis around the world dashboard where ILO monitors
209 countries and territories and the information is available on all the measures, extension of
social protection, the coverage of new people for the countries. So far, information is available
on 1709 measures in 209 countries.
Indicator 8.3.1
ESCWA Are the maids part of the
informal or formal employment?
This is the case of self-employed people. If the maid pays the taxes and declare the income, then
he/she will be considered as part of the formal employment.
Lebanon – Zeina
Maalouf
People working in informal
sector fear to lose their work
that is why they do not speak
about the problems they have at
work. How to proceed in this
case?
This question is precisely why ILO prefers to look at LFS and Household Surveys rather than
Establishment Surveys for informality because we know if you go and ask people at their place
of work, they will be afraid to answer because of the sensitivity.
Indicator 8.5.1
Lebanon – Zeina
Maalouf
Does this indicator include also
the informal sector?
It depends on the source of data. So, if the country is using an establishment survey, then the
informal sector is excluded. And this is related to the issue of comparability between countries,
because this indicator has to cover different groups of population

27
Somalia -
Abdirahman Ali
Is there a global average for the
gender pay gap?
ILO does not do an estimate for the global average for the gender pay gap although for the SDG
purposes we will look into doing this average. When we look at the middle figure it is around
10-15% depending on the number of the countries included in the calculation. It does also
depend on the occupations. From the data available, it is obvious that the more heavily male
the occupations are the larger the gender pay gap is.
Lebanon – Zeina
Maalouf
For the gender gap, do we need
to calculate it by occupation?
Ideally yes, all the data first must be disaggregated by occupation. As well as countries can
calculate the overall gender pay gap. In the LFS, the occupations are classified as per the ISCO-
08 classifications
Jordan – Manal
Sweidan
To calculate the gender pay gap
in Jordan we use data from
establishment surveys and from
administrative records
specifically from the social
security corporation records.
There is a huge difference
between the two sources for the
same sector, occupation and
economic activity. How do we
proceed in this case and what is
the best source of data?
This is not a surprising issue as the difference in data sources will create a huge difference in
terms of the results. This issue is related to coverage. The advice is to use the source that
provides a more comprehensive coverage of the workforce and usually the establishment survey
is better because it provides more accurate data than the labour force survey. But again it
depends on the coverage of each of the data sources and this depends on the country.
Indicator 8.7.1
Morocco - Assia
Nijari
For data sources, can we also use
population census?
It depends on the type of information the census collects. There are some censuses that collect
information on working children but not always on the working hours which are both available
in the DHS or MICS.
Lebanon – Zeina
Maalouf
Does the economic activity
include prostitution too?
In theory, it should cover prostitution which is one kind of child labour. Unfortunately, this kind
of child labour is not included in the household surveys and for this we need other type of

28
survey and methodology. Therefore, looking at the number of hours and the type of
occupation is some kind of a proxy.
ESCWA How does this indicator capture
begging?
There is a survey that captures begging, but it covers only children living in a household. It can
be also covered by the general question on working activity. There are other methodologies to
capture begging children not living in a household.
Lebanon – Zeina
Maalouf
Can the data of this indicator be
disaggregated by sex?
This indicator can be disaggregated by sex and location.
Indicator 8.8.1
Lebanon – Zeina
Maalouf
How does ILO collect data on this
indicator knowing that
sometimes employees are afraid
to lose their jobs after answering
questions related to work
injuries?
The preferred source of data for this indicator is the administrative records. Otherwise,
household surveys and establishment surveys are used. But it is not usually the case.
Lebanon – Zeina
Maalouf
Injuries include sexual
harassment?
If an injury occurs from the sexual harassment, then yes.

29
Annex 5: METADATA
Indicators Data Source Summary of Metadata Questions
1.3.1 Proportion of
children/households
receiving
child/family cash
benefit, by sex (%)
Main source:
Administrative
records (include
insurance records,
social security
records, records of
the labour ministries
and records of
health ministries,
among others)
Second source:
Household surveys
(household budget
surveys or labour
force surveys)
The indicator reflects the proportion
of persons effectively covered by a
social protection system, including
social protection floors. It also
reflects the main components of
social protection: child and maternity
benefits, support for persons without
a job, persons with disabilities,
victims of work injuries
and older persons.
Computation method:
Number of children/households
receiving children benefits/ Total
number of children/households with
children * 100
Does any member of your household receive any cash
benefit? - Yes - No
Does any child of your household receive any cash benefit? -
Yes - No
1.3.1 Proportion of
population with
severe disabilities
receiving disability
cash benefit, by sex
(%)
Main source:
Administrative
records (include
insurance records,
social security
records, records of
the labour ministries
and records of
health ministries,
among others)
Second source:
The indicator reflects the proportion
of persons effectively covered by a
social protection system, including
social protection floors. It also
reflects the main components of
social protection: child and maternity
benefits, support for persons without
a job, persons with disabilities,
victims of work injuries
and older persons.
Have the difficulties (you/NAME) have been officially
recognized (certified) as a disability? - Yes - No
(Do/Does) (you/NAME) receive any cash benefits from the
government linked to [your/his/her] disability? - Yes - No
(Do/Does) (you/NAME) receive any goods or services from
the government linked to [your/his/her] disability? - Yes - No

30
Household surveys
(household budget
surveys or labour
force surveys)
Computation method:
Number of persons receiving
disability benefits/ Total number of
persons with severe disability * 100
1.3.1 Proportion of
population covered
by labour market
programs (%)
Main source:
Administrative
records (include
insurance records,
social security
records, records of
the labour ministries
and records of
health ministries,
among others)
Second source:
Household surveys
(household budget
surveys or labour
force surveys)
The indicator reflects the proportion
of persons effectively covered by a
social protection system, including
social protection floors. It also
reflects the main components of
social protection: child and maternity
benefits, support for persons without
a job, persons with disabilities,
victims of work injuries
and older persons.
Computation method:
Number of employed persons
covered by labour market programs/
Total number of employed persons *
100
During the past 7 days, did (NAME) do any work for wage,
salary, commission, tip or any other pay even if only for one
hour? - Yes - No
During the past 7 days, did (NAME) run or do any kind of
business, farming or other activities to generate income,
even if it was only for one hour? - Yes - No
During the past 7 days, did (NAME) help unpaid in a business
owned by a household or family member or help a member
of household or family in his/her paid job, even if it was only
for one hour? - Yes – No
Does your employer pay contributions for social security on
your behalf? - Yes - No
1.3.1 Proportion of
mothers with
newborns receiving
maternity cash
benefit (%)
Main source:
Administrative
records (include
insurance records,
social security
records, records of
the labour ministries
and records of
health ministries,
among others)
The indicator reflects the proportion
of persons effectively covered by a
social protection system, including
social protection floors. It also
reflects the main components of
social protection: child and maternity
benefits, support for persons without
a job, persons with disabilities,
victims of work injuries
and older persons.
Have you given birth recently? - Yes - No
Do you receive maternity cash benefits? - Yes - No

31
Second source:
Household surveys
(household budget
surveys or labour
force surveys)
Computation method:
Number of women receiving
maternity benefits / Total number of
women giving birth* 100
1.3.1 Proportion of
population above
statutory
pensionable age
receiving a pension,
by sex (%)
Main source:
Administrative
records (include
insurance records,
social security
records, records of
the labour ministries
and records of
health ministries,
among others)
Second source:
Household surveys
(household budget
surveys or labour
force surveys)
The indicator reflects the proportion
of persons effectively covered by a
social protection system, including
social protection floors. It also
reflects the main components of
social protection: child and maternity
benefits, support for persons without
a job, persons with disabilities,
victims of work injuries
and older persons.
Computation method:
Number of persons above statutory
retirement age receiving an old age
pension/ Total number of persons
above statutory retirement age* 100
ST3. Has your household or anyone in your household
received assistance through (any retirement pension)? - Yes
- No
1.3.1 Proportion of
poor population
receiving social
assistance cash
benefit, by sex (%)
Main source:
Administrative
records (include
insurance records,
social security
records, records of
the labour ministries
and records of
The indicator reflects the proportion
of persons effectively covered by a
social protection system, including
social protection floors. It also
reflects the main components of
social protection: child and maternity
benefits, support for persons without
a job, persons with disabilities,
victims of work injuries
Has any of your household members received income from
…. , last 12 months? (Answers include gits, donations and
compensations, in kind assistance) - Yes - No - Don't know
If the household receive assistance (Cash or other than
cash), last 12 months, who is the donating entity?

32
health ministries,
among others)
Second source:
Household surveys
(household budget
surveys or labour
force surveys)
and older persons.
Computation method:
Number of persons receiving social
assistance cash benefits/ Total
number of poor persons* 100
1.3.1 Proportion of
population covered
by social assistance
programs (%)
Main source:
Administrative
records (include
insurance records,
social security
records, records of
the labour ministries
and records of
health ministries,
among others)
Second source:
Household surveys
(household budget
surveys or labour
force surveys)
The indicator reflects the proportion
of persons effectively covered by a
social protection system, including
social protection floors. It also
reflects the main components of
social protection: child and maternity
benefits, support for persons without
a job, persons with disabilities,
victims of work injuries
and older persons.
Computation method:
Number of persons covered by social
assistance program/ Total number of
population* 100
ST3. Has your household or anyone in your household
received assistance through (any retirement pension)? - Yes
- No
1.3.1 Proportion of
population covered
by social insurance
programs (%)
Main source:
Administrative
records (include
insurance records,
social security
records, records of
the labour ministries
and records of
The indicator reflects the proportion
of persons effectively covered by a
social protection system, including
social protection floors. It also
reflects the main components of
social protection: child and maternity
benefits, support for persons without
WB18. Are you covered by any health insurance? - Yes - No
WB19. What type of health insurance are you covered by? -
Mutual health organization/ community-based health
insurance - Insurance - Health insurance through employer -
Social security - Other privately purchased commercial
health insurance - Other

33
health ministries,
among others)
Second source:
Household surveys
(household budget
surveys or labour
force surveys)
a job, persons with disabilities,
victims of work injuries
and older persons.
Computation method:
Number of persons covered by social
insurance program/ Total number of
population* 100
1.3.1 Proportion of
unemployed persons
receiving
unemployment cash
benefit, by sex (%)
Main source:
Administrative
records (include
insurance records,
social security
records, records of
the labour ministries
and records of
health ministries,
among others)
Second source:
Household surveys
(household budget
surveys or labour
force surveys)
The indicator reflects the proportion
of persons effectively covered by a
social protection system, including
social protection floors. It also
reflects the main components of
social protection: child and maternity
benefits, support for persons without
a job, persons with disabilities,
victims of work injuries
and older persons.
Computation method:
Number of recipients of
unemployment benefits / Total
number of unemployed persons *
100
During the past 7 days, did (NAME) do any work for wage,
salary, commission, tip or any other pay even if only for one
hour? - Yes - No
During the past 7 days, did (NAME) run or do any kind of
business, farming or other activities to generate income,
even if it was only for one hour? - Yes - No
During the past 7 days, did (NAME) help unpaid in a business
owned by a household or family member or help a member
of household or family in his/her paid job, even if it was only
for one hour? - Yes - No
Is (NAME) temporarily absent from any work? - Yes - No
Does (name) receive any unemployment benefit? - Yes - No
1.3.1 Proportion of
vulnerable
population receiving
social assistance
cash benefit, by sex
(%)
Main source:
Administrative
records (include
insurance records,
social security
records, records of
The indicator reflects the proportion
of persons effectively covered by a
social protection system, including
social protection floors. It also
reflects the main components of
social protection: child and maternity
Has any of your household members received income from
…. , last 12 months? (Answers include gits, donations and
compensations, in kind assistance) - Yes - No - Don't know
If the household receive assistance (Cash or other than
cash), last 12 months, who is the donating entity?

34
the labour ministries
and records of
health ministries,
among others)
Second source:
Household surveys
(household budget
surveys or labour
force surveys)
benefits, support for persons without
a job, persons with disabilities,
victims of work injuries
and older persons.
Computation method:
Number of vulnerable persons
receiving social assistance cash
benefits / Total number of vulnerable
persons * 100
1.3.1 Proportion of
employed
population covered
in the event of work
injury, by sex (%
Main source:
Administrative
records (include
insurance records,
social security
records, records of
the labour ministries
and records of
health ministries,
among others)
Second source:
Household surveys
(household budget
surveys or labour
force surveys)
The indicator reflects the proportion
of persons effectively covered by a
social protection system, including
social protection floors. It also
reflects the main components of
social protection: child and maternity
benefits, support for persons without
a job, persons with disabilities,
victims of work injuries
and older persons.
Computation method:
Number of workers covered by injury
insurance / Total employment * 100
During the past 7 days, did (NAME) do any work for wage,
salary, commission, tip or any other pay even if only for one
hour? - Yes - No
During the past 7 days, did (NAME) run or do any kind of
business, farming or other activities to generate income,
even if it was only for one hour? - Yes - No
During the past 7 days, did (NAME) help unpaid in a business
owned by a household or family member or help a member
of household or family in his/her paid job, even if it was only
for one hour? - Yes - No
Does (name) current employer provide occupational injury
insurance? - Yes - No - Don't know
8.3.1 Proportion of
informal
employment in total
employment, by sex
and sector
Main sources:
Labour Force Survey
(LFS)
Informal employment comprises
persons who in their main or
secondary jobs were in one of the
following categories:
During the past 7 days, did (NAME) help unpaid in a business
owned by a household or family member or help a member
of household or family in his/her paid job, even if it was only
for one hour?
- Yes

35
- Own-account workers, employers
and members of producers’
cooperatives employed in their own
informal sector enterprises (the
characteristics of the enterprise
determine the informal nature of
their jobs);
- Own-account workers engaged in
the production of goods exclusively
for own final use by their household
(e.g. subsistence farming);
- Contributing family workers,
regardless of whether they work in
formal or informal sector enterprises
(they usually do not have explicit,
written contracts of employment,
and are not subject to labour
legislation, social security regulations,
collective agreements, etc., which
determines the informal nature
of their jobs);
- Employees holding informal jobs,
whether employed by formal sector
enterprises, informal sector
enterprises, or as paid domestic
workers by households (employees
are considered to have informal jobs
if their employment relationship is, in
law or in practice, not subject to
national labour legislation, income
- No
Was this work in agriculture, farming or fishing?
- Yes
- No
Was the work in agriculture or fishing done by (NAME) for
his own consumption or for sale?
- Yes
- No
I am going to ask you some questions regarding the MAIN
job (NAME) had last week.
What is the economic activity of the establishment/business
where (NAME) works in his/her main job?
What are the main goods or services produced?
What is (NAME)’s current employment status in his/her
main job or occupation?
1. Employer / Partner
2. Own account worker
3. Contributing family helper (unpaid)
4. Monthly paid employee
5. Weekly, daily or on the basis of
productivity paid employee
6. Trainee, apprentice
9. Other (specify) ……………………….

36
taxation, social protection or
entitlement to certain employment
benefits). An enterprise belongs to
the informal sector if it fulfils the
three following conditions:
- It is an unincorporated enterprise (it
is not constituted as a legal entity
separate from its owners, and it is
owned and controlled by one or
more members of one or more
households, and it is not a
quasicorporation: it does not have a
complete set of accounts, including
balance sheets);
- It is a market enterprise (it sells at
least some of the goods or services it
produces);
- The enterprise is not registered, or
the employees of the enterprise are
not registered or the number of
persons engaged on a continuous
basis is below a threshold
determined by the country.
Computation method:
the proportion of informal
employment in total employment is
computed by dividing the informal
employment by total employment,
multiplied by 100.
What is the institutional sector of the establishment where
(NAME) currently works for his/her main current job or
occupation?
1- Private business or private farm, etc
2- Private household
3- Government institution / state owned enterprise
4- Non-governmental institution, non-profit organization
5- Embassy or international organization
6- Political parties
9- Other, specify...
Is the business / enterprise where (NAME) works, registered
in the commercial registry?
1. Yes
2. In process
3. No
4. Don’t know

37
8.5.1 Average hourly
earnings of female
and male
employees, by
occupation, age and
persons with
disabilities
Main source:
Establishment
survey
Second source:
Household surveys,
LFS, LSMS,
administrative
records
Earnings refer to the gross
remuneration in cash or in kind paid
to employees, as a rule at regular
intervals, for time worked or work
done together with remuneration for
time not worked, such as annual
vacation, other type of paid leave or
holidays. Earnings exclude
employers’ contributions in respect
of
their employees paid to social
security and pension schemes and
also the benefits received by
employees under these schemes.
Earnings also exclude severance and
termination pay.
Computation method:
Statistics on average hourly earnings
by sex can be used to calculate the
gender pay gap, as follows:
Gender pay gap= (〖Average hourly
earnings〗_Men- 〖Average hourly
earnings〗_Women)/〖Average
hourly earnings〗_Men x 100
Because of a health condition, does (NAME) have weak
sight, even with use of eyeglasses?
- No difficulty
- Some difficulty
- A lot of difficulty
- Cannot see at all
- Not applicable
Because of a health condition, does (NAME) have weakness
of hearing, even with hearing aid?
- No difficulty
- Some difficulty
- A lot of difficulty
- Cannot hear at all
- Not applicable
Because of a health condition, does (NAME) have difficulty in
walking or climbing steps?
- No difficulty
- Some difficulty
- A lot of difficulty
- Cannot do at all
- Not applicable
Because of a health condition, does (NAME) have difficulty in
remembering or concentrating?
- No difficulty
- Some difficulty
- A lot of difficulty
- Cannot do at all

38
- Not applicable
Because of a health condition, does (NAME) have difficulty
with self-care (such as washing all over / dressing, feeding,
toileting, etc…)?
- No difficulty
- Some difficulty
- A lot of difficulty
- Cannot do at all
- Not applicable
Because of a health condition, does (NAME) have difficulty in
communicating in his own language?
- No difficulty
- Some difficulty
- A lot of difficulty
- Cannot communicate at all
- Not applicable
During the past 7 days, did (NAME) do any work for wage,
salary, commission, tip or any other pay even if only for one
hour?
- Yes
- No
During the past 7 days, did (NAME) do any work for wage,
salary, commission, tip or any other pay even if only for one
hour?
- Yes
- No
39
During the past 7 days, did (NAME) run or do any kind of
business, farming or other activities to generate income,
even if it was only for one hour?
- Yes
- No
During the past 7 days, did (NAME) help unpaid in a business
owned by a household or family member or help a member
of household or family in his/her paid job, even if it was only
for one hour?
- Yes
- No
Is (NAME) temporarily absent from any work?
- Yes
- No
How many hours does (NAME) usually work per week?
How much was (NAME)’s income or net earnings in cash or
in kind from his/her main job last month?
In his main job, what kind of work (NAME) usually do?
What is the job title of (NAME)?
What are his/her main tasks or duties?
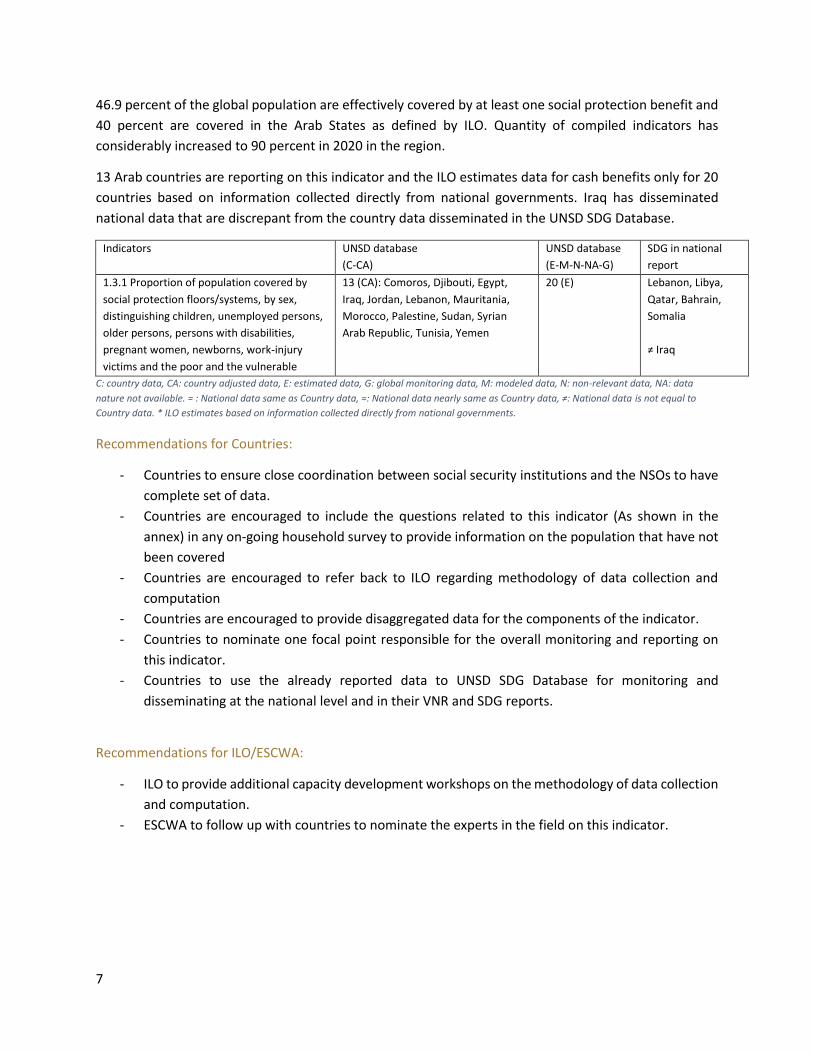
8.6.1 Proportion of
youth (aged 15-24
years) not in
education,
Main sources:
Labour Force Survey
(LFS)
For the purposes of this indicator,
youth is defined as all persons
between the ages of 15 and 24
(inclusive).
Is (NAME) currently enrolled in school?
- Yes
- No

40
employment or
training
Secondary sources:
Population census
or other type of
household survey
with employment
module
Non-formal education, like formal
education is defined in ISCED as
education that is institutionalized,
intentional and planned by an
education provider but is considered
an addition, alternative and/or a
complement to formal education. It
may be short in duration and/or low
in intensity and it is typically provided
in the form of short courses,
workshops or seminars. Informal
learning is defined in ISCED as forms
of learning that are intentional or
deliberate, but not institutionalized.
It is thus less organized and less
structured than either formal or non-
formal education. Informal learning
may include learning activities that
occur in the family, in the workplace,
in the local community, and in daily
life, on a self-directed, family-
directed or socially-directed basis.
For the purposes of this indicator,
persons will be considered in
education if they are in formal or
non-formal education, as described
above, but excluding informal
learning.
Employment is defined as all persons
of working age who, during a short
During the past 7 days, did (NAME) do any work for wage,
salary, commission, tip or any other pay even if only for one
hour?
- Yes
- No
During the past 7 days, did (NAME) run or do any kind of
business, farming or other activities to generate income,
even if it was only for one hour?
- Yes
- No
During the past 7 days, did (NAME) help unpaid in a business
owned by a household or family member or help a member
of household or family in his/her paid job, even if it was only
for one hour?
- Yes
- No
Is (NAME) temporarily absent from any work?
- Yes
- No
Did (NAME) actively search for a job or try to start a business
in the previous 4 weeks?
- Yes
- No
What (NAME) did to look for work during the last 4 weeks?
- By relative or friends

41
reference period (one week), were
engaged in any activity to produce
goods or provide services for pay or
profit.
For the purpose of this indicator,
persons are considered to be in
training if they are in a non-academic
learning activity through which they
acquire specific skills intended for
vocational or technical jobs.
Vocational training prepares trainees
for jobs that are based on manual or
practical activities, and for skilled
operative jobs, both blue and white
collar related to a specific trade,
occupation or vocation.
Technical training on the other hand
imparts learning that can be applied
in intermediate-level jobs, in
particular those of technicians and
middle managers.
Computation method:
Youth NEET rate = (Youth - (Youth in
employment + Youth not in
employment but in education or
training))*100 / Youth
- Applying directly to employers
- Enquiring at workplaces (eg. Farms, industries, market,…)
- Subscribing in the National employment office
- Subscription in private employment agency
- Answering to job advertisement in newspapers or internet
- Advertising publication in newspapers or internet
- Setting-up/establishing a business (search for
land/building, arranging for financial resources, applying for
permits, licenses,..)
- Other (specify)
Does (NAME) want to work?
- Yes
- No
If a job became available, would (NAME) be involved to start
working within the next two weeks?
- Yes
- No
For what reason (NAME) is not currently available to work?
If a job with requirements below (NAME)’s professional or
educational level were available, would (NAME) accept it?
- Yes
- No
8.7.1 Proportion and
number of children
aged 5‑17 years
Main sources:
Household surveys,
Labour Force Survey
Economic activity includes all types of
establishments or businesses in
which persons are engaged in the
CL1. Now I would like to ask about any work (name) may do.
Since last (day of the week), did (name) do any of the
following activities, even for only one hour?

42
engaged in child
labour, by sex and
age
(LFS), National
multipurpose
household survey,
World Health Survey
(WHS),
Demographic and
Health Survey (DHS),
Living Standard
Measurement
Survey (LSMS),
SIMPOC (statistical
information and
monitoring
programme on child
labour)
production and/or distribution of
goods and services.
Household chores refer to services
rendered by and for household
members without pay. These include
activities such as cooking, ironing,
housecleaning, shopping, looking
after children and small repairs.
The former limits the frame of
reference to economic activity, while
the latter extends it to include both
economic activity and unpaid
household services, that is, the
production of domestic and personal
services by a household member for
consumption within their own
household, commonly called
“household chores”.
Computation method:
Children aged 5-17: Number of
children aged 5-17 reported in child
labour during the week prior to the
survey divided by the total number of
children aged 5-17 in the population,
multiplied by 100.
Children aged 5-14: Number of
children aged 5-14 reported in child
labour during the week prior to the
survey divided by the total number of
[A] Did (name) do any work or help on (his/her) own or the
household’s plot, farm, food garden or looked after animals?
For example, growing farm produce, harvesting, or feeding,
grazing or milking animals?
[B] Did (name) help in a family business or a relative’s
business with or without pay, or run (his/her) own business?
[C] Did (name) produce or sell articles, handicrafts, clothes,
food or agricultural products?
[X] Since last (day of the week), did (name) engage in any
other activity in return for income in cash or in kind, even for
only one hour?
CL3. Since last (day of the week) about how many hours did
(name) engage in (this activity/these activities), in total?
CL7. Since last (day of the week), did (name) fetch water for
household use?
- Yes
- No
CL8. In total, how many hours did (name) spend on fetching
water for household use, since last (day of the week)?
CL9. Since last (day of the week), did (name) collect firewood
for household use?
- Yes
- No

43
children aged 5-14 in the population,
multiplied by 100.
Children aged 15-17: Number of
children aged 15-17 reported child
labour during the week prior to the
survey divided by the total number of
children aged 15-17 in the
population, multiplied by 100.
CL10. In total, how many hours did (name) spend on
collecting firewood for household use, since last (day of the
week)?
CL11. Since last (day of the week), did (name) do any of the
following for this household?
[A] Shopping for the household?
[B] Cooking?
[C] Washing dishes or cleaning around the house?
[D] Washing clothes?
[E] Caring for children?
[F] Caring for someone old or sick?
[X] Other household tasks?
CL13. Since last (day of the week), about how many hours
did (name) engage in (this activity/these activities), in total?
8.8.1 Fatal
occupational injuries
among employees,
by sex and migrant
status (per 100,000
employees)
Main sources:
Administrative
records (insurance
records, labour
inspection records,
records kept by the
Labour Ministry or
the relevant social
security institution,
etc)
Secondary sources:
Household surveys,
Occupational accident: an
unexpected and unplanned
occurrence, including acts of
violence, arising out of or in
connection with work which results
in one or more workers incurring a
personal injury, disease or death.
Occupational accidents are to be
considered travel, transport or road
traffic accidents in which workers are
injured and which arise out of or in
the course of work; that is, while
engaged in an
Household survey:
6. Did this person do any work at all (that is, work for wages,
salary, profit, or family gain, in cash or in kind) in the last 12
months (that is, since)?
- Yes
- No
10. Have you ever been hurt in an occupational accident
(that is, an unexpected event that happened at work or in
connection with your work and that caused you personal
injury or illness)?
- Yes
- No

44
establishment
surveys
economic activity, or at work, or
carrying out the business of the
employer.
Occupational injury: any personal
injury, disease or death resulting
from an occupational accident. An
occupational injury is different from
an occupational disease, which
comes as a result of an exposure over
a period of time to risk factors linked
to the work activity. Diseases are
included only in cases were
the disease arose as a direct result of
an accident. An occupational injury
can be fatal or non-fatal (and non-
fatal injuries could entail the loss of
workdays).
Fatal occupational injury: an
occupational injury leading to death
within one year of the day of the
occupational accident.
Case of occupational injury: the case
of one worker incurring one or more
occupational injuries as a result of
one occupational accident.
Workers in the reference group:
workers in the reference group refer
to the average number of workers in
the particular group under
consideration and who are covered
11. Did any of these accidents occur in the last 12 months,
that is, since?
- Yes
- No
12. And did any of the injuries you received in the last 12
months result in you being absent from work, or unable to
work, for at least one day, apart from the day of the
accident?
- Yes
- No
13. How many of these injuries (with lost time) did you have
in the last 12 months?
14. But did any of these occupational injuries in the last 12
months seriously restrict your work activities as a result of
the injury even though you were not absent from work or
unable to work?
Establishment survey:
Please provide information about each case of occupational
injury (including fatalities) incurred by working in this
establishment in the last calendar year, that is between 1
January and 31 December (year). Enter the appropriate code
in each column. Cases of occupational injury are those cases
where, as a result of their injuries, the injured employees did
not work for at least one day, excluding the day of the
accident.

45
by the source of the statistics on
occupational injuries (for example,
those of a specific sex or in a specific
economic activity, occupation,
region, age group, or any
combination of these, or those
covered by a particular insurance
scheme, accident notification
systems, or household or
establishment survey).
Computation method:
Fatal occupational injury incidence
rate = New cases of fatal injury
during the reference year *100,000 /
Workers in the reference group
during the reference year
1- Month and year of accident
2- Sex
3- Age
13- Was accident fatal?
- Fatal
- Non-fatal
8.8.1 Non-fatal
occupational injuries
among employees,
by sex and migrant
status (per 100,000
employees)
Main sources:
Administrative
records (insurance
records, labour
inspection records,
records kept by the
Labour Ministry or
the relevant social
security institution,
etc)
Secondary sources:
Occupational accident: an
unexpected and unplanned
occurrence, including acts of
violence, arising out of or in
connection with work which results
in one or more workers incurring a
personal injury, disease or death.
Occupational accidents are to be
considered travel, transport or road
traffic accidents in which workers are
injured and which arise out of or in
the course of work; that is, while
engaged in an economic activity, or
Household survey:
Has any member of this household died in the last five?
- Yes
- No
How many deaths have there been in the last five years?
Did (any of them / this person) die as a result of an accident
at work?
For each person who died as a result of an accident at work,
please give the following information:
Month and year of accident

46
Household surveys,
establishment
surveys
at work, or carrying out the business
of the employer. Occupational injury:
any personal injury, disease or death
resulting from an occupational
accident. An occupational injury is
different from an occupational
disease, which comes as a result of
an exposure over a period of time to
risk factors linked to the work
activity. Diseases are included only in
cases where the disease arose as a
direct result of an accident. An
occupational injury can be fatal or
non-fatal (and non-fatal injuries could
entail the loss of work days). Fatal
occupational injury: an occupational
injury leading to death within one
year of the day of the occupational
accident. Case of occupational injury:
the case of one worker incurring one
or more occupational injuries as a
result of one occupational accident.
Workers in the reference group:
workers in the reference group refer
to the average number of workers in
the particular group under
consideration and who are covered
by the source of the statistics on
occupational injuries (for example,
those of a specific sex or in a specific
Month and year of death Sex (Male 1, Female 2)
Age at time of death (in completed years)
Occupational group at time of accident (use ISCO coding
frame)
Economic activity at time of accident (use ISIC coding frame)
Establishment survey:
Please provide information about each case of occupational
injury (including fatalities) incurred by working in this
establishment in the last calendar year, that is between 1
January and 31 December (year). Enter the appropriate code
in each column. Cases of occupational injury are those cases
where, as a result of their injuries, the injured employees did
not work for at least one day, excluding the day of the
accident.
1- Month and year of accident
2- Sex
3- Age
13- Was accident fatal?
- Fatal
- Non-fatal

47
economic activity, occupation,
region, age group, or any
combination of these, or those
covered by a particular insurance
scheme, accident notification
systems, or household or
establishment survey). Computation
method: Non-fatal occupational
injury incidence rate = Number of
new cases of non-fatal occupational
injury during the reference period
*100,000 / Number of workers in the
reference group during the reference
period Non-fatal occupational injury
frequency rate = Number of new
cases of non-fatal occupational injury
during the reference period
*1,000,000 / Total number of hours
worked by workers in the reference
group during the reference period
More indicators:
8.2.1 Annual growth rate of real GDP per employed person and 10.4.1 Labour share of GDP, countries are advised to disseminated UNSD data as
national data in their VNRs and SDG reports.
8.b.1 Existence of a developed and operationalized national strategy for youth employment, as a distinct strategy or as part of a national
employment strategy and 10.7.1 Recruitment cost borne by employee as a proportion of yearly income earned in country of destination: Tier III
indicators recently upgraded to tier II. Data for both will be provided by National Focal Points.