DISTRICT BUDGET - San Antonio ISD
393
SAN ANTONIO INDEPENDENT SCHOOL DISTRICT JULY 1, 2021 - JUNE 30, 2022 WWW.SAISD.NET DISTRICT BUDGET San Antonio Independent School District 514 W. Quincy St. | San Antonio | Bexar County, TX 78212
-
Upload
khangminh22 -
Category
Documents
-
view
0 -
download
0
Transcript of DISTRICT BUDGET - San Antonio ISD
SAN ANTONIO INDEPENDENT SCHOOL DISTRICT
JULY 1, 2021 - JUNE 30, 2022
WWW.SAISD.NET
DISTRICT BUDGETSan Antonio Independent School District514 W. Quincy St. | San Antonio | Bexar County, TX 78212
i
Table of Contents Preface .............................................................................................................................................. vi Tracking the Education Dollar ................................................................................................. viii
EEXXEECCUUTTIIVVEE SSUUMMMMAARRYY SSEECCTTIIOONN Executive Summary ............................................................................................................................ 1
Introduction ............................................................................................................................ 1 Mission Statement .................................................................................................................. 2 2021-2022 Budget ................................................................................................................. 3 2021-2022 District Budget Highlights and Key Drivers ........................................................ 4 Analysis of Adopted Budget .................................................................................................. 6 General Fund Revenues .......................................................................................................... 7 Debt Service Fund .................................................................................................................. 8 Property Tax Information ....................................................................................................... 9 Personnel Allocation ............................................................................................................ 10 Student Membership, Demographics and Performance Measurement................................. 11 STAAR Performance Results ............................................................................................... 12 Summary .............................................................................................................................. 13
Addendum ......................................................................................................................................... 14 Distinguished Budget Presentation Awards ..................................................................................... 15 Acknowledgements ........................................................................................................................... 17 District Recognitions and Accomplishments .................................................................................... 18 Board of Education & Administration .............................................................................................. 23 School Board Highlights ................................................................................................................... 24
When and Where the Board Makes Its Decisions ............................................................... 24 Public (Citizen’s) Participation ............................................................................................ 24 Meeting Schedule ................................................................................................................. 25
Consultants & Advisors ..................................................................................................................... 26
OORRGGAANNIIZZAATTIIOONNAALL SSEECCTTIIOONN Our Mission, Beliefs and Core Values ............................................................................................. 27 Organization Chart ............................................................................................................................ 30 Meet the Seven Trustees of Our District ........................................................................................... 31 From Our Origins to the Present ....................................................................................................... 33 Budget Highlights …………………………. .................................................................................... 37 Financial Structure and Basis of Accounting .................................................................................... 39
Description of Entity ............................................................................................................ 39 Fund Accounting .................................................................................................................. 39 Where Our Money Comes From and How It Is Spent ......................................................... 40 District Revenue Sources ..................................................................................................... 41 Governmental Fund Types ................................................................................................... 42 Official District Budget ........................................................................................................ 44 Basis of Accounting Code Structure .................................................................................... 44 Overview of Account Code Structure .................................................................................. 45
Fund Codes ................................................................................................................. 45 Function Codes ........................................................................................................... 47 Object Codes............................................................................................................... 48 Organization Codes .................................................................................................... 49 Program Intent Codes ................................................................................................. 50 Year Code ................................................................................................................... 50
Significant Financial Policies and Procedures................................................................................... 51 Balanced Budget................................................................................................................... 51 Cash Management ................................................................................................................ 51
ii
Investment Policies............................................................................................................... 51 Debt Administration ............................................................................................................. 51 Encumbrances ...................................................................................................................... 52 Fund Balance ........................................................................................................................ 52 Capital Improvements .......................................................................................................... 53 Risk Management ................................................................................................................. 53 Property Taxes ...................................................................................................................... 53 Property Tax Exemptions ..................................................................................................... 53 Tax Abatements .................................................................................................................... 54 Tax Rate Adoption ............................................................................................................... 54 Independent Audit & Financial Reporting ........................................................................... 54
Budget Policies and Development Procedures .................................................................................. 55 Statement of Texas Law ....................................................................................................... 55 Texas Education Agency (TEA) Legal Requirements ......................................................... 55 District Budget Requirements .............................................................................................. 56 Budget Development Process .............................................................................................. 58
Planning ......................................................................................................................... 58 Coordination and Preparation ........................................................................................ 58 Review ........................................................................................................................... 58 Adoption ........................................................................................................................ 58 Implementation .............................................................................................................. 58 Monitoring ..................................................................................................................... 58 Evaluation ...................................................................................................................... 60 Submission ..................................................................................................................... 60
Budget Administration and Management Process............................................................................. 61 Expenditure Controls ............................................................................................................ 61 Purchase Order ..................................................................................................................... 61 Budget Amendments ............................................................................................................ 61 Final Amended Budget ......................................................................................................... 62 Reporting to the Texas Education Agency (TEA)................................................................ 62
Budget Calendar ................................................................................................................................ 63
FFIINNAANNCCIIAALL SSEECCTTIIOONN District’s Governmental Funds Summary of Revenues, Expenditures, and Changes in Fund Balances ............................................ 64 Governmental Funds by Revenue Sources ........................................................................................ 68 Chart of Governmental Funds by Revenue Sources .......................................................................... 69 Governmental Funds by Revenue Fund Type ................................................................................... 70 Governmental Funds Expenditures by Major Function and Average Daily Attendance .................. 71 Chart of Governmental Funds Expenditures per Average Daily Attendance .................................... 72 Governmental Funds Expenditures and Budget by Major Function ................................................. 73
District’s Operating Budget 2021-2022 Summary of Estimated Revenues, Expenditures, and Other Resources (Uses) ............................... 74 Appropriations by Major Object & Program Intent Code ................................................................. 78 Graphs by Major Object Code and Program Intent Code ................................................................. 79 Estimated Revenue- All Funds .......................................................................................................... 81 Appropriations Budget ..................................................................................................................... 82 Total Estimated Revenue for All Funds by Source ........................................................................... 83 Summary of Estimated Revenues by Fund ....................................................................................... 84 Total Estimated Expenditures ............................................................................................................ 85 Estimated Expenditures by Function and Fund Type for All Funds ................................................. 86 Graph of Estimated Expenditures by Function- All Funds ............................................................... 87

iii
GENERAL FUND Definition........................................................................................................................................... 88 General Fund Revenue Sources Last Ten Fiscal Years ..................................................................... 89 General Fund Revenue Trends ......................................................................................................... 90 General Fund Expenditures by Major Function Last Ten Years ....................................................... 91 General Fund Expenditures by Major Function per Average Daily Attendance ............................... 92 Comparison of Budgeted Per Pupil Expenditures ............................................................................. 93 Payroll Expenditures and Budget Comparison by Function ............................................................. 94 Payroll Expenditures and Budget Comparison by Object Code ........................................................ 95 Revenues and Expenditures Six-Year Comparison ........................................................................... 96 Estimated Revenue ............................................................................................................................ 97 Estimated Expenditures ..................................................................................................................... 98 Function Comparison ........................................................................................................................ 99 General Fund by Type of Service .................................................................................................... 100 General Fund Budget by Program Intent Code and Major Object Code ......................................... 101 ADA and Student Membership Impact on State Funding ............................................................... 102 Changes in Fund Balance- General Fund ........................................................................................ 103 Campus Local Operating Budget 2021-2022 General Fund by Major Object Code & Campus ............................................................................ 104 Budget Summary by Major Function and Campus Level ............................................................... 107 Budget Summary by Function and Program ................................................................................... 123 Enrollment and Budget Multi-Year Comparisons ........................................................................... 130 Comparison of Expenditures and Budgets by Campus ................................................................... 133
CHILD NUTRITION FUND Revenues and Expenditures Eight-Year Comparison ..................................................................... 136 Mission Statement and Overview ................................................................................................... 137 SPECIAL REVENUE FUND Definition......................................................................................................................................... 145 Revenues and Expenditures Six-Year Comparison ......................................................................... 146 Estimated Revenues & Expenditures ............................................................................................. 147 Chart of Estimated Expenditures .................................................................................................... 148 Budget by Function and Major Object Code ................................................................................... 149 Campus Special Revenue Budget 2021-2022 Special Revenue Fund by Major Object Code & Campus .............................................................. 150 Comparison of Expenditures and Budgets by Campus ................................................................... 153 DEBT SERVICE FUND Definition......................................................................................................................................... 156 Revenues and Expenditures Six-Year Comparison ......................................................................... 157 Estimated Revenues & Expenditures .............................................................................................. 158 Computation of Legal Debt Margin ................................................................................................ 159 Computation of Direct and Estimated Overlapping Bonded Debt .................................................. 160 Ratio of Annual Debt Service for General Bonded Debt to Total General Fund Expenditures ...... 161 Ratio of Net General Obligation Bonded Debt to Estimated Actual Value and Net General Obligation Bonded Debt per Average Daily Membership .............................................................. 162 CAPITAL PROJECTS FUND Definition......................................................................................................................................... 163 Revenues and Expenditures Eight-Year Comparison .................................................................... 164 Capital Projects Program- Where Are We Today? ........................................................................ 165 SAISD Energy & Sustainability Initiatives ..................................................................................... 168 Construction Needs from the Bond Referendum Status Report ...................................................... 170 Financial Status Report for 2016 Bond Construction ...................................................................... 172 Executive Summary ........................................................................................................................ 179 Bond 2016 Project Summaries ........................................................................................................ 180 Forecast Information Forecast Assumptions for General Operating Fund ........................................................................ 194
iv
Forecast of Budget Drivers .............................................................................................................. 195 General Fund Forecasts Revenues and Expenditures ...................................................................... 196 Child Nutrition Fund Forecasts Revenues and Expenditures .......................................................... 197 Debt Service Fund Forecasts Revenues and Expenditures .............................................................. 198 District and Statewide Comparisons Major Urban Districts Comparison by Program.............................................................................. 199 Statewide Three-Year Comparison by Program .............................................................................. 200 Urban Districts Three-Year Comparison by Program ..................................................................... 201 San Antonio ISD Three-Year Comparison by Program .................................................................. 202 Major Urban Districts Comparison of Revenue Per Student .......................................................... 203
IINNFFOORRMMAATTIIOONNAALL SSEECCTTIIOONN Property Tax Information Tax Collections Forecast ................................................................................................................. 204 Comptroller’s Certified Property Values for SAISD ...................................................................... 205 The Effect of Rising Property Values on State and Local Revenues .............................................. 206 Property Tax Rate History ............................................................................................................... 207 Graph of Property Tax Rate Trends in SAISD ................................................................................ 208 Property Taxes for an Average Residence ...................................................................................... 209 Property Tax Rate Surrounding School Districts Comparison ........................................................ 210 Property Tax Rates- Direct and Overlapping Governments ............................................................ 211 Taxable Assessed & Estimated Market Value of Property ............................................................ 212 Allocation of Property Tax Rates and Tax Levies .......................................................................... 213 Allocation of Property Tax Levies and Collections ........................................................................ 214 Principal Taxpayers ......................................................................................................................... 215 Debt Service Fund Debt Service Fund- General Obligation and Lease Revenue Bonds Schedule ............................... 216 Debt Service Fund- Annual Requirements for Retirement of General Obligation Bonds to Maturity ........................................................................................................................................... 217 Student Projections and Performance Indicators Student Enrollment .......................................................................................................................... 218 SAISD Projection Process ............................................................................................................... 219 SAISD Extended Projections .......................................................................................................... 223 Overview of Performance Measures for San Antonio ISD ............................................................. 225
Standardized Test Scores (2016 to 2019) ........................................................................... 226 Four Years of Standardized Test Scores using the State of Texas Assessment of
Academic Readiness (STAAR).......................................................................... 227 Graduation Rate: Analysis of District Performance ........................................................... 229 Distinction Designations ................................................................................................... 234
District and State Enrollment ................................................................................ 235 Enrollment, Membership, & Attendance............................................................... 236 STAAR Performance By Subject: Approaches Grade Level (Passing) ............... 237 STAAR Percent Performance at Masters Grade Level ......................................... 238 STAAR Percent Met or Exceeded % Progress ...................................................... 239 SAISD, State and State-Economically Disadvantaged Comparing the Graduation,
Continuer, GED Recipient and Dropout Rates ...................................................... 240 Class of 2020 Graduation Rate by Group ............................................................. 241 Comparison of 4-Year Graduates, Continuers, GED Recipients and Dropouts .... 242 Class of 2020 Dropout Rate by Group .................................................................. 243 English Learners (EL) .......................................................................................... 244 Student College Entrance Exams .......................................................................... 245 Data Quality .......................................................................................................... 247

v
Staff Projections and Population Served Staff Full Time Equivalents (FTE) By Category............................................................................. 248 Teachers by Population Served ....................................................................................................... 249 District Divisions District Divisions ............................................................................................................................. 250 Superintendent’s Division ............................................................................................................... 251 Financial Services Division ............................................................................................................. 261 Human Resources Division ............................................................................................................. 267 Technology and Management Information Systems Division ........................................................ 269 Deputy Superintendent of Schools Division ................................................................................... 270 Operations Division ......................................................................................................................... 305 Board & Superintendent Services ................................................................................................... 314
Supplemental Information Community Profile .......................................................................................................................... 318 Historical Attractions ...................................................................................................................... 320 Other Attractions & Information ..................................................................................................... 321 Ten Largest Corporate Headquarters ............................................................................................... 324 Demographics of San Antonio ........................................................................................................ 325 Bexar County San Antonio Metropolitan Map ............................................................................... 327 District Mini Map ........................................................................................................................... 328 2021-2022 Instructional Calendar ................................................................................................... 329 Teacher Hiring Salary Schedule ...................................................................................................... 330 Financial Integrity Rating System of Texas 2019-20 District Status .............................................. 331 Endeavors of the Division of Finance, Business Operations, and Student Health Services............ 333 Reference Information Acronyms ........................................................................................................................................ 335 Glossary of Funds ............................................................................................................................ 339 Glossary of Terms ........................................................................................................................... 346
vi
PREFACE Most people are not accountants or analysts by profession, and probably have limited knowledge or experience with regard to a District budget. That is why we have prepared this document to make it easier to understand the what, when, where, how and why’s of the San Antonio ISD’s “District” budget.
Let’s begin by reading the questions and answers below in order to provide our readers background information about the “District” budget. WHAT IS THE PURPOSE OF A BUDGET? The purpose of a budget is to provide a means of communicating educational goals and programs through a financial plan for the Board of Trustees, the public, the Texas Education Agency and school district staff. WHAT IS THE DISTRICT BUDGET? The District’s budget is a financial plan prepared annually that describes the allocations provided to campuses and department offices to maintain daily operations for the budget year July 1 through June 30 of the following year. The District budget for fiscal year 2021-2022 is based upon SAISD’s Long-Range District Improvement Plan (DIP) that will guide the School Board of Trustees, staff, and community in working toward the mission and goals of educating all students and continuously improving their academic performance. Input from every school, department, advisory group, and stakeholder category, as well as the public at large has been sought. It incorporates essential planning and implementation strategies needed so that all stakeholders focus on what’s needed and are working toward the same goals.
WHAT IS A BALANCED BUDGET? This means matching the District’s current “needs” with its current “resources” to ensure long-term fiscal health. WHAT ARE THE DISTRICT’S NEEDS? This translates into operating costs comprised of salary and fringe benefits, purchased and contracted services, supplies and materials, other costs, debt service, and capital outlay. WHAT ARE THE DISTRICT’S RESOURCES? The District’s resources are comprised of Local, State, and Federal revenue. Local revenue consists primarily of property taxes and also includes local grant donations. State revenue accounts for the District’s largest share of revenue and is driven mainly by Average Daily Attendance (ADA) and the District’s total property value. Federal revenue is a minor component of the general fund operating budget but the major source of revenue for the Food Service Fund and is driven by the number of meals served and the number of students that qualify for the free and reduced price lunch program.
vii
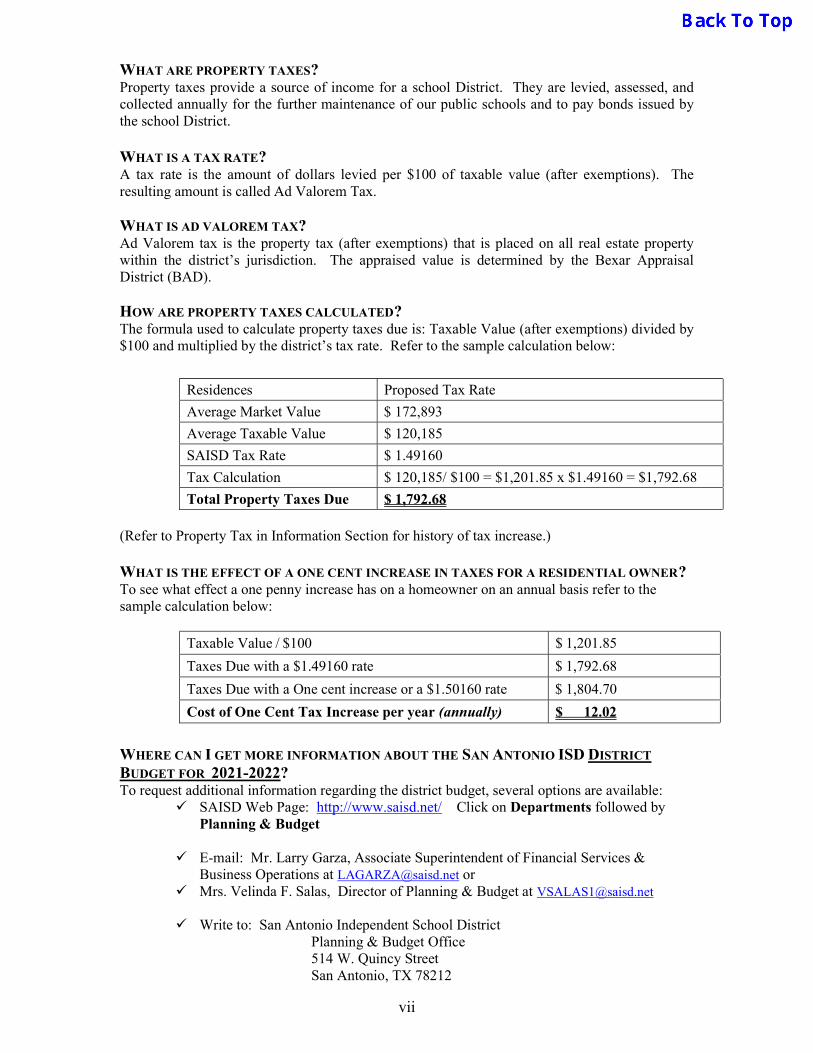
WHAT ARE PROPERTY TAXES? Property taxes provide a source of income for a school District. They are levied, assessed, and collected annually for the further maintenance of our public schools and to pay bonds issued by the school District. WHAT IS A TAX RATE? A tax rate is the amount of dollars levied per $100 of taxable value (after exemptions). The resulting amount is called Ad Valorem Tax. WHAT IS AD VALOREM TAX? Ad Valorem tax is the property tax (after exemptions) that is placed on all real estate property within the district’s jurisdiction. The appraised value is determined by the Bexar Appraisal District (BAD). HOW ARE PROPERTY TAXES CALCULATED? The formula used to calculate property taxes due is: Taxable Value (after exemptions) divided by $100 and multiplied by the district’s tax rate. Refer to the sample calculation below:
Residences Proposed Tax Rate
Average Market Value $ 172,893
Average Taxable Value $ 120,185
SAISD Tax Rate $ 1.49160
Tax Calculation $ 120,185/ $100 = $1,201.85 x $1.49160 = $1,792.68
Total Property Taxes Due $ 1,792.68 (Refer to Property Tax in Information Section for history of tax increase.) WHAT IS THE EFFECT OF A ONE CENT INCREASE IN TAXES FOR A RESIDENTIAL OWNER? To see what effect a one penny increase has on a homeowner on an annual basis refer to the sample calculation below:
Taxable Value / $100 $ 1,201.85
Taxes Due with a $1.49160 rate $ 1,792.68
Taxes Due with a One cent increase or a $1.50160 rate $ 1,804.70
Cost of One Cent Tax Increase per year (annually) $ 12.02
WHERE CAN I GET MORE INFORMATION ABOUT THE SAN ANTONIO ISD DISTRICT
BUDGET FOR 2021-2022? To request additional information regarding the district budget, several options are available:
SAISD Web Page: http://www.saisd.net/ Click on Departments followed by Planning & Budget
E-mail: Mr. Larry Garza, Associate Superintendent of Financial Services &
Business Operations at [email protected] or Mrs. Velinda F. Salas, Director of Planning & Budget at [email protected] Write to: San Antonio Independent School District
Planning & Budget Office 514 W. Quincy Street San Antonio, TX 78212
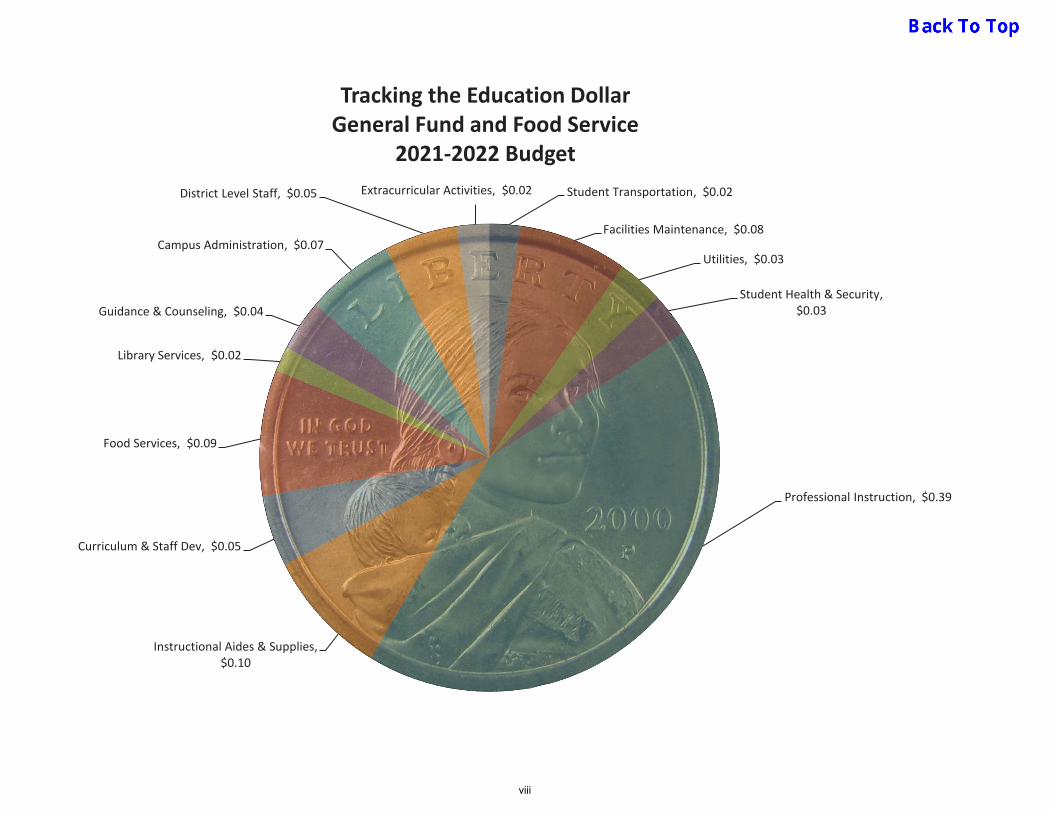
Student Transportation, $0.02
Facilities Maintenance, $0.08
Utilities, $0.03
Student Health & Security, $0.03
Professional Instruction, $0.39
Instructional Aides & Supplies, $0.10
Curriculum & Staff Dev, $0.05
Food Services, $0.09
Library Services, $0.02
Guidance & Counseling, $0.04
Campus Administration, $0.07
District Level Staff, $0.05 Extracurricular Activities, $0.02
Tracking the Education DollarGeneral Fund and Food Service
2021-2022 Budget
viii
EXECUTIVE
SUMMARY
SECTION
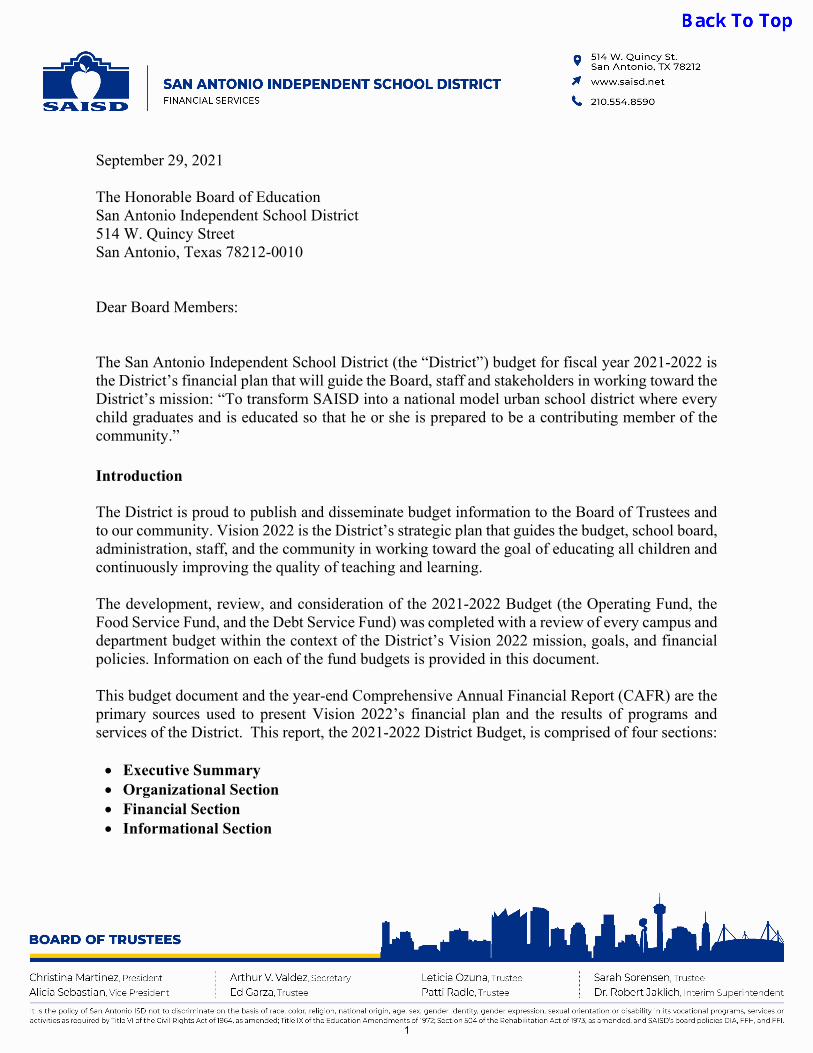
September 29, 2021
The Honorable Board of Education San Antonio Independent School District 514 W. Quincy Street San Antonio, Texas 78212-0010
Dear Board Members:
The San Antonio Independent School District (the “District”) budget for fiscal year 2021-2022 is the District’s financial plan that will guide the Board, staff and stakeholders in working toward the District’s mission: “To transform SAISD into a national model urban school district where every child graduates and is educated so that he or she is prepared to be a contributing member of the community.”
Introduction
The District is proud to publish and disseminate budget information to the Board of Trustees and to our community. Vision 2022 is the District’s strategic plan that guides the budget, school board, administration, staff, and the community in working toward the goal of educating all children and continuously improving the quality of teaching and learning.
The development, review, and consideration of the 2021-2022 Budget (the Operating Fund, the Food Service Fund, and the Debt Service Fund) was completed with a review of every campus and department budget within the context of the District’s Vision 2022 mission, goals, and financial policies. Information on each of the fund budgets is provided in this document.
This budget document and the year-end Comprehensive Annual Financial Report (CAFR) are the primary sources used to present Vision 2022’s financial plan and the results of programs and services of the District. This report, the 2021-2022 District Budget, is comprised of four sections:
Executive Summary Organizational Section Financial Section Informational Section
1

2021-2022 District Budget Executive Summary
Our most important objective in the presentation of the budget data is to improve the quality of information provided to our community about the financial support plan for the 2021-2022 fiscal year. The material in the budget document includes information that has been suggested by the Board Members, staff, and the community. The budget reflects the allocation of revenues and expenditures to support educational programs and services. It presents the vision of the District and staff and is articulated through financial and operating policies. It also represents a responsive balance between the educational needs of students and the ability of the Community and the State to provide the necessary financial support to serve them. Vision Our primary purpose of improving lives through a quality education is driven by an unrelenting determination to have all students graduate and prepare them for success beyond graduation. Our ideology is reflected in our core beliefs, values, and commitments that guide us in our daily practices. Core Values
Student-Centered Integrity High Expectations Respect Commitment Teamwork Passion
Core Beliefs
Every student and staff member should be valued and that their differences should be honored and respected.
Every student should have equitable access to excellent educational experience and can learn and achieve at high levels.
Every student and staff member is entitled to a safe and secure learning and work environment.
Every District operation should be managed and monitored efficiently and effectively. Mission Statement To transform SAISD into a national model urban school district where every child graduates and is educated so that he or she is prepared to be a contributing member of the community. Vision 2022– District Priorities and Goals The District prepares a comprehensive District Improvement Plan which guides the organization in the pursuit of our goals and the achievement of our mission to transform SAISD into a national model urban school district where every child graduates and is educated so that he or she is prepared to be a contributing member of the community. The District Improvement Plan is the product of a collaborative effort between all administrative departments. The document serves as the District plan for all major functions to include, but not limited to finance, organization operations, and constituent services. Monitoring of goals and objectives identified in each action plan will focus on these specific strategies:
Fidelity to the Program Hyper Monitoring Data Analysis Frequent Assessments Teamwork
2
2021-2022 District Budget Executive Summary
The District Improvement Plan is supported by individual Campus Improvement Plans and detailed departmental action plans including goals, measurable performance objectives, and timelines for completion. This document is posted on our District website to communicate to families, staff, and the community the priorities and goals of the District in support of our mission. 2021-2022 Budget The budget process timeline is comprised of seven phases – planning, preparation and submission, review and coordination, adoption, implementation, monitoring, and evaluation. The preparation of the budget commences in November with the initial student enrollment forecast, property value projections, and the development and adoption of the budget calendar. The budget process continues through June and includes budget reviews of each of the department’s base level budget. Recommendations from schools, parents, employee groups, and stakeholders of the District were considered during the budget process. The final 2021-2022 budget was approved by the Board of Trustees on June 21, 2021.
Legislative Changes The Texas Legislature meets in regular session in odd-numbered years. During these sessions, the Legislature approves the state budget, which includes funding for local public-school districts. The 87th Texas Legislature convened in January of 2021, to plan for funding K-12 education for the 2022-2023 biennium. The prior legislative session provided a significant increase in state funding with a higher “Basic Allotment”, funding for new programs, and enhanced weights for some existing special allotments. Given the uncertainty surrounding the Covid pandemic during this 87th legislative session, these funding enhancements were fortunately approved to continue for the 2022-2023 biennium. Although the significant changes to school funding were the result of HB3 passed in the prior legislative session, HB 1525 was passed in 2021 to correct unintended issues of that bill, and to add a few additional provisions that were beneficial to the District.
A few of the major components of change are noted below:
1882 partnership elementary schools can now receive funding for both ADSY and SB 1882.
Modifies the CTE allotment to now be the sum of the basic allotment and the small and midsize allotment per student and modifies the weight to be 1.1 for courses not in an approved program of study; 1.28 for courses in levels 1 and 2; and 1.47 for courses in levels 3 and 4.
Reinstates the gifted and talented allotment eliminated by HB 3 last session at .07 with a statewide appropriations limit of $100 million and a 5% local ADA cap.
Allows districts to use the instructional materials allotment for remote learning costs. Homeless students will automatically receive the maximum compensatory education
funding. Triggers a $620 million reduction from the $1 billion Technology and Instructional
Materials Allotment (TIMA) to school districts to fund expanded TEA grant programs. The District must now pay the 1.7% TRS contribution that we were previously exempted
from as a Social Security participating district. Increased 0.1% each year thereafter, up to a planned final 2.0%.
3

2021-2022 District Budget Executive Summary
Major Assumptions for the 2021-2022 Budget Student enrollment is the largest financial driver in our annual budget process, as we earn the largest portion of our State Funding from student enrollment and attendance. The District has experienced declining enrollment over the past eight years, though the decline flattened substantially in 2019-20. Due to the Covid-19 pandemic, the District experienced a significant student enrollment decline of 2,575 students. For the 2021-22 school year, the District is projecting to recover about 2/3 of those students lost during the pandemic. Local Property Tax values are another significant revenue driver for Debt Service payments, and tax revenues are projected to increase 2.0% for the 2021-2022 school year based on early estimates. 2021-22 District Budget Highlights and Key Drivers
Student Membership. Student membership declined in the 2020-21 school year by 2,575 students from the prior year due to the Covid-19 pandemic. The projected 2021-22 student membership is 47,470, an expected increase of 1,550 students. The projected recovery of enrollment is based on in-person learning resuming, along with the increase in the number of new seats coming available in new and existing choice schools such as YWLA Primary, CAST Med HS, CAST Tech HS, Advanced Learning Academy, Steele Montessori, and Rodriguez Montessori.
Key Projected Operating Statistics for 2021-22. Per pupil General Fund appropriations
(487,527,835 / 47,470) $10,270 Projected Student-Teacher ratio (47,470 / 2,945) 16.2
(Counting local general fund teachers only) Budget Projections. The estimated revenues for fiscal year 2021-22 were based on the
following key assumptions: Average Daily Attendance 41,650 Maintenance and Operations Tax Rate $1.01035 Debt Service Tax Rate $0.48125 Tax Collection Rate 98.75% Property Value Growth +2.00%
Compensation. The San Antonio ISD Board of Trustees did approve a compensation
increase for the 2021-22 school year with two major components. There is a 2.0% General Pay Increase for all full-time district employees, as well as an adjustment to the entry wage rate for full-time, permanent employees from $15.00 to $16.00 per hour. The starting salary for new teachers, librarians and registered nurses has increased to $54,200 for this school year. The Board also approved the continuation of the $500 longevity stipend for 2021-22.
Payroll Share of General Fund. Salaries and fringe benefits are expected to consume 82.6% of General Fund expenditures.
4

2021-2022 District Budget Executive Summary
Tax Rate. While not yet Board approved, the anticipated 2021-2020 tax rate of $1.49160 is comprised of $1.01035 for lawful maintenance and operation expenditures of the district (M&O Tax Rate) and $0.48125 for payment of debt service on bonds authorized by voters of the District (I&S Tax Rate). This represents no change to the I&S tax rate, and a reduction of approximately one cent to the M&O tax rate for this year, due to state-mandated compression for property tax relief.
Budget Comparison The following table presents a comparison of the 2021-2022 Budget for selected Governmental Funds with the 2021-2022 budget year. The budgets for the Governmental Funds shown below are required by the Texas Education Agency to be formally adopted by the Board of Trustees. These funds are the General Operating Fund, Food Service Fund, and the Debt Service Fund.
5
2021-2022 District Budget Executive Summary
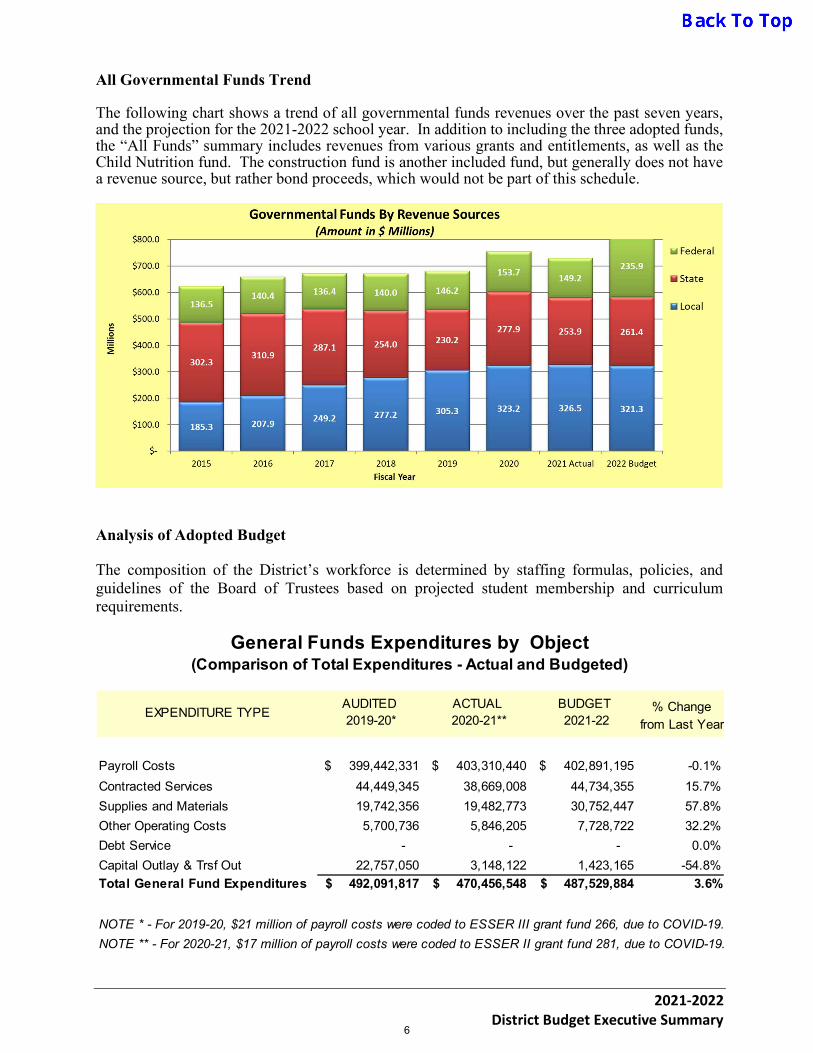
All Governmental Funds Trend The following chart shows a trend of all governmental funds revenues over the past seven years, and the projection for the 2021-2022 school year. In addition to including the three adopted funds, the “All Funds” summary includes revenues from various grants and entitlements, as well as the Child Nutrition fund. The construction fund is another included fund, but generally does not have a revenue source, but rather bond proceeds, which would not be part of this schedule.
Analysis of Adopted Budget The composition of the District’s workforce is determined by staffing formulas, policies, and guidelines of the Board of Trustees based on projected student membership and curriculum requirements.
% Changefrom Last Year
Payroll Costs 399,442,331$ 403,310,440$ 402,891,195$ -0.1%
Contracted Services 44,449,345 38,669,008 44,734,355 15.7%
Supplies and Materials 19,742,356 19,482,773 30,752,447 57.8%
Other Operating Costs 5,700,736 5,846,205 7,728,722 32.2%
Debt Service - - - 0.0%
Capital Outlay & Trsf Out 22,757,050 3,148,122 1,423,165 -54.8%
Total General Fund Expenditures 492,091,817$ 470,456,548$ 487,529,884$ 3.6%
NOTE * - For 2019-20, $21 million of payroll costs were coded to ESSER III grant fund 266, due to COVID-19.
NOTE ** - For 2020-21, $17 million of payroll costs were coded to ESSER II grant fund 281, due to COVID-19.
(Comparison of Total Expenditures - Actual and Budgeted)
EXPENDITURE TYPEAUDITED 2019-20*
ACTUAL 2020-21**
BUDGET 2021-22
General Funds Expenditures by Object
6
2021-2022 District Budget Executive Summary
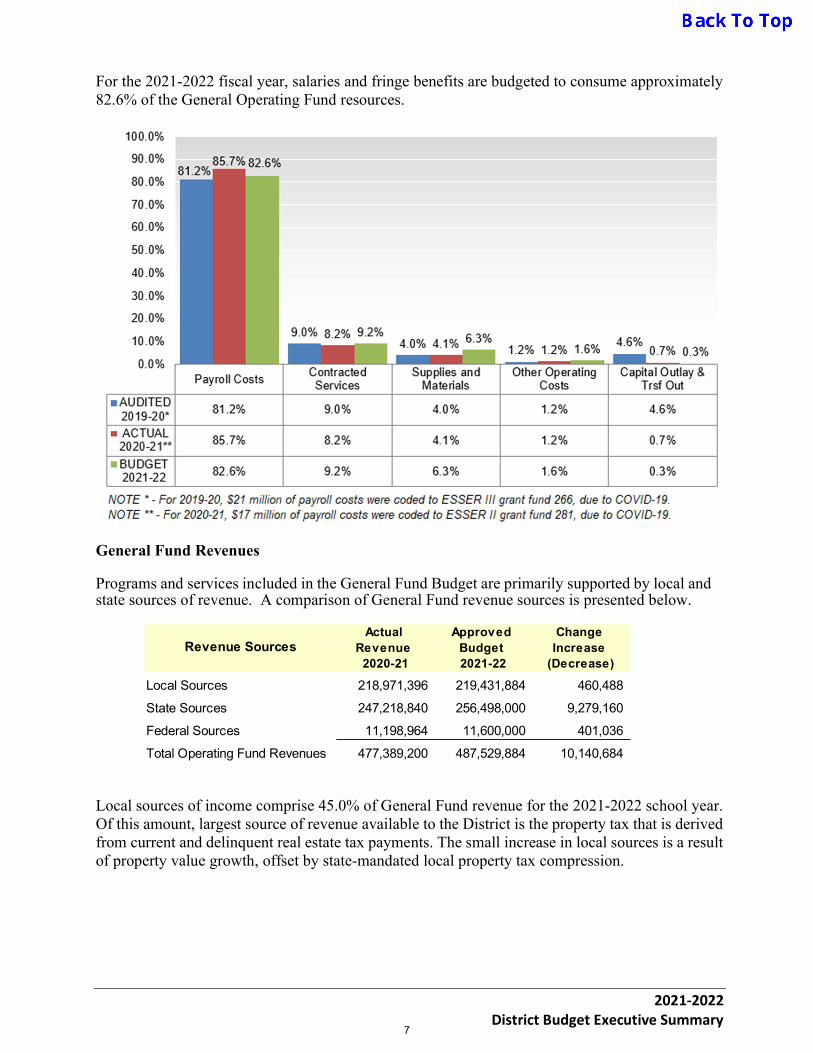
For the 2021-2022 fiscal year, salaries and fringe benefits are budgeted to consume approximately 82.6% of the General Operating Fund resources.
General Fund Revenues Programs and services included in the General Fund Budget are primarily supported by local and state sources of revenue. A comparison of General Fund revenue sources is presented below.
Local sources of income comprise 45.0% of General Fund revenue for the 2021-2022 school year. Of this amount, largest source of revenue available to the District is the property tax that is derived from current and delinquent real estate tax payments. The small increase in local sources is a result of property value growth, offset by state-mandated local property tax compression.
Local Sources 218,971,396 219,431,884 460,488
State Sources 247,218,840 256,498,000 9,279,160
Federal Sources 11,198,964 11,600,000 401,036
Total Operating Fund Revenues 477,389,200 487,529,884 10,140,684
Actual Revenue
2020-21
Approved Budget 2021-22
Change Increase
(Decrease)Revenue Sources
7

2021-2022 District Budget Executive Summary
State revenue represents 52.6% of the estimated General Fund revenue. The 2021-2022 state revenue projections are based on an estimated 47,470 students, an average daily attendance (ADA) of 41,650 and the estimated certified taxable property values (after tax freeze) for the 2021 tax year (2021-2022 school year) of $21,044,394,700. State revenue formulas are expected to remain stable for 2021-22, with a few funding enhancements that were provided in the most recent legislative session, as updates to HB3. The state of Texas did also maintain the compression of the M&O portion of the tax rate to accomplish taxpayer relief of the amount of property taxes paid. Federal revenues represent 2.4% of the General Fund revenue budget. The revenue projected from the Medicaid Reimbursement Program comprises the majority of this portion of the budget is expected to remain stable in the coming year. Debt Service Fund The following table illustrates a comparison of the actual revenues for 2019-20 and 2020-21, and the 2021-22 estimated revenues for the Interest and Sinking Fund (I&S). For each year, the corresponding I&S tax rates are shown:
$0.46260 per $100 of assessed property value in 2019-20 $0.48125 per $100 of assessed property value in 2020-21 $0.48125 per $100 of assessed property value in 2021-22
8
2021-2022 District Budget Executive Summary
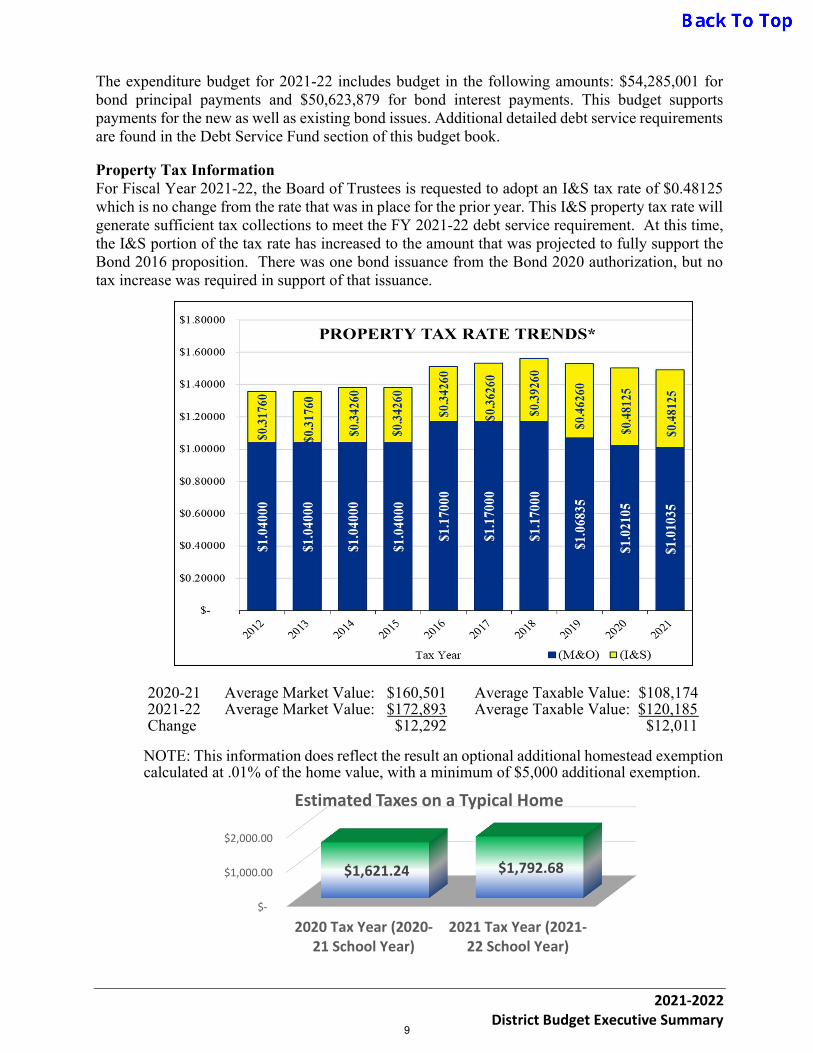
The expenditure budget for 2021-22 includes budget in the following amounts: $54,285,001 for bond principal payments and $50,623,879 for bond interest payments. This budget supports payments for the new as well as existing bond issues. Additional detailed debt service requirements are found in the Debt Service Fund section of this budget book. Property Tax Information For Fiscal Year 2021-22, the Board of Trustees is requested to adopt an I&S tax rate of $0.48125 which is no change from the rate that was in place for the prior year. This I&S property tax rate will generate sufficient tax collections to meet the FY 2021-22 debt service requirement. At this time, the I&S portion of the tax rate has increased to the amount that was projected to fully support the Bond 2016 proposition. There was one bond issuance from the Bond 2020 authorization, but no tax increase was required in support of that issuance.
2020-21 Average Market Value: $160,501 Average Taxable Value: $108,174 2021-22 Average Market Value: $172,893 Average Taxable Value: $120,185 Change $12,292 $12,011
NOTE: This information does reflect the result an optional additional homestead exemption calculated at .01% of the home value, with a minimum of $5,000 additional exemption.
$-
$1,000.00
$2,000.00
2020 Tax Year (2020-21 School Year)
2021 Tax Year (2021-22 School Year)
$1,621.24 $1,792.68
Estimated Taxes on a Typical Home
9

2021-2022 District Budget Executive Summary
San Antonio ISD utilizes Dr. Rostam Kavoussi as a consultant specializing in tracking the District’s property values and providing projections of the final values that will be certified by the Texas Comptroller. These projections are based on the Bexar County Appraisal District’s early projection of the July Certified taxable values, but also factors in possible taxpayer appeals. Based upon this, the District’s estimated certified total taxable value (after tax freeze) for the 2021 tax year (2021-22 school year) is $21,044,394,700, a slight decline when compared to the $21,149,326,62 final estimated value for tax year 2020 (2020-21 fiscal year). Due to the HB3 legislative change, the District will realize a decrease or increase in the tax roll only on the Debt (I&S) portion of the tax rate, and an increase is capped at approximately 2.5% on the M&O portion due to mandated tax compression. It is expected that the District will experience relatively modest increases in the tax base over the next several years.
Personnel Allocation The goals and objectives of the District are achieved through the dedicated efforts of teachers, aides, administrators, and other support personnel. Student membership projections and campus staffing formulas direct the allocation of teachers and other staff among the campuses. The District has undertaken many innovative approaches to help reach specific goals. The following table illustrates the change in general fund staffing allocations from last year to the current year.
AUTHORIZED POSITIONS - GENERAL FUND
ADOPTED BUDGET
2020-2021
ADOPTED BUDGET
2021-2022
CHANGE IN # OF POSITIONS
PERCENTAGE CHANGE
Campus Teachers 3,004.8 2,945.0 (59.8) -2.0%
Campus Administrative Support 636.5 670.0 33.5 5.3%
Campus Paraprofessionals 969.0 987.5 18.5 1.9%
Classified 1,288.0 1,201.0 (87.0) -6.8%
Department Professionals 525.8 566.7 40.9 7.8%
Department Paraprofessionals 159.4 253.6 94.2 59.1%
Total General Fund FTEs 6,583.5 6,623.9 40.4 0.6%
10
2021-2022 District Budget Executive Summary
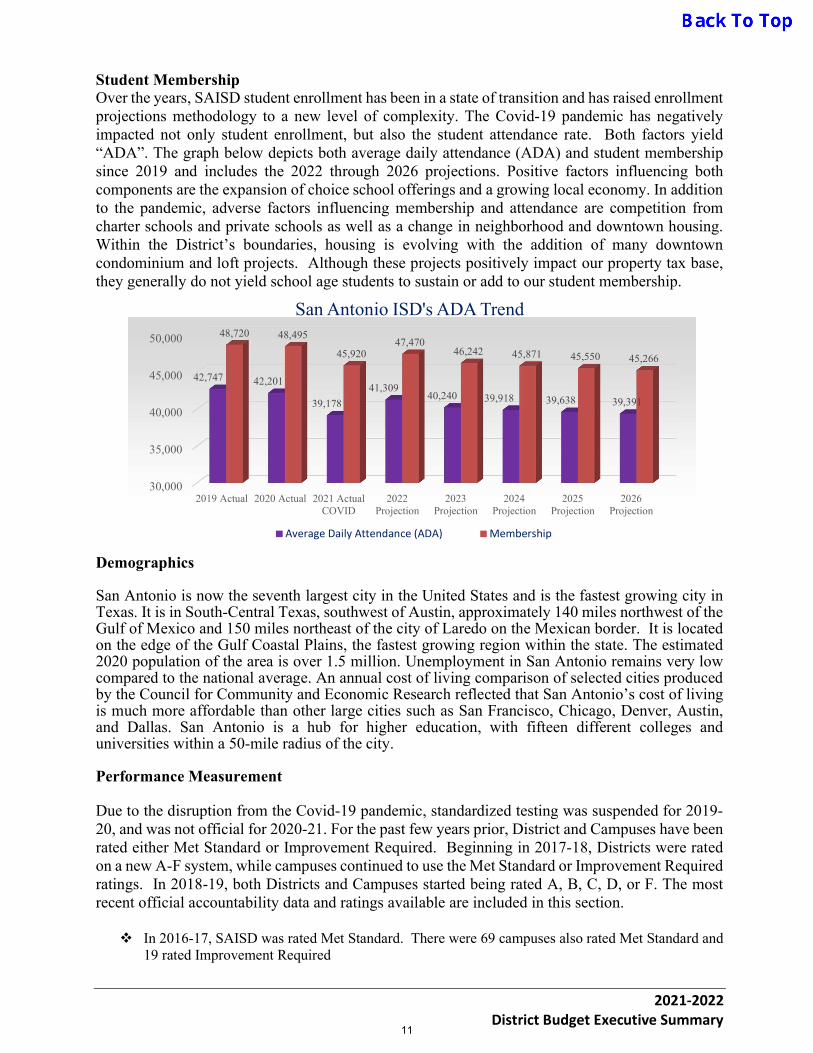
Student Membership Over the years, SAISD student enrollment has been in a state of transition and has raised enrollment projections methodology to a new level of complexity. The Covid-19 pandemic has negatively impacted not only student enrollment, but also the student attendance rate. Both factors yield “ADA”. The graph below depicts both average daily attendance (ADA) and student membership since 2019 and includes the 2022 through 2026 projections. Positive factors influencing both components are the expansion of choice school offerings and a growing local economy. In addition to the pandemic, adverse factors influencing membership and attendance are competition from charter schools and private schools as well as a change in neighborhood and downtown housing. Within the District’s boundaries, housing is evolving with the addition of many downtown condominium and loft projects. Although these projects positively impact our property tax base, they generally do not yield school age students to sustain or add to our student membership.
Demographics San Antonio is now the seventh largest city in the United States and is the fastest growing city in Texas. It is in South-Central Texas, southwest of Austin, approximately 140 miles northwest of the Gulf of Mexico and 150 miles northeast of the city of Laredo on the Mexican border. It is located on the edge of the Gulf Coastal Plains, the fastest growing region within the state. The estimated 2020 population of the area is over 1.5 million. Unemployment in San Antonio remains very low compared to the national average. An annual cost of living comparison of selected cities produced by the Council for Community and Economic Research reflected that San Antonio’s cost of living is much more affordable than other large cities such as San Francisco, Chicago, Denver, Austin, and Dallas. San Antonio is a hub for higher education, with fifteen different colleges and universities within a 50-mile radius of the city. Performance Measurement Due to the disruption from the Covid-19 pandemic, standardized testing was suspended for 2019-20, and was not official for 2020-21. For the past few years prior, District and Campuses have been rated either Met Standard or Improvement Required. Beginning in 2017-18, Districts were rated on a new A-F system, while campuses continued to use the Met Standard or Improvement Required ratings. In 2018-19, both Districts and Campuses started being rated A, B, C, D, or F. The most recent official accountability data and ratings available are included in this section.
In 2016-17, SAISD was rated Met Standard. There were 69 campuses also rated Met Standard and 19 rated Improvement Required
30,000
35,000
40,000
45,000
50,000
2019 Actual 2020 Actual 2021 ActualCOVID
2022Projection
2023Projection
2024Projection
2025Projection
2026Projection
42,747 42,201
39,178
41,30940,240 39,918 39,638 39,391
48,720 48,495
45,92047,470
46,242 45,871 45,550 45,266
San Antonio ISD's ADA Trend
Average Daily Attendance (ADA) Membership
11

2021-2022 District Budget Executive Summary
In 2017-18, SAISD earned a letter grade of “C”. There were 76 campuses rated Met Standard and 16 rated Improvement Required.
In 2018-19, SAISD earned a letter grade of “B”. There were 77 campuses rated Met Standard and 16 rated Improvement Required.
In 2019-20 and 2020-21, because of the COVID-19 pandemic, there was no standardized testing with accountability ratings in Texas. The information presented below is from the most recent rated school year, 2018-2019.
2019 Distinction Designation Performance There were 42 campuses in SAISD which earned one or more distinction designations, up from 34 in 2018:
Campus Type
Earned 1 Distinction
Earned 2 Distinctions
Earned 3 Distinctions
Earned 4 Distinctions
Earned 5 Distinctions
Earned 6 Distinctions
Earned 7 Distinctions
Total
High School
2 3 3 3 7 50
Middle School
3 2 1 1 15
Elementary 6 1 3 4 6 41
Academy 3 1 2 13
Total 14 7 7 9 1 6 7 119
There were 5 campuses which earned all possible Distinction Designations: All Possible Distinction Designations
Young Women’s Leadership (7 out of 7) Fox Tech High School (7 out of 7)
Young Men’s Leadership Academy (7 out of 7) Highland Park Elementary (6 out of 6)
Schenck Elementary (6 out of 6)
End of Course (EOC) STAAR Assessments by Subject
The chart below reflects the District’s STAAR performance for the assessment administered in the spring of the 2016, 2017, 2018 and 2019 school years. As anticipated, the STAAR test was a deeper and more rigorous assessment of the Texas Essential Knowledge and Skills (TEKS).
STAAR Assessment Results - % Passing
In 2018-19, scores showed improvement for Reading, Math, Social Studies, Science and Writing. Beginning in the 2016-17 school year, student performance levels were reported as Approaches,
12
2021-2022 District Budget Executive Summary
Meets, and Masters Grade Level, replacing Passing, Final/College Ready, and Advanced. STAAR-A is no longer an option for students with disabilities although STAAR-ALT remains an option for students with severe disabilities.
Looking Beyond 2021-2022
San Antonio ISD has accomplished much since embracing our 5-year plan “SAISD Blueprint for Excellence: Target 2020”, and the Board has recently established new goals for 2025. This plan incorporates best practices to raise academic expectations for all students and elevate teaching in all classrooms. We began our turnaround initiatives guided by our five pillars of success: Academic excellence, talent management, culture shift, stakeholder engagement, and fiscal management.
Much has been accomplished for our SAISD students. These changes have redefined excellence for all our students, so that many more achieve at higher levels and graduate well-prepared for success in college and career. As we work together with our Board of Trustees to frame our vision for the next 5 years, we will continue to strategically align our financial resources to the many underlying initiatives that support these bold goals for our students and look forward to measuring our progress each year.
Summary
I appreciate the fiscal support provided by the Board of Trustees and the community for development, implementation, and maintenance of the excellent educational program for children of the District. The 2021-2022 budget supports the District’s commitment to improving student achievement and maintaining strict public accountability for quality instructional services. This budget is a sound, school-centered proposal that has been built to facilitate cost-effective management and an ongoing open relationship with the entire community.
Respectfully,
Robert Jaklich, Ed. D. Interim Superintendent
13
2021-2022 District Budget Executive Summary
ADDENDUM This budget report was prepared in a format necessary to meet the requirements of the Government Finance Officers Association (GFOA) Distinguished Budget Presentation Award program and the Association of School Business Officials International (ASBO) Meritorious Budget Award program. To receive these awards, an entity must publish a budget document that meets a large number of specific program criteria and serves as a policy document, an operations guide, a financial plan, and a communications device. These awards represent the highest level of recognition in budgeting for school entities. The SAISD was awarded the Meritorious Budget Award by ASBO as well as the GFOA Distinguished Budget Presentation Award for fiscal year 2020-21 (shown on the following pages). We believe our current budget is structured to meet the requirements of both programs and are submitting it to these organizations to determine its continuing eligibility for these awards.
14
PRESENTED TO
San Antonio Independent School District Texas
For the Fiscal Year Beginning
July 01, 2020
Executive Director
GOVERNMENT FINANCE OFFICERS ASSOCIATION
Distinguished Budget Presentation
Award
15
This Meritorious Budget Award is presented to
SAN ANTONIO INDEPENDENT
SCHOOL DISTRICT
for excellence in the preparation and issuance of its budget
for the Fiscal Year 2020–2021.
The budget adheres to the principles and standards
of ASBO International’s Meritorious Budget Award criteria.
W. Edward Chabal David J. Lewis
President Executive Director
16
ACKNOWLEDGEMENTS
The District would like to acknowledge all the departments below who contributed to the development and publishing of the “2021-2022 Budget” document, thus making it possible to submit to the Government Finance Officers Association’s (GFOA) Distinguished Budget Presentation Award program and the Association of School Business Officials International’s (ASBO) Meritorious Budget Award program.
Accountability, Research, Evaluation, & Testing Theresa Urrabazo, ReNee Lewis, Liza Rosenthal
Child Nutrition Services Jenny Arredondo, Shannon Thompson
Communications Department John Lawler
Gus Lopez, Jill De La Cruz, Printing Services
Construction and Development Services Michelle Lopez, Allison Day, Neeosha Hunt-Mcglown
Treasury Department Sean Mullen
Financial Services & Business Operations Accounting Department
Funds Management & Special Revenue Department
greater:SATX Regional Economic Partnership Christopher Mammen, Ruby Martinez-Berrier
__________________________
Planning and Budget Department Staff
Director: Velinda F. Salas Budget Analyst: Maria del Socorro Gamez
Budget Analyst: Angie Ramirez
17
SAISD District Recognitions and Accomplishments
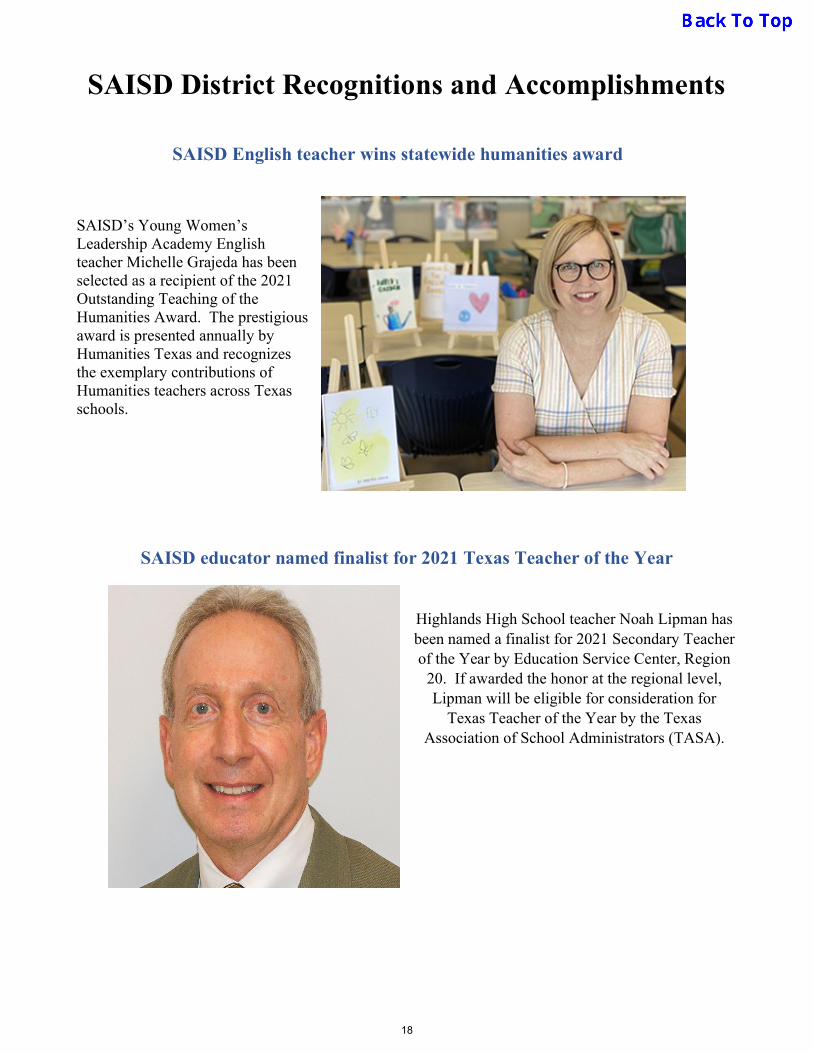
SAISD English teacher wins statewide humanities award
SAISD’s Young Women’s Leadership Academy English teacher Michelle Grajeda has been selected as a recipient of the 2021 Outstanding Teaching of the Humanities Award. The prestigious award is presented annually by Humanities Texas and recognizes the exemplary contributions of Humanities teachers across Texas schools.
SAISD educator named finalist for 2021 Texas Teacher of the Year
Highlands High School teacher Noah Lipman has been named a finalist for 2021 Secondary Teacher of the Year by Education Service Center, Region
20. If awarded the honor at the regional level, Lipman will be eligible for consideration for
Texas Teacher of the Year by the Texas Association of School Administrators (TASA).
18
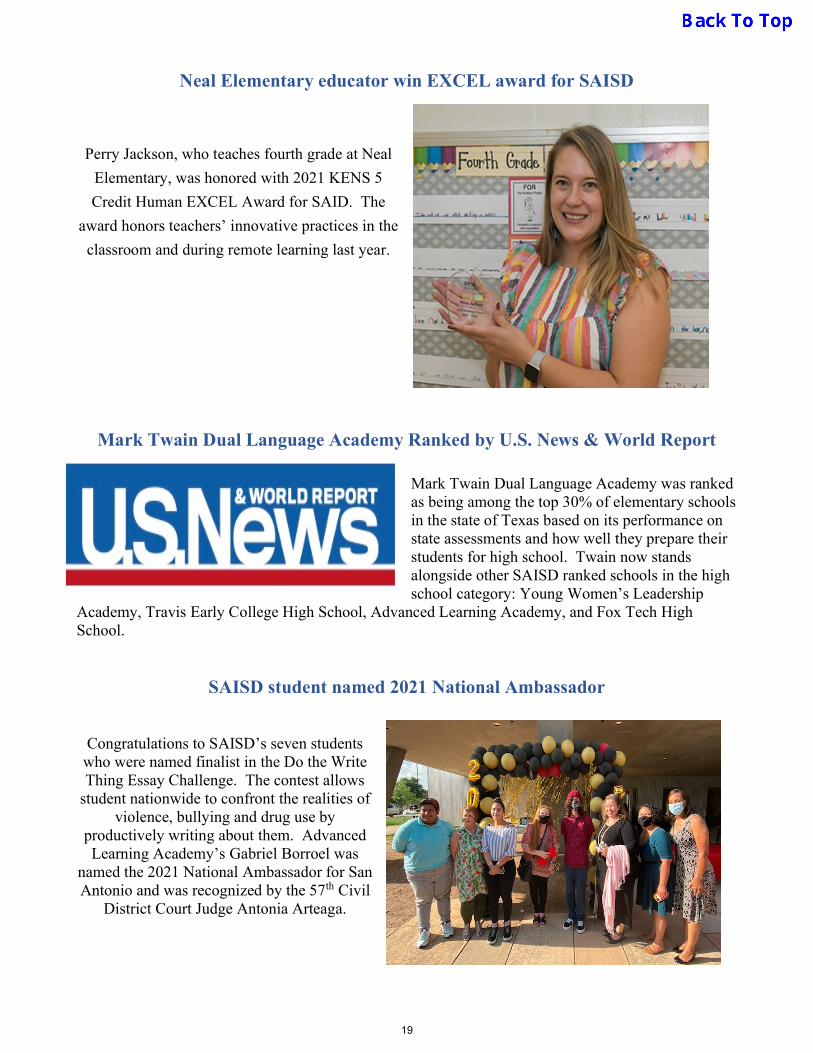
Neal Elementary educator win EXCEL award for SAISD
Perry Jackson, who teaches fourth grade at Neal
Elementary, was honored with 2021 KENS 5
Credit Human EXCEL Award for SAID. The
award honors teachers’ innovative practices in the
classroom and during remote learning last year.
Mark Twain Dual Language Academy Ranked by U.S. News & World Report
Mark Twain Dual Language Academy was ranked as being among the top 30% of elementary schools in the state of Texas based on its performance on state assessments and how well they prepare their students for high school. Twain now stands alongside other SAISD ranked schools in the high school category: Young Women’s Leadership
Academy, Travis Early College High School, Advanced Learning Academy, and Fox Tech High School.
SAISD student named 2021 National Ambassador
Congratulations to SAISD’s seven students
who were named finalist in the Do the Write Thing Essay Challenge. The contest allows
student nationwide to confront the realities of violence, bullying and drug use by
productively writing about them. Advanced Learning Academy’s Gabriel Borroel was
named the 2021 National Ambassador for San Antonio and was recognized by the 57th Civil
District Court Judge Antonia Arteaga.
19
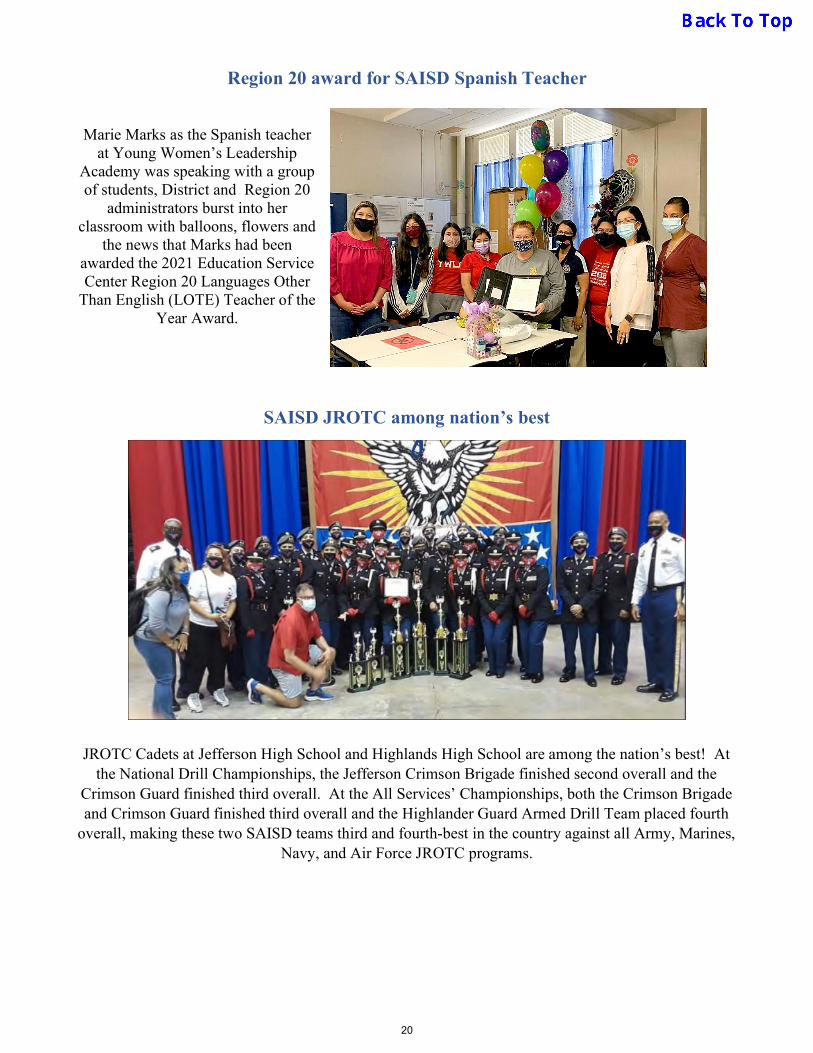
Region 20 award for SAISD Spanish Teacher
Marie Marks as the Spanish teacher
at Young Women’s Leadership Academy was speaking with a group of students, District and Region 20
administrators burst into her classroom with balloons, flowers and
the news that Marks had been awarded the 2021 Education Service Center Region 20 Languages Other
Than English (LOTE) Teacher of the Year Award.
SAISD JROTC among nation’s best
JROTC Cadets at Jefferson High School and Highlands High School are among the nation’s best! At the National Drill Championships, the Jefferson Crimson Brigade finished second overall and the
Crimson Guard finished third overall. At the All Services’ Championships, both the Crimson Brigade and Crimson Guard finished third overall and the Highlander Guard Armed Drill Team placed fourth
overall, making these two SAISD teams third and fourth-best in the country against all Army, Marines, Navy, and Air Force JROTC programs.
20
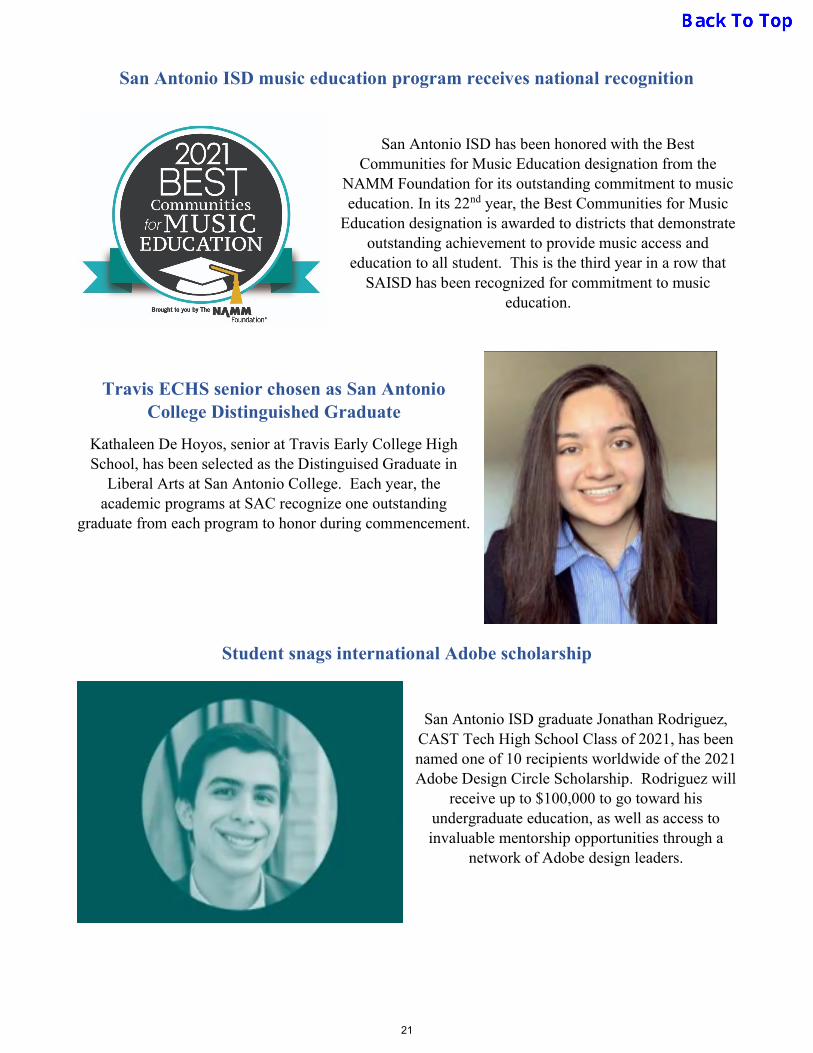
San Antonio ISD music education program receives national recognition
San Antonio ISD has been honored with the Best Communities for Music Education designation from the
NAMM Foundation for its outstanding commitment to music education. In its 22nd year, the Best Communities for Music
Education designation is awarded to districts that demonstrate outstanding achievement to provide music access and
education to all student. This is the third year in a row that SAISD has been recognized for commitment to music
education.
Travis ECHS senior chosen as San Antonio College Distinguished Graduate
Kathaleen De Hoyos, senior at Travis Early College High School, has been selected as the Distinguised Graduate in
Liberal Arts at San Antonio College. Each year, the academic programs at SAC recognize one outstanding
graduate from each program to honor during commencement.
Student snags international Adobe scholarship
San Antonio ISD graduate Jonathan Rodriguez, CAST Tech High School Class of 2021, has been named one of 10 recipients worldwide of the 2021 Adobe Design Circle Scholarship. Rodriguez will
receive up to $100,000 to go toward his undergraduate education, as well as access to invaluable mentorship opportunities through a
network of Adobe design leaders.
21
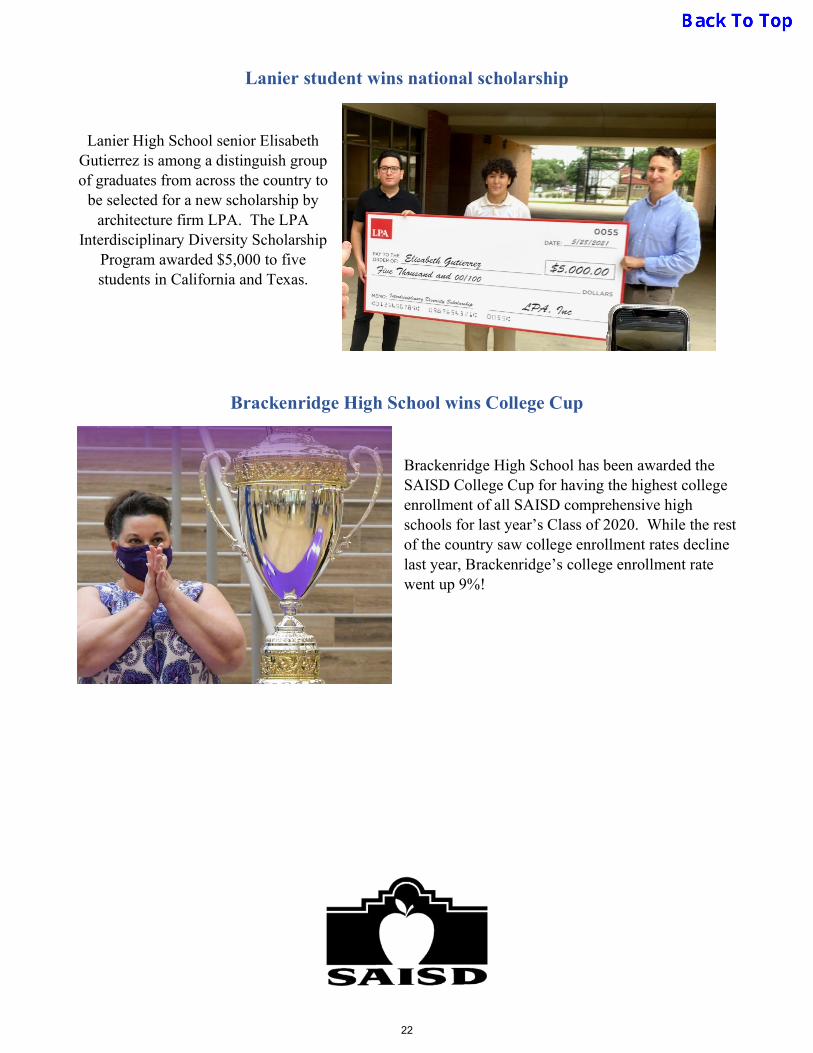
Lanier student wins national scholarship
Lanier High School senior Elisabeth Gutierrez is among a distinguish group of graduates from across the country to
be selected for a new scholarship by architecture firm LPA. The LPA
Interdisciplinary Diversity Scholarship Program awarded $5,000 to five students in California and Texas.
Brackenridge High School wins College Cup
Brackenridge High School has been awarded the SAISD College Cup for having the highest college enrollment of all SAISD comprehensive high schools for last year’s Class of 2020. While the rest of the country saw college enrollment rates decline last year, Brackenridge’s college enrollment rate went up 9%!
22
Board of Education Full biographies for all Trustees are included in Organization Section
Pedro Martinez Superintendent of Schools
Superintendent’s Cabinet Organizational Chart is located in the Organization Section
Christina Martinez President
Sarah Sorensen Trustee
Alicia Sebastian Perry Vice President
Leticia Ozuna Trustee
Arthur V. Valdez Secretary
Patti Radle Trustee
Ed Garza Trustee
Dr. Patricia Baumer Executive Director, Office of Access & Enrollment Services
Willie Burroughs Chief Operations & Building Security Officer
Vacant Chief Innovation Officer
Joe Curiel Chief of Police
Larry Garza Associate Superintendent, Financial Services & Business Operations
Vacant Chief of Staff & Diversity Officer
Laura Short Interim Chief Communications Officer
Patricia Salzmann Deputy Superintendent
Dr. Kenneth Thompson Chief Information Technology & Accountability Officer
Toni Thompson Associate Superintendent, Human Resources
Theresa Urrabazo Senior Executive Director, Accountability, Research & Evaluation
Jenny Arredondo Senior Executive Director, Child Nutrition Services
Yesenia Cordova Assistant Superintendent, Al Levels & Athletics
Gerard Cortez Assistant Superintendent, Behavior & Disability Services
Dr. Joanelda De Leon Assistant Superintendent, Elementary Schools
Kamal ElHabr Associate Superintendent, Facilities Services
Dr. Julio Garcia Assistant Superintendent, All Levels
Daniel Girard Assistant Superintendent, All Levels & International Baccalaureate
Nathan Graf Senior Executive Director, Transportation & Vehicle Maintenance
Garry Hardcastle Senior Executive Director, Organizational Learning & Support Services
Dr. Olivia Hernandez Assistant Superintendent, Learning, Language & Literacy
Elsa Pennell Director, Family Engagement
Lorena Rios Director, Employee Benefit, Risk Management & Safety
Angelica Romero Assistant Superintendent, Innovation Schools
Edward Romero Director, Procurement Services
Chris Salley Senior Executive Director, Facilities Services
Johnny Vahalik Senior Executive Director, Career & Technology
Dr. Stacey Wallace Nurse Practitioner, Student Health Services
Eric Wicker Senior Executive Director, School Improvement & Federal Programs
Kedrick Wright Executive Director, Planning & Construction
Board of Education • Administration
San Antonio Independent School District
23
SCHOOL BOARD HIGHLIGHTS The Board of Education, composed of seven SAISD residents elected by voters of the districts they serve, is the school system’s policy-making body. Prior to 1986 when single-member districts were implemented, School Board members were elected at-large. Trustees serve four-year terms. The Board’s major duties include:
Adopting goals and objectives for the District Reviewing and acting on policies Adopting an annual budget and setting the tax rate Electing school personnel as recommended by the superintendent Reporting to the public on the District’s progress
The Board’s mission is to transform SAISD into a national model urban school district where every child graduates and is educated so that he or she is prepared to be a contributing member of the community. WHEN AND WHERE THE BOARD MAKES ITS DECISIONS
All District School Board meetings are open to the public, and unless otherwise noted are held at 5:30 p.m. the second and third Mondays of the month at the Central Office Board Room, 514 W. Quincy St. Upon providing proper notice, Trustees also may hold special meetings and work sessions as needed. In accordance with the Texas Open Meetings Act, portions of a School Board meeting may be closed to the public for topics including, but not limited to: real estate transactions, personnel matters, student hearings, and legal matters. Business meetings of the SAISD Board of Education are generally held on the second and third Mondays of each month. All meetings are subject to change due to conflicts with federal holidays and/or school district events. All meetings will be posted in accordance with the requirements of the Texas Open Meetings Act. All meetings of the Board are open to the public. Citizens who wish to present any matter of concern
must sign up before the meeting begins. The Board may go into closed (executive) session at any time during a meeting to consider matters regarding personnel, real estate, security, school children, negotiated contracts for prospective gifts or donations, consultation, and/or legal issues, and for receiving information, all as may be permitted under the Open Meetings Act. A schedule of board meetings is found on the next page and is also posted on the district’s web site. PUBLIC (CITIZENS’) PARTICIPATION
Any citizen wishing to present information to the Board may do so by signing up to speak before the meeting begins. Each presentation is limited to three minutes. Remarks may be related to any topic, whether agenda items or non-agenda items. The overall time limit for public comments at business meetings is 60 minutes and 30 minutes at work sessions.
24

2020-2021 MEETING SCHEDULE
All dates, locations and times are subject to change.
2021
Board Meeting A Board Meeting B
N/A Monday, June 21
N/A Monday, July 19
N/A Monday, August 16
Monday, September 13 Monday, September 20
Tuesday, October 12 Monday, October 18
Monday, November 8 Monday, November 15
Monday, December 6 Monday, December 13
2022
Board Meeting A Board Meeting B
Monday, January 10 Tuesday, January 18
Tuesday, February 15 Tuesday, February 22
Tuesday, March 15 Monday, March 21
Monday, April 11 Monday, April 18
Monday, May 9 Monday, May 16
N/A Monday, June 20
N/A Monday, July 18
25
CONSULTANTS & ADVISORS
LEGAL & BOND COUNSEL
ESCAMILLA & PONECK, INC. 700 ST. MARY’S STREET, SUITE 850
SAN ANTONIO, TEXAS 78205 (210) 225-0001
FINANCIAL ADVISOR
FROST BANK CAPITAL MARKETS DIVISION 111 W. HOUSTON ST.
SAN ANTONIO, TEXAS 78205 (210) 220-4590
DELINQUENT TAX ATTORNEY
LINEBARGER, GOGGAN, BLAIR & SAMPSON, LLP 711 NAVARRO, SUITE 300
SAN ANTONIO, TEXAS 78205 (210) 225-4422
INDEPENDENT AUDITORS
GARZA/GONZALEZ & ASSOCIATES 207 ARDEN GROVE
SAN ANTONIO, TEXAS 78215 (210) 227-1389
DEPOSITORY BANK
FROST BANK 111 W. HOUSTON ST.
SAN ANTONIO, TEXAS 78205 (210) 220-4077
26

ORGANIZATIONAL
SECTION
OUR MISSION, BELIEFS AND CORE VALUES
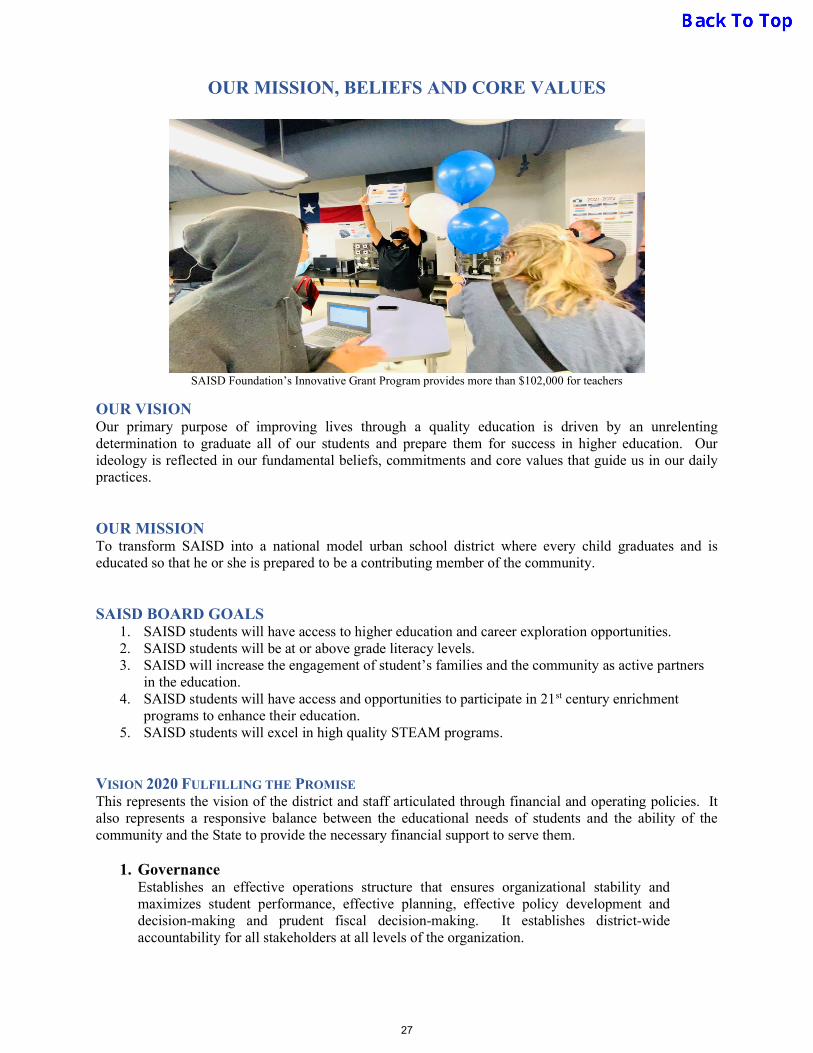
SAISD Foundation’s Innovative Grant Program provides more than $102,000 for teachers
OUR VISION Our primary purpose of improving lives through a quality education is driven by an unrelenting determination to graduate all of our students and prepare them for success in higher education. Our ideology is reflected in our fundamental beliefs, commitments and core values that guide us in our daily practices.
OUR MISSION To transform SAISD into a national model urban school district where every child graduates and is educated so that he or she is prepared to be a contributing member of the community.
SAISD BOARD GOALS 1. SAISD students will have access to higher education and career exploration opportunities.2. SAISD students will be at or above grade literacy levels.3. SAISD will increase the engagement of student’s families and the community as active partners
in the education.4. SAISD students will have access and opportunities to participate in 21st century enrichment
programs to enhance their education.5. SAISD students will excel in high quality STEAM programs.
VISION 2020 FULFILLING THE PROMISE This represents the vision of the district and staff articulated through financial and operating policies. It also represents a responsive balance between the educational needs of students and the ability of the community and the State to provide the necessary financial support to serve them.
1. GovernanceEstablishes an effective operations structure that ensures organizational stability andmaximizes student performance, effective planning, effective policy development anddecision-making and prudent fiscal decision-making. It establishes district-wideaccountability for all stakeholders at all levels of the organization.
27
2. Teaching and Learning Establishes expectations of excellence and equity in student academic performance and provides high quality instructional programs for all students.
3. Student Support
Establishes expectations of excellence and equity in student social and life skill development and provides high quality and personalized student support services to all students.
4. Administration
Establishes an effective, efficient organizational structure that promotes excellence in the performance of all District staff and ensures high quality administrative support services through a district-wide accountability system.
5. Human Resources Establishes an effective recruitment, hiring, and retention process to maintain the desired quantity and quality of personnel necessary to achieve the organization’s mission.
6. Technology Establishes and maintains state-of-art technology to support academic instruction, management information, and administrative services.
7. Communications Provides and maintains effective internal and external two-way communications that inform all stakeholders throughout the school district in a systematic and comprehensive way and that are disseminated continuously and promptly.
8. School-Community Relations
Establishes and maintains student-centered and meaningful relationships with parents, business, civic, and community leaders to provide meaningful support to the public schools.
9. Special Facilities Construction and Improvement Initiative (Bond
Construction): Ensures effective and efficient implementation of the facilities construction and improvement program.
OUR BELIEFS AND COMMITMENTS
Every student and staff member should be valued and that their differences should be honored and respected.
o We will ensure a high level of professionalism, customer service and respect for everyone.
o We will lead by example.
Every student should have equitable access to an excellent educational experience and can learn and achieve at high levels.
o We will make all decisions based on attaining student achievement at or above grade level.
o We will ensure that all decisions, actions, and resource allocations are made in the best interest of the students.
28
Every student and staff member is entitled to a safe and secure learning and work
environment.
o We will ensure a safe learning and working environment for all students and employees.
Every District operation should be managed and monitored efficiently and effectively.
o We will ensure fiscal responsibility to the taxpayers of the District.
OUR CORE VALUES
In order to achieve our goals and attain our commitments we expect the following values
to guide the behavior of all District employees:
Student Centered
High Expectations
Commitment
Passion
Integrity
Respect
Teamwork
Celebrating the first day of the school year 2021-2022.
29
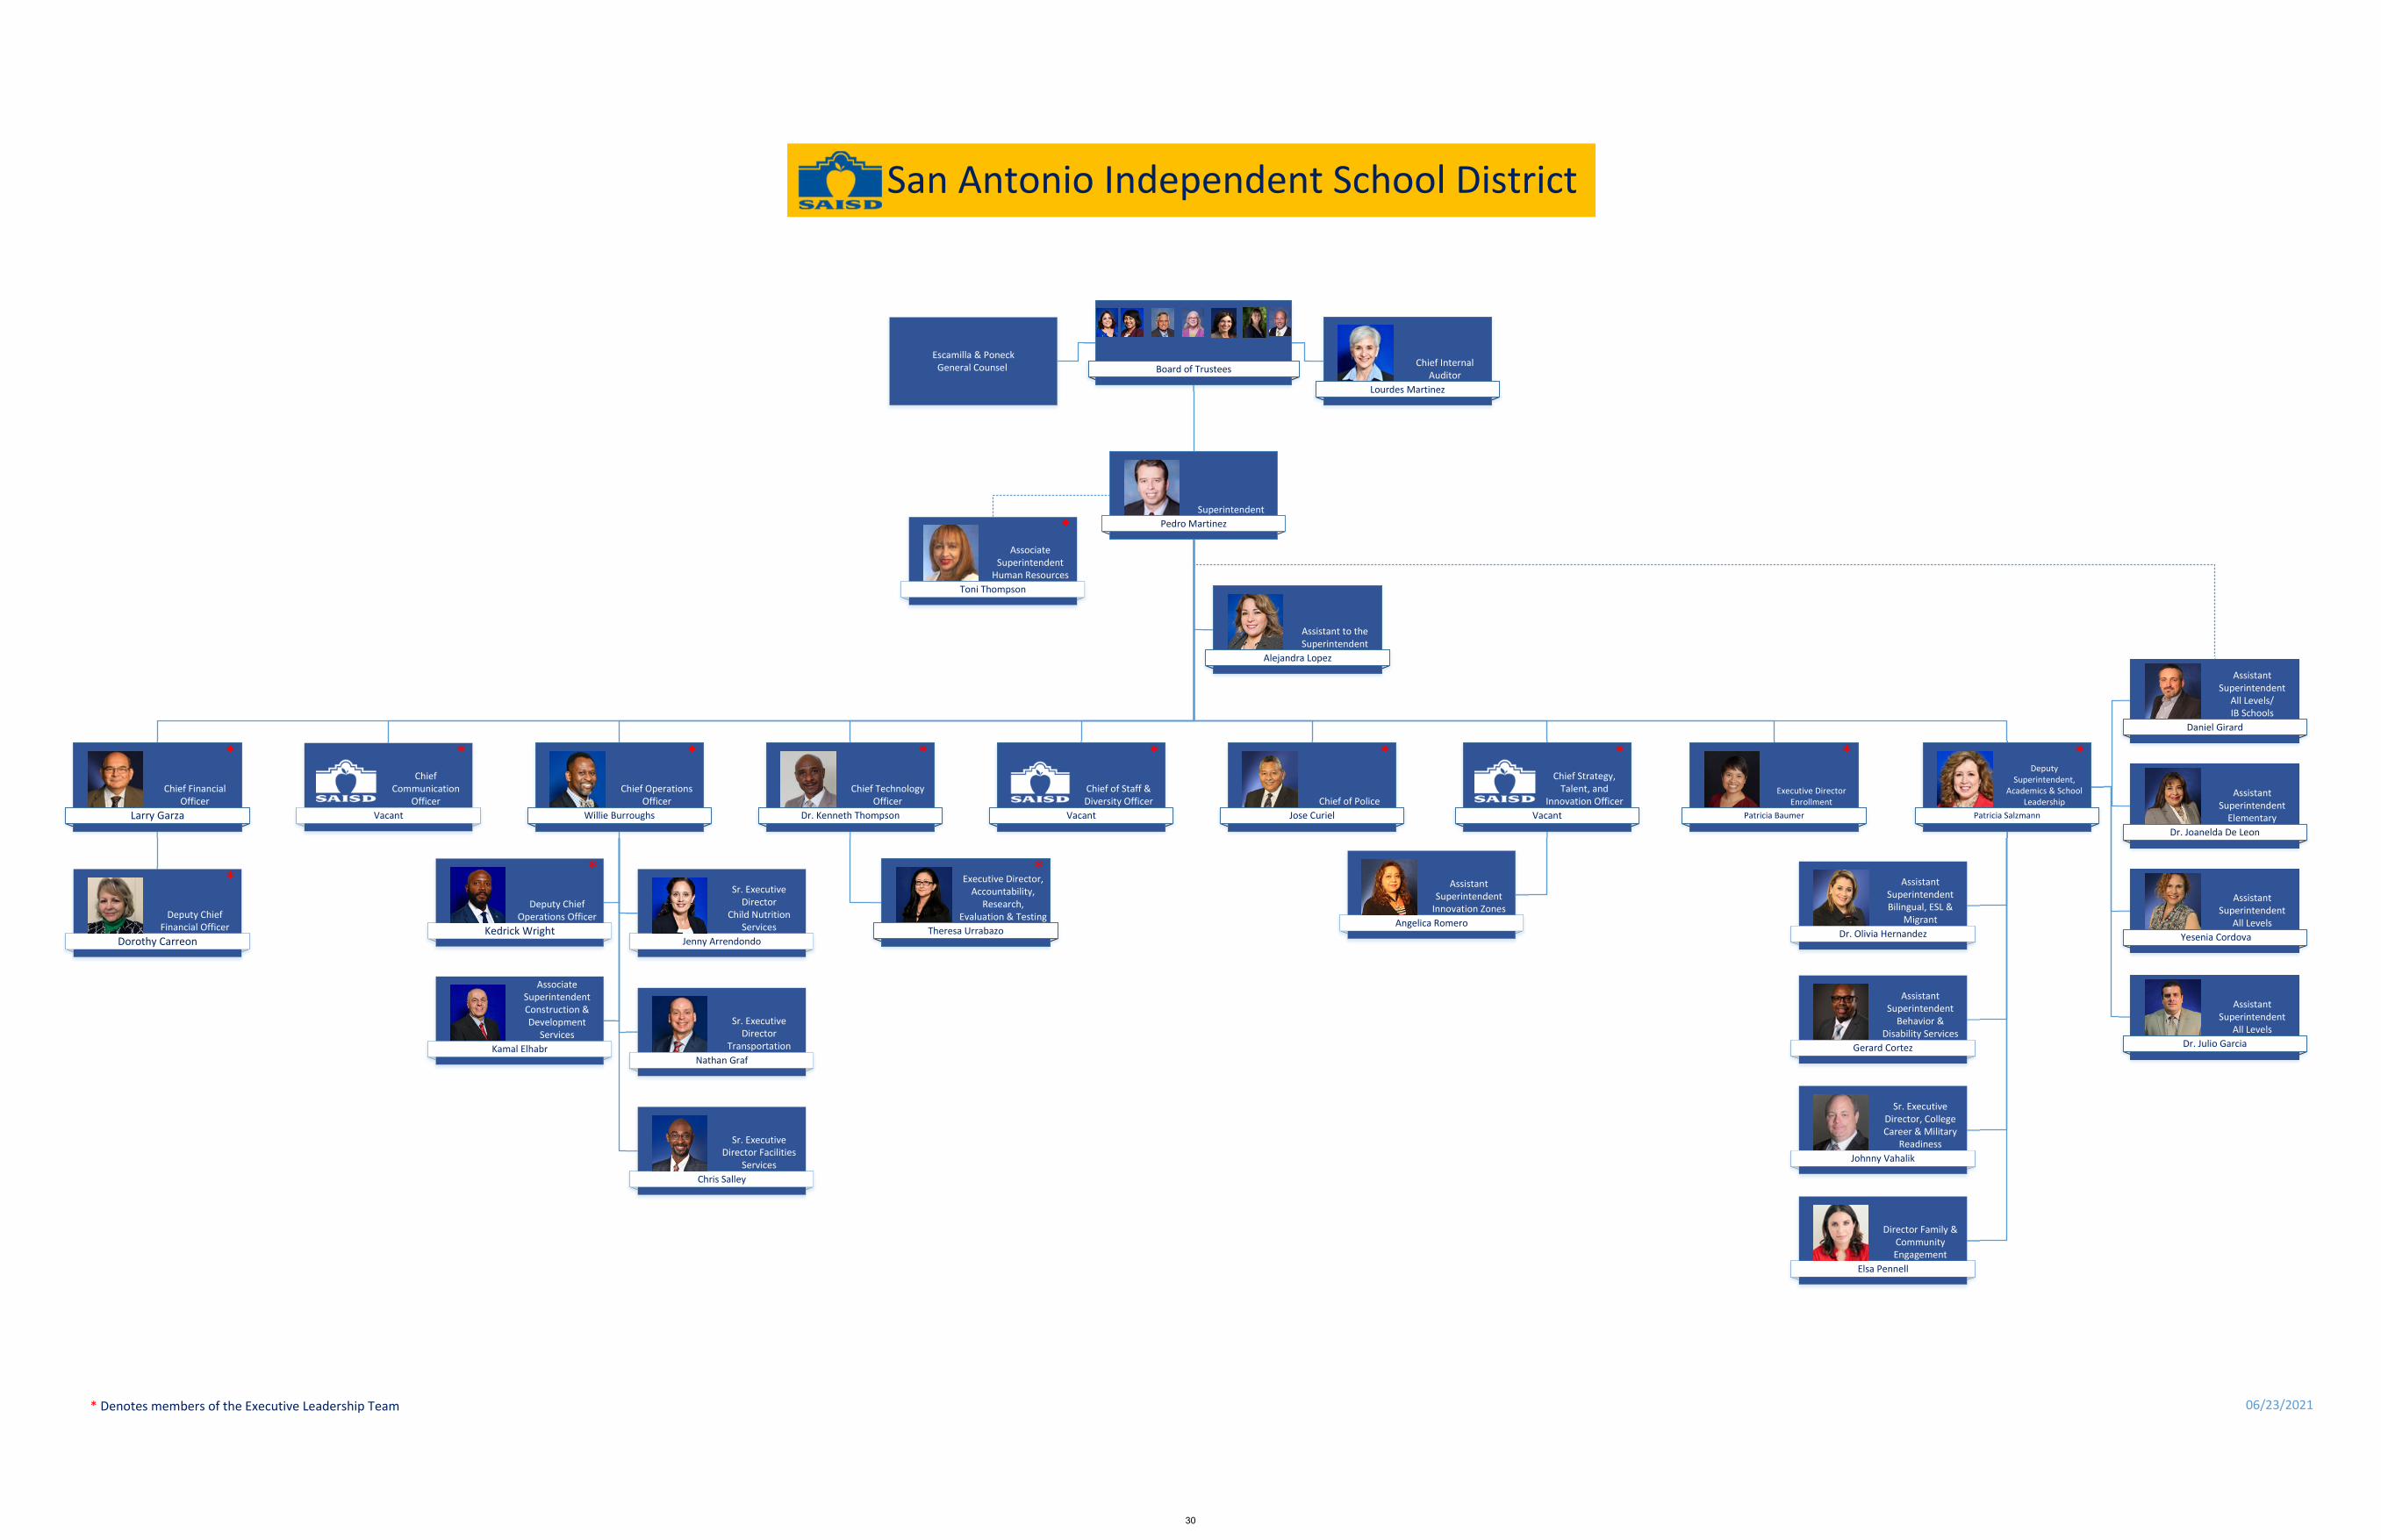
Pedro MartinezSuperintendent
Jose Curiel Chief of Police
Dr. Kenneth Thompson
Chief Technology Officer
Larry Garza
Chief Financial Officer
Angelica Romero
Assistant Superintendent Innovation Zones
Patricia Salzmann
Deputy Superintendent,
Academics & School Leadership
Gerard Cortez
Assistant Superintendent Behavior &
Disability Services
Johnny Vahalik
Sr. Executive Director, College Career & Military
Readiness
Dr. Olivia Hernandez
Assistant Superintendent Bilingual, ESL &
MigrantTheresa Urrabazo
Executive Director, Accountability,
Research, Evaluation & Testing
Vacant
Chief of Staff & Diversity Officer
Vacant
Chief Strategy, Talent, and
Innovation Officer
Toni Thompson
Associate Superintendent Human Resources
Vacant
Chief Communication
OfficerWillie Burroughs
Chief Operations Officer
Jenny Arrendondo
Sr. Executive Director
Child Nutrition ServicesKedrick Wright
Deputy Chief Operations Officer
Kamal Elhabr
Associate Superintendent Construction & Development
Services
Nathan Graf
Sr. Executive Director
Transportation
Yesenia Cordova
Assistant Superintendent
All Levels
Daniel Girard
Assistant Superintendent
All Levels/ IB Schools
Dr. Joanelda De Leon
Assistant Superintendent Elementary
Dr. Julio Garcia
Assistant Superintendent
All Levels
Board of Trustees
Lourdes Martinez
Chief Internal Auditor
Alejandra Lopez
Assistant to the Superintendent
Patricia Baumer
Executive Director Enrollment
Escamilla & PoneckGeneral Counsel
San Antonio Independent School District
* ** **
*
***
* Denotes members of the Executive Leadership Team 06/23/2021
Chris Salley
Sr. Executive Director Facilities
Services
Elsa Pennell
Director Family & Community Engagement
*
*
*
Dorothy Carreon
Deputy Chief Financial Officer
*
30
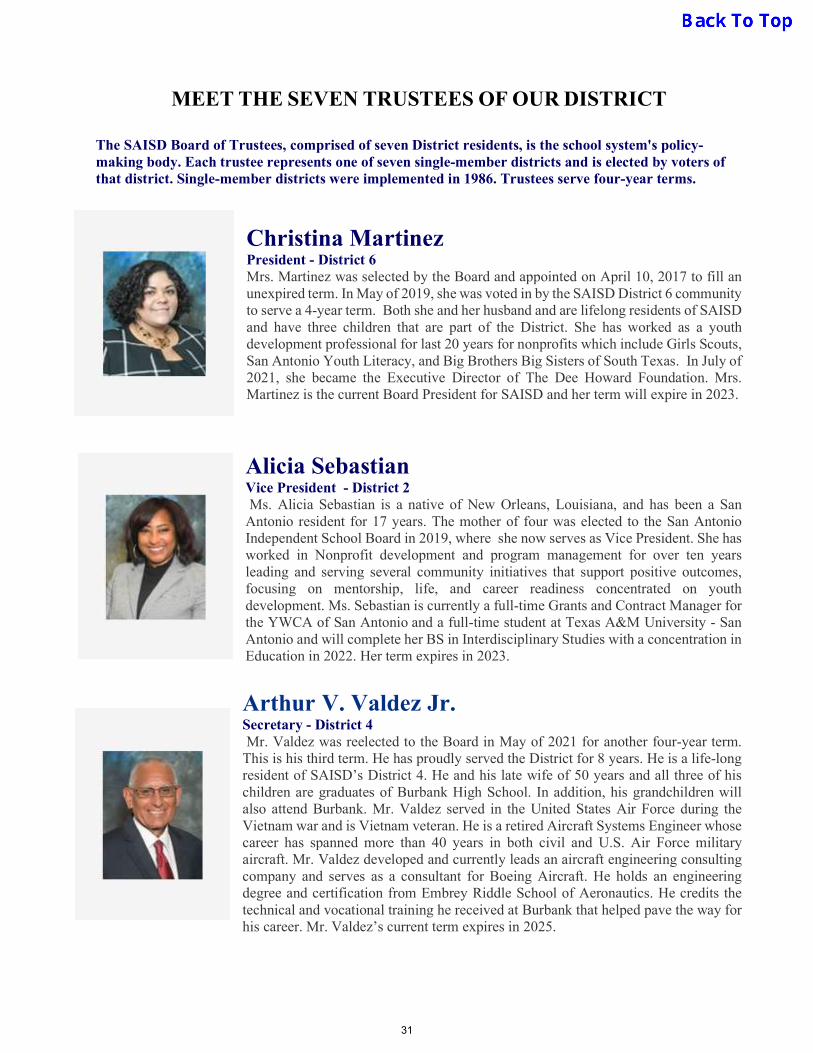
MEET THE SEVEN TRUSTEES OF OUR DISTRICT The SAISD Board of Trustees, comprised of seven District residents, is the school system's policy-making body. Each trustee represents one of seven single-member districts and is elected by voters of that district. Single-member districts were implemented in 1986. Trustees serve four-year terms.
Christina Martinez President - District 6 Mrs. Martinez was selected by the Board and appointed on April 10, 2017 to fill an unexpired term. In May of 2019, she was voted in by the SAISD District 6 community to serve a 4-year term. Both she and her husband and are lifelong residents of SAISD and have three children that are part of the District. She has worked as a youth development professional for last 20 years for nonprofits which include Girls Scouts, San Antonio Youth Literacy, and Big Brothers Big Sisters of South Texas. In July of 2021, she became the Executive Director of The Dee Howard Foundation. Mrs. Martinez is the current Board President for SAISD and her term will expire in 2023.
Alicia Sebastian
Vice President - District 2
Ms. Alicia Sebastian is a native of New Orleans, Louisiana, and has been a San Antonio resident for 17 years. The mother of four was elected to the San Antonio Independent School Board in 2019, where she now serves as Vice President. She has worked in Nonprofit development and program management for over ten years leading and serving several community initiatives that support positive outcomes, focusing on mentorship, life, and career readiness concentrated on youth development. Ms. Sebastian is currently a full-time Grants and Contract Manager for the YWCA of San Antonio and a full-time student at Texas A&M University - San Antonio and will complete her BS in Interdisciplinary Studies with a concentration in Education in 2022. Her term expires in 2023.
Arthur V. Valdez Jr.
Secretary - District 4
Mr. Valdez was reelected to the Board in May of 2021 for another four-year term. This is his third term. He has proudly served the District for 8 years. He is a life-long resident of SAISD’s District 4. He and his late wife of 50 years and all three of his children are graduates of Burbank High School. In addition, his grandchildren will also attend Burbank. Mr. Valdez served in the United States Air Force during the Vietnam war and is Vietnam veteran. He is a retired Aircraft Systems Engineer whose career has spanned more than 40 years in both civil and U.S. Air Force military aircraft. Mr. Valdez developed and currently leads an aircraft engineering consulting company and serves as a consultant for Boeing Aircraft. He holds an engineering degree and certification from Embrey Riddle School of Aeronautics. He credits the technical and vocational training he received at Burbank that helped pave the way for his career. Mr. Valdez’s current term expires in 2025.
31

Sarah Sorensen Trustee - District 1 Ms. Sorensen was elected to the Board of Trustees in May 2021. She is an experienced public education advocate with a track record of speaking up for students, families, teachers and school workers. Ms. Sorensen is the proud parent of an SAISD student. She has been an active parent volunteer serving on the PTA and various school committees. Ms. Sorensen has a background in public policy, research, advocacy, organizing, coalition building and project management. She has worked in nonprofits and state and local government. She holds a Bachelor’s degree in Social Work from the University of Montana and a Master’s degree in Public Affairs and Policy from the University at Albany, State University of New York. Her term expires in 2025.
Leticia Ozuna Trustee - District 3 Leticia Ozuna was elected to the Board of Trustees in May of 2021. She is a third generation SAISD alumni and a proud parent of a recent SAISD graduate. Ms. Ozuna served on the San Antonio City Council and the San Antonio Water System Board of Trustees. As an active parent, she supported students as a Girl Scout Leader, a sports team mom, and a PTA member. Professionally, she is a Principal Senior Engineer and Cybersecurity Subject Matter Expert supporting the United States Space Force. Her post-secondary education and degrees are from the University of Texas at Austin, Texas A&M at College Station and Our Lady of the Lake University, San Antonio. Ms. Ozuna is an outcome oriented collaborator and looks forward to serving her community. Her term expires in 2025.
Patti Radle Trustee - District 5 Mrs. Radle was elected to the San Antonio Independent School District Board of Trustees in May of 2011. She is a graduate of Marquette University with a major in Theology. She obtained her teacher and bilingual certification and a second major in English from Our Lady of the Lake University. She taught elementary in SAISD for 12 years and taught high school and middle school in other Districts. She served on the San Antonio City Council from 2003-2007. Ms. Radle has also served, with her husband, as the Volunteer Director of Inner City Development since 1972. Her current term expires in 2023.
Ed Garza Trustee - District 7 Mr. Garza was elected to the Board in May 2009. He is a third generation SAISD graduate of Thomas Jefferson High School. He earned a Bachelor’s degree in landscape architecture-urban planning and a Master of Science degree in land development from Texas A&M University. Mr. Garza previously served two terms both on the City Council and as Mayor of San Antonio. Mr. Garza and his wife are active members of St. Paul Catholic Church, the Jefferson-Woodlawn Lake neighborhood and other local charitable organizations. Mr. Garza’s current term expires in 2025.
32

FROM OUR ORIGINS TO THE PRESENT
100% of SAISD students have access to Fine Arts
SAISD is as diverse and historically rich as the city whose name it shares. As San Antonio’s founding school district, SAISD neighborhood schools have served the heart of the Alamo City for more than 100 years. Today, SAISD serves about 47,000 students across more than 90 schools in our culturally proud, urban community. We offer a wide variety of programs, including dual-language, career exploration and college-preparation. Along with traditional school models, we also offer academies comprising non-traditional grade ranges such as PK-8.
True to our roots, SAISD continues to pave the way in San Antonio with the city’s only public Montessori school, single-gender campuses, and K-12 International Baccalaureate framework. Additionally, the District has grown 5 P-TECH programs in just a few years.
Outside of the traditional classroom, the spirit of SAISD can be found in programs and activities from extensive athletics to fine arts – including a mariachi curriculum that was pioneered in our District before being modeled across the nation.
CHOICES AVAILABLE TO PARENTS
From forward-thinking academic and extracurricular programs at our neighborhood schools to a growing list of specialized schools, SAISD students can customize their own educational experience and find what truly drives them. Every student has a journey, and SAISD is supporting that path wherever it may lead for each of its students. Our approximately 47,000 students attend:
- 15 High Schools - 10 Traditional Middle Schools (6-8) - 18 Academies (PK-8) - 42 Elementary Schools - 5 Early Childhood Education Centers - 9 Special Campuses
33
WHAT SAISD OFFERS STUDENTS 3 Single-Gender Schools: • Young Women’s Leadership Academy- A 6th-12th grade, all-girls, two time National Blue Ribbon
School, the focus of San Antonio's first all-girls public school is on math, science, and technology, along with college preparation, career development, and community involvement.
• Young Women’s Leadership Academy Primary- (YWLA Primary) is San Antonio’s first public,
tuition-free, all-girls elementary school. With special focuses on STEAM (science, technology, engineering, the arts, and mathematics), social-emotional learning, and early college preparation.
• Young Men’s Leadership Academy- All-boys school grades 4-9th. Focuses on character, leadership
and discipline and provides educational setting tailored to the male learner.
5 Career-Focused P-TECH/Early College High Schools: • Cyber Security P-TECH at Sam Houston HS is the first in the city and county. Through St.
Philip’s, students will have the opportunity to earn an Associate of Applied Science in Information Technology Cybersecurity Specialist degree
• Nursing H-TECH program at Fox Tech High School where students will work toward both their
high school diploma as well as an associate degree for careers in nursing and healthcare. • School of Business P-TECH program at Edison HS offers college-level courses towards post-
secondary degree or credentials from San Antonio College. • Highlands P-TECH – Aerospace, Engineering, Manufacturing, Welding program at Highlands
HS offers 4 different programs of study. • Construction Science P-TECH program at Lanier HS offers an advanced and rigorous curriculum
in all core subjects with a focus on career opportunities in Construction Technology, Construction Science and Management, or Power Generation and Alternative Energy
3 Early College High Schools: • Travis Early College High School- Offered at no cost, in partnership with San Antonio College,
this academically advanced environment is designed to immerse students in a culture of higher education. Students can earn an associate's degree and/or up to 60 hours, or two years of college credit, toward a bachelor's degree upon high school graduation.
• St. Philip's Early College High School- A partnership between SAISD and Alamo Colleges, is
SAISD's newest early college high school. It opened to its inaugural class of freshmen on the campus of St. Philip's College in August 2014. The school gives students a jumpstart on their futures by providing them the opportunity to earn up to 60 hours of college credit – that’s two years’ worth of college – or to earn an associate degree, in addition to earning their high school diploma. Students also have the opportunity to obtain a certificate in a high-demand industry – all at no cost to the students or their families.
• Brackenridge Early College High School- This unique school is designed to provide students the opportunity to attend high school on a traditional high school campus while also attending college. The typical comprehensive high school experience is redefined by providing a small school setting inside a high school campus. Students will seamlessly transition from the- ninth grade through the first two years of college earning both their high school Distinguished Diploma and an Associate of Arts (A.A.) from St. Philip’s College.
34
• International Baccalaureate (IB) – IB framework at 9 schools (five IB World schools and four IB Candidate schools). SAISD is the only district in the country with IB at the elementary, middle and high school levels.
• Fox Tech High School - A stand-alone magnet school dedicated to developing future health and law
professionals. Our college-preparatory magnets are designed for students interested in pursuing pre-med or pre-law degrees but provide a solid academic foundation for any eligible college-bound student living either inside or outside of the SAISD boundaries. Located in the heart of downtown, students can draw on a host of legal and medical professionals in close proximity to the school, to experience specialized learning programs and career opportunities within their field of interest.
• CAST Tech High School- The Centers for Applied Science and Technology school that will work hand-in-hand with industry partners to prepare student s for careers in technology and business, fields where the demand is high for talented workers. CAST Tech will use computer based learning to allow students to progress more quickly in areas where they have mastered concepts, allowing them to dive more deeply into projects and areas with great interest. College coursework in embedded in the program, and students can graduate with an associate’s degree, industry certifications and portfolios that feature long-term projects and other examples of their work.
• CAST Med High School- A public high school that provides high school students a strong
foundation, especially in mathematics and science, so that they can be successful once they enroll in college an achieve their medical career aspirations. College coursework will be embedded in classroom curriculum, allowing student to graduate with a high school diploma and a minimum of 30 hours of college coursework.
• Advanced Learning Academy- A partnership between SAISD and Trinity University, this school
was designed for students who seek academic challenge with greater depth and complexity and opportunities for acceleration. Advanced Learning Academy will be located across two campuses, opening with Pre-kindergarten through 3rd grades housed at the site of the former Austin Academy, and the majority of the grades, 4th through 11th, at nearby Fox Tech High School.
• Steele Montessori Academy- opened in August of 2017 with ages 3 to 6, and will expand to age 12 in subsequent years. A mix of younger and older children in the same development stage allows students to advance seamlessly as they are ready for more challenging material, build authentic community and learn from both teachers and peers. • Rodriguez Montessori Elementary- opened in August of 2020 with ages 3 to 6, expanding to fifth grade in subsequent years. Based on research, the school’s dual language pathway is expected
to help increase students’ creativity and problem-solving, boost their mental ability, and promote higher performance on standardized tests.
• Early Childhood Education- Qualified students starting at age 3 are afforded the firm academic
foundation necessary for life-long success through this full-day program available at all SAISD elementaries and pre-kinder to grades 5-8 academies.
• Full Day Kindergarten is provided at all SAISD elementary schools and pre-kinder to grade 8
academies. • Free breakfast and lunch to all students.
35

• Pre-kinder to Grade 8 Academies- Eighteen schools are taking a lesson from the past to create a learning experience that’s thoroughly modern by serving both elementary- and middle school-age youngsters at the same campus.
• Dual Language Programs at over 60 schools. Students will have the opportunity to become fluent
in both English and Spanish. The schools teaching model will put students who are native speakers of each language in the same classrooms to learn side-by-side.
• Emergency Medical Technician (EMT) Program at Edison HS as part of the Health Professions’
First Responder Institute, which also offers fire fighting and law enforcement. • Fine Arts – All K-5 students are provided with art class. 100% of SAISD students have access to
fine arts. • In-District Charter Schools- Students can start cultivating the talents and abilities that could lead to
future careers while receiving challenging academics at any of the District’s charters. This designation allows open enrollment throughout Bexar County, and permits these schools flexibility to develop programs specifically designed for their students’ unique learning styles.
• The Magnets- The future is now for students enrolled in the SAISD's Magnet programs where
hands-on experiences and advanced academics provide opportunities to explore tomorrow’s careers. The District hosts high school and middle school level Magnet programs offering specialties including health professions, the International Baccalaureate Diploma, business and finance, law, media productions, multilingual studies, and science, engineering and technology.
• College Readiness- SAISD perpetuates a culture in which higher education isn’t just an option; it’s
expected. A number of programs and partnerships are helping students prepare, including:
-Advancement Via Individual Determination to provide a college preparatory path. -Advanced Placement for teens wanting to earn college credit while in high school. -ChemBridge, a collaboration between the University of Texas at Austin and all SAISD high schools allowing students to receive three hours of college chemistry credit while earning concurrent high school credit for an advanced science class. -College Connections, a partnership with the Alamo Community Colleges and all SAISD high schools through which students may apply online to an ACC school from their home campuses. Enrollment is guaranteed. -Project STAY San Antonio, a non-profit college placement service organization. -Project Phoenix based at St. Philip’s College Southwest Campus where students earn dual high school and college credit.
The new Frontline Parent Portal is an easy-to-use and secure communication tool that allows parents/guardians to monitor their child’s progress in real time.
36
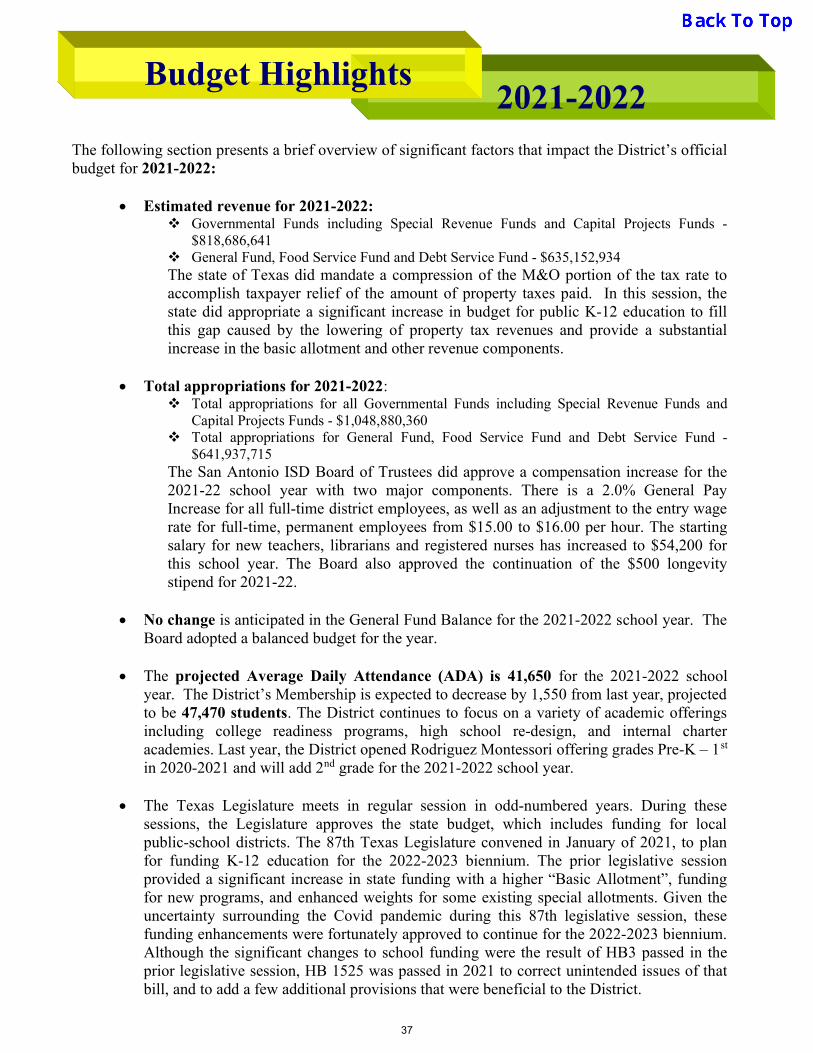
2021-2022Budget Highlights
The following section presents a brief overview of significant factors that impact the District’s official budget for 2021-2022:
Estimated revenue for 2021-2022: Governmental Funds including Special Revenue Funds and Capital Projects Funds -
$818,686,641 General Fund, Food Service Fund and Debt Service Fund - $635,152,934The state of Texas did mandate a compression of the M&O portion of the tax rate toaccomplish taxpayer relief of the amount of property taxes paid. In this session, thestate did appropriate a significant increase in budget for public K-12 education to fillthis gap caused by the lowering of property tax revenues and provide a substantialincrease in the basic allotment and other revenue components.
Total appropriations for 2021-2022: Total appropriations for all Governmental Funds including Special Revenue Funds and
Capital Projects Funds - $1,048,880,360 Total appropriations for General Fund, Food Service Fund and Debt Service Fund -
$641,937,715The San Antonio ISD Board of Trustees did approve a compensation increase for the 2021-22 school year with two major components. There is a 2.0% General Pay Increase for all full-time district employees, as well as an adjustment to the entry wage rate for full-time, permanent employees from $15.00 to $16.00 per hour. The starting salary for new teachers, librarians and registered nurses has increased to $54,200 for this school year. The Board also approved the continuation of the $500 longevity stipend for 2021-22.
No change is anticipated in the General Fund Balance for the 2021-2022 school year. TheBoard adopted a balanced budget for the year.
The projected Average Daily Attendance (ADA) is 41,650 for the 2021-2022 schoolyear. The District’s Membership is expected to decrease by 1,550 from last year, projectedto be 47,470 students. The District continues to focus on a variety of academic offeringsincluding college readiness programs, high school re-design, and internal charteracademies. Last year, the District opened Rodriguez Montessori offering grades Pre-K – 1st
in 2020-2021 and will add 2nd grade for the 2021-2022 school year.
The Texas Legislature meets in regular session in odd-numbered years. During thesesessions, the Legislature approves the state budget, which includes funding for localpublic-school districts. The 87th Texas Legislature convened in January of 2021, to planfor funding K-12 education for the 2022-2023 biennium. The prior legislative sessionprovided a significant increase in state funding with a higher “Basic Allotment”, fundingfor new programs, and enhanced weights for some existing special allotments. Given theuncertainty surrounding the Covid pandemic during this 87th legislative session, thesefunding enhancements were fortunately approved to continue for the 2022-2023 biennium.Although the significant changes to school funding were the result of HB3 passed in theprior legislative session, HB 1525 was passed in 2021 to correct unintended issues of thatbill, and to add a few additional provisions that were beneficial to the District.
37
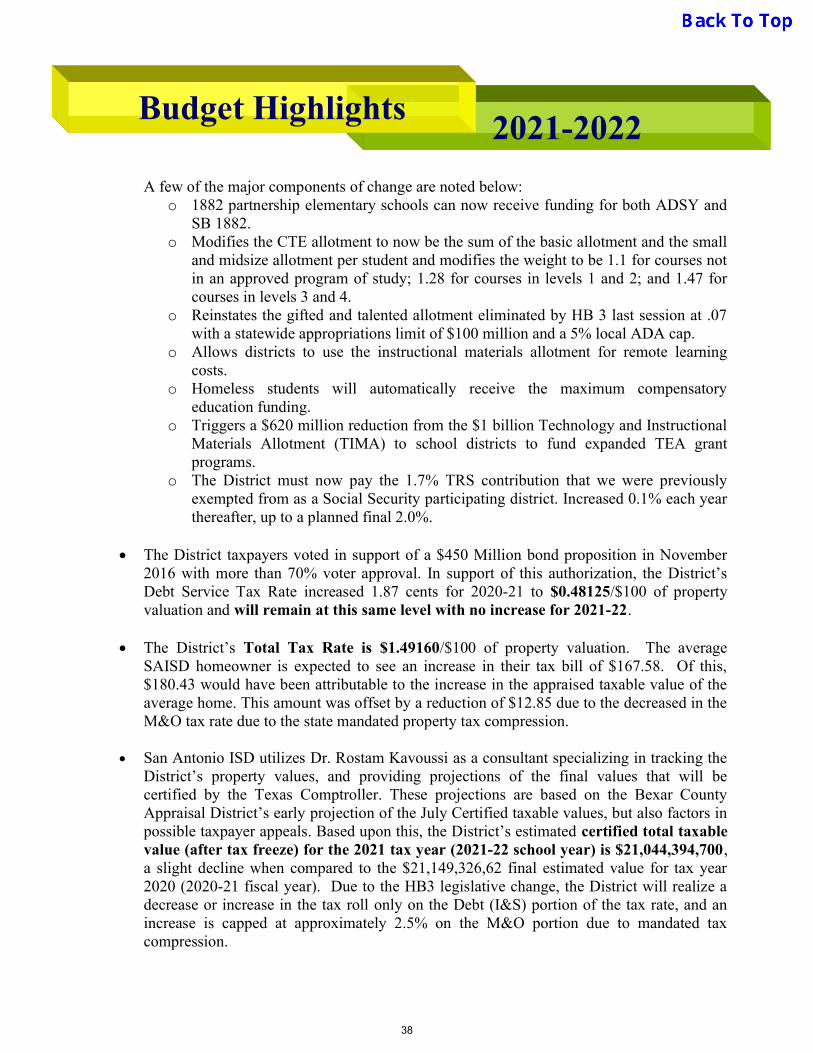
2021-2022 Budget Highlights
A few of the major components of change are noted below:
o 1882 partnership elementary schools can now receive funding for both ADSY and SB 1882.
o Modifies the CTE allotment to now be the sum of the basic allotment and the small and midsize allotment per student and modifies the weight to be 1.1 for courses not in an approved program of study; 1.28 for courses in levels 1 and 2; and 1.47 for courses in levels 3 and 4.
o Reinstates the gifted and talented allotment eliminated by HB 3 last session at .07 with a statewide appropriations limit of $100 million and a 5% local ADA cap.
o Allows districts to use the instructional materials allotment for remote learning costs.
o Homeless students will automatically receive the maximum compensatory education funding.
o Triggers a $620 million reduction from the $1 billion Technology and Instructional Materials Allotment (TIMA) to school districts to fund expanded TEA grant programs.
o The District must now pay the 1.7% TRS contribution that we were previously exempted from as a Social Security participating district. Increased 0.1% each year thereafter, up to a planned final 2.0%.
The District taxpayers voted in support of a $450 Million bond proposition in November
2016 with more than 70% voter approval. In support of this authorization, the District’s Debt Service Tax Rate increased 1.87 cents for 2020-21 to $0.48125/$100 of property valuation and will remain at this same level with no increase for 2021-22.
The District’s Total Tax Rate is $1.49160/$100 of property valuation. The average SAISD homeowner is expected to see an increase in their tax bill of $167.58. Of this, $180.43 would have been attributable to the increase in the appraised taxable value of the average home. This amount was offset by a reduction of $12.85 due to the decreased in the M&O tax rate due to the state mandated property tax compression.
San Antonio ISD utilizes Dr. Rostam Kavoussi as a consultant specializing in tracking the
District’s property values, and providing projections of the final values that will be certified by the Texas Comptroller. These projections are based on the Bexar County Appraisal District’s early projection of the July Certified taxable values, but also factors in possible taxpayer appeals. Based upon this, the District’s estimated certified total taxable value (after tax freeze) for the 2021 tax year (2021-22 school year) is $21,044,394,700, a slight decline when compared to the $21,149,326,62 final estimated value for tax year 2020 (2020-21 fiscal year). Due to the HB3 legislative change, the District will realize a decrease or increase in the tax roll only on the Debt (I&S) portion of the tax rate, and an increase is capped at approximately 2.5% on the M&O portion due to mandated tax compression.
38

FINANCIAL STRUCTURE AND BASIS OF ACCOUNTING
DESCRIPTION OF ENTITY
The San Antonio Independent School District is a public educational agency operating under the applicable laws and regulations of the State of Texas. The district is a political subdivision of the State of Texas, governed and operating as an independent school district under the laws thereof, and is therefore fiscally independent. It is governed by a seven-member Board of Trustees elected by registered voters of the district. The SAISD offers a wide range of educational opportunities from pre-kindergarten through grade 12 in academics, arts, and career and technology education. Along with regular education, the district offers services for children with disabilities from three through 21 years of age, English as a second language (ESL) and bilingual education programs. The broad range of elective courses includes the Magnet Schools and extracurricular activities in athletics, fine arts, and UIL competition. During the summer, students may participate in a variety of summer recreation programs, the summer feeding program, summer school for academic and enrichment courses. Our District also provides a community education program which offers academic and enrichment opportunities for both youths and adults. FUND ACCOUNTING
The fund accounts of the district have been established under the rules prescribed in the Financial Accounting and Reporting Module of the Texas Education Agency Financial Accountability System Resource Guide. This budget document contains detailed information for all funds for which the Board of Education is required to adopt annual budgets. Budgets for all funds are prepared using the same method of accounting as for financial reports (modified accrual basis of accounting), except for the Capital Projects Fund budget, which is not legally adopted on an annual basis. Under the modified accrual basis of accounting, revenues are recognized in the accounting period in which they become both measurable and available. Expenditures are recognized in the accounting period in which the fund liability is incurred, if measurable, except for principal and interest on general long-term debt, which is recognized when due. The diagram found on the next page provides an overview of the relationship between the various types of revenue sources and expenditures for each governmental fund. A discussion explaining the district’s revenue sources and governmental fund types immediately follows the diagram.
39
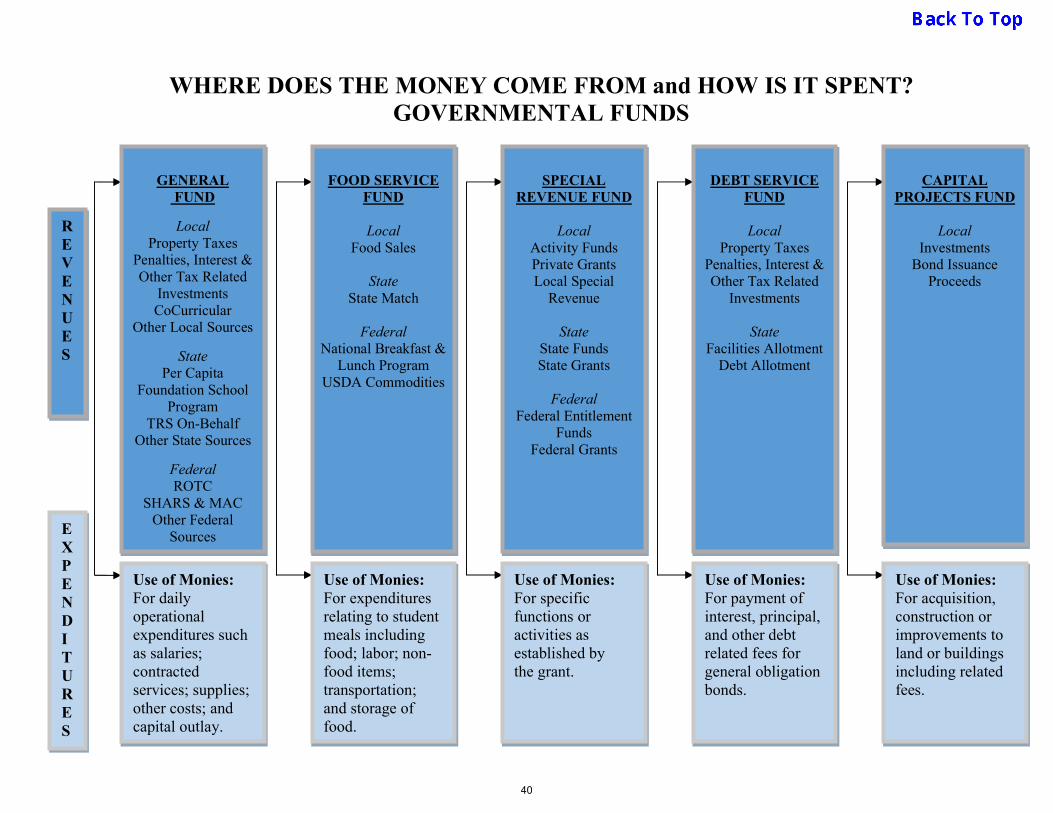
WHERE DOES THE MONEY COME FROM and HOW IS IT SPENT? GOVERNMENTAL FUNDS
R EVENUES
EXPEN D I TURE S
GENERAL
FUND
Local Property Taxes
Penalties, Interest & Other Tax Related
Investments CoCurricular
Other Local Sources
State Per Capita
Foundation School Program
TRS On-Behalf Other State Sources
Federal ROTC
SHARS & MAC Other Federal
Sources
Use of Monies: For daily operational expenditures such as salaries; contracted services; supplies; other costs; and capital outlay.
FOOD SERVICE
FUND
Local Food Sales
State
State Match
Federal National Breakfast &
Lunch Program USDA Commodities
Use of Monies: For expenditures relating to student meals including food; labor; non-food items; transportation; and storage of food.
SPECIAL
REVENUE FUND
Local Activity Funds Private Grants Local Special
Revenue
State State Funds State Grants
Federal
Federal Entitlement Funds
Federal Grants
Use of Monies: For specific functions or activities as established by the grant.
DEBT SERVICE
FUND
Local Property Taxes
Penalties, Interest & Other Tax Related
Investments
State Facilities Allotment
Debt Allotment
Use of Monies: For payment of interest, principal, and other debt related fees for general obligation bonds.
CAPITAL
PROJECTS FUND
Local Investments
Bond Issuance Proceeds
Use of Monies: For acquisition, construction or improvements to land or buildings including related fees.
40
DISTRICT REVENUE SOURCES
The San Antonio Independent School District has three major sources of revenues: Local, State and Federal Funds. LOCAL
This revenue is primarily derived from taxes levied on real estate by the district. Other sources of local funds include interest earnings, athletic events, and other miscellaneous income. On an “All Funds” basis, the Local property tax revenue amounts to approximately 38.7% of the district’s total revenue. Local revenue is 39.3% of the total revenue. STATE
This revenue is based primarily upon average daily attendance (ADA) of the district’s pupils by their educational category (Bilingual, Compensatory, Regular, Special Education, Gifted & Talented and Career & Technology). The State determines what the total cost for a basic program should be for the district by special formulas and weights for type of students served. The State then deducts the amount of revenue required to be raised by the district. The balance is then provided as State Aid. The State assists with funding Debt Service on new and old bond issues. Due to increases in the district’s tax roll, SAISD no longer receives state aid for debt service payments. FEDERAL
This revenue is primarily provided from grants designated for a special purpose. It cannot be spent for any reason other than the one so specified. Federal sources account for approximately 28.8% of the total revenue.
41
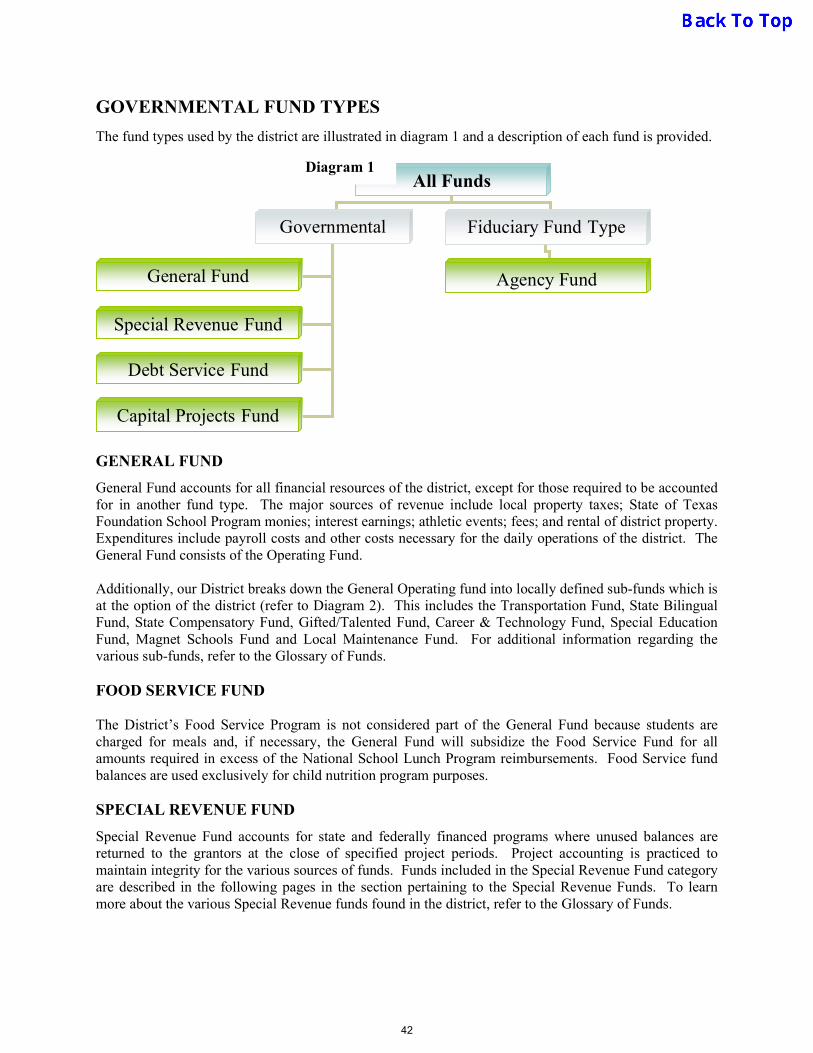
GOVERNMENTAL FUND TYPES
The fund types used by the district are illustrated in diagram 1 and a description of each fund is provided.
GENERAL FUND
General Fund accounts for all financial resources of the district, except for those required to be accounted for in another fund type. The major sources of revenue include local property taxes; State of Texas Foundation School Program monies; interest earnings; athletic events; fees; and rental of district property. Expenditures include payroll costs and other costs necessary for the daily operations of the district. The General Fund consists of the Operating Fund. Additionally, our District breaks down the General Operating fund into locally defined sub-funds which is at the option of the district (refer to Diagram 2). This includes the Transportation Fund, State Bilingual Fund, State Compensatory Fund, Gifted/Talented Fund, Career & Technology Fund, Special Education Fund, Magnet Schools Fund and Local Maintenance Fund. For additional information regarding the various sub-funds, refer to the Glossary of Funds. FOOD SERVICE FUND The District’s Food Service Program is not considered part of the General Fund because students are charged for meals and, if necessary, the General Fund will subsidize the Food Service Fund for all amounts required in excess of the National School Lunch Program reimbursements. Food Service fund balances are used exclusively for child nutrition program purposes.
SPECIAL REVENUE FUND
Special Revenue Fund accounts for state and federally financed programs where unused balances are returned to the grantors at the close of specified project periods. Project accounting is practiced to maintain integrity for the various sources of funds. Funds included in the Special Revenue Fund category are described in the following pages in the section pertaining to the Special Revenue Funds. To learn more about the various Special Revenue funds found in the district, refer to the Glossary of Funds.
All Funds
Governmental Fund Types
Fiduciary Fund Type
General Fund
Special Revenue Fund
Debt Service Fund
Capital Projects Fund
Agency Fund
Diagram 1
42
DEBT SERVICE FUND
The Debt Service budget and Capital Projects budget are closely linked. The Debt Service budget must cover the cost of financing new facilities built under the Capital Projects Fund. It must pay interest expense and payments on all bonded debt of the district. The primary sources of revenue for the Debt Service Fund are local property taxes and the State Instructional Facilities Allotment and Existing Debt Allotment. CAPITAL PROJECTS FUND
Although the Texas Education Agency does not require an annual adopted budget for the Capital Projects Fund, a budget is approved by the board through the district’s budget amendment process at the start of a project. This fund accounts for proceeds from bond issues, revenues and expenditures related to authorized construction and other capital asset acquisition.
FIDUCIARY FUND
The district is the trustee, or fiduciary, for money raised by student activities. The district accounts for these monies in a custodial capacity as an Agency Fund. These are not budgeted funds and the district cannot use them to support its operations. The district, however, is responsible for ensuring that the assets reported in these funds are used for their intended purpose. All of the District’s Fiduciary activities are reported in the Comprehensive Annual Financial Report (CAFR) in Exhibit E-1.
43
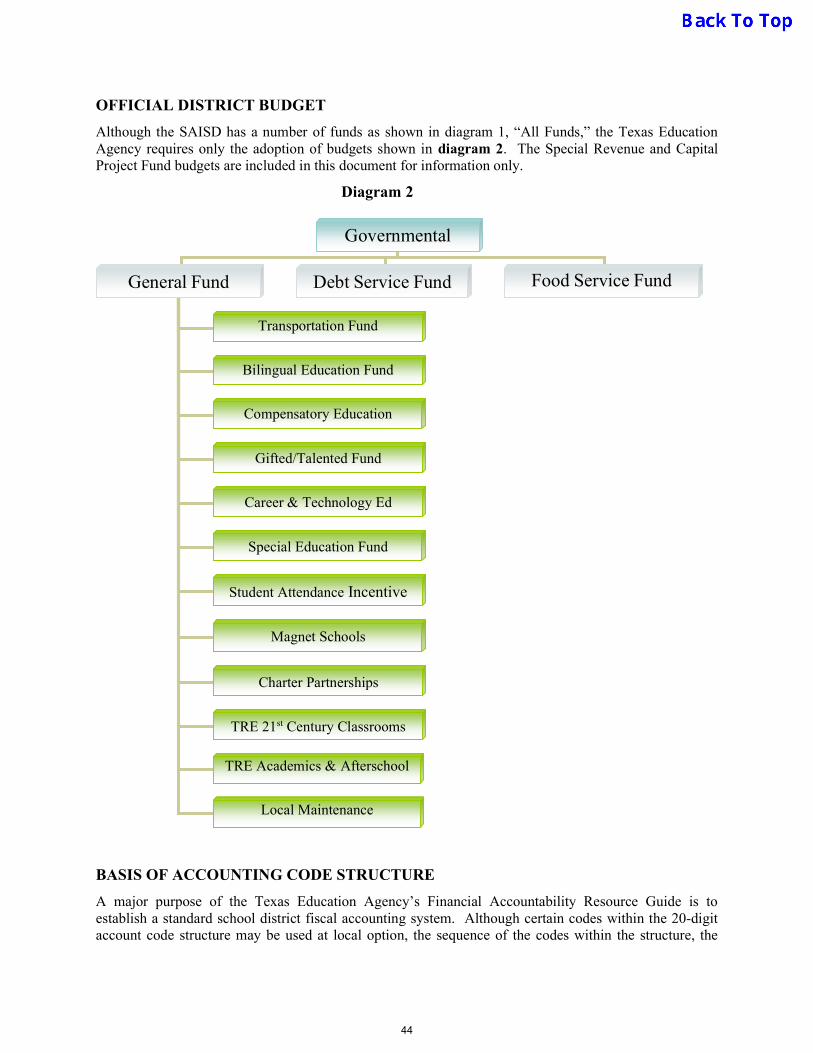
OFFICIAL DISTRICT BUDGET
Although the SAISD has a number of funds as shown in diagram 1, “All Funds,” the Texas Education Agency requires only the adoption of budgets shown in diagram 2. The Special Revenue and Capital Project Fund budgets are included in this document for information only.
BASIS OF ACCOUNTING CODE STRUCTURE
A major purpose of the Texas Education Agency’s Financial Accountability Resource Guide is to establish a standard school district fiscal accounting system. Although certain codes within the 20-digit account code structure may be used at local option, the sequence of the codes within the structure, the
Governmental Funds
Debt Service Fund General Fund
Transportation Fund
Bilingual Education Fund
Compensatory Education
Gifted/Talented Fund
Career & Technology Ed
Special Education Fund
Student Attendance Incentive
Magnet Schools
Food Service Fund
Charter Partnerships
TRE 21st Century Classrooms
TRE Academics & Afterschool
Local Maintenance
Diagram 2
44
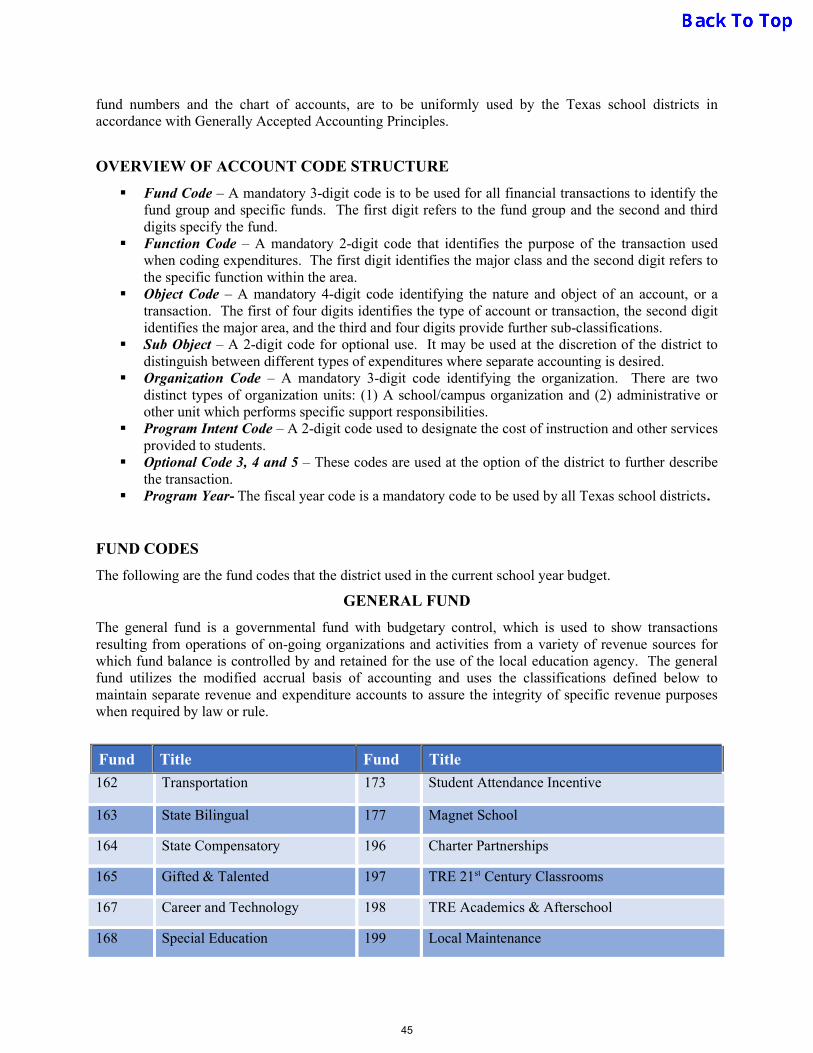
fund numbers and the chart of accounts, are to be uniformly used by the Texas school districts in accordance with Generally Accepted Accounting Principles.
OVERVIEW OF ACCOUNT CODE STRUCTURE
Fund Code – A mandatory 3-digit code is to be used for all financial transactions to identify the fund group and specific funds. The first digit refers to the fund group and the second and third digits specify the fund.
Function Code – A mandatory 2-digit code that identifies the purpose of the transaction used when coding expenditures. The first digit identifies the major class and the second digit refers to the specific function within the area.
Object Code – A mandatory 4-digit code identifying the nature and object of an account, or a transaction. The first of four digits identifies the type of account or transaction, the second digit identifies the major area, and the third and four digits provide further sub-classifications.
Sub Object – A 2-digit code for optional use. It may be used at the discretion of the district to distinguish between different types of expenditures where separate accounting is desired.
Organization Code – A mandatory 3-digit code identifying the organization. There are two distinct types of organization units: (1) A school/campus organization and (2) administrative or other unit which performs specific support responsibilities.
Program Intent Code – A 2-digit code used to designate the cost of instruction and other services provided to students.
Optional Code 3, 4 and 5 – These codes are used at the option of the district to further describe the transaction.
Program Year- The fiscal year code is a mandatory code to be used by all Texas school districts.
FUND CODES
The following are the fund codes that the district used in the current school year budget.
GENERAL FUND
The general fund is a governmental fund with budgetary control, which is used to show transactions resulting from operations of on-going organizations and activities from a variety of revenue sources for which fund balance is controlled by and retained for the use of the local education agency. The general fund utilizes the modified accrual basis of accounting and uses the classifications defined below to maintain separate revenue and expenditure accounts to assure the integrity of specific revenue purposes when required by law or rule.
162 Transportation 173 Student Attendance Incentive
163 State Bilingual 177 Magnet School
164 State Compensatory 196 Charter Partnerships
165 Gifted & Talented 197 TRE 21st Century Classrooms
167 Career and Technology 198 TRE Academics & Afterschool
168 Special Education 199 Local Maintenance
Fund Title Fund Title
45
SPECIAL REVENUE FUND
(Federal Programs)
This group of funds is used to account for federally funded special revenue funds. Member districts of shared services arrangements are to use fund codes 200 through 379 to account for the member district portion of a shared services arrangement.
(State Programs)
State Programs in which the district is not acting as a fiscal agent for shared services arrangement are designated by fund codes 380 through 429.
(Local Programs)
The district uses fund Codes 460 through 499 to account for local programs such as campus student activity funds or grants from local business or organizations that require that the funds be expended for a specific purpose.
46
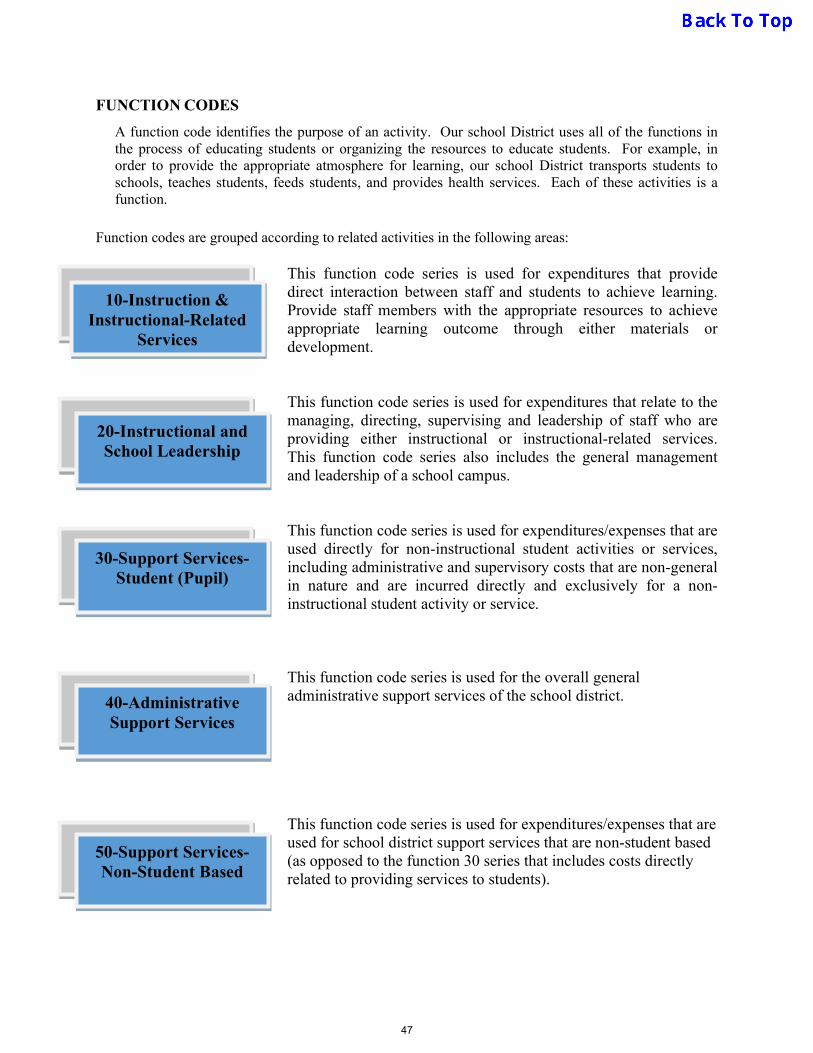
FUNCTION CODES
A function code identifies the purpose of an activity. Our school District uses all of the functions in the process of educating students or organizing the resources to educate students. For example, in order to provide the appropriate atmosphere for learning, our school District transports students to schools, teaches students, feeds students, and provides health services. Each of these activities is a function.
Function codes are grouped according to related activities in the following areas:
This function code series is used for expenditures that provide direct interaction between staff and students to achieve learning. Provide staff members with the appropriate resources to achieve appropriate learning outcome through either materials or development.
This function code series is used for expenditures that relate to the managing, directing, supervising and leadership of staff who are providing either instructional or instructional-related services. This function code series also includes the general management and leadership of a school campus.
This function code series is used for expenditures/expenses that are used directly for non-instructional student activities or services, including administrative and supervisory costs that are non-general in nature and are incurred directly and exclusively for a non-instructional student activity or service.
This function code series is used for the overall general administrative support services of the school district.
This function code series is used for expenditures/expenses that are used for school district support services that are non-student based (as opposed to the function 30 series that includes costs directly related to providing services to students).
10-Instruction &
Instructional-Related Services
20-Instructional and School Leadership
30-Support Services-
Student (Pupil)
40-Administrative Support Services
50-Support Services-Non-Student Based
47

This function code series is used for expenditures/expenses that are for school district support services supplemental to the operation of the school district.
This function code series is used for expenditures/expenses
for the payment of debt principal and interest.
This function code series is used for expenditures/expenses that are for acquisitions, construction, or major renovations of school district facilities.
“Intergovernmental” is a classification that is appropriate when one governmental unit transfers resources to another. In particular, Chapter 41 purchase of WADA (Weighted Average Daily Attendance) and the transfer of students where one school district pays another school district for educating students are examples of intergovernmental charges.
Each of the above major function areas is further defined by detail function codes and described in the glossary. OBJECT CODES
An object code identifies the nature and object of an account, a transaction, or a source. When the first digit of an object code begins with the digit “5” it denotes Revenue. The three major categories of revenue sources are:
5700’s Local Revenue 5800’s State Revenue 5900’s Federal Revenue
Additional information regarding our District’s revenue can be found in the section titled District Revenue Sources. When an object code codes begins with the digit “6” it identifies it as an expenditure account or transaction. There are six major expenditure classifications and are described on the next page.
60-Ancillary Services
80-Capital Outlay
90-Intergovernmental
Charges
70-Debt Service
48
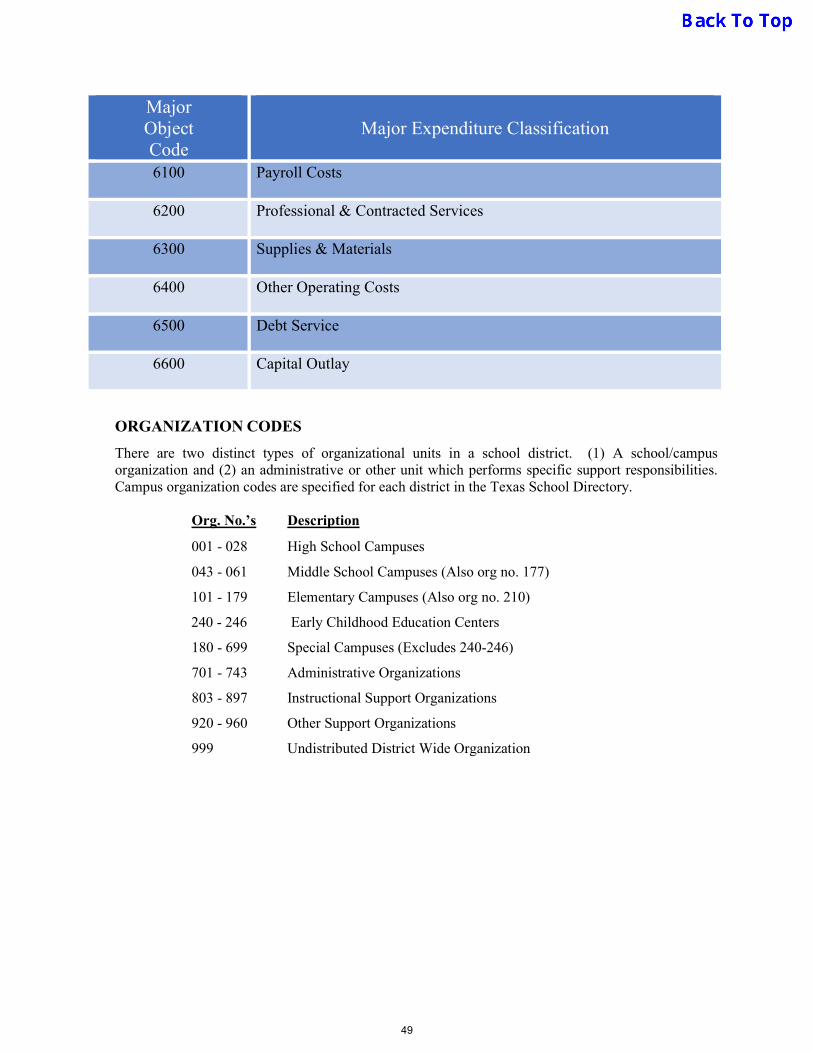
Major Object Code
Major Expenditure Classification
6100 Payroll Costs
6200 Professional & Contracted Services
6300 Supplies & Materials
6400 Other Operating Costs
6500 Debt Service
6600 Capital Outlay
ORGANIZATION CODES
There are two distinct types of organizational units in a school district. (1) A school/campus organization and (2) an administrative or other unit which performs specific support responsibilities. Campus organization codes are specified for each district in the Texas School Directory. Org. No.’s Description
001 - 028 High School Campuses
043 - 061 Middle School Campuses (Also org no. 177)
101 - 179 Elementary Campuses (Also org no. 210)
240 - 246 Early Childhood Education Centers
180 - 699 Special Campuses (Excludes 240-246)
701 - 743 Administrative Organizations
803 - 897 Instructional Support Organizations
920 - 960 Other Support Organizations
999 Undistributed District Wide Organization
49

PROGRAM INTENT CODES (PIC)
A 2-digit code used to designate the intent of a program provided to students. These codes are used to account for the cost of instruction and other services that are directed toward a particular need of a specific set of students. The student group toward which the instructional or other service is directed determines the program intent code, not the demographic make up of the students served. In the case of state programs, state law may determine the intent and the permissible use of allotments.
PROGRAM INTENT CODE & DESCRIPTION
11 Basic Educational Services
21 Gifted and Talented
22 Career and Technology
23 Services to Students with Disabilities (Sp. Ed.)
24 Accelerated Education (Compensatory Ed.)
25 Bilingual Education and Special Language Programs
26 Non-Disciplinary Alternative Education Program- AEP Services
28 Disciplinary Alternative Education Program- DAEP Basic Services
30 Title I, Part A, School Wide Activities, and State Compensatory Education Costs related to Title I School Wide on Campuses with 40% or more Educationally Disadvantaged Students
31 High School Allotment
32 Pre-Kindergarten
33 Special Education Pre-Kindergarten
34 State Compensatory Pre-Kindergarten
35 Bilingual Pre-Kindergarten
36 Early Education
37 Dyslexia
38 College, Career & Military Readiness
43 Dyslexia- Special Education Student IEP
91 Athletics and Related Activities
99 Undistributed District Wide (Not for a specific program.)
YEAR CODE
The fiscal year code is a mandatory code to be used by all Texas school districts. The fiscal year for the SAISD is July1 through June 30. For the District’s 2021-2022 fiscal year, the school year would be represented by the year code “2022”.
50

SIGNIFICANT FINANCIAL POLICIES AND PROCEDURES The following financial policies and procedures of the District influence the development of the annual budget. BALANCED BUDGET
The District’s Board of Trustees is committed to having a balanced budget (revenue equals expenditures per fund) under normal circumstances. When budget enhancements require the District to adopt a budget that is not balanced, full disclosure of the circumstances surrounding the decision are itemized for all interested parties in budget reports, such as this one. Furthermore, plans for implementing cost saving strategies for future budgets are also discussed in the Executive Summary. CASH MANAGEMENT
The District’s cash and cash equivalents are considered to be cash on hand, demand deposits and short-term investments with original maturities of three months or less from date of acquisition. The District’s cash management goals are safety, liquidity, and maximize yield. Specifically, this is accomplished by:
Ensuring proper collateralization of deposits Ensuring adequate balances to cover cash disbursements Maximizing interest earnings Minimizing bank charges
Cash balances are monitored daily by the District through on-line banking. Using this system allows the Director of Cash and Treasury Management to determine the best investment opportunities on an ongoing basis. INVESTMENT POLICIES
The Board of Trustees has adopted a written investment policy regarding the investment of its funds as defined in the Public Funds Investment Act of 1995. The main goal of the investment program is to ensure safety, as well as to maximize financial returns within current market conditions in accordance with the District’s investment policy. Monitoring is performed quarterly as investment reports are submitted to the Board of Trustees for review. At June 30, 2021 the District was invested in a sinking fund repurchase agreement, local government investment pools, and no load money market mutual funds. DEBT ADMINISTRATION
Debt Service is a major area of cost due to the District’s construction program, which is primarily financed by the sale of voter authorized general obligation bonds. At June 30, 2021, the ratio of total net tax supported debt to net taxable assessed value for the District is 4.99%. Educational legislation has eliminated limits on outstanding debt. However, prior law limited debt to 10% of the assessed value, and the District is well below that level. With the exception of the Series 2015 Refunding Bonds, interest payments are payable in February and August of each year with principal payable in August of each year. The annual principal payments for the Series 2015 Refunding Bonds are payable in February of each year. On February 1st of each year, outstanding taxes become delinquent which permits the collection of a large majority of taxes levied before the long-term debt payments are due.
51
The Districts unlimited ad valorem tax-supported indebtedness has an underlying rating of “AA” and “F1+” by Fitch Ratings (“Fitch”) and “Aa2” and “P-1” by Moody’s Investors Service, Inc. (“Moody’s). As of June 30, 2021, the District’s bond ratings on all unlimited ad valorem tax-supported indebtedness, by virtue of guarantee of the Permanent School Fund of the State of Texas were as follows: Moody’s Fitch General Obligation Bonds Aaa AAA An explanation of the significance of such ratings may be obtained from Fitch and Moody’s. ENCUMBRANCES
Purchase orders, contracts, and other commitments are recorded in the general ledger in order to reserve that portion of the applicable appropriation. Once expenditure is recorded then the encumbrance is liquidated. Encumbrances outstanding at year-end are commitments that do not constitute expenditures or liabilities, but are reported as reservations of fund balances. Since all General Fund appropriations lapse at the end of each fiscal year, outstanding encumbrances approved by the Associate Superintendent of Finance, Business Services & Food Services are appropriately provided for in the subsequent fiscal year’s budget to provide for the liquidation of the prior commitments.
FUND BALANCE
General Fund – The Fund Balance of the General Fund provides for a contingency fund that will allow the District to maintain financial and program stability and flexibility. The Unreserved Undesignated Fund Balance needs to be sufficient to cover anticipated normal operating cash flow deficits. In addition, it should provide additional protection for possible budgeted revenue and expenditure variances. A threshold of no less than 10% of the prior fiscal year’s Total Expenditures as a minimum Unreserved Undesignated Fund Balance is established to ensure that revenue and expenditure fluctuation do not place the District in jeopardy of dropping into a negative cash flow position.
Food Service Fund – The fund balance for food service should not exceed three months of average Food Service operations expenditures. Average monthly food service expenditures are calculated by the prior year’s expenditures by ten months since the Food Service program only operates for ten months out of the year.
Debt Service Fund – The District maintains a debt service fund balance for the payment of scheduled debt service payments. The Federal Tax Reform Act of 1986 requires issuers of tax-exempt debt to make payment to the U.S. Treasury for investment income received at yields that exceed the issuer’s tax exempt borrowing rates. The US Treasury requires payment for each issue every five years.
Strategic Initiatives Fund – On June 28, 2012, the Board authorized a Local Special Revenue Fund to be established with proceeds of the 2011 Qualified School Construction Bond (QSCB) Federal Interest Subsidy. This amount was supplemented with the 2011-12 General Fund surplus to establish a reserve for future lawful expenditures. The QSCB Federal Interest Subsidy received in future years is the designated revenue source for this fund. Potential uses for the fund may be compensation, deferred facility maintenance, technology initiatives, instructional enhancements, and other District initiatives.
52
CAPITAL IMPROVEMENTS
The District defines capital expenditures and projects as follows:
Capital Expenditures–Any purchase of furniture, equipment, vehicles, land or permanent improvement having a per unit cost of $5,000 or more and a useful life of more than one year is classified as a capital asset.
Capital Project – An activity that does not occur routinely or annually, has a scheduled and
definitive beginning and ending, and results in a capital improvement or acquisition. Funding for this activity is from local revenue sources.
Capital Projects Bond Program – Major technology infrastructure and facility needs such as
new construction, or upgrading existing facilities are funded through the sale of bonds. As part of a bond elections process, the District develops a framework of the projects to be addressed. These projects are determined through internal staff analysis and input from the community. Once the projects are identified, specific project budgets are established on a project basis.
RISK MANAGEMENT
The District is self-funded with regard to the majority of health, dental and worker compensation benefits provided to employees and their dependents. Certain functions of these self-funded programs are overseen by external administrators whose primary function is to settle claims. The District’s Risk Management office monitors activities performed by these external administrators. The District, in cooperation with the Workers Compensation Plan administrator, initiated an Accident Prevention Program. The program implements various risk control techniques to minimize accident-related losses.
PROPERTY TAXES
Property taxes are levied by October 1 in conformity with Subtitle E, Texas Property Tax Code. Taxes are due upon receipt of the tax bill and are delinquent if not paid before February 1 of the year following the year in which imposed. On January 1 of each year, a tax lien attaches to the property to secure the payment of all taxes, penalties, and interest ultimately imposed. The Bexar Appraisal District (BAD) of Bexar County, Texas, establishes appraised values. Taxes are levied by the District’s Board of Trustees based on the appraised values received from the BAD. Property tax rates, established in accordance with state law, are levied on real and personal property within the District’s boundaries for use in financing general operating and debt service expenditures.
PROPERTY TAX EXEMPTIONS
Senate Bill 1, enacted by the Eighty-fourth Texas Legislature, amended section 11.13 of the Tax Code. This amendment increased the amount of the homestead exemption from $15,000 to $25,000 beginning with the 2015 tax year. Due to this change, SAISD now grants the homestead exemption of $25,000 from the market value of all individual residential homesteads, and an additional exemption of $10,000 from the market value of the residence homestead of persons 65 or over or disabled. In November of 2016, the SAISD Board passed a resolution adopting an additional percentage-based residence homestead exemption effective for tax year 2017. This optional exemption will entitle the individual to a tax exemption of at least $5,000, by an additional 0.01% exemption of the appraised value of a person’s residence homestead in accordance with Section 11.13(n) of the Property Tax Code for the State of Texas.
53
TAX ABATEMENTS
The District has a moratorium on tax abatements pending favorable legislative change that does not penalize the District in the loss of state aid. TAX RATE ADOPTION The District has a July 1st fiscal year start date and because of this, the Board adopts the budget in advance of receiving the certified tax roll. The important dates for 2021-2022 are as follows:
The required legal notice was published on June 10, 2021. The Board of Trustees held the required public meeting on June 21, 2021. The acceptance of the Bexar Appraisal District 2021 Certified Tax roll was on August 16, 2021. The Board of Trustees adopted the tax rate on August 16, 2021.
Note that if the certified tax roll indicated a tax rate higher than was on the June published notice; the District would be required to publish a revised notice and hold an additional public hearing prior to the adoption of the higher rates.
INDEPENDENT AUDIT AND FINANCIAL REPORTING
In accordance with Section 221.256, Texas Education Code, public school districts in Texas shall have their accounts audited annually by a firm of licensed certified public accountants. The audit shall be made on an organization-wide basis, and shall involve all fund types and account groups of the school district. In addition to meeting the requirements set for in State statues, the audit is also designed to meet the requirements of the federal Single Audit Act of 1984 and the related provisions of OMB Circular A-133 “Audits of State, Local Governments, and Non-Profit Organizations.”
Once the audit is complete, an Annual Financial Report is prepared and submitted to the Texas Agency for review. The Annual Financial Reports is designed to meet the specific monitoring needs of the Texas Education Agency. Thus, a Comprehensive Annual Financial Report, conforming to the standards of both the Association of School Business Official International (ASBOI) and the Government Finance Officers Association (GFOA), is also prepared to better serve the needs of taxpayers and other financial statement users. Since 1989, the District has received the Excellence in Financial Reporting Awards from both the ASBOI and the GFOA.
54

BUDGET POLICIES AND DEVELOPMENT PROCEDURES
Legal requirements for school district budgets are formulated by the State of Texas, the Texas Education Agency (TEA), and the local District. This section deals with these requirements for basic budget development, adoption, and submission. STATEMENT OF TEXAS LAW Section 44.001 through 44.006 of the Texas Education Code establishes the legal basis for budget development in school districts. The following seven items summarize the legal requirements from the code:
The superintendent is the budget officer for the district and prepares or causes the budget to be prepared.
The District’s preliminary budget must be prepared by the date set by the State Board of
Education. Due to the mandated posting requirements for the public hearing, the preliminary budget is completed by this date.
The fiscal year of a school district begins on July 1 or September 1 of each year, as
determined by the board of trustees of the district.
The president of the Board of Trustees must call a public meeting of the board members, giving a ten-day public notice in a newspaper, for the adoption of the District budget. Any taxpayer in the District may be present and participate in the meeting.
No funds may be expended in any manner other than as provided for in the adopted
budget. The board does have the authority to amend the budget or adopt a supplementary emergency budget to cover unforeseen expenditures.
The budget must be prepared in accordance with generally accepted accounting
principals (GAAP) and state guidelines.
The budget must be legally adopted before the adoption of the tax rate. TEXAS EDUCATION AGENCY (TEA) LEGAL REQUIREMENTS Additional requirements imposed by the TEA for school district budget preparation are as follows:
The budget must be adopted by the Board of Trustees, inclusive of amendments, no later than June 30 (August 31 if the district uses a September 1 fiscal year start date).
Minutes from the District’s board meeting will be used to record budget adoption and
amendments to the budget.
Budgets for the General Fund, the Food Service Fund (whether accounted for in the General Fund, a Special Revenue Fund or an Enterprise Fund) and the Debt Service fund must be included in the official District budget (legal for fiscal year basis). This budget must be prepared and approved at least at the fund and function level to comply with the state’s legal level of control mandates.
55

The officially adopted District budget, as amended, must be filed with the TEA through the Public Education Information Management System (PEIMS) by the date prescribed in the annual system guidelines. Revenues, other sources, other uses, and fund balances must be reported by fund, object (at the fourth level), fiscal year, and amount. Expenditures must be reported by fund, function, object (at the second level), organization, fiscal year, program intent, and amount.
A school district must amend the official budget before exceeding a functional
expenditure category (i.e., instruction, administrations, etc.) in the total district budget. The Comprehensive Annual Financial Report (CAFR) should reflect the amended budget and actual amounts. The requirement for filing the amended budget with the TEA is satisfied when the school district files its Comprehensive Annual Financial Report.
DISTRICT BUDGET REQUIREMENTS
In addition to state legal requirements, the San Antonio Independent School District Board of Trustees has established its own requirements for annual budget preparation through Board Policy CE (LOCAL) Annual Operating Budget.
FISCAL YEAR
The District shall operate on a fiscal year beginning July 1 and ending June 30.
BUDGET PLANNING
Budget planning shall be an integral part of overall program planning so that the budget effectively reflects the District's programs and activities and provides the resources to implement them. In the budget planning process, general educational goals, specific program goals, and alternatives for achieving program goals shall be considered, as well as input from the District- and campus-level planning and decision-making committees. Budget planning and evaluation are continuous processes and shall be a part of each month's activities.
AVAILABILITY OF PROPOSED BUDGET
After it is presented to the Board and prior to adoption, a copy of the proposed budget shall be available upon request from the finance office or Superintendent. The Superintendent or designee shall be available to answer questions arising from inspection of the budget.
56
BUDGET MEETING
The annual public meeting to discuss the proposed budget and tax rate shall be conducted as follows:
1. The Board President shall request at the beginning of the meeting that all persons who desire to speak on the proposed budget and/or tax rate sign up on the sheet provided.
2. Prior to the beginning of the meeting, the Board may establish time limits for speakers.
3. Speakers shall confine their remarks to the appropriation of funds as contained in the proposed budget and/or the tax rate.
4. No officer or employee of the District shall be required to respond to questions from speakers at the meeting.
AUTHORIZED EXPENDITURES
The adopted budget provides authority to expend funds for the purposes indicated and in accordance with state law, Board policy, and the District's approved purchasing procedures. The expenditure of funds shall be under the direction of the Superintendent or designee who shall ensure that funds are expended in accordance with the adopted budget.
BUDGET AMENDMENTS
The budget shall be amended when a change is made to fund balance or functions.
MONTHLY REPORTS TO BOARD
A monthly statement showing budget appropriations, expenditures for the current month and for the year-to-date, together with a statement of receipts and the balances in the several funds, shall be presented to the Board.
57
BUDGET DEVELOPMENT PROCESS
Parents, school personnel, employee union groups, and community members of the district under the direction of the Superintendent, Associate Superintendent of Financial Services, Business Operations and Food Service, Budget Office, and other staff of the District, develop the budget. All expenditure allocations are determined and based on projected revenue from State and local sources with the goals of adopting a balanced budget, maintaining an appropriate fund balance and combined tax rate. Sometimes the balanced budget objective is met through the use of Fund Balance to pay for services that are needed. Such uses of Fund Balance must be in accordance with applicable state and local policies. The budget process is comprised of several major phases: planning, coordination and preparation, review, adoption, implementation, submission, monitoring and evaluation. PLANNING
The budget process is a continuous cycle that begins in January with the planning phase during which a Budget Calendar is developed with the dates and activities to accomplish during a typical budget cycle. The calendar prepared for budget 2020-2021 is found at the end of this section. The budget process typically ends in December with the results of operations for the previous year presented in the District’s Comprehensive Annual Financial Report (CAFR). COORDINATION AND PREPARATION
The preparation of the budget commences with student enrollment projections, the basis for significant budgetary decisions, including per pupil allocations to each campus, instructional staffing allocations, and other required service levels. Per pupil allocations are also important since it’s an equitable way of distributing funds between campuses. These allocations are for equipment repairs, supplies and materials, student travel, professional development and other appropriate instructional costs. Principals are responsible for taking into consideration recommendations from their school’s PTA, employee representatives, their school community, and business partners. Decisions concerning utilization of these allocations are made by the campus-based decision making teams. The Associate Superintendent of Financial Services, Business Operations and Food Service prepares revenue projections for all funding. These projections are based on student enrollment projections, estimates of local tax revenue, State funding formulas, and other significant factors. The State funding formulas are extremely complex. The complexity is compounded by changes that the Legislature regularly makes when they meet every other year to consider changes to the State Funding formula and other issues. Salaries and benefits comprise approximately 85% of the annual General Fund Operating budget. Therefore, the Board of Trustees gives careful consideration to pay increases and staffing allocations for both instructional and non-instructional positions. Personnel units are allocated to each campus based on projected student enrollment. The budget amounts are then developed for each position based on the average cost of employees currently filling each position. Budgets for non-campus units are developed by each department head who is the budget manager for their organization’s budget. The non-campus organizations utilize Budget Action Plans which break up the budget into discrete activities or operations. There are three possible levels of Budget Action Plans:
58
Level I makes use of modified zero-based budgeting. It supports the current level of staffing and funding. Level I is required of all department heads. These are not ranked.
Level II identifies new initiatives or District Enhancements. Level II is optional. These are ranked according to District priorities by the Superintendent’s cabinet.
Level III identifies programs for possible elimination. Level III is optional unless mandated by the Board of Trustees or the Superintendent.
These non-campus budgets are reviewed by the Superintendent’s Executive Cabinet and focus on district priorities. The Associate Superintendent of Financial Services, Business Operations and Food Service, and Budget Office staff develop the Debt Service Fund budget. This budget is constructed based primarily on tax base assumptions (for local revenue projections), State funding estimates, and required projected debt retirement obligations. The Food Service Fund budget is prepared by the Senior Executive Director for the Child Nutrition Program and is then evaluated by the Associate Superintendent of Financial Services, Business Operations and Food Service. REVIEW
Following this development process, consolidated budgetary information is presented to the Board of Trustees in budget workshops and regular business meetings. This information is summarized in different presentations and line item detail is provided, as requested, through written and verbal supporting information. ADOPTION
The culmination of the budget process is reached when the proposed budget is adopted by the Board of Trustees. This year the public notice was published on June 10, 2021 followed by a public hearing and adoption of the 2021-2022 District Budget which took place at the Board meeting of June 21, 2021. IMPLEMENTATION
The district’s adopted budget is interfaced with the Region 20 system approximately two working days prior to July 1st. Meanwhile, school campuses and departments are sent an electronic version of its respective operating budget for the new fiscal year. On July 1st all campuses, schools and departments, may begin the requisition process against the new budget. MONITORING
TEA monitors for compliance at the district level only. The monitoring is a legal requirement to ensure mandatory expenditure levels in certain areas. Performance monitoring of the budget is also conducted regularly. This includes such items as comparing the planned effectiveness of educational programs with actual student achievement results, reviewing a particular department’s effectiveness at using allocated resources to achieve specified results, and reviewing a school or department budget against standard ratios to monitor unusual expenditure patterns.
59

Similarly, the District’s administrators monitor the entire district budget by means of an interactive, on-line budgetary accounting and control system. The system provides many useful reports to assist finance/business personnel, internal auditors, and budget managers across the District in administering, monitoring, and controlling the implementation of the budget. The system also provides many checks on account balances to ensure that funds are not over expended at the budgetary line-item accounts. If sufficient funds are not available in the account, purchase orders and check requisitions cannot be generated. The Budget and Accounting Offices monitor comparison between budget and actual expenditures to maintain cost control and to ensure against overspending for payroll and related accounts. On a monthly basis, management reviews financial projection reports generated by the Accounting and Planning & Budget Offices. This process of reviewing projected revenue and year-end expenditure levels, as well as current expenditure levels, provides an increased level of comfort in assuring budgetary compliance. Relevant financial reports are submitted to the Board of Trustees on a monthly basis keeping the Board apprised of issues that might affect the district’s performance.
EVALUATION
The last step in the district’s budget cycle is evaluation, where performance data gathered in the monitoring phase are assembled to evaluate individual departments as well as the District in its entirety. The results of the evaluation phase in the budgeting cycle impact the planning phase for the next budget year. The three main areas of evaluation include schools and programs, stakeholders’ satisfaction, and budgetary performance. Schools and programs are evaluated for student achievement using such tools as State of Texas Assessments of Academic Readiness (STAAR) tests, attendance rates, drop-out and graduation rates, SAT and ACT test results, etc. Stakeholders’ satisfaction is measured through questionnaires, survey instruments, and indirect measures such as voter approval of bond elections, etc. Budgetary performance evaluation includes measures such as budget-to-actual or budget-to-projected actual comparisons of revenues, expenditures, cash flow, fund balances, and staffing levels. Periodic evaluations or performance reports are issued to inform both district officials and the public of campus and district performance. The annual budget document will continue to serve as a primary vehicle for delivering evaluation results of the previous fiscal year and communicating the reasons for new or redirected budget allocations. SUBMISSION
The District budget must be submitted to TEA via the Public Education Information Management System (PEIMS) transmission process as of the snapshot date established in the annual instructions for the system. This submission is referred to as the Fall submission. During this submission TEA monitors the areas of staffing, student and budget data.
60
BUDGET ADMINISTRATION AND MANAGEMENT PROCESS Adoption of the official budget by the Board of Trustees is a major step in the budget process. Following adoption, the budget administration and management process begins. This process is the means of regulating expenditures throughout the fiscal year to ensure that the District does not exceed authorized amounts and that the resources are used for intended, proper and legal purposes. EXPENDITURE CONTROLS
Expenditure appropriations are allocated among approximately 200 organizations or cost centers i.e., campuses or departments. Each organization has a budget manager (principal or department head.) The budget manager is accountable for their organizations portion of the General Fund budget. Each budget manager is authorized to approve the expenditure of funds for their respective organization, provided that funds are expended in accordance with District purchasing procedures and legal requirements. PURCHASE ORDER
All purchases of tangible goods and services are processed through an automated purchasing/finance management system with the appropriate approval controls to ensure the availability of funds. Purchase requisitions are initially entered on-line at the campus or department level and are approved by the campus principal or department head. Once a purchase requisition is entered and the system verifies the availability of funds, an encumbrance amount is created in the account code(s) specified. An encumbrance is a commitment of a budgetary amount for open purchase orders for goods or services that have not yet been received. The purpose of the encumbrance is to ensure that obligations are recognized as soon as financial commitments are made in order to prevent inadvertent over expenditure of funds due to lack of information about future commitments. Purchase requisitions for Special Revenue Funds are approved by the appropriate Program Director. When the purchase requisition reaches the Materials Management/Purchasing Department, it is their job to verify compliance with legal purchasing requirements. Upon completion of the review, the purchase requisition is then converted into a Purchase Order and forwarded to the vendor. When a campus or department receives goods or services, the receiving report must be signed by the principal or department head and sent to accounts payable. Upon receipt of an invoice, accounts payable verifies the receipt of goods, prepares a check to the vendor and closes the purchase order. A very limited number of expenses that cannot be processed on a Purchase Order can be submitted on AB-17 form. These requests, along with the appropriate supporting documentation, are forwarded to the finance department for verification, approval and payment. BUDGET AMENDMENTS
The budget (General Fund, Food Service Fund & Debt Service Fund) is legally adopted at the fund and function level. The Board of Trustees must, therefore, approve budget amendments that transfer funds between functions or funds. For example, appropriations for school administration (function 23) cannot be transferred to instruction (function 11) without Board approval. Additionally, any budget amendment that causes an increase/decrease in the fund or revenue would also require Board approval. These budget amendments are presented to the Board at its regular monthly meeting and are reflected in the official minutes. However, for budget amendments that occur with the same expenditure function, these are reviewed and approved/disapproved by the Planning & Budget office.
61
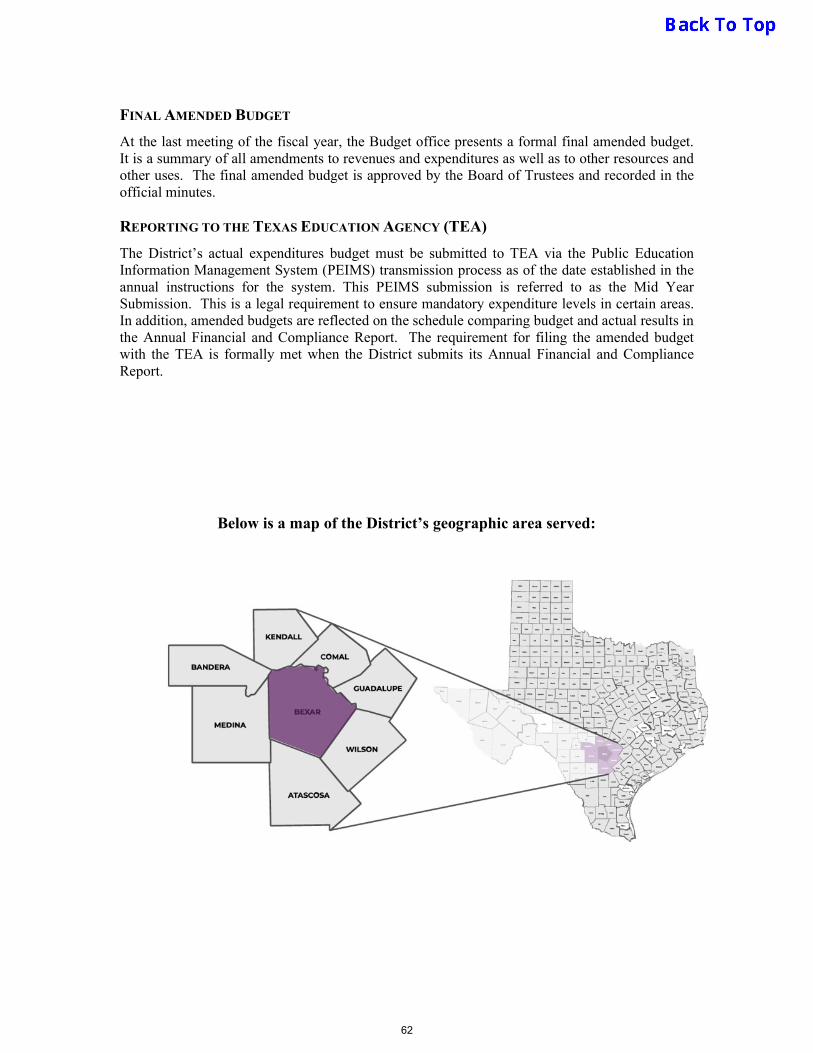
FINAL AMENDED BUDGET
At the last meeting of the fiscal year, the Budget office presents a formal final amended budget. It is a summary of all amendments to revenues and expenditures as well as to other resources and other uses. The final amended budget is approved by the Board of Trustees and recorded in the official minutes. REPORTING TO THE TEXAS EDUCATION AGENCY (TEA)
The District’s actual expenditures budget must be submitted to TEA via the Public Education Information Management System (PEIMS) transmission process as of the date established in the annual instructions for the system. This PEIMS submission is referred to as the Mid Year Submission. This is a legal requirement to ensure mandatory expenditure levels in certain areas. In addition, amended budgets are reflected on the schedule comparing budget and actual results in the Annual Financial and Compliance Report. The requirement for filing the amended budget with the TEA is formally met when the District submits its Annual Financial and Compliance Report.
Below is a map of the District’s geographic area served:
62
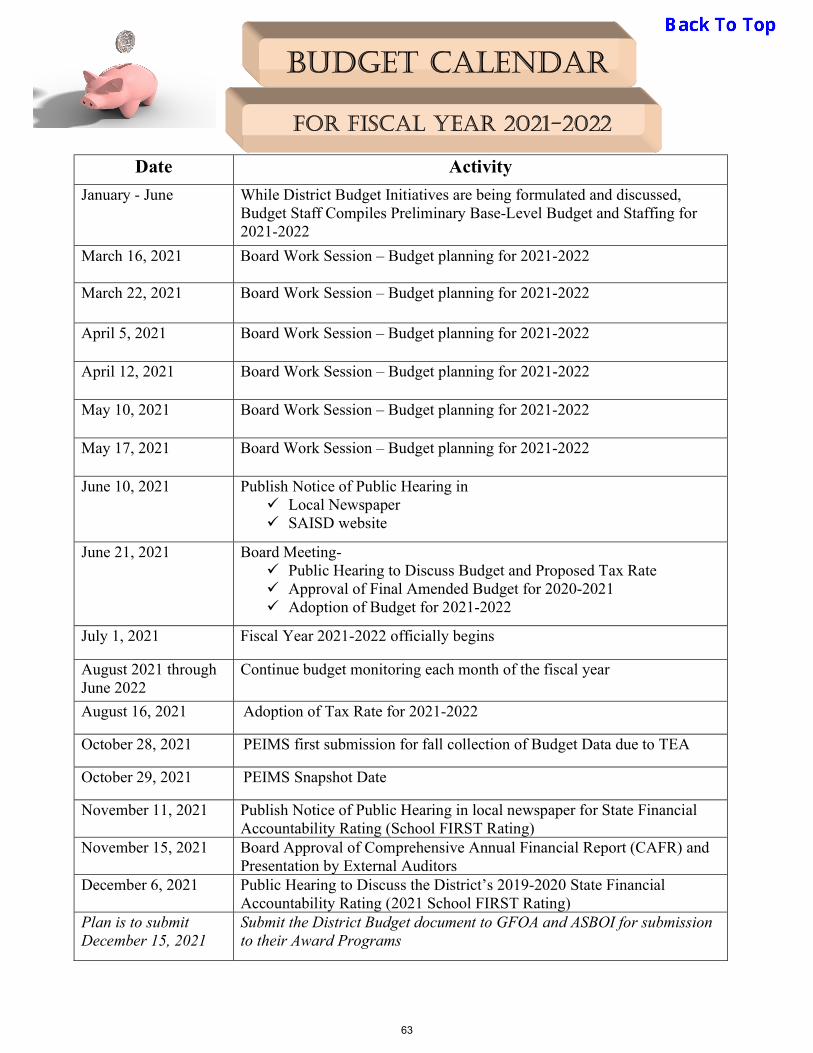
Date Activity
January - June While District Budget Initiatives are being formulated and discussed, Budget Staff Compiles Preliminary Base-Level Budget and Staffing for 2021-2022
March 16, 2021 Board Work Session – Budget planning for 2021-2022
March 22, 2021 Board Work Session – Budget planning for 2021-2022
April 5, 2021 Board Work Session – Budget planning for 2021-2022
April 12, 2021 Board Work Session – Budget planning for 2021-2022
May 10, 2021 Board Work Session – Budget planning for 2021-2022
May 17, 2021 Board Work Session – Budget planning for 2021-2022
June 10, 2021 Publish Notice of Public Hearing in Local Newspaper SAISD website
June 21, 2021 Board Meeting- Public Hearing to Discuss Budget and Proposed Tax Rate Approval of Final Amended Budget for 2020-2021 Adoption of Budget for 2021-2022
July 1, 2021 Fiscal Year 2021-2022 officially begins
August 2021 through June 2022
Continue budget monitoring each month of the fiscal year
August 16, 2021 Adoption of Tax Rate for 2021-2022
October 28, 2021 PEIMS first submission for fall collection of Budget Data due to TEA
October 29, 2021 PEIMS Snapshot Date
November 11, 2021 Publish Notice of Public Hearing in local newspaper for State Financial Accountability Rating (School FIRST Rating)
November 15, 2021 Board Approval of Comprehensive Annual Financial Report (CAFR) and Presentation by External Auditors
December 6, 2021 Public Hearing to Discuss the District’s 2019-2020 State Financial Accountability Rating (2021 School FIRST Rating)
Plan is to submit December 15, 2021
Submit the District Budget document to GFOA and ASBOI for submission to their Award Programs
For Fiscal Year 2021-2022
Budget calendar
63

FINANCIAL
SECTION

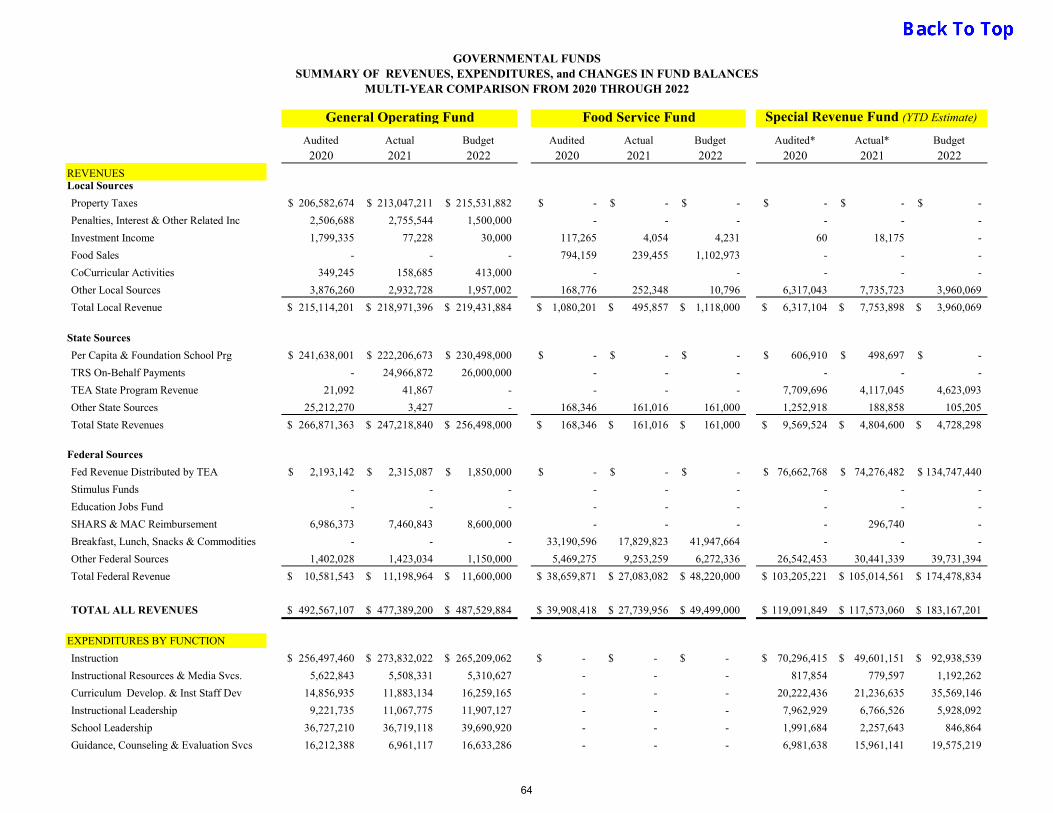
GOVERNMENTAL FUNDSSUMMARY OF REVENUES, EXPENDITURES, and CHANGES IN FUND BALANCES
MULTI-YEAR COMPARISON FROM 2020 THROUGH 2022
Audited Actual Budget Audited Actual Budget Audited* Actual* Budget
2020 2021 2022 2020 2021 2022 2020 2021 2022
REVENUESLocal Sources
Property Taxes 206,582,674$ 213,047,211$ 215,531,882$ -$ -$ -$ -$ -$ -$
Penalties, Interest & Other Related Inc 2,506,688 2,755,544 1,500,000 - - - - - -
Investment Income 1,799,335 77,228 30,000 117,265 4,054 4,231 60 18,175 -
Food Sales - - - 794,159 239,455 1,102,973 - - -
CoCurricular Activities 349,245 158,685 413,000 - - - - -
Other Local Sources 3,876,260 2,932,728 1,957,002 168,776 252,348 10,796 6,317,043 7,735,723 3,960,069
Total Local Revenue 215,114,201$ 218,971,396$ 219,431,884$ 1,080,201$ 495,857$ 1,118,000$ 6,317,104$ 7,753,898$ 3,960,069$
State Sources
Per Capita & Foundation School Prg 241,638,001$ 222,206,673$ 230,498,000$ -$ -$ -$ 606,910$ 498,697$ -$
TRS On-Behalf Payments - 24,966,872 26,000,000 - - - - - -
TEA State Program Revenue 21,092 41,867 - - - - 7,709,696 4,117,045 4,623,093
Other State Sources 25,212,270 3,427 - 168,346 161,016 161,000 1,252,918 188,858 105,205
Total State Revenues 266,871,363$ 247,218,840$ 256,498,000$ 168,346$ 161,016$ 161,000$ 9,569,524$ 4,804,600$ 4,728,298$
Federal Sources
Fed Revenue Distributed by TEA 2,193,142$ 2,315,087$ 1,850,000$ -$ -$ -$ 76,662,768$ 74,276,482$ 134,747,440$
Stimulus Funds - - - - - - - - -
Education Jobs Fund - - - - - - - - -
SHARS & MAC Reimbursement 6,986,373 7,460,843 8,600,000 - - - - 296,740 -
Breakfast, Lunch, Snacks & Commodities - - - 33,190,596 17,829,823 41,947,664 - - -
Other Federal Sources 1,402,028 1,423,034 1,150,000 5,469,275 9,253,259 6,272,336 26,542,453 30,441,339 39,731,394
Total Federal Revenue 10,581,543$ 11,198,964$ 11,600,000$ 38,659,871$ 27,083,082$ 48,220,000$ 103,205,221$ 105,014,561$ 174,478,834$
TOTAL ALL REVENUES 492,567,107$ 477,389,200$ 487,529,884$ 39,908,418$ 27,739,956$ 49,499,000$ 119,091,849$ 117,573,060$ 183,167,201$
EXPENDITURES BY FUNCTION
Instruction 256,497,460$ 273,832,022$ 265,209,062$ -$ -$ -$ 70,296,415$ 49,601,151$ 92,938,539$
Instructional Resources & Media Svcs. 5,622,843 5,508,331 5,310,627 - - - 817,854 779,597 1,192,262
Curriculum Develop. & Inst Staff Dev 14,856,935 11,883,134 16,259,165 - - - 20,222,436 21,236,635 35,569,146
Instructional Leadership 9,221,735 11,067,775 11,907,127 - - - 7,962,929 6,766,526 5,928,092
School Leadership 36,727,210 36,719,118 39,690,920 - - - 1,991,684 2,257,643 846,864
Guidance, Counseling & Evaluation Svcs 16,212,388 6,961,117 16,633,286 - - - 6,981,638 15,961,141 19,575,219
General Operating Fund Food Service Fund Special Revenue Fund (YTD Estimate)
64
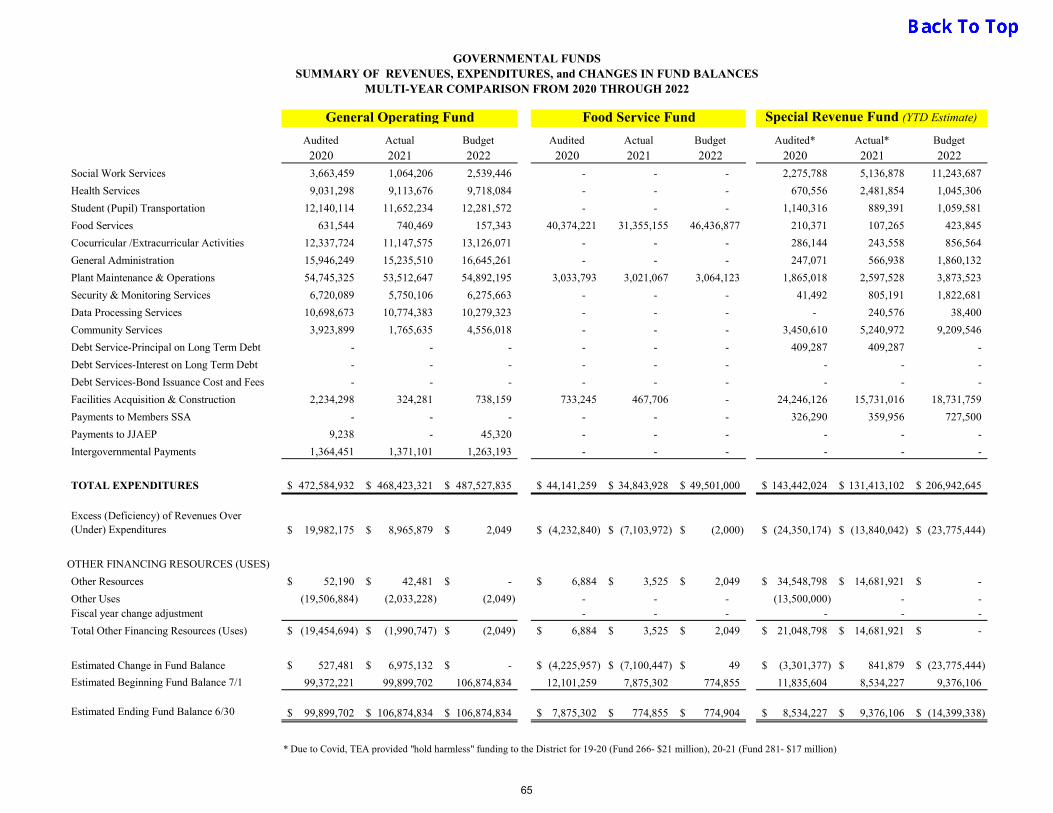
GOVERNMENTAL FUNDSSUMMARY OF REVENUES, EXPENDITURES, and CHANGES IN FUND BALANCES
MULTI-YEAR COMPARISON FROM 2020 THROUGH 2022
Audited Actual Budget Audited Actual Budget Audited* Actual* Budget
2020 2021 2022 2020 2021 2022 2020 2021 2022
General Operating Fund Food Service Fund Special Revenue Fund (YTD Estimate)
Social Work Services 3,663,459 1,064,206 2,539,446 - - - 2,275,788 5,136,878 11,243,687
Health Services 9,031,298 9,113,676 9,718,084 - - - 670,556 2,481,854 1,045,306
Student (Pupil) Transportation 12,140,114 11,652,234 12,281,572 - - - 1,140,316 889,391 1,059,581
Food Services 631,544 740,469 157,343 40,374,221 31,355,155 46,436,877 210,371 107,265 423,845
Cocurricular /Extracurricular Activities 12,337,724 11,147,575 13,126,071 - - - 286,144 243,558 856,564
General Administration 15,946,249 15,235,510 16,645,261 - - - 247,071 566,938 1,860,132
Plant Maintenance & Operations 54,745,325 53,512,647 54,892,195 3,033,793 3,021,067 3,064,123 1,865,018 2,597,528 3,873,523
Security & Monitoring Services 6,720,089 5,750,106 6,275,663 - - - 41,492 805,191 1,822,681
Data Processing Services 10,698,673 10,774,383 10,279,323 - - - - 240,576 38,400
Community Services 3,923,899 1,765,635 4,556,018 - - - 3,450,610 5,240,972 9,209,546
Debt Service-Principal on Long Term Debt - - - - - - 409,287 409,287 -
Debt Services-Interest on Long Term Debt - - - - - - - - -
Debt Services-Bond Issuance Cost and Fees - - - - - - - - -
Facilities Acquisition & Construction 2,234,298 324,281 738,159 733,245 467,706 - 24,246,126 15,731,016 18,731,759
Payments to Members SSA - - - - - - 326,290 359,956 727,500
Payments to JJAEP 9,238 - 45,320 - - - - - -
Intergovernmental Payments 1,364,451 1,371,101 1,263,193 - - - - - -
TOTAL EXPENDITURES 472,584,932$ 468,423,321$ 487,527,835$ 44,141,259$ 34,843,928$ 49,501,000$ 143,442,024$ 131,413,102$ 206,942,645$
Excess (Deficiency) of Revenues Over (Under) Expenditures 19,982,175$ 8,965,879$ 2,049$ (4,232,840)$ (7,103,972)$ (2,000)$ (24,350,174)$ (13,840,042)$ (23,775,444)$
OTHER FINANCING RESOURCES (USES)
Other Resources 52,190$ 42,481$ -$ 6,884$ 3,525$ 2,049$ 34,548,798$ 14,681,921$ -$
Other Uses (19,506,884) (2,033,228) (2,049) - - - (13,500,000) - - Fiscal year change adjustment - - - - - -
Total Other Financing Resources (Uses) (19,454,694)$ (1,990,747)$ (2,049)$ 6,884$ 3,525$ 2,049$ 21,048,798$ 14,681,921$ -$
Estimated Change in Fund Balance 527,481$ 6,975,132$ -$ (4,225,957)$ (7,100,447)$ 49$ (3,301,377)$ 841,879$ (23,775,444)$
Estimated Beginning Fund Balance 7/1 99,372,221 99,899,702 106,874,834 12,101,259 7,875,302 774,855 11,835,604 8,534,227 9,376,106
Estimated Ending Fund Balance 6/30 99,899,702$ 106,874,834$ 106,874,834$ 7,875,302$ 774,855$ 774,904$ 8,534,227$ 9,376,106$ (14,399,338)$
* Due to Covid, TEA provided "hold harmless" funding to the District for 19-20 (Fund 266- $21 million), 20-21 (Fund 281- $17 million)
65
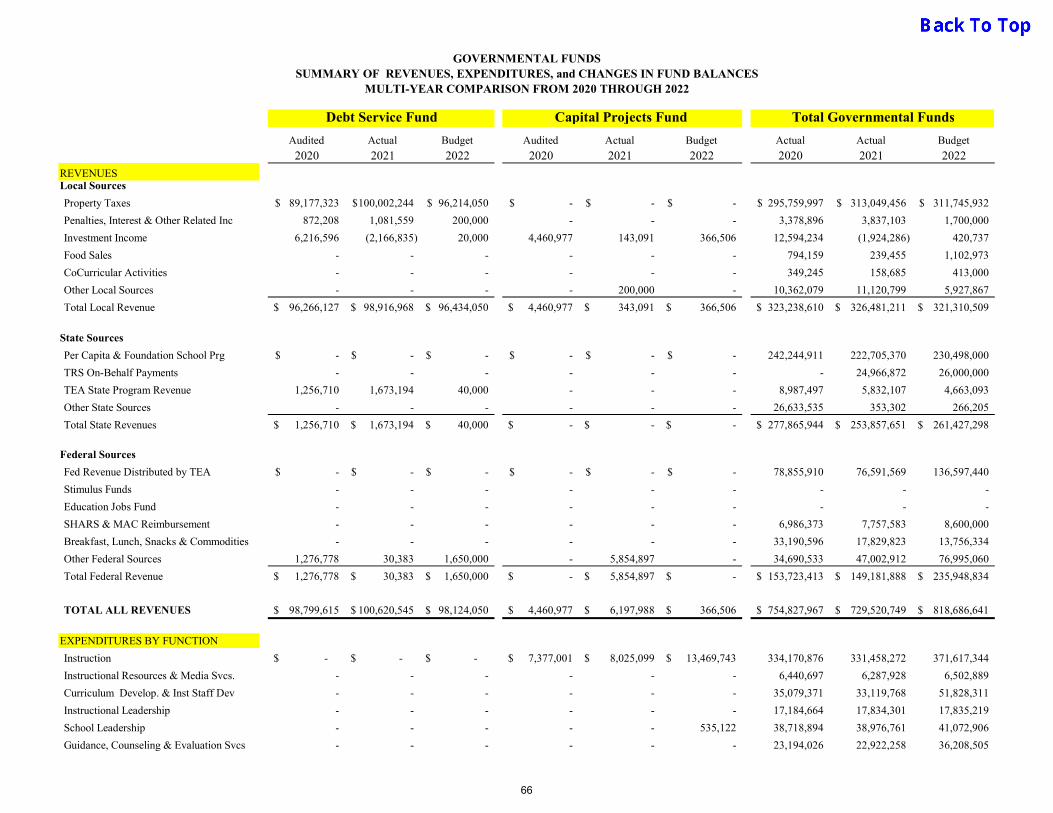
GOVERNMENTAL FUNDSSUMMARY OF REVENUES, EXPENDITURES, and CHANGES IN FUND BALANCES
MULTI-YEAR COMPARISON FROM 2020 THROUGH 2022
REVENUESLocal Sources
Property Taxes
Penalties, Interest & Other Related Inc
Investment Income
Food Sales
CoCurricular Activities
Other Local Sources
Total Local Revenue
State Sources
Per Capita & Foundation School Prg
TRS On-Behalf Payments
TEA State Program Revenue
Other State Sources
Total State Revenues
Federal Sources
Fed Revenue Distributed by TEA
Stimulus Funds
Education Jobs Fund
SHARS & MAC Reimbursement
Breakfast, Lunch, Snacks & Commodities
Other Federal Sources
Total Federal Revenue
TOTAL ALL REVENUES
EXPENDITURES BY FUNCTION
Instruction
Instructional Resources & Media Svcs.
Curriculum Develop. & Inst Staff Dev
Instructional Leadership
School Leadership
Guidance, Counseling & Evaluation Svcs
Audited Actual Budget Audited Actual Budget Actual Actual Budget
2020 2021 2022 2020 2021 2022 2020 2021 2022
89,177,323$ 100,002,244$ 96,214,050$ -$ -$ -$ 295,759,997$ 313,049,456$ 311,745,932$
872,208 1,081,559 200,000 - - - 3,378,896 3,837,103 1,700,000
6,216,596 (2,166,835) 20,000 4,460,977 143,091 366,506 12,594,234 (1,924,286) 420,737
- - - - - - 794,159 239,455 1,102,973
- - - - - - 349,245 158,685 413,000
- - - - 200,000 - 10,362,079 11,120,799 5,927,867
96,266,127$ 98,916,968$ 96,434,050$ 4,460,977$ 343,091$ 366,506$ 323,238,610$ 326,481,211$ 321,310,509$
-$ -$ -$ -$ -$ -$ 242,244,911 222,705,370 230,498,000
- - - - - - - 24,966,872 26,000,000
1,256,710 1,673,194 40,000 - - - 8,987,497 5,832,107 4,663,093
- - - - - - 26,633,535 353,302 266,205
1,256,710$ 1,673,194$ 40,000$ -$ -$ -$ 277,865,944$ 253,857,651$ 261,427,298$
-$ -$ -$ -$ -$ -$ 78,855,910 76,591,569 136,597,440
- - - - - - - - -
- - - - - - - - -
- - - - - - 6,986,373 7,757,583 8,600,000
- - - - - - 33,190,596 17,829,823 13,756,334
1,276,778 30,383 1,650,000 - 5,854,897 - 34,690,533 47,002,912 76,995,060
1,276,778$ 30,383$ 1,650,000$ -$ 5,854,897$ -$ 153,723,413$ 149,181,888$ 235,948,834$
98,799,615$ 100,620,545$ 98,124,050$ 4,460,977$ 6,197,988$ 366,506$ 754,827,967$ 729,520,749$ 818,686,641$
-$ -$ -$ 7,377,001$ 8,025,099$ 13,469,743$ 334,170,876 331,458,272 371,617,344
- - - - - - 6,440,697 6,287,928 6,502,889
- - - - - - 35,079,371 33,119,768 51,828,311
- - - - - - 17,184,664 17,834,301 17,835,219
- - - - - 535,122 38,718,894 38,976,761 41,072,906
- - - - - - 23,194,026 22,922,258 36,208,505
Debt Service Fund Capital Projects Fund Total Governmental Funds
66
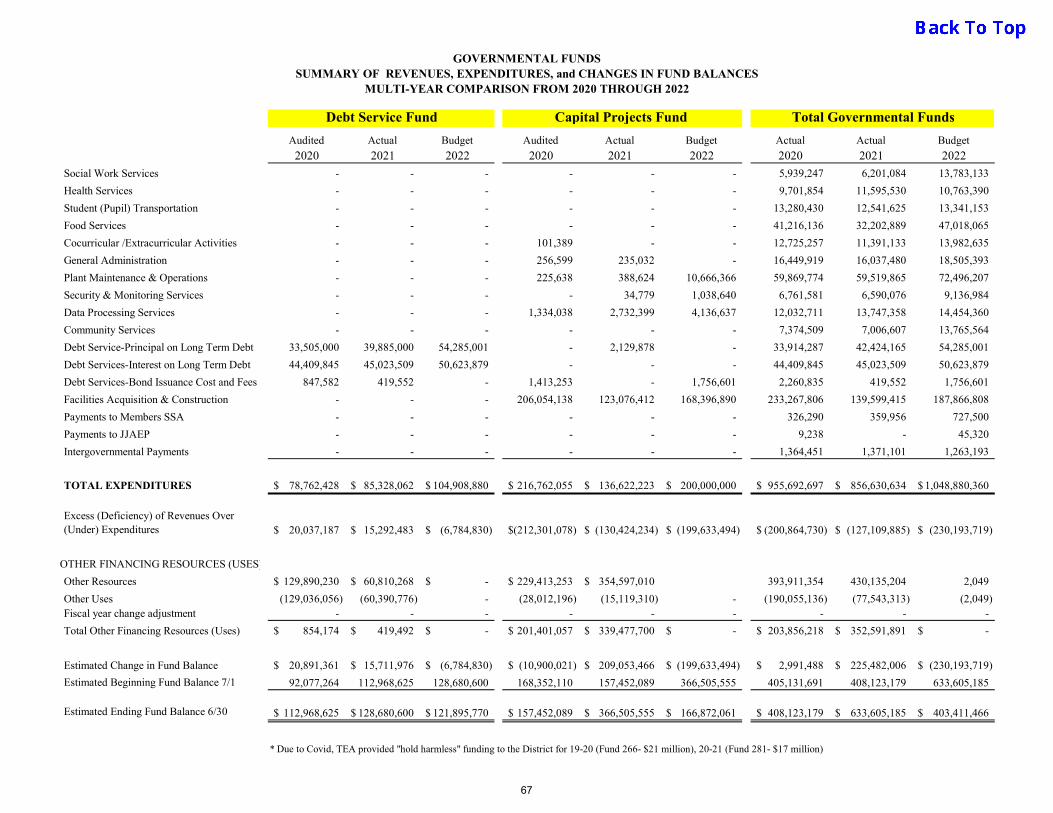
GOVERNMENTAL FUNDSSUMMARY OF REVENUES, EXPENDITURES, and CHANGES IN FUND BALANCES
MULTI-YEAR COMPARISON FROM 2020 THROUGH 2022
Social Work Services
Health Services
Student (Pupil) Transportation
Food Services
Cocurricular /Extracurricular Activities
General Administration
Plant Maintenance & Operations
Security & Monitoring Services
Data Processing Services
Community Services
Debt Service-Principal on Long Term Debt
Debt Services-Interest on Long Term Debt
Debt Services-Bond Issuance Cost and Fees
Facilities Acquisition & Construction
Payments to Members SSA
Payments to JJAEP
Intergovernmental Payments
TOTAL EXPENDITURES
Excess (Deficiency) of Revenues Over (Under) Expenditures
OTHER FINANCING RESOURCES (USES)
Other Resources
Other UsesFiscal year change adjustment
Total Other Financing Resources (Uses)
Estimated Change in Fund Balance
Estimated Beginning Fund Balance 7/1
Estimated Ending Fund Balance 6/30
Audited Actual Budget Audited Actual Budget Actual Actual Budget
2020 2021 2022 2020 2021 2022 2020 2021 2022
Debt Service Fund Capital Projects Fund Total Governmental Funds
- - - - - - 5,939,247 6,201,084 13,783,133
- - - - - - 9,701,854 11,595,530 10,763,390
- - - - - - 13,280,430 12,541,625 13,341,153
- - - - - - 41,216,136 32,202,889 47,018,065
- - - 101,389 - - 12,725,257 11,391,133 13,982,635
- - - 256,599 235,032 - 16,449,919 16,037,480 18,505,393
- - - 225,638 388,624 10,666,366 59,869,774 59,519,865 72,496,207
- - - - 34,779 1,038,640 6,761,581 6,590,076 9,136,984
- - - 1,334,038 2,732,399 4,136,637 12,032,711 13,747,358 14,454,360
- - - - - - 7,374,509 7,006,607 13,765,564
33,505,000 39,885,000 54,285,001 - 2,129,878 - 33,914,287 42,424,165 54,285,001
44,409,845 45,023,509 50,623,879 - - - 44,409,845 45,023,509 50,623,879
847,582 419,552 - 1,413,253 - 1,756,601 2,260,835 419,552 1,756,601
- - - 206,054,138 123,076,412 168,396,890 233,267,806 139,599,415 187,866,808
- - - - - - 326,290 359,956 727,500
- - - - - - 9,238 - 45,320
- - - - - - 1,364,451 1,371,101 1,263,193
78,762,428$ 85,328,062$ 104,908,880$ 216,762,055$ 136,622,223$ 200,000,000$ 955,692,697$ 856,630,634$ 1,048,880,360$
20,037,187$ 15,292,483$ (6,784,830)$ (212,301,078)$ (130,424,234)$ (199,633,494)$ (200,864,730)$ (127,109,885)$ (230,193,719)$
129,890,230$ 60,810,268$ -$ 229,413,253$ 354,597,010$ 393,911,354 430,135,204 2,049
(129,036,056) (60,390,776) - (28,012,196) (15,119,310) - (190,055,136) (77,543,313) (2,049) - - - - - - - - -
854,174$ 419,492$ -$ 201,401,057$ 339,477,700$ -$ 203,856,218$ 352,591,891$ -$
20,891,361$ 15,711,976$ (6,784,830)$ (10,900,021)$ 209,053,466$ (199,633,494)$ 2,991,488$ 225,482,006$ (230,193,719)$
92,077,264 112,968,625 128,680,600 168,352,110 157,452,089 366,505,555 405,131,691 408,123,179 633,605,185
112,968,625$ 128,680,600$ 121,895,770$ 157,452,089$ 366,505,555$ 166,872,061$ 408,123,179$ 633,605,185$ 403,411,466$
* Due to Covid, TEA provided "hold harmless" funding to the District for 19-20 (Fund 266- $21 million), 20-21 (Fund 281- $17 million)
67
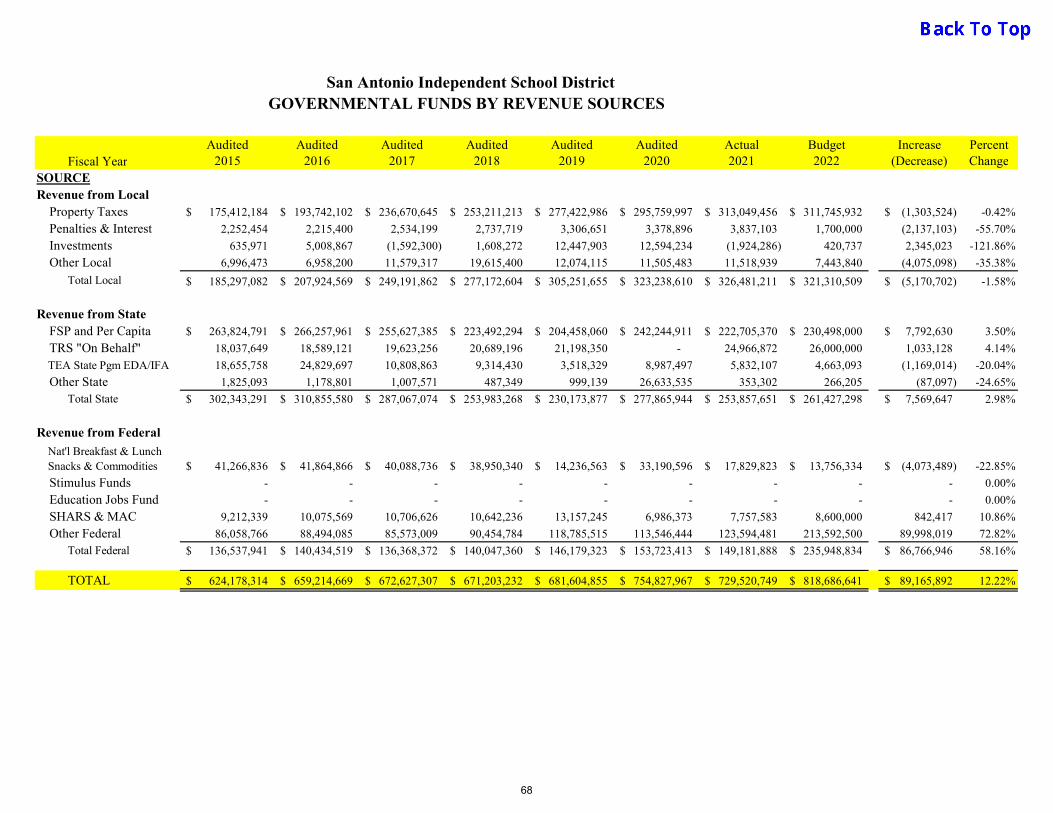
Audited Audited Audited Audited Audited Audited Actual Budget Increase PercentFiscal Year 2015 2016 2017 2018 2019 2020 2021 2022 (Decrease) Change
SOURCERevenue from Local
175,412,184$ 193,742,102$ 236,670,645$ 253,211,213$ 277,422,986$ 295,759,997$ 313,049,456$ 311,745,932$ (1,303,524)$ -0.42%
2,252,454 2,215,400 2,534,199 2,737,719 3,306,651 3,378,896 3,837,103 1,700,000 (2,137,103) -55.70%
635,971 5,008,867 (1,592,300) 1,608,272 12,447,903 12,594,234 (1,924,286) 420,737 2,345,023 -121.86%
6,996,473 6,958,200 11,579,317 19,615,400 12,074,115 11,505,483 11,518,939 7,443,840 (4,075,098) -35.38%
Total Local 185,297,082$ 207,924,569$ 249,191,862$ 277,172,604$ 305,251,655$ 323,238,610$ 326,481,211$ 321,310,509$ (5,170,702)$ -1.58%
Revenue from State 263,824,791$ 266,257,961$ 255,627,385$ 223,492,294$ 204,458,060$ 242,244,911$ 222,705,370$ 230,498,000$ 7,792,630$ 3.50%
18,037,649 18,589,121 19,623,256 20,689,196 21,198,350 - 24,966,872 26,000,000 1,033,128 4.14%
18,655,758 24,829,697 10,808,863 9,314,430 3,518,329 8,987,497 5,832,107 4,663,093 (1,169,014) -20.04%
1,825,093 1,178,801 1,007,571 487,349 999,139 26,633,535 353,302 266,205 (87,097) -24.65%
Total State 302,343,291$ 310,855,580$ 287,067,074$ 253,983,268$ 230,173,877$ 277,865,944$ 253,857,651$ 261,427,298$ 7,569,647$ 2.98%
Revenue from Federal
41,266,836$ 41,864,866$ 40,088,736$ 38,950,340$ 14,236,563$ 33,190,596$ 17,829,823$ 13,756,334$ (4,073,489)$ -22.85%
- - - - - - - - - 0.00%
- - - - - - - - - 0.00%
9,212,339 10,075,569 10,706,626 10,642,236 13,157,245 6,986,373 7,757,583 8,600,000 842,417 10.86%
Other Federal 86,058,766 88,494,085 85,573,009 90,454,784 118,785,515 113,546,444 123,594,481 213,592,500 89,998,019 72.82%
Total Federal 136,537,941$ 140,434,519$ 136,368,372$ 140,047,360$ 146,179,323$ 153,723,413$ 149,181,888$ 235,948,834$ 86,766,946$ 58.16%
TOTAL 624,178,314$ 659,214,669$ 672,627,307$ 671,203,232$ 681,604,855$ 754,827,967$ 729,520,749$ 818,686,641$ 89,165,892$ 12.22%
TRS "On Behalf"
Other State
Other Local
TEA State Pgm EDA/IFA
Nat'l Breakfast & Lunch Snacks & Commodities
SHARS & MAC
Stimulus Funds Education Jobs Fund
San Antonio Independent School District GOVERNMENTAL FUNDS BY REVENUE SOURCES
Property Taxes Penalties & Interest Investments
FSP and Per Capita
68
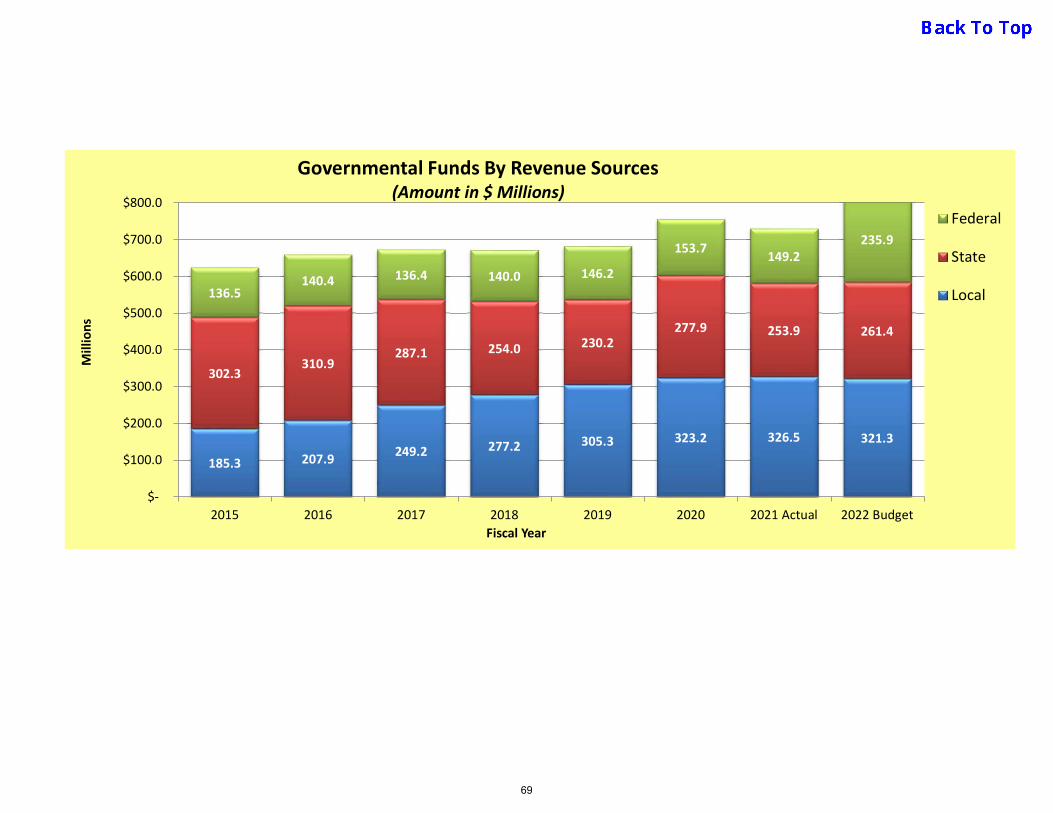
185.3 207.9 249.2 277.2 305.3 323.2 326.5 321.3
302.3310.9
287.1 254.0 230.2277.9 253.9 261.4
136.5140.4 136.4 140.0 146.2
153.7 149.2235.9
$-
$100.0
$200.0
$300.0
$400.0
$500.0
$600.0
$700.0
$800.0
2015 2016 2017 2018 2019 2020 2021 Actual 2022 Budget
Mill
ions
Fiscal Year
Governmental Funds By Revenue Sources(Amount in $ Millions)
Federal
State
Local
69
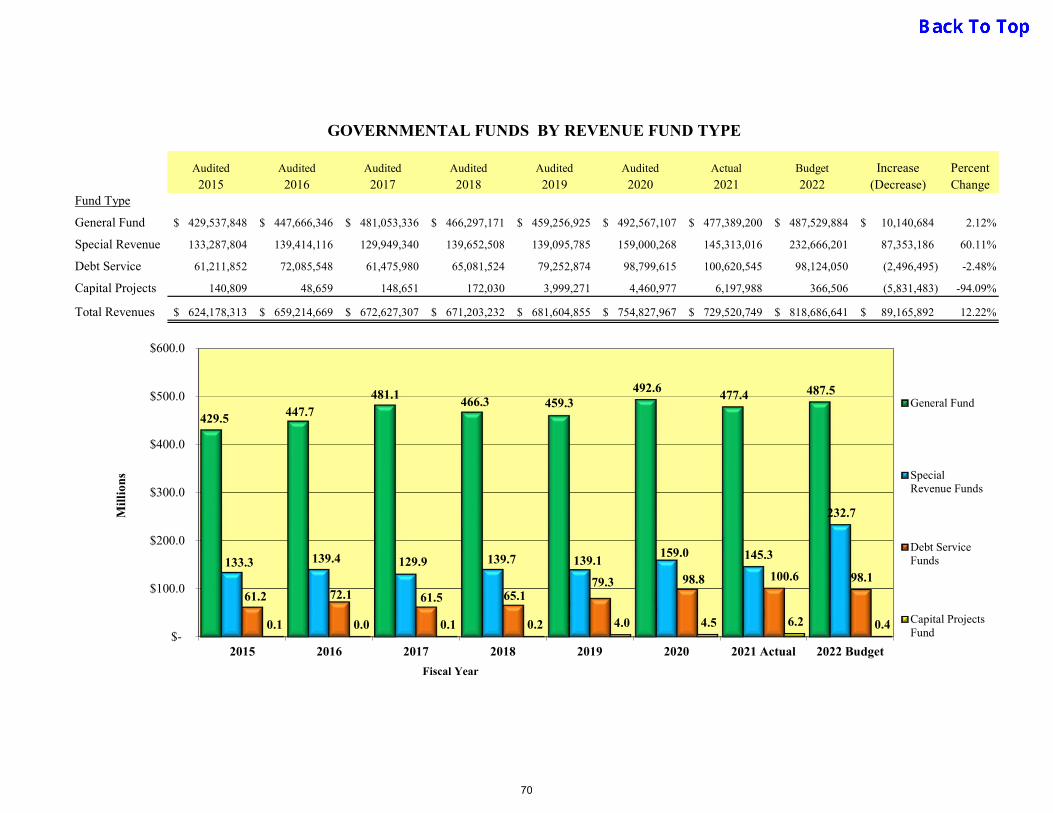
Audited Audited Audited Audited Audited Audited Actual Budget Increase Percent2015 2016 2017 2018 2019 2020 2021 2022 (Decrease) Change
Fund Type
General Fund 429,537,848$ 447,666,346$ 481,053,336$ 466,297,171$ 459,256,925$ 492,567,107$ 477,389,200$ 487,529,884$ 10,140,684$ 2.12%
Special Revenue 133,287,804 139,414,116 129,949,340 139,652,508 139,095,785 159,000,268 145,313,016 232,666,201 87,353,186 60.11%
Debt Service 61,211,852 72,085,548 61,475,980 65,081,524 79,252,874 98,799,615 100,620,545 98,124,050 (2,496,495) -2.48%
Capital Projects 140,809 48,659 148,651 172,030 3,999,271 4,460,977 6,197,988 366,506 (5,831,483) -94.09%
Total Revenues 624,178,313$ 659,214,669$ 672,627,307$ 671,203,232$ 681,604,855$ 754,827,967$ 729,520,749$ 818,686,641$ 89,165,892$ 12.22%
GOVERNMENTAL FUNDS BY REVENUE FUND TYPE
429.5 447.7 481.1
466.3 459.3 492.6
477.4 487.5
133.3 139.4 129.9 139.7 139.1 159.0 145.3
232.7
61.2 72.1 61.5 65.1 79.3 98.8 100.6 98.1
0.1 0.0 0.1 0.2 4.0 4.5 6.2 0.4 $-
$100.0
$200.0
$300.0
$400.0
$500.0
$600.0
2015 2016 2017 2018 2019 2020 2021 Actual 2022 Budget
Mil
lion
s
General Fund
SpecialRevenue Funds
Debt ServiceFunds
Capital ProjectsFund
Fiscal Year
70
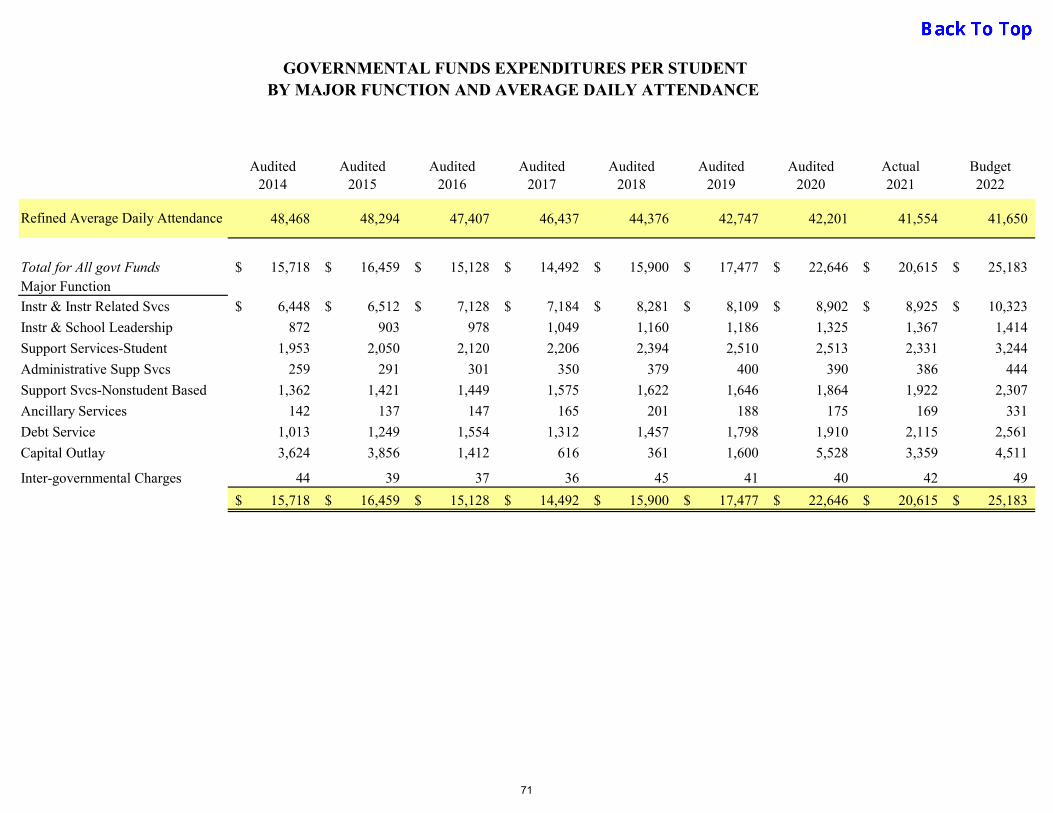
GOVERNMENTAL FUNDS EXPENDITURES PER STUDENT BY MAJOR FUNCTION AND AVERAGE DAILY ATTENDANCE
Audited 2014
Audited 2015
Audited 2016
Audited 2017
Audited 2018
Audited 2019
Audited 2020
Actual 2021
Budget2022
48,468 48,294 47,407 46,437 44,376 42,747 42,201 41,554 41,650
Total for All govt Funds 15,718$ 16,459$ 15,128$ 14,492$ 15,900$ 17,477$ 22,646$ 20,615$ 25,183$ Major Function
Instr & Instr Related Svcs 6,448$ 6,512$ 7,128$ 7,184$ 8,281$ 8,109$ 8,902$ 8,925$ 10,323$
Instr & School Leadership 872 903 978 1,049 1,160 1,186 1,325 1,367 1,414
Support Services-Student 1,953 2,050 2,120 2,206 2,394 2,510 2,513 2,331 3,244
Administrative Supp Svcs 259 291 301 350 379 400 390 386 444
Support Svcs-Nonstudent Based 1,362 1,421 1,449 1,575 1,622 1,646 1,864 1,922 2,307
Ancillary Services 142 137 147 165 201 188 175 169 331
Debt Service 1,013 1,249 1,554 1,312 1,457 1,798 1,910 2,115 2,561
Capital Outlay 3,624 3,856 1,412 616 361 1,600 5,528 3,359 4,511
Inter-governmental Charges 44 39 37 36 45 41 40 42 49
15,718$ 16,459$ 15,128$ 14,492$ 15,900$ 17,477$ 22,646$ 20,615$ 25,183$
Refined Average Daily Attendance
71
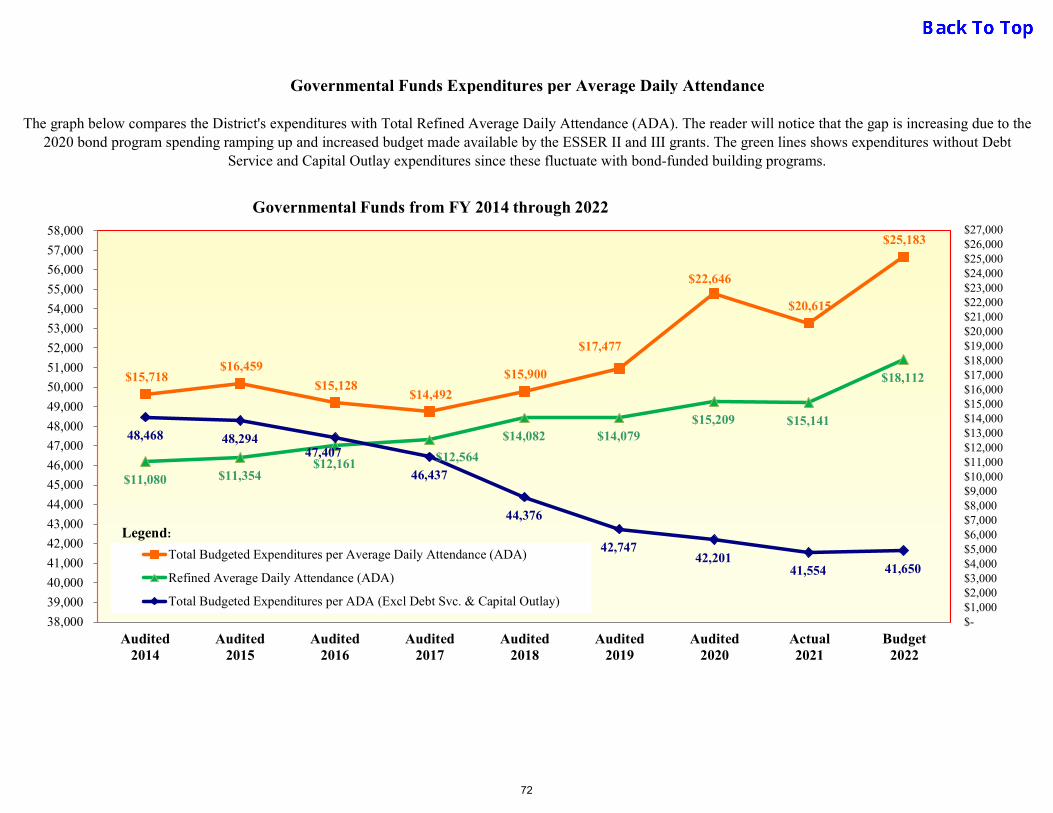
The graph below compares the District's expenditures with Total Refined Average Daily Attendance (ADA). The reader will notice that the gap is increasing due to the 2020 bond program spending ramping up and increased budget made available by the ESSER II and III grants. The green lines shows expenditures without Debt
Service and Capital Outlay expenditures since these fluctuate with bond-funded building programs.
Governmental Funds Expenditures per Average Daily Attendance
$15,718 $16,459
$15,128 $14,492
$15,900
$17,477
$22,646
$20,615
$25,183
$11,080 $11,354$12,161 $12,564
$14,082 $14,079$15,209 $15,141
$18,112
48,468 48,29447,407
46,437
44,376
42,74742,201
41,554 41,650
38,000
39,000
40,000
41,000
42,000
43,000
44,000
45,000
46,000
47,000
48,000
49,000
50,000
51,000
52,000
53,000
54,000
55,000
56,000
57,000
58,000
$- $1,000 $2,000 $3,000 $4,000 $5,000 $6,000 $7,000 $8,000 $9,000 $10,000 $11,000 $12,000 $13,000 $14,000 $15,000 $16,000 $17,000 $18,000 $19,000 $20,000 $21,000 $22,000 $23,000 $24,000 $25,000 $26,000 $27,000
Audited2014
Audited2015
Audited2016
Audited2017
Audited2018
Audited2019
Audited2020
Actual2021
Budget2022
Total Budgeted Expenditures per Average Daily Attendance (ADA)
Refined Average Daily Attendance (ADA)
Total Budgeted Expenditures per ADA (Excl Debt Svc. & Capital Outlay)
Legend:
Governmental Funds from FY 2014 through 2022
72
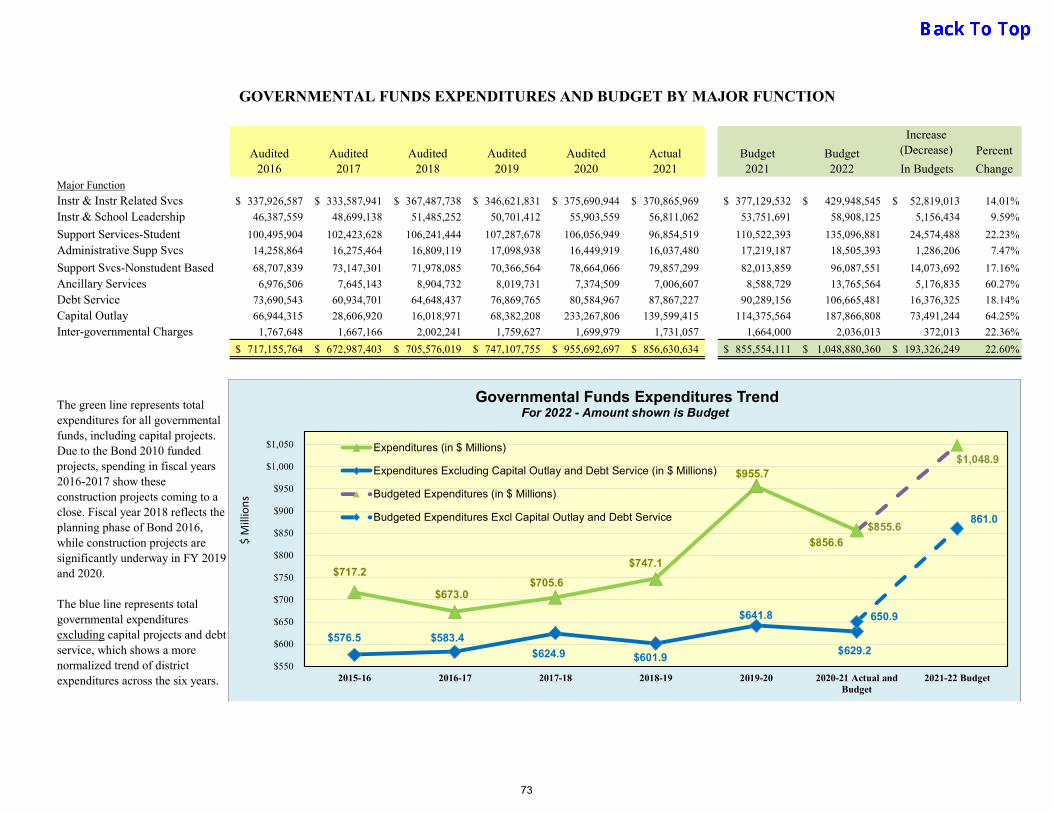
Increase (Decrease) Percent
In Budgets ChangeMajor Function
Instr & Instr Related Svcs 337,926,587$ 333,587,941$ 367,487,738$ 346,621,831$ 375,690,944$ 370,865,969$ 377,129,532$ 429,948,545$ 52,819,013$ 14.01%
Instr & School Leadership 46,387,559 48,699,138 51,485,252 50,701,412 55,903,559 56,811,062 53,751,691 58,908,125 5,156,434 9.59%
Support Services-Student 100,495,904 102,423,628 106,241,444 107,287,678 106,056,949 96,854,519 110,522,393 135,096,881 24,574,488 22.23%
Administrative Supp Svcs 14,258,864 16,275,464 16,809,119 17,098,938 16,449,919 16,037,480 17,219,187 18,505,393 1,286,206 7.47%
Support Svcs-Nonstudent Based 68,707,839 73,147,301 71,978,085 70,366,564 78,664,066 79,857,299 82,013,859 96,087,551 14,073,692 17.16%
Ancillary Services 6,976,506 7,645,143 8,904,732 8,019,731 7,374,509 7,006,607 8,588,729 13,765,564 5,176,835 60.27%
Debt Service 73,690,543 60,934,701 64,648,437 76,869,765 80,584,967 87,867,227 90,289,156 106,665,481 16,376,325 18.14%
Capital Outlay 66,944,315 28,606,920 16,018,971 68,382,208 233,267,806 139,599,415 114,375,564 187,866,808 73,491,244 64.25%
Inter-governmental Charges 1,767,648 1,667,166 2,002,241 1,759,627 1,699,979 1,731,057 1,664,000 2,036,013 372,013 22.36%
717,155,764$ 672,987,403$ 705,576,019$ 747,107,755$ 955,692,697$ 856,630,634$ 855,554,111$ 1,048,880,360$ 193,326,249$ 22.60%
Budget2021
Budget2022
GOVERNMENTAL FUNDS EXPENDITURES AND BUDGET BY MAJOR FUNCTION
The green line represents total expenditures for all governmental funds, including capital projects. Due to the Bond 2010 funded projects, spending in fiscal years 2016-2017 show these construction projects coming to a close. Fiscal year 2018 reflects the planning phase of Bond 2016, while construction projects are significantly underway in FY 2019 and 2020.
The blue line represents total governmental expenditures excluding capital projects and debt service, which shows a more normalized trend of district expenditures across the six years.
Audited2016
Audited2017
Audited2018
Audited2019
Actual2021
Audited2020
$717.2
$673.0$705.6
$747.1
$955.7
$856.6
$576.5 $583.4
$624.9 $601.9
$641.8
$629.2
$855.6
$1,048.9
650.9
861.0
$550
$600
$650
$700
$750
$800
$850
$900
$950
$1,000
$1,050
2015-16 2016-17 2017-18 2018-19 2019-20 2020-21 Actual andBudget
2021-22 Budget
Governmental Funds Expenditures TrendFor 2022 - Amount shown is Budget
Expenditures (in $ Millions)
Expenditures Excluding Capital Outlay and Debt Service (in $ Millions)
Budgeted Expenditures (in $ Millions)
Budgeted Expenditures Excl Capital Outlay and Debt Service
$ M
illio
ns
73

SUMMARY OF ESTIMATED REVENUES, EXPENDITURES & OTHER RESOURCES (USES) BUDGET FOR FISCAL YEAR 2021-2022
Operating Food Service Debt Service Cap. Proj. & Special Total
Fund Fund Fund Revenue Funds All Funds
ESTIMATED REVENUES
5700 Local Sources 219,431,884$ 1,118,000$ 96,434,050$ 4,326,575$ 321,310,509$
5800 State Sources 256,498,000 161,000 40,000 4,728,298 261,427,298
5900 Federal Sources 11,600,000 48,220,000 1,650,000 174,478,834 235,948,834
Total Revenues 487,529,884$ 49,499,000$ 98,124,050$ 183,533,707$ 818,686,641$
APPROPRIATED EXPENDITURES
11 Instruction
6100 Payroll 236,189,800$ -$ -$ 75,294,086$ 311,483,886$
6200 Contracted Svc 14,152,595 - - 2,835,961 16,988,556
6300 Supplies 13,430,258 - - 26,630,385 40,060,643
6400 Other Costs 1,436,409 - - 1,530,268 2,966,677
6600 Capital Outlay - - - 117,583 117,583
Total Fnc 11 265,209,062$ -$ -$ 106,408,282$ 371,617,344$
12
6100 Payroll 4,467,510$ -$ -$ 1,105,396$ 5,572,906$
6200 Contracted Svc - - - 156 156
6300 Supplies 843,117 - - 83,755 926,872
6400 Other Costs - - - 2,955 2,955
6600 Capital Outlay - - - - -
Total Fnc 12 5,310,627$ -$ -$ 1,192,262$ 6,502,889$
13 Curriculum Development & Instructional Staff Development
6100 Payroll 11,673,120$ -$ -$ 23,982,226$ 35,655,346$
6200 Contracted Svc 1,567,236 - - 4,463,428 6,030,664
6300 Supplies 2,120,715 - - 953,562 3,074,277
6400 Other Costs 898,094 - - 6,169,929 7,068,023
6600 Capital Outlay - - - - -
Total Fnc 13 16,259,165$ -$ -$ 35,569,146$ 51,828,311$
21 Instructional Leadership
6100 Payroll 10,833,866$ -$ -$ 4,917,352$ 15,751,218$
6200 Contracted Svc 271,078 - - 724,434 995,512
6300 Supplies 497,151 - - 154,484 651,635
6400 Other Costs 305,032 - - 131,821 436,853
6600 Capital Outlay - - - - -
Total Fnc 21 11,907,127$ -$ -$ 5,928,092$ 17,835,219$
23 School Leadership
6100 Payroll 39,373,610$ -$ -$ 625,000$ 39,998,610$
6200 Contracted Svc - - - 23,448 23,448
6300 Supplies 260,488 - - 546,896 807,384
6400 Other Costs 56,822 - - 186,642 243,464
6600 Capital Outlay - - - 0 0
Total Fnc 23 39,690,920$ -$ -$ 1,381,986$ 41,072,906$
Instructional Resources & Media
74
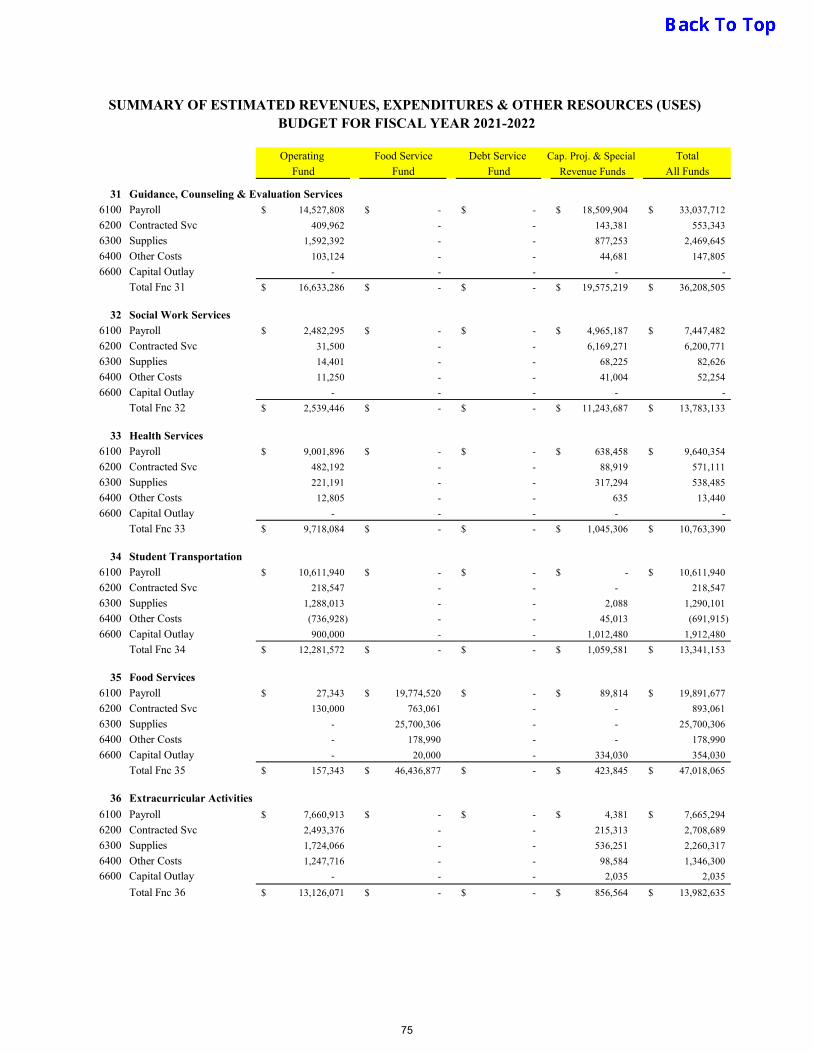
SUMMARY OF ESTIMATED REVENUES, EXPENDITURES & OTHER RESOURCES (USES) BUDGET FOR FISCAL YEAR 2021-2022
Operating Food Service Debt Service Cap. Proj. & Special Total
Fund Fund Fund Revenue Funds All Funds
31 Guidance, Counseling & Evaluation Services
6100 Payroll 14,527,808$ -$ -$ 18,509,904$ 33,037,712$
6200 Contracted Svc 409,962 - - 143,381 553,343
6300 Supplies 1,592,392 - - 877,253 2,469,645
6400 Other Costs 103,124 - - 44,681 147,805
6600 Capital Outlay - - - - -
Total Fnc 31 16,633,286$ -$ -$ 19,575,219$ 36,208,505$
32 Social Work Services
6100 Payroll 2,482,295$ -$ -$ 4,965,187$ 7,447,482$
6200 Contracted Svc 31,500 - - 6,169,271 6,200,771
6300 Supplies 14,401 - - 68,225 82,626
6400 Other Costs 11,250 - - 41,004 52,254
6600 Capital Outlay - - - - -
Total Fnc 32 2,539,446$ -$ -$ 11,243,687$ 13,783,133$
33 Health Services
6100 Payroll 9,001,896$ -$ -$ 638,458$ 9,640,354$
6200 Contracted Svc 482,192 - - 88,919 571,111
6300 Supplies 221,191 - - 317,294 538,485
6400 Other Costs 12,805 - - 635 13,440
6600 Capital Outlay - - - - -
Total Fnc 33 9,718,084$ -$ -$ 1,045,306$ 10,763,390$
34 Student Transportation
6100 Payroll 10,611,940$ -$ -$ -$ 10,611,940$
6200 Contracted Svc 218,547 - - - 218,547
6300 Supplies 1,288,013 - - 2,088 1,290,101
6400 Other Costs (736,928) - - 45,013 (691,915)
6600 Capital Outlay 900,000 - - 1,012,480 1,912,480
Total Fnc 34 12,281,572$ -$ -$ 1,059,581$ 13,341,153$
35 Food Services
6100 Payroll 27,343$ 19,774,520$ -$ 89,814$ 19,891,677$
6200 Contracted Svc 130,000 763,061 - - 893,061
6300 Supplies - 25,700,306 - - 25,700,306
6400 Other Costs - 178,990 - - 178,990
6600 Capital Outlay - 20,000 - 334,030 354,030
Total Fnc 35 157,343$ 46,436,877$ -$ 423,845$ 47,018,065$
36 Extracurricular Activities
6100 Payroll 7,660,913$ -$ -$ 4,381$ 7,665,294$
6200 Contracted Svc 2,493,376 - - 215,313 2,708,689
6300 Supplies 1,724,066 - - 536,251 2,260,317
6400 Other Costs 1,247,716 - - 98,584 1,346,300
6600 Capital Outlay - - - 2,035 2,035
Total Fnc 36 13,126,071$ -$ -$ 856,564$ 13,982,635$
75

SUMMARY OF ESTIMATED REVENUES, EXPENDITURES & OTHER RESOURCES (USES) BUDGET FOR FISCAL YEAR 2021-2022
Operating Food Service Debt Service Cap. Proj. & Special Total
Fund Fund Fund Revenue Funds All Funds
41 General Administration
6100 Payroll 12,984,425$ -$ -$ 1,608,277$ 14,592,702.21$
6200 Contracted Svc 2,365,222 - - 188,218 2,553,440
6300 Supplies 666,356 - - 48,095 714,451
6400 Other Costs 609,142 - - 5,342 614,484
6600 Capital Outlay 20,116 - - 10,200 30,316
Total Fnc 41 16,645,261$ -$ -$ 1,860,132$ 18,505,393$
51 Plant Maintenance & Operations
6100 Payroll 28,993,915$ 2,338,789$ -$ 1,297,824$ 32,630,528$
6200 Contracted Svc 18,226,797 725,334 - 2,050,250 21,002,381
6300 Supplies 3,856,643 - - 7,669,408 11,526,051
6400 Other Costs 3,314,840 - - 1,950 3,316,790
6600 Capital Outlay 500,000 - - 3,520,456 4,020,456
Total Fnc 51 54,892,195$ 3,064,123$ -$ 14,539,889$ 72,496,207$
52 Security & Monitoring
6100 Payroll 4,939,065$ -$ -$ 8,448$ 4,947,513$
6200 Contracted Svc 925,302 - - 37,224 962,526
6300 Supplies 272,350 - - 1,989,643 2,261,993
6400 Other Costs 138,946 - - 735 139,681
6600 Capital Outlay - - - 825,272 825,272
Total Fnc 52 6,275,663$ -$ -$ 2,861,321$ 9,136,984$
53 Data Processing Services
6100 Payroll 5,131,090$ -$ -$ 6,297$ 5,137,387$
6200 Contracted Svc 1,101,930 - - 1,642,952 2,744,882
6300 Supplies 3,883,631 - - 1,984,127 5,867,758
6400 Other Costs 162,672 - - - 162,672
6600 Capital Outlay - - - 541,660 541,660
Total Fnc 53 10,279,323$ -$ -$ 4,175,037$ 14,454,360$
61 Community Services
6100 Payroll 3,846,011$ -$ -$ 5,734,703$ 9,580,714$
6200 Contracted Svc 459,534 - - 2,404,296 2,863,830
6300 Supplies 81,675 - - 714,468 796,143
6400 Other Costs 168,798 - - 356,080 524,878
6600 Capital Outlay - - - - -
Total Fnc 61 4,556,018$ -$ -$ 9,209,546$ 13,765,564$
71 Debt Services
6500 Debt Service -$ -$ 104,908,880$ 1,756,601$ 106,665,481$
Total Fnc 71 -$ -$ 104,908,880$ 1,756,601$ 106,665,481$
76
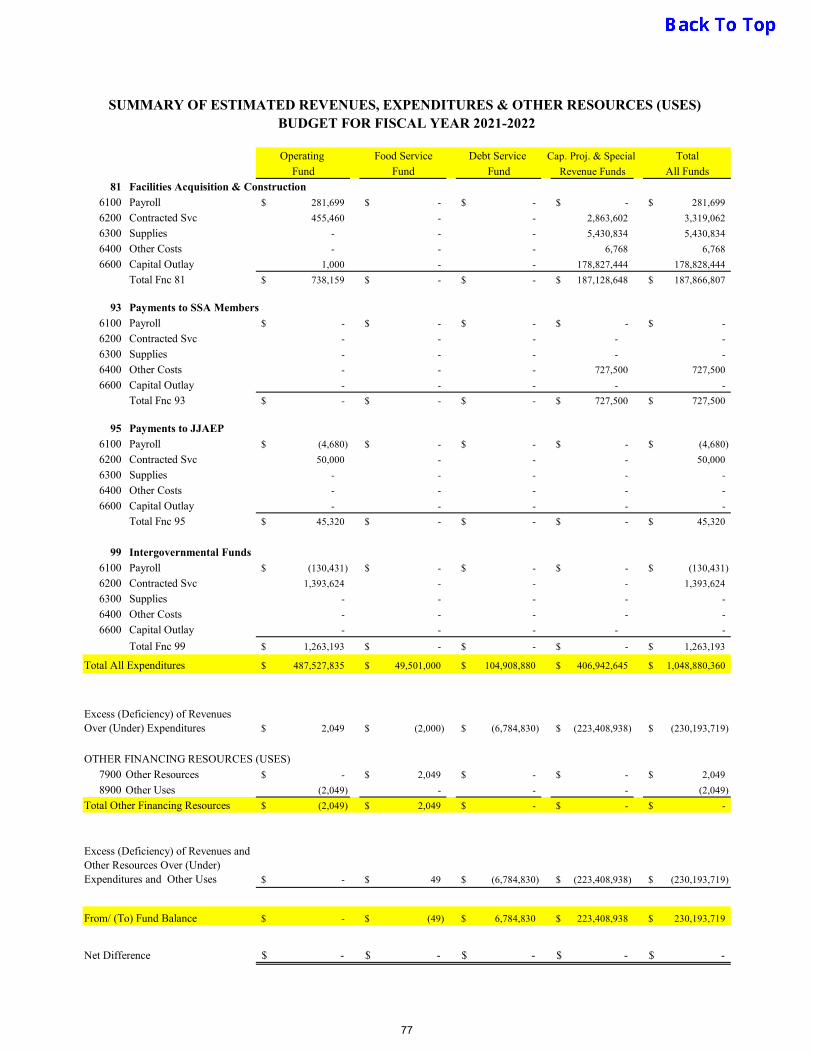
SUMMARY OF ESTIMATED REVENUES, EXPENDITURES & OTHER RESOURCES (USES) BUDGET FOR FISCAL YEAR 2021-2022
Operating Food Service Debt Service Cap. Proj. & Special Total
Fund Fund Fund Revenue Funds All Funds
81 Facilities Acquisition & Construction
6100 Payroll 281,699$ -$ -$ -$ 281,699$
6200 Contracted Svc 455,460 - - 2,863,602 3,319,062
6300 Supplies - - - 5,430,834 5,430,834
6400 Other Costs - - - 6,768 6,768
6600 Capital Outlay 1,000 - - 178,827,444 178,828,444
Total Fnc 81 738,159$ -$ -$ 187,128,648$ 187,866,807$
93 Payments to SSA Members
6100 Payroll -$ -$ -$ -$ -$
6200 Contracted Svc - - - - -
6300 Supplies - - - - -
6400 Other Costs - - - 727,500 727,500
6600 Capital Outlay - - - - -
Total Fnc 93 -$ -$ -$ 727,500$ 727,500$
95 Payments to JJAEP
6100 Payroll (4,680)$ -$ -$ -$ (4,680)$
6200 Contracted Svc 50,000 - - - 50,000
6300 Supplies - - - - -
6400 Other Costs - - - - -
6600 Capital Outlay - - - - -
Total Fnc 95 45,320$ -$ -$ -$ 45,320$
99 Intergovernmental Funds
6100 Payroll (130,431)$ -$ -$ -$ (130,431)$
6200 Contracted Svc 1,393,624 - - - 1,393,624
6300 Supplies - - - - -
6400 Other Costs - - - - -
6600 Capital Outlay - - - - -
Total Fnc 99 1,263,193$ -$ -$ -$ 1,263,193$
Total All Expenditures 487,527,835$ 49,501,000$ 104,908,880$ 406,942,645$ 1,048,880,360$
2,049$ (2,000)$ (6,784,830)$ (223,408,938)$ (230,193,719)$
OTHER FINANCING RESOURCES (USES)
7900 Other Resources -$ 2,049$ -$ -$ 2,049$
8900 Other Uses (2,049) - - - (2,049)
Total Other Financing Resources (2,049)$ 2,049$ -$ -$ -$
-$ 49$ (6,784,830)$ (223,408,938)$ (230,193,719)$
From/ (To) Fund Balance -$ (49)$ 6,784,830$ 223,408,938$ 230,193,719$
Net Difference -$ -$ -$ -$ -$
Excess (Deficiency) of Revenues and Other Resources Over (Under) Expenditures and Other Uses
Excess (Deficiency) of Revenues Over (Under) Expenditures
77
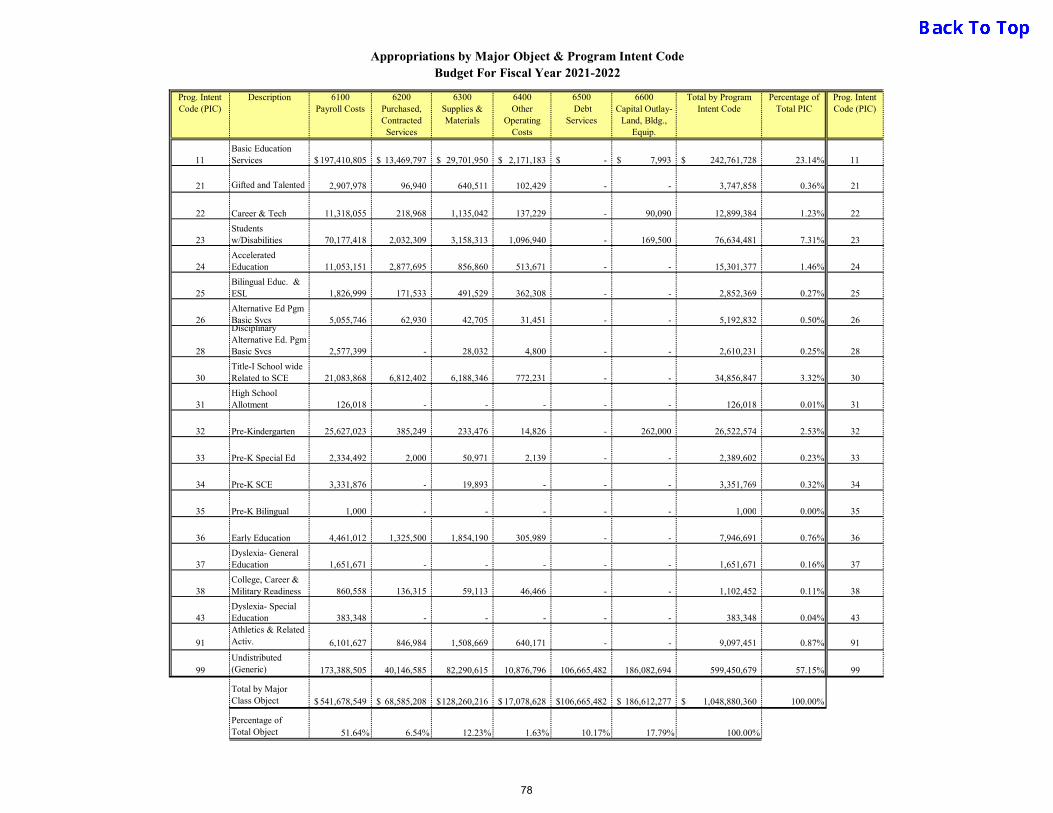
Appropriations by Major Object & Program Intent CodeBudget For Fiscal Year 2021-2022
Prog. Intent Code (PIC)
Description 6100 Payroll Costs
6200 Purchased, Contracted
Services
6300 Supplies & Materials
6400 Other
Operating Costs
6500 Debt
Services
6600Capital Outlay-
Land, Bldg., Equip.
Total by Program Intent Code
Percentage of Total PIC
Prog. Intent Code (PIC)
11Basic Education Services 197,410,805$ 13,469,797$ 29,701,950$ 2,171,183$ -$ 7,993$ 242,761,728$ 23.14% 11
21 Gifted and Talented 2,907,978 96,940 640,511 102,429 - - 3,747,858 0.36% 21
22 Career & Tech 11,318,055 218,968 1,135,042 137,229 - 90,090 12,899,384 1.23% 22
23Students w/Disabilities 70,177,418 2,032,309 3,158,313 1,096,940 - 169,500 76,634,481 7.31% 23
24Accelerated Education 11,053,151 2,877,695 856,860 513,671 - - 15,301,377 1.46% 24
25Bilingual Educ. & ESL 1,826,999 171,533 491,529 362,308 - - 2,852,369 0.27% 25
26Alternative Ed Pgm Basic Svcs 5,055,746 62,930 42,705 31,451 - - 5,192,832 0.50% 26
28
Disciplinary Alternative Ed. Pgm Basic Svcs 2,577,399 - 28,032 4,800 - - 2,610,231 0.25% 28
30Title-I School wide Related to SCE 21,083,868 6,812,402 6,188,346 772,231 - - 34,856,847 3.32% 30
31High School Allotment 126,018 - - - - - 126,018 0.01% 31
32 Pre-Kindergarten 25,627,023 385,249 233,476 14,826 - 262,000 26,522,574 2.53% 32
33 Pre-K Special Ed 2,334,492 2,000 50,971 2,139 - - 2,389,602 0.23% 33
34 Pre-K SCE 3,331,876 - 19,893 - - - 3,351,769 0.32% 34
35 Pre-K Bilingual 1,000 - - - - - 1,000 0.00% 35
36 Early Education 4,461,012 1,325,500 1,854,190 305,989 - - 7,946,691 0.76% 36
37Dyslexia- General Education 1,651,671 - - - - - 1,651,671 0.16% 37
38College, Career & Military Readiness 860,558 136,315 59,113 46,466 - - 1,102,452 0.11% 38
43Dyslexia- Special Education 383,348 - - - - - 383,348 0.04% 43
91
Athletics & Related Activ. 6,101,627 846,984 1,508,669 640,171 - - 9,097,451 0.87% 91
99Undistributed (Generic) 173,388,505 40,146,585 82,290,615 10,876,796 106,665,482 186,082,694 599,450,679 57.15% 99
Total by Major Class Object 541,678,549$ 68,585,208$ 128,260,216$ 17,078,628$ 106,665,482$ 186,612,277$ 1,048,880,360$ 100.00%
Percentage of Total Object 51.64% 6.54% 12.23% 1.63% 10.17% 17.79% 100.00%
78
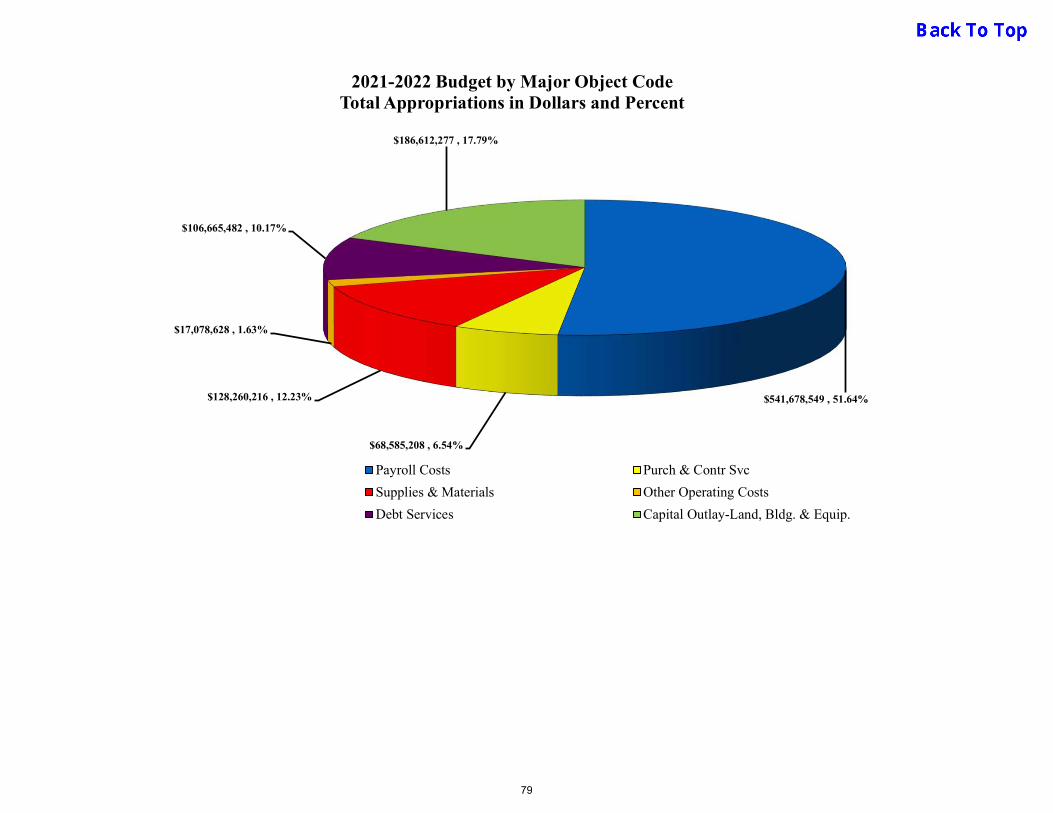
$541,678,549 , 51.64%
$68,585,208 , 6.54%
$128,260,216 , 12.23%
$17,078,628 , 1.63%
$106,665,482 , 10.17%
$186,612,277 , 17.79%
2021-2022 Budget by Major Object CodeTotal Appropriations in Dollars and Percent
Payroll Costs Purch & Contr Svc
Supplies & Materials Other Operating Costs
Debt Services Capital Outlay-Land, Bldg. & Equip.
79
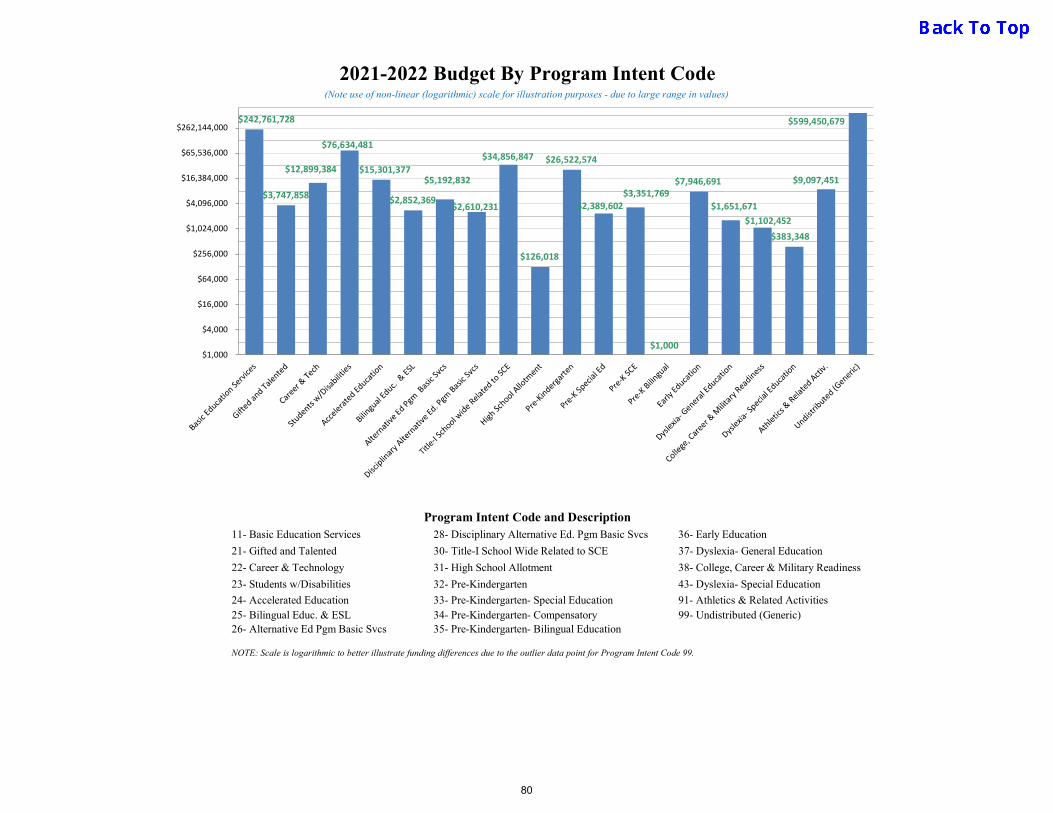
NOTE: Scale is logarithmic to better illustrate funding differences due to the outlier data point for Program Intent Code 99.
26- Alternative Ed Pgm Basic Svcs
33- Pre-Kindergarten- Special Education
35- Pre-Kindergarten- Bilingual Education34- Pre-Kindergarten- Compensatory
43- Dyslexia- Special Education
91- Athletics & Related Activities25- Bilingual Educ. & ESL 99- Undistributed (Generic)
32- Pre-Kindergarten
31- High School Allotment
28- Disciplinary Alternative Ed. Pgm Basic Svcs
22- Career & Technology
36- Early Education
24- Accelerated Education
38- College, Career & Military Readiness
21- Gifted and Talented 30- Title-I School Wide Related to SCE 37- Dyslexia- General Education
(Note use of non-linear (logarithmic) scale for illustration purposes - due to large range in values)
2021-2022 Budget By Program Intent Code
23- Students w/Disabilities
Program Intent Code and Description11- Basic Education Services
$242,761,728
$3,747,858
$12,899,384
$76,634,481
$15,301,377
$2,852,369
$5,192,832
$2,610,231
$34,856,847
$126,018
$26,522,574
$2,389,602$3,351,769
$1,000
$7,946,691
$1,651,671$1,102,452
$383,348
$9,097,451
$599,450,679
$1,000
$4,000
$16,000
$64,000
$256,000
$1,024,000
$4,096,000
$16,384,000
$65,536,000
$262,144,000
80
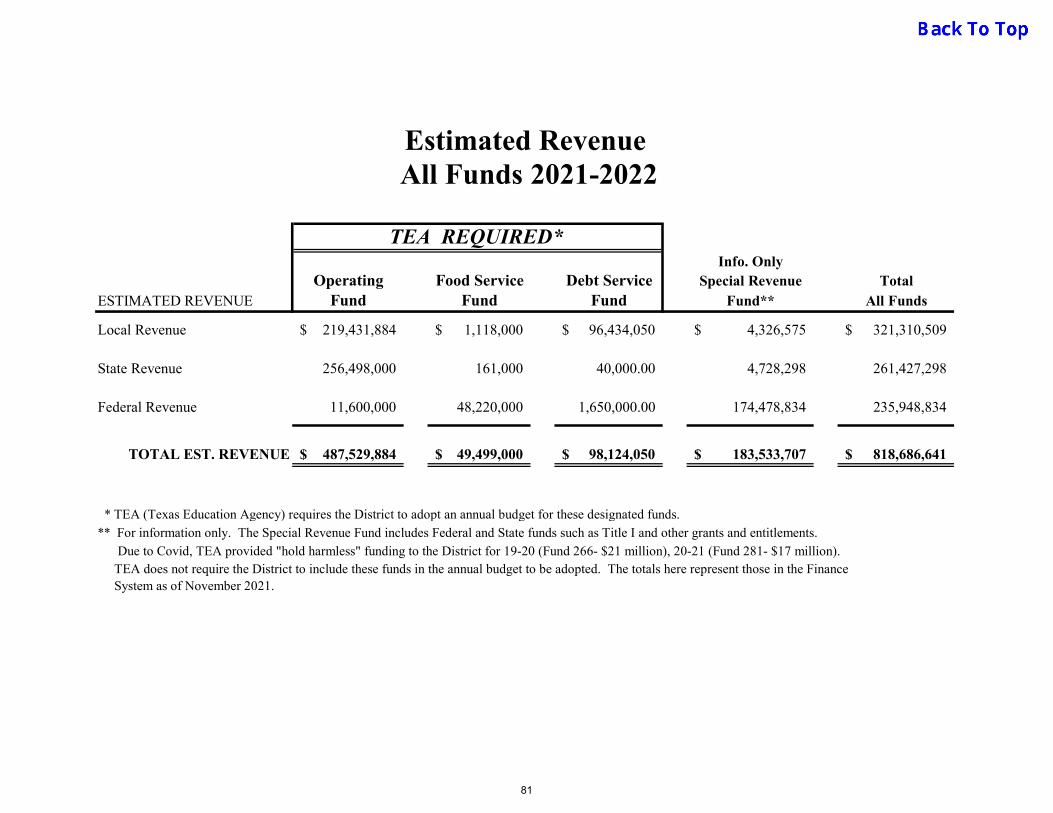
Estimated Revenue All Funds 2021-2022
TEA REQUIRED*Info. Only
Operating Food Service Debt Service Special Revenue TotalESTIMATED REVENUE Fund Fund Fund Fund** All Funds
Local Revenue 219,431,884$ 1,118,000$ 96,434,050$ 4,326,575$ 321,310,509$
State Revenue 256,498,000 161,000 40,000.00 4,728,298 261,427,298
Federal Revenue 11,600,000 48,220,000 1,650,000.00 174,478,834 235,948,834
TOTAL EST. REVENUE 487,529,884$ 49,499,000$ 98,124,050$ 183,533,707$ 818,686,641$
* TEA (Texas Education Agency) requires the District to adopt an annual budget for these designated funds.** For information only. The Special Revenue Fund includes Federal and State funds such as Title I and other grants and entitlements.
TEA does not require the District to include these funds in the annual budget to be adopted. The totals here represent those in the Finance System as of November 2021.
Due to Covid, TEA provided "hold harmless" funding to the District for 19-20 (Fund 266- $21 million), 20-21 (Fund 281- $17 million).
81

Appropriations Budget2021-2022
TEA REQUIRED*Info. Only
Operating Child Nutrition Debt Service Special Revenue TotalESTIMATED EXPENDITURES Fund Fund Fund Fund** All Funds Instruction 265,209,062$ -$ -$ 106,408,282$ 371,617,344$ Instructional Resources & Media 5,310,627 - - 1,192,262 6,502,889 Curriculum & Prof. Development 16,259,165 - - 35,569,146 51,828,311 Instructional Administration 11,907,127 - - 5,928,092 17,835,219 School Leadership 39,690,920 - - 1,381,986 41,072,906 Guidance & Counseling 16,633,286 - - 19,575,219 36,208,505 Social Work Services 2,539,446 - - 11,243,687 13,783,133 Health Services 9,718,084 - - 1,045,306 10,763,390 Student Transportation 12,281,572 - - 1,059,581 13,341,153 Food Services 157,343 46,436,877 - 423,845 47,018,065 Extracurricular 13,126,071 - - 856,564 13,982,635 General Administration 16,645,261 - - 1,860,132 18,505,393 Facilities Maintenance and Operations 54,892,195 3,064,123 - 14,539,889 72,496,207 Security & Monitoring 6,275,663 - - 2,861,321 9,136,984 Data Processing 10,279,323 - - 4,175,037 14,454,360 Community Services 4,556,018 - - 9,209,546 13,765,564 Debt Services - - 104,908,880 1,756,601 106,665,481 Facilities Acq. & Constr. 738,159 - - 187,128,649 187,866,808 Payments to Members SSA - - - 727,500 727,500 Payments to JJAEP 45,320 - - - 45,320Intergovernmental Payments 1,263,193 - - - 1,263,193
TOTAL EST. EXPENDITURES 487,527,835$ 49,501,000$ 104,908,880$ 406,942,645$ 1,048,880,360$
Total Other Uses 2,049$ -$ -$ -$ 2,049$
Total Expenditures 487,529,884$ 49,501,000$ 104,908,880$ 406,942,645$ 1,048,882,409$
* TEA (Texas Education Agency) requires the District to adopt an annual budget for these designated funds.** For information only. The Special Revenue Fund includes Federal and State funds such as Title I and other grants and entitlements.
TEA does not require the District to include these funds in the annual budget to be adopted. The totals here represent those in the Finance System as of November 2021.
Due to Covid, TEA provided "hold harmless" funding to the District for 19-20 (Fund 266- $21 million), 20-21 (Fund 281- $17 million).
82
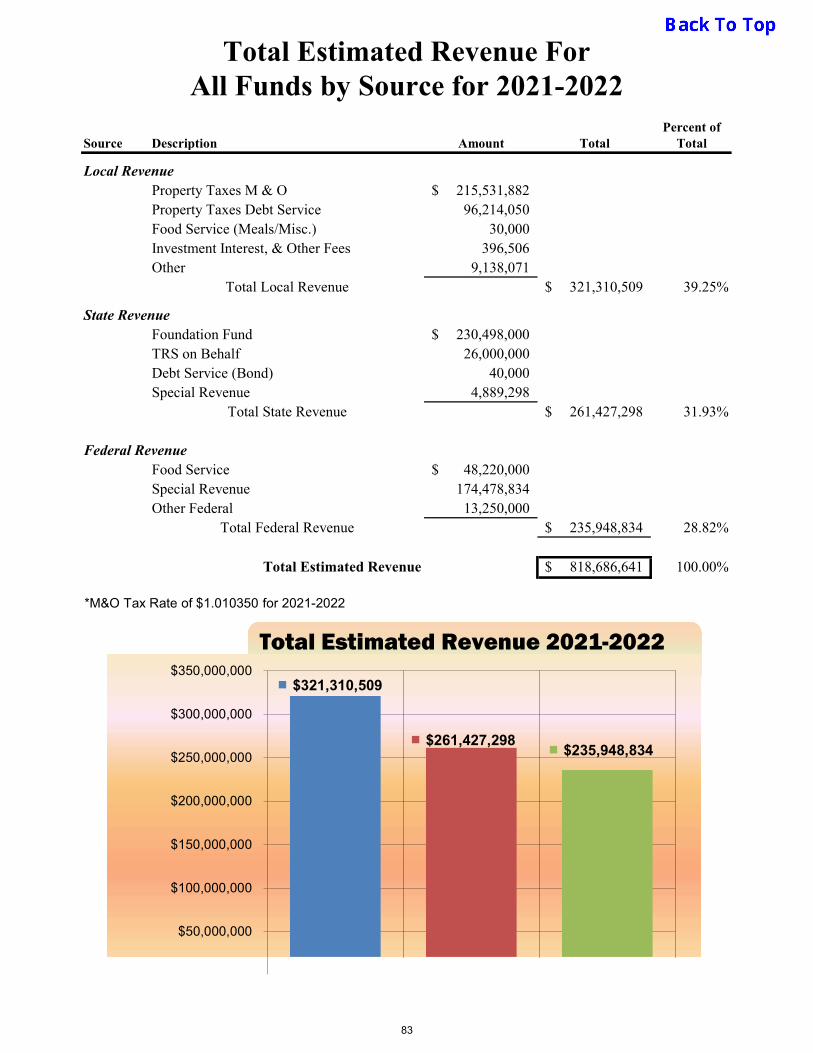
Total Estimated Revenue ForAll Funds by Source for 2021-2022
Percent ofSource Description Amount Total Total
Local RevenueProperty Taxes M & O 215,531,882$ Property Taxes Debt Service 96,214,050 Food Service (Meals/Misc.) 30,000 Investment Interest, & Other Fees 396,506 Other 9,138,071
Total Local Revenue 321,310,509$ 39.25%
State RevenueFoundation Fund 230,498,000$ TRS on Behalf 26,000,000 Debt Service (Bond) 40,000 Special Revenue 4,889,298
Total State Revenue 261,427,298$ 31.93%
Federal RevenueFood Service 48,220,000$ Special Revenue 174,478,834 Other Federal 13,250,000
Total Federal Revenue 235,948,834$ 28.82%
Total Estimated Revenue 818,686,641$ 100.00%
$321,310,509
$261,427,298$235,948,834
$50,000,000
$100,000,000
$150,000,000
$200,000,000
$250,000,000
$300,000,000
$350,000,000
Total Estimated Revenue 2021-2022
*M&O Tax Rate of $1.010350 for 2021-2022
83
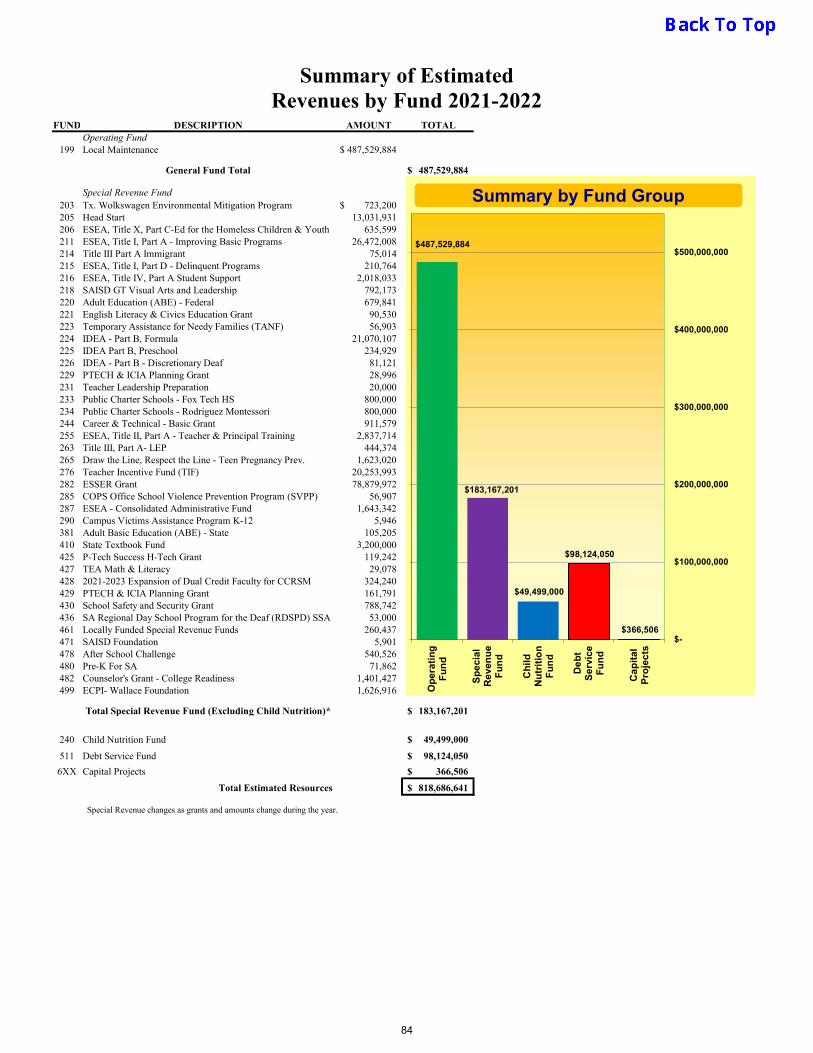
FUND DESCRIPTION AMOUNT TOTALOperating Fund
199 Local Maintenance 487,529,884$
General Fund Total 487,529,884$
Special Revenue Fund203 Tx. Wolkswagen Environmental Mitigation Program 723,200$ 205 Head Start 13,031,931 206 ESEA, Title X, Part C-Ed for the Homeless Children & Youth 635,599 211 ESEA, Title I, Part A - Improving Basic Programs 26,472,008 214 Title III Part A Immigrant 75,014 215 ESEA, Title I, Part D - Delinquent Programs 210,764 216 ESEA, Title IV, Part A Student Support 2,018,033 218 SAISD GT Visual Arts and Leadership 792,173 220 Adult Education (ABE) - Federal 679,841 221 English Literacy & Civics Education Grant 90,530 223 Temporary Assistance for Needy Families (TANF) 56,903 224 IDEA - Part B, Formula 21,070,107 225 IDEA Part B, Preschool 234,929 226 IDEA - Part B - Discretionary Deaf 81,121 229 PTECH & ICIA Planning Grant 28,996 231 Teacher Leadership Preparation 20,000 233 Public Charter Schools - Fox Tech HS 800,000 234 Public Charter Schools - Rodriguez Montessori 800,000 244 Career & Technical - Basic Grant 911,579 255 ESEA, Title II, Part A - Teacher & Principal Training 2,837,714 263 Title III, Part A- LEP 444,374 265 Draw the Line, Respect the Line - Teen Pregnancy Prev. 1,623,020 276 Teacher Incentive Fund (TIF) 20,253,993 282 ESSER Grant 78,879,972 285 COPS Office School Violence Prevention Program (SVPP) 56,907 287 ESEA - Consolidated Administrative Fund 1,643,342 290 Campus Victims Assistance Program K-12 5,946 381 Adult Basic Education (ABE) - State 105,205 410 State Textbook Fund 3,200,000 425 P-Tech Success H-Tech Grant 119,242 427 TEA Math & Literacy 29,078 428 2021-2023 Expansion of Dual Credit Faculty for CCRSM 324,240 429 PTECH & ICIA Planning Grant 161,791 430 School Safety and Security Grant 788,742 436 SA Regional Day School Program for the Deaf (RDSPD) SSA 53,000 461 Locally Funded Special Revenue Funds 260,437 471 SAISD Foundation 5,901 478 After School Challenge 540,526 480 Pre-K For SA 71,862 482 Counselor's Grant - College Readiness 1,401,427 499 ECPI- Wallace Foundation 1,626,916
Total Special Revenue Fund (Excluding Child Nutrition)* 183,167,201$
240 Child Nutrition Fund 49,499,000$
511 Debt Service Fund 98,124,050$
6XX Capital Projects 366,506$
Total Estimated Resources 818,686,641$
Special Revenue changes as grants and amounts change during the year.
Summary of EstimatedRevenues by Fund 2021-2022
$487,529,884
$183,167,201
$49,499,000
$98,124,050
$366,506 $-
$100,000,000
$200,000,000
$300,000,000
$400,000,000
$500,000,000
Op
era
tin
gF
un
d
Sp
eci
alR
eve
nu
eF
un
d
Ch
ild
Nu
trit
ion
Fu
nd
De
bt
Se
rvic
eF
un
d
Ca
pit
al
Pro
jec
ts
Summary by Fund Group
84

Total EstimatedExpenditures 2021-2022
The estimated SAISD expenditures for all funds are as follows:
BUDGET PERCENTEXPENDITURE TYPE 2021-22 OF TOTAL
Payroll Costs 541,678,549 51.64%
Contracted Services 68,585,208 6.54%
Supplies and Materials 128,260,216 12.23%
Other Operating Costs 17,078,628 1.63%
Debt Service 106,665,482 10.17%
Capital Outlay 186,612,278 17.79%
TOTAL BUDGET 1,048,880,360$ 100.00%
Total Estimated Expenditures
-
100,000,000
200,000,000
300,000,000
400,000,000
500,000,000
600,000,000
541
,67
8,54
9
68,
585
,208
128
,26
0,21
6
17,
078
,628
106
,66
5,48
2
186
,61
2,27
8
85
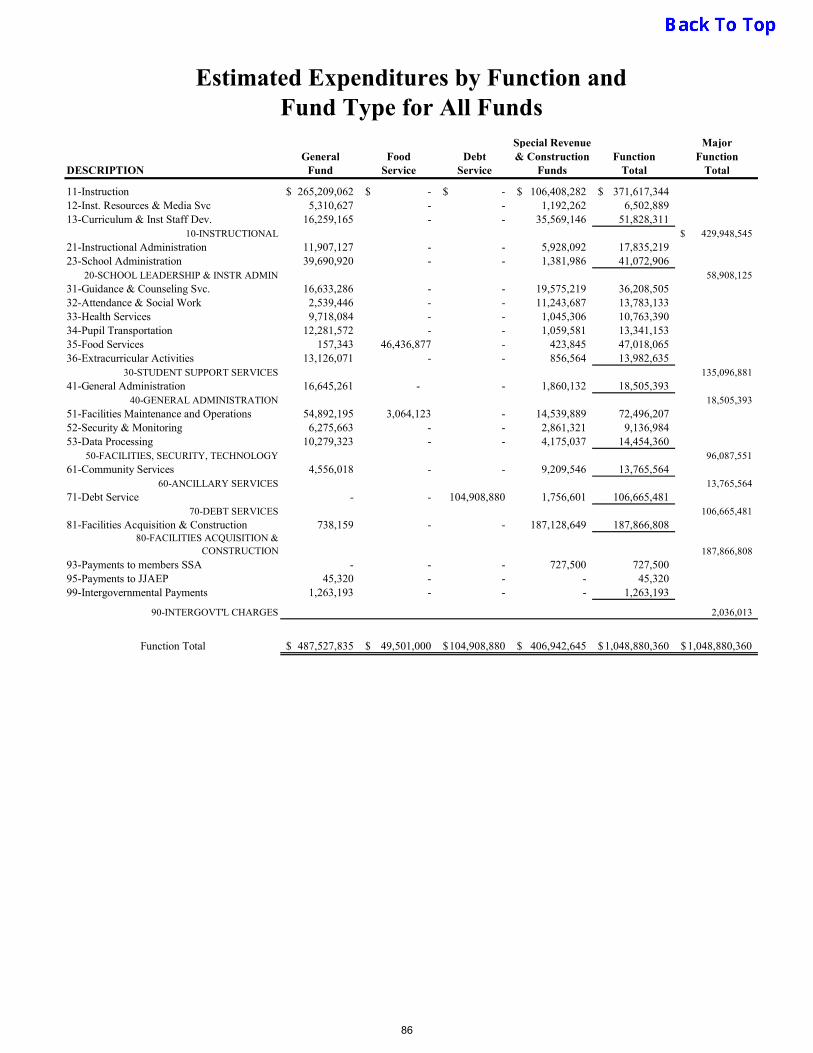
Special Revenue MajorGeneral Food Debt & Construction Function Function
DESCRIPTION Fund Service Service Funds Total Total
11-Instruction 265,209,062$ -$ -$ 106,408,282$ 371,617,344$ 12-Inst. Resources & Media Svc 5,310,627 - - 1,192,262 6,502,889 13-Curriculum & Inst Staff Dev. 16,259,165 - - 35,569,146 51,828,311
10-INSTRUCTIONAL 429,948,545$ 21-Instructional Administration 11,907,127 - - 5,928,092 17,835,219 23-School Administration 39,690,920 - - 1,381,986 41,072,906
20-SCHOOL LEADERSHIP & INSTR ADMIN 58,908,125 31-Guidance & Counseling Svc. 16,633,286 - - 19,575,219 36,208,505 32-Attendance & Social Work 2,539,446 - - 11,243,687 13,783,133 33-Health Services 9,718,084 - - 1,045,306 10,763,390 34-Pupil Transportation 12,281,572 - - 1,059,581 13,341,153 35-Food Services 157,343 46,436,877 - 423,845 47,018,065 36-Extracurricular Activities 13,126,071 - - 856,564 13,982,635
30-STUDENT SUPPORT SERVICES 135,096,881 41-General Administration 16,645,261 - - 1,860,132 18,505,393
40-GENERAL ADMINISTRATION 18,505,393 51-Facilities Maintenance and Operations 54,892,195 3,064,123 - 14,539,889 72,496,207 52-Security & Monitoring 6,275,663 - - 2,861,321 9,136,984 53-Data Processing 10,279,323 - - 4,175,037 14,454,360
50-FACILITIES, SECURITY, TECHNOLOGY 96,087,551 61-Community Services 4,556,018 - - 9,209,546 13,765,564
60-ANCILLARY SERVICES 13,765,564 71-Debt Service - - 104,908,880 1,756,601 106,665,481
70-DEBT SERVICES 106,665,481 81-Facilities Acquisition & Construction 738,159 - - 187,128,649 187,866,808
80-FACILITIES ACQUISITION & CONSTRUCTION 187,866,808
93-Payments to members SSA - - - 727,500 727,500 95-Payments to JJAEP 45,320 - - - 45,320 99-Intergovernmental Payments 1,263,193 - - - 1,263,193
90-INTERGOVT'L CHARGES 2,036,013
Function Total 487,527,835$ 49,501,000$ 104,908,880$ 406,942,645$ 1,048,880,360$ 1,048,880,360$
Estimated Expenditures by Function andFund Type for All Funds
86

Estimated Expenditures by Function - All Funds
$-
$50,000,000
$100,000,000
$150,000,000
$200,000,000
$250,000,000
$300,000,000
$350,000,000
87
This fund group accounts for all financial resources of the District, except for those required to beaccounted for in another fund type. The major sources of revenue include local property taxes;State of Texas Foundation School Program revenues, interest earnings, athletic event revenue,tuition, and revenue from the rental of district property. Expenditures include payroll costs,contracted services, supplies, capital outlay, and other costs necessary for the daily operations of thedistrict.
Additionally, our District breaks down the Operating Fund into locally defined sub-funds which isat the option of the district. This includes the Transportation Fund, State Bilingual Fund, StateCompensatory Fund, Gifted/Talented Fund, Career & Technology Fund, Special Education Fund,Magnet Schools Fund and Local Maintenance Fund. For additional information regarding thevarious sub-funds, refer to the Glossary of Funds.
GENERAL FUND
88
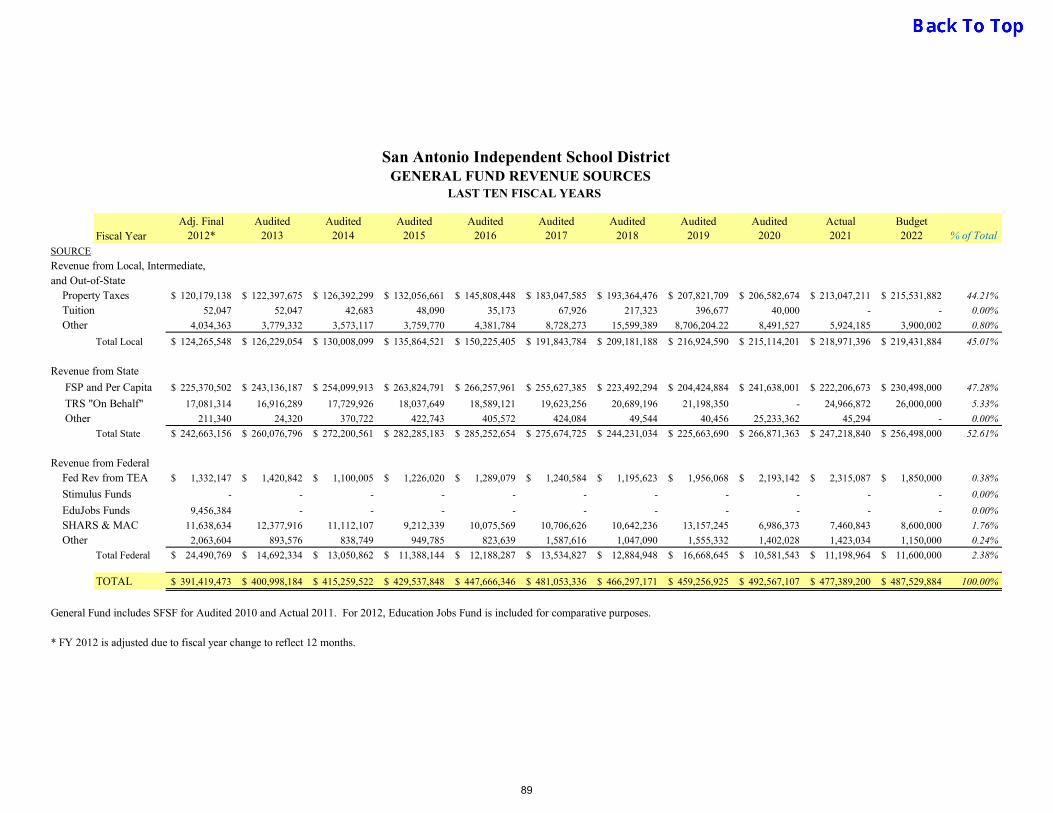
San Antonio Independent School DistrictGENERAL FUND REVENUE SOURCES
LAST TEN FISCAL YEARS
Fiscal YearAdj. Final
2012*Audited
2013Audited
2014Audited
2015Audited
2016Audited
2017Audited
2018Audited
2019Audited
2020Actual2021
Budget2022 % of Total
SOURCE
Revenue from Local, Intermediate, and Out-of-State Property Taxes 120,179,138$ 122,397,675$ 126,392,299$ 132,056,661$ 145,808,448$ 183,047,585$ 193,364,476$ 207,821,709$ 206,582,674$ 213,047,211$ 215,531,882$ 44.21%
Tuition 52,047 52,047 42,683 48,090 35,173 67,926 217,323 396,677 40,000 - - 0.00%
Other 4,034,363 3,779,332 3,573,117 3,759,770 4,381,784 8,728,273 15,599,389 8,706,204.22 8,491,527 5,924,185 3,900,002 0.80%
Total Local 124,265,548$ 126,229,054$ 130,008,099$ 135,864,521$ 150,225,405$ 191,843,784$ 209,181,188$ 216,924,590$ 215,114,201$ 218,971,396$ 219,431,884$ 45.01%
Revenue from State
FSP and Per Capita 225,370,502$ 243,136,187$ 254,099,913$ 263,824,791$ 266,257,961$ 255,627,385$ 223,492,294$ 204,424,884$ 241,638,001$ 222,206,673$ 230,498,000$ 47.28%
TRS "On Behalf" 17,081,314 16,916,289 17,729,926 18,037,649 18,589,121 19,623,256 20,689,196 21,198,350 - 24,966,872 26,000,000 5.33%
Other 211,340 24,320 370,722 422,743 405,572 424,084 49,544 40,456 25,233,362 45,294 - 0.00%
Total State 242,663,156$ 260,076,796$ 272,200,561$ 282,285,183$ 285,252,654$ 275,674,725$ 244,231,034$ 225,663,690$ 266,871,363$ 247,218,840$ 256,498,000$ 52.61%
Revenue from Federal Fed Rev from TEA 1,332,147$ 1,420,842$ 1,100,005$ 1,226,020$ 1,289,079$ 1,240,584$ 1,195,623$ 1,956,068$ 2,193,142$ 2,315,087$ 1,850,000$ 0.38%
- - - - - - - - - - - 0.00%
9,456,384 - - - - - - - - - - 0.00%
SHARS & MAC 11,638,634 12,377,916 11,112,107 9,212,339 10,075,569 10,706,626 10,642,236 13,157,245 6,986,373 7,460,843 8,600,000 1.76%
Other 2,063,604 893,576 838,749 949,785 823,639 1,587,616 1,047,090 1,555,332 1,402,028 1,423,034 1,150,000 0.24%
Total Federal 24,490,769$ 14,692,334$ 13,050,862$ 11,388,144$ 12,188,287$ 13,534,827$ 12,884,948$ 16,668,645$ 10,581,543$ 11,198,964$ 11,600,000$ 2.38%
TOTAL 391,419,473$ 400,998,184$ 415,259,522$ 429,537,848$ 447,666,346$ 481,053,336$ 466,297,171$ 459,256,925$ 492,567,107$ 477,389,200$ 487,529,884$ 100.00%
General Fund includes SFSF for Audited 2010 and Actual 2011. For 2012, Education Jobs Fund is included for comparative purposes.
Stimulus Funds
EduJobs Funds
* FY 2012 is adjusted due to fiscal year change to reflect 12 months.
89

2012 2013 2014 2015 2016 2017 2018 2019 2020 2021 2022
Federal 24,490,769 14,692,334 13,050,862 11,388,144 12,188,287 13,534,827 12,884,948 16,668,645 10,581,543 11,198,964 11,600,000
State 242,663,156 260,076,796 272,200,561 282,285,183 285,252,654 275,674,725 244,231,034 225,663,690 266,871,363 247,218,840 256,498,000
Local 124,265,548 126,229,054 130,008,099 135,864,521 150,225,405 191,843,784 209,181,188 216,924,590 215,114,201 $218,971,39 $219,431,88
$0
$50,000,000
$100,000,000
$150,000,000
$200,000,000
$250,000,000
$300,000,000
$350,000,000
$400,000,000
$450,000,000
$500,000,000
GENERAL FUND REVENUE TRENDS LAST TEN FISCAL YEARS & CURRENT YEAR BUDGET
90
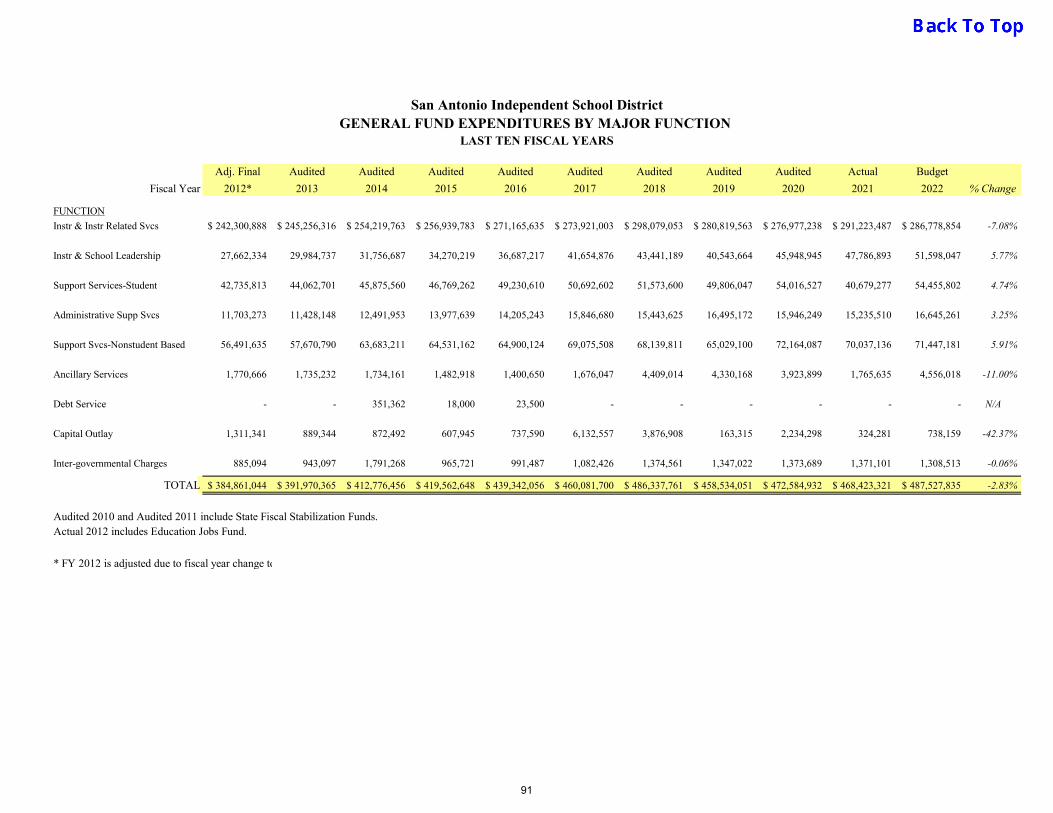
Adj. Final Audited Audited Audited Audited Audited Audited Audited Audited Actual Budget
Fiscal Year 2012* 2013 2014 2015 2016 2017 2018 2019 2020 2021 2022
FUNCTION
Instr & Instr Related Svcs 242,300,888$ 245,256,316$ 254,219,763$ 256,939,783$ 271,165,635$ 273,921,003$ 298,079,053$ 280,819,563$ 276,977,238$ 291,223,487$ 286,778,854$ -7.08%
Instr & School Leadership 27,662,334 29,984,737 31,756,687 34,270,219 36,687,217 41,654,876 43,441,189 40,543,664 45,948,945 47,786,893 51,598,047 5.77%
Support Services-Student 42,735,813 44,062,701 45,875,560 46,769,262 49,230,610 50,692,602 51,573,600 49,806,047 54,016,527 40,679,277 54,455,802 4.74%
Administrative Supp Svcs 11,703,273 11,428,148 12,491,953 13,977,639 14,205,243 15,846,680 15,443,625 16,495,172 15,946,249 15,235,510 16,645,261 3.25%
Support Svcs-Nonstudent Based 56,491,635 57,670,790 63,683,211 64,531,162 64,900,124 69,075,508 68,139,811 65,029,100 72,164,087 70,037,136 71,447,181 5.91%
Ancillary Services 1,770,666 1,735,232 1,734,161 1,482,918 1,400,650 1,676,047 4,409,014 4,330,168 3,923,899 1,765,635 4,556,018 -11.00%
Debt Service - - 351,362 18,000 23,500 - - - - - - N/A
Capital Outlay 1,311,341 889,344 872,492 607,945 737,590 6,132,557 3,876,908 163,315 2,234,298 324,281 738,159 -42.37%
Inter-governmental Charges 885,094 943,097 1,791,268 965,721 991,487 1,082,426 1,374,561 1,347,022 1,373,689 1,371,101 1,308,513 -0.06%
TOTAL 384,861,044$ 391,970,365$ 412,776,456$ 419,562,648$ 439,342,056$ 460,081,700$ 486,337,761$ 458,534,051$ 472,584,932$ 468,423,321$ 487,527,835$ -2.83%
Audited 2010 and Audited 2011 include State Fiscal Stabilization Funds.Actual 2012 includes Education Jobs Fund.
% Change
* FY 2012 is adjusted due to fiscal year change to reflect 12 months.
San Antonio Independent School DistrictGENERAL FUND EXPENDITURES BY MAJOR FUNCTION
LAST TEN FISCAL YEARS
91

Fiscal YearAdj. Final
2012*Audited
2013Audited
2014Audited
2015Audited
2016Audited
2017Audited
2018Audited
2019Audited
2020Actual 2021
Budget 2022 % Change
Average Daily Attendance 48,793 48,770 48,468 48,294 47,407 46,437 44,376 42,747 42,201 41,554 41,650 -1.28%
FunctionInstr & Instr Related Svcs 4,966$ 5,029$ 5,245$ 5,320$ 5,720$ 5,899$ 6,717$ 6,569$ 6,563$ 6,901$ 6,796$ -0.09%
Instr & School Leadership 567 615 655 710 774 897 979 948 1,089 1,132 1,223 14.80%
Support Services-Student 876 903 947 968 1,038 1,092 1,162 1,165 1,280 964 1,290 9.86%
Administrative Supp Svcs 240 234 258 289 300 341 348 386 378 361 394 -2.08%
Support Svcs-Nonstudent Based 1,158 1,183 1,314 1,336 1,369 1,488 1,536 1,521 1,710 1,660 1,693 12.41%
Ancillary Services 36 36 36 31 30 36 99 101 93 42 108 -8.21%
Debt Service - - 7 0 0 - - - - - - N/A
Capital Outlay 27 18 18 13 16 132 87 4 53 8 17 1285.79%- -
Inter-governmental Charges 18 19 37 20 21 23 31 32 33 32 31 3.30%
TOTAL 7,888$ 8,037$ 8,516$ 8,688$ 9,267$ 9,908$ 10,959$ 10,727$ 11,198$ 11,100$ 11,553$ 2.18%
Audited 2010 and Audited 2011 include State Fiscal Stabilization Funds.
Actual 2012 includes Education Jobs Fund.
* FY 2012 is adjusted due to fiscal year change to reflect 12 months.
GENERAL FUND EXPENDITURES BY MAJOR FUNCTION PER AVERAGE DAILY ATTENDANCESan Antonio Independent School District
LAST TEN FISCAL YEARS
92
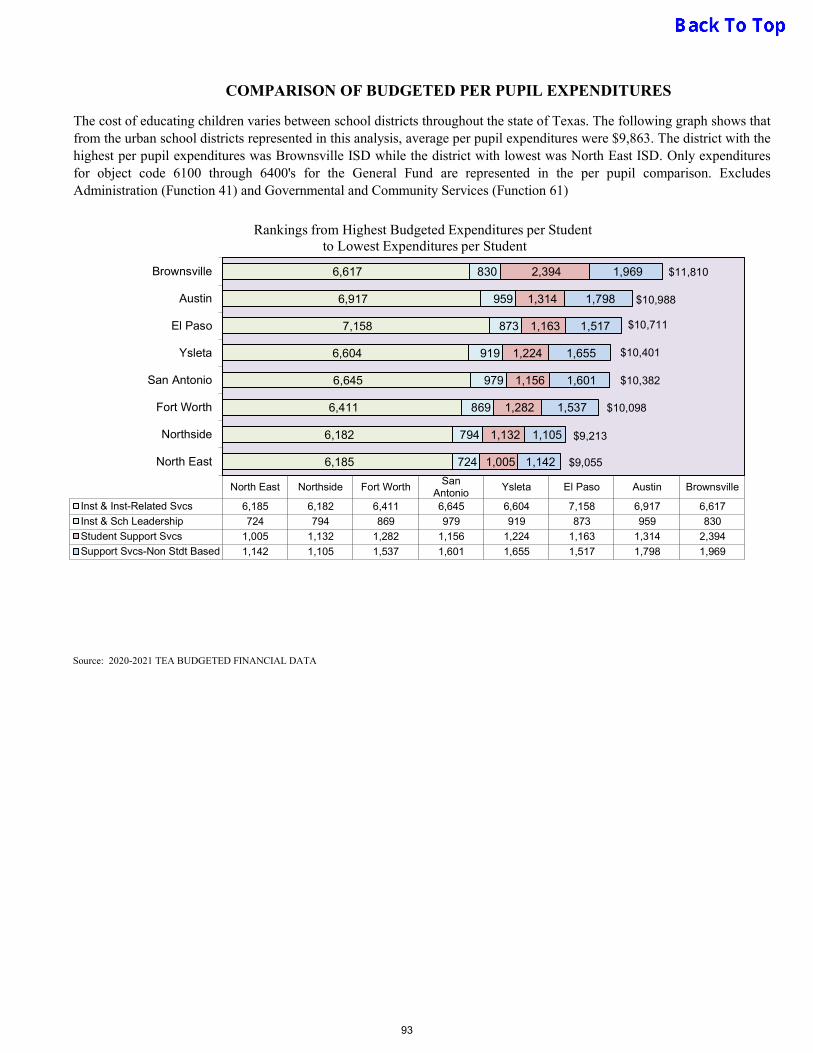
Source: 2020-2021 TEA BUDGETED FINANCIAL DATA
The cost of educating children varies between school districts throughout the state of Texas. The following graph shows thatfrom the urban school districts represented in this analysis, average per pupil expenditures were $9,863. The district with thehighest per pupil expenditures was Brownsville ISD while the district with lowest was North East ISD. Only expendituresfor object code 6100 through 6400's for the General Fund are represented in the per pupil comparison. ExcludesAdministration (Function 41) and Governmental and Community Services (Function 61)
COMPARISON OF BUDGETED PER PUPIL EXPENDITURES
6,185
6,182
6,411
6,645
6,604
7,158
6,917
6,617
724
794
869
979
919
873
959
830
1,005
1,132
1,282
1,156
1,224
1,163
1,314
2,394
1,142
1,105
1,537
1,601
1,655
1,517
1,798
1,969
North East
Northside
Fort Worth
San Antonio
Ysleta
El Paso
Austin
Brownsville
North East Northside Fort WorthSan
AntonioYsleta El Paso Austin Brownsville
Inst & Inst-Related Svcs 6,185 6,182 6,411 6,645 6,604 7,158 6,917 6,617
Inst & Sch Leadership 724 794 869 979 919 873 959 830
Student Support Svcs 1,005 1,132 1,282 1,156 1,224 1,163 1,314 2,394
Support Svcs-Non Stdt Based 1,142 1,105 1,537 1,601 1,655 1,517 1,798 1,969
Rankings from Highest Budgeted Expenditures per Studentto Lowest Expenditures per Student
$11,810
$10,401
$10,098
$10,988
$9,213
$10,711
$9,055
$10,382
93
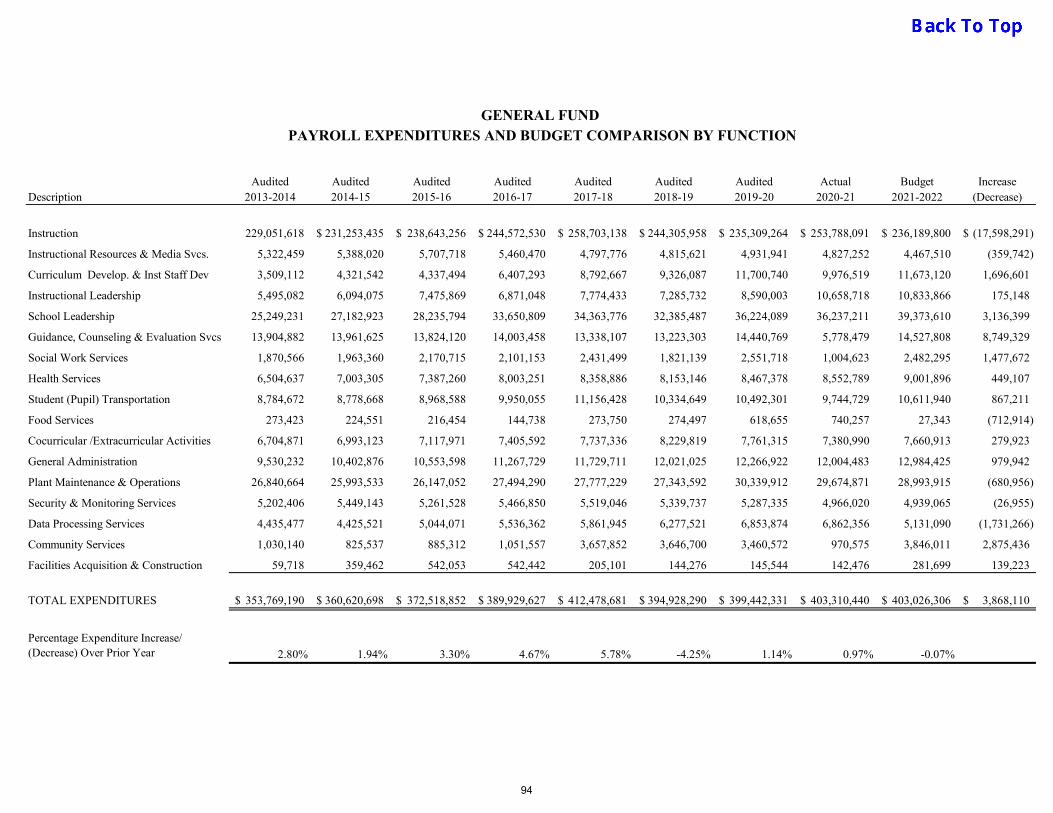
GENERAL FUND PAYROLL EXPENDITURES AND BUDGET COMPARISON BY FUNCTION
Audited Audited Audited Audited Audited Audited Audited Actual Budget IncreaseDescription 2013-2014 2014-15 2015-16 2016-17 2017-18 2018-19 2019-20 2020-21 2021-2022 (Decrease)
Instruction 229,051,618 231,253,435$ 238,643,256$ 244,572,530$ 258,703,138$ 244,305,958$ 235,309,264$ 253,788,091$ 236,189,800$ (17,598,291)$
Instructional Resources & Media Svcs. 5,322,459 5,388,020 5,707,718 5,460,470 4,797,776 4,815,621 4,931,941 4,827,252 4,467,510 (359,742)
Curriculum Develop. & Inst Staff Dev 3,509,112 4,321,542 4,337,494 6,407,293 8,792,667 9,326,087 11,700,740 9,976,519 11,673,120 1,696,601
Instructional Leadership 5,495,082 6,094,075 7,475,869 6,871,048 7,774,433 7,285,732 8,590,003 10,658,718 10,833,866 175,148
School Leadership 25,249,231 27,182,923 28,235,794 33,650,809 34,363,776 32,385,487 36,224,089 36,237,211 39,373,610 3,136,399
Guidance, Counseling & Evaluation Svcs 13,904,882 13,961,625 13,824,120 14,003,458 13,338,107 13,223,303 14,440,769 5,778,479 14,527,808 8,749,329
Social Work Services 1,870,566 1,963,360 2,170,715 2,101,153 2,431,499 1,821,139 2,551,718 1,004,623 2,482,295 1,477,672
Health Services 6,504,637 7,003,305 7,387,260 8,003,251 8,358,886 8,153,146 8,467,378 8,552,789 9,001,896 449,107
Student (Pupil) Transportation 8,784,672 8,778,668 8,968,588 9,950,055 11,156,428 10,334,649 10,492,301 9,744,729 10,611,940 867,211
Food Services 273,423 224,551 216,454 144,738 273,750 274,497 618,655 740,257 27,343 (712,914)
Cocurricular /Extracurricular Activities 6,704,871 6,993,123 7,117,971 7,405,592 7,737,336 8,229,819 7,761,315 7,380,990 7,660,913 279,923
General Administration 9,530,232 10,402,876 10,553,598 11,267,729 11,729,711 12,021,025 12,266,922 12,004,483 12,984,425 979,942
Plant Maintenance & Operations 26,840,664 25,993,533 26,147,052 27,494,290 27,777,229 27,343,592 30,339,912 29,674,871 28,993,915 (680,956)
Security & Monitoring Services 5,202,406 5,449,143 5,261,528 5,466,850 5,519,046 5,339,737 5,287,335 4,966,020 4,939,065 (26,955)
Data Processing Services 4,435,477 4,425,521 5,044,071 5,536,362 5,861,945 6,277,521 6,853,874 6,862,356 5,131,090 (1,731,266)
Community Services 1,030,140 825,537 885,312 1,051,557 3,657,852 3,646,700 3,460,572 970,575 3,846,011 2,875,436
Facilities Acquisition & Construction 59,718 359,462 542,053 542,442 205,101 144,276 145,544 142,476 281,699 139,223
TOTAL EXPENDITURES 353,769,190$ 360,620,698$ 372,518,852$ 389,929,627$ 412,478,681$ 394,928,290$ 399,442,331$ 403,310,440$ 403,026,306$ 3,868,110$
Percentage Expenditure Increase/ (Decrease) Over Prior Year 2.80% 1.94% 3.30% 4.67% 5.78% -4.25% 1.14% 0.97% -0.07%
94
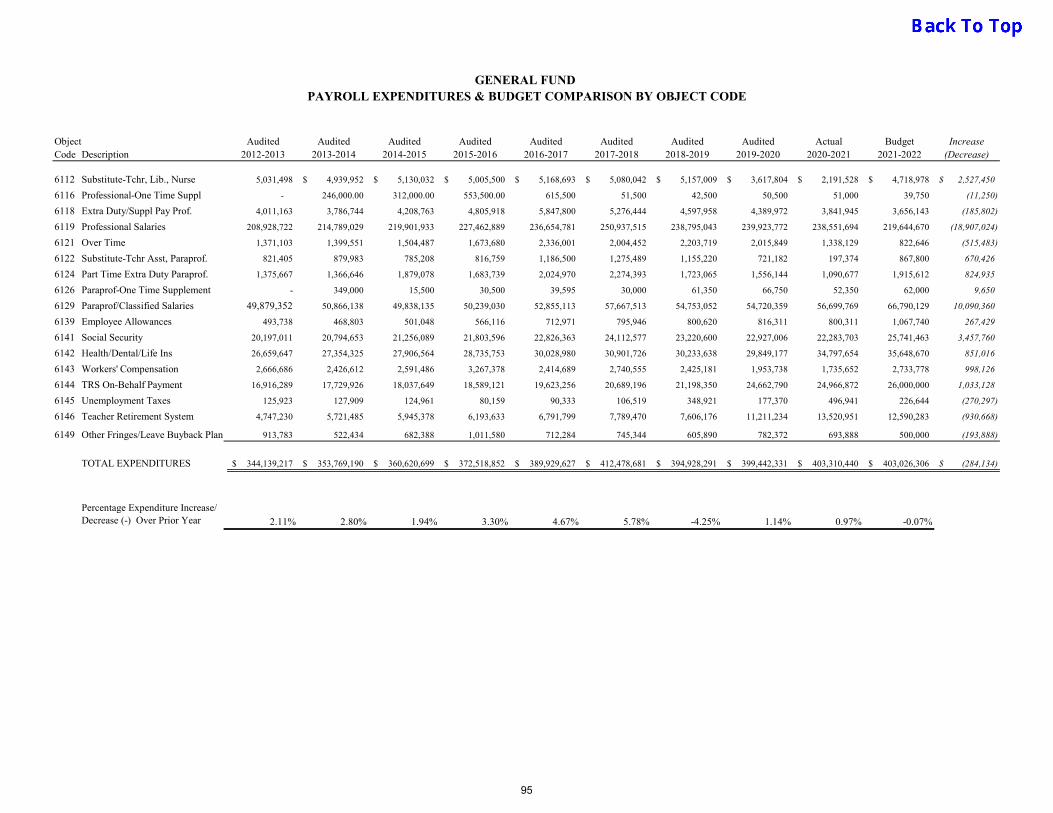
Object Audited Audited Audited Audited Audited Audited Audited Audited Actual Budget IncreaseCode Description 2012-2013 2013-2014 2014-2015 2015-2016 2016-2017 2017-2018 2018-2019 2019-2020 2020-2021 2021-2022 (Decrease)
6112 Substitute-Tchr, Lib., Nurse 5,031,498 4,939,952$ 5,130,032$ 5,005,500$ 5,168,693$ 5,080,042$ 5,157,009$ 3,617,804$ 2,191,528$ 4,718,978$ 2,527,450$
6116 Professional-One Time Suppl - 246,000.00 312,000.00 553,500.00 615,500 51,500 42,500 50,500 51,000 39,750 (11,250)
6118 Extra Duty/Suppl Pay Prof. 4,011,163 3,786,744 4,208,763 4,805,918 5,847,800 5,276,444 4,597,958 4,389,972 3,841,945 3,656,143 (185,802)
6119 Professional Salaries 208,928,722 214,789,029 219,901,933 227,462,889 236,654,781 250,937,515 238,795,043 239,923,772 238,551,694 219,644,670 (18,907,024)
6121 Over Time 1,371,103 1,399,551 1,504,487 1,673,680 2,336,001 2,004,452 2,203,719 2,015,849 1,338,129 822,646 (515,483)
6122 Substitute-Tchr Asst, Paraprof. 821,405 879,983 785,208 816,759 1,186,500 1,275,489 1,155,220 721,182 197,374 867,800 670,426
6124 Part Time Extra Duty Paraprof. 1,375,667 1,366,646 1,879,078 1,683,739 2,024,970 2,274,393 1,723,065 1,556,144 1,090,677 1,915,612 824,935
6126 Paraprof-One Time Supplement - 349,000 15,500 30,500 39,595 30,000 61,350 66,750 52,350 62,000 9,650
6129 Paraprof/Classified Salaries 49,879,352 50,866,138 49,838,135 50,239,030 52,855,113 57,667,513 54,753,052 54,720,359 56,699,769 66,790,129 10,090,360
6139 Employee Allowances 493,738 468,803 501,048 566,116 712,971 795,946 800,620 816,311 800,311 1,067,740 267,429
6141 Social Security 20,197,011 20,794,653 21,256,089 21,803,596 22,826,363 24,112,577 23,220,600 22,927,006 22,283,703 25,741,463 3,457,760
6142 Health/Dental/Life Ins 26,659,647 27,354,325 27,906,564 28,735,753 30,028,980 30,901,726 30,233,638 29,849,177 34,797,654 35,648,670 851,016
6143 Workers' Compensation 2,666,686 2,426,612 2,591,486 3,267,378 2,414,689 2,740,555 2,425,181 1,953,738 1,735,652 2,733,778 998,126
6144 TRS On-Behalf Payment 16,916,289 17,729,926 18,037,649 18,589,121 19,623,256 20,689,196 21,198,350 24,662,790 24,966,872 26,000,000 1,033,128
6145 Unemployment Taxes 125,923 127,909 124,961 80,159 90,333 106,519 348,921 177,370 496,941 226,644 (270,297)
6146 Teacher Retirement System 4,747,230 5,721,485 5,945,378 6,193,633 6,791,799 7,789,470 7,606,176 11,211,234 13,520,951 12,590,283 (930,668)
6149 Other Fringes/Leave Buyback Plan 913,783 522,434 682,388 1,011,580 712,284 745,344 605,890 782,372 693,888 500,000 (193,888)
TOTAL EXPENDITURES 344,139,217$ 353,769,190$ 360,620,699$ 372,518,852$ 389,929,627$ 412,478,681$ 394,928,291$ 399,442,331$ 403,310,440$ 403,026,306$ (284,134)$
Percentage Expenditure Increase/ Decrease (-) Over Prior Year 2.11% 2.80% 1.94% 3.30% 4.67% 5.78% -4.25% 1.14% 0.97% -0.07%
GENERAL FUND PAYROLL EXPENDITURES & BUDGET COMPARISON BY OBJECT CODE
95

2016-17 2017-18 2018-19 2019-20 2020-21 2021-2022AUDITED AUDITED AUDITED AUDITED ACTUAL BUDGET
REVENUES
5700 Local Sources 191,843,784$ 209,181,188$ 216,924,590$ 215,114,201$ 218,971,396$ 219,431,884$
5800 State Sources 275,674,725 244,231,034 225,663,690 266,871,363 247,218,840 256,498,000
5900 Federal Sources 13,534,827 12,884,948 16,668,645 10,581,543 11,198,964 11,600,000
Total Revenues 481,053,336$ 466,297,171$ 459,256,925$ 492,567,107$ 477,389,200$ 487,529,884$
EXPENDITURES BY FUNCTION
11 Instruction 258,285,364$ 278,760,212$ 263,067,287$ 256,497,460$ 273,832,022$ 265,209,062$
12 Instructional Resources & Media Svcs. 6,329,734 5,779,422 5,721,667 5,622,843 5,508,331 5,310,627
13 Curriculum Develop. & Inst Staff Dev 9,305,904 13,539,419 12,030,609 14,856,935 11,883,134 16,259,165
21 Instructional Leadership 7,609,255 8,559,018 7,834,435 9,221,735 11,067,775 11,907,127
23 School Leadership 34,045,622 34,882,172 32,709,229 36,727,210 36,719,118 39,690,920
31 Guidance, Counseling & Evaluation Svcs 15,979,612 15,306,861 15,021,647 16,212,388 6,961,117 16,633,286
32 Social Work Services 3,812,609 3,205,855 2,714,378 3,663,459 1,064,206 2,539,446
33 Health Services 8,510,298 9,083,458 8,694,684 9,031,298 9,113,676 9,718,084
34 Student ( Pupil) Transportation 10,746,156 12,133,898 11,100,401 12,140,114 11,652,234 12,281,572
35 Food Services 144,738 273,750 274,497 631,544 740,469 157,343
36 Cocurricular /Extracurricular Activities 11,499,189 11,569,779 12,000,441 12,337,724 11,147,575 13,126,071
41 General Administration 15,846,680 15,443,625 16,495,172 15,946,249 15,235,510 16,645,261
51 Plant Maintenance & Operations 52,094,107 52,401,112 48,981,858 54,745,325 53,512,647 54,892,195
52 Security & Monitoring Services 5,936,753 6,078,397 6,579,074 6,720,089 5,750,106 6,275,663
53 Data Processing Services 11,044,647 9,660,302 9,468,168 10,698,673 10,774,383 10,279,323
61 Community Services 1,676,047 4,409,014 4,330,168 3,923,899 1,765,635 4,556,018
71 Debt Services - - - - - -
81 Facilities Acquisition & Construction 6,132,557 3,876,908 163,315 2,234,298 324,281 738,159
93 Payments to Members SSA - - - - - -
95 Payments to JJAEP 8,151 93,737 46,597 9,238 - 45,320
99 Intergovernmental Payments 1,074,275 1,280,824 1,300,425 1,364,451 1,371,101 1,263,193
Total Expenditures 460,081,700$ 486,337,761$ 458,534,051$ 472,584,932$ 468,423,321$ 487,527,835$
20,971,636$ (20,040,590)$ 722,874$ 19,982,175$ 8,965,879$ 2,049$
OTHER FINANCING RESOURCES (USES)
7900 Other Resources 3,994,896$ 31,893,236$ 22,713$ 52,190$ 42,481$ -$
8900 Other Uses (401,934) (10,973,274) (30,545) (19,506,884) (2,033,228) (2,049)
Fiscal Year Change Adjustment - - - - - -
Total Other Financing Resources (Uses) 3,592,962$ 20,919,962$ (7,832)$ (19,454,694)$ (1,990,747)$ (2,049)$
Estimated Change in Fund Balance 24,564,598$ 879,372$ 715,042$ 527,481$ 6,975,132$ -$
Estimated Beginning Fund Balance 7/1 73,213,209 97,777,807 98,657,179 99,372,221 99,899,702 106,874,834
Estimated Ending Fund Balance 6/30 97,777,807$ 98,657,179$ 99,372,221$ 99,899,702$ 106,874,834$ 106,874,834$
Excess (Deficiency) of Revenues Over (Under) Expenditures
GENERAL FUND REVENUES AND EXPENDITURES SIX-YEAR COMPARISON
BUDGET YEAR 2021-2022
96
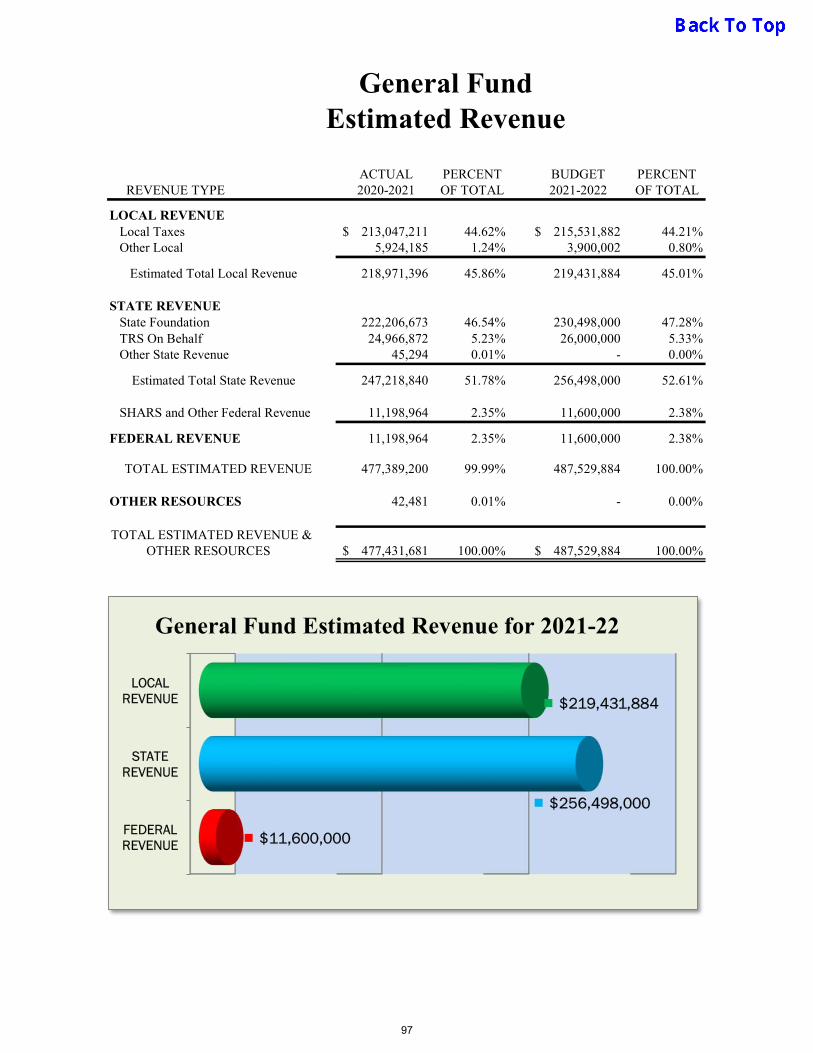
General FundEstimated Revenue
ACTUAL PERCENT BUDGET PERCENT REVENUE TYPE 2020-2021 OF TOTAL 2021-2022 OF TOTAL
LOCAL REVENUE Local Taxes 213,047,211$ 44.62% 215,531,882$ 44.21% Other Local 5,924,185 1.24% 3,900,002 0.80%
Estimated Total Local Revenue 218,971,396 45.86% 219,431,884 45.01%
STATE REVENUE State Foundation 222,206,673 46.54% 230,498,000 47.28% TRS On Behalf 24,966,872 5.23% 26,000,000 5.33% Other State Revenue 45,294 0.01% - 0.00%
Estimated Total State Revenue 247,218,840 51.78% 256,498,000 52.61%
SHARS and Other Federal Revenue 11,198,964 2.35% 11,600,000 2.38%
FEDERAL REVENUE 11,198,964 2.35% 11,600,000 2.38%
TOTAL ESTIMATED REVENUE 477,389,200 99.99% 487,529,884 100.00%
OTHER RESOURCES 42,481 0.01% - 0.00%
TOTAL ESTIMATED REVENUE & OTHER RESOURCES 477,431,681$ 100.00% 487,529,884$ 100.00%
FEDERALREVENUE
STATEREVENUE
LOCALREVENUE
$11,600,000
$256,498,000
$219,431,884
General Fund Estimated Revenue for 2021-22
97
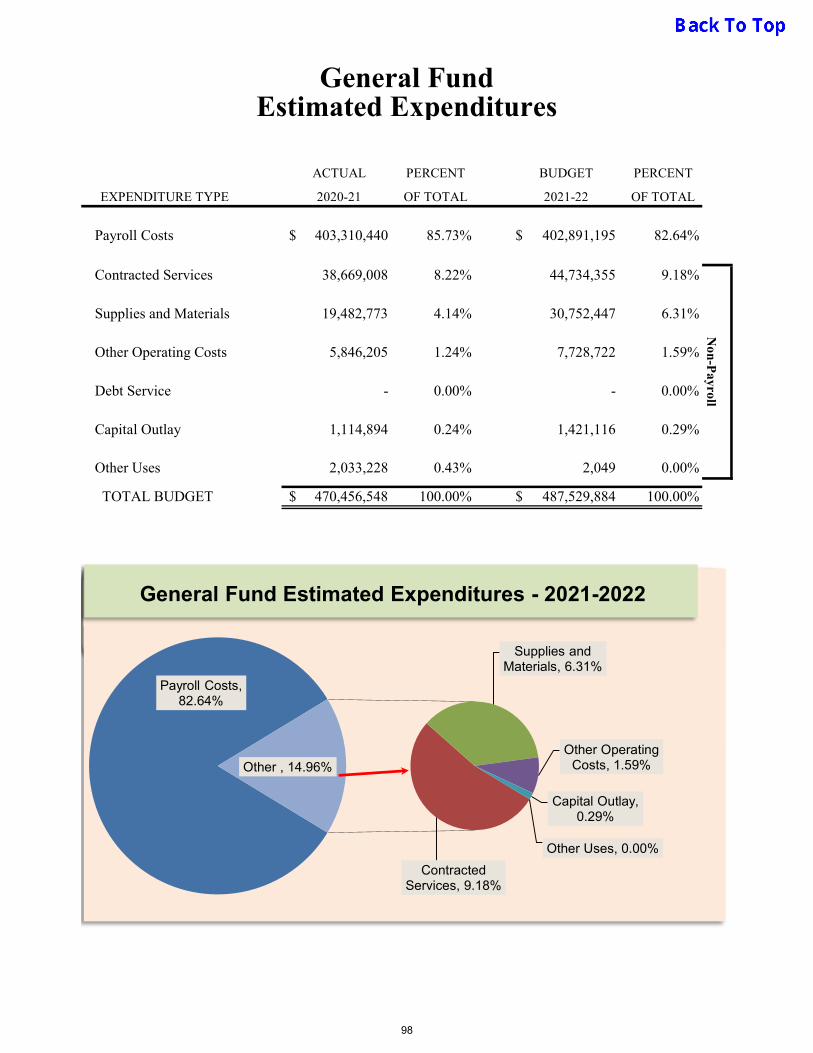
ACTUAL PERCENT BUDGET PERCENT
EXPENDITURE TYPE 2020-21 OF TOTAL 2021-22 OF TOTAL
Payroll Costs 403,310,440$ 85.73% 402,891,195$ 82.64%
Contracted Services 38,669,008 8.22% 44,734,355 9.18%
Supplies and Materials 19,482,773 4.14% 30,752,447 6.31%
Other Operating Costs 5,846,205 1.24% 7,728,722 1.59%
Debt Service - 0.00% - 0.00%
Capital Outlay 1,114,894 0.24% 1,421,116 0.29%
Other Uses 2,033,228 0.43% 2,049 0.00%
TOTAL BUDGET 470,456,548$ 100.00% 487,529,884$ 100.00%
General FundEstimated Expenditures
Non
-Payroll
Payroll Costs, 82.64%
Contracted Services, 9.18%
Supplies and Materials, 6.31%
Other Operating Costs, 1.59%
Capital Outlay, 0.29%
Other Uses, 0.00%
Other , 14.96%
General Fund Estimated Expenditures - 2021-2022
98
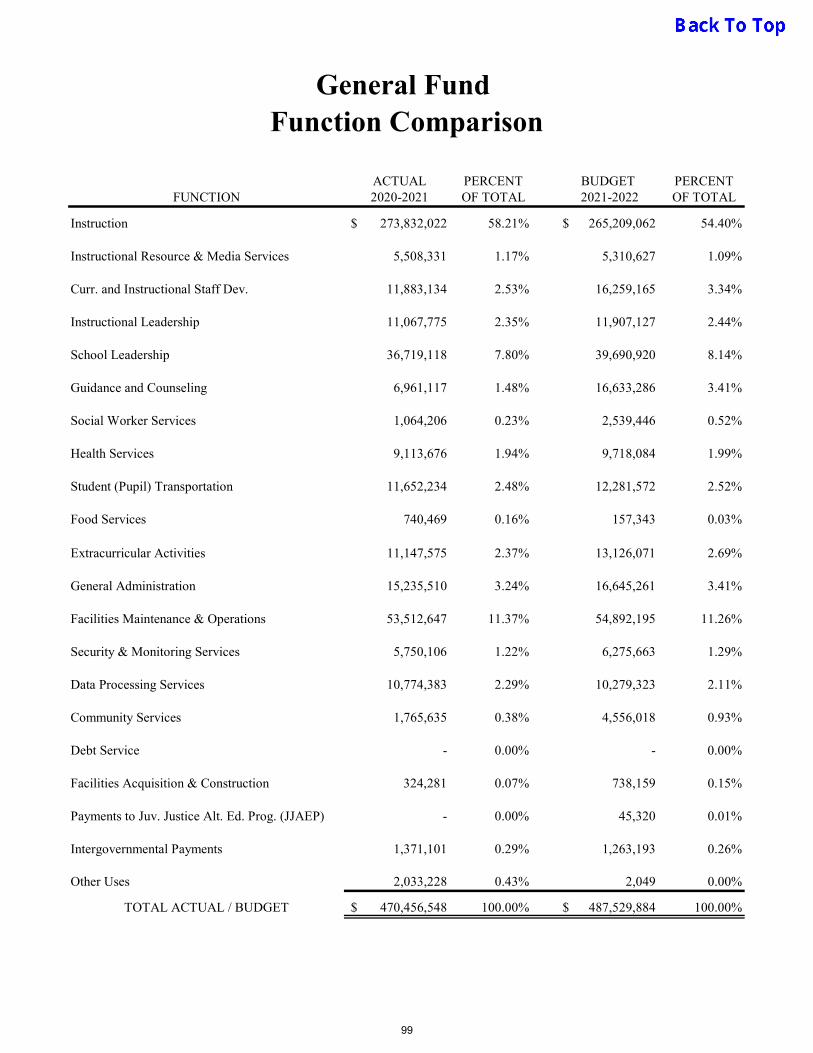
General Fund Function Comparison
ACTUAL PERCENT BUDGET PERCENTFUNCTION 2020-2021 OF TOTAL 2021-2022 OF TOTAL
Instruction 273,832,022$ 58.21% 265,209,062$ 54.40%
Instructional Resource & Media Services 5,508,331 1.17% 5,310,627 1.09%
Curr. and Instructional Staff Dev. 11,883,134 2.53% 16,259,165 3.34%
Instructional Leadership 11,067,775 2.35% 11,907,127 2.44%
School Leadership 36,719,118 7.80% 39,690,920 8.14%
Guidance and Counseling 6,961,117 1.48% 16,633,286 3.41%
Social Worker Services 1,064,206 0.23% 2,539,446 0.52%
Health Services 9,113,676 1.94% 9,718,084 1.99%
Student (Pupil) Transportation 11,652,234 2.48% 12,281,572 2.52%
Food Services 740,469 0.16% 157,343 0.03%
Extracurricular Activities 11,147,575 2.37% 13,126,071 2.69%
General Administration 15,235,510 3.24% 16,645,261 3.41%
Facilities Maintenance & Operations 53,512,647 11.37% 54,892,195 11.26%
Security & Monitoring Services 5,750,106 1.22% 6,275,663 1.29%
Data Processing Services 10,774,383 2.29% 10,279,323 2.11%
Community Services 1,765,635 0.38% 4,556,018 0.93%
Debt Service - 0.00% - 0.00%
Facilities Acquisition & Construction 324,281 0.07% 738,159 0.15%
Payments to Juv. Justice Alt. Ed. Prog. (JJAEP) - 0.00% 45,320 0.01%
Intergovernmental Payments 1,371,101 0.29% 1,263,193 0.26%
Other Uses 2,033,228 0.43% 2,049 0.00%
TOTAL ACTUAL / BUDGET 470,456,548$ 100.00% 487,529,884$ 100.00%
99
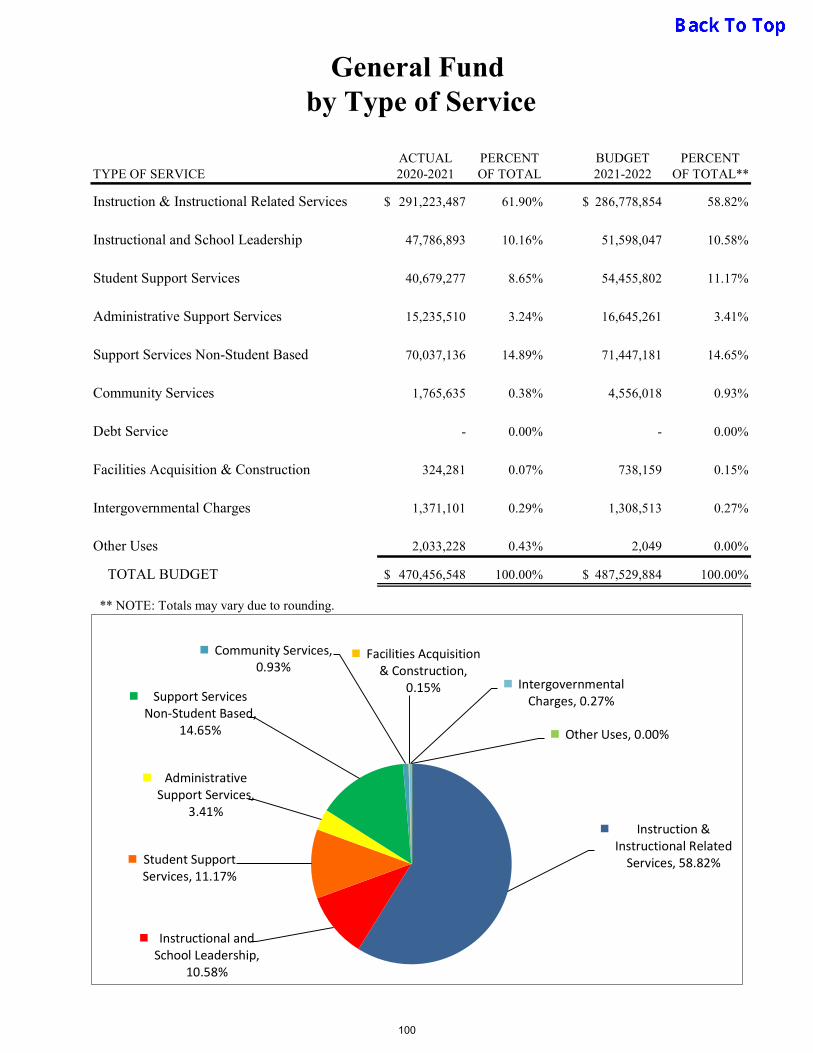
General Fund by Type of Service
ACTUAL PERCENT BUDGET PERCENTTYPE OF SERVICE 2020-2021 OF TOTAL 2021-2022 OF TOTAL**
Instruction & Instructional Related Services 291,223,487$ 61.90% 286,778,854$ 58.82%
Instructional and School Leadership 47,786,893 10.16% 51,598,047 10.58%
Student Support Services 40,679,277 8.65% 54,455,802 11.17%
Administrative Support Services 15,235,510 3.24% 16,645,261 3.41%
Support Services Non-Student Based 70,037,136 14.89% 71,447,181 14.65%
Community Services 1,765,635 0.38% 4,556,018 0.93%
Debt Service - 0.00% - 0.00%
Facilities Acquisition & Construction 324,281 0.07% 738,159 0.15%
Intergovernmental Charges 1,371,101 0.29% 1,308,513 0.27%
Other Uses 2,033,228 0.43% 2,049 0.00%
TOTAL BUDGET 470,456,548$ 100.00% 487,529,884$ 100.00%
** NOTE: Totals may vary due to rounding.
Instruction & Instructional Related
Services, 58.82%
Instructional and School Leadership,
10.58%
Student Support Services, 11.17%
Administrative Support Services,
3.41%
Support Services Non-Student Based,
14.65%
Community Services, 0.93%
Facilities Acquisition & Construction,
0.15% Intergovernmental Charges, 0.27%
Other Uses, 0.00%
100

General Fund Budget by Program Intentand Major Object Code 2021-2022
61XX 62XX 63XX 64XX 65XX 66XX Total ByPayroll Costs Purch./Contr. Supplies & Other Oper. Debt Cap. Outlay Program
P.I.C. Description Services Materials Expenses Services Land, Bldg, Eqp. Intent Code
11 Basic Educ Services 154,280,614$ 12,823,531$ 8,808,647$ 1,147,055$ -$ -$ 177,059,847$
21 Gifted and Talented 2,520,967 44,740 331,765 58,212 - - 2,955,684
22 Career and Tech (VOC) 10,618,370 86,745 835,042 72,229 - - 11,612,386
23 Student w/Disabilities (Sp Ed) 52,487,330 264,033 513,463 102,200 - 150,000 53,517,026
24 Accelerated Ed (Compensation) 515,878 - 58,601 6,460 - - 580,939
25 Bilingual Ed & ESL 1,770,093 119,255 150,983 186,710 - - 2,227,041
26 Non-Disciplinary AEP Services 5,055,746 62,930 42,705 31,450 - - 5,192,831
28 DAEP Basic Services 2,577,399 - 28,032 4,800 - - 2,610,231
30 T-1 Schoolwide Related 6,971,038 396,353 4,296,023 184,896 - - 11,848,310
31 High School Allotment 126,018 - - - - - 126,018
32 Pre-K and Head Start 7,046,699 - - - - - 7,046,699
33 Pre-K Special Education 2,154,673 - - - - - 2,154,673
34 Pre-K State Compensatory Educ 4,906,835 - 19,893 - - - 4,926,728
35 Pre-K Bilingual Education 1,000 - - - - - 1,000
36 Early Education 4,450,512 1,228,750 1,133,483 305,989 - - 7,118,734
37 Dyslexia 1,651,671 - - - - - 1,651,671
38 College, Career & Military Rdns 568,338 136,315 47,000 25,100 - - 776,753
43 Dyslexia- Special Education 383,348 - - - - - 383,348
91 Athletics & Related Acti. 6,101,462 821,283 1,191,195 587,060 - - 8,701,000
99 Undistributed (Generic) 138,703,204 28,750,420 13,295,615 5,016,561 - 1,271,116 187,036,916
402,891,195$ 44,734,355$ 30,752,447$ 7,728,722$ -$ 1,421,116$ 487,527,835$
82.64% 9.18% 6.31% 1.59% 0.00% 0.29% 100.00%
Major Class Object Total
% of Total
101

This graph depicts both membership and attendance statistics since 2014. Positive factors influencing both componentsare the growing local economy and expansion of innovative specialty schools within the District. Adverse factorsinfluencing membership and attendance are attributed to increased competition from charter schools and privateschools.
ADA and Student Membership Impact on State Funding
Trend shows Loss of State Funding
54,330 53,511 53,596 53,063 52,805
49,969 48,762 48,567
47,470
53,979 53,701 53,035 52,486
50,641
48,720 48,495
45,920 44,921
48,856 48,856 48,291 47,584
46,822
43,753 42,608
42,163 41,650
48,468 48,294 47,407
46,437
44,376
42,747 42,201
39,178
35,806 34,000 35,000 36,000 37,000 38,000 39,000 40,000 41,000 42,000 43,000 44,000 45,000 46,000 47,000 48,000 49,000 50,000 51,000 52,000 53,000 54,000 55,000 56,000
2014 2015 2016 2017 2018 2019 2020 2021 2022
School Year
SAISD Average Daily Attendance& Membership Trends
Membership Projection Membership Actual (October Snapshot)
ADA Projected for Funding ADA for Funding Received (Final)
102
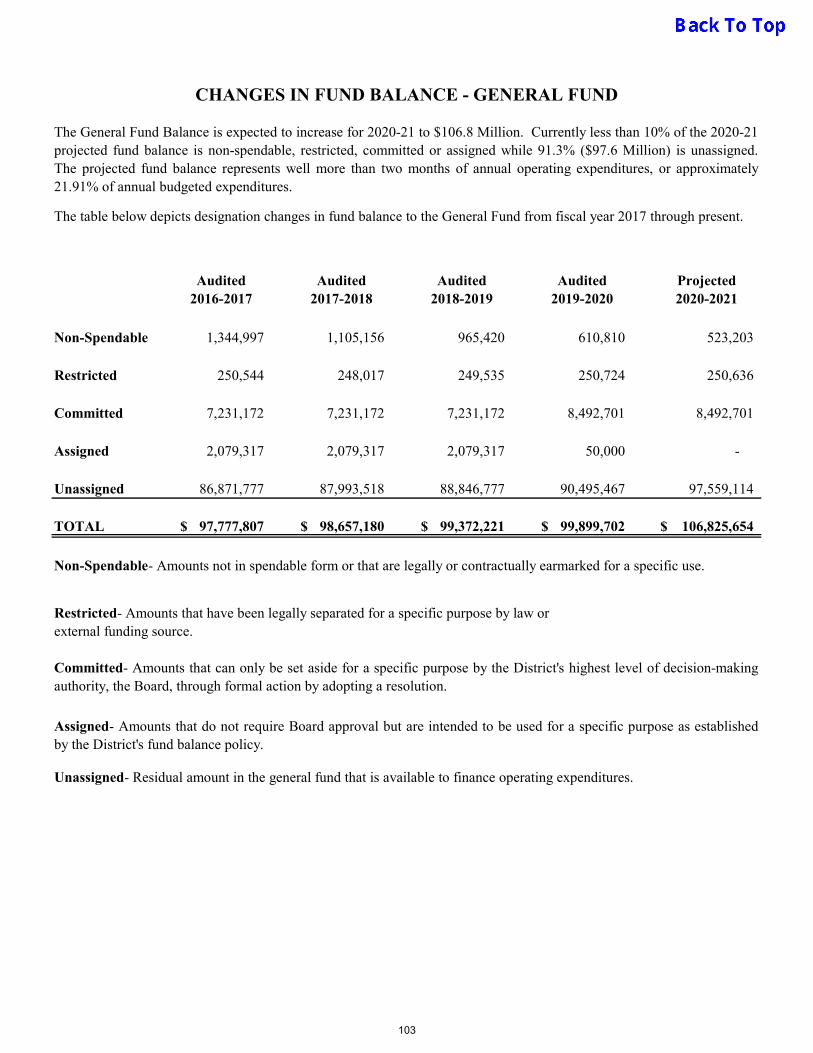
Audited2016-2017
Audited2017-2018
Audited2018-2019
Audited 2019-2020
Projected 2020-2021
Non-Spendable 1,344,997 1,105,156 965,420 610,810 523,203
Restricted 250,544 248,017 249,535 250,724 250,636
Committed 7,231,172 7,231,172 7,231,172 8,492,701 8,492,701
Assigned 2,079,317 2,079,317 2,079,317 50,000 -
Unassigned 86,871,777 87,993,518 88,846,777 90,495,467 97,559,114
TOTAL 97,777,807$ 98,657,180$ 99,372,221$ 99,899,702$ 106,825,654$
CHANGES IN FUND BALANCE - GENERAL FUND
The General Fund Balance is expected to increase for 2020-21 to $106.8 Million. Currently less than 10% of the 2020-21projected fund balance is non-spendable, restricted, committed or assigned while 91.3% ($97.6 Million) is unassigned.The projected fund balance represents well more than two months of annual operating expenditures, or approximately21.91% of annual budgeted expenditures.
The table below depicts designation changes in fund balance to the General Fund from fiscal year 2017 through present.
Unassigned- Residual amount in the general fund that is available to finance operating expenditures.
Committed- Amounts that can only be set aside for a specific purpose by the District's highest level of decision-makingauthority, the Board, through formal action by adopting a resolution.
Assigned- Amounts that do not require Board approval but are intended to be used for a specific purpose as establishedby the District's fund balance policy.
Non-Spendable- Amounts not in spendable form or that are legally or contractually earmarked for a specific use.
Restricted- Amounts that have been legally separated for a specific purpose by law or external funding source.
103


Org. No. Campus Name
MembershipProjection
Payroll Costs
Purchased& Contracted
Services
Supplies&
Materials
Other Operating
Costs Capital Outlay Total Budget
001 Brackenridge 1,523 9,934,546$ 152,862$ 248,247$ 50,439$ -$ 10,386,094$
002 Burbank 1,302 9,240,295 244,493 410,386 150,282 - 10,045,456
003 Edison 1,430 9,438,978 118,008 242,794 48,169 - 9,847,949
004 Tech 517 3,559,361 260,062 180,590 34,445 - 4,034,458
005 Highlands 1,512 10,235,440 126,266 245,430 51,096 - 10,658,232
006 Houston 844 7,039,892 111,351 189,287 33,982 - 7,374,512
007 Jefferson 1,614 10,687,199 282,305 489,441 125,129 - 11,584,074
008 Lanier 1,428 9,758,122 125,072 255,033 50,630 - 10,188,857
022 Travis Early College 455 2,435,517 281,448 51,189 37,561 - 2,805,715
025 St. Philips Early College 364 1,995,419 433,856 27,104 8,074 - 2,464,453
026 Advanced Learning 1,028 6,414,345 125,432 217,141 13,960 - 6,770,878
027 CAST Tech 475 2,994,238 48,633 40,359 10,580 - 3,093,810
028 CAST Med 277 2,029,059 244,898 44,641 14,551 - 2,333,149
Subtotal 12,769 85,762,411$ 2,554,686$ 2,641,642$ 628,898$ -$ 91,587,637$
010 Estrada 106 2,400,965$ -$ 19,132$ 18,300$ -$ 2,438,397$
020 Juvenile Justice 5 - 50,000 - - - 50,000
024 Cooper Academy 356 2,706,708 11,000 17,163 19,274 - 2,754,145
Subtotal 467 5,107,673$ 61,000$ 36,295$ 37,574$ -$ 5,242,542$
023 Young Women's 618 4,307,522$ 107,980$ 102,171$ 58,503$ -$ 4,576,176$
043 Davis 590 4,389,791 3,496 47,665 7,086 - 4,448,038
044 Hot Wells 413 3,066,280 1,099 118,380 5,975 - 3,191,734
047 Harris 841 5,426,476 85,759 148,266 33,417 - 5,693,918
050 Longfellow 866 5,929,294 28,129 75,451 34,339 - 6,067,213
051 Lowell 299 2,896,942 2,149 28,501 4,161 - 2,931,753
054 Poe 478 3,421,299 43,095 46,464 8,811 - 3,519,669
055 Rhodes 553 3,798,276 2,819 46,355 6,856 - 3,854,306
057 Rogers 392 3,152,149 3,278 39,491 5,516 - 3,200,434
059 Whittier 749 4,695,030 3,796 61,317 9,066 - 4,769,209
061 Tafolla 868 670,002 - 2,177 - - 672,179
Subtotal 6,667 41,753,061$ 281,600$ 716,238$ 173,730$ -$ 42,924,629$
064 Pickett Center 14 1,454,152$ 1,000$ 15,650$ 8,100$ -$ 1,478,902$
Subtotal 14 1,454,152$ 1,000$ 15,650$ 8,100$ -$ 1,478,902$
101 Arnold 582 3,536,423$ 1,400$ 31,259$ 3,564$ -$ 3,572,646$
103 Ball 322 2,545,555 861 17,301 2,167 - 2,565,884
105 Baskin 339 2,304,732 920 17,795 692 - 2,324,139
106 Beacon Hill 385 2,758,675 22,411 25,956 3,830 - 2,810,872
107 Bonham 628 4,213,587 124,286 75,105 5,215 - 4,418,193
110 J.T. Brackenridge 505 3,059,092 1,113 27,283 4,097 - 3,091,585
112 Briscoe 398 2,700,670 39,831 114,512 18,588 - 2,873,601
114 Cameron 304 2,315,774 39,527 193,323 5,896 - 2,554,520
116 Collins Garden 455 2,695,776 1,205 23,566 2,342 - 2,722,889
117 Cotton 455 3,436,632 25,814 30,369 4,347 - 3,497,162
118 Crockett 675 4,345,971 50,463 42,239 5,600 - 4,444,273
119 Douglass 204 1,969,914 560 11,719 516 - 1,982,709
Elementary Schools
GENERAL FUND BY MAJOR OBJECT CODE & CAMPUS
High Schools
Alternative High Schools
Middle Schools
Alternative Middle Schools
BUDGET 2021-2022
* Head Start Campus
104
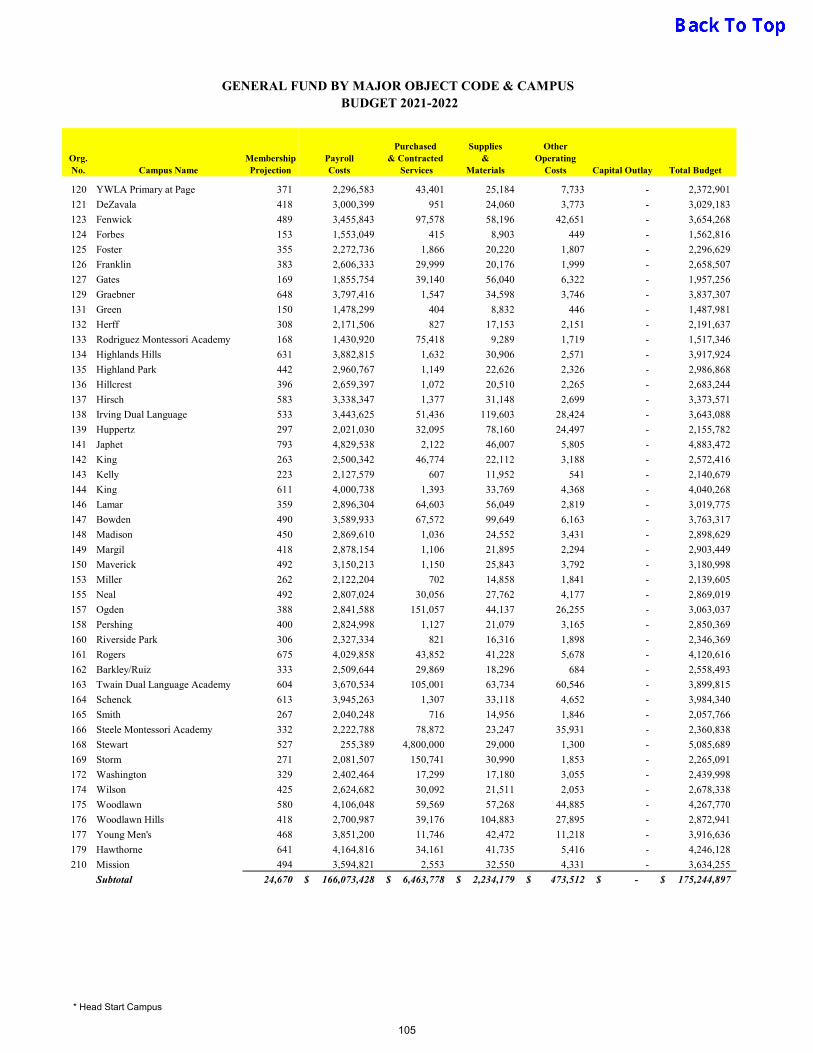
Org. No. Campus Name
MembershipProjection
Payroll Costs
Purchased& Contracted
Services
Supplies&
Materials
Other Operating
Costs Capital Outlay Total Budget
GENERAL FUND BY MAJOR OBJECT CODE & CAMPUS BUDGET 2021-2022
120 YWLA Primary at Page 371 2,296,583 43,401 25,184 7,733 - 2,372,901
121 DeZavala 418 3,000,399 951 24,060 3,773 - 3,029,183
123 Fenwick 489 3,455,843 97,578 58,196 42,651 - 3,654,268
124 Forbes 153 1,553,049 415 8,903 449 - 1,562,816
125 Foster 355 2,272,736 1,866 20,220 1,807 - 2,296,629
126 Franklin 383 2,606,333 29,999 20,176 1,999 - 2,658,507
127 Gates 169 1,855,754 39,140 56,040 6,322 - 1,957,256
129 Graebner 648 3,797,416 1,547 34,598 3,746 - 3,837,307
131 Green 150 1,478,299 404 8,832 446 - 1,487,981
132 Herff 308 2,171,506 827 17,153 2,151 - 2,191,637
133 Rodriguez Montessori Academy 168 1,430,920 75,418 9,289 1,719 - 1,517,346
134 Highlands Hills 631 3,882,815 1,632 30,906 2,571 - 3,917,924
135 Highland Park 442 2,960,767 1,149 22,626 2,326 - 2,986,868
136 Hillcrest 396 2,659,397 1,072 20,510 2,265 - 2,683,244
137 Hirsch 583 3,338,347 1,377 31,148 2,699 - 3,373,571
138 Irving Dual Language 533 3,443,625 51,436 119,603 28,424 - 3,643,088
139 Huppertz 297 2,021,030 32,095 78,160 24,497 - 2,155,782
141 Japhet 793 4,829,538 2,122 46,007 5,805 - 4,883,472
142 King 263 2,500,342 46,774 22,112 3,188 - 2,572,416
143 Kelly 223 2,127,579 607 11,952 541 - 2,140,679
144 King 611 4,000,738 1,393 33,769 4,368 - 4,040,268
146 Lamar 359 2,896,304 64,603 56,049 2,819 - 3,019,775
147 Bowden 490 3,589,933 67,572 99,649 6,163 - 3,763,317
148 Madison 450 2,869,610 1,036 24,552 3,431 - 2,898,629
149 Margil 418 2,878,154 1,106 21,895 2,294 - 2,903,449
150 Maverick 492 3,150,213 1,150 25,843 3,792 - 3,180,998
153 Miller 262 2,122,204 702 14,858 1,841 - 2,139,605
155 Neal 492 2,807,024 30,056 27,762 4,177 - 2,869,019
157 Ogden 388 2,841,588 151,057 44,137 26,255 - 3,063,037
158 Pershing 400 2,824,998 1,127 21,079 3,165 - 2,850,369
160 Riverside Park 306 2,327,334 821 16,316 1,898 - 2,346,369
161 Rogers 675 4,029,858 43,852 41,228 5,678 - 4,120,616
162 Barkley/Ruiz 333 2,509,644 29,869 18,296 684 - 2,558,493
163 Twain Dual Language Academy 604 3,670,534 105,001 63,734 60,546 - 3,899,815
164 Schenck 613 3,945,263 1,307 33,118 4,652 - 3,984,340
165 Smith 267 2,040,248 716 14,956 1,846 - 2,057,766
166 Steele Montessori Academy 332 2,222,788 78,872 23,247 35,931 - 2,360,838
168 Stewart 527 255,389 4,800,000 29,000 1,300 - 5,085,689
169 Storm 271 2,081,507 150,741 30,990 1,853 - 2,265,091
172 Washington 329 2,402,464 17,299 17,180 3,055 - 2,439,998
174 Wilson 425 2,624,682 30,092 21,511 2,053 - 2,678,338
175 Woodlawn 580 4,106,048 59,569 57,268 44,885 - 4,267,770
176 Woodlawn Hills 418 2,700,987 39,176 104,883 27,895 - 2,872,941
177 Young Men's 468 3,851,200 11,746 42,472 11,218 - 3,916,636
179 Hawthorne 641 4,164,816 34,161 41,735 5,416 - 4,246,128
210 Mission 494 3,594,821 2,553 32,550 4,331 - 3,634,255
Subtotal 24,670 166,073,428$ 6,463,778$ 2,234,179$ 473,512$ -$ 175,244,897$
* Head Start Campus
105

Org. No. Campus Name
MembershipProjection
Payroll Costs
Purchased& Contracted
Services
Supplies&
Materials
Other Operating
Costs Capital Outlay Total Budget
GENERAL FUND BY MAJOR OBJECT CODE & CAMPUS BUDGET 2021-2022
180 Gonzales 1 298,444$ -$ 9,400$ 1,500$ -$ 309,344$
182 Healy Murphy 132 554,834 - 4,000 - - 558,834
184 Santa Rosa Child Hosp 2 99,518 - 64 - - 99,582
195 Juvenile Detention Ctr 112 1,183,666 - 4,000 - - 1,187,666
201 Children's Shelter of S.A. 0 - - - - - -
202 Healy Murphy Pre-K 34 129,303 - 912 - - 130,215
Subtotal 281 2,265,765$ -$ 18,376$ 1,500$ -$ 2,285,641$
* 240 Carroll Early Childhood 516 2,603,241$ 32,071$ 189,937$ 8,679$ -$ 2,833,928$
* 241 Carvajal Early Childhood 480 2,815,532 935 28,633 5,330 - 2,850,430
* 242 Knox Early Childhood 267 1,057,332 - 21,116 6,973 - 1,085,421
* 244 Tynan Early Childhood 240 1,124,516 14,633 27,853 25,369 - 1,192,371
* 245 Nelson Early Childhood 219 945,479 - 17,268 5,677 - 968,424
* 246 Gonzalez Early Childhood 145 1,040,686 135 7,537 2,110 - 1,050,468
Subtotal 1,867 9,586,786$ 47,774$ 292,344$ 54,138$ -$ 9,981,042$
Total for Schools 46,735 312,003,276$ 9,409,838$ 5,954,724$ 1,377,452$ -$ 328,745,290$
Alternative Elementary/Satellite Schools
Early Childhood Centers
* Head Start Campus
106

San Antonio Independent School DistrictBUDGET SUMMARY BY FUNCTION AND CAMPUS LEVEL
Total Budget 177,059,847$ MAJOR GROUPInstruction 101,787,645$ 22,157,831$ 47,799,262$ 30,814$ 5,182,555$ 5,328$
Percentage 100.00% 100.00% 99.82% 100.00% 99.81% 100.00%Instructional/School Leadership
- - 86,412 - 1,000 -
Percentage 0.18% 0.02%Support Services-Students
- - - - 9,000 -
Percentage 0.17%Administrative Support Services
- - - - - -
PercentageSupport Services-Non Student Based
- - - - - -
Percentage
Other Services - - - - - -
Percentage
Total Budget 101,787,645$ 22,157,831$ 47,885,674$ 30,814$ 5,192,555$ 5,328$ Elementary
SchoolsMiddle Schools
High Schools
Non-Traditional Schools
District Wide *
Other -Departments *
* Provides student support at all grade levels.
REGULAR EDUCATION
CAMPUS LEVEL
FUNCTIONS
107

San Antonio Independent School DistrictBUDGET SUMMARY BY FUNCTION AND CAMPUS LEVEL
Total Budget 2,955,684$ MAJOR GROUPInstruction -$ 52$ -$ -$ 2,672,673$ -$
Percentage 100.00% 90.43%Instructional/School Leadership
- - - - - -
PercentageSupport Services-Students
- - - - 280,719 -
Percentage 9.50%Administrative Support Services
- - - - - -
PercentageSupport Services-Non Student Based
- - - - 1,740 -
Percentage 0.06%
Other Services - - - - 500.00 -
Percentage 0.02%
Total Budget -$ 52$ -$ -$ 2,955,632$ -$ Elementary
SchoolsMiddle Schools
High Schools
Non-Traditional Schools
District Wide *
Other -Departments *
* Provides student support at all grade levels.
GIFTED & TALENTED
CAMPUS LEVEL
FUNCTIONS
108

San Antonio Independent School DistrictBUDGET SUMMARY BY FUNCTION AND CAMPUS LEVEL
Total Budget 11,612,386$ MAJOR GROUPInstruction 2,500$ 49,862$ 9,319,187$ 76,731$ 325,080$ -$
Percentage 100.00% 100.00% 90.00% 100.00% 28.81%Instructional/School Leadership
- - - - 460,301 -
Percentage 40.797%Support Services-Students
- - 983,884 - 230,254 -
Percentage 9.50% 20.41%Administrative Support Services
- - - - - -
PercentageSupport Services-Non Student Based
- - 51,944 - 112,643 -
Percentage 0.50% 9.98%
Other Services - - - - - -
Percentage
Total Budget 2,500$ 49,862$ 10,355,015$ 76,731$ 1,128,278$ -$ Elementary
SchoolsMiddle Schools
High Schools
Non-Traditional Schools
District Wide *
Other -Departments *
* Provides student support at all grade levels.
CAREER & TECHNOLOGY
CAMPUS LEVEL
FUNCTIONS
109
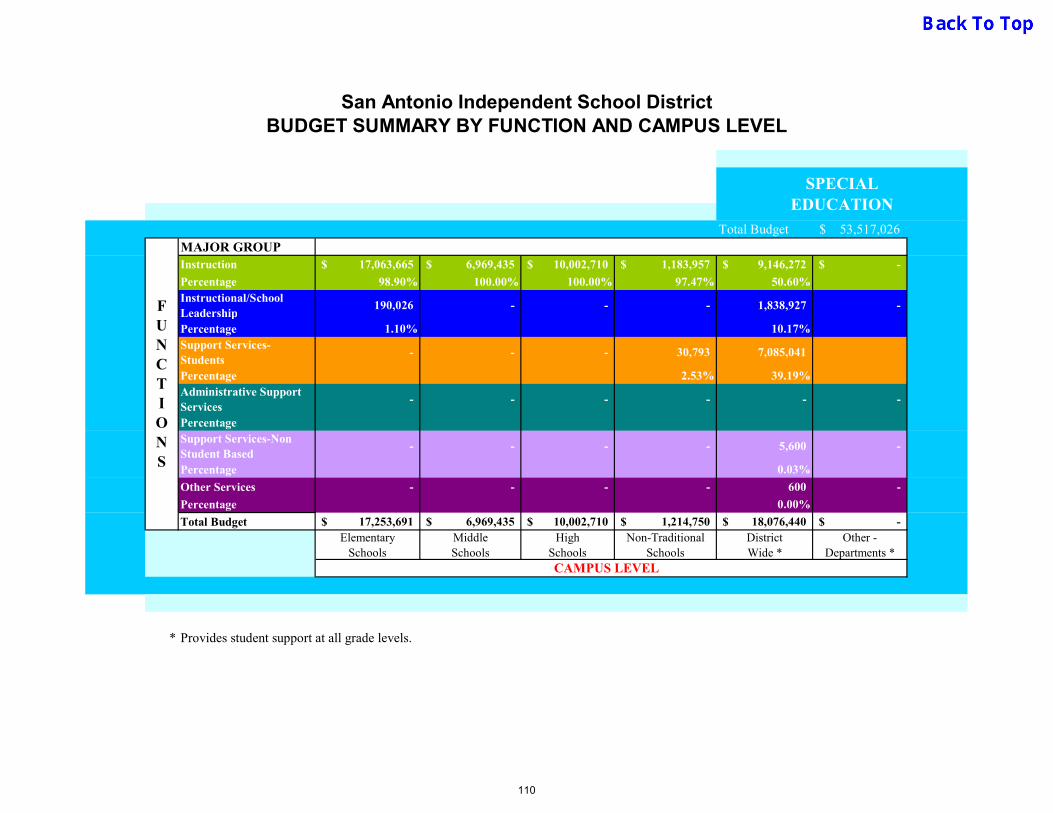
San Antonio Independent School DistrictBUDGET SUMMARY BY FUNCTION AND CAMPUS LEVEL
Total Budget 53,517,026$ MAJOR GROUPInstruction 17,063,665$ 6,969,435$ 10,002,710$ 1,183,957$ 9,146,272$ -$
Percentage 98.90% 100.00% 100.00% 97.47% 50.60%Instructional/School Leadership
190,026 - - - 1,838,927 -
Percentage 1.10% 10.17%Support Services-Students
- - - 30,793 7,085,041
Percentage 2.53% 39.19%Administrative Support Services
- - - - - -
PercentageSupport Services-Non Student Based
- - - - 5,600 -
Percentage 0.03%
Other Services - - - - 600 -
Percentage 0.00%
Total Budget 17,253,691$ 6,969,435$ 10,002,710$ 1,214,750$ 18,076,440$ -$ Elementary
SchoolsMiddle Schools
High Schools
Non-Traditional Schools
District Wide *
Other -Departments *
* Provides student support at all grade levels.
SPECIAL EDUCATION
CAMPUS LEVEL
FUNCTIONS
110
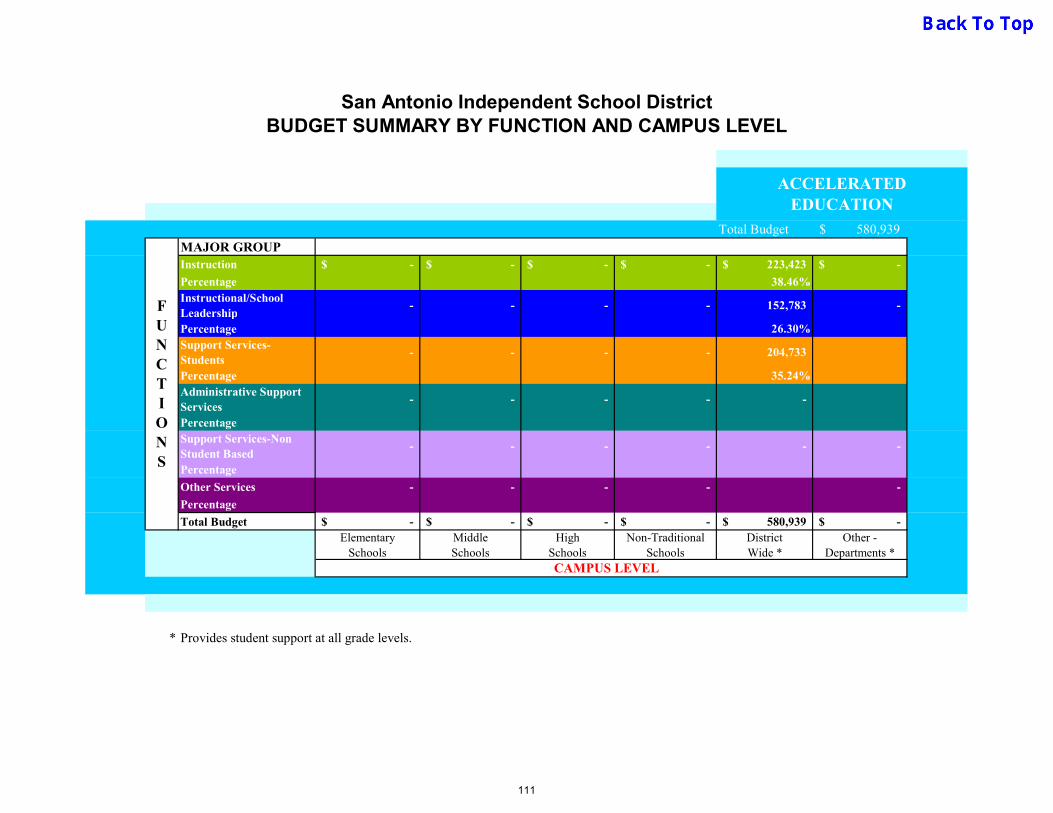
San Antonio Independent School DistrictBUDGET SUMMARY BY FUNCTION AND CAMPUS LEVEL
Total Budget 580,939$ MAJOR GROUPInstruction -$ -$ -$ -$ 223,423$ -$
Percentage 38.46%Instructional/School Leadership
- - - - 152,783 -
Percentage 26.30%Support Services-Students
- - - - 204,733
Percentage 35.24%Administrative Support Services
- - - - -
PercentageSupport Services-Non Student Based
- - - - - -
Percentage
Other Services - - - - -
Percentage
Total Budget -$ -$ -$ -$ 580,939$ -$ Elementary
SchoolsMiddle Schools
High Schools
Non-Traditional Schools
District Wide *
Other -Departments *
* Provides student support at all grade levels.
ACCELERATED EDUCATION
CAMPUS LEVEL
FUNCTIONS
111
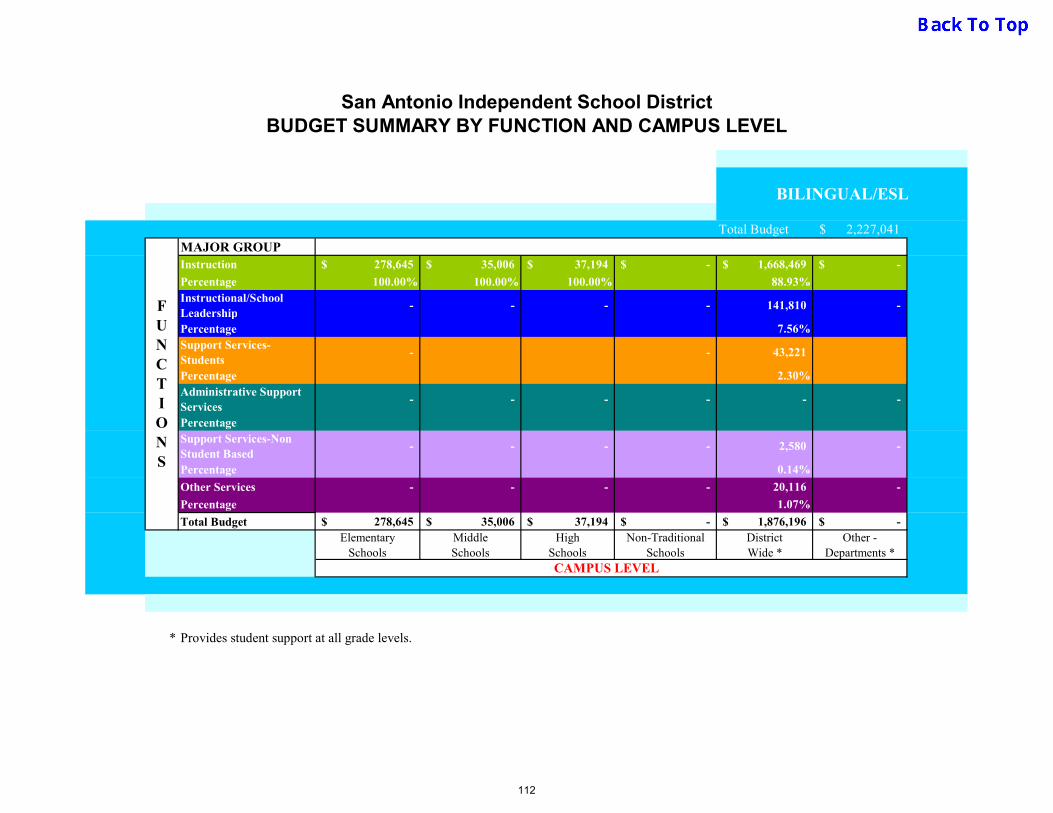
San Antonio Independent School DistrictBUDGET SUMMARY BY FUNCTION AND CAMPUS LEVEL
Total Budget 2,227,041$ MAJOR GROUPInstruction 278,645$ 35,006$ 37,194$ -$ 1,668,469$ -$
Percentage 100.00% 100.00% 100.00% 88.93%Instructional/School Leadership
- - - - 141,810 -
Percentage 7.56%Support Services-Students
- - 43,221
Percentage 2.30%Administrative Support Services
- - - - - -
PercentageSupport Services-Non Student Based
- - - - 2,580 -
Percentage 0.14%
Other Services - - - - 20,116 -
Percentage 1.07%
Total Budget 278,645$ 35,006$ 37,194$ -$ 1,876,196$ -$ Elementary
SchoolsMiddle Schools
High Schools
Non-Traditional Schools
District Wide *
Other -Departments *
* Provides student support at all grade levels.
CAMPUS LEVEL
BILINGUAL/ESL
FUNCTIONS
112
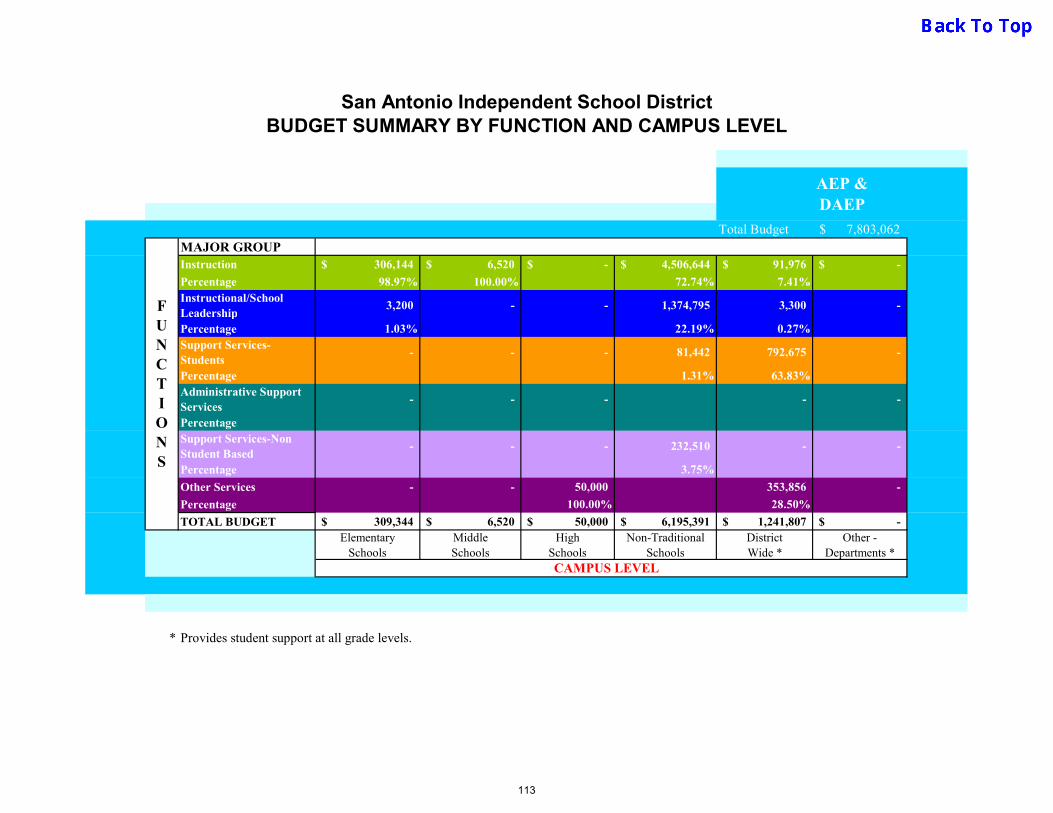
San Antonio Independent School DistrictBUDGET SUMMARY BY FUNCTION AND CAMPUS LEVEL
Total Budget 7,803,062$ MAJOR GROUPInstruction 306,144$ 6,520$ -$ 4,506,644$ 91,976$ -$
Percentage 98.97% 100.00% 72.74% 7.41%Instructional/School Leadership
3,200 - - 1,374,795 3,300 -
Percentage 1.03% 22.19% 0.27%Support Services-Students
- - - 81,442 792,675 -
Percentage 1.31% 63.83%Administrative Support Services
- - - - -
PercentageSupport Services-Non Student Based
- - - 232,510 - -
Percentage 3.75%
Other Services - - 50,000 353,856 -
Percentage 100.00% 28.50%
TOTAL BUDGET 309,344$ 6,520$ 50,000$ 6,195,391$ 1,241,807$ -$ Elementary
SchoolsMiddle Schools
High Schools
Non-Traditional Schools
District Wide *
Other -Departments *
* Provides student support at all grade levels.
AEP & DAEP
CAMPUS LEVEL
FUNCTIONS
113

San Antonio Independent School DistrictBUDGET SUMMARY BY FUNCTION AND CAMPUS LEVEL
Total Budget 11,848,310$ MAJOR GROUPInstruction 1,397,062$ 2,174,610$ 1,599,124$ 64$ 4,938,695$ -$
Percentage 95.23% 83.77% 84.60% 100.00% 83.78%Instructional/School Leadership
- - - - 5,500 -
Percentage 0.09%Support Services-Students
70,054 421,419 291,160 950,622
Percentage 4.77% 16.23% 15.40% 16.13%Administrative Support Services
- - - - - -
PercentageSupport Services-Non Student Based
- - - - -
Percentage
Other Services - - - - -
Percentage
Total Budget 1,467,116$ 2,596,029$ 1,890,284$ 64$ 5,894,817$ -$ Elementary
SchoolsMiddle Schools
High Schools
Non-Traditional Schools
District Wide *
Other -Departments *
* Provides student support at all grade levels.
CAMPUS LEVEL
TITLE I SCHOOL WIDE
FUNCTIONS
114

San Antonio Independent School DistrictBUDGET SUMMARY BY FUNCTION AND CAMPUS LEVEL
Total Budget 126,018$ MAJOR GROUPInstruction -$ -$ 2,190$ -$ -$ -$
Percentage 100.00%Instructional/School Leadership
- - - - 123,828 -
Percentage 100.00%Support Services-Students
- - - - - -
PercentageAdministrative Support Services
- - - - - -
PercentageSupport Services-Non Student Based
- - - - - -
Percentage
Other Services - - - - - -
Percentage
Total Budget -$ -$ 2,190$ -$ 123,828$ -$ Elementary
SchoolsMiddle Schools
High Schools
Non-Traditional Schools
District Wide *
Other -Departments *
* Provides student support at all grade levels.
HIGH SCHOOL ALLOTMENT
CAMPUS LEVEL
FUNCTIONS
115
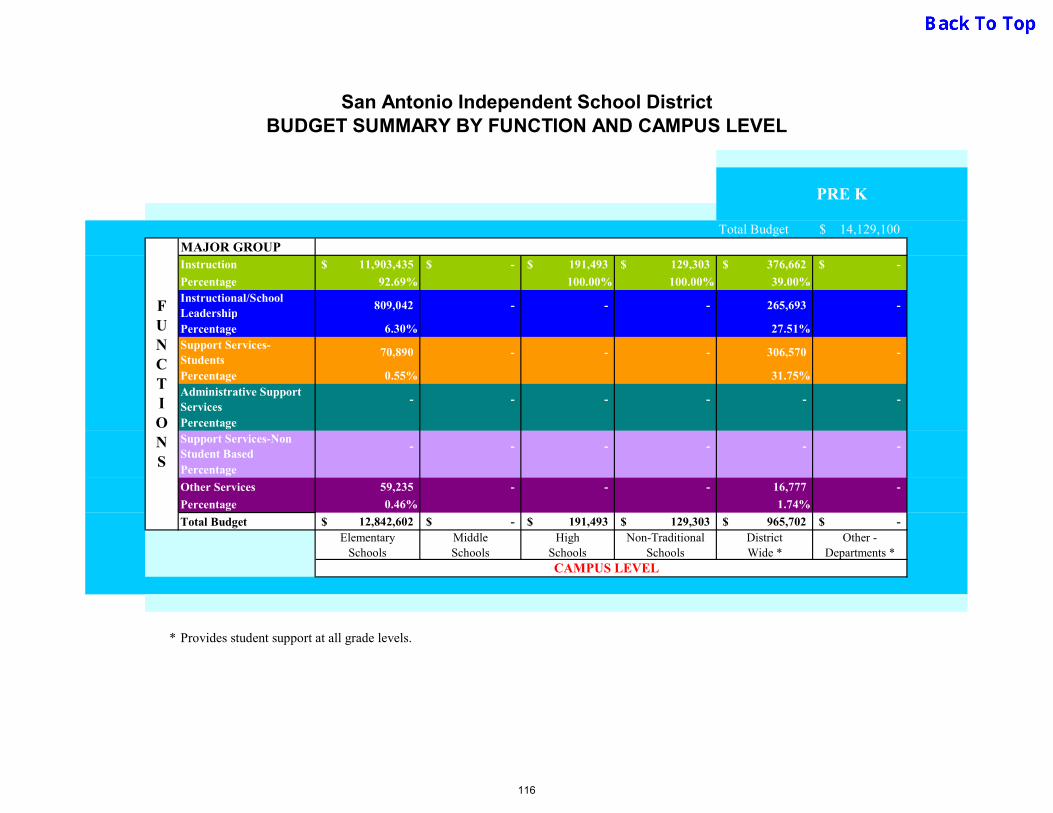
San Antonio Independent School DistrictBUDGET SUMMARY BY FUNCTION AND CAMPUS LEVEL
Total Budget 14,129,100$ MAJOR GROUPInstruction 11,903,435$ -$ 191,493$ 129,303$ 376,662$ -$
Percentage 92.69% 100.00% 100.00% 39.00%Instructional/School Leadership
809,042 - - - 265,693 -
Percentage 6.30% 27.51%Support Services-Students
70,890 - - - 306,570 -
Percentage 0.55% 31.75%Administrative Support Services
- - - - - -
PercentageSupport Services-Non Student Based
- - - - - -
Percentage
Other Services 59,235 - - - 16,777 -
Percentage 0.46% 1.74%
Total Budget 12,842,602$ -$ 191,493$ 129,303$ 965,702$ -$ Elementary
SchoolsMiddle Schools
High Schools
Non-Traditional Schools
District Wide *
Other -Departments *
* Provides student support at all grade levels.
PRE K
CAMPUS LEVEL
FUNCTIONS
116

San Antonio Independent School DistrictBUDGET SUMMARY BY FUNCTION AND CAMPUS LEVEL
Total Budget 7,118,734$ MAJOR GROUPInstruction 4,916,550$ -$ 1,650$ -$ 1,858,253$ -$
Percentage 97.07% 100.00% 90.55%Instructional/School Leadership
145,719 - - - 102,150 -
Percentage 2.88% 4.98%Support Services-Students
967 - - - 66,100 -
Percentage 0.02% 3.22%Administrative Support Services
- - - - - -
PercentageSupport Services-Non Student Based
1,565 - - - 11,500 -
Percentage 0.03% 0.56%
Other Services - - - - 14,280 -
Percentage 0.70%
Total Budget 5,064,801$ -$ 1,650$ -$ 2,052,283$ -$ Elementary
SchoolsMiddle Schools
High Schools
Non-Traditional Schools
District Wide *
Other -Departments *
* Provides student support at all grade levels.
EARLY EDUCATION ALLOTMENT
FUNCTIONS
CAMPUS LEVEL
117

San Antonio Independent School DistrictBUDGET SUMMARY BY FUNCTION AND CAMPUS LEVEL
Total Budget 2,035,019$ MAJOR GROUPInstruction -$ -$ -$ -$ 2,035,019$ -$
Percentage 100.00%Instructional/School Leadership
- - - - - -
PercentageSupport Services-Students
- - - - - -
PercentageAdministrative Support Services
- - - - - -
PercentageSupport Services-Non Student Based
- - - - - -
Percentage
Other Services - - - - - -
Percentage
Total Budget -$ -$ -$ -$ 2,035,019$ -$ Elementary
SchoolsMiddle Schools
High Schools
Non-Traditional Schools
District Wide *
Other -Departments *
* Provides student support at all grade levels.
DYSLEXIA
FUNCTIONS
CAMPUS LEVEL
118

San Antonio Independent School DistrictBUDGET SUMMARY BY FUNCTION AND CAMPUS LEVEL
Total Budget 776,753$ MAJOR GROUPInstruction -$ -$ -$ -$ 135,315$ -$
Percentage 17.42%Instructional/School Leadership
- - - - 577,838 -
Percentage 74.39%Support Services-Students
- - - - 63,600 -
Percentage 8.19%Administrative Support Services
- - - - - -
PercentageSupport Services-Non Student Based
- - - - - -
Percentage
Other Services - - - - - -
Percentage
Total Budget -$ -$ -$ -$ 776,753$ -$ Elementary
SchoolsMiddle Schools
High Schools
Non-Traditional Schools
District Wide *
Other -Departments *
* Provides student support at all grade levels.
FUNCTIONS
CAMPUS LEVEL
COLLEGE, CAREER, MILITARY READINESS
119

San Antonio Independent School DistrictBUDGET SUMMARY BY FUNCTION AND CAMPUS LEVEL
Total Budget 8,701,000$ MAJOR GROUPInstruction -$ -$ -$ -$ -$ -$
PercentageInstructional/School Leadership
- - - - - -
PercentageSupport Services-Students
742,254 792,521 3,351,478 - 3,814,747 -
Percentage 100.00% 100.00% 100.00% 100.00%Administrative Support Services
- - - - - -
PercentageSupport Services-Non Student Based
- - - - - -
Percentage
Other Services - - - - - -
Percentage
Total Budget 742,254$ 792,521$ 3,351,478$ -$ 3,814,747$ -$ Elementary
SchoolsMiddle Schools
High Schools
Non-Traditional Schools
District Wide *
Other -Departments *
* Provides student support at all grade levels.
ATHLETICSRELATED ACTIVITIES
CAMPUS LEVEL
FUNCTIONS
120

San Antonio Independent School DistrictBUDGET SUMMARY BY FUNCTION AND CAMPUS LEVEL
Total Budget 187,036,916$ MAJOR GROUPInstruction 4,278,155$ 901,627$ 2,153,904$ 810$ 6,855,353$ -$
Percentage 9.16% 8.27% 8.85% 0.28% 7.52%Instructional/School Leadership
18,842,556 4,137,169 10,275,856 157,028 11,408,638 494,476
Percentage 40.35% 37.94% 42.21% 54.25% 12.52% 3.62%Support Services-Students
11,160,758 3,195,209 6,172,427 4,485 12,591,533 647,246
Percentage 23.90% 29.30% 25.35% 1.55% 13.81% 4.74%Administrative Support Services
- - - - 5,972,930 10,672,331
Percentage 6.55% 78.20%Support Services-Non Student Based
10,661,024 2,257,552 5,002,549 81,316 53,069,675 -
Percentage 22.83% 20.70% 20.55% 28.09% 58.22%
Other Services 1,750,762 412,394 741,389 45,816 1,258,884 1,833,064
Percentage 3.75% 3.78% 3.05% 15.83% 1.38% 13.43%
TOTAL BUDGET 46,693,255$ 10,903,951$ 24,346,125$ 289,455$ 91,157,013$ 13,647,117$ Elementary
SchoolsMiddle Schools
High Schools
Non-Traditional Schools
District Wide *
Other -Departments *
* Provides student support at all grade levels.
UNDISTRIBUTED
CAMPUS LEVEL
FUNCTIONS
121
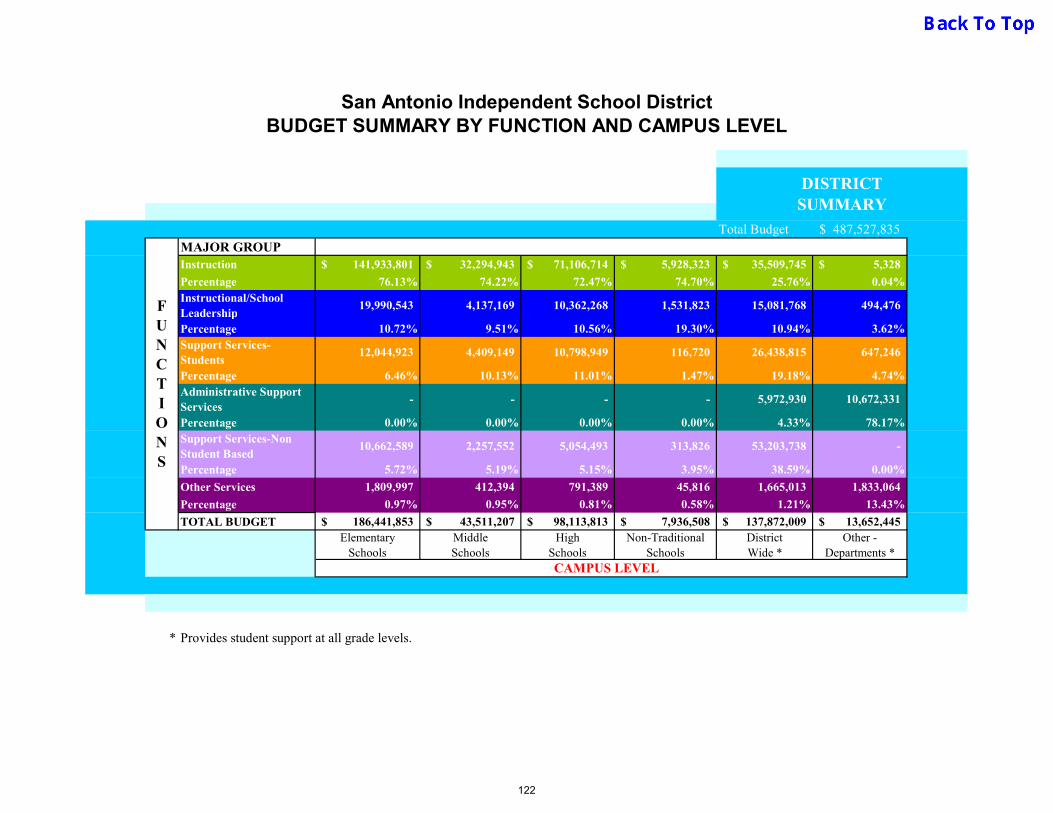
San Antonio Independent School DistrictBUDGET SUMMARY BY FUNCTION AND CAMPUS LEVEL
Total Budget 487,527,835$ MAJOR GROUPInstruction 141,933,801$ 32,294,943$ 71,106,714$ 5,928,323$ 35,509,745$ 5,328$
Percentage 76.13% 74.22% 72.47% 74.70% 25.76% 0.04%Instructional/School Leadership
19,990,543 4,137,169 10,362,268 1,531,823 15,081,768 494,476
Percentage 10.72% 9.51% 10.56% 19.30% 10.94% 3.62%Support Services-Students
12,044,923 4,409,149 10,798,949 116,720 26,438,815 647,246
Percentage 6.46% 10.13% 11.01% 1.47% 19.18% 4.74%Administrative Support Services
- - - - 5,972,930 10,672,331
Percentage 0.00% 0.00% 0.00% 0.00% 4.33% 78.17%Support Services-Non Student Based
10,662,589 2,257,552 5,054,493 313,826 53,203,738 -
Percentage 5.72% 5.19% 5.15% 3.95% 38.59% 0.00%
Other Services 1,809,997 412,394 791,389 45,816 1,665,013 1,833,064
Percentage 0.97% 0.95% 0.81% 0.58% 1.21% 13.43%
TOTAL BUDGET 186,441,853$ 43,511,207$ 98,113,813$ 7,936,508$ 137,872,009$ 13,652,445$ Elementary
SchoolsMiddle Schools
High Schools
Non-Traditional Schools
District Wide *
Other -Departments *
* Provides student support at all grade levels.
DISTRICTSUMMARY
CAMPUS LEVEL
FUNCTIONS
122
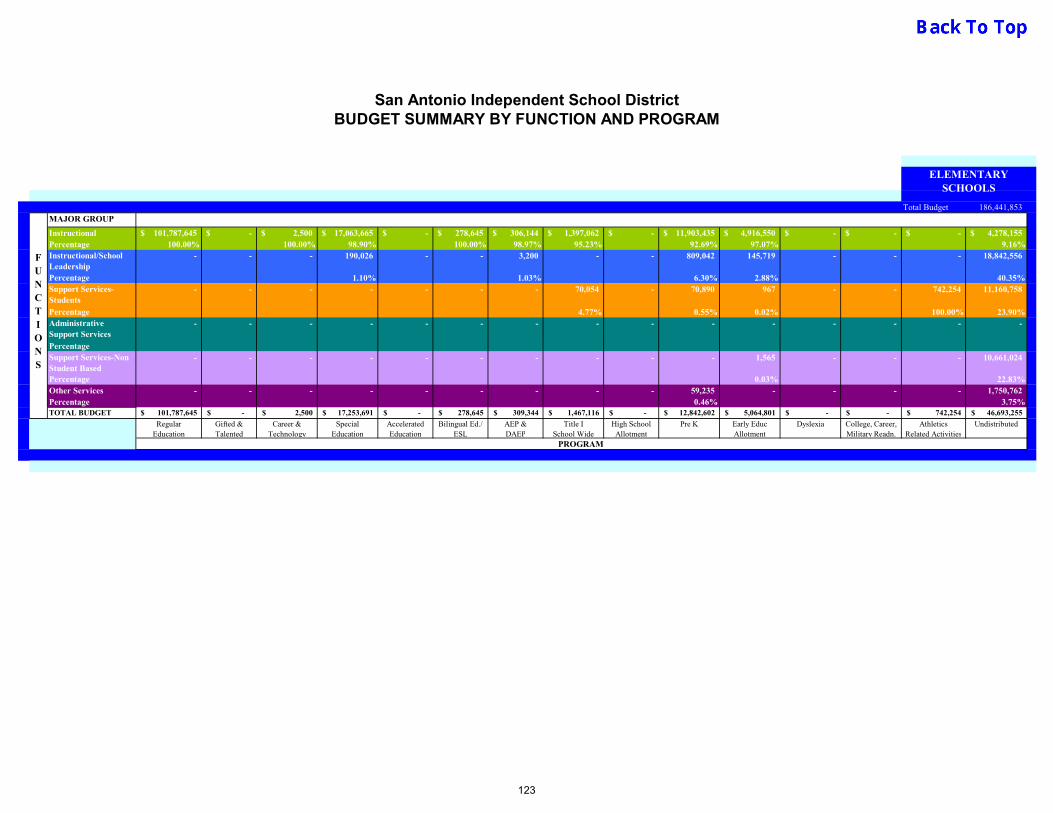
San Antonio Independent School DistrictBUDGET SUMMARY BY FUNCTION AND PROGRAM
Total Budget 186,441,853 MAJOR GROUP
Instructional 101,787,645$ -$ 2,500$ 17,063,665$ -$ 278,645$ 306,144$ 1,397,062$ -$ 11,903,435$ 4,916,550$ -$ -$ -$ 4,278,155$ Percentage 100.00% 100.00% 98.90% 100.00% 98.97% 95.23% 92.69% 97.07% 9.16%Instructional/School Leadership
- - - 190,026 - - 3,200 - - 809,042 145,719 - - - 18,842,556
Percentage 1.10% 1.03% 6.30% 2.88% 40.35%Support Services-Students
- - - - - - - 70,054 - 70,890 967 - - 742,254 11,160,758
Percentage 4.77% 0.55% 0.02% 100.00% 23.90%Administrative Support Services
- - - - - - - - - - - - - - -
PercentageSupport Services-Non Student Based
- - - - - - - - - - 1,565 - - - 10,661,024
Percentage 0.03% 22.83%Other Services - - - - - - - - - 59,235 - - - - 1,750,762 Percentage 0.46% 3.75%TOTAL BUDGET 101,787,645$ -$ 2,500$ 17,253,691$ -$ 278,645$ 309,344$ 1,467,116$ -$ 12,842,602$ 5,064,801$ -$ -$ 742,254$ 46,693,255$
Regular Education
Gifted & Talented
Career & Technology
Special Education
Accelerated Education
Bilingual Ed./ ESL
AEP & DAEP
Title I School Wide
High School Allotment
Pre K Early Educ Allotment
Dyslexia College, Career, Military Readn.
AthleticsRelated Activities
Undistributed
ELEMENTARY SCHOOLS
FUNCTIONS
PROGRAM
123
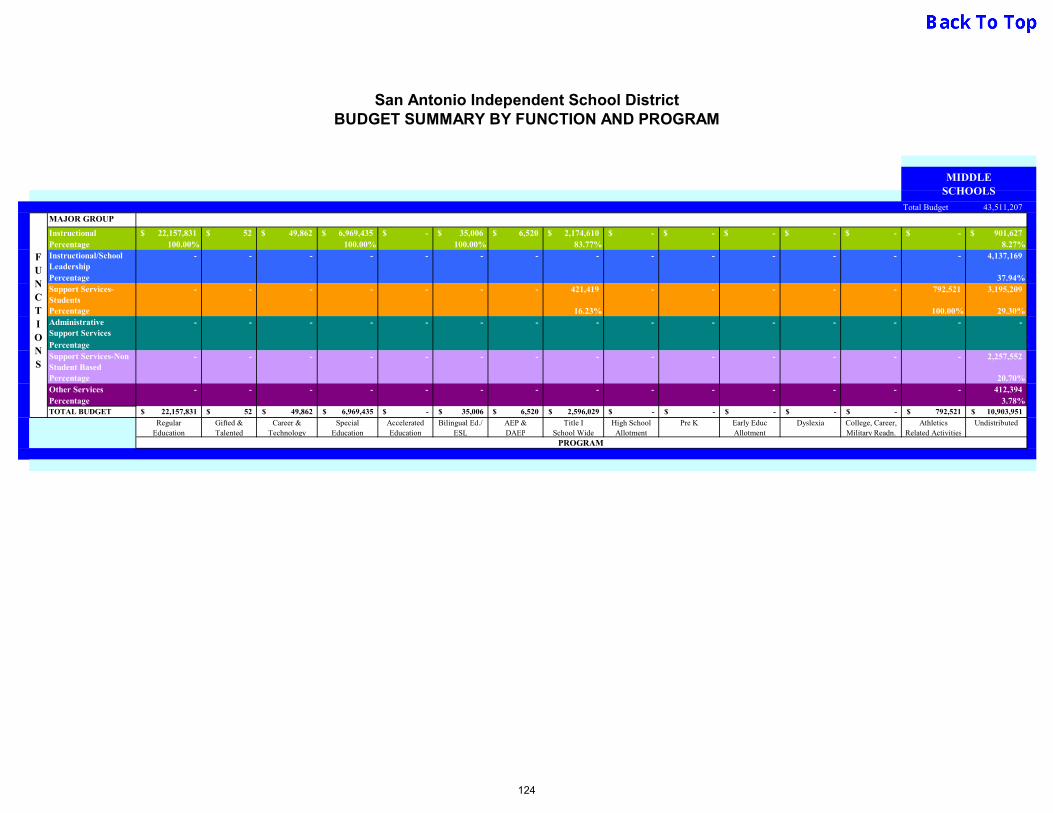
San Antonio Independent School DistrictBUDGET SUMMARY BY FUNCTION AND PROGRAM
Total Budget 43,511,207 MAJOR GROUP
Instructional 22,157,831$ 52$ 49,862$ 6,969,435$ -$ 35,006$ 6,520$ 2,174,610$ -$ -$ -$ -$ -$ -$ 901,627$ Percentage 100.00% 100.00% 100.00% 83.77% 8.27%Instructional/School Leadership
- - - - - - - - - - - - - - 4,137,169
Percentage 37.94%Support Services-Students
- - - - - - - 421,419 - - - - - 792,521 3,195,209
Percentage 16.23% 100.00% 29.30%Administrative Support Services
- - - - - - - - - - - - - - -
PercentageSupport Services-Non Student Based
- - - - - - - - - - - - - - 2,257,552
Percentage 20.70%Other Services - - - - - - - - - - - - - - 412,394 Percentage 3.78%TOTAL BUDGET 22,157,831$ 52$ 49,862$ 6,969,435$ -$ 35,006$ 6,520$ 2,596,029$ -$ -$ -$ -$ -$ 792,521$ 10,903,951$
Regular Education
Gifted & Talented
Career & Technology
Special Education
Accelerated Education
Bilingual Ed./ ESL
AEP & DAEP
Title I School Wide
High School Allotment
Pre K Early Educ Allotment
Dyslexia College, Career, Military Readn.
AthleticsRelated Activities
Undistributed
FUNCTIONS
PROGRAM
MIDDLE SCHOOLS
124

San Antonio Independent School DistrictBUDGET SUMMARY BY FUNCTION AND PROGRAM
Total Budget 98,113,813 MAJOR GROUP
Instructional 47,799,262$ -$ 9,319,187$ 10,002,710$ -$ 37,194$ -$ 1,599,124$ 2,190$ 104,597$ 86,896$ -$ 1,650$ -$ 2,153,904$ Percentage 99.82% 90.00% 100.00% 100.00% 84.60% 100.00% 100.00% 100.00% 8.85%Instructional/School Leadership
86,412 - - - - - - - - - - - - - 10,275,856
Percentage 0.18% 42.21%Support Services-Students
- - 983,884 - - - - 291,160 - - - - - 3,351,478 6,172,427
Percentage 9.50% 15.40% 100.00% 25.35%Administrative Support Services
- - - - - - - - - - - - - - -
PercentageSupport Services-Non Student Based
- - 51,944 - - - - - - - - - - - 5,002,549
Percentage 0.50% 20.55%Other Services - - - - - - 50,000 - - - - - - - 741,389 Percentage 100.00% 3.05%TOTAL BUDGET 47,885,674$ -$ 10,355,015$ 10,002,710$ -$ 37,194$ 50,000$ 1,890,284$ 2,190$ 104,597$ 86,896$ -$ 1,650$ 3,351,478$ 24,346,125$
Regular Education
Gifted & Talented
Career & Technology
Special Education
Accelerated Education
Bilingual Ed./ ESL
AEP & DAEP
Title I School Wide
High School Allotment
Pre K Early Educ Allotment
Dyslexia College, Career, Military Readn.
AthleticsRelated Activities
Undistributed
HIGH SCHOOLS
FUNCTIONS
PROGRAM
125
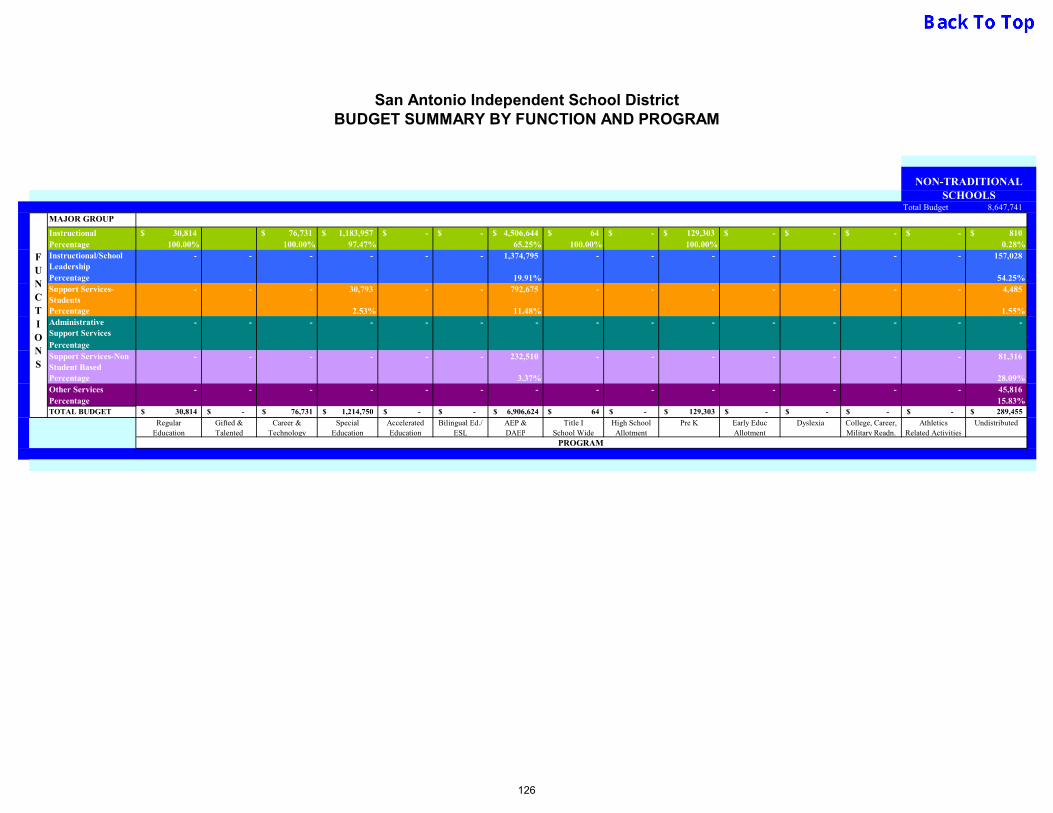
San Antonio Independent School DistrictBUDGET SUMMARY BY FUNCTION AND PROGRAM
Total Budget 8,647,741 MAJOR GROUP
Instructional 30,814$ 76,731$ 1,183,957$ -$ -$ 4,506,644$ 64$ -$ 129,303$ -$ -$ -$ -$ 810$ Percentage 100.00% 100.00% 97.47% 65.25% 100.00% 100.00% 0.28%Instructional/School Leadership
- - - - - - 1,374,795 - - - - - - - 157,028
Percentage 19.91% 54.25%Support Services-Students
- - - 30,793 - - 792,675 - - - - - - - 4,485
Percentage 2.53% 11.48% 1.55%Administrative Support Services
- - - - - - - - - - - - - - -
PercentageSupport Services-Non Student Based
- - - - - - 232,510 - - - - - - - 81,316
Percentage 3.37% 28.09%Other Services - - - - - - - - - - - - - - 45,816 Percentage 15.83%TOTAL BUDGET 30,814$ -$ 76,731$ 1,214,750$ -$ -$ 6,906,624$ 64$ -$ 129,303$ -$ -$ -$ -$ 289,455$
Regular Education
Gifted & Talented
Career & Technology
Special Education
Accelerated Education
Bilingual Ed./ ESL
AEP & DAEP
Title I School Wide
High School Allotment
Pre K Early Educ Allotment
Dyslexia College, Career, Military Readn.
AthleticsRelated Activities
Undistributed
PROGRAM
NON-TRADITIONAL SCHOOLS
FUNCTIONS
126
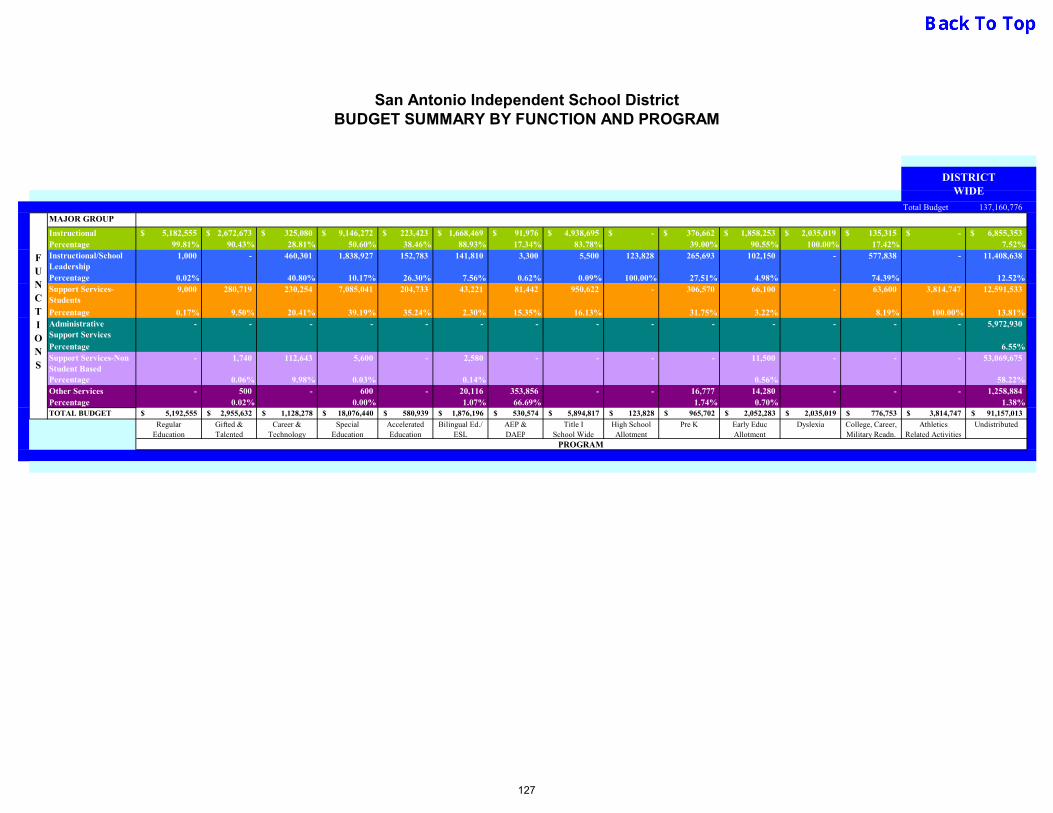
San Antonio Independent School DistrictBUDGET SUMMARY BY FUNCTION AND PROGRAM
Total Budget 137,160,776 MAJOR GROUP
Instructional 5,182,555$ 2,672,673$ 325,080$ 9,146,272$ 223,423$ 1,668,469$ 91,976$ 4,938,695$ -$ 376,662$ 1,858,253$ 2,035,019$ 135,315$ -$ 6,855,353$ Percentage 99.81% 90.43% 28.81% 50.60% 38.46% 88.93% 17.34% 83.78% 39.00% 90.55% 100.00% 17.42% 7.52%Instructional/School Leadership
1,000 - 460,301 1,838,927 152,783 141,810 3,300 5,500 123,828 265,693 102,150 - 577,838 - 11,408,638
Percentage 0.02% 40.80% 10.17% 26.30% 7.56% 0.62% 0.09% 100.00% 27.51% 4.98% 74.39% 12.52%Support Services-Students
9,000 280,719 230,254 7,085,041 204,733 43,221 81,442 950,622 - 306,570 66,100 - 63,600 3,814,747 12,591,533
Percentage 0.17% 9.50% 20.41% 39.19% 35.24% 2.30% 15.35% 16.13% 31.75% 3.22% 8.19% 100.00% 13.81%Administrative Support Services
- - - - - - - - - - - - - - 5,972,930
Percentage 6.55%Support Services-Non Student Based
- 1,740 112,643 5,600 - 2,580 - - - - 11,500 - - - 53,069,675
Percentage 0.06% 9.98% 0.03% 0.14% 0.56% 58.22%Other Services - 500 - 600 - 20,116 353,856 - - 16,777 14,280 - - - 1,258,884 Percentage 0.02% 0.00% 1.07% 66.69% 1.74% 0.70% 1.38%TOTAL BUDGET 5,192,555$ 2,955,632$ 1,128,278$ 18,076,440$ 580,939$ 1,876,196$ 530,574$ 5,894,817$ 123,828$ 965,702$ 2,052,283$ 2,035,019$ 776,753$ 3,814,747$ 91,157,013$
Regular Education
Gifted & Talented
Career & Technology
Special Education
Accelerated Education
Bilingual Ed./ ESL
AEP & DAEP
Title I School Wide
High School Allotment
Pre K Early Educ Allotment
Dyslexia College, Career, Military Readn.
AthleticsRelated Activities
Undistributed
DISTRICT WIDE
FUNCTIONS
PROGRAM
127
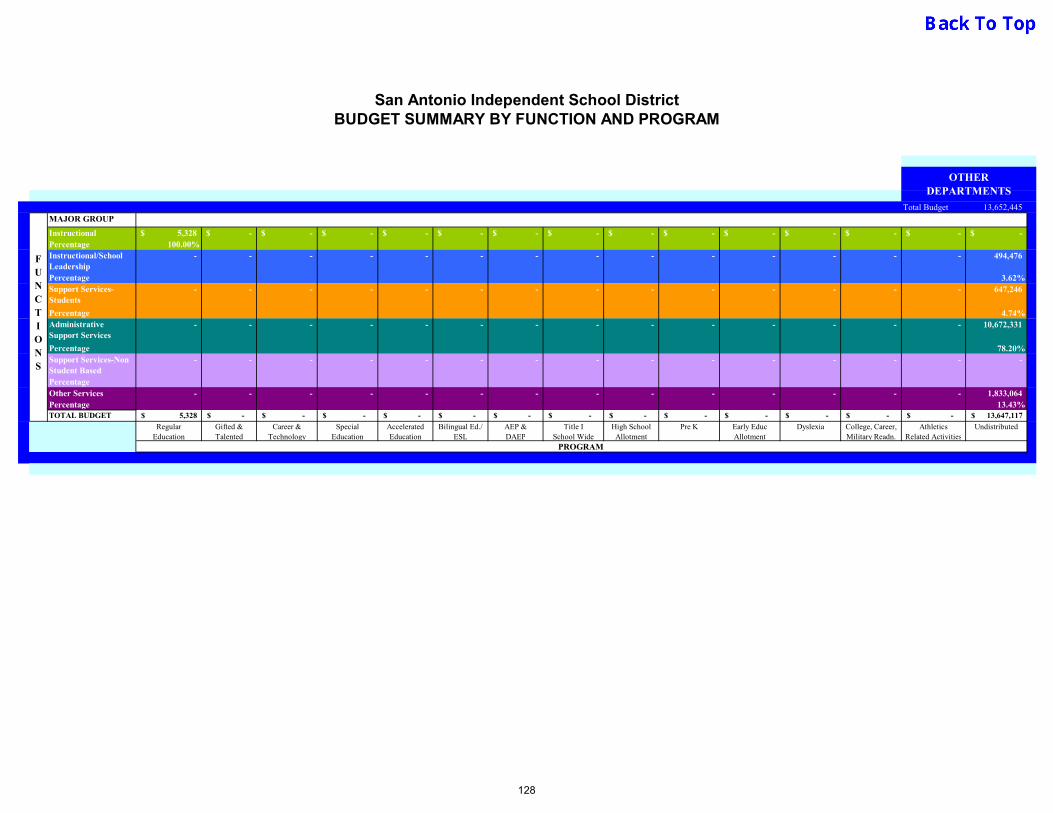
San Antonio Independent School DistrictBUDGET SUMMARY BY FUNCTION AND PROGRAM
Total Budget 13,652,445 MAJOR GROUP
Instructional 5,328$ -$ -$ -$ -$ -$ -$ -$ -$ -$ -$ -$ -$ -$ -$ Percentage 100.00%Instructional/School Leadership
- - - - - - - - - - - - - - 494,476
Percentage 3.62%Support Services-Students
- - - - - - - - - - - - - - 647,246
Percentage 4.74%Administrative Support Services
- - - - - - - - - - - - - - 10,672,331
Percentage 78.20%Support Services-Non Student Based
- - - - - - - - - - - - - - -
PercentageOther Services - - - - - - - - - - - - - - 1,833,064 Percentage 13.43%TOTAL BUDGET 5,328$ -$ -$ -$ -$ -$ -$ -$ -$ -$ -$ -$ -$ -$ 13,647,117$
Regular Education
Gifted & Talented
Career & Technology
Special Education
Accelerated Education
Bilingual Ed./ ESL
AEP & DAEP
Title I School Wide
High School Allotment
Pre K Early Educ Allotment
Dyslexia College, Career, Military Readn.
AthleticsRelated Activities
Undistributed
OTHERDEPARTMENTS
FUNCTIONS
PROGRAM
128

San Antonio Independent School DistrictBUDGET SUMMARY BY FUNCTION AND PROGRAM
Total Budget 487,527,835 MAJOR GROUP
Instructional 176,963,435$ 2,672,725$ 9,773,360$ 44,366,039$ 223,423$ 2,019,314$ 4,911,284$ 10,109,555$ 2,190$ 12,513,997$ 6,861,699$ 2,035,019$ 136,965$ -$ 14,189,849$ Percentage 99.95% 90.43% 84.16% 82.90% 38.46% 90.67% 62.94% 85.32% 1.74% 1607.65% 881.51% 261.44% 17.60% 7.59%Instructional/School Leadership
87,412 - 460,301 2,028,953 152,783 141,810 1,381,295 5,500 123,828 1,074,735 247,869 - 577,838 - 45,315,723
Percentage 0.05% 0.00% 3.96% 3.79% 26.30% 6.37% 17.70% 98.26% 7.65% 3.44% 0.00% 74.23% 24.23%Support Services-Students
9,000 280,719 1,214,138 7,115,834 204,733 43,221 874,117 1,733,255 - 377,460 67,067 - 63,600 8,701,000 33,771,658
Percentage 0.01% 9.50% 10.46% 13.30% 35.24% 1.94% 11.20% 14.63% 0.00% 2.69% 0.93% 0.00% 8.17% 100.00% 18.06%Administrative Support Services
- - - - - - - - - - - - - - 16,645,261
Percentage 0.00% 0.000% 0.000% 0.000% 0.000% 8.90%Support Services-Non Student Based
- 1,740 164,587 5,600 - 2,580 232,510 - - - 13,065 - - - 71,072,116
Percentage 0.06% 1.42% 0.01% 0.00% 0.12% 2.98% 0.00% 0.00% 0.18% 0.00% 0.00% 38.00%Other Services - 500 - 600 - 20,116 403,856 - - 76,012 14,280 - - - 6,042,309 Percentage 0.00% 0.00% 0.90% 5.18% 0.00% 0.00% 0.54% 0.20% 0.00% 0.00% 3.23%TOTAL BUDGET 177,059,847$ 2,955,684$ 11,612,386$ 53,517,026$ 580,939$ 2,227,041$ 7,803,062$ 11,848,310$ 126,018$ 14,042,204$ 7,203,980$ 2,035,019$ 778,403$ 8,701,000$ 187,036,916$
Regular Education
Gifted & Talented
Career & Technology
Special Education
Accelerated Education
Bilingual Ed./ ESL
AEP & DAEP
Title I School Wide
High School Allotment
Pre K Early Educ Allotment
Dyslexia College, Career, Military Readn.
AthleticsRelated Activities
Undistributed
FUNCTIONS
PROGRAM
DISTRICT SUMMARY
129
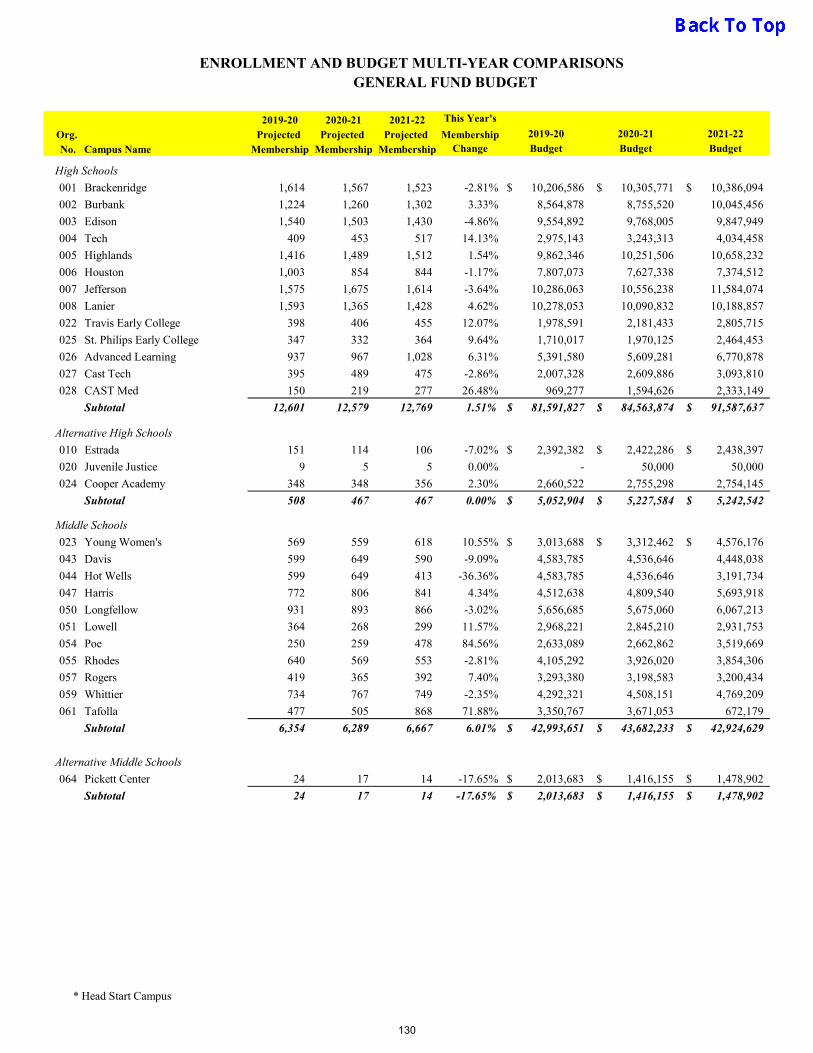
ENROLLMENT AND BUDGET MULTI-YEAR COMPARISONSGENERAL FUND BUDGET
2019-20 2020-21 2021-22 This Year's
Org. Projected Projected Projected Membership 2019-20 2020-21 2021-22
No. Campus Name Membership Membership Membership Change Budget Budget Budget
High Schools
001 Brackenridge 1,614 1,567 1,523 -2.81% 10,206,586$ 10,305,771$ 10,386,094$
002 Burbank 1,224 1,260 1,302 3.33% 8,564,878 8,755,520 10,045,456
003 Edison 1,540 1,503 1,430 -4.86% 9,554,892 9,768,005 9,847,949
004 Tech 409 453 517 14.13% 2,975,143 3,243,313 4,034,458
005 Highlands 1,416 1,489 1,512 1.54% 9,862,346 10,251,506 10,658,232
006 Houston 1,003 854 844 -1.17% 7,807,073 7,627,338 7,374,512
007 Jefferson 1,575 1,675 1,614 -3.64% 10,286,063 10,556,238 11,584,074
008 Lanier 1,593 1,365 1,428 4.62% 10,278,053 10,090,832 10,188,857
022 Travis Early College 398 406 455 12.07% 1,978,591 2,181,433 2,805,715
025 St. Philips Early College 347 332 364 9.64% 1,710,017 1,970,125 2,464,453
026 Advanced Learning 937 967 1,028 6.31% 5,391,580 5,609,281 6,770,878
027 Cast Tech 395 489 475 -2.86% 2,007,328 2,609,886 3,093,810
028 CAST Med 150 219 277 26.48% 969,277 1,594,626 2,333,149
Subtotal 12,601 12,579 12,769 1.51% 81,591,827$ 84,563,874$ 91,587,637$
Alternative High Schools
010 Estrada 151 114 106 -7.02% 2,392,382$ 2,422,286$ 2,438,397$
020 Juvenile Justice 9 5 5 0.00% - 50,000 50,000
024 Cooper Academy 348 348 356 2.30% 2,660,522 2,755,298 2,754,145
Subtotal 508 467 467 0.00% 5,052,904$ 5,227,584$ 5,242,542$
Middle Schools
023 Young Women's 569 559 618 10.55% 3,013,688$ 3,312,462$ 4,576,176$
043 Davis 599 649 590 -9.09% 4,583,785 4,536,646 4,448,038
044 Hot Wells 599 649 413 -36.36% 4,583,785 4,536,646 3,191,734
047 Harris 772 806 841 4.34% 4,512,638 4,809,540 5,693,918
050 Longfellow 931 893 866 -3.02% 5,656,685 5,675,060 6,067,213
051 Lowell 364 268 299 11.57% 2,968,221 2,845,210 2,931,753
054 Poe 250 259 478 84.56% 2,633,089 2,662,862 3,519,669
055 Rhodes 640 569 553 -2.81% 4,105,292 3,926,020 3,854,306
057 Rogers 419 365 392 7.40% 3,293,380 3,198,583 3,200,434
059 Whittier 734 767 749 -2.35% 4,292,321 4,508,151 4,769,209
061 Tafolla 477 505 868 71.88% 3,350,767 3,671,053 672,179
Subtotal 6,354 6,289 6,667 6.01% 42,993,651$ 43,682,233$ 42,924,629$
064 Pickett Center 24 17 14 -17.65% 2,013,683$ 1,416,155$ 1,478,902$
Subtotal 24 17 14 -17.65% 2,013,683$ 1,416,155$ 1,478,902$
Alternative Middle Schools
* Head Start Campus
130
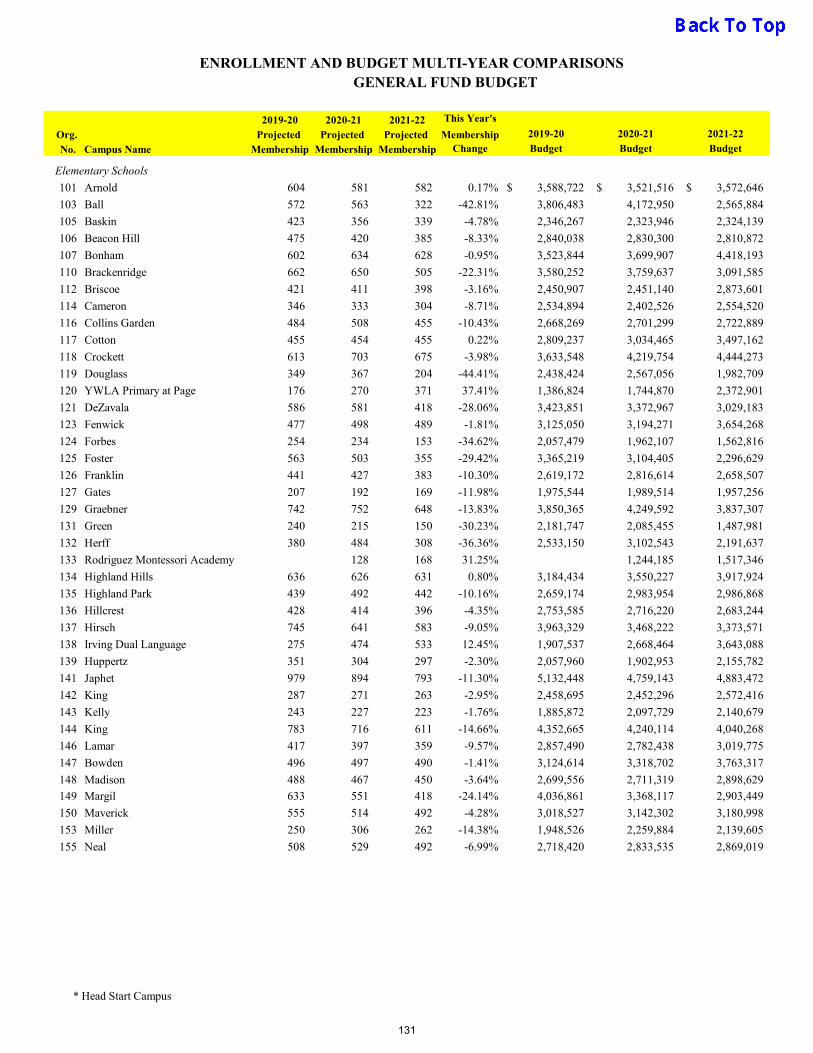
ENROLLMENT AND BUDGET MULTI-YEAR COMPARISONSGENERAL FUND BUDGET
2019-20 2020-21 2021-22 This Year's
Org. Projected Projected Projected Membership 2019-20 2020-21 2021-22
No. Campus Name Membership Membership Membership Change Budget Budget Budget
Elementary Schools
101 Arnold 604 581 582 0.17% 3,588,722$ 3,521,516$ 3,572,646$
103 Ball 572 563 322 -42.81% 3,806,483 4,172,950 2,565,884
105 Baskin 423 356 339 -4.78% 2,346,267 2,323,946 2,324,139
106 Beacon Hill 475 420 385 -8.33% 2,840,038 2,830,300 2,810,872
107 Bonham 602 634 628 -0.95% 3,523,844 3,699,907 4,418,193
110 Brackenridge 662 650 505 -22.31% 3,580,252 3,759,637 3,091,585
112 Briscoe 421 411 398 -3.16% 2,450,907 2,451,140 2,873,601
114 Cameron 346 333 304 -8.71% 2,534,894 2,402,526 2,554,520
116 Collins Garden 484 508 455 -10.43% 2,668,269 2,701,299 2,722,889
117 Cotton 455 454 455 0.22% 2,809,237 3,034,465 3,497,162
118 Crockett 613 703 675 -3.98% 3,633,548 4,219,754 4,444,273
119 Douglass 349 367 204 -44.41% 2,438,424 2,567,056 1,982,709
120 YWLA Primary at Page 176 270 371 37.41% 1,386,824 1,744,870 2,372,901
121 DeZavala 586 581 418 -28.06% 3,423,851 3,372,967 3,029,183
123 Fenwick 477 498 489 -1.81% 3,125,050 3,194,271 3,654,268
124 Forbes 254 234 153 -34.62% 2,057,479 1,962,107 1,562,816
125 Foster 563 503 355 -29.42% 3,365,219 3,104,405 2,296,629
126 Franklin 441 427 383 -10.30% 2,619,172 2,816,614 2,658,507
127 Gates 207 192 169 -11.98% 1,975,544 1,989,514 1,957,256
129 Graebner 742 752 648 -13.83% 3,850,365 4,249,592 3,837,307
131 Green 240 215 150 -30.23% 2,181,747 2,085,455 1,487,981
132 Herff 380 484 308 -36.36% 2,533,150 3,102,543 2,191,637
133 Rodriguez Montessori Academy 128 168 31.25% 1,244,185 1,517,346
134 Highland Hills 636 626 631 0.80% 3,184,434 3,550,227 3,917,924
135 Highland Park 439 492 442 -10.16% 2,659,174 2,983,954 2,986,868
136 Hillcrest 428 414 396 -4.35% 2,753,585 2,716,220 2,683,244
137 Hirsch 745 641 583 -9.05% 3,963,329 3,468,222 3,373,571
138 Irving Dual Language 275 474 533 12.45% 1,907,537 2,668,464 3,643,088
139 Huppertz 351 304 297 -2.30% 2,057,960 1,902,953 2,155,782
141 Japhet 979 894 793 -11.30% 5,132,448 4,759,143 4,883,472
142 King 287 271 263 -2.95% 2,458,695 2,452,296 2,572,416
143 Kelly 243 227 223 -1.76% 1,885,872 2,097,729 2,140,679
144 King 783 716 611 -14.66% 4,352,665 4,240,114 4,040,268
146 Lamar 417 397 359 -9.57% 2,857,490 2,782,438 3,019,775
147 Bowden 496 497 490 -1.41% 3,124,614 3,318,702 3,763,317
148 Madison 488 467 450 -3.64% 2,699,556 2,711,319 2,898,629
149 Margil 633 551 418 -24.14% 4,036,861 3,368,117 2,903,449
150 Maverick 555 514 492 -4.28% 3,018,527 3,142,302 3,180,998
153 Miller 250 306 262 -14.38% 1,948,526 2,259,884 2,139,605
155 Neal 508 529 492 -6.99% 2,718,420 2,833,535 2,869,019
* Head Start Campus
131

ENROLLMENT AND BUDGET MULTI-YEAR COMPARISONSGENERAL FUND BUDGET
2019-20 2020-21 2021-22 This Year's
Org. Projected Projected Projected Membership 2019-20 2020-21 2021-22
No. Campus Name Membership Membership Membership Change Budget Budget Budget
157 Ogden 730 665 388 -41.65% 4,197,293$ 3,943,531$ 3,063,037$
158 Pershing 463 453 400 -11.70% 2,763,376 2,845,908 2,850,369
160 Riverside Park 452 465 306 -34.19% 2,821,068 3,149,318 2,346,369
161 Rogers 691 676 675 -0.15% 3,859,278 3,860,914 4,120,616
162 Barkley/Ruiz 507 467 333 -28.69% 2,981,892 3,081,639 2,558,493
163 Twain Dual Language Academy 466 572 604 5.59% 2,884,863 3,130,582 3,899,815
164 Schenck 591 621 613 -1.29% 3,229,382 3,371,198 3,984,340
165 Smith 331 321 267 -16.82% 2,216,470 2,201,051 2,057,766
166 Steele Montessori Academy 198 269 332 23.42% 1,960,436 2,166,467 2,360,838
168 Stewart 374 464 527 13.58% 278,413 248,689 5,085,689
169 Storm 322 341 271 -20.53% 2,607,756 2,258,878 2,265,091
172 Washington 355 354 329 -7.06% 2,077,353 2,487,868 2,439,998
174 Wilson 417 410 425 3.66% 2,619,131 2,414,722 2,678,338
175 Woodlawn 575 585 580 -0.85% 3,434,724 3,620,529 4,267,770
176 Woodlawn Hills 451 461 418 -9.33% 2,431,173 2,815,786 2,872,941
177 Young Men's 395 427 468 9.60% 2,899,014 3,246,942 3,916,636
179 Hawthorne 720 719 641 -10.85% 4,058,237 4,170,043 4,246,128
210 Mission Academy 541 531 494 -6.97% 3,345,732 3,410,871 3,634,255
Subtotal 27,164 27,385 24,670 -9.91% 164,164,570$ 170,231,574$ 175,244,897$
Alternative Elementary/Satellite Schools
180 Gonzales 9 3 1 -66.67% 296,432$ 308,446$ 309,344$
182 Healy Murphy 174 133 132 -0.75% 578,569 557,176 558,834
184 Christus Santa Rosa 3 1 2 100.00% 96,080 99,334 99,582
195 Juvenile Detention Ctr 90 97 112 15.46% 1,183,292 1,184,618 1,187,666
201 Children's Shelter 29 14 0 -100.00% 121,144 126,772 -
202 Healy Murphy Pre-K 36 34 34 0.00% 124,106 130,352 130,215
Subtotal 341 282 281 -0.35% 2,399,623$ 2,406,698$ 2,285,641$
Early Childhood Centers
* 240 Carroll Early Childhood 531 495 516 4.24% 2,306,302$ 2,379,159$ 2,833,928$
* 241 Carvajal Early Childhood 527 512 480 -6.25% 2,712,481 2,617,293 2,850,430
* 242 Knox Early Childhood 281 269 267 -0.74% 1,012,920 1,065,676 1,085,421
* 244 Tynan Early Childhood 241 240 240 0.00% 994,023 1,091,763 1,192,371
* 245 Nelson Early Childhood 211 236 219 -7.20% 816,552 950,975 968,424
* 246 Gonzalez Early Childhood 113 149 145 -2.68% 807,011 939,528 1,050,468
Subtotal 1,904 1,901 1,867 -1.79% 8,649,289$ 9,044,394$ 9,981,042$
Total for Schools 48,896 48,920 46,735 -4.47% 306,865,547$ 316,572,512$ 328,745,290$
Elementary Schools
* Head Start Campus
132

COMPARISON OF EXPENDITURES AND BUDGETS BY CAMPUS
2019-20 2020-21 % Change
Campus Actual Actual 2019-20 2020-21 2021-22 From 20-21
No. Campus Name Expn Expn Budget Budget Budget Budget
001 Brackenridge HS 10,637,904$ 11,156,061$ 10,206,586$ 10,305,771$ 10,386,094$ 0.78%
002 Burbank HS 10,134,027 10,471,110 8,564,878 8,755,520 10,045,456 14.73%
003 Edison HS 9,988,993 10,271,781 9,554,892 9,768,005 9,847,949 0.82%
004 Tech HS 3,553,698 3,926,856 2,975,143 3,243,313 4,034,458 24.39%
005 Highlands HS 10,119,613 11,208,458 9,862,346 10,251,506 10,658,232 3.97%
006 Houston HS 8,289,187 7,744,798 7,807,073 7,627,338 7,374,512 -3.31%
007 Jefferson HS 11,694,706 12,426,882 10,286,063 10,556,238 11,584,074 9.74%
008 Lanier HS 10,541,288 10,638,575 10,278,053 10,090,832 10,188,857 0.97%
022 Travis Early College 2,626,085 2,761,509 1,978,591 2,181,433 2,805,715 28.62%
025 St. Philips Early College 2,235,749 2,257,675 1,710,017 1,970,125 2,464,453 25.09%
026 Advanced Learning 7,393,115 7,373,472 5,391,580 5,609,281 6,770,878 20.71%
027 CAST Tech 2,945,245 3,407,039 2,007,328 2,609,886 3,093,810 18.54%
028 CAST Med 1,660,704 2,066,824 969,277 1,594,626 2,333,149 46.31%
Subtotal 91,820,311$ 95,711,039$ 81,591,827$ 84,563,874$ 91,587,637$ 8.31%
010 Estrada AC 2,415,311$ 2,350,742$ 2,392,382$ 2,422,286$ 2,438,397$ 0.67%
020 Juv Justice Alt Ed Prog 9,238 - - 50,000 50,000 0.00%
024 Cooper Academy 2,829,099 2,820,156 2,660,522 2,755,298 2,754,145 -0.04%
Subtotal 5,253,648$ 5,170,898$ 5,052,904$ 5,227,584$ 5,242,542$ 0.29%
023 Young Women's 3,747,210$ 4,288,902$ 3,013,688$ 3,312,462$ 4,576,176$ 38.15%
043 Davis MS 4,352,691 4,462,780 4,583,785 4,536,646 4,448,038 -1.95%
044 Hot Wells MS - 56,740 - - 3,191,734 0.00%
047 Harris MS 5,458,381 5,806,603 4,512,638 4,809,540 5,693,918 18.39%
050 Longfellow MS 6,101,128 6,419,340 5,656,685 5,675,060 6,067,213 6.91%
051 Lowell MS 2,828,138 3,002,671 2,968,221 2,845,210 2,931,753 3.04%
054 Poe MS 2,887,678 2,761,514 2,633,089 2,662,862 3,519,669 32.18%
055 Rhodes MS 3,879,470 4,112,664 4,105,292 3,926,020 3,854,306 -1.83%
057 Rogers MS 3,311,897 3,256,658 3,293,380 3,198,583 3,200,434 0.06%
059 Whittier MS 4,319,499 4,980,582 4,292,321 4,508,151 4,769,209 5.79%
061 Tafolla MS 3,497,609 3,949,632 3,350,767 3,671,053 672,179 -81.69%
Subtotal 40,383,699$ 43,098,085$ 38,409,866$ 39,145,587$ 42,924,629$ 9.65%
064 Pickett Center 1,775,130$ 1,349,642$ 2,013,683$ 1,416,155$ 1,478,902$ 4.43%
Subtotal 1,775,130$ 1,349,642$ 2,013,683$ 1,416,155$ 1,478,902$ 4.43%
GENERAL FUND
High Schools
Alternative High Schools
Middle Schools
Alternative Middle Schools
* Head Start Campus
133
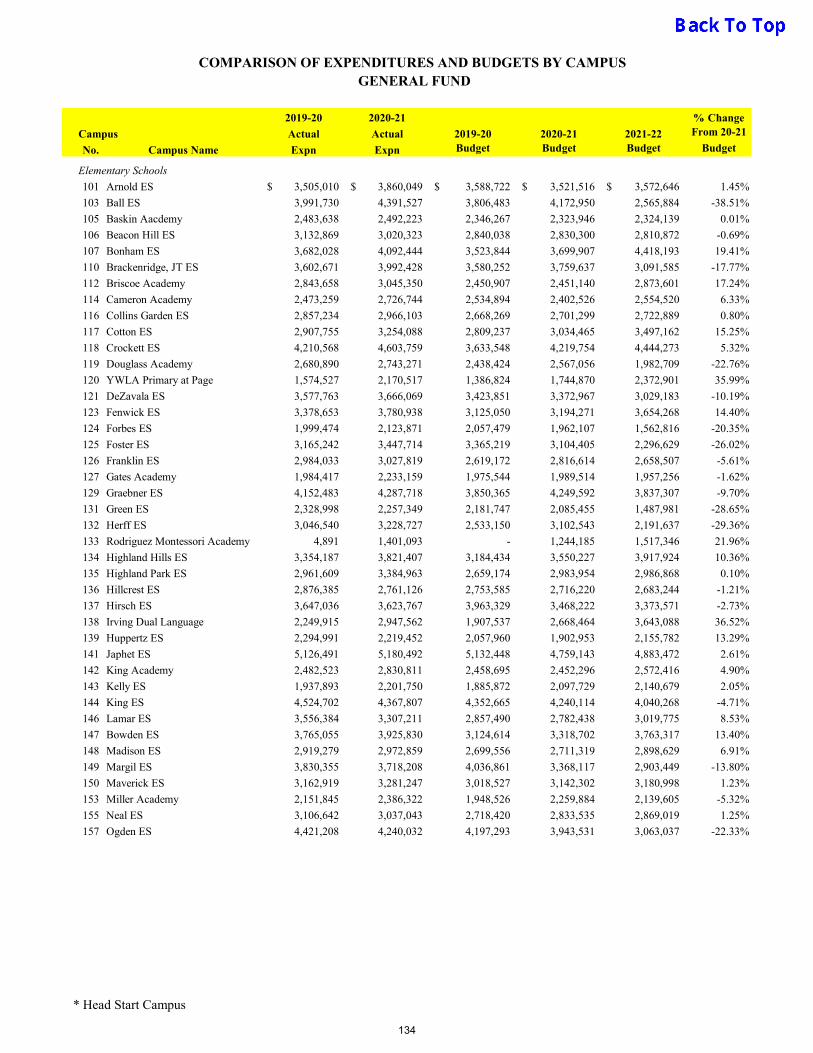
COMPARISON OF EXPENDITURES AND BUDGETS BY CAMPUS
2019-20 2020-21 % Change
Campus Actual Actual 2019-20 2020-21 2021-22 From 20-21
No. Campus Name Expn Expn Budget Budget Budget Budget
GENERAL FUND
101 Arnold ES 3,505,010$ 3,860,049$ 3,588,722$ 3,521,516$ 3,572,646$ 1.45%
103 Ball ES 3,991,730 4,391,527 3,806,483 4,172,950 2,565,884 -38.51%
105 Baskin Aacdemy 2,483,638 2,492,223 2,346,267 2,323,946 2,324,139 0.01%
106 Beacon Hill ES 3,132,869 3,020,323 2,840,038 2,830,300 2,810,872 -0.69%
107 Bonham ES 3,682,028 4,092,444 3,523,844 3,699,907 4,418,193 19.41%
110 Brackenridge, JT ES 3,602,671 3,992,428 3,580,252 3,759,637 3,091,585 -17.77%
112 Briscoe Academy 2,843,658 3,045,350 2,450,907 2,451,140 2,873,601 17.24%
114 Cameron Academy 2,473,259 2,726,744 2,534,894 2,402,526 2,554,520 6.33%
116 Collins Garden ES 2,857,234 2,966,103 2,668,269 2,701,299 2,722,889 0.80%
117 Cotton ES 2,907,755 3,254,088 2,809,237 3,034,465 3,497,162 15.25%
118 Crockett ES 4,210,568 4,603,759 3,633,548 4,219,754 4,444,273 5.32%
119 Douglass Academy 2,680,890 2,743,271 2,438,424 2,567,056 1,982,709 -22.76%
120 YWLA Primary at Page 1,574,527 2,170,517 1,386,824 1,744,870 2,372,901 35.99%
121 DeZavala ES 3,577,763 3,666,069 3,423,851 3,372,967 3,029,183 -10.19%
123 Fenwick ES 3,378,653 3,780,938 3,125,050 3,194,271 3,654,268 14.40%
124 Forbes ES 1,999,474 2,123,871 2,057,479 1,962,107 1,562,816 -20.35%
125 Foster ES 3,165,242 3,447,714 3,365,219 3,104,405 2,296,629 -26.02%
126 Franklin ES 2,984,033 3,027,819 2,619,172 2,816,614 2,658,507 -5.61%
127 Gates Academy 1,984,417 2,233,159 1,975,544 1,989,514 1,957,256 -1.62%
129 Graebner ES 4,152,483 4,287,718 3,850,365 4,249,592 3,837,307 -9.70%
131 Green ES 2,328,998 2,257,349 2,181,747 2,085,455 1,487,981 -28.65%
132 Herff ES 3,046,540 3,228,727 2,533,150 3,102,543 2,191,637 -29.36%
133 Rodriguez Montessori Academy 4,891 1,401,093 - 1,244,185 1,517,346 21.96%
134 Highland Hills ES 3,354,187 3,821,407 3,184,434 3,550,227 3,917,924 10.36%
135 Highland Park ES 2,961,609 3,384,963 2,659,174 2,983,954 2,986,868 0.10%
136 Hillcrest ES 2,876,385 2,761,126 2,753,585 2,716,220 2,683,244 -1.21%
137 Hirsch ES 3,647,036 3,623,767 3,963,329 3,468,222 3,373,571 -2.73%
138 Irving Dual Language 2,249,915 2,947,562 1,907,537 2,668,464 3,643,088 36.52%
139 Huppertz ES 2,294,991 2,219,452 2,057,960 1,902,953 2,155,782 13.29%
141 Japhet ES 5,126,491 5,180,492 5,132,448 4,759,143 4,883,472 2.61%
142 King Academy 2,482,523 2,830,811 2,458,695 2,452,296 2,572,416 4.90%
143 Kelly ES 1,937,893 2,201,750 1,885,872 2,097,729 2,140,679 2.05%
144 King ES 4,524,702 4,367,807 4,352,665 4,240,114 4,040,268 -4.71%
146 Lamar ES 3,556,384 3,307,211 2,857,490 2,782,438 3,019,775 8.53%
147 Bowden ES 3,765,055 3,925,830 3,124,614 3,318,702 3,763,317 13.40%
148 Madison ES 2,919,279 2,972,859 2,699,556 2,711,319 2,898,629 6.91%
149 Margil ES 3,830,355 3,718,208 4,036,861 3,368,117 2,903,449 -13.80%
150 Maverick ES 3,162,919 3,281,247 3,018,527 3,142,302 3,180,998 1.23%
153 Miller Academy 2,151,845 2,386,322 1,948,526 2,259,884 2,139,605 -5.32%
155 Neal ES 3,106,642 3,037,043 2,718,420 2,833,535 2,869,019 1.25%
157 Ogden ES 4,421,208 4,240,032 4,197,293 3,943,531 3,063,037 -22.33%
Elementary Schools
* Head Start Campus
134
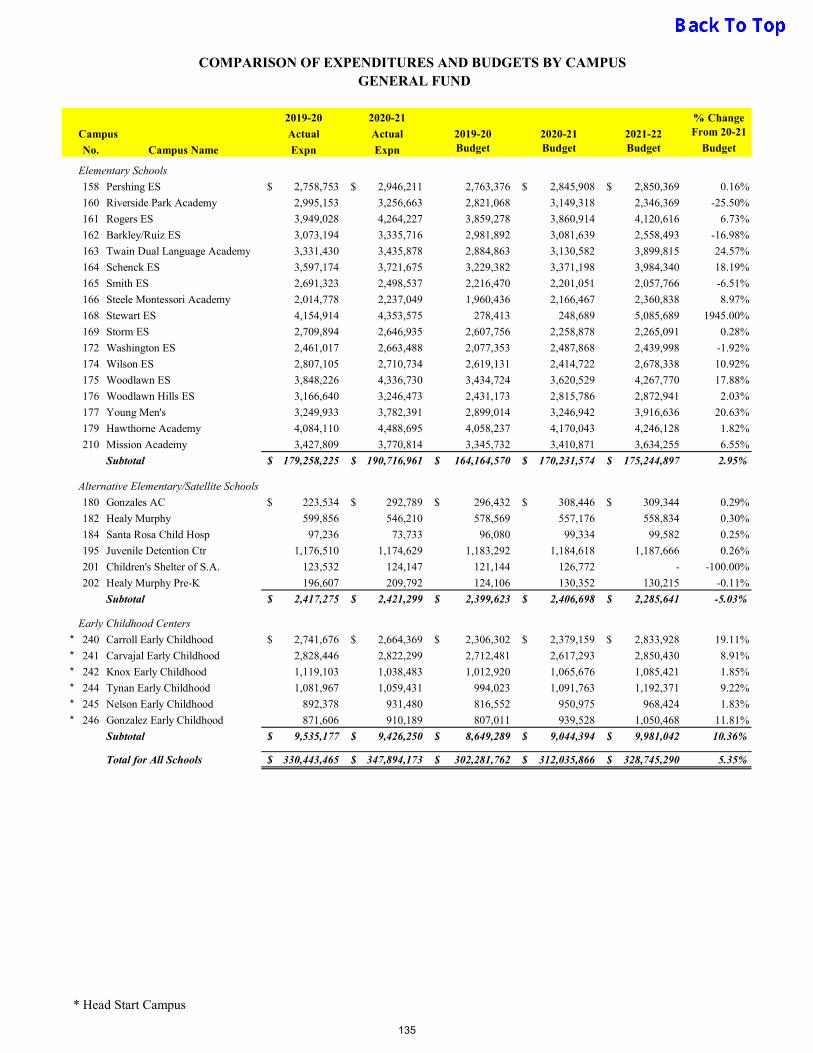
COMPARISON OF EXPENDITURES AND BUDGETS BY CAMPUS
2019-20 2020-21 % Change
Campus Actual Actual 2019-20 2020-21 2021-22 From 20-21
No. Campus Name Expn Expn Budget Budget Budget Budget
GENERAL FUND
158 Pershing ES 2,758,753$ 2,946,211$ 2,763,376 2,845,908$ 2,850,369$ 0.16%
160 Riverside Park Academy 2,995,153 3,256,663 2,821,068 3,149,318 2,346,369 -25.50%
161 Rogers ES 3,949,028 4,264,227 3,859,278 3,860,914 4,120,616 6.73%
162 Barkley/Ruiz ES 3,073,194 3,335,716 2,981,892 3,081,639 2,558,493 -16.98%
163 Twain Dual Language Academy 3,331,430 3,435,878 2,884,863 3,130,582 3,899,815 24.57%
164 Schenck ES 3,597,174 3,721,675 3,229,382 3,371,198 3,984,340 18.19%
165 Smith ES 2,691,323 2,498,537 2,216,470 2,201,051 2,057,766 -6.51%
166 Steele Montessori Academy 2,014,778 2,237,049 1,960,436 2,166,467 2,360,838 8.97%
168 Stewart ES 4,154,914 4,353,575 278,413 248,689 5,085,689 1945.00%
169 Storm ES 2,709,894 2,646,935 2,607,756 2,258,878 2,265,091 0.28%
172 Washington ES 2,461,017 2,663,488 2,077,353 2,487,868 2,439,998 -1.92%
174 Wilson ES 2,807,105 2,710,734 2,619,131 2,414,722 2,678,338 10.92%
175 Woodlawn ES 3,848,226 4,336,730 3,434,724 3,620,529 4,267,770 17.88%
176 Woodlawn Hills ES 3,166,640 3,246,473 2,431,173 2,815,786 2,872,941 2.03%
177 Young Men's 3,249,933 3,782,391 2,899,014 3,246,942 3,916,636 20.63%
179 Hawthorne Academy 4,084,110 4,488,695 4,058,237 4,170,043 4,246,128 1.82%
210 Mission Academy 3,427,809 3,770,814 3,345,732 3,410,871 3,634,255 6.55%
Subtotal 179,258,225$ 190,716,961$ 164,164,570$ 170,231,574$ 175,244,897$ 2.95%
180 Gonzales AC 223,534$ 292,789$ 296,432$ 308,446$ 309,344$ 0.29%
182 Healy Murphy 599,856 546,210 578,569 557,176 558,834 0.30%
184 Santa Rosa Child Hosp 97,236 73,733 96,080 99,334 99,582 0.25%
195 Juvenile Detention Ctr 1,176,510 1,174,629 1,183,292 1,184,618 1,187,666 0.26%
201 Children's Shelter of S.A. 123,532 124,147 121,144 126,772 - -100.00%
202 Healy Murphy Pre-K 196,607 209,792 124,106 130,352 130,215 -0.11%
Subtotal 2,417,275$ 2,421,299$ 2,399,623$ 2,406,698$ 2,285,641$ -5.03%
* 240 Carroll Early Childhood 2,741,676$ 2,664,369$ 2,306,302$ 2,379,159$ 2,833,928$ 19.11%
* 241 Carvajal Early Childhood 2,828,446 2,822,299 2,712,481 2,617,293 2,850,430 8.91%
* 242 Knox Early Childhood 1,119,103 1,038,483 1,012,920 1,065,676 1,085,421 1.85%
* 244 Tynan Early Childhood 1,081,967 1,059,431 994,023 1,091,763 1,192,371 9.22%
* 245 Nelson Early Childhood 892,378 931,480 816,552 950,975 968,424 1.83%
* 246 Gonzalez Early Childhood 871,606 910,189 807,011 939,528 1,050,468 11.81%
Subtotal 9,535,177$ 9,426,250$ 8,649,289$ 9,044,394$ 9,981,042$ 10.36%
Total for All Schools 330,443,465$ 347,894,173$ 302,281,762$ 312,035,866$ 328,745,290$ 5.35%
Early Childhood Centers
Alternative Elementary/Satellite Schools
Elementary Schools
* Head Start Campus
135

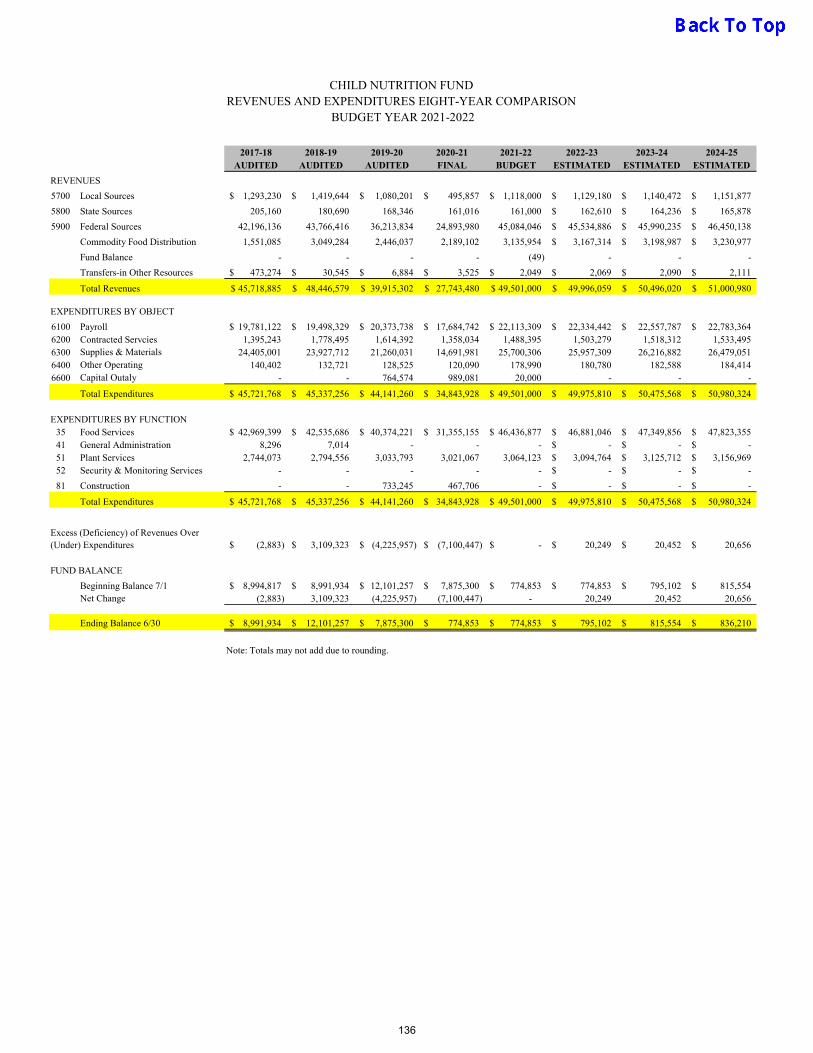
CHILD NUTRITION FUND REVENUES AND EXPENDITURES EIGHT-YEAR COMPARISON
BUDGET YEAR 2021-2022
2017-18 2018-19 2019-20 2020-21 2021-22 2022-23 2023-24 2024-25AUDITED AUDITED AUDITED FINAL BUDGET ESTIMATED ESTIMATED ESTIMATED
REVENUES
5700 Local Sources 1,293,230$ 1,419,644$ 1,080,201$ 495,857$ 1,118,000$ 1,129,180$ 1,140,472$ 1,151,877$
5800 State Sources 205,160 180,690 168,346 161,016 161,000 162,610$ 164,236$ 165,878$
5900 Federal Sources 42,196,136 43,766,416 36,213,834 24,893,980 45,084,046 45,534,886$ 45,990,235$ 46,450,138$
Commodity Food Distribution 1,551,085 3,049,284 2,446,037 2,189,102 3,135,954 3,167,314$ 3,198,987$ 3,230,977$
Fund Balance - - - - (49) - - -
Transfers-in Other Resources 473,274$ 30,545$ 6,884$ 3,525$ 2,049$ 2,069$ 2,090$ 2,111$
Total Revenues 45,718,885$ 48,446,579$ 39,915,302$ 27,743,480$ 49,501,000$ 49,996,059$ 50,496,020$ 51,000,980$
EXPENDITURES BY OBJECT
6100 Payroll 19,781,122$ 19,498,329$ 20,373,738$ 17,684,742$ 22,113,309$ 22,334,442$ 22,557,787$ 22,783,364$ 6200 Contracted Servcies 1,395,243 1,778,495 1,614,392 1,358,034 1,488,395 1,503,279 1,518,312 1,533,495 6300 Supplies & Materials 24,405,001 23,927,712 21,260,031 14,691,981 25,700,306 25,957,309 26,216,882 26,479,051 6400 Other Operating 140,402 132,721 128,525 120,090 178,990 180,780 182,588 184,414 6600 Capital Outaly - - 764,574 989,081 20,000 - - -
Total Expenditures 45,721,768$ 45,337,256$ 44,141,260$ 34,843,928$ 49,501,000$ 49,975,810$ 50,475,568$ 50,980,324$
EXPENDITURES BY FUNCTION35 Food Services 42,969,399$ 42,535,686$ 40,374,221$ 31,355,155$ 46,436,877$ 46,881,046$ 47,349,856$ 47,823,355$ 41 General Administration 8,296 7,014 - - - -$ -$ -$ 51 Plant Services 2,744,073 2,794,556 3,033,793 3,021,067 3,064,123 3,094,764$ 3,125,712$ 3,156,969$ 52 Security & Monitoring Services - - - - - -$ -$ -$
81 Construction - - 733,245 467,706 - -$ -$ -$
Total Expenditures 45,721,768$ 45,337,256$ 44,141,260$ 34,843,928$ 49,501,000$ 49,975,810$ 50,475,568$ 50,980,324$
(2,883)$ 3,109,323$ (4,225,957)$ (7,100,447)$ -$ 20,249$ 20,452$ 20,656$
FUND BALANCE
Beginning Balance 7/1 8,994,817$ 8,991,934$ 12,101,257$ 7,875,300$ 774,853$ 774,853$ 795,102$ 815,554$ Net Change (2,883) 3,109,323 (4,225,957) (7,100,447) - 20,249 20,452 20,656
Ending Balance 6/30 8,991,934$ 12,101,257$ 7,875,300$ 774,853$ 774,853$ 795,102$ 815,554$ 836,210$
Note: Totals may not add due to rounding.
Excess (Deficiency) of Revenues Over (Under) Expenditures
136

CHILD NUTRITION SERVICES OVERVIEW MISSION STATEMENT
The mission of the Financial Services and Business Operations Division is to support campus and department operations by effectively and efficiently managing resources and providing resource management systems.
The mission of the San Antonio Independent School District Child Nutrition Services is to enhance the learning and health of children by nourishing their bodies and minds through healthy, nutritious meals. By maintaining a standard of excellence, it enables Child Nutrition Services to provide support services to each campus in a way that helps schools to improve student academic performance, attendance, and behavior.
CHILD NUTRITION FUND OVERVIEW
The District’s Child Nutrition Fund is accounted for as a special revenue fund since school year 2008-2009. The Child Nutrition Fund is included in the annual budget adopted by the Board of Trustees as required by the Texas Education Agency regulations. SAISD Child Nutrition Services operates in accordance with Texas Department of Agriculture (TDA) and United States Department of Agriculture (USDA) guidelines.
Funding for SAISD Child Nutrition is based on the total reimbursable meals served. All students are offered a meal at no cost. As of school year 2014-2015 the Child Nutrition Department operates under the Community Eligibility Provision (CEP). CEP allows all students to eat breakfast and lunch free of charge. The federal reimbursement received is based on the number of students receiving meals. All meals served are claimed at the free rate. For the 2020-2021 school year the Child Nutrition department is serving breakfast and lunch meals utilizing the Seamless Summer Program (SSO) waiver. This option also allows students to eat breakfast and lunch free of charge but the meals are reimbursed at higher rate as compared to CEP.
In addition to serving School Nutrition Program (SNP) breakfast, lunch, and after school snacks, the SAISD Child Nutrition Department also serves the PM snack to all Head Start students and an after-school meal (supper). The department claims Head Start PM Snacks, the afterschool meal (supper), and the Cooper at Navarro Daycare meals through the Child and Adult Care Food Program also known as CACFP. The Child Nutrition Department also offers weekend meals as requested by campuses that meet certain program requirements. During the Covid 19 Pandemic, Child Nutrition serves an at-risk snack through CACFP in lieu of the after school snack through School Nutrition Program.
OVERVIEW OF 2020-2021 BUDGET
The Child Nutrition Services Department experienced a decrease in student breakfast and student lunch meals due to the Covid-19 pandemic. Due to remote learning, total lunch meals served decreased by (2,846,301) while total breakfast meals served decreased by (2,517,020). Increasing student participation is always an on-going goal for the Child Nutrition department. CHILD NUTRITION DEPARTMENT UPDATES Due to the pandemic, Child Nutrition Programs can continue to operate the Seamless Summer Program (SSO). SSO during the 2021-2022 school year. This program continues to offer meals to students free of charge and the district is reimbursed at an increased rate.
Effective for the 2014-2015 school year, the Child Nutrition program implemented the Community Eligibility Provision (CEP). CEP allows all students district wide to eat breakfast and lunch free of charge and the department receives free reimbursement for 100% of total meals served at CEP sites. All sites in SAISD are eligible for CEP. Child Nutrition has continued to track the CEP status to continue eligibility when post pandemic operations resume.
137
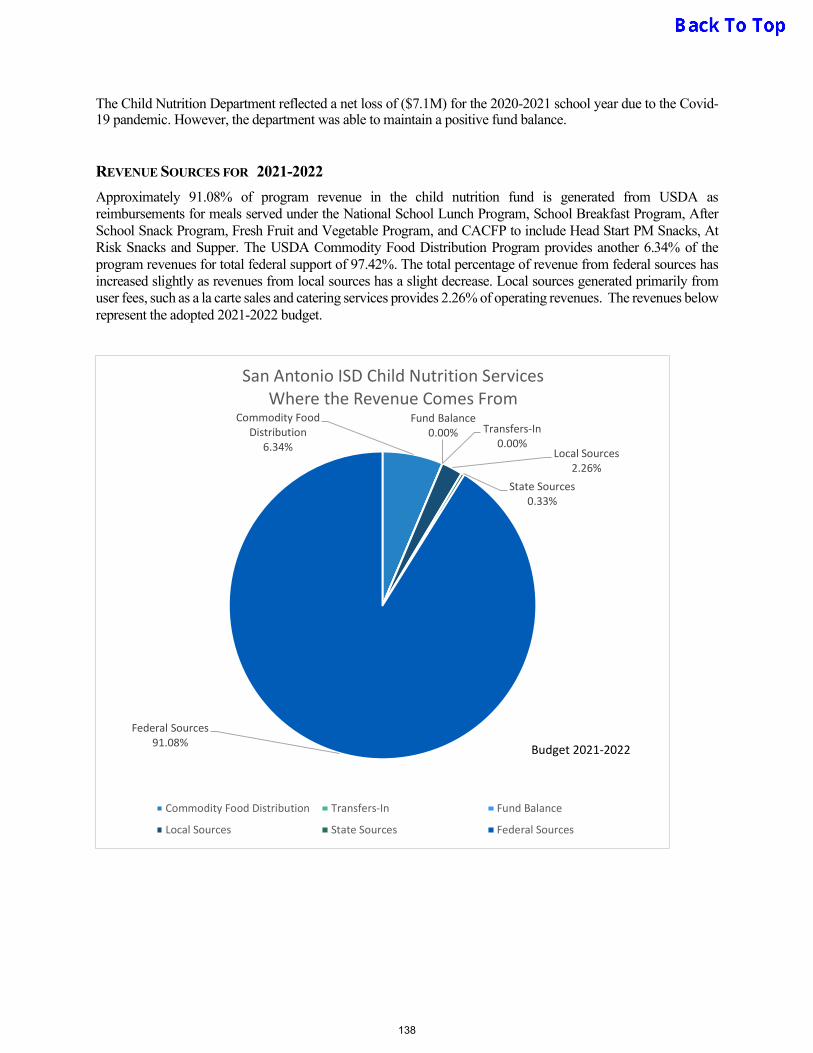
The Child Nutrition Department reflected a net loss of ($7.1M) for the 2020-2021 school year due to the Covid-19 pandemic. However, the department was able to maintain a positive fund balance.
REVENUE SOURCES FOR 2021-2022
Approximately 91.08% of program revenue in the child nutrition fund is generated from USDA as reimbursements for meals served under the National School Lunch Program, School Breakfast Program, After School Snack Program, Fresh Fruit and Vegetable Program, and CACFP to include Head Start PM Snacks, At Risk Snacks and Supper. The USDA Commodity Food Distribution Program provides another 6.34% of the program revenues for total federal support of 97.42%. The total percentage of revenue from federal sources has increased slightly as revenues from local sources has a slight decrease. Local sources generated primarily from user fees, such as a la carte sales and catering services provides 2.26% of operating revenues. The revenues below represent the adopted 2021-2022 budget.
Commodity Food Distribution
6.34%Transfers-In
0.00%
Fund Balance0.00%
Local Sources2.26%
State Sources0.33%
Federal Sources91.08%
San Antonio ISD Child Nutrition Services Where the Revenue Comes From
Commodity Food Distribution Transfers-In Fund Balance
Local Sources State Sources Federal Sources
Budget 2021-2022
138
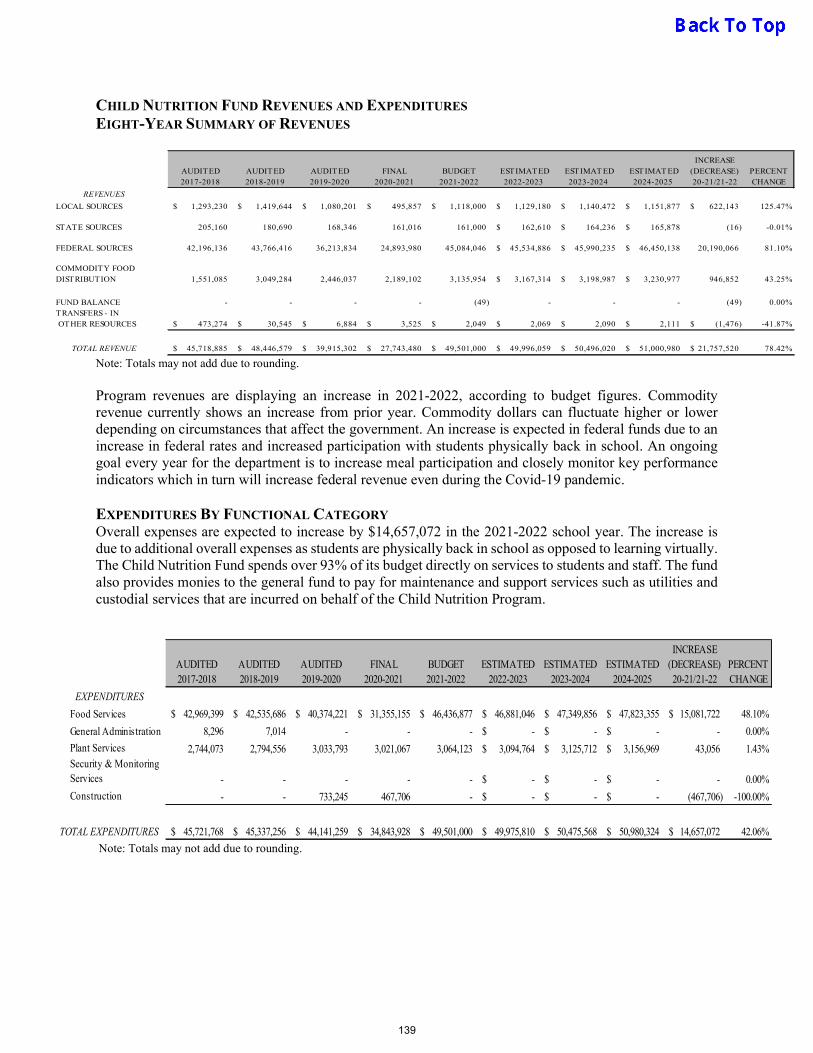
CHILD NUTRITION FUND REVENUES AND EXPENDITURES EIGHT-YEAR SUMMARY OF REVENUES
ESTIMATED 2022-2023
ESTIMAT ED 2023-2024
EST IMAT ED 2024-2025
LOCAL SOURCES 1,293,230$ 1,419,644$ 1,080,201$ 495,857$ 1,118,000$ 1,129,180$ 1,140,472$ 1,151,877$ 622,143$ 125.47%
STATE SOURCES 205,160 180,690 168,346 161,016 161,000 162,610$ 164,236$ 165,878$ (16) -0.01%
FEDERAL SOURCES 42,196,136 43,766,416 36,213,834 24,893,980 45,084,046 45,534,886$ 45,990,235$ 46,450,138$ 20,190,066 81.10%
COMMODITY FOOD DISTRIBUTION 1,551,085 3,049,284 2,446,037 2,189,102 3,135,954 3,167,314$ 3,198,987$ 3,230,977$ 946,852 43.25%
FUND BALANCE - - - - (49) - - - (49) 0.00%TRANSFERS - IN OTHER RESOURCES 473,274$ 30,545$ 6,884$ 3,525$ 2,049$ 2,069$ 2,090$ 2,111$ (1,476)$ -41.87%
45,718,885$ 48,446,579$ 39,915,302$ 27,743,480$ 49,501,000$ 49,996,059$ 50,496,020$ 51,000,980$ 21,757,520$ 78.42%
BUDGET 2021-2022
INCREASE (DECREASE) 20-21/21-22
PERCENT CHANGE
REVENUES
TOTAL REVENUE
AUDITED 2017-2018
AUDITED 2018-2019
AUDITED 2019-2020
FINAL 2020-2021
Note: Totals may not add due to rounding. Program revenues are displaying an increase in 2021-2022, according to budget figures. Commodity revenue currently shows an increase from prior year. Commodity dollars can fluctuate higher or lower depending on circumstances that affect the government. An increase is expected in federal funds due to an increase in federal rates and increased participation with students physically back in school. An ongoing goal every year for the department is to increase meal participation and closely monitor key performance indicators which in turn will increase federal revenue even during the Covid-19 pandemic. EXPENDITURES BY FUNCTIONAL CATEGORY Overall expenses are expected to increase by $14,657,072 in the 2021-2022 school year. The increase is due to additional overall expenses as students are physically back in school as opposed to learning virtually. The Child Nutrition Fund spends over 93% of its budget directly on services to students and staff. The fund also provides monies to the general fund to pay for maintenance and support services such as utilities and custodial services that are incurred on behalf of the Child Nutrition Program.
Food Services 42,969,399$ 42,535,686$ 40,374,221$ 31,355,155$ 46,436,877$ 46,881,046$ 47,349,856$ 47,823,355$ 15,081,722$ 48.10%
General Administration 8,296 7,014 - - - -$ -$ -$ - 0.00%
Plant Services 2,744,073 2,794,556 3,033,793 3,021,067 3,064,123 3,094,764$ 3,125,712$ 3,156,969$ 43,056 1.43%Security & Monitoring Services - - - - - -$ -$ -$ - 0.00%
Construction - - 733,245 467,706 - -$ -$ -$ (467,706) -100.00%
45,721,768$ 45,337,256$ 44,141,259$ 34,843,928$ 49,501,000$ 49,975,810$ 50,475,568$ 50,980,324$ 14,657,072$ 42.06%
PERCENT CHANGE
EXPENDITURES
TOTAL EXPENDITURES
AUDITED 2017-2018
AUDITED 2018-2019
AUDITED 2019-2020
FINAL 2020-2021
BUDGET 2021-2022
INCREASE (DECREASE) 20-21/21-22
ESTIMATED 2022-2023
ESTIMATED 2023-2024
ESTIMATED 2024-2025
Note: Totals may not add due to rounding.
139
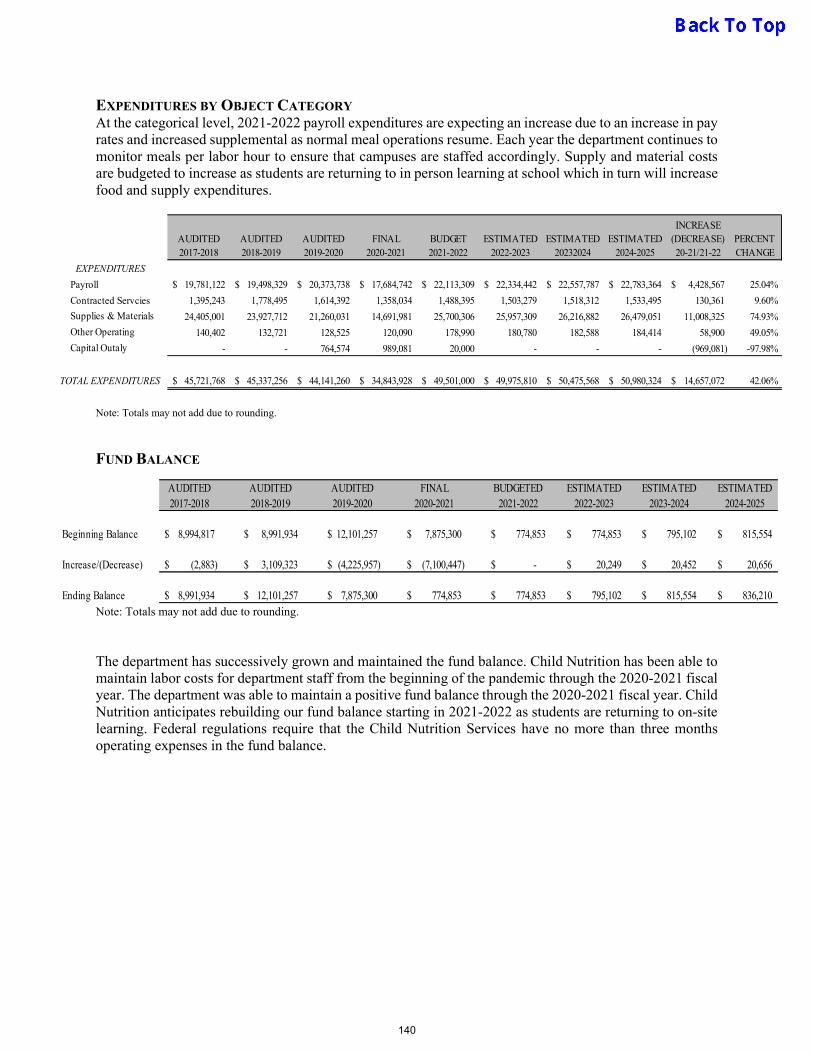
EXPENDITURES BY OBJECT CATEGORY At the categorical level, 2021-2022 payroll expenditures are expecting an increase due to an increase in pay rates and increased supplemental as normal meal operations resume. Each year the department continues to monitor meals per labor hour to ensure that campuses are staffed accordingly. Supply and material costs are budgeted to increase as students are returning to in person learning at school which in turn will increase food and supply expenditures.
Payroll 19,781,122$ 19,498,329$ 20,373,738$ 17,684,742$ 22,113,309$ 22,334,442$ 22,557,787$ 22,783,364$ 4,428,567$ 25.04%
Contracted Servcies 1,395,243 1,778,495 1,614,392 1,358,034 1,488,395 1,503,279 1,518,312 1,533,495 130,361 9.60%
Supplies & Materials 24,405,001 23,927,712 21,260,031 14,691,981 25,700,306 25,957,309 26,216,882 26,479,051 11,008,325 74.93%
Other Operating 140,402 132,721 128,525 120,090 178,990 180,780 182,588 184,414 58,900 49.05%
Capital Outaly - - 764,574 989,081 20,000 - - - (969,081) -97.98%
45,721,768$ 45,337,256$ 44,141,260$ 34,843,928$ 49,501,000$ 49,975,810$ 50,475,568$ 50,980,324$ 14,657,072$ 42.06%
PERCENT CHANGE
EXPENDITURES
TOTAL EXPENDITURES
AUDITED 2017-2018
AUDITED 2018-2019
AUDITED 2019-2020
FINAL 2020-2021
BUDGET 2021-2022
INCREASE (DECREASE) 20-21/21-22
ESTIMATED 2022-2023
ESTIMATED 20232024
ESTIMATED 2024-2025
Note: Totals may not add due to rounding.
FUND BALANCE
Beginning Balance 8,994,817$ 8,991,934$ 12,101,257$ 7,875,300$ 774,853$ 774,853$ 795,102$ 815,554$
Increase/(Decrease) (2,883)$ 3,109,323$ (4,225,957)$ (7,100,447)$ -$ 20,249$ 20,452$ 20,656$
Ending Balance 8,991,934$ 12,101,257$ 7,875,300$ 774,853$ 774,853$ 795,102$ 815,554$ 836,210$
ESTIMATED2022-2023
ESTIMATED2023-2024
ESTIMATED2024-2025
AUDITED2017-2018
AUDITED2018-2019
AUDITED2019-2020
FINAL2020-2021
BUDGETED2021-2022
Note: Totals may not add due to rounding.
The department has successively grown and maintained the fund balance. Child Nutrition has been able to maintain labor costs for department staff from the beginning of the pandemic through the 2020-2021 fiscal year. The department was able to maintain a positive fund balance through the 2020-2021 fiscal year. Child Nutrition anticipates rebuilding our fund balance starting in 2021-2022 as students are returning to on-site learning. Federal regulations require that the Child Nutrition Services have no more than three months operating expenses in the fund balance.
140

SCHOOL BREAKFAST PROGRAM
The Child Nutrition Services breakfast program operates under the United States Department of Agriculture guidelines as administered by the Texas Department of Agriculture. The USDA through the TDA reimburses the program for each reimbursable meal served in accordance with established rates. Due to the pandemic, Child Nutrition is utilizing the waiver which allows districts to operating under the NSLP SSO program for the 2021 -2022 school year. All students are allowed to eat free of charge and the rate of reimbursement is a higher rate than the standard breakfast reimbursement rate. For the 2021-2022 school year, reimbursable breakfast rates have increased by 8.96% from school year 2020-2021. Current and historical reimbursement rates for the School Breakfast Program are provided below.
School Year School Breakfast Paid Reduced Free
2021-2022 $ 0.00 $ 0.00 $ 2.4625
2020-2021 $ 0.32 $ 1.96 $ 2.26
2019-2020 $ 0.31 $ 1.90 $ 2.20
2018-2019 $ 0.31 $ 1.84 $ 2.14
2017-2018 $ 0.30 $ 1.79 $ 2.09 Includes Severe Need Allocation for districts with 40% or more economically disadvantaged.
141
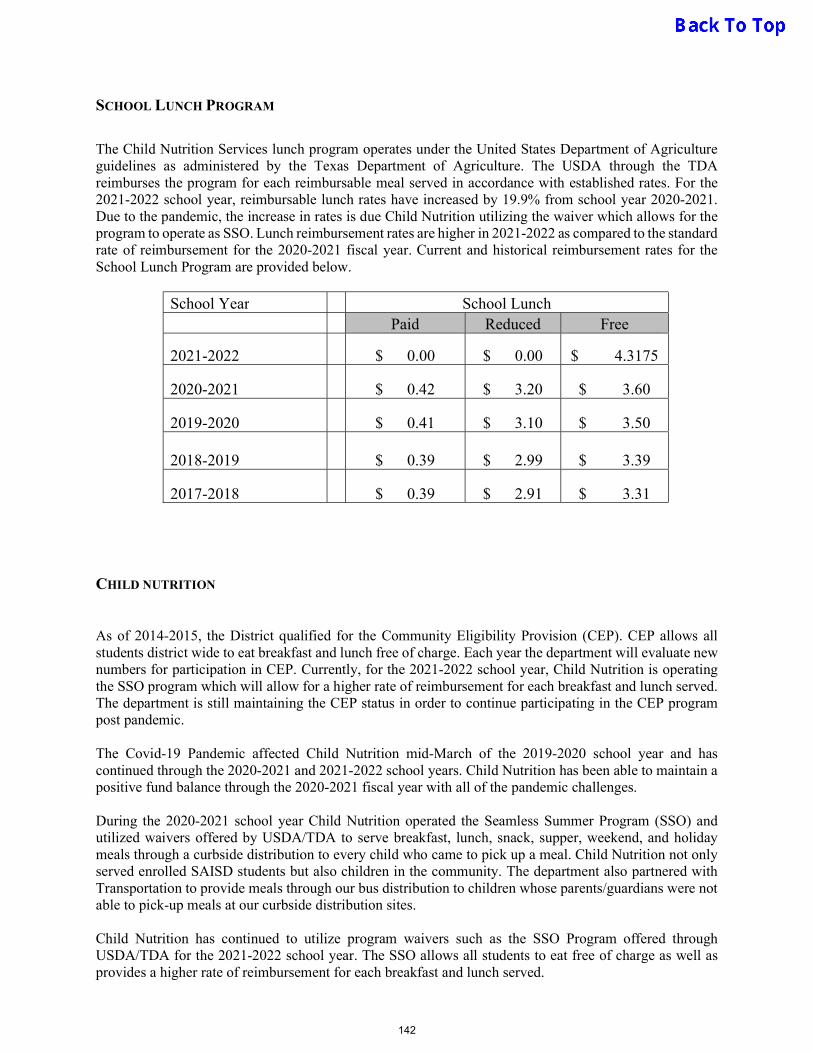
SCHOOL LUNCH PROGRAM
The Child Nutrition Services lunch program operates under the United States Department of Agriculture guidelines as administered by the Texas Department of Agriculture. The USDA through the TDA reimburses the program for each reimbursable meal served in accordance with established rates. For the 2021-2022 school year, reimbursable lunch rates have increased by 19.9% from school year 2020-2021. Due to the pandemic, the increase in rates is due Child Nutrition utilizing the waiver which allows for the program to operate as SSO. Lunch reimbursement rates are higher in 2021-2022 as compared to the standard rate of reimbursement for the 2020-2021 fiscal year. Current and historical reimbursement rates for the School Lunch Program are provided below.
School Year School Lunch Paid Reduced Free
2021-2022 $ 0.00 $ 0.00 $ 4.3175
2020-2021 $ 0.42 $ 3.20 $ 3.60
2019-2020 $ 0.41 $ 3.10 $ 3.50 2018-2019 $ 0.39 $ 2.99 $ 3.39
2017-2018 $ 0.39 $ 2.91 $ 3.31
CHILD NUTRITION
As of 2014-2015, the District qualified for the Community Eligibility Provision (CEP). CEP allows all students district wide to eat breakfast and lunch free of charge. Each year the department will evaluate new numbers for participation in CEP. Currently, for the 2021-2022 school year, Child Nutrition is operating the SSO program which will allow for a higher rate of reimbursement for each breakfast and lunch served. The department is still maintaining the CEP status in order to continue participating in the CEP program post pandemic. The Covid-19 Pandemic affected Child Nutrition mid-March of the 2019-2020 school year and has continued through the 2020-2021 and 2021-2022 school years. Child Nutrition has been able to maintain a positive fund balance through the 2020-2021 fiscal year with all of the pandemic challenges. During the 2020-2021 school year Child Nutrition operated the Seamless Summer Program (SSO) and utilized waivers offered by USDA/TDA to serve breakfast, lunch, snack, supper, weekend, and holiday meals through a curbside distribution to every child who came to pick up a meal. Child Nutrition not only served enrolled SAISD students but also children in the community. The department also partnered with Transportation to provide meals through our bus distribution to children whose parents/guardians were not able to pick-up meals at our curbside distribution sites. Child Nutrition has continued to utilize program waivers such as the SSO Program offered through USDA/TDA for the 2021-2022 school year. The SSO allows all students to eat free of charge as well as provides a higher rate of reimbursement for each breakfast and lunch served.
142
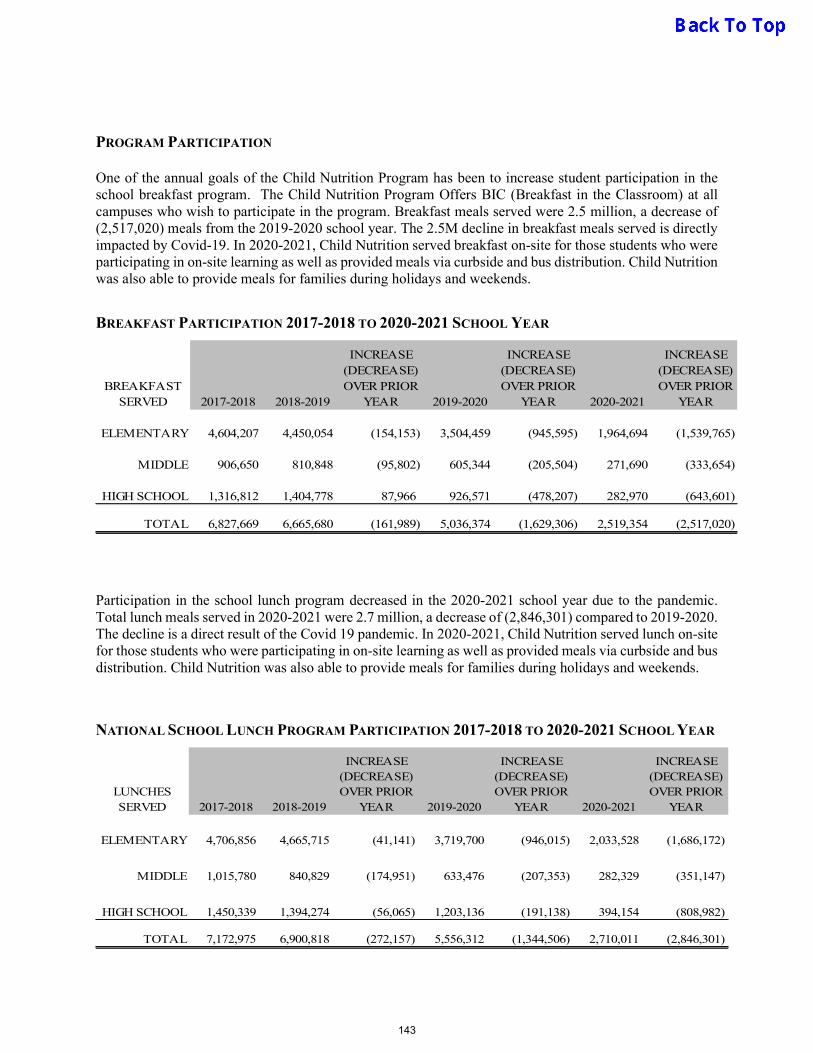
PROGRAM PARTICIPATION One of the annual goals of the Child Nutrition Program has been to increase student participation in the school breakfast program. The Child Nutrition Program Offers BIC (Breakfast in the Classroom) at all campuses who wish to participate in the program. Breakfast meals served were 2.5 million, a decrease of (2,517,020) meals from the 2019-2020 school year. The 2.5M decline in breakfast meals served is directly impacted by Covid-19. In 2020-2021, Child Nutrition served breakfast on-site for those students who were participating in on-site learning as well as provided meals via curbside and bus distribution. Child Nutrition was also able to provide meals for families during holidays and weekends.
BREAKFAST PARTICIPATION 2017-2018 TO 2020-2021 SCHOOL YEAR
BREAKFASTSERVED 2017-2018 2018-2019
INCREASE(DECREASE)OVER PRIOR
YEAR 2019-2020
INCREASE(DECREASE)OVER PRIOR
YEAR 2020-2021
INCREASE(DECREASE)OVER PRIOR
YEAR
ELEMENTARY 4,604,207 4,450,054 (154,153) 3,504,459 (945,595) 1,964,694 (1,539,765)
MIDDLE 906,650 810,848 (95,802) 605,344 (205,504) 271,690 (333,654)
HIGH SCHOOL 1,316,812 1,404,778 87,966 926,571 (478,207) 282,970 (643,601)
TOTAL 6,827,669 6,665,680 (161,989) 5,036,374 (1,629,306) 2,519,354 (2,517,020)
Participation in the school lunch program decreased in the 2020-2021 school year due to the pandemic. Total lunch meals served in 2020-2021 were 2.7 million, a decrease of (2,846,301) compared to 2019-2020. The decline is a direct result of the Covid 19 pandemic. In 2020-2021, Child Nutrition served lunch on-site for those students who were participating in on-site learning as well as provided meals via curbside and bus distribution. Child Nutrition was also able to provide meals for families during holidays and weekends.
NATIONAL SCHOOL LUNCH PROGRAM PARTICIPATION 2017-2018 TO 2020-2021 SCHOOL YEAR
LUNCHESSERVED 2017-2018 2018-2019
INCREASE(DECREASE)OVER PRIOR
YEAR 2019-2020
INCREASE(DECREASE)OVER PRIOR
YEAR 2020-2021
INCREASE(DECREASE)OVER PRIOR
YEAR
ELEMENTARY 4,706,856 4,665,715 (41,141) 3,719,700 (946,015) 2,033,528 (1,686,172)
MIDDLE 1,015,780 840,829 (174,951) 633,476 (207,353) 282,329 (351,147)
HIGH SCHOOL 1,450,339 1,394,274 (56,065) 1,203,136 (191,138) 394,154 (808,982)
TOTAL 7,172,975 6,900,818 (272,157) 5,556,312 (1,344,506) 2,710,011 (2,846,301)
143

DEPARTMENTAL GOALS FOR 2021-2022 The goal for the San Antonio ISD Child Nutrition Program for the 2021-2022 school year is to serve student meals and maintain safety practices due to the Covid-19 Pandemic. The Department is monitoring the overall meals served which directly affects the total revenue received. The department continues to monitor expenses and continuously adjusts controllable costs such as labor, food, supplies, and contracted services. Child Nutrition has continued to utilize the program waivers offered through USDA/TDA for the 2021-2022 school year to offer as many meals possible to our students as well as the community. Child Nutrition’s primary goal during the pandemic is to ensure students as well as children in our community receive meals they need during this difficult time.
144

This fund group accounts for state and federally funded programs where unused balances are returned to the grantors at the close of specified project periods. Project accounting is practiced to maintainintegrity for the various sources of funds. Specific funds included in the Special Revenue Fundcategory are described in more detail in a section referred to as the Glossary of Funds.
SPECIAL REVENUE FUND
145
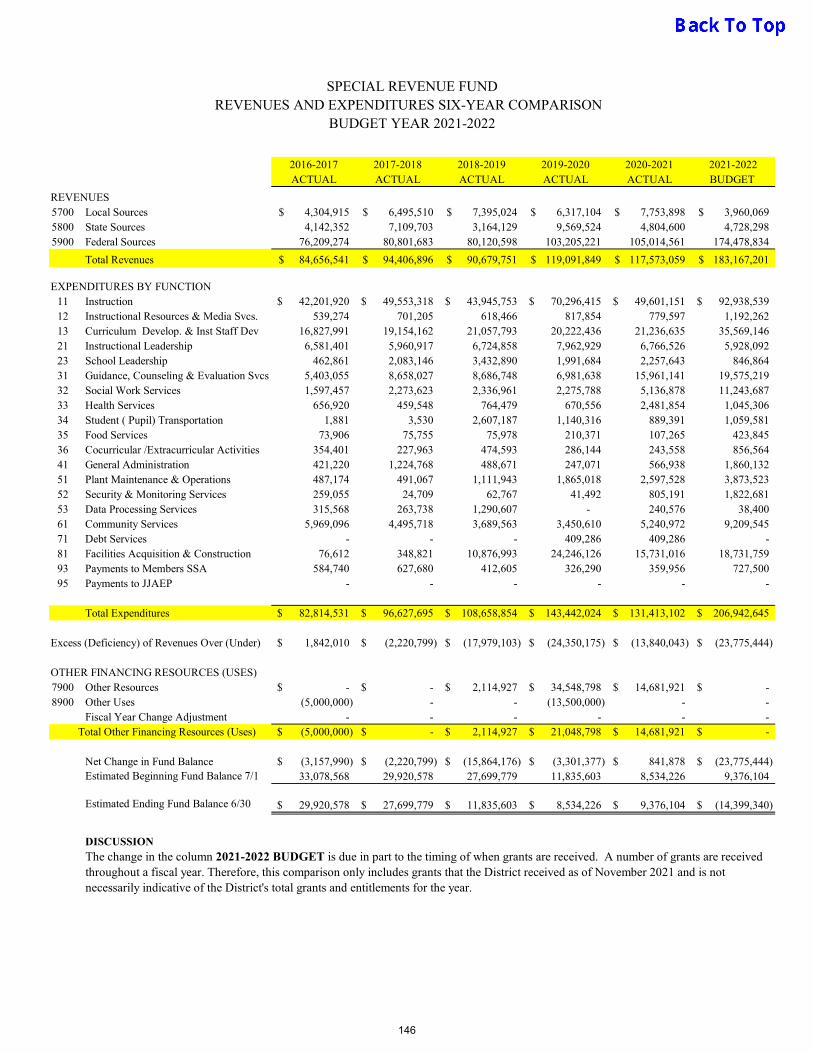
SPECIAL REVENUE FUNDREVENUES AND EXPENDITURES SIX-YEAR COMPARISON
BUDGET YEAR 2021-2022
2016-2017 2017-2018 2018-2019 2019-2020 2020-2021 2021-2022ACTUAL ACTUAL ACTUAL ACTUAL ACTUAL BUDGET
REVENUES5700 Local Sources 4,304,915$ 6,495,510$ 7,395,024$ 6,317,104$ 7,753,898$ 3,960,069$ 5800 State Sources 4,142,352 7,109,703 3,164,129 9,569,524 4,804,600 4,728,298 5900 Federal Sources 76,209,274 80,801,683 80,120,598 103,205,221 105,014,561 174,478,834
Total Revenues 84,656,541$ 94,406,896$ 90,679,751$ 119,091,849$ 117,573,059$ 183,167,201$
EXPENDITURES BY FUNCTION11 Instruction 42,201,920$ 49,553,318$ 43,945,753$ 70,296,415$ 49,601,151$ 92,938,539$ 12 Instructional Resources & Media Svcs. 539,274 701,205 618,466 817,854 779,597 1,192,262 13 Curriculum Develop. & Inst Staff Dev 16,827,991 19,154,162 21,057,793 20,222,436 21,236,635 35,569,146 21 Instructional Leadership 6,581,401 5,960,917 6,724,858 7,962,929 6,766,526 5,928,092 23 School Leadership 462,861 2,083,146 3,432,890 1,991,684 2,257,643 846,864 31 Guidance, Counseling & Evaluation Svcs 5,403,055 8,658,027 8,686,748 6,981,638 15,961,141 19,575,219 32 Social Work Services 1,597,457 2,273,623 2,336,961 2,275,788 5,136,878 11,243,687 33 Health Services 656,920 459,548 764,479 670,556 2,481,854 1,045,306 34 Student ( Pupil) Transportation 1,881 3,530 2,607,187 1,140,316 889,391 1,059,581 35 Food Services 73,906 75,755 75,978 210,371 107,265 423,845 36 Cocurricular /Extracurricular Activities 354,401 227,963 474,593 286,144 243,558 856,564 41 General Administration 421,220 1,224,768 488,671 247,071 566,938 1,860,132 51 Plant Maintenance & Operations 487,174 491,067 1,111,943 1,865,018 2,597,528 3,873,523 52 Security & Monitoring Services 259,055 24,709 62,767 41,492 805,191 1,822,681 53 Data Processing Services 315,568 263,738 1,290,607 - 240,576 38,400 61 Community Services 5,969,096 4,495,718 3,689,563 3,450,610 5,240,972 9,209,545 71 Debt Services - - - 409,286 409,286 - 81 Facilities Acquisition & Construction 76,612 348,821 10,876,993 24,246,126 15,731,016 18,731,759 93 Payments to Members SSA 584,740 627,680 412,605 326,290 359,956 727,500 95 Payments to JJAEP - - - - - -
Total Expenditures 82,814,531$ 96,627,695$ 108,658,854$ 143,442,024$ 131,413,102$ 206,942,645$
1,842,010$ (2,220,799)$ (17,979,103)$ (24,350,175)$ (13,840,043)$ (23,775,444)$
OTHER FINANCING RESOURCES (USES)7900 Other Resources -$ -$ 2,114,927$ 34,548,798$ 14,681,921$ -$ 8900 Other Uses (5,000,000) - - (13,500,000) - -
Fiscal Year Change Adjustment - - - - - - Total Other Financing Resources (Uses) (5,000,000)$ -$ 2,114,927$ 21,048,798$ 14,681,921$ -$
Net Change in Fund Balance (3,157,990)$ (2,220,799)$ (15,864,176)$ (3,301,377)$ 841,878$ (23,775,444)$ Estimated Beginning Fund Balance 7/1 33,078,568 29,920,578 27,699,779 11,835,603 8,534,226 9,376,104
Estimated Ending Fund Balance 6/30 29,920,578$ 27,699,779$ 11,835,603$ 8,534,226$ 9,376,104$ (14,399,340)$
DISCUSSION
Excess (Deficiency) of Revenues Over (Under)
The change in the column 2021-2022 BUDGET is due in part to the timing of when grants are received. A number of grants are received throughout a fiscal year. Therefore, this comparison only includes grants that the District received as of November 2021 and is not necessarily indicative of the District's total grants and entitlements for the year.
146

Special Revenue Fund
ORIGINAL* ESTIMATED BUDGET PERCENT REVENUE PERCENT
REVENUE TYPE 2020-2021 OF TOTAL 2021-2022 OF TOTAL**
ESTIMATED REVENUE
Local 3,177,062$ 3.32% 3,960,069$ 2.16% State 3,343,656 3.49% 4,728,298 2.58% Federal Revenue 89,315,341 93.20% 174,478,834 95.26%
TOTAL ESTIMATED REVENUE 95,836,059$ 100.00% 183,167,201$ 100.00%
ORIGINAL*BUDGET PERCENT BUDGET PERCENT
EXPENDITURE TYPE 2020-2021 OF TOTAL 2021-2022 OF TOTAL **
ESTIMATED EXPENDITURES
Payroll Costs 62,830,421$ 63.28% 138,771,057$ 73.64% Contracted Services 9,706,141 9.78% 18,490,876 9.81% Supplies and Materials 20,048,147 20.19% 19,113,638 10.14% Other Operating Costs 2,885,091 2.91% 9,342,689 4.96% Capital Outlay 3,817,745 3.85% 2,714,868 1.44%
TOTAL ESTIMATED EXPENDITURES 99,287,544$ 100.00% 188,433,128$ 100.00%
Other Oper and Capital Outlay 12,057,557
MAJOR SPECIAL REVENUE FUNDS INCLUDED:TITLE I, PART A FEDERAL CAREER AND TECHNOLOGY BASICTITLE II, PART A, TEACHER, PRINCIPAL IDEA-B FORMULA SPECIAL ED.
TRAINING AND RECRUITING IDEA-B PRESCHOOL SPECIAL ED.
** NOTE: Totals may vary due to rounding.
* The original budget is used for Special Revenue comparison because a number of grants are received during theschool year. Some grants are multi-year and the balances are carried forward from prior years. The SpecialRevenue fund decreases for 2021-2022 and is due in part to the timing of when grants are approved and does notnecessarily indicate a total change in grants and entitlements.
Estimated Revenues & Expenditures
147

Special Revenue Fund Chart
Estimated Expenditures
Payroll Costs $138,771,057
73.64%
Contracted Services $18,490,876
9.81% Other Operating Costs $19,113,638
10.14%
Debt Service $9,342,689
4.96%
Capital Outlay $2,714,868
1.44%
148
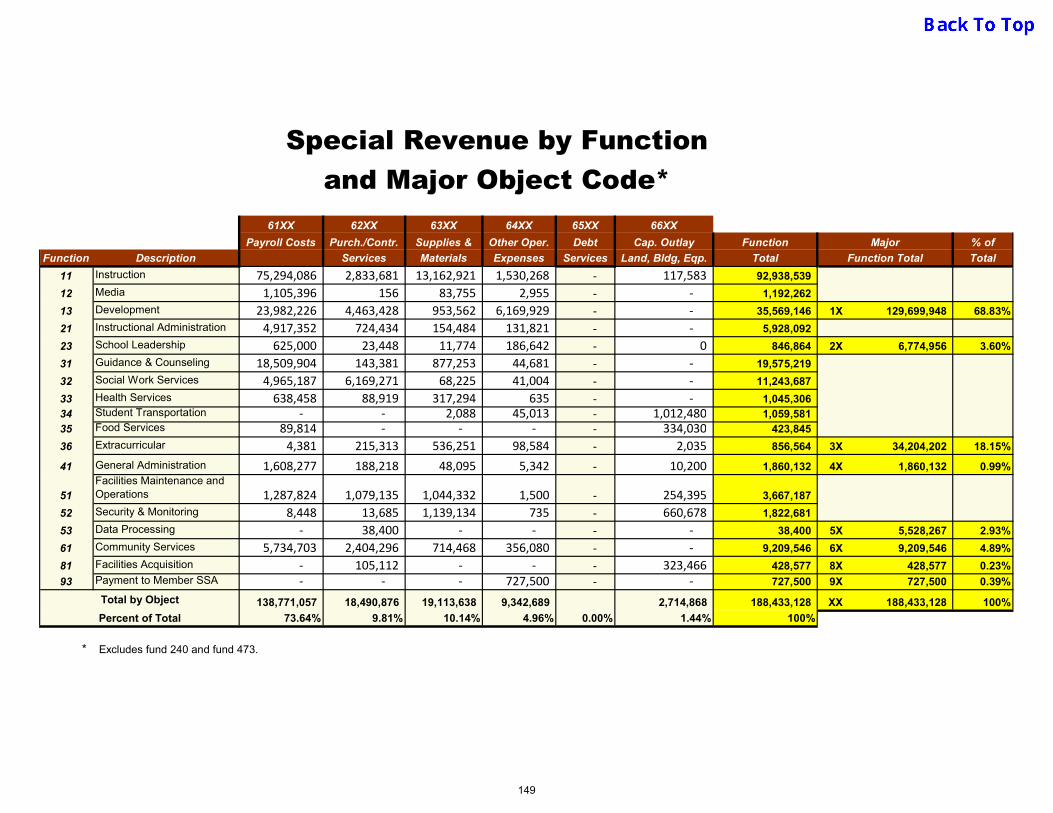
Special Revenue by Functionand Major Object Code*
61XX 62XX 63XX 64XX 65XX 66XX
Payroll Costs Purch./Contr. Supplies & Other Oper. Debt Cap. Outlay Function Major % of
Function Description Services Materials Expenses Services Land, Bldg, Eqp. Total Function Total Total
11 Instruction 75,294,086 2,833,681 13,162,921 1,530,268 - 117,583 92,938,539
12 Media 1,105,396 156 83,755 2,955 - - 1,192,262
13 Development 23,982,226 4,463,428 953,562 6,169,929 - - 35,569,146 1X 129,699,948 68.83%
21 Instructional Administration 4,917,352 724,434 154,484 131,821 - - 5,928,092
23 School Leadership 625,000 23,448 11,774 186,642 - 0 846,864 2X 6,774,956 3.60%
31 Guidance & Counseling 18,509,904 143,381 877,253 44,681 - - 19,575,219
32 Social Work Services 4,965,187 6,169,271 68,225 41,004 - - 11,243,687
33 Health Services 638,458 88,919 317,294 635 - - 1,045,306 34 Student Transportation - - 2,088 45,013 - 1,012,480 1,059,581 35 Food Services 89,814 - - - - 334,030 423,845
36 Extracurricular 4,381 215,313 536,251 98,584 - 2,035 856,564 3X 34,204,202 18.15%
41 General Administration 1,608,277 188,218 48,095 5,342 - 10,200 1,860,132 4X 1,860,132 0.99%
51Facilities Maintenance and Operations 1,287,824 1,079,135 1,044,332 1,500 - 254,395 3,667,187
52 Security & Monitoring 8,448 13,685 1,139,134 735 - 660,678 1,822,681
53 Data Processing - 38,400 - - - - 38,400 5X 5,528,267 2.93%
61 Community Services 5,734,703 2,404,296 714,468 356,080 - - 9,209,546 6X 9,209,546 4.89%
81 Facilities Acquisition - 105,112 - - - 323,466 428,577 8X 428,577 0.23%
93 Payment to Member SSA - - - 727,500 - - 727,500 9X 727,500 0.39%
138,771,057 18,490,876 19,113,638 9,342,689 2,714,868 188,433,128 XX 188,433,128 100%
73.64% 9.81% 10.14% 4.96% 0.00% 1.44% 100%
* Excludes fund 240 and fund 473.
Total by Object
Percent of Total
149
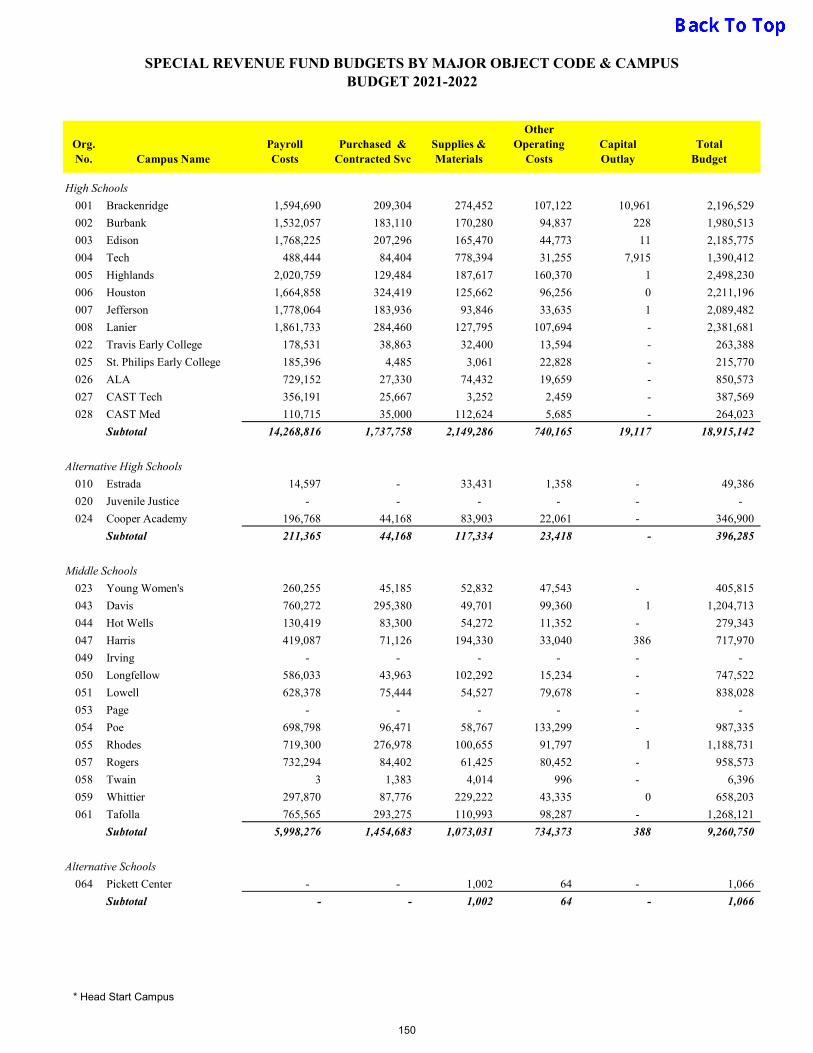
BUDGET 2021-2022
Org. No. Campus Name
Payroll Costs
Purchased &Contracted Svc
Supplies &Materials
Other Operating
CostsCapital Outlay
Total Budget
001 Brackenridge 1,594,690 209,304 274,452 107,122 10,961 2,196,529
002 Burbank 1,532,057 183,110 170,280 94,837 228 1,980,513
003 Edison 1,768,225 207,296 165,470 44,773 11 2,185,775
004 Tech 488,444 84,404 778,394 31,255 7,915 1,390,412
005 Highlands 2,020,759 129,484 187,617 160,370 1 2,498,230
006 Houston 1,664,858 324,419 125,662 96,256 0 2,211,196
007 Jefferson 1,778,064 183,936 93,846 33,635 1 2,089,482
008 Lanier 1,861,733 284,460 127,795 107,694 - 2,381,681
022 Travis Early College 178,531 38,863 32,400 13,594 - 263,388
025 St. Philips Early College 185,396 4,485 3,061 22,828 - 215,770
026 ALA 729,152 27,330 74,432 19,659 - 850,573
027 CAST Tech 356,191 25,667 3,252 2,459 - 387,569
028 CAST Med 110,715 35,000 112,624 5,685 - 264,023
Subtotal 14,268,816 1,737,758 2,149,286 740,165 19,117 18,915,142
010 Estrada 14,597 - 33,431 1,358 - 49,386
020 Juvenile Justice - - - - - -
024 Cooper Academy 196,768 44,168 83,903 22,061 - 346,900
Subtotal 211,365 44,168 117,334 23,418 - 396,285
023 Young Women's 260,255 45,185 52,832 47,543 - 405,815
043 Davis 760,272 295,380 49,701 99,360 1 1,204,713
044 Hot Wells 130,419 83,300 54,272 11,352 - 279,343
047 Harris 419,087 71,126 194,330 33,040 386 717,970
049 Irving - - - - - -
050 Longfellow 586,033 43,963 102,292 15,234 - 747,522
051 Lowell 628,378 75,444 54,527 79,678 - 838,028
053 Page - - - - - -
054 Poe 698,798 96,471 58,767 133,299 - 987,335
055 Rhodes 719,300 276,978 100,655 91,797 1 1,188,731
057 Rogers 732,294 84,402 61,425 80,452 - 958,573
058 Twain 3 1,383 4,014 996 - 6,396
059 Whittier 297,870 87,776 229,222 43,335 0 658,203
061 Tafolla 765,565 293,275 110,993 98,287 - 1,268,121
Subtotal 5,998,276 1,454,683 1,073,031 734,373 388 9,260,750
064 Pickett Center - - 1,002 64 - 1,066
Subtotal - - 1,002 64 - 1,066
SPECIAL REVENUE FUND BUDGETS BY MAJOR OBJECT CODE & CAMPUS
High Schools
Alternative High Schools
Middle Schools
Alternative Schools
* Head Start Campus
150
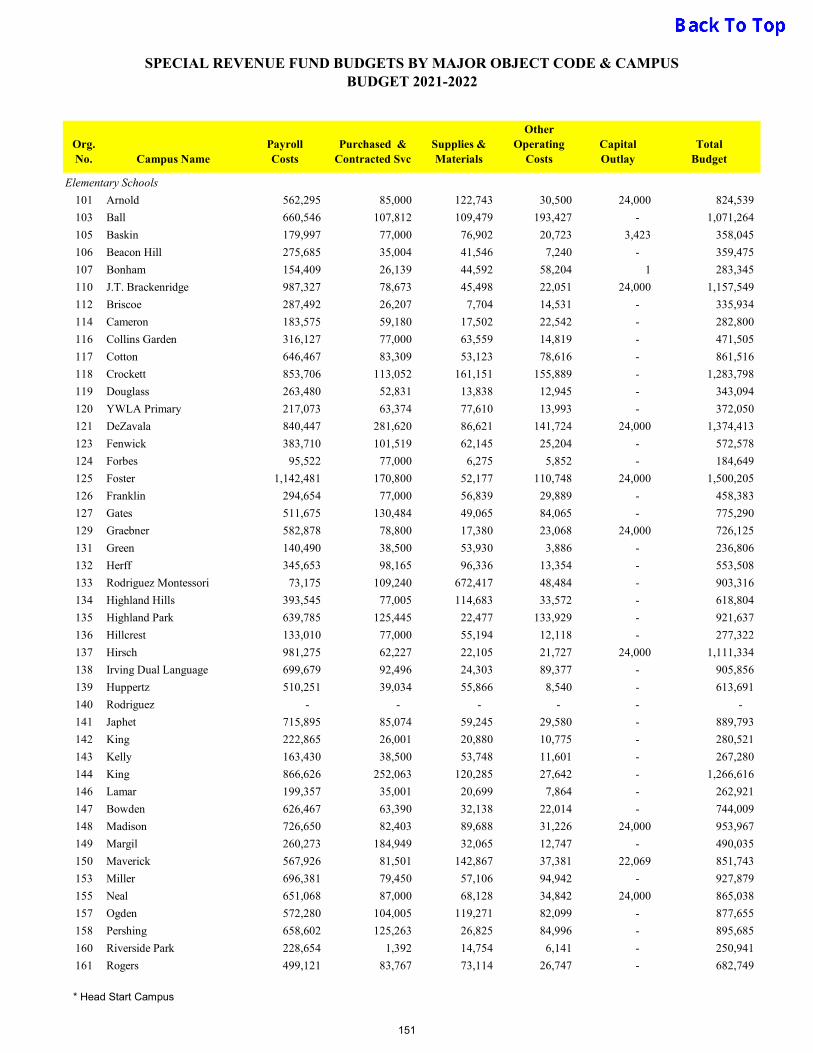
BUDGET 2021-2022
Org. No. Campus Name
Payroll Costs
Purchased &Contracted Svc
Supplies &Materials
Other Operating
CostsCapital Outlay
Total Budget
SPECIAL REVENUE FUND BUDGETS BY MAJOR OBJECT CODE & CAMPUS
101 Arnold 562,295 85,000 122,743 30,500 24,000 824,539
103 Ball 660,546 107,812 109,479 193,427 - 1,071,264
105 Baskin 179,997 77,000 76,902 20,723 3,423 358,045
106 Beacon Hill 275,685 35,004 41,546 7,240 - 359,475
107 Bonham 154,409 26,139 44,592 58,204 1 283,345
110 J.T. Brackenridge 987,327 78,673 45,498 22,051 24,000 1,157,549
112 Briscoe 287,492 26,207 7,704 14,531 - 335,934
114 Cameron 183,575 59,180 17,502 22,542 - 282,800
116 Collins Garden 316,127 77,000 63,559 14,819 - 471,505
117 Cotton 646,467 83,309 53,123 78,616 - 861,516
118 Crockett 853,706 113,052 161,151 155,889 - 1,283,798
119 Douglass 263,480 52,831 13,838 12,945 - 343,094
120 YWLA Primary 217,073 63,374 77,610 13,993 - 372,050
121 DeZavala 840,447 281,620 86,621 141,724 24,000 1,374,413
123 Fenwick 383,710 101,519 62,145 25,204 - 572,578
124 Forbes 95,522 77,000 6,275 5,852 - 184,649
125 Foster 1,142,481 170,800 52,177 110,748 24,000 1,500,205
126 Franklin 294,654 77,000 56,839 29,889 - 458,383
127 Gates 511,675 130,484 49,065 84,065 - 775,290
129 Graebner 582,878 78,800 17,380 23,068 24,000 726,125
131 Green 140,490 38,500 53,930 3,886 - 236,806
132 Herff 345,653 98,165 96,336 13,354 - 553,508
133 Rodriguez Montessori 73,175 109,240 672,417 48,484 - 903,316
134 Highland Hills 393,545 77,005 114,683 33,572 - 618,804
135 Highland Park 639,785 125,445 22,477 133,929 - 921,637
136 Hillcrest 133,010 77,000 55,194 12,118 - 277,322
137 Hirsch 981,275 62,227 22,105 21,727 24,000 1,111,334
138 Irving Dual Language 699,679 92,496 24,303 89,377 - 905,856
139 Huppertz 510,251 39,034 55,866 8,540 - 613,691
140 Rodriguez - - - - - -
141 Japhet 715,895 85,074 59,245 29,580 - 889,793
142 King 222,865 26,001 20,880 10,775 - 280,521
143 Kelly 163,430 38,500 53,748 11,601 - 267,280
144 King 866,626 252,063 120,285 27,642 - 1,266,616
146 Lamar 199,357 35,001 20,699 7,864 - 262,921
147 Bowden 626,467 63,390 32,138 22,014 - 744,009
148 Madison 726,650 82,403 89,688 31,226 24,000 953,967
149 Margil 260,273 184,949 32,065 12,747 - 490,035
150 Maverick 567,926 81,501 142,867 37,381 22,069 851,743
153 Miller 696,381 79,450 57,106 94,942 - 927,879
155 Neal 651,068 87,000 68,128 34,842 24,000 865,038
157 Ogden 572,280 104,005 119,271 82,099 - 877,655
158 Pershing 658,602 125,263 26,825 84,996 - 895,685
160 Riverside Park 228,654 1,392 14,754 6,141 - 250,941
161 Rogers 499,121 83,767 73,114 26,747 - 682,749
Elementary Schools
* Head Start Campus
151
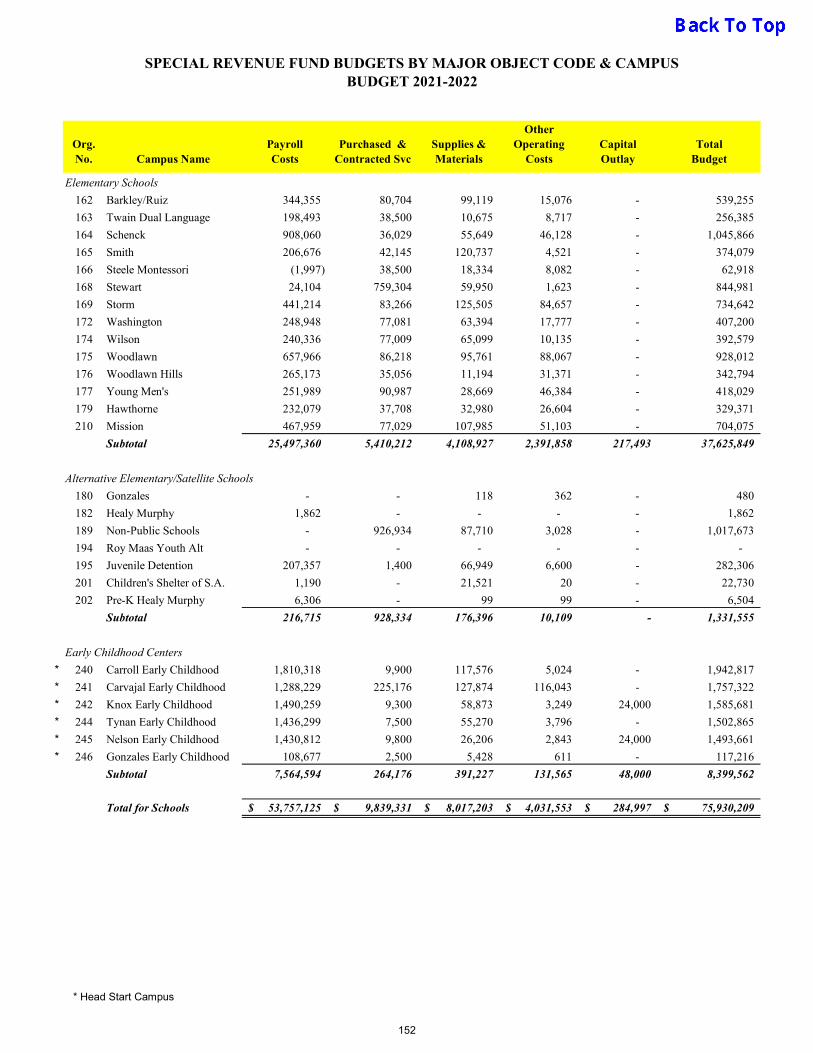
BUDGET 2021-2022
Org. No. Campus Name
Payroll Costs
Purchased &Contracted Svc
Supplies &Materials
Other Operating
CostsCapital Outlay
Total Budget
SPECIAL REVENUE FUND BUDGETS BY MAJOR OBJECT CODE & CAMPUS
162 Barkley/Ruiz 344,355 80,704 99,119 15,076 - 539,255
163 Twain Dual Language 198,493 38,500 10,675 8,717 - 256,385
164 Schenck 908,060 36,029 55,649 46,128 - 1,045,866
165 Smith 206,676 42,145 120,737 4,521 - 374,079
166 Steele Montessori (1,997) 38,500 18,334 8,082 - 62,918
168 Stewart 24,104 759,304 59,950 1,623 - 844,981
169 Storm 441,214 83,266 125,505 84,657 - 734,642
172 Washington 248,948 77,081 63,394 17,777 - 407,200
174 Wilson 240,336 77,009 65,099 10,135 - 392,579
175 Woodlawn 657,966 86,218 95,761 88,067 - 928,012
176 Woodlawn Hills 265,173 35,056 11,194 31,371 - 342,794
177 Young Men's 251,989 90,987 28,669 46,384 - 418,029
179 Hawthorne 232,079 37,708 32,980 26,604 - 329,371
210 Mission 467,959 77,029 107,985 51,103 - 704,075
Subtotal 25,497,360 5,410,212 4,108,927 2,391,858 217,493 37,625,849
180 Gonzales - - 118 362 - 480
182 Healy Murphy 1,862 - - - - 1,862
189 Non-Public Schools - 926,934 87,710 3,028 - 1,017,673
194 Roy Maas Youth Alt - - - - - -
195 Juvenile Detention 207,357 1,400 66,949 6,600 - 282,306
201 Children's Shelter of S.A. 1,190 - 21,521 20 - 22,730
202 Pre-K Healy Murphy 6,306 - 99 99 - 6,504
Subtotal 216,715 928,334 176,396 10,109 - 1,331,555
* 240 Carroll Early Childhood 1,810,318 9,900 117,576 5,024 - 1,942,817
* 241 Carvajal Early Childhood 1,288,229 225,176 127,874 116,043 - 1,757,322
* 242 Knox Early Childhood 1,490,259 9,300 58,873 3,249 24,000 1,585,681
* 244 Tynan Early Childhood 1,436,299 7,500 55,270 3,796 - 1,502,865
* 245 Nelson Early Childhood 1,430,812 9,800 26,206 2,843 24,000 1,493,661
* 246 Gonzales Early Childhood 108,677 2,500 5,428 611 - 117,216
Subtotal 7,564,594 264,176 391,227 131,565 48,000 8,399,562
Total for Schools 53,757,125$ 9,839,331$ 8,017,203$ 4,031,553$ 284,997$ 75,930,209$
Early Childhood Centers
Alternative Elementary/Satellite Schools
Elementary Schools
* Head Start Campus
152
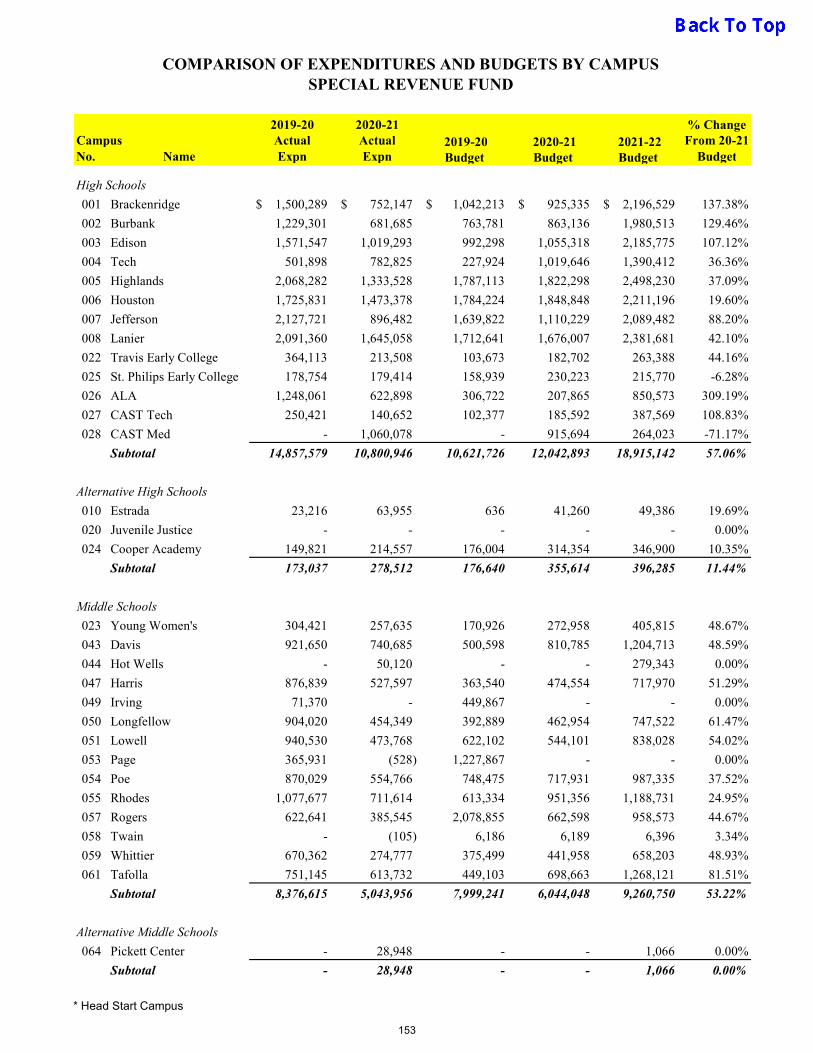
2019-20 2020-21 % ChangeActual Actual 2019-20 2020-21 2021-22 From 20-21
No. Name Expn Expn Budget Budget Budget Budget
001 Brackenridge 1,500,289$ 752,147$ 1,042,213$ 925,335$ 2,196,529$ 137.38%
002 Burbank 1,229,301 681,685 763,781 863,136 1,980,513 129.46%
003 Edison 1,571,547 1,019,293 992,298 1,055,318 2,185,775 107.12%
004 Tech 501,898 782,825 227,924 1,019,646 1,390,412 36.36%
005 Highlands 2,068,282 1,333,528 1,787,113 1,822,298 2,498,230 37.09%
006 Houston 1,725,831 1,473,378 1,784,224 1,848,848 2,211,196 19.60%
007 Jefferson 2,127,721 896,482 1,639,822 1,110,229 2,089,482 88.20%
008 Lanier 2,091,360 1,645,058 1,712,641 1,676,007 2,381,681 42.10%
022 Travis Early College 364,113 213,508 103,673 182,702 263,388 44.16%
025 St. Philips Early College 178,754 179,414 158,939 230,223 215,770 -6.28%
026 ALA 1,248,061 622,898 306,722 207,865 850,573 309.19%
027 CAST Tech 250,421 140,652 102,377 185,592 387,569 108.83%
028 CAST Med - 1,060,078 - 915,694 264,023 -71.17%
Subtotal 14,857,579 10,800,946 10,621,726 12,042,893 18,915,142 57.06%
010 Estrada 23,216 63,955 636 41,260 49,386 19.69%
020 Juvenile Justice - - - - - 0.00%
024 Cooper Academy 149,821 214,557 176,004 314,354 346,900 10.35%
Subtotal 173,037 278,512 176,640 355,614 396,285 11.44%
023 Young Women's 304,421 257,635 170,926 272,958 405,815 48.67%
043 Davis 921,650 740,685 500,598 810,785 1,204,713 48.59%
044 Hot Wells - 50,120 - - 279,343 0.00%
047 Harris 876,839 527,597 363,540 474,554 717,970 51.29%
049 Irving 71,370 - 449,867 - - 0.00%
050 Longfellow 904,020 454,349 392,889 462,954 747,522 61.47%
051 Lowell 940,530 473,768 622,102 544,101 838,028 54.02%
053 Page 365,931 (528) 1,227,867 - - 0.00%
054 Poe 870,029 554,766 748,475 717,931 987,335 37.52%
055 Rhodes 1,077,677 711,614 613,334 951,356 1,188,731 24.95%
057 Rogers 622,641 385,545 2,078,855 662,598 958,573 44.67%
058 Twain - (105) 6,186 6,189 6,396 3.34%
059 Whittier 670,362 274,777 375,499 441,958 658,203 48.93%
061 Tafolla 751,145 613,732 449,103 698,663 1,268,121 81.51%
Subtotal 8,376,615 5,043,956 7,999,241 6,044,048 9,260,750 53.22%
064 Pickett Center - 28,948 - - 1,066 0.00%
Subtotal - 28,948 - - 1,066 0.00%
Alternative Middle Schools
COMPARISON OF EXPENDITURES AND BUDGETS BY CAMPUS
Campus
SPECIAL REVENUE FUND
High Schools
Alternative High Schools
Middle Schools
* Head Start Campus
153
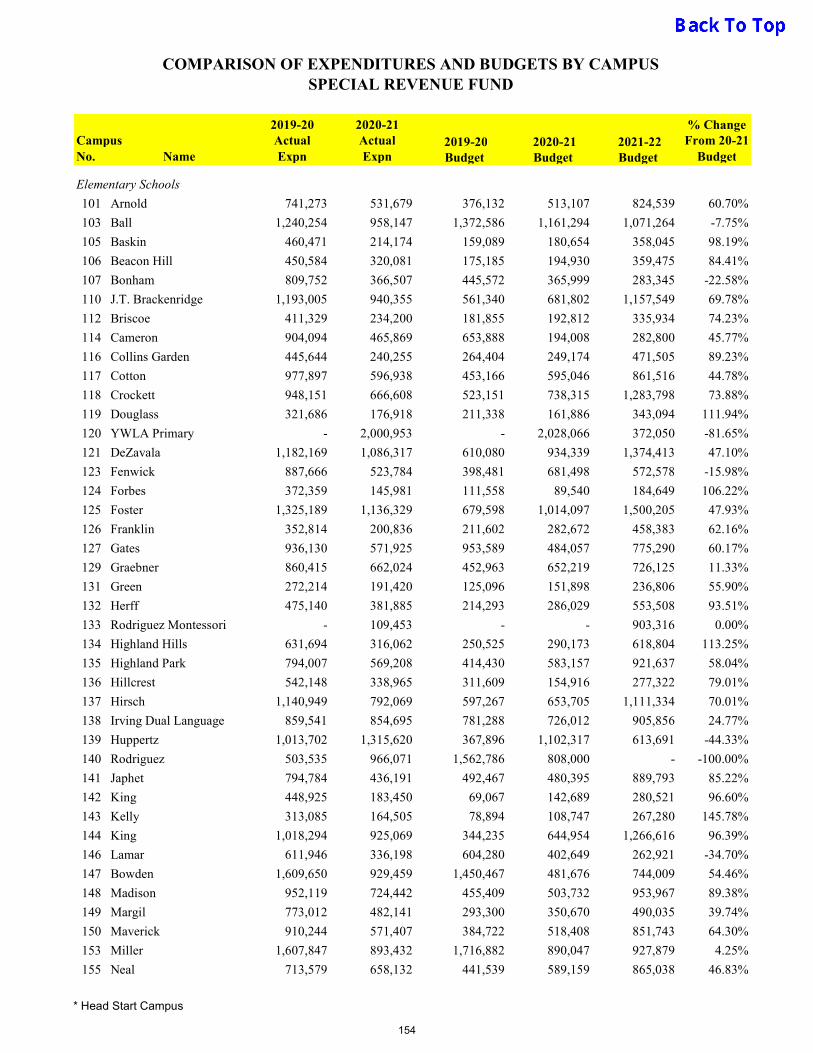
2019-20 2020-21 % ChangeActual Actual 2019-20 2020-21 2021-22 From 20-21
No. Name Expn Expn Budget Budget Budget Budget
COMPARISON OF EXPENDITURES AND BUDGETS BY CAMPUS
Campus
SPECIAL REVENUE FUND
101 Arnold 741,273 531,679 376,132 513,107 824,539 60.70%
103 Ball 1,240,254 958,147 1,372,586 1,161,294 1,071,264 -7.75%
105 Baskin 460,471 214,174 159,089 180,654 358,045 98.19%
106 Beacon Hill 450,584 320,081 175,185 194,930 359,475 84.41%
107 Bonham 809,752 366,507 445,572 365,999 283,345 -22.58%
110 J.T. Brackenridge 1,193,005 940,355 561,340 681,802 1,157,549 69.78%
112 Briscoe 411,329 234,200 181,855 192,812 335,934 74.23%
114 Cameron 904,094 465,869 653,888 194,008 282,800 45.77%
116 Collins Garden 445,644 240,255 264,404 249,174 471,505 89.23%
117 Cotton 977,897 596,938 453,166 595,046 861,516 44.78%
118 Crockett 948,151 666,608 523,151 738,315 1,283,798 73.88%
119 Douglass 321,686 176,918 211,338 161,886 343,094 111.94%
120 YWLA Primary - 2,000,953 - 2,028,066 372,050 -81.65%
121 DeZavala 1,182,169 1,086,317 610,080 934,339 1,374,413 47.10%
123 Fenwick 887,666 523,784 398,481 681,498 572,578 -15.98%
124 Forbes 372,359 145,981 111,558 89,540 184,649 106.22%
125 Foster 1,325,189 1,136,329 679,598 1,014,097 1,500,205 47.93%
126 Franklin 352,814 200,836 211,602 282,672 458,383 62.16%
127 Gates 936,130 571,925 953,589 484,057 775,290 60.17%
129 Graebner 860,415 662,024 452,963 652,219 726,125 11.33%
131 Green 272,214 191,420 125,096 151,898 236,806 55.90%
132 Herff 475,140 381,885 214,293 286,029 553,508 93.51%
133 Rodriguez Montessori - 109,453 - - 903,316 0.00%
134 Highland Hills 631,694 316,062 250,525 290,173 618,804 113.25%
135 Highland Park 794,007 569,208 414,430 583,157 921,637 58.04%
136 Hillcrest 542,148 338,965 311,609 154,916 277,322 79.01%
137 Hirsch 1,140,949 792,069 597,267 653,705 1,111,334 70.01%
138 Irving Dual Language 859,541 854,695 781,288 726,012 905,856 24.77%
139 Huppertz 1,013,702 1,315,620 367,896 1,102,317 613,691 -44.33%
140 Rodriguez 503,535 966,071 1,562,786 808,000 - -100.00%
141 Japhet 794,784 436,191 492,467 480,395 889,793 85.22%
142 King 448,925 183,450 69,067 142,689 280,521 96.60%
143 Kelly 313,085 164,505 78,894 108,747 267,280 145.78%
144 King 1,018,294 925,069 344,235 644,954 1,266,616 96.39%
146 Lamar 611,946 336,198 604,280 402,649 262,921 -34.70%
147 Bowden 1,609,650 929,459 1,450,467 481,676 744,009 54.46%
148 Madison 952,119 724,442 455,409 503,732 953,967 89.38%
149 Margil 773,012 482,141 293,300 350,670 490,035 39.74%
150 Maverick 910,244 571,407 384,722 518,408 851,743 64.30%
153 Miller 1,607,847 893,432 1,716,882 890,047 927,879 4.25%
155 Neal 713,579 658,132 441,539 589,159 865,038 46.83%
Elementary Schools
* Head Start Campus
154
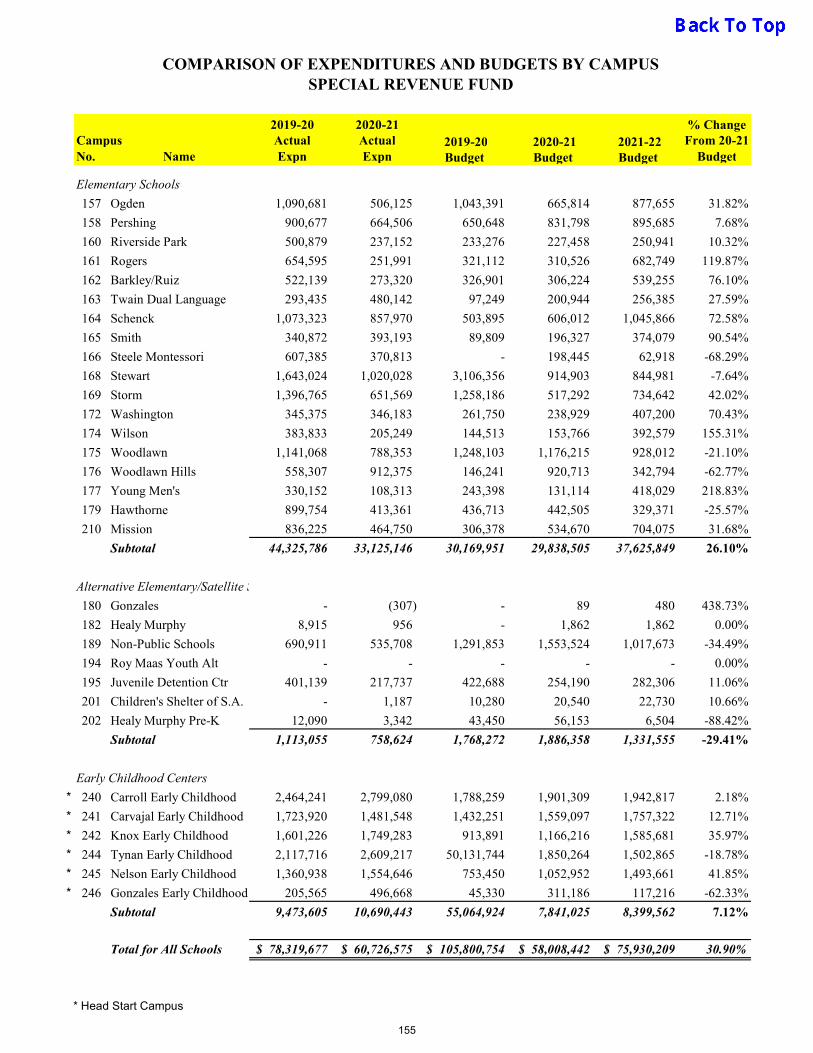
2019-20 2020-21 % ChangeActual Actual 2019-20 2020-21 2021-22 From 20-21
No. Name Expn Expn Budget Budget Budget Budget
COMPARISON OF EXPENDITURES AND BUDGETS BY CAMPUS
Campus
SPECIAL REVENUE FUND
157 Ogden 1,090,681 506,125 1,043,391 665,814 877,655 31.82%
158 Pershing 900,677 664,506 650,648 831,798 895,685 7.68%
160 Riverside Park 500,879 237,152 233,276 227,458 250,941 10.32%
161 Rogers 654,595 251,991 321,112 310,526 682,749 119.87%
162 Barkley/Ruiz 522,139 273,320 326,901 306,224 539,255 76.10%
163 Twain Dual Language 293,435 480,142 97,249 200,944 256,385 27.59%
164 Schenck 1,073,323 857,970 503,895 606,012 1,045,866 72.58%
165 Smith 340,872 393,193 89,809 196,327 374,079 90.54%
166 Steele Montessori 607,385 370,813 - 198,445 62,918 -68.29%
168 Stewart 1,643,024 1,020,028 3,106,356 914,903 844,981 -7.64%
169 Storm 1,396,765 651,569 1,258,186 517,292 734,642 42.02%
172 Washington 345,375 346,183 261,750 238,929 407,200 70.43%
174 Wilson 383,833 205,249 144,513 153,766 392,579 155.31%
175 Woodlawn 1,141,068 788,353 1,248,103 1,176,215 928,012 -21.10%
176 Woodlawn Hills 558,307 912,375 146,241 920,713 342,794 -62.77%
177 Young Men's 330,152 108,313 243,398 131,114 418,029 218.83%
179 Hawthorne 899,754 413,361 436,713 442,505 329,371 -25.57%
210 Mission 836,225 464,750 306,378 534,670 704,075 31.68%
Subtotal 44,325,786 33,125,146 30,169,951 29,838,505 37,625,849 26.10%
180 Gonzales - (307) - 89 480 438.73%
182 Healy Murphy 8,915 956 - 1,862 1,862 0.00%
189 Non-Public Schools 690,911 535,708 1,291,853 1,553,524 1,017,673 -34.49%
194 Roy Maas Youth Alt - - - - - 0.00%
195 Juvenile Detention Ctr 401,139 217,737 422,688 254,190 282,306 11.06%
201 Children's Shelter of S.A. - 1,187 10,280 20,540 22,730 10.66%
202 Healy Murphy Pre-K 12,090 3,342 43,450 56,153 6,504 -88.42%
Subtotal 1,113,055 758,624 1,768,272 1,886,358 1,331,555 -29.41%
* 240 Carroll Early Childhood 2,464,241 2,799,080 1,788,259 1,901,309 1,942,817 2.18%
* 241 Carvajal Early Childhood 1,723,920 1,481,548 1,432,251 1,559,097 1,757,322 12.71%
* 242 Knox Early Childhood 1,601,226 1,749,283 913,891 1,166,216 1,585,681 35.97%
* 244 Tynan Early Childhood 2,117,716 2,609,217 50,131,744 1,850,264 1,502,865 -18.78%
* 245 Nelson Early Childhood 1,360,938 1,554,646 753,450 1,052,952 1,493,661 41.85%
* 246 Gonzales Early Childhood 205,565 496,668 45,330 311,186 117,216 -62.33%
Subtotal 9,473,605 10,690,443 55,064,924 7,841,025 8,399,562 7.12%
Total for All Schools 78,319,677$ 60,726,575$ 105,800,754$ 58,008,442$ 75,930,209$ 30.90%
Early Childhood Centers
Elementary Schools
Alternative Elementary/Satellite Schools
* Head Start Campus
155

DEBT SERVICE FUND
This fund group accounts for resources accumulated and payments made for principal and interest on all bonds of the District. The primary sources of revenue for the Debt Service Fund are local property taxes, interest earnings on the fund balance, and the State Instructional Facilities Allotment. The amount of state aid earned by the District will continue to decline, due to the growth of our property tax roll on a per student basis.
156
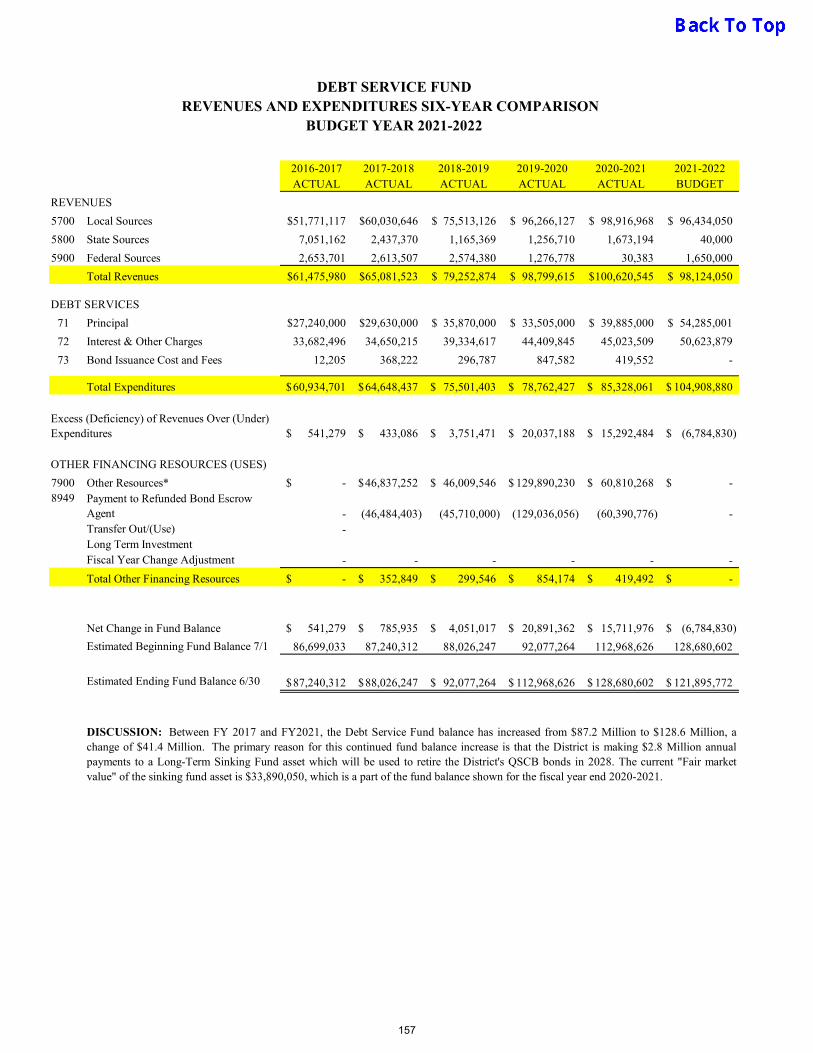
DEBT SERVICE FUNDREVENUES AND EXPENDITURES SIX-YEAR COMPARISON
BUDGET YEAR 2021-2022
2016-2017 2017-2018 2018-2019 2019-2020 2020-2021 2021-2022ACTUAL ACTUAL ACTUAL ACTUAL ACTUAL BUDGET
REVENUES
5700 Local Sources 51,771,117$ 60,030,646$ 75,513,126$ 96,266,127$ 98,916,968$ 96,434,050$
5800 State Sources 7,051,162 2,437,370 1,165,369 1,256,710 1,673,194 40,000
5900 Federal Sources 2,653,701 2,613,507 2,574,380 1,276,778 30,383 1,650,000
Total Revenues 61,475,980$ 65,081,523$ 79,252,874$ 98,799,615$ 100,620,545$ 98,124,050$
DEBT SERVICES
71 Principal 27,240,000$ 29,630,000$ 35,870,000$ 33,505,000$ 39,885,000$ 54,285,001$
72 Interest & Other Charges 33,682,496 34,650,215 39,334,617 44,409,845 45,023,509 50,623,879
73 Bond Issuance Cost and Fees 12,205 368,222 296,787 847,582 419,552 -
Total Expenditures 60,934,701$ 64,648,437$ 75,501,403$ 78,762,427$ 85,328,061$ 104,908,880$
541,279$ 433,086$ 3,751,471$ 20,037,188$ 15,292,484$ (6,784,830)$
OTHER FINANCING RESOURCES (USES)
7900 Other Resources* -$ 46,837,252$ 46,009,546$ 129,890,230$ 60,810,268$ -$ 8949 Payment to Refunded Bond Escrow
Agent - (46,484,403) (45,710,000) (129,036,056) (60,390,776) - Transfer Out/(Use) - Long Term InvestmentFiscal Year Change Adjustment - - - - - -
Total Other Financing Resources -$ 352,849$ 299,546$ 854,174$ 419,492$ -$
Net Change in Fund Balance 541,279$ 785,935$ 4,051,017$ 20,891,362$ 15,711,976$ (6,784,830)$
Estimated Beginning Fund Balance 7/1 86,699,033 87,240,312 88,026,247 92,077,264 112,968,626 128,680,602
Estimated Ending Fund Balance 6/30 87,240,312$ 88,026,247$ 92,077,264$ 112,968,626$ 128,680,602$ 121,895,772$
Excess (Deficiency) of Revenues Over (Under) Expenditures
DISCUSSION: Between FY 2017 and FY2021, the Debt Service Fund balance has increased from $87.2 Million to $128.6 Million, achange of $41.4 Million. The primary reason for this continued fund balance increase is that the District is making $2.8 Million annualpayments to a Long-Term Sinking Fund asset which will be used to retire the District's QSCB bonds in 2028. The current "Fair marketvalue" of the sinking fund asset is $33,890,050, which is a part of the fund balance shown for the fiscal year end 2020-2021.
157
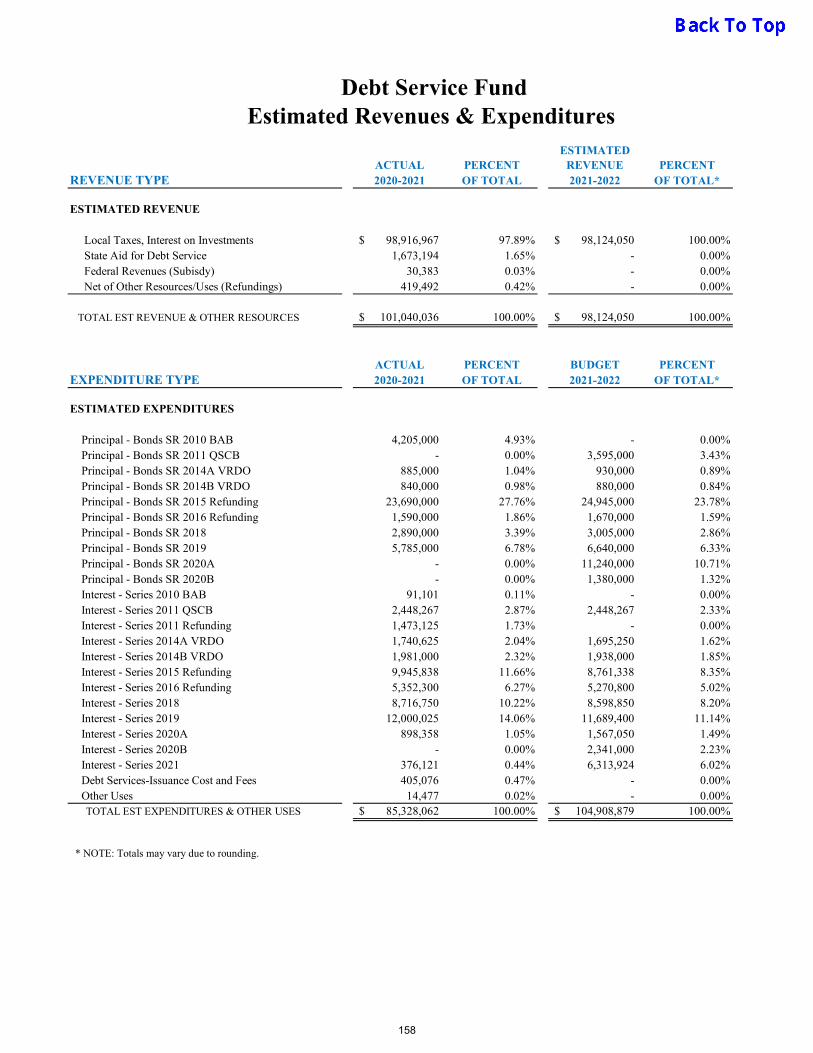
Debt Service FundEstimated Revenues & Expenditures
ESTIMATEDACTUAL PERCENT REVENUE PERCENT
REVENUE TYPE 2020-2021 OF TOTAL 2021-2022 OF TOTAL*
ESTIMATED REVENUE
Local Taxes, Interest on Investments 98,916,967$ 97.89% 98,124,050$ 100.00% State Aid for Debt Service 1,673,194 1.65% - 0.00% Federal Revenues (Subisdy) 30,383 0.03% - 0.00% Net of Other Resources/Uses (Refundings) 419,492 0.42% - 0.00%
TOTAL EST REVENUE & OTHER RESOURCES 101,040,036$ 100.00% 98,124,050$ 100.00%
ACTUAL PERCENT BUDGET PERCENTEXPENDITURE TYPE 2020-2021 OF TOTAL 2021-2022 OF TOTAL*
ESTIMATED EXPENDITURES
Principal - Bonds SR 2010 BAB 4,205,000 4.93% - 0.00% Principal - Bonds SR 2011 QSCB - 0.00% 3,595,000 3.43% Principal - Bonds SR 2014A VRDO 885,000 1.04% 930,000 0.89% Principal - Bonds SR 2014B VRDO 840,000 0.98% 880,000 0.84% Principal - Bonds SR 2015 Refunding 23,690,000 27.76% 24,945,000 23.78% Principal - Bonds SR 2016 Refunding 1,590,000 1.86% 1,670,000 1.59% Principal - Bonds SR 2018 2,890,000 3.39% 3,005,000 2.86% Principal - Bonds SR 2019 5,785,000 6.78% 6,640,000 6.33% Principal - Bonds SR 2020A - 0.00% 11,240,000 10.71% Principal - Bonds SR 2020B - 0.00% 1,380,000 1.32% Interest - Series 2010 BAB 91,101 0.11% - 0.00% Interest - Series 2011 QSCB 2,448,267 2.87% 2,448,267 2.33% Interest - Series 2011 Refunding 1,473,125 1.73% - 0.00% Interest - Series 2014A VRDO 1,740,625 2.04% 1,695,250 1.62% Interest - Series 2014B VRDO 1,981,000 2.32% 1,938,000 1.85% Interest - Series 2015 Refunding 9,945,838 11.66% 8,761,338 8.35% Interest - Series 2016 Refunding 5,352,300 6.27% 5,270,800 5.02% Interest - Series 2018 8,716,750 10.22% 8,598,850 8.20% Interest - Series 2019 12,000,025 14.06% 11,689,400 11.14% Interest - Series 2020A 898,358 1.05% 1,567,050 1.49% Interest - Series 2020B - 0.00% 2,341,000 2.23% Interest - Series 2021 376,121 0.44% 6,313,924 6.02% Debt Services-Issuance Cost and Fees 405,076 0.47% - 0.00% Other Uses 14,477 0.02% - 0.00% TOTAL EST EXPENDITURES & OTHER USES 85,328,062$ 100.00% 104,908,879$ 100.00%
* NOTE: Totals may vary due to rounding.
158

Assessed Valuation 2021 Tax Roll 21,467,794,795$
Debt Limit - 10% of Assessed Valuation 2,146,779,480$
General Obligation & Lease Revenue Bonds 1,271,104,988$
Less: Amount Available in Debt Service Fund 128,680,602$
Total Amount of Debt Applicable to Debt Limit 1,142,424,386$
Legal Debt Margin 1,004,355,094$
COMPUTATION OF LEGAL DEBT MARGIN June 30, 2021
(Unaudited)
The Texas Education Code (TEC) authorizes the District to issue negotiable coupon bonds to construct,acquire, or equip school buildings, to purchase necessary sites, and to acquire or refinance property financedunder a contract entered into under the Public Property Finance Act. The District is further authorized tolevy and assess annual ad valorem taxes sufficient to pay the principal and interest on the bonds as theybecome due.
Local policy gives the superintendent or his designees management oversight responsibility for the debtservice operation of the District. In this capacity, the superintendent recommends all proposed bond sales tothe board for its approval.
All bond elections are held in accordance with statutory requirements, and bonds are sold, as authorized bythe qualified voters of the District, on a competitive basis under the direction of a fiscal agent selected bythe board.
Texas statutes do not prescribe a debt limit; however, by custom, a practical economic debt limit of 10% ofthe assessed valuation is used.
The computation of the District's legal debt margin is found below:
159

Net Debt Estimated OverlappingTaxing Body Obligation As of Percentage Amount
Alamo Community College District 576,183,842$ 6/30/2021 13.71% 78,994,805$
Balcones Heights, City of 293,000 6/30/2021 50.78% 148,785
Bexar County 1,521,792,615 6/30/2021 13.71% 208,637,768
Bexar County Hospital District 886,420,540 6/30/2021 13.71% 121,528,256
Olmos Park, City of 465,000 6/30/2021 6.14% 28,551
San Antonio, City of 1,928,644,866 6/30/2021 19.01% 366,635,389
Subtotal 775,973,554 San Antonio Independent School District 6/30/2021 1,401,290,574
2,177,264,128$
* Source: The Texas Municipal Report from the Municipal Advisory Council of Texas.
COMPUTATION OF DIRECT AND ESTIMATED OVERLAPPING BONDED DEBT *
TOTAL
As of June 30, 2021
Note: Overlapping governments are those that coincide, at least in part, with the geographic boundaries of theDistrict. This schedule estimates the portion of the outstanding debt of those overlapping governments that isborne by the residents and businesses of the District. This process recognizes that, when considering theDistrict's ability to issue and repay long-term debt, the entire debt burden borne by the residents and businessesshould be taken into account. This does not imply that every taxpayer is a resident, and therefore responsible forrepaying the debt of each overlapping government.
160
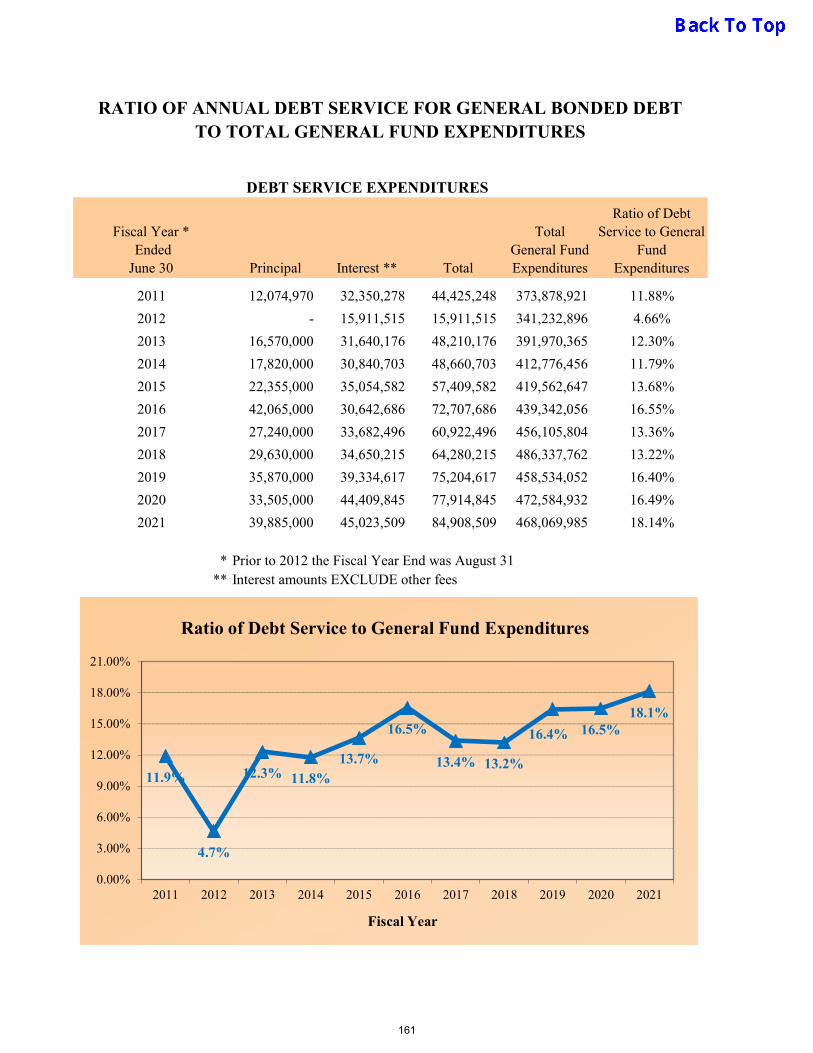
RATIO OF ANNUAL DEBT SERVICE FOR GENERAL BONDED DEBTTO TOTAL GENERAL FUND EXPENDITURES
Fiscal Year * Ended June 30 Principal Interest ** Total
Total General Fund Expenditures
Ratio of Debt Service to General
Fund Expenditures
2011 12,074,970 32,350,278 44,425,248 373,878,921 11.88%
2012 - 15,911,515 15,911,515 341,232,896 4.66%
2013 16,570,000 31,640,176 48,210,176 391,970,365 12.30%
2014 17,820,000 30,840,703 48,660,703 412,776,456 11.79%
2015 22,355,000 35,054,582 57,409,582 419,562,647 13.68%
2016 42,065,000 30,642,686 72,707,686 439,342,056 16.55%
2017 27,240,000 33,682,496 60,922,496 456,105,804 13.36%
2018 29,630,000 34,650,215 64,280,215 486,337,762 13.22%
2019 35,870,000 39,334,617 75,204,617 458,534,052 16.40%
2020 33,505,000 44,409,845 77,914,845 472,584,932 16.49%
2021 39,885,000 45,023,509 84,908,509 468,069,985 18.14%
* Prior to 2012 the Fiscal Year End was August 31** Interest amounts EXCLUDE other fees
DEBT SERVICE EXPENDITURES
11.9%
4.7%
12.3% 11.8%13.7%
16.5%
13.4% 13.2%
16.4% 16.5%18.1%
0.00%
3.00%
6.00%
9.00%
12.00%
15.00%
18.00%
21.00%
2011 2012 2013 2014 2015 2016 2017 2018 2019 2020 2021
Fiscal Year
Ratio of Debt Service to General Fund Expenditures
161
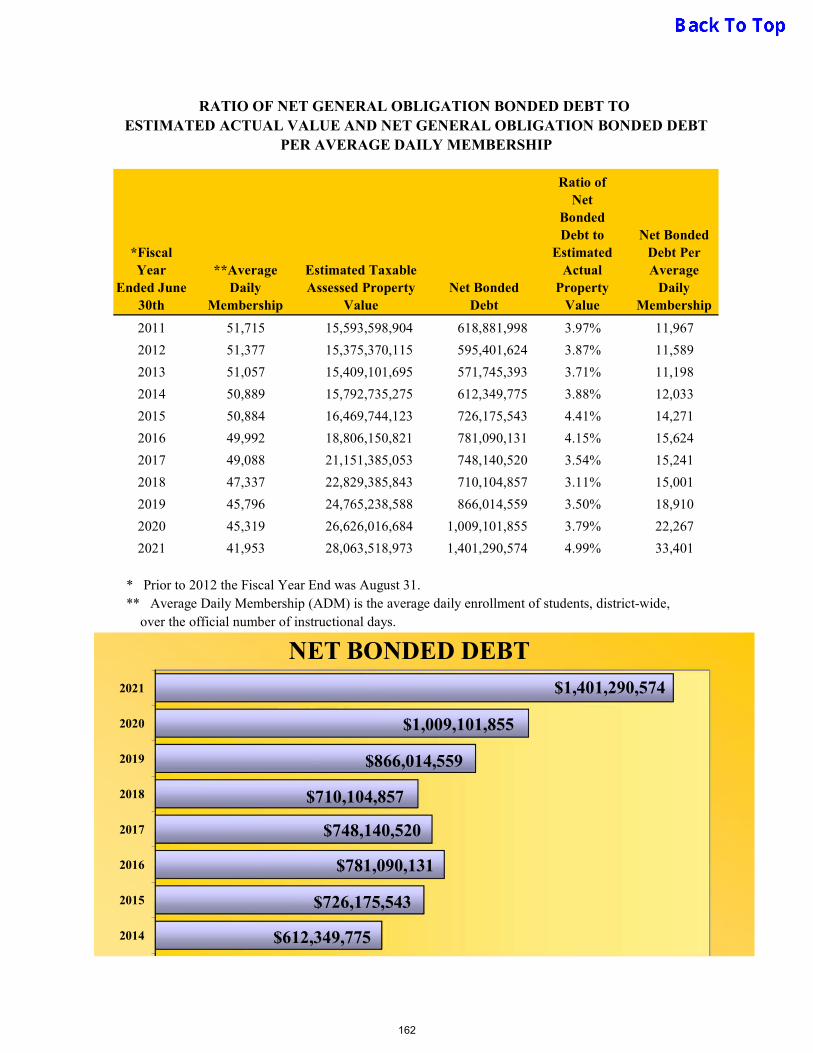
RATIO OF NET GENERAL OBLIGATION BONDED DEBT TO ESTIMATED ACTUAL VALUE AND NET GENERAL OBLIGATION BONDED DEBT
PER AVERAGE DAILY MEMBERSHIP
*Fiscal Year
Ended June 30th
**Average Daily
Membership
Estimated Taxable Assessed Property
ValueNet Bonded
Debt
Ratio of Net
Bonded Debt to
Estimated Actual
Property Value
Net Bonded Debt Per Average
Daily Membership
2011 51,715 15,593,598,904 618,881,998 3.97% 11,967
2012 51,377 15,375,370,115 595,401,624 3.87% 11,589
2013 51,057 15,409,101,695 571,745,393 3.71% 11,198
2014 50,889 15,792,735,275 612,349,775 3.88% 12,033
2015 50,884 16,469,744,123 726,175,543 4.41% 14,271
2016 49,992 18,806,150,821 781,090,131 4.15% 15,624
2017 49,088 21,151,385,053 748,140,520 3.54% 15,241
2018 47,337 22,829,385,843 710,104,857 3.11% 15,001
2019 45,796 24,765,238,588 866,014,559 3.50% 18,910
2020 45,319 26,626,016,684 1,009,101,855 3.79% 22,267
2021 41,953 28,063,518,973 1,401,290,574 4.99% 33,401
* Prior to 2012 the Fiscal Year End was August 31. ** Average Daily Membership (ADM) is the average daily enrollment of students, district-wide, over the official number of instructional days.
2014
2015
2016
2017
2018
2019
2020
2021
$612,349,775
$726,175,543
$781,090,131
$748,140,520
$710,104,857
$866,014,559
$1,009,101,855
$1,401,290,574
NET BONDED DEBT
162
CAPITAL PROJECTS FUND
The District's major capital projects are accounted for in this fund group. The major projects arefunded through the sale of Voter approved General Obligation Bonds. Although the Texas EducationAgency does not require an annual adopted budget for this fund group, a budget is established at thestart of a project through the District's budget amendment process. In other words, this fund isbudgeted on a project basis and continues until the project's completion.
163
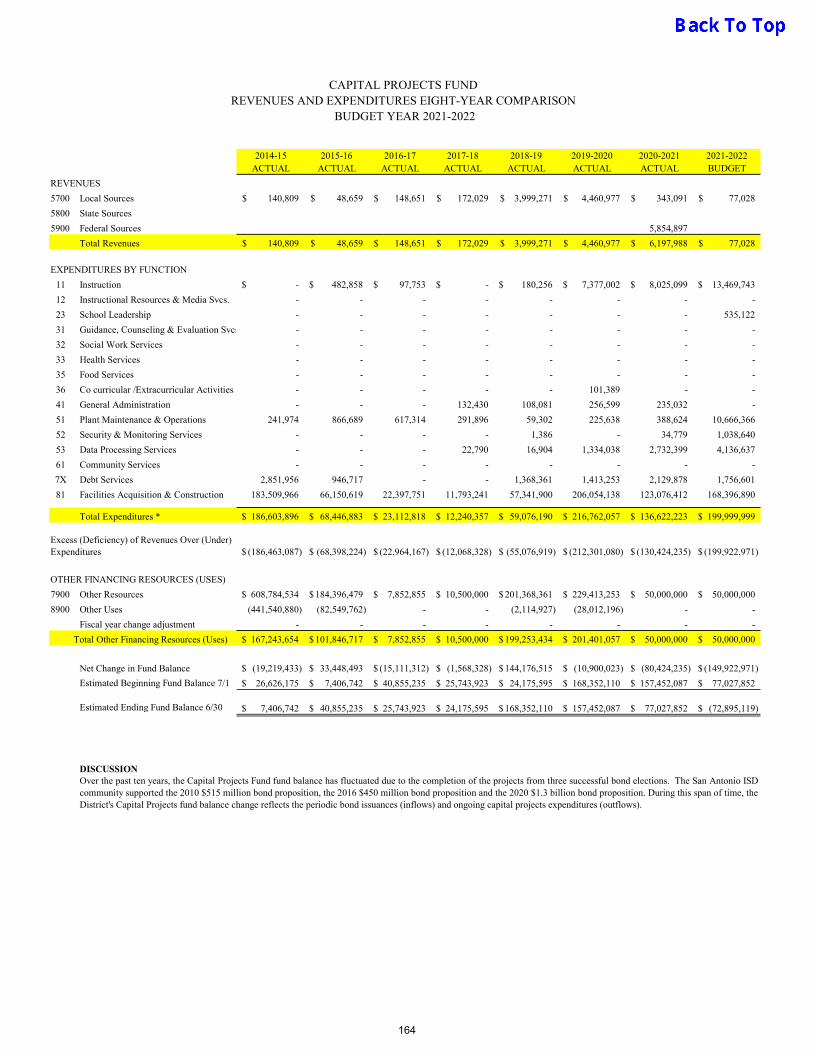
CAPITAL PROJECTS FUND REVENUES AND EXPENDITURES EIGHT-YEAR COMPARISON
BUDGET YEAR 2021-2022
2014-15 2015-16 2016-17 2017-18 2018-19 2019-2020 2020-2021 2021-2022ACTUAL ACTUAL ACTUAL ACTUAL ACTUAL ACTUAL ACTUAL BUDGET
REVENUES
5700 Local Sources 140,809$ 48,659$ 148,651$ 172,029$ 3,999,271$ 4,460,977$ 343,091$ 77,028$
5800 State Sources
5900 Federal Sources 5,854,897
Total Revenues 140,809$ 48,659$ 148,651$ 172,029$ 3,999,271$ 4,460,977$ 6,197,988$ 77,028$
EXPENDITURES BY FUNCTION
11 Instruction -$ 482,858$ 97,753$ -$ 180,256$ 7,377,002$ 8,025,099$ 13,469,743$
12 Instructional Resources & Media Svcs. - - - - - - - -
23 School Leadership - - - - - - - 535,122
31 Guidance, Counseling & Evaluation Svcs - - - - - - - -
32 Social Work Services - - - - - - - -
33 Health Services - - - - - - - -
35 Food Services - - - - - - - -
36 Co curricular /Extracurricular Activities - - - - - 101,389 - -
41 General Administration - - - 132,430 108,081 256,599 235,032 -
51 Plant Maintenance & Operations 241,974 866,689 617,314 291,896 59,302 225,638 388,624 10,666,366
52 Security & Monitoring Services - - - - 1,386 - 34,779 1,038,640
53 Data Processing Services - - - 22,790 16,904 1,334,038 2,732,399 4,136,637
61 Community Services - - - - - - - -
7X Debt Services 2,851,956 946,717 - - 1,368,361 1,413,253 2,129,878 1,756,601
81 Facilities Acquisition & Construction 183,509,966 66,150,619 22,397,751 11,793,241 57,341,900 206,054,138 123,076,412 168,396,890
Total Expenditures * 186,603,896$ 68,446,883$ 23,112,818$ 12,240,357$ 59,076,190$ 216,762,057$ 136,622,223$ 199,999,999$
(186,463,087)$ (68,398,224)$ (22,964,167)$ (12,068,328)$ (55,076,919)$ (212,301,080)$ (130,424,235)$ (199,922,971)$
OTHER FINANCING RESOURCES (USES)
7900 Other Resources 608,784,534$ 184,396,479$ 7,852,855$ 10,500,000$ 201,368,361$ 229,413,253$ 50,000,000$ 50,000,000$
8900 Other Uses (441,540,880) (82,549,762) - - (2,114,927) (28,012,196) - -
Fiscal year change adjustment - - - - - - - -
Total Other Financing Resources (Uses) 167,243,654$ 101,846,717$ 7,852,855$ 10,500,000$ 199,253,434$ 201,401,057$ 50,000,000$ 50,000,000$
Net Change in Fund Balance (19,219,433)$ 33,448,493$ (15,111,312)$ (1,568,328)$ 144,176,515$ (10,900,023)$ (80,424,235)$ (149,922,971)$
Estimated Beginning Fund Balance 7/1 26,626,175$ 7,406,742$ 40,855,235$ 25,743,923$ 24,175,595$ 168,352,110$ 157,452,087$ 77,027,852$
Estimated Ending Fund Balance 6/30 7,406,742$ 40,855,235$ 25,743,923$ 24,175,595$ 168,352,110$ 157,452,087$ 77,027,852$ (72,895,119)$
DISCUSSION
Excess (Deficiency) of Revenues Over (Under) Expenditures
Over the past ten years, the Capital Projects Fund fund balance has fluctuated due to the completion of the projects from three successful bond elections. The San Antonio ISDcommunity supported the 2010 $515 million bond proposition, the 2016 $450 million bond proposition and the 2020 $1.3 billion bond proposition. During this span of time, theDistrict's Capital Projects fund balance change reflects the periodic bond issuances (inflows) and ongoing capital projects expenditures (outflows).
164
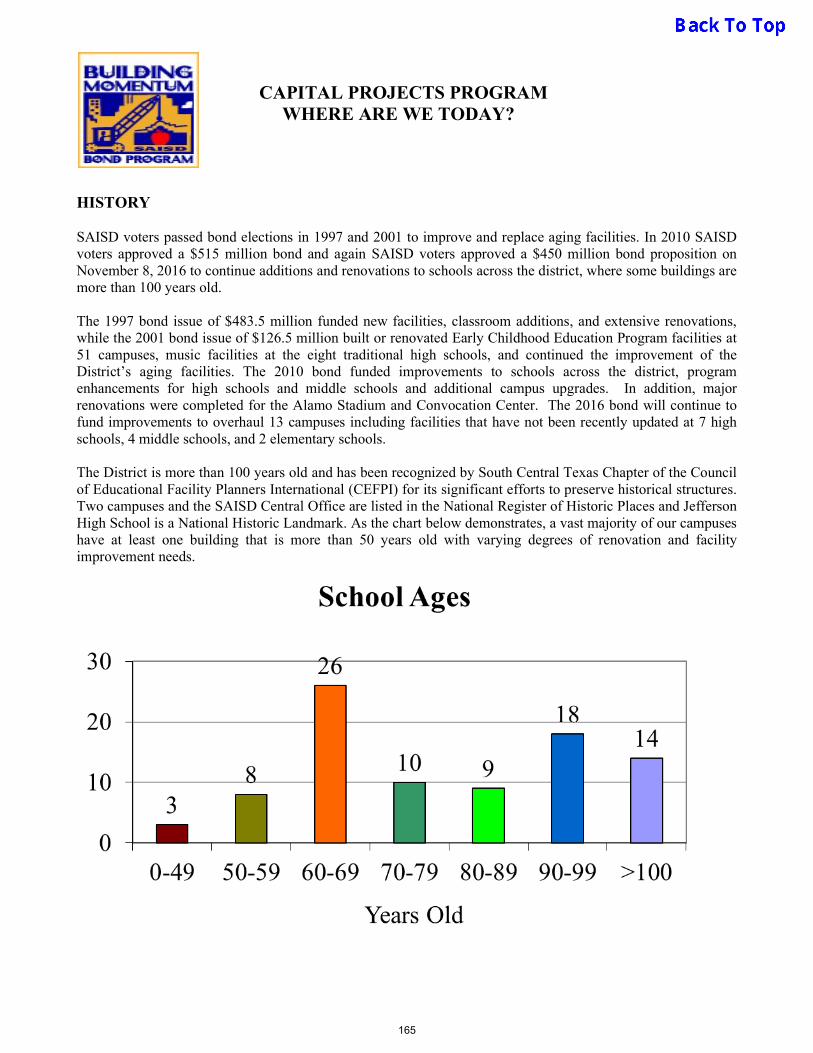
CAPITAL PROJECTS PROGRAM WHERE ARE WE TODAY?
HISTORY SAISD voters passed bond elections in 1997 and 2001 to improve and replace aging facilities. In 2010 SAISD voters approved a $515 million bond and again SAISD voters approved a $450 million bond proposition on November 8, 2016 to continue additions and renovations to schools across the district, where some buildings are more than 100 years old. The 1997 bond issue of $483.5 million funded new facilities, classroom additions, and extensive renovations, while the 2001 bond issue of $126.5 million built or renovated Early Childhood Education Program facilities at 51 campuses, music facilities at the eight traditional high schools, and continued the improvement of the District’s aging facilities. The 2010 bond funded improvements to schools across the district, program enhancements for high schools and middle schools and additional campus upgrades. In addition, major renovations were completed for the Alamo Stadium and Convocation Center. The 2016 bond will continue to fund improvements to overhaul 13 campuses including facilities that have not been recently updated at 7 high schools, 4 middle schools, and 2 elementary schools. The District is more than 100 years old and has been recognized by South Central Texas Chapter of the Council of Educational Facility Planners International (CEFPI) for its significant efforts to preserve historical structures. Two campuses and the SAISD Central Office are listed in the National Register of Historic Places and Jefferson High School is a National Historic Landmark. As the chart below demonstrates, a vast majority of our campuses have at least one building that is more than 50 years old with varying degrees of renovation and facility improvement needs.
165

1997 BOND PROGRAM UPDATE
Through the $483.5 million 1997 Bond Program, six campuses received entirely new school buildings. Major additions and renovations were constructed at 76 schools and air-conditioned physical education facilities were added at 51 schools. Students enrolled at the Estrada Achievement Center are now at the former Barkley Elementary site at 1112 South Zarzamora St. It features renovated classrooms, amenities, a paved parking lot, and a new multi-purpose building. 2001 BOND PROGRAM UPDATE The $126.5 million 2001 Bond Program provided the impetus to create specially-designed facilities for the youngest students – those who are enrolled in the Early Childhood Education Program, and to construct music facilities at the eight traditional high schools. Stand-alone Early Childhood Education Program facilities were built at 31 elementaries while existing classrooms at 22 were modified to accommodate this program that gives pre-kindergarten students a strong academic foundation. Another new Early Childhood Education Program facility opened at Navarro Academy as a joint project with the University of Texas at San Antonio. The newly-constructed music buildings feature the latest state-of-the-art facilities for band, choral, mariachi and orchestra students. The buildings have large performance halls, sound module rooms with recording equipment, and computer labs where young composers can create their own music. Total cost for the buildings was $41.5 million. Interest earnings of approximately $119 million from both programs have funded additional capital projects not originally part of the bond plans. These are: $4.5 million used for a new furniture replacement program; $40 million for deferred maintenance and other projects; approximately $25 million for the new pre-kinder to grade 8 Mission Academy for San Antonio’s fast-growing Southeast Side; and $23.6 million for additional improvements. All of the 1997 and 2001 bond program projects are complete and occupied. 2010 BOND PROGRAM UPDATE The $515 million 2010 bond program provided $43.9 million in safety and security upgrades, $6.2 million in technology upgrades, $347.4 million for renovations and additions to selected elementary and secondary schools, $73.8 million in vocation & career instruction enhancements, $6.1 million in playgrounds and athletic tracks, $35 million to Alamo Stadium and Convocation Center renovations and $2.5 million in transportation efficiencies. The 2010 bond program allowed for restructuring plans and consolidation of five schools. No bond funds were used on schools proposed for consolidation- those schools were maintained out of the District operating budget. The five schools to be consolidated were: Brewer, Nelson, Steele and W.W. White elementary schools and Austin Academy. The consolidation took place before the 2015-16 school year, and only after the main receiving schools had been fully renovated to model schools. All of the 2010 bond program projects are complete and occupied.
2016 BOND PROGRAM UPDATE
The $450 million 2016 bond program will provide extensive renovations at 13 aging schools, including replacing infrastructure that, in many cases, is more than 40 years old. The bond will provide $318 million in funding for 7 high schools, $97.5 million for 4 middle schools, $23 million for 2 elementary schools, and $11.5
166
million for program management and cost of issuance fees. The renovations include upgrades to mechanical and electrical systems, plumbing, renovations to address accessibility, and other infrastructure needs. In addition, the bond will provide much needed upgrades to science labs and core classrooms, including technology upgrades and in some cases increased room sizes to meet TEA standards. Child Nutrition Services will be upgraded with new kitchen equipment and more efficient layouts. During the 2018-19 school year, all 13 projects received Guaranteed Maximum Prices (GMP) from the assigned Construction-Manager-at-Risk (CMAR) contractors within the allocated budgets. Construction on these projects have been on-going with the majority of the projects being substantially complete and delivered to schools for occupancy. The majority of classroom construction is expected to be completed by Winter 2021. 2020 BOND PROGRAM UPDATE Bond 2020 is a $1.3 billion program involving 36 campuses. This includes 21 schools whose main buildings have not been fully renovated in more than 50 years, and most with 30-year-old infrastructure. In addition, funds will go toward the final phase to complete campus renovations at 15 schools that received partial renovations under Bond 2016 or Bond 2010. Of the 43 schools with the oldest infrastructure on the long-range facilities master plan, this bond will fund renovations for nearly half of them, and completely renovate the majority of the largest schools. All SAISD schools will benefit from the 2020 bond with security upgrades. In addition, all outdated air-conditioning chillers will be replaced, benefiting another 30 campuses, and at the 21 aging schools to receive renovations, high-quality, modern HVAC systems will be installed as part of that work, boosting indoor air quality by allowing for fresh air from the outside to be pulled into the system and circulated throughout the school. IMPACT ON OPERATING BUDGET
We are fortunate to have strong community support behind our Capital Improvement bond initiatives. Bond 2020 represents the first phase of implementation of Masterplan 2030. The current bond concentrates on renovating or replacing existing facilities to align with the District’s new Educational Specifications. However, the new or updated buildings include more safety and security systems that must be incorporated into our annual maintenance budget. The Deferred Maintenance Program was successful in replacing old equipment with more efficient equipment, resulting in lower operating costs. The District’s conservation efforts that include new energy-efficient appliances, infrastructure and improved maintenance have resulted in decreased consumption of gas and electricity. Many of the projects resulted in planned increases in campus square footage, which naturally comes with added operating and maintenance costs. Most recently, many of the added buildings were programmatic enhancements such as state-of-the-art Career & Technology buildings, additional computer labs, and special purpose facilities such as dance studios. These enhancements to the District’s offerings are expected to improve our ability to attract students and families to our District and improve the trajectory of student enrollment. Historically the District has applied for and received rebates from CPS Energy for investments in energy efficient upgrades. These included new HVAC equipment, lighting upgrades, and efficient appliances. 2016 Bond facilities were designed with energy efficiency in mind and all available rebates were pursued to ensure that the buildings operate efficiently. The net effect resulting from more efficient buildings and replaced or renovated square footage is expected to generate a net savings to operational costs across the district. All savings generated due to operations will be reinvested into the classroom in support of the academic initiatives.
167

SAISD ENERGY & SUSTAINABILITY INITIATIVES With utility rates increasing over time, the District has made energy efficiency and lean operations priorities to constrain the impact of these rising costs. Through participation in the programs mentioned below and intensive monitoring by staff, the District reduced utility costs by more than $300,000 in FY 2020-2021 compared to the prior fiscal year and over $2.2 million compared to the FY 2017-2018 baseline.
LED Retrofit Program. Building on past success in lighting upgrades from fluorescent T12 to T8 lamps, the District is now making investments in light emitting diodes (LEDs). LED technology has the potential to reduce lighting energy consumption by 60% or more and drastically reduce maintenance costs associated with replacing lighting. In 2021, 12 partial interior LED upgrades were completed (mainly to gyms), which will
save the District over $30,100/year and have an average payback of 4.8 years. At least 3 more locations are slated for upgrades in the coming months.
Comprehensive interior LED upgrades in at least 10 campuses are complete or will be completed through the 2016 Bond before the end of the year and rebates will be pursued for these projects.
CPS Energy Demand Response Program. This program encourages the curtailment of electric
demand (kW) during peak energy events. Participants are paid an incentive based on their performance during the contract period. SAISD’s participation in the program began in 2014 and has brought in the following amounts per year: 2014: $44,712 2015: $100,648 2016: $41,814 2017: $178,365 2018: $192,408 2019: $162,474 2020: $268,165 2021: $240,952
CPS Energy Score Program. The District pursues rebates and incentives for HVAC, lighting,
and other upgrades through CPS Energy’s Schools Conserving Resources (SCORE) program. In 2019-2020, rebates totaled over $500,000 and this year total rebates are expected to exceed $600,000.
Utility Bill Cost Savings Program. This initiative was designed by staff to closely monitor the
consumption of SAISD utilities throughout the year and eliminate waste wherever possible.
Water, gas, and electric accounts are researched, sorted, and set up on spreadsheets to monitor all bills, credits, over-charges, incorrect billings, actual usages, and dollar amounts. Accounts continue to be added/deleted as needed. Coordination with SAISD Accounts Payable Department continues to take place.
Significant water leaks are monitored and repaired as quickly as possible, and Facilities
Services seeks reimbursements from SAWS for all large leaks that are repaired. Large water accounts are now being monitored with devices that provide real-time water consumption data to better track consumption patterns and more quickly respond to leaks.
168
Facilities Services continues to look for water efficiency opportunities to reduce utility costs and preserve this vital resource.
All District facilities and utility accounts have been entered into Portfolio Manager® to
track energy and water consumption and costs. Portfolio Manager® tracks these metrics, performs analytics on facility performance, and provides reports based on available metrics. This online tool is managed by the US EPA and is available at no cost to the District.
Updated Energy Policy. In April 2018, the Board approved revisions to CL(LOCAL), which now serves as the District’s energy policy. The associated Administrative Procedures, C31, were also updated and include a myriad of standards and practices that have reduced energy consumption and operating costs related to HVAC, lighting, and other energy-intensive systems. The Administrative Procedures are regularly reviewed and updated as necessary based on user feedback and changing facility needs.
Energy Master Plan and RMS. The Board endorsed an Energy Master Plan for the District in August 2018, including a goal to reduce energy consumption 30% below 2017-2018 levels by 2021. The District also signed up for the Resource Management Services (RMS) program, which is a behavior-based energy conservation initiative that serves as a starting point towards meeting the 30% savings goal. The newest phase in this program is to expand student engagement and tie energy conservation efforts into academic programs.
Student Engagement. Energy & Sustainability staff actively seek out student engagement
opportunities to further the energy & water conservation goals of the program and enhance the educational experience. Recent efforts include project-based learning activities to help increase awareness and participation in the areas of resource conservation at the campus level.
Chiller Tune-Ups. Facilities Services is piloting a chiller tune-up program for a custom rebate.
This program is based on preventive maintenance best practices that improve chiller reliability and reduce electrical demand (kW) and energy (kWh) usage associated with cooling and will be evaluated with data provided through the building automation system or data loggers. Tune-ups will be completed on 10 chillers with energy savings data being evaluated by CPS Energy. Once the results are complete, the data will be used to calculate a rebate based on verified savings. If the pilot tune-ups yield adequate savings, Facilities plans to complete chiller tune-ups at multiple campuses using incentives received from past projects.
HVAC Controls and Equipment Upgrades. The district replaces unreliable, inefficient air conditioning and controls systems every year. This past summer, chillers and controls were upgraded at 6 campuses with units that are energy efficient and more reliable. These were commissioned by a 3rd-party engineer to ensure the controls and mechanical systems operate as intended and result in lower energy and operating costs. Facilities Services plays a central role in the design review and throughout the construction & closeout periods, which includes spearheading the CPS Energy rebate process for these upgrades.
Building Retrocommissioning. Using in-house resources while leveraging 3rd-party engineering support, Facilities Services completed retrocommissioning (building fine-tuning) at 4 campuses in 2021. Campuses were selected based on high utility costs and work order volumes and were addressed by taking an in-depth review of controls and mechanical systems to identify, and solve, the root causes of operating deficiencies. As a result, user complaints have been drastically reduced while improving the energy performance of these facilities.
169
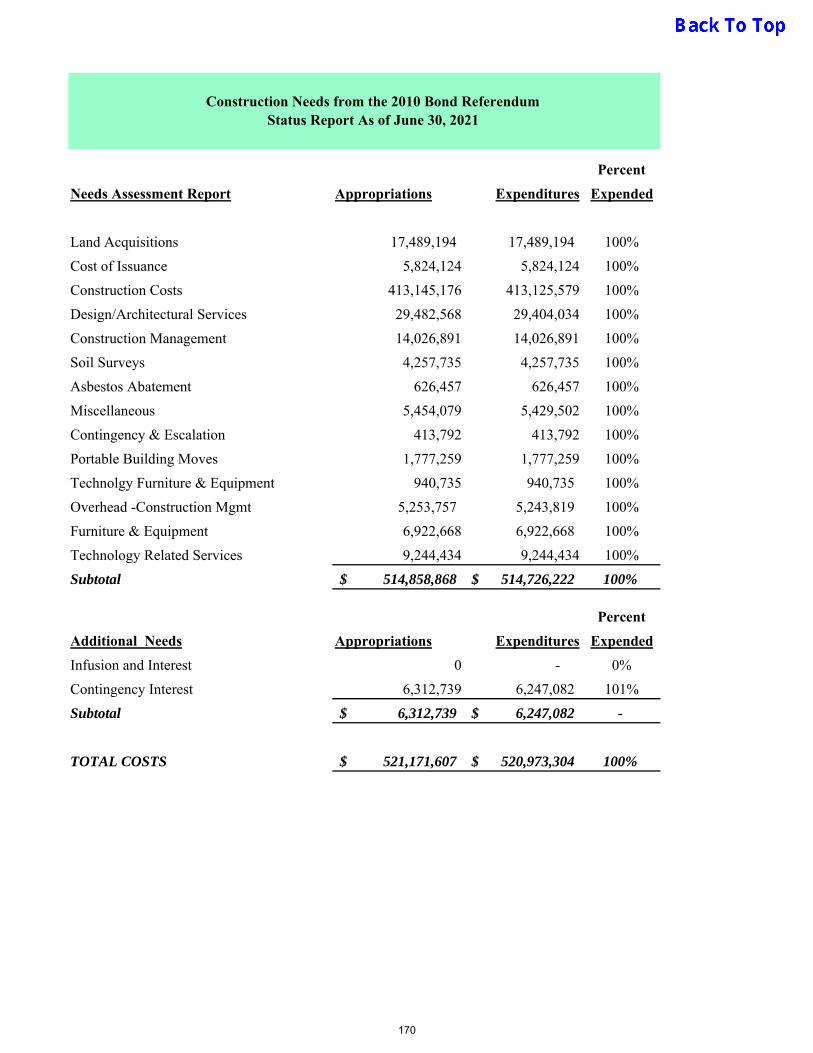
Percent
Needs Assessment Report Appropriations Expenditures Expended
Land Acquisitions 17,489,194 17,489,194 100%
Cost of Issuance 5,824,124 5,824,124 100%
Construction Costs 413,145,176 413,125,579 100%
Design/Architectural Services 29,482,568 29,404,034 100%
Construction Management 14,026,891 14,026,891 100%
Soil Surveys 4,257,735 4,257,735 100%
Asbestos Abatement 626,457 626,457 100%
Miscellaneous 5,454,079 5,429,502 100%
Contingency & Escalation 413,792 413,792 100%
Portable Building Moves 1,777,259 1,777,259 100%
Technolgy Furniture & Equipment 940,735 940,735 100%
Overhead -Construction Mgmt 5,253,757 5,243,819 100%
Furniture & Equipment 6,922,668 6,922,668 100%
Technology Related Services 9,244,434 9,244,434 100%
Subtotal 514,858,868$ 514,726,222$ 100%
Percent
Additional Needs Appropriations Expenditures Expended
Infusion and Interest 0 - 0%
Contingency Interest 6,312,739 6,247,082 101%
Subtotal 6,312,739$ 6,247,082$ -
TOTAL COSTS 521,171,607$ 520,973,304$ 100%
Construction Needs from the 2010 Bond Referendum Status Report As of June 30, 2021
170

Percent
Needs Assessment Report Appropriations Expenditures Expended
Land Acquisitions - - -
Cost of Issuance 3,154,890 3,154,890 100%
Construction Costs 293,388,978 264,795,731 90%
Design/Architectural Services 18,611,612 17,149,536 92%
Owner's Fees & Costs 48,034 48,034 100%
Soil Surveys 3,640,273 2,500,314 69%
Asbestos Abatement 830,078 615,651 74%
Miscellaneous 2,413,002 2,017,118 84%
Portable Building Moves 4,331,919 4,139,103 96%
Technology Furniture & Equipment 2,461,782 2,280,094 93%
Overhead -Construction Mgmt 12,967,225 10,647,250 82%
Technology Related Services 1,417,928 1,274,941 90%
Subtotal 343,265,720$ 308,622,660$ 90%
TOTAL COSTS 343,265,720$ 308,622,660$ 90%
Construction Needs from the 2016 Bond Referendum Status Report As of June 30, 2021
171
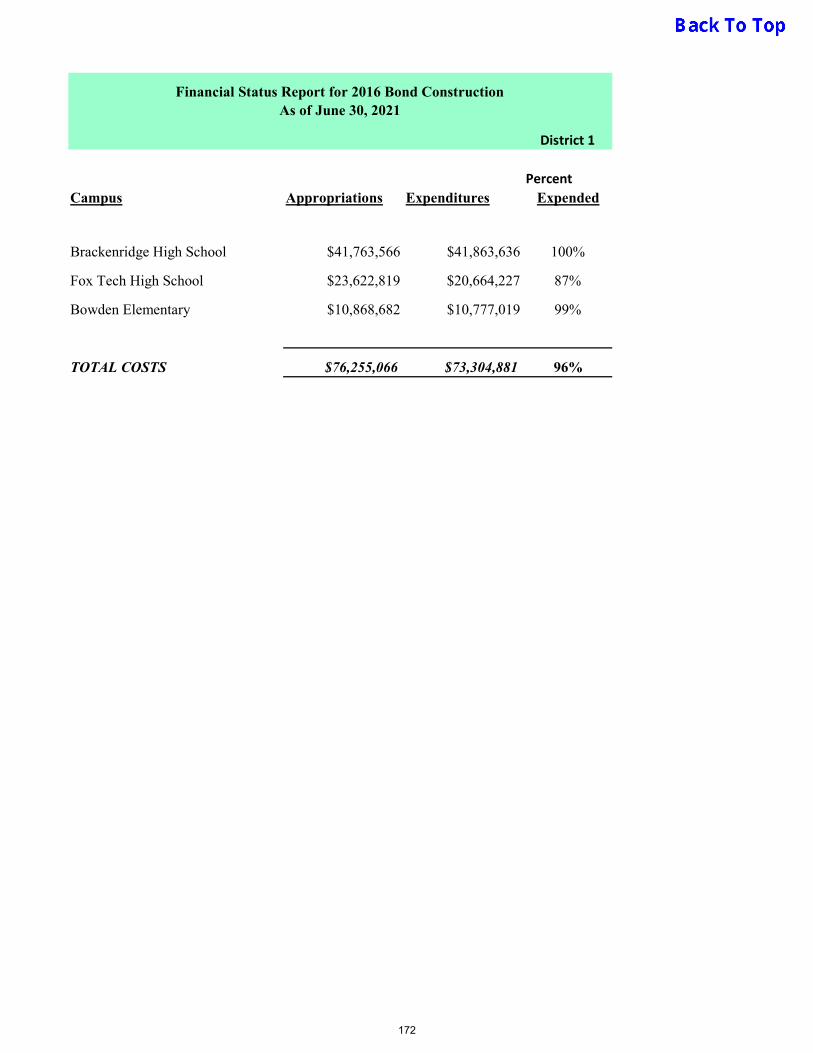
District 1
PercentCampus Appropriations Expenditures Expended
Brackenridge High School $41,763,566 $41,863,636 100%
Fox Tech High School $23,622,819 $20,664,227 87%
Bowden Elementary $10,868,682 $10,777,019 99%
TOTAL COSTS $76,255,066 $73,304,881 96%
Financial Status Report for 2016 Bond ConstructionAs of June 30, 2021
172
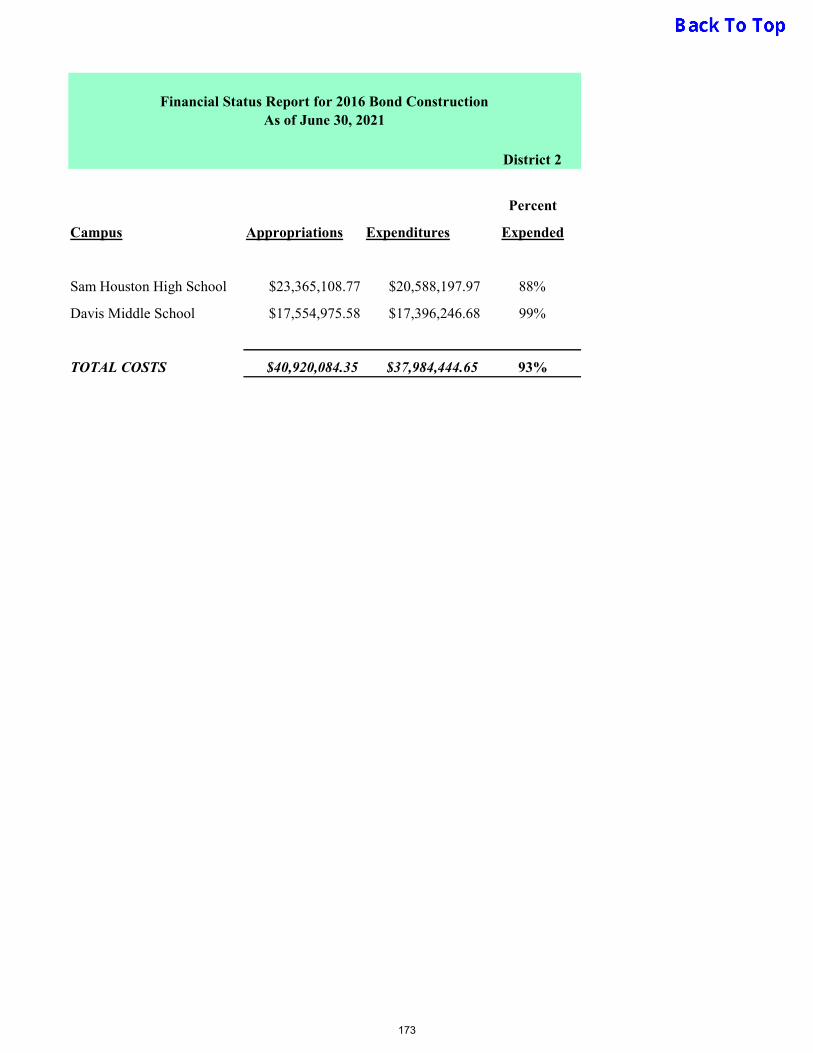
District 2
Percent
Campus Appropriations Expenditures Expended
Sam Houston High School $23,365,108.77 $20,588,197.97 88%
Davis Middle School $17,554,975.58 $17,396,246.68 99%
TOTAL COSTS $40,920,084.35 $37,984,444.65 93%
Financial Status Report for 2016 Bond ConstructionAs of June 30, 2021
173

District 3
Percent
Campus Appropriations Expenditures Expended
Rogers Middle School $24,578,989 $21,456,469 87%
TOTAL COSTS $24,578,989 $21,456,469 87%
Financial Status Report for 2016 Bond ConstructionAs of June 30, 2021
174
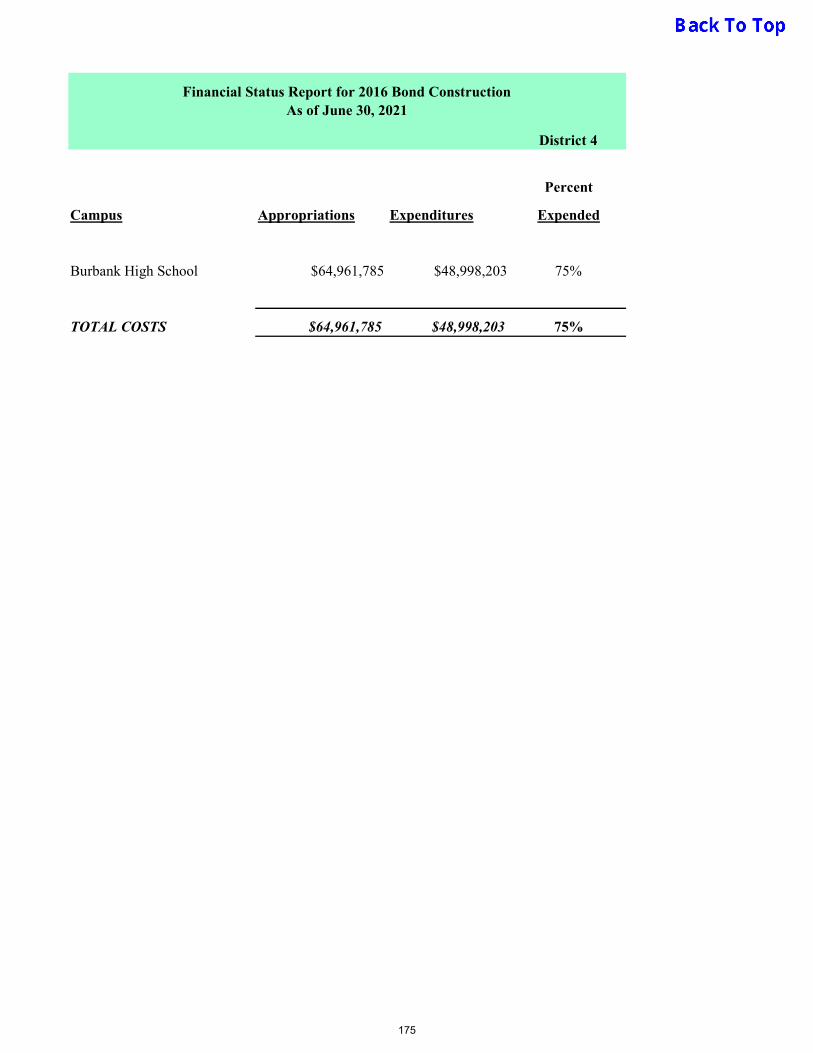
District 4
Percent
Campus Appropriations Expenditures Expended
Burbank High School $64,961,785 $48,998,203 75%
TOTAL COSTS $64,961,785 $48,998,203 75%
Financial Status Report for 2016 Bond ConstructionAs of June 30, 2021
175

District 5
Percent
Campus Appropriations Expenditures Expended
Lanier High School $40,341,113 $32,363,062 80%
Irving Middle School $20,361,349 $20,062,970 99%
JT Brackenridege Elementary $11,803,089 $10,532,015 89%
Tafolla Middle School $22,496,001 $21,597,849 96%
TOTAL COSTS $95,001,552 $84,555,896 89%
Financial Status Report for 2016 Bond ConstructionAs of June 30, 2021
176

District 6
Percent
Campus Appropriations Expenditures Expended
Edison High School $25,758,908 $25,015,723 97%
TOTAL COSTS $25,758,908 $25,015,723 97%
Financial Status Report for 2016 Bond ConstructionAs of June 30, 2021
177

District 7
Percent
Campus Appropriations Expenditures Expended
Jefferson High School $52,491,642 $41,772,301 80%
TOTAL COSTS $52,491,642 $41,772,301 80%
Financial Status Report for 2016 Bond ConstructionAs of June 30, 2021
178
SAISD BOND 2016
The SAISD Board of Trustees called for $450 million bond and voters approved on November 8, 2016. The fundingwould pay for major renovaions at 13 schools, replacing infrastructure systems that are more than 40 years old.Renovations will include upgrading science labs and expanding other classroom spaces to meet state guidelines.
Bond Proposal Summary:Renovations and Additions…........................................... $438.5 million Elementary Schools …................................................. $23.1 million Middle Schools …....................................................... $97.5 million High Schools …........................................................... 317.9 million
Project Management …............................................................................. $8.8 millionBond Issuance …....................................................................................... $2.7 millionTotal …..................................................................................................... $450 million
Bond SalesSAISD Bond 2016 Total $450,000,000Bond Sale #1 issued (Fund 651) $200,000,000Bond Salw #2 issued (Fund 652) $200,000,000
Unissued Balance $50,000,000
SWMBEThe District's SWMBE participation goal is 20%.
EXECUTIVE SUMMARY
179
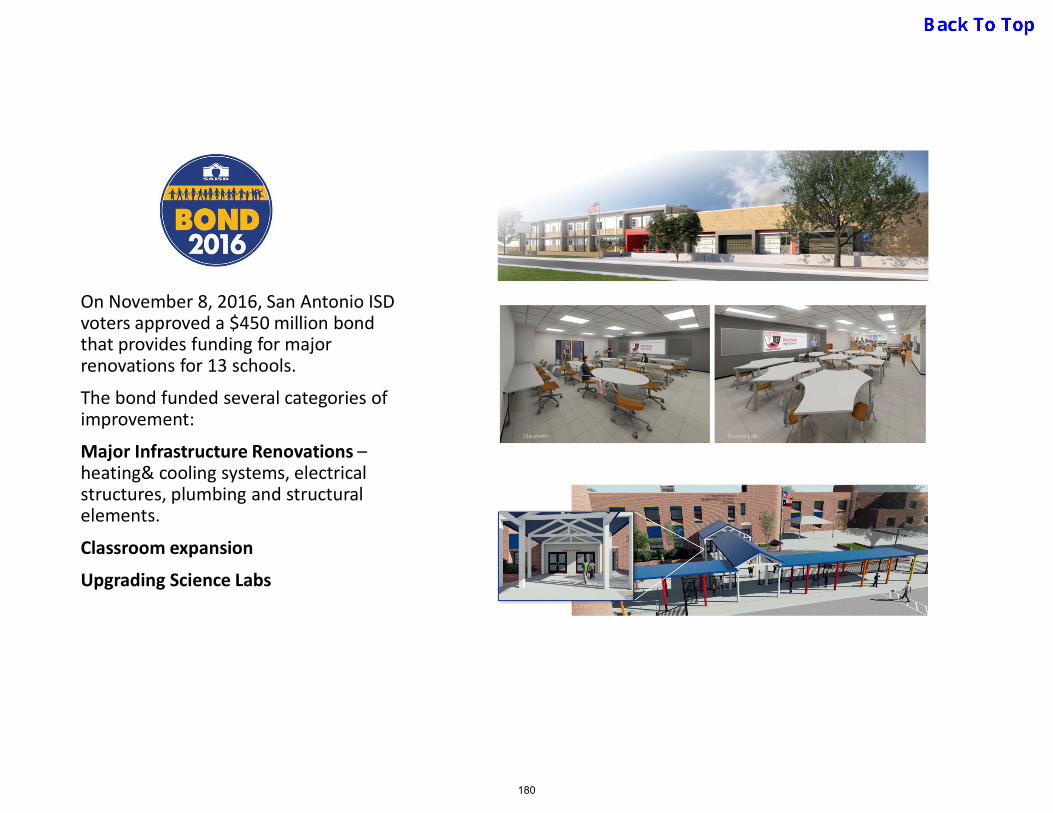
On November 8, 2016, San Antonio ISD voters approved a $450 million bond that provides funding for major renovations for 13 schools.
The bond funded several categories of improvement:
Major Infrastructure Renovations –heating& cooling systems, electrical structures, plumbing and structural elements.
Classroom expansion
Upgrading Science Labs
180
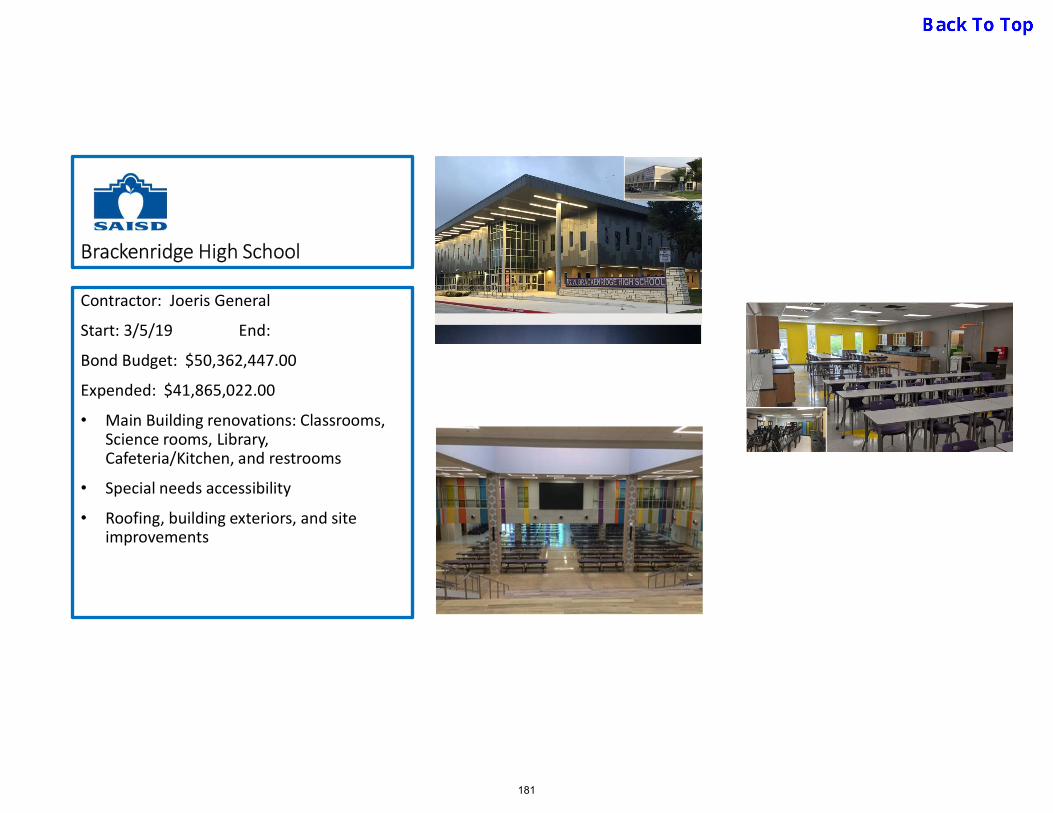
Brackenridge High School
Contractor: Joeris General
Start: 3/5/19 End:
Bond Budget: $50,362,447.00
Expended: $41,865,022.00
• Main Building renovations: Classrooms, Science rooms, Library, Cafeteria/Kitchen, and restrooms
• Special needs accessibility
• Roofing, building exteriors, and site improvements
181
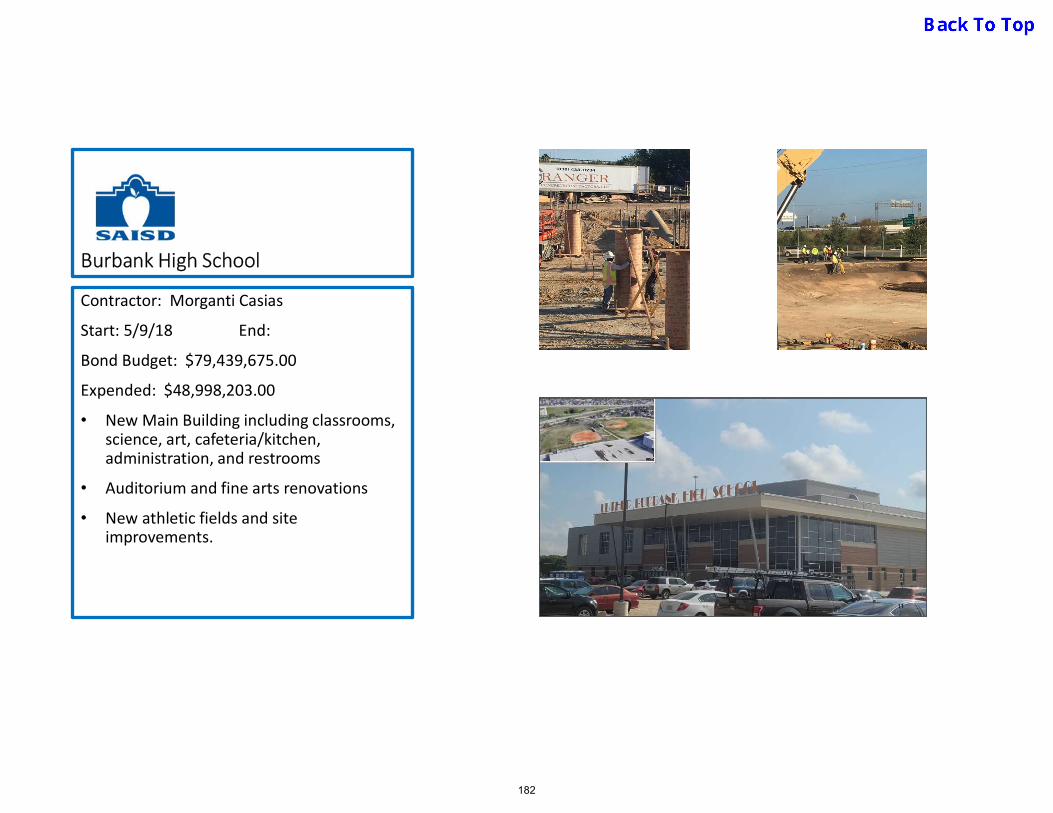
Burbank High School
Contractor: Morganti Casias
Start: 5/9/18 End:
Bond Budget: $79,439,675.00
Expended: $48,998,203.00
• New Main Building including classrooms, science, art, cafeteria/kitchen, administration, and restrooms
• Auditorium and fine arts renovations
• New athletic fields and site improvements.
182
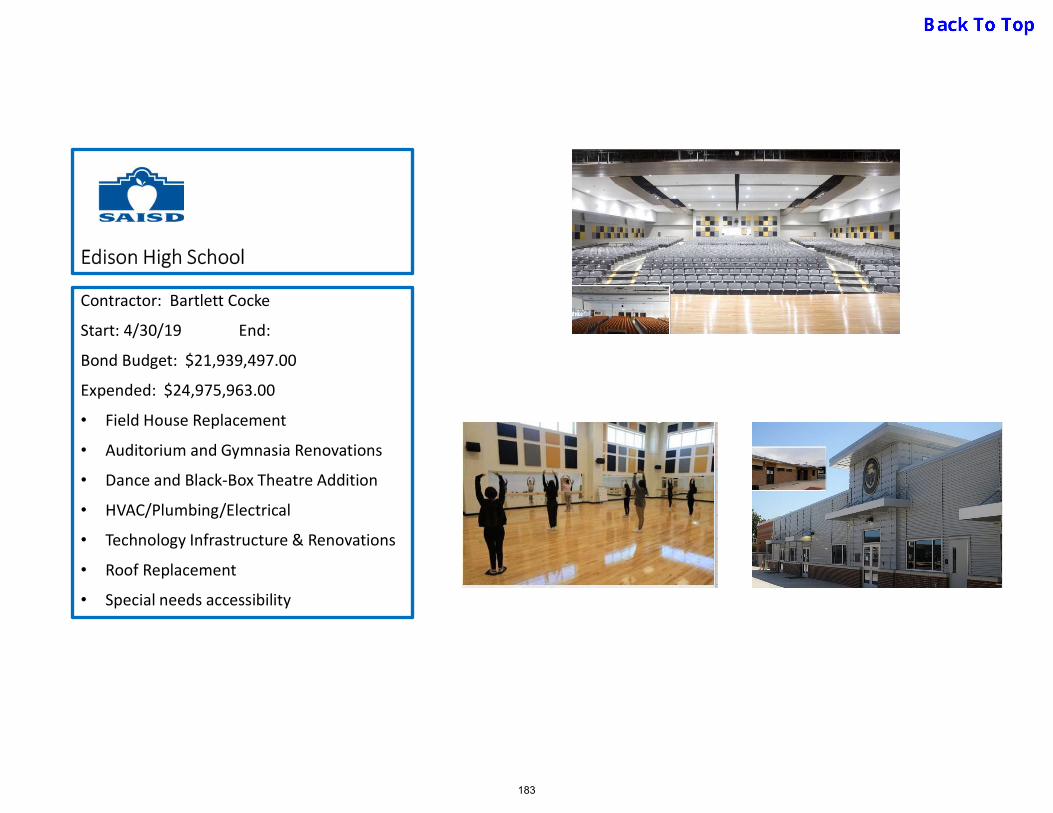
Edison High School
Contractor: Bartlett Cocke
Start: 4/30/19 End:
Bond Budget: $21,939,497.00
Expended: $24,975,963.00
• Field House Replacement
• Auditorium and Gymnasia Renovations
• Dance and Black-Box Theatre Addition
• HVAC/Plumbing/Electrical
• Technology Infrastructure & Renovations
• Roof Replacement
• Special needs accessibility
183

Fox Tech High School
Contractor: Bartlett Cocke
Start: 3/5/19 End:
Bond Budget: $26,264,880.00
Expended: $20,588,198.00
• Renovate: classroom spaces, restrooms
• Replaced cafeteria/kitchen
• Added science and make-ready areas
• Special Education office constructed on 1st floor
• HVAC/Plumbing/Electrical
• Technology Infrastructure
• Lighting
184

Sam Houston High School
Contractor: Joeris General
Start: 5/17/19 End:
Bond Budget: $33,190,150.00
Expended: $28,174,630.00
• Renovate: classroom spaces, restrooms, cafeteria/kitchen
• Special needs accessibility in entryways
• HVAC/Plumbing/Electrical
• Technology Infrastructure
• Lighting
• Roofing, building exterior and site improvements.
185

Jefferson High School
Contractor: Bartlett Cocke
Start: 10/10/18 End:
Bond Budget: $59,816,244.00
Expended: $176,291.00
• Renovated black box theater, gymnasia, athletic field house, cafeteria/kitchen, and auditorium
• Main building classroom renovations
• Foundation repairs
• Fire Sprinkler System
• Special needs accessibility
• Front entry modifications
• Roofing and site improvements.
186

Lanier High School
Contractor: Gilbane Building
Start: 5/6/19 End:
Bond Budget: $46,894,508.00
Expended: $32,363,062.00
• Renovated classroom spaces, science rooms, restrooms, cafeteria/kitchen
• Special Education classrooms
• HVAC/Plumbing/Electrical
• Technology Infrastructure
• Lighting
• Roofing, building exteriors and site improvements.
187

Davis Middle School
Contractor: Joeris General
Start: 3/15/19 End: 8/7/2020
Bond Budget: $20,286,485.00
Expended: $17,396,247.00
• Renovate: classroom spaces, restrooms, cafeteria/kitchen, and auditorium
• Special needs accessibility
• Roofing and site improvements
• Technology Infrastructure
• Lighting
• Fire sprinkler systems
188

Rogers Middle School
Contractor: Gilbane Building
Start: 4/16/19 End:
Bond Budget: $28,790,583.00
Expended: $21,456,469.00
• New classroom and administration building
• Site improvement
189
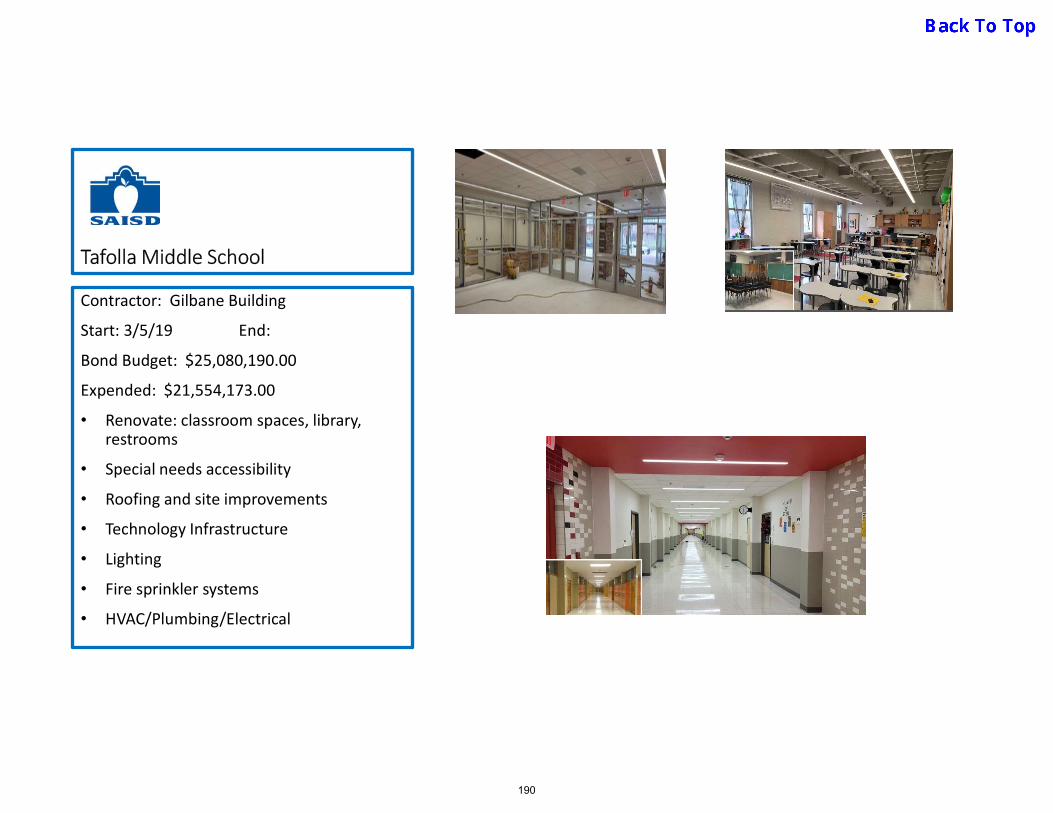
Tafolla Middle School
Contractor: Gilbane Building
Start: 3/5/19 End:
Bond Budget: $25,080,190.00
Expended: $21,554,173.00
• Renovate: classroom spaces, library, restrooms
• Special needs accessibility
• Roofing and site improvements
• Technology Infrastructure
• Lighting
• Fire sprinkler systems
• HVAC/Plumbing/Electrical
190
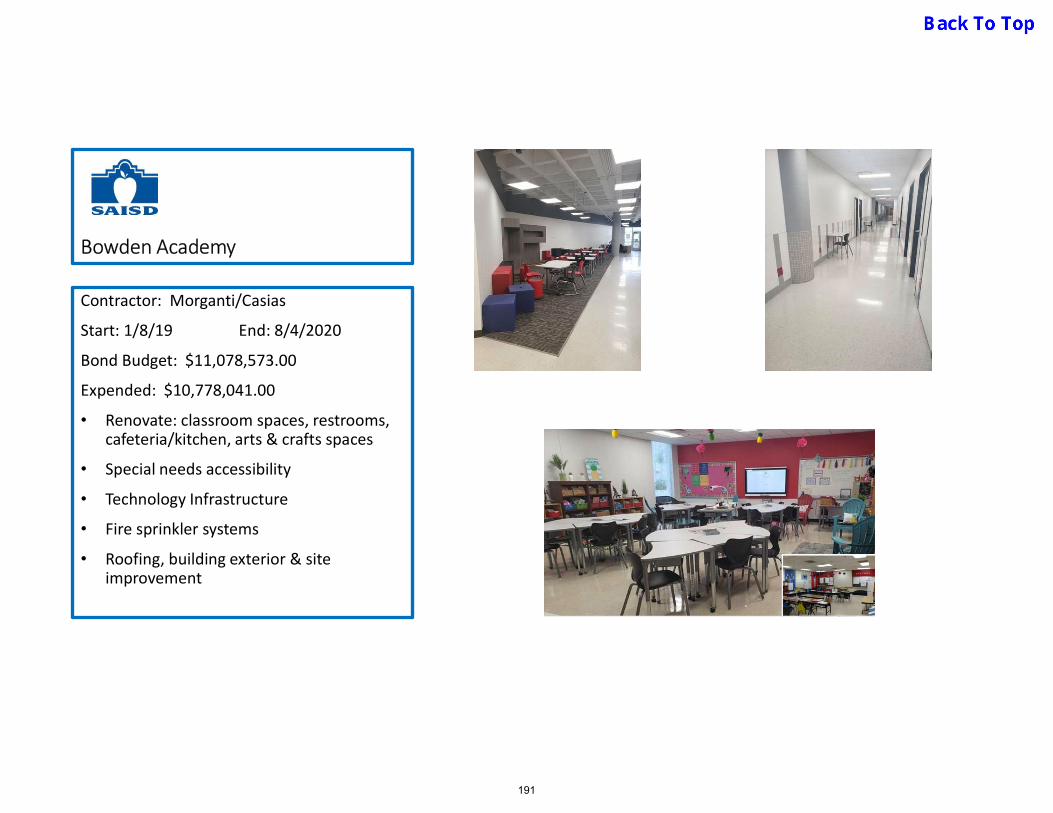
Bowden Academy
Contractor: Morganti/Casias
Start: 1/8/19 End: 8/4/2020
Bond Budget: $11,078,573.00
Expended: $10,778,041.00
• Renovate: classroom spaces, restrooms, cafeteria/kitchen, arts & crafts spaces
• Special needs accessibility
• Technology Infrastructure
• Fire sprinkler systems
• Roofing, building exterior & site improvement
191
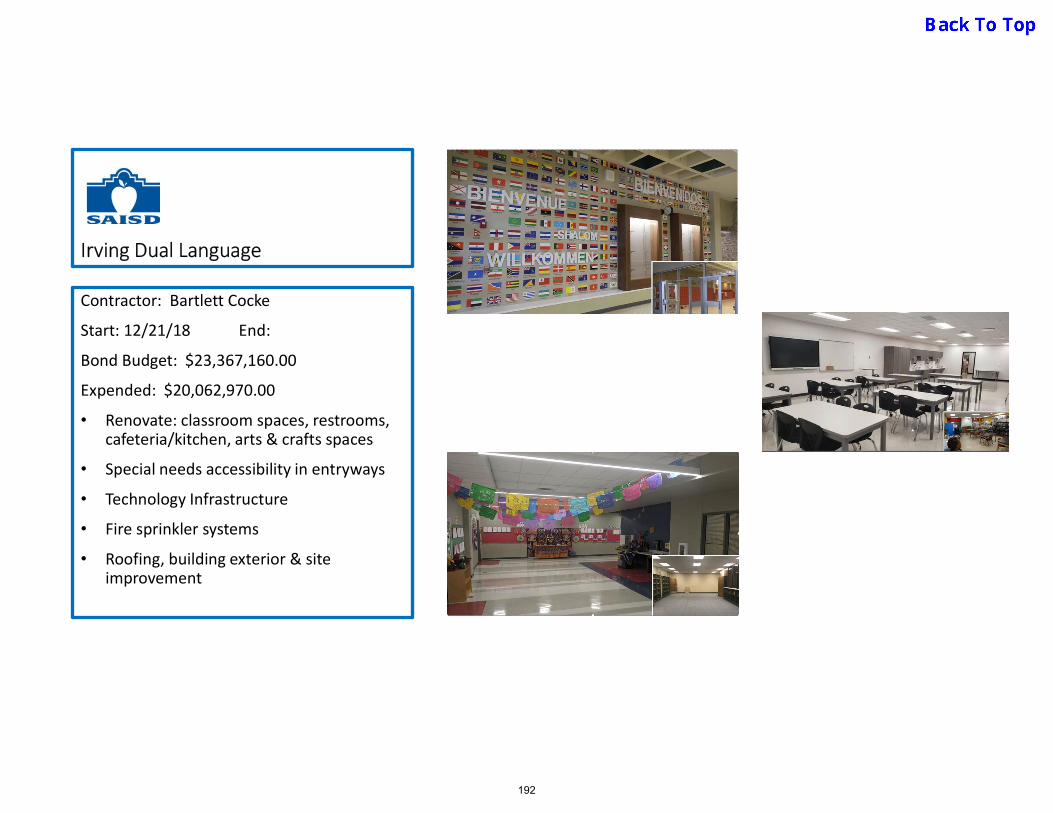
Irving Dual Language
Contractor: Bartlett Cocke
Start: 12/21/18 End:
Bond Budget: $23,367,160.00
Expended: $20,062,970.00
• Renovate: classroom spaces, restrooms, cafeteria/kitchen, arts & crafts spaces
• Special needs accessibility in entryways
• Technology Infrastructure
• Fire sprinkler systems
• Roofing, building exterior & site improvement
192
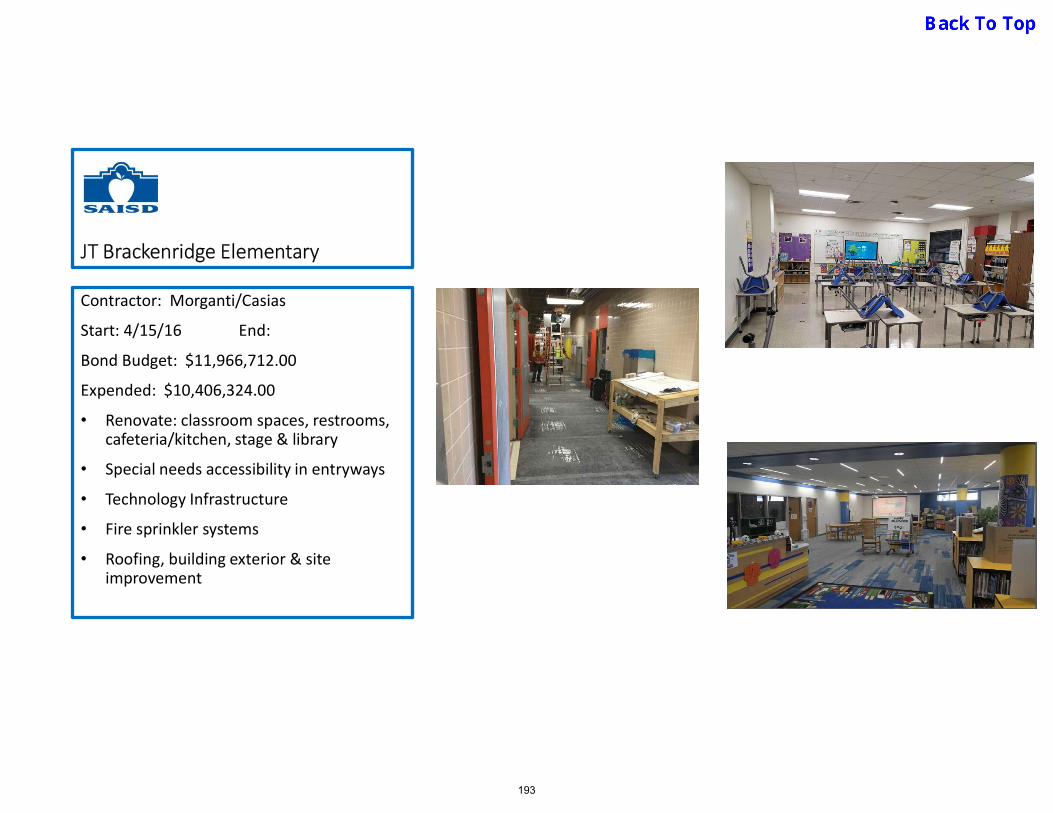
JT Brackenridge Elementary
Contractor: Morganti/Casias
Start: 4/15/16 End:
Bond Budget: $11,966,712.00
Expended: $10,406,324.00
• Renovate: classroom spaces, restrooms, cafeteria/kitchen, stage & library
• Special needs accessibility in entryways
• Technology Infrastructure
• Fire sprinkler systems
• Roofing, building exterior & site improvement
193

2. Annual Property Value Growth increased more than 3% in 2020-21, and is expected to increase byapproximately 2% 2021-22 and by a smaller amount in the coming years. Due to HB3, which waseffective for the 2019-20 school year, there is now a mandated compression of the M&O tax rate, whichwill limit realization of property growth to 2.5%.
FORECAST ASSUMPTIONS FOR GENERAL OPERATING FUND
7. San Antonio ISD did budget for a Board-approved 2% general pay increase for all full-timeemployees for the 2021-2022 school year. In addition, the Board also approved an increase to theDistrict's minimum entry hourly pay rate from $15.00 to $16.00.
1. Average Daily Attendance (ADA) for state funding is expected to remain relatively flat for the nextfew years. Completion of the bond funded building program and growth of existing new choice schoolsmay positively impact enrollment in future years. Since the District did experience a large enrollmentdecline due to Covid-19, the expectation is that a portion of that loss will be recovered in 2021-2022.Subsequent years are projected to be close to flat.
3. In November of 2016, the District held a successful Tax Ratification Election, where theMaintenance and Operations (M&O) tax rate increased from $1.04 to $1.17 per $100 propertyvaluation. The 2019 Texas state legislation mandated a compression of the M&O tax rate to reduceproperty taxes. Under this new legislation, the M&O rate decreased almost sixteen cents from $1.17 to$1.01035.
4. The I&S tax rate is required to be adjusted, if needed, to generate sufficient tax collections to meetdebt service requirements. The Debt Service tax rate will remain the same this year to $0.48125 per$100 property valuation.
5. Tax collections are projected at 98.75%. This is the average tax collection rate the district is expectedto achieve over the next four years.
6. Local revenue, primarily consisting of local property taxes, will increase only slightly due to the state-mandated compression of the M&O tax rate.
194
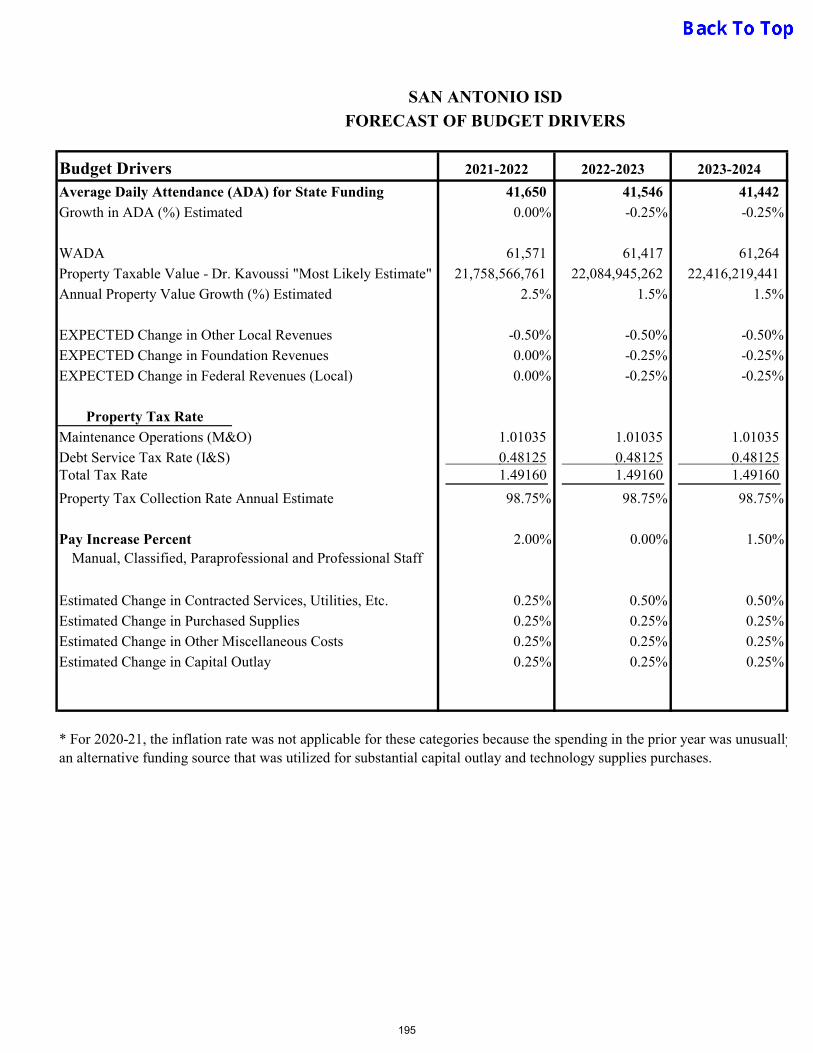
Budget Drivers 2021-2022 2022-2023 2023-2024
Average Daily Attendance (ADA) for State Funding 41,650 41,546 41,442
Growth in ADA (%) Estimated 0.00% -0.25% -0.25%
WADA 61,571 61,417 61,264
Property Taxable Value - Dr. Kavoussi "Most Likely Estimate" 21,758,566,761 22,084,945,262 22,416,219,441
Annual Property Value Growth (%) Estimated 2.5% 1.5% 1.5%
EXPECTED Change in Other Local Revenues -0.50% -0.50% -0.50%
EXPECTED Change in Foundation Revenues 0.00% -0.25% -0.25%
EXPECTED Change in Federal Revenues (Local) 0.00% -0.25% -0.25%
Property Tax Rate
Maintenance Operations (M&O) 1.01035 1.01035 1.01035
Debt Service Tax Rate (I&S) 0.48125 0.48125 0.48125 Total Tax Rate 1.49160 1.49160 1.49160
Property Tax Collection Rate Annual Estimate 98.75% 98.75% 98.75%
2.00% 0.00% 1.50%
Estimated Change in Contracted Services, Utilities, Etc. 0.25% 0.50% 0.50%
Estimated Change in Purchased Supplies 0.25% 0.25% 0.25%
Estimated Change in Other Miscellaneous Costs 0.25% 0.25% 0.25%
Estimated Change in Capital Outlay 0.25% 0.25% 0.25%
* For 2020-21, the inflation rate was not applicable for these categories because the spending in the prior year was unusually low due toan alternative funding source that was utilized for substantial capital outlay and technology supplies purchases.
Pay Increase Percent Manual, Classified, Paraprofessional and Professional Staff
SAN ANTONIO ISD
FORECAST OF BUDGET DRIVERS
195

Estimated Revenues 2021-2022 2022-2023 2023-2024WADA 62,219 61,571 61,417
Local RevenuesProperty Taxes (Current & Delinquent) 215,531,882 218,764,860 222,046,333 Property Tax Penalty & Interest 1,500,000 1,500,000 1,500,000 Other Local Revenue 2,400,002 2,388,002 2,376,062 Total Local Revenues 219,431,884$ 222,652,862$ 225,922,395$
State Revenues 256,498,000 255,856,755 255,217,113
Federal Revenues 11,600,000 11,572,000 11,543,000
Land Sale Proceeds - - - Other Resources - - -
Total Revenues 487,529,884$ 490,081,617$ 492,682,508$
ExpendituresPayroll Costs 402,891,195 402,891,195 408,934,563 Contracted Services 44,734,355 44,958,027 45,182,817 Supplies & Materials 30,752,447 30,829,328 30,906,401 Other Operating 7,728,722 7,748,044 7,767,414 Debt Service - - - Capital Outlay 1,421,116 1,424,669 1,428,230 Other Expenses - - - Total Expenditures 487,527,835$ 487,851,262$ 494,219,426$
Other Uses 2,049 2,049 2,049 Projected Change in Fund Balance -$ 2,228,306$ (1,538,966)$ Beginning Fund Balance 106,000,000$ 106,000,000$ 108,228,306$
Ending Fund Balance 106,000,000$ 108,228,306$ 106,689,339$
Monthly Expenditures 40,627,320 40,654,272 41,184,952 Two Months of Expenditures 81,254,639$ 81,308,544$ 82,369,904$ Number of Months to Operate 2.6 2.6 2.6
GENERAL FUND FORECASTSREVENUES AND EXPENDITURES
196
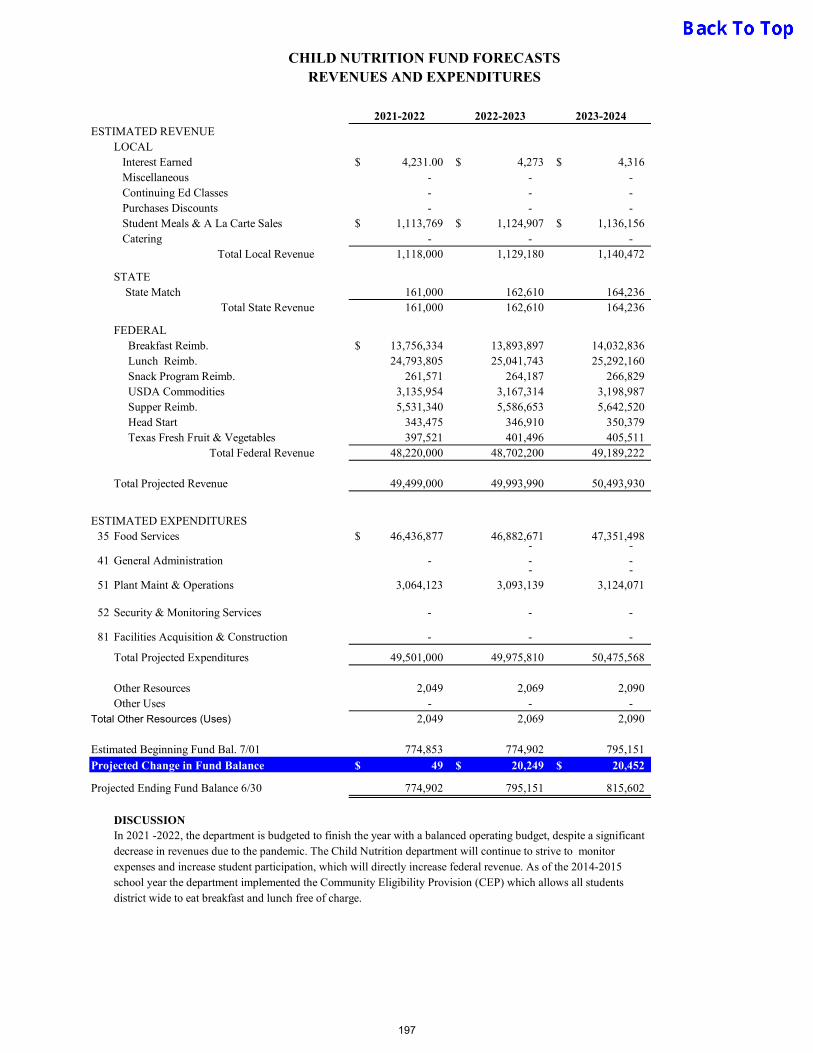
2021-2022 2022-2023 2023-2024ESTIMATED REVENUE
LOCAL Interest Earned 4,231.00$ 4,273$ 4,316$ Miscellaneous - - - Continuing Ed Classes - - - Purchases Discounts - - - Student Meals & A La Carte Sales 1,113,769$ 1,124,907$ 1,136,156$ Catering - - -
Total Local Revenue 1,118,000 1,129,180 1,140,472
STATE State Match 161,000 162,610 164,236
Total State Revenue 161,000 162,610 164,236
FEDERAL Breakfast Reimb. 13,756,334$ 13,893,897 14,032,836 Lunch Reimb. 24,793,805 25,041,743 25,292,160 Snack Program Reimb. 261,571 264,187 266,829 USDA Commodities 3,135,954 3,167,314 3,198,987 Supper Reimb. 5,531,340 5,586,653 5,642,520
Head Start Head Start 343,475 346,910 350,379 Texas Fresh Fruit & Vegetables 397,521 401,496 405,511
Total Federal Revenue 48,220,000 48,702,200 49,189,222
Total Projected Revenue 49,499,000 49,993,990 50,493,930
ESTIMATED EXPENDITURES35 Food Services 46,436,877$ 46,882,671 47,351,498
- - 41 General Administration - - -
- - 51 Plant Maint & Operations 3,064,123 3,093,139 3,124,071
52 Security & Monitoring Services - - -
81 Facilities Acquisition & Construction - - -
Total Projected Expenditures 49,501,000 49,975,810 50,475,568
Other Resources 2,049 2,069 2,090 Other Uses - - -
Total Other Resources (Uses) 2,049 2,069 2,090
Estimated Beginning Fund Bal. 7/01 774,853 774,902 795,151
Projected Change in Fund Balance 49$ 20,249$ 20,452$
Projected Ending Fund Balance 6/30 774,902 795,151 815,602
DISCUSSIONIn 2021 -2022, the department is budgeted to finish the year with a balanced operating budget, despite a significant decrease in revenues due to the pandemic. The Child Nutrition department will continue to strive to monitor expenses and increase student participation, which will directly increase federal revenue. As of the 2014-2015 school year the department implemented the Community Eligibility Provision (CEP) which allows all students district wide to eat breakfast and lunch free of charge.
CHILD NUTRITION FUND FORECASTSREVENUES AND EXPENDITURES
197

2021-2022 2022-2023 2023-2024 2024-2025
ESTIMATED REVENUE
Local Revenue
Investment / Interest Revenue 20,000$ 20,000$ 20,000$ 20,000$
Penalties on Tax Collections 200,000 200,000 200,000 200,000
Tax Revenue 96,214,050$ 97,657,261$ 99,122,120$ 100,608,951$
Total Local Revenue 96,434,050$ 97,877,261$ 99,342,120$ 100,828,951$
State Revenue
IFA/EDA 40,000$ -$ -$ -$
Total State Revenue 40,000$ -$ -$ -$
Federal Revenue
Other Federal Sources 1,650,000$ -$ -$ -$
Total Federal Revenue 1,650,000$ -$ -$ -$
TOTAL PROJECTED REVENUE 98,124,050$ 97,877,261$ 99,342,120$ 100,828,951$
ESTIMATED EXPENDITURES
Miscellaneous Fees -$ -$ -$ -$
71 Principal 54,285,001 46,045,000 44,440,000 27,965,000
72-73 Interest/Fees 50,623,879 50,888,223 48,695,348 46,499,098
TOTAL PROJECTED DEBT SERVICE 104,908,880$ 96,933,223$ 93,135,348$ 74,464,098$
OTHER FINANCING RESOURCESOther Resources -$ -$ -$ -$ Other Uses
Total Other Financing Resources -$ -$ -$ -$
Estimated Beginning Fund Bal. 7/01 128,680,600$ 121,895,770$ 122,839,808$ 129,046,579$ Projected Change in Fund Balance (6,784,830)$ 944,038$ 6,206,772$ 26,364,853$
Projected Ending Fund Balance 6/30 (NOTE 1) 121,895,770$ 122,839,808$ 129,046,579$ 155,411,433$
DISCUSSION
NOTE 1
DEBT SERVICE FUND FORECASTSREVENUES AND EXPENDITURES
The Debt Service Fund realized the majority of revenues from local property tax collections. State Funding in support of the District's
debt payments is expected to be received for only this current year, after which time the support will be phased out due to increasing
local property wealth. The District previously received revenues from the Federal Government due to our participation in the "Build
America Bonds" program, where the revenue is intended to offset the interest on these bonds. However, those bonds will be refunded in
July 2019, and therefore this Federal revenue will not be received in future years. Also, note that the debt service fund balance is
generally increasing each year due to the accumulation of a sinking fund to retire QSCB bonds.
Note that the debt service expenditure requirements will increase in these future years presented as the bonds are issued to complete the
2020 bond construction program.
The Debt Service Fund Balance will continue to grow each year through 2028, due to a "Guaranteed Investment Contract" Long-term
Asset which is a part of the fund balance. The contract will mature and be paid in 2028. The fair market value at Year-end 2020 was
$33.9 million.
198

52.50 41.74 45.89 48.51 50.52 45.32 52.26 53.89 48.72 45.36
3.92 0.57 0.87 0.52 0.38 0.53 0.57 1.14 0.61 0.19
3.33 1.69 2.67 3.32 2.90 2.64 2.40 2.75 2.86 3.87
10.71 18.65 9.87 11.90 11.19 11.57 16.28 16.42 14.77 15.42
6.62 6.26 7.59 8.02 8.26 9.41 5.12 4.79 5.63 7.13
0.62 1.92 2.91 1.16 1.31 2.16 0.65 0.33 0.65 0.81
0.01 0.09 0.00 0.00 0.05 0.12 0.00 0.00 0.10 0.00
0.00 3.09 0.51 1.44 1.98 2.05 1.47 1.21 2.06 1.15
1.61 0.24 3.25 2.62 1.43 2.83 1.26 0.00 1.16 2.80
0.59 0.09 0.83 0.68 0.26 0.30 0.19 0.06 0.53 0.31
0.50 0.59 0.40 0.91 0.35 0.45 0.42 0.72 0.32 0.23
1.55 1.30 1.33 1.95 1.83 0.53 1.72 1.80 1.62 1.74
18.03 23.78 23.88 18.96 19.53 22.09 17.67 16.87 20.98 21.00
Arlington Austin Dallas El Paso Ft.
Worth Houston North East Northside
San Antonio Ysleta
Source: TEA Standard Financial Reports
MAJOR URBAN DISTRICTS(In Alphabetical Order)
PreKindergarten
Early Education AllotmentDyslexia or Related Disorder ServicesCollege, Career, & Military Readiness
Athletics/Related Activities
Un-Allocated
High School Allotment
MAJOR URBAN DISTRICTS COMPARISON BY PROGRAM GENERAL FUND BUDGET 2020-2021
PROGRAM PERCENTAGE OF 2020-2021 BUDGET
Basic Education
Gifted & Talented
Career & Technical
Students with Disabilities
State Compensatory Ed.
Bilingual
199
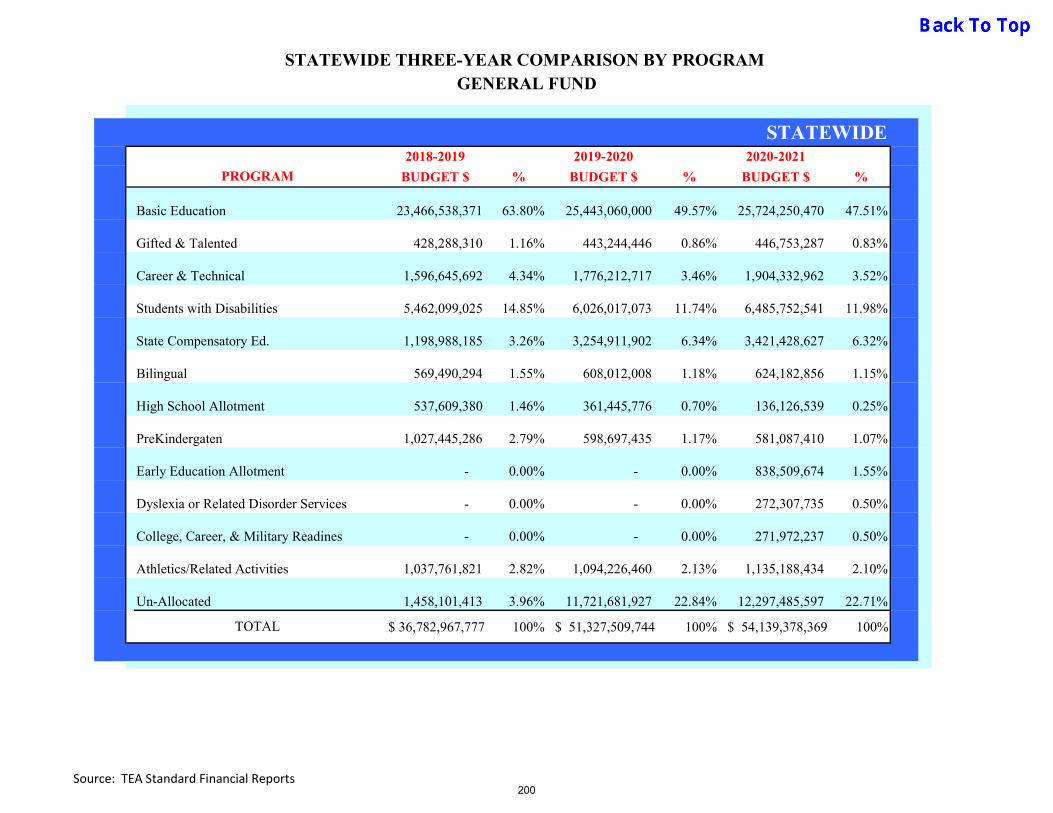
2018-2019 2019-2020 2020-2021
BUDGET $ % BUDGET $ % BUDGET $ %
Basic Education 23,466,538,371 63.80% 25,443,060,000 49.57% 25,724,250,470 47.51%
Gifted & Talented 428,288,310 1.16% 443,244,446 0.86% 446,753,287 0.83%
Career & Technical 1,596,645,692 4.34% 1,776,212,717 3.46% 1,904,332,962 3.52%
Students with Disabilities 5,462,099,025 14.85% 6,026,017,073 11.74% 6,485,752,541 11.98%
State Compensatory Ed. 1,198,988,185 3.26% 3,254,911,902 6.34% 3,421,428,627 6.32%
569,490,294 1.55% 608,012,008 1.18% 624,182,856 1.15%
High School Allotment 537,609,380 1.46% 361,445,776 0.70% 136,126,539 0.25%
1,027,445,286 2.79% 598,697,435 1.17% 581,087,410 1.07%
- 0.00% - 0.00% 838,509,674 1.55%
- 0.00% - 0.00% 272,307,735 0.50%
- 0.00% - 0.00% 271,972,237 0.50%
1,037,761,821 2.82% 1,094,226,460 2.13% 1,135,188,434 2.10%
Un-Allocated 1,458,101,413 3.96% 11,721,681,927 22.84% 12,297,485,597 22.71%
$ 36,782,967,777 100% $ 51,327,509,744 100% $ 54,139,378,369 100%TOTAL
STATEWIDE THREE-YEAR COMPARISON BY PROGRAM GENERAL FUND
STATEWIDE
PROGRAM
Bilingual
PreKindergaten
Early Education Allotment
Dyslexia or Related Disorder Services
College, Career, & Military Readines
Athletics/Related Activities
Source: TEA Standard Financial Reports200
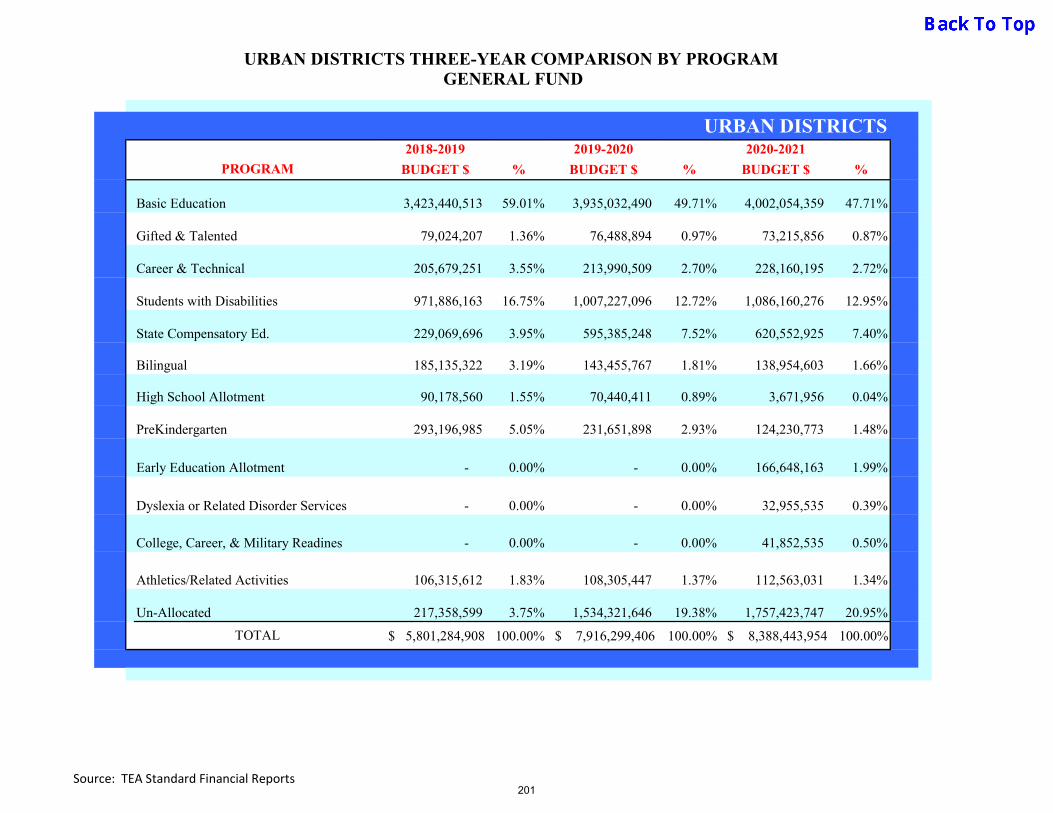
2018-2019 2019-2020 2020-2021
BUDGET $ % BUDGET $ % BUDGET $ %
Basic Education 3,423,440,513 59.01% 3,935,032,490 49.71% 4,002,054,359 47.71%
Gifted & Talented 79,024,207 1.36% 76,488,894 0.97% 73,215,856 0.87%
Career & Technical 205,679,251 3.55% 213,990,509 2.70% 228,160,195 2.72%
Students with Disabilities 971,886,163 16.75% 1,007,227,096 12.72% 1,086,160,276 12.95%
State Compensatory Ed. 229,069,696 3.95% 595,385,248 7.52% 620,552,925 7.40%
185,135,322 3.19% 143,455,767 1.81% 138,954,603 1.66%
High School Allotment 90,178,560 1.55% 70,440,411 0.89% 3,671,956 0.04%
293,196,985 5.05% 231,651,898 2.93% 124,230,773 1.48%
- 0.00% - 0.00% 166,648,163 1.99%
- 0.00% - 0.00% 32,955,535 0.39%
- 0.00% - 0.00% 41,852,535 0.50%
106,315,612 1.83% 108,305,447 1.37% 112,563,031 1.34%
Un-Allocated 217,358,599 3.75% 1,534,321,646 19.38% 1,757,423,747 20.95%
$ 5,801,284,908 100.00% $ 7,916,299,406 100.00% $ 8,388,443,954 100.00%
PreKindergarten
Early Education Allotment
Dyslexia or Related Disorder Services
College, Career, & Military Readines
TOTAL
Athletics/Related Activities
Bilingual
PROGRAM
URBAN DISTRICTS THREE-YEAR COMPARISON BY PROGRAM GENERAL FUND
URBAN DISTRICTS
Source: TEA Standard Financial Reports201
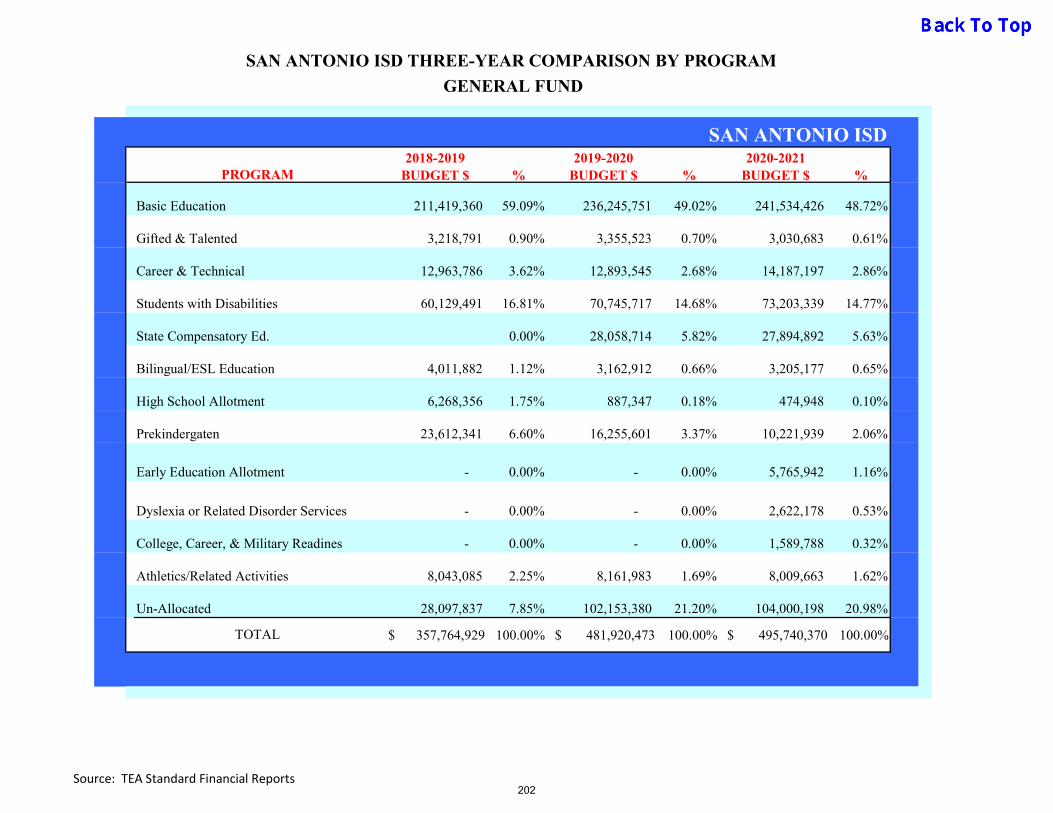
2018-2019 2019-2020 2020-2021BUDGET $ % BUDGET $ % BUDGET $ %
Basic Education 211,419,360 59.09% 236,245,751 49.02% 241,534,426 48.72%
Gifted & Talented 3,218,791 0.90% 3,355,523 0.70% 3,030,683 0.61%
Career & Technical 12,963,786 3.62% 12,893,545 2.68% 14,187,197 2.86%
Students with Disabilities 60,129,491 16.81% 70,745,717 14.68% 73,203,339 14.77%
State Compensatory Ed. 0.00% 28,058,714 5.82% 27,894,892 5.63%
4,011,882 1.12% 3,162,912 0.66% 3,205,177 0.65%
High School Allotment 6,268,356 1.75% 887,347 0.18% 474,948 0.10%
23,612,341 6.60% 16,255,601 3.37% 10,221,939 2.06%
- 0.00% - 0.00% 5,765,942 1.16%
- 0.00% - 0.00% 2,622,178 0.53%
- 0.00% - 0.00% 1,589,788 0.32%
8,043,085 2.25% 8,161,983 1.69% 8,009,663 1.62%
Un-Allocated 28,097,837 7.85% 102,153,380 21.20% 104,000,198 20.98%
$ 357,764,929 100.00% $ 481,920,473 100.00% $ 495,740,370 100.00%TOTAL
Prekindergaten
Early Education Allotment
Dyslexia or Related Disorder Services
College, Career, & Military Readines
Athletics/Related Activities
SAN ANTONIO ISD THREE-YEAR COMPARISON BY PROGRAM
GENERAL FUND
SAN ANTONIO ISD
PROGRAM
Bilingual/ESL Education
Source: TEA Standard Financial Reports202
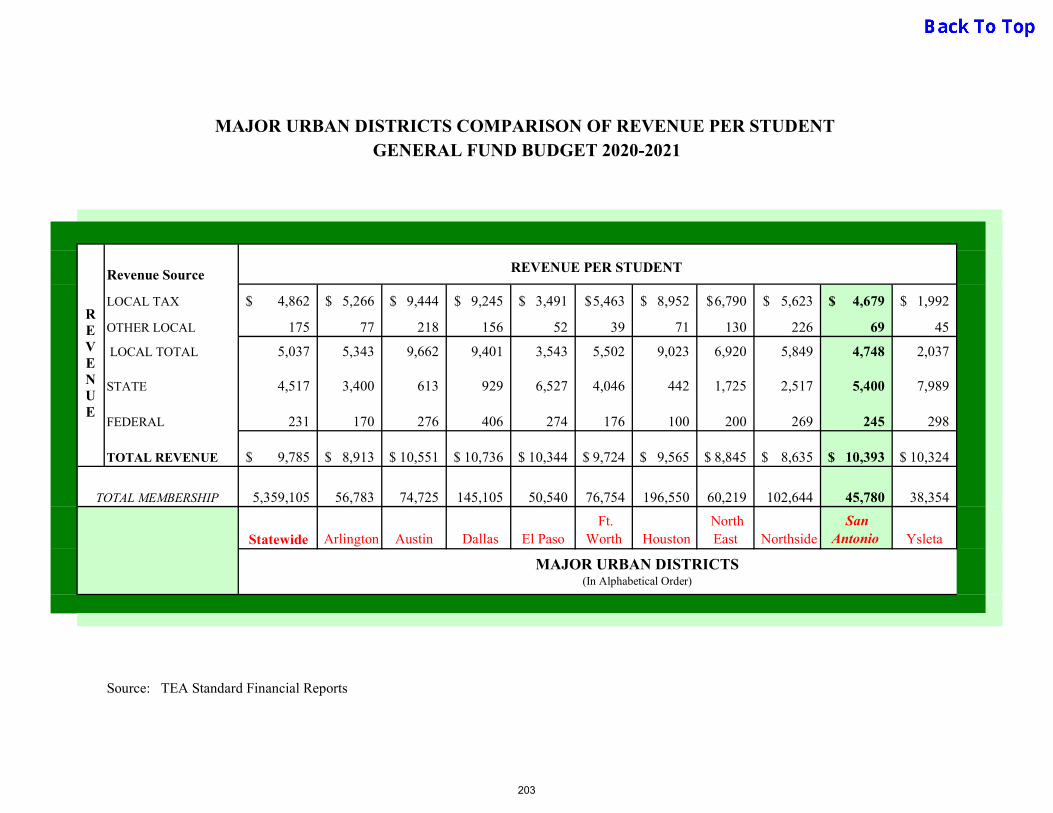
4,862$ 5,266$ 9,444$ 9,245$ 3,491$ 5,463$ 8,952$ 6,790$ 5,623$ 4,679$ 1,992$
175 77 218 156 52 39 71 130 226 69 45
5,037 5,343 9,662 9,401 3,543 5,502 9,023 6,920 5,849 4,748 2,037
4,517 3,400 613 929 6,527 4,046 442 1,725 2,517 5,400 7,989
231 170 276 406 274 176 100 200 269 245 298
9,785$ 8,913$ 10,551$ 10,736$ 10,344$ 9,724$ 9,565$ 8,845$ 8,635$ 10,393$ 10,324$
5,359,105 56,783 74,725 145,105 50,540 76,754 196,550 60,219 102,644 45,780 38,354
Statewide Arlington Austin Dallas El Paso Ft.
Worth Houston North East Northside
San Antonio Ysleta
Source: TEA Standard Financial Reports
FEDERAL
TOTAL REVENUE
TOTAL MEMBERSHIP
MAJOR URBAN DISTRICTS(In Alphabetical Order)
STATE
MAJOR URBAN DISTRICTS COMPARISON OF REVENUE PER STUDENT GENERAL FUND BUDGET 2020-2021
Revenue Source REVENUE PER STUDENT
LOCAL TAX
OTHER LOCAL
LOCAL TOTAL
REVENUE
203

INFORMATIONAL
SECTION

GENERAL OPERATING FUND 2021-22 2022-23 2023-24 2023-25
Est. Taxable Assesed Values 21,758,566,761$ 22,084,945,262$ 22,416,219,441$ 22,752,462,733$
Tax Rate 1.01035$ 1.01035$ 1.01035$ 1.01035$
Tax Revenue at 100% Rate of Collection 219,837,679$ 223,135,244$ 226,482,273$ 229,879,507$
SAISD Projected Current Year Tax Collection Rate 98.75% 98.75% 98.75% 98.75%
General Fund Projected Current Year Property Tax Revenue (Incl Tax on Frozen Properties) 217,089,708$ 220,346,054$ 223,651,245$ 227,006,013$
DEBT SERVICE FUND 2021-22 2022-23 2023-24 2023-25Tax Rate 0.48125$ 0.48125$ 0.48125$ 0.48125$
Tax Revenue at 100% Rate of Collection 104,713,103$ 106,283,799$ 107,878,056$ 109,496,227$
SAISD Projected Current Year Tax Collection Rate 98.75% 98.75% 98.75% 98.75%
Debt Service Fund Projected Current Year Property Tax Revenue 102,583,896$ 105,661,413$ 108,831,255$ 112,096,193$
TOTAL PROJECTED TAX REVENUE 319,673,604$ 326,007,466$ 332,482,500$ 339,102,206$
DISCUSSION:
TAX COLLECTIONS FORECAST
GENERAL OPERATING FUND & DEBT SERVICE FUND
The primary source of local funding for the school district remains ad valorem taxes levied against the local taxbase. The House Bill 1 (HB 1) as passed by the Texas Legislature in 2006 resulted in a reduction of the M&O taxrate from $1.50 per $100 of taxable property value in 2005-06 to $1.37 in 2006-07 and $1.04 in all years since.Prior to 2019-20, the maximum M&O tax rate that a school district can adopt is $1.17 per $100 of taxable propertyvalue pending voter approval. San Antonio ISD did receive voter approval in November 2016 to increase theM&O tax rate to $1.17 for the 2016-17 and future tax years. Beginning with the 2020-21 biennium, the StateLegislature enacted HB3, which included a mandated compression of property tax rates, in conjunction witheducation funding reform. The M&O tax rate was compressed by formula, and changed from $1.17 to $1.0683 for2019-20, $1.02105 for 2020-21, and $1.01035 for 2021-2022 . There is no compression of the I&S tax rate, whichremained unchanged from the prior year.
204
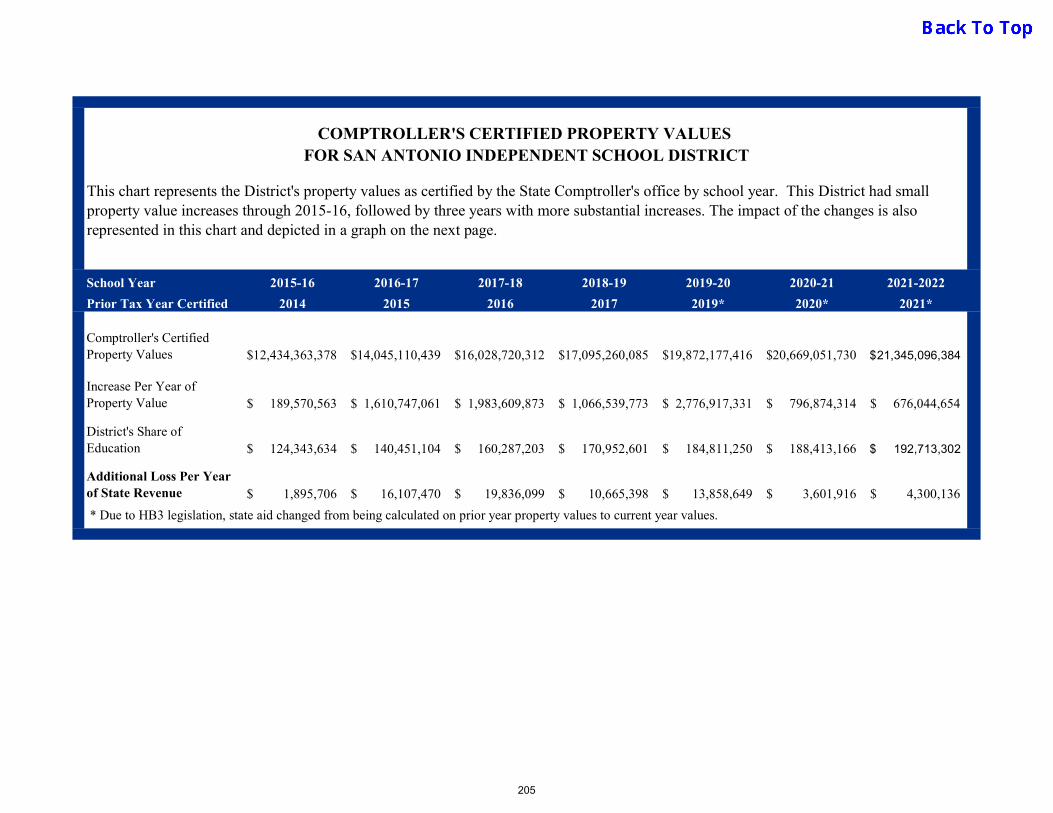
COMPTROLLER'S CERTIFIED PROPERTY VALUES FOR SAN ANTONIO INDEPENDENT SCHOOL DISTRICT
School Year 2015-16 2016-17 2017-18 2018-19 2019-20 2020-21 2021-2022
Prior Tax Year Certified 2014 2015 2016 2017 2019* 2020* 2021*
Comptroller's Certified Property Values 12,434,363,378$ 14,045,110,439$ 16,028,720,312$ 17,095,260,085$ 19,872,177,416$ 20,669,051,730$ 21,345,096,384$
Increase Per Year of Property Value 189,570,563$ 1,610,747,061$ 1,983,609,873$ 1,066,539,773$ 2,776,917,331$ 796,874,314$ 676,044,654$
District's Share of Education 124,343,634$ 140,451,104$ 160,287,203$ 170,952,601$ 184,811,250$ 188,413,166$ 192,713,302$
Additional Loss Per Year of State Revenue 1,895,706$ 16,107,470$ 19,836,099$ 10,665,398$ 13,858,649$ 3,601,916$ 4,300,136$
* Due to HB3 legislation, state aid changed from being calculated on prior year property values to current year values.
This chart represents the District's property values as certified by the State Comptroller's office by school year. This District had small property value increases through 2015-16, followed by three years with more substantial increases. The impact of the changes is also represented in this chart and depicted in a graph on the next page.
205

This graph illustrates that over the past seven years, the District's property values have continued to increase, with significant increases inthe past few years. An increase has a two fold impact on the District revenues. First, it decreases the amount of State revenue the Districtreceives each year. Second, due to the loss of State funding, the cost of education for the District increases in Local revenue generatedprimarily through property taxes. Since 2015-16 school year, the District has had a cumulative loss of approximately $69,432,040 in Staterevenue over these seven years.
In the 86th Texas Legislative session, a mandated compression of the M&O tax was implemented to provide property tax relief toconstituents. In conjunction with this, the State has dedicated significant additional resources for education to fill the budget gap that theproperty tax compression causes. This is a welcome move that shirts the burden for public education back toward the state's budget andrelieves the local sources. While there is still a burden on local taxpayers, this recent legislation did begin to address this.
San Antonio Independent School DistrictTHE EFFECT OF RISING PROPERTY VALUES ON STATE & LOCAL REVENUES
2015-16 2016-17 2017-18 2018-19 2019-20 2020-21 2021-2022
District's Share of Education $124,343,634 $140,451,104 $160,287,203 $170,952,601 $184,811,250 $188,413,166 $192,713,302
$75,000,000
$95,000,000
$115,000,000
$135,000,000
$155,000,000
$175,000,000
$195,000,000
$215,000,000
Property Values Impact on State & Local Revenues
State Funding Allocation Lost Since 2016($70,265,374)
206

Fiscal Tax
Maintenance & Operations
Debt Service
Total Tax
Year Year (M&O) (I&S) Rate *
2012-13 2012 1.04000 0.31760 1.35760
2013-14 2013 1.04000 0.31760 1.35760
2014-15 2014 1.04000 0.34260 1.38260
2015-16 2015 1.04000 0.34260 1.38260
2016-17 2016 1.17000 0.34260 1.51260
2017-18 2017 1.17000 0.36260 1.53260
2018-19 2018 1.17000 0.39260 1.56260
2019-20 2019 1.06835 0.46260 1.53095
2020-21 2020 1.02105 0.48125 1.50230 2021-22* 2021 1.01035 0.48125 1.49160
* The SAISD Board is scheduled to vote on the the tax rate on August 16, 2021.
A graphic illustration of the District tax rate trends for the last 10 years is found on the next page.
The tax rate of a school district consists of Maintenance & Operations (M&O) and a Debt Service tax rate or asis sometimes referred to an Interest & Sink (I&S) tax rate. The M&O tax rate is a local school district tax ratethat raises revenue to be used to operate and maintain schools. The passage of House Bill 1 (HB 1) required allTexas school districts to lower the maximum allowable M&O tax rate beginning with the 2006-2007 schoolyear. The M&O tax rate increased from $1.04 to $1.17 due to a successful Tax Ratification Election inNovember of 2016. The passage of House Bill 3 (HB 3) required all Texas school districts to compress themaximum allowable M&O tax rate beginning with the 2019-2020 school year. For SAISD, the M&O tax ratewas compressed from $1.17 to $1.06835 in 2019-20, $1.02105 for 2020-21, and then to $1.01035 for 2021-2022. The District does not collect any alternative minimum taxes which refers to individuals and corporationsthat benefit from certain exclusions, deductions or credits pay at least a minimum amount of tax.
The 2021-2022 tax rate will be voted on by the SAISD Board of Trustees on August 16, 2021. The DebtService (I&S) tax rate is a tax levied by the school district that raises money to pay for voter approved bondindebtedness, usually for the construction of facilities, equipment or both.
SAISD PROPERTY TAX RATE HISTORY *
* Per $100 of Assessed Value.
207

$1.0
4000
$1.0
4000
$1.0
4000
$1.0
4000
$1.1
7000
$1.1
7000
$1.1
7000
$1.0
6835
$1.0
2105
$1.0
1035
$0.3
1760
$0.3
1760
$0.3
4260
$0.3
4260
$0.3
4260
$0.3
6260
$0.3
9260
$0.4
6260
$0.4
8125
$0.4
8125
$-
$0.20000
$0.40000
$0.60000
$0.80000
$1.00000
$1.20000
$1.40000
$1.60000
$1.80000
Tax Year
PROPERTY TAX RATE TRENDS*
(M&O) (I&S)
* Per $100 of Assessed Value.
208
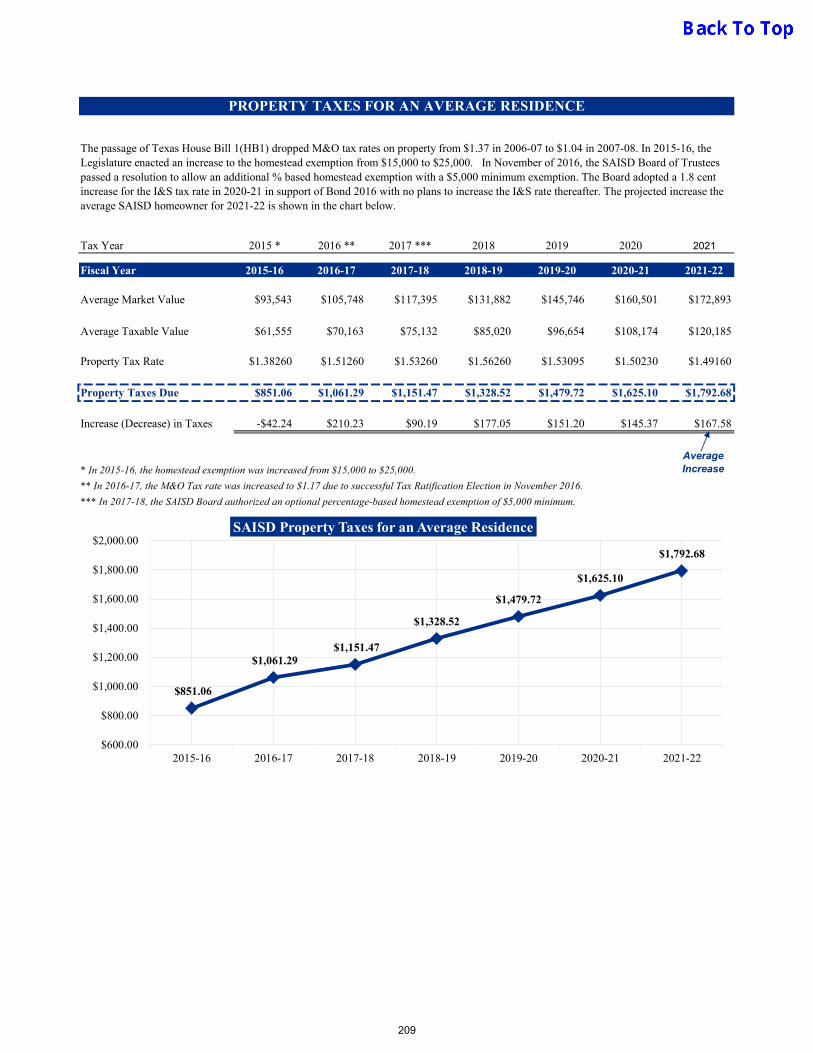
Tax Year 2015 * 2016 ** 2017 *** 2018 2019 2020 2021
Fiscal Year 2015-16 2016-17 2017-18 2018-19 2019-20 2020-21 2021-22
Average Market Value $93,543 $105,748 $117,395 $131,882 $145,746 $160,501 $172,893
Average Taxable Value $61,555 $70,163 $75,132 $85,020 $96,654 $108,174 $120,185
Property Tax Rate $1.38260 $1.51260 $1.53260 $1.56260 $1.53095 $1.50230 $1.49160
Property Taxes Due $851.06 $1,061.29 $1,151.47 $1,328.52 $1,479.72 $1,625.10 $1,792.68
Increase (Decrease) in Taxes -$42.24 $210.23 $90.19 $177.05 $151.20 $145.37 $167.58
* In 2015-16, the homestead exemption was increased from $15,000 to $25,000.AverageIncrease
** In 2016-17, the M&O Tax rate was increased to $1.17 due to successful Tax Ratification Election in November 2016.
*** In 2017-18, the SAISD Board authorized an optional percentage-based homestead exemption of $5,000 minimum.
The passage of Texas House Bill 1(HB1) dropped M&O tax rates on property from $1.37 in 2006-07 to $1.04 in 2007-08. In 2015-16, the Legislature enacted an increase to the homestead exemption from $15,000 to $25,000. In November of 2016, the SAISD Board of Trustees passed a resolution to allow an additional % based homestead exemption with a $5,000 minimum exemption. The Board adopted a 1.8 cent increase for the I&S tax rate in 2020-21 in support of Bond 2016 with no plans to increase the I&S rate thereafter. The projected increase the average SAISD homeowner for 2021-22 is shown in the chart below.
PROPERTY TAXES FOR AN AVERAGE RESIDENCE
$851.06
$1,061.29 $1,151.47
$1,328.52
$1,479.72
$1,625.10
$1,792.68
$600.00
$800.00
$1,000.00
$1,200.00
$1,400.00
$1,600.00
$1,800.00
$2,000.00
2015-16 2016-17 2017-18 2018-19 2019-20 2020-21 2021-22
SAISD Property Taxes for an Average Residence
209
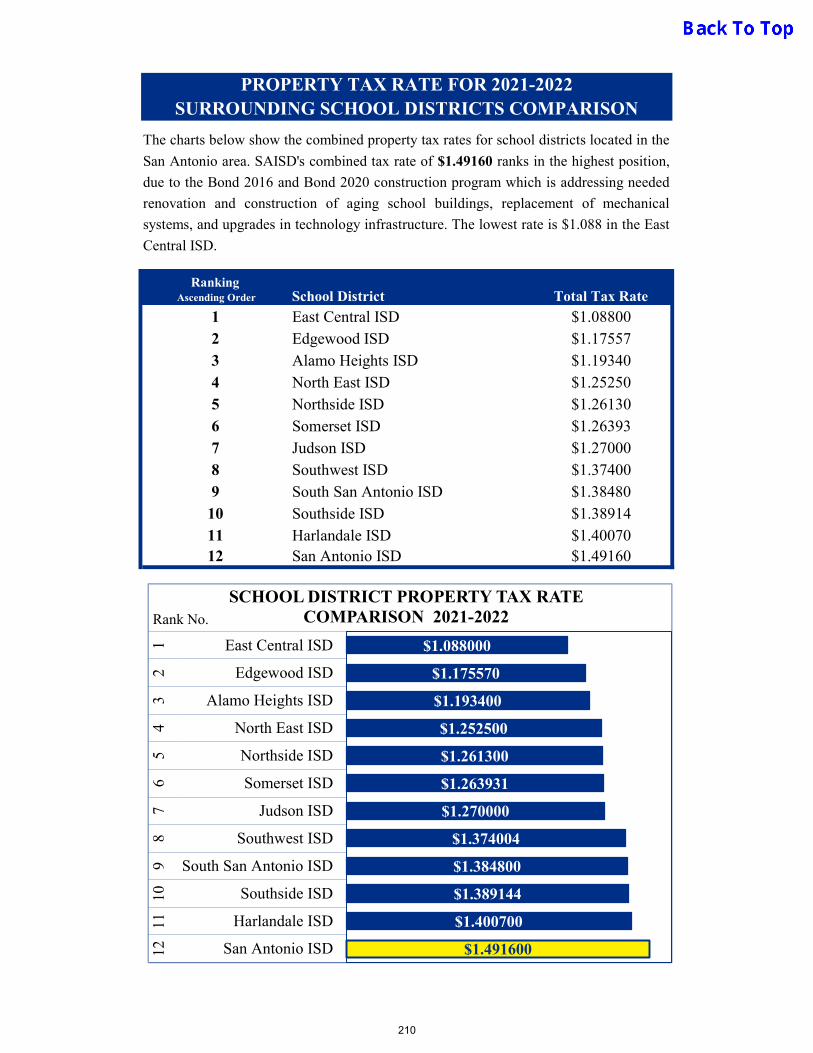
School District Total Tax Rate
East Central ISD $1.08800Edgewood ISD $1.17557Alamo Heights ISD $1.19340North East ISD $1.25250Northside ISD $1.26130Somerset ISD $1.26393Judson ISD $1.27000Southwest ISD $1.37400South San Antonio ISD $1.38480Southside ISD $1.38914Harlandale ISD $1.40070San Antonio ISD $1.4916012
PROPERTY TAX RATE FOR 2021-2022SURROUNDING SCHOOL DISTRICTS COMPARISON
The charts below show the combined property tax rates for school districts located in the
San Antonio area. SAISD's combined tax rate of $1.49160 ranks in the highest position,
due to the Bond 2016 and Bond 2020 construction program which is addressing needed
renovation and construction of aging school buildings, replacement of mechanical
systems, and upgrades in technology infrastructure. The lowest rate is $1.088 in the East
Central ISD.
Ranking Ascending Order
123456789
1011
North East
Northside
Harlandale
Edgewood
San Antonio
Southside
East Central
Southwest
Alamo Heights
$1.088000
$1.175570
$1.193400
$1.252500
$1.261300
$1.263931
$1.270000
$1.374004
$1.384800
$1.389144
$1.400700
$1.491600
East Central ISD
Edgewood ISD
Alamo Heights ISD
North East ISD
Northside ISD
Somerset ISD
Judson ISD
Southwest ISD
South San Antonio ISD
Southside ISD
Harlandale ISD
San Antonio ISD
12
34
56
78
910
1112
Rank No.
SCHOOL DISTRICT PROPERTY TAX RATE COMPARISON 2021-2022
210
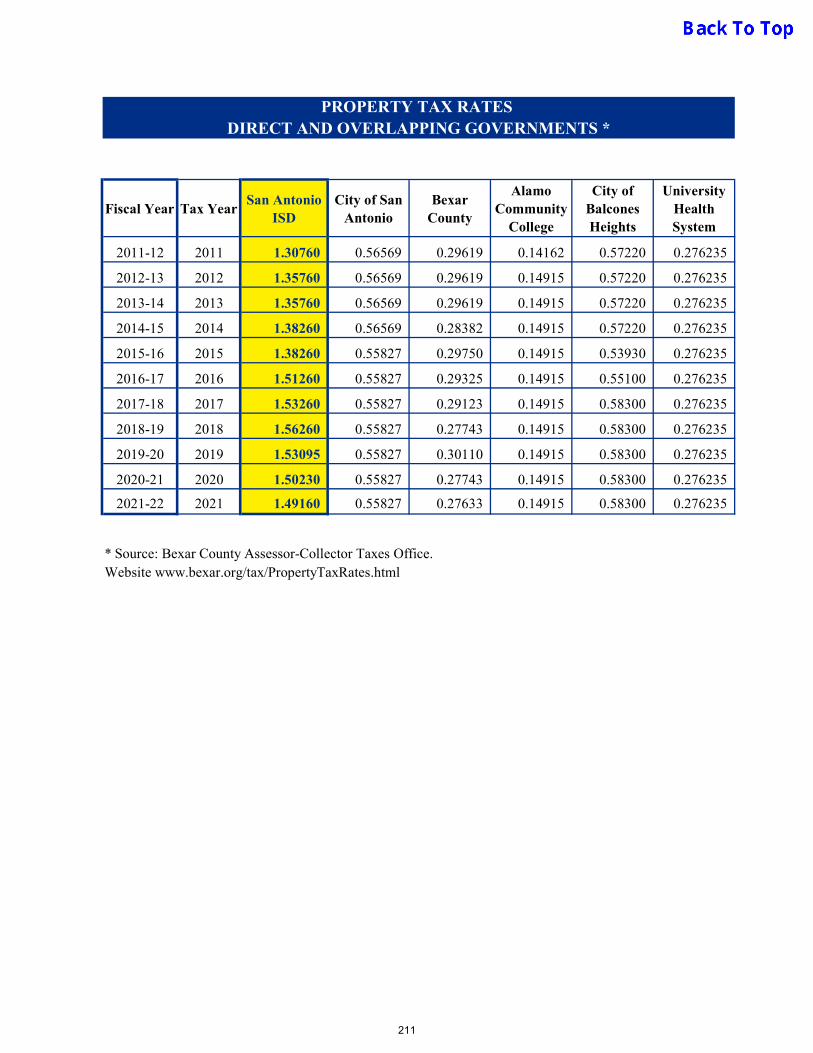
PROPERTY TAX RATES DIRECT AND OVERLAPPING GOVERNMENTS *
Fiscal Year Tax YearSan Antonio
ISDCity of San
AntonioBexar
County
Alamo Community
College
City of Balcones Heights
University Health System
2011-12 2011 1.30760 0.56569 0.29619 0.14162 0.57220 0.276235
2012-13 2012 1.35760 0.56569 0.29619 0.14915 0.57220 0.276235
2013-14 2013 1.35760 0.56569 0.29619 0.14915 0.57220 0.276235
2014-15 2014 1.38260 0.56569 0.28382 0.14915 0.57220 0.276235
2015-16 2015 1.38260 0.55827 0.29750 0.14915 0.53930 0.276235
2016-17 2016 1.51260 0.55827 0.29325 0.14915 0.55100 0.276235
2017-18 2017 1.53260 0.55827 0.29123 0.14915 0.58300 0.276235
2018-19 2018 1.56260 0.55827 0.27743 0.14915 0.58300 0.276235
2019-20 2019 1.53095 0.55827 0.30110 0.14915 0.58300 0.276235
2020-21 2020 1.50230 0.55827 0.27743 0.14915 0.58300 0.276235
2021-22 2021 1.49160 0.55827 0.27633 0.14915 0.58300 0.276235
* Source: Bexar County Assessor-Collector Taxes Office. Website www.bexar.org/tax/PropertyTaxRates.html
211

Fiscal Year Tax Year Taxable Assessed Value Estimated Market ValueRatio of Taxable Assessed to Total
Estimated Market Value
2011-12 2011 12,264,858,813 15,375,370,115 79.77%
2012-13 2012 12,361,723,024 15,409,101,695 80.22%
2013-14 2013 12,737,897,528 15,792,735,275 80.66%
2014-15 2014 13,324,011,635 16,469,744,123 80.90%
2015-16 2015 14,797,210,947 18,806,150,821 78.68%
2016-17 2016 16,592,753,459 21,151,385,053 78.45%
2017-18 2017 17,901,811,247 22,829,385,843 78.42%
2018-19 2018 19,390,019,051 24,765,238,588 78.30%
2019-20 2019 20,973,719,122 26,626,016,684 78.77%
2020-21 2020 21,467,794,795 28,063,518,973 76.50%
* Source: SAISD CAFR, Certified Tax Roll Statement- Bexar County Tax Assessor-Collector
TAXABLE ASSESSED & ESTIMATED MARKET VALUE OF PROPERTY
LAST TEN FISCAL YEARS*
212
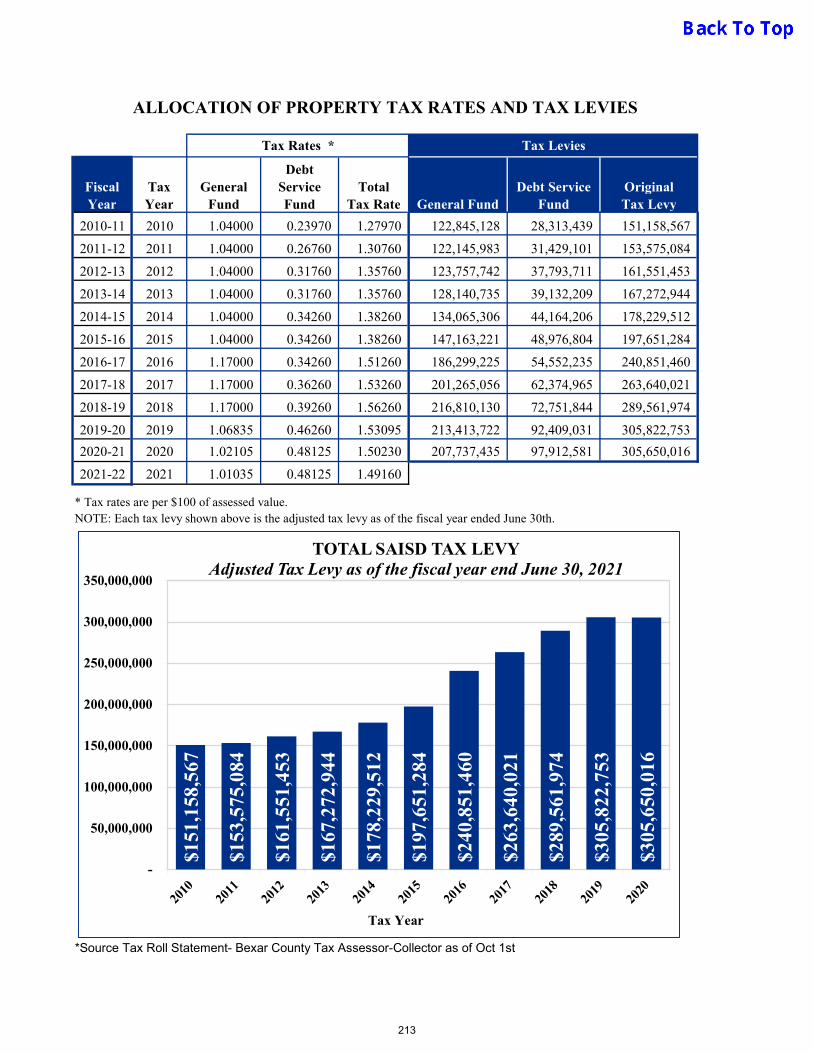
ALLOCATION OF PROPERTY TAX RATES AND TAX LEVIES
Fiscal Year
Tax Year
General Fund
Debt Service Fund
Total Tax Rate General Fund
Debt Service Fund
Original Tax Levy
2010-11 2010 1.04000 0.23970 1.27970 122,845,128 28,313,439 151,158,567
2011-12 2011 1.04000 0.26760 1.30760 122,145,983 31,429,101 153,575,084
2012-13 2012 1.04000 0.31760 1.35760 123,757,742 37,793,711 161,551,453
2013-14 2013 1.04000 0.31760 1.35760 128,140,735 39,132,209 167,272,944
2014-15 2014 1.04000 0.34260 1.38260 134,065,306 44,164,206 178,229,512
2015-16 2015 1.04000 0.34260 1.38260 147,163,221 48,976,804 197,651,284
2016-17 2016 1.17000 0.34260 1.51260 186,299,225 54,552,235 240,851,460
2017-18 2017 1.17000 0.36260 1.53260 201,265,056 62,374,965 263,640,021
2018-19 2018 1.17000 0.39260 1.56260 216,810,130 72,751,844 289,561,974
2019-20 2019 1.06835 0.46260 1.53095 213,413,722 92,409,031 305,822,753
2020-21 2020 1.02105 0.48125 1.50230 207,737,435 97,912,581 305,650,016
2021-22 2021 1.01035 0.48125 1.49160
* Tax rates are per $100 of assessed value.NOTE: Each tax levy shown above is the adjusted tax levy as of the fiscal year ended June 30th.
*Source Tax Roll Statement- Bexar County Tax Assessor-Collector as of Oct 1st
Tax Rates * Tax Levies
$151
,158
,567
$153
,575
,084
$161
,551
,453
$167
,272
,944
$178
,229
,512
$197
,651
,284
$240
,851
,460
$263
,640
,021
$289
,561
,974
$305
,822
,753
$305
,650
,016
-
50,000,000
100,000,000
150,000,000
200,000,000
250,000,000
300,000,000
350,000,000
Tax Year
TOTAL SAISD TAX LEVYAdjusted Tax Levy as of the fiscal year end June 30, 2021
213
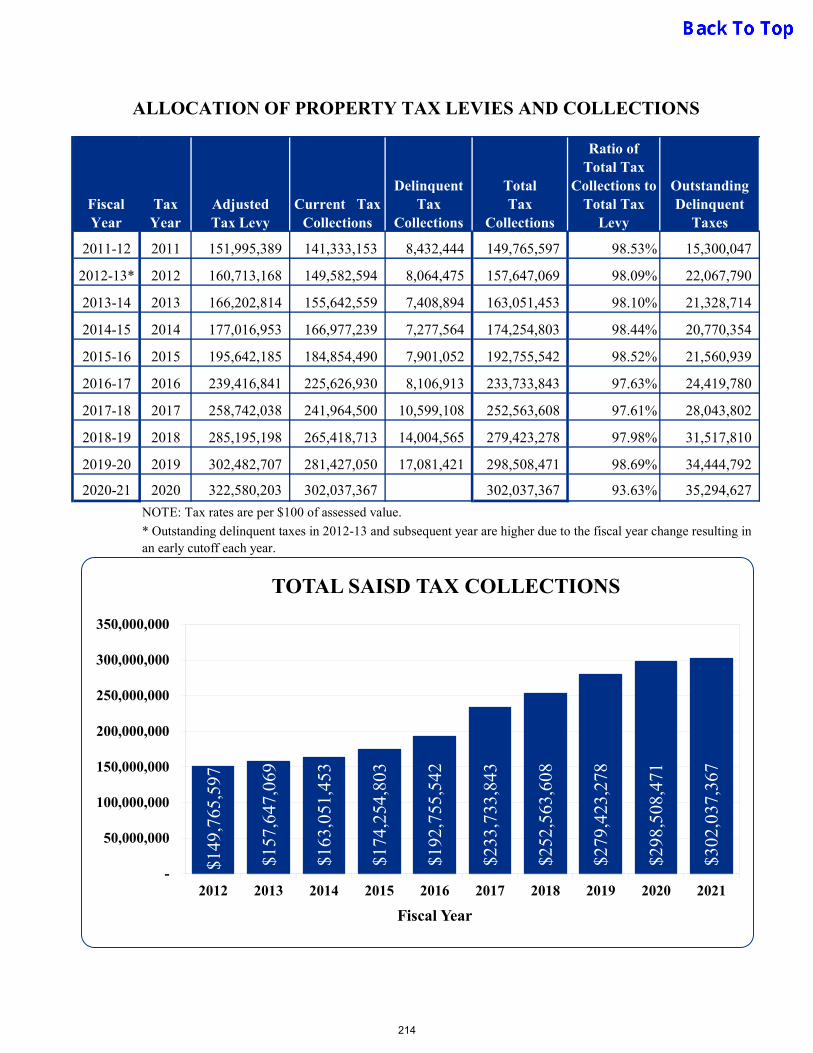
ALLOCATION OF PROPERTY TAX LEVIES AND COLLECTIONS
Fiscal Year
Tax Year
Adjusted Tax Levy
Current Tax Collections
Delinquent Tax
Collections
Total Tax
Collections
Ratio of Total Tax
Collections to Total Tax
Levy
Outstanding Delinquent
Taxes
2011-12 2011 151,995,389 141,333,153 8,432,444 149,765,597 98.53% 15,300,047
2012-13* 2012 160,713,168 149,582,594 8,064,475 157,647,069 98.09% 22,067,790
2013-14 2013 166,202,814 155,642,559 7,408,894 163,051,453 98.10% 21,328,714
2014-15 2014 177,016,953 166,977,239 7,277,564 174,254,803 98.44% 20,770,354
2015-16 2015 195,642,185 184,854,490 7,901,052 192,755,542 98.52% 21,560,939
2016-17 2016 239,416,841 225,626,930 8,106,913 233,733,843 97.63% 24,419,780
2017-18 2017 258,742,038 241,964,500 10,599,108 252,563,608 97.61% 28,043,802
2018-19 2018 285,195,198 265,418,713 14,004,565 279,423,278 97.98% 31,517,810
2019-20 2019 302,482,707 281,427,050 17,081,421 298,508,471 98.69% 34,444,792
2020-21 2020 322,580,203 302,037,367 302,037,367 93.63% 35,294,627
NOTE: Tax rates are per $100 of assessed value.
* Outstanding delinquent taxes in 2012-13 and subsequent year are higher due to the fiscal year change resulting inan early cutoff each year.
$149
,765
,597
$157
,647
,069
$163
,051
,453
$174
,254
,803
$192
,755
,542
$233
,733
,843
$252
,563
,608
$279
,423
,278
$298
,508
,471
$302
,037
,367
-
50,000,000
100,000,000
150,000,000
200,000,000
250,000,000
300,000,000
350,000,000
2012 2013 2014 2015 2016 2017 2018 2019 2020 2021
Fiscal Year
TOTAL SAISD TAX COLLECTIONS
214
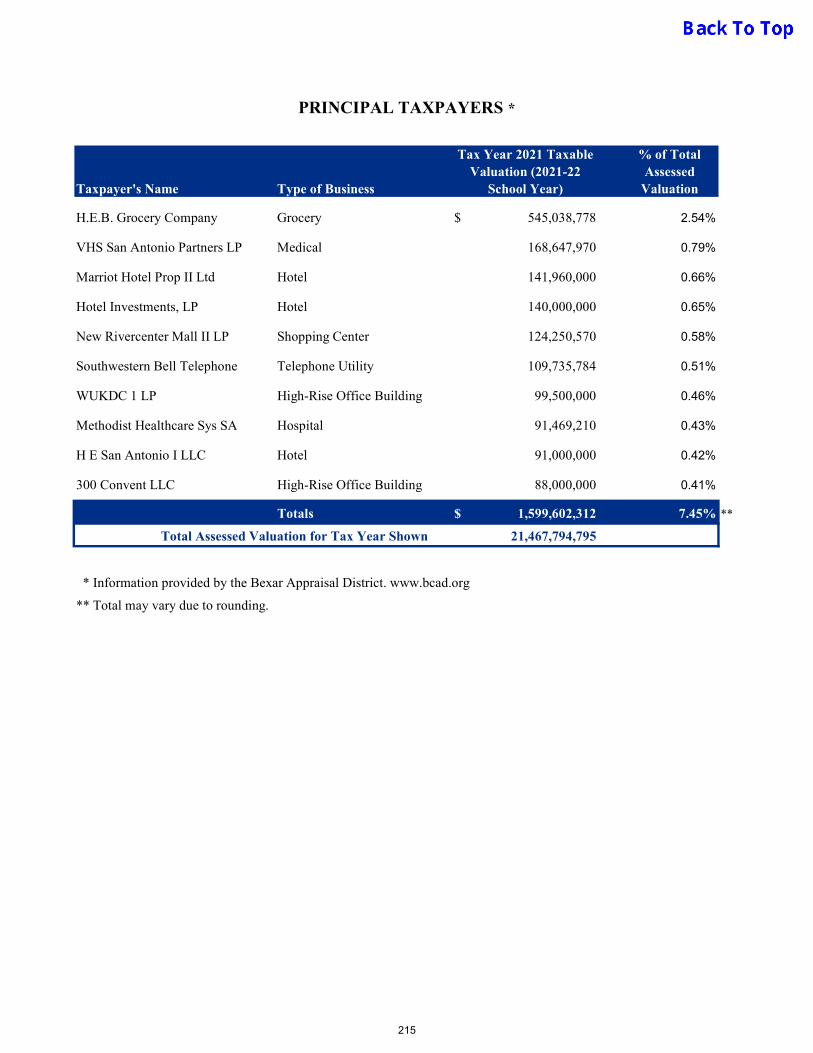
Taxpayer's Name Type of Business
Tax Year 2021 Taxable Valuation (2021-22
School Year)
% of Total Assessed
Valuation
H.E.B. Grocery Company Grocery 545,038,778$ 2.54%
VHS San Antonio Partners LP Medical 168,647,970 0.79%
Marriot Hotel Prop II Ltd Hotel 141,960,000 0.66%
Hotel Investments, LP Hotel 140,000,000 0.65%
New Rivercenter Mall II LP Shopping Center 124,250,570 0.58%
Southwestern Bell Telephone Telephone Utility 109,735,784 0.51%
WUKDC 1 LP High-Rise Office Building 99,500,000 0.46%
Methodist Healthcare Sys SA Hospital 91,469,210 0.43%
H E San Antonio I LLC Hotel 91,000,000 0.42%
300 Convent LLC High-Rise Office Building 88,000,000 0.41%
Totals 1,599,602,312$ 7.45% **
21,467,794,795
* Information provided by the Bexar Appraisal District. www.bcad.org
** Total may vary due to rounding.
PRINCIPAL TAXPAYERS *
Total Assessed Valuation for Tax Year Shown
215

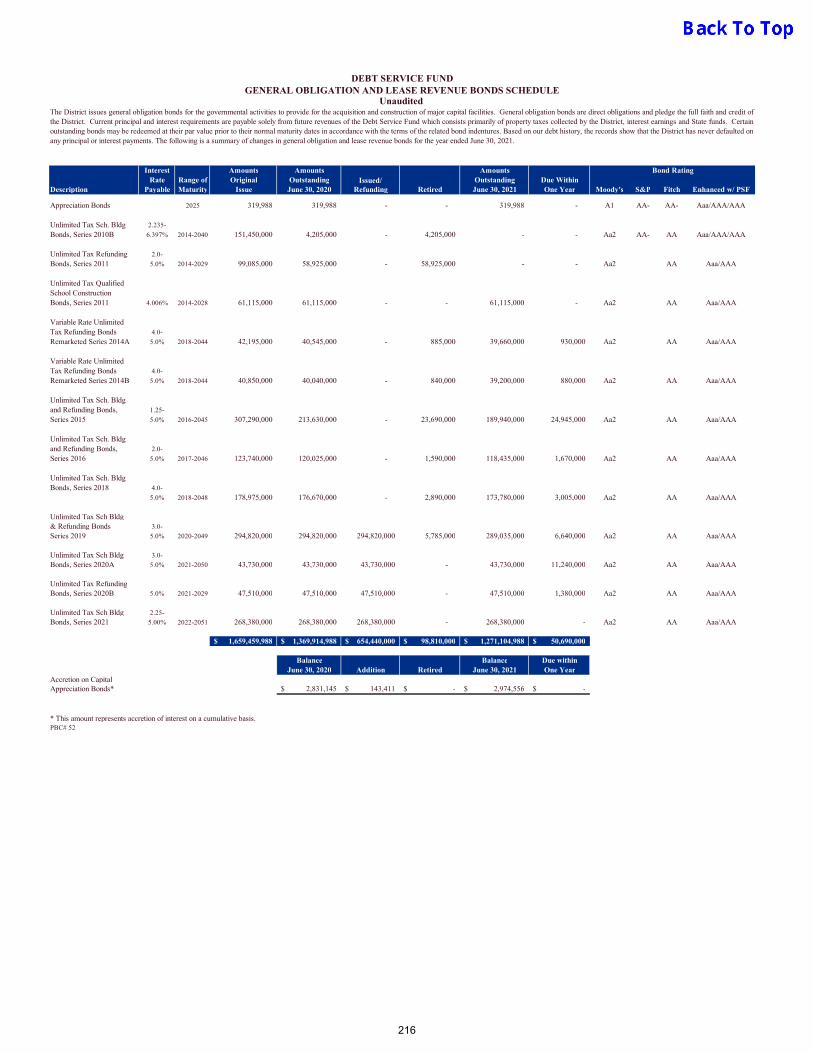
Interest Amounts Amounts AmountsRate Range of Original Outstanding Issued/ Outstanding Due Within
Description Payable Maturity Issue June 30, 2020 Refunding Retired June 30, 2021 One Year Moody's S&P Fitch Enhanced w/ PSF
Appreciation Bonds 2025 319,988 319,988 - - 319,988 - A1 AA- AA- Aaa/AAA/AAA
Unlimited Tax Sch. Bldg 2.235-
Bonds, Series 2010B 6.397% 2014-2040 151,450,000 4,205,000 - 4,205,000 - - Aa2 AA- AA Aaa/AAA/AAA
Unlimited Tax Refunding 2.0-
Bonds, Series 2011 5.0% 2014-2029 99,085,000 58,925,000 - 58,925,000 - - Aa2 AA Aaa/AAA
Unlimited Tax QualifiedSchool ConstructionBonds, Series 2011 4.006% 2014-2028 61,115,000 61,115,000 - - 61,115,000 - Aa2 AA Aaa/AAA
Variable Rate UnlimitedTax Refunding Bonds 4.0-
Remarketed Series 2014A 5.0% 2018-2044 42,195,000 40,545,000 - 885,000 39,660,000 930,000 Aa2 AA Aaa/AAA
Variable Rate UnlimitedTax Refunding Bonds 4.0-
Remarketed Series 2014B 5.0% 2018-2044 40,850,000 40,040,000 - 840,000 39,200,000 880,000 Aa2 AA Aaa/AAA
Unlimited Tax Sch. Bldgand Refunding Bonds, 1.25-
Series 2015 5.0% 2016-2045 307,290,000 213,630,000 - 23,690,000 189,940,000 24,945,000 Aa2 AA Aaa/AAA
Unlimited Tax Sch. Bldgand Refunding Bonds, 2.0-
Series 2016 5.0% 2017-2046 123,740,000 120,025,000 - 1,590,000 118,435,000 1,670,000 Aa2 AA Aaa/AAA
Unlimited Tax Sch. BldgBonds, Series 2018 4.0-
5.0% 2018-2048 178,975,000 176,670,000 - 2,890,000 173,780,000 3,005,000 Aa2 AA Aaa/AAA
Unlimited Tax Sch Bldg& Refunding Bonds 3.0-
Series 2019 5.0% 2020-2049 294,820,000 294,820,000 294,820,000 5,785,000 289,035,000 6,640,000 Aa2 AA Aaa/AAA
Unlimited Tax Sch Bldg 3.0-
Bonds, Series 2020A 5.0% 2021-2050 43,730,000 43,730,000 43,730,000 - 43,730,000 11,240,000 Aa2 AA Aaa/AAA
Unlimited Tax RefundingBonds, Series 2020B 5.0% 2021-2029 47,510,000 47,510,000 47,510,000 - 47,510,000 1,380,000 Aa2 AA Aaa/AAA
Unlimited Tax Sch Bldg 2.25-
Bonds, Series 2021 5.00% 2022-2051 268,380,000 268,380,000 268,380,000 - 268,380,000 - Aa2 AA Aaa/AAA
1,659,459,988$ 1,369,914,988$ 654,440,000$ 98,810,000$ 1,271,104,988$ 50,690,000$
Balance Balance Due withinJune 30, 2020 Addition Retired June 30, 2021 One Year
Accretion on CapitalAppreciation Bonds* 2,831,145$ 143,411$ -$ 2,974,556$ -$
* This amount represents accretion of interest on a cumulative basis.PBC# 52
Bond Rating
The District issues general obligation bonds for the governmental activities to provide for the acquisition and construction of major capital facilities. General obligation bonds are direct obligations and pledge the full faith and credit ofthe District. Current principal and interest requirements are payable solely from future revenues of the Debt Service Fund which consists primarily of property taxes collected by the District, interest earnings and State funds. Certainoutstanding bonds may be redeemed at their par value prior to their normal maturity dates in accordance with the terms of the related bond indentures. Based on our debt history, the records show that the District has never defaulted on any principal or interest payments. The following is a summary of changes in general obligation and lease revenue bonds for the year ended June 30, 2021.
DEBT SERVICE FUNDGENERAL OBLIGATION AND LEASE REVENUE BONDS SCHEDULE
Unaudited
216
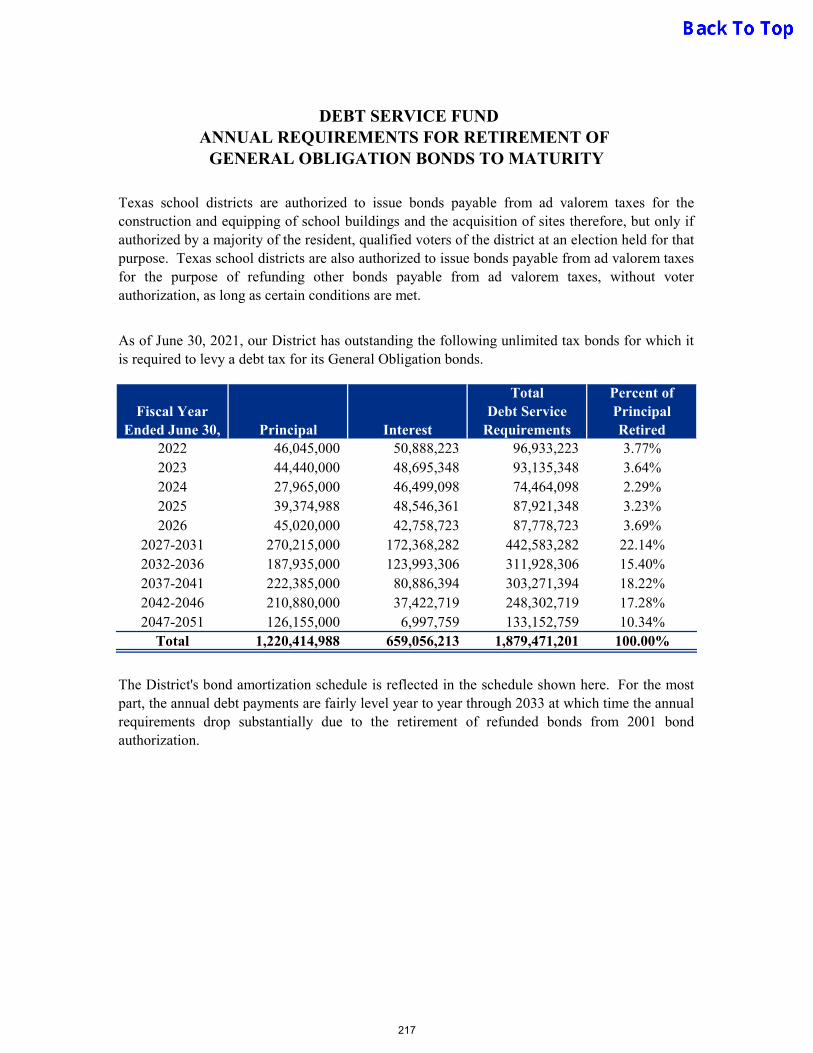
Fiscal Year Ended June 30, Principal Interest
Total Debt Service
Requirements
Percent of Principal Retired
2022 46,045,000 50,888,223 96,933,223 3.77%2023 44,440,000 48,695,348 93,135,348 3.64%2024 27,965,000 46,499,098 74,464,098 2.29%2025 39,374,988 48,546,361 87,921,348 3.23%2026 45,020,000 42,758,723 87,778,723 3.69%
2027-2031 270,215,000 172,368,282 442,583,282 22.14%2032-2036 187,935,000 123,993,306 311,928,306 15.40%2037-2041 222,385,000 80,886,394 303,271,394 18.22%2042-2046 210,880,000 37,422,719 248,302,719 17.28%2047-2051 126,155,000 6,997,759 133,152,759 10.34%
Total 1,220,414,988 659,056,213 1,879,471,201 100.00%
DEBT SERVICE FUND
The District's bond amortization schedule is reflected in the schedule shown here. For the mostpart, the annual debt payments are fairly level year to year through 2033 at which time the annualrequirements drop substantially due to the retirement of refunded bonds from 2001 bondauthorization.
Texas school districts are authorized to issue bonds payable from ad valorem taxes for theconstruction and equipping of school buildings and the acquisition of sites therefore, but only ifauthorized by a majority of the resident, qualified voters of the district at an election held for thatpurpose. Texas school districts are also authorized to issue bonds payable from ad valorem taxesfor the purpose of refunding other bonds payable from ad valorem taxes, without voterauthorization, as long as certain conditions are met.
As of June 30, 2021, our District has outstanding the following unlimited tax bonds for which itis required to levy a debt tax for its General Obligation bonds.
GENERAL OBLIGATION BONDS TO MATURITYANNUAL REQUIREMENTS FOR RETIREMENT OF
217
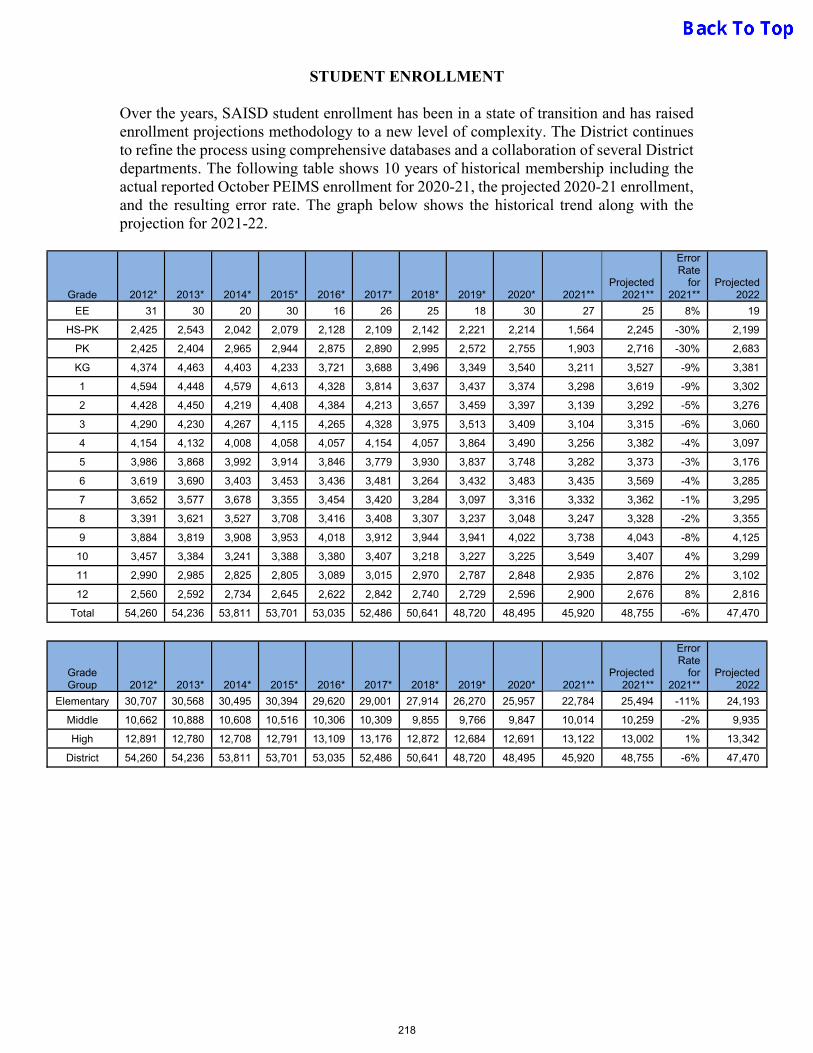
STUDENT ENROLLMENT Over the years, SAISD student enrollment has been in a state of transition and has raised enrollment projections methodology to a new level of complexity. The District continues to refine the process using comprehensive databases and a collaboration of several District departments. The following table shows 10 years of historical membership including the actual reported October PEIMS enrollment for 2020-21, the projected 2020-21 enrollment, and the resulting error rate. The graph below shows the historical trend along with the projection for 2021-22.
Grade 2012* 2013* 2014* 2015* 2016* 2017* 2018* 2019* 2020* 2021** Projected
2021**
Error Rate
for 2021**
Projected 2022
EE 31 30 20 30 16 26 25 18 30 27 25 8% 19
HS-PK 2,425 2,543 2,042 2,079 2,128 2,109 2,142 2,221 2,214 1,564 2,245 -30% 2,199
PK 2,425 2,404 2,965 2,944 2,875 2,890 2,995 2,572 2,755 1,903 2,716 -30% 2,683
KG 4,374 4,463 4,403 4,233 3,721 3,688 3,496 3,349 3,540 3,211 3,527 -9% 3,381
1 4,594 4,448 4,579 4,613 4,328 3,814 3,637 3,437 3,374 3,298 3,619 -9% 3,302
2 4,428 4,450 4,219 4,408 4,384 4,213 3,657 3,459 3,397 3,139 3,292 -5% 3,276
3 4,290 4,230 4,267 4,115 4,265 4,328 3,975 3,513 3,409 3,104 3,315 -6% 3,060
4 4,154 4,132 4,008 4,058 4,057 4,154 4,057 3,864 3,490 3,256 3,382 -4% 3,097
5 3,986 3,868 3,992 3,914 3,846 3,779 3,930 3,837 3,748 3,282 3,373 -3% 3,176
6 3,619 3,690 3,403 3,453 3,436 3,481 3,264 3,432 3,483 3,435 3,569 -4% 3,285
7 3,652 3,577 3,678 3,355 3,454 3,420 3,284 3,097 3,316 3,332 3,362 -1% 3,295
8 3,391 3,621 3,527 3,708 3,416 3,408 3,307 3,237 3,048 3,247 3,328 -2% 3,355
9 3,884 3,819 3,908 3,953 4,018 3,912 3,944 3,941 4,022 3,738 4,043 -8% 4,125
10 3,457 3,384 3,241 3,388 3,380 3,407 3,218 3,227 3,225 3,549 3,407 4% 3,299
11 2,990 2,985 2,825 2,805 3,089 3,015 2,970 2,787 2,848 2,935 2,876 2% 3,102
12 2,560 2,592 2,734 2,645 2,622 2,842 2,740 2,729 2,596 2,900 2,676 8% 2,816
Total 54,260 54,236 53,811 53,701 53,035 52,486 50,641 48,720 48,495 45,920 48,755 -6% 47,470
Grade Group 2012* 2013* 2014* 2015* 2016* 2017* 2018* 2019* 2020* 2021**
Projected 2021**
Error Rate
for 2021**
Projected 2022
Elementary 30,707 30,568 30,495 30,394 29,620 29,001 27,914 26,270 25,957 22,784 25,494 -11% 24,193
Middle 10,662 10,888 10,608 10,516 10,306 10,309 9,855 9,766 9,847 10,014 10,259 -2% 9,935
High 12,891 12,780 12,708 12,791 13,109 13,176 12,872 12,684 12,691 13,122 13,002 1% 13,342
District 54,260 54,236 53,811 53,701 53,035 52,486 50,641 48,720 48,495 45,920 48,755 -6% 47,470
218
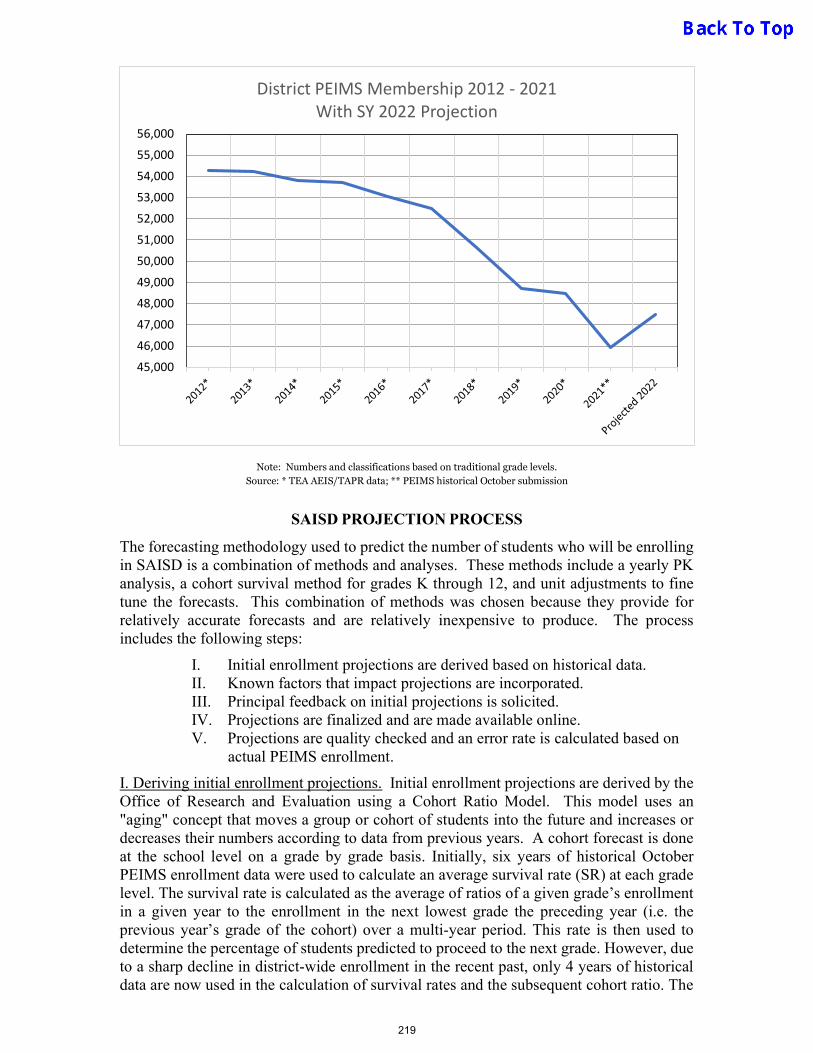
Note: Numbers and classifications based on traditional grade levels. Source: * TEA AEIS/TAPR data; ** PEIMS historical October submission
SAISD PROJECTION PROCESS
The forecasting methodology used to predict the number of students who will be enrolling in SAISD is a combination of methods and analyses. These methods include a yearly PK analysis, a cohort survival method for grades K through 12, and unit adjustments to fine tune the forecasts. This combination of methods was chosen because they provide for relatively accurate forecasts and are relatively inexpensive to produce. The process includes the following steps:
I. Initial enrollment projections are derived based on historical data. II. Known factors that impact projections are incorporated. III. Principal feedback on initial projections is solicited. IV. Projections are finalized and are made available online. V. Projections are quality checked and an error rate is calculated based on
actual PEIMS enrollment.
I. Deriving initial enrollment projections. Initial enrollment projections are derived by the Office of Research and Evaluation using a Cohort Ratio Model. This model uses an "aging" concept that moves a group or cohort of students into the future and increases or decreases their numbers according to data from previous years. A cohort forecast is done at the school level on a grade by grade basis. Initially, six years of historical October PEIMS enrollment data were used to calculate an average survival rate (SR) at each grade level. The survival rate is calculated as the average of ratios of a given grade’s enrollment in a given year to the enrollment in the next lowest grade the preceding year (i.e. the previous year’s grade of the cohort) over a multi-year period. This rate is then used to determine the percentage of students predicted to proceed to the next grade. However, due to a sharp decline in district-wide enrollment in the recent past, only 4 years of historical data are now used in the calculation of survival rates and the subsequent cohort ratio. The
45,000
46,000
47,000
48,000
49,000
50,000
51,000
52,000
53,000
54,000
55,000
56,000
District PEIMS Membership 2012 - 2021With SY 2022 Projection
219
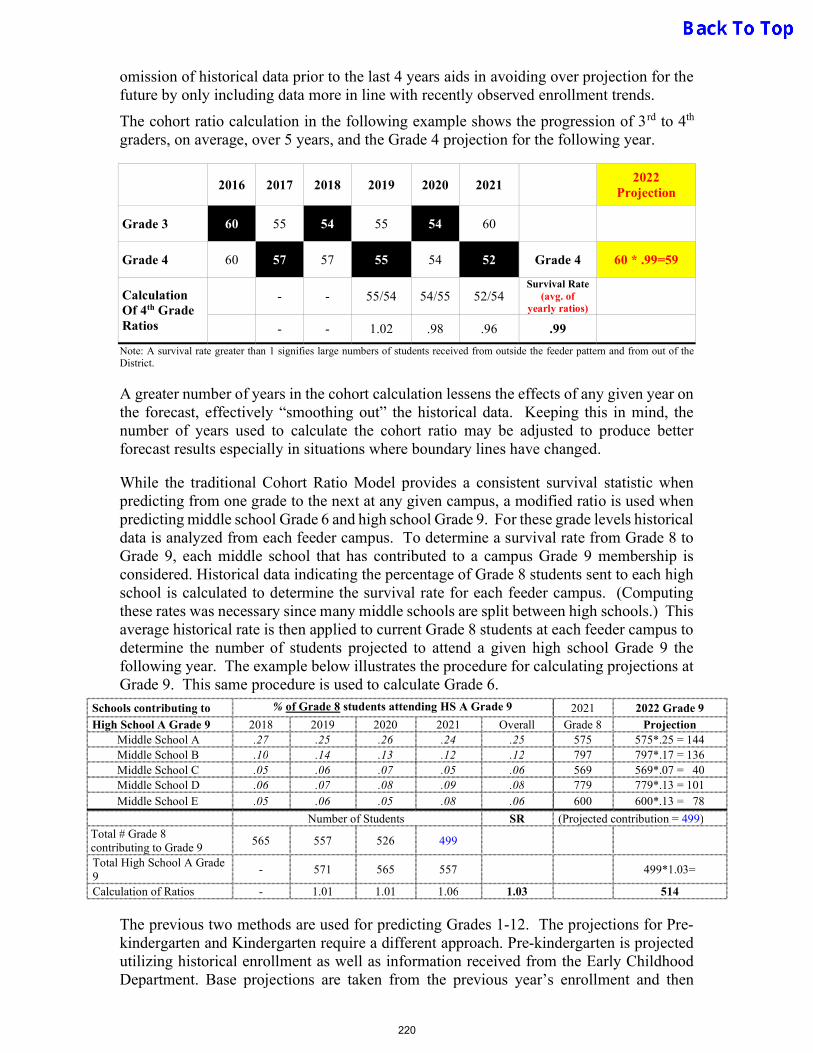
omission of historical data prior to the last 4 years aids in avoiding over projection for the future by only including data more in line with recently observed enrollment trends.
The cohort ratio calculation in the following example shows the progression of 3rd to 4th graders, on average, over 5 years, and the Grade 4 projection for the following year.
2016 2017 2018 2019 2020 2021 2022
Projection
Grade 3 60 55 54 55 54 60
Grade 4 60 57 57 55 54 52 Grade 4 60 * .99=59
Calculation Of 4th Grade Ratios
- - 55/54 54/55 52/54 Survival Rate
(avg. of yearly ratios)
- - 1.02 .98 .96 .99
Note: A survival rate greater than 1 signifies large numbers of students received from outside the feeder pattern and from out of the District. A greater number of years in the cohort calculation lessens the effects of any given year on the forecast, effectively “smoothing out” the historical data. Keeping this in mind, the number of years used to calculate the cohort ratio may be adjusted to produce better forecast results especially in situations where boundary lines have changed. While the traditional Cohort Ratio Model provides a consistent survival statistic when predicting from one grade to the next at any given campus, a modified ratio is used when predicting middle school Grade 6 and high school Grade 9. For these grade levels historical data is analyzed from each feeder campus. To determine a survival rate from Grade 8 to Grade 9, each middle school that has contributed to a campus Grade 9 membership is considered. Historical data indicating the percentage of Grade 8 students sent to each high school is calculated to determine the survival rate for each feeder campus. (Computing these rates was necessary since many middle schools are split between high schools.) This average historical rate is then applied to current Grade 8 students at each feeder campus to determine the number of students projected to attend a given high school Grade 9 the following year. The example below illustrates the procedure for calculating projections at Grade 9. This same procedure is used to calculate Grade 6.
The previous two methods are used for predicting Grades 1-12. The projections for Pre-kindergarten and Kindergarten require a different approach. Pre-kindergarten is projected utilizing historical enrollment as well as information received from the Early Childhood Department. Base projections are taken from the previous year’s enrollment and then
Schools contributing to % of Grade 8 students attending HS A Grade 9 2021 2022 Grade 9
High School A Grade 9 2018 2019 2020 2021 Overall Grade 8 Projection Middle School A .27 .25 .26 .24 .25 575 575*.25 = 144 Middle School B .10 .14 .13 .12 .12 797 797*.17 = 136 Middle School C .05 .06 .07 .05 .06 569 569*.07 = 40 Middle School D .06 .07 .08 .09 .08 779 779*.13 = 101 Middle School E .05 .06 .05 .08 .06 600 600*.13 = 78
Number of Students SR (Projected contribution = 499) Total # Grade 8 contributing to Grade 9
565 557 526 499
Total High School A Grade 9
- 571 565 557 499*1.03=
Calculation of Ratios - 1.01 1.01 1.06 1.03 514
220

adjustments are made based on data received from Early Childhood, such as, waiting list information, and new classroom additions to campuses. Kindergarten utilizes the same cohort ratio method as applicable Grades 1-12, but the next year’s projection is constrained by a +/- 2% variance cap from the current year’s enrollment. This measure has been implemented to reduce the chance of over/under projection for Kindergarten as much as possible. II. Incorporating factors that impact projections. Once initial projections have been completed, several meetings are held with various District offices to determine if there are other known factors which may impact projections. The Facility Planning and Construction Department (FPCD) provide the number of students expected to increase/decrease projections based on changes in local housing developments. The FPCD tracks new developments in the SAISD attendance zone and those within 2 miles. There are a variety of factors such as historical trends, student to dwelling yields, residential sale values or rental rates of the new or renovated properties, etc. that are used to develop these projections. Once the per unit student ratio has been calculated and applied to determine student yield, then based on the occupancy date for a new development, adjustments are made to the projection year impacted. These adjustments are provided by the FPCD by campus, by grade level, and either add to or subtract from initial projections. Another factor which has played a significant role in SAISD enrollment projections has been the recent changes in school configurations, converting PK-5 campuses to PK-8, and the addition of specialty campuses such as the new Innovative Campus Models (ALA & CAST), PK and early childhood Montessori campus, and the new dual language campuses. In these situations, some campus grade levels are without previous history from which to compute a survival rate. For this reason, a diagonal analysis is used. Campus projections for newly added grade levels assumed enrollment from the previous grade. This is done until a campus builds up at least four years of historical data for a given grade at which point a survival rate is calculated. During this initial period, manual adjustments are made until historical data allows the model to adjust to the new school configuration. In the case of campuses converting from PK-5 to PK-8, projections for middle schools are decreased to account for the number of students remaining at the feeder elementary campus. Other factors which impact projections include changes in special programs, such as, Bilingual programs, Special Education programs, and Early Childhood programs. Each department responsible for special populations an opportunity to provide input. Once initial projections are reviewed by the committee then any specific campus programmatic changes are discussed. These changes may include the addition of a dual language program, the addition of new Special Education units, or the reconfiguration of Early Childhood programs for three- and four-year olds. All known factors which may impact enrollment are discussed to compute a by campus, by grade level, adjustment. In addition, campuses create enrollment plans designed to maintain or increase enrollment. The plans are reviewed by the Office of Enrollment and projections are adjusted based on campuses meeting their enrollment targets. III. Soliciting principal feedback on initial projections. Campus principals play a very crucial role in the projections process. Their feedback can trigger projection adjustments based on documented/proven campus anomalies. For this reason, before projections are finalized, principals receive their initial enrollment projections and are given 2 weeks to either accept or reject. During this time, campus principals who wish to reject their projections gather facts to support their desired changes. All principals requesting a change
221
to projections submit their request in writing. These requests are then reviewed. If there is enough evidence to warrant a change. Each principal who submits a request for change receives a notice informing them of the committee’s final decision. IV. Projections are finalized and made available online. Once district and campus enrollment projections have incorporated all known internal and external influences, then projections are finalized. SAISD enrollment projections and methodologies are all made available to campuses through a web-based application that utilizes an interactive graphical user interface. Over the past three years projection reports have evolved from static reports to a dynamic user environment. Each campus principal is given an account to view projections on the SAISD Projections website. V. Projections are quality checked and an error rate is calculated based on actual enrollment. At the beginning of each school year projections are monitored to see if the District is on track to meet the projected October membership. Daily District projections are used to forecast early on if enrollment is up or down. After the October PEIMS date, District and campus enrollment are compared to projections. Campuses are divided into three groups: over projected by more than 5%, projected within 5%, and under projected by more than 5%. Each campus falling into one of the two extremes is discussed to determine possible reasons for the differences between actual and projected enrollment. On average, SAISD projects District membership within 2% of actual PEIMS enrollment. Grades PK, KG, and 6 continue to be the most difficult to predict using our current model. Other statistical methods are being researched to fine-tune the process at this grade level. For example, the District has begun evaluating the validity of unit adjustments made to grades PK and HS-PK by performing a spatial analysis of changes in birth rates for areas surrounding those campuses using geographic information systems (GIS). In the future, this analysis may become part of the initial projection calculation, as building upon it can help guide the District in making more informed decisions on where to locate certain programs as well as compensate for highly unpredictable enrollment trends influenced by external forces. For Kindergarten, adjustment of the variance cap has been necessary to reduce the chance of over/under projection. The projection for Grade 6 may continue to be difficult for the near future due to the ongoing transition of several PK-5 Elementary School to PK-8 Academies as well as Grade 6-8 Middle Schools to various special campuses, such as Irving and Twain Dual Language Academies. The goal of the projection and quality check processes is to reduce the range of error, and monitor the process over time, so it can continually be improved.
The global COVID-19 crisis that shut down school districts nationally in Spring 2020 and necessitated districts quickly implement virtual learning and strict social distancing along with other safety measures, continues to affect public school enrollment around the country. The following summarizes District membership in relation to projections as of October 8, 2021.
2021-22 School Year started August 9, 2021. At the end of the nineth week of school, SAISD has enrolled 45,097 students, a
decrease of 426 students compared to this time last year. Twenty-five campuses matched or surpassed their projected enrollment while
seventy-two campuses remained below their projected enrollment. About 60% of the difference from projection is at PK, KG, and Grade 1.
222

At the end of Week 9, SAISD was 2,373 students below the projected enrollment for October.
SAISD EXTENDED PROJECTIONS
Applying the historical membership trends forward yields the following projected enrollment for the next five years. The data suggest that membership will stabilize. By 2026, the membership for SAISD is projected to be approximately 45,300, a decrease of roughly 130 students per year over the next five years.
10 years of District PEIMS Membership with 5 years of Extended Projections
15,000
20,000
25,000
30,000
35,000
Oct-12Oct-13Oct-14Oct-15Oct-16Oct-17Oct-18Oct-19Oct-20Oct-21Oct-22Oct-23Oct-24Oct-25Oct-26
Elementary Campuses
Values Forecast Lower Confidence Bound Upper Confidence Bound
SAISD Extended Projections
Grade 2018* 2019* 2020* 2021** Projected Projected Projected Projected Projected
2022 2023 2024 2025 2026
EE 25 18 30 27 19 24 23 23 23
PK 5,137 4,793 4,969 3467 4,882 4,229 4,151 4,083 4,024
KG 3,496 3,349 3,540 3211 3,381 3,317 3,302 3,290 3,279
1 3,637 3,437 3,374 3298 3,302 3,230 3,197 3,168 3,143
2 3,657 3,459 3,397 3139 3,276 3,151 3,107 3,070 3,036
3 3,975 3,513 3,409 3104 3,060 2,933 2,845 2,768 2,700
4 4,057 3,864 3,490 3256 3,097 3,037 2,942 2,859 2,787
5 3,930 3,837 3,748 3282 3,176 3,197 3,123 3,059 3,003
6 3,264 3,432 3,483 3435 3,285 3,418 3,425 3,431 3,436
7 3,284 3,097 3,316 3332 3,295 3,307 3,315 3,322 3,328
8 3,307 3,237 3,048 3247 3,355 3,232 3,231 3,230 3,229
9 3,944 3,941 4,022 3738 4,125 3,975 3,979 3,983 3,986
10 3,218 3,227 3,225 3549 3,299 3,403 3,422 3,438 3,452
11 2,970 2,787 2,848 2935 3,102 2,981 2,991 2,999 3,007
12 2,740 2,729 2,596 2900 2,816 2,808 2,818 2,826 2,834
Elementary 27,914 26,270 25,957 22,784 24,193 23,117 22,690 22,321 21,995
Middle 9,855 9,766 9,847 10,014 9,935 9,957 9,971 9,983 9,993
High 12,872 12,684 12,691 13,122 13,342 13,168 13,210 13,246 13,278
Total 50,641 48,720 48,495 45,920 47,470 46,242 45,871 45,550 45,266
223
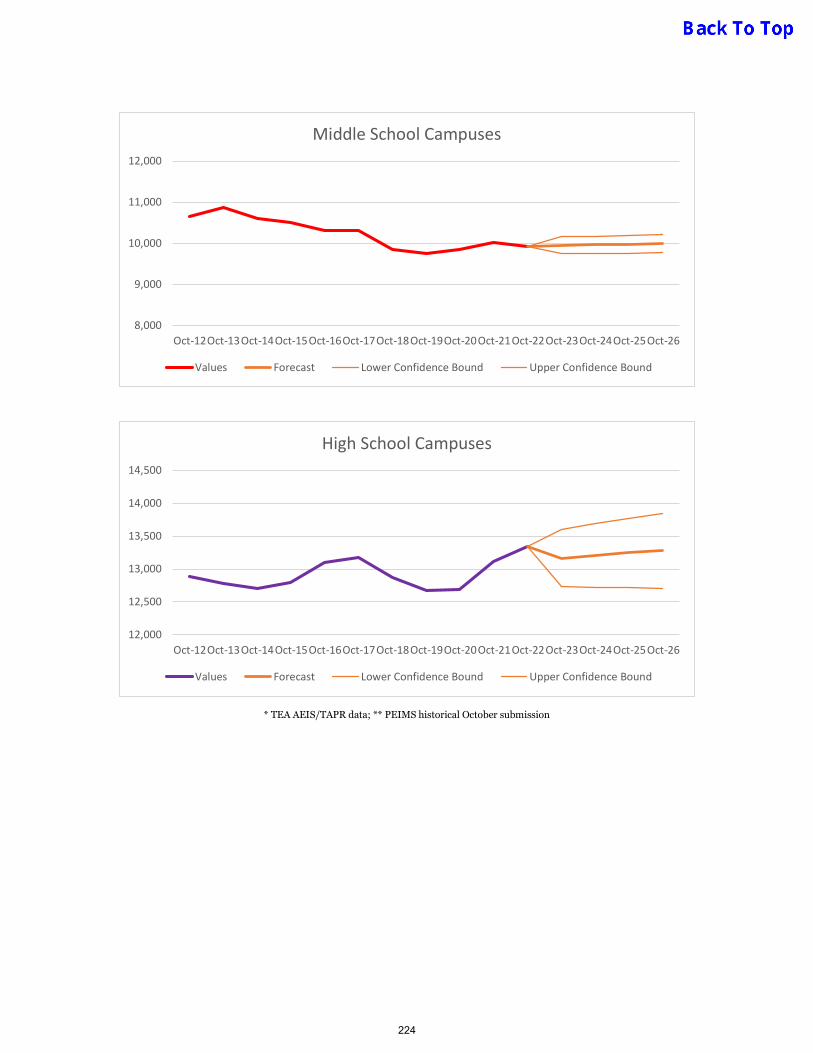
* TEA AEIS/TAPR data; ** PEIMS historical October submission
8,000
9,000
10,000
11,000
12,000
Oct-12Oct-13Oct-14Oct-15Oct-16Oct-17Oct-18Oct-19Oct-20Oct-21Oct-22Oct-23Oct-24Oct-25Oct-26
Middle School Campuses
Values Forecast Lower Confidence Bound Upper Confidence Bound
12,000
12,500
13,000
13,500
14,000
14,500
Oct-12Oct-13Oct-14Oct-15Oct-16Oct-17Oct-18Oct-19Oct-20Oct-21Oct-22Oct-23Oct-24Oct-25Oct-26
High School Campuses
Values Forecast Lower Confidence Bound Upper Confidence Bound
224
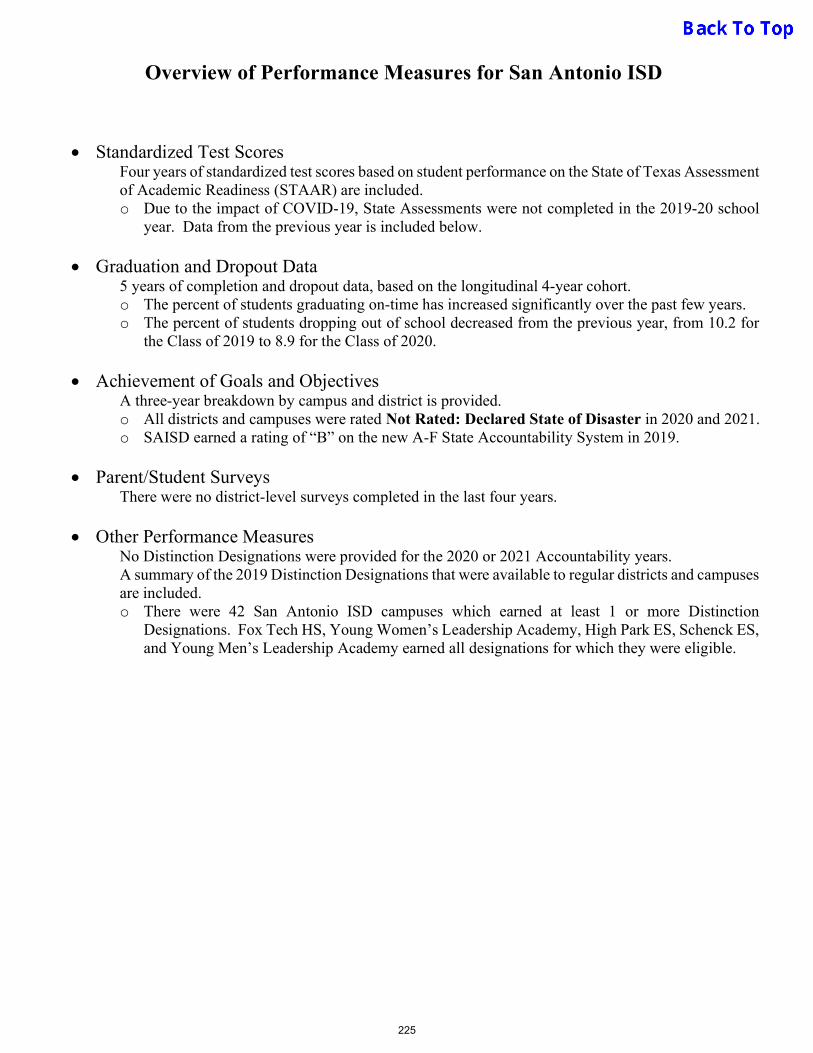
Overview of Performance Measures for San Antonio ISD
Standardized Test Scores Four years of standardized test scores based on student performance on the State of Texas Assessment of Academic Readiness (STAAR) are included. o Due to the impact of COVID-19, State Assessments were not completed in the 2019-20 school
year. Data from the previous year is included below.
Graduation and Dropout Data 5 years of completion and dropout data, based on the longitudinal 4-year cohort. o The percent of students graduating on-time has increased significantly over the past few years. o The percent of students dropping out of school decreased from the previous year, from 10.2 for
the Class of 2019 to 8.9 for the Class of 2020.
Achievement of Goals and Objectives A three-year breakdown by campus and district is provided. o All districts and campuses were rated Not Rated: Declared State of Disaster in 2020 and 2021. o SAISD earned a rating of “B” on the new A-F State Accountability System in 2019.
Parent/Student Surveys There were no district-level surveys completed in the last four years.
Other Performance Measures No Distinction Designations were provided for the 2020 or 2021 Accountability years. A summary of the 2019 Distinction Designations that were available to regular districts and campuses are included. o There were 42 San Antonio ISD campuses which earned at least 1 or more Distinction
Designations. Fox Tech HS, Young Women’s Leadership Academy, High Park ES, Schenck ES, and Young Men’s Leadership Academy earned all designations for which they were eligible.
225
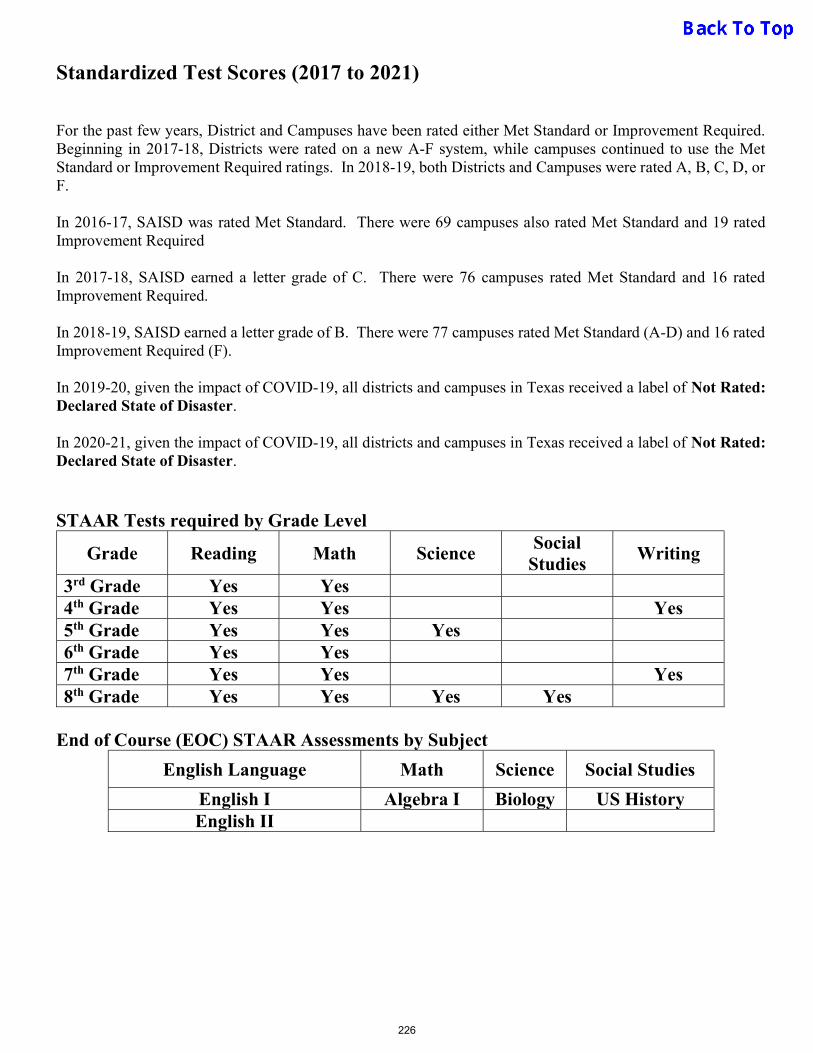
Standardized Test Scores (2017 to 2021) For the past few years, District and Campuses have been rated either Met Standard or Improvement Required. Beginning in 2017-18, Districts were rated on a new A-F system, while campuses continued to use the Met Standard or Improvement Required ratings. In 2018-19, both Districts and Campuses were rated A, B, C, D, or F. In 2016-17, SAISD was rated Met Standard. There were 69 campuses also rated Met Standard and 19 rated Improvement Required In 2017-18, SAISD earned a letter grade of C. There were 76 campuses rated Met Standard and 16 rated Improvement Required. In 2018-19, SAISD earned a letter grade of B. There were 77 campuses rated Met Standard (A-D) and 16 rated Improvement Required (F). In 2019-20, given the impact of COVID-19, all districts and campuses in Texas received a label of Not Rated: Declared State of Disaster. In 2020-21, given the impact of COVID-19, all districts and campuses in Texas received a label of Not Rated: Declared State of Disaster. STAAR Tests required by Grade Level
Grade Reading Math Science Social
Studies Writing
3rd Grade Yes Yes 4th Grade Yes Yes Yes 5th Grade Yes Yes Yes 6th Grade Yes Yes 7th Grade Yes Yes Yes 8th Grade Yes Yes Yes Yes
End of Course (EOC) STAAR Assessments by Subject
English Language Math Science Social Studies
English I Algebra I Biology US History English II
226
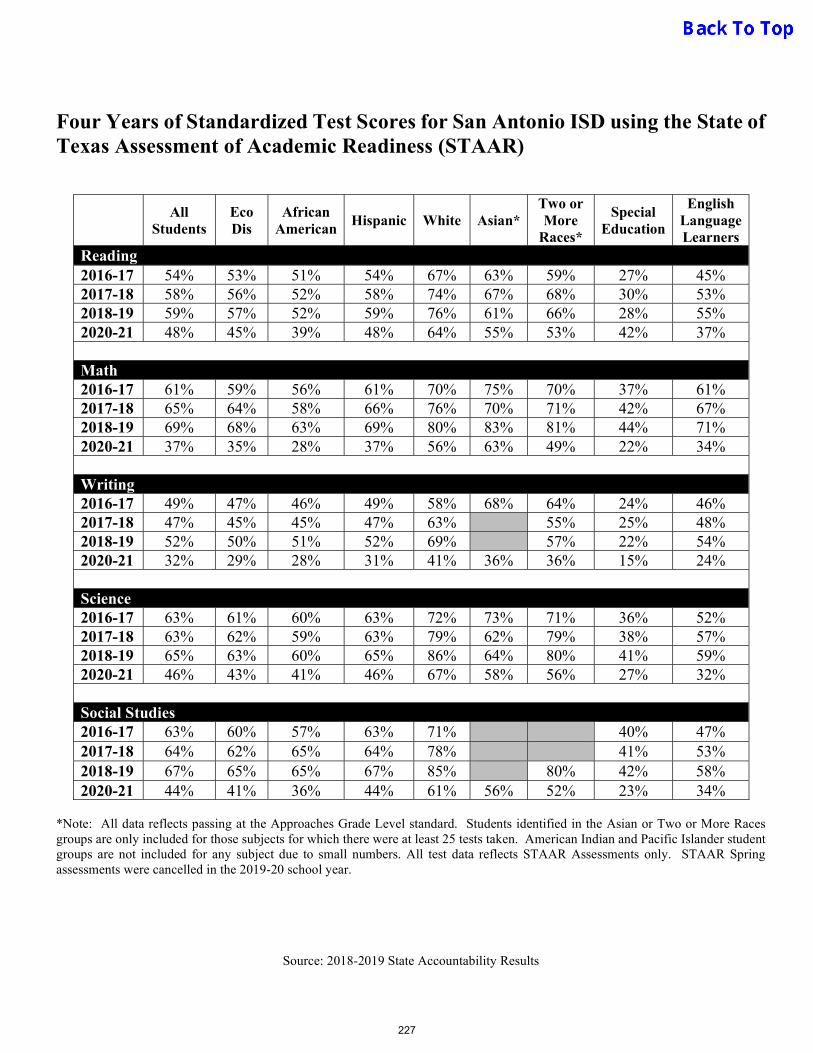
Four Years of Standardized Test Scores for San Antonio ISD using the State of Texas Assessment of Academic Readiness (STAAR)
All Students
Eco Dis
African American
Hispanic White Asian* Two or More
Races*
Special Education
English Language Learners
Reading 2016-17 54% 53% 51% 54% 67% 63% 59% 27% 45% 2017-18 58% 56% 52% 58% 74% 67% 68% 30% 53% 2018-19 59% 57% 52% 59% 76% 61% 66% 28% 55% 2020-21 48% 45% 39% 48% 64% 55% 53% 42% 37% Math 2016-17 61% 59% 56% 61% 70% 75% 70% 37% 61% 2017-18 65% 64% 58% 66% 76% 70% 71% 42% 67% 2018-19 69% 68% 63% 69% 80% 83% 81% 44% 71% 2020-21 37% 35% 28% 37% 56% 63% 49% 22% 34% Writing 2016-17 49% 47% 46% 49% 58% 68% 64% 24% 46% 2017-18 47% 45% 45% 47% 63% 55% 25% 48% 2018-19 52% 50% 51% 52% 69% 57% 22% 54% 2020-21 32% 29% 28% 31% 41% 36% 36% 15% 24% Science 2016-17 63% 61% 60% 63% 72% 73% 71% 36% 52% 2017-18 63% 62% 59% 63% 79% 62% 79% 38% 57% 2018-19 65% 63% 60% 65% 86% 64% 80% 41% 59% 2020-21 46% 43% 41% 46% 67% 58% 56% 27% 32% Social Studies 2016-17 63% 60% 57% 63% 71% 40% 47% 2017-18 64% 62% 65% 64% 78% 41% 53% 2018-19 67% 65% 65% 67% 85% 80% 42% 58% 2020-21 44% 41% 36% 44% 61% 56% 52% 23% 34%
*Note: All data reflects passing at the Approaches Grade Level standard. Students identified in the Asian or Two or More Races groups are only included for those subjects for which there were at least 25 tests taken. American Indian and Pacific Islander student groups are not included for any subject due to small numbers. All test data reflects STAAR Assessments only. STAAR Spring assessments were cancelled in the 2019-20 school year.
Source: 2018-2019 State Accountability Results
227
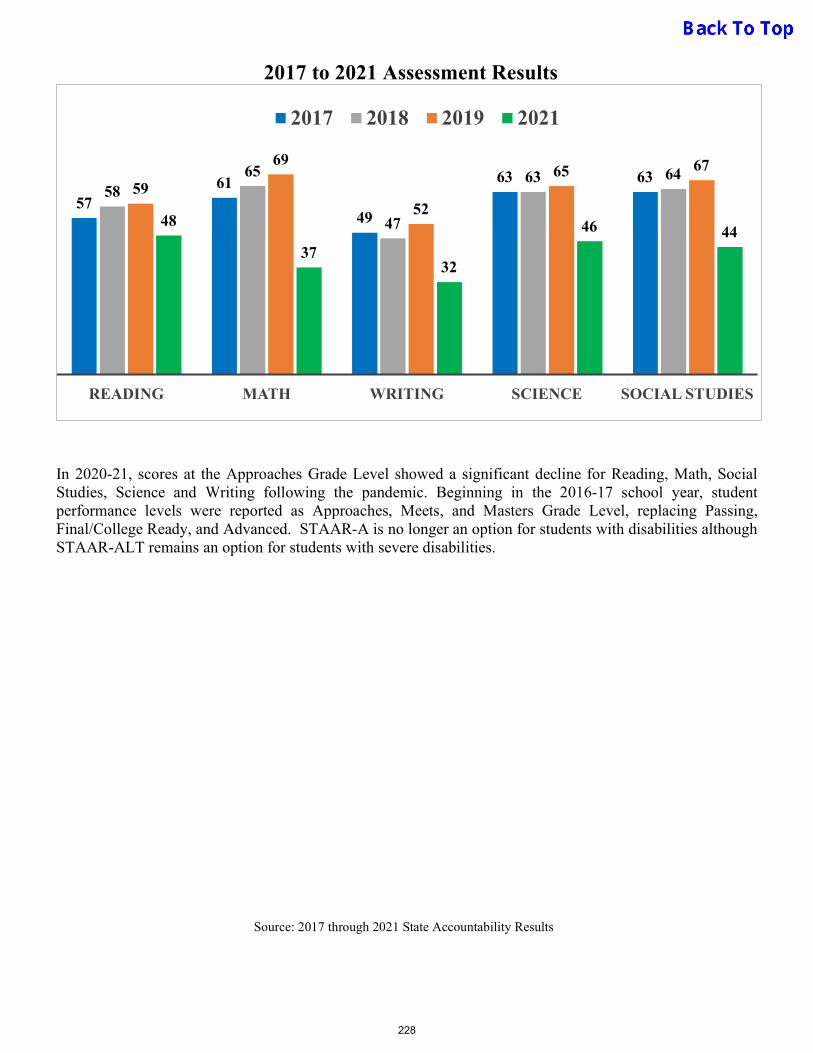
2017 to 2021 Assessment Results
In 2020-21, scores at the Approaches Grade Level showed a significant decline for Reading, Math, Social Studies, Science and Writing following the pandemic. Beginning in the 2016-17 school year, student performance levels were reported as Approaches, Meets, and Masters Grade Level, replacing Passing, Final/College Ready, and Advanced. STAAR-A is no longer an option for students with disabilities although STAAR-ALT remains an option for students with severe disabilities.
Source: 2017 through 2021 State Accountability Results
5761
49
63 6358
65
47
63 6459
69
52
65 67
48
3732
46 44
READING MATH WRITING SCIENCE SOCIAL STUDIES
2017 2018 2019 2021
228
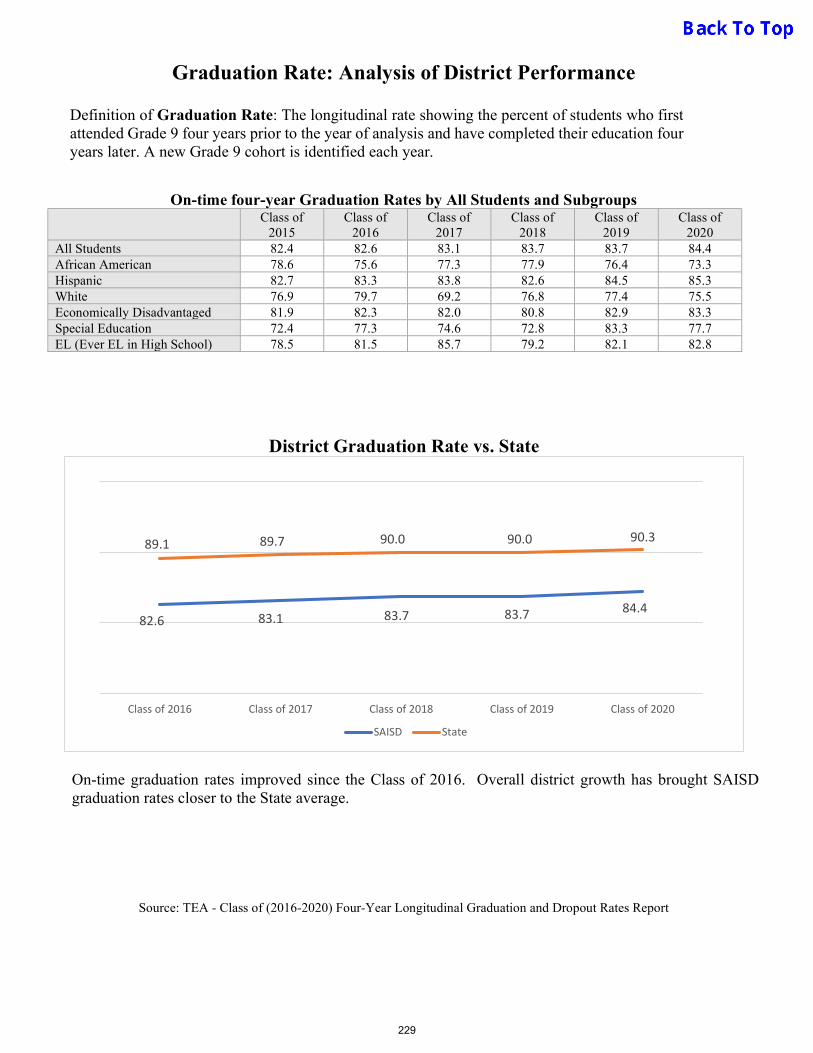
Graduation Rate: Analysis of District Performance
On-time four-year Graduation Rates by All Students and Subgroups Class of
2015 Class of
2016 Class of
2017 Class of
2018 Class of
2019 Class of
2020 All Students 82.4 82.6 83.1 83.7 83.7 84.4 African American 78.6 75.6 77.3 77.9 76.4 73.3 Hispanic 82.7 83.3 83.8 82.6 84.5 85.3 White 76.9 79.7 69.2 76.8 77.4 75.5 Economically Disadvantaged 81.9 82.3 82.0 80.8 82.9 83.3 Special Education 72.4 77.3 74.6 72.8 83.3 77.7 EL (Ever EL in High School) 78.5 81.5 85.7 79.2 82.1 82.8
District Graduation Rate vs. State
On-time graduation rates improved since the Class of 2016. Overall district growth has brought SAISD graduation rates closer to the State average.
Source: TEA - Class of (2016-2020) Four-Year Longitudinal Graduation and Dropout Rates Report
82.6 83.1 83.7 83.7 84.4
89.1 89.7 90.0 90.0 90.3
Class of 2016 Class of 2017 Class of 2018 Class of 2019 Class of 2020
SAISD State
Definition of Graduation Rate: The longitudinal rate showing the percent of students who first attended Grade 9 four years prior to the year of analysis and have completed their education four years later. A new Grade 9 cohort is identified each year.
229
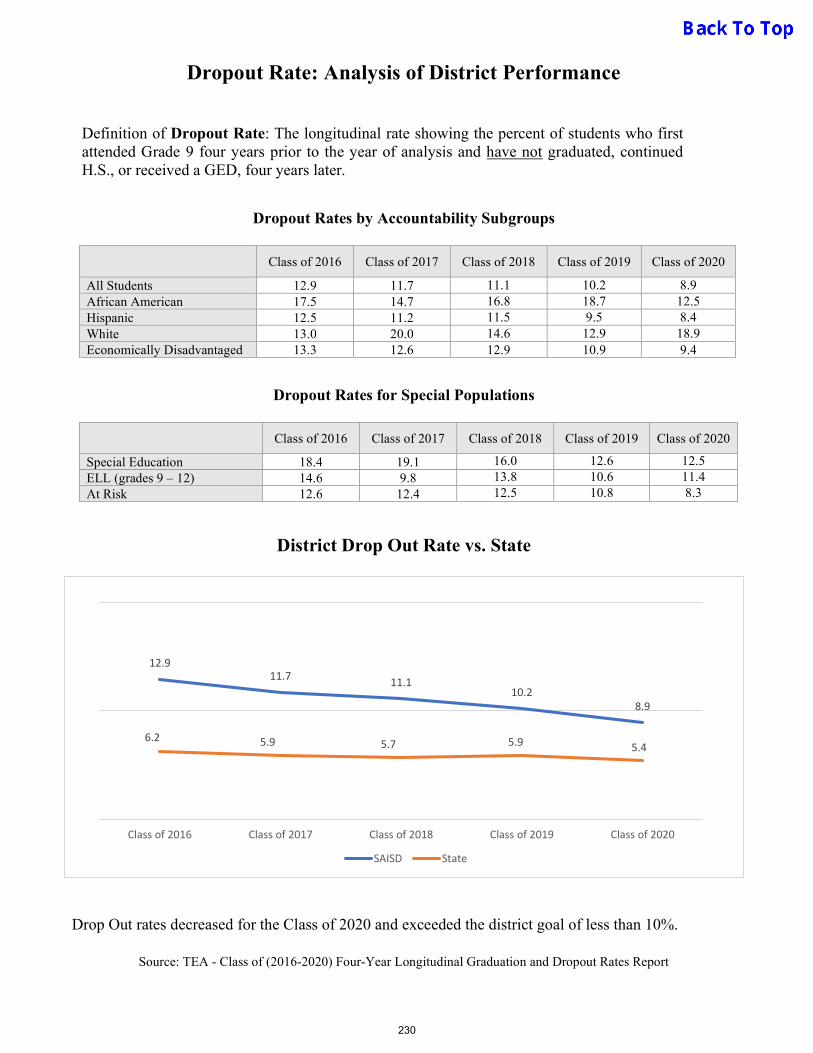
Dropout Rate: Analysis of District Performance
Dropout Rates by Accountability Subgroups
Class of 2016 Class of 2017 Class of 2018 Class of 2019 Class of 2020
All Students 12.9 11.7 11.1 10.2 8.9 African American 17.5 14.7 16.8 18.7 12.5 Hispanic 12.5 11.2 11.5 9.5 8.4 White 13.0 20.0 14.6 12.9 18.9 Economically Disadvantaged 13.3 12.6 12.9 10.9 9.4
Dropout Rates for Special Populations
Class of 2016 Class of 2017 Class of 2018 Class of 2019 Class of 2020
Special Education 18.4 19.1 16.0 12.6 12.5 ELL (grades 9 – 12) 14.6 9.8 13.8 10.6 11.4 At Risk 12.6 12.4 12.5 10.8 8.3
District Drop Out Rate vs. State
Drop Out rates decreased for the Class of 2020 and exceeded the district goal of less than 10%.
Source: TEA - Class of (2016-2020) Four-Year Longitudinal Graduation and Dropout Rates Report
12.911.7 11.1
10.28.9
6.2 5.9 5.7 5.9 5.4
Class of 2016 Class of 2017 Class of 2018 Class of 2019 Class of 2020
SAISD State
Definition of Dropout Rate: The longitudinal rate showing the percent of students who first attended Grade 9 four years prior to the year of analysis and have not graduated, continued H.S., or received a GED, four years later.
230
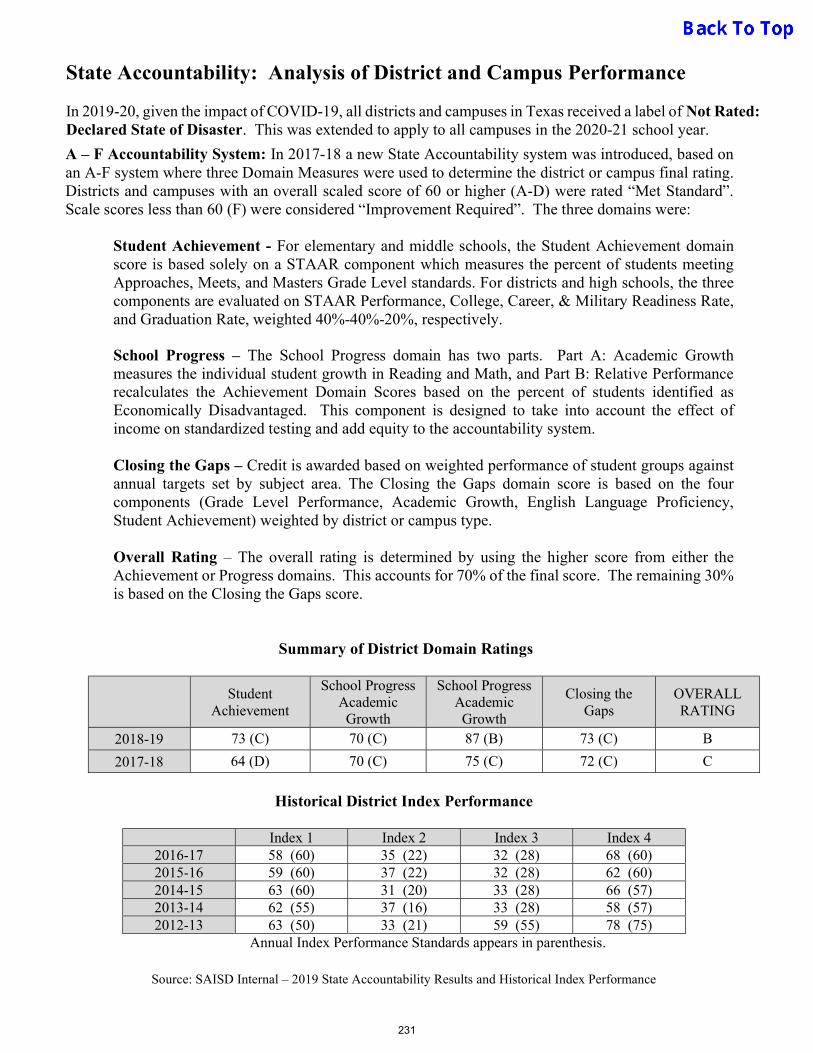
State Accountability: Analysis of District and Campus Performance
In 2019-20, given the impact of COVID-19, all districts and campuses in Texas received a label of Not Rated: Declared State of Disaster. This was extended to apply to all campuses in the 2020-21 school year.
A – F Accountability System: In 2017-18 a new State Accountability system was introduced, based on an A-F system where three Domain Measures were used to determine the district or campus final rating. Districts and campuses with an overall scaled score of 60 or higher (A-D) were rated “Met Standard”. Scale scores less than 60 (F) were considered “Improvement Required”. The three domains were:
Student Achievement - For elementary and middle schools, the Student Achievement domain score is based solely on a STAAR component which measures the percent of students meeting Approaches, Meets, and Masters Grade Level standards. For districts and high schools, the three components are evaluated on STAAR Performance, College, Career, & Military Readiness Rate, and Graduation Rate, weighted 40%-40%-20%, respectively. School Progress – The School Progress domain has two parts. Part A: Academic Growth measures the individual student growth in Reading and Math, and Part B: Relative Performance recalculates the Achievement Domain Scores based on the percent of students identified as Economically Disadvantaged. This component is designed to take into account the effect of income on standardized testing and add equity to the accountability system. Closing the Gaps – Credit is awarded based on weighted performance of student groups against annual targets set by subject area. The Closing the Gaps domain score is based on the four components (Grade Level Performance, Academic Growth, English Language Proficiency, Student Achievement) weighted by district or campus type. Overall Rating – The overall rating is determined by using the higher score from either the Achievement or Progress domains. This accounts for 70% of the final score. The remaining 30% is based on the Closing the Gaps score.
Summary of District Domain Ratings
Student
Achievement
School Progress Academic
Growth
School Progress Academic
Growth
Closing the Gaps
OVERALL RATING
2018-19 73 (C) 70 (C) 87 (B) 73 (C) B
2017-18 64 (D) 70 (C) 75 (C) 72 (C) C
Historical District Index Performance
Index 1 Index 2 Index 3 Index 4
2016-17 58 (60) 35 (22) 32 (28) 68 (60) 2015-16 59 (60) 37 (22) 32 (28) 62 (60) 2014-15 63 (60) 31 (20) 33 (28) 66 (57) 2013-14 62 (55) 37 (16) 33 (28) 58 (57) 2012-13 63 (50) 33 (21) 59 (55) 78 (75)
Annual Index Performance Standards appears in parenthesis.
Source: SAISD Internal – 2019 State Accountability Results and Historical Index Performance
231
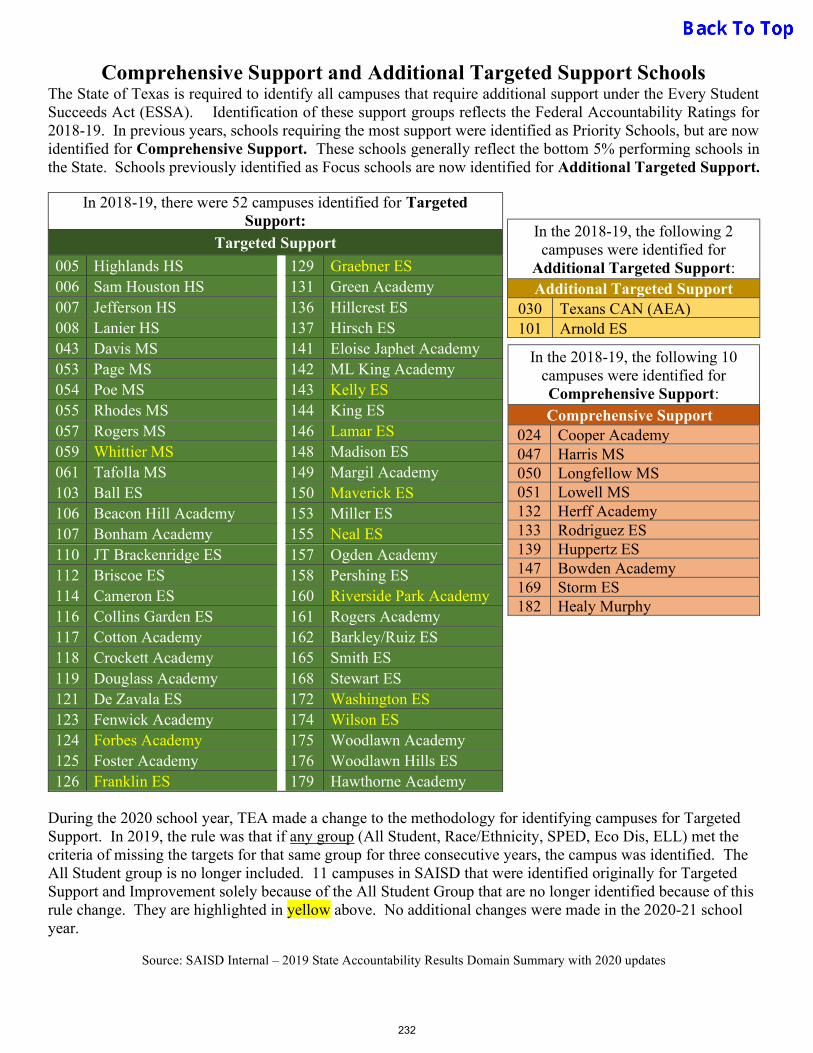
Comprehensive Support and Additional Targeted Support Schools The State of Texas is required to identify all campuses that require additional support under the Every Student Succeeds Act (ESSA). Identification of these support groups reflects the Federal Accountability Ratings for 2018-19. In previous years, schools requiring the most support were identified as Priority Schools, but are now identified for Comprehensive Support. These schools generally reflect the bottom 5% performing schools in the State. Schools previously identified as Focus schools are now identified for Additional Targeted Support.
During the 2020 school year, TEA made a change to the methodology for identifying campuses for Targeted Support. In 2019, the rule was that if any group (All Student, Race/Ethnicity, SPED, Eco Dis, ELL) met the criteria of missing the targets for that same group for three consecutive years, the campus was identified. The All Student group is no longer included. 11 campuses in SAISD that were identified originally for Targeted Support and Improvement solely because of the All Student Group that are no longer identified because of this rule change. They are highlighted in yellow above. No additional changes were made in the 2020-21 school year.
Source: SAISD Internal – 2019 State Accountability Results Domain Summary with 2020 updates
In the 2018-19, the following 10 campuses were identified for Comprehensive Support: Comprehensive Support
024 Cooper Academy 047 Harris MS 050 Longfellow MS 051 Lowell MS 132 Herff Academy 133 Rodriguez ES 139 Huppertz ES 147 Bowden Academy 169 Storm ES 182 Healy Murphy
In 2018-19, there were 52 campuses identified for Targeted Support:
Targeted Support
005 Highlands HS 129 Graebner ES 006 Sam Houston HS 131 Green Academy 007 Jefferson HS 136 Hillcrest ES 008 Lanier HS 137 Hirsch ES 043 Davis MS 141 Eloise Japhet Academy 053 Page MS 142 ML King Academy 054 Poe MS 143 Kelly ES 055 Rhodes MS 144 King ES 057 Rogers MS 146 Lamar ES 059 Whittier MS 148 Madison ES 061 Tafolla MS 149 Margil Academy 103 Ball ES 150 Maverick ES 106 Beacon Hill Academy 153 Miller ES 107 Bonham Academy 155 Neal ES 110 JT Brackenridge ES 157 Ogden Academy 112 Briscoe ES 158 Pershing ES 114 Cameron ES 160 Riverside Park Academy 116 Collins Garden ES 161 Rogers Academy 117 Cotton Academy 162 Barkley/Ruiz ES 118 Crockett Academy 165 Smith ES 119 Douglass Academy 168 Stewart ES 121 De Zavala ES 172 Washington ES 123 Fenwick Academy 174 Wilson ES 124 Forbes Academy 175 Woodlawn Academy 125 Foster Academy 176 Woodlawn Hills ES 126 Franklin ES 179 Hawthorne Academy
In the 2018-19, the following 2 campuses were identified for
Additional Targeted Support: Additional Targeted Support
030 Texans CAN (AEA) 101 Arnold ES
232

Criteria for identification are:
COMPREHENSIVE SUPPORT TARGETED SUPPORT ADDITIONAL TARGETED
SUPPORT The Closing the Gaps domain scaled score is used to identify schools for comprehensive support and improvement. TEA rank orders the scaled domain score for all campuses. The lowest five percent of campuses that receive Title I, Part A funds are identified for comprehensive support and improvement. Also, if a campus does not attain a 67 percent four-year graduation rate for the all students group, the campus is also automatically identified for comprehensive support and improvement. Additionally, any Title I campus identified for targeted support and improvement for three consecutive years is identified for comprehensive support and improvement the following school year.
TEA uses the Closing the Gaps domain to identify campuses that have consistently underperforming student groups. TEA defines “consistently underperforming” as a campus having one or more student groups that do not meet interim benchmark goals for three consecutive years. Any campus that has one or more achievement gap(s) between individual student groups and the performance targets will be identified for targeted support and improvement. In 2020, TEA removed the “All Student” group from the identification process.
Any campus that is not identified for comprehensive or targeted support and improvement will be identified for additional targeted support if an individual student group’s percentage of evaluated indicators met is at or below the percentage used to identify that campus type for comprehensive support and improvement.
Exit Criteria for Comprehensive Support and Improvement Schools Campuses that do not rank in the bottom five percent of the Closing the Gaps domain for two consecutive years and have increased a letter grade (for example, from F to D or from D to C) on the Closing the Gaps domain will be considered as having successfully exited comprehensive support and improvement status. Exit Criteria for Additional Targeted Support and Improvement Schools To exit additional targeted support and improvement status, a student group must meet at least 50 percent of the indicators evaluated and meet the targets for the Academic Achievement component in both reading and mathematics.
233
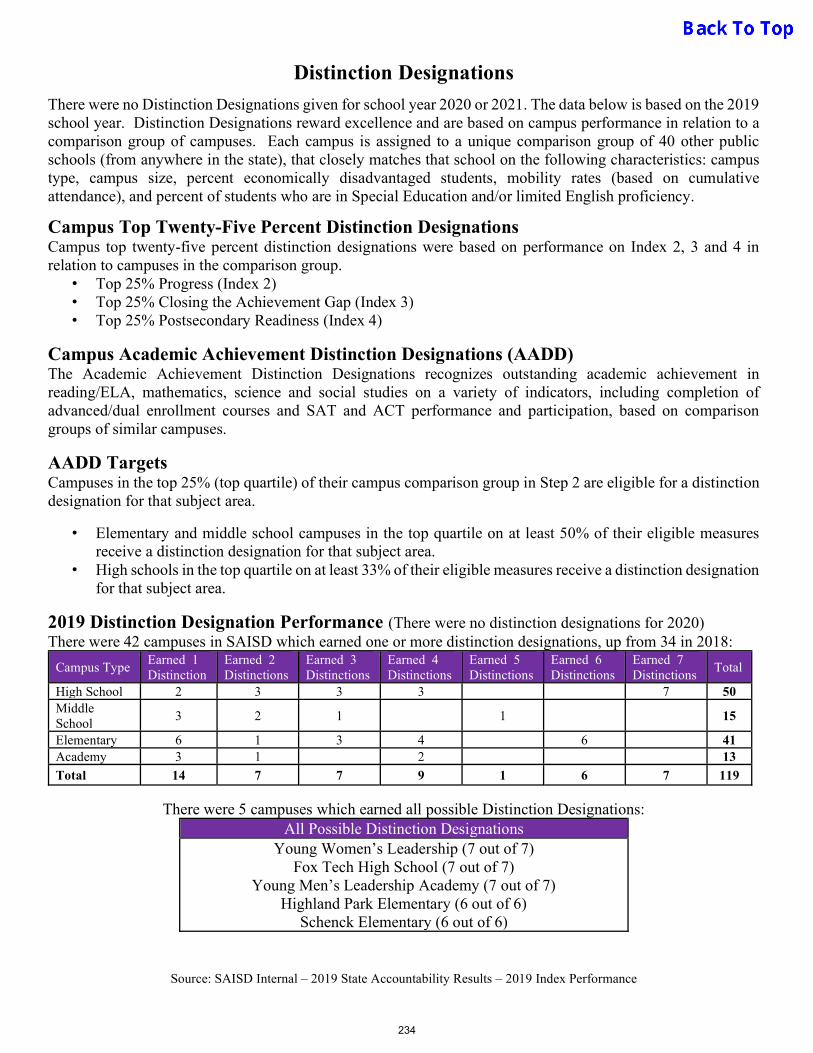
Distinction Designations
There were no Distinction Designations given for school year 2020 or 2021. The data below is based on the 2019 school year. Distinction Designations reward excellence and are based on campus performance in relation to a comparison group of campuses. Each campus is assigned to a unique comparison group of 40 other public schools (from anywhere in the state), that closely matches that school on the following characteristics: campus type, campus size, percent economically disadvantaged students, mobility rates (based on cumulative attendance), and percent of students who are in Special Education and/or limited English proficiency.
Campus Top Twenty-Five Percent Distinction Designations Campus top twenty-five percent distinction designations were based on performance on Index 2, 3 and 4 in relation to campuses in the comparison group.
• Top 25% Progress (Index 2) • Top 25% Closing the Achievement Gap (Index 3) • Top 25% Postsecondary Readiness (Index 4)
Campus Academic Achievement Distinction Designations (AADD) The Academic Achievement Distinction Designations recognizes outstanding academic achievement in reading/ELA, mathematics, science and social studies on a variety of indicators, including completion of advanced/dual enrollment courses and SAT and ACT performance and participation, based on comparison groups of similar campuses.
AADD Targets Campuses in the top 25% (top quartile) of their campus comparison group in Step 2 are eligible for a distinction designation for that subject area.
• Elementary and middle school campuses in the top quartile on at least 50% of their eligible measures receive a distinction designation for that subject area.
• High schools in the top quartile on at least 33% of their eligible measures receive a distinction designation for that subject area.
2019 Distinction Designation Performance (There were no distinction designations for 2020) There were 42 campuses in SAISD which earned one or more distinction designations, up from 34 in 2018:
Campus Type Earned 1 Distinction
Earned 2 Distinctions
Earned 3 Distinctions
Earned 4 Distinctions
Earned 5 Distinctions
Earned 6 Distinctions
Earned 7 Distinctions
Total
High School 2 3 3 3 7 50 Middle School
3 2 1 1 15
Elementary 6 1 3 4 6 41 Academy 3 1 2 13
Total 14 7 7 9 1 6 7 119
There were 5 campuses which earned all possible Distinction Designations: All Possible Distinction Designations
Young Women’s Leadership (7 out of 7) Fox Tech High School (7 out of 7)
Young Men’s Leadership Academy (7 out of 7) Highland Park Elementary (6 out of 6)
Schenck Elementary (6 out of 6)
Source: SAISD Internal – 2019 State Accountability Results – 2019 Index Performance
234
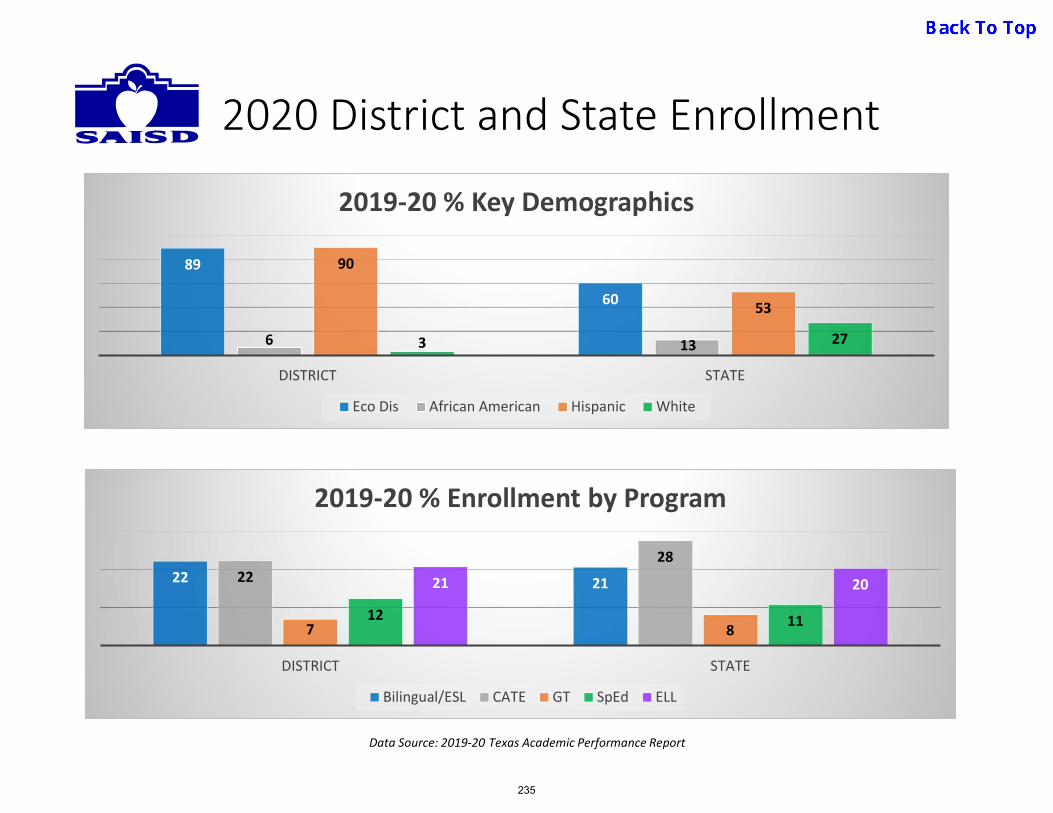
2020 District and State Enrollment
22 212228
7 812 11
21 20
DISTRICT STATE
2019-20 % Enrollment by Program
Bilingual/ESL CATE GT SpEd ELL
89
60
6 13
90
53
3 27
DISTRICT STATE
2019-20 % Key Demographics
Eco Dis African American Hispanic White
Data Source: 2019-20 Texas Academic Performance Report
235

Enrollment, Membership,& Attendance
Data Source: 2020-21 SAISD (Membership graph data tables)
GRADE LEVEL EE PK KG 1 2 3 4 5 6 7 8 9 10 11 12 TOTALS:ENROLLMENT 63 3,923 3,501 3,584 3,361 3,376 3,468 3,513 3,665 3,555 3,510 4,120 3,960 3,205 3,114 49,479MEMBERSHIP 53 3,463 3,179 3,275 3,102 3,101 3,201 3,288 3,412 3,306 3,278 3,573 3,446 2,877 2,765 45,319
% ATT RATE 84.6% 88.9% 89.5% 89.5% 90.0% 90.4% 92.1% 90.9% 91.5% 90.8% 89.4% 84.8% 84.7% 86.6% 88.6% 89.1%
2012 2013 2014 2015 2016 2017 2018 2019 2020* 202195.0% 95.0% 95.3% 94.9% 94.7% 94.3% 93.4% 93.0% 93.1% 89.1%
* 2020 Attendance rate is from Aug.12 to Mar.06 (Pre-Pandemic)
EE PK KG 1 2 3 4 5 6 7 8 9 10 11 12
2021 ENROLLMENT & MEMBERSHIP
ENROLLMENT MEMBERSHIP
Historical ADA Attendance
236

STAAR Performance By Subject:% Approaches Grade Level (Passing)
5760
51
6562
54
61
49
63 6358
65
47
63 6459
69
52
65 67
48
3732
46
59
68 66
58
71 73
READING/ELA MATH WRITING SCIENCE SOCIAL STUDIES
2016 to 2021
2016 2017 2018 2019 2021 State 2021
Data Source: Texas Academic Performance Reportand 2020-21 STAAR Performance Data Tables (TEA)
237
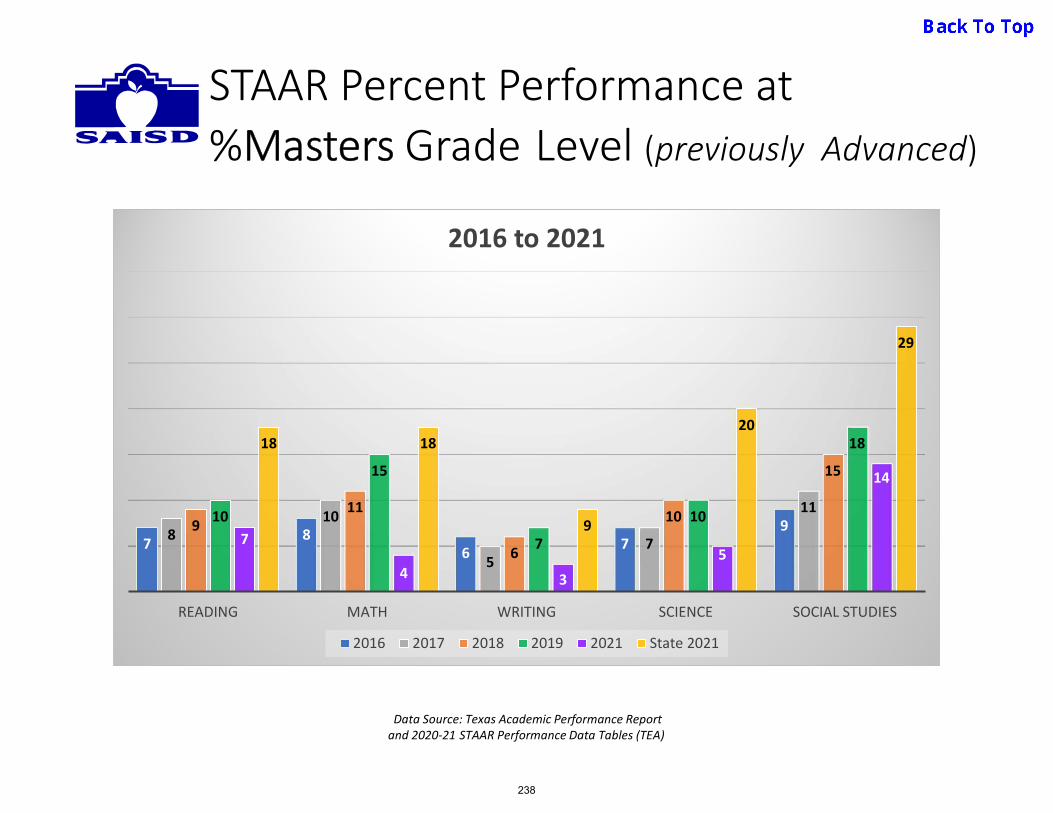
STAAR Percent Performance at %Masters Grade Level (previously Advanced)
7 86 7
9810
57
119
11
6
10
15
10
15
7
10
18
7
4 3
5
14
18 18
9
20
29
READING MATH WRITING SCIENCE SOCIAL STUDIES
2016 to 2021
2016 2017 2018 2019 2021 State 2021
Data Source: Texas Academic Performance Reportand 2020-21 STAAR Performance Data Tables (TEA)
238

STAAR Percent Met or Exceeded %Progress in Reading & Math
55
29
56 5453 52
65 6665 6668 70
READING MATH
% Met or Exceeded Progress
2015 2016 2017 2018 2019 State 2019
Data Source: Texas Academic Performance Reportand 2019-20 STAAR Performance Data Tables (TEA)
There were significant changes to the methodology for calculating growth introduced in 2018-19. This accounted for much of the increase from previous years. Progress measure was not calculated for the school years 2020 and 2021.
239
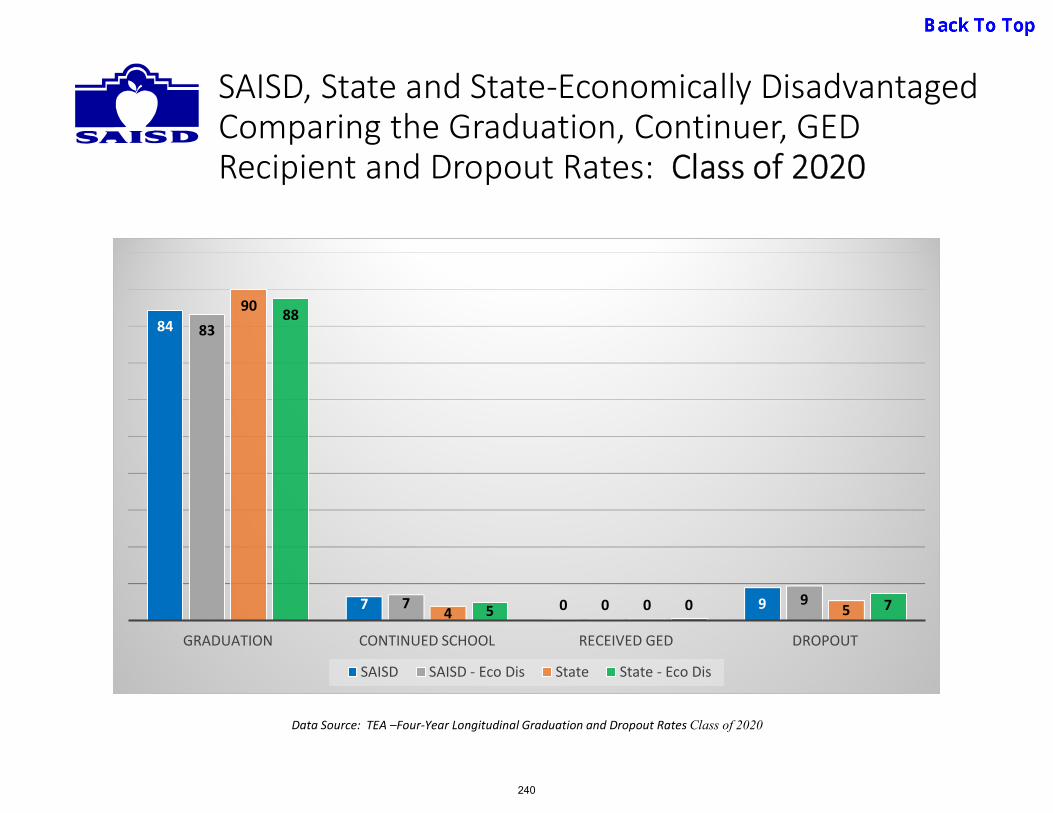
SAISD, State and State-Economically DisadvantagedComparing the Graduation, Continuer, GED Recipient and Dropout Rates: Class of 2020
84
7 0 9
83
7 0 9
90
4 0 5
88
5 0 7
GRADUATION CONTINUED SCHOOL RECEIVED GED DROPOUT
SAISD SAISD - Eco Dis State State - Eco Dis
Data Source: TEA –Four-Year Longitudinal Graduation and Dropout Rates Class of 2020
240

Class of 2020 Graduation Rate by Group
84
73
85
76 7883
9087 89
94
79 79
ALL STUDENTS AFRICAN AMERICAN HISPANIC WHITE SPECIAL EDUCATION
ELL*
SAISD State
Data Source: TEA – Four-Year Longitudinal Graduation and Dropout Rates Class of 2020
241
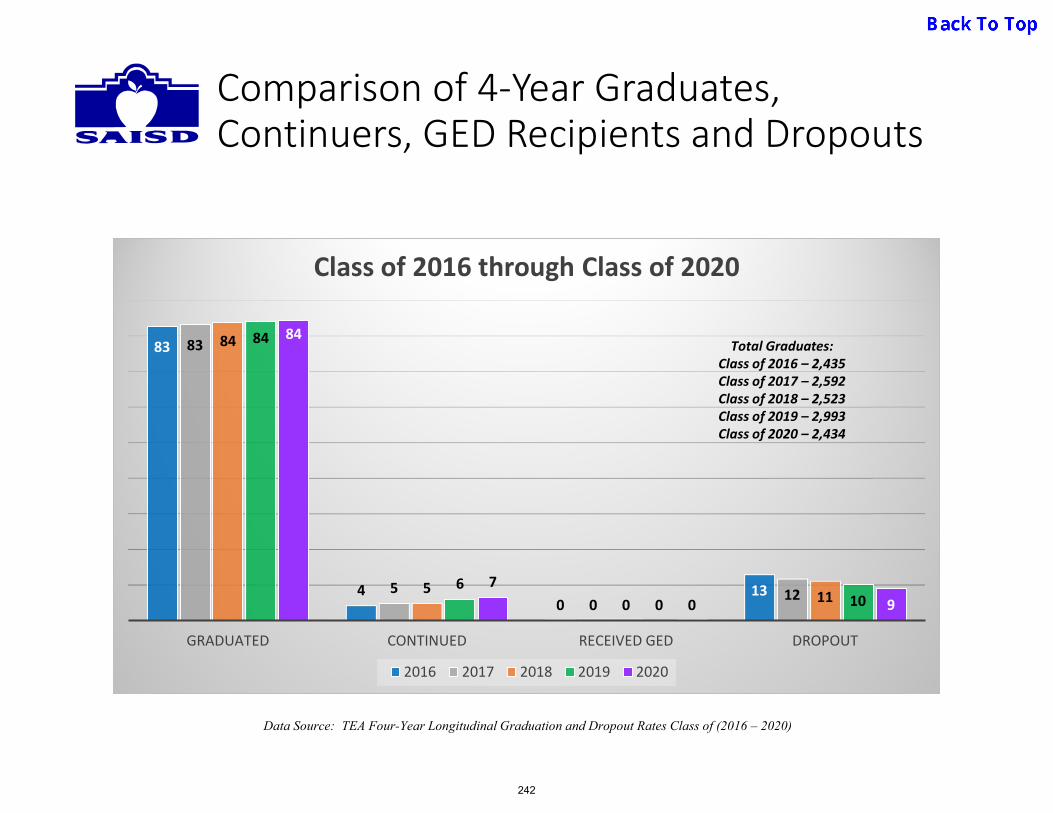
Comparison of 4-Year Graduates, Continuers, GED Recipients and Dropouts
83
40
13
83
50
12
84
50 11
84
60 10
84
70 9
GRADUATED CONTINUED RECEIVED GED DROPOUT
Class of 2016 through Class of 2020
2016 2017 2018 2019 2020
Total Graduates:Class of 2016 – 2,435Class of 2017 – 2,592Class of 2018 – 2,523Class of 2019 – 2,993Class of 2020 – 2,434
Data Source: TEA Four-Year Longitudinal Graduation and Dropout Rates Class of (2016 – 2020)
242
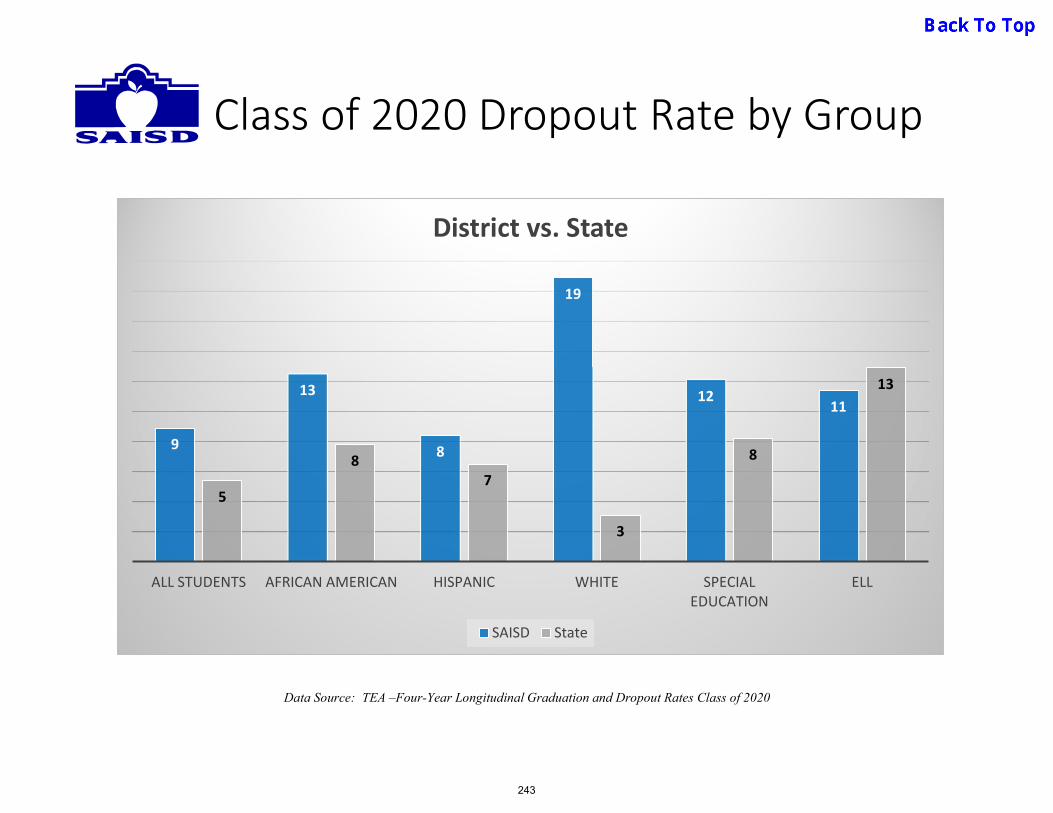
Class of 2020 Dropout Rate by Group
9
13
8
19
1211
5
87
3
8
13
ALL STUDENTS AFRICAN AMERICAN HISPANIC WHITE SPECIAL EDUCATION
ELL
District vs. State
SAISD State
Data Source: TEA –Four-Year Longitudinal Graduation and Dropout Rates Class of 2020
243

English Learners (EL)2021 STAAR Results for EL, Exited EL, and Non-EL Students
• Exited students within their first 4 years of monitoring significantly outperform all groups listed below.
• The percent of EL students at the approaches in level in STAAR Social Studies was significantly lower (-22%) when compared to the district average and 5 percent lower when compared to LEP Parent Denials.
SAISDEL
(tested in English)
EL (testedin
Spanish)
EL (Declined
EL Services)
Exited EL (within last
4 years)
Non-EL Students
Reading/ELA 47 33 47 34 86 49
Math 35 32 35 31 71 34
Science 45 32 14 36 80 48
Social Studies 59 37 n/a 42 70 63
Writing 31 22 25 25 81 32
Data Source: 2019-20 STAAR Performance Data Tables (TEA) Results for EL & Non-EL others using 2021 STAAR Results for ELL, Exited EL, Non-EL District Accountability Subset Report
244
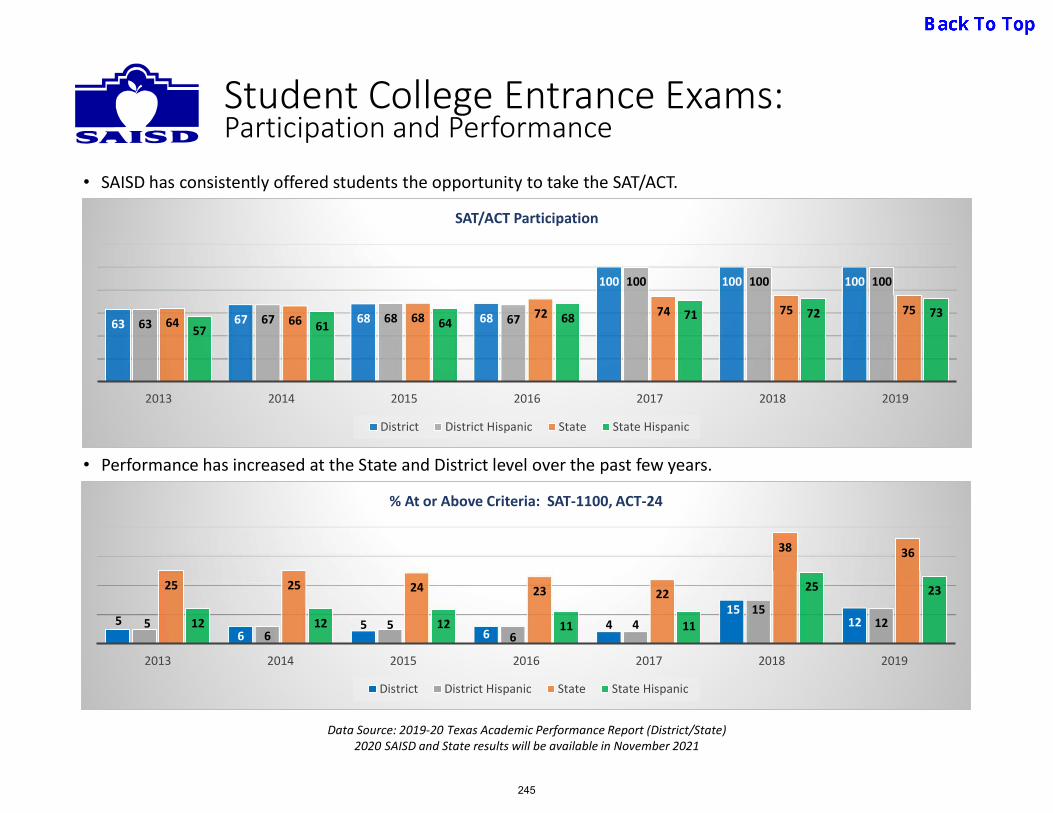
63 67 68 68
100 100 100
63 67 68 67
100 100 100
64 66 68 72 74 75 75
57 61 64 68 71 72 73
2013 2014 2015 2016 2017 2018 2019
SAT/ACT Participation
District District Hispanic State State Hispanic
• SAISD has consistently offered students the opportunity to take the SAT/ACT.
• Performance has increased at the State and District level over the past few years.
Student College Entrance Exams:Participation and Performance
56
56
415
1256
56
415
12
25 25 24 23 22
38 36
12 12 12 11 11
25 23
2013 2014 2015 2016 2017 2018 2019
% At or Above Criteria: SAT-1100, ACT-24
District District Hispanic State State Hispanic
Data Source: 2019-20 Texas Academic Performance Report (District/State)2020 SAISD and State results will be available in November 2021
245
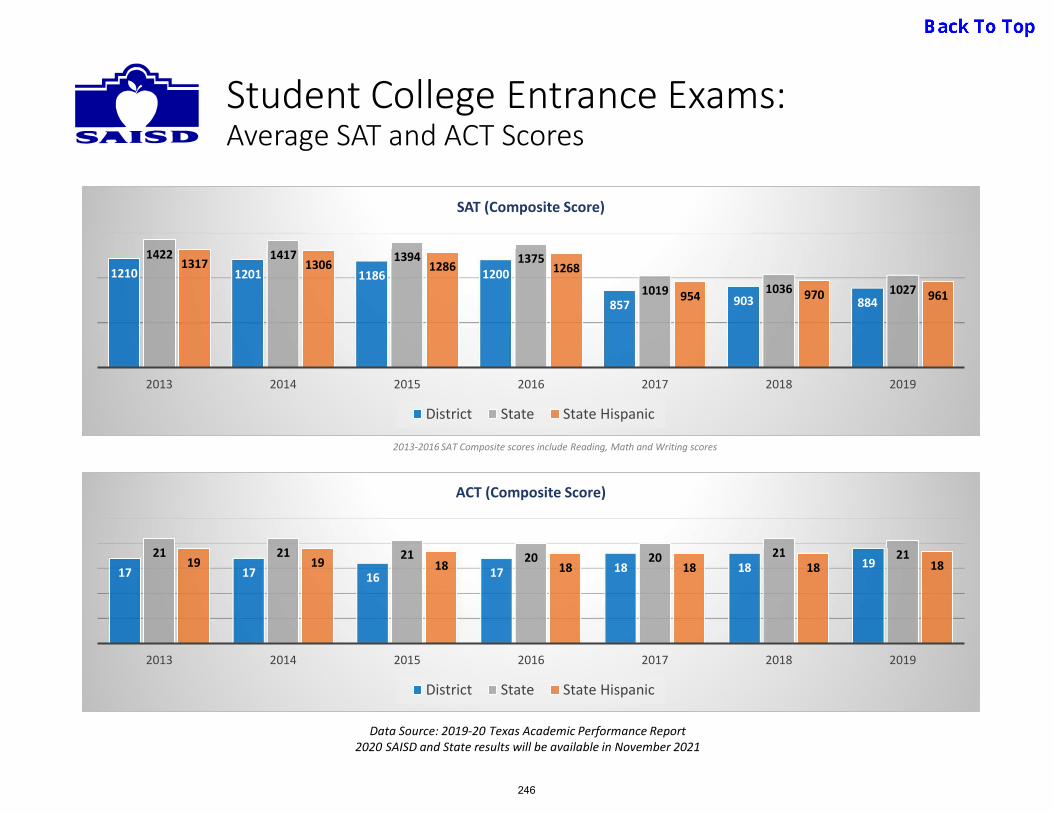
Student College Entrance Exams: Average SAT and ACT Scores
1210 1201 1186 1200
857 903 884
1422 1417 1394 1375
1019 1036 1027
1317 1306 1286 1268
954 970 961
2013 2014 2015 2016 2017 2018 2019
SAT (Composite Score)
District State State Hispanic
17 17 16 17 18 18 1921 21 21 20 20 21 2119 19 18 18 18 18 18
2013 2014 2015 2016 2017 2018 2019
ACT (Composite Score)
District State State Hispanic
2013-2016 SAT Composite scores include Reading, Math and Writing scores
Data Source: 2019-20 Texas Academic Performance Report2020 SAISD and State results will be available in November 2021
246
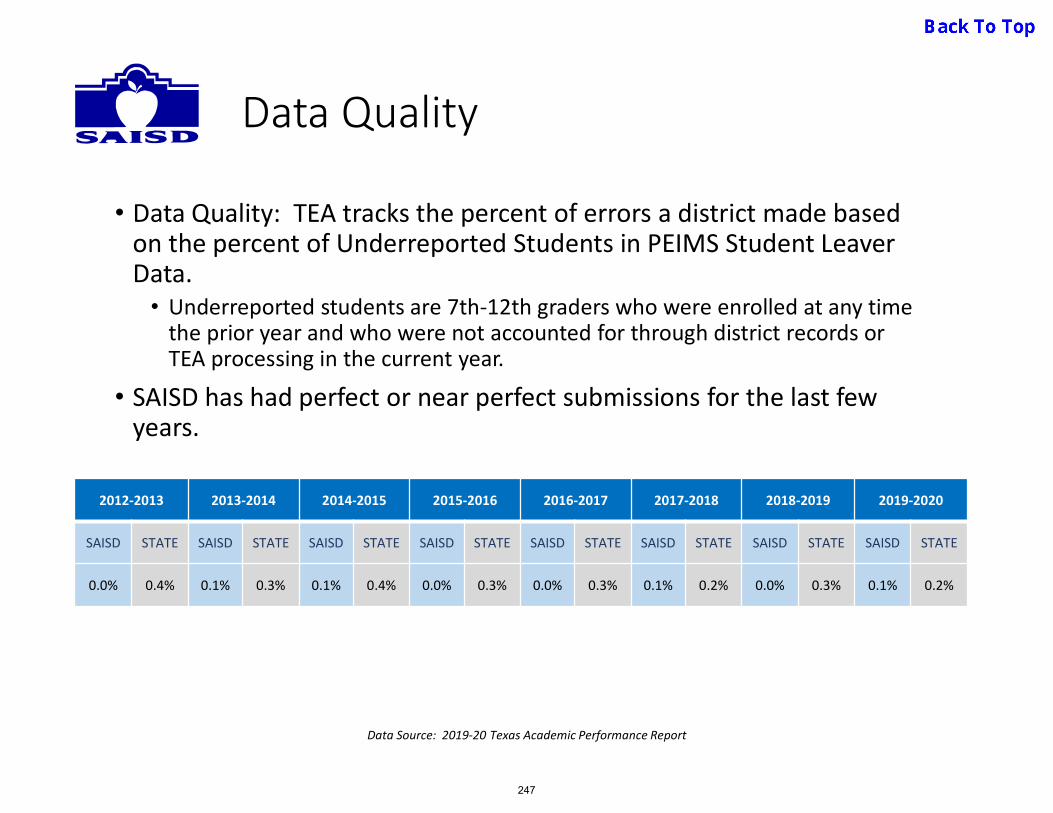
Data Quality
• Data Quality: TEA tracks the percent of errors a district made based on the percent of Underreported Students in PEIMS Student Leaver Data.
• Underreported students are 7th-12th graders who were enrolled at any time the prior year and who were not accounted for through district records or TEA processing in the current year.
• SAISD has had perfect or near perfect submissions for the last few years.
2012-2013 2013-2014 2014-2015 2015-2016 2016-2017 2017-2018 2018-2019 2019-2020
SAISD STATE SAISD STATE SAISD STATE SAISD STATE SAISD STATE SAISD STATE SAISD STATE SAISD STATE
0.0% 0.4% 0.1% 0.3% 0.1% 0.4% 0.0% 0.3% 0.0% 0.3% 0.1% 0.2% 0.0% 0.3% 0.1% 0.2%
Data Source: 2019-20 Texas Academic Performance Report
247
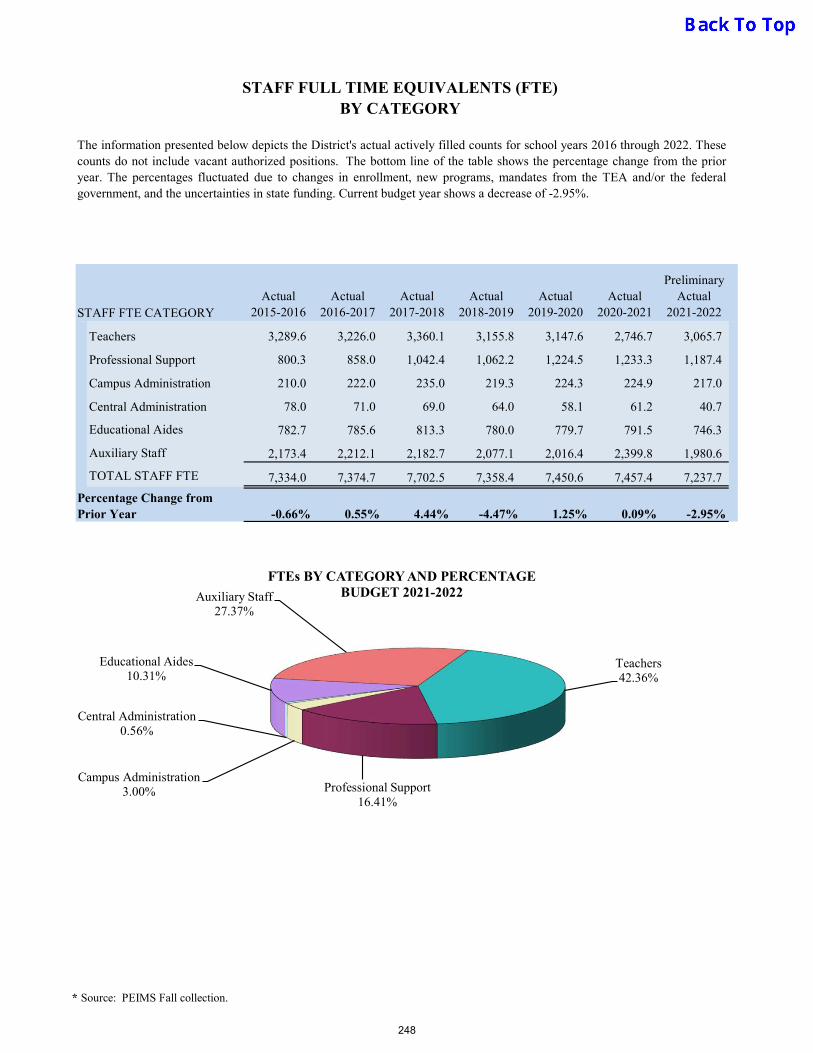
STAFF FULL TIME EQUIVALENTS (FTE) BY CATEGORY
STAFF FTE CATEGORYActual
2015-2016Actual
2016-2017Actual
2017-2018Actual
2018-2019Actual
2019-2020Actual
2020-2021
PreliminaryActual
2021-2022
Teachers 3,289.6 3,226.0 3,360.1 3,155.8 3,147.6 2,746.7 3,065.7
Professional Support 800.3 858.0 1,042.4 1,062.2 1,224.5 1,233.3 1,187.4
Campus Administration 210.0 222.0 235.0 219.3 224.3 224.9 217.0
Central Administration 78.0 71.0 69.0 64.0 58.1 61.2 40.7
Educational Aides 782.7 785.6 813.3 780.0 779.7 791.5 746.3
Auxiliary Staff 2,173.4 2,212.1 2,182.7 2,077.1 2,016.4 2,399.8 1,980.6
TOTAL STAFF FTE 7,334.0 7,374.7 7,702.5 7,358.4 7,450.6 7,457.4 7,237.7
-0.66% 0.55% 4.44% -4.47% 1.25% 0.09% -2.95%
The information presented below depicts the District's actual actively filled counts for school years 2016 through 2022. Thesecounts do not include vacant authorized positions. The bottom line of the table shows the percentage change from the prioryear. The percentages fluctuated due to changes in enrollment, new programs, mandates from the TEA and/or the federalgovernment, and the uncertainties in state funding. Current budget year shows a decrease of -2.95%.
Percentage Change from Prior Year
Teachers42.36%
Professional Support16.41%
Campus Administration3.00%
Central Administration0.56%
Educational Aides10.31%
Auxiliary Staff27.37%
FTEs BY CATEGORY AND PERCENTAGE BUDGET 2021-2022
* Source: PEIMS Fall collection.
248
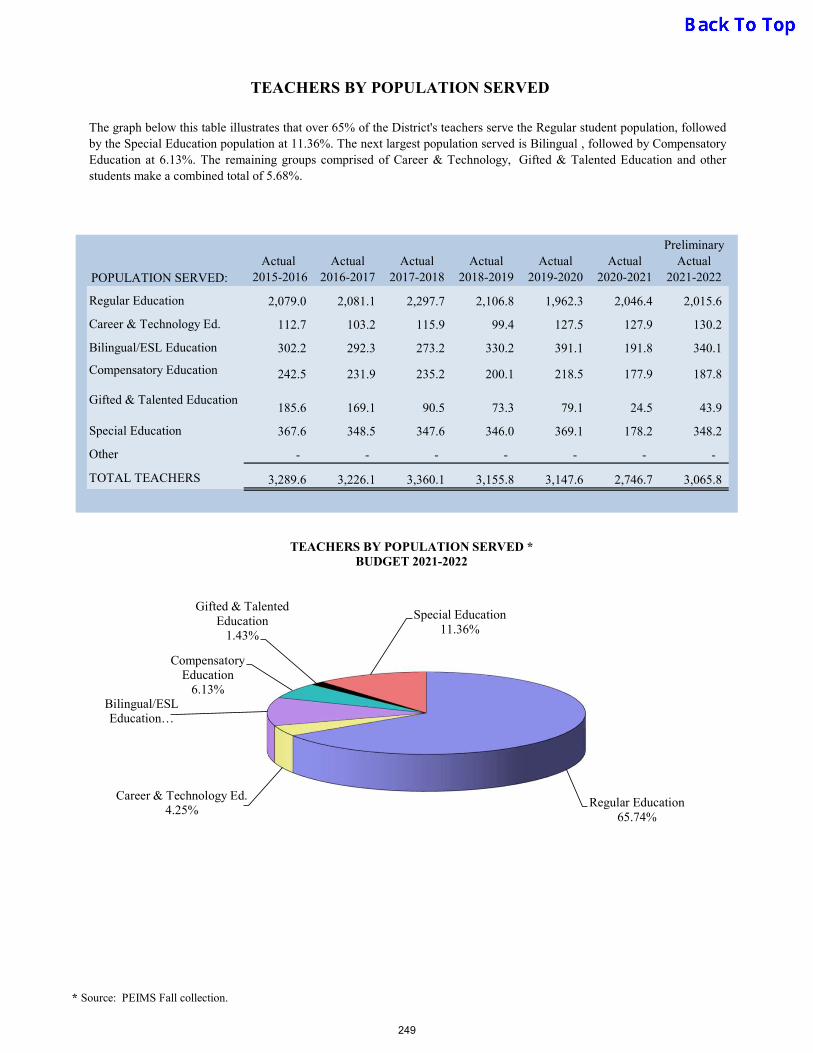
TEACHERS BY POPULATION SERVED
Actual 2015-2016
Actual2016-2017
Actual2017-2018
Actual2018-2019
Actual2019-2020
Actual2020-2021
PreliminaryActual
2021-2022
Regular Education 2,079.0 2,081.1 2,297.7 2,106.8 1,962.3 2,046.4 2,015.6
Career & Technology Ed. 112.7 103.2 115.9 99.4 127.5 127.9 130.2
Bilingual/ESL Education 302.2 292.3 273.2 330.2 391.1 191.8 340.1
Compensatory Education 242.5 231.9 235.2 200.1 218.5 177.9 187.8
Gifted & Talented Education185.6 169.1 90.5 73.3 79.1 24.5 43.9
Special Education 367.6 348.5 347.6 346.0 369.1 178.2 348.2
Other - - - - - - -
TOTAL TEACHERS 3,289.6 3,226.1 3,360.1 3,155.8 3,147.6 2,746.7 3,065.8
POPULATION SERVED:
The graph below this table illustrates that over 65% of the District's teachers serve the Regular student population, followedby the Special Education population at 11.36%. The next largest population served is Bilingual , followed by CompensatoryEducation at 6.13%. The remaining groups comprised of Career & Technology, Gifted & Talented Education and otherstudents make a combined total of 5.68%.
Regular Education65.74%
Career & Technology Ed.4.25%
Bilingual/ESL Education…
Compensatory Education
6.13%
Gifted & Talented Education
1.43%
Special Education11.36%
TEACHERS BY POPULATION SERVED *BUDGET 2021-2022
* Source: PEIMS Fall collection.
249
The District is divided into these major operating division. Identified below are the organizations that compromise each division.
On the following pages, the current year General Fund budget for each department is provided.
701 - Office of the Superintendent 803 - Office of Acad & Sch Ldrshp 808 - Operations
726 - Communications
728 - Internal Audit
807 - Office of Access & Enrollment
884 - Safety & Security (Police) 815 - School Leadership Team 2 743 - Procurement Services
960 - Printing Services 821 - School Leadership Team 5
825 - School Leadership Team 1
826 - School Leadership Team 4 885 - Transportation
840 - School Leadership Team 3
703 - Tax Costs
741 - Planning & Budget 887 - Child Nutrition Services
742 - Financial Services 198 - Special Education District-Wide
890 - Student Health Services 367 - Head Start
893 - Finance - Medicaid 727 - Parent & Community Engagement 930 - Plant Services
805 - SEAD & Restorative Practices 932 - PS Custodial Services
810 - Extended Learning 933 - PS Facilities Maintenance
830 - Dual Language, ESL & Migrant 934 - PS MEP Maintenance
730 - Human Resources 849 - Gifted and Talented
735 - Employee Benefits, Risk 851 - Family & Student Support Svcs.
Management & Safety 855 - Adult & Community Education 935 - Construction & Development Svcs
804 - Office of Continuous Improvement 856 - Org Learning & Support Services
806 - Office of Innovation 858 - Fine Arts
841 - Talent Management 860 - Student & Academic Support Svcs
862 - Grants Development, Mgmt. 865 - College, Career & Military Rdnss 702 - Board of Trustees
866 - Dyslexia / 504 725 - Governmental & Community
868 - Early Childhood Relations
872 - Learning & Compliance Support Svcs 732 - Integrated Communications
950 - Information Technology 873 - Literacy (ELAR) Network
945 - Data Operations & Services 874 - Social Studies 809 - Board & Superintendent Services
875 - Curriculum, Instruction & Assessment
876 - Educational Technology &
Extended Learning
878 - Advanced Acad & Post-Sec Access
880 - Mathematics
881 - Science
883 - Health / Physical Education
886 - Disability & Learning Support Svcs
888 - School Age Parenting889 - Athletics947 - School Improvement & Federal
Programs
Construction Services
District Instruction
Information Technology
Innovation and Talent Mgmt
Board & Superintendent Services
Financial Services
Transportation
Child Nutrition Services
Facility Services
DISTRICT DIVISIONS
Operations (COO)Deputy Superintendent of SchoolsSuperintendent
Campus Leadership
The following two divisions report to the Deputy Supt. of Schools
The following five divisions report to the Chief Operating Officer
Procurement Services
250

Vision 2022 Statement of Duties
Vision 2022 Objectives
Vision 2022 Initiatives & Strategies
Vision 2022 Performance Measurements
General Fund Original Budget 2021-2022
Description
6200 Contracted Services6300 Supplies & Materials6400 Other Operating Costs6600 Capital Outlay
TOTAL
General Fund Actual Expenditures with Prior Year Comparisons
Description 2018 - 2019 % 2019 - 2020 % 2020 - 2021 %6100 Payroll 483,816$ 18.1% 523,875$ 27.2% 524,848$ 25.1%6200 Contracted Services 2,061,234 77.1% 1,290,977 66.9% 1,423,436$ 68.2%6300 Supplies & Materials 6,889 0.3% 1,064 0.1% 1,345 0.1%6400 Other Operating Costs 121,620 4.5% 113,551 5.9% 138,992 6.7%6600 Capital Outlay - 0.0% - 0.0% - 0.0%
TOTAL 2,673,560$ 100.0% 1,929,466$ 100.0% 2,088,621$ 100.0%
General Fund Budgeted Staff with Prior Year Comparisons
Description 2019 - 2020 % 2020 - 2021 % 2021 - 2022 %Professional 1.00 50.0% 1.00 50.0% 1.00 50.0%Paraprofessional 1.00 50.0% 1.00 50.0% 1.00 50.0%Classified 0.00 0.0% 0.00 0.0% 0.00 0.0%
TOTAL 2.00 100.0% 2.00 100.0% 2.00 100.0%
- 0.0%2,020,591$ 100.0%
1,371,000 67.9%5,000 0.2%
152,611 7.6%
An annual budget will incorporate strategies and be adopted by the Board of Trustees prior to June 30th of each year and budget changes and reports will be processed in an efficient manner.
Amount Percentage6100 Payroll Costs 491,980$ 24.3%
Maintain a smooth operating Superintendent's budget. Maintain all incoming and outgoing requisitions, invoices, payments in an efficient manner.
The annual budget process will take into account district enhancements and priorities to ensure that long term planning and goals determine what budget decisions are made.
Superintendent's Office - Org. # 701Budget Year 2021 - 2022
To plan, coordinate, prepare, present and monitor the Superintendent's Annual Budget. To provide timely budget assistance to all vendors, schools, departments, and process all budget documents.
251

Vision 2022 Statement of Duties
Vision 2022 Objectives
Vision 2022 Initiatives & Strategies
Vision 2022 Performance Measurements
General Fund Original Budget 2021-2022
Description
6200 Contracted Services6300 Supplies & Materials6400 Other Operating Costs6600 Capital Outlay
TOTAL
General Fund Actual Expenditures with Prior Year Comparisons
Description 2018 - 2019 % 2019 - 2020 % 2020 - 2021 %6100 Payroll 734,181$ 73.1% 798,460$ 77.9% 759,689$ 68.1%6200 Contracted Services 159,891 15.9% 131,155 12.8% 245,466$ 22.0%6300 Supplies & Materials 53,010 5.3% 45,003 4.4% 78,980 7.1%6400 Other Operating Costs 56,596 5.6% 50,352 4.9% 32,189 2.9%6600 Capital Outlay - 0.0% - 0.0% - 0.0%
TOTAL 1,003,677$ 100.0% 1,024,970$ 100.0% 1,116,323$ 100.0%
General Fund Budgeted Staff with Prior Year Comparisons
Description 2019 - 2020 % 2020 - 2021 % 2021 - 2022 %Professional 8.50 89.5% 7.50 88.2% 9.25 90.2%Paraprofessional 1.00 10.5% 1.00 11.8% 1.00 9.8%Classified 0.00 0.0% 0.00 0.0% 0.00 0.0%
TOTAL 9.50 100.0% 8.50 100.0% 10.25 100.0%
6,620 0.6%1,170,494$ 100.0%
153,240 13.1%48,337 4.1%13,706 1.2%
A well-informed public on SAISD successes, and increased confidence among key stakeholders in the District and our schools. Increased community trust in District’s implementation of the bond, and a shared view of bond’s success in providing for our students. Enrollment maintained or increased.
Amount Percentage6100 Payroll Costs 948,591$ 81.0%
Build the reputation as a District providing students a high-quality education with access to best-in-class programs and offerings. Ensure awareness of progress of bond 2016 projects while building support and buy-in for a future bond. Retain & Recruit students through a comprehensive marketing program.
Sustained communications on District plan and progress toward goals. Build on the shared vision of providing students what they need to succeed and utilize a combination of outreach/communications strategies to reach all stakeholders around bonds. Execute broad, integrated campaigns for choice application period and registration and support campuses in engaging with their community.
Communications - Org. # 726Budget Year 2021 - 2022
Our mission is to increase the value of SAISD among its publics through the creation of clear, honest, timely and targeted communications strategies and products that foster trust with our audiences and influence perceptions. We develop communications that deliver key messages to inform and engage stakeholders using multiple channels, including the media, web, social media, publications, marketing, video, events and a variety of public awareness programs.
252
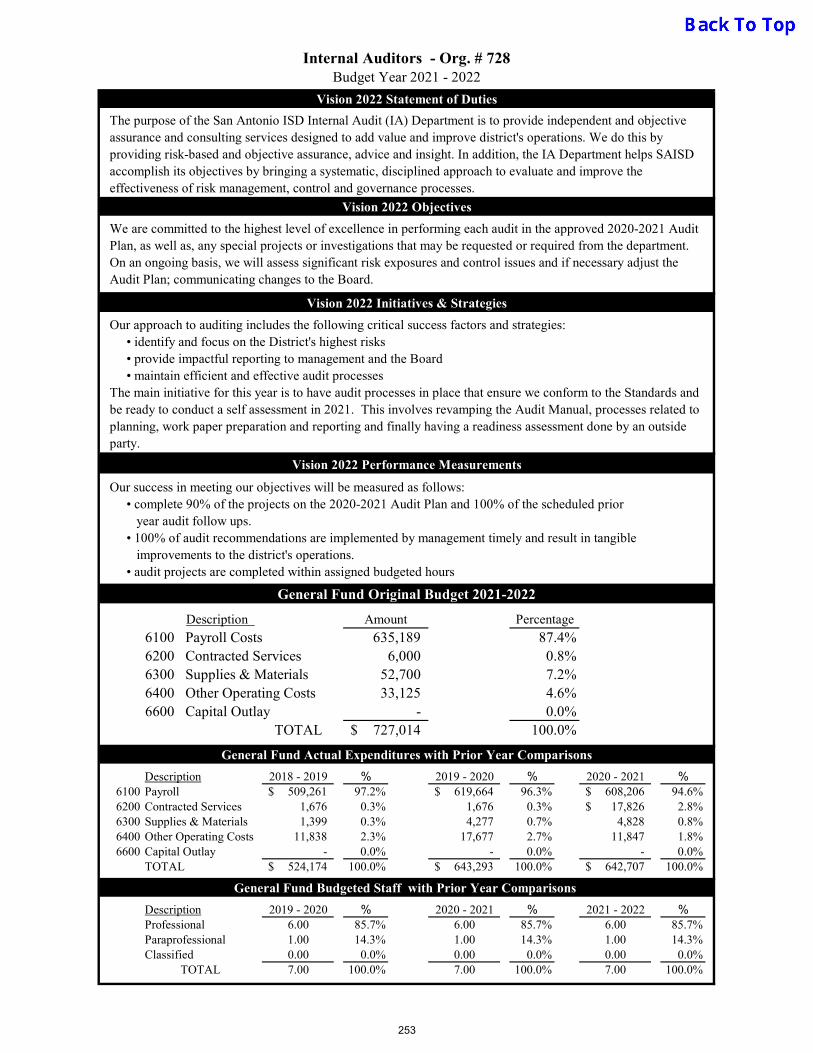
Vision 2022 Statement of Duties
Vision 2022 Objectives
Vision 2022 Initiatives & Strategies
Vision 2022 Performance Measurements
General Fund Original Budget 2021-2022
Description
6200 Contracted Services6300 Supplies & Materials6400 Other Operating Costs6600 Capital Outlay
TOTAL
General Fund Actual Expenditures with Prior Year Comparisons
Description 2018 - 2019 % 2019 - 2020 % 2020 - 2021 %6100 Payroll 509,261$ 97.2% 619,664$ 96.3% 608,206$ 94.6%6200 Contracted Services 1,676 0.3% 1,676 0.3% 17,826$ 2.8%6300 Supplies & Materials 1,399 0.3% 4,277 0.7% 4,828 0.8%6400 Other Operating Costs 11,838 2.3% 17,677 2.7% 11,847 1.8%6600 Capital Outlay - 0.0% - 0.0% - 0.0%
TOTAL 524,174$ 100.0% 643,293$ 100.0% 642,707$ 100.0%
General Fund Budgeted Staff with Prior Year Comparisons
Description 2019 - 2020 % 2020 - 2021 % 2021 - 2022 %Professional 6.00 85.7% 6.00 85.7% 6.00 85.7%Paraprofessional 1.00 14.3% 1.00 14.3% 1.00 14.3%Classified 0.00 0.0% 0.00 0.0% 0.00 0.0%
TOTAL 7.00 100.0% 7.00 100.0% 7.00 100.0%
Internal Auditors - Org. # 728Budget Year 2021 - 2022
The purpose of the San Antonio ISD Internal Audit (IA) Department is to provide independent and objective assurance and consulting services designed to add value and improve district's operations. We do this by providing risk-based and objective assurance, advice and insight. In addition, the IA Department helps SAISD accomplish its objectives by bringing a systematic, disciplined approach to evaluate and improve the effectiveness of risk management, control and governance processes.
We are committed to the highest level of excellence in performing each audit in the approved 2020-2021 Audit Plan, as well as, any special projects or investigations that may be requested or required from the department. On an ongoing basis, we will assess significant risk exposures and control issues and if necessary adjust the Audit Plan; communicating changes to the Board.
Our approach to auditing includes the following critical success factors and strategies: • identify and focus on the District's highest risks • provide impactful reporting to management and the Board • maintain efficient and effective audit processesThe main initiative for this year is to have audit processes in place that ensure we conform to the Standards and be ready to conduct a self assessment in 2021. This involves revamping the Audit Manual, processes related to planning, work paper preparation and reporting and finally having a readiness assessment done by an outside party.
Our success in meeting our objectives will be measured as follows: • complete 90% of the projects on the 2020-2021 Audit Plan and 100% of the scheduled prior year audit follow ups. • 100% of audit recommendations are implemented by management timely and result in tangible improvements to the district's operations. • audit projects are completed within assigned budgeted hours
Amount Percentage
6100 Payroll Costs 635,189 87.4%6,000 0.8%
52,700 7.2%33,125 4.6%
- 0.0%727,014$ 100.0%
253
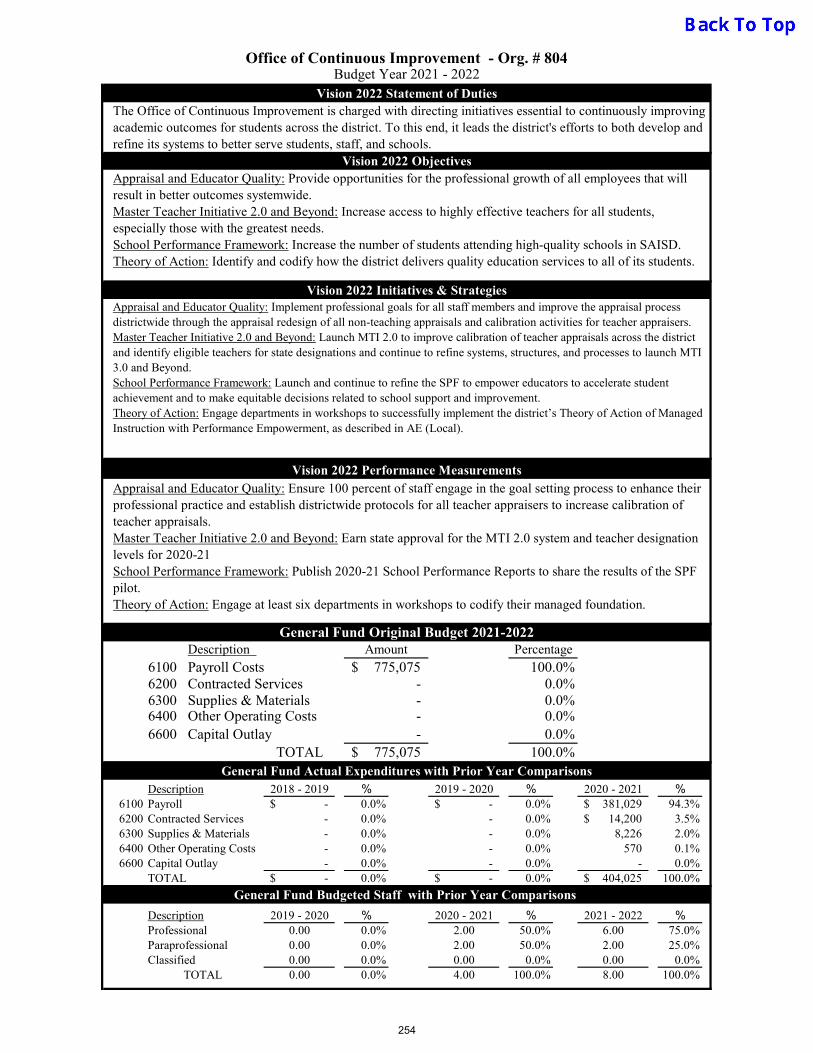
Vision 2022 Statement of Duties
Vision 2022 Objectives
Vision 2022 Initiatives & Strategies
Vision 2022 Performance Measurements
General Fund Original Budget 2021-2022Description
6200 Contracted Services6300 Supplies & Materials6400 Other Operating Costs6600 Capital Outlay
TOTALGeneral Fund Actual Expenditures with Prior Year Comparisons
Description 2018 - 2019 % 2019 - 2020 % 2020 - 2021 %6100 Payroll -$ 0.0% -$ 0.0% 381,029$ 94.3%6200 Contracted Services - 0.0% - 0.0% 14,200$ 3.5%6300 Supplies & Materials - 0.0% - 0.0% 8,226 2.0%6400 Other Operating Costs - 0.0% - 0.0% 570 0.1%6600 Capital Outlay - 0.0% - 0.0% - 0.0%
TOTAL -$ 0.0% -$ 0.0% 404,025$ 100.0%
General Fund Budgeted Staff with Prior Year Comparisons
Description 2019 - 2020 % 2020 - 2021 % 2021 - 2022 %Professional 0.00 0.0% 2.00 50.0% 6.00 75.0%Paraprofessional 0.00 0.0% 2.00 50.0% 2.00 25.0%Classified 0.00 0.0% 0.00 0.0% 0.00 0.0%
TOTAL 0.00 0.0% 4.00 100.0% 8.00 100.0%
- 0.0%775,075$ 100.0%
- 0.0%- 0.0%- 0.0%
Appraisal and Educator Quality: Ensure 100 percent of staff engage in the goal setting process to enhance their professional practice and establish districtwide protocols for all teacher appraisers to increase calibration of teacher appraisals.Master Teacher Initiative 2.0 and Beyond: Earn state approval for the MTI 2.0 system and teacher designation levels for 2020-21School Performance Framework: Publish 2020-21 School Performance Reports to share the results of the SPF pilot.Theory of Action: Engage at least six departments in workshops to codify their managed foundation.
Amount Percentage6100 Payroll Costs 775,075$ 100.0%
Appraisal and Educator Quality: Provide opportunities for the professional growth of all employees that will result in better outcomes systemwide.Master Teacher Initiative 2.0 and Beyond: Increase access to highly effective teachers for all students, especially those with the greatest needs. School Performance Framework: Increase the number of students attending high-quality schools in SAISD.Theory of Action: Identify and codify how the district delivers quality education services to all of its students.
Appraisal and Educator Quality: Implement professional goals for all staff members and improve the appraisal process districtwide through the appraisal redesign of all non-teaching appraisals and calibration activities for teacher appraisers.Master Teacher Initiative 2.0 and Beyond: Launch MTI 2.0 to improve calibration of teacher appraisals across the district and identify eligible teachers for state designations and continue to refine systems, structures, and processes to launch MTI 3.0 and Beyond.School Performance Framework: Launch and continue to refine the SPF to empower educators to accelerate student achievement and to make equitable decisions related to school support and improvement. Theory of Action: Engage departments in workshops to successfully implement the district’s Theory of Action of Managed Instruction with Performance Empowerment, as described in AE (Local).
Office of Continuous Improvement - Org. # 804Budget Year 2021 - 2022
The Office of Continuous Improvement is charged with directing initiatives essential to continuously improving academic outcomes for students across the district. To this end, it leads the district's efforts to both develop and refine its systems to better serve students, staff, and schools.
254
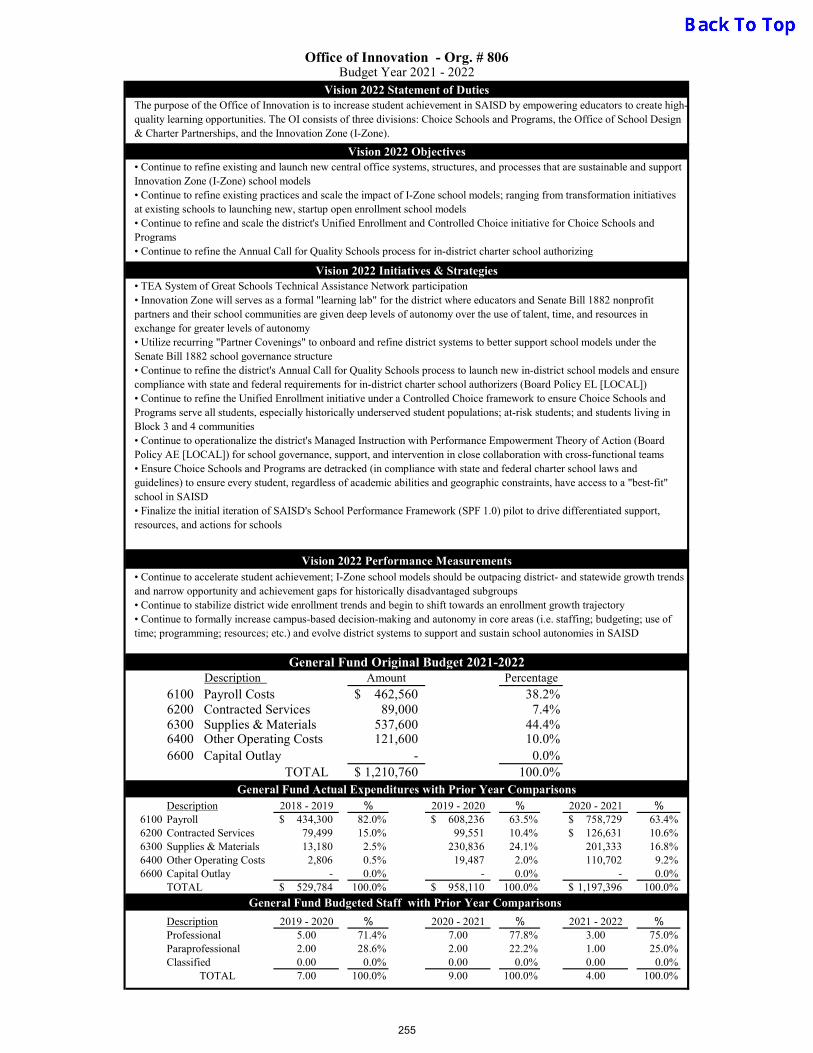
Vision 2022 Statement of Duties
Vision 2022 Objectives
Vision 2022 Initiatives & Strategies
Vision 2022 Performance Measurements
General Fund Original Budget 2021-2022Description
6200 Contracted Services6300 Supplies & Materials6400 Other Operating Costs6600 Capital Outlay
TOTALGeneral Fund Actual Expenditures with Prior Year Comparisons
Description 2018 - 2019 % 2019 - 2020 % 2020 - 2021 %6100 Payroll 434,300$ 82.0% 608,236$ 63.5% 758,729$ 63.4%6200 Contracted Services 79,499 15.0% 99,551 10.4% 126,631$ 10.6%6300 Supplies & Materials 13,180 2.5% 230,836 24.1% 201,333 16.8%6400 Other Operating Costs 2,806 0.5% 19,487 2.0% 110,702 9.2%6600 Capital Outlay - 0.0% - 0.0% - 0.0%
TOTAL 529,784$ 100.0% 958,110$ 100.0% 1,197,396$ 100.0%
General Fund Budgeted Staff with Prior Year Comparisons
Description 2019 - 2020 % 2020 - 2021 % 2021 - 2022 %Professional 5.00 71.4% 7.00 77.8% 3.00 75.0%Paraprofessional 2.00 28.6% 2.00 22.2% 1.00 25.0%Classified 0.00 0.0% 0.00 0.0% 0.00 0.0%
TOTAL 7.00 100.0% 9.00 100.0% 4.00 100.0%
- 0.0%1,210,760$ 100.0%
89,000 7.4%537,600 44.4%121,600 10.0%
• Continue to accelerate student achievement; I-Zone school models should be outpacing district- and statewide growth trends and narrow opportunity and achievement gaps for historically disadvantaged subgroups• Continue to stabilize district wide enrollment trends and begin to shift towards an enrollment growth trajectory• Continue to formally increase campus-based decision-making and autonomy in core areas (i.e. staffing; budgeting; use of time; programming; resources; etc.) and evolve district systems to support and sustain school autonomies in SAISD
Amount Percentage
6100 Payroll Costs 462,560$ 38.2%
• Continue to refine existing and launch new central office systems, structures, and processes that are sustainable and support Innovation Zone (I-Zone) school models• Continue to refine existing practices and scale the impact of I-Zone school models; ranging from transformation initiatives at existing schools to launching new, startup open enrollment school models• Continue to refine and scale the district's Unified Enrollment and Controlled Choice initiative for Choice Schools and Programs• Continue to refine the Annual Call for Quality Schools process for in-district charter school authorizing
• TEA System of Great Schools Technical Assistance Network participation• Innovation Zone will serves as a formal "learning lab" for the district where educators and Senate Bill 1882 nonprofit partners and their school communities are given deep levels of autonomy over the use of talent, time, and resources in exchange for greater levels of autonomy• Utilize recurring "Partner Covenings" to onboard and refine district systems to better support school models under the Senate Bill 1882 school governance structure • Continue to refine the district's Annual Call for Quality Schools process to launch new in-district school models and ensure compliance with state and federal requirements for in-district charter school authorizers (Board Policy EL [LOCAL])• Continue to refine the Unified Enrollment initiative under a Controlled Choice framework to ensure Choice Schools and Programs serve all students, especially historically underserved student populations; at-risk students; and students living in Block 3 and 4 communities• Continue to operationalize the district's Managed Instruction with Performance Empowerment Theory of Action (Board Policy AE [LOCAL]) for school governance, support, and intervention in close collaboration with cross-functional teams • Ensure Choice Schools and Programs are detracked (in compliance with state and federal charter school laws and guidelines) to ensure every student, regardless of academic abilities and geographic constraints, have access to a "best-fit" school in SAISD• Finalize the initial iteration of SAISD's School Performance Framework (SPF 1.0) pilot to drive differentiated support, resources, and actions for schools
Office of Innovation - Org. # 806Budget Year 2021 - 2022
The purpose of the Office of Innovation is to increase student achievement in SAISD by empowering educators to create high-quality learning opportunities. The OI consists of three divisions: Choice Schools and Programs, the Office of School Design & Charter Partnerships, and the Innovation Zone (I-Zone).
255

Vision 2022 Statement of Duties
Vision 2022 Objectives
Vision 2022 Initiatives & Strategies
Vision 2022 Performance Measurements
General Fund Original Budget 2021-2022Description
6200 Contracted Services6300 Supplies & Materials6400 Other Operating Costs6600 Capital Outlay
TOTALGeneral Fund Actual Expenditures with Prior Year Comparisons
Description 2018 - 2019 % 2019 - 2020 % 2020 - 2021 %6100 Payroll -$ 0.0% 348,013$ 0.0% 614,456$ 93.8%6200 Contracted Services - 0.0% 1,351 0.0% 29,617$ 4.5%6300 Supplies & Materials - 0.0% 12,604 0.0% 10,442 1.6%6400 Other Operating Costs - 0.0% 9,173 0.0% 283 0.0%6600 Capital Outlay - 0.0% - 0.0% - 0.0%
TOTAL -$ 0.0% 371,141$ 0.0% 654,797$ 100.0%
General Fund Budgeted Staff with Prior Year Comparisons
Description 2019 - 2020 % 2020 - 2021 % 2021 - 2022 %Professional 0.00 0.0% 5.00 50.0% 5.00 50.0%Paraprofessional 0.00 0.0% 5.00 50.0% 5.00 50.0%Classified 0.00 0.0% 0.00 0.0% 0.00 0.0%
TOTAL 0.00 0.0% 10.00 100.0% 10.00 100.0%
-$ 0.0%743,224$ 100.0%
2,200$ 0.3%53,100$ 7.1%14,700$ 2.0%
•Stabilize districtwide enrollment from PEIMS snapshot to PEIMS snapshot •Increase retention rate of currently enrolled students to the following year, especially in transition grades (PK to KG, 5 to 6,
8 to 9) •Increase return of previously withdrawn students
Amount Percentage6100 Payroll Costs 673,224$ 90.6%
•Establish, update, and maintain enrollment systems and processes, including registration, Choice application, transfers, withdrawals, and all policies related to unified enrollment and Controlled Choice framework •Create and implement annual district enrollment recruitment and retention strategy
•Districtwide enrollment plan, to include targeted neighborhood retention and recruitment plans •Districtwide transitions plan •Districtwide enrollment manual •Mobile registration strategy •Centralized enrollment information hub for families •“We Miss You” reach out campaign of withdrawn students
Office of Access & Enrollment - Org. # 807Budget Year 2021 - 2022
The Office of Access and Enrollment Services supports and oversees the District’s enrollment procedures, which includes systems such as the registration process, the transfer process, and the Choice application and selection process. The department is focused on providing a unified enrollment process that ensures equitable access to all campuses in SAISD, with an overall goal of stabilizing and increasing districtwide enrollment.
256

Vision 2022 Statement of Duties
Vision 2022 Objectives
Vision 2022 Initiatives & Strategies
Vision 2022 Performance Measurements
General Fund Original Budget 2021-2022
Description
6200 Contracted Services6300 Supplies & Materials6400 Other Operating Costs6600 Capital Outlay
TOTAL
General Fund Actual Expenditures with Prior Year Comparisons
Description 2018 - 2019 % 2019 - 2020 % 2020 - 2021 %6100 Payroll 3,510,732$ 83.7% 2,772,863$ 81.0% 2,598,544$ 85.0%6200 Contracted Services 484,674 11.5% 348,154 10.2% 291,105$ 9.5%6300 Supplies & Materials 86,283 2.1% 226,549 6.6% 117,231 3.8%6400 Other Operating Costs 115,177 2.7% 73,610 2.2% 51,355 1.7%6600 Capital Outlay - 0.0% - 0.0% - 0.0%
TOTAL 4,196,866$ 100.0% 3,421,176$ 100.0% 3,058,235$ 100.0%
General Fund Budgeted Staff with Prior Year Comparisons
Description 2019 - 2020 % 2020 - 2021 % 2021 - 2022 %Professional 30.00 56.6% 20.00 50.0% 23.00 50.0%Paraprofessional 23.00 43.4% 20.00 50.0% 23.00 50.0%Classified 0.00 0.0% 0.00 0.0% 0.00 0.0%
TOTAL 53.00 100.0% 40.00 100.0% 46.00 100.0%
Talent Management - Org. # 841Budget Year 2021 - 2022
Our vision is to supply the district high quality talent necessary to reach our organizational goal to improve academic achievement for all students through strategic recruitment and hiring, ongoing performance evaluation to enhance the skills and abilites of the workforce, retaining top talent and the district's 'irreplaceables' and using data to drive our decision-making.
Our objectives are to recruit, hire and retain high-quality educators and support staff and provide on-going guidance and support to all employees through fair and equitable evaluation practices and the expertise of experienced educators to support new and strugglilng teachers and leaders.
To reach our vision and objectives, we will employ the following objectives: 1) Launch a robust recruitment campaign and programs to attract talent to the district 2) Develop performance evaluations for non-certified and professional staff 3) Streamline and automate our hiring and onboarding processes using technology and LEAN processing best practices 4) Maintain a variety of personnel and program resources that will recruit and retain high-quality teachers, leaders, and support staff.
1) High-quality educators and support staff, as demonstrated through evaluation metrics, student achievement, and survey data. 2) Satisfaction of hiring managers (principals, departments) in Talent Management services
Amount Percentage
6100 Payroll Costs 3,369,302$ 82.1%489,247 11.9%
81,565 2.0%163,021 4.0%
- 0.0%4,103,135$ 100.0%
257
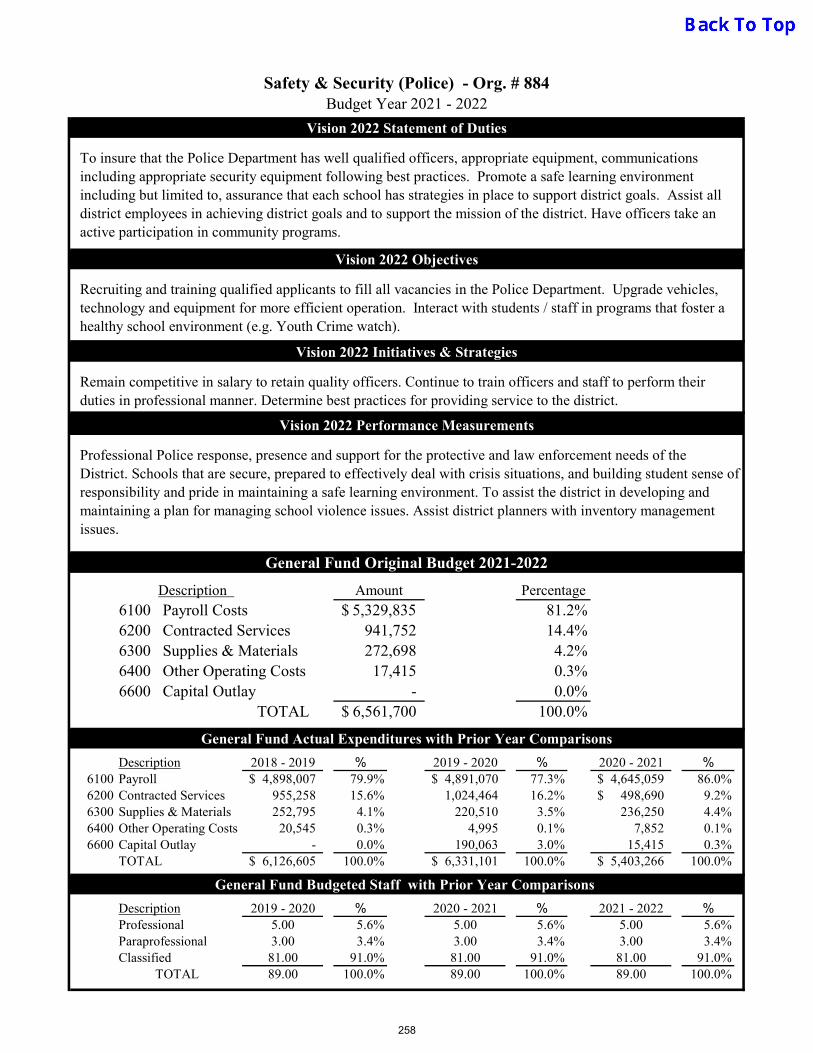
Vision 2022 Statement of Duties
Vision 2022 Objectives
Vision 2022 Initiatives & Strategies
Vision 2022 Performance Measurements
General Fund Original Budget 2021-2022
Description
6200 Contracted Services6300 Supplies & Materials6400 Other Operating Costs6600 Capital Outlay
TOTAL
General Fund Actual Expenditures with Prior Year Comparisons
Description 2018 - 2019 % 2019 - 2020 % 2020 - 2021 %6100 Payroll 4,898,007$ 79.9% 4,891,070$ 77.3% 4,645,059$ 86.0%6200 Contracted Services 955,258 15.6% 1,024,464 16.2% 498,690$ 9.2%6300 Supplies & Materials 252,795 4.1% 220,510 3.5% 236,250 4.4%6400 Other Operating Costs 20,545 0.3% 4,995 0.1% 7,852 0.1%6600 Capital Outlay - 0.0% 190,063 3.0% 15,415 0.3%
TOTAL 6,126,605$ 100.0% 6,331,101$ 100.0% 5,403,266$ 100.0%
General Fund Budgeted Staff with Prior Year Comparisons
Description 2019 - 2020 % 2020 - 2021 % 2021 - 2022 %Professional 5.00 5.6% 5.00 5.6% 5.00 5.6%Paraprofessional 3.00 3.4% 3.00 3.4% 3.00 3.4%Classified 81.00 91.0% 81.00 91.0% 81.00 91.0%
TOTAL 89.00 100.0% 89.00 100.0% 89.00 100.0%
- 0.0%6,561,700$ 100.0%
941,752 14.4%272,698 4.2%
17,415 0.3%
Professional Police response, presence and support for the protective and law enforcement needs of the District. Schools that are secure, prepared to effectively deal with crisis situations, and building student sense of responsibility and pride in maintaining a safe learning environment. To assist the district in developing and maintaining a plan for managing school violence issues. Assist district planners with inventory management issues.
Amount Percentage6100 Payroll Costs 5,329,835$ 81.2%
Recruiting and training qualified applicants to fill all vacancies in the Police Department. Upgrade vehicles, technology and equipment for more efficient operation. Interact with students / staff in programs that foster a healthy school environment (e.g. Youth Crime watch).
Remain competitive in salary to retain quality officers. Continue to train officers and staff to perform their duties in professional manner. Determine best practices for providing service to the district.
Safety & Security (Police) - Org. # 884Budget Year 2021 - 2022
To insure that the Police Department has well qualified officers, appropriate equipment, communications including appropriate security equipment following best practices. Promote a safe learning environment including but limited to, assurance that each school has strategies in place to support district goals. Assist all district employees in achieving district goals and to support the mission of the district. Have officers take an active participation in community programs.
258

Vision 2022 Statement of Duties
Vision 2022 Objectives
Vision 2022 Initiatives & Strategies
Vision 2022 Performance Measurements
General Fund Original Budget 2021-2022
Description
6200 Contracted Services6300 Supplies & Materials6400 Other Operating Costs6600 Capital Outlay
TOTAL
General Fund Actual Expenditures with Prior Year Comparisons
Description 2018 - 2019 % 2019 - 2020 % 2020 - 2021 %6100 Payroll 1,499,850$ 68.1% 1,853,989$ 75.5% 1,807,093$ 81.8%6200 Contracted Services 15,633 0.7% 12,891 0.5% 20,956$ 0.9%6300 Supplies & Materials 655,694 29.8% 556,848 22.7% 367,444 16.6%6400 Other Operating Costs 30,663 1.4% 31,307 1.3% 14,097 0.6%6600 Capital Outlay - 0.0% - 0.0% - 0.0%
TOTAL 2,201,840$ 100.0% 2,455,034$ 100.0% 2,209,590$ 100.0%
General Fund Budgeted Staff with Prior Year Comparisons
Description 2019 - 2020 % 2020 - 2021 % 2021 - 2022 %Professional 17.00 77.3% 16.00 72.7% 24.00 77.4%Paraprofessional 3.00 13.6% 3.00 13.6% 4.00 12.9%Classified 2.00 9.1% 3.00 13.6% 3.00 9.7%
TOTAL 22.00 100.0% 22.00 100.0% 31.00 100.0%
- 0.0%4,339,369$ 100.0%
16,276 0.4%1,644,679 37.9%
69,428 1.6%
Redefine program support to include a formative and summative evaluation approach. Implement processes that reduce reactionary responses and increase proactive measures. By coordinating all State and Local assessments, the District can better manage the distribution and collection of all testing materials and resulting data files.
Amount Percentage6100 Payroll Costs 2,608,986$ 60.1%
Improve services by coordinating all State and Local assessments and provide training and support to District, campuses, and programs to ensure District, State, and Federal guidelines are followed.Use data to help guide academic instruction, data management and administrative decision-making.Build capacity for data-driven inquiry and reflection at both the administrative and campus levels. Provide relevant and innovative reporting to campus and district staff.
Integrate program evaluation, data dissemination, and accountability-related services to provide a comprehensive campus/District profile. Model the process of data-driven inquiry and reflection. Manage, update, and provide training on usage of data delivery tools such as Crystal Enterprise (BI Platform Reports), Campus Operations, and Dashboards. Deliver informative, timely reports to all District administrators.
Accountability, Testing, Research & Evaluation - Org. # 945Budget Year 2021 - 2022
The function of the department is to administer, evaluate, and disseminate all State and Local assessments while providing on-going data support and accountability-related services to help guide instruction, data management, and administrative decision-making.
259

Vision 2022 Statement of Duties
Vision 2022 Objectives
Vision 2022 Initiatives & Strategies
Vision 2022 Performance Measurements
General Fund Original Budget 2021-2022
Description
6200 Contracted Services6300 Supplies & Materials6400 Other Operating Costs6600 Capital Outlay
TOTAL
General Fund Actual Expenditures with Prior Year Comparisons
Description 2018 - 2019 % 2019 - 2020 % 2020 - 2021 %6100 Payroll 445,187$ 54.1% 466,901$ 55.3% 467,787$ 65.5%6200 Contracted Services 227,401 27.6% 270,703 32.1% 128,386$ 18.0%6300 Supplies & Materials 134,486 16.3% 100,039 11.9% 117,370 16.4%6400 Other Operating Costs 220 0.0% 233 0.0% 294 0.0%6600 Capital Outlay 15,545 1.9% 6,007 0.7% - 0.0%
TOTAL 822,838$ 100.0% 843,882$ 100.0% 713,837$ 100.0%
General Fund Budgeted Staff with Prior Year Comparisons
Description 2019 - 2020 % 2020 - 2021 % 2021 - 2022 %Professional 2.00 22.2% 2.00 22.2% 2.00 22.2%Paraprofessional 4.00 44.4% 4.00 44.4% 4.00 44.4%Classified 3.00 33.3% 3.00 33.3% 3.00 33.3%
TOTAL 9.00 100.0% 9.00 100.0% 9.00 100.0%
14,496$ 1.5%998,005$ 100.0%
159,016$ 15.9%348,245$ 34.9%
1,028$ 0.1%
In Printing Services, we strive to improve the quality and create professionally-printed Districtwide materials such as newsletters, logos, handbooks, brochures, posters, banners, website graphics, posters and mailers. We offer a myriad of services to our clients in-house reducing the need for outsourcing of projects. We aspire to elevate public awareness of SAISD in a positive manner and to promote the many successes of our District.
Amount Percentage
6100 Payroll Costs 475,220$ 47.6%
Increase print business. Further utilize new printing equipment to increase production of outdoor banners and environment graphics including window, floor and vehicle decals. Further inform and educate employees on SAISD brand standards and facilitate adherence to guidelines.
Continue to improve our communication with all campuses and departments through networking and marketing efforts to promote our visibility and offerings available with Printing Services. We will maintain SAISD brand standards and encourage others to adapt to our guidelines to provide clear, concise and consistent messaging throughout the District. Also, we will continue to upgrade our department equipment and peripherals as necessary in order to provide quality services and solutions to our clients.
Printing Services - Org. # 960Budget Year 2021 - 2022
The Central Office Printing Services department strives to conduct business with respect and integrity towards all of our clients and to complete all requested projects in a timely manner. We support all SAISD campuses, departments and affiliated programs with design, print, copy and mail solutions. Our professional graphic designers collaborate with our clients to create custom solutions in the form of logos, posters, flyers, post cards, banners and much more. We provide print and copy options that strategically combine a high quality output while maintaining competitive and cost effective pricing. The SAISD Mailroom works in conjunction with Printing Services to provide internal and external mail needs throughout the District.
260


Vision 2022 Statement of Duties
Vision 2022 Objectives
Vision 2022 Initiatives & Strategies
Vision 2022 Performance Measurements
General Fund Original Budget 2021-2022
Description
6200 Contracted Services6300 Supplies & Materials6400 Other Operating Costs6600 Capital Outlay
TOTAL
General Fund Actual Expenditures with Prior Year Comparisons
Description 2018 - 2019 % 2019 - 2020 % 2020 - 2021 %6100 Payroll -$ 0.0% -$ 0.0% -$ 0.0%6200 Contracted Services 1,495,669 100.0% 1,562,064 100.0% 1,558,722$ 100.0%6300 Supplies & Materials - 0.0% - 0.0% - 0.0%6400 Other Operating Costs - 0.0% - 0.0% - 0.0%6600 Capital Outlay - 0.0% - 0.0% - 0.0%
TOTAL 1,495,669$ 100.0% 1,562,064$ 100.0% 1,558,722$ 100.0%
General Fund Budgeted Staff with Prior Year Comparisons
Description 2019 - 2020 % 2020 - 2021 % 2021 - 2022 %Professional 0.00 0.0% 0.00 0.0% 0.00 0.0%Paraprofessional 0.00 0.0% 0.00 0.0% 0.00 0.0%Classified 0.00 0.0% 0.00 0.0% 0.00 0.0%
TOTAL 0.00 0.0% 0.00 0.0% 0.00 0.0%
- 0.0%1,593,624$ 100.0%
1,593,624 100.0%- 0.0%- 0.0%
The District will receive timely notification of all assessment and valuation changes to determine theeffect of the assessment rolls on the district's tax revenue. The District will keep abreast of all legislative and economic changes that may impact anticipated revenues.
Amount Percentage6100 Payroll Costs -$ 0.0%
To monitor tax assessments and valuations performed by the Bexar Appraisal District.To monitor tax collections performed by the Bexar County Tax Office. To monitor delinquent tax collections by the delinquent tax attorney.
Prepare monthly reports of tax assessments and valuations.Deposit all collected taxes in a timely manner to allow the treasurer to invest monies and earn additional revenue for operating expenditures.
Tax Costs - Org. # 703Budget Year 2021 - 2022
The purpose of this organized cost unit is to provide a mechanism to collect property taxes. SAISD contracts with Bexar County for this service.
261
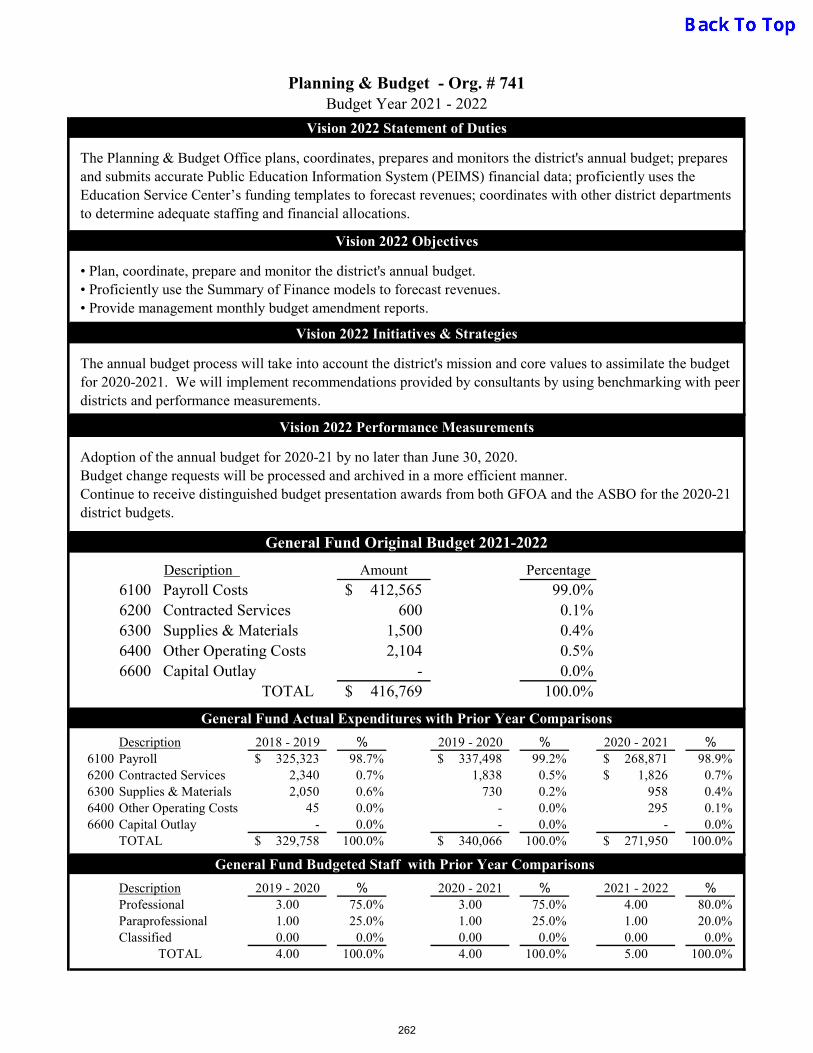
Vision 2022 Statement of Duties
Vision 2022 Objectives
Vision 2022 Initiatives & Strategies
Vision 2022 Performance Measurements
General Fund Original Budget 2021-2022
Description
6200 Contracted Services6300 Supplies & Materials6400 Other Operating Costs6600 Capital Outlay
TOTAL
General Fund Actual Expenditures with Prior Year Comparisons
Description 2018 - 2019 % 2019 - 2020 % 2020 - 2021 %6100 Payroll 325,323$ 98.7% 337,498$ 99.2% 268,871$ 98.9%6200 Contracted Services 2,340 0.7% 1,838 0.5% 1,826$ 0.7%6300 Supplies & Materials 2,050 0.6% 730 0.2% 958 0.4%6400 Other Operating Costs 45 0.0% - 0.0% 295 0.1%6600 Capital Outlay - 0.0% - 0.0% - 0.0%
TOTAL 329,758$ 100.0% 340,066$ 100.0% 271,950$ 100.0%
General Fund Budgeted Staff with Prior Year Comparisons
Description 2019 - 2020 % 2020 - 2021 % 2021 - 2022 %Professional 3.00 75.0% 3.00 75.0% 4.00 80.0%Paraprofessional 1.00 25.0% 1.00 25.0% 1.00 20.0%Classified 0.00 0.0% 0.00 0.0% 0.00 0.0%
TOTAL 4.00 100.0% 4.00 100.0% 5.00 100.0%
- 0.0%416,769$ 100.0%
600 0.1%1,500 0.4%2,104 0.5%
Adoption of the annual budget for 2020-21 by no later than June 30, 2020. Budget change requests will be processed and archived in a more efficient manner.Continue to receive distinguished budget presentation awards from both GFOA and the ASBO for the 2020-21 district budgets.
Amount Percentage6100 Payroll Costs 412,565$ 99.0%
• Plan, coordinate, prepare and monitor the district's annual budget.• Proficiently use the Summary of Finance models to forecast revenues. • Provide management monthly budget amendment reports.
The annual budget process will take into account the district's mission and core values to assimilate the budget for 2020-2021. We will implement recommendations provided by consultants by using benchmarking with peer districts and performance measurements.
Planning & Budget - Org. # 741Budget Year 2021 - 2022
The Planning & Budget Office plans, coordinates, prepares and monitors the district's annual budget; prepares and submits accurate Public Education Information System (PEIMS) financial data; proficiently uses the Education Service Center’s funding templates to forecast revenues; coordinates with other district departments to determine adequate staffing and financial allocations.
262
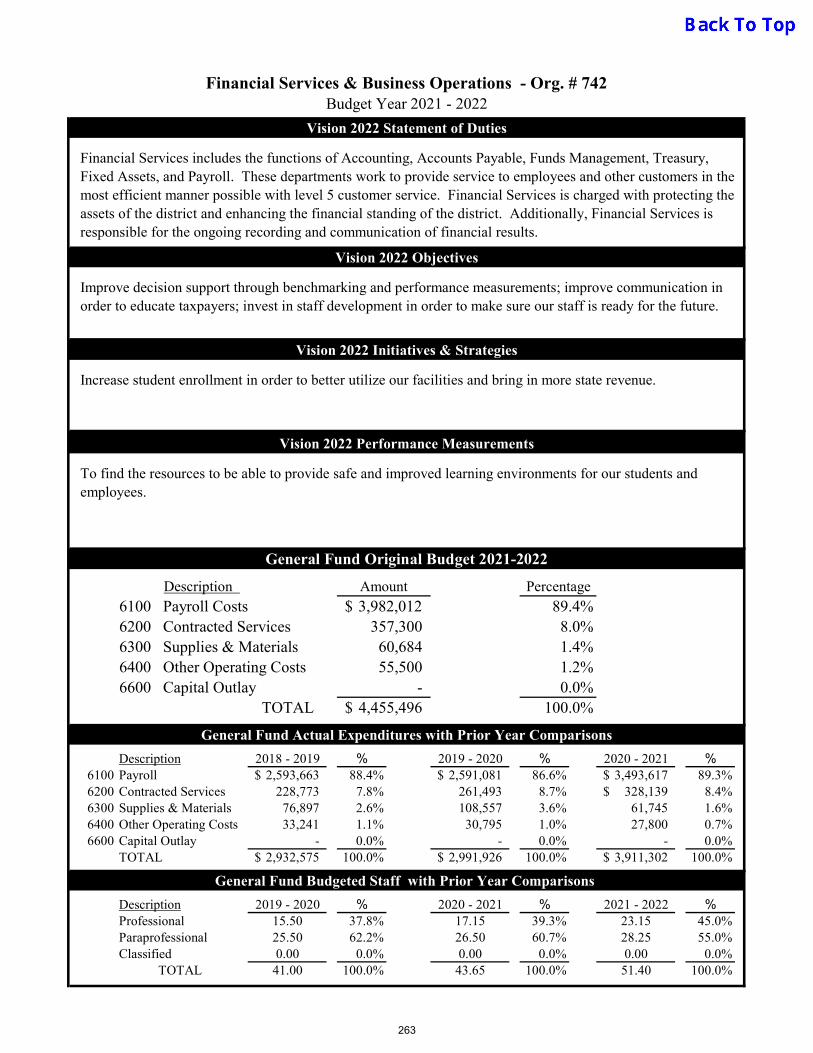
Vision 2022 Statement of Duties
Vision 2022 Objectives
Vision 2022 Initiatives & Strategies
Vision 2022 Performance Measurements
General Fund Original Budget 2021-2022
Description
6200 Contracted Services6300 Supplies & Materials6400 Other Operating Costs6600 Capital Outlay
TOTAL
General Fund Actual Expenditures with Prior Year Comparisons
Description 2018 - 2019 % 2019 - 2020 % 2020 - 2021 %6100 Payroll 2,593,663$ 88.4% 2,591,081$ 86.6% 3,493,617$ 89.3%6200 Contracted Services 228,773 7.8% 261,493 8.7% 328,139$ 8.4%6300 Supplies & Materials 76,897 2.6% 108,557 3.6% 61,745 1.6%6400 Other Operating Costs 33,241 1.1% 30,795 1.0% 27,800 0.7%6600 Capital Outlay - 0.0% - 0.0% - 0.0%
TOTAL 2,932,575$ 100.0% 2,991,926$ 100.0% 3,911,302$ 100.0%
General Fund Budgeted Staff with Prior Year Comparisons
Description 2019 - 2020 % 2020 - 2021 % 2021 - 2022 %Professional 15.50 37.8% 17.15 39.3% 23.15 45.0%Paraprofessional 25.50 62.2% 26.50 60.7% 28.25 55.0%Classified 0.00 0.0% 0.00 0.0% 0.00 0.0%
TOTAL 41.00 100.0% 43.65 100.0% 51.40 100.0%
- 0.0%4,455,496$ 100.0%
357,300 8.0%60,684 1.4%55,500 1.2%
To find the resources to be able to provide safe and improved learning environments for our students and employees.
Amount Percentage6100 Payroll Costs 3,982,012$ 89.4%
Improve decision support through benchmarking and performance measurements; improve communication in order to educate taxpayers; invest in staff development in order to make sure our staff is ready for the future.
Increase student enrollment in order to better utilize our facilities and bring in more state revenue.
Financial Services & Business Operations - Org. # 742Budget Year 2021 - 2022
Financial Services includes the functions of Accounting, Accounts Payable, Funds Management, Treasury, Fixed Assets, and Payroll. These departments work to provide service to employees and other customers in the most efficient manner possible with level 5 customer service. Financial Services is charged with protecting the assets of the district and enhancing the financial standing of the district. Additionally, Financial Services is responsible for the ongoing recording and communication of financial results.
263
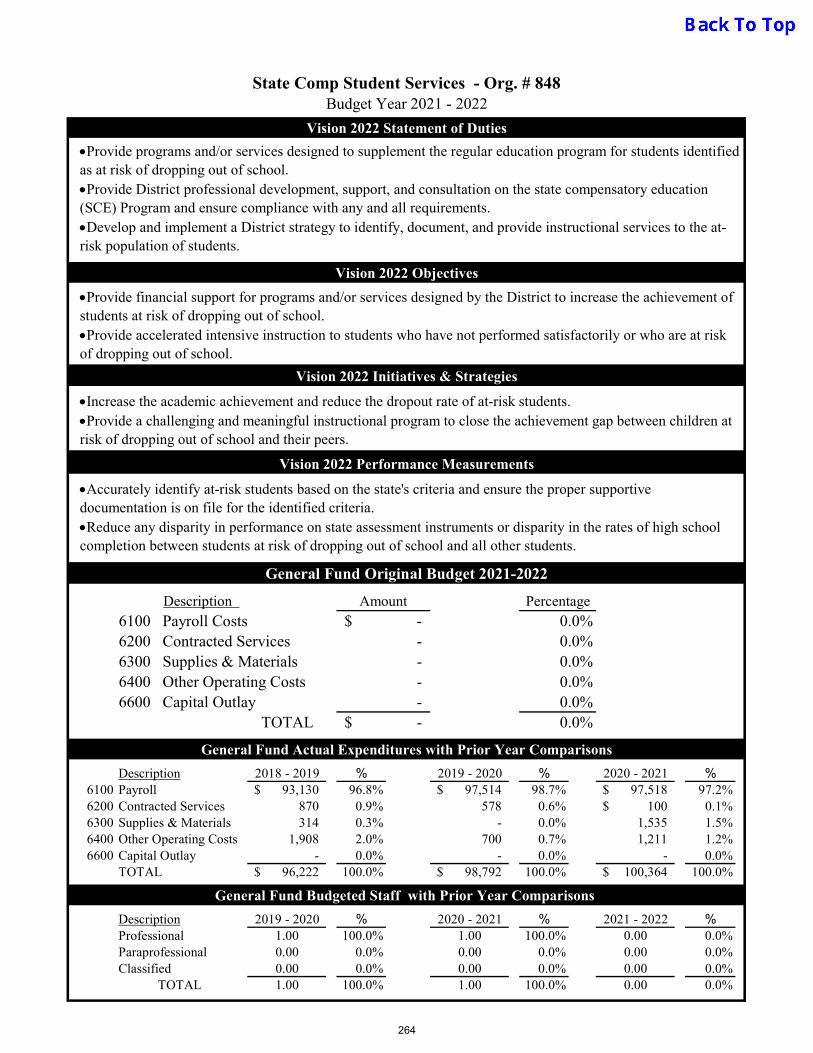
Vision 2022 Statement of Duties
Vision 2022 Objectives
Vision 2022 Initiatives & Strategies
Vision 2022 Performance Measurements
General Fund Original Budget 2021-2022
Description
6200 Contracted Services6300 Supplies & Materials6400 Other Operating Costs6600 Capital Outlay
TOTAL
General Fund Actual Expenditures with Prior Year Comparisons
Description 2018 - 2019 % 2019 - 2020 % 2020 - 2021 %6100 Payroll 93,130$ 96.8% 97,514$ 98.7% 97,518$ 97.2%6200 Contracted Services 870 0.9% 578 0.6% 100$ 0.1%6300 Supplies & Materials 314 0.3% - 0.0% 1,535 1.5%6400 Other Operating Costs 1,908 2.0% 700 0.7% 1,211 1.2%6600 Capital Outlay - 0.0% - 0.0% - 0.0%
TOTAL 96,222$ 100.0% 98,792$ 100.0% 100,364$ 100.0%
General Fund Budgeted Staff with Prior Year Comparisons
Description 2019 - 2020 % 2020 - 2021 % 2021 - 2022 %Professional 1.00 100.0% 1.00 100.0% 0.00 0.0%Paraprofessional 0.00 0.0% 0.00 0.0% 0.00 0.0%Classified 0.00 0.0% 0.00 0.0% 0.00 0.0%
TOTAL 1.00 100.0% 1.00 100.0% 0.00 0.0%
- 0.0%-$ 0.0%
- 0.0%- 0.0%- 0.0%
Accurately identify at-risk students based on the state's criteria and ensure the proper supportive documentation is on file for the identified criteria. Reduce any disparity in performance on state assessment instruments or disparity in the rates of high school completion between students at risk of dropping out of school and all other students.
Amount Percentage6100 Payroll Costs -$ 0.0%
Provide financial support for programs and/or services designed by the District to increase the achievement of students at risk of dropping out of school. Provide accelerated intensive instruction to students who have not performed satisfactorily or who are at risk of dropping out of school.
Increase the academic achievement and reduce the dropout rate of at-risk students.Provide a challenging and meaningful instructional program to close the achievement gap between children at risk of dropping out of school and their peers.
State Comp Student Services - Org. # 848Budget Year 2021 - 2022
Provide programs and/or services designed to supplement the regular education program for students identified as at risk of dropping out of school. Provide District professional development, support, and consultation on the state compensatory education (SCE) Program and ensure compliance with any and all requirements. Develop and implement a District strategy to identify, document, and provide instructional services to the at-risk population of students.
264
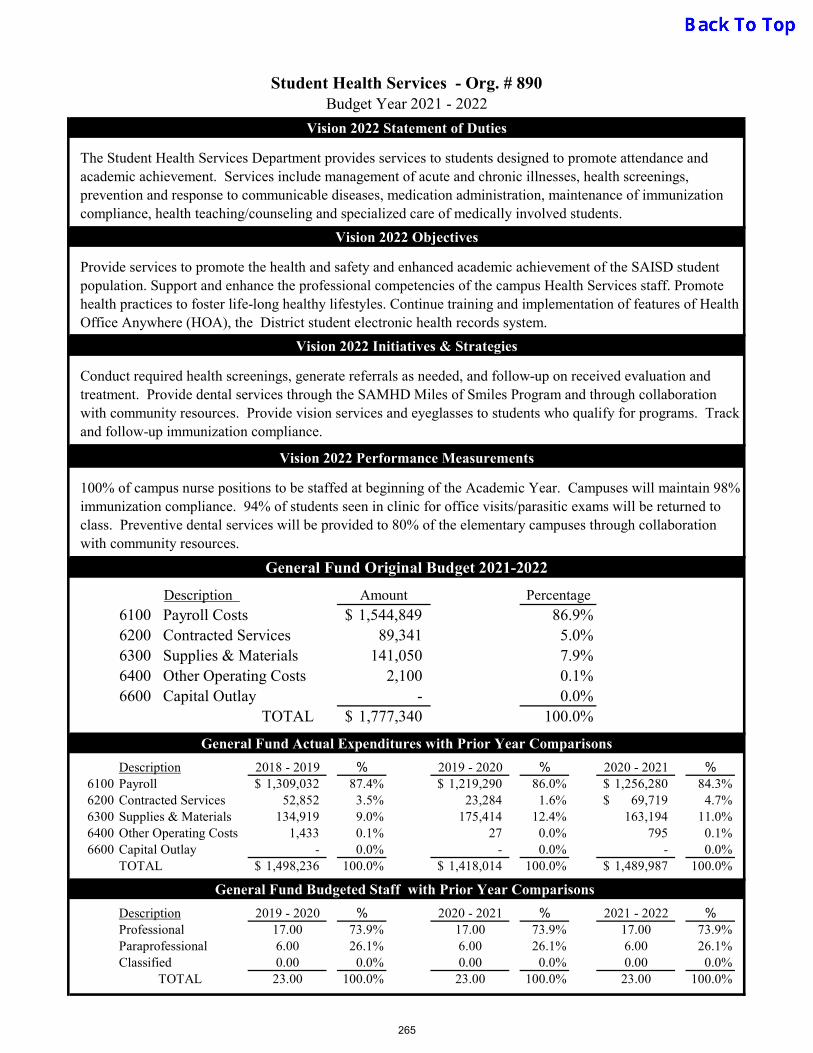
Vision 2022 Statement of Duties
Vision 2022 Objectives
Vision 2022 Initiatives & Strategies
Vision 2022 Performance Measurements
General Fund Original Budget 2021-2022
Description
6200 Contracted Services6300 Supplies & Materials6400 Other Operating Costs6600 Capital Outlay
TOTAL
General Fund Actual Expenditures with Prior Year Comparisons
Description 2018 - 2019 % 2019 - 2020 % 2020 - 2021 %6100 Payroll 1,309,032$ 87.4% 1,219,290$ 86.0% 1,256,280$ 84.3%6200 Contracted Services 52,852 3.5% 23,284 1.6% 69,719$ 4.7%6300 Supplies & Materials 134,919 9.0% 175,414 12.4% 163,194 11.0%6400 Other Operating Costs 1,433 0.1% 27 0.0% 795 0.1%6600 Capital Outlay - 0.0% - 0.0% - 0.0%
TOTAL 1,498,236$ 100.0% 1,418,014$ 100.0% 1,489,987$ 100.0%
General Fund Budgeted Staff with Prior Year Comparisons
Description 2019 - 2020 % 2020 - 2021 % 2021 - 2022 %Professional 17.00 73.9% 17.00 73.9% 17.00 73.9%Paraprofessional 6.00 26.1% 6.00 26.1% 6.00 26.1%Classified 0.00 0.0% 0.00 0.0% 0.00 0.0%
TOTAL 23.00 100.0% 23.00 100.0% 23.00 100.0%
- 0.0%1,777,340$ 100.0%
89,341 5.0%141,050 7.9%
2,100 0.1%
100% of campus nurse positions to be staffed at beginning of the Academic Year. Campuses will maintain 98% immunization compliance. 94% of students seen in clinic for office visits/parasitic exams will be returned to class. Preventive dental services will be provided to 80% of the elementary campuses through collaboration with community resources.
Amount Percentage6100 Payroll Costs 1,544,849$ 86.9%
Provide services to promote the health and safety and enhanced academic achievement of the SAISD student population. Support and enhance the professional competencies of the campus Health Services staff. Promote health practices to foster life-long healthy lifestyles. Continue training and implementation of features of Health Office Anywhere (HOA), the District student electronic health records system.
Conduct required health screenings, generate referrals as needed, and follow-up on received evaluation and treatment. Provide dental services through the SAMHD Miles of Smiles Program and through collaboration with community resources. Provide vision services and eyeglasses to students who qualify for programs. Track and follow-up immunization compliance.
Student Health Services - Org. # 890Budget Year 2021 - 2022
The Student Health Services Department provides services to students designed to promote attendance and academic achievement. Services include management of acute and chronic illnesses, health screenings, prevention and response to communicable diseases, medication administration, maintenance of immunization compliance, health teaching/counseling and specialized care of medically involved students.
265

Vision 2022 Statement of Duties
Vision 2022 Objectives
Vision 2022 Initiatives & Strategies
Vision 2022 Performance Measurements
General Fund Original Budget 2021-2022
Description
6200 Contracted Services6300 Supplies & Materials6400 Other Operating Costs6600 Capital Outlay
TOTAL
General Fund Actual Expenditures with Prior Year Comparisons
Description 2018 - 2019 % 2019 - 2020 % 2020 - 2021 %6100 Payroll 457,930$ 63.6% 476,669$ 68.0% 371,681$ 79.8%6200 Contracted Services 253,046 35.1% 165,909 23.7% 71,313$ 15.3%6300 Supplies & Materials 4,085 0.6% 54,755 7.8% 21,442 4.6%6400 Other Operating Costs 5,171 0.7% 3,876 0.6% 1,290 0.3%6600 Capital Outlay - 0.0% - 0.0% - 0.0%
TOTAL 720,232$ 100.0% 701,208$ 100.0% 465,726$ 100.0%
General Fund Budgeted Staff with Prior Year Comparisons
Description 2019 - 2020 % 2020 - 2021 % 2021 - 2022 %Professional 5.00 100.0% 5.00 100.0% 5.00 100.0%Paraprofessional 0.00 0.0% 0.00 0.0% 0.00 0.0%Classified 0.00 0.0% 0.00 0.0% 0.00 0.0%
TOTAL 5.00 100.0% 5.00 100.0% 5.00 100.0%
- 0.0%775,416$ 100.0%
257,197 33.2%17,188 2.2%10,105 1.3%
To maximize the Medicaid reimbursement payments relative to the percentage of special education students served for that school year. Demonstrate participating district staffs adherence to quarterly billing timelines through compliance reports. Complete the MAC quarterly claims and the annual SHARS cost report in a timely manner.
Amount Percentage6100 Payroll Costs 490,926$ 63.3%
Ensuring that all eligible special education students are identified, and that the services rendered to those students are appropriately documented and submitted for billing; ensuring that all eligible costs are identified and captured in the annual SHARS cost report; ensuring that all staff eligible to participate in MAC are appropriately trained and participate in the MAC time study as applicable.
Improve the efficiency of billing practices, ensure that billing meets regulatory compliance, and will collaborate with other departments to increase understanding of the Medicaid Programs compliance requirements.
Finance-Medicaid - Org. # 893Budget Year 2021 - 2022
The purpose of the Medicaid Department is to collect eligible reimbursement payments for the district, from the two state Medicaid Programs (SHARS and MAC) in which the district participates. • SHARS - reimburses for direct services to Medicaid-eligible special education students, and other supplemental costs • MAC - reimburses for the administrative costs of providing medical outreach to all students
266


Vision 2022 Statement of Duties
Vision 2022 Objectives
Vision 2022 Initiatives & Strategies
Vision 2022 Performance Measurements
General Fund Original Budget 2021-2022
Description
6200 Contracted Services6300 Supplies & Materials6400 Other Operating Costs6600 Capital Outlay
TOTAL
General Fund Actual Expenditures with Prior Year Comparisons
Description 2018 - 2019 % 2019 - 2020 % 2020 - 2021 %6100 Payroll 1,482,830$ 74.2% 888,736$ 86.7% 801,572$ 93.1%6200 Contracted Services 323,456 16.2% 40,186 3.9% 33,626$ 3.9%6300 Supplies & Materials 122,358 6.1% 67,426 6.6% 14,856 1.7%6400 Other Operating Costs 69,352 3.5% 28,799 2.8% 10,821 1.3%6600 Capital Outlay - 0.0% - 0.0% - 0.0%
TOTAL 1,997,997$ 100.0% 1,025,147$ 100.0% 860,875$ 100.0%
General Fund Budgeted Staff with Prior Year Comparisons
Description 2019 - 2020 % 2020 - 2021 % 2021 - 2022 %Professional 5.00 55.6% 6.00 60.0% 2.00 50.0%Paraprofessional 4.00 44.4% 4.00 40.0% 2.00 50.0%Classified 0.00 0.0% 0.00 0.0% 0.00 0.0%
TOTAL 9.00 100.0% 10.00 100.0% 4.00 100.0%
- 0.0%399,339$ 100.0%
3,000 0.8%5,000 1.3%2,000 0.5%
A high quality cadre of academically prepared, professionally performing, and student caring teachers, support staff and professional staff.
Amount Percentage6100 Payroll Costs 389,339$ 97.5%
Recruit and retain highly qualified teachers, support staff and administrative staff; Maintain an equitable compensation plan; Provide on-going guidance and support to all employees; Maintain and provide guidance on District polices and administrative procedures; Enhance preparation and awareness for new employees through orientation and training sessions.
Maintain a variety of personnel and program resources that will attract highly qualified applicants for teaching, support staff and professional positions. Maintain an equitable compensation plan. Implement staffing efficiencies in an effort to streamline costs and align functions more effectively.
Human Resources - Org. # 730Budget Year 2021 - 2022
To achieve the District’s mission and embodying its core values by recruiting and retaining highly qualified teachers, support staff and administrative staff. A “student centered” District cannot thrive without hard-working, passionate educators teaching classes, providing support and administering programs. Our main purpose is to use creative solutions and efficient processes to attract and support high performing employees.
267

Vision 2022 Statement of Duties
Vision 2022 Objectives
Vision 2022 Initiatives & Strategies
Vision 2022 Performance Measurements
General Fund Original Budget 2021-2022
Description
6200 Contracted Services6300 Supplies & Materials6400 Other Operating Costs6600 Capital Outlay
TOTAL
General Fund Actual Expenditures with Prior Year Comparisons
Description 2018 - 2019 % 2019 - 2020 % 2020 - 2021 %6100 Payroll 418,900$ 21.9% 399,902$ 12.8% 399,618$ 12.5%6200 Contracted Services 10,002 0.5% 7,546 0.2% 9,483$ 0.3%6300 Supplies & Materials 11,727 0.6% 11,904 0.4% 17,686 0.6%6400 Other Operating Costs 1,470,188 76.9% 2,699,870 86.6% 2,780,442 86.7%6600 Capital Outlay - 0.0% - 0.0% - 0.0%
TOTAL 1,910,817$ 100.0% 3,119,223$ 100.0% 3,207,230$ 100.0%
General Fund Budgeted Staff with Prior Year Comparisons
Description 2019 - 2020 % 2020 - 2021 % 2021 - 2022 %Professional 1.35 20.9% 1.35 20.9% 1.35 16.0%Paraprofessional 5.10 79.1% 5.10 79.1% 7.10 84.0%Classified 0.00 0.0% 0.00 0.0% 0.00 0.0%
TOTAL 6.45 100.0% 6.45 100.0% 8.45 100.0%
- 0.0%456,589$ 100.0%
19,500 4.3%13,000 2.8%
(55,000) -12.0%
Offer valuable benefits, are cost-effective, and are prudently managed to support the District’s recruiting and retention initiatives. Ensure fiscal health by reducing costs associated with property and casualty exposures and claims. Continuously increase safety awareness through on-going initiatives.
Amount Percentage6100 Payroll Costs 479,089$ 104.9%
Analyze and classify risks and measure financial effect of risks on the District. Continue to promote a safe work environment and reduce workers’ compensation injuries, property losses, auto liability and other identified risks that can adversely affect District operations or financial resources. Manage the Department of Transportation compliance standards for all District eligible drivers, to include white fleet.
The analysis of insurance and employee benefits programs will take into account market availability, legislative action, and financial impact to employees and the District, which will be evaluated through the competitive solicitation process. Continuous development and support of the District-wide Safety Program through Investigation, Inspection & Training initiatives.
Employee Benefits, Risk Management & Safety - Org. # 735Budget Year 2021 - 2022
To protect human, financial and physical assets of the District. The goal is to materially reduce our risk-related losses and concurrently our costs by following good risk management practices. Our safety program has been designed to comply with all recognized local, state, and federal safety laws and regulations, as well as to minimize exposures to the public. It is every employees' obligation to be knowledgeable of our safety standards and to work in a manner to ensure compliance with them.
268
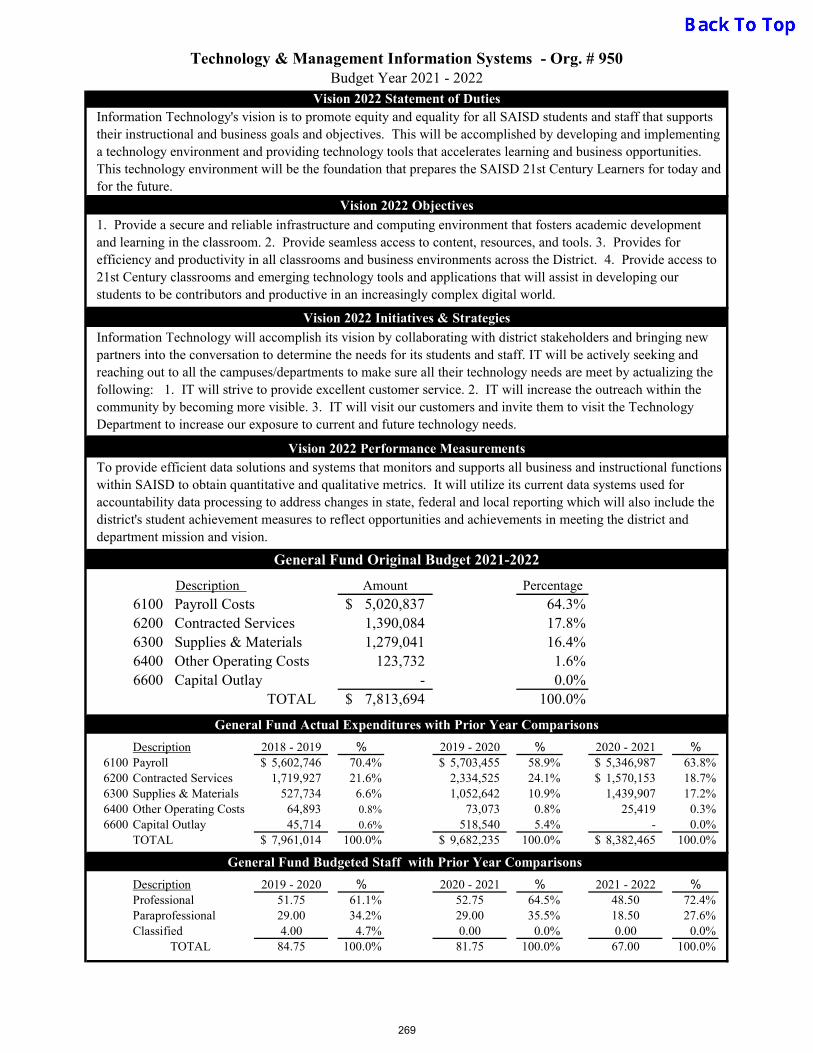
Vision 2022 Statement of Duties
Vision 2022 Objectives
Vision 2022 Initiatives & Strategies
Vision 2022 Performance Measurements
General Fund Original Budget 2021-2022
Description
6200 Contracted Services6300 Supplies & Materials6400 Other Operating Costs6600 Capital Outlay
TOTAL
General Fund Actual Expenditures with Prior Year Comparisons
Description 2018 - 2019 % 2019 - 2020 % 2020 - 2021 %6100 Payroll 5,602,746$ 70.4% 5,703,455$ 58.9% 5,346,987$ 63.8%6200 Contracted Services 1,719,927 21.6% 2,334,525 24.1% 1,570,153$ 18.7%6300 Supplies & Materials 527,734 6.6% 1,052,642 10.9% 1,439,907 17.2%6400 Other Operating Costs 64,893 0.8% 73,073 0.8% 25,419 0.3%6600 Capital Outlay 45,714 0.6% 518,540 5.4% - 0.0%
TOTAL 7,961,014$ 100.0% 9,682,235$ 100.0% 8,382,465$ 100.0%
General Fund Budgeted Staff with Prior Year Comparisons
Description 2019 - 2020 % 2020 - 2021 % 2021 - 2022 %Professional 51.75 61.1% 52.75 64.5% 48.50 72.4%Paraprofessional 29.00 34.2% 29.00 35.5% 18.50 27.6%Classified 4.00 4.7% 0.00 0.0% 0.00 0.0%
TOTAL 84.75 100.0% 81.75 100.0% 67.00 100.0%
- 0.0%7,813,694$ 100.0%
1,390,084 17.8%1,279,041 16.4%
123,732 1.6%
Amount Percentage
6100 Payroll Costs 5,020,837$ 64.3%
1. Provide a secure and reliable infrastructure and computing environment that fosters academic development and learning in the classroom. 2. Provide seamless access to content, resources, and tools. 3. Provides for efficiency and productivity in all classrooms and business environments across the District. 4. Provide access to 21st Century classrooms and emerging technology tools and applications that will assist in developing our students to be contributors and productive in an increasingly complex digital world.
Information Technology will accomplish its vision by collaborating with district stakeholders and bringing new partners into the conversation to determine the needs for its students and staff. IT will be actively seeking and reaching out to all the campuses/departments to make sure all their technology needs are meet by actualizing the following: 1. IT will strive to provide excellent customer service. 2. IT will increase the outreach within the community by becoming more visible. 3. IT will visit our customers and invite them to visit the Technology Department to increase our exposure to current and future technology needs.
To provide efficient data solutions and systems that monitors and supports all business and instructional functions within SAISD to obtain quantitative and qualitative metrics. It will utilize its current data systems used for accountability data processing to address changes in state, federal and local reporting which will also include the district's student achievement measures to reflect opportunities and achievements in meeting the district and department mission and vision.
Technology & Management Information Systems - Org. # 950Budget Year 2021 - 2022
Information Technology's vision is to promote equity and equality for all SAISD students and staff that supports their instructional and business goals and objectives. This will be accomplished by developing and implementing a technology environment and providing technology tools that accelerates learning and business opportunities. This technology environment will be the foundation that prepares the SAISD 21st Century Learners for today and for the future.
269

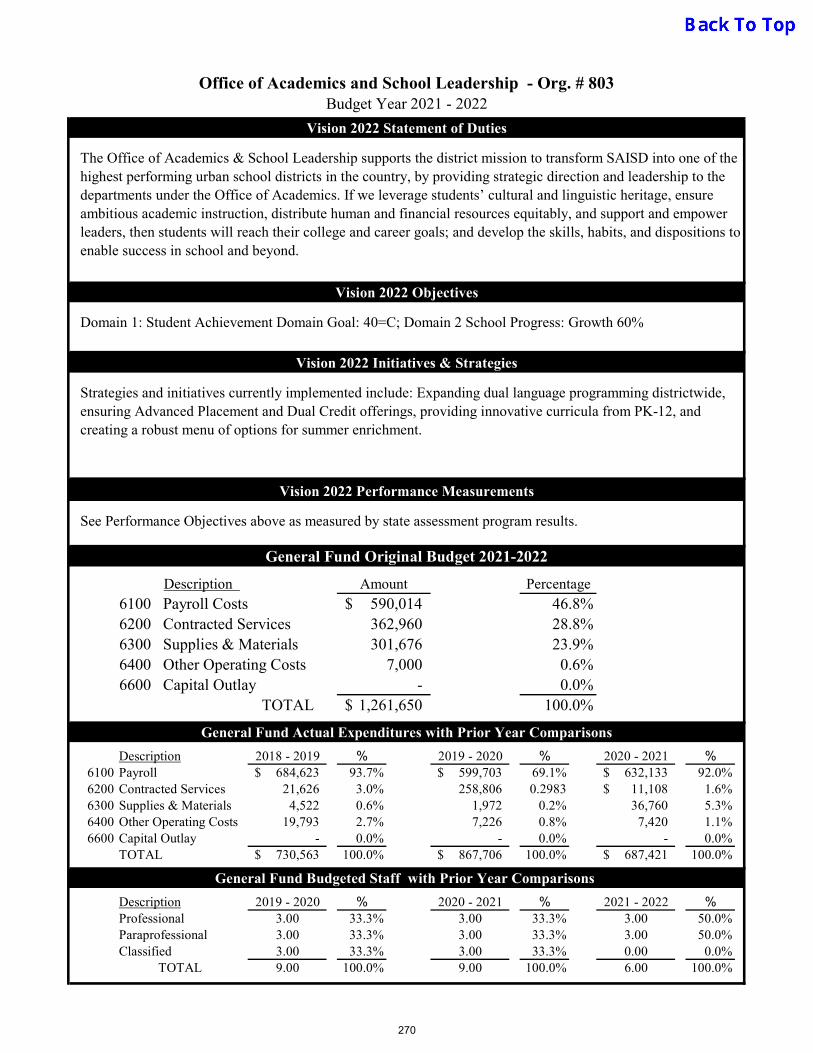
Vision 2022 Statement of Duties
Vision 2022 Objectives
Vision 2022 Initiatives & Strategies
Vision 2022 Performance Measurements
General Fund Original Budget 2021-2022
Description
6200 Contracted Services6300 Supplies & Materials6400 Other Operating Costs6600 Capital Outlay
TOTAL
General Fund Actual Expenditures with Prior Year Comparisons
Description 2018 - 2019 % 2019 - 2020 % 2020 - 2021 %6100 Payroll 684,623$ 93.7% 599,703$ 69.1% 632,133$ 92.0%6200 Contracted Services 21,626 3.0% 258,806 0.2983 11,108$ 1.6%6300 Supplies & Materials 4,522 0.6% 1,972 0.2% 36,760 5.3%6400 Other Operating Costs 19,793 2.7% 7,226 0.8% 7,420 1.1%6600 Capital Outlay - 0.0% - 0.0% - 0.0%
TOTAL 730,563$ 100.0% 867,706$ 100.0% 687,421$ 100.0%
General Fund Budgeted Staff with Prior Year Comparisons
Description 2019 - 2020 % 2020 - 2021 % 2021 - 2022 %Professional 3.00 33.3% 3.00 33.3% 3.00 50.0%Paraprofessional 3.00 33.3% 3.00 33.3% 3.00 50.0%Classified 3.00 33.3% 3.00 33.3% 0.00 0.0%
TOTAL 9.00 100.0% 9.00 100.0% 6.00 100.0%
- 0.0%1,261,650$ 100.0%
362,960 28.8%301,676 23.9%
7,000 0.6%
See Performance Objectives above as measured by state assessment program results.
Amount Percentage6100 Payroll Costs 590,014$ 46.8%
Domain 1: Student Achievement Domain Goal: 40=C; Domain 2 School Progress: Growth 60%
Strategies and initiatives currently implemented include: Expanding dual language programming districtwide, ensuring Advanced Placement and Dual Credit offerings, providing innovative curricula from PK-12, and creating a robust menu of options for summer enrichment.
Office of Academics and School Leadership - Org. # 803Budget Year 2021 - 2022
The Office of Academics & School Leadership supports the district mission to transform SAISD into one of the highest performing urban school districts in the country, by providing strategic direction and leadership to the departments under the Office of Academics. If we leverage students’ cultural and linguistic heritage, ensure ambitious academic instruction, distribute human and financial resources equitably, and support and empower leaders, then students will reach their college and career goals; and develop the skills, habits, and dispositions to enable success in school and beyond.
270

Vision 2022 Statement of Duties
Vision 2022 Objectives
Vision 2022 Initiatives & Strategies
Vision 2022 Performance Measurements
General Fund Original Budget 2021-2022
Description
6200 Contracted Services6300 Supplies & Materials6400 Other Operating Costs6600 Capital Outlay
TOTAL
General Fund Actual Expenditures with Prior Year Comparisons
Description 2018 - 2019 % 2019 - 2020 % 2020 - 2021 %6100 Payroll 211,328$ 88.6% 615,121$ 93.6% 483,873$ 89.6%6200 Contracted Services 8,485 3.6% 8,389 1.3% 32,213$ 6.0%6300 Supplies & Materials 9,765 4.1% 23,288 3.5% 21,394 4.0%6400 Other Operating Costs 9,049 3.8% 10,049 1.5% 2,345 0.4%6600 Capital Outlay - 0.0% - 0.0% - 0.0%
TOTAL 238,627$ 100.0% 656,846$ 100.0% 539,825$ 100.0%
General Fund Budgeted Staff with Prior Year Comparisons
Description 2019 - 2020 % 2020 - 2021 % 2021 - 2022 %Professional 1.00 50.0% 7.00 87.5% 1.00 50.0%Paraprofessional 1.00 50.0% 1.00 12.5% 1.00 50.0%Classified 0.00 0.0% 0.00 0.0% 0.00 0.0%
TOTAL 2.00 100.0% 8.00 100.0% 2.00 100.0%
- 0.0%274,637$ 100.0%
- 0.0%30,000 10.9%
- 0.0%
Campuses will maximize instructional time, to maintain alignment with district initiatives and realize individual campus goals in meeting state and federal accountability.
Amount Percentage6100 Payroll Costs 244,637$ 89.1%
Ensure that campuses are aligned with district initiatives by providing support and technical assistance in ways that enable campuses to maximize instructional implementation of academic initiatives; thus ensuring and impacting student success.
• Assist in the development of comprehensive school improvement plans for sustained improvement.• Provide assistance with the implementation of school improvement plans, monitor progress of school improvement plans, provide professional growth and development opportunities for campus staff. • Provide necessary training coupled with coaching focused on implementation plan, roll out, and systems to protect leadership team's time to focus on instructional leadership.
Assistant Superintendent - All Levels - Org. # 815Budget Year 2021 - 2022
Provide consultation and guidance to school leaders in instruction, operation and/or emergencies, as well as support school leaders with professional growth and development. Ensure that all campuses receive timely information and required updates necessary for enhancing the best learning environment for all stake holders. Our office works toward informing instructional leaders about best practices and educational trends that meets the vision of our district.
271

Vision 2022 Statement of Duties
Vision 2022 Objectives
Vision 2022 Initiatives & Strategies
Vision 2022 Performance Measurements
General Fund Original Budget 2021-2022
Description
6200 Contracted Services6300 Supplies & Materials6400 Other Operating Costs6600 Capital Outlay
TOTAL
General Fund Actual Expenditures with Prior Year Comparisons
Description 2018 - 2019 % 2019 - 2020 % 2020 - 2021 %6100 Payroll 203,355$ 88.9% 338,623$ 92.2% 231,154$ 93.8%6200 Contracted Services 4,120 1.8% 3,636 1.0% 1,113$ 0.5%6300 Supplies & Materials 16,735 7.3% 14,757 4.0% 10,278 4.2%6400 Other Operating Costs 4,437 1.9% 10,286 2.8% 4,007 1.6%6600 Capital Outlay - 0.0% - 0.0% - 0.0%
TOTAL 228,647$ 100.0% 367,301$ 100.0% 246,553$ 100.0%
General Fund Budgeted Staff with Prior Year Comparisons
Description 2019 - 2020 % 2020 - 2021 % 2021 - 2022 %Professional 1.00 50.0% 1.00 50.0% 1.00 50.0%Paraprofessional 1.00 50.0% 1.00 50.0% 1.00 50.0%Classified 0.00 0.0% 0.00 0.0% 0.00 0.0%
TOTAL 2.00 100.0% 2.00 100.0% 2.00 100.0%
- 0.0%257,610$ 100.0%
4,000 1.6%21,000 8.2%
3,400 1.3%
Increases student performance on STAAR. Have performance at 50% - 60% Tier 1 MAP and increase on growth. Decrease failure rate from previous year. Increase attendance T-PESS goals are obtained.
Amount Percentage6100 Payroll Costs 229,210$ 89.0%
Ensure continuous improvement cycle with the understanding and implementation of the Effective School Framework (ESF) so that all campuses are rated B or higher.
Continue to work with 4th grade teachers from 26 campuses on Writers Workshops. Conduct monthly instructional rounds with a focus of F and D campuses. PLN Teams with Lead principal to help mentor and support campuses on their PLN. Ensure all campuses complete ESF (TIP) to monitor student performance.
Assistant Superintendent - Elementary Schools - Org. # 821Budget Year 2021 - 2022
To mentor, coach and guide 26 campuses (IR, D-rated and C-A traditional schools) To promote best instructional/Leadership practices are used frequently with support of District Content Departments, campuses will work towards obtaining B or higher rating with TEA distinction.
272
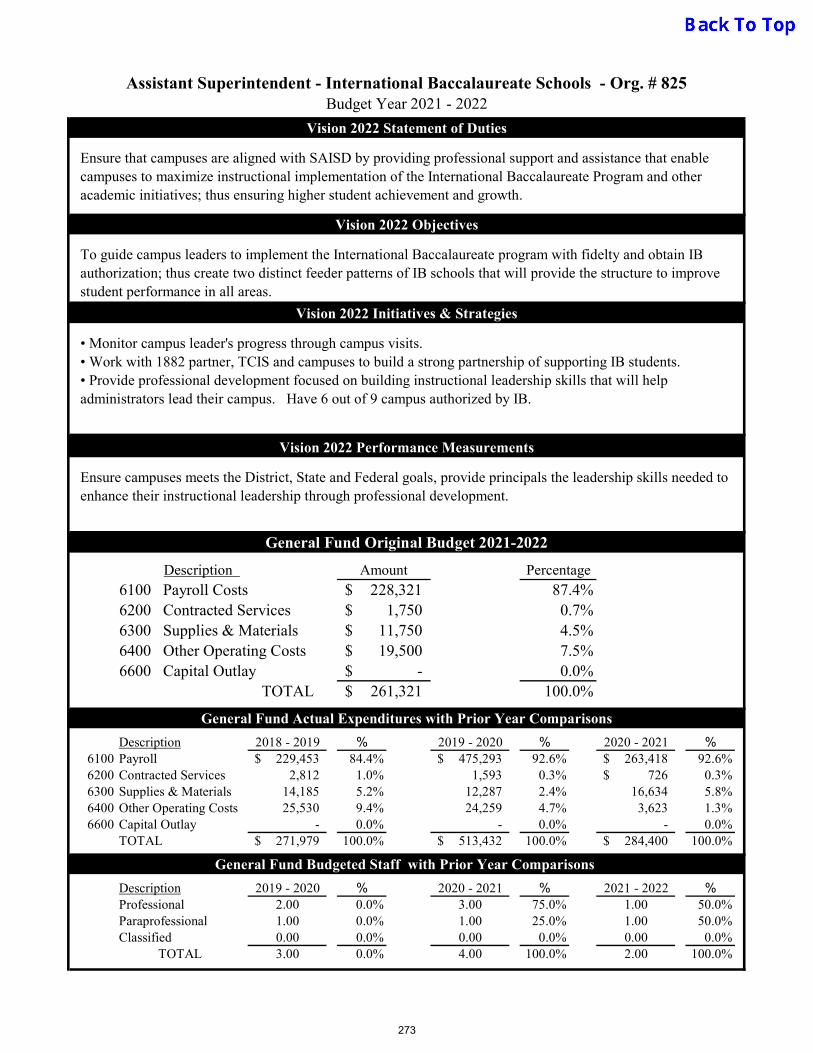
Vision 2022 Statement of Duties
Vision 2022 Objectives
Vision 2022 Initiatives & Strategies
Vision 2022 Performance Measurements
General Fund Original Budget 2021-2022
Description
6200 Contracted Services6300 Supplies & Materials6400 Other Operating Costs6600 Capital Outlay
TOTAL
General Fund Actual Expenditures with Prior Year Comparisons
Description 2018 - 2019 % 2019 - 2020 % 2020 - 2021 %6100 Payroll 229,453$ 84.4% 475,293$ 92.6% 263,418$ 92.6%6200 Contracted Services 2,812 1.0% 1,593 0.3% 726$ 0.3%6300 Supplies & Materials 14,185 5.2% 12,287 2.4% 16,634 5.8%6400 Other Operating Costs 25,530 9.4% 24,259 4.7% 3,623 1.3%6600 Capital Outlay - 0.0% - 0.0% - 0.0%
TOTAL 271,979$ 100.0% 513,432$ 100.0% 284,400$ 100.0%
General Fund Budgeted Staff with Prior Year Comparisons
Description 2019 - 2020 % 2020 - 2021 % 2021 - 2022 %Professional 2.00 0.0% 3.00 75.0% 1.00 50.0%Paraprofessional 1.00 0.0% 1.00 25.0% 1.00 50.0%Classified 0.00 0.0% 0.00 0.0% 0.00 0.0%
TOTAL 3.00 0.0% 4.00 100.0% 2.00 100.0%
-$ 0.0%261,321$ 100.0%
1,750$ 0.7%11,750$ 4.5%19,500$ 7.5%
Ensure campuses meets the District, State and Federal goals, provide principals the leadership skills needed to enhance their instructional leadership through professional development.
Amount Percentage6100 Payroll Costs 228,321$ 87.4%
To guide campus leaders to implement the International Baccalaureate program with fidelty and obtain IB authorization; thus create two distinct feeder patterns of IB schools that will provide the structure to improve student performance in all areas.
• Monitor campus leader's progress through campus visits. • Work with 1882 partner, TCIS and campuses to build a strong partnership of supporting IB students. • Provide professional development focused on building instructional leadership skills that will help administrators lead their campus. Have 6 out of 9 campus authorized by IB.
Assistant Superintendent - International Baccalaureate Schools - Org. # 825Budget Year 2021 - 2022
Ensure that campuses are aligned with SAISD by providing professional support and assistance that enable campuses to maximize instructional implementation of the International Baccalaureate Program and other academic initiatives; thus ensuring higher student achievement and growth.
273
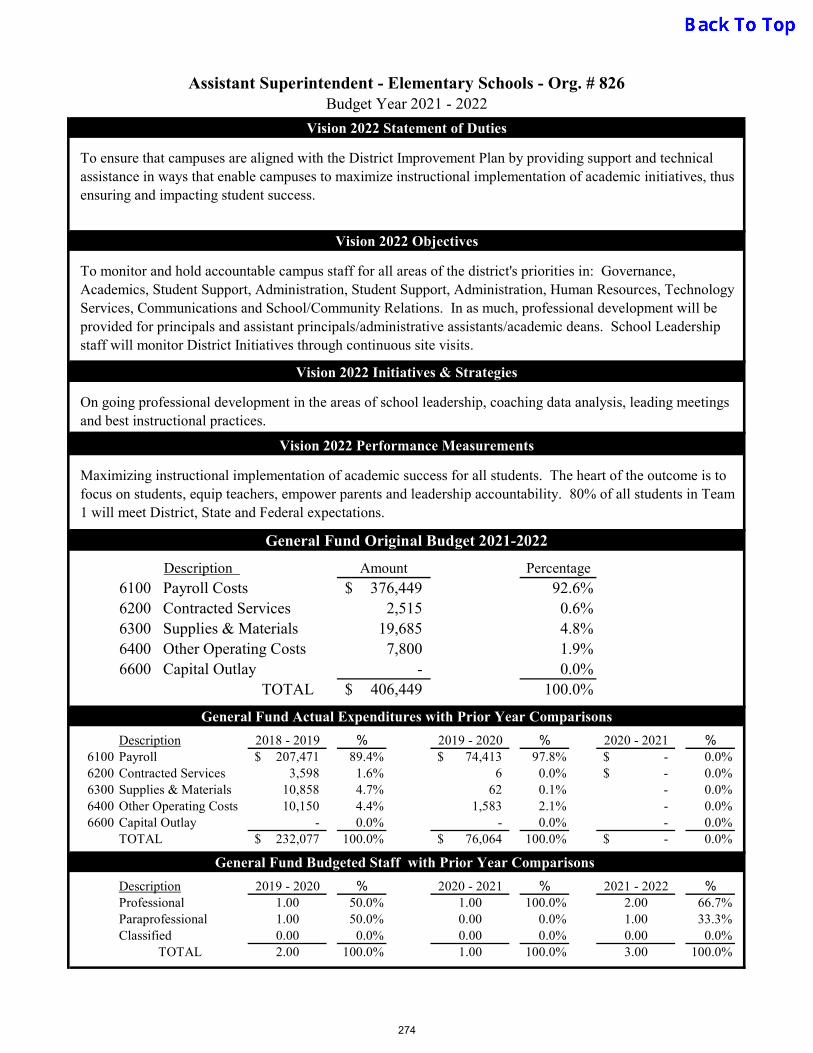
Vision 2022 Statement of Duties
Vision 2022 Objectives
Vision 2022 Initiatives & Strategies
Vision 2022 Performance Measurements
General Fund Original Budget 2021-2022
Description
6200 Contracted Services6300 Supplies & Materials6400 Other Operating Costs6600 Capital Outlay
TOTAL
General Fund Actual Expenditures with Prior Year Comparisons
Description 2018 - 2019 % 2019 - 2020 % 2020 - 2021 %6100 Payroll 207,471$ 89.4% 74,413$ 97.8% -$ 0.0%6200 Contracted Services 3,598 1.6% 6 0.0% -$ 0.0%6300 Supplies & Materials 10,858 4.7% 62 0.1% - 0.0%6400 Other Operating Costs 10,150 4.4% 1,583 2.1% - 0.0%6600 Capital Outlay - 0.0% - 0.0% - 0.0%
TOTAL 232,077$ 100.0% 76,064$ 100.0% -$ 0.0%
General Fund Budgeted Staff with Prior Year Comparisons
Description 2019 - 2020 % 2020 - 2021 % 2021 - 2022 %Professional 1.00 50.0% 1.00 100.0% 2.00 66.7%Paraprofessional 1.00 50.0% 0.00 0.0% 1.00 33.3%Classified 0.00 0.0% 0.00 0.0% 0.00 0.0%
TOTAL 2.00 100.0% 1.00 100.0% 3.00 100.0%
- 0.0%406,449$ 100.0%
2,515 0.6%19,685 4.8%
7,800 1.9%
Maximizing instructional implementation of academic success for all students. The heart of the outcome is to focus on students, equip teachers, empower parents and leadership accountability. 80% of all students in Team 1 will meet District, State and Federal expectations.
Amount Percentage6100 Payroll Costs 376,449$ 92.6%
To monitor and hold accountable campus staff for all areas of the district's priorities in: Governance, Academics, Student Support, Administration, Student Support, Administration, Human Resources, Technology Services, Communications and School/Community Relations. In as much, professional development will be provided for principals and assistant principals/administrative assistants/academic deans. School Leadership staff will monitor District Initiatives through continuous site visits.
On going professional development in the areas of school leadership, coaching data analysis, leading meetings and best instructional practices.
Assistant Superintendent - Elementary Schools - Org. # 826Budget Year 2021 - 2022
To ensure that campuses are aligned with the District Improvement Plan by providing support and technical assistance in ways that enable campuses to maximize instructional implementation of academic initiatives, thus ensuring and impacting student success.
274

Vision 2022 Statement of Duties
Vision 2022 Objectives
Vision 2022 Initiatives & Strategies
Vision 2022 Performance Measurements
General Fund Original Budget 2021-2022
Description
6200 Contracted Services6300 Supplies & Materials6400 Other Operating Costs6600 Capital Outlay
TOTAL
General Fund Actual Expenditures with Prior Year Comparisons
Description 2018 - 2019 % 2019 - 2020 % 2020 - 2021 %6100 Payroll 219,763$ 85.1% 224,751$ 92.8% 301,739$ 88.4%6200 Contracted Services 874 0.3% 715 0.3% 5,470$ 1.6%6300 Supplies & Materials 21,908 8.5% 9,542 3.9% 19,446 5.7%6400 Other Operating Costs 15,734 6.1% 7,055 2.9% 14,711 4.3%6600 Capital Outlay - 0.0% - 0.0% - 0.0%
TOTAL 258,280$ 100.0% 242,062$ 100.0% 341,366$ 100.0%
General Fund Budgeted Staff with Prior Year Comparisons
Description 2019 - 2020 % 2020 - 2021 % 2021 - 2022 %Professional 1.00 50.0% 1.00 50.0% 2.00 66.7%Paraprofessional 1.00 50.0% 1.00 50.0% 1.00 33.3%Classified 0.00 0.0% 0.00 0.0% 0.00 0.0%
TOTAL 2.00 100.0% 2.00 100.0% 3.00 100.0%
- 0.0%437,696$ 100.0%
4,900 1.1%31,900 7.3%57,200 13.1%
All levels of campuses will maximize instructional time to maintain alignment with district initiatives and realize individual campus goals in meeting state and federal accountability.
Amount Percentage6100 Payroll Costs 343,696$ 78.5%
Ensure that campuses are aligned with district initiatives by providing support and technical assistance in ways that enable them to maximize instructional implementation of academic iniatives; thus ensuring and impacting student success.
Assist in the development of comprehensive school improvement plans for sustained improvement. Provide assistance with the implementation of school improvement plans, and monitor progress of them. Provide professional grownth and development opportunities for campus staff.
Assistant Superintendent - All Levels - Org. # 840Budget Year 2021 - 2022
Improving student instruction and supporting school leaders with professional growth and development. Our team works toward ensuring all campuses receive information about best practices and required updates necessary for enhancing the best learning environment and meeting our district's vision. All schools are required to meet state accountability and federal safeguards.
275

Vision 2022 Statement of Duties
Vision 2022 Objectives
Vision 2022 Initiatives & Strategies
Vision 2022 Performance Measurements
General Fund Original Budget 2021-2022
Description
6200 Contracted Services6300 Supplies & Materials6400 Other Operating Costs6600 Capital Outlay
TOTAL
General Fund Actual Expenditures with Prior Year Comparisons
Description 2018 - 2019 % 2019 - 2020 % 2020 - 2021 %6100 Payroll 6,311,832$ 87.1% 6,804,366$ 87.1% 7,354,253$ 92.2%6200 Contracted Services 906,352 12.5% 990,871 12.7% 619,499$ 7.8%6300 Supplies & Materials - 0.0% - 0.0% - 0.0%6400 Other Operating Costs 24,672 0.3% 20,742 0.3% 6,343 0.1%6600 Capital Outlay - 0.0% - 0.0% - 0.0%
TOTAL 7,242,855$ 100.0% 7,815,978$ 100.0% 7,980,095$ 100.0%
General Fund Budgeted Staff with Prior Year Comparisons
Description 2019 - 2020 % 2020 - 2021 % 2021 - 2022 %Professional 98.00 83.1% 95.70 86.4% 93.70 84.6%Paraprofessional 20.00 16.9% 15.00 13.6% 17.00 15.4%Classified 0.00 0.0% 0.00 0.0% 0.00 0.0%
TOTAL 118.00 100.0% 110.70 100.0% 110.70 100.0%
- 0.0%8,532,202$ 100.0%
225,000 2.6%- 0.0%
46,900 0.5%
Increase student performance on state mandated assessments and progress toward mastery of Individual Education Plan (IEP) goals. Increase student graduation rate and maintain parent support systems for information and education.
Amount Percentage6100 Payroll Costs 8,260,302$ 96.8%
Program compliance guidelines will support student instruction and achievement.Continue to provide a full continuum of special education services.Actively promote parent education, training, and participation.
Develop systems for ensuring program compliance and instructional implementation.Provide information to parents related to program and related services.Maintain initiatives to support parent education, training and participation.
Special Education- District Wide - Org. # 198Budget Year 2021 - 2022
Support students with disabilities within the general curriculum. The intent of the support services is to enable all students with disabilities to make progress in the general curriculum, to participate in extracurricular and nonacademic activities, and to be educated and participate with disabled and non disabled peers in the public school system.
276

Vision 2022 Statement of Duties
Vision 2022 Objectives
Vision 2022 Initiatives & Strategies
Vision 2022 Performance Measurements
General Fund Original Budget 2021-2022
Description
6200 Contracted Services6300 Supplies & Materials6400 Other Operating Costs6600 Capital Outlay
TOTAL
General Fund Actual Expenditures with Prior Year Comparisons
Description 2018 - 2019 % 2019 - 2020 % 2020 - 2021 %6100 Payroll 178,026$ 37.7% 153,002$ 38.7% 77,102$ 24.6%6200 Contracted Services 37,131 7.9% 49,578 12.6% 10,596$ 3.4%6300 Supplies & Materials 148,446 31.4% 99,341 25.2% 124,447 39.7%6400 Other Operating Costs 101,732 21.5% 93,046 23.6% 101,704 32.4%6600 Capital Outlay 7,020 1.5% - 0.0% - 0.0%
TOTAL 472,355$ 100.0% 394,966$ 100.0% 313,850$ 100.0%
General Fund Budgeted Staff with Prior Year Comparisons
Description 2019 - 2020 % 2020 - 2021 % 2021 - 2022 %Professional 1.50 100.0% 0.50 100.0% 0.50 100.0%Paraprofessional 0.00 0.0% 0.00 0.0% 0.00 0.0%Classified 0.00 0.0% 0.00 0.0% 0.00 0.0%
TOTAL 1.50 100.0% 0.50 100.0% 0.50 100.0%
Head Start - Org. # 367Budget Year 2021 - 2022
Provide required Head Start services to 2,243 three and four year old children with bilingual, special and regular educational programing in compliance with both state and federal regulations and standards.
To maintain the funded enrollment of 2,243 with 10% of the population being children with disabilities and to implement best practices in teaching strategies so that children will be prepared for Kindergarten and future success.
Professional development, strategic monitoring reports, classroom instruction, collecting and analyzing student assessment and development data, reporting regularly to teachers, directors, principal and program staff.
Four year old students will be ready for Kindergarten and future success and to serve families with medical and social services provided through the Head Start program.
Amount Percentage6100 Payroll Costs 99,456$ 20.3%
53,250 10.9%174,970 35.7%162,776 33.2%
- 0.0%490,452$ 100.0%
277
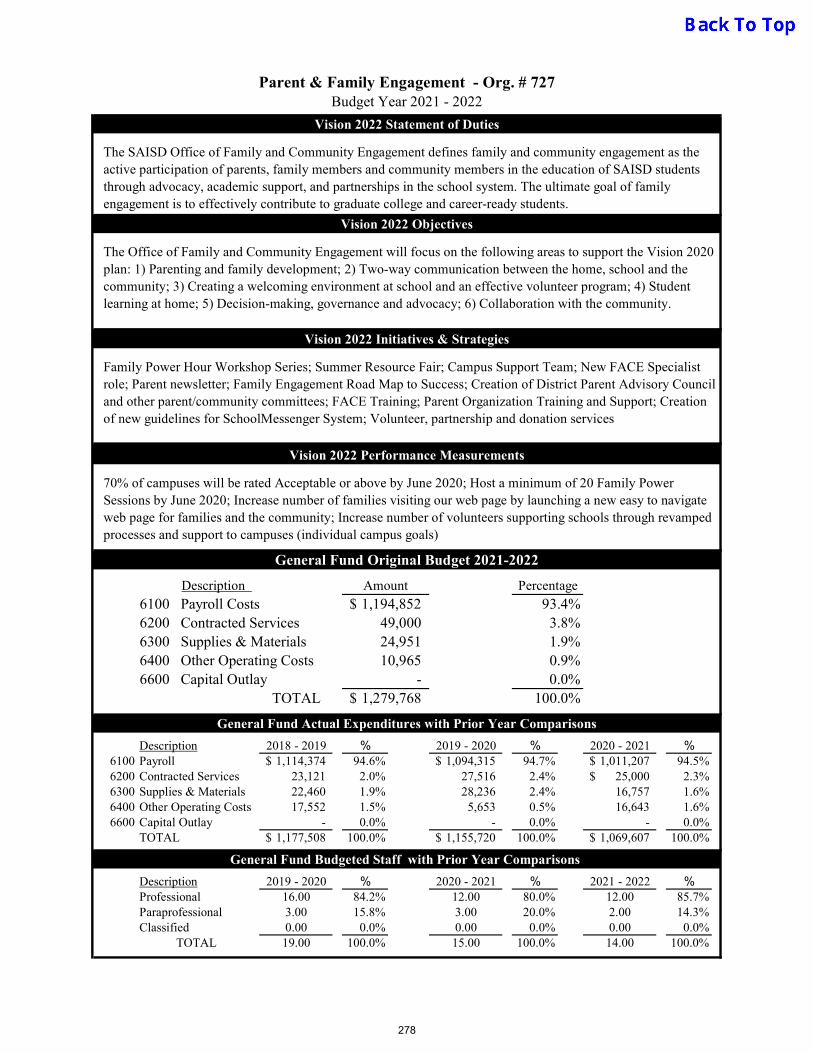
Vision 2022 Statement of Duties
Vision 2022 Objectives
Vision 2022 Initiatives & Strategies
Vision 2022 Performance Measurements
General Fund Original Budget 2021-2022
Description
6200 Contracted Services6300 Supplies & Materials6400 Other Operating Costs6600 Capital Outlay
TOTAL
General Fund Actual Expenditures with Prior Year Comparisons
Description 2018 - 2019 % 2019 - 2020 % 2020 - 2021 %6100 Payroll 1,114,374$ 94.6% 1,094,315$ 94.7% 1,011,207$ 94.5%6200 Contracted Services 23,121 2.0% 27,516 2.4% 25,000$ 2.3%6300 Supplies & Materials 22,460 1.9% 28,236 2.4% 16,757 1.6%6400 Other Operating Costs 17,552 1.5% 5,653 0.5% 16,643 1.6%6600 Capital Outlay - 0.0% - 0.0% - 0.0%
TOTAL 1,177,508$ 100.0% 1,155,720$ 100.0% 1,069,607$ 100.0%
General Fund Budgeted Staff with Prior Year Comparisons
Description 2019 - 2020 % 2020 - 2021 % 2021 - 2022 %Professional 16.00 84.2% 12.00 80.0% 12.00 85.7%Paraprofessional 3.00 15.8% 3.00 20.0% 2.00 14.3%Classified 0.00 0.0% 0.00 0.0% 0.00 0.0%
TOTAL 19.00 100.0% 15.00 100.0% 14.00 100.0%
- 0.0%1,279,768$ 100.0%
49,000 3.8%24,951 1.9%10,965 0.9%
70% of campuses will be rated Acceptable or above by June 2020; Host a minimum of 20 Family Power Sessions by June 2020; Increase number of families visiting our web page by launching a new easy to navigate web page for families and the community; Increase number of volunteers supporting schools through revamped processes and support to campuses (individual campus goals)
Amount Percentage
6100 Payroll Costs 1,194,852$ 93.4%
The Office of Family and Community Engagement will focus on the following areas to support the Vision 2020 plan: 1) Parenting and family development; 2) Two‐way communication between the home, school and the community; 3) Creating a welcoming environment at school and an effective volunteer program; 4) Student learning at home; 5) Decision‐making, governance and advocacy; 6) Collaboration with the community.
Family Power Hour Workshop Series; Summer Resource Fair; Campus Support Team; New FACE Specialist role; Parent newsletter; Family Engagement Road Map to Success; Creation of District Parent Advisory Council and other parent/community committees; FACE Training; Parent Organization Training and Support; Creation of new guidelines for SchoolMessenger System; Volunteer, partnership and donation services
Parent & Family Engagement - Org. # 727Budget Year 2021 - 2022
The SAISD Office of Family and Community Engagement defines family and community engagement as the active participation of parents, family members and community members in the education of SAISD students through advocacy, academic support, and partnerships in the school system. The ultimate goal of family engagement is to effectively contribute to graduate college and career‐ready students.
278
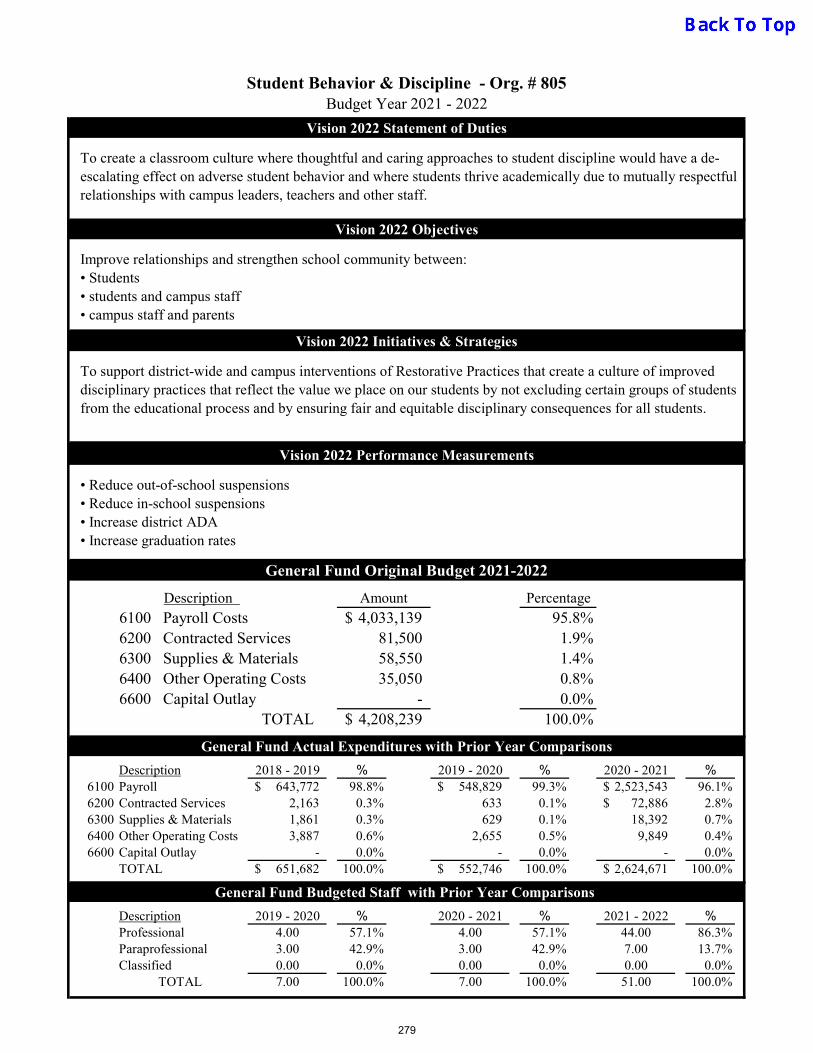
Vision 2022 Statement of Duties
Vision 2022 Objectives
Vision 2022 Initiatives & Strategies
Vision 2022 Performance Measurements
General Fund Original Budget 2021-2022
Description
6200 Contracted Services6300 Supplies & Materials6400 Other Operating Costs6600 Capital Outlay
TOTAL
General Fund Actual Expenditures with Prior Year Comparisons
Description 2018 - 2019 % 2019 - 2020 % 2020 - 2021 %6100 Payroll 643,772$ 98.8% 548,829$ 99.3% 2,523,543$ 96.1%6200 Contracted Services 2,163 0.3% 633 0.1% 72,886$ 2.8%6300 Supplies & Materials 1,861 0.3% 629 0.1% 18,392 0.7%6400 Other Operating Costs 3,887 0.6% 2,655 0.5% 9,849 0.4%6600 Capital Outlay - 0.0% - 0.0% - 0.0%
TOTAL 651,682$ 100.0% 552,746$ 100.0% 2,624,671$ 100.0%
General Fund Budgeted Staff with Prior Year Comparisons
Description 2019 - 2020 % 2020 - 2021 % 2021 - 2022 %Professional 4.00 57.1% 4.00 57.1% 44.00 86.3%Paraprofessional 3.00 42.9% 3.00 42.9% 7.00 13.7%Classified 0.00 0.0% 0.00 0.0% 0.00 0.0%
TOTAL 7.00 100.0% 7.00 100.0% 51.00 100.0%
Student Behavior & Discipline - Org. # 805Budget Year 2021 - 2022
To create a classroom culture where thoughtful and caring approaches to student discipline would have a de-escalating effect on adverse student behavior and where students thrive academically due to mutually respectful relationships with campus leaders, teachers and other staff.
Improve relationships and strengthen school community between:• Students• students and campus staff• campus staff and parents
To support district-wide and campus interventions of Restorative Practices that create a culture of improved disciplinary practices that reflect the value we place on our students by not excluding certain groups of students from the educational process and by ensuring fair and equitable disciplinary consequences for all students.
• Reduce out-of-school suspensions• Reduce in-school suspensions• Increase district ADA• Increase graduation rates
Amount Percentage6100 Payroll Costs 4,033,139$ 95.8%
81,500 1.9%58,550 1.4%35,050 0.8%
- 0.0%4,208,239$ 100.0%
279

Vision 2022 Statement of Duties
Vision 2022 Objectives
Vision 2022 Initiatives & Strategies
Vision 2022 Performance Measurements
General Fund Original Budget 2021-2022
Description
6200 Contracted Services6300 Supplies & Materials6400 Other Operating Costs6600 Capital Outlay
TOTAL
General Fund Actual Expenditures with Prior Year ComparisonsDescription 2018 - 2019 % 2019 - 2020 % 2020 - 2021 %
6100 Payroll 233,104$ 41.1% 124,587$ 43.0% 145,193$ 25.3%6200 Contracted Services 326,769 57.7% 163,862 56.5% 395,087$ 69.0%6300 Supplies & Materials 6,681 1.2% 1,015 0.4% 32,255 5.6%6400 Other Operating Costs 245 0.0% 505 0.2% 368 0.1%6600 Capital Outlay - 0.0% - 0.0% - 0.0%
TOTAL 566,800$ 100.0% 289,970$ 100.0% 572,903$ 100.0%
General Fund Budgeted Staff with Prior Year Comparisons
Description 2019 - 2020 % 2020 - 2021 % 2021 - 2022 %Professional 1.00 33.3% 1.00 50.0% 1.00 50.0%Paraprofessional 2.00 66.7% 1.00 50.0% 1.00 50.0%Classified 0.00 0.0% 0.00 0.0% 0.00 0.0%
TOTAL 3.00 100.0% 2.00 100.0% 2.00 100.0%
- 0.0%551,763$ 100.0%
323,771 58.7%72,359 13.1%
3,467 0.6%
Meet the City of San Antonio Scorecard measurements in attendance, STAAR performance, grade progress, and discipline referrals. In summer learning, increase student achievement levels for students re-testing in STAAR and EOC; and the number of students re-enrolling in SAISD the following year.
Amount Percentage
6100 Payroll Costs 152,166$ 27.6%
In the Extended Day programs, provide students with a safe extended learning environment focused on homework assistance, reading, STEM education, and physical and enrichment activities. Through Summer Learning, reduce the summer learning loss by increasing the number of students participating in enrichment opportunities and increasing the number of students passing HS EOC exams and Math and ELAR STARR assessments.
Implement new district STEM, Coding, and Reading units of study in all extended day programs; enhance curricular programming with after school partners to coordinate professional development and the standardization of effective safety and curricular practices; and align systems of support to expand access to educational facilities and high quality teachers. For the summer learning program, develop a comprehensive summer camp program for K-5 that integrates popular enrichment activities in technology, fine arts and physical education within a reading and math program. Increase the use of technology-embedded tools for registration, marketing and program coordination including payroll. Faciliate coordination of campus-based and district summer programing beyond the traditional program offerings in K-12.
Extended Learning - Org. # 810Budget Year 2021 - 2022
The Office of Extended Learning and Summer School supports the District's 5-Year Goals by implementing an Extended Day Program in paratnership with the City of San Antonio and coordinating and implementating a robust district wide Summer Learning Program designed for enrichment, intervention, summer bridge, acceleration and college, career and military readiness experiences.
280
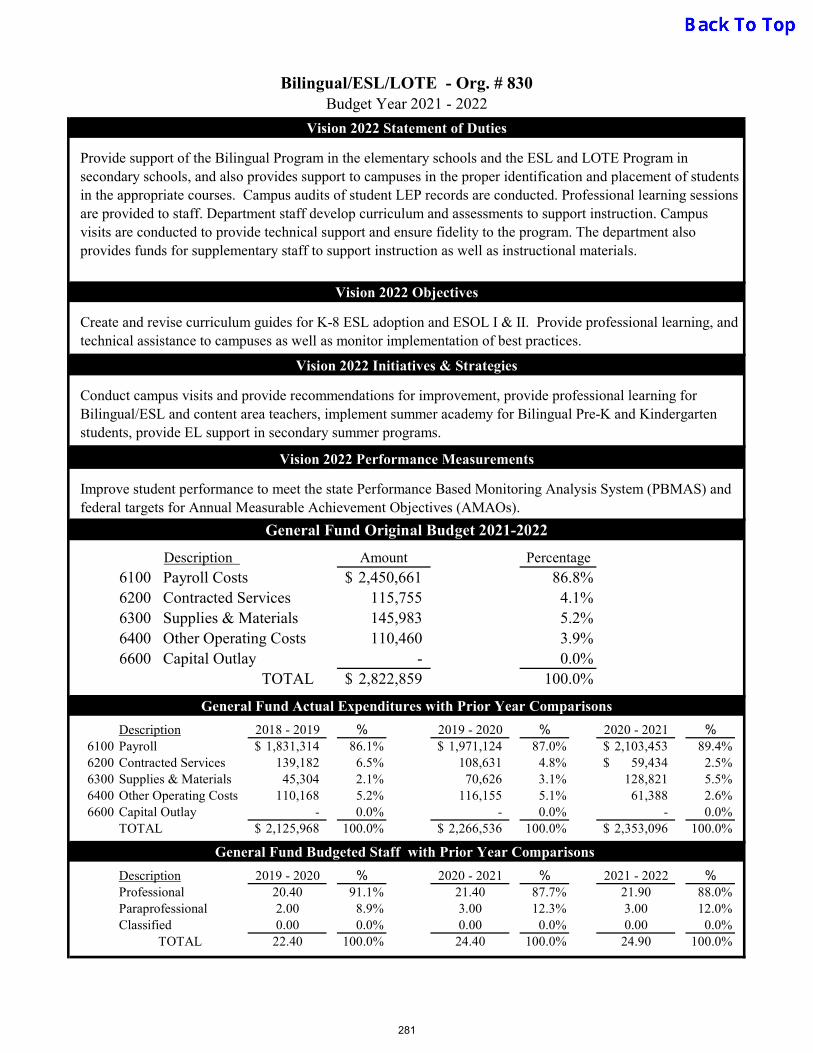
Vision 2022 Statement of Duties
Vision 2022 Objectives
Vision 2022 Initiatives & Strategies
Vision 2022 Performance Measurements
General Fund Original Budget 2021-2022
Description
6200 Contracted Services6300 Supplies & Materials6400 Other Operating Costs6600 Capital Outlay
TOTAL
General Fund Actual Expenditures with Prior Year Comparisons
Description 2018 - 2019 % 2019 - 2020 % 2020 - 2021 %6100 Payroll 1,831,314$ 86.1% 1,971,124$ 87.0% 2,103,453$ 89.4%6200 Contracted Services 139,182 6.5% 108,631 4.8% 59,434$ 2.5%6300 Supplies & Materials 45,304 2.1% 70,626 3.1% 128,821 5.5%6400 Other Operating Costs 110,168 5.2% 116,155 5.1% 61,388 2.6%6600 Capital Outlay - 0.0% - 0.0% - 0.0%
TOTAL 2,125,968$ 100.0% 2,266,536$ 100.0% 2,353,096$ 100.0%
General Fund Budgeted Staff with Prior Year Comparisons
Description 2019 - 2020 % 2020 - 2021 % 2021 - 2022 %Professional 20.40 91.1% 21.40 87.7% 21.90 88.0%Paraprofessional 2.00 8.9% 3.00 12.3% 3.00 12.0%Classified 0.00 0.0% 0.00 0.0% 0.00 0.0%
TOTAL 22.40 100.0% 24.40 100.0% 24.90 100.0%
- 0.0%2,822,859$ 100.0%
115,755 4.1%145,983 5.2%110,460 3.9%
Improve student performance to meet the state Performance Based Monitoring Analysis System (PBMAS) and federal targets for Annual Measurable Achievement Objectives (AMAOs).
Amount Percentage6100 Payroll Costs 2,450,661$ 86.8%
Create and revise curriculum guides for K-8 ESL adoption and ESOL I & II. Provide professional learning, and technical assistance to campuses as well as monitor implementation of best practices.
Conduct campus visits and provide recommendations for improvement, provide professional learning for Bilingual/ESL and content area teachers, implement summer academy for Bilingual Pre-K and Kindergarten students, provide EL support in secondary summer programs.
Bilingual/ESL/LOTE - Org. # 830Budget Year 2021 - 2022
Provide support of the Bilingual Program in the elementary schools and the ESL and LOTE Program in secondary schools, and also provides support to campuses in the proper identification and placement of students in the appropriate courses. Campus audits of student LEP records are conducted. Professional learning sessions are provided to staff. Department staff develop curriculum and assessments to support instruction. Campus visits are conducted to provide technical support and ensure fidelity to the program. The department also provides funds for supplementary staff to support instruction as well as instructional materials.
281

Vision 2022 Statement of Duties
Vision 2022 Objectives
Vision 2022 Initiatives & Strategies
Vision 2022 Performance Measurements
General Fund Original Budget 2021-2022
Description
6200 Contracted Services6300 Supplies & Materials6400 Other Operating Costs6600 Capital Outlay
TOTAL
General Fund Actual Expenditures with Prior Year Comparisons
Description 2018 - 2019 % 2019 - 2020 % 2020 - 2021 %6100 Payroll 131,609$ 67.8% 136,657$ 77.1% 800,467$ 93.3%6200 Contracted Services 10,928 5.6% 11,777 6.6% 14,065$ 1.6%6300 Supplies & Materials 36,032 18.6% 15,700 8.9% 34,693 4.0%6400 Other Operating Costs 15,553 8.0% 13,176 7.4% 8,910 1.0%6600 Capital Outlay - 0.0% - 0.0% - 0.0%
TOTAL 194,122$ 100.0% 177,311$ 100.0% 858,135$ 100.0%
General Fund Budgeted Staff with Prior Year Comparisons
Description 2019 - 2020 % 2020 - 2021 % 2021 - 2022 %Professional 1.00 100.0% 1.00 100.0% 17.00 100.0%Paraprofessional 0.00 0.0% 0.00 0.0% 0.00 0.0%Classified 0.00 0.0% 0.00 0.0% 0.00 0.0%
TOTAL 1.00 100.0% 1.00 100.0% 17.00 100.0%
- 0.0%1,682,897$ 100.0%
20,090 1.2%37,315 2.2%12,612 0.7%
Increase % of student identified as gifted to 7%, Ensure demographic statistics of GATE identified students matches that of the district, provide opportunities for enrichment/advanced coursework at every campus.
Amount Percentage6100 Payroll Costs 1,612,880$ 95.8%
To implement an identification system allowing students to demonstrate diverse talents & abilities & that matches those students with appropriate GATE services, provide an array of evidence-based GATE service options to support educational needs, strengths, & interests of identified students, provide access to curriculum & instruction appropriately modified in terms of depth, complexity, & pacing to meet the needs of identified students, provide opportunities for professional development for faculty & staff involved in the planning, creation, & delivery of services to identified students, to ensure that stakeholders (family, community, students) are aware of & have opportunities to be involved in services that are provided for GATE identified students, & to meet the goals of the Javits GT grant focused on developing an identification strategy for giftedness in the visual arts and leadership, developing & implementing a service model to meet the needs of identified students.
Testing and Universal Screening, Review of GATE Identification practices, GATE Implementation Specialists services, Enrichment Instruction/Opportunities, Cluster Grouping, Dual Language Gifted Services, District Showcase, Region 20 Cooperative, Parent Outreach & Communication.
Gifted & Talented Program - Org. # 849Budget Year 2021 - 2022
The mission of the San Antonio Independent School District’s Gifted and Talented Education (GATE) Department is to transform potential in youth into outstanding achievement in adulthood. The district is committed to identifying and nurturing individual strengths in order to cultivate the unique intellectual and academic gifts and talents of our students.
282
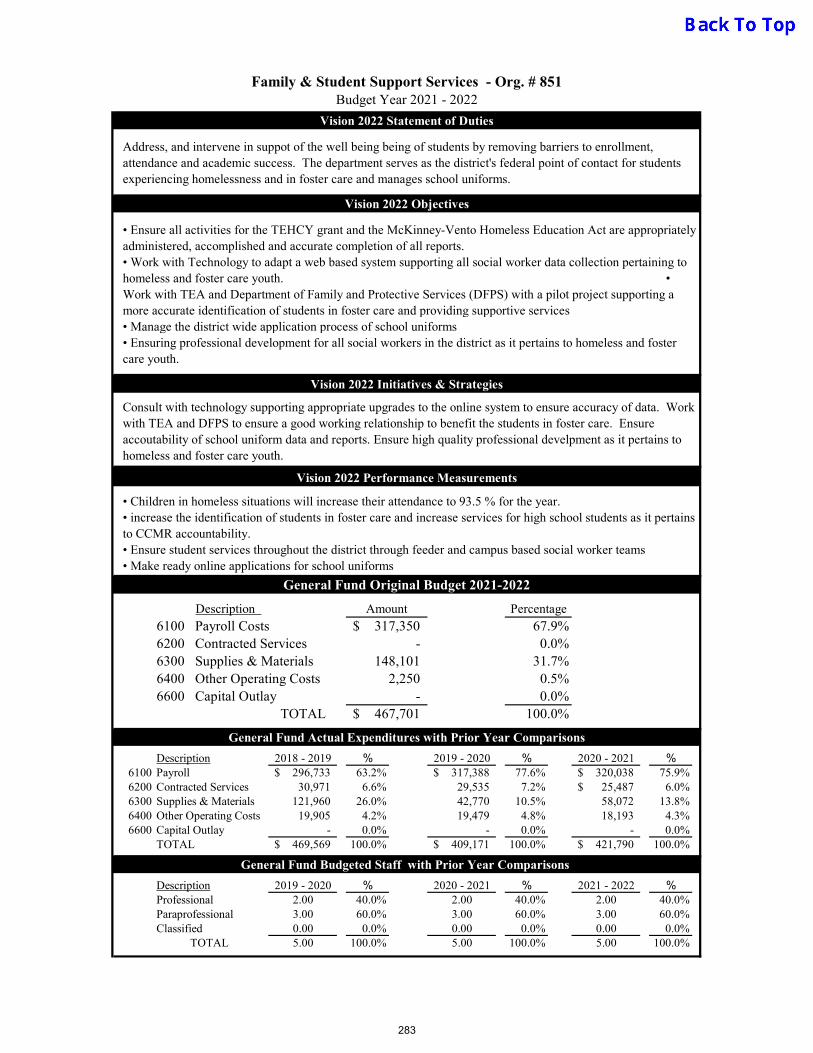
Vision 2022 Statement of Duties
Vision 2022 Objectives
Vision 2022 Initiatives & Strategies
Vision 2022 Performance Measurements
General Fund Original Budget 2021-2022
Description
6200 Contracted Services6300 Supplies & Materials6400 Other Operating Costs6600 Capital Outlay
TOTAL
General Fund Actual Expenditures with Prior Year Comparisons
Description 2018 - 2019 % 2019 - 2020 % 2020 - 2021 %6100 Payroll 296,733$ 63.2% 317,388$ 77.6% 320,038$ 75.9%6200 Contracted Services 30,971 6.6% 29,535 7.2% 25,487$ 6.0%6300 Supplies & Materials 121,960 26.0% 42,770 10.5% 58,072 13.8%6400 Other Operating Costs 19,905 4.2% 19,479 4.8% 18,193 4.3%6600 Capital Outlay - 0.0% - 0.0% - 0.0%
TOTAL 469,569$ 100.0% 409,171$ 100.0% 421,790$ 100.0%
General Fund Budgeted Staff with Prior Year Comparisons
Description 2019 - 2020 % 2020 - 2021 % 2021 - 2022 %Professional 2.00 40.0% 2.00 40.0% 2.00 40.0%Paraprofessional 3.00 60.0% 3.00 60.0% 3.00 60.0%Classified 0.00 0.0% 0.00 0.0% 0.00 0.0%
TOTAL 5.00 100.0% 5.00 100.0% 5.00 100.0%
- 0.0%467,701$ 100.0%
- 0.0%148,101 31.7%
2,250 0.5%
• Children in homeless situations will increase their attendance to 93.5 % for the year. • increase the identification of students in foster care and increase services for high school students as it pertains to CCMR accountability. • Ensure student services throughout the district through feeder and campus based social worker teams • Make ready online applications for school uniforms
Amount Percentage6100 Payroll Costs 317,350$ 67.9%
• Ensure all activities for the TEHCY grant and the McKinney-Vento Homeless Education Act are appropriately administered, accomplished and accurate completion of all reports. • Work with Technology to adapt a web based system supporting all social worker data collection pertaining to homeless and foster care youth. • Work with TEA and Department of Family and Protective Services (DFPS) with a pilot project supporting a more accurate identification of students in foster care and providing supportive services • Manage the district wide application process of school uniforms • Ensuring professional development for all social workers in the district as it pertains to homeless and foster care youth.
Consult with technology supporting appropriate upgrades to the online system to ensure accuracy of data. Work with TEA and DFPS to ensure a good working relationship to benefit the students in foster care. Ensure accoutability of school uniform data and reports. Ensure high quality professional develpment as it pertains to homeless and foster care youth.
Family & Student Support Services - Org. # 851Budget Year 2021 - 2022
Address, and intervene in suppot of the well being being of students by removing barriers to enrollment, attendance and academic success. The department serves as the district's federal point of contact for students experiencing homelessness and in foster care and manages school uniforms.
283
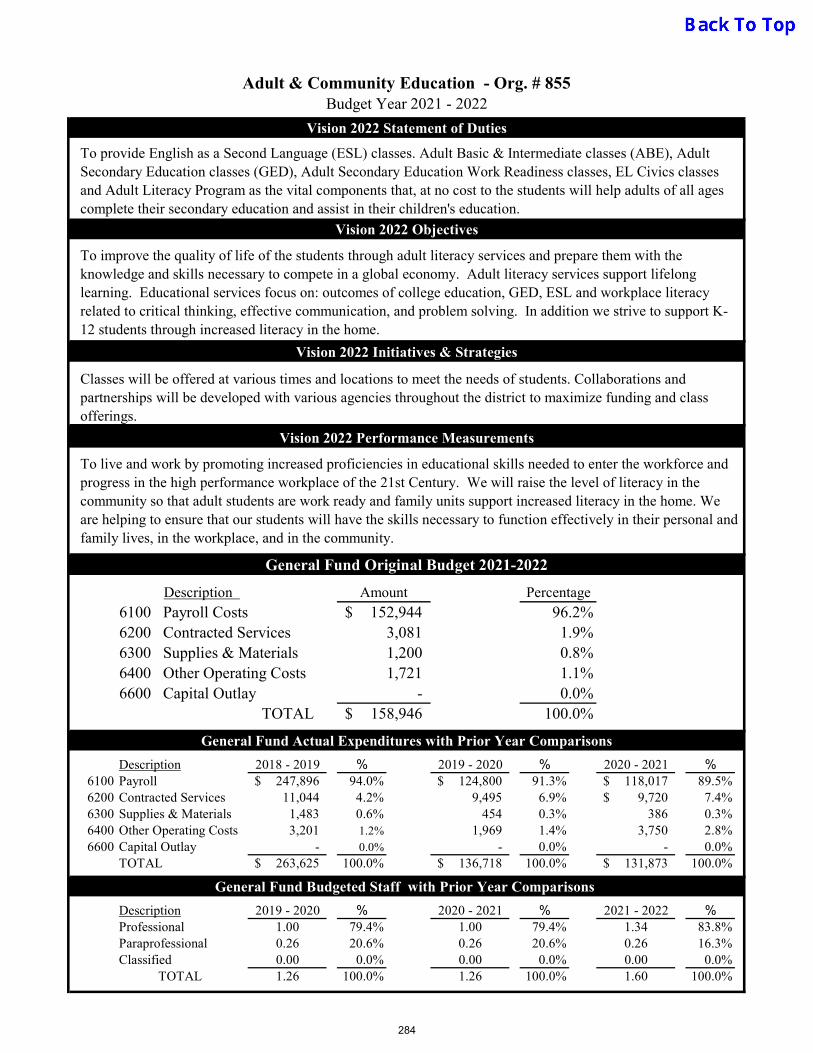
Vision 2022 Statement of Duties
Vision 2022 Objectives
Vision 2022 Initiatives & Strategies
Vision 2022 Performance Measurements
General Fund Original Budget 2021-2022
Description
6200 Contracted Services6300 Supplies & Materials6400 Other Operating Costs6600 Capital Outlay
TOTAL
General Fund Actual Expenditures with Prior Year Comparisons
Description 2018 - 2019 % 2019 - 2020 % 2020 - 2021 %6100 Payroll 247,896$ 94.0% 124,800$ 91.3% 118,017$ 89.5%6200 Contracted Services 11,044 4.2% 9,495 6.9% 9,720$ 7.4%6300 Supplies & Materials 1,483 0.6% 454 0.3% 386 0.3%6400 Other Operating Costs 3,201 1.2% 1,969 1.4% 3,750 2.8%6600 Capital Outlay - 0.0% - 0.0% - 0.0%
TOTAL 263,625$ 100.0% 136,718$ 100.0% 131,873$ 100.0%
General Fund Budgeted Staff with Prior Year Comparisons
Description 2019 - 2020 % 2020 - 2021 % 2021 - 2022 %Professional 1.00 79.4% 1.00 79.4% 1.34 83.8%Paraprofessional 0.26 20.6% 0.26 20.6% 0.26 16.3%Classified 0.00 0.0% 0.00 0.0% 0.00 0.0%
TOTAL 1.26 100.0% 1.26 100.0% 1.60 100.0%
- 0.0%158,946$ 100.0%
3,081 1.9%1,200 0.8%1,721 1.1%
To live and work by promoting increased proficiencies in educational skills needed to enter the workforce and progress in the high performance workplace of the 21st Century. We will raise the level of literacy in the community so that adult students are work ready and family units support increased literacy in the home. We are helping to ensure that our students will have the skills necessary to function effectively in their personal and family lives, in the workplace, and in the community.
Amount Percentage6100 Payroll Costs 152,944$ 96.2%
To improve the quality of life of the students through adult literacy services and prepare them with the knowledge and skills necessary to compete in a global economy. Adult literacy services support lifelong learning. Educational services focus on: outcomes of college education, GED, ESL and workplace literacy related to critical thinking, effective communication, and problem solving. In addition we strive to support K-12 students through increased literacy in the home.
Classes will be offered at various times and locations to meet the needs of students. Collaborations and partnerships will be developed with various agencies throughout the district to maximize funding and class offerings.
Adult & Community Education - Org. # 855Budget Year 2021 - 2022
To provide English as a Second Language (ESL) classes. Adult Basic & Intermediate classes (ABE), Adult Secondary Education classes (GED), Adult Secondary Education Work Readiness classes, EL Civics classes and Adult Literacy Program as the vital components that, at no cost to the students will help adults of all ages complete their secondary education and assist in their children's education.
284

Vision 2022 Statement of Duties
Vision 2022 Objectives
Vision 2022 Initiatives & Strategies
Vision 2022 Performance Measurements
General Fund Original Budget 2021-2022
Description
6200 Contracted Services6300 Supplies & Materials6400 Other Operating Costs6600 Capital Outlay
TOTAL
General Fund Actual Expenditures with Prior Year Comparisons
Description 2018 - 2019 % 2019 - 2020 % 2020 - 2021 %6100 Payroll 2,356,935$ 92.7% 3,836,556$ 85.0% 2,445,750$ 87.8%6200 Contracted Services 96,001 3.8% 464,022 10.3% 241,510$ 8.7%6300 Supplies & Materials 61,145 2.4% 86,333 1.9% 30,180 1.1%6400 Other Operating Costs 27,511 1.1% 128,635 2.8% 67,035 2.4%6600 Capital Outlay - 0.0% - 0.0% - 0.0%
TOTAL 2,541,592$ 100.0% 4,515,546$ 100.0% 2,784,475$ 100.0%
General Fund Budgeted Staff with Prior Year Comparisons
Description 2019 - 2020 % 2020 - 2021 % 2021 - 2022 %Professional 31.00 93.9% 42.00 95.5% 15.20 83.5%Paraprofessional 2.00 6.1% 2.00 4.5% 3.00 16.5%Classified 0.00 0.0% 0.00 0.0% 0.00 0.0%
TOTAL 33.00 100.0% 44.00 100.0% 18.20 100.0%
- 0.0%2,715,970$ 100.0%
557,700 20.5%129,900 4.8%
79,400 2.9%
To provide high quality job-embedded learning opportunities that serve to improve student achievement, foster collaboration, and build leadership capacity. Create systems of support for the effective implementation of intended learning outcomes amongst various departments district-wide by leveraging stakeholder feedback to design high quality, relevant PD.
Amount Percentage6100 Payroll Costs 1,948,970$ 71.8%
All students will demonstrate SAISD core values as they develop college readiness skills in PK-12. Students will engage in creativity/innovation across content by reinforcing the habit of asking good questions; and accessing and analyzing information to understand more deeply as evidenced by student work, classroom walkthroughs, and curriculum-based assessments. Students will be provided with opportunities for dual-credit early college coursework as measured by dual-credit program participation.
Develop professional learning opportunities focused on innovative instructional practices that promote the use of technology tools, social media, critical questioning, problem solving skills and effective communication. Develop professional learning opportunities focused on deepening content knowledge, pedagogy and instructional leadership practices that increase student performance in reading and writing.
Organizational Learning & Support Services - Org. # 856Budget Year 2021 - 2022
Design, monitor and sustain systems that support the district, campus and the individual professional development goals of SAISD staff: Establish guidelines, codify procedures and practices, integrate technology to enhance professional learning.
285
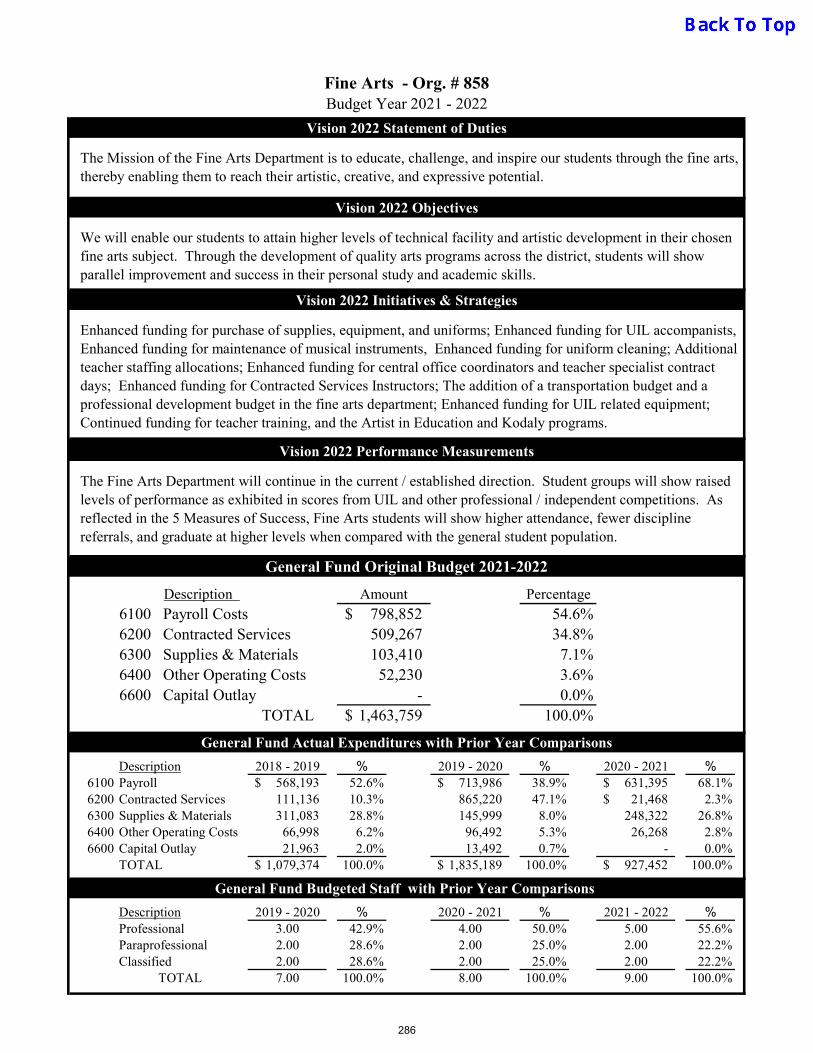
Vision 2022 Statement of Duties
Vision 2022 Objectives
Vision 2022 Initiatives & Strategies
Vision 2022 Performance Measurements
General Fund Original Budget 2021-2022
Description
6200 Contracted Services6300 Supplies & Materials6400 Other Operating Costs6600 Capital Outlay
TOTAL
General Fund Actual Expenditures with Prior Year Comparisons
Description 2018 - 2019 % 2019 - 2020 % 2020 - 2021 %6100 Payroll 568,193$ 52.6% 713,986$ 38.9% 631,395$ 68.1%6200 Contracted Services 111,136 10.3% 865,220 47.1% 21,468$ 2.3%6300 Supplies & Materials 311,083 28.8% 145,999 8.0% 248,322 26.8%6400 Other Operating Costs 66,998 6.2% 96,492 5.3% 26,268 2.8%6600 Capital Outlay 21,963 2.0% 13,492 0.7% - 0.0%
TOTAL 1,079,374$ 100.0% 1,835,189$ 100.0% 927,452$ 100.0%
General Fund Budgeted Staff with Prior Year Comparisons
Description 2019 - 2020 % 2020 - 2021 % 2021 - 2022 %Professional 3.00 42.9% 4.00 50.0% 5.00 55.6%Paraprofessional 2.00 28.6% 2.00 25.0% 2.00 22.2%Classified 2.00 28.6% 2.00 25.0% 2.00 22.2%
TOTAL 7.00 100.0% 8.00 100.0% 9.00 100.0%
- 0.0%1,463,759$ 100.0%
509,267 34.8%103,410 7.1%
52,230 3.6%
The Fine Arts Department will continue in the current / established direction. Student groups will show raised levels of performance as exhibited in scores from UIL and other professional / independent competitions. As reflected in the 5 Measures of Success, Fine Arts students will show higher attendance, fewer discipline referrals, and graduate at higher levels when compared with the general student population.
Amount Percentage6100 Payroll Costs 798,852$ 54.6%
We will enable our students to attain higher levels of technical facility and artistic development in their chosen fine arts subject. Through the development of quality arts programs across the district, students will show parallel improvement and success in their personal study and academic skills.
Enhanced funding for purchase of supplies, equipment, and uniforms; Enhanced funding for UIL accompanists, Enhanced funding for maintenance of musical instruments, Enhanced funding for uniform cleaning; Additional teacher staffing allocations; Enhanced funding for central office coordinators and teacher specialist contract days; Enhanced funding for Contracted Services Instructors; The addition of a transportation budget and a professional development budget in the fine arts department; Enhanced funding for UIL related equipment; Continued funding for teacher training, and the Artist in Education and Kodaly programs.
Fine Arts - Org. # 858Budget Year 2021 - 2022
The Mission of the Fine Arts Department is to educate, challenge, and inspire our students through the fine arts, thereby enabling them to reach their artistic, creative, and expressive potential.
286
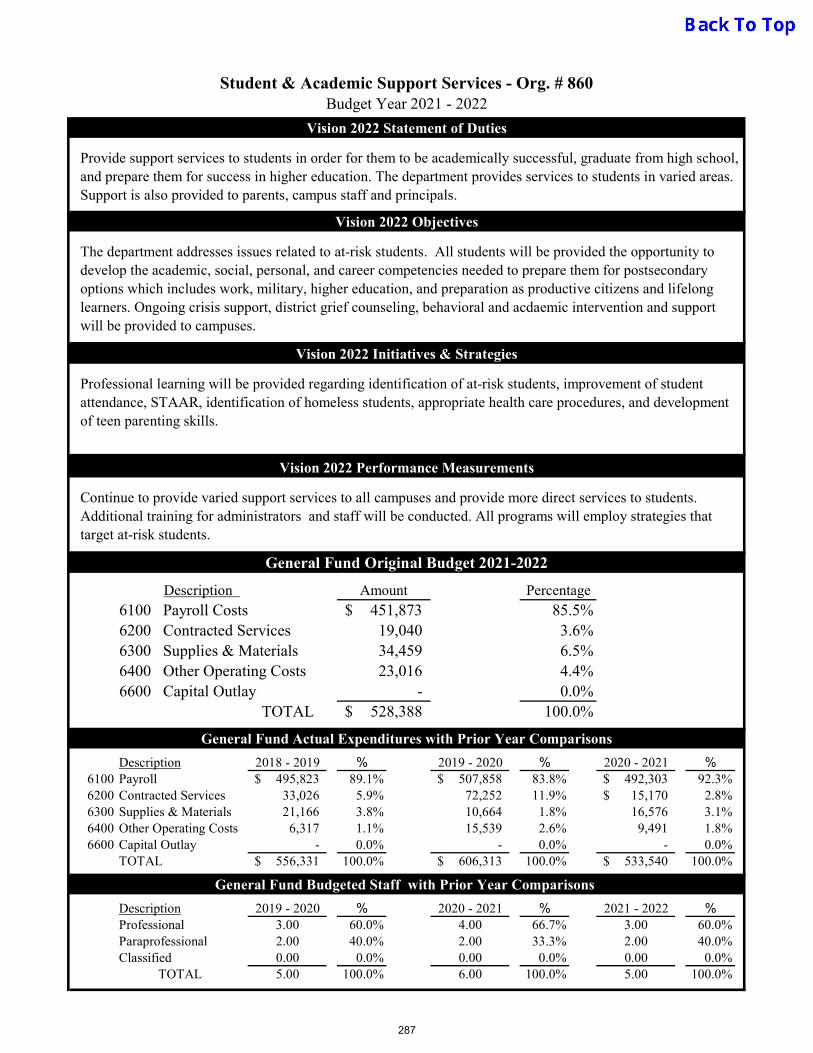
Vision 2022 Statement of Duties
Vision 2022 Objectives
Vision 2022 Initiatives & Strategies
Vision 2022 Performance Measurements
General Fund Original Budget 2021-2022
Description
6200 Contracted Services6300 Supplies & Materials6400 Other Operating Costs6600 Capital Outlay
TOTAL
General Fund Actual Expenditures with Prior Year Comparisons
Description 2018 - 2019 % 2019 - 2020 % 2020 - 2021 %6100 Payroll 495,823$ 89.1% 507,858$ 83.8% 492,303$ 92.3%6200 Contracted Services 33,026 5.9% 72,252 11.9% 15,170$ 2.8%6300 Supplies & Materials 21,166 3.8% 10,664 1.8% 16,576 3.1%6400 Other Operating Costs 6,317 1.1% 15,539 2.6% 9,491 1.8%6600 Capital Outlay - 0.0% - 0.0% - 0.0%
TOTAL 556,331$ 100.0% 606,313$ 100.0% 533,540$ 100.0%
General Fund Budgeted Staff with Prior Year Comparisons
Description 2019 - 2020 % 2020 - 2021 % 2021 - 2022 %Professional 3.00 60.0% 4.00 66.7% 3.00 60.0%Paraprofessional 2.00 40.0% 2.00 33.3% 2.00 40.0%Classified 0.00 0.0% 0.00 0.0% 0.00 0.0%
TOTAL 5.00 100.0% 6.00 100.0% 5.00 100.0%
- 0.0%528,388$ 100.0%
19,040 3.6%34,459 6.5%23,016 4.4%
Continue to provide varied support services to all campuses and provide more direct services to students. Additional training for administrators and staff will be conducted. All programs will employ strategies that target at-risk students.
Amount Percentage6100 Payroll Costs 451,873$ 85.5%
The department addresses issues related to at-risk students. All students will be provided the opportunity to develop the academic, social, personal, and career competencies needed to prepare them for postsecondary options which includes work, military, higher education, and preparation as productive citizens and lifelong learners. Ongoing crisis support, district grief counseling, behavioral and acdaemic intervention and support will be provided to campuses.
Professional learning will be provided regarding identification of at-risk students, improvement of student attendance, STAAR, identification of homeless students, appropriate health care procedures, and development of teen parenting skills.
Student & Academic Support Services - Org. # 860Budget Year 2021 - 2022
Provide support services to students in order for them to be academically successful, graduate from high school, and prepare them for success in higher education. The department provides services to students in varied areas. Support is also provided to parents, campus staff and principals.
287
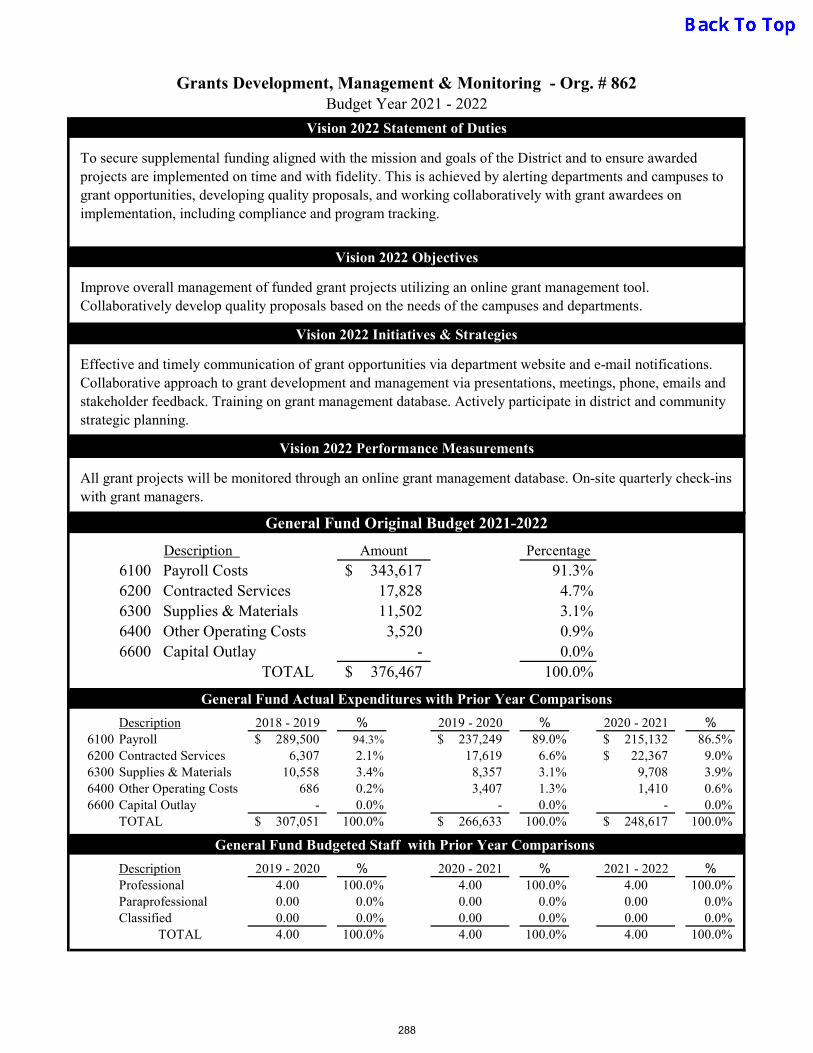
Vision 2022 Statement of Duties
Vision 2022 Objectives
Vision 2022 Initiatives & Strategies
Vision 2022 Performance Measurements
General Fund Original Budget 2021-2022
Description
6200 Contracted Services6300 Supplies & Materials6400 Other Operating Costs6600 Capital Outlay
TOTAL
General Fund Actual Expenditures with Prior Year Comparisons
Description 2018 - 2019 % 2019 - 2020 % 2020 - 2021 %6100 Payroll 289,500$ 94.3% 237,249$ 89.0% 215,132$ 86.5%6200 Contracted Services 6,307 2.1% 17,619 6.6% 22,367$ 9.0%6300 Supplies & Materials 10,558 3.4% 8,357 3.1% 9,708 3.9%6400 Other Operating Costs 686 0.2% 3,407 1.3% 1,410 0.6%6600 Capital Outlay - 0.0% - 0.0% - 0.0%
TOTAL 307,051$ 100.0% 266,633$ 100.0% 248,617$ 100.0%
General Fund Budgeted Staff with Prior Year Comparisons
Description 2019 - 2020 % 2020 - 2021 % 2021 - 2022 %Professional 4.00 100.0% 4.00 100.0% 4.00 100.0%Paraprofessional 0.00 0.0% 0.00 0.0% 0.00 0.0%Classified 0.00 0.0% 0.00 0.0% 0.00 0.0%
TOTAL 4.00 100.0% 4.00 100.0% 4.00 100.0%
- 0.0%376,467$ 100.0%
17,828 4.7%11,502 3.1%
3,520 0.9%
All grant projects will be monitored through an online grant management database. On-site quarterly check-ins with grant managers.
Amount Percentage6100 Payroll Costs 343,617$ 91.3%
Improve overall management of funded grant projects utilizing an online grant management tool. Collaboratively develop quality proposals based on the needs of the campuses and departments.
Effective and timely communication of grant opportunities via department website and e-mail notifications. Collaborative approach to grant development and management via presentations, meetings, phone, emails and stakeholder feedback. Training on grant management database. Actively participate in district and community strategic planning.
Grants Development, Management & Monitoring - Org. # 862Budget Year 2021 - 2022
To secure supplemental funding aligned with the mission and goals of the District and to ensure awarded projects are implemented on time and with fidelity. This is achieved by alerting departments and campuses to grant opportunities, developing quality proposals, and working collaboratively with grant awardees on implementation, including compliance and program tracking.
288

Vision 2022 Statement of Duties
Vision 2022 Objectives
Vision 2022 Initiatives & Strategies
Vision 2022 Performance Measurements
General Fund Original Budget 2021-2022
Description
6200 Contracted Services6300 Supplies & Materials6400 Other Operating Costs6600 Capital Outlay
TOTAL
General Fund Actual Expenditures with Prior Year Comparisons
Description 2018 - 2019 % 2019 - 2020 % 2020 - 2021 %6100 Payroll 625,962$ 99.2% 902,966$ 92.3% 1,082,987$ 87.9%6200 Contracted Services 3,557 0.6% 11,418 1.2% 16,319$ 1.3%6300 Supplies & Materials 870 0.1% 42,433 4.3% 62,587 5.1%6400 Other Operating Costs 425 0.1% 21,678 2.2% 69,952 5.7%6600 Capital Outlay - 0.0% - 0.0% - 0.0%
TOTAL 630,814$ 100.0% 978,494$ 100.0% 1,231,845$ 100.0%
General Fund Budgeted Staff with Prior Year Comparisons
Description 2019 - 2020 % 2020 - 2021 % 2021 - 2022 %Professional 7.00 70.0% 7.00 63.6% 9.00 75.0%Paraprofessional 2.00 20.0% 3.00 27.3% 2.00 16.7%Classified 1.00 10.0% 1.00 9.1% 1.00 8.3%
TOTAL 10.00 100.0% 11.00 100.0% 12.00 100.0%
- 0.0%1,291,705$ 100.0%
40,745 3.2%112,042 8.7%
36,352 2.8%
Performance measures for programs will include completion rates, certifications, dual credit, internships, STAAR scores, access to programs for non-traditional students, career and military readiness skills, and student competitions.
Amount Percentage6100 Payroll Costs 1,102,566$ 85.4%
All students will receive quality instruction to prepare students for college, career and the military. All students will have an opportunity to fully develop their special interests, social life skills, and have an opportunity for community service learning.
Programs of study will be aligned to the in-demand and living wage occupations and pathways that will include post secondary education, including military. Academic excellence will focus on certifications, dual credit, marketable skills, and academic knowledge and application.
College, Career & Military Readiness - Org. # 865Budget Year 2021 - 2022
To support College, Career and Military Readiness activities for 6th-12th students and staff that include coordinating, supportinging, scheduling and funding STEM programs, Career and Technical Education programs, Technology Applications programs, JROTC, LOTC, GEAR UP, and specialized programs like magnets, CAST, and PTECH programs.
289
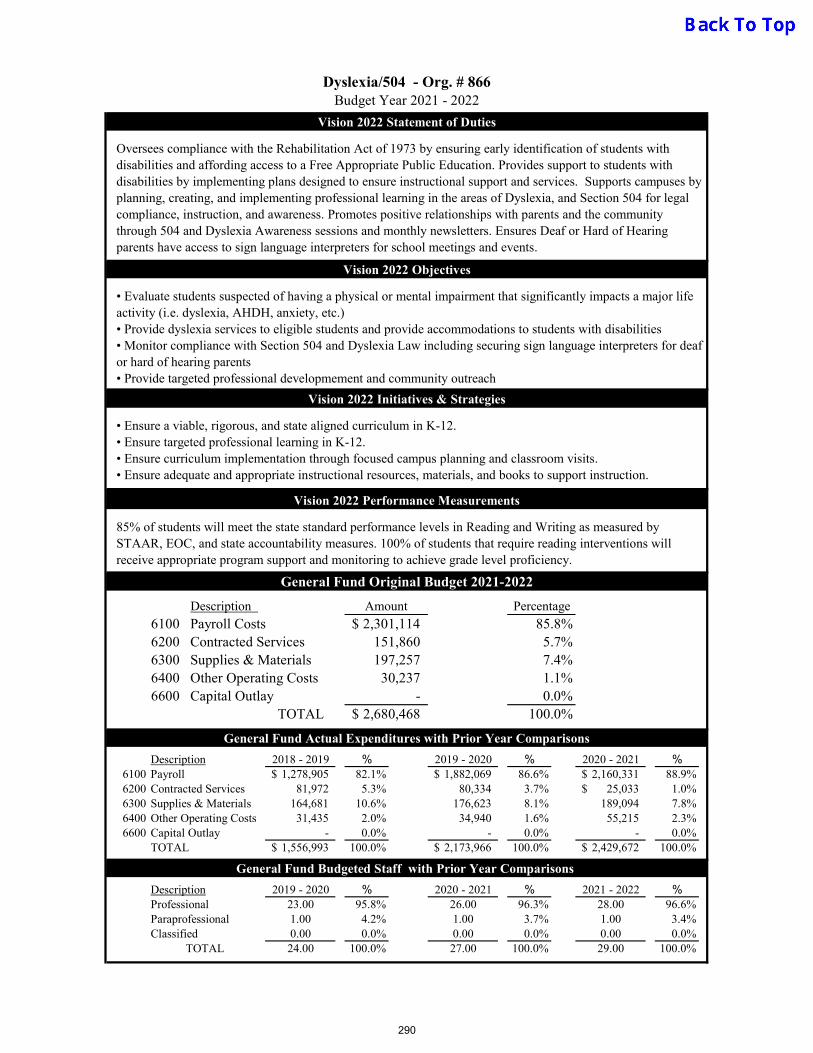
Vision 2022 Statement of Duties
Vision 2022 Objectives
Vision 2022 Initiatives & Strategies
Vision 2022 Performance Measurements
General Fund Original Budget 2021-2022
Description
6200 Contracted Services6300 Supplies & Materials6400 Other Operating Costs6600 Capital Outlay
TOTAL
General Fund Actual Expenditures with Prior Year Comparisons
Description 2018 - 2019 % 2019 - 2020 % 2020 - 2021 %6100 Payroll 1,278,905$ 82.1% 1,882,069$ 86.6% 2,160,331$ 88.9%6200 Contracted Services 81,972 5.3% 80,334 3.7% 25,033$ 1.0%6300 Supplies & Materials 164,681 10.6% 176,623 8.1% 189,094 7.8%6400 Other Operating Costs 31,435 2.0% 34,940 1.6% 55,215 2.3%6600 Capital Outlay - 0.0% - 0.0% - 0.0%
TOTAL 1,556,993$ 100.0% 2,173,966$ 100.0% 2,429,672$ 100.0%
General Fund Budgeted Staff with Prior Year Comparisons
Description 2019 - 2020 % 2020 - 2021 % 2021 - 2022 %Professional 23.00 95.8% 26.00 96.3% 28.00 96.6%Paraprofessional 1.00 4.2% 1.00 3.7% 1.00 3.4%Classified 0.00 0.0% 0.00 0.0% 0.00 0.0%
TOTAL 24.00 100.0% 27.00 100.0% 29.00 100.0%
- 0.0%2,680,468$ 100.0%
151,860 5.7%197,257 7.4%
30,237 1.1%
85% of students will meet the state standard performance levels in Reading and Writing as measured by STAAR, EOC, and state accountability measures. 100% of students that require reading interventions will receive appropriate program support and monitoring to achieve grade level proficiency.
Amount Percentage6100 Payroll Costs 2,301,114$ 85.8%
• Evaluate students suspected of having a physical or mental impairment that significantly impacts a major life activity (i.e. dyslexia, AHDH, anxiety, etc.) • Provide dyslexia services to eligible students and provide accommodations to students with disabilities• Monitor compliance with Section 504 and Dyslexia Law including securing sign language interpreters for deaf or hard of hearing parents • Provide targeted professional developmement and community outreach
• Ensure a viable, rigorous, and state aligned curriculum in K-12. • Ensure targeted professional learning in K-12. • Ensure curriculum implementation through focused campus planning and classroom visits. • Ensure adequate and appropriate instructional resources, materials, and books to support instruction.
Dyslexia/504 - Org. # 866Budget Year 2021 - 2022
Oversees compliance with the Rehabilitation Act of 1973 by ensuring early identification of students with disabilities and affording access to a Free Appropriate Public Education. Provides support to students with disabilities by implementing plans designed to ensure instructional support and services. Supports campuses by planning, creating, and implementing professional learning in the areas of Dyslexia, and Section 504 for legal compliance, instruction, and awareness. Promotes positive relationships with parents and the community through 504 and Dyslexia Awareness sessions and monthly newsletters. Ensures Deaf or Hard of Hearing parents have access to sign language interpreters for school meetings and events.
290

Vision 2022 Statement of Duties
Vision 2022 Objectives
Vision 2022 Initiatives & Strategies
Vision 2022 Performance Measurements
General Fund Original Budget 2021-2022
Description
6200 Contracted Services6300 Supplies & Materials6400 Other Operating Costs6600 Capital Outlay
TOTAL
General Fund Actual Expenditures with Prior Year Comparisons
Description 2018 - 2019 % 2019 - 2020 % 2020 - 2021 %6100 Payroll 231,232$ 75.8% 216,220$ 80.7% 217,444$ 89.0%6200 Contracted Services - 0.0% 162 0.1% 78$ 0.0%6300 Supplies & Materials 41,401 13.6% 20,703 7.7% 11,455 4.7%6400 Other Operating Costs 32,494 10.6% 30,952 11.5% 15,400 6.3%6600 Capital Outlay - 0.0% - 0.0% - 0.0%
TOTAL 305,127$ 100.0% 268,037$ 100.0% 244,376$ 100.0%
General Fund Budgeted Staff with Prior Year Comparisons
Description 2019 - 2020 % 2020 - 2021 % 2021 - 2022 %Professional 1.25 33.3% 1.25 35.7% 1.25 35.7%Paraprofessional 2.50 66.7% 2.25 64.3% 2.25 64.3%Classified 0.00 0.0% 0.00 0.0% 0.00 0.0%
TOTAL 3.75 100.0% 3.50 100.0% 3.50 100.0%
- 0.0%288,278$ 100.0%
500 0.2%12,016 4.2%38,700 13.4%
Pre-K students will develop a strong foundation in oral language, vocabulary development, early literacy skills, numeric and math skills, social studies, science, physical development and fine arts. Alignment to the TEA Pre-K Curriculum Guidelines will strengthen assessment results.
Amount Percentage6100 Payroll Costs 237,062$ 82.2%
The vision of the Early Childhood Education Department is to prepare all SAISD children by providing them with the skills necessary to create a strong foundation for future learning and success. The department strives to ensure this by providing developmentally appropriate and high quality full day programs to all eligible three and four year-old children.
In an effort to enhance and strengthen instruction, the Pre-K 3, Pre-K 4 Focus Documents continue to be revised and refined. The Focus Documents are written at appropriate developmental levels and include all core areas. In an effort to ensure fidelity and consistent implementation, professional learning and support are also provided to teachers and teacher assistants. The department also provides guidance and support to campus administrators.
Early Childhood - Org. # 868Budget Year 2021 - 2022
The overall function of the Early Childhood Education Department is to support all Pre-K teachers and teacher assistants by providing professional development, mentoring, coaching, and model teaching. The department also provides technical support to campus administrators. The results are a quality early childhood program where children are on or above grade level.
291
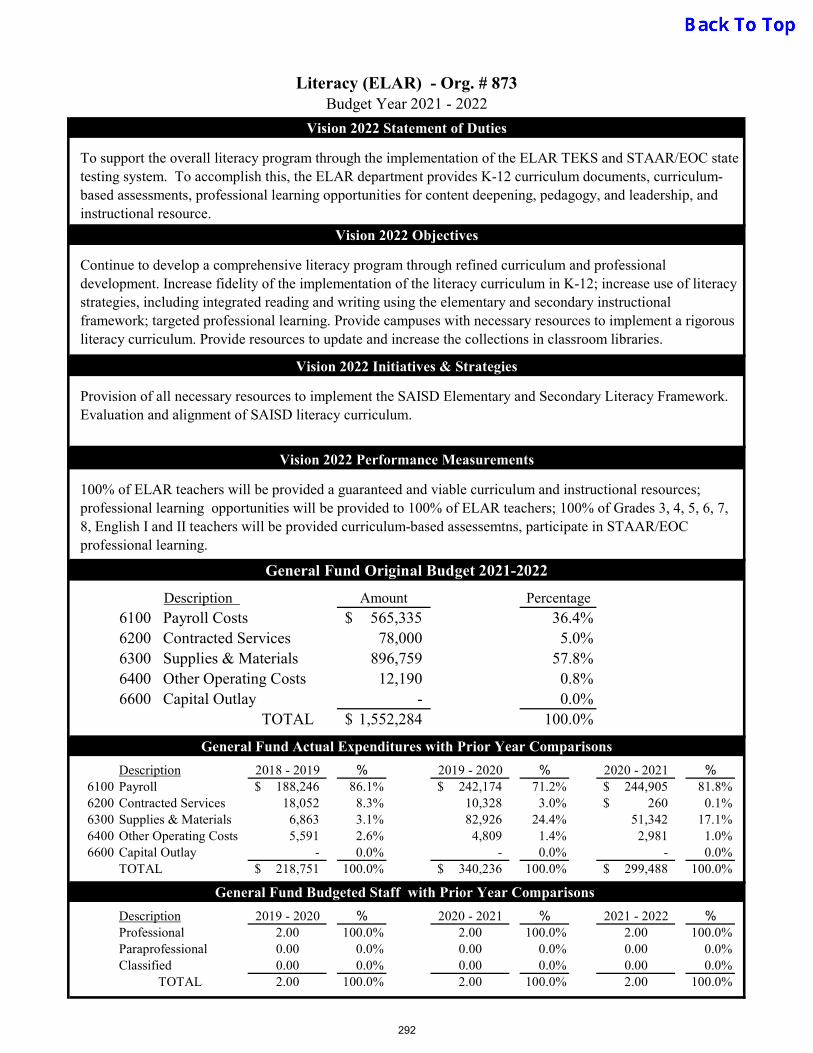
Vision 2022 Statement of Duties
Vision 2022 Objectives
Vision 2022 Initiatives & Strategies
Vision 2022 Performance Measurements
General Fund Original Budget 2021-2022
Description
6200 Contracted Services6300 Supplies & Materials6400 Other Operating Costs6600 Capital Outlay
TOTAL
General Fund Actual Expenditures with Prior Year Comparisons
Description 2018 - 2019 % 2019 - 2020 % 2020 - 2021 %6100 Payroll 188,246$ 86.1% 242,174$ 71.2% 244,905$ 81.8%6200 Contracted Services 18,052 8.3% 10,328 3.0% 260$ 0.1%6300 Supplies & Materials 6,863 3.1% 82,926 24.4% 51,342 17.1%6400 Other Operating Costs 5,591 2.6% 4,809 1.4% 2,981 1.0%6600 Capital Outlay - 0.0% - 0.0% - 0.0%
TOTAL 218,751$ 100.0% 340,236$ 100.0% 299,488$ 100.0%
General Fund Budgeted Staff with Prior Year Comparisons
Description 2019 - 2020 % 2020 - 2021 % 2021 - 2022 %Professional 2.00 100.0% 2.00 100.0% 2.00 100.0%Paraprofessional 0.00 0.0% 0.00 0.0% 0.00 0.0%Classified 0.00 0.0% 0.00 0.0% 0.00 0.0%
TOTAL 2.00 100.0% 2.00 100.0% 2.00 100.0%
- 0.0%1,552,284$ 100.0%
78,000 5.0%896,759 57.8%
12,190 0.8%
100% of ELAR teachers will be provided a guaranteed and viable curriculum and instructional resources; professional learning opportunities will be provided to 100% of ELAR teachers; 100% of Grades 3, 4, 5, 6, 7, 8, English I and II teachers will be provided curriculum-based assessemtns, participate in STAAR/EOC professional learning.
Amount Percentage6100 Payroll Costs 565,335$ 36.4%
Continue to develop a comprehensive literacy program through refined curriculum and professional development. Increase fidelity of the implementation of the literacy curriculum in K-12; increase use of literacy strategies, including integrated reading and writing using the elementary and secondary instructional framework; targeted professional learning. Provide campuses with necessary resources to implement a rigorous literacy curriculum. Provide resources to update and increase the collections in classroom libraries.
Provision of all necessary resources to implement the SAISD Elementary and Secondary Literacy Framework. Evaluation and alignment of SAISD literacy curriculum.
Literacy (ELAR) - Org. # 873Budget Year 2021 - 2022
To support the overall literacy program through the implementation of the ELAR TEKS and STAAR/EOC state testing system. To accomplish this, the ELAR department provides K-12 curriculum documents, curriculum-based assessments, professional learning opportunities for content deepening, pedagogy, and leadership, and instructional resource.
292
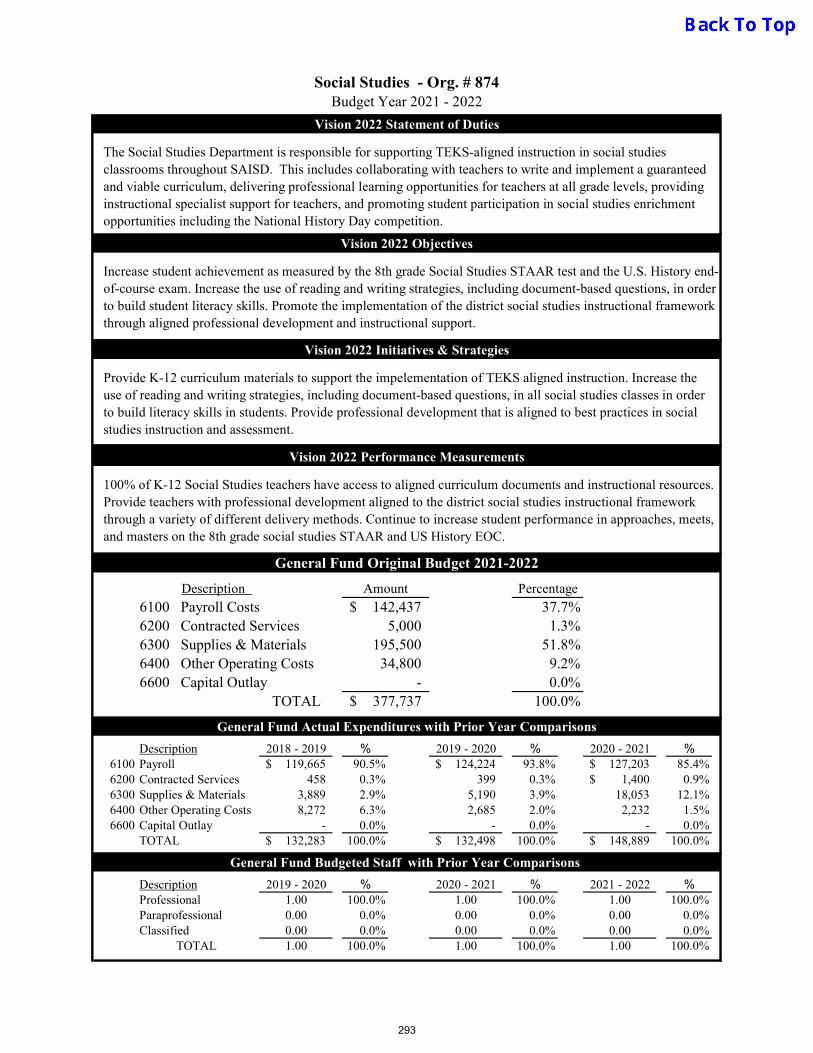
Vision 2022 Statement of Duties
Vision 2022 Objectives
Vision 2022 Initiatives & Strategies
Vision 2022 Performance Measurements
General Fund Original Budget 2021-2022
Description
6200 Contracted Services6300 Supplies & Materials6400 Other Operating Costs6600 Capital Outlay
TOTAL
General Fund Actual Expenditures with Prior Year Comparisons
Description 2018 - 2019 % 2019 - 2020 % 2020 - 2021 %6100 Payroll 119,665$ 90.5% 124,224$ 93.8% 127,203$ 85.4%6200 Contracted Services 458 0.3% 399 0.3% 1,400$ 0.9%6300 Supplies & Materials 3,889 2.9% 5,190 3.9% 18,053 12.1%6400 Other Operating Costs 8,272 6.3% 2,685 2.0% 2,232 1.5%6600 Capital Outlay - 0.0% - 0.0% - 0.0%
TOTAL 132,283$ 100.0% 132,498$ 100.0% 148,889$ 100.0%
General Fund Budgeted Staff with Prior Year Comparisons
Description 2019 - 2020 % 2020 - 2021 % 2021 - 2022 %Professional 1.00 100.0% 1.00 100.0% 1.00 100.0%Paraprofessional 0.00 0.0% 0.00 0.0% 0.00 0.0%Classified 0.00 0.0% 0.00 0.0% 0.00 0.0%
TOTAL 1.00 100.0% 1.00 100.0% 1.00 100.0%
- 0.0%377,737$ 100.0%
5,000 1.3%195,500 51.8%
34,800 9.2%
100% of K-12 Social Studies teachers have access to aligned curriculum documents and instructional resources. Provide teachers with professional development aligned to the district social studies instructional framework through a variety of different delivery methods. Continue to increase student performance in approaches, meets, and masters on the 8th grade social studies STAAR and US History EOC.
Amount Percentage
6100 Payroll Costs 142,437$ 37.7%
Increase student achievement as measured by the 8th grade Social Studies STAAR test and the U.S. History end-of-course exam. Increase the use of reading and writing strategies, including document-based questions, in order to build student literacy skills. Promote the implementation of the district social studies instructional framework through aligned professional development and instructional support.
Provide K-12 curriculum materials to support the impelementation of TEKS aligned instruction. Increase the use of reading and writing strategies, including document-based questions, in all social studies classes in order to build literacy skills in students. Provide professional development that is aligned to best practices in social studies instruction and assessment.
Social Studies - Org. # 874Budget Year 2021 - 2022
The Social Studies Department is responsible for supporting TEKS-aligned instruction in social studies classrooms throughout SAISD. This includes collaborating with teachers to write and implement a guaranteed and viable curriculum, delivering professional learning opportunities for teachers at all grade levels, providing instructional specialist support for teachers, and promoting student participation in social studies enrichment opportunities including the National History Day competition.
293
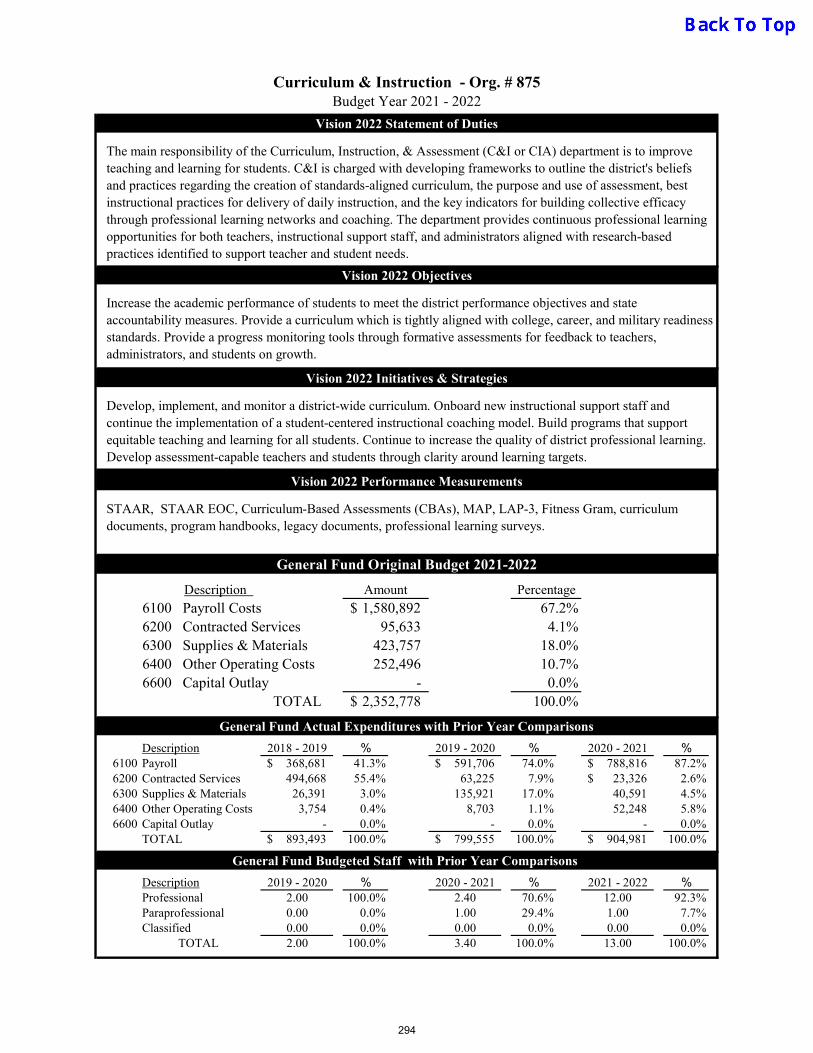
Vision 2022 Statement of Duties
Vision 2022 Objectives
Vision 2022 Initiatives & Strategies
Vision 2022 Performance Measurements
General Fund Original Budget 2021-2022
Description
6200 Contracted Services6300 Supplies & Materials6400 Other Operating Costs6600 Capital Outlay
TOTAL
General Fund Actual Expenditures with Prior Year Comparisons
Description 2018 - 2019 % 2019 - 2020 % 2020 - 2021 %6100 Payroll 368,681$ 41.3% 591,706$ 74.0% 788,816$ 87.2%6200 Contracted Services 494,668 55.4% 63,225 7.9% 23,326$ 2.6%6300 Supplies & Materials 26,391 3.0% 135,921 17.0% 40,591 4.5%6400 Other Operating Costs 3,754 0.4% 8,703 1.1% 52,248 5.8%6600 Capital Outlay - 0.0% - 0.0% - 0.0%
TOTAL 893,493$ 100.0% 799,555$ 100.0% 904,981$ 100.0%
General Fund Budgeted Staff with Prior Year Comparisons
Description 2019 - 2020 % 2020 - 2021 % 2021 - 2022 %Professional 2.00 100.0% 2.40 70.6% 12.00 92.3%Paraprofessional 0.00 0.0% 1.00 29.4% 1.00 7.7%Classified 0.00 0.0% 0.00 0.0% 0.00 0.0%
TOTAL 2.00 100.0% 3.40 100.0% 13.00 100.0%
- 0.0%2,352,778$ 100.0%
95,633 4.1%423,757 18.0%252,496 10.7%
STAAR, STAAR EOC, Curriculum-Based Assessments (CBAs), MAP, LAP-3, Fitness Gram, curriculum documents, program handbooks, legacy documents, professional learning surveys.
Amount Percentage
6100 Payroll Costs 1,580,892$ 67.2%
Increase the academic performance of students to meet the district performance objectives and state accountability measures. Provide a curriculum which is tightly aligned with college, career, and military readiness standards. Provide a progress monitoring tools through formative assessments for feedback to teachers, administrators, and students on growth.
Develop, implement, and monitor a district-wide curriculum. Onboard new instructional support staff and continue the implementation of a student-centered instructional coaching model. Build programs that support equitable teaching and learning for all students. Continue to increase the quality of district professional learning. Develop assessment-capable teachers and students through clarity around learning targets.
Curriculum & Instruction - Org. # 875Budget Year 2021 - 2022
The main responsibility of the Curriculum, Instruction, & Assessment (C&I or CIA) department is to improve teaching and learning for students. C&I is charged with developing frameworks to outline the district's beliefs and practices regarding the creation of standards-aligned curriculum, the purpose and use of assessment, best instructional practices for delivery of daily instruction, and the key indicators for building collective efficacy through professional learning networks and coaching. The department provides continuous professional learning opportunities for both teachers, instructional support staff, and administrators aligned with research-based practices identified to support teacher and student needs.
294
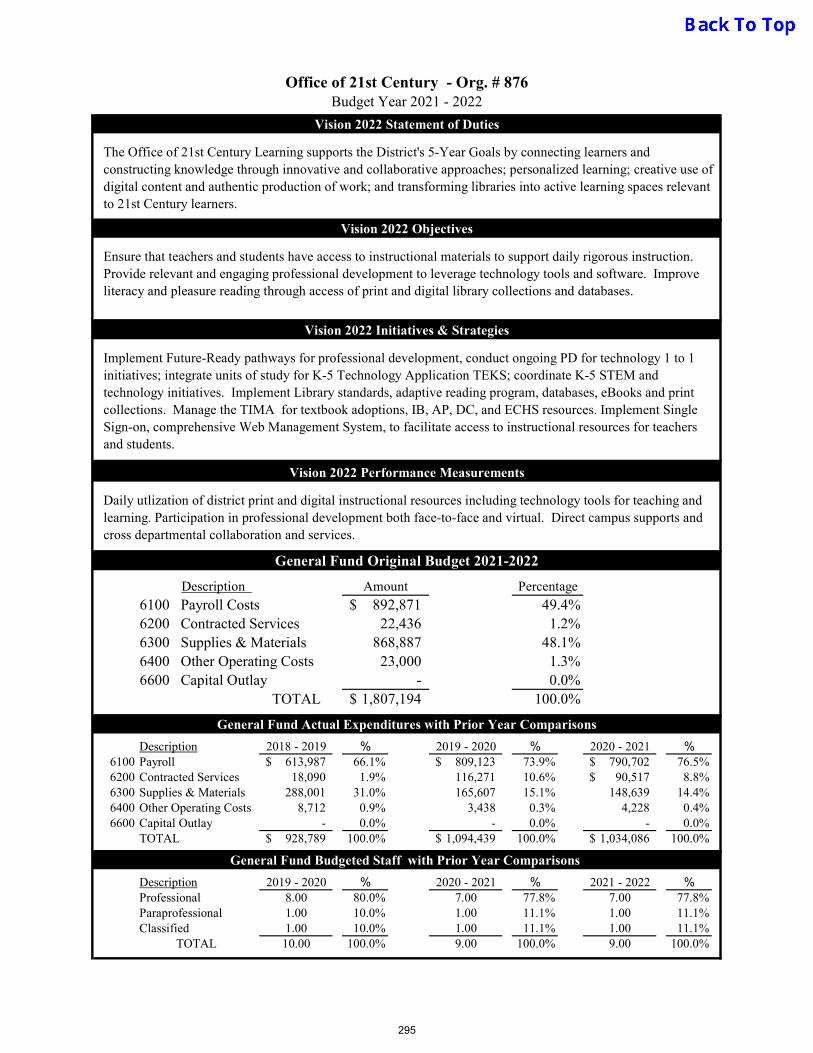
Vision 2022 Statement of Duties
Vision 2022 Objectives
Vision 2022 Initiatives & Strategies
Vision 2022 Performance Measurements
General Fund Original Budget 2021-2022
Description
6200 Contracted Services6300 Supplies & Materials6400 Other Operating Costs6600 Capital Outlay
TOTAL
General Fund Actual Expenditures with Prior Year Comparisons
Description 2018 - 2019 % 2019 - 2020 % 2020 - 2021 %6100 Payroll 613,987$ 66.1% 809,123$ 73.9% 790,702$ 76.5%6200 Contracted Services 18,090 1.9% 116,271 10.6% 90,517$ 8.8%6300 Supplies & Materials 288,001 31.0% 165,607 15.1% 148,639 14.4%6400 Other Operating Costs 8,712 0.9% 3,438 0.3% 4,228 0.4%6600 Capital Outlay - 0.0% - 0.0% - 0.0%
TOTAL 928,789$ 100.0% 1,094,439$ 100.0% 1,034,086$ 100.0%
General Fund Budgeted Staff with Prior Year Comparisons
Description 2019 - 2020 % 2020 - 2021 % 2021 - 2022 %Professional 8.00 80.0% 7.00 77.8% 7.00 77.8%Paraprofessional 1.00 10.0% 1.00 11.1% 1.00 11.1%Classified 1.00 10.0% 1.00 11.1% 1.00 11.1%
TOTAL 10.00 100.0% 9.00 100.0% 9.00 100.0%
Office of 21st Century - Org. # 876Budget Year 2021 - 2022
The Office of 21st Century Learning supports the District's 5-Year Goals by connecting learners and constructing knowledge through innovative and collaborative approaches; personalized learning; creative use of digital content and authentic production of work; and transforming libraries into active learning spaces relevant to 21st Century learners.
Ensure that teachers and students have access to instructional materials to support daily rigorous instruction. Provide relevant and engaging professional development to leverage technology tools and software. Improve literacy and pleasure reading through access of print and digital library collections and databases.
Implement Future-Ready pathways for professional development, conduct ongoing PD for technology 1 to 1 initiatives; integrate units of study for K-5 Technology Application TEKS; coordinate K-5 STEM and technology initiatives. Implement Library standards, adaptive reading program, databases, eBooks and print collections. Manage the TIMA for textbook adoptions, IB, AP, DC, and ECHS resources. Implement Single Sign-on, comprehensive Web Management System, to facilitate access to instructional resources for teachers and students.
Daily utlization of district print and digital instructional resources including technology tools for teaching and learning. Participation in professional development both face-to-face and virtual. Direct campus supports and cross departmental collaboration and services.
Amount Percentage
6100 Payroll Costs 892,871$ 49.4%22,436 1.2%
868,887 48.1%23,000 1.3%
- 0.0%1,807,194$ 100.0%
295
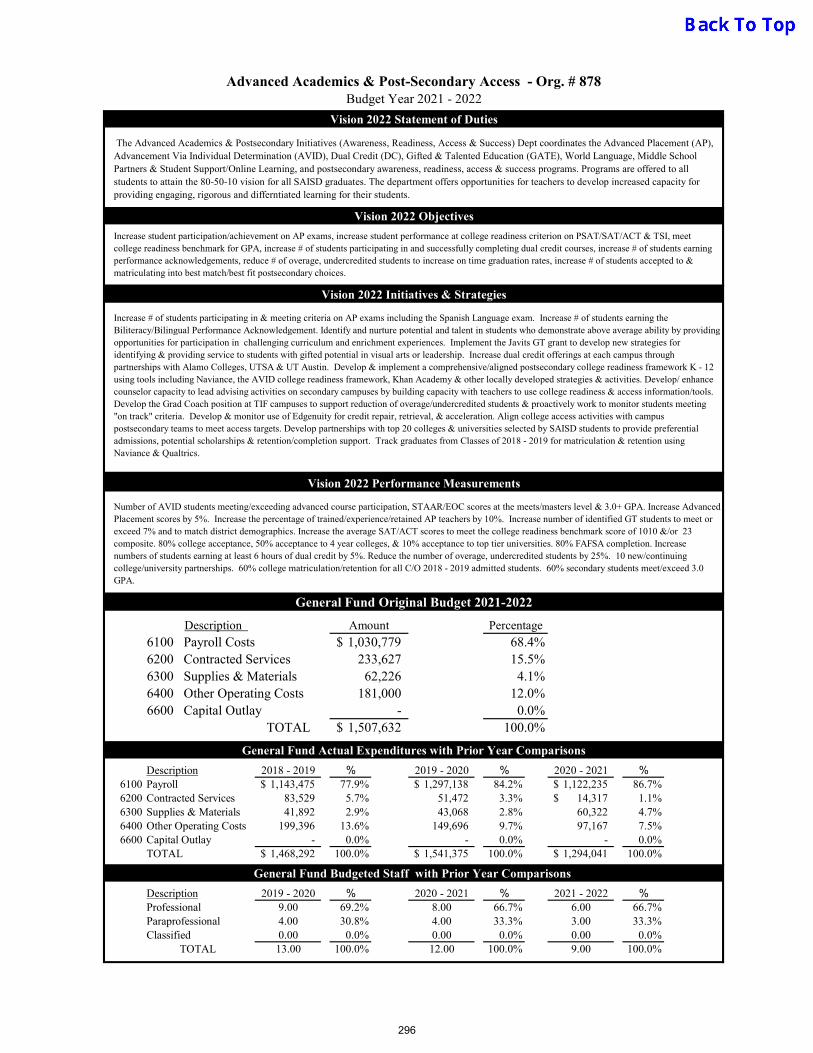
Vision 2022 Statement of Duties
Vision 2022 Objectives
Vision 2022 Initiatives & Strategies
Vision 2022 Performance Measurements
General Fund Original Budget 2021-2022
Description
6200 Contracted Services6300 Supplies & Materials6400 Other Operating Costs6600 Capital Outlay
TOTAL
General Fund Actual Expenditures with Prior Year Comparisons
Description 2018 - 2019 % 2019 - 2020 % 2020 - 2021 %6100 Payroll 1,143,475$ 77.9% 1,297,138$ 84.2% 1,122,235$ 86.7%6200 Contracted Services 83,529 5.7% 51,472 3.3% 14,317$ 1.1%6300 Supplies & Materials 41,892 2.9% 43,068 2.8% 60,322 4.7%6400 Other Operating Costs 199,396 13.6% 149,696 9.7% 97,167 7.5%6600 Capital Outlay - 0.0% - 0.0% - 0.0%
TOTAL 1,468,292$ 100.0% 1,541,375$ 100.0% 1,294,041$ 100.0%
General Fund Budgeted Staff with Prior Year Comparisons
Description 2019 - 2020 % 2020 - 2021 % 2021 - 2022 %Professional 9.00 69.2% 8.00 66.7% 6.00 66.7%Paraprofessional 4.00 30.8% 4.00 33.3% 3.00 33.3%Classified 0.00 0.0% 0.00 0.0% 0.00 0.0%
TOTAL 13.00 100.0% 12.00 100.0% 9.00 100.0%
- 0.0%1,507,632$ 100.0%
233,627 15.5%62,226 4.1%
181,000 12.0%
Number of AVID students meeting/exceeding advanced course participation, STAAR/EOC scores at the meets/masters level & 3.0+ GPA. Increase Advanced Placement scores by 5%. Increase the percentage of trained/experience/retained AP teachers by 10%. Increase number of identified GT students to meet or exceed 7% and to match district demographics. Increase the average SAT/ACT scores to meet the college readiness benchmark score of 1010 &/or 23 composite. 80% college acceptance, 50% acceptance to 4 year colleges, & 10% acceptance to top tier universities. 80% FAFSA completion. Increase numbers of students earning at least 6 hours of dual credit by 5%. Reduce the number of overage, undercredited students by 25%. 10 new/continuing college/university partnerships. 60% college matriculation/retention for all C/O 2018 - 2019 admitted students. 60% secondary students meet/exceed 3.0 GPA.
Amount Percentage
6100 Payroll Costs 1,030,779$ 68.4%
Increase student participation/achievement on AP exams, increase student performance at college readiness criterion on PSAT/SAT/ACT & TSI, meet college readiness benchmark for GPA, increase # of students participating in and successfully completing dual credit courses, increase # of students earning performance acknowledgements, reduce # of overage, undercredited students to increase on time graduation rates, increase # of students accepted to & matriculating into best match/best fit postsecondary choices.
Increase # of students participating in & meeting criteria on AP exams including the Spanish Language exam. Increase # of students earning the Biliteracy/Bilingual Performance Acknowledgement. Identify and nurture potential and talent in students who demonstrate above average ability by providing opportunities for participation in challenging curriculum and enrichment experiences. Implement the Javits GT grant to develop new strategies for identifying & providing service to students with gifted potential in visual arts or leadership. Increase dual credit offerings at each campus through partnerships with Alamo Colleges, UTSA & UT Austin. Develop & implement a comprehensive/aligned postsecondary college readiness framework K - 12 using tools including Naviance, the AVID college readiness framework, Khan Academy & other locally developed strategies & activities. Develop/ enhance counselor capacity to lead advising activities on secondary campuses by building capacity with teachers to use college readiness & access information/tools. Develop the Grad Coach position at TIF campuses to support reduction of overage/undercredited students & proactively work to monitor students meeting "on track" criteria. Develop & monitor use of Edgenuity for credit repair, retrieval, & acceleration. Align college access activities with campus postsecondary teams to meet access targets. Develop partnerships with top 20 colleges & universities selected by SAISD students to provide preferential admissions, potential scholarships & retention/completion support. Track graduates from Classes of 2018 - 2019 for matriculation & retention using Naviance & Qualtrics.
Advanced Academics & Post-Secondary Access - Org. # 878Budget Year 2021 - 2022
The Advanced Academics & Postsecondary Initiatives (Awareness, Readiness, Access & Success) Dept coordinates the Advanced Placement (AP), Advancement Via Individual Determination (AVID), Dual Credit (DC), Gifted & Talented Education (GATE), World Language, Middle School Partners & Student Support/Online Learning, and postsecondary awareness, readiness, access & success programs. Programs are offered to all students to attain the 80-50-10 vision for all SAISD graduates. The department offers opportunities for teachers to develop increased capacity for providing engaging, rigorous and differntiated learning for their students.
296
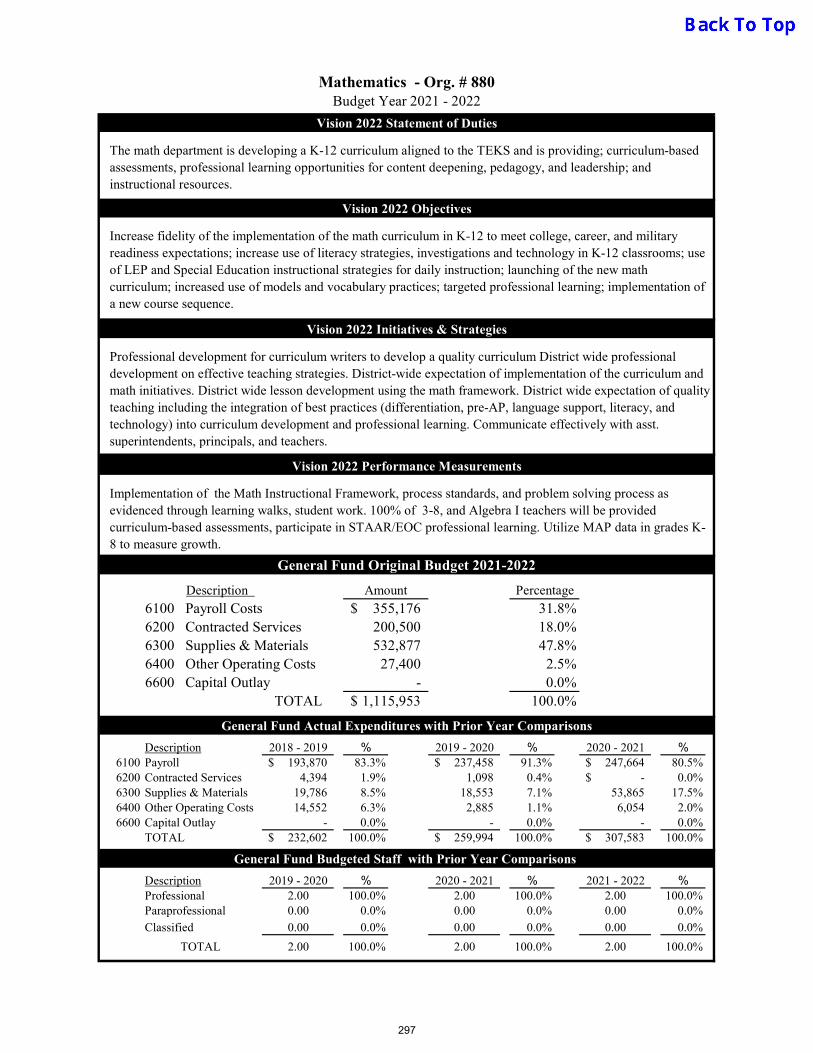
Vision 2022 Statement of Duties
Vision 2022 Objectives
Vision 2022 Initiatives & Strategies
Vision 2022 Performance Measurements
General Fund Original Budget 2021-2022
Description
6200 Contracted Services6300 Supplies & Materials6400 Other Operating Costs6600 Capital Outlay
TOTAL
General Fund Actual Expenditures with Prior Year Comparisons
Description 2018 - 2019 % 2019 - 2020 % 2020 - 2021 %6100 Payroll 193,870$ 83.3% 237,458$ 91.3% 247,664$ 80.5%6200 Contracted Services 4,394 1.9% 1,098 0.4% -$ 0.0%6300 Supplies & Materials 19,786 8.5% 18,553 7.1% 53,865 17.5%6400 Other Operating Costs 14,552 6.3% 2,885 1.1% 6,054 2.0%6600 Capital Outlay - 0.0% - 0.0% - 0.0%
TOTAL 232,602$ 100.0% 259,994$ 100.0% 307,583$ 100.0%
General Fund Budgeted Staff with Prior Year Comparisons
Description 2019 - 2020 % 2020 - 2021 % 2021 - 2022 %Professional 2.00 100.0% 2.00 100.0% 2.00 100.0%Paraprofessional 0.00 0.0% 0.00 0.0% 0.00 0.0%
Classified 0.00 0.0% 0.00 0.0% 0.00 0.0%
TOTAL 2.00 100.0% 2.00 100.0% 2.00 100.0%
- 0.0%1,115,953$ 100.0%
200,500 18.0%532,877 47.8%
27,400 2.5%
Implementation of the Math Instructional Framework, process standards, and problem solving process as evidenced through learning walks, student work. 100% of 3-8, and Algebra I teachers will be provided curriculum-based assessments, participate in STAAR/EOC professional learning. Utilize MAP data in grades K-8 to measure growth.
Amount Percentage
6100 Payroll Costs 355,176$ 31.8%
Increase fidelity of the implementation of the math curriculum in K-12 to meet college, career, and military readiness expectations; increase use of literacy strategies, investigations and technology in K-12 classrooms; use of LEP and Special Education instructional strategies for daily instruction; launching of the new math curriculum; increased use of models and vocabulary practices; targeted professional learning; implementation of a new course sequence.
Professional development for curriculum writers to develop a quality curriculum District wide professional development on effective teaching strategies. District-wide expectation of implementation of the curriculum and math initiatives. District wide lesson development using the math framework. District wide expectation of quality teaching including the integration of best practices (differentiation, pre-AP, language support, literacy, and technology) into curriculum development and professional learning. Communicate effectively with asst. superintendents, principals, and teachers.
Mathematics - Org. # 880Budget Year 2021 - 2022
The math department is developing a K-12 curriculum aligned to the TEKS and is providing; curriculum-based assessments, professional learning opportunities for content deepening, pedagogy, and leadership; and instructional resources.
297
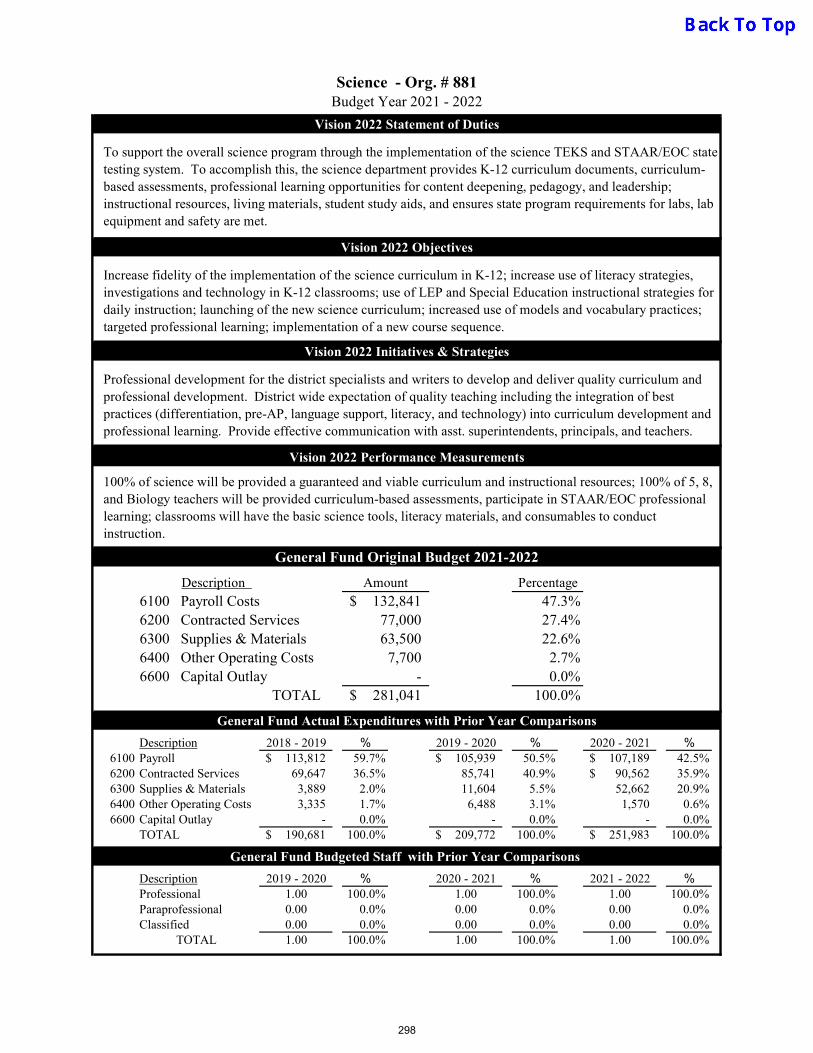
Vision 2022 Statement of Duties
Vision 2022 Objectives
Vision 2022 Initiatives & Strategies
Vision 2022 Performance Measurements
General Fund Original Budget 2021-2022
Description
6200 Contracted Services6300 Supplies & Materials6400 Other Operating Costs6600 Capital Outlay
TOTAL
General Fund Actual Expenditures with Prior Year Comparisons
Description 2018 - 2019 % 2019 - 2020 % 2020 - 2021 %6100 Payroll 113,812$ 59.7% 105,939$ 50.5% 107,189$ 42.5%6200 Contracted Services 69,647 36.5% 85,741 40.9% 90,562$ 35.9%6300 Supplies & Materials 3,889 2.0% 11,604 5.5% 52,662 20.9%6400 Other Operating Costs 3,335 1.7% 6,488 3.1% 1,570 0.6%6600 Capital Outlay - 0.0% - 0.0% - 0.0%
TOTAL 190,681$ 100.0% 209,772$ 100.0% 251,983$ 100.0%
General Fund Budgeted Staff with Prior Year Comparisons
Description 2019 - 2020 % 2020 - 2021 % 2021 - 2022 %Professional 1.00 100.0% 1.00 100.0% 1.00 100.0%Paraprofessional 0.00 0.0% 0.00 0.0% 0.00 0.0%Classified 0.00 0.0% 0.00 0.0% 0.00 0.0%
TOTAL 1.00 100.0% 1.00 100.0% 1.00 100.0%
- 0.0%281,041$ 100.0%
77,000 27.4%63,500 22.6%
7,700 2.7%
100% of science will be provided a guaranteed and viable curriculum and instructional resources; 100% of 5, 8, and Biology teachers will be provided curriculum-based assessments, participate in STAAR/EOC professional learning; classrooms will have the basic science tools, literacy materials, and consumables to conduct instruction.
Amount Percentage
6100 Payroll Costs 132,841$ 47.3%
Increase fidelity of the implementation of the science curriculum in K-12; increase use of literacy strategies, investigations and technology in K-12 classrooms; use of LEP and Special Education instructional strategies for daily instruction; launching of the new science curriculum; increased use of models and vocabulary practices; targeted professional learning; implementation of a new course sequence.
Professional development for the district specialists and writers to develop and deliver quality curriculum and professional development. District wide expectation of quality teaching including the integration of best practices (differentiation, pre-AP, language support, literacy, and technology) into curriculum development and professional learning. Provide effective communication with asst. superintendents, principals, and teachers.
Science - Org. # 881Budget Year 2021 - 2022
To support the overall science program through the implementation of the science TEKS and STAAR/EOC state testing system. To accomplish this, the science department provides K-12 curriculum documents, curriculum-based assessments, professional learning opportunities for content deepening, pedagogy, and leadership; instructional resources, living materials, student study aids, and ensures state program requirements for labs, lab equipment and safety are met.
298
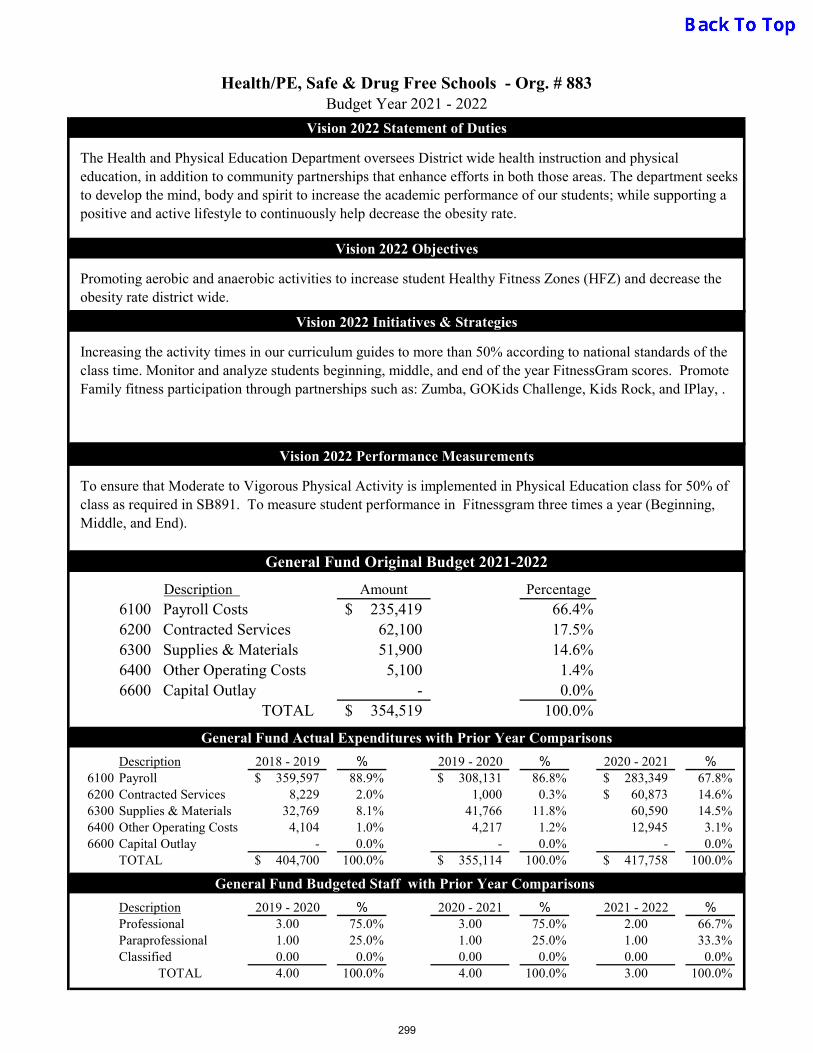
Vision 2022 Statement of Duties
Vision 2022 Objectives
Vision 2022 Initiatives & Strategies
Vision 2022 Performance Measurements
General Fund Original Budget 2021-2022
Description
6200 Contracted Services6300 Supplies & Materials6400 Other Operating Costs6600 Capital Outlay
TOTAL
General Fund Actual Expenditures with Prior Year Comparisons
Description 2018 - 2019 % 2019 - 2020 % 2020 - 2021 %6100 Payroll 359,597$ 88.9% 308,131$ 86.8% 283,349$ 67.8%6200 Contracted Services 8,229 2.0% 1,000 0.3% 60,873$ 14.6%6300 Supplies & Materials 32,769 8.1% 41,766 11.8% 60,590 14.5%6400 Other Operating Costs 4,104 1.0% 4,217 1.2% 12,945 3.1%6600 Capital Outlay - 0.0% - 0.0% - 0.0%
TOTAL 404,700$ 100.0% 355,114$ 100.0% 417,758$ 100.0%
General Fund Budgeted Staff with Prior Year Comparisons
Description 2019 - 2020 % 2020 - 2021 % 2021 - 2022 %Professional 3.00 75.0% 3.00 75.0% 2.00 66.7%Paraprofessional 1.00 25.0% 1.00 25.0% 1.00 33.3%Classified 0.00 0.0% 0.00 0.0% 0.00 0.0%
TOTAL 4.00 100.0% 4.00 100.0% 3.00 100.0%
- 0.0%354,519$ 100.0%
62,100 17.5%51,900 14.6%
5,100 1.4%
To ensure that Moderate to Vigorous Physical Activity is implemented in Physical Education class for 50% of class as required in SB891. To measure student performance in Fitnessgram three times a year (Beginning, Middle, and End).
Amount Percentage6100 Payroll Costs 235,419$ 66.4%
Promoting aerobic and anaerobic activities to increase student Healthy Fitness Zones (HFZ) and decrease the obesity rate district wide.
Increasing the activity times in our curriculum guides to more than 50% according to national standards of the class time. Monitor and analyze students beginning, middle, and end of the year FitnessGram scores. Promote Family fitness participation through partnerships such as: Zumba, GOKids Challenge, Kids Rock, and IPlay, .
Health/PE, Safe & Drug Free Schools - Org. # 883Budget Year 2021 - 2022
The Health and Physical Education Department oversees District wide health instruction and physical education, in addition to community partnerships that enhance efforts in both those areas. The department seeks to develop the mind, body and spirit to increase the academic performance of our students; while supporting a positive and active lifestyle to continuously help decrease the obesity rate.
299
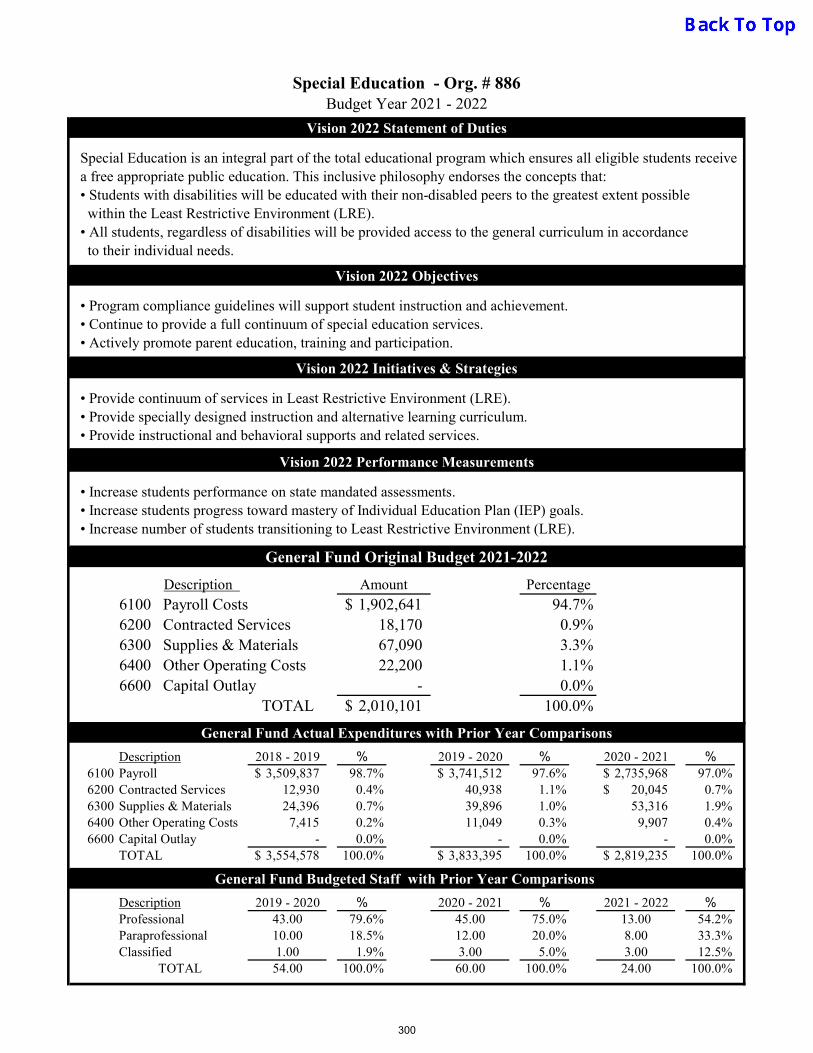
Vision 2022 Statement of Duties
Vision 2022 Objectives
Vision 2022 Initiatives & Strategies
Vision 2022 Performance Measurements
General Fund Original Budget 2021-2022
Description
6200 Contracted Services6300 Supplies & Materials6400 Other Operating Costs6600 Capital Outlay
TOTAL
General Fund Actual Expenditures with Prior Year Comparisons
Description 2018 - 2019 % 2019 - 2020 % 2020 - 2021 %6100 Payroll 3,509,837$ 98.7% 3,741,512$ 97.6% 2,735,968$ 97.0%6200 Contracted Services 12,930 0.4% 40,938 1.1% 20,045$ 0.7%6300 Supplies & Materials 24,396 0.7% 39,896 1.0% 53,316 1.9%6400 Other Operating Costs 7,415 0.2% 11,049 0.3% 9,907 0.4%6600 Capital Outlay - 0.0% - 0.0% - 0.0%
TOTAL 3,554,578$ 100.0% 3,833,395$ 100.0% 2,819,235$ 100.0%
General Fund Budgeted Staff with Prior Year Comparisons
Description 2019 - 2020 % 2020 - 2021 % 2021 - 2022 %Professional 43.00 79.6% 45.00 75.0% 13.00 54.2%Paraprofessional 10.00 18.5% 12.00 20.0% 8.00 33.3%Classified 1.00 1.9% 3.00 5.0% 3.00 12.5%
TOTAL 54.00 100.0% 60.00 100.0% 24.00 100.0%
- 0.0%2,010,101$ 100.0%
18,170 0.9%67,090 3.3%22,200 1.1%
• Increase students performance on state mandated assessments.• Increase students progress toward mastery of Individual Education Plan (IEP) goals.• Increase number of students transitioning to Least Restrictive Environment (LRE).
Amount Percentage6100 Payroll Costs 1,902,641$ 94.7%
• Program compliance guidelines will support student instruction and achievement.• Continue to provide a full continuum of special education services.• Actively promote parent education, training and participation.
• Provide continuum of services in Least Restrictive Environment (LRE).• Provide specially designed instruction and alternative learning curriculum.• Provide instructional and behavioral supports and related services.
Special Education - Org. # 886Budget Year 2021 - 2022
Special Education is an integral part of the total educational program which ensures all eligible students receive a free appropriate public education. This inclusive philosophy endorses the concepts that: • Students with disabilities will be educated with their non-disabled peers to the greatest extent possible within the Least Restrictive Environment (LRE).• All students, regardless of disabilities will be provided access to the general curriculum in accordance to their individual needs.
300

Vision 2022 Statement of Duties
Vision 2022 Objectives
Vision 2022 Initiatives & Strategies
Vision 2022 Performance Measurements
General Fund Original Budget 2021-2022
Description
6200 Contracted Services6300 Supplies & Materials6400 Other Operating Costs6600 Capital Outlay
TOTAL
General Fund Actual Expenditures with Prior Year Comparisons
Description 2018 - 2019 % 2019 - 2020 % 2020 - 2021 %6100 Payroll 425,919$ 81.6% 280,652$ 85.8% 353,426$ 91.3%6200 Contracted Services 27,309 5.2% 18,712 5.7% 16,341$ 4.2%6300 Supplies & Materials 22,124 4.2% 10,641 3.3% 12,961 3.3%6400 Other Operating Costs 46,617 8.9% 17,240 5.3% 4,579 1.2%6600 Capital Outlay - 0.0% - 0.0% - 0.0%
TOTAL 521,969$ 100.0% 327,245$ 100.0% 387,307$ 100.0%
General Fund Budgeted Staff with Prior Year Comparisons
Description 2019 - 2020 % 2020 - 2021 % 2021 - 2022 %Professional 3.00 60.0% 3.00 60.0% 3.00 60.0%Paraprofessional 2.00 40.0% 2.00 40.0% 2.00 40.0%Classified 0.00 0.0% 0.00 0.0% 0.00 0.0%
TOTAL 5.00 100.0% 5.00 100.0% 5.00 100.0%
- 0.0%523,199$ 100.0%
72,750 13.9%15,480 3.0%63,500 12.1%
Intended outcomes include but not limited to: increase high school graduation rate, reduce the dropout rate, improve school attendance, provide parenting and child development classes and provide materials to increase coping skills with the on-going relationship issues faced by school-aged parents to include reducing the incidence of repeat births.
Amount Percentage6100 Payroll Costs 371,469$ 71.0%
Deploy district social workers to provide necessary services and follow up to ensure students are provided every opportunity to stay in school. To provide childcare services to school age parents in the district and ensure staff are provided with professional staff development to provide the best services.
Provide necessary staff to achieve goals and objectives, work with community agencies to support our teen pregnant and parenting population, provide flexible scheduling to meet student needs, and maintain the highest standards for on-site childcare services.
School Age Parenting Program - Org. # 888Budget Year 2021 - 2022
The School Age Parenting Program offers integrated programs of educational and support services designed to improve school attendance, reduce dropouts, increase high school graduation rates, and enhance parenting skills for students who are pregnant or parents (male or female) and at risk of dropping out of school.
301
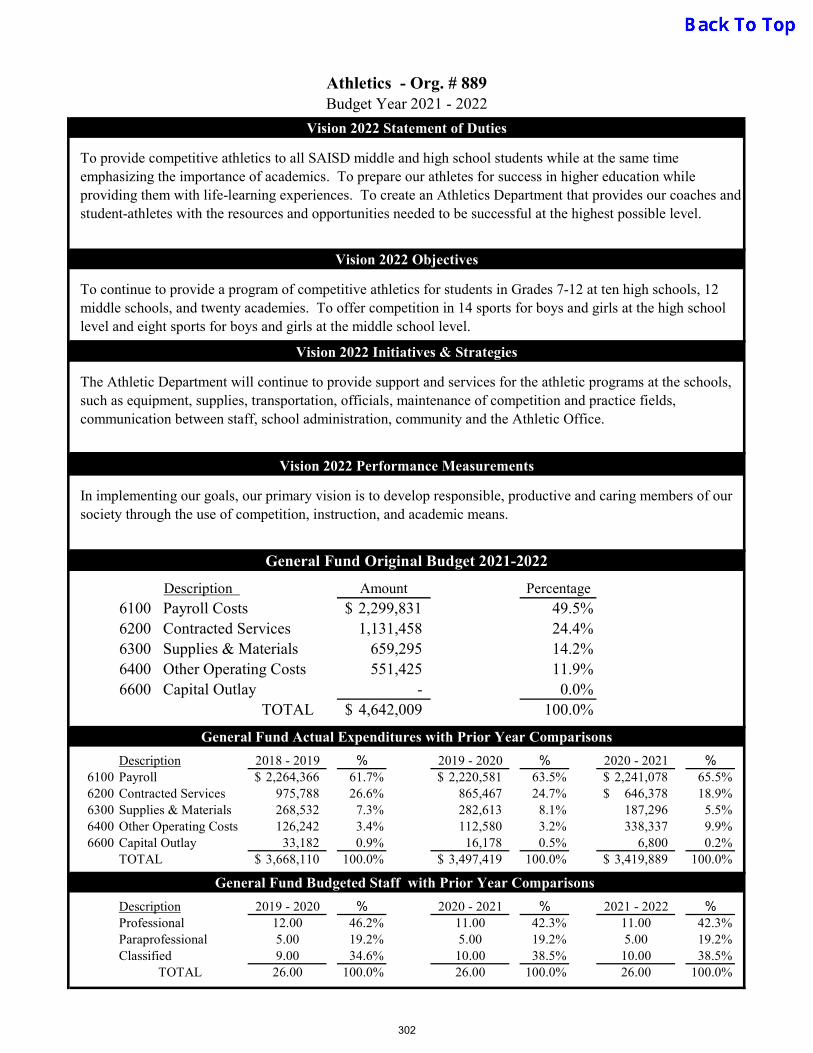
Vision 2022 Statement of Duties
Vision 2022 Objectives
Vision 2022 Initiatives & Strategies
Vision 2022 Performance Measurements
General Fund Original Budget 2021-2022
Description
6200 Contracted Services6300 Supplies & Materials6400 Other Operating Costs6600 Capital Outlay
TOTAL
General Fund Actual Expenditures with Prior Year Comparisons
Description 2018 - 2019 % 2019 - 2020 % 2020 - 2021 %6100 Payroll 2,264,366$ 61.7% 2,220,581$ 63.5% 2,241,078$ 65.5%6200 Contracted Services 975,788 26.6% 865,467 24.7% 646,378$ 18.9%6300 Supplies & Materials 268,532 7.3% 282,613 8.1% 187,296 5.5%6400 Other Operating Costs 126,242 3.4% 112,580 3.2% 338,337 9.9%6600 Capital Outlay 33,182 0.9% 16,178 0.5% 6,800 0.2%
TOTAL 3,668,110$ 100.0% 3,497,419$ 100.0% 3,419,889$ 100.0%
General Fund Budgeted Staff with Prior Year Comparisons
Description 2019 - 2020 % 2020 - 2021 % 2021 - 2022 %Professional 12.00 46.2% 11.00 42.3% 11.00 42.3%Paraprofessional 5.00 19.2% 5.00 19.2% 5.00 19.2%Classified 9.00 34.6% 10.00 38.5% 10.00 38.5%
TOTAL 26.00 100.0% 26.00 100.0% 26.00 100.0%
- 0.0%4,642,009$ 100.0%
1,131,458 24.4%659,295 14.2%551,425 11.9%
In implementing our goals, our primary vision is to develop responsible, productive and caring members of our society through the use of competition, instruction, and academic means.
Amount Percentage6100 Payroll Costs 2,299,831$ 49.5%
To continue to provide a program of competitive athletics for students in Grades 7-12 at ten high schools, 12 middle schools, and twenty academies. To offer competition in 14 sports for boys and girls at the high school level and eight sports for boys and girls at the middle school level.
The Athletic Department will continue to provide support and services for the athletic programs at the schools, such as equipment, supplies, transportation, officials, maintenance of competition and practice fields, communication between staff, school administration, community and the Athletic Office.
Athletics - Org. # 889Budget Year 2021 - 2022
To provide competitive athletics to all SAISD middle and high school students while at the same time emphasizing the importance of academics. To prepare our athletes for success in higher education while providing them with life-learning experiences. To create an Athletics Department that provides our coaches and student-athletes with the resources and opportunities needed to be successful at the highest possible level.
302
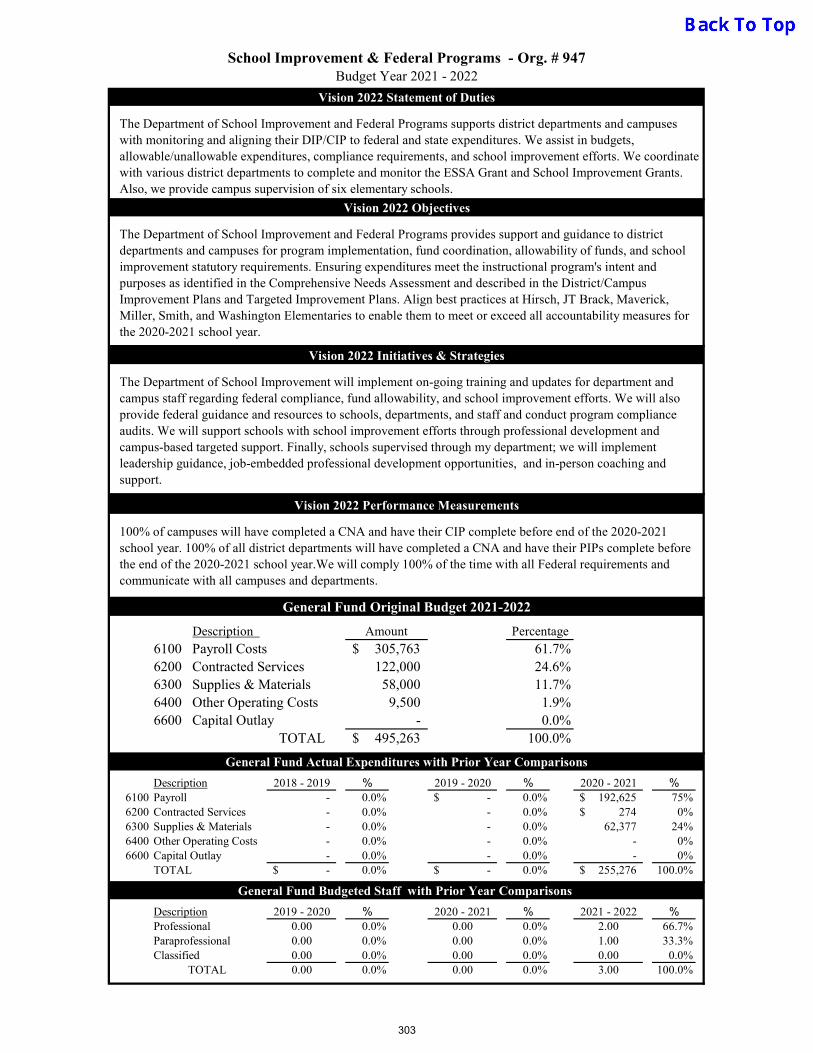
Vision 2022 Statement of Duties
Vision 2022 Objectives
Vision 2022 Initiatives & Strategies
Vision 2022 Performance Measurements
General Fund Original Budget 2021-2022
Description
6200 Contracted Services6300 Supplies & Materials6400 Other Operating Costs6600 Capital Outlay
TOTAL
General Fund Actual Expenditures with Prior Year Comparisons
Description 2018 - 2019 % 2019 - 2020 % 2020 - 2021 %6100 Payroll - 0.0% -$ 0.0% 192,625$ 75%6200 Contracted Services - 0.0% - 0.0% 274$ 0%6300 Supplies & Materials - 0.0% - 0.0% 62,377 24%6400 Other Operating Costs - 0.0% - 0.0% - 0%6600 Capital Outlay - 0.0% - 0.0% - 0%
TOTAL -$ 0.0% -$ 0.0% 255,276$ 100.0%
General Fund Budgeted Staff with Prior Year Comparisons
Description 2019 - 2020 % 2020 - 2021 % 2021 - 2022 %Professional 0.00 0.0% 0.00 0.0% 2.00 66.7%Paraprofessional 0.00 0.0% 0.00 0.0% 1.00 33.3%Classified 0.00 0.0% 0.00 0.0% 0.00 0.0%
TOTAL 0.00 0.0% 0.00 0.0% 3.00 100.0%
- 0.0%495,263$ 100.0%
122,000 24.6%58,000 11.7%
9,500 1.9%
Amount Percentage
6100 Payroll Costs 305,763$ 61.7%
100% of campuses will have completed a CNA and have their CIP complete before end of the 2020-2021 school year. 100% of all district departments will have completed a CNA and have their PIPs complete before the end of the 2020-2021 school year.We will comply 100% of the time with all Federal requirements and communicate with all campuses and departments.
The Department of School Improvement and Federal Programs provides support and guidance to district departments and campuses for program implementation, fund coordination, allowability of funds, and school improvement statutory requirements. Ensuring expenditures meet the instructional program's intent and purposes as identified in the Comprehensive Needs Assessment and described in the District/Campus Improvement Plans and Targeted Improvement Plans. Align best practices at Hirsch, JT Brack, Maverick, Miller, Smith, and Washington Elementaries to enable them to meet or exceed all accountability measures for the 2020-2021 school year.
The Department of School Improvement will implement on-going training and updates for department and campus staff regarding federal compliance, fund allowability, and school improvement efforts. We will also provide federal guidance and resources to schools, departments, and staff and conduct program compliance audits. We will support schools with school improvement efforts through professional development and campus-based targeted support. Finally, schools supervised through my department; we will implement leadership guidance, job-embedded professional development opportunities, and in-person coaching and support.
School Improvement & Federal Programs - Org. # 947Budget Year 2021 - 2022
The Department of School Improvement and Federal Programs supports district departments and campuses with monitoring and aligning their DIP/CIP to federal and state expenditures. We assist in budgets, allowable/unallowable expenditures, compliance requirements, and school improvement efforts. We coordinate with various district departments to complete and monitor the ESSA Grant and School Improvement Grants. Also, we provide campus supervision of six elementary schools.
303
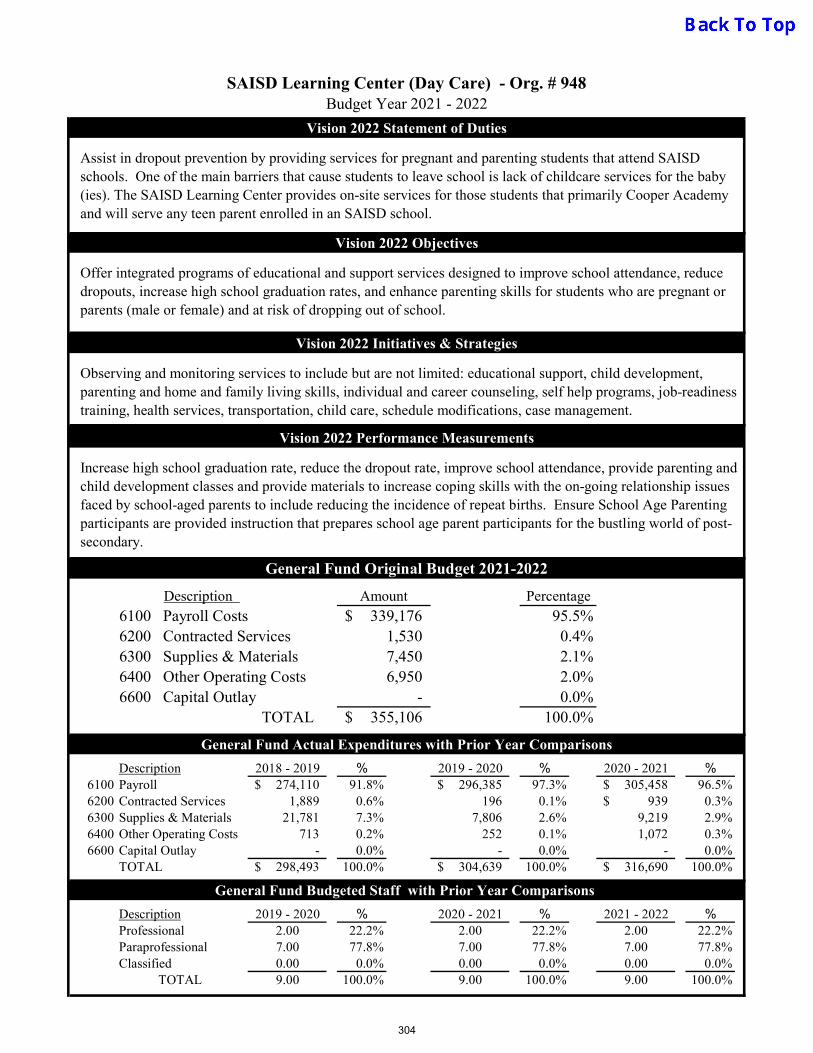
Vision 2022 Statement of Duties
Vision 2022 Objectives
Vision 2022 Initiatives & Strategies
Vision 2022 Performance Measurements
General Fund Original Budget 2021-2022
Description
6200 Contracted Services6300 Supplies & Materials6400 Other Operating Costs6600 Capital Outlay
TOTAL
General Fund Actual Expenditures with Prior Year Comparisons
Description 2018 - 2019 % 2019 - 2020 % 2020 - 2021 %6100 Payroll 274,110$ 91.8% 296,385$ 97.3% 305,458$ 96.5%6200 Contracted Services 1,889 0.6% 196 0.1% 939$ 0.3%6300 Supplies & Materials 21,781 7.3% 7,806 2.6% 9,219 2.9%6400 Other Operating Costs 713 0.2% 252 0.1% 1,072 0.3%6600 Capital Outlay - 0.0% - 0.0% - 0.0%
TOTAL 298,493$ 100.0% 304,639$ 100.0% 316,690$ 100.0%
General Fund Budgeted Staff with Prior Year Comparisons
Description 2019 - 2020 % 2020 - 2021 % 2021 - 2022 %Professional 2.00 22.2% 2.00 22.2% 2.00 22.2%Paraprofessional 7.00 77.8% 7.00 77.8% 7.00 77.8%Classified 0.00 0.0% 0.00 0.0% 0.00 0.0%
TOTAL 9.00 100.0% 9.00 100.0% 9.00 100.0%
- 0.0%355,106$ 100.0%
1,530 0.4%7,450 2.1%6,950 2.0%
Increase high school graduation rate, reduce the dropout rate, improve school attendance, provide parenting and child development classes and provide materials to increase coping skills with the on-going relationship issues faced by school-aged parents to include reducing the incidence of repeat births. Ensure School Age Parenting participants are provided instruction that prepares school age parent participants for the bustling world of post-secondary.
Amount Percentage6100 Payroll Costs 339,176$ 95.5%
Offer integrated programs of educational and support services designed to improve school attendance, reduce dropouts, increase high school graduation rates, and enhance parenting skills for students who are pregnant or parents (male or female) and at risk of dropping out of school.
Observing and monitoring services to include but are not limited: educational support, child development, parenting and home and family living skills, individual and career counseling, self help programs, job-readiness training, health services, transportation, child care, schedule modifications, case management.
SAISD Learning Center (Day Care) - Org. # 948Budget Year 2021 - 2022
Assist in dropout prevention by providing services for pregnant and parenting students that attend SAISD schools. One of the main barriers that cause students to leave school is lack of childcare services for the baby (ies). The SAISD Learning Center provides on-site services for those students that primarily Cooper Academy and will serve any teen parent enrolled in an SAISD school.
304
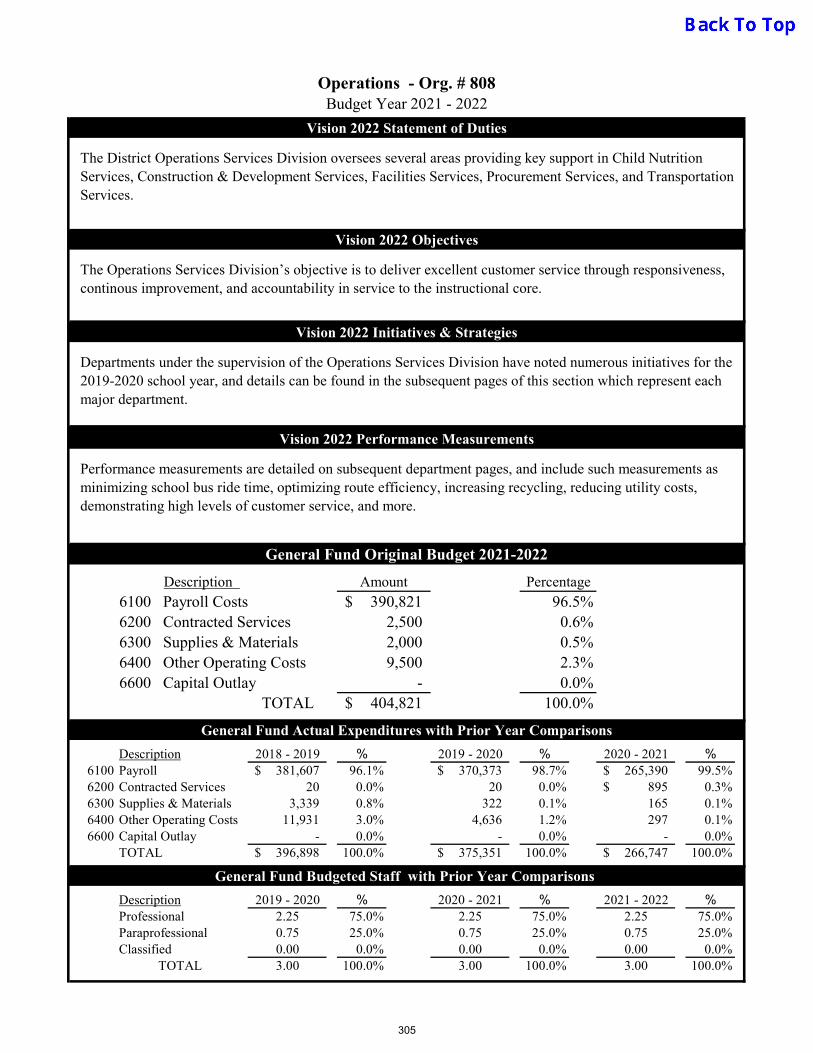
Vision 2022 Statement of Duties
Vision 2022 Objectives
Vision 2022 Initiatives & Strategies
Vision 2022 Performance Measurements
General Fund Original Budget 2021-2022
Description
6200 Contracted Services6300 Supplies & Materials6400 Other Operating Costs6600 Capital Outlay
TOTAL
General Fund Actual Expenditures with Prior Year Comparisons
Description 2018 - 2019 % 2019 - 2020 % 2020 - 2021 %6100 Payroll 381,607$ 96.1% 370,373$ 98.7% 265,390$ 99.5%6200 Contracted Services 20 0.0% 20 0.0% 895$ 0.3%6300 Supplies & Materials 3,339 0.8% 322 0.1% 165 0.1%6400 Other Operating Costs 11,931 3.0% 4,636 1.2% 297 0.1%6600 Capital Outlay - 0.0% - 0.0% - 0.0%
TOTAL 396,898$ 100.0% 375,351$ 100.0% 266,747$ 100.0%
General Fund Budgeted Staff with Prior Year Comparisons
Description 2019 - 2020 % 2020 - 2021 % 2021 - 2022 %Professional 2.25 75.0% 2.25 75.0% 2.25 75.0%Paraprofessional 0.75 25.0% 0.75 25.0% 0.75 25.0%Classified 0.00 0.0% 0.00 0.0% 0.00 0.0%
TOTAL 3.00 100.0% 3.00 100.0% 3.00 100.0%
- 0.0%404,821$ 100.0%
2,500 0.6%2,000 0.5%9,500 2.3%
Performance measurements are detailed on subsequent department pages, and include such measurements as minimizing school bus ride time, optimizing route efficiency, increasing recycling, reducing utility costs, demonstrating high levels of customer service, and more.
Amount Percentage6100 Payroll Costs 390,821$ 96.5%
The Operations Services Division’s objective is to deliver excellent customer service through responsiveness, continous improvement, and accountability in service to the instructional core.
Departments under the supervision of the Operations Services Division have noted numerous initiatives for the 2019-2020 school year, and details can be found in the subsequent pages of this section which represent each major department.
Operations - Org. # 808Budget Year 2021 - 2022
The District Operations Services Division oversees several areas providing key support in Child Nutrition Services, Construction & Development Services, Facilities Services, Procurement Services, and Transportation Services.
305
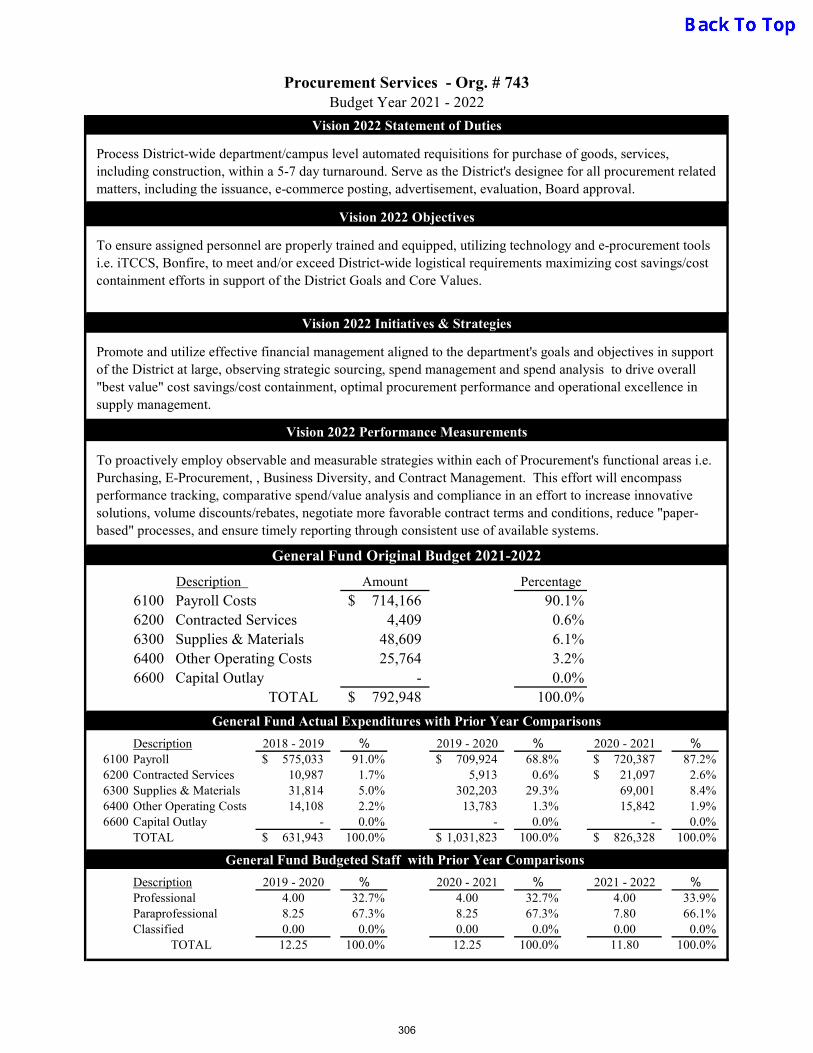
Vision 2022 Statement of Duties
Vision 2022 Objectives
Vision 2022 Initiatives & Strategies
Vision 2022 Performance Measurements
General Fund Original Budget 2021-2022
Description
6200 Contracted Services6300 Supplies & Materials6400 Other Operating Costs6600 Capital Outlay
TOTAL
General Fund Actual Expenditures with Prior Year Comparisons
Description 2018 - 2019 % 2019 - 2020 % 2020 - 2021 %6100 Payroll 575,033$ 91.0% 709,924$ 68.8% 720,387$ 87.2%6200 Contracted Services 10,987 1.7% 5,913 0.6% 21,097$ 2.6%6300 Supplies & Materials 31,814 5.0% 302,203 29.3% 69,001 8.4%6400 Other Operating Costs 14,108 2.2% 13,783 1.3% 15,842 1.9%6600 Capital Outlay - 0.0% - 0.0% - 0.0%
TOTAL 631,943$ 100.0% 1,031,823$ 100.0% 826,328$ 100.0%
General Fund Budgeted Staff with Prior Year Comparisons
Description 2019 - 2020 % 2020 - 2021 % 2021 - 2022 %Professional 4.00 32.7% 4.00 32.7% 4.00 33.9%Paraprofessional 8.25 67.3% 8.25 67.3% 7.80 66.1%Classified 0.00 0.0% 0.00 0.0% 0.00 0.0%
TOTAL 12.25 100.0% 12.25 100.0% 11.80 100.0%
- 0.0%792,948$ 100.0%
4,409 0.6%48,609 6.1%25,764 3.2%
To proactively employ observable and measurable strategies within each of Procurement's functional areas i.e. Purchasing, E-Procurement, , Business Diversity, and Contract Management. This effort will encompass performance tracking, comparative spend/value analysis and compliance in an effort to increase innovative solutions, volume discounts/rebates, negotiate more favorable contract terms and conditions, reduce "paper-based" processes, and ensure timely reporting through consistent use of available systems.
Amount Percentage
6100 Payroll Costs 714,166$ 90.1%
To ensure assigned personnel are properly trained and equipped, utilizing technology and e-procurement tools i.e. iTCCS, Bonfire, to meet and/or exceed District-wide logistical requirements maximizing cost savings/cost containment efforts in support of the District Goals and Core Values.
Promote and utilize effective financial management aligned to the department's goals and objectives in support of the District at large, observing strategic sourcing, spend management and spend analysis to drive overall "best value" cost savings/cost containment, optimal procurement performance and operational excellence in supply management.
Procurement Services - Org. # 743Budget Year 2021 - 2022
Process District-wide department/campus level automated requisitions for purchase of goods, services, including construction, within a 5-7 day turnaround. Serve as the District's designee for all procurement related matters, including the issuance, e-commerce posting, advertisement, evaluation, Board approval.
306
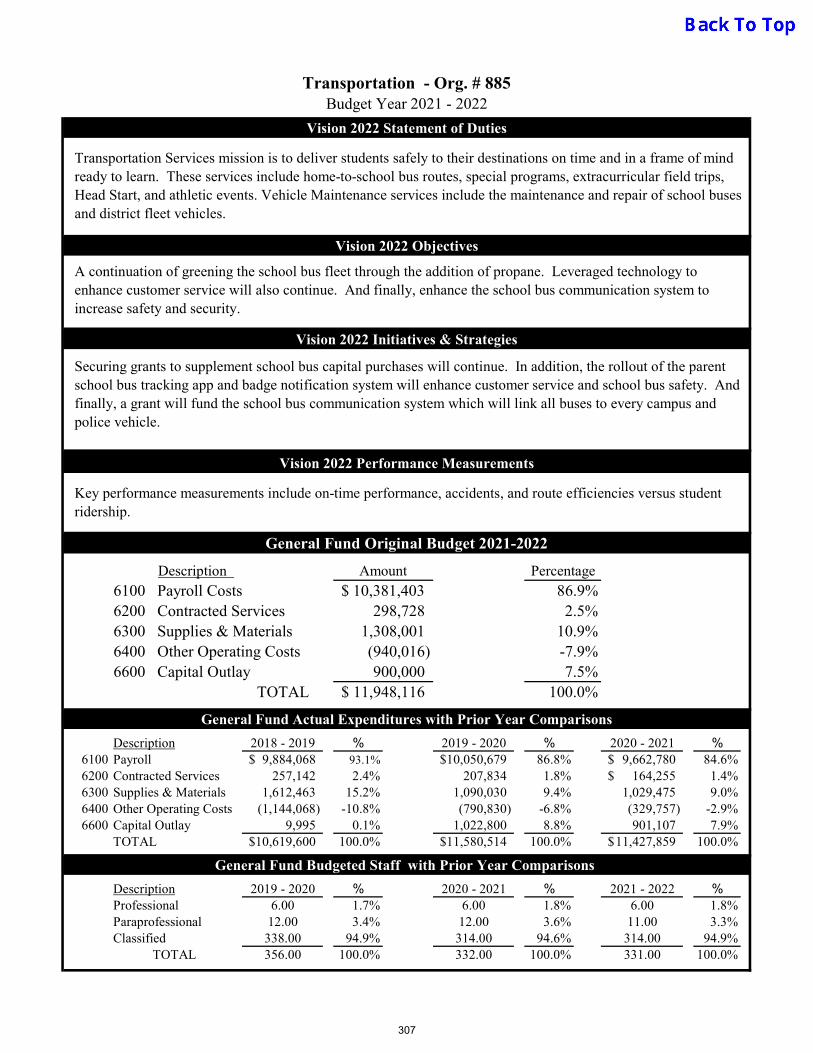
Vision 2022 Statement of Duties
Vision 2022 Objectives
Vision 2022 Initiatives & Strategies
Vision 2022 Performance Measurements
General Fund Original Budget 2021-2022
Description
6200 Contracted Services6300 Supplies & Materials6400 Other Operating Costs6600 Capital Outlay
TOTAL
General Fund Actual Expenditures with Prior Year Comparisons
Description 2018 - 2019 % 2019 - 2020 % 2020 - 2021 %6100 Payroll 9,884,068$ 93.1% 10,050,679$ 86.8% 9,662,780$ 84.6%6200 Contracted Services 257,142 2.4% 207,834 1.8% 164,255$ 1.4%6300 Supplies & Materials 1,612,463 15.2% 1,090,030 9.4% 1,029,475 9.0%6400 Other Operating Costs (1,144,068) -10.8% (790,830) -6.8% (329,757) -2.9%6600 Capital Outlay 9,995 0.1% 1,022,800 8.8% 901,107 7.9%
TOTAL 10,619,600$ 100.0% 11,580,514$ 100.0% 11,427,859$ 100.0%
General Fund Budgeted Staff with Prior Year Comparisons
Description 2019 - 2020 % 2020 - 2021 % 2021 - 2022 %Professional 6.00 1.7% 6.00 1.8% 6.00 1.8%Paraprofessional 12.00 3.4% 12.00 3.6% 11.00 3.3%Classified 338.00 94.9% 314.00 94.6% 314.00 94.9%
TOTAL 356.00 100.0% 332.00 100.0% 331.00 100.0%
900,000 7.5%11,948,116$ 100.0%
298,728 2.5%1,308,001 10.9%(940,016) -7.9%
Key performance measurements include on-time performance, accidents, and route efficiencies versus student ridership.
Amount Percentage6100 Payroll Costs 10,381,403$ 86.9%
A continuation of greening the school bus fleet through the addition of propane. Leveraged technology to enhance customer service will also continue. And finally, enhance the school bus communication system to increase safety and security.
Securing grants to supplement school bus capital purchases will continue. In addition, the rollout of the parent school bus tracking app and badge notification system will enhance customer service and school bus safety. And finally, a grant will fund the school bus communication system which will link all buses to every campus and police vehicle.
Transportation - Org. # 885Budget Year 2021 - 2022
Transportation Services mission is to deliver students safely to their destinations on time and in a frame of mind ready to learn. These services include home-to-school bus routes, special programs, extracurricular field trips, Head Start, and athletic events. Vehicle Maintenance services include the maintenance and repair of school buses and district fleet vehicles.
307

Vision 2022 Statement of Duties
Vision 2022 Objectives
Vision 2022 Initiatives & Strategies
Vision 2022 Performance Measurements
Original Budget 2021-2022
Description
6200 Contracted Services6300 Supplies & Materials6400 Other Operating Costs6600 Capital Outlay
TOTAL
Actual Expenditures with Prior Year Comparisons
Description 2018 - 2019 % 2019 - 2020 % 2020 - 2021 %6100 Payroll 4,864,536$ 15.9% 5,173,388$ 17.9% 4,383,707$ 20.4%6200 Contracted Services 1,779,699 5.8% 1,616,146 5.6% 1,366,713$ 6.3%6300 Supplies & Materials 23,753,729 77.8% 21,169,587 73.3% 14,662,650 68.1%6400 Other Operating Costs 139,244 0.5% 138,017 0.5% 127,289 0.6%6600 Capital Outlay - 0.0% 764,574 2.6% 989,081 4.6%
TOTAL 30,537,208$ 100.0% 28,861,711$ 100.0% 21,529,438$ 100.0%
Budgeted Staff with Prior Year Comparisons
Description 2019 - 2020 % 2020 - 2021 % 2021 - 2022 %Professional 26.00 28.9% 26.00 29.5% 26.00 31.7%Paraprofessional 15.00 16.7% 14.00 15.9% 14.00 17.1%Classified 49.00 54.4% 48.00 54.5% 42.00 51.2%
TOTAL 90.00 100.0% 88.00 100.0% 82.00 100.0%
20,000 0.1%32,448,959$ 100.0%
1,501,171 4.6%25,937,158 79.9%
188,544 0.6%
The Child Nutrition Services Department has put in place key performance indicators to monitor primary areas of the operation, to include: Meals per labor hour, food cost, student participation and inventory data.
Amount Percentage6100 Payroll Costs 4,802,086$ 14.8%
The Child Nutrition Services Department plans to ensure fiscal responsibility by remaining self-sufficient and independent of the general fund.
The Child Nutrition Services Department will continuously improve the quality of food choices offered to San Antonio ISD students and maintain participation rates above the national standards.
Child Nutrition Services - Org. # 887Budget Year 2021 - 2022
The SAISD Child Nutrition Services Department enhances the learning and health of students by nourishing their bodies and minds through the availability of healthy, nutritious and appetizing meals. This standard of excellence and variety of programs offered enables the Department to support the academic core by improving student outcomes, attendance, and behavior.
308
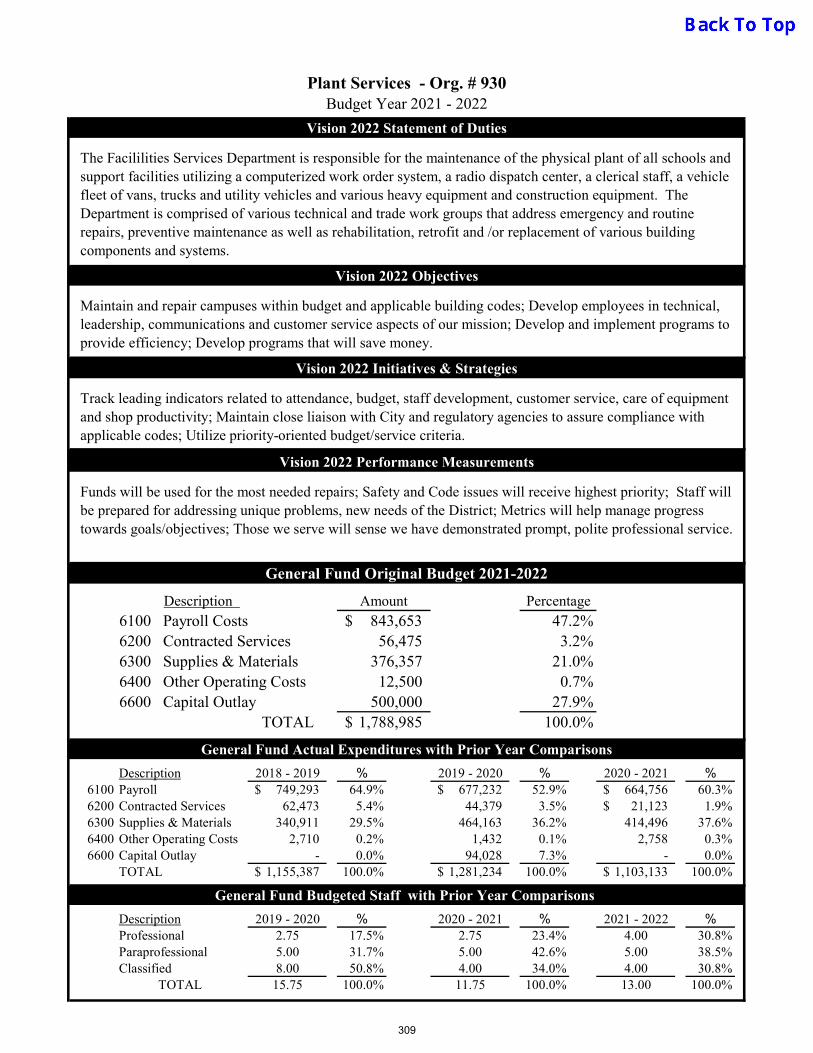
Vision 2022 Statement of Duties
Vision 2022 Objectives
Vision 2022 Initiatives & Strategies
Vision 2022 Performance Measurements
General Fund Original Budget 2021-2022
Description
6200 Contracted Services6300 Supplies & Materials6400 Other Operating Costs6600 Capital Outlay
TOTAL
General Fund Actual Expenditures with Prior Year Comparisons
Description 2018 - 2019 % 2019 - 2020 % 2020 - 2021 %6100 Payroll 749,293$ 64.9% 677,232$ 52.9% 664,756$ 60.3%6200 Contracted Services 62,473 5.4% 44,379 3.5% 21,123$ 1.9%6300 Supplies & Materials 340,911 29.5% 464,163 36.2% 414,496 37.6%6400 Other Operating Costs 2,710 0.2% 1,432 0.1% 2,758 0.3%6600 Capital Outlay - 0.0% 94,028 7.3% - 0.0%
TOTAL 1,155,387$ 100.0% 1,281,234$ 100.0% 1,103,133$ 100.0%
General Fund Budgeted Staff with Prior Year Comparisons
Description 2019 - 2020 % 2020 - 2021 % 2021 - 2022 %Professional 2.75 17.5% 2.75 23.4% 4.00 30.8%Paraprofessional 5.00 31.7% 5.00 42.6% 5.00 38.5%Classified 8.00 50.8% 4.00 34.0% 4.00 30.8%
TOTAL 15.75 100.0% 11.75 100.0% 13.00 100.0%
500,000 27.9%1,788,985$ 100.0%
56,475 3.2%376,357 21.0%
12,500 0.7%
Funds will be used for the most needed repairs; Safety and Code issues will receive highest priority; Staff will be prepared for addressing unique problems, new needs of the District; Metrics will help manage progress towards goals/objectives; Those we serve will sense we have demonstrated prompt, polite professional service.
Amount Percentage6100 Payroll Costs 843,653$ 47.2%
Maintain and repair campuses within budget and applicable building codes; Develop employees in technical, leadership, communications and customer service aspects of our mission; Develop and implement programs to provide efficiency; Develop programs that will save money.
Track leading indicators related to attendance, budget, staff development, customer service, care of equipment and shop productivity; Maintain close liaison with City and regulatory agencies to assure compliance with applicable codes; Utilize priority-oriented budget/service criteria.
Plant Services - Org. # 930Budget Year 2021 - 2022
The Facililities Services Department is responsible for the maintenance of the physical plant of all schools and support facilities utilizing a computerized work order system, a radio dispatch center, a clerical staff, a vehicle fleet of vans, trucks and utility vehicles and various heavy equipment and construction equipment. The Department is comprised of various technical and trade work groups that address emergency and routine repairs, preventive maintenance as well as rehabilitation, retrofit and /or replacement of various building components and systems.
309

Vision 2022 Statement of Duties
Vision 2022 Objectives
Vision 2022 Initiatives & Strategies
Vision 2022 Performance Measurements
General Fund Original Budget 2021-2022
Description
6200 Contracted Services6300 Supplies & Materials6400 Other Operating Costs6600 Capital Outlay
TOTAL
General Fund Actual Expenditures with Prior Year Comparisons
Description 2018 - 2019 % 2019 - 2020 % 2020 - 2021 %6100 Payroll 4,484,444$ 82.8% 4,713,761$ 80.6% 4,573,378$ 84.8%6200 Contracted Services 705,239 13.0% 713,979 12.2% 563,215$ 10.4%6300 Supplies & Materials 220,844 4.1% 415,295 7.1% 247,840 4.6%6400 Other Operating Costs 2,906 0.1% 4,658 0.1% 2,266 0.0%6600 Capital Outlay - 0.0% - 0.0% 9,069 0.2%
TOTAL 5,413,434$ 100.0% 5,847,692$ 100.0% 5,395,769$ 100.0%
General Fund Budgeted Staff with Prior Year Comparisons
Description 2019 - 2020 % 2020 - 2021 % 2021 - 2022 %Professional 11.00 11.8% 12.00 12.9% 12.00 12.6%Paraprofessional 2.00 2.2% 2.00 2.2% 2.00 2.1%Classified 80.00 86.0% 79.00 84.9% 81.00 85.3%
TOTAL 93.00 100.0% 93.00 100.0% 95.00 100.0%
- 0.0%6,381,824$ 100.0%
523,862 8.2%1,375,816 21.6%
4,500 0.1%
Increase garbage recycling capabilities, reduce garbage collection costs, and reduce the amount of garbage that goes to a City landfill. Clean facilities and maintenance all campus grounds.
Amount Percentage
6100 Payroll Costs 4,477,646$ 70.2%
Maintain well-groomed, safe grounds. Use safe, effective preventive methods, and provide timely response, to reduce/eliminate pest problems. Reduce the annual budget by developing effective money saving strategies that provide efficient services to all District campuses at a reduced cost.
Continue to develop a well equipped, properly trained, motivated staff of sufficient size and composition to fulfill our objectives. Refine simple, measurable, comprehensive inspections that identify the level of cleanliness of our facilities. Improve efficiency without compromising the environment.
PS Custodial Services - Org. # 932Budget Year 2021 - 2022
The Custodial and Grounds Department provides technical expertise and support to ensure all SAISD facilities are clean, safe and properly maintained utilizing a staff of Custodial Supervisors, radio dispatch center, and clerical staff, and a vehicle fleet of vans, trucks, utility vehicles and various grounds and landscape maintenance equipment. Five area supervisors oversee the daily operations for the four areas in the District. Centralized custodial staff receive cleaning assistance and absence augmentation by using custodians assigned to this department. The department also oversees the District-wide pest control in adherance to the State Integrated Pest Management guidelines.
310
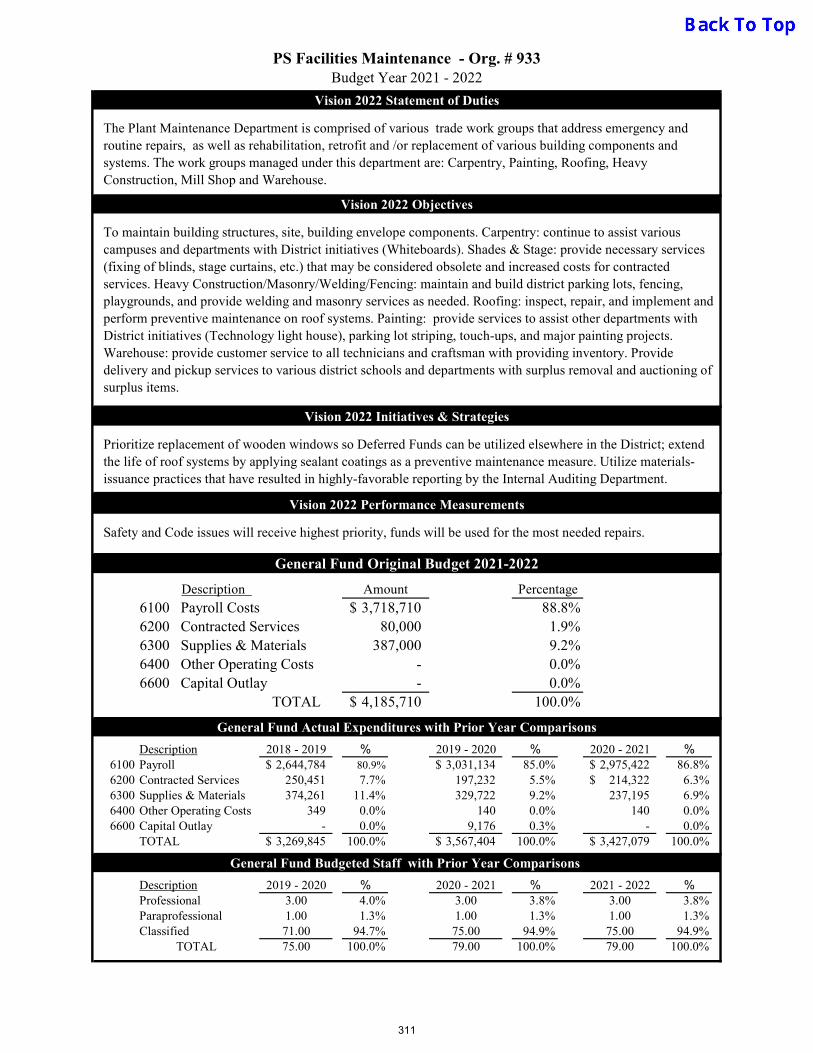
Vision 2022 Statement of Duties
Vision 2022 Objectives
Vision 2022 Initiatives & Strategies
Vision 2022 Performance Measurements
General Fund Original Budget 2021-2022
Description
6200 Contracted Services6300 Supplies & Materials6400 Other Operating Costs6600 Capital Outlay
TOTAL
General Fund Actual Expenditures with Prior Year Comparisons
Description 2018 - 2019 % 2019 - 2020 % 2020 - 2021 %6100 Payroll 2,644,784$ 80.9% 3,031,134$ 85.0% 2,975,422$ 86.8%6200 Contracted Services 250,451 7.7% 197,232 5.5% 214,322$ 6.3%6300 Supplies & Materials 374,261 11.4% 329,722 9.2% 237,195 6.9%6400 Other Operating Costs 349 0.0% 140 0.0% 140 0.0%6600 Capital Outlay - 0.0% 9,176 0.3% - 0.0%
TOTAL 3,269,845$ 100.0% 3,567,404$ 100.0% 3,427,079$ 100.0%
General Fund Budgeted Staff with Prior Year Comparisons
Description 2019 - 2020 % 2020 - 2021 % 2021 - 2022 %Professional 3.00 4.0% 3.00 3.8% 3.00 3.8%Paraprofessional 1.00 1.3% 1.00 1.3% 1.00 1.3%Classified 71.00 94.7% 75.00 94.9% 75.00 94.9%
TOTAL 75.00 100.0% 79.00 100.0% 79.00 100.0%
- 0.0%4,185,710$ 100.0%
80,000 1.9%387,000 9.2%
- 0.0%
Safety and Code issues will receive highest priority, funds will be used for the most needed repairs.
Amount Percentage
6100 Payroll Costs 3,718,710$ 88.8%
To maintain building structures, site, building envelope components. Carpentry: continue to assist various campuses and departments with District initiatives (Whiteboards). Shades & Stage: provide necessary services (fixing of blinds, stage curtains, etc.) that may be considered obsolete and increased costs for contracted services. Heavy Construction/Masonry/Welding/Fencing: maintain and build district parking lots, fencing, playgrounds, and provide welding and masonry services as needed. Roofing: inspect, repair, and implement and perform preventive maintenance on roof systems. Painting: provide services to assist other departments with District initiatives (Technology light house), parking lot striping, touch-ups, and major painting projects. Warehouse: provide customer service to all technicians and craftsman with providing inventory. Provide delivery and pickup services to various district schools and departments with surplus removal and auctioning of surplus items.
Prioritize replacement of wooden windows so Deferred Funds can be utilized elsewhere in the District; extend the life of roof systems by applying sealant coatings as a preventive maintenance measure. Utilize materials-issuance practices that have resulted in highly-favorable reporting by the Internal Auditing Department.
PS Facilities Maintenance - Org. # 933Budget Year 2021 - 2022
The Plant Maintenance Department is comprised of various trade work groups that address emergency and routine repairs, as well as rehabilitation, retrofit and /or replacement of various building components and systems. The work groups managed under this department are: Carpentry, Painting, Roofing, Heavy Construction, Mill Shop and Warehouse.
311
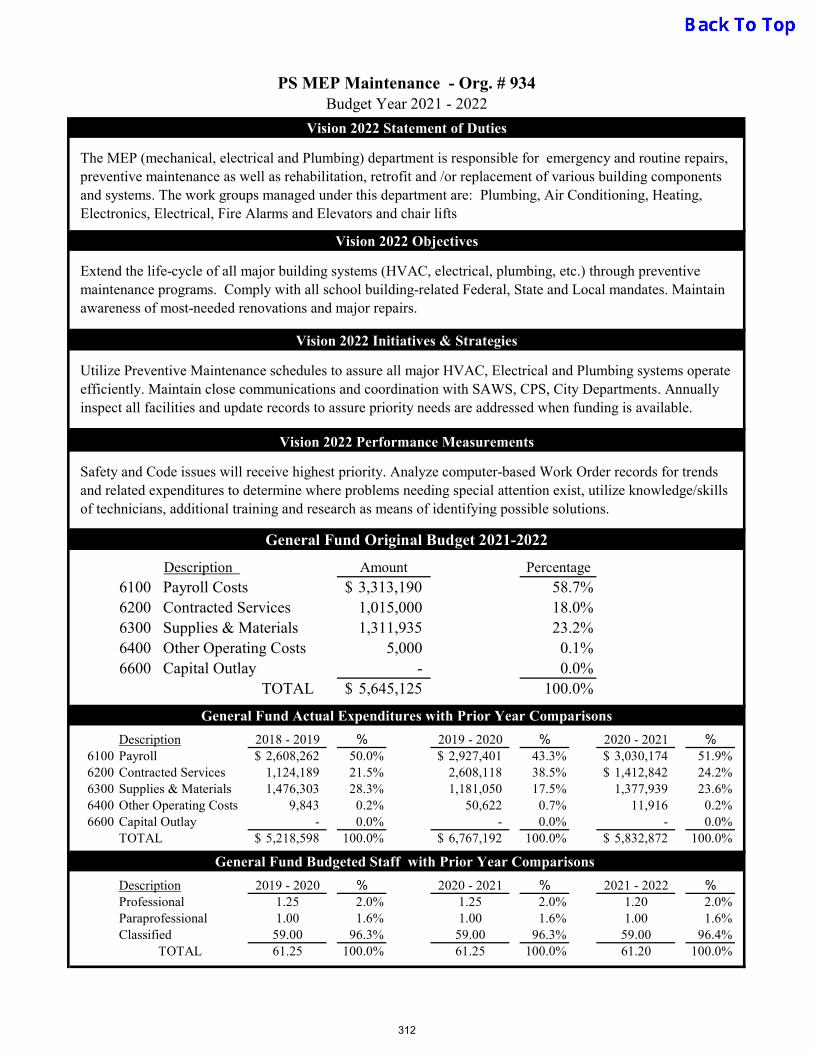
Vision 2022 Statement of Duties
Vision 2022 Objectives
Vision 2022 Initiatives & Strategies
Vision 2022 Performance Measurements
General Fund Original Budget 2021-2022
Description
6200 Contracted Services6300 Supplies & Materials6400 Other Operating Costs6600 Capital Outlay
TOTAL
General Fund Actual Expenditures with Prior Year Comparisons
Description 2018 - 2019 % 2019 - 2020 % 2020 - 2021 %6100 Payroll 2,608,262$ 50.0% 2,927,401$ 43.3% 3,030,174$ 51.9%6200 Contracted Services 1,124,189 21.5% 2,608,118 38.5% 1,412,842$ 24.2%6300 Supplies & Materials 1,476,303 28.3% 1,181,050 17.5% 1,377,939 23.6%6400 Other Operating Costs 9,843 0.2% 50,622 0.7% 11,916 0.2%6600 Capital Outlay - 0.0% - 0.0% - 0.0%
TOTAL 5,218,598$ 100.0% 6,767,192$ 100.0% 5,832,872$ 100.0%
General Fund Budgeted Staff with Prior Year Comparisons
Description 2019 - 2020 % 2020 - 2021 % 2021 - 2022 %Professional 1.25 2.0% 1.25 2.0% 1.20 2.0%Paraprofessional 1.00 1.6% 1.00 1.6% 1.00 1.6%Classified 59.00 96.3% 59.00 96.3% 59.00 96.4%
TOTAL 61.25 100.0% 61.25 100.0% 61.20 100.0%
- 0.0%5,645,125$ 100.0%
1,015,000 18.0%1,311,935 23.2%
5,000 0.1%
Amount Percentage6100 Payroll Costs 3,313,190$ 58.7%
Extend the life-cycle of all major building systems (HVAC, electrical, plumbing, etc.) through preventive maintenance programs. Comply with all school building-related Federal, State and Local mandates. Maintain awareness of most-needed renovations and major repairs.
Utilize Preventive Maintenance schedules to assure all major HVAC, Electrical and Plumbing systems operate efficiently. Maintain close communications and coordination with SAWS, CPS, City Departments. Annually inspect all facilities and update records to assure priority needs are addressed when funding is available.
Safety and Code issues will receive highest priority. Analyze computer-based Work Order records for trends and related expenditures to determine where problems needing special attention exist, utilize knowledge/skills of technicians, additional training and research as means of identifying possible solutions.
PS MEP Maintenance - Org. # 934Budget Year 2021 - 2022
The MEP (mechanical, electrical and Plumbing) department is responsible for emergency and routine repairs, preventive maintenance as well as rehabilitation, retrofit and /or replacement of various building components and systems. The work groups managed under this department are: Plumbing, Air Conditioning, Heating, Electronics, Electrical, Fire Alarms and Elevators and chair lifts
312
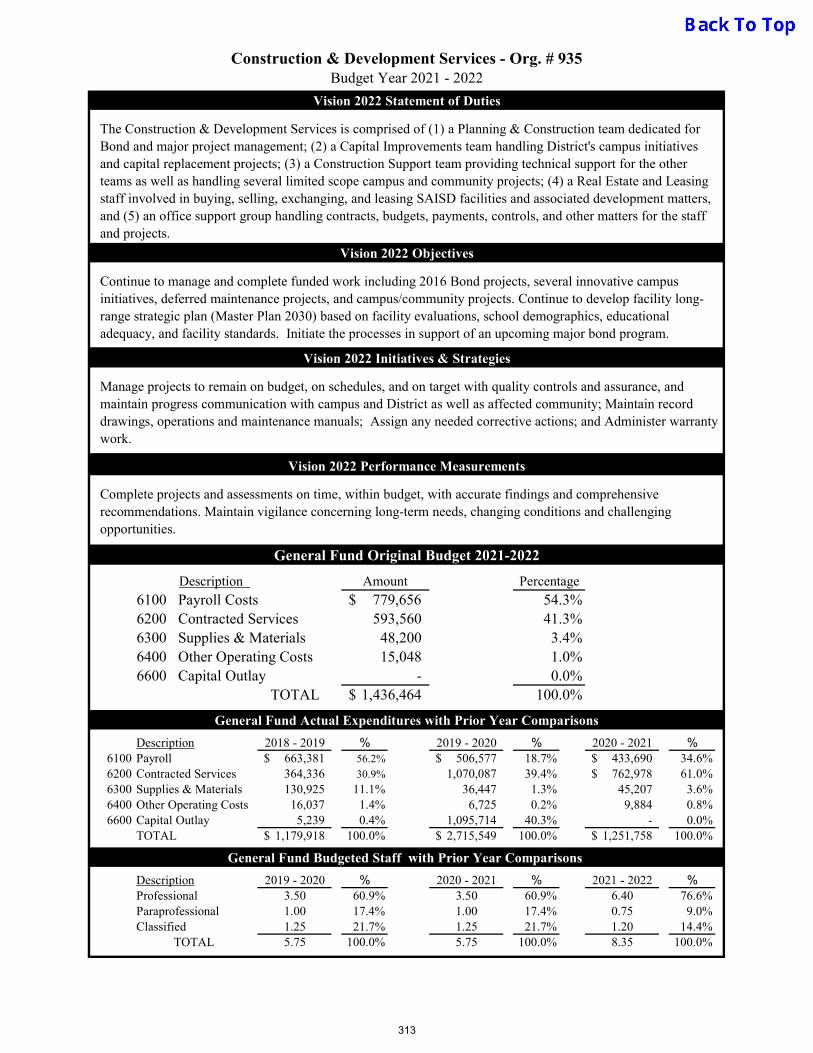
Vision 2022 Statement of Duties
Vision 2022 Objectives
Vision 2022 Initiatives & Strategies
Vision 2022 Performance Measurements
General Fund Original Budget 2021-2022
Description
6200 Contracted Services6300 Supplies & Materials6400 Other Operating Costs6600 Capital Outlay
TOTAL
General Fund Actual Expenditures with Prior Year Comparisons
Description 2018 - 2019 % 2019 - 2020 % 2020 - 2021 %6100 Payroll 663,381$ 56.2% 506,577$ 18.7% 433,690$ 34.6%6200 Contracted Services 364,336 30.9% 1,070,087 39.4% 762,978$ 61.0%6300 Supplies & Materials 130,925 11.1% 36,447 1.3% 45,207 3.6%6400 Other Operating Costs 16,037 1.4% 6,725 0.2% 9,884 0.8%6600 Capital Outlay 5,239 0.4% 1,095,714 40.3% - 0.0%
TOTAL 1,179,918$ 100.0% 2,715,549$ 100.0% 1,251,758$ 100.0%
General Fund Budgeted Staff with Prior Year Comparisons
Description 2019 - 2020 % 2020 - 2021 % 2021 - 2022 %Professional 3.50 60.9% 3.50 60.9% 6.40 76.6%Paraprofessional 1.00 17.4% 1.00 17.4% 0.75 9.0%Classified 1.25 21.7% 1.25 21.7% 1.20 14.4%
TOTAL 5.75 100.0% 5.75 100.0% 8.35 100.0%
- 0.0%1,436,464$ 100.0%
593,560 41.3%48,200 3.4%15,048 1.0%
Complete projects and assessments on time, within budget, with accurate findings and comprehensive recommendations. Maintain vigilance concerning long-term needs, changing conditions and challenging opportunities.
Amount Percentage
6100 Payroll Costs 779,656$ 54.3%
Continue to manage and complete funded work including 2016 Bond projects, several innovative campus initiatives, deferred maintenance projects, and campus/community projects. Continue to develop facility long-range strategic plan (Master Plan 2030) based on facility evaluations, school demographics, educational adequacy, and facility standards. Initiate the processes in support of an upcoming major bond program.
Manage projects to remain on budget, on schedules, and on target with quality controls and assurance, and maintain progress communication with campus and District as well as affected community; Maintain record drawings, operations and maintenance manuals; Assign any needed corrective actions; and Administer warranty work.
Construction & Development Services - Org. # 935Budget Year 2021 - 2022
The Construction & Development Services is comprised of (1) a Planning & Construction team dedicated for Bond and major project management; (2) a Capital Improvements team handling District's campus initiatives and capital replacement projects; (3) a Construction Support team providing technical support for the other teams as well as handling several limited scope campus and community projects; (4) a Real Estate and Leasing staff involved in buying, selling, exchanging, and leasing SAISD facilities and associated development matters, and (5) an office support group handling contracts, budgets, payments, controls, and other matters for the staff and projects.
313

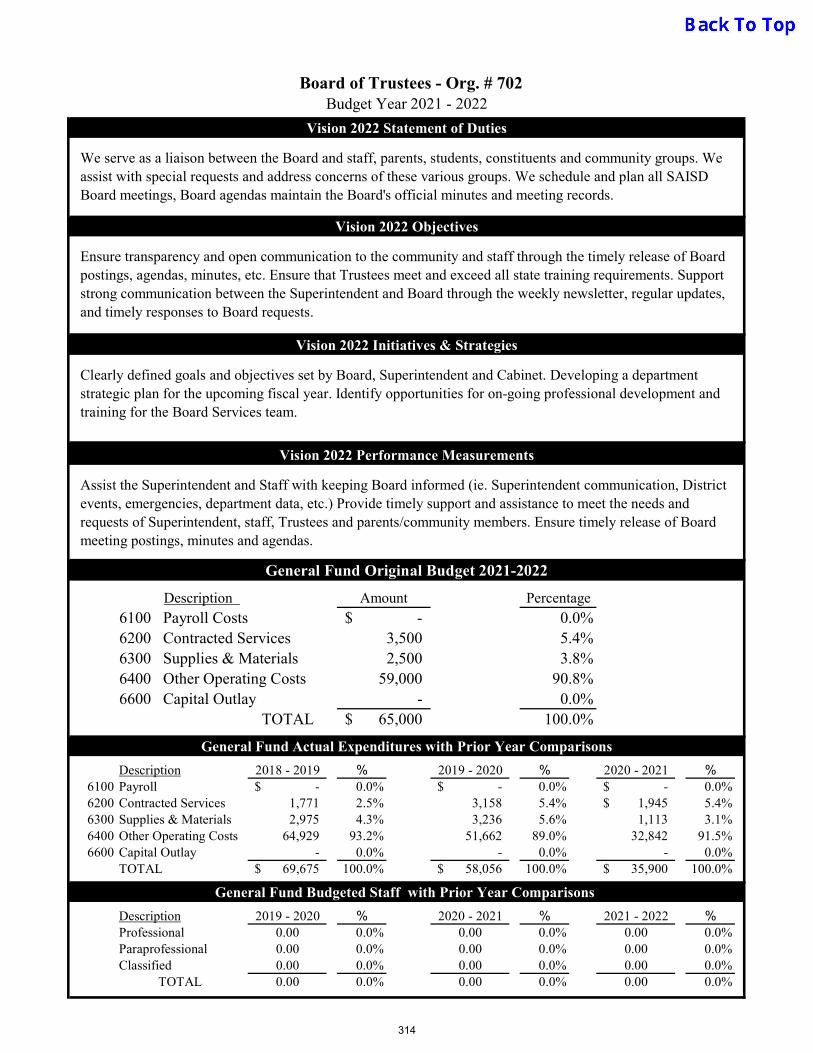
Vision 2022 Statement of Duties
Vision 2022 Objectives
Vision 2022 Initiatives & Strategies
Vision 2022 Performance Measurements
General Fund Original Budget 2021-2022
Description
6200 Contracted Services6300 Supplies & Materials6400 Other Operating Costs6600 Capital Outlay
TOTAL
General Fund Actual Expenditures with Prior Year Comparisons
Description 2018 - 2019 % 2019 - 2020 % 2020 - 2021 %6100 Payroll -$ 0.0% -$ 0.0% -$ 0.0%6200 Contracted Services 1,771 2.5% 3,158 5.4% 1,945$ 5.4%6300 Supplies & Materials 2,975 4.3% 3,236 5.6% 1,113 3.1%6400 Other Operating Costs 64,929 93.2% 51,662 89.0% 32,842 91.5%6600 Capital Outlay - 0.0% - 0.0% - 0.0%
TOTAL 69,675$ 100.0% 58,056$ 100.0% 35,900$ 100.0%
General Fund Budgeted Staff with Prior Year Comparisons
Description 2019 - 2020 % 2020 - 2021 % 2021 - 2022 %Professional 0.00 0.0% 0.00 0.0% 0.00 0.0%Paraprofessional 0.00 0.0% 0.00 0.0% 0.00 0.0%Classified 0.00 0.0% 0.00 0.0% 0.00 0.0%
TOTAL 0.00 0.0% 0.00 0.0% 0.00 0.0%
- 0.0%65,000$ 100.0%
3,500 5.4%2,500 3.8%
59,000 90.8%
Assist the Superintendent and Staff with keeping Board informed (ie. Superintendent communication, District events, emergencies, department data, etc.) Provide timely support and assistance to meet the needs and requests of Superintendent, staff, Trustees and parents/community members. Ensure timely release of Board meeting postings, minutes and agendas.
Amount Percentage6100 Payroll Costs -$ 0.0%
Ensure transparency and open communication to the community and staff through the timely release of Board postings, agendas, minutes, etc. Ensure that Trustees meet and exceed all state training requirements. Support strong communication between the Superintendent and Board through the weekly newsletter, regular updates, and timely responses to Board requests.
Clearly defined goals and objectives set by Board, Superintendent and Cabinet. Developing a department strategic plan for the upcoming fiscal year. Identify opportunities for on-going professional development and training for the Board Services team.
Board of Trustees - Org. # 702Budget Year 2021 - 2022
We serve as a liaison between the Board and staff, parents, students, constituents and community groups. We assist with special requests and address concerns of these various groups. We schedule and plan all SAISD Board meetings, Board agendas maintain the Board's official minutes and meeting records.
314
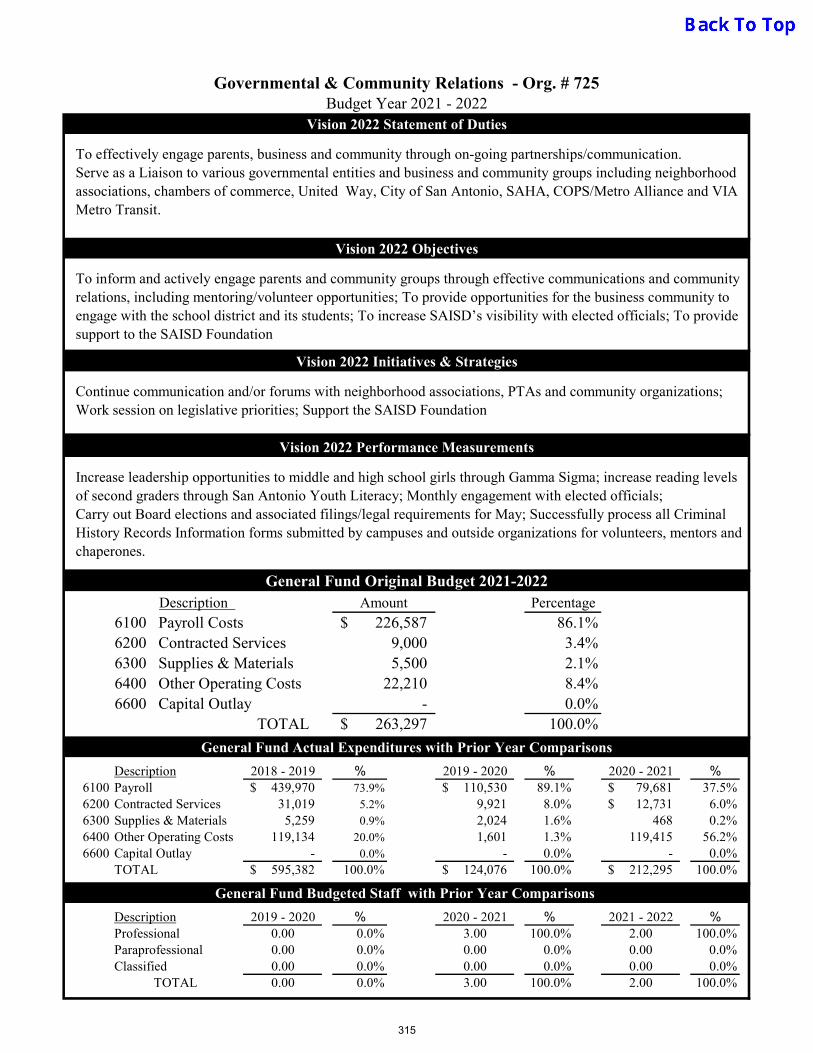
Vision 2022 Statement of Duties
Vision 2022 Objectives
Vision 2022 Initiatives & Strategies
Vision 2022 Performance Measurements
General Fund Original Budget 2021-2022Description
6200 Contracted Services6300 Supplies & Materials6400 Other Operating Costs6600 Capital Outlay
TOTAL
General Fund Actual Expenditures with Prior Year Comparisons
Description 2018 - 2019 % 2019 - 2020 % 2020 - 2021 %6100 Payroll 439,970$ 73.9% 110,530$ 89.1% 79,681$ 37.5%6200 Contracted Services 31,019 5.2% 9,921 8.0% 12,731$ 6.0%6300 Supplies & Materials 5,259 0.9% 2,024 1.6% 468 0.2%6400 Other Operating Costs 119,134 20.0% 1,601 1.3% 119,415 56.2%6600 Capital Outlay - 0.0% - 0.0% - 0.0%
TOTAL 595,382$ 100.0% 124,076$ 100.0% 212,295$ 100.0%
General Fund Budgeted Staff with Prior Year Comparisons
Description 2019 - 2020 % 2020 - 2021 % 2021 - 2022 %Professional 0.00 0.0% 3.00 100.0% 2.00 100.0%Paraprofessional 0.00 0.0% 0.00 0.0% 0.00 0.0%Classified 0.00 0.0% 0.00 0.0% 0.00 0.0%
TOTAL 0.00 0.0% 3.00 100.0% 2.00 100.0%
- 0.0%263,297$ 100.0%
9,000 3.4%5,500 2.1%
22,210 8.4%
Amount Percentage6100 Payroll Costs 226,587$ 86.1%
To inform and actively engage parents and community groups through effective communications and community relations, including mentoring/volunteer opportunities; To provide opportunities for the business community to engage with the school district and its students; To increase SAISD’s visibility with elected officials; To provide support to the SAISD Foundation
Continue communication and/or forums with neighborhood associations, PTAs and community organizations; Work session on legislative priorities; Support the SAISD Foundation
Increase leadership opportunities to middle and high school girls through Gamma Sigma; increase reading levels of second graders through San Antonio Youth Literacy; Monthly engagement with elected officials;Carry out Board elections and associated filings/legal requirements for May; Successfully process all Criminal History Records Information forms submitted by campuses and outside organizations for volunteers, mentors and chaperones.
Governmental & Community Relations - Org. # 725Budget Year 2021 - 2022
To effectively engage parents, business and community through on-going partnerships/communication.Serve as a Liaison to various governmental entities and business and community groups including neighborhood associations, chambers of commerce, United Way, City of San Antonio, SAHA, COPS/Metro Alliance and VIA Metro Transit.
315

Vision 2022 Statement of Duties
Vision 2022 Objectives
Vision 2022 Initiatives & Strategies
Vision 2022 Performance Measurements
General Fund Original Budget 2021-2022
Description
6200 Contracted Services6300 Supplies & Materials6400 Other Operating Costs6600 Capital Outlay
TOTAL
General Fund Actual Expenditures with Prior Year Comparisons
Description 2018 - 2019 % 2019 - 2020 % 2020 - 2021 %6100 Payroll -$ 0.0% -$ 0.0% -$ 0.0%6200 Contracted Services - 0.0% - 0.0% -$ 0.0%6300 Supplies & Materials 2,994 34.0% 1,389 25.3% 3,903 64.7%6400 Other Operating Costs 5,810 66.0% 4,101 74.7% 2,127 35.3%6600 Capital Outlay - 0.0% - 0.0% - 0.0%
TOTAL 8,804$ 100.0% 5,490$ 100.0% 6,029$ 100.0%
General Fund Budgeted Staff with Prior Year Comparisons
Description 2019 - 2020 % 2020 - 2021 % 2021 - 2022 %Professional 0.00 0.0% 0.00 0.0% 0.00 0.0%Paraprofessional 0.00 0.0% 0.00 0.0% 0.00 0.0%Classified 0.00 0.0% 0.00 0.0% 0.00 0.0%
TOTAL 0.00 0.0% 0.00 0.0% 0.00 0.0%
- 0.0%7,750$ 100.0%
250 3.2%2,500 32.3%5,000 64.5%
100% of CLT rosters will be submitted to the Assistant Superintendents and Family Engagement Services with 100% designated positions filled. All 48 designated positions on DLT will be filled. Attendance at DLT meetings will continue to increase. All duties required in BQA - LOCAL will be completed by DLT.
Amount Percentage6100 Payroll Costs -$ 0.0%
Increase engagement and support from community members and business partners; encourage dialogue and student-centric decision-making; the review and approval of the District Improvement Plan ahead of implementation for following school year; establish solid partnerships between District superintendent/administration/faculty/staff and parents, businesses and community members.
Initiate CLT and DLT member elections at the start of the school year to fill vacancies ( members serve for two years); complete elections by end of September 2020; communicate with District administration about topics of discussion expected to be covered in the new school year; schedule 7 required DLT meetings at the start of the school year; publicly display DLT meeting schedule (district website).
Integrated Communications Network - Org. # 732Budget Year 2021 - 2022
Establish and review the District's educational goals and objectives; review major district-wide instructional programs identified by the Board or Superintendent; analyze dropout rates, dropout prevention plans and graduation rates; and approve staff development of a district-wide nature.
316

Vision 2022 Statement of Duties
Vision 2022 Objectives
Vision 2022 Initiatives & Strategies
Vision 2022 Performance Measurements
General Fund Original Budget 2021-2022
Description
6200 Contracted Services6300 Supplies & Materials6400 Other Operating Costs6600 Capital Outlay
TOTAL
General Fund Actual Expenditures with Prior Year Comparisons
Description 2018 - 2019 % 2019 - 2020 % 2020 - 2021 %6100 Payroll 423,713$ 75.6% 374,375$ 69.4% 470,851$ 79.8%6200 Contracted Services 18,478 3.3% 39,794 7.4% 11,620$ 2.0%6300 Supplies & Materials 10,586 1.9% 2,295 0.4% 229 0.0%6400 Other Operating Costs 108,031 19.3% 122,615 22.7% 107,012 18.1%6600 Capital Outlay - 0.0% - 0.0% - 0.0%
TOTAL 560,809$ 100.0% 539,079$ 100.0% 589,712$ 100.0%
General Fund Budgeted Staff with Prior Year Comparisons
Description 2019 - 2020 % 2020 - 2021 % 2021 - 2022 %Professional 6.00 66.7% 3.00 60.0% 4.00 57.1%Paraprofessional 3.00 33.3% 2.00 40.0% 3.00 42.9%Classified 0.00 0.0% 0.00 0.0% 0.00 0.0%
TOTAL 9.00 100.0% 5.00 100.0% 7.00 100.0%
- 0.0%702,347$ 100.0%
19,000 2.7%2,700 0.4%
115,300 16.4%
Amount Percentage6100 Payroll Costs 565,347$ 80.5%
To increase family engagement in SAISD and on our campuses. To improve the volunteer engagement and onboarding process on campuses and across the District. To increase, engage and monitor existing and new strategic partners. To serve as a resource to families and community members and as an additional vehicle that spreads the great things that are happening in SAISD.
To develop NEW and support existing Campus/Districtwide Family Activities in partnership with various departments (Counseling, SPED, Bilingual, Innovation Zone/Enrollment and Curriculum and Instruction). To develop and implement family outreach efforts. To increase volunteer & mentor recruitment and online registration.
Performance will be measured through a tracker designed to monitor progress and trends; family attendance at campus and District events; number of volunteers registered online; attendance at community meetings; number of family outreach efforts - home visits, mailers, texts, emails and phone calls; and the number of family calls received by family and customer care specialists.
Family Engagement Services - Org. # 809Budget Year 2021 - 2022
To connect families, community members and local and state leaders to campuses and to the District as a whole – engaging these groups as partners committed to the success of our students.
317

COMMUNITY PROFILE *
The SAISD Central Office was originally Lamar School, which opened in 1878 at Lavaca St.
San Antonio is the seventh largest city in the United States and encompasses 368.6 square miles in South Central Texas. San Antonio is in the region of 140 miles northwest of the Gulf of Mexico and 150 miles northeast of the city of Laredo along the Mexican border. The city of San Antonio first got its name when Spanish explorers and missionaries came upon a river in 1691. It was the feast day of St. Anthony so they decided to name the river “San Antonio.” Today, San Antonio Independent School District exists in the heart of the San Antonio metropolitan area. Living in a school district as diverse and historically rich as the city whose name it shares, SAISD residents enjoy easy access to a variety of activities. Those pursuing cultural outings will find major museums such as the Museo Alameda, an affiliate of the Smithsonian Institute boasting the nation’s largest Latino collection; the San Antonio Museum of Art, and the Witte Museum; art galleries; ballets; libraries; the Botanical Center; the Institute of Texan Cultures; Scobee Planetarium; the Southwest Craft Center and the Spanish Governor’s Palace, to name a few. Enjoy a performance by the San Antonio Symphony or catch a Broadway show, opera or concert in the splendour of one of downtown’s impeccably-restored historic theatres. Also a shopper’s paradise, the city’s vibrant downtown offers options ranging from the ultra-modern Rivercenter Mall, to the historic La Villita, festive Market Square, El Mercado, and along the Riverwalk, or explore the eclectic offerings in Southtown on the fringe of San Antonio’s central business district.
That Home Town Feel - One of San Antonio's most outstanding assets is the preservation of its historic sites and neighbourhoods, most of which are found within SAISD. These include the city’s registered residential historic districts of Dignowity Hill, Fulton Avenue, Government Hill, King William, Lavaca, Monte Vista, and Monticello Park. All have strong, active neighborhood associations, with styles of houses ranging from early Texas pioneer, late 1800s Colonial, Mediterranean and Spanish-style mansions to 1920s bungalows, 1930s art deco designs, and more modern homes, along with trendy urban chic lofts giving new life and identity to former factories and warehouses.
318

COMMUNITY PROFILE *
Fiesta City USA - Each April downtown hosts Fiesta's signature festivities and parades, while June means the multicultural Texas Folk Life Festival at the Institute of Texan Cultures. Festivals, in fact, are a way of life in San Antonio, whether the observance focuses on our rich heritage, our love of the arts or simply our love of life.
Bonham Academy is excited to announce SAISD’s first Conjunto class for middle school students.
Our place in the Alamo City community
Our residents live in the hub of what American humorist Will Rogers rightly called one of America's four unique cities. SAISD is a family-oriented, urban community of thriving neighborhoods, well-established businesses, including the downtown central business district, historic sites, active worship centers, world-renowned museums, excellent restaurants and recreational facilities. Supreme among our city’s featured attractions are first-class institutes of education, ours and those that many from SAISD go on to attend. We share the inner-city with most of Bexar County’s colleges and universities, some of which are internationally-recognized, which include Our Lady of the Lake University; St. Mary's University; Trinity University; University of the Incarnate Word; University of Mexico in San Antonio (Universidad Nacional Autonoma de Mexico); the University of Texas at San Antonio’s downtown campus; Texas A&M University San Antonio and the Alamo Colleges.
Congratulations to Annabelle Reyna from Burbank HS on her first college acceptance to Texas A&M University San Antonio!
319
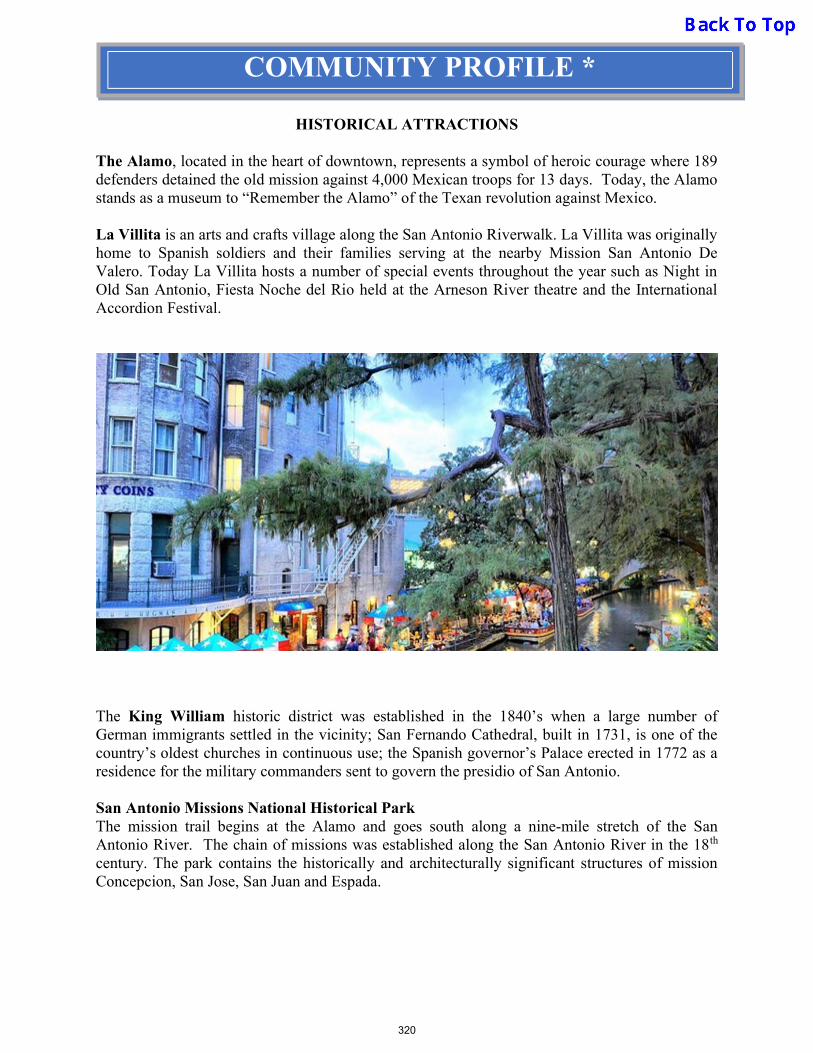
COMMUNITY PROFILE *
HISTORICAL ATTRACTIONS The Alamo, located in the heart of downtown, represents a symbol of heroic courage where 189 defenders detained the old mission against 4,000 Mexican troops for 13 days. Today, the Alamo stands as a museum to “Remember the Alamo” of the Texan revolution against Mexico. La Villita is an arts and crafts village along the San Antonio Riverwalk. La Villita was originally home to Spanish soldiers and their families serving at the nearby Mission San Antonio De Valero. Today La Villita hosts a number of special events throughout the year such as Night in Old San Antonio, Fiesta Noche del Rio held at the Arneson River theatre and the International Accordion Festival.
The King William historic district was established in the 1840’s when a large number of German immigrants settled in the vicinity; San Fernando Cathedral, built in 1731, is one of the country’s oldest churches in continuous use; the Spanish governor’s Palace erected in 1772 as a residence for the military commanders sent to govern the presidio of San Antonio. San Antonio Missions National Historical Park The mission trail begins at the Alamo and goes south along a nine-mile stretch of the San Antonio River. The chain of missions was established along the San Antonio River in the 18th century. The park contains the historically and architecturally significant structures of mission Concepcion, San Jose, San Juan and Espada.
320
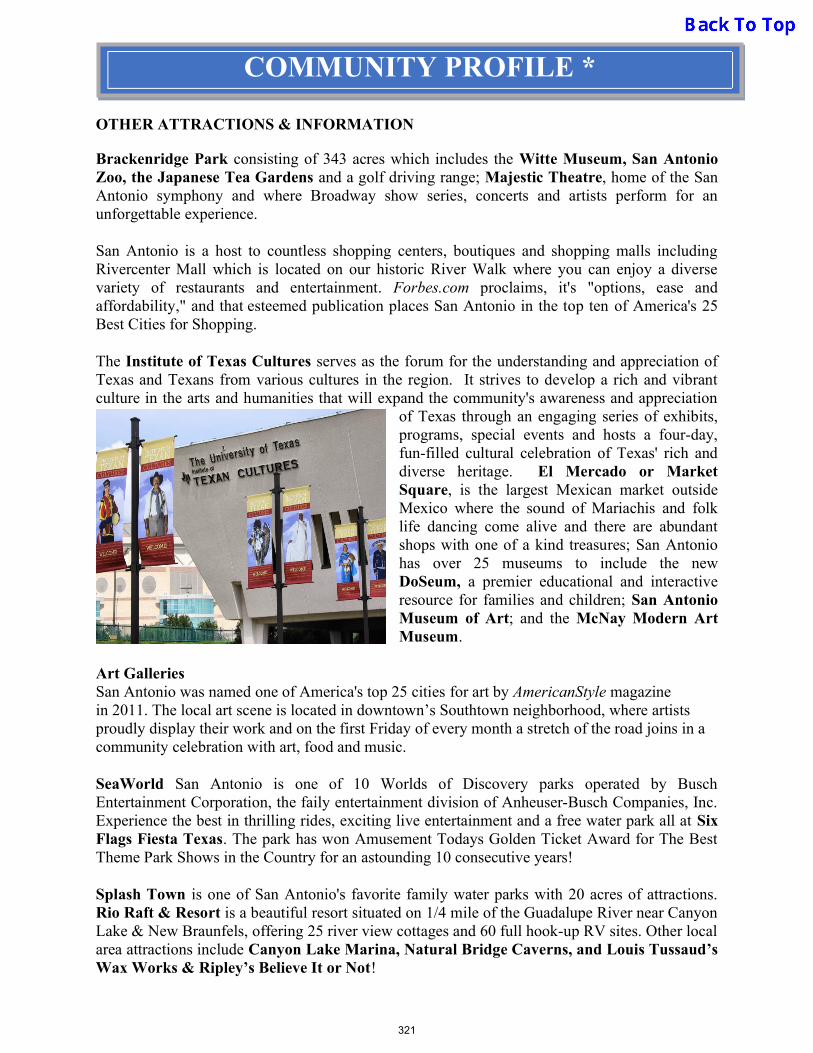
COMMUNITY PROFILE *
OTHER ATTRACTIONS & INFORMATION Brackenridge Park consisting of 343 acres which includes the Witte Museum, San Antonio Zoo, the Japanese Tea Gardens and a golf driving range; Majestic Theatre, home of the San Antonio symphony and where Broadway show series, concerts and artists perform for an unforgettable experience.
San Antonio is a host to countless shopping centers, boutiques and shopping malls including Rivercenter Mall which is located on our historic River Walk where you can enjoy a diverse variety of restaurants and entertainment. Forbes.com proclaims, it's "options, ease and affordability," and that esteemed publication places San Antonio in the top ten of America's 25 Best Cities for Shopping.
The Institute of Texas Cultures serves as the forum for the understanding and appreciation of Texas and Texans from various cultures in the region. It strives to develop a rich and vibrant culture in the arts and humanities that will expand the community's awareness and appreciation
of Texas through an engaging series of exhibits, programs, special events and hosts a four-day, fun-filled cultural celebration of Texas' rich and diverse heritage. El Mercado or Market Square, is the largest Mexican market outside Mexico where the sound of Mariachis and folk life dancing come alive and there are abundant shops with one of a kind treasures; San Antonio has over 25 museums to include the new DoSeum, a premier educational and interactive resource for families and children; San Antonio Museum of Art; and the McNay Modern Art Museum.
Art Galleries San Antonio was named one of America's top 25 cities for art by AmericanStyle magazine in 2011. The local art scene is located in downtown’s Southtown neighborhood, where artists proudly display their work and on the first Friday of every month a stretch of the road joins in a community celebration with art, food and music.
SeaWorld San Antonio is one of 10 Worlds of Discovery parks operated by Busch Entertainment Corporation, the faily entertainment division of Anheuser-Busch Companies, Inc. Experience the best in thrilling rides, exciting live entertainment and a free water park all at Six Flags Fiesta Texas. The park has won Amusement Todays Golden Ticket Award for The Best Theme Park Shows in the Country for an astounding 10 consecutive years!
Splash Town is one of San Antonio's favorite family water parks with 20 acres of attractions. Rio Raft & Resort is a beautiful resort situated on 1/4 mile of the Guadalupe River near Canyon Lake & New Braunfels, offering 25 river view cottages and 60 full hook-up RV sites. Other local area attractions include Canyon Lake Marina, Natural Bridge Caverns, and Louis Tussaud’s Wax Works & Ripley’s Believe It or Not!
321
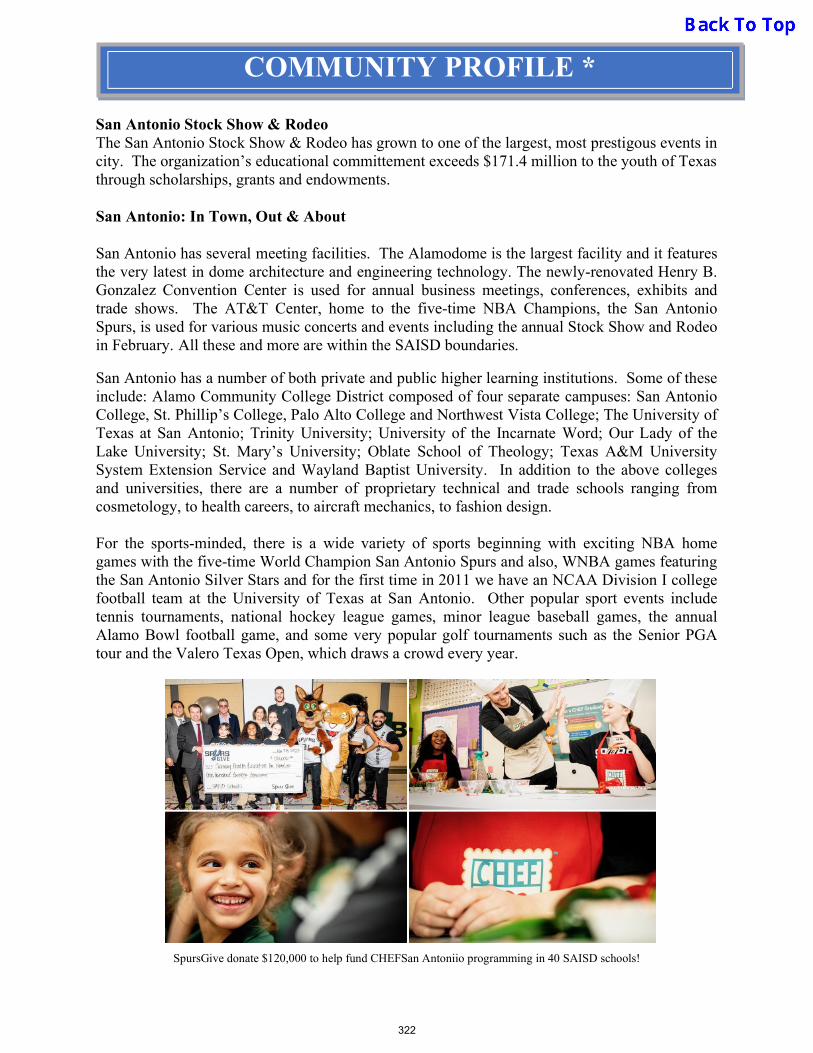
COMMUNITY PROFILE *
San Antonio Stock Show & Rodeo The San Antonio Stock Show & Rodeo has grown to one of the largest, most prestigous events in city. The organization’s educational committement exceeds $171.4 million to the youth of Texas through scholarships, grants and endowments.
San Antonio: In Town, Out & About
San Antonio has several meeting facilities. The Alamodome is the largest facility and it features the very latest in dome architecture and engineering technology. The newly-renovated Henry B. Gonzalez Convention Center is used for annual business meetings, conferences, exhibits and trade shows. The AT&T Center, home to the five-time NBA Champions, the San Antonio Spurs, is used for various music concerts and events including the annual Stock Show and Rodeo in February. All these and more are within the SAISD boundaries. San Antonio has a number of both private and public higher learning institutions. Some of these include: Alamo Community College District composed of four separate campuses: San Antonio College, St. Phillip’s College, Palo Alto College and Northwest Vista College; The University of Texas at San Antonio; Trinity University; University of the Incarnate Word; Our Lady of the Lake University; St. Mary’s University; Oblate School of Theology; Texas A&M University System Extension Service and Wayland Baptist University. In addition to the above colleges and universities, there are a number of proprietary technical and trade schools ranging from cosmetology, to health careers, to aircraft mechanics, to fashion design. For the sports-minded, there is a wide variety of sports beginning with exciting NBA home games with the five-time World Champion San Antonio Spurs and also, WNBA games featuring the San Antonio Silver Stars and for the first time in 2011 we have an NCAA Division I college football team at the University of Texas at San Antonio. Other popular sport events include tennis tournaments, national hockey league games, minor league baseball games, the annual Alamo Bowl football game, and some very popular golf tournaments such as the Senior PGA tour and the Valero Texas Open, which draws a crowd every year.
SpursGive donate $120,000 to help fund CHEFSan Antoniio programming in 40 SAISD schools!
322

COMMUNITY PROFILE *
The city has miles of developed Greenway Trails and 1,100 acres of property along creek ways. There are several cities, downtown and county parks and natural areas and gardens around town for recreation and leisure activities.
In San Antonio, visitors can enjoy it all. Family fun, relaxing getaways, scenic pleasures and countless activities of a major metropolitan city can be found with the first class hotels and spa resorts, restaurants with cuisine inspired from around the world, live music for every genre and all kinds of annual entertainment and festivals. Enjoy the variety of the River Walk that stretches miles, offering a one-of-a-kind experience
Trinity University and SAISD are proud to announce the creation of the Trinity Community Investment partnership, which will make a Trinity education accessible to the district’s top graduating seniors by meeting their full demonstrated financial need.
*Sources: The Greater San Antonio Chamber of Commerce www.sachamber.org San Antonio Convention & Visitors Bureau www.visitsanantonio.com SAISD website www.saisd.net San Antonio Stock Show & Rodeo www.sarodeo.com Twitter.com
323

*Sources: greater:SATX primary business research; confirmations of public-facing approximate headcounts. https://www.nisd.net https://www.neisd.net/Page/30834 https://www.saisd.net/page/financial-district
The ten largest corporate headquarters, by employee size, located in San Antonio are:
Company Business *Approx. Employed in San
Antonio
H-E-B Retail Grocer 20,000
USAA Financial Services 19,000
Rackspace IT Managed/Cloud Hosting 6,300
Whataburger
Restaurant Chain 6,000
Cullen / Frost Bankers Financial Services 4,000
Bill Miller Bar-B-Q
Restaurant Chain 3,500
Toyota Motor Manufacturing TX Auto Manufacturing 3,200
Southwest Research Institute Research & Development 3,000
SWBC Financial Services 3,000
Clear Channel Communications Media 2,800
San Antonio’s top ten major regional employers are:
Company Business *Approx. Employed in San
Antonio
Lackland Air Force Base Military 33,300
Fort Sam Houston
Military
30,000
H-E-B Retail Grocer 20,000
USAA Financial Services 19,000
City of San Antonio Municipal Government 12,700
Methodist Healthcare Systems Healthcare Services 12,000
Randolph Air Force Base Military 11,000
Northside I.S.D. Public School District 12,605
North East I.S.D. Public School District 8,500
San Antonio I.S.D. Public School District 8,311 San Antonio has four major military installations, all part of Joint Base San Antonio (JBSA). JBSA employs 74,300 people.
324
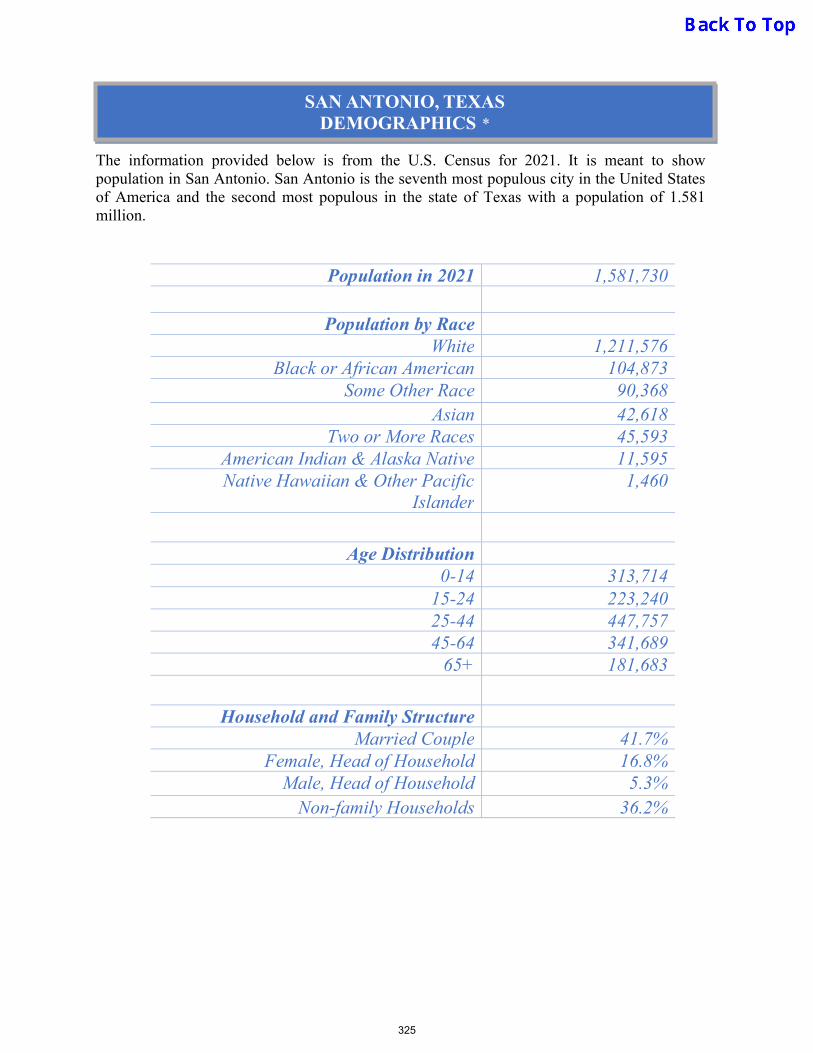
The information provided below is from the U.S. Census for 2021. It is meant to show population in San Antonio. San Antonio is the seventh most populous city in the United States of America and the second most populous in the state of Texas with a population of 1.581 million.
Population in 2021 1,581,730
Population by Race White 1,211,576
Black or African American 104,873 Some Other Race 90,368
Asian 42,618 Two or More Races 45,593
American Indian & Alaska Native 11,595 Native Hawaiian & Other Pacific
Islander 1,460
Age Distribution 0-14 313,714
15-24 223,240 25-44 447,757 45-64 341,689
65+ 181,683
Household and Family Structure Married Couple 41.7%
Female, Head of Household 16.8% Male, Head of Household 5.3%
Non-family Households 36.2%
SAN ANTONIO, TEXAS DEMOGRAPHICS *
325

Educational Attainment in Population 25 Years & Over
Less than 9th grade 80,566 9th to 12th grade 90,403
High School Graduate 255,464
Some College, no degree 217,253 Associate degree 74,925
Bachelor’s degree 160,884
Graduate or Prof. degree 91,634
Language Spoken at Home for Age 5+
Only English 57.2% Spanish 38.8%
Other Indo-European excludes English & Spanish
1.5%
Asian 1.8% Other 0.7%
*Sources: US Census Bureau; World Population Review
SAN ANTONIO, TEXAS DEMOGRAPHICS *
326
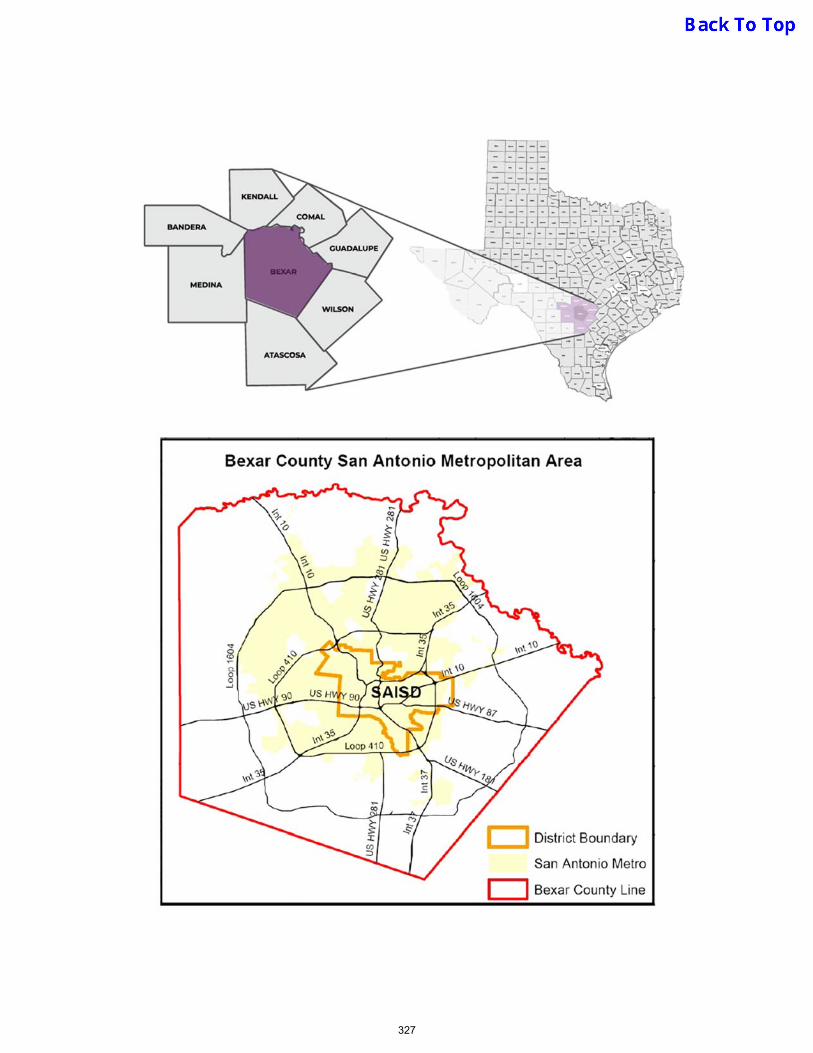
327

SPUR 122
W SOUTHCROSS BLVDMC
CULL
OUGH
AVE
N NE
W BR
AUNF
ELS A
VE
N MA
IN AV
E
S PRESA ST
W COMMERCE ST
ROOSEVELTAVE
SPUR
422
BROA
DWAY
NOGALITO
S ST
S WW
WHI
TE R
D
GIBBS -SPRAWL RD
WEST
AVE
SE MILITARY DR
W HILDEBRAND AVE
SW MILITARY DR
FREDERICKSBURG RD
RIGSBY AVE
SAN
PEDR
O AV
E
S NEW BRAUNFELSAV E
PROB AND TST
SZA
RZAM
ORA S
T
E HILDEBRAND AVE
N WWWHITE
RD
S MAIN
AVE
W M ILITARY DR
AUSTIN HWY
POTE
ETJO
URDA
NTON
FWY
BANDERA RD
CULEBRA RD
E COMMERCE ST
E SOUTHCROSS BLVD
GRISSOM RD
Southside ISD
SouthWest ISD
Lackland
FortSam
Northeast ISD
Edgewood ISD
EastCentral
ISDHarlandale
ISDSouth San ISD
Northside ISD
AlamoHeights
ISDJudson ISD
Northeast ISD
DemocracyPrep Stewart
ES
PershingES
GatesES
SmithES
MillerES
Hearly MurphySpecPro
DouglassACAD
WoodlawnHillsES
JeffersonHS
FenwickACAD
GonzalesECEC
TwainDL
Barkley- RuizES
WhittierMS
MaverickES
HarrisMS
BurbankHS
WilsonES
CollinsGarden
ES
EdisonHS
YWLAPRIMARY
HighlandHillsES
SamHouston
HS
YMLACAD
GreenACAD
BowdenES
LamarACAD
CameronES
MissionACAD
FosterACAD
HighlandParkES
H.RogersMS
GraebnerES
BriscoeES
MargilACAD
MadisonES
ML.KingACAD
Highlands &Texans Can
HS & SpecPro
LongfellowMS
HuppertzES
BaskinES
NelsonECEC
WashingtonES
CottonACAD
ArnoldES
Beacon HillACAD
De ZavalaES
OgdenACAD
LanierHS
IrvingDL
GW BrackenridgeHS, ECHS
SchenckES
ForbesACAD
TafollaMS
CrockettACAD
HirschES
RhodesMS
RiversidePark
ACAD
LowellMS
PoeMS
JaphetACAD
CASTMed
ACAD
St. Philips ECHSSatellite
TynanECEC
StormES
BonhamACAD
YWLACAD
HillcrestES
W.RogersACAD
JTBrackenridge
ES
FranklinES
NavarroSpecPro
HerffACAD
KnoxECEC
CarrollECEC
WoodlawnACAD
AL, Fox &CAST Tech
ACAD
CarvajalES
KellyES
S KingES
HawthorneACAD
TravisECHS
BallACAD
AL EuclidACAD
SteeleMontessoriACAD
DavisMS
BrewerSpecPro
NealES
EstradaSpecPro
LegendSAISD BoundaryOther Districts
San Antonio I.S.D. Mini Map
141 Lavaca StreetSan Antonio, TX 78210-1095
ES = Elementary SchoolMS = Middle SchoolHS = High SchoolACAD = AcademyECHS = Early College High SchoolECEC = Early Childhood Education CenterSpecPro = Special Program
328
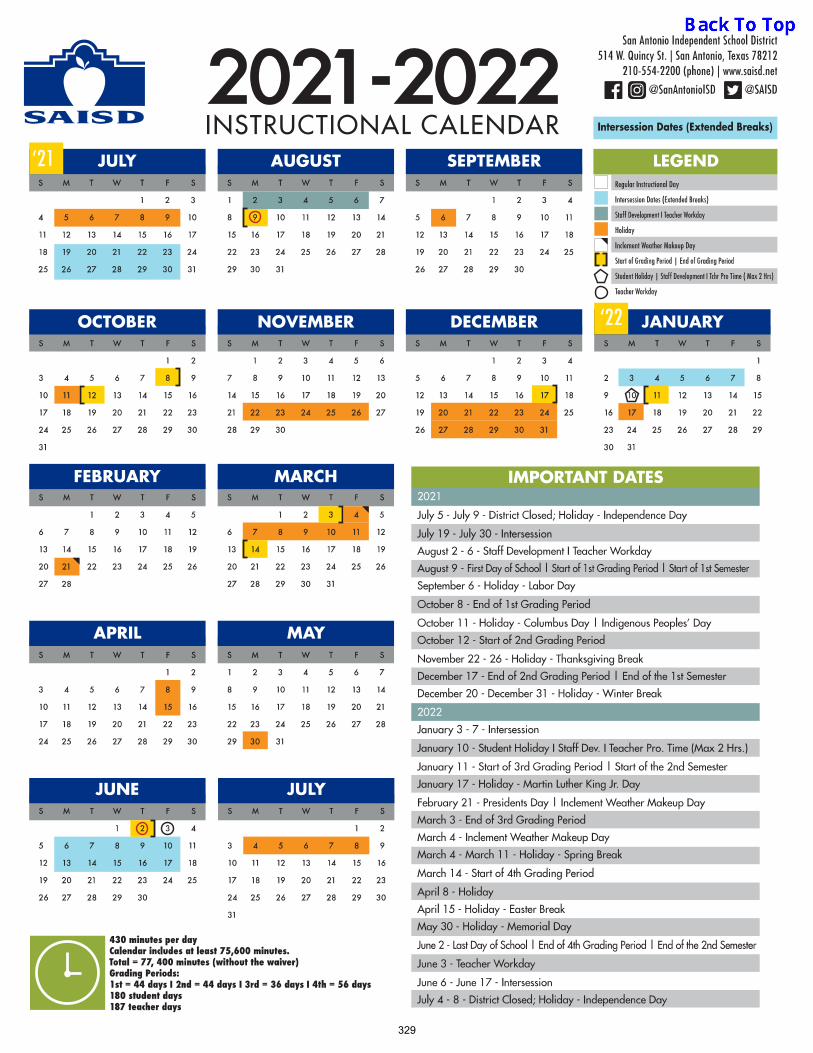
329
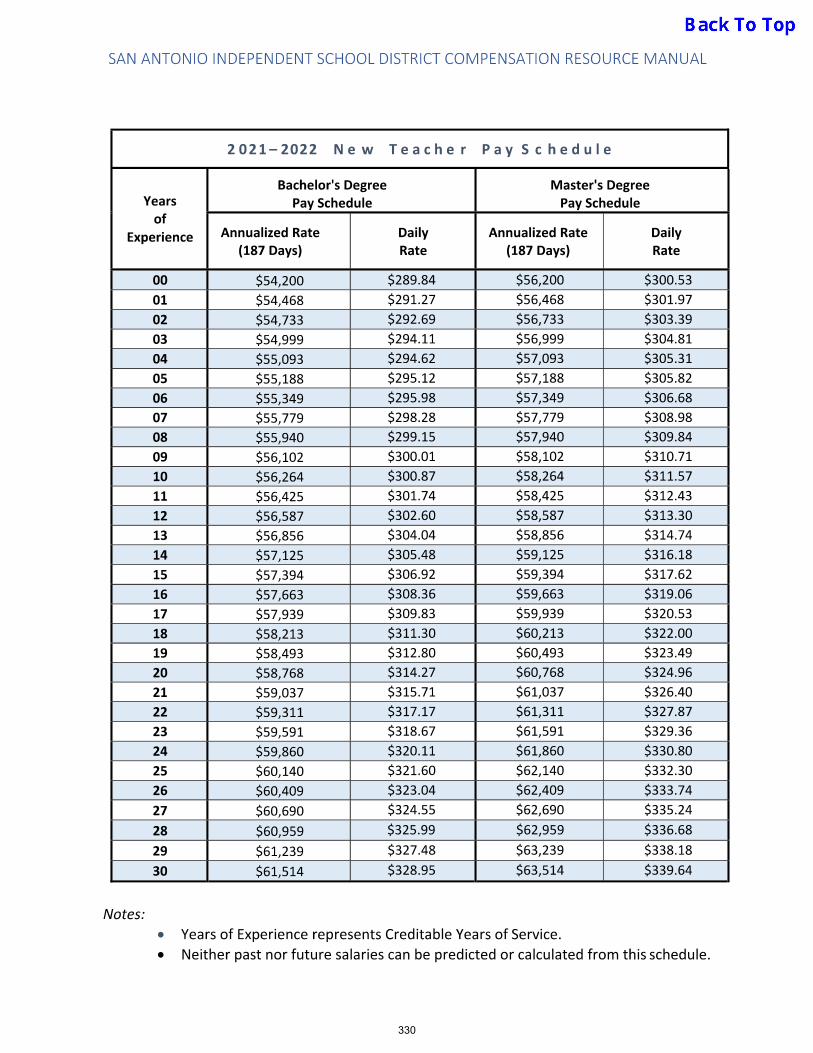
330
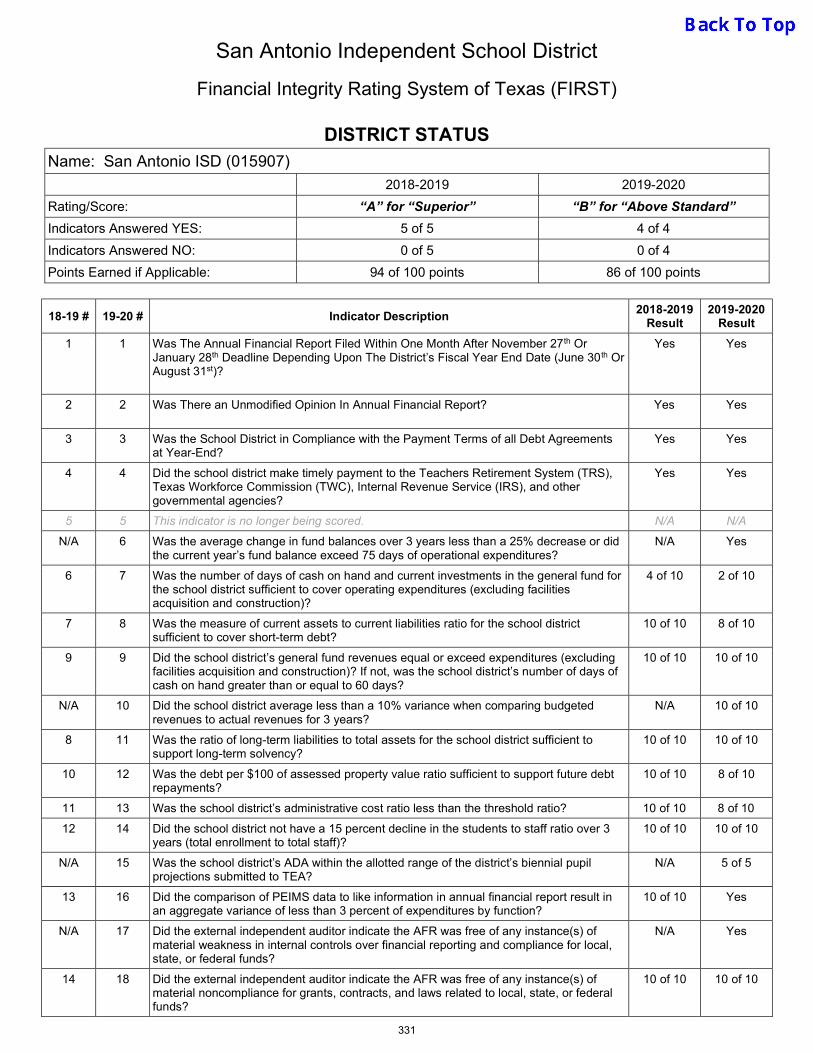
San Antonio Independent School District
Financial Integrity Rating System of Texas (FIRST)
DISTRICT STATUS Name: San Antonio ISD (015907)
2018-2019 2019-2020
Rating/Score: “A” for “Superior” “B” for “Above Standard”
Indicators Answered YES: 5 of 5 4 of 4
Indicators Answered NO: 0 of 5 0 of 4
Points Earned if Applicable: 94 of 100 points 86 of 100 points
18-19 # 19-20 # Indicator Description 2018-2019
Result 2019-2020
Result
1 1 Was The Annual Financial Report Filed Within One Month After November 27th Or January 28th Deadline Depending Upon The District’s Fiscal Year End Date (June 30th Or August 31st)?
Yes Yes
2 2
Was There an Unmodified Opinion In Annual Financial Report? Yes
Yes
3 3 Was the School District in Compliance with the Payment Terms of all Debt Agreements at Year-End?
Yes Yes
4 4 Did the school district make timely payment to the Teachers Retirement System (TRS), Texas Workforce Commission (TWC), Internal Revenue Service (IRS), and other governmental agencies?
Yes Yes
5 5 This indicator is no longer being scored. N/A N/A
N/A 6 Was the average change in fund balances over 3 years less than a 25% decrease or did the current year’s fund balance exceed 75 days of operational expenditures?
N/A Yes
6 7 Was the number of days of cash on hand and current investments in the general fund for the school district sufficient to cover operating expenditures (excluding facilities acquisition and construction)?
4 of 10 2 of 10
7 8 Was the measure of current assets to current liabilities ratio for the school district sufficient to cover short-term debt?
10 of 10 8 of 10
9 9 Did the school district’s general fund revenues equal or exceed expenditures (excluding facilities acquisition and construction)? If not, was the school district’s number of days of cash on hand greater than or equal to 60 days?
10 of 10 10 of 10
N/A 10 Did the school district average less than a 10% variance when comparing budgeted revenues to actual revenues for 3 years?
N/A 10 of 10
8 11 Was the ratio of long-term liabilities to total assets for the school district sufficient to support long-term solvency?
10 of 10 10 of 10
10 12 Was the debt per $100 of assessed property value ratio sufficient to support future debt repayments?
10 of 10 8 of 10
11 13 Was the school district’s administrative cost ratio less than the threshold ratio? 10 of 10 8 of 10
12 14 Did the school district not have a 15 percent decline in the students to staff ratio over 3 years (total enrollment to total staff)?
10 of 10 10 of 10
N/A 15 Was the school district’s ADA within the allotted range of the district’s biennial pupil projections submitted to TEA?
N/A 5 of 5
13 16 Did the comparison of PEIMS data to like information in annual financial report result in an aggregate variance of less than 3 percent of expenditures by function?
10 of 10 Yes
N/A 17 Did the external independent auditor indicate the AFR was free of any instance(s) of material weakness in internal controls over financial reporting and compliance for local, state, or federal funds?
N/A Yes
14 18 Did the external independent auditor indicate the AFR was free of any instance(s) of material noncompliance for grants, contracts, and laws related to local, state, or federal funds?
10 of 10 10 of 10
331

18-19 # 19-20 # Indicator Description 2018-2019
Result 2019-2020
Result
15 N/A Did the school district not receive an adjusted repayment schedule for more than one fiscal year for an over allocation of Foundation School Program (FSP) funds as a result of a financial hardship?
10 of 10 N/A
N/A 19 Did the school district Post the required financial information on its website in accordance with Government Code, Local Government Coe, Texas Education Code, Texas Administrative Code, and other statutes, laws and rules that were in effect at year end?
N/A 5 of 5
N/A 20 Did school board members discuss the district’s property values at a board meeting within 120 days before the district adopted its budget?
N/A Yes
DETERMINATION OF RATING
A. Did The District Answer No To Indicators 1, 2, 3, or 4? If So, The District’s Rating Is “F for Substandard Achievement” regardless of points earned.
B. 2018-19: Determine Rating By Applicable Range For summation of the indicator scores (Indicators 6-15) 2019-20: Determine Rating By Applicable Range For summation of the indicator scores (Indicators 6-20)
A = Superior Achievement 2018-19: 90-100 Points 2019-20: 90-100 Points
B = Above Standard Achievement 2018-19: 80-89 Points 2019-20: 80-89 Points
C= Meets Standard 2018-19: 70-79 Points 2019-20: 70-79 Points
F = Substandard Achievement 2018-19: <70 2019-20: <70
332

ENDEAVORS OF THE DIVISION OF FINANCE, BUSINESS OPERATIONS, AND STUDENT HEALTH SERVICES
It is the mission of the Division of Finance, Business Operations, and Student Health Services to provide sound fiscal management practices, in order to maximize available resources and provide for uses of those resources in a productive and efficient manner, so that the District can provide quality and equity in its delivery of services to attain excellence in educating our children. The Division of Finance, Business Operations, and Student Health Services addresses this mission by placing emphasis on financial stewardship, accountability and greater efficiency.
On November 3, 2020, SAISD voters approved a historic $1.3 billion bond that will have impact on every campus. The three key elements in the success of Bond 2020 included a demonstrated need, planning, and most importantly, voter confidence in the direction that the San Antonio Independent School District is moving. Among voters, almost 70% approved “Proposition A,” the $1.21 billion construction portion of Bond 2020, and almost 70% said yes to “Proposition B,” the $90 million technology component of the Bond. Due to language defined by the Texas legislature in 2019, building construction needed to be separated from technology upgrades. SAISD superintendent Pedro Martinez said that thanks to the community, students will benefit from new and improved learning environments with bigger classrooms, updated infrastructure and the latest technology. Indeed, Bond 2020 is historic. In fact, it’s the largest bond that SAISD has ever called, and the largest bond program ever sought in Bexar County.
On September 2019, our Board approved the Enterprise Resource Planning (ERP) and Student Information System (SIS) Frontline Platform, an enterprise solution software package specifically designed for K-12 institutions. The selected system is a modern, centralized and integrated system that will streamline current business practices as well as implement best practices and improve operational processes to ensure efficiency and effectiveness in the District’s daily operations. This purchase will provide a platform for the following District data: student, general ledger, financial, human resources, talent management, procurement, inventory and other program specific data modules. In addition, the Board approved the purchase with Frontline Education and authorized the Superintendent or his designee to exercise any renewals or extensions of the contract term pursuant to the contract’s provisions.
The Federal Programs department embarked on a “continuous improvement” initiative where all
department processes and forms are reviewed, streamlined, or improved whenever possible. This year, many forms were converted to be “Fillable” online forms, improving efficiency and saving paper waste. Additionally, all department forms are now centrally located on the department’s SharePoint site.
Two years ago, our Board approved an agreement with the University Health System to open onsite health clinics at two of our middle schools. The clinic at Tafolla Middle School opened in February 2020 and the second clinic at Davis Middle School opened in October 2020. The school-based clinics will be housed in portable buildings for patient privacy and will begin by serving students and campus staff within the Lanier and Sam Houston high school feeders – gradually expanding services to include as many District students and staff as capacity permits. Our hope is that this collaboration with the University Health System will reduce barriers to obtaining needed health services and decrease health-related absences, thereby improving student achievement.
333
The District has introduced a “no-fee” pay card, as an alternative to employees who do not have a way to participate in direct deposit of their paycheck. The District is considering options to offer employees to receive not only their paycheck, but also pay stubs and W-2s, in a more environmentally friendly and less expensive manner than printing paper forms.
Our Accounts Payable department is expanding the use of Automated Clearing House (ACH) payments, as another more efficient and less costly way to pay vendors and employee reimbursements. Currently, all employees that are signed up for direct-deposit for their payroll check, are automatically paid in the same manner for any reimbursements that may be paid to them. Any District vendor is also invited to participate in ACH payments with no fee, enabling these vendors to receive payments quickly, and more efficiently, than with paper checks.
The District introduced a new, online system for the purchase of tickets to District Athletic events. This system brings added convenience to our students, parents, and community members who attend our events, by allowing them to print tickets at home, and bypass the lines that often form at the ticket windows.
The District continued to participate in the Community Eligibility Provision for the National
School Lunch Program (NLSP) and School Breakfast Program (SBP), a program that was released initially for the 2014-15 school year. Community Eligibility gives school districts with high percentages of low-income children the option to offer free school meals to all children in those schools without collecting applications. Since the 2014-15 school year, all San Antonio ISD students have benefited with both breakfast and lunch at no charge, regardless of family income.
Students continue to benefit from the electronic health records system implemented by Health Services. A comprehensive individual health record follows the student through their SAISD academic career and assists with better continuity of care. Health issues can now be identified more timely and accurate data can be provided for health care management.
AWARDS, RECOGNITIONS & RATINGS Received “Above Standard Achievement” on the 2021 State of Texas School Financial Integrity
Rating System of Texas (School FIRST), which was based on information in the 2019-20 school year.
Received the Certificate of Achievement for Excellence in Financial Reporting from the Government Financial Officers Association for the thirty-third consecutive year.
Received the Certificate of Achievement for Excellence in Financial Reporting from the Association of School Business Officials (ASBO) International for the forty-first consecutive year.
Received the Distinguished Budget Presentation Award from the Government Financial Officers Association (GFOA) for the thirteenth time.
Received the Award for Best Practices in School Budgeting from the Government Financial Officers Association (GFOA) for Fiscal Year Ending 2018, 2019 and 2020.
Received the Meritorious Budget Award from the Association of School Business Officials (ASBO) International for the fifteenth consecutive year.
334


The following is a list of the commonly used acronyms throughout this budget document.
ACRONYMS
-A- AAS Advanced Academics Services ABE Adult Basic & Intermediate A.C. Achievement Center ACT American College Testing ADA Average Daily Attendance AADD Academic Achievement Distinction Designations ADM Average Daily Membership AEIS Academic Excellence Indicator System AEP Alternative Education Program AFT American Federation of Teachers AMI Accelerated Reading Initiatives AP Advanced Placement ARD Admission Review Dismissal ARI Accelerated Reading Initiatives ARRA American Recovery and Reinvestment Act ASBOI Association of School Business Officials International AVID Advances Via Individual Determination AYP Adequate Yearly Progress -B- BAD Bexar Appraisal District BCR Budget Change Request BOC Bilingual Opportunity Classroom -C- CAFR Comprehensive Annual Financial Report CATE Career and Applied Technology Education CCS Child Care Services CD
CEFPI Certificate of Deposit Council of Education Facility Planners International
CI Comparable Improvement C & I Curriculum and Instruction CIC Campus Instruction Coordinator CMS
COV Curriculum Management System COVID-19
CPF Capital Projects Fund CPTD Certified Property Tax Division CSHP Coordinated School Health Program CTE Career and Technology Education -D- DAEP Disciplinary Alternative Education Program DSF Debt Service Fund
335

The following is a list of the commonly used acronyms throughout this budget document.
ACRONYMS
-E- ECEC
ECHS Early Childhood Education Centers Early College High School
EE Early Education EDA Existing Debt Allotment ELA English Language Arts ELL English Language Learners ELPS English Language Proficiency Standards EOC
EPA End-of-Course Environmental Protection Agency
ES Elementary School ESL
ESSER English as a Second Language Elementary & Secondary School Emergency Relief Fund
-F- FASRG Financial Accountability System Resource Guide FFA Future Farmers of America FIRST Financial Indicator Rating System of Texas FPCD Facility Planning and Construction Department FTE Full Time Equivalent FSP Foundation School Program FY Fiscal Year -G- GAAP Generally Accepted Accounting Procedures GASB Governmental Accounting Standards Board GED General Educational Development GF General Fund GL General Ledger GFOA Governmental Finance Officers Association GPA Gold Performance Acknowledgement GPC
GPI Grade Placement Committee Genuine Progress Indicator
GOF General Operating Fund GT Gifted and Talented -H- HVAC
HB Heating, Ventilation, Air Conditioning House Bill
HFZ Health Fitness Zone HS High School -I- I & S Interest and Sinking IFA Instructional Facilities Allotment IMA Instructional Materials Allotment ISD Independent School District
336

The following is a list of the commonly used acronyms throughout this budget document.
ACRONYMS
IT Instructional Technology
-J-
JBSA JJAEP
Joint Base San Antonio Juvenile Justice Alternative Education Program
-K- K Kindergarten -L- LEP
LOTC Limited English Proficiency (Bilingual) Leadership Officer Training Corps
LOTE Languages Other Than English (Bilingual) LRE Least Restrictive Environment -M- MAC
M & O Medicaid Administrative Claiming Maintenance and Operations
MS Middle School -N- NAEYC National Association for the Education of Young Children NBA
NCAA National Basketball Association National Collegiate Athletic Association
-O- OMB Office of Management and Budget -P- PEIMS Public Education Information Management System PGA Professional Golf Association PLC Professional Learning Committees PK Pre-Kindergarten -Q- QSCB Qualified School Construction Bonds -R- RMTS Random Time Study ROTC Reserve Officers Training Corps -S- SAISD San Antonio Independent School District SAT Scholastic Aptitude Test SB Senate Bill SBDM Site-Based Decision Making SCE State Compensatory Education
337

The following is a list of the commonly used acronyms throughout this budget document.
ACRONYMS
SDAA State Developed Alternative Assessment SFSF State Fiscal Stabilization Funds SHARS School Health and Related Services SLC Smaller Learning Communities SR Survival Ration SRF Special Revenue Fund SSI Student Success Initiative SSL Spanish as a Second Language STAAR State of Texas Assessments of Academic Readiness -T- TAAS Texas Assessment of Academic Skills TAH Teaching American History TAKS Texas Assessment Knowledge and Skills TANF Temporary Assistance to Needy Families TASA Texas Association of School Administrators TASB Texas Association of School Board TEA Texas Education Agency TEAMS Texas Educating Adult Management System TEEM Texas Early Education Model TEKS Texas Essential Knowledge and Skills TFA Teach for America TIF Teacher Incentive Fund TPRI Texas Primary Reading Inventory TPS Texas Performance Standards TRS Texas Retirement System TTIPS Texas Title I Priority Schools Grant TTL
TWC Title Texas Workforce Commission
-U- UA Unit Adjustment UIL University Interscholastic League UTSA University of Texas at San Antonio -W- WADA Weighted Average Daily Attendance -Y- YTD Year-to-Date
338
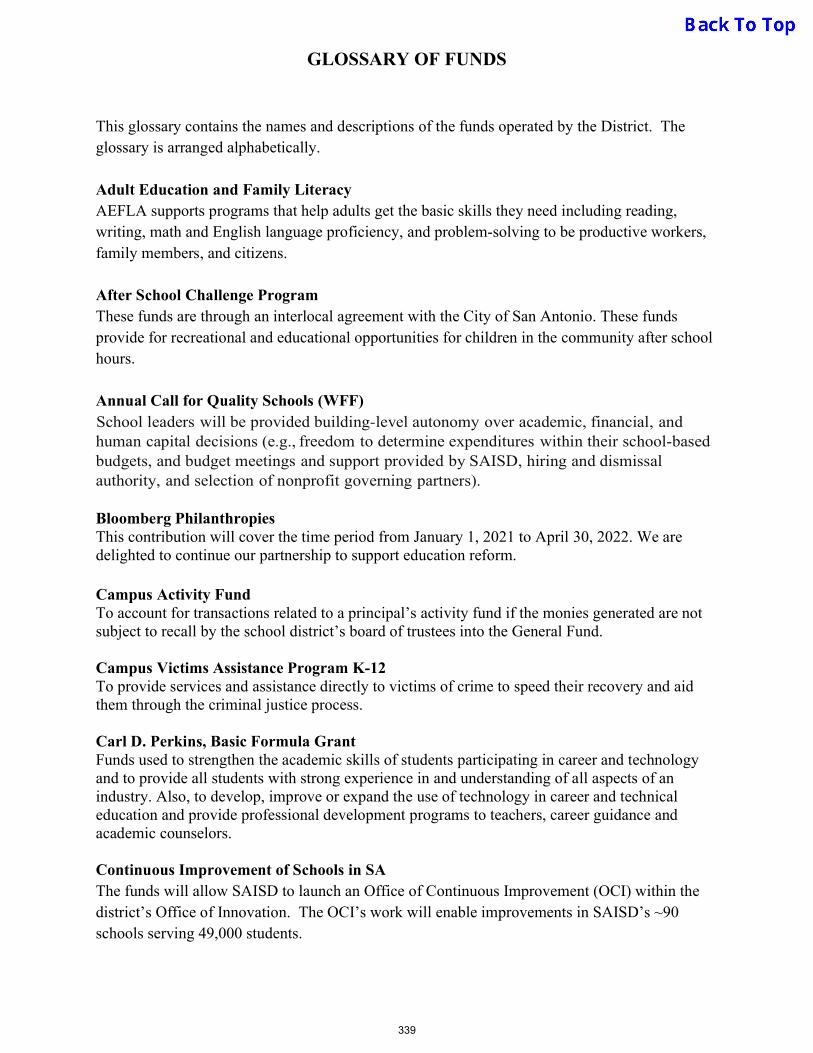
GLOSSARY OF FUNDS
This glossary contains the names and descriptions of the funds operated by the District. The glossary is arranged alphabetically. Adult Education and Family Literacy AEFLA supports programs that help adults get the basic skills they need including reading, writing, math and English language proficiency, and problem-solving to be productive workers, family members, and citizens. After School Challenge Program These funds are through an interlocal agreement with the City of San Antonio. These funds provide for recreational and educational opportunities for children in the community after school hours. Annual Call for Quality Schools (WFF) School leaders will be provided building-level autonomy over academic, financial, and human capital decisions (e.g., freedom to determine expenditures within their school-based budgets, and budget meetings and support provided by SAISD, hiring and dismissal authority, and selection of nonprofit governing partners). Bloomberg Philanthropies This contribution will cover the time period from January 1, 2021 to April 30, 2022. We are delighted to continue our partnership to support education reform. Campus Activity Fund To account for transactions related to a principal’s activity fund if the monies generated are not subject to recall by the school district’s board of trustees into the General Fund. Campus Victims Assistance Program K-12 To provide services and assistance directly to victims of crime to speed their recovery and aid them through the criminal justice process. Carl D. Perkins, Basic Formula Grant Funds used to strengthen the academic skills of students participating in career and technology and to provide all students with strong experience in and understanding of all aspects of an industry. Also, to develop, improve or expand the use of technology in career and technical education and provide professional development programs to teachers, career guidance and academic counselors. Continuous Improvement of Schools in SA The funds will allow SAISD to launch an Office of Continuous Improvement (OCI) within the district’s Office of Innovation. The OCI’s work will enable improvements in SAISD’s ~90 schools serving 49,000 students.
339
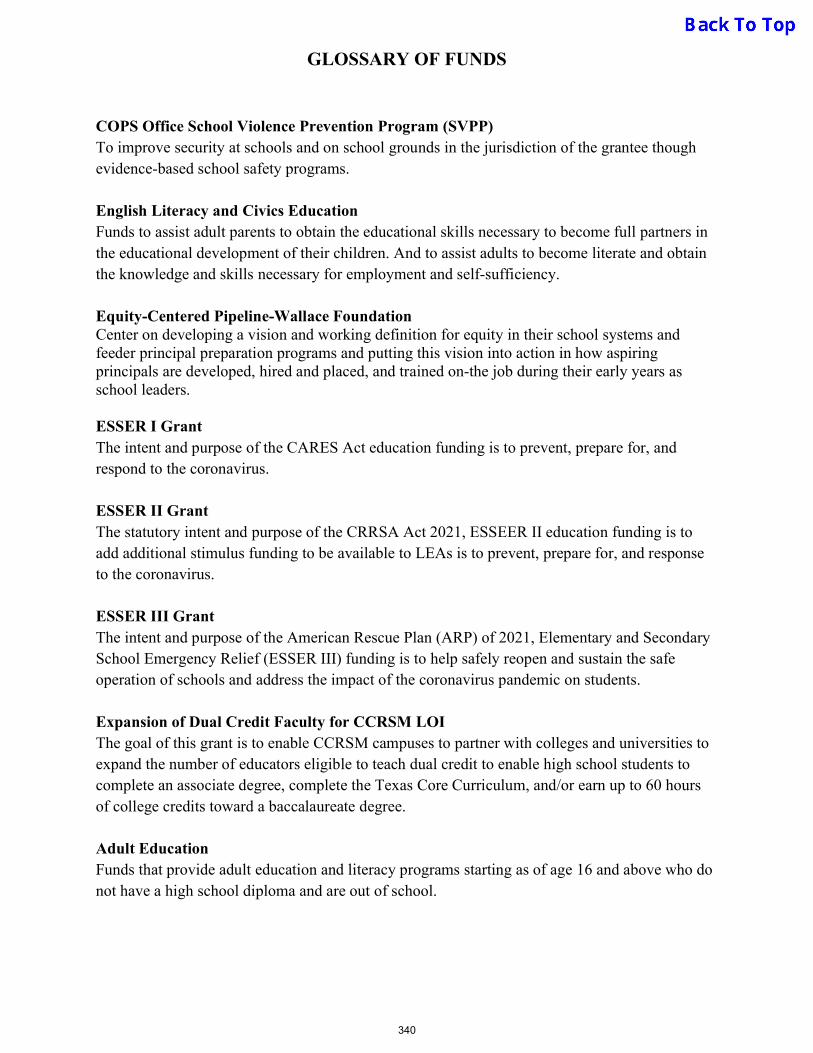
GLOSSARY OF FUNDS
COPS Office School Violence Prevention Program (SVPP) To improve security at schools and on school grounds in the jurisdiction of the grantee though evidence-based school safety programs. English Literacy and Civics Education Funds to assist adult parents to obtain the educational skills necessary to become full partners in the educational development of their children. And to assist adults to become literate and obtain the knowledge and skills necessary for employment and self-sufficiency. Equity-Centered Pipeline-Wallace Foundation Center on developing a vision and working definition for equity in their school systems and feeder principal preparation programs and putting this vision into action in how aspiring principals are developed, hired and placed, and trained on-the job during their early years as school leaders. ESSER I Grant The intent and purpose of the CARES Act education funding is to prevent, prepare for, and respond to the coronavirus. ESSER II Grant The statutory intent and purpose of the CRRSA Act 2021, ESSEER II education funding is to add additional stimulus funding to be available to LEAs is to prevent, prepare for, and response to the coronavirus. ESSER III Grant The intent and purpose of the American Rescue Plan (ARP) of 2021, Elementary and Secondary School Emergency Relief (ESSER III) funding is to help safely reopen and sustain the safe operation of schools and address the impact of the coronavirus pandemic on students. Expansion of Dual Credit Faculty for CCRSM LOI The goal of this grant is to enable CCRSM campuses to partner with colleges and universities to expand the number of educators eligible to teach dual credit to enable high school students to complete an associate degree, complete the Texas Core Curriculum, and/or earn up to 60 hours of college credits toward a baccalaureate degree. Adult Education Funds that provide adult education and literacy programs starting as of age 16 and above who do not have a high school diploma and are out of school.
340
GLOSSARY OF FUNDS
GT Visual Arts and Leadership Program Funds to support evidence-based research, demonstration projects, innovative strategies, and similar activities designed to build and enhance the ability to identify gifted and talented students and meet their special education needs. Head Start Program Grant funds that provide comprehensive early childhood education, health, nutrition and parent involvement services to low-income children and their families. IDEA-B – Discretionary Deaf Help ensure that eligible students with disabilities (Ages 3-21) are provided with a free appropriate public education as required by Federal statute. IDEA-B – Formula Supplemental federal funds ensure that eligible students (ages 3-21) with disabilities are provided with a free appropriate public education as required by federal statute. IDEA-B – Preschool Preschool provides supplemental resources to help LEAs ensure that eligible students (ages 3-5) with disabilities are provided with a free appropriate public education as required by federal statute. IDEA-C - ECI The purpose of IDEA-C is to carry out programs that provide early intervention services to infants and toddlers with auditory impairments ages 0-2. Instructional Continuity Grant The Instructional Continuity Grant is designed to provide supplemental resources to LEAs. Jobs and Education for Texans-Highlands H.S. The grant allows SAISD (Highlands HS) to purchase the equipment necessary to offer a comprehensive pathway for students to obtain an Associates of Applied Science (AAS) in Advance Manufacturing Technology (AMT) through St. Philip's College. Law Enforcement Officer Standards and Education Funds for expenses related to continuing education of licensed police officers. Network Principal Initiative-Bloomberg Funds are used to support the next cohort of network principals. This grant will fund roles and initiatives as well as contract work.
341
GLOSSARY OF FUNDS
Nita M. Lowey 21st Century Community Learning Centers (CCLC) Cycle 9 Year 5 The purpose of the 21st CCLC program is to assist students in meeting state and local academic achievement standards in core subjects, such as reading and mathematics, by providing the students with opportunities for academic enrichment activities and appropriate supplemental activities during non-school hours or periods when school is not in session. Perkins V: Strengthening CTE for 21st Century Funds used to strengthen the academic skills of students participating in career and technology and to provide all students with strong experience in and understanding of all aspects of an industry. Also, to develop, improve or expand the use of technology in career and technical education and provide professional development programs to teachers, career guidance and academic counselors. Pre-K for SA (ASEP) Grant Funds to enhance the current full-day prekindergarten education at SAISD Early Childhood Centers and at some elementary sites. Provides structured after-school enrichment and arts-integrated instruction in a safe and positive climate. Principal Residency Grant This grant program seeks to provide LEA's with an opportunity to build strong campus leaders and help support internal leadership pipelines through full-time, year-long principal residencies. Project Lead the Way Grant Funds to provide schools the opportunity to bring computer science education to students with a grant for the implementation of PLTW Gateway computer science units. P-Tech & ICIA Planning & Implementation Grant P-TECH and ICIA models allow students to receive a high school diploma, a work credential, an associate’s degree, and work-based education programs on or before the sixth anniversary of a student's first day of high school. P-Tech Success Grant Program To provide students with a smooth transitional experience to postsecondary and the workforce. Public Charter School Start-Up Grants
The purpose of this grant program is to provide financial assistance for the planning, program design, and initial implementation of charter schools and to expand the number of high-quality charter schools available to students. San Antonio Regional Day School Program for the Deaf (RDSPD) SSA-Tuition To Provide a quality educational program for students who are deaf or hard of hearing. Combining educational alternatives for students from participating LEAs into one cooperative educational program.
342
GLOSSARY OF FUNDS
School Safety and Security Grant To provide funding for additional safety and security equipment (campus hardening) such as: (1) exterior doors with push bars; (2) metal detectors at school entrances; (3) erected vehicle barriers; (4) security systems that monitor and record school entrances, exits, and hallways; (5) campus-wide active shooter alarm systems that are separate from fire alarms; (6) two-way radio systems; (7) perimeter security fencing; (8) bullet-resistant glass or film for school entrances; and (9) door-locking systems. School Transformation Fund-Implementation To assist districts with the planning and execution of school actions, providing an opportunity for school districts to create new and improved learning environments that substantially increase student achievement. School Transformation Fund-Planning Funds provide improvement and great school options for students and families in low-performing schools. This includes bold action to provide great school campuses, new and improved educational opportunities for students by transforming struggling campuses into high-quality autonomous campuses. State Adult Education- RG20 Funds that provide adult education and literacy programs starting as of age 16 and above who do not have a high school diploma and are out of school. State Deaf The purpose of State Deaf is to provide educational services to students ages 0-21 who are deaf or hard of hearing and enrolled in Regional Day School Programs for the Deaf (RDSPDs). Supplemental Services for the Visually Impaired Funds are targeted to improve the achievement of visually impaired students. Teacher Incentive Fund (TIF) This grant provides funds to support, develop, and implement sustainable performance-based compensation systems for teachers, principals and other personnel in high-need schools within the context of an overall Human Capital Management System in order to increase Educator effectiveness and student achievement. Teacher Leadership Cycle 2 This grant aims to increase the retention of highly effective teachers in Texas classrooms.
343
GLOSSARY OF FUNDS
Temporary Assistance for Needy Families (TANF) Federal funds that provide education services to undereducated adult recipients that receive cash assistance through TANF. Recipients of benefits are required to participate in adult basic education or job training programs as a condition of eligibility. Texas COVID Learning Acceleration Supports (TCLAS) Texas COVID Learning Acceleration Supports (TCLAS) is a set of funding and targeted supports available to Local Education Agencies (LEAs) to accelerate student learning in the wake of COVID-19, utilizing state and federal funds. Texas Department of Agriculture Fresh Fruit and Vegetable Program FFVP will introduce children to locally grown foods and provide the education they need to pursue healthy lifestyles Texas Education for Homeless Children and Youth (TEHCY) The purpose of this grant is to assist TEA with developing and marketing the Texas Education for Homeless Children and Youth (TEHCY) Statewide Summit. Grant activities include managing all aspects of the Summit’s redesign, creation, and execution in collaboration with TEA. Texas Volkswagen Environmental Mitigation Program The purpose of providing financial assistance for emissions reduction projects as authorized under Texas Water Code Section 5.124, the Volkswagen Environmental Mitigation Trust Agreement for State Beneficiaries (State Trust), and the Beneficiary Mitigation Plan for Texas. Title I 1003 - School Improvement This grant provides supplemental funds to campuses identified with high concentrations of students from low-income families provide high-quality education, which will enable all children to meet the state student performance standards. These funds are used to implement the required interventions. Title I, Part A - Improving Basic Programs Supplemental funds to provide resources to help schools with high concentrations of students from low-income families to acquire the knowledge and skills in the state content standards and to meet the state student performance standards. Title I, Part C – Migrant Funds used for instructional and support services for migrant students and out of school migrant youth.
344

GLOSSARY OF FUNDS
Title I, Part D- Subpart 2 -Delinquent Programs Funds to improve the educational services to children residing in facilities for delinquent children to acquire the knowledge and skills in the state content standards and state student performance standards. Title I, ESF-Focused Support Grant This grant program is intended to support the applicant with school-level improvement efforts to directly benefit these Comprehensive Support and Improvement, Targeted Support and Improvement, or Additional Targeted Support and Improvement schools. The Title I, 1003 Effective Schools Framework-Focused Support Grant should be used to support the awarded schools with efforts to strengthen campus systems, build staff capacity, improve school outcomes and continue implementation and/or support of their improvement efforts.
Title II, Part A – Supporting Effective Instruction Funds to improve student academic achievement by improving teacher and principal quality and increasing the number of effective teachers in classrooms and qualified principals and assistant principals in schools. Title III, Part A - ELA Title III, Part A ELA is to develop programs for limited English proficient students to attain English proficiency, develop high levels of academic attainment, and meet the state content standards and student achievement standards. Title III, Part A - IMMIGRANT Funds to develop programs for immigrant children to attain English proficiency, develop high levels of academic attainment, and meet the state content standards and student achievement standards. Title IV, Part A- Subpart 1 SSAEP Funds to improve student academic achievement by providing access to a well-rounded education; improve school conditions for student learning; and improve the use of technology. Transformation Zone Planning Grant This grant provides financial assistance to plan and design a Transformation Zone comprised of multiple campuses. These campuses are provided financial support for campus autonomy. The District's Transformation Zone is supported by dedicated zone leadership and support team that supports the development and oversight of strategies aimed at significantly improving academic outcomes.
345
GLOSSARY OF TERMS
This glossary contains definitions of terms used in this book and such additional terms as seem necessary to common understandings concerning financial accounting procedures for schools. Several terms that are not primarily financial accounting have been included because of their significance for school financial accounting. The glossary is arranged alphabetically with appropriate cross-referencing where necessary. ACADEMY - The term used when a campus may have grades PK- 8 and/or may be an in-district charter school. ACCOUNTABILITY - The state of being obliged to explain one’s actions, to justify what one does. Accountability requires governments to answer to the citizenry it represents, to justify the raising of public resources and the purpose for which they are used. ACCOUNTING SYSTEM - The methods and records established to identify, assemble, analyze, classify, record and report a government’s transactions and to maintain accountability for the related assets and liabilities. ACCRUAL BASIS - The recording of the financial effects on a government of transactions and other events and circumstances that have cash consequences for the government in the periods in which those transactions, events and circumstances occur, other than in the periods in which cash is received or paid by the government. ACCRUE - To record revenues when earned or when levies are made and to record expenditures as soon as they result in liabilities, regardless of when the revenue is actually received or the payment is actually made. Sometimes, the term is used in a restricted sense to denote the recording of revenues earned but not yet due, such as accrued interest on investments and the recoding of expenditures which result in liabilities that are payable in another account period, such as accrued interest on bonds. See also Revenue, Estimated and Expenditures. ACCRUED INTEREST - Interest accumulated between interest dates but not yet due. AD VALOREM TAXES - Taxes imposed in proportion to the value of assessed property. APPROPRIATION - A legal authorization granted by a legislative body to make expenditures and to incur obligations for specific purposes. An appropriation usually is limited in amount and time it may be expended. APPROPRIATION ACCOUNT - A budgetary account set up to record spending authorizations for specific purposes. The account is credited with original appropriations and any supplemental appropriations and is charged with expenditures and encumbrances. AMENDED BUDGET - The original adopted plus any amendments passed of a certain date. ASSETS - Property owned by the District which has monetary value. AVERAGE DAILY ATTENDANCE (ADA) - Average Daily Attendance is the average number of students in daily attendance in a given school year. A major part of the state funding formula is based on Average Daily Attendance.
346
GLOSSARY OF TERMS
AVERAGE DAILY MEMBERSHIP - An enrollment projection number used to calculate a budget for a campus in any given school year. AUDIT - A systematic examination of resource utilization concluding in a written report. It is a test of management’s internal accounting controls and is intended to: Ascertain whether financial statements fairly present financial position and results of operations, test whether transactions have been legally performed, identify area for possible improvements in accounting practices and procedures, ascertain whether transactions have been recorded accurately and consistently, and ascertain the stewardship of officials responsible for governmental resources. BALANCE SHEET - A financial statement disclosing the assets, liabilities, and equity of an entity at a specified date in conformity with GAAP (Generally Accepted Accounting Principles). BOARD OF EDUCATION, PUBLIC - The elected or appointed body that has been created according to State law and vested with the responsibilities for educational activities in a given geographical area. These bodies are sometimes called school boards, governing boards, boards of directors, school committees, school trustees, etc. This definition relates to the general term and covers State boards, intermediate administrative unit boards, and local basic administrative unit boards. BOND - A written promise, generally under seal, to pay a specified sum of money, called the face value, at a fixed time in the future called the date of maturity, and carrying interest at a fixed rate, usually payable periodically. The difference between a note and a bond is that the latter usually runs for a longer period of time and requires greater legal formality. See also Surety Bond. BONDED DEBT - The portion of indebtedness represented by outstanding bonds. Sometimes called "Funded Debt". BONDS AUTHORIZED AND UNISSUED - Bonds that have been legally authorized but not issued and which can be issued and sold without further authorization. BONDS ISSUED - This refer to bonds sold. BONDS PAYABLE - The face value of bonds issued and unpaid. BUDGET - A plan of financial operation embodying an estimate of proposed expenditures for a given period or purpose and the proposed means of financing them. The budget usually consists of three parts. The first part contains a message from the budget-making authority together with a summary of the proposed expenditures and the means of financing them. The second part is composed of drafts of the appropriations, revenue, and borrowing measures necessary to put the budget into effect. The third part consists of schedules supporting the summary. These schedules show in detail the proposed expenditures and means of financing them together with information as to past years’ actual revenues and expenditures and other data used in making the estimates. BUDGET CALENDAR - A schedule of key dates or milestones in which a government follows in preparation for the adoption of a budget.
347
GLOSSARY OF TERMS
BUDGETARY CONTROL - The control or management of the business affairs of the school district in accordance with an approved budget with a responsibility to keep expenditures within the authorized amounts. BUILDINGS - A fixed asset account, which reflects the acquisition value of permanent structures used to house persons and property, owned by the local education agency. If buildings are purchased or constructed, this account includes the purchase or contract price of all permanent buildings and fixtures attached to and forming a permanent part of such buildings. If buildings are acquired by gift, the account reflects their appraised value at the time of acquisition. CAPITAL BUDGET - A plan of proposed capital outlays and the means of financing them for the current fiscal period. It is usually a part of the current budget. If a Capital Program is in operation, it will be the first year thereof. A Capital Program is sometimes referred to as a Capital Budget. See Capital Program. CAPITAL OUTLAYS - Expenditures which result in the acquisition of an addition to fixed assets. CAPITAL PROGRAM - A plan for capital expenditures to be incurred each year over a fixed period of years to meet capital needs arising from the long term work program or otherwise. It sets forth each project or other contemplated expenditure in which the local education agency is to have a part and specified the full resources estimated to be available to finance the projected expenditures. CAPITAL PROJECTS - Projects that purchase or construct capital assets. Typically, a capital project encompasses a purchase of land and/or the construction of a buildings or facility. CAREER AND TECHNOLOGY EDUCATION (CATE) - This term refers to courses that are designed to help students identify careers and build skills necessary for success in the world of work. CERTIFICATE OF DEPOSIT - A negotiable or non-negotiable receipt for monies deposited in a bank of other financial institution for a specified period for a specified rate of interest. CHARTER SCHOOL, IN-DISTRICT - The term is used for a SAISD campus that operates as a charter school from authority granted by the State Board of Education. CODING - A system of numbering, or otherwise designating, accounts, entries, invoices, vouchers, etc., in such a manner that the symbol used reveals quickly certain required information. COHORT SURVIVAL RATIO - This is an enrollment projection method which essentially compares the number of students in a particular grade to the number of student in the previous grade during the previous year. Ratios are computed for each grade progression and are then used to project future enrollments. COMPENSATORY EDUCATION - Program and instructional services designed for at-risk students. These programs and services are funded with Compensatory Education funds. CONTRACTED SERVICES - Labor, materials and other costs for services rendered by personnel who are not on the payroll of the local education agency.
348
GLOSSARY OF TERMS
COST PER PUPIL - See Current Expenditures Per Pupil. CURRENT EXPENDITURES PER PUPIL - Current expenditures for a given period of time divided by pupil unit of measure (average daily membership, average daily attendance, etc.). CURRENT YEAR’S TAX LEVY - Taxes levied for the current fiscal period. DEBT - An obligation resulting from the borrowing of money or from the purchase of goods and services. Debts of local education agencies include bonds, time warrants and notes. DEBT LIMIT - The maximum amount of gross or net debt which is legally permitted. DEBT SERVICE - Expenditures for the retirement of debt and expenditures for interest on debt, except principal and interest of current loans. DEFICIT - The term refers to the excess of expenditures over revenues during an accounting period. DELINQUENT TAXES - Taxes remaining unpaid on and after the date on which they become delinquent according to state law. DEPARTMENT - A major administrative/supportive division of the district that indicates overall management responsibility for an operation or a group of related operations within a functional area. EFFECTIVE TAX RATE - The total tax levy for the school district divided by the State Comptroller Tax Division Index Value for the district, times 100, equals the effective tax rate per $100 valuation. (Also see Nominal Tax Rate.) ENCUMBRANCE ACCOUNTING - A system or procedure which involves giving recognition in the budgetary expenditure control records for the issuance of purchase orders, statements, or other commitments chargeable to an appropriation in advance of any liability or payment. ENCUMBRANCES - Funds which are set aside or committed for a future expenditure. Encumbrances include obligations in the form of purchase orders, contracts or salary commitments which are chargeable to an appropriation account. Used in budgeting, encumbrances are not GAAP expenditures or liabilities, but represent the estimated amount of expenditures ultimately to result if unperformed contracts in process are completed.
EQUIPMENT - Those moveable items used for school operations that are of a non-expendable and mechanical nature, i.e., perform an operation. Typewriters, projectors, computers, lathes, machinery, and vehicles, etc., are classified as equipment. (Heating and air-conditioning systems, lighting fixtures and similar items permanently fixed to or within a building are considered as part of the building.)
349

GLOSSARY OF TERMS
EXPENDITURES - Expenditures/expenses should be classified by the major object classes according to the types of items purchased or services obtained. An expenditure/expense account identifies the nature and object of an account, or a transaction. The school district’s accounting records are to reflect expenditures/expenses at the most detailed level. Expenditures are debited in the accounting period in which a measurable fund liability is incurred, except for unmatured principal and interest on general long-term debt, prepaid items, and other long-term obligations which are recorded as a debit in the accounting period when due. Expenses are debited in the accounting period in which they are incurred. FINANCIAL ACCOUNTABILITY SYSTEM RESOURCE GUIDE (FASRG) – This is an accounting guide produced by the Texas Education Agency for school district to use as a reference. FINANCIAL EXCELLENCE INDICAOR SYSTEM OF TEXAS (FEISTER) - Used to provide financial, academic program management, and resource allocation data. FINANCIAL INTEGRITY RATING SYSTEM OF TEXAS (FIRST) - This is a TEA rating system for Texas school districts in the area of finance. FISCAL PERIOD - Any period at the end of which a local education agency determines its financial position and the results of its operations. The period may be a month, a quarter, or a year, depending upon the scope of operations and requirements for managerial control and reporting. FISCAL YEAR - A twelve-month period of time to which the annual budget applies and at the end of which a local education agency determines its financial position and the results of its operations. The SAISD fiscal year is July 1 to June 30. FIXED ASSETS - Assets of a long-term nature that are intended to continue to be held or used such as land, buildings, machinery, furniture and other equipment. FOUNDATION SCHOOL PROGRAM (FSP) - It entitles Texas public school districts to provide a basic education for each student. Funding is comprised of local property taxes and state revenues. FUNCTION - This term refers to a mandatory 2-digit code applied to expenditures that identifies the purpose of the transaction. Examples: 11-Instruction; 23-School Administration; 33-Health Services, etc. FUND - A fiscal and accounting entity with a self-balancing set of accounts in which cash and other financial resources, all related liabilities and residual equities, or balances, and changes there in are recorded and segregated to carry on specific activities or attain certain objectives in accordance with special regulations, restrictions or limitations. FUND BALANCE - The difference between the assets and liabilities of a fund. During the fiscal year prior to closing, it represents the excess of the fund’s assets and estimated revenues over its liabilities, reserves and appropriations for the period. FURNITURE - Those moveable, non-expendable items used for school operations that are not of a mechanical nature. Chairs, tables, desks, file cabinets, and workstations, are examples of furniture.
350

GLOSSARY OF TERMS
GENERALLY ACCEPTED ACCOUNTING PRINCIPLES (GAAP) - Uniform minimum standards and guidelines for financial accounting and reporting set forth by the Governmental Accounting Standards Board. GENERAL FUND - The fund used to finance the ordinary operating of the local education agency. It is available for a legally authorized purpose and consists of money not specifically designated for some other particular purpose. GRANTS - An award of money from a governmental entity such as the State or Federal or a private entity usually for a specific purpose. INSTRUCTION - The activities dealing directly with the teaching of students. INTEREST & SINKING - The total amount to be expended by a taxing unit from property tax revenues to pay principal and interest on outstanding debts. INVESTMENTS - Securities such as certificates of deposit, money market saving accounts, US Treasury Notes, US Treasury Bills are purchased and held for the production of revenue in the form of interest and dividends. INVENTORY - A detailed listing of property currently held by the District showing quantities, descriptions and values of the property, and units of measure and unit prices. LEVY - (Verb) To impose taxes or special assessments. (Noun) The total of the taxes or special assessments imposed by a governmental unit. LIABILITY - Debt or other legal obligations arising out of transactions in the past, which must be paid, renewed or refunded at some future date. Note this does not include encumbrances. MAINTENANCE, FACILITIES (plant/buildings repairs and replacement of equipment) - Those activities which are concerned with keeping the grounds, buildings, and equipment at their original condition of completeness or efficiency, either through repairs or by replacements (anything less than replacement of a total building). MODIFIED ZERO BASED BUDGETING - A budget procedure for all non-schools made up of separate decision packages prepared for each department. An enhancement decision package must be prepared for all increases over prior year budget. The packages, including increases for inflation and services must be justified and compete for available resources. Schools are budgeted based on projected membership. NOMINAL TAX RATE - The tax rate for $100 valuation applied to the taxable value of property in the district. The county appraisal district determines the taxable value of property in the district. (Also see Effective Tax Rate) OBJECT CODE – As applied to expenditures, this code identifies the nature of a transaction or expenditure classification such as payroll costs; purchased and contracted services; supplies and materials; other operating costs; debt services; and capital outlay.
351

GLOSSARY OF TERMS
ORIGINAL BUDGET - The annual budget as adopted by the Board of Trustees. It includes the major fund groups (General Operating, Food Service and Debt Service Fund) and functions as mandated by the State of Texas. PAYROLL COSTS- This major classification includes the gross salaries or wages and benefit costs for employee services. An employee is paid a salary or wage. PERSONNEL, ADMINISTRATIVE - Personnel on the school payroll who are primarily engaged in activities which have as their purpose the general regulation, direction and control of the affairs of the school district that are system-wide and not confined to the school; for example, superintendent of schools, business manager and accountant, human resources manager, etc. PERSONNEL, CLERICAL - Personnel occupying positions which have as their major responsibilities the preparing, transferring transcribing, systematizing, or preserving of written communications and records. This also includes stock clerks, etc. PERSONNEL, HEALTH - Persons in the field of physical and mental health such as physicians, psychiatrists, school nurses, dentist, dental hygienists, psychiatric social workers, and therapists, whose services are directed primarily at individuals, although sometimes used for group activities. PERSONNEL, INSTRUCTIONAL ADMINISTRATION - Persons who manage, direct, and supervise the district-wide instructional program, and improve the quality of instruction and the curriculum. Included here are: supervisors of instruction, curriculum, research and development, etc. PERSONNEL, MAINTENANCE - Personnel on the school payroll who are primarily engaged in the repairing and upkeep of grounds, buildings, and equipment. POSITIONS AUTHORIZED - Refers to full-time and part-time positions with employee contracts that are budgeted in the adopted budget in the expenditure category called payroll costs. PROGRAM - The definition of an effort to accomplish a specific objective or objectives consistent with funds or resources available. Budgets and actual revenue and expenditure records may be maintained by program. PUBLIC EDUCATION INFORMATION MANAGEMENT SYSTEM (PEIMS) - An information system that requires all school districts to submit data on students, personnel and financial for use by the TEA and the Legislature. RECEIPTS, NONREVENUE - Amounts received that either incur an obligation that must be met at some future date or change the form of an asset from property to cash and thereafter decrease the amount and value of school property. Money received from loans, sale of bonds, sale of property purchased from capital funds, and proceeds from insurance loss settlements constitute most of the non-revenue receipts. REVENUES, ESTIMATED - Amounts estimated to be received based on local tax rates, state funding formula, federal grants and other known resources.
352

GLOSSARY OF TERMS
SCHOOL - A division of the school system consisting of a group of pupils composed of one or more teachers to give instruction of a defined type, and housed in a school plant of one or more buildings. More than one school may be housed in one school plant, as is the case when the elementary and secondary programs are housed in the same school plant. SCHOOL, ALTERNATIVE - A separately organized school offering alternative education programs for students at-risk of being suspended from the school system. The name refers to sites that offer educational programs to serve specific student needs. Campus Educational Programs are staffed with SAISD teachers and teacher assistants. SCHOOL, ELEMENTARY - A school classified as elementary by State and local practice and composed of any span of grades not above grade eight. In this book, this term includes pre-kindergartens if they are under the control of the local board of education. In SAISD, grades Pre-K to 6+ are the elementary schools. SCHOOL, MIDDLE - A separately organized secondary school inte5mediate between elementary and high school. In this district, some grades 6 to 8 are in the middle schools. SCHOOL, HIGH - A school offering the final years of schoolwork necessary for graduation; invariable preceded by a middle or junior high school in the same system. High schools in SAISD include grades 9 through 12. SCHOOL, SUMMER - The name applied to the school session carried on during the period between the end of one regular school term and the beginning of the next regular school term. SCHOOL PLANT - The site, building, and equipment constituting the physical facilities used by single school or by two or more schools sharing the use of common facilities. SCHOOL SITE - The land and all improvements to the site, other than structure, such as grading, drainage, drives, parking areas, walks, plantings, play courts, and play fields. SITE-BASED DECISION MAKING (SBDM) - A process in which the most effective decisions are made by those who will actually implement the decisions. The objective of SBDM is to improve student performance and to enhance accountability. Each campus has the responsibility to set its own educational objectives consistent with the school district’s goals from Vision 2010. SPECIAL REVENUE FUND - A fund used to account for the proceeds of specific revenue resources, other than trusts or capital projects, that is legally restricted to expenditures for specified purposes. STUDENT BODY ACTIVITIES - Direct and personal services for public school pupils, such as interscholastic athletics, entertainments, publications, clubs, band and orchestra, that are managed or operated by the student body under the guidance and direction of an adult, and are not part of the regular instructional program. These are usually called extracurricular activities. STUDENT OPERATING FUNDS - Campus level generated money, which enhances the general operating budget for the campus.
353
GLOSSARY OF TERMS
SURETY BOND - A written promise to pay damages or to indemnify against losses caused by the party or parties named in the document, through nonperformance or through defalcation; for example, a surety bond given by a contractor or by an official handling cash or securities. TAX LEVY - The total amount of funds to be raised by general property taxes for operating ad debt service purposes that is determined by the Bexar County Appraisal District. TAXES - Compulsory charges levied by a governmental unit for the purpose of financing services performed for the common benefit. It does not include special assessments. TAX ROLL - The official list showing the amount of taxes levied against each taxpayer or property from the Bexar County Appraisal District. TEXAS ASSESSMENT OF KNOWLEDGE AND SKILLS (TAKS) - This is an examination for students in grades 3 through 11 that measures knowledge and skills taught in public schools, and which is used to allow students to progress to the next higher grade. This test was administered for the first time during school year 2003-2004. The Texas Assessment of Academic Skills (TAAS) was TAKS predecessor. TEXAS EDUCATION AGENCY (TEA) - This agency exercises general control of the public education at the state level in accordance with the provisions of the Texas Education Code. TIER I - This term refers to each school district’s share of the foundation school program. It consists of an allotment per student times ADA plus categorical aid for special population students. TIER II - This term refers to a guarantee yield component of the Foundation School program which provides each school district with the opportunity to enrich the basic educational program funded through Tier I. Each school district is guaranteed a specified amount per weighted student in state and local funds for each cent of tax effort over that required for the districts local fund assignment up to the maximum specified by state law. TEACHER RETIREMENT SYSTEM (TRS) - An agency of the state of Texas created to provide service and disability retirement benefits and administer a healthcare program for all eligible public school employees. VIA - This term refers to by means of or by way of or through. WEIGHTED AVERAGE DAILY ATTENDANCE (WADA) - This is used to in Tier II to represent a count of students. In simplified terms, it is the result of dividing the cost of Tier I by the Tier I adjusted basic allotment. YIELD – The rate earned on an investment based on the price paid for the investment, the insert earned during the period held, and the selling price or redemption value of the investment.
354
Thank you for your interest in the 2021-22 District Budget for
San Antonio Independent School District
SAISD JROTC cadets throughout the district held 9/11 remembrance ceremonies for the 20th anniversary of the tragedy, and pictured
are Jefferson and Burbank High Schools.
355