Distribution patterns of epipelagic copepods off Rio de Janeiro (SE Brazil) in summer 1991/1992 and...
14
Hydrobiologia 411: 161–174, 1999. © 1999 Kluwer Academic Publishers. Printed in the Netherlands. 161 Distribution patterns of epipelagic copepods off Rio de Janeiro (SE Brazil) in summer 1991/1992 and winter 1992 Rubens M. Lopes 1,2, * , Frederico P. Brandini 1 & Salvador A. Gaeta 3 1 Centro de Estudos do Mar, Universidade Federal do Paran´ a, Pontal do Paran´ a, PR 83255-000, Brazil 2 Present address: UESC, Depto de Ciências Biol´ ogicas, Ilh´ eus, BA 45650-000, Brazil E-mail address: [email protected] 3 Instituto Oceanogr´ afico, Universidade de São Paulo, São Paulo, SP 05508-900, Brazil Received 9 June 1998; in revised form 27 May 1999; accepted 4 July 1999 Key words: copepods, distribution, continental shelf, hydrography, South-west Atlantic, Brazil Abstract The spatial distribution of copepod populations on the eastern continental shelf off Rio de Janeiro State, Brazil, was analysed in relation to the hydrographic regime in December–January (summer 1991/92) and July (winter 1992). Advection of cold and nutrient-rich South Atlantic Central Water (SACW) onto the shelf was a prevailing circula- tion mechanism in both seasonal cruises. The SACW occupied a larger proportion of bottom layers in summer as compared to winter, but only in the latter a well-defined upwelling event was recorded off Cape Frio. Two calanoid copepods were representative of shelf areas influenced by SACW intrusions: Calanoides carinatus, which occurred mainly during summer and Ctenocalanus vanus, recorded at high densities in both periods. Paracalanus quasimodo was the dominant copepod at inner- and mid-shelf stations both in summer and winter, followed by Temora spp. and Oncaea spp. These coastal species peaked at the upwelling site. A highly diversified and comparatively less abundant copepod assemblage, dominated by Clausocalanus furcatus and Oithona plumifera, was recorded in outer-shelf stations occupied by the oligotrophic Tropical Waters of the Brazil Current. We conclude that regional and seasonal contrasts in copepod species composition and abundance are controlled to a great extent by the advection and upwelling of the SACW onto the shelf. Introduction The oceanographic structure off Rio de Janeiro State (Figure 1) is basically formed by the same water masses of southern Brazil, as described by Emilsson (1961). Tropical Waters (TW) of the Brazil Current are transported from the northeast towards the south- west, as part of the South Atlantic western boundary current system. In surface layers of the outer-shelf and offshore regions salinities and temperatures are >36 psu and >20 ◦ C, respectively. In oceanic areas a permanent thermocline separates the upper warm water from the deeper South Atlantic Central Water (SACW; Sverdrup et al., 1946; Emilsson, 1961). The * Author for correspondence intrusion of such cold (<20 ◦ C), less saline (<36) and nutrient-rich water over the bottom of the shelf is a ma- jor regional feature from December to March, due to the predominance of longshore northeast winds. These winds drive surface coastal waters away from the coast due to Ekman transport, allowing the penetration of deep cold waters belonging to the SACW towards the coast (Castro & Miranda, 1998). Bottom intrusions determine well-defined thermo- clines in the shelf domain and, if sufficiently strong, they may shift the thermocline upward the euphotic zone, or even reach the surface during short (<10 days) coastal upwelling episodes (Mascarenhas et al., 1971; Signorini, 1978; Valentin, 1984a). Such events are more frequent off Cape Frio where the continental shelf is comparatively narrow than in adjacent shelf
Transcript of Distribution patterns of epipelagic copepods off Rio de Janeiro (SE Brazil) in summer 1991/1992 and...
Hydrobiologia 411: 161–174, 1999.© 1999Kluwer Academic Publishers. Printed in the Netherlands.
161
Distribution patterns of epipelagic copepods off Rio de Janeiro(SE Brazil) in summer 1991/1992 and winter 1992
Rubens M. Lopes1,2,∗, Frederico P. Brandini1 & Salvador A. Gaeta31Centro de Estudos do Mar, Universidade Federal do Paran´a, Pontal do Paran´a, PR 83255-000, Brazil2Present address: UESC, Depto de Ciências Biol´ogicas, Ilheus, BA 45650-000, BrazilE-mail address: [email protected] Oceanogr´afico, Universidade de São Paulo, São Paulo, SP 05508-900, Brazil
Received 9 June 1998; in revised form 27 May 1999; accepted 4 July 1999
Key words:copepods, distribution, continental shelf, hydrography, South-west Atlantic, Brazil
Abstract
The spatial distribution of copepod populations on the eastern continental shelf off Rio de Janeiro State, Brazil, wasanalysed in relation to the hydrographic regime in December–January (summer 1991/92) and July (winter 1992).Advection of cold and nutrient-rich South Atlantic Central Water (SACW) onto the shelf was a prevailing circula-tion mechanism in both seasonal cruises. The SACW occupied a larger proportion of bottom layers in summer ascompared to winter, but only in the latter a well-defined upwelling event was recorded off Cape Frio. Two calanoidcopepods were representative of shelf areas influenced by SACW intrusions:Calanoides carinatus, which occurredmainly during summer andCtenocalanus vanus, recorded at high densities in both periods.Paracalanus quasimodowas the dominant copepod at inner- and mid-shelf stations both in summer and winter, followed byTemoraspp.andOncaeaspp. These coastal species peaked at the upwelling site. A highly diversified and comparatively lessabundant copepod assemblage, dominated byClausocalanus furcatusand Oithona plumifera, was recorded inouter-shelf stations occupied by the oligotrophic Tropical Waters of the Brazil Current. We conclude that regionaland seasonal contrasts in copepod species composition and abundance are controlled to a great extent by theadvection and upwelling of the SACW onto the shelf.
Introduction
The oceanographic structure off Rio de Janeiro State(Figure 1) is basically formed by the same watermasses of southern Brazil, as described by Emilsson(1961). Tropical Waters (TW) of the Brazil Currentare transported from the northeast towards the south-west, as part of the South Atlantic western boundarycurrent system. In surface layers of the outer-shelfand offshore regions salinities and temperatures are>36 psu and>20 ◦C, respectively. In oceanic areasa permanent thermocline separates the upper warmwater from the deeper South Atlantic Central Water(SACW; Sverdrup et al., 1946; Emilsson, 1961). The
∗ Author for correspondence
intrusion of such cold (<20◦C), less saline (<36) andnutrient-rich water over the bottom of the shelf is a ma-jor regional feature from December to March, due tothe predominance of longshore northeast winds. Thesewinds drive surface coastal waters away from the coastdue to Ekman transport, allowing the penetration ofdeep cold waters belonging to the SACW towards thecoast (Castro & Miranda, 1998).
Bottom intrusions determine well-defined thermo-clines in the shelf domain and, if sufficiently strong,they may shift the thermocline upward the euphoticzone, or even reach the surface during short (<10days) coastal upwelling episodes (Mascarenhas et al.,1971; Signorini, 1978; Valentin, 1984a). Such eventsare more frequent off Cape Frio where the continentalshelf is comparatively narrow than in adjacent shelf

162
Figure 1. Map of the study area showing the positions of transectsand stations.
waters further north (Figure 1). The inner and mid-shelf regions are dominated by Shelf Waters (SW),with salinities between 34.5 and 36 psu and temper-atures above 20◦C, resulting from the mixing of theTW, SACW and continental drainage (coastal water,CW).
Investigations on epipelagic copepods off Brazil,reviewed by Brandini et al. (1997), started at the endof last century. Björnberg (1963) provided the firstdetailed account on the communities of epipelagicspecies in relation to the distribution of water masses.This pioneering study was subsequently supplementedwith taxonomic details and ecological considerations(e.g. Björnberg, 1980, 1981; Valentin, 1984b; Cam-paner, 1985; Campaner & Honda, 1987). During thepast 20 years, many investigations have describedthe plankton community off Cape Frio (reviews byValentin, 1989; Brandini et al., 1997). However, onlylimited information on copepod assemblages occur-ring to the north of the Cape Frio region is available(Valentin & Monteiro-Ribas, 1993).
The objective of this paper is to analyze the spatialdistribution of pelagic copepods in the shelf area offRio de Janeiro State during two seasonally differentperiods in relation to basic hydrographic characterist-ics.
Material and methods
A total of 40 stations were occupied in the studyarea during summer (December 29, 1991–January 19,1992) and winter (June 27–July 15, 1992) (Figure 1).The stations were positioned along five transects (T1–T5) across the shelf up to the continental slope. Cross-shelf sections are here defined according to the localbathymetry: the terms inner, mid- and outer shelf rep-resent sections between the shoreline and 20 m, from20 to 100 m and more than 100 m depth, respectively.Most stations were occupied during daytime.
Zooplankton samples were obtained from verticalhauls made above and below the pycnocline (as de-termined from CTD casts), or taking the mid-depth asreference when strong physical gradients were absent.The net used was of an opening-closing type, with0.2 m2 mouth area and fitted with a 200µm meshedgauze, and a TSK flowmeter mounted centrally in themouth of the net. Net hauls were made from 5 m offthe ocean floor to the pycnocline or the mid-depth inthe lower strata and from just above the pycnocline ormid-depth to the surface in the upper strata. Therefore,the depth of both strata varied according to sound-ing and to the thermal structure of the water column.Since the thermocline changed in position, being evenabsent at several stations, the spatial distribution ofcopepods is graphically represented using the averageconcentration for the whole water column.
Samples were preserved in 4% buffered formalde-hyde. Whole samples, or aliquots representing up to1/128 of the sample (obtained with a Motoda splitter),were analysed under a WILD M8 stereomicroscopeand at least 30 individuals of each dominant specieswere enumerated. Individuals belonging to less abund-ant species were counted in whole samples. Copepodswere identified to the species level whenever possible.Adults and juveniles were enumerated separately toprovide a more realistic estimate of total species dens-ities. However, the developmental stages of imatureindividuals (CI–CV) were not discriminated in thisstudy.
The vertical distribution of selected copepod spe-cies was analyzed using the parameterV of Huntley &Escritor (1991),
V = log10(Du/Dl),
whereDu is the copepod density in the upper layerandDl is the copepod density in the lower layer at thesame station. Positive and negativeV values indicate
163
greater densities respectively in the upper and lowerlayer.
A principal component analysis (PCA) was per-formed to assess the main trends of variability inthe data. PCA included biotic and abiotic variables(Table 3) averaged over the same depth strata as thenet hauls, besides the abundances of the most fre-quent copepod species, i.e. those occurring in morethan 10% of the samples. Abundances were log-transformed [log(x+1)] to obtain a homoscedastic datadistribution (Legendre & Legendre, 1984). Raw envir-onmental data were used for the PCA, except in thecase of total phytoplankton densities (cells/l), whichwere log-transformed as above. Environmental datawere obtained from Cacciari et al. (1994), Gaeta(1994) and Moser (1997).
Results
Details on the physical structure of water masses dur-ing the summer and winter cruises have been reportedby Cacciari et al. (1994), so only aspects relevant tothe present study are summarized here.
The horizontal distribution of water in the strataabove and below the pycnocline is depicted in Fig-ure 2. The surface layer showed a similar pattern ofwater mass distribution in both cruises, with the Trop-ical Water (TW) occupying a large offshore extent ofthe northern transects, but being restricted to the outershelf and slope areas in the south (T1 and T2), whereshelf water predominated. On the other hand, watermass distribution in the bottom layer varied accordingto the season. During summer, the SACW occupiedboth the southern and northeastern borders of the studyarea, as well as the mid-shelf regions between CapeFrio and Cape of São Tomé. Shelf Water (SW) andTW were present from mid-shelf to the outer stationsof T2 and T3 and in most of T5, the former also ina narrow belt near the coast. During winter, SW andTW dominated the northern transects. The SW wasmore spread across the entire shelf in the centre of thestudy area (T3). The SACW penetrated over the bot-tom of the shelf in the southern part of the study area(mainly T1 and T2) and a nucleus of surface upwellingof SACW was observed off Cape Frio.
The vertical structure of water masses in transectsT1 and T2 is illustrated in Figure 3, showing that thegreater depths of the continental shelf off Cape Friofacilitate the intrusion of SACW, which dominated thelower half of the water column of T1 in both periods.
In contrast, the presence of SACW near the bottomof T2 (as representative of the northernmost transects)was not as extensive as in T1.
The copepod assemblages were numerically dom-inated by Paracalanus quasimodo, Ctenocalanusvanus and Calanoides carinatus, followed byClausocalanus furcatus, Temora stylifera, T. tur-binata, Oncaea curta, O. venusta, Oithona plum-ifera and Corycaeus giesbrechti(Table 1). There-fore the analysis of dominant copepod distributionfocused mainly on these taxa. The generaAcar-tia, Acrocalanus, Calanopia, Calocalanus, Can-dacia, Centropages, Eucalanus, Lucicutia, Mecyno-cera, PleuromammaandFarranula were common inthe samples but usually less abundant.
Total copepod abundances were generally higheron the inner shelf on all transects, especially in thenorth of the study area during summer, whilst inthe south during winter (Figure 4A). However, highabundances were also recorded at mid-shelf stationson transects T2 and T3, especially during summer.A bimodal summer distribution was evident on T5,with maxima at either end of the transect. Althoughabundances were usually higher during summer onT2, T3, T4 and T5, winter abundances on T1 offCape Frio, were almost always higher (up to 61 207ind. m−3). Longshore variations in copepod abund-ance were large. On transect T1, copepod abundancesdid not exceed 2500 ind. m−3 in either sampling peri-ods, except for the near-shore stations 1 and 2 wherepeak abundances were recorded during winter. On theother hand, much higher numbers were observed ontransects T2, T3 and T4. Lower copepod abundancesoccurred again at the northern extent of the study areaon transect T5.
Paracalanus was the most abundant copepodgenus in the study area (Table 1), so that its distri-bution pattern mirrored that of total copepods (Fig-ure 4B).P. quasimodowas the dominant species, fol-lowed byP. indicus(Table 1). On average, this genuswas more abundant during summer, with abundancesof >2500 ind. m−3 at several coastal and mid-shelfstations. However, a peak of almost 50 000 ind. m−3
was recorded at station 1 off Cape Frio during winter.Low abundances occurred in most of the outer shelf,except in the slope region on T5.
Ctenocalanus vanuswas more abundant at inner-and mid-shelf stations, decreasing towards the outershelf. Except for the mid-shelf stations of T2 and T3,winter abundances were usually higher than in sum-mer (Figure 4C). Peak concentrations of about 2000

164
Figure 2. Schematic representation of the horizontal distribution of water masses in surface (approx. 5 m depth) and bottom (approx. 5–10 mabove the sea floor) layers. SACW: South Atlantic Central Water; TW: Tropical Water; SW: Shelf Water.

165
Figure 3. Vertical structure of water masses along transect T1 (off Cape Frio) and T2 in Summer (January) and Winter (July). SACW: SouthAtlantic Central Water; TW: Tropical Water; SW: Shelf Water.
ind. m−3 were observed on T3 (st. 22 and 23) duringthe summer cruise. High abundances of this specieswere also detected during winter in coastal areas offCape Frio and in mid-shelf areas of the northernmosttransects T4 and T5.
In contrast,Calanoides carinatuswas remarkablymore abundant at the mid-shelf stations of all transectsduring the summer cruise (Figure 4D). This specieshad lower abundances at inner- and outer-shelf sta-tions, but a secondary peak occurred in the slope areaof T5 (station 36).
The two species ofTemorashowed different pat-terns of spatial distribution during both study periods.On average, densities were one order of magnitudelower thanC. vanus, C. carinatusandP. quasimodo.During summer,T. styliferaoccurred at comparativelyhigh abundances (up to 270 ind. m−3) at station 4 oftransect T1, at the mid-shelf stations of T2 and at innerand mid-shelf stations of T4 and T5. Mean concentra-tions decreased in winter, except for station 1 off CapeFrio (T1), some mid-shelf stations of T2 and T3 andthe innermost station of T3 (Figure 4E). On average,T. turbinatashowed lower abundances thanT. stylifera(Table 1 and Figure 4F). Although high concentrations
were recorded at stations 1 (T1), 22 (T3) and 26 (T4)during winter, mean values during both cruises werebelow 100 ind. m−3 for T. turbinata.
Clausocalanusspp. (represented mainly byC.furcatus) was comparatively more abundant duringwinter – except at T5 – at mid- and outer-shelf areas(Figure 4G). Except for the peaks of up to 1124 ind.m−3 at mid-shelf stations of T2, abundances rangedfrom 25 to 450 ind. m−3.
The dominant species of the genusOithonawasO.plumifera, followed by O. nana. Cross-shelf abund-ances ofOithona spp. varied between 20 and 1126ind. m−3, decreasing seaward with clear seasonal dif-ferences evident at the innermost stations (Figure 4H).
The genusOncaea (represented mainly byO.venusta, O. mediaandO. curta) was remarkably moreabundant during winter (Figure 4I). Peak concentra-tions of up to 940 ind. m−3 were observed at theinner and mid-shelf stations of transects T1, T2 andT3, decreasing sharply seawards. The northernmosttransects showed no apparent cross-shelf variations forboth periods.
The Corycaeidae (Figure 4J), including species ofthe generaCorycaeusandFarranula, were dominated

166
Table 1. Maximum and mean abundances (ind. m−3) of the dominant copepod taxa and their affinity to local water masses, according toBjörnberg (1981). Standard deviations (SD) and number of stations (n) where each taxa was recorded are shown
Species Water mass Summer Winter
Max. Mean SD n Max. Mean SD n
Acartia danae TW 33 5 8 23 7 5 5 2
Acartia lilljeborgi CW 141 11 34 4 n.d. n.d. n.d. –
Acrocalanus longicornis TW 30 4 7 5 18 5 8 4
Calanoides carinatus SACW/SW 3989 285 766 37 277 22 79 31
Calanopia americana SW/TW 231 10 33 19 55 10 17 3
Calocalanusspp. SW/TW 41 7 11 18 506 60 87 30
Candaciaspp. TW 67 5 10 25 3 1 1 3
Centropages velificatus CW/SW 44 3 7 22 12 5 5 3
Clausocalanus furcatus TW/SW 312 26 126 31 1087 90 267 38
Corycaeus amazonicus CW 22 8 11 5 n.d. n.d. n.d. –
Corycaeus giesbrechti CW/SW 210 130 40 36 340 99 57 38
Corycaeus speciosus TW 7 3 4 5 3 2 2 4
Ctenocalanus vanus SACW/SW 2464 204 571 29 1389 370 563 39
Euaetideus giesbrechti SACW 2 1 1 5 3 1 2 3
Eucalanus pileatus SW 77 3 10 9 10 4 4 3
Euchaeta marina TW 8 2 4 8 4 2 2 3
Euterpina acutifrons CW 21 18 19 2 3 1 1 3
Farranula gracilis TW 78 15 25 17 27 16 17 4
Haloptilus longicornis SACW 4 1 2 6 2 1 1 3
Haloptilusspp. TW 8 1 2 3 2 1 1 4
Heterorhabdus papilliger SACW 2 1 1 4 3 2 2 3
Lucicutiaspp. TW 100 4 12 13 11 3 4 4
Macrosetella gracilis TW 1 1 1 2 11 2 4 3
Mecynocera clausi TW 47 5 10 18 20 5 6 3
Nannocalanus minor TW 4 2 2 9 25 5 11 4
Oithona hebes CW 22 4 14 4 15 3 8 4
Oithona nana CW 273 40 85 20 67 12 25 9
Oithona plumifera TW/SW 1008 125 279 30 544 60 194 33
Oithona setigera TW 21 3 9 9 3 2 2 9
Oncaea curta CW 230 22 68 18 610 71 200 36
Oncaea media SW 32 2 8 20 687 103 233 33
Oncaea subtilis SW 35 20 34 5 40 12 20 10
Oncaea venusta SW/TW 233 12 37 23 27 9 12 35
Paracalanus aculeatus SW 20 5 9 23 67 8 22 29
Paracalanus crassirostris CW n.d. n.d. n.d. – 263 86 131 5
Paracalanus indicus CW/SW 1981 251 546 19 2823 86 282 32
Paracalanus quasimodo CW/SW 5994 408 1275 35 45943 2529 9673 31
Pleuromammaspp. TW 1903 91 321 20 56 7 11 24
Sapphirinaspp. TW 12 3 6 16 3 1 3 3
Scolecithricellaspp. TW 41 2 6 13 9 3 3 4
Temora stylifera SW/TW 270 32 90 37 231 31 57 35
Temora turbinata n.d.a 87 8 39 9 6885 94 319 33
Undinula vulgaris SW 3 1 2 3 7 4 4 2
aSpecies only recently recorded in Brazilian waters; no comparative data available.

167
Figure 4. Spatial distribution of pelagic copepods in summer and winter – (A) total copepods, (B)Paracalanusspp., (C)Ctenocalanus vanus,(D) Calanoides carinatus, (E) Temora stylifera, (F) Temora turbinata, (G) Clausocalanusspp., (H)Oithona spp., (I)Oncaeaspp. and (J)Corycaeidae (CorycaeusandFarranula).

168
[Figure 4 Continued].

169
[Figure 4 Continued]
by C. giesbrechti. During summer, both genera weremost abundant in the north (transects T4 and T5), de-creasing in an offshore direction. Spatial distributionin winter varied irregularly throughout the study area,with peak abundances at station 15 (T2) and at theinner and mid-shelf stations of T4 and T5. No cross-shelf variation was evident in transects T1, T2 and T3during either seasons, with isolated maxima occurringat mid-shelf areas.
The vertical stratification of taxa is shown bythe average estimates of the stratification parameterV (Table 2). Copepods associated with the TropicalWaters of the Brazil Current, such asAcrocalanus lon-gicornis, Calanopia americana, Clausocalanus furc-atus, Farranula gracilis and Paracalanus aculeatus,among others, were more abundant in the uppermixed layer. Cold-water species includingCalanoidescarinatus, Ctenocalanus vanusandHaloptilus longi-cornis occurred mainly in the bottom layers, asso-ciated with the SACW. Several other species typicalof coastal and shelf waters were more abundant be-low the thermocline (Table 2). This was the caseof Paracalanus quasimodo, Temora turbinata, Ca-localanusspp.,Oithona plumiferaandOncaea curta.
The relationship between copepod assemblagesand environmental variables is revealed in the PCAresults (Figure 5). In both seasons, factor 1 repres-ents the cross-shelf variability. The negative quadrant
Table 2 Vertical stratification parameter (Huntley & Escritor, 1991)averaged over the entire study area on each season. Estimates arefor the most abundant and frequent copepod taxa. Positive valuesindicate higher abundances above the thermocline while negativevalues indicate higher abundances below the thermocline
Species Summer Winter
adults juveniles adults juveniles
Acrocalanus longicornis 0.64 0.90 2.13 1.03
Calanoides carinatus −0.52 −0.18 −1.19 0.19
Calanopia americana 0.29 0.28 1.40 0.46
Calocalanusspp. −0.25 −0.61 −2.22 −1.79
Clausocalanus furcatus 1.19 0.90 1.90 1.36
Corycaeus giesbrechti 0.04 0.58 0.43 0.97
Ctenocalanus vanus −1.32 −0.62 −2.13 −0.88
Farranula gracilis 1.20 0.91 2.74 0.84
Haloptilus longicornis −1.88 −0.95 −1.15 −0.87
Mecynocera clausi −0.04 −0.35 −0.13 0.86
Nannocalanus minor 0.31 0.43 1.19 3.29
Oithona plumifera −0.15 −0.25 −3.15 0.35
Oncaea curta −1.00 −0.65 −4.54 0.16
Oncaea media 0.41 0.20 0.55 0.31
Oncaea venusta 0.35 0.22 0.58 0.23
Paracalanus aculeatus 1.14 0.42 1.54 0.78
Paracalanus quasimodo−0.46 −0.07 1.01 0.37
Temora stylifera 0.06 0.09 1.13 1.03
Temora turbinata −1.03 −0.67 −1.34 0.11
170
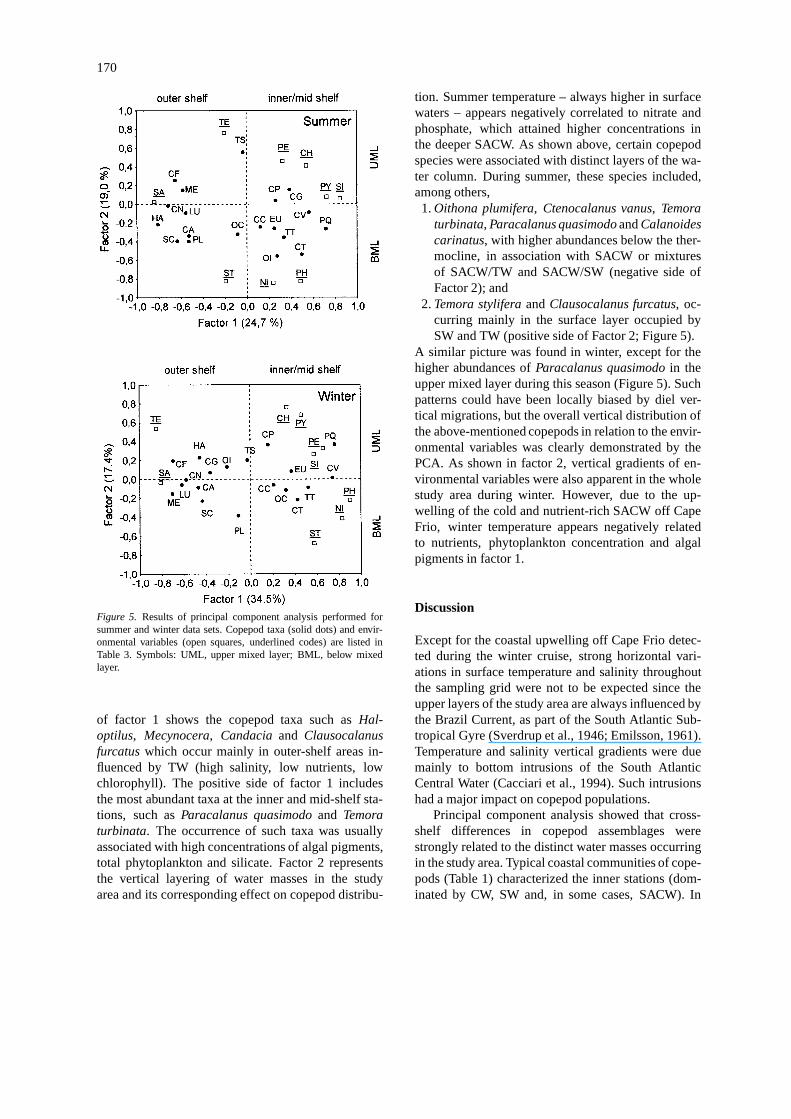
Figure 5. Results of principal component analysis performed forsummer and winter data sets. Copepod taxa (solid dots) and envir-onmental variables (open squares, underlined codes) are listed inTable 3. Symbols: UML, upper mixed layer; BML, below mixedlayer.
of factor 1 shows the copepod taxa such asHal-optilus, Mecynocera, Candaciaand Clausocalanusfurcatuswhich occur mainly in outer-shelf areas in-fluenced by TW (high salinity, low nutrients, lowchlorophyll). The positive side of factor 1 includesthe most abundant taxa at the inner and mid-shelf sta-tions, such asParacalanus quasimodoand Temoraturbinata. The occurrence of such taxa was usuallyassociated with high concentrations of algal pigments,total phytoplankton and silicate. Factor 2 representsthe vertical layering of water masses in the studyarea and its corresponding effect on copepod distribu-
tion. Summer temperature – always higher in surfacewaters – appears negatively correlated to nitrate andphosphate, which attained higher concentrations inthe deeper SACW. As shown above, certain copepodspecies were associated with distinct layers of the wa-ter column. During summer, these species included,among others,1.Oithona plumifera, Ctenocalanus vanus, Temora
turbinata, Paracalanus quasimodoandCalanoidescarinatus, with higher abundances below the ther-mocline, in association with SACW or mixturesof SACW/TW and SACW/SW (negative side ofFactor 2); and
2.Temora styliferaandClausocalanus furcatus, oc-curring mainly in the surface layer occupied bySW and TW (positive side of Factor 2; Figure 5).
A similar picture was found in winter, except for thehigher abundances ofParacalanus quasimodoin theupper mixed layer during this season (Figure 5). Suchpatterns could have been locally biased by diel ver-tical migrations, but the overall vertical distribution ofthe above-mentioned copepods in relation to the envir-onmental variables was clearly demonstrated by thePCA. As shown in factor 2, vertical gradients of en-vironmental variables were also apparent in the wholestudy area during winter. However, due to the up-welling of the cold and nutrient-rich SACW off CapeFrio, winter temperature appears negatively relatedto nutrients, phytoplankton concentration and algalpigments in factor 1.
Discussion
Except for the coastal upwelling off Cape Frio detec-ted during the winter cruise, strong horizontal vari-ations in surface temperature and salinity throughoutthe sampling grid were not to be expected since theupper layers of the study area are always influenced bythe Brazil Current, as part of the South Atlantic Sub-tropical Gyre (Sverdrup et al., 1946; Emilsson, 1961).Temperature and salinity vertical gradients were duemainly to bottom intrusions of the South AtlanticCentral Water (Cacciari et al., 1994). Such intrusionshad a major impact on copepod populations.
Principal component analysis showed that cross-shelf differences in copepod assemblages werestrongly related to the distinct water masses occurringin the study area. Typical coastal communities of cope-pods (Table 1) characterized the inner stations (dom-inated by CW, SW and, in some cases, SACW). In
171
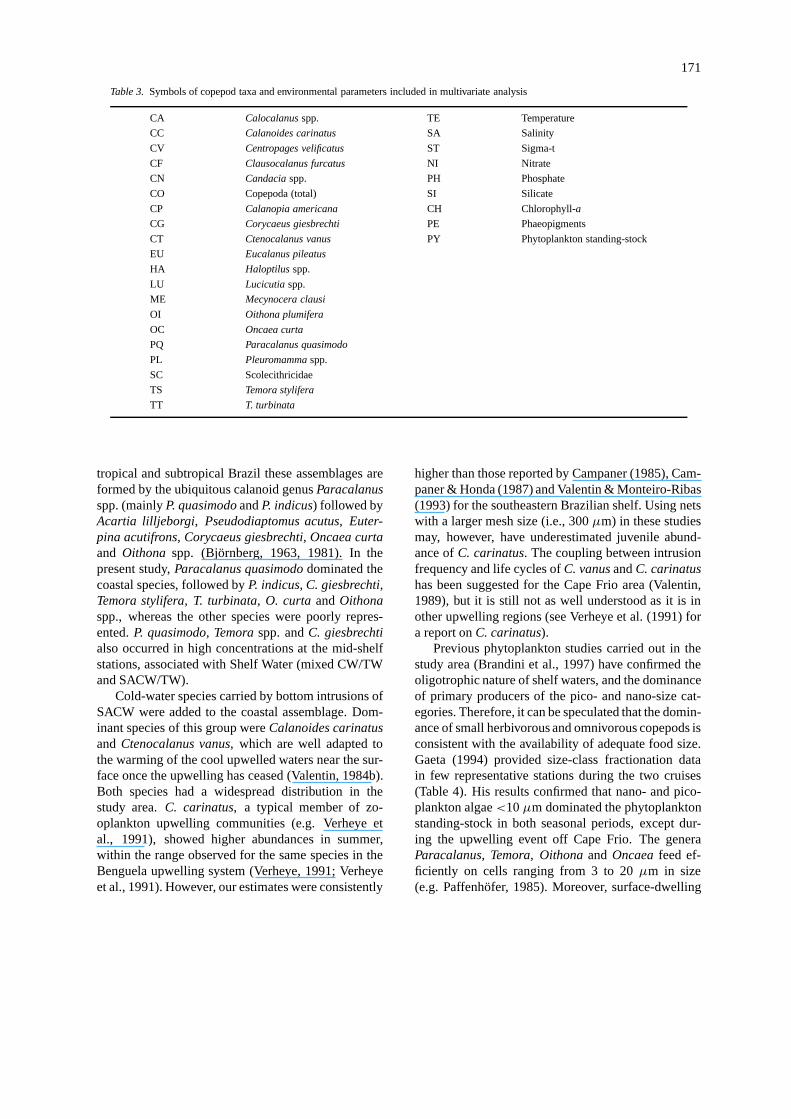
Table 3. Symbols of copepod taxa and environmental parameters included in multivariate analysis
CA Calocalanusspp. TE Temperature
CC Calanoides carinatus SA Salinity
CV Centropages velificatus ST Sigma-t
CF Clausocalanus furcatus NI Nitrate
CN Candaciaspp. PH Phosphate
CO Copepoda (total) SI Silicate
CP Calanopia americana CH Chlorophyll-a
CG Corycaeus giesbrechti PE Phaeopigments
CT Ctenocalanus vanus PY Phytoplankton standing-stock
EU Eucalanus pileatus
HA Haloptilusspp.
LU Lucicutiaspp.
ME Mecynocera clausi
OI Oithona plumifera
OC Oncaea curta
PQ Paracalanus quasimodo
PL Pleuromammaspp.
SC Scolecithricidae
TS Temora stylifera
TT T. turbinata
tropical and subtropical Brazil these assemblages areformed by the ubiquitous calanoid genusParacalanusspp. (mainlyP. quasimodoandP. indicus) followed byAcartia lilljeborgi, Pseudodiaptomus acutus, Euter-pina acutifrons, Corycaeus giesbrechti, Oncaea curtaand Oithona spp. (Björnberg, 1963, 1981). In thepresent study,Paracalanus quasimododominated thecoastal species, followed byP. indicus, C. giesbrechti,Temora stylifera, T. turbinata, O. curta andOithonaspp., whereas the other species were poorly repres-ented.P. quasimodo, Temoraspp. andC. giesbrechtialso occurred in high concentrations at the mid-shelfstations, associated with Shelf Water (mixed CW/TWand SACW/TW).
Cold-water species carried by bottom intrusions ofSACW were added to the coastal assemblage. Dom-inant species of this group wereCalanoides carinatusand Ctenocalanus vanus, which are well adapted tothe warming of the cool upwelled waters near the sur-face once the upwelling has ceased (Valentin, 1984b).Both species had a widespread distribution in thestudy area.C. carinatus, a typical member of zo-oplankton upwelling communities (e.g. Verheye etal., 1991), showed higher abundances in summer,within the range observed for the same species in theBenguela upwelling system (Verheye, 1991; Verheyeet al., 1991). However, our estimates were consistently
higher than those reported by Campaner (1985), Cam-paner & Honda (1987) and Valentin & Monteiro-Ribas(1993) for the southeastern Brazilian shelf. Using netswith a larger mesh size (i.e., 300µm) in these studiesmay, however, have underestimated juvenile abund-ance ofC. carinatus. The coupling between intrusionfrequency and life cycles ofC. vanusandC. carinatushas been suggested for the Cape Frio area (Valentin,1989), but it is still not as well understood as it is inother upwelling regions (see Verheye et al. (1991) fora report onC. carinatus).
Previous phytoplankton studies carried out in thestudy area (Brandini et al., 1997) have confirmed theoligotrophic nature of shelf waters, and the dominanceof primary producers of the pico- and nano-size cat-egories. Therefore, it can be speculated that the domin-ance of small herbivorous and omnivorous copepods isconsistent with the availability of adequate food size.Gaeta (1994) provided size-class fractionation datain few representative stations during the two cruises(Table 4). His results confirmed that nano- and pico-plankton algae<10µm dominated the phytoplanktonstanding-stock in both seasonal periods, except dur-ing the upwelling event off Cape Frio. The generaParacalanus, Temora, Oithonaand Oncaeafeed ef-ficiently on cells ranging from 3 to 20µm in size(e.g. Paffenhöfer, 1985). Moreover, surface-dwelling

172
Table 4. Chlorophyll-a (chl-a) size-fractions at representative stations of inner and mid-shelf waters during summer (stations 16 and 11) andwinter (stations 3 and 7) cruises. Values represent the mean ofn concentrations (µg.l−1) recorded in the water column. Standard deviationsare shown in parentheses. Size fractions were obtained by filtering water samples through polycarbonate Nuclepore (1 and 10µm) and GF/Ffilters (0.4µm). MSD: Maximum sampling depth
Station total <1µm >1<10µm % of chl-a n MSD
# chl-a fraction fraction < 10µm
16 0.98 0.26 0.35 62 5 30
(0.33) (0.08) (0.11)
11 0.21 0.09 0.06 71 6 54
(0.03) (0.01) (0.03)
3 6.00 0.12 0.87 16 5 25
(1.88) (0.05) (0.50)
7 0.12 0.05 0.04 75 4 9
(0.01) (0.02) (0.01)
copepodites ofCalanoides carinatusare able to in-gest food particles of 1–25µm (Mensah, 1974, citedby Verheye, 1991). Whether the same holds true forCtenocalanus vanusis still to be confirmed.
BesidesC. carinatus, other typical species of theSACW, such asEuaetideus giesbrechti, HaloptiluslongicornisandHeterorhabdus papilliger, occurred atlow abundances in both cruises (Table 1). These spe-cies penetrate onto the shelf only during the upwellingbut, in contrast toC. carinatus, they disappear afterthe warming of the upwelled water (Valentin et al.,1976). The absence of such species from the cold wa-ter nucleus recorded off Cape Frio during winter maybe the first indication that, in fact, no upwelling wastaking place at the time of sampling. Moreover, coastalcopepods likeParacalanus quasimodo, CtenocalanusvanusandTemora turbinatareached abundance peaksoff Cape Frio during the winter upwelling. These op-portunistic species probably fed upon the relativelylarge phytoplankton standing-stock (e.g. 6.0µg Chl-al−1 at station 3; see Table 4) which developed follow-ing the upwelling of the nutrient-rich SACW. Moser& Gianesella-Galvão (1997) suggested that the ‘up-welling’ event was in its initial phase during the wintercruise. These authors argued that low water temper-atures might have prevented the exponential growthof phytoplankton despite the high nutrient content ofadvected waters. Our results, however, provide a dif-ferent scenario for the winter water column conditionsoff Cape Frio for the following reasons:
1. typical SACW copepods were not found in the up-welling area – except for the opportunistic species
C. carinatusand C. vanus– indicating that theplankton system was in a post-upwelling stage;
2. the mean chlorophyll concentration of 6.0µgChl-a l−1 has been previously reported for thetypical ‘productive phase’ in Cape Frio (Gonzalez-Rodriguez et al., 1992); and
3. the observed dense populations of coastal cope-pods were probably supported by a large phyto-plankton (or, alternatively, microzooplankton)standing-stock.
The outer shelf copepod assemblage was dom-inated by Clausocalanus furcatusand, to a lesserextent, by species ofCalocalanus, Candacia, Centro-pages, Eucalanus, Oithona, OncaeaandCorycaeus.Although occurring at very low abundances (Table 1),several other species contributed to the high copepoddiversity recorded in this area, as typically observedfor tropical oceanic regions (e.g. Longhurst & Har-rison, 1989). It should be emphasized that the shelf offCape Frio is comparatively narrower than the north-ern shelf areas and hence more subjected to oceanicinfluences. Accordingly, during both periods copepodabundances at the mid- and outer stations of tran-sect T1 were consistently lower than transects furthernorth. Nogueira & Oliveira (1991) and Valentin &Monteiro-Ribas (1993) have reported sharp inshore-offshore gradients in zooplankton abundance off CapeFrio. Therefore, scarcity of zooplankton appears to bea consistent feature in intermediate shelf waters offCape Frio.
The advection of SACW extended further north-eastwards during summer than in winter, with a corres-ponding impact on the distribution of copepod species.

173
For example,Calanoides carinatusoccurred at highabundances during summer in regions occupied bySACW or in warmer Shelf Waters subjected to mix-ing with intruded SACW. Tropical copepods such asClausocalanus furcatushad an opposite behaviour,reaching high abundances only in those areas not dir-ectly affected by the cold SACW. Well-defined verticaldistribution patterns were found for several copepodspecies in both cruises, as a probable effect of thewell-pronounced layering of contrasting water masses.These results give additional support to the notion thatseasonal differences in the distribution and compos-ition of pelagic copepods in the Southern Brazilianshelf are directly associated with bottom intrusions ofthe SACW (Valentin, 1989).
Acknowledgements
This work was jointly supported by Petróleo BrasileiroS.A. and Fundação de Estudos e Pesquisas Aquáticas(FUNDESPA), under contract # 2 186 115-0-91. Wethank T. A. Cordeiro and E. T. Silva for their help inplotting copepod abundances on the maps of Figure 4.
References
Björnberg, T. K. S., 1963. On the marine free-living copepods offBrazil. Bolm Inst. oceanogr. S. Paulo 13: 3–142.
Björnberg, T. K. S., 1980. Revisão da distribuição dos gênerosParacalanus, Clausocalanuse Ctenocalanus(Copepoda, Crus-tacea) ao largo do Brasil. Bolm Inst. oceanogr. S. Paulo 29:65–68.
Björnberg, T. K. S., 1981. Copepoda. In Boltovskoy, D. (ed.), Atlasdel Zooplankton del Atlantico Sudoccidental, INIDEP, Mar delPlata: 587–679.
Brandini, F. P., R. M. Lopes, K. S. Gutseit, H. L. Spach & R.Sassi, 1997. Planctonologia na plataforma continental do Brasil– Diagnose e revisão bibliográfica. Femar, Rio de Janeiro: 196pp.
Cacciari, P. L., J. Harari, J. E. R. Pereira & A Talaska, 1994.Identificação e distribuição das massas d’água e da corrente desuperfície sobre a plataforma e talude continental da Bacia deCampos no verão e no inverno de 1992. In Tommasi, L. R.(coord.), Programa de Monitoramento Ambiental Oceânico daBacia de Campos (RJ). Final report. FUNDESPA-GEOMAP,São Paulo: 302–372.
Campaner, A. F., 1985. Occurrence and distribution of copepods(Crustacea) in the epipelagial off Southern Brazil. Bolm Inst.oceanogr. S. Paulo 33: 5–27.
Campaner, A. F. & S. Honda, 1987. Distribution and co-occurrenceof Calanoides carinatusand larvae ofSardinella brasiliensisandEngraulis anchoitaover the Southern Brazilian continental shelf.Bolm Inst. oceanogr. S. Paulo 35: 7–16.
Castro, B. M. & L. B. Miranda, 1998. Physical oceanography of thewestern Atlantic continental shelf located between 4◦ N and 34◦S. In Robinson, A. R. & H. B. Kenneth (eds), The Sea, vol. 11:209–251.
Emilsson, I., 1961. The shelf and coastal waters off Southern Brazil.Bolm Inst. oceanogr. S. Paulo 11: 101–112.
Gaeta, S. A., 1994. Fitoplâncton e produção primária. In Tommasi,L. R. (coord.), Programa de Monitoramento Ambiental Oceânicoda Bacia de Campos (RJ). Final report. FUNDESPA-GEOMAP,São Paulo: 446–464.
Gonzalez Rodriguez, E., J. L. Valentin, D. L. André & S. A.Jacob, 1992. Upwelling and downwelling at Cabo Frio (Brazil):Comparison of biomass and primary production responses. J.Plankton Res. 14: 289–306.
Huntley, M. & F. Escritor, 1991. Dynamics ofCalanoides acutus(Copepoda: Calanoida) in Antarctic coastal waters. Deep-SeaRes. 38: 1145–1167.
Legendre, L. & P. Legendre, 1984. Ecologie Numérique 2. La stru-ture des données écologiques. Masson Presses de l’Université duQuebec, Quebec (2éme éd.): 335 pp.
Longhurst, A. R. & W. G. Harrison, 1989. The biological pump:profiles of plankton production and consumption in the upperocean. Prog. Oceanogr. 22: 47–123.
Mascarenhas, A. S., L. B. Miranda & N. J. Rock, 1971. A studyof the oceanographic conditions in the region of Cabo Frio. InCostlow, J. D. (ed.), Fertility of the Sea. Gordon and BreachScience Publishers: 285–308.
Moser, G. A. O., 1997. Estudo da distribuição da biomassa fito-planctônica e de variáveis oceanográficas na Bacia de Campos(RJ), utilizando um sistema de informações geográficas (SIG).MSc. Dissertation, Instituto Oceanográfico: 149 pp.
Moser, G. A. O. & S. M. F. Gianesella-Galvão, 1997. Biological andoceanographic upwelling indicators at Cabo Frio (RJ). Rev. bras.oceanogr. 45: 11–23.
Nogueira, C. R. & S. R. Oliveira Jr., 1991. Siphonophora from thecoast of Brazil (17◦ S–24◦ S). Bolm Inst. oceanogr. S. Paulo 39:61–69.
Paffenhöfer, G. A., 1985. The abundance and distribution of zo-oplankton on the Southeastern shelf of the United States. InAtkinson, L. P., D. W. Menzel & K. A. Bush (eds), Oceano-graphy of the Southeastern U.S. Continental Shelf, Coastal andEstuarine Sciences 2, American Geophysical Union, Washing-ton: 156 pp.
Signorini, S. R., 1978. On the circulation and the volume trans-port of the Brazil current between the Cape of São Tomé andGuanabara Bay. Deep Sea Res. 25: 481–490.
Sverdrup, H. U., M. W. Johnson & R. H. Fleming, 1946. TheOceans. Their physics, chemistry and general biology, 2nd edn.Prentice Hall, New York: 1087 pp.
Valentin, J. L., 1984a. Analyse des paramètres hydrobiologiquesdans la remontée de Cabo Frio (Brésil). Mar. Biol. 82: 259–276.
Valentin, J. L., 1984b. Spatial structure of the zooplankton com-munity in the Cabo Frio region (Brazil) influenced by coastalupwelling. Hydrobiologia 113: 183–199.
Valentin, J. L., 1989. A dinâmica do plâncton na ressurgência deCabo Frio – RJ. In Brandini, F. P. (ed.), Memórias do III EncontroBrasileiro de Plâncton, Caiobá (PR): 25–35.
Valentin, J. L. & W. Monteiro-Ribas, 1993. Zooplankton com-munity structure on the east-southeast Brazilian continental shelf(18–23◦ S latitude). Cont. Shelf Res. 13: 407–424.
Valentin, J. L., W. Monteiro-Ribas, A. Mureb & E. Pessotti, 1976. Aorigem das massas d’água na ressurgência de Cabo Frio (Brasil)vista através do estudo das comunidades de copépodos. Publ.Inst. Pesq. Marinha 97: 1–6.

174
Verheye, H. M., 1991. Short-term variability during an anchorstation study in the southern Benguela upwelling system: Abund-ance, distribution and estimated production of mesozooplanktonwith special reference toCalanoides carinatus(Krøyer, 1849).Prog. Oceanog. 28: 91–119.
Verheye, H. M., L. Hutchings, J. A. Huggett & S. J. Painting, 1991.Mesozooplankton dynamics in the Benguela ecosystem, withemphasis on the herbivorous copepods. S. Afr. J. mar. Sci. 12:561–584.