Distribution of molecular size within an unfolded state ensemble using small-angle X-ray scattering...
12
Distribution of Molecular Size within an Unfolded State Ensemble using Small-angle X-ray Scattering and Pulse Field Gradient NMR Techniques Wing-Yiu Choy 1 , Frans A. A. Mulder 1 , Karin A. Crowhurst 2 D. R. Muhandiram 1 , Ian S. Millett 3 , Sebastian Doniach 4 Julie D. Forman-Kay 2 and Lewis E. Kay 1 * 1 Protein Engineering Network Centers of Excellence and Departments of Medical Genetics and Microbiology Biochemistry, and Chemistry University of Toronto, Toronto Ontario, Canada M5S 1A8 2 Structural Biology and Biochemistry, The Hospital for Sick Children, 555 University Avenue, Toronto, Ontario Canada, M5G 1X8, and Department of Biochemistry University of Toronto, Toronto Ontario, Canada M5S 1A8 3 Department of Chemistry Stanford University, Stanford CA 94305, USA 4 Department of Applied Physics, Stanford University Stanford, CA 92343, USA The size distribution of molecules within an unfolded state of the N- terminal SH3 domain of drk (drkN SH3) has been studied by small-angle X-ray scattering (SAXS) and pulsed-field-gradient NMR (PFG-NMR) methods. An empirical model to describe this distribution in the unfolded state ensemble has been proposed based on (i) the ensemble-averaged radius of gyration and hydrodynamic radius derived from the SAXS and PFG-NMR data, respectively, and (ii) a histogram of the size distribution of structures obtained from preliminary analyses of structural parameters recorded on the unfolded state. Results show that this unfolded state, U exch , which exists in equilibrium with the folded state, F exch , under non- denaturing conditions, is relatively compact, with the average size of con- formers within the unfolded state ensemble only 30-40 % larger than the folded state structure. In addition, the model predicts a significant over- lap in the size range of structures comprising the U exch state with those in a denatured state obtained by addition of 2 M guanidinium chloride. # 2002 Elsevier Science Ltd. Keywords: unfolded state; SH3 domain; PFG-NMR; SAXS; ensemble *Corresponding author Introduction Contrary to a simplistic structure-function para- digm, an increasing number of proteins that are unstructured under physiological conditions yet biologically active are being described. 1 For example, the p21 Cdk inhibitors and the C-term- inal activation domain of c-Fos are functionally active but intrinsically disordered in the absence of binding to target proteins. 2,3 It has been suggested that conformational disorder may play an import- ant role in the diversity of interactions of these and other such proteins. In addition to the experimen- tally demonstrated examples, a significant fraction of protein sequences in various genomes are predicted to code for disordered or partially disordered ‘‘structures’’. 4 To better understand the potential biological role of disorder, structural information on unfolded and partially unfolded states of proteins under physiological conditions is crucial. Unlike a protein in its folded state, the unfolded state is an ensemble of rapidly interconverting conformers. A complete characterization requires not only descriptions of average local and global properties but details on the various conformers that contrib- ute to the disordered state ensemble and their rela- tive populations. 5 Even though unfolded states have much less persistent structure than folded states, recently developed NMR and other spectro- E-mail address of the corresponding author: [email protected] Abbreviations used: NOE, nuclear Overhauser effect; SAXS, small-angle X-ray scattering; PFG, pulsed-field- gradient. doi:10.1006/jmbi.2001.5328 available online at http://www.idealibrary.com on J. Mol. Biol. (2002) 316, 101–112 0022-2836/02/010101–12 $35.00/0 # 2002 Elsevier Science Ltd.
Transcript of Distribution of molecular size within an unfolded state ensemble using small-angle X-ray scattering...
doi:10.1006/jmbi.2001.5328 available online at http://www.idealibrary.com on J. Mol. Biol. (2002) 316, 101±112
Distribution of Molecular Size within an UnfoldedState Ensemble using Small-angle X-ray Scatteringand Pulse Field Gradient NMR Techniques
Wing-Yiu Choy1, Frans A. A. Mulder1, Karin A. Crowhurst2
D. R. Muhandiram1, Ian S. Millett3, Sebastian Doniach4
Julie D. Forman-Kay2 and Lewis E. Kay1*
*Corresponding author
Introduction
Contrary to a simplistic structure-function para-digm, an increasing number of proteins that areunstructured under physiological conditions yetbiologically active are being described.1 Forexample, the p21 Cdk inhibitors and the C-term-inal activation domain of c-Fos are functionallyactive but intrinsically disordered in the absence ofbinding to target proteins.2,3 It has been suggestedthat conformational disorder may play an import-ant role in the diversity of interactions of these and
E-mail address of the corresponding author:[email protected]
Abbreviations used: NOE, nuclear Overhauser effect;SAXS, small-angle X-ray scattering; PFG, pulsed-®eld-gradient.
0022-2836/02/010101±12 $35.00/0
other such proteins. In addition to the experimen-tally demonstrated examples, a signi®cant fractionof protein sequences in various genomes arepredicted to code for disordered or partiallydisordered ``structures''.4
To better understand the potential biological roleof disorder, structural information on unfoldedand partially unfolded states of proteins underphysiological conditions is crucial. Unlike a proteinin its folded state, the unfolded state is anensemble of rapidly interconverting conformers. Acomplete characterization requires not onlydescriptions of average local and global propertiesbut details on the various conformers that contrib-ute to the disordered state ensemble and their rela-tive populations.5 Even though unfolded stateshave much less persistent structure than foldedstates, recently developed NMR and other spectro-
1Protein Engineering NetworkCenters of Excellence andDepartments of MedicalGenetics and MicrobiologyBiochemistry, and ChemistryUniversity of Toronto, TorontoOntario, Canada M5S 1A82Structural Biology andBiochemistry, The Hospital forSick Children, 555 UniversityAvenue, Toronto, OntarioCanada, M5G 1X8, andDepartment of BiochemistryUniversity of Toronto, TorontoOntario, Canada M5S 1A83Department of ChemistryStanford University, StanfordCA 94305, USA4Department of AppliedPhysics, Stanford UniversityStanford, CA 92343, USA
The size distribution of molecules within an unfolded state of the N-terminal SH3 domain of drk (drkN SH3) has been studied by small-angleX-ray scattering (SAXS) and pulsed-®eld-gradient NMR (PFG-NMR)methods. An empirical model to describe this distribution in the unfoldedstate ensemble has been proposed based on (i) the ensemble-averagedradius of gyration and hydrodynamic radius derived from the SAXS andPFG-NMR data, respectively, and (ii) a histogram of the size distributionof structures obtained from preliminary analyses of structural parametersrecorded on the unfolded state. Results show that this unfolded state,Uexch, which exists in equilibrium with the folded state, Fexch, under non-denaturing conditions, is relatively compact, with the average size of con-formers within the unfolded state ensemble only 30-40 % larger than thefolded state structure. In addition, the model predicts a signi®cant over-lap in the size range of structures comprising the Uexch state with thosein a denatured state obtained by addition of 2 M guanidinium chloride.
# 2002 Elsevier Science Ltd.
Keywords: unfolded state; SH3 domain; PFG-NMR; SAXS; ensemble
# 2002 Elsevier Science Ltd.
102 Size Distribution in an Unfolded State Ensemble
scopic techniques have allowed characterization ofthe residual structure present. Information onbackbone conformational preferences can bederived from NMR parameters including scalarJ-coupling constants,6 ± 8 sequential HN-HN andHa-HN NOEs9 as well as chemical shifts.10,11 Longrange HN-HN NOEs can also be observed in theunfolded state ensemble using extensive deutera-tion to reduce relaxation12 and paramagnetic relax-ation enhancement13,14 and residual dipolarcouplings15 can be used to probe structural featuresof partially unfolded or unfolded molecules.Details on speci®c interactions in populated confor-mers of the unfolded state ensemble can thus beobtained.
A full description of the unfolded state, how-ever, requires information about the ensemble dis-tribution of molecular sizes, shapes and the extentof compactness. Small-angle X-ray scattering(SAXS) is one of the few techniques that provides adirect measure of these properties.16 Recentadvances in X-ray sources and instrumentationmake SAXS a powerful tool for studying the con-formations and interactions of biological macro-molecules with a number of studies focussing ondisordered states. In particular, SAXS results haveshown that thermally and chemically denaturedstates of ribonuclease A are more compact than arandom coil of the same length.17 A time-resolvedapproach to SAXS has also been applied to studythe changes in compactness of lysozyme duringdifferent stages of the folding process.18,19
Pulsed-®eld-gradient NMR (PFG-NMR) isanother useful technique to study molecularsize.20,21 While SAXS yields the radius of gyration(Rg), PFG-NMR provides a measure of the transla-tional diffusion coef®cient, which can be used todetermine the hydrodynamic radius (Rh). Thismethod has been applied to the study of foldedand unfolded states of a number of proteins.21 ± 23
Here, we have used SAXS and PFG-NMR tomeasure the radius of gyration and hydrodynamicradius of the unfolded state ensemble of theisolated N-terminal SH3 domain of the Drosophiliasignal transduction protein drk (drkN SH3) undernon-denaturing conditions. The Drosophilia proteindrk functions to couple activated receptor tyrosinekinases to Ras signaling via binding of the guaninenucleotide exchange factor Sos to this SH3domain.24 SH3 domains, in general, mediate pro-tein recognition in signal transduction and cellularlocalization by binding to proline-rich targets.25
Most isolated SH3 domains are stably folded; how-ever, the drkN SH3 domain is unstable in theabsence of its binding target Sos and exists in equi-librium between a folded (Fexch) and an unfoldedform (Uexch) in aqueous buffer and near neutralpH. The protein can be stabilized to the foldedstate (Fs) by addition of 0.4 M sodium sulfate ordenatured (Ugdn) by adding 2.0 M guanidiniumchloride (GdnCl). Extensive structural studies ofthese various states have been performed usingNMR and other spectroscopic techniques.5,12,26 ± 35
To enable a more complete understanding of theUexch state, which coexists with the folded stateunder non-denaturing conditions, we have appliedSAXS and PFG-NMR techniques to determine themolecular size distribution in the Uexch ensemble.In particular, we have taken advantage of thedifference in modes of ensemble averaging of theradius of gyration and hydrodynamic radius,along with additional information provided bypreliminary structures of the unfolded ensemble,5
to describe the size distribution of conformers inthis state.
Results and Discussion
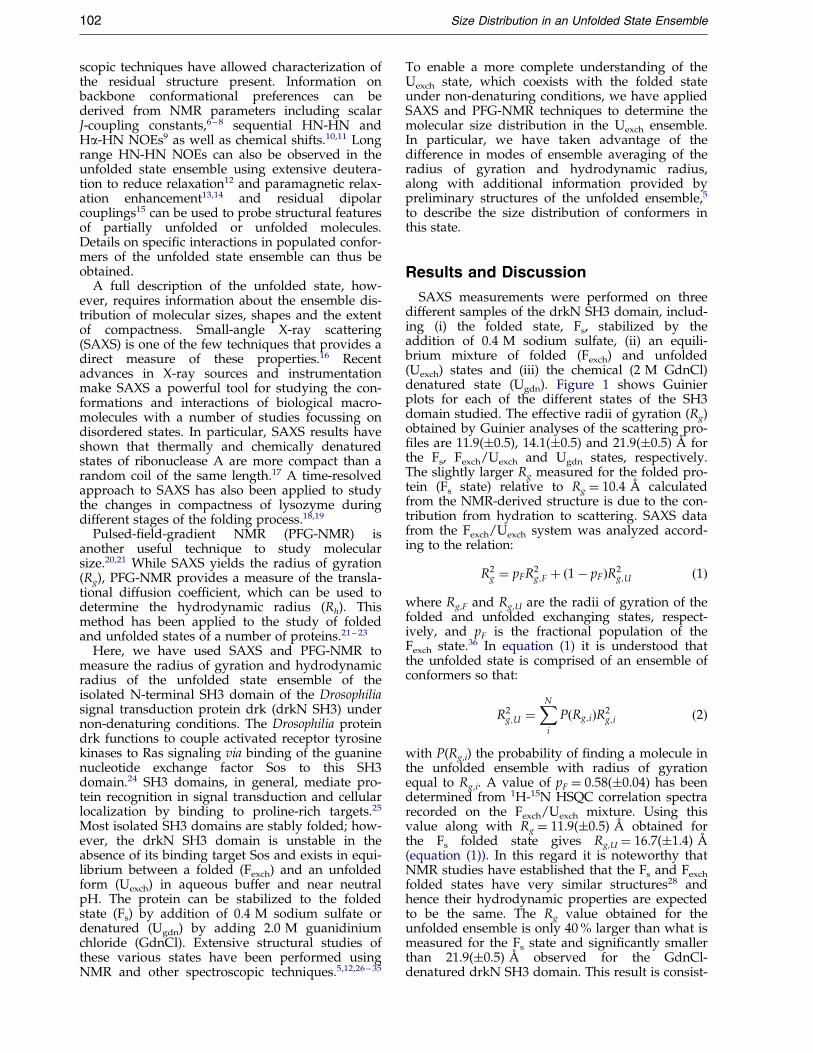
SAXS measurements were performed on threedifferent samples of the drkN SH3 domain, includ-ing (i) the folded state, Fs, stabilized by theaddition of 0.4 M sodium sulfate, (ii) an equili-brium mixture of folded (Fexch) and unfolded(Uexch) states and (iii) the chemical (2 M GdnCl)denatured state (Ugdn). Figure 1 shows Guinierplots for each of the different states of the SH3domain studied. The effective radii of gyration (Rg)obtained by Guinier analyses of the scattering pro-®les are 11.9(�0.5), 14.1(�0.5) and 21.9(�0.5) AÊ forthe Fs, Fexch/Uexch and Ugdn states, respectively.The slightly larger Rg measured for the folded pro-tein (Fs state) relative to Rg � 10.4 AÊ calculatedfrom the NMR-derived structure is due to the con-tribution from hydration to scattering. SAXS datafrom the Fexch/Uexch system was analyzed accord-ing to the relation:
R2g � pFR2
g;F � �1ÿ pF�R2g;U �1�
where Rg,F and Rg,U are the radii of gyration of thefolded and unfolded exchanging states, respect-ively, and pF is the fractional population of theFexch state.36 In equation (1) it is understood thatthe unfolded state is comprised of an ensemble ofconformers so that:
R2g;U �
XN
i
P�Rg;i�R2g;i �2�
with P(Rg,i) the probability of ®nding a molecule inthe unfolded ensemble with radius of gyrationequal to Rg,i. A value of pF � 0.58(�0.04) has beendetermined from 1H-15N HSQC correlation spectrarecorded on the Fexch/Uexch mixture. Using thisvalue along with Rg � 11.9(�0.5) AÊ obtained forthe Fs folded state gives Rg,U � 16.7(�1.4) AÊ
(equation (1)). In this regard it is noteworthy thatNMR studies have established that the Fs and Fexch
folded states have very similar structures28 andhence their hydrodynamic properties are expectedto be the same. The Rg value obtained for theunfolded ensemble is only 40 % larger than what ismeasured for the Fs state and signi®cantly smallerthan 21.9(�0.5) AÊ observed for the GdnCl-denatured drkN SH3 domain. This result is consist-
0 0.5 1 1.5 2 2.5 3 3.5-2
-1.9
-1.8
-1.7
-1.6
-1.5
-1.4
-1.3
-2( )10-4S2
ln(I)
(a)
0 0.2 0.4 0.6 0.8 1-3
-2.9
-2.8
-2.7
-2.6
-2.5
-2.4
-2.3
-2( )10-4S2
ln(I)
(c)
0 0.5 1 1.5 2-2.8
-2.7
-2.6
-2.5
-2.4
-2.3
-2.2
-2.1
-2
-2( )10-4S2
ln(I)
(b)
Figure 1. Guinier plots of scattering data recorded onthe Fs state stabilized by addition of 0.4 M Na2SO4 (a),the Fexch/Uexch equilibrium state in 50 mM phosphatebuffer solution at pH 6.0 (b) and the denatured state in2 M GdnCl, Ugdn (c). The slope of each line is pro-portional to ÿ(4p2Rg
2/3). Guinier Rg values of the Fs,Fexch/Uexch and Ugdn states are 11.9(�0.5), 14.6(�0.5) and21.9(�0.5) AÊ , respectively. The Rg value of the Fexch/Uexch equilibrium state derived from the ®rst two min-utes of data is 14.1(�0.5) AÊ
Size Distribution in an Unfolded State Ensemble 103
ent with long range amide distances observed inNOESY experiments recorded on the Uexch statethat were not observed in similar experiments onthe Ugdn state12 and argues that the Uexch ensembleis comprised of a large fraction of compact struc-tures (see below).
Equation (2) indicates that any interpretation ofRg,U in terms of the properties of the ensemble ispredicated on knowing the form of P(Rg). To ourknowledge, however, there is no standard modelthat describes the distribution of Rg values for con-formers in an unfolded state ensemble. With this inmind we have used two different functional formsfor P(Rg). The ®rst relation is based on an empiricalmodel proposed by Flory and Fisk to describe thestatistical distribution of the radii of gyration in anensemble of linear chain molecules neglectingexcluded volume effects:37
P�Rg� � const� R6g exp
ÿ7R2g
2hR2gio
" #�3�
where hRg2i is the mean-square radius of gyration
for the ensemble. Based on equation (3) the distri-bution can be written as:
p�Rg� ��Rg ÿ Rnative
g �m expÿ�Rg ÿ Rnative
g �2s
" #XRg�Rextended
g
Rg�Rnativeg
�Rg ÿ Rnativeg �m exp
ÿ�Rg ÿ Rnativeg �2
s
" #�4a�
where Rgnative and Rg
extended are the radii of gyrationfor the folded and the completely extended drkNSH3 domain structures, respectively, and s and mare the ®tting parameters. The second model thatwe have examined is completely empirical and isgiven by the expression:
p�Rg� ��Rg ÿ Rnative
g �2 expÿ2�Rg ÿ Rnative
g �s
" #XRg�Rextended
g
Rg�Rnativeg
�Rg ÿ Rnativeg �2 exp
ÿ2�Rg ÿ Rnativeg �
s
" #�4b�
where s is the single ®tting parameter. The func-tional form of P(Rg) is quite sensitive to s and notsurprisingly, therefore, P(Rg) can ®t many differentdistributions including, as we show below, thosecomprised of structures from unfolding trajectoriesof the drkN SH3 domain. In what follows we arenot concerned about the interpretation of theseparameters in terms of properties of the distri-bution; only whether meaningful P(Rg) distri-butions can be obtained in the ®rst place. In bothmodels a value of Rg
extended � 40 AÊ was chosenbased on calculations of Rg for unfolded molecules

104 Size Distribution in an Unfolded State Ensemble
generated during unfolding trajectories (seebelow).
In addition to the SAXS-derived data on Rg,further information on the size-distribution proper-ties of the Fexch/Uexch system can be obtained fromNMR studies of translational diffusion rates. Sincemolecules in the folded and unfolded statesexchange slowly on the chemical shift time scale,diffusion coef®cients for both states can beobtained simultaneously from measurements on asingle sample. The ratio of diffusion constantsobtained in this manner is therefore independentof sample viscosity, simplifying analysis, asdescribed below. Figure 2 shows the decay of mag-netization as a function of PFG strength for signalderived from T12 in the Fexch (circle) and Uexch
(square) states. In total, decay curves for 42 resi-dues from the folded state and 19 from theunfolded ensemble could be measured usingtwo-dimensional PFG experiments describedin Materials and Methods. Average diffusioncoef®cients of 7.10(�0.04) � 10ÿ7 cm2 sÿ1 and5.40(�0.03) � 10ÿ7 cm2 sÿ1 have been obtained forthe Fexch and Uexch states. The translational diffu-sion coef®cient of a molecule, Dt, is related to itshydrodynamic radius, Rh de®ned as the radius of asphere with the same value of Dt, according to theStokes-Einstein equation:
Dt � kT
6pZRh�5�
where k is Boltzmann's constant, T is the absolutetemperature and Z is the solvent viscosity. Thus:
Dt;F
Dt;U� 1:30� 0:01 � Rÿ1
h;F
Rÿ1h;U
�6�
where the subscripts F and U denote folded andunfolded states, respectively. The value of Rÿ1
h,U isaveraged over all conformations in the unfoldedstate according to:
0 2000 4000
g2 (G2cm-2)
0
0.5
1
Intensity(a.u.)
Figure 2. Diffusion attenuation data for Thr12 in theFexch (*) and Uexch (&) states. Similar curves wereobtained for 42 residues in the Fexch state and 19 resi-dues in the Uexch state.
Rÿ1h;U �
XN
i
P�Rh;i�Rÿ1h;i �7�
where P(Rh,i) is the probability of an unfolded con-formation having a hydrodynamic radius of Rh,i.The value of Rÿ1
h,U can be obtained from equation(6) so long as Rÿ1
h,F is known. Using the programHYDROPRO38 along with the NMR-derived struc-ture of the folded drkN SH3 domain and assumingapproximately one shell of bound water (seeMaterials and Methods) a value of Rh,F � 15.6 AÊ iscalculated and therefore Rh,U � 20.3(�0.2) AÊ .
Equation (2) shows that R2g,U, measured by the
SAXS experiment, is biased by extended confor-mers in the unfolded ensemble. In contrast, inspec-tion of equations (6) and (7) indicates that theparameter measured in the NMR experiment, thediffusion coef®cient and hence Rÿ1
h,U, is weightedmore heavily by compact structures. In what fol-lows the difference in the way in which R2
g and Dt
average will be exploited to estimate the size distri-bution of conformations in the Uexch ensemble.
Before such an estimate can be obtained, how-ever, it is necessary to develop a relation betweenRg and Rh so that the SAXS and NMR data can becombined. In the case of a globular folded protein,the characteristic ratio, Rg/Rh, equals
��������3=5p
(�0.775), while for an ideal Gaussian chain and anexcluded volume chain this ratio is 1.24 and 1.56,respectively.39 An Rg/Rh ratio of 0.75 is obtainedfor the Fs state of the drkN SH3 domain, with Rg
measured using SAXS and Rh calculated usingHYDROPRO38 and the NMR structure. This ratiois very close to the expected value. In contrast, theexperimentally determined ratio of Rg/Rh for theUexch state is 0.82, far removed from the valuesexpected for either a Gaussian or excluded volumechain. Indeed, a ratio of 0.82 argues strongly thatthe Uexch state is comprised of a signi®cant popu-lation of compact structures.
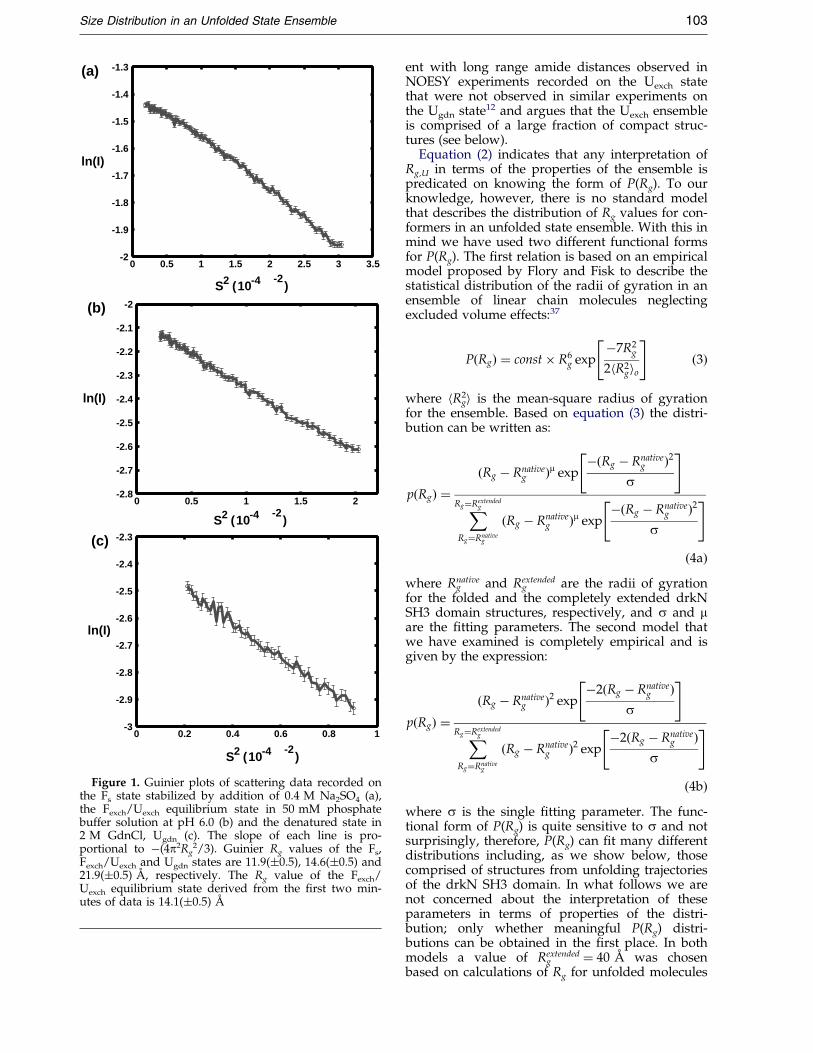
An empirical correlation between Rg and Rh hasbeen obtained from a large set of conformerswhich provide a reasonable sampling of the con-formational space available to the Uexch state of thedrkN SH3 domain. Conformers have been gener-ated by creating multiple unfolding trajectoriesusing the program TRADES (Trajectory DirectedEnsemble Sampling).40 In this approach, Ca atomsof the Fs state structure were displaced in an itera-tive manner in a series of 100 steps; after each stepthe remaining backbone atoms are added, followedby the side-chains using a rotamer library. A totalof 600 of these unfolding trajectories were gener-ated to produce 60,000 conformers. In each trajec-tory structures range from those close to the foldedstate (i.e. with Rg near that of the Fs state) to thosethat are very extended, providing a sampling ofboth native-like and unfolded proteins. Sub-sequently Rg and Rh values have been calculatedfor all structures using HYDROPRO,38 includingapproximately one water layer of hydration, withRh and Rg/Rh illustrated as a function Rg in
10 15 20 25 30 35 4014
16
18
20
22
24
26
28
Rg (Å)
Rh
(Å
)
10 15 20 25 30 35 400.7
0.8
0.9
1
1.1
1.2
1.3
1.4
1.5
Rg (Å)
Rg
/Rh
(a)
(b)
Figure 3. Correlation between Rg
and Rh (a) and between (Rg/Rh) andRg (b) for the 60,000 structures gen-erated in an unfolding trajectoryusing the program TRADES.40 Rg
and Rh values for all conformerswere calculated using the programHYDROPRO.38
Size Distribution in an Unfolded State Ensemble 105
Figure 3(a) and (b), respectively. The range ofcharacteristic ratios extends from 0.74 to 1.42 andinterestingly a linear correlation between Rg/Rh
and Rg is observed:
Rg=Rh � 0:0273� Rg � 0:396 �8a�Since the ratio Rg/Rh de®ned by equation (8a) iscritical to the analysis that follows, we have usedan alternative method to obtain an unfolding tra-jectory from which this ratio can be obtained. Thisensures that the functional form of equation (8a)above is not an artifact of the method that hasbeen used to calculate the ensemble of structures
in the ®rst place. Starting from a 10 ns moleculardynamics trajectory of the drkN SH3 domain at498 K, 9600 structures have been extracted, withan additional 600 structures obtained from a 3.6 nstrajectory at 598 K (see Materials and Methods).From this distribution of structures the ratio Rg/Rh
was calculated and, as with the ensemble of struc-tures obtained from TRADES,40 a linear correlationbetween Rg/Rh and Rg was obtained, as de®nedby:
Rg=Rh � 0:0274� Rg � 0:423 �8b�In what follows we have used equation (8a); essen-
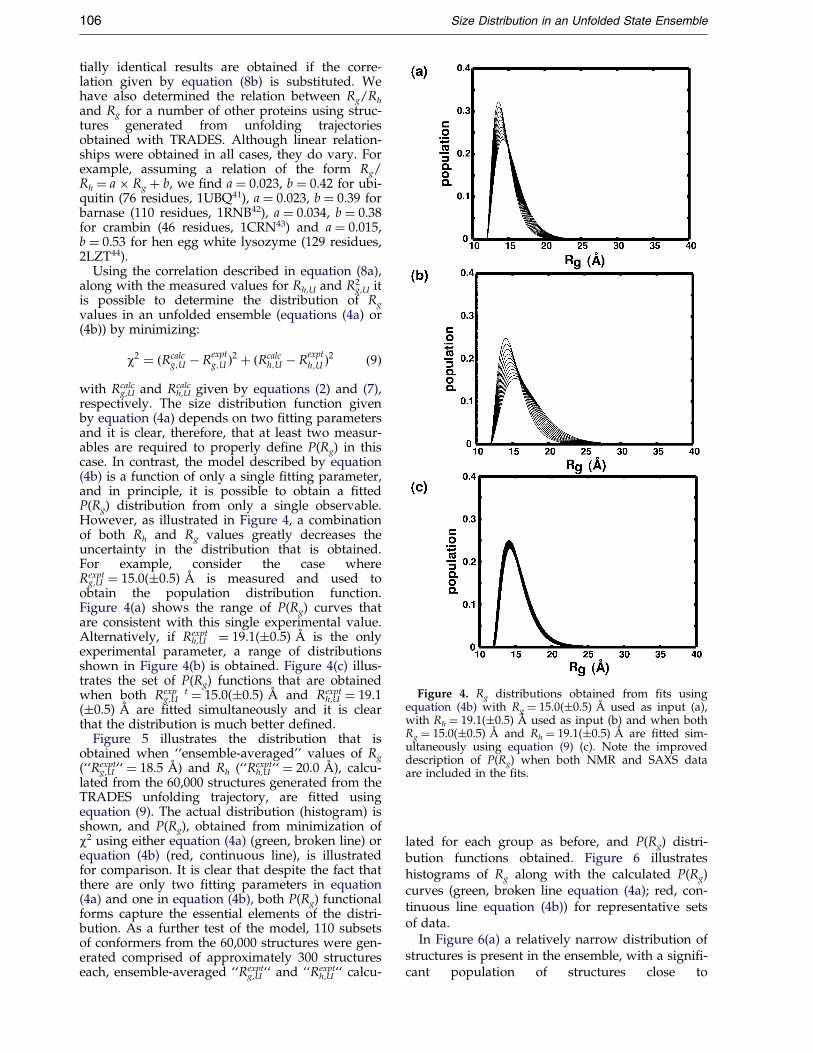
Figure 4. Rg distributions obtained from ®ts usingequation (4b) with Rg � 15.0(�0.5) AÊ used as input (a),with Rh � 19.1(�0.5) AÊ used as input (b) and when bothRg � 15.0(�0.5) AÊ and Rh � 19.1(�0.5) AÊ are ®tted sim-ultaneously using equation (9) (c). Note the improveddescription of P(Rg) when both NMR and SAXS dataare included in the ®ts.
106 Size Distribution in an Unfolded State Ensemble
tially identical results are obtained if the corre-lation given by equation (8b) is substituted. Wehave also determined the relation between Rg/Rh
and Rg for a number of other proteins using struc-tures generated from unfolding trajectoriesobtained with TRADES. Although linear relation-ships were obtained in all cases, they do vary. Forexample, assuming a relation of the form Rg/Rh � a � Rg � b, we ®nd a � 0.023, b � 0.42 for ubi-quitin (76 residues, 1UBQ41), a � 0.023, b � 0.39 forbarnase (110 residues, 1RNB42), a � 0.034, b � 0.38for crambin (46 residues, 1CRN43) and a � 0.015,b � 0.53 for hen egg white lysozyme (129 residues,2LZT44).
Using the correlation described in equation (8a),along with the measured values for Rh,U and R2
g,U itis possible to determine the distribution of Rg
values in an unfolded ensemble (equations (4a) or(4b)) by minimizing:
w2 � �Rcalcg;U ÿ R
exptg;U �2 � �Rcalc
h;U ÿ Rexpth;U �2 �9�
with Rcalcg,U and Rcalc
h,U given by equations (2) and (7),respectively. The size distribution function givenby equation (4a) depends on two ®tting parametersand it is clear, therefore, that at least two measur-ables are required to properly de®ne P(Rg) in thiscase. In contrast, the model described by equation(4b) is a function of only a single ®tting parameter,and in principle, it is possible to obtain a ®ttedP(Rg) distribution from only a single observable.However, as illustrated in Figure 4, a combinationof both Rh and Rg values greatly decreases theuncertainty in the distribution that is obtained.For example, consider the case whereRexpt
g,U � 15.0(�0.5) AÊ is measured and used toobtain the population distribution function.Figure 4(a) shows the range of P(Rg) curves thatare consistent with this single experimental value.Alternatively, if Rexpt
h,U � 19.1(�0.5) AÊ is the onlyexperimental parameter, a range of distributionsshown in Figure 4(b) is obtained. Figure 4(c) illus-trates the set of P(Rg) functions that are obtainedwhen both Rexp t
g,U � 15.0(�0.5) AÊ and Rexpth,U � 19.1
(�0.5) AÊ are ®tted simultaneously and it is clearthat the distribution is much better de®ned.
Figure 5 illustrates the distribution that isobtained when ``ensemble-averaged'' values of Rg
(``Rexptg,U `` � 18.5 AÊ ) and Rh (``Rexpt
h,U `` � 20.0 AÊ ), calcu-lated from the 60,000 structures generated from theTRADES unfolding trajectory, are ®tted usingequation (9). The actual distribution (histogram) isshown, and P(Rg), obtained from minimization ofw2 using either equation (4a) (green, broken line) orequation (4b) (red, continuous line), is illustratedfor comparison. It is clear that despite the fact thatthere are only two ®tting parameters in equation(4a) and one in equation (4b), both P(Rg) functionalforms capture the essential elements of the distri-bution. As a further test of the model, 110 subsetsof conformers from the 60,000 structures were gen-erated comprised of approximately 300 structureseach, ensemble-averaged ``Rexpt
g,U `` and ``Rexpth,U `` calcu-
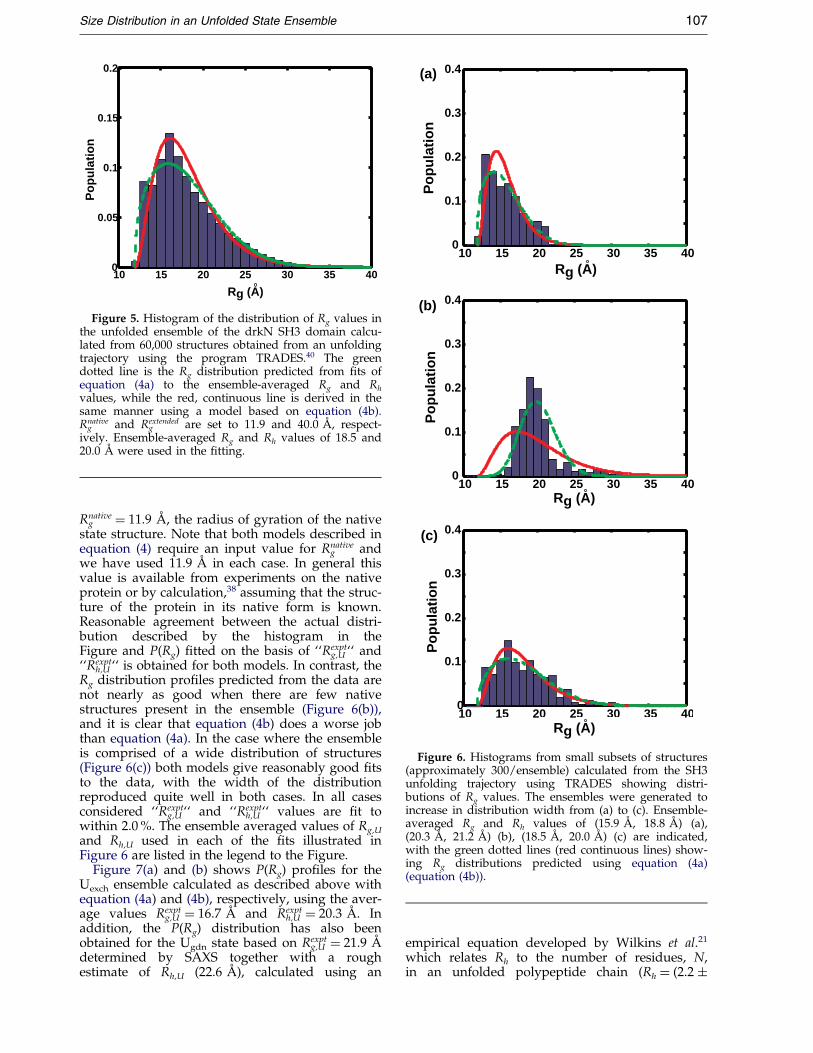
lated for each group as before, and P(Rg) distri-bution functions obtained. Figure 6 illustrateshistograms of Rg along with the calculated P(Rg)curves (green, broken line equation (4a); red, con-tinuous line equation (4b)) for representative setsof data.
In Figure 6(a) a relatively narrow distribution ofstructures is present in the ensemble, with a signi®-cant population of structures close to
10 15 20 25 30 35 400
0.1
0.2
0.3
0.4
Rg (A)
Po
pu
lati
on
(a)
Rg (A)
Po
pu
lati
on
10 15 20 25 30 35 400
0.1
0.2
0.3
0.4(b)
Rg (A)
Po
pu
lati
on
10 15 20 25 30 35 400
0.1
0.2
0.3
0.4(c)
Figure 6. Histograms from small subsets of structures(approximately 300/ensemble) calculated from the SH3unfolding trajectory using TRADES showing distri-butions of Rg values. The ensembles were generated toincrease in distribution width from (a) to (c). Ensemble-averaged Rg and Rh values of (15.9 AÊ , 18.8 AÊ ) (a),(20.3 AÊ , 21.2 AÊ ) (b), (18.5 AÊ , 20.0 AÊ ) (c) are indicated,with the green dotted lines (red continuous lines) show-ing Rg distributions predicted using equation (4a)(equation (4b)).
10 15 20 25 30 35 400
0.05
0.1
0.15
0.2
Rg (A)
Po
pu
lati
on
Figure 5. Histogram of the distribution of Rg values inthe unfolded ensemble of the drkN SH3 domain calcu-lated from 60,000 structures obtained from an unfoldingtrajectory using the program TRADES.40 The greendotted line is the Rg distribution predicted from ®ts ofequation (4a) to the ensemble-averaged Rg and Rh
values, while the red, continuous line is derived in thesame manner using a model based on equation (4b).Rnative
g and Rextendedg are set to 11.9 and 40.0 AÊ , respect-
ively. Ensemble-averaged Rg and Rh values of 18.5 and20.0 AÊ were used in the ®tting.
Size Distribution in an Unfolded State Ensemble 107
Rnativeg � 11.9 AÊ , the radius of gyration of the native
state structure. Note that both models described inequation (4) require an input value for Rnative
g andwe have used 11.9 AÊ in each case. In general thisvalue is available from experiments on the nativeprotein or by calculation,38 assuming that the struc-ture of the protein in its native form is known.Reasonable agreement between the actual distri-bution described by the histogram in theFigure and P(Rg) ®tted on the basis of ``Rexpt
g,U `` and``Rexpt
h,U `` is obtained for both models. In contrast, theRg distribution pro®les predicted from the data arenot nearly as good when there are few nativestructures present in the ensemble (Figure 6(b)),and it is clear that equation (4b) does a worse jobthan equation (4a). In the case where the ensembleis comprised of a wide distribution of structures(Figure 6(c)) both models give reasonably good ®tsto the data, with the width of the distributionreproduced quite well in both cases. In all casesconsidered ``Rexpt
g,U `` and ``Rexpth,U `` values are ®t to
within 2.0 %. The ensemble averaged values of Rg,U
and Rh,U used in each of the ®ts illustrated inFigure 6 are listed in the legend to the Figure.
Figure 7(a) and (b) shows P(Rg) pro®les for theUexch ensemble calculated as described above withequation (4a) and (4b), respectively, using the aver-age values Rexpt
g,U � 16.7 AÊ and Rexpth,U � 20.3 AÊ . In
addition, the P(Rg) distribution has also beenobtained for the Ugdn state based on Rexpt
g,U � 21.9 AÊ
determined by SAXS together with a roughestimate of Rh,U (22.6 AÊ ), calculated using an
empirical equation developed by Wilkins et al.21
which relates Rh to the number of residues, N,in an unfolded polypeptide chain (Rh � (2.2 �
10 15 20 25 30 35 400
0.05
0.1
0.15
0.2
0.25(a)
Po
pu
lati
on
10 15 20 25 30 35 400
0.2
0.4
0.6
0.8
Uexch
Ugdn
Rg (A)
Po
pu
lati
on
(b)
Rg (A)
Rg (A)
Po
pu
lati
on
(c)
10 15 20 25 30 35 400
0.05
0.1
0.15
0.2
0.25
12 14 16 18 20 22 24 26 28 30 32 34 36 38 400
0.05
0.1
0.15
0.2
0.25
10 15 20 25 30 35 400
0.2
0.4
0.6
0.8
Uexch
Ugdn
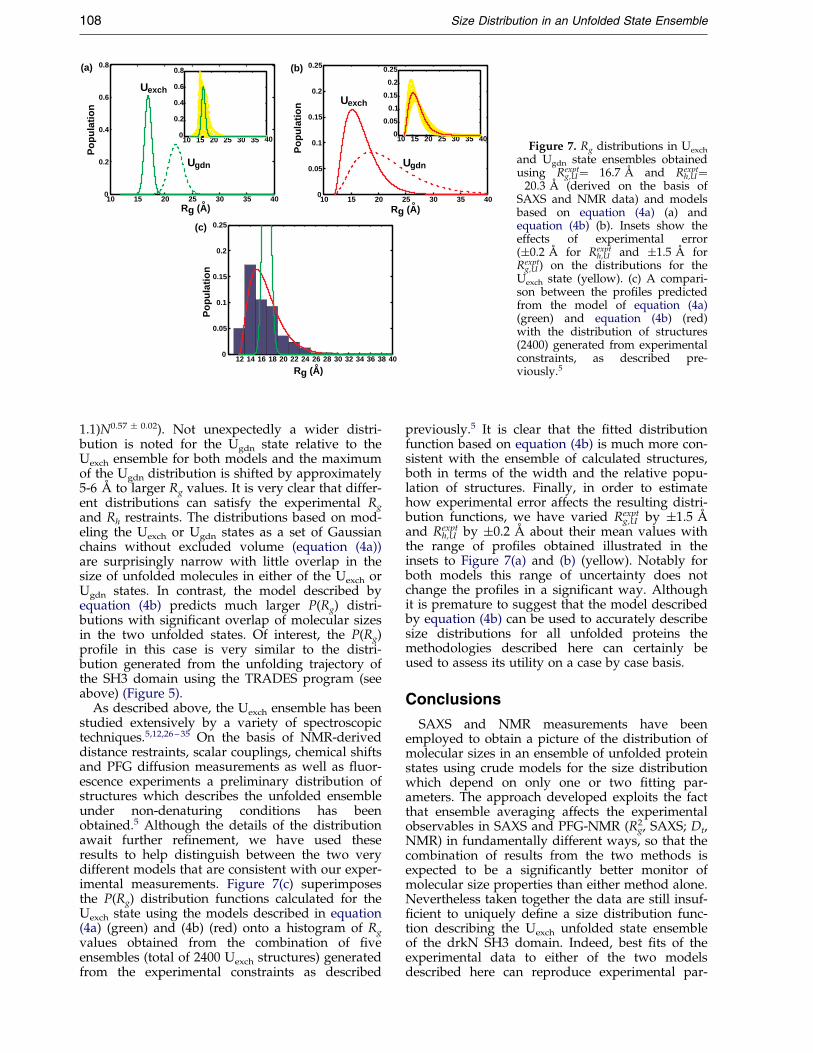
Figure 7. Rg distributions in Uexch
and Ugdn state ensembles obtainedusing Rexpt
g,U� 16.7 AÊ and Rexpth,U�
20.3 AÊ (derived on the basis ofSAXS and NMR data) and modelsbased on equation (4a) (a) andequation (4b) (b). Insets show theeffects of experimental error(�0.2 AÊ for Rexpt
h,U and �1.5 AÊ forRexpt
g,U ) on the distributions for theUexch state (yellow). (c) A compari-son between the pro®les predictedfrom the model of equation (4a)(green) and equation (4b) (red)with the distribution of structures(2400) generated from experimentalconstraints, as described pre-viously.5
108 Size Distribution in an Unfolded State Ensemble
1.1)N0.57 � 0.02). Not unexpectedly a wider distri-bution is noted for the Ugdn state relative to theUexch ensemble for both models and the maximumof the Ugdn distribution is shifted by approximately5-6 AÊ to larger Rg values. It is very clear that differ-ent distributions can satisfy the experimental Rg
and Rh restraints. The distributions based on mod-eling the Uexch or Ugdn states as a set of Gaussianchains without excluded volume (equation (4a))are surprisingly narrow with little overlap in thesize of unfolded molecules in either of the Uexch orUgdn states. In contrast, the model described byequation (4b) predicts much larger P(Rg) distri-butions with signi®cant overlap of molecular sizesin the two unfolded states. Of interest, the P(Rg)pro®le in this case is very similar to the distri-bution generated from the unfolding trajectory ofthe SH3 domain using the TRADES program (seeabove) (Figure 5).
As described above, the Uexch ensemble has beenstudied extensively by a variety of spectroscopictechniques.5,12,26 ± 35 On the basis of NMR-deriveddistance restraints, scalar couplings, chemical shiftsand PFG diffusion measurements as well as ¯uor-escence experiments a preliminary distribution ofstructures which describes the unfolded ensembleunder non-denaturing conditions has beenobtained.5 Although the details of the distributionawait further re®nement, we have used theseresults to help distinguish between the two verydifferent models that are consistent with our exper-imental measurements. Figure 7(c) superimposesthe P(Rg) distribution functions calculated for theUexch state using the models described in equation(4a) (green) and (4b) (red) onto a histogram of Rg
values obtained from the combination of ®veensembles (total of 2400 Uexch structures) generatedfrom the experimental constraints as described
previously.5 It is clear that the ®tted distributionfunction based on equation (4b) is much more con-sistent with the ensemble of calculated structures,both in terms of the width and the relative popu-lation of structures. Finally, in order to estimatehow experimental error affects the resulting distri-bution functions, we have varied Rexpt
g,U by �1.5 AÊ
and Rexpth,U by �0.2 AÊ about their mean values with
the range of pro®les obtained illustrated in theinsets to Figure 7(a) and (b) (yellow). Notably forboth models this range of uncertainty does notchange the pro®les in a signi®cant way. Althoughit is premature to suggest that the model describedby equation (4b) can be used to accurately describesize distributions for all unfolded proteins themethodologies described here can certainly beused to assess its utility on a case by case basis.
Conclusions
SAXS and NMR measurements have beenemployed to obtain a picture of the distribution ofmolecular sizes in an ensemble of unfolded proteinstates using crude models for the size distributionwhich depend on only one or two ®tting par-ameters. The approach developed exploits the factthat ensemble averaging affects the experimentalobservables in SAXS and PFG-NMR (R2
g, SAXS; Dt,NMR) in fundamentally different ways, so that thecombination of results from the two methods isexpected to be a signi®cantly better monitor ofmolecular size properties than either method alone.Nevertheless taken together the data are still insuf-®cient to uniquely de®ne a size distribution func-tion describing the Uexch unfolded state ensembleof the drkN SH3 domain. Indeed, best ®ts of theexperimental data to either of the two modelsdescribed here can reproduce experimental par-
Size Distribution in an Unfolded State Ensemble 109
ameters to within 4 %, yet very different distri-bution functions are generated. Both of the pro®lesare consistent with previous NMR studies of theUexch state that suggested that molecules are rela-tively compact with signi®cant amounts of non-native secondary and tertiary interactions, withmany of these contacts disappearing upon additionof guanidinium chloride.12 However, comparisonof the different models obtained exclusively on thebasis of the PFG-NMR and SAXS data with the dis-tribution of structures in Uexch ensembles calcu-lated primarily from NOE, chemical shift, scalarcoupling and diffusion constant restraints5 indi-cates that one of the pro®les is much more likely(model described by equation (4b)). Notably thispro®le predicts a wide distribution of structures,similar to what is observed when an ensemblecomprised of 60,000 conformers is generated bysuccessively unfolding the SH3 domain, as well assigni®cant overlap in the family of structures of theUexch and Ugdn states.
Materials and Methods
Sample preparation
The protein expression and puri®cation of the drkNSH3 domain has been described.12 The sample of theFexch/Uexch equilibrium mixture contained 7 mg/ml pro-tein in 50 mM phosphate buffer solution at pH 6.0.Samples of the fully stabilized folded state (Fs) (11.6 mg/
Gz-g2
g2 g4 g4g3
15N t1/2
φ 2φ 1
1H
y
τa
g1
τa
β
-x -y
τb
y y
TN-τb TN-
∆
aδ/2
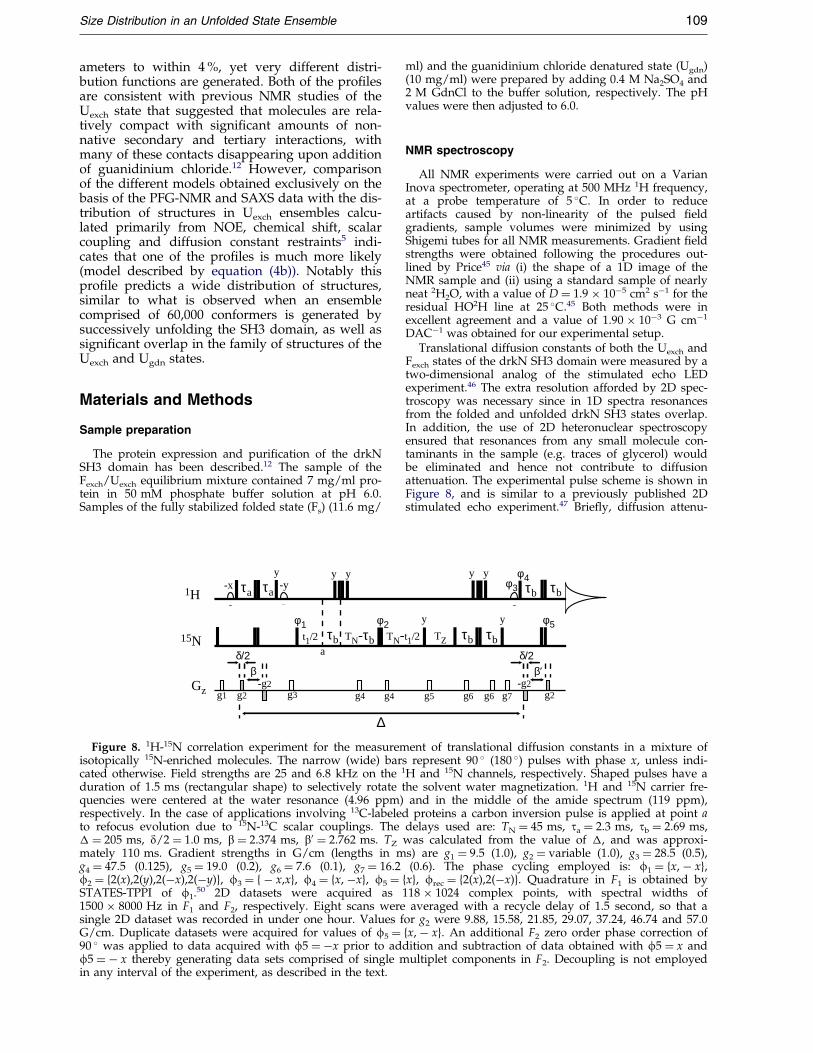
Figure 8. 1H-15N correlation experiment for the measuremisotopically 15N-enriched molecules. The narrow (wide) barcated otherwise. Field strengths are 25 and 6.8 kHz on the 1
duration of 1.5 ms (rectangular shape) to selectively rotate tquencies were centered at the water resonance (4.96 ppm)respectively. In the case of applications involving 13C-labeleto refocus evolution due to 15N-13C scalar couplings. The� � 205 ms, d/2 � 1.0 ms, b � 2.374 ms, b0 � 2.762 ms. TZ
mately 110 ms. Gradient strengths in G/cm (lengths in mg4 � 47.5 (0.125), g5 � 19.0 (0.2), g6 � 7.6 (0.1), g7 � 16.2f2 � {2(x),2(y),2(ÿx),2(ÿy)}, f3 � { ÿ x,x}, f4 � {x, ÿx}, f5 �STATES-TPPI of f1.
50 2D datasets were acquired as1500 � 8000 Hz in F1 and F2, respectively. Eight scans weresingle 2D dataset was recorded in under one hour. Values fG/cm. Duplicate datasets were acquired for values of f5 �90 � was applied to data acquired with f5 � ÿx prior to adf5 � ÿ x thereby generating data sets comprised of single min any interval of the experiment, as described in the text.
ml) and the guanidinium chloride denatured state (Ugdn)(10 mg/ml) were prepared by adding 0.4 M Na2SO4 and2 M GdnCl to the buffer solution, respectively. The pHvalues were then adjusted to 6.0.
NMR spectroscopy
All NMR experiments were carried out on a VarianInova spectrometer, operating at 500 MHz 1H frequency,at a probe temperature of 5 �C. In order to reduceartifacts caused by non-linearity of the pulsed ®eldgradients, sample volumes were minimized by usingShigemi tubes for all NMR measurements. Gradient ®eldstrengths were obtained following the procedures out-lined by Price45 via (i) the shape of a 1D image of theNMR sample and (ii) using a standard sample of nearlyneat 2H2O, with a value of D � 1.9 � 10ÿ5 cm2 sÿ1 for theresidual HO2H line at 25 �C.45 Both methods were inexcellent agreement and a value of 1.90 � 10ÿ3 G cmÿ1
DACÿ1 was obtained for our experimental setup.Translational diffusion constants of both the Uexch and
Fexch states of the drkN SH3 domain were measured by atwo-dimensional analog of the stimulated echo LEDexperiment.46 The extra resolution afforded by 2D spec-troscopy was necessary since in 1D spectra resonancesfrom the folded and unfolded drkN SH3 states overlap.In addition, the use of 2D heteronuclear spectroscopyensured that resonances from any small molecule con-taminants in the sample (e.g. traces of glycerol) wouldbe eliminated and hence not contribute to diffusionattenuation. The experimental pulse scheme is shown inFigure 8, and is similar to a previously published 2Dstimulated echo experiment.47 Brie¯y, diffusion attenu-
g6 g6g5 g7
y
τbt1/2 TZ τb
y y
y
φ 3φ 4
g2-g2
τb τb
φ 5
β′δ/2
ent of translational diffusion constants in a mixture ofs represent 90 � (180 �) pulses with phase x, unless indi-H and 15N channels, respectively. Shaped pulses have ahe solvent water magnetization. 1H and 15N carrier fre-and in the middle of the amide spectrum (119 ppm),
d proteins a carbon inversion pulse is applied at point adelays used are: TN � 45 ms, ta � 2.3 ms, tb � 2.69 ms,was calculated from the value of �, and was approxi-s) are g1 � 9.5 (1.0), g2 � variable (1.0), g3 � 28.5 (0.5),(0.6). The phase cycling employed is: f1 � {x, ÿ x},
{x}, frec � {2(x),2(ÿx)}. Quadrature in F1 is obtained by118 � 1024 complex points, with spectral widths of
averaged with a recycle delay of 1.5 second, so that aor g2 were 9.88, 15.58, 21.85, 29.07, 37.24, 46.74 and 57.0{x, ÿ x}. An additional F2 zero order phase correction ofdition and subtraction of data obtained with f5 � x and
ultiplet components in F2. Decoupling is not employed

110 Size Distribution in an Unfolded State Ensemble
ation is achieved by varying the ®eld strength of encod-ing and decoding gradients, g2, while keeping the delaysbetween them constant. The encoding and decoding gra-dients are split and merged with the polarization transfersteps of a 2D constant time (CT) heteronuclear singlequantum correlation (HSQC) experiment. The diffusionlabeling gradients (in gray) bracket the constant-timeevolution period (2TN) for chemical shift labeling and aperiod where the magnetization is stored along thez-axis (TZ), which exploits the slower relaxation of longi-tudinal versus transverse nitrogen magnetization, as inthe LED experiment.46 Note also that the evolutionperiod precedes the delay TZ (�110 ms) so that exchangebetween the folded and unfolded species during thistime would generate cross-peaks. Notably we have notobserved such peaks in the present study, in agreementwith the very slow exchange rates between folded andunfolded states (<1 sÿ1) at 5 �C measured previously.26
The absence of cross-peaks ensures that the diffusioncoef®cients obtained from the auto-peaks of the folded/unfolded states are not contaminated due to theexchange process.
In order to minimize sample heating throughout thecourse of the measurements decoupling was notemployed during any stage of the experiment. We haveobserved that decoupling can create temperature gradi-ents leading to convection currents along the Z-axis,resulting in signal attenuation and hence an increase inthe measured diffusion constant.45 When decouplingwas applied errors were particularly noticeable in stu-dies of the Ugdn state of the drkN SH3 domain where theprotein was dissolved in 2 M GdnCl. The absence ofdecoupling during acquisition does, however double thenumber of cross-peaks. In order to minimize spectralcrowding we have elected to record F2-inphase (f5 � x)and F2-antiphase (f5 � ÿx) spectra in an interleavedmanner. Addition and subtraction of the resultant datasets produces spectra where cross-peaks are displaced by1JHN Hz from each other in the F2 dimension, and diffu-sion constants can be measured using both spectra there-by decreasing the measurement error by
p2, with the
number of cross-peaks identical to what is obtained indecoupled spectra.
We have also developed a similar experiment whichrecords 2D 13C-1H CT-HSQC correlation maps and usedthis experiment to measure diffusion constants from theintensity versus gradient strength pro®le of methyl corre-lations. Notably, identical diffusion constants weremeasured using both 15N and 13C-based approachesonce decoupling was eliminated from both experiments.
A series of well-resolved 2D 15N-1H HSQC spectrawere obtained for different values of the encoding/decoding gradient ®eld strength g2 and peak intensities®tted to the relation:
I�G� � I�0� expfÿ�gGd�2D��ÿ d=3ÿ 3b=4� b0=4�g �10�which has been derived for the experiment of Figure 8.In equation (10) G is the ®eld strength of the encodingand decoding gradients, g2, g is the proton gyromagneticratio (2.675 � 104 rad Gÿ1 sÿ1), D is the diffusion coef®-cient and the delays �, d, b and b0 are de®ned in theFigure. Equation (10) was obtained following theapproach described by Stejskal and Tanner48 and reducesto their well-known result for the case where the bipolargradient pairs merge to single gradient pulses of lengthd (b � b0 � 0). Notably, amide peak intensities wereobtained for 72 % of residues in the folded state and32 % of the available residues in the unfolded state.
Small-angle X-ray scattering
All measurements were made at the Stanford Synchro-tron Radiation Laboratory (SSRL) at a sample tempera-ture of 5 �C. The beam energy was selected to be 8980 eV(Cu K-edge) using a high ¯ux multi-layer monochroma-tor (Mo/B4C). To avoid radiation-induced aggregationinherent in the measurements, the protein samples werere-circulated through a polypropylene ¯ow cell. A maxi-mum ¯ow rate of 1.3 ml/minute was used to minimizethe time any particular volume of sample remained inthe beam. Each sample was measured for ten minutes.Radii of gyration were calculated according to theGuinier approximation:49
ln�I�S�� � ln�I�0�� ÿ 4p2R2g
3S2 �11�
where Rg is the radius of gyration, S � (2 siny)/l, with2y the scattering angle and l is the X-ray wavelength.The ®tting ranges used were 0.0041-0.0175 AÊ ÿ1, 0.0045-0.0142 AÊ ÿ1 and 0.0044-0.0095 AÊ ÿ1, for the Fs, Fexch/Uexch
and Ugdn samples, respectively. Even with the compara-tively large volumes of protein used in the study, thetime-dependent increase in Rg suggested that there wassome radiation damage to the protein and therefore onlythe ®rst two minutes of data were used in the analysis.An error in Rg of �0.5 AÊ was estimated from repeatmeasurements.
Generation of unfolding trajectories from TRADES
Starting from the NMR structure of the folded state ofthe drkN SH3 domain (Singer and Forman-Kay, unpub-lished), Ca atoms were displaced in an iterative manner.The amount of displacement is dependent on two user-de®ned parameters, the temperature and the timestep, insuch a way that the Ca displacement increases with bothparameters.40 After each displacement, the remainingatoms from backbone and side-chain positions areadded, using a side-chain rotamer library. In this manner600 unfolding trajectories were generated, each with 100structures. 300 of the trajectories were obtained with thetemperature and the timestep set to 298 K and 100 fs,respectively, while the remaining structures were gener-ated using values of 400 K and 400 fs for the tempera-ture and timestep parameters. Further details can befound in Choy and Forman-Kay.5
Generation of unfolding trajectories from hightemperature molecular dynamics
Molecular dynamics trajectories were kindly providedby M. Philippopoulos and R. Pomes (unpublishedresults). These simulations were preformed usingAMBER version 6 with the AMBER PARM96.DAT par-ameter set starting from a fully hydrated drkN SH3domain structure. 9600 structures were extracted from a10 ns trajectory at 498 K, with an additional 592 struc-tures obtained from a 3.55 ns trajectory recorded at598 K, with the ®nal structure of the 498 K run used asinput for the higher temperature simulation.
Calculation of hydrodynamic properties using theprogram HYDROPRO
Hydrodynamic radii and radii of gyration for the60,000 structures from the TRADES unfolding trajectoryand for the 10,200 structures from molecular dynamics
Size Distribution in an Unfolded State Ensemble 111
simulations were calculated using the program HYDRO-PRO.38 Details of the calculation can be obtained fromthe original reference. Brie¯y, for each structure, a pre-liminary hydrodynamic model was obtained by repla-cing non-hydrogen atoms with spherical elements of®xed radius a. The resulting particle, comprised of over-lapping spheres, is then used to obtain a rough shellmodel, consisting of a shell of mini-beads of radius s,upon which the hydrodynamic forces act. Hydrodyn-amic radii are then calculated using a value of a � 3 AÊ ,which takes into account the effects of hydration,38
assumed the same for folded and unfolded states. Avalue of s � 1.74 AÊ was used in all calculations.
Acknowledgments
We thank Dr Jose GarcõÂa de la Torre (University deMurcia, Spain) and Dr Hue Sun Chan (University of Tor-onto) for many useful discussions. W.-Y.C. and F.A.A.M.are research fellows supported by a grant from AstraZe-neca UK Limited. L.E.K. and J.D.F-K. acknowledge grantsupport from the CIHR. L.E.K. is an InternationalResearch Scholar of the Howard Hughes MedicalInstitute.
References
1. Wright, P. E. & Dyson, H. J. (1999). Intrinsicallyunstructured proteins: re-assessing the protein struc-ture-function paradigm. J. Mol. Biol. 293, 321-331.
2. Kriwacki, R. W., Hengst, L., Tennant, L., Reed,S. I. & Wright, P. E. (1996). Structural studies ofp21Waf1/Cip1/Sdi1 in the free and Cdk2-bound state:Cconformational disorder mediates binding diver-sity. Proc. Natl Acad. Sci. USA, 93, 11504-11509.
3. Campbell, K. M., Terrell, A. R., Laybourn, P. J. &Lumb, K. J. (2000). Intrinsic structural disorder ofthe C-terminal activation domain from the bZIPtranscription factor Fos. Biochemistry, 39, 2708-2713.
4. Dunker, A. K., Obradovic, Z., Romero, P., Garner,E. C. & Brown, C. J. (2000). Intrinsic protein disorderin complete genomes. Genome Infomatics, 11, 161-171.
5. Choy, W.-Y. & Forman-Kay, J. D. (2001). Calculationof ensembles of structures representing the unfoldedstate of an SH3 domain. J. Mol. Biol. 308, 1011-1032.
6. Serrano, L. (1995). Comparison between the f distri-bution of the amino acids in the protein databaseand NMR data indicates that amino acids have var-ious f propensities in the random coil conformation.J. Mol. Biol. 254, 322-333.
7. Smith, L. J., Bolin, K. A., Schwalbe, H., MacArthur,M. W., Thornton, J. M. & Dobson, C. M. (1996).Analysis of main chain torsion angles in proteins:prediction of NMR coupling constants for nativeand random coil conformations. J. Mol. Biol. 255,494-506.
8. Fiebig, K. M., Schwalbe, H., Buck, M., Smith, L. J. &Dobson, C. J. (1996). Toward a description of theconformations of denatured states of proteins. Com-parison of a random coil model with NMR measure-ments. J. Phys. Chem. 100, 2661-2666.
9. Dyson, H. J. & Wright, P. E. (1991). De®ningsolution conformations of small linear peptides.Annu. Rev. Biophys. Biophys. Chem. 20, 519-538.
10. Wishart, D. S. & Sykes, B. D. (1994). The C-13chemical-shift index- a simple method for the identi-
®cation of protein secondary structure using C-13chemical-shift data. J. Biomol. NMR, 4, 171-180.
11. Schwarzinger, S., Kroon, G. J. A., Foss, T. R.,Chung, J., Wright, P. E. & Dyson, H. J. (2001).Sequence-dependent correction of random coil NMRchemical shifts. J. Am. Chem. Soc. 123, 2970-2978.
12. Mok, Y.-K., Kay, C. M., Kay, L. E. & Forman-Kay,J. D. (1999). NOE data demonstrating a compactunfolded state for an SH3 domain under non-dena-turing conditions. J. Mol. Biol. 289, 619-638.
13. Gillespie, J. R. & Shortle, D. (1997). Characterizationof long-range structure in the denatured state ofstaphylococcal nuclease. I. Paramagnetic relaxationenhancement by nitroxide spin labels. J. Mol. Biol.268, 158-169.
14. Gillespie, J. R. & Shortle, D. (1997). Characterizationof long-range structure in the denatured state of sta-phylococcal nuclease. II. Distance restraints fromparamagnetic relaxation and calculation of anensemble of structures. J. Mol. Biol. 268, 170-184.
15. Shortle, D. & Ackerman, M. S. (2001). Persistence ofnative-like topology in a denatured protein in 8 Murea. Science, 293, 487-489.
16. Doniach, S. (2001). Changes in biomolecular confor-mation seen by small-angle X-ray scattering. Chem.Revs. 101, 1763-1778.
17. Sosnick, T. R. & Trewhella, J. (1992). Denaturedstates of ribonuclease A have compact dimensionsand residual secondary structure. Biochemistry, 31,8329-8335.
18. Chen, L., Wildegger, G., Kiefhaber, T., Hodgson,K. O. & Doniach, S. (1998). Kinetics of lysozymerefolding: structural characterization of a non-speci®cally collapsed state using time-resolved X-rayscattering. J. Mol. Biol. 276, 225-237.
19. Segel, D. J., Bachmann, A., Hofrichter, J., Hodgson,K. O., Doniach, S. & Kiefhaber, T. (1999). Character-ization of transient intermediates in lysozyme fold-ing with time-resolved small-angle X-ray scattering.J. Mol. Biol. 288, 489-499.
20. Jones, J. A., Wilkins, D. K., Smith, L. J. & Dobson,C. M. (1997). Characterisation of protein unfoldingby NMR diffusion measurements. J. Biomol. NMR,10, 199-203.
21. Wilkins, D. K., Grimshaw, S. B., Receveur, V.,Dobson, C. M., Jones, J. A. & Smith, L. J. (1999).Hydrodynamic radii of native and denaturedproteins measured by pulse ®eld gradient NMRtechniques. Biochemistry, 38, 16424-16431.
22. Pan, H., Barany, G. & Woodward, G. (1997).Reduced BPTI is collapsed. A pulsed ®eld gradientNMR study of unfolded and partially folded bovinepancreatic trypsin inhibitor. Protein Sci. 6, 1985-1992.
23. Morgan, C. J., Wilkins, D. K., Smith, L. J., Kawata,Y. & Dobson, C. M. (2000). A compact monomericintermediate identi®ed by NMR in the denaturationof dimeric triose phosphate isomerase. J. Mol. Biol.300, 11-16.
24. Olivier, J. P., Raabe, T., Henkemeyer, M., Dickson,B., Mbamalu, G., Margolis, B. et al. (1993). ADrosophila SH2-SH3 adaptor protein implicated incoupling the sevenless tyrosine kinase to an activa-tor of Ras guanine nucleotide exchange, Sos. Cell,73, 179-191.
25. Bar-Sagi, D., Rotin, D., Batzer, A., Mandiyan, V. &Schlessinger, J. (1993). SH3 domains direct cellularlocalization of signaling molecules. Cell, 74, 83-91.
26. Farrow, N. A., Zhang, O., Forman-Kay, J. D. & Kay,L. E. (1994). A heteronuclear correlation experiment

112 Size Distribution in an Unfolded State Ensemble
for simultaneous determination of 15N longitudinaldecay and chemical exchange rates of systems inslow equilibrium. J. Biomol. NMR, 4, 727-734.
27. Zhang, O., Kay, L. E., Olivier, J. P. & Forman-Kay,J. D. (1994). Backbone 1H and 15N resonance assign-ments of the N-terminal SH3 domain of drk infolded and unfolded states using enhanced-sensi-tivity pulsed ®eld gradient NMR techniques.J. Biomol. NMR, 4, 845-858.
28. Zhang, O. & Forman-Kay, J. D. (1995). Structuralcharacterization of folded and unfolded states ofan SH3 domain in equilibrium in aqueous buffer.Biochemistry, 34, 6784-6794.
29. Farrow, N. A., Zhang, O., Forman-Kay, J. D. & Kay,L. E. (1995). Comparison of the backbone dynamicsof a folded and an unfolded SH3 domain existing inequilibrium in aqueous buffer. Biochemistry, 34, 868-878.
30. Farrow, N. A., Zhang, O., Forman-Kay, J. D. & Kay,L. E. (1997). Characterization of the backbonedynamics of folded and denatured states of an SH3domain. Biochemistry, 36, 2390-2402.
31. Zhang, O. & Forman-Kay, J. D. (1997). NMR studiesof unfolded states of an SH3 domain in aqueoussolution and denaturing conditions. Biochemistry, 36,3959-3970.
32. Zhang, O., Forman-Kay, J. D., Shortle, D. & Kay,L. E. (1997). Triple-resonance NOESY-based exper-iments with improved spectral resolution: appli-cations to structural characterization of unfolded,partially folded and folded proteins. J. Biomol. NMR,9, 181-200.
33. Yang, D., Mittermaier, A., Mok, Y.-K. & Kay, L. E.(1998). A study of protein side-chain dynamics fromnew 2H auto-correlation and 13C cross-correlationNMR experiments: application to the N-terminalSH3 domain from drk. J. Mol. Biol. 276, 939-954.
34. Yang, D., Mok, Y.-K., Muhandiram, D. R., Forman-Kay, J. D. & Kay, L. E. (1999). 1H-13C dipole-dipolecross-correlated spin relaxation as a probe ofdynamics in unfolded proteins: application to theDrkN SH3 domain. J. Am. Chem. Soc. 121, 3555-3556.
35. Mok, Y.-K., Elisseeva, E. L., Davidson, A. R. &Forman-Kay, J. D. (2001). Dramatic stabilization ofan SH3 domain by single substitution: roles of thefolded and unfolded states. J. Mol. Biol. 307, 913-928.
36. Segel, D. J., Fink, A. L., Hodgson, K. O. & Doniach,S. (1998). Protein denaturation: a small-angle X-rayscattering study of the ensemble of unfolded statesof Cytochrome c. Biochemistry, 37, 12443-12451.
37. Flory, P. J. & Fisk, S. (1966). Effect of volume exclu-sion on the dimensions of polymer chains. J. Chem.Phys. 44, 2243-2248.
38. Garcia de la Torre, J., Huertas, M. L. & Carrasco, B.(2000). Calculation of hydrodynamic properties ofproteins from their atomic level structures. Biophys.J. 78, 719-730.
39. Oono, Y. & Kohmoto, M. (1983). Renormalizationgroup theory of transport properties of polymer sol-utions. I. Dilute solutions. J. Chem. Phys. 78, 520-528.
40. Feldman, H. J. & Hogue, C. W. V. (2000). A fastmethod to sample real protein conformational space.Proteins: Struct. Funct. Genet. 39, 112-131.
41. Vijay-Kumar, S., Bugg, C. E. & Cook, W. J. (1987).Structure of ubiquitin re®ned at 1.8 AÊ resolution.J. Mol. Biol. 194, 531-544.
42. Baudet, S. & Janin, J. (1991). Crystal structure of abarnase-d(GpC) complex at 1.9 AÊ resolution. J. Mol.Biol. 219, 123-132.
43. Williams, R. W. & Teeter, M. M. (1984). Ramanspectroscopy of homologous plant toxins: crambinand a1 and b-purothionin secondary structures,disul®de conformation and tyrosine environment.Biochemistry, 23, 6796-6802.
44. Ramanadham, M., Sieker, L. C. & Jensen, L. H.(1990). Re®nement of triclinic lysozyme: II. Themethod of stereochemically restrained least squares.Acta Crystallog. sect. B, 46, 63-69.
45. Price, W. S. (1998). Pulsed-®eld gradient nuclearmagnetic resonance as tool for studying translationaldiffusion: Part II. Experimental aspects. ConceptsMagn. Reson. 10, 197-237.
46. Gibbs, S. J. & Johnson, C. S., Jr (1991). A PFG NMRexperiement for accurate diffusion and ¯ow studiesin the presence of eddy currents. J. Magn. Reson. 93,395-402.
47. Orekhov, V. Y., Korzhnev, D. M., Pervushin, K. V.,Hoffman, E. & Arseniev, A. S. (1999). Sampling ofprotein dynamics in nanosecond time scale by 15NNMR relaxation and self-diffusion measurements.J. Biomol. Struct. Dynam. 17, 157-174.
48. Stejskal, E. O. & Tanner, J. E. (1965). Spin diffusionmeasurements: spin echoes in the presence of atime-dependent ®eld gradient. J. Chem. Phys. 42,288-292.
49. Glatter, O. & Kratky, O. (1982). Small Angle X-rayScattering, Academic Press, New York.
50. Marion, D., Ikura, M., Tschudin, R. & Bax, A.(1989). Rapid recording of 2D NMR spectra withoutphase cycling. Application to the study of hydrogenexchange in proteins. J. Magn. Reson. 85, 393-399.
Edited by P. E. Wright
(Received 4 October 2001; received in revised form 29 November 2001; accepted 6 December 2001)