Distributed lag associations between respiratory illnesses and mortality with suspended particle...
12
ORIGINAL ARTICLE Distributed lag associations between respiratory illnesses and mortality with suspended particle concentration in Tula, a highly polluted industrial region in Central Mexico Eva M. Melgar-Paniagua • Elizabeth Vega-Rangel • Luz M. Del Razo • Carlos A. Lucho-Constantino • Stephen J. Rothenberg • Andrea De Vizcaya-Ruiz Received: 7 December 2011 / Accepted: 22 March 2012 / Published online: 8 April 2012 Ó Springer-Verlag 2012 Abstract Purpose We aimed to evaluate the association between changes in airborne particulate matter concentration (PM) with changes in cases of mortality, acute respiratory infections (ARI) and asthma over 2004–2008 in an indus- trialized and polluted region in central Mexico. Methods A generalized linear model with a Poisson dis- tribution and a negative binomial analysis was used to evaluate the influence of PM and temperature on all-cause mortality (All-cause-M), cause-specific mortality (Cause- specific-M), ARI and asthma, using cubic spline functions and distributed lags of PM. Estimated changes in relative risk were calculated for an exposure corresponding to each increase of 10 lg/m 3 in PM level. Results Associations between PM and mortality and morbidity were statistically most consistent for total sus- pended particulate (TSP) than for particulate matter \ 10 lM aerodynamic diameter (PM 10 ). The greatest effects in mortality were observed with a 3-week lag, and effects were greater for Cause-specific-M. We also found a displacement effect up to 4-week lag for Cause-specific-M and TSP. The greatest effects in morbidity were observed at 0-week lag, yet they were statistically marginal and were greater for asthma. We found a displacement effect at 4–5– 6-week lag for asthma and TSP. All associations of mor- tality and morbidity, expressed as change in relative risk, were greater with PM 10 ; however, all of them were sta- tistically marginal. Conclusions Increased respiratory morbidity and mortal- ity is associated with weekly changes of PM air pollution in the region. A reduction in air pollutants from industrial sources would benefit life quality and health of the exposed population. Keywords Respiratory illnesses Á Mortality Á Air pollution Á Generalized linear model Á Distributed lag model Á Time-series Introduction Tula–Tepeji is a major industrial region located in the state of Hidalgo, northwest of Mexico City’s Metropolitan Area, where power plants, an oil refinery and cement factories are located and release large amounts of pollutants into the air. This region is composed of 10 municipalities, of which four, Tula de Allende, Tepeji del Rio, Atotonilco de Tula E. M. Melgar-Paniagua Á L. M. Del Razo Á S. J. Rothenberg Á A. De Vizcaya-Ruiz (&) Departamento de Toxicologı ´a, Centro de Investigacio ´n y de Estudios Avanzados del Instituto Polite ´cnico Nacional, Av. Instituto Polite ´cnico Nacional 2508, Col. San Pedro Zacatenco, Delegacio ´n Gustavo A. Madero, 07760 Mexico, D. F., Mexico e-mail: [email protected] E. Vega-Rangel Programas de Investigacio ´n, Instituto Mexicano del Petro ´leo, Eje Central La ´zaro Ca ´rdenas No. 152, Col. San Bartolo Atepehuacan, Delegacio ´n Gustavo A, Madero, 07730 Mexico, D. F., Mexico C. A. Lucho-Constantino Ingenierı ´a en Biotecnologı ´a, Universidad Polite ´cnica de Pachuca, Carretera Pachuca, Cd. Sahagu ´n, km 20, Ex-Hacienda de Santa Ba ´rbara, Municipio de Zempoala, Hidalgo, Mexico S. J. Rothenberg Centro de Investigaciones en Salud Poblacional, Instituto Nacional de Salud Pu ´blica, Universidad No. 655, Col. Santa Marı ´a Ahuacatitla ´n, Cerrada Los Pinos y Caminera, 62100 Cuernavaca, Morelos, Mexico 123 Int Arch Occup Environ Health (2013) 86:321–332 DOI 10.1007/s00420-012-0768-2
Transcript of Distributed lag associations between respiratory illnesses and mortality with suspended particle...

ORIGINAL ARTICLE
Distributed lag associations between respiratory illnesses
and mortality with suspended particle concentration in Tula,
a highly polluted industrial region in Central Mexico
Eva M. Melgar-Paniagua • Elizabeth Vega-Rangel •
Luz M. Del Razo • Carlos A. Lucho-Constantino •
Stephen J. Rothenberg • Andrea De Vizcaya-Ruiz
Received: 7 December 2011 / Accepted: 22 March 2012 / Published online: 8 April 2012
Ó Springer-Verlag 2012
Abstract
Purpose We aimed to evaluate the association between
changes in airborne particulate matter concentration (PM)
with changes in cases of mortality, acute respiratory
infections (ARI) and asthma over 2004–2008 in an indus-
trialized and polluted region in central Mexico.
Methods A generalized linear model with a Poisson dis-
tribution and a negative binomial analysis was used to
evaluate the influence of PM and temperature on all-cause
mortality (All-cause-M), cause-specific mortality (Cause-
specific-M), ARI and asthma, using cubic spline functions
and distributed lags of PM. Estimated changes in relative
risk were calculated for an exposure corresponding to each
increase of 10 lg/m3 in PM level.
Results Associations between PM and mortality and
morbidity were statistically most consistent for total sus-
pended particulate (TSP) than for particulate matter
\10 lM aerodynamic diameter (PM10). The greatest
effects in mortality were observed with a 3-week lag, and
effects were greater for Cause-specific-M. We also found a
displacement effect up to 4-week lag for Cause-specific-M
and TSP. The greatest effects in morbidity were observed
at 0-week lag, yet they were statistically marginal and were
greater for asthma. We found a displacement effect at 4–5–
6-week lag for asthma and TSP. All associations of mor-
tality and morbidity, expressed as change in relative risk,
were greater with PM10; however, all of them were sta-
tistically marginal.
Conclusions Increased respiratory morbidity and mortal-
ity is associated with weekly changes of PM air pollution in
the region. A reduction in air pollutants from industrial
sources would benefit life quality and health of the exposed
population.
Keywords Respiratory illnesses � Mortality �
Air pollution � Generalized linear model �
Distributed lag model � Time-series
Introduction
Tula–Tepeji is a major industrial region located in the state
of Hidalgo, northwest of Mexico City’s Metropolitan Area,
where power plants, an oil refinery and cement factories
are located and release large amounts of pollutants into the
air. This region is composed of 10 municipalities, of which
four, Tula de Allende, Tepeji del Rio, Atotonilco de Tula
E. M. Melgar-Paniagua � L. M. Del Razo �
S. J. Rothenberg � A. De Vizcaya-Ruiz (&)
Departamento de Toxicologıa, Centro de Investigacion y
de Estudios Avanzados del Instituto Politecnico Nacional,
Av. Instituto Politecnico Nacional 2508, Col. San Pedro
Zacatenco, Delegacion Gustavo A. Madero,
07760 Mexico, D. F., Mexico
e-mail: [email protected]
E. Vega-Rangel
Programas de Investigacion, Instituto Mexicano del Petroleo,
Eje Central Lazaro Cardenas No. 152, Col. San Bartolo
Atepehuacan, Delegacion Gustavo A, Madero,
07730 Mexico, D. F., Mexico
C. A. Lucho-Constantino
Ingenierıa en Biotecnologıa,
Universidad Politecnica de Pachuca, Carretera Pachuca,
Cd. Sahagun, km 20, Ex-Hacienda de Santa Barbara,
Municipio de Zempoala, Hidalgo, Mexico
S. J. Rothenberg
Centro de Investigaciones en Salud Poblacional,
Instituto Nacional de Salud Publica, Universidad No. 655,
Col. Santa Marıa Ahuacatitlan, Cerrada Los Pinos y Caminera,
62100 Cuernavaca, Morelos, Mexico
123
Int Arch Occup Environ Health (2013) 86:321–332
DOI 10.1007/s00420-012-0768-2

and Atitalaquia, are notable for their major industrial
activity (Fig. 1).
In accordance with Mexican environmental regulations,
this region is considered critically polluted (NOM-085-
SEMARNAT-1994). According to the 2005 Emissions
Inventory published by federal environmental authority,
the industrial sectors of food and beverage; power gener-
ation; iron and steel; cement and lime; and petroleum and
petrochemical generated, nationally and globally, account
for more than 90 % of annual national emissions of PM10,
PM2.5, SO2, CO, NOx and NH3. In the same year in the
Tula–Tepeji region, 272 ktons per year (ktpy) of SO2,
35.5 ktpy of particulate matter (PM) and 30.8 ktpy of NOx
were released (SEMARNAT 2009), reporting the town of
Tula as the second municipality nationwide where the
highest amount of pollutants are released, specifically PM
and SO2, the latter attributed to oil processing (INEM
2005). When comparing the emissions (PM10, PM2.5, SO2
and NOx) between Hidalgo state industrial area versus
Mexico City urban area, important differences among air
pollutants can be observed (Fig. 2); higher emissions of
PM10, PM2.5 and SO2 are reported for Hidalgo state due
mainly to the power generation, cement and lime and
petroleum and petrochemical industries prevailing in the
region, whereas in the Mexico City urban area the highest
emitted pollutant was NOx attributable to mobile sources.
The difference in pollutants and sources between a mega-
lopolis like Mexico City and the highly industrialized
region around Tula less than 100 km from Mexico City
emphasizes the importance of conducting studies in the
Tula region.
In Tula–Tepeji region in Hidalgo state, the main emit-
ters are the Miguel Hidalgo oil refinery and Francisco
Perez Rios power plant. The oil refinery, the largest in
Mexico (PEMEX 2010), processes 289.5 thousand barrels
per day (TBD) of crude oil representing 22 % of the total
refining capacity in the country, and this refinery will
expand its capacity with additional 300 TBD in 2015.
Francisco Perez Rios power plant is the second biggest
power plant in the country with a capacity of 2095
Megawatts distributed in nine units combining vapor (fuel
oil-based) and combined cycle (based on diesel and natural
gas) technologies (CFE 2010). The air quality is poor and
pollution sometimes exceeds Mexican Air Quality Stan-
dards. Reported evidence suggests that the incidence of
respiratory illness (acute respiratory infections and asthma)
in the Tula–Tepeji region is higher than in the rest of
Hidalgo; in the case of acute respiratory infections, the
incidence in the region is higher than in the rest of the
country (Secretarıa de Salud 2008) and the main munici-
palities affected are Tula de Allende, Tepeji del Rio,
Atotonilco de Tula and Atitalaquia. The population of the
Tula–Tepeji region is about 335,000 inhabitants (2005); the
largest city in this region is Tula de Allende, which is
Fig. 1 Tula–Tepeji region.
Source Google Earth. Image Ó
2012. Yellow arrows: air quality
monitoring sites (located in each
one of the five cities); black
circles: industries (energy sector
‘‘PP’’, oil sector ‘‘PR’’ and
cement ‘‘CI’’ and lime sector);
white squares: weather stations
(WS-1: CFE station, WS-2:
National Institute for Forestry,
Agriculture and Livestock
Station, and WS-3: COEDE
Station) and black stars:
cities—residential areas (Tula,
Tepeji, Tlaxcoapan, Atitalaquia
and Atotonilco) (color figure
online)
Fig. 2 Comparison of the emissions in 2005 (ktpy: kilotons per year
in logarithmic scale) between Hidalgo State (include Tula–Tepeji
region) and the urban area of Mexico City (a highly polluted city)
322 Int Arch Occup Environ Health (2013) 86:321–332
123

located approximately 100 km to the north-northwest of
Mexico City. It is also the most populated municipality
with a population of 93,296 inhabitants (2005), corre-
sponding to 28.2 % of the population in the region. Tula de
Allende also has the largest emissions of criteria pollutants
in the region (Beltran et al. 2008).
The impact of air pollution on human health has been
widely studied and reported around the world. The evi-
dence shows that exposure to ambient air pollution as well
as short-term weather conditions may cause respiratory
illnesses in the general population (Schwartz and Dockery
1992a, b; Schwartz and Marcus 1990). Some studies have
also shown positive associations of air pollution with
mortality, using distributed lag models with an effect noted
through 40 days after exposure (Goodman et al. 2004;
Zanobetti et al. 2003) and those that use single lags
between 1 and 5 days (Cakmak et al. 2007; Welty and
Zeger 2005).
In the 1990s, several studies evaluated the association
between air pollutants and health effects, stimulated by
findings of an annual increase in the number of days that
exceeded the maximum permissible limits established by
International and Mexican Air Quality Standards (Sanchez
et al. 1991).
Population studies of mortality in adults and children
(general, cardiovascular and respiratory illnesses) (Borja-
Aburto et al. 1997a, b; Loomis et al. 1999), adverse effects
on children’s respiratory systems (Romieu et al.1992),
asthmatic children (acute inflammation) and school-age
children (Barraza-Villarreal et al. 2008; Carbajal-Arroyo
et al. 2011; Hernandez-Cadena et al. 2007; Rojas-Martinez
et al. 2007; Romieu et al. 1995, 1996) found an association
between mortality, morbidity and the concentration of
ozone and particulate matter\10 lM aerodynamic diam-
eter (PM10) and particulate matter\2.5 lM aerodynamic
diameter (PM2.5) in Mexico City and in the border city of
Ciudad Juarez, Chihuahua, Mexico. Most of the studies
conducted in Mexico have focused primarily on health
problems and air pollution in major metropolitan areas,
either in the metropolitan area of Mexico City or the border
city of Ciudad Juarez. No epidemiological or scientific
studies of the impact of air pollutants in exposed popula-
tions have been published for other regions of the country,
especially those considered to have critically high amounts
of emissions from industrial activities or for regions where
there are oil refineries and power plants, such as the Tula–
Tepeji region. In addition, most of the previous studies
have only considered health effects on the same day or a
few days after the high air pollution event, while in this
study, we report effects several weeks after exposure.
The goal of this study was to examine the associations
between changes in total suspended particulate (TSP) and
PM10 levels in the air and changes in weekly cases of
all-cause mortality (All-cause-M) and mortality related to
the sum of respiratory illnesses, ischemic heart disease and
cerebrovascular diseases (Cause-specific-M) as well as
changes in weekly cases of acute respiratory infections
(ARI) and asthma during the 2004–2008 period in the
Tula–Tepeji region. We used generalized linear models
with Poisson and negative binomial distributions to eval-
uate the influence of weekly PM concentrations and min-
imum temperature on All-cause-M, Cause-specific-M, ARI
and asthma. We analyzed PM time series with a fast fourier
transformation (FFT) to plot the frequency power spectrum
in the series used in the models in order to explain the
displacement effects due to results indicating that the
estimated associations were two or three times larger for
the extended 6-week follow-up period than for the acute
effects as would be measured with daily PM measurements
and daily mortality and morbidity.
Results are expressed as the percentage of change in
relative risk (% increase RR) in the outcome associated
with each 10 lg/m3 increase in PM pollution over the
weekly lag periods.
Materials and methods
Particulate matter data
Air pollution data were obtained from the State Council of
Ecology (COEDE, Spanish acronym) of Hidalgo, and data
were validated by the National Center of Environmental
Research and Training (CENICA, Spanish acronym) from
the National Institute of Ecology (INE, Spanish acronym).
In this region, as in many others in economically devel-
oping countries, the manual monitoring network measures
TSP and PM10 1 day every 6 days. For this study, the data
were obtained over the years from 2004 to 2008 (a total of
260 weeks). TSP and PM10 were measured using reference
methods for HiVol Particulate Collection Systems (NOM-
CCAM-002-ECOL 1993; USEPA 1990), as designated by
the United States Environmental Protection Agency. The
TSP and PM10 data from 6-day intervals were transformed
to weekly-average (arithmetic mean) concentrations in
those weeks where two measurements were recorded. The
COEDE site is located at 20°3038.9000 North and
99°20012.2600 West, 6 km to the west of the main industries
(an oil refinery and power plants). Meteorological data for
year 2005 were considered for this study. Since winds at
Tula predominantly blew from the N (12 %) and NNE
(15 %), toward rather than from the primary sources of
particulates, particulate exposure in Tula may represent a
lower conservative bound to exposure in other cities of the
region, where predominant winds favor particulate trans-
port from the sources to those cities. The TSP monitors
Int Arch Occup Environ Health (2013) 86:321–332 323
123
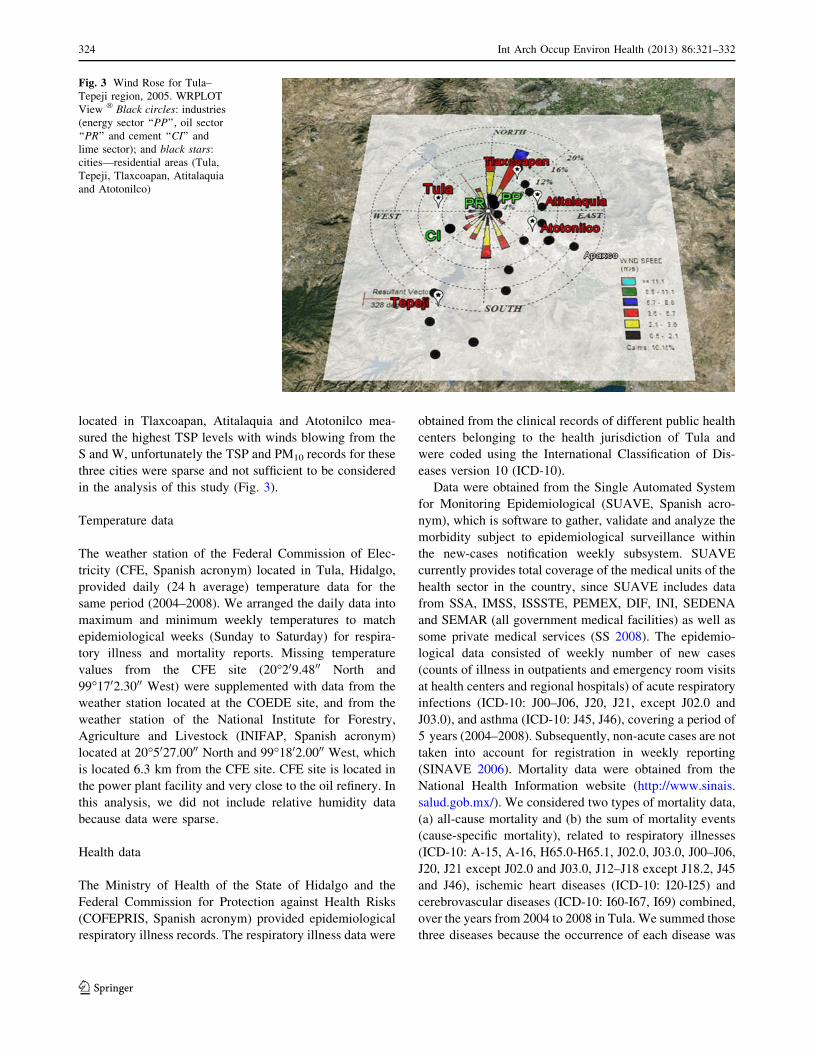
located in Tlaxcoapan, Atitalaquia and Atotonilco mea-
sured the highest TSP levels with winds blowing from the
S and W, unfortunately the TSP and PM10 records for these
three cities were sparse and not sufficient to be considered
in the analysis of this study (Fig. 3).
Temperature data
The weather station of the Federal Commission of Elec-
tricity (CFE, Spanish acronym) located in Tula, Hidalgo,
provided daily (24 h average) temperature data for the
same period (2004–2008). We arranged the daily data into
maximum and minimum weekly temperatures to match
epidemiological weeks (Sunday to Saturday) for respira-
tory illness and mortality reports. Missing temperature
values from the CFE site (20°209.4800 North and
99°1702.3000 West) were supplemented with data from the
weather station located at the COEDE site, and from the
weather station of the National Institute for Forestry,
Agriculture and Livestock (INIFAP, Spanish acronym)
located at 20°5027.0000 North and 99°1802.0000 West, which
is located 6.3 km from the CFE site. CFE site is located in
the power plant facility and very close to the oil refinery. In
this analysis, we did not include relative humidity data
because data were sparse.
Health data
The Ministry of Health of the State of Hidalgo and the
Federal Commission for Protection against Health Risks
(COFEPRIS, Spanish acronym) provided epidemiological
respiratory illness records. The respiratory illness data were
obtained from the clinical records of different public health
centers belonging to the health jurisdiction of Tula and
were coded using the International Classification of Dis-
eases version 10 (ICD-10).
Data were obtained from the Single Automated System
for Monitoring Epidemiological (SUAVE, Spanish acro-
nym), which is software to gather, validate and analyze the
morbidity subject to epidemiological surveillance within
the new-cases notification weekly subsystem. SUAVE
currently provides total coverage of the medical units of the
health sector in the country, since SUAVE includes data
from SSA, IMSS, ISSSTE, PEMEX, DIF, INI, SEDENA
and SEMAR (all government medical facilities) as well as
some private medical services (SS 2008). The epidemio-
logical data consisted of weekly number of new cases
(counts of illness in outpatients and emergency room visits
at health centers and regional hospitals) of acute respiratory
infections (ICD-10: J00–J06, J20, J21, except J02.0 and
J03.0), and asthma (ICD-10: J45, J46), covering a period of
5 years (2004–2008). Subsequently, non-acute cases are not
taken into account for registration in weekly reporting
(SINAVE 2006). Mortality data were obtained from the
National Health Information website (http://www.sinais.
salud.gob.mx/). We considered two types of mortality data,
(a) all-cause mortality and (b) the sum of mortality events
(cause-specific mortality), related to respiratory illnesses
(ICD-10: A-15, A-16, H65.0-H65.1, J02.0, J03.0, J00–J06,
J20, J21 except J02.0 and J03.0, J12–J18 except J18.2, J45
and J46), ischemic heart diseases (ICD-10: I20-I25) and
cerebrovascular diseases (ICD-10: I60-I67, I69) combined,
over the years from 2004 to 2008 in Tula. We summed those
three diseases because the occurrence of each disease was
Fig. 3 Wind Rose for Tula–
Tepeji region, 2005. WRPLOT
View ÒBlack circles: industries
(energy sector ‘‘PP’’, oil sector
‘‘PR’’ and cement ‘‘CI’’ and
lime sector); and black stars:
cities—residential areas (Tula,
Tepeji, Tlaxcoapan, Atitalaquia
and Atotonilco)
324 Int Arch Occup Environ Health (2013) 86:321–332
123
low. We chose those types of illnesses because they are
related to air pollution, although the mechanisms by which
these illnesses affect humans are different.
Statistical methods
Generalized linear models (GLM) with parametric splines
(e.g., natural cubic splines) (McCullagh and Nelder 1989)
were used to estimate the effects associated with exposure
to air pollution while accounting for smooth seasonal fluc-
tuations in morbidity or mortality that may confound esti-
mates of the pollution effect. Taking into account that the
natural stochastic model for counts is a Poisson point pro-
cess for the occurrence of the event of interest, which
implies a Poisson distribution for the number of occurrences
of the event, we used GLMwith a Poisson distribution and a
negative binomial regression model when the variance was
significantly larger than the mean (overdispersion). A typ-
ical issue considered in time-series data analysis is the
autocorrelation of the series residuals; we used the cubic
spline functions to account for the seasonal variations of the
count data (morbidity and mortality), which in turn solved
the problem of residual autocorrelation.
GLM with Poisson distributions were applied to assess
the quantitative association between mortality (All-cause-
M and Cause-specific-M) and pollutant concentration
levels, and negative binomials were used to assess the
quantitative association between disease incidence (ARI
and asthma) and pollutant concentration levels, according
to the model diagnostic indications. We considered mini-
mum temperature to be a confounding variable, and we
additionally adjusted the models with the estimated
exposed population week by week. We used a polynomial
regression to interpolate the population of the study area
during the period of interest (2004–2008) to take into
account historical population trends based on population
data from 1990 to 2005, from the every 5-year points given
by the national census of the region, the population size
was 91,539 inhabitants (at week 1, 2004) at the start of the
mortality series and 103,768 inhabitants (at week 52, 2008)
at the end of the series, smoothly increasing over the
interval. We estimated the average exposed population to
be 96,381.89 (95 % CI 95977.44, 96786.35) inhabitants per
week. In addition, we took into account different model
assumptions and controlled for the following: (a) the use of
cubic spline functions, for mortality and morbidity data, in
the regression analysis to smooth and seasonally adjust the
model (Royston and Sauerbrei 2007; Sasieni 1994), fitting
the spline function to the original mortality and morbidity
series, models effectively measure the effect of particulates
on departures from these seasonal influences (b) the use of
orthogonal distributed lag models to verify the influence of
exposure over many previous weeks on outcomes, avoiding
multi-collinearity or correlated covariates (Dear et al.
2005) with orthogonal third-degree polynomials with up to
6 weeks of lag, allowing weekly mortality and morbidity
to be influenced by air pollution and temperature over the
previous 40 days (Goodman et al. 2004; Zanobetti et al.
2003). This approach is based on the concept that expo-
sure to air pollution may produce an increased risk of
mortality/morbidity on the day of exposure, for subsequent
days or possibly many days after exposure. (c) We first
tested a GLM with a Poisson distribution for goodness of
fit; failure of goodness of fit was followed up with a
negative binomial model with verification that the ln(al-
pha) parameter was significantly above 0 (score test) to
confirm overdispersion. (d) We diagnosed possible serial
correlations of model residuals with the autocorrelation
function. (e) We used robust standard errors to adjust for
residual heterogeneity in the model. (f) We plotted histo-
grams of the residuals showing a symmetrical distribution
around zero. (g) We analyzed the association of PM with
mortality and morbidity using both linear and logarithmic
particulates while controlling for both linear and loga-
rithmic minimum temperature and compared model results
with the Akaike Information Criterion (AIC) to select the
best-fitting characterizations of these variables (detailed
results not shown). (h) We used a FFT analysis to plot the
frequency histogram of power in the PM series used in
the models.
Sensitivity testing
To date, the assessment of public health consequences of
air pollution focuses on a multi-pollutant approach aimed
to estimate the increased risk of adverse health outcomes
associated with the exposure to several air pollutants and
incorporate the chemical composition of fine and coarse
particles into the analysis. We were unable to use measures
of ozone (O3), SO2 and NOx in this study since there was
an excess of missing data for those measures for the
2004–2008 period. However, to assess the influence of
these pollutant gases, we used a short period from week 23
of 2006 to week 34 of 2007 (64 weeks in total with the
most complete gas pollutant data) in sensitivity testing in
order to evaluate the association between multi-pollutants
(TSP or PM10 with O3 and NOx) and mortality and mor-
bidity using a distributed lag model and a GLM with a
Poisson distribution. The inclusion of both gases (NOx and
O3) in the models did not substantially change the results of
the % RR. However, there were insufficient observations to
model PM10 and the two gases for mortality (All-cause-M
and Cause-specific-M), ARI and asthma. Though the power
of the models with gases was very low because of
incomplete data, the same temporal patterns of the asso-
ciation of morbidity and mortality with PM alone and PM
Int Arch Occup Environ Health (2013) 86:321–332 325
123

with gases suggest that the inclusion of gases, while pos-
sibly affecting the size of the morbidity and mortality
effects, did not materially affect the main body of the
results with PM, as described in the PM-alone minimum
temperature models.
We expressed the effect as the percentage of change in
relative risk (% increase in RR) in the outcome associated
with each 10 lg/m3 increase in PM pollution over the lag
period. Data management and statistical procedures were
performed with Stata version 11.1 (StataCorp, College
Station, TX, USA).
Results
Descriptive statistics
Table 1 shows descriptive statistics for all variables
included in the analysis. Of the total number of cases
recorded for the entire period of analysis (2004–2008),
there were 267,911 cases of ARI, 2,672 cases of asthma,
5,120 cases of All-cause-M and 933 cases of Cause-spe-
cific-M. From the total number of Cause-specific-M, we
found 14 % for respiratory illnesses, 51 % for ischemic
heart disease and 35 % for cerebrovascular diseases. The
table also shows the weekly minimum, maximum, mean
and standard deviation for each outcome.
We plotted the observations (disease incidence, mor-
tality data, and minimum temperature and air pollution
concentration levels) against time to visualize variable
changes over time (Fig. 4). The data appeared to fluctuate
over time in a pattern. For that analysis, we assumed that
the main sources of variation were the trend, seasonality,
outliers, discontinuous and shorter cyclic changes in the
series (Chatfield 2004). We noted the yearly variations for
each of the variables analyzed (ARI, asthma, All-cause-M,
Cause-specific-M, TSP, PM10 and temperature).
Particulate emissions in the Tula–Tepeji region
increased over the period of 2002–2005 from 17.16 ktpy
in 2002 (SEMARNAT 2006) to 35.5 ktpy in 2005
(SEMARNAT 2009). In 2002, we observed 5,449 cases of
ARI per 10,000 inhabitants and a weekly average of 927
cases of ARI, while in 2005, the number of annual cases of
ARI was 6,334 cases per 10,000 inhabitants with a weekly
average of 1,136 cases, representing an increase of
16.24 % in population-adjusted cases. In accordance with
the Mexican emission inventory (SEMARNAT 2009), the
main contributions to PM emissions in the region were the
power generation industry and the petroleum and petro-
chemical industry, followed by the cement and lime
industries.
Mortality models
Figure 5 presents the results from the Poisson regression
model for estimating the relationship between All-cause-M
and Cause-specific-M and changes in the TSP and PM10
concentrations. The results show (Fig. 5) that All-cause-M
increased 0.4 % RR (95 % CI 0.0, 0.9) with a 3-week lag
with an increasing trend from 0- to 2-week lag, although
not statistically significant and that Cause-specific-M
increased 1.3 % RR (95 % CI 0.2, 2.5) with a 3-week lag
and 1.4 % RR (95 % CI 0.2, 2.7) with a 4-week lag, per
each increase of 10 lg/m3 in TSP levels. The Cause-spe-
cific-M trend increased from 0 to 4-week lag and then
decreased.
With an increase of 10 lg/m3 in PM10, the Cause-spe-
cific-M increased marginally by 1.9 % RR (95 % CI -0.3,
4.2) with 3-week lag, and an increasing trend from 0- to
2-week lag, with the highest value at 2-week lag but
Table 1 Descriptive statistics for all variables in the analysis, 2004–2008
Variables Unit Weeks Min Max Mean SD Total
cases
Exceed
NOM 24 hbExceed
NOM annualc
ARI Cases 260 420 1,892 1,030.4 307.1 267,911
Asthma Cases 259 1 26 10.3 5 2,672
All-cause mortality Cases 260 6 42 19.7 5.3 5,120
Specific causes of mortalitya Cases 260 0 10 3.6 1.8 933
TSP lg/m3 158 14.3 293.28 86.25 44.7 1 Time (n.a.)
PM10 lg/m3 161 3.4 159.15 34.08 23.91 3 Times 24 Times
Tmin °C 234 -3.8 13.1 7.27 3.94
ARI acute respiratory infections, TSP total suspended particulate, PM10 particulate matter\ 10 lM aerodynamic diameter, Tmin minimum
temperature, Weeks number of weekly records, Min minimum, Max maximum, SD Standard Deviation, NOM mexican air quality standard for
TSP and PM10 (NOM-025-SSA1-1993 amended: 24 h average and annual), n.a. not applicablea Sum of respiratory, cardiovascular and cerebrovascular diseasesb NOM-025-SSA1-1993 amended for PM10 24 h average: 120 lg/m3 and NOM TSP 24 h average: 210 lg/m3
c NOM-025-SSA1-1993 amended for PM10 annual: 50 lg/m3
326 Int Arch Occup Environ Health (2013) 86:321–332
123

without statistical significance and then a subsequent
decrease in relative risk; and the All-cause-M increased
marginally by 1.0 % RR (95 % CI -0.4, 2.5), with a
3-week lag in both cases, with the trend behavior similar to
the one presented for TSP.
Morbidity models
We used the negative binomial model to evaluate the
association between respiratory illnesses and pollution
since the distribution of acute respiratory infections and
asthma data displayed signs of overdispersion, measured
by a significant dispersion coefficient (log-alpha). Results
indicate that ARI increased 0.6 % RR (95 % CI -0.1, 1.3)
with a 0-week lag and at lag-weeks 4, 5 and 6 [0.2 % RR
(95 % CI -0.1, 0.6), 0.3 % RR (95 % CI 1.0, 0.6) and
0.1 % RR (95 % CI 0.0, 0.3), respectively] after TSP levels
increased 10 lg/m3, with an increasing trend from 1- to
5-week lag, and the highest value at the 5-week lag and
then the elevation in relative risk decreased. Asthma
increased marginally by 1.4 % RR (95 % CI -0.5, 3.3) at
the 0-week lag and at lag-weeks 4, 5 and 6 [1.1 % RR
(95 % CI 0.2, 2.0), 1.1 % RR (95 % CI 0.2, 1.9) and 0.5 %
RR (95 % CI 0.1, 0.8), respectively] after each increase of
10 lg/m3 in TSP levels and with the same time trend seen
with TSP and ARI (Fig. 6). Both ARI and asthma increased
marginally by 1.1 % RR (95 % CI -0.2, 2.4) and 3.0 %
RR (95 % CI -1.0, 7.2), respectively, at the 0-week lag
(Fig. 6) after each increase of 10 lg/m3 in PM10 levels. In
the first case, trend behavior is similar to the one presented
for TSP but without statistical significance. In the case of
asthma and TSP the highest, though non-significant %RR
was with 0-week lag, decreasing throughout lags 1 and
2 weeks and remained stable thereafter.
Fast fourier transformation (FFT) analysis
We used FFT analysis to plot a frequency power spectrum
in the PM series used only in the morbidity models. We
observed power frequency peaks between 4 and 8 weeks in
10
20
30
40
Weekly
cases
All−cause mortality
0
100
200
300
ug/m
3
TSP
0
2
4
6
8
10
Weekly
cases
Cause−specific mortalty
0
50
100
150
ug/m
3
PM10
500
1000
1500
2000
We
ekly
cases
Acute Respiratory Infection
−5
5
15
°C
2004
w1
2004
w27
2005
w1
2005
w26
2006
w1
2006
w26
2007
w1
2007
w26
2008
w1
2008
w27
2009
w1
Minimum temperature
0
25
50
We
ekly
ca
se
s
2004
w1
2004
w27
2005
w1
2005
w26
2006
w1
2006
w26
2007
w1
2007
w26
2008
w1
2008
w27
2009
w1
Asthma
Weeks per year
Weeks per year
Fig. 4 Time-series plot for mortality data (all-cause mortality and
cause-specific mortality), disease incidence (acute respiratory infec-
tion and asthma), TSP (total suspended particulate), PM10 (particulate
matter\ 10 lm aerodynamic diameter) and minimum temperature in
order to visualize variable changes over time
Int Arch Occup Environ Health (2013) 86:321–332 327
123

the PM10 series (Fig. 7a) and 6–9 weeks in the TSP series
(Fig. 7b).
Temperature association
There were no differences in the analysis when temperature
was included with its original values (T) or values
transformed to natural logarithm of temperature (lnT). The
values of %RR are similar in both cases. In Figs. 5 and 6, we
report the values of % RR resulting from the model that
included lnT.When we analyzed the models (Poisson model
and negative binomial model) between morbidity and mor-
tality with particulate matter including maximum tempera-
ture as a confounder variable, no association was observed.
Fig. 6 The effect of changes in
the TSP and PM10
concentrations on morbidity
(ARI and asthma), expressed as
% increase in RR (95 % CI
confidence interval). Fitted
models were selected based on
AIC values. All models were
adjusted for natural log-
minimum temperature (lnT)
Fig. 5 The effect of changes in
the TSP and PM10
concentrations on mortality (all-
cause and cause-specific
mortality), expressed as %
increase in RR (95 % CI
confidence interval). Fitted
models were selected based on
AIC values. All models were
adjusted for natural log-
minimum temperature (lnT)
328 Int Arch Occup Environ Health (2013) 86:321–332
123
Discussion
This study shows that in Tula–Tepeji region, PM concen-
trations and morbidity and mortality were very likely to be
higher during winter and in early spring over period
2004–2008. Moreover, there were statistically significant
associations between PM and epidemiological variables,
the maximum effect in mortality occurred 3 weeks after the
PM concentration increase and for morbidity the maximum
effect was at 0-week lag, but also re-appeared at 4-, 5- and
6-week lag.
We had to aggregate particulate data into weekly values
or averages due to the 6-day measurement routine practiced
in the Tula–Tepeji region, similar to particulate measure-
ment schemes in many economically developing countries.
In addition to forcing the aggregation of mortality and
morbidity cases into weekly averages, thus not permitting
analyses on the scale of days as in many recent studies, the
procedure left open the possibility that in some weeks the
critical increases or decreases of measured PM actually
occurred after most of the illnesses or deaths for that week
had already occurred. In other words, this study was carried
out considering 6-day interval data transformed to weekly
average. Uncertainties of up to ±3 days in the period in
which atmospheric pollutants occured and impacted mor-
bidity and mortality were unavoidable. However, weekly
analysis allowed the estimation of short-term effects since
the effects were accounted for in the first week covered
from day 0 to 7. Thus, it was possible to evaluate the short-
term effects although we could not discern if the event
occurred on the day of particulate measurement or within
±3 days.
The statistical model applied in this study was not
affected by weekly data, since the data complied with the
model assumptions: there were count data and positive
numbers, there was no autocorrelation of the series resid-
uals, and the residuals showed a symmetrical distribution
around zero, which also minimized heteroscedasticity of
the residuals. Moreover, this study established the need to
have daily records of diseases and daily records of criteria
pollutants in the Tula–Tepeji region for a better under-
standing of the immediate impact of air pollutants on
health for effective environmental management. Also, the
advantage of conducting weekly studies is that it was
possible to demonstrate that in long-term exposure analy-
sis, we can detect positive and statistically significant
effects on morbidity and mortality., Since previous daily
studies (Goodman et al. 2004; Zanobetti et al. 2003) as well
this weekly study demonstrated significant effects of par-
ticulates up to 40 days from the particulate event, sub-
sequent studies should expand the search for delayed
effects up to at least this range of lags.
The small number of weekly events limited statistical
analysis, especially for asthma and specific cause of mor-
tality and prevented a more detailed analysis by age or
gender groups, by season or by each specific cause of
mortality or other respiratory illnesses (pneumonia or
bronchitis). Study power was also limited by the relatively
small number of weeks available for analysis. The ability
to detect small %RR as significant at any criterion level
would increase if we had a larger number of time periods.
Results suggested that an increase of 10 lg/m3 in air PM
levels increased the relative risk for mortality (All-cause-M
and Cause-specific-M) with a substantial lag effect. The
increase in relative risk was significantly associated with
TSP and marginally associated with PM10. In both cases,
the maximum elevation in mortality occurred 3 weeks after
the PM concentration increase. We also found a different
pattern of mortality risk over time because the magnitude of
effects for mortality (All-cause-M and Cause-specific-M)
and air pollution (PM10 and TSP) increased from 1 to 3
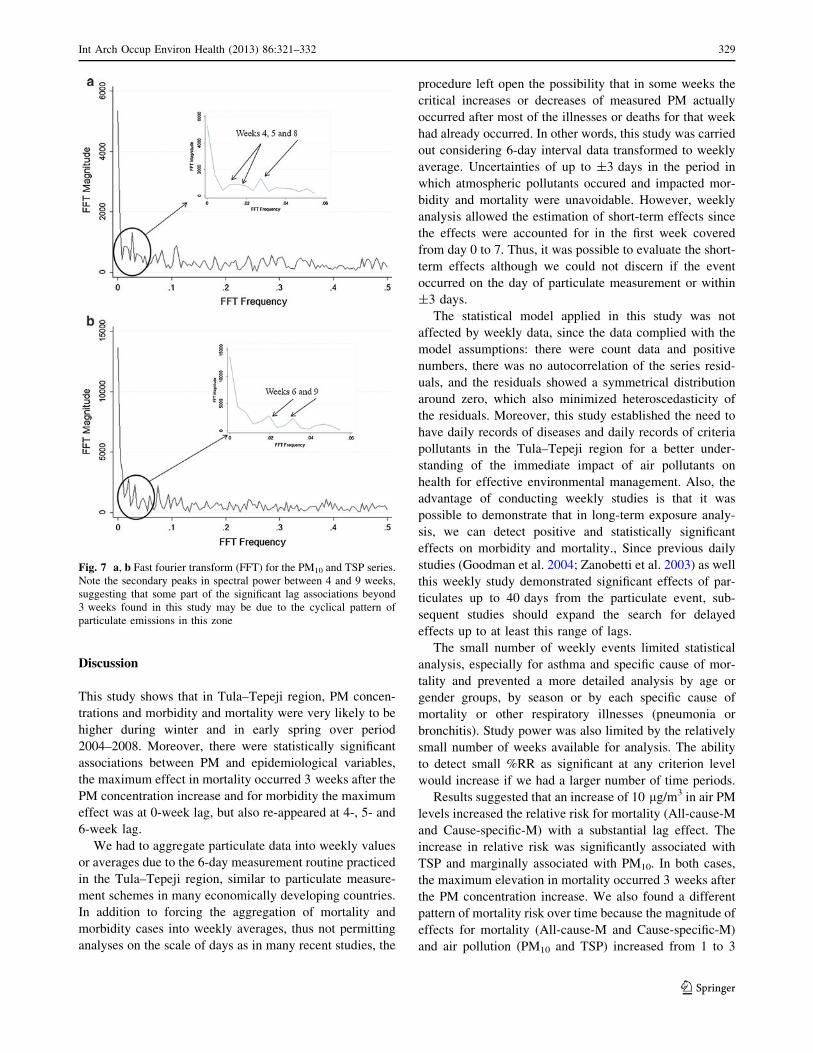
Fig. 7 a, b Fast fourier transform (FFT) for the PM10 and TSP series.
Note the secondary peaks in spectral power between 4 and 9 weeks,
suggesting that some part of the significant lag associations beyond
3 weeks found in this study may be due to the cyclical pattern of
particulate emissions in this zone
Int Arch Occup Environ Health (2013) 86:321–332 329
123

weekly lags. It is likely that exposure to air pollution
simultaneously increases the number of people who become
frail or exacerbates pre-existing respiratory diseases,
resulting in death several weeks later. These associations in
the statistical models were not affected by the inclusion of
minimum temperature data. Since the seasonal variation in
mortality and morbidity tracked well with temperature, the
inclusion of the spline function to track overall changes in
mortality and morbidity likely reduced the impact of the
temperature variable on outcomes. Zanobetti et al. (2003)
used an unconstrained distributed lag in a Poisson regres-
sion to model the effect of PM10 exposure on deaths up to
40 days after the exposure. The results indicated that the
size of health effect estimates for exposure to PM10 was
twice as great when considering long-term effects for all
causes of mortality. Several studies have confirmed that
most of the adverse health effects, associated with air pol-
lution, persist not only for a few days but also for more than
a month after exposure (Goodman et al. 2004; Kelsall et al.
1997; Schwartz and Dockery 1992a, b; Schwartz and
Marcus 1990; Zanobetti et al. 2003). Other studies have
compared the association of adverse health effects with
short-time effects (1–3 days mean) versus the cumulative
associations over extended follow-up periods. The results
indicated that the estimated associations were two or three
times larger for the extended follow-up period than for the
acute effects, because of short-time exposure (Dominici
et al. 2003; Goodman et al. 2004). This effect is called
‘‘displacement effect or harvesting’’.
Rosales-Castillo et al. (2001), in a meta-analysis,
observed an increase of 0.96 % in respiratory mortality and
1.82 % in cardiovascular mortality when PM10 levels
increased 10 lg/m3. Our effect-size estimates are higher
than previous studies in Mexico City (O’Neill et al. 2004;
Rosales-Castillo et al. 2001) and in other countries or
multi-city studies (Chang et al. 2003; Dockery 2001;
Lippmann et al. 2000; Samoli et al. 2001; Sunyer et al.
2000; Zanobetti and Schwartz 2009), although our study
was performed in a smaller area, with intense industrial
activity where the pollutant emissions from point sources
are continuous and in large quantities.
Acute respiratory infections in Tula were associated
with TSP air pollution, although PM levels are lower than
the maximum permissible limits established by the Mexi-
can Air Quality Standards. We observed a significant and
positive association of acute respiratory infections with
TSP in the statistical models. The adverse effects were
observed in the same week that TSP level increased. We
found positive and marginally significant associations with
increased PM10 levels. Asthma and PM10 were marginally
statistically significant for 0-week lag. We also found a
marginally significant association between asthma and TSP
levels at lag 0, whereas at 4, 5 and 6-weeks of lags, the
associations were significant.
Air pollution is convincingly associated with many
signs of asthma aggravation. These include pulmonary
function decrements, increased bronchial hyper-respon-
siveness, visits to emergency departments, hospital
admissions, increased medication use and symptom
reporting, inflammatory changes, interactions between air
pollution and allergen challenges, and immune system
changes (Koenig 1999). The main characteristic of asthma
is inflammation of airways; this inflammatory state may
be driven by exposure to inhaled allergens, such as house
dust mites, pollens or mold spores, that is, there are
specific stimuli generating an early response. The
increased frequency of exposure both in quantity and
frequency activates primary response in the bronchial
mucosa defense repeatedly, and it triggers an antigen–
antibody response, initiating immune-mediated phenome-
non, which is not an immediate response (GINA 2011).
However, the manifestation of the primary symptoms that
occur at 0-week lag could be asthma-like symptoms,
because response is not immune-mediated; in other words,
there is no recognition of allergen.
When the stimuli are continuous as with prolonged
exposure to air pollutants, these pollutants may act as
inciters or triggers when the airways are hyper-responsive,
resulting in transient airway narrowing.
Also, air pollution may act as an inducer to increase
airway inflammation and therefore airway hyper-respon-
siveness, which may persist beyond the exposure time,
affecting the immune system, resulting in sensitization or
increased allergic responses in the airway and the inflam-
matory response tends to become chronic (Cruz Mena and
Moreno Bolton 1999; LaDou 2005).
This could be the mechanism by which we find positive
and statistically significant associations between TSP and
asthma, even at 4-, 5- and 6-week lag. Abdo Arbex et al.
(2007) carried out a study in Brazil, and they observed that
TSP had an acute effect on asthma admissions, starting
1 day after TSP concentrations increased and remaining
almost unchanged for the next 4 days.
Also, we observed peak power frequencies of
4–8 weeks in the PM10 series (Fig. 7a) and 6–9 weeks in
the TSP series (Fig. 7b) in the FFT analysis. These peri-
odicities might be caused by peak emissions from indus-
trial activities such as startup and shutdown events for
maintenance or emergencies, resulting in a lack of control
in the discharge of pollutants into the atmosphere. This
may partially explain the observed lags of several weeks in
adverse health effects. This would be in addition to the
inflammatory processes lasting up to several days after the
pollution event because of cumulative exposure, which
330 Int Arch Occup Environ Health (2013) 86:321–332
123

would be reflected in the association of pollution and health
effects until 4 or 5 weeks of lag.
Barraza-Villarreal, in 2008, observed that the effects on
inflammatory markers were higher for PM B 2.5 lM and
O3 than for NO2. The effects appeared on the same day as
the exposure and were cumulative over several days,
resulting in lung function impairment after 4 or 5 days of
cumulative exposure. In addition, the oxidative effects of
PM can increase secretions of pro-inflammatory cytokines
and other molecules and enhance allergic reactions in the
airway (Behndig et al. 2006; Takizawa 2004).
Hernandez-Cadena et al. (2000) reported estimates
similar to our findings, but in relation to increments in
PM10 levels in association with increments in ozone levels.
TSP concentrations were not included in that study. Most
time-series analyses of the relationship between air pollu-
tion and respiratory diseases are associated with PM10 and
PM2.5 and, more recently, with coarse particles. Most of
those studies were performed in large cities or urban areas.
There is little prior evidence of the relationship between air
pollution and respiratory diseases in industrial areas rather
than urban areas.
Finally, despite the prevailing winds blowing from the N
and NNE, in a conservative scenario, there is the
assumption that the measured concentrations of TSP and
PM10 at the Tula monitoring station represent a lower
bound of the exposure to which population are exposed in
the entire region.
Considering TSP and PM10 concentrations was below
those established by the NOM-025-SSA-1-1993 for most
weeks of the study years, corresponding associations,
positive and statistically significant, were found with
mortality, acute respiratory infections and asthma.
This study provides evidence for the need to expand air
quality monitoring network and the daily record of the
criteria pollutants in the region.
Conclusions
Increased respiratory morbidity and mortality is associated
with weekly changes of PM air pollution in the region. A
reduction in air pollutants from industrial sources would
benefit life quality and health of the exposed population.
Acknowledgments COEDE and CENICA-INE for air pollution
data, Secretaria de Salud del Estado de Hidalgo and COFEPRIS for
epidemiological data and CFE for meteorological data. Special thanks
to Dr. Keith Dear from the National Centre for Epidemiology and
Population Health, Australian National University, Canberra for the
advice on the application of distributed lag models and for allowing
us to use the commands he developed for Stata.
Conflict of interest The authors declare that they have no conflict
of interest.
References
Abdo Arbex M, Conceicao Martins L, Carvalho de Oliveira R et al
(2007) Air pollution from biomass burning and asthma hospital
admissions in a sugar cane plantation area in Brazil. J Epidemiol
Community Health 61:395–400. doi:10.1136/jech.2005.044743
Barraza-Villarreal A, Sunyer J, Hernandez-Cadena L, Escamilla-
Nunez MC, Sienra-Monge JJ, Ramirez-Aguilar M et al (2008)
Air pollution, airway inflammation, and lung function in a cohort
study of Mexico City schoolchildren. Environ Health Perspect
116(6):832–838
Behndig AF, Mudway IS, Brown JL, Stenfors N, Helleday R, Duggan
ST et al (2006) Airway antioxidant and inflammatory responses
to diesel exhaust exposure in non-asthmatic humans. Eur Respir
J 27:359–365
Beltran I, Acevedo O, Alvarado P, Melgar-Paniagua EM, De
Vizcaya-Ruiz A, Del Razo-Jimenez LM et al. (2008) Diagnosico
de la calidad del Aire de la Region Tula–Tepeji, Hidalgo. Estado
de Hidalgo, Gobierno del Estado de Hidalgo, Universidad
Autonoma del Estado de Hidalgo, Universidad Politecnica de
Pachuca, Centro de Investigacion y de Estudios Avanzados del
IPN, EnviroGlobe, S. A., SEMARNAT
Borja-Aburto VH, Loomis DP, Bangdiwala SI, Shy CM, Rascon-
Pacheco RA (1997a) Ozone, suspended particulates, and daily
mortality in Mexico City. Am J Epidemiol 145(3):258–268
Borja-Aburto VH, Munoz SR, Bustamante-Montes P (1997b) The case-
control design in medical research. Rev Invest Clin 49(6):481–489
Cakmak S, Dales RE, Vidal CB (2007) Air pollution and mortality in
Chile: susceptibility among the elderly. Environ Health Perspect
115(4):524–527
Carbajal-Arroyo L, Miranda-Soberanis V, Medina-Ramon M, Rojas-
Bracho L, Tzintzun G, Solıs-Gutierrez P, Mendez-Ramırez I,
Hurtado-Dıaz M, Schwartz J, Romieu I (2011) Effect of PM10
and O3 on infant mortality among residents in the Mexico
City Metropolitan area: a case-crossover analysis, 1997–2005.
J Epidemiol Community Health 65:715–721
CFE (2010) Estadisticas del Sector Electrico. http://www.sener.
gob.mx/portal/industria_electrica_mexicana.html. Accessed on
2nd November 2011
Chang G, Pan X, Xie X, Gao Y (2003) Time-series analysis on the
relationship between air pollution and daily mortality in Beijing.
Wei Sheng Yan Jiu 32(6):565–568
Chatfield C (2004) The analysis of time series. An introduction,
6th edn. CRC, Chapman and Hall, London
Cruz Mena E, Moreno Bolton R (1999) Asma bronquial. In: Aparato
respiratorio, Fisiologıa y Clınica. 4a Edicion. Editorial Medit-
erraneo, Chile, pp 240–242
Dear K, Ranmuthugala G, Kjelltrom T, Skinner C, Hanigan I (2005)
Effects of temperature and ozone on daily mortality during the
August 2003 heat wave in France. Arch Environ Occup Health
60(4):205–212
Dockery DW (2001) Epidemiologic evidence of cardiovascular
effects of particulate air pollution. Environ Health Perspect
109(Suppl 4):483–486
Dominici F, McDermott A, Zeger SL et al (2003) Airborne particulate
matter and mortality: timescale effects in four US cities. Am J
Epidemiol 157(12):1055–1065
GINA (2011) Global strategy for asthma management and prevention,
global initiative for asthma. Available from: http://www.
ginasthma.org/. Accessed on 2nd March 2012
Goodman PG, Dockery DW, Clancy L (2004) Cause-Specific
mortality and the extended effects of particulate pollution and
temperature exposure. Environ Health Perspect 112(2):179–185
Hernandez-Cadena L, Tellez-Rojo MM, Sanin-Aguirre LH, Lacasana-
Navarro M, Campos A, Romieu I (2000) Relationship between
Int Arch Occup Environ Health (2013) 86:321–332 331
123

emergency consultations for respiratory diseases and air pollution
in Juarez City, Chihuahua. Salud Publica Mex 42(4):288–297
Hernandez-Cadena L, Barraza-Villarreal A, Ramirez-Aguilar M,
Moreno-Macias H, Miller P, Carbajal-Arroyo LA, Romieu I
(2007) Infant morbidity caused by respiratory diseases and its
relation with the air pollution in Juarez City, Chihuahua, Mexico.
Salud Publica Mex 49(1):27–36
INEM (2005) Inventario Nacional de Emisiones de Mexico 2005.
Secretarıa de Medio Ambiente y Recursos Naturales, Subsec-
retarıa de Gestion para la Proteccion Ambiental, Direccion
General de Gestion de la Calidad del Aire y RETC. December,
2011
Kelsall JE, Samet JM, Zeger SL, Xu J (1997) Air pollution and
mortality in Philadelphia, 1974–1988. Am J Epidemiol 146(9):
750–762
Koenig JQ (1999) Air pollution and asthma. Department of Environ-
mental Health, University of Washington, Seattle, Wash. 98195,
USA. J Allergy Clin Immunol 104(4 Pt 1):717–722
LaDou J (2005) Diagnostico y tratamiento en medicina laboral y
ambiental. 3a. Edicion. Editorial Manual Moderno, Mexico
Lippmann M, Ito K, Nadas A, Burnett RT (2000) Association of
particulate matter components with daily mortality and morbid-
ity in urban populations. Res Rep Health Eff Inst 95:5–72,
discussion 73–82
Loomis D, Castillejos M, Gold DR, McDonnell W, Borja-Aburto VH
(1999) Air pollution and infant mortality in Mexico City.
Epidemiology 10(2):118–123
McCullagh P, Nelder JA (1989) Generalized linear models. Chapman
and Hall, London
NOM-CCAM-002-ECOL-1993 (1993) Norma Oficial Mexicana que
establece los metodos de medicion para determinar la concen-
tracion de partıculas suspendidas totales en el aire ambiente y el
procedimiento para la calibracion de los equipos de medicion
O’Neill MS, Loomis D, Borja-Aburto VH, Gold D, Hertz-Picciotto I,
Castillejos M (2004) Do associations between airborne particles
and daily mortality in Mexico City differ by measurement
method, region, or modeling strategy? J Expo Anal Environ
Epidemiol 14(6):429–439
PEMEX (2010) Anuario Estadıstico 2010, Petroleos Mexicanos.
http://www.ri.pemex.com/index.cfm?action=content§ionID=
134&catID=12202&media=pdf. Accessed on 2nd November
2011
Rojas-Martinez R, Perez-Padilla R, Olaiz-Fernandez G et al (2007)
Lung function growth in children with long-term exposure to air
pollutants in Mexico City. Am J Respir Crit Care Med 176(4):
377–384
Romieu I, Lugo MC, Velasco SR, Sanchez S, Meneses F, Hernandez
M (1992) Air pollution and school absenteeism among children
in Mexico City. Am J Epidemiol 136(12):1524–1531
Romieu I, Meneses F, Ruiz S, Sienra JJ, Huerta J, Ruiz Velasco S,
White MC, Etzel RA, Hernandez-Avila M (1995) Effects of
urban air pollutants on emergency visits for childhood asthma in
Mexico City. Am J Epidemiol 141(6):546–553
Romieu I, Meneses F, Ruiz S, Sienra JJ, Huerta J, White MC, Etzel
RA (1996) Effects of air pollution on the respiratory health of
asthmatic children living in Mexico City. Am J Respir Crit Care
Med 154(2 Pt 1):300–307
Rosales-Castillo JA, Torres-Meza VM, Olaiz-Fernandez G, Borja-
Aburto VH (2001) Acute effects of air pollution on health:
evidence from epidemiological studies. Salud Publica Mex
43(6):544–555
Royston P, Sauerbrei W (2007) Multivariable modeling with cubic
regression splines: a principled approach. Stata J 7(1):45–70
Samoli E, Schwartz J, Wojtyniak B, Touloumi G, Spix C, Balducci F
et al (2001) Investigating regional differences in short-term
effects of air pollution on daily mortality in the APHEA project:
a sensitivity analysis for controlling long-term trends and
seasonality. Environ Health Perspect 109(4):349–353
Sanchez LR, Quadri GR, Martınez J, Perez DR (1991) Evaluacion de
la calidad del aire en la Ciudad de Mexico. Revista Internacional
de Contaminacion Ambiental 7(001):99–100
Sasieni P (1994) Stata technical bulletin. STB22, Stata Corporation,
New York. November
Schwartz J, Dockery DW (1992a) Increased mortality in Philadelphia
associated with daily air pollution concentrations. Am Rev
Respir Dis 145(3):600–604
Schwartz J, Dockery DW (1992) Particulate air pollution and daily
mortality in Steubenville, Ohio. Am J Epidemiol 135(1):12–19;
discussion 20–15
Schwartz J, Marcus A (1990) Mortality and air pollution in London: a
time series analysis. Am J Epidemiol 131(1):185–194
Secretarıa de Salud (2008) Panorama Epidemiologico de la Region
Tul-Tepeji, Hidalgo, Comision para la Proteccion contra Riesgos
Sanitarios del Estado de Hidalgo (COPRISEH), Subcomision de
Evidencia, Manejo de Riesgos y Tramites. Secretarıa de Salud de
Hidalgo
SEMARNAT (2006) Secretaria de Medio Ambiente y Recursos
Naturales y Consejo Estatal de Ecologıa del Estado de Hidalgo.
Inventario de emisiones de la Region Tula–Tepeji, 2002
SEMARNAT (2009) Secretaria de Medio Ambiente y Recursos
Naturales. Inventario de emisiones de la Region Tula–Tepej,
2005
SINAVE (2006) Sistema Nacional de Vigilancia Epidemiologica.
Manual de Procedimientos de la Notificacion Semanal de Casos
Nuevos. Secretarıa de Salud, Primera Edicion. pp 23–31
SS (2008) Secretaria de Salud. Manual metodologico de camino a la
excelencia 2008–2012
Sunyer J, Schwartz J, Tobias A, Macfarlane D, Garcia J, Anto JM
(2000) Patients with chronic obstructive pulmonary disease are
at increased risk of death associated with urban particle air
pollution: a case-crossover analysis. Am J Epidemiol 151(1):
50–56
Takizawa H (2004) Diesel exhaust particles and their effect on
induced cytokine expression in human bronchial epithelial cells.
Curr Opin Allergy Clin Immunol 4:355–359
USEPA (1990) United Stats environmental protection agency. Code
of federal regulations 40, Part 50, appendix B, revised July 1990,
USA
Welty LJ, Zeger SL (2005) Are the acute effects of particulate matter
on mortality in the national morbidity, mortality, and air
pollution study the result of inadequate control for weather and
season? A sensitivity analysis using flexible distributed lag
models. Am J Epidemiol 162(1):80–88
Zanobetti A, Schwartz J (2009) The effect of fine and coarse
particulate air pollution on mortality: a national analysis.
Environ Health Perspect 117(6):898–903
Zanobetti A, Schwartz J, Samoli E, Gryparis A, Touloumi G, Peacock
J et al (2003) The temporal pattern of respiratory and heart
disease mortality in response to air pollution. Environ Health
Perspect 111(9):1188–1193
332 Int Arch Occup Environ Health (2013) 86:321–332
123