Distributed Hierarchical Control versus an Economic Model for Cloud Resource Management
13
Distributed Hierarchical Control versus an Economic Model for Cloud Resource Management Dan C. Marinescu and Ashkan Paya Computer Science Division, EECS Department University of Central Florida, Orlando, Florida 32814, USA Email: [dcm, apaya]@cs.ucf.edu John P. Morrison and Philip Healy Computer Science Department University College Cork, Cork, Ireland Email: [j.morrison, phealy]@cs.ucc.ie March 4, 2015 We investigate a hierarchically organized cloud infras- tructure and compare distributed hierarchical control based on resource monitoring with market mechanisms for resource management. The latter do not require a model of the system, incur a low overhead, are robust, and satisfy several other desiderates of autonomic com- puting. We introduce several performance measures and report on simulation studies which show that a straight- forward bidding scheme supports an effective admission control mechanism, while reducing the communication complexity by several orders of magnitude and also in- creasing the acceptance rate compared to hierarchical control and monitoring mechanisms. Resource manage- ment based on market-based mechanisms can be seen as an intermediate step towards cloud self-organization, an ideal alternative to current mechanisms for cloud re- source management. 1 Introduction Cloud computing is a form of utility computing, a service delivery model in which a provider makes computing resources and infrastructure management available to the customer as needed and charges them for the actual resource consumption. Today, utility computing, envisioned by John McCarthy 1 and others, is a social and technical reality. Cloud computing emulates traditional utilities – such as electricity, water, and gas – and attempts to reduce costs by assembling large pools of computing resources into data centers. These data centers take advantage of the latest com- puting and communication technologies, exploit economies of scale, reduce the overhead for delivering services, and provide an appealing computing environment for a large user popula- 1 In1961, in a speech given to celebrate MIT’s centennial, he sug- gested that in the future computing power and applications could be sold through the utility business model. tion. Over the last decade cloud service providers (CSPs) such as Amazon, Google, and Microsoft, have built data centers at unprecedented scales. It is estimated that in 2013 these three CSPs were running roughly one million servers each. For several decades we have designed and built heteroge- neous computing systems with very large numbers of compo- nents interacting with each other and with the environment in intricate ways. The complexity of such systems is undeniable but their design was, and still is, based on traditional, mostly deterministic, system organization and management. Ideally this should change, but the path to change is strenuous. Resource management in large-scale computing and com- munication systems such as computer clouds poses significant challenges and generates multiple research opportunities. For example, at this time, the average cloud server utilization is low, while the power consumption of clouds based on over- provisioning is excessive and has a negative ecological impact [5, 31]. We live in a world of limited resources and cloud over- provisioning is not sustainable either economically or environ- mentally. It is generally accepted that distributed systems which maintain state information are neither scalable nor robust; this is the reason why most Internet services are delivered by stateless servers. We have also known for some time that col- lecting state information consumes a significant share of sys- tem resources and that system management decisions based on obsolete state information are far from optimal. This knowledge is critical for the communication and computing infrastructure built around the Internet. In contrast, resource management in cloud computing is still based on hierarchical control models where state information is maintained at sev- eral levels. We have also known that assembling large collec- tions of systems each with a small, but finite probability of failure, requires novel design principles to guarantee system availability. 1 arXiv:1503.01061v1 [cs.DC] 3 Mar 2015
-
Upload
independent -
Category
Documents
-
view
5 -
download
0
Transcript of Distributed Hierarchical Control versus an Economic Model for Cloud Resource Management
Distributed Hierarchical Control versus an Economic Model for Cloud
Resource Management
Dan C. Marinescu and Ashkan Paya
Computer Science Division, EECS DepartmentUniversity of Central Florida, Orlando, Florida 32814, USA
Email: [dcm, apaya]@cs.ucf.edu
John P. Morrison and Philip Healy
Computer Science DepartmentUniversity College Cork, Cork, IrelandEmail: [j.morrison, phealy]@cs.ucc.ie
March 4, 2015
We investigate a hierarchically organized cloud infras-tructure and compare distributed hierarchical controlbased on resource monitoring with market mechanismsfor resource management. The latter do not require amodel of the system, incur a low overhead, are robust,and satisfy several other desiderates of autonomic com-puting. We introduce several performance measures andreport on simulation studies which show that a straight-forward bidding scheme supports an effective admissioncontrol mechanism, while reducing the communicationcomplexity by several orders of magnitude and also in-creasing the acceptance rate compared to hierarchicalcontrol and monitoring mechanisms. Resource manage-ment based on market-based mechanisms can be seenas an intermediate step towards cloud self-organization,an ideal alternative to current mechanisms for cloud re-source management.
1 Introduction
Cloud computing is a form of utility computing, a servicedelivery model in which a provider makes computing resourcesand infrastructure management available to the customer asneeded and charges them for the actual resource consumption.Today, utility computing, envisioned by John McCarthy1 andothers, is a social and technical reality.
Cloud computing emulates traditional utilities – such aselectricity, water, and gas – and attempts to reduce costsby assembling large pools of computing resources into datacenters. These data centers take advantage of the latest com-puting and communication technologies, exploit economies ofscale, reduce the overhead for delivering services, and providean appealing computing environment for a large user popula-
1In1961, in a speech given to celebrate MIT’s centennial, he sug-gested that in the future computing power and applications could besold through the utility business model.
tion. Over the last decade cloud service providers (CSPs) suchas Amazon, Google, and Microsoft, have built data centers atunprecedented scales. It is estimated that in 2013 these threeCSPs were running roughly one million servers each.
For several decades we have designed and built heteroge-neous computing systems with very large numbers of compo-nents interacting with each other and with the environment inintricate ways. The complexity of such systems is undeniablebut their design was, and still is, based on traditional, mostlydeterministic, system organization and management. Ideallythis should change, but the path to change is strenuous.
Resource management in large-scale computing and com-munication systems such as computer clouds poses significantchallenges and generates multiple research opportunities. Forexample, at this time, the average cloud server utilization islow, while the power consumption of clouds based on over-provisioning is excessive and has a negative ecological impact[5, 31]. We live in a world of limited resources and cloud over-provisioning is not sustainable either economically or environ-mentally.
It is generally accepted that distributed systems whichmaintain state information are neither scalable nor robust;this is the reason why most Internet services are delivered bystateless servers. We have also known for some time that col-lecting state information consumes a significant share of sys-tem resources and that system management decisions basedon obsolete state information are far from optimal. Thisknowledge is critical for the communication and computinginfrastructure built around the Internet. In contrast, resourcemanagement in cloud computing is still based on hierarchicalcontrol models where state information is maintained at sev-eral levels. We have also known that assembling large collec-tions of systems each with a small, but finite probability offailure, requires novel design principles to guarantee systemavailability.
1
arX
iv:1
503.
0106
1v1
[cs
.DC
] 3
Mar
201
5

New strategies, policies and mechanisms to implementthese policies are necessary to: allow cloud servers to op-erate more efficiently; reduce costs for the Cloud ServiceProviders (CSPs); provide an even more attractive environ-ment for cloud users; and support some form of interoper-ability. The pressure to provide new services, better managecloud resources, and respond to a broader range of applicationrequirements is increasing, as more US government agenciesare encouraged to use cloud services2.
It is rather difficult given the scale involved to either con-struct analytical models or to experiment with the systemsdiscussed in this paper and this is precisely the reason whywe choose simulation. As stated in [6]: “First, they (WSCs)are a new class of large-scale machines driven by a new andrapidly evolving set of workloads. Their size alone makesthem difficult to experiment with, or to simulate efficiently.”
The remainder of this paper is organized as follows. InSection 2 we analyze the need for alternative strategies forcloud resource management and discuss market based strate-gies as an intermediate step towards cloud self-organizationand self-management. In Section 3 we examine hierarchicalorganization and control, which represents the state-of-the-artfor the management of existing clouds. To compare hierarchi-cal control prevalent in existing clouds with economic modelswe conduct a series of simulation experiments and report theresults in Sections 4 and 5, respectively. Finally, in Section 6we present our conclusions and discuss future work.
2 Cloud Resource Management
The policies for cloud resource management can be looselygrouped into five classes: (1) admission control; (2) capacityallocation; (3) load balancing; (4) energy optimization; and(5) quality of service (QoS) guarantees.
The explicit goal of an admission control policy is to preventthe system from accepting workload in violation of high-levelsystem policies [14]. Limiting the workload requires someknowledge of the global state of the system. Capacity allo-cation means to allocate resources for individual instances,where an instance is an activation of a service. Locating re-sources subject to multiple global optimization constraintsrequires a search in a very large search space when the stateof individual systems changes rapidly.
Load balancing and energy optimization are correlated andaffect the cost of providing the services; they can be donelocally, but global load balancing and energy optimizationpolicies encounter the same difficulties as the the capacityallocation [21]. Quality of service is probably the most chal-lenging aspect of resource management and, at the same time,possibly the most critical for the future of cloud computing.
Resource management policies must be based on disci-plined, rather than ad hoc methods. The basic mechanismsfor the implementation of resource management policies are:
2See for example the November 6 memorandum “The DoD CloudWay Forward” which stresses the need for the DoD to increase its use ofcloud services.
-1. Control theory. Control theory uses the feedback to guar-antee system stability and to predict transient behavior [21],but can be used only to predict local, rather than global be-havior; applications of control theory to resource allocationare covered in [11]. Kalman filters have been used for unreal-istically simplified models as reported in [18], and the place-ment of application controllers is the topic of [35].
-2. Machine learning. Machine learning techniques do notneed a performance model of the system [36]; this techniquecould be applied to the coordination of multiple autonomicsystem managers [19].
-3. Utility-based. Utility based approaches require a perfor-mance model and a mechanism to correlate user-level perfor-mance with cost [20].
-4. Economic models. Economic models such as the one dis-cussed in [34], cost-utility models [25], macroeconomic models[4], are an intriguing alternative and have been the focus ofresearch in recent years [8, 26].
The need for alternative mechanisms for cloud re-source management. The cloud ecosystem is evolving, be-coming more complex by the day. Some of the transforma-tions expected in the future add to the complexity of cloudresource management and require different policies and mech-anisms implementing these policies. Some of the factors af-fecting the complexity of cloud resource management deci-sions are:
a. Cloud infrastructures are increasingly heterogeneous.Servers with different configurations of multi-core processors,attached co-processors (GPUs, FPGAs, MICs), and data flowengines are already, or are expected to become, elements of thecloud computing landscape. Amazon Web Services (AWS) al-ready support G2-type instances with GPU co-processors.
b. The spectrum of cloud services and cloud applicationswidens. For example, in the last year AWS added some 10 newservices, including Lambda, Glacier, Redshift, Elastic Cache,and Dynamo DB. Several types of EC2 (Elastic Cloud Com-puting) profiles, M3 - balanced, C3 - compute optimized, R3 -memory optimized, I2 and HS1 - storage optimized were alsointroduced in recent months. The spectrum of EC2 instancetypes is also broadening; each instance type provides differentsets of computer resources measured by vCPUs (vCPU is ahyper-thread of an Intel Xeon core for M3, C3, R3, HS1, G2,and I2).
As the cloud user community grows, instead of a discretemenu of services and instance types we expect a continuumspectrum; policies and mechanisms allowing a cloud user toprecisely specify the resources it needs and the conditions forrunning her application should be in place. At the same time,the cloud infrastructure should support an increasing numberof data- and CPU-intensive Big Data applications.
Many big data applications in computational science andengineering do not perform well on cloud. A 2010 paper [16]presents the results of an HPCC (High Performance Comput-ing Challenge) benchmark of EC2 and three supercomputersat NERSC. The results show that the floating performance ofEC2 is about 2.5 times lower, 4.6 Gflops versus 10.2 Gflops.
2

The memory bandwidth is also about 2.5 times lower: 1.7 ver-sus 4.4 GB/sec. The network latency is significantly higher,145 versus 2.1 µsec and the network bandwidth is orders ofmagnitude lower, 0.06 versus 3.4 GB/sec.
c. Cloud over-provisioning demands high initial costs andleads to low system utilization; this strategy is not econom-ically sustainable [9]. Cloud elasticity is now based on over-provisioning, i.e., assembling pools of resources far larger thanrequired to satisfy the baseline load. Elasticity allows cloudusers to increase or decrease their resource consumption basedon their needs. The average cloud server utilization is in the18% to 30% range [5, 6]. Low server utilization implies thatthe cloud power consumption is far larger than it should be.The power consumption of cloud servers is not proportionalwith the load, even when idle they use a significant fractionof the power consumed at the maximum load. Computers arenot energy proportional systems [5] thus, power consumptionof clouds based on over-provisioning is excessive and has anegative ecological impact. A 2010 survey [7] reports thatidle or under utilized servers contribute 11 million tonnes ofunnecessary CO2 emissions each year and that the total yearlycost for the idle servers is $19 billion.
d. The cloud computing landscape is fragmented. CSPs sup-port different cloud delivery models: Amazon predominantlyIaaS (Infrastructure as a Service), Microsoft PaaS (Platformas a Service), Google mostly SaaS (Software as a Service), andso on. An obvious problem with clear negative implication isvendor lock-in; once becoming familiar and storing her dataon one cloud it is very costly for the user to migrate to an-other CSP. An organization that can seamlessly support cloudinteroperability and allow multiple cloud delivery models tocoexist poses additional intellectual challenges.
Autonomic computing and self-organization. In theearly 2000s it was recognized that the traditional managementof computer systems is impractical and IBM advanced theconcept of autonomic computing [13, 17]. However, progressin the implementation of autonomic computing has been slow.The main aspects of autonomic computing as identified in [17]are: Self-configuration - configuration of components and sys-tems follows high-level policies, the entire system system ad-justs automatically and seamlessly; Self-optimization - com-ponents continually seek opportunities to improve their ownperformance and efficiency; Self-healing - the system auto-matically detects, diagnoses, and repairs localized softwareand hardware problems; and Self-protection - automaticallydefend against malicious attacks and anticipate and preventsystem-wide failures.
Autonomic computing is closely related to self-organizationand self-management. Several aspects of cloud self-organization are discussed in the literature [14, 15, 22]. Prac-tical implementation of cloud self-organization is challengingfor several reasons:
A. The absence of a technically suitable definition of self-organization, a definition that could hint to practical designprinciples for self-organizing systems and quantitative evalu-ation of the results. Marvin Minsky and Murray Gell-Mann
[12] have discussed the limitations of core concepts in complexsystem theory such as emergence and self-organization. Thesame applies to autonomic computing, there is no indicationon how to implement any of the four principles and how tomeasure the effects of their implementation.
B. Computer clouds exhibit the essential aspects of complexity;it is inherently difficult to control complex systems. Complexsystems: (a) are nonlinear 3; (b) operate far from equilibrium;(c) are intractable at the component level; (d) exhibit differ-ent patterns of behavior at different scales; (e) require a longhistory to draw conclusion about their properties; (f) exhibitcomplex forms of emergence4; (g) are affected by phase transi-tions - for example, a faulty error recovery mechanism in caseof a power failure took down Amazon’s East Coast Regionoperations; and (h) scale well. In contrast, simple systemsare linear, operate close to equilibrium, are tractable at com-ponent level, exhibit similar patterns of behavior at differentlevels, relevant properties can be inferred based on a shorthistory, exhibit simple forms of emergence, are not affectedby phase transitions, and do not scale well, see also Chapter10 of [27].C. A quantitative characterization of complex systems and ofself-organization is extremely difficult. We can only asses thegoodness of a particular self-organization algorithm/protocolindirectly, based on some of the measures of system effective-ness, e.g., the savings in cost or energy consumption. We donot know how far from optimal a particular self-organizationalgorithm is.
Market-oriented cloud resource management. Themodel we propose uses a market approach based on bid-ding mechanisms to provide a relatively simple, scalable, andtractable solution to cloud resource allocation, eliminate theneed for admission control policies, which require some infor-mation about the global state of the system and, most impor-tantly, allow the service to be tailored to the specific privacy,security, and Quality of Service (QoS) needs of each appli-cation. At this time, Amazon Web Services (AWS) supportreservations and the so called spot instances. The reserva-tion system offers instances at a fixed price while the spotinstances use a market-based pricing.
The application of market-oriented policies [25, 26, 34] andtheir advantages over the other basic mechanisms implement-ing resource management policies in large-scale systems havebeen analyzed in the literature. Control theory [18, 21] andutility-based methods require a detailed model of the systemand are not scalable. If no bid exists for a service requestthen the request cannot be accepted. This procedure actsas an effective admission control. When a bid is generated,the resources are guaranteed to be available. Delivering onthat bid is based solely on bidder’s local state, so the abilityto quantify and to satisfy QoS constraints can be establishedwith a higher degree of assurance.
3The relation between cause and effect is often unpredictable: smallcauses could have large effects, and large causes could have small ef-fects. This phenomena is caused by feedback, the results of an action ortransformation are fed back and affect the system behavior.
4Emergence is generally understood as a property of a system that isnot predictable from the properties of individual system components.
3

Energy optimization decisions such as: how to locateservers using only green energy, how to ensure that individ-ual servers operate within the boundaries of optimal energyconsumption [5, 31], when and how to switch lightly loadedservers to a sleep state will also be based on local informationin an auction-based system. Thus, basing decisions on localinformation will be accurate and will not require a sophisti-cated system model nor a large set of parameters that cannotbe easily obtained in a practice.
3 Hierarchical Organization & Con-trol of Existing Clouds
The large-scale data center infrastructure is based on the socalled warehouse-scale computers (WSCs) [6]. The key in-sight of the analysis of the cloud architecture in [6] is thata discontinuity in the cost of networking equipment leads toa hierarchical, rather than flat, network topology. Further-more, a limited numbers of uplinks are typically allocated tocross-switch traffic, resulting in disparities between intra- andinter-rack communication bandwidth.
In a typical WSC, racks are populated with low-end serverswith a 1U3 or blade enclosure format. The servers within arack are interconnected using a local Ethernet switch with 1or 10 Gbps links. Similar cross-switch connections are used toconnect racks to cluster5-level networks spanning more than10,000 individual servers. If the blade enclosure format isbeing used, then a lower-level local network is present withineach blade chassis, where processing blades are connected toa smaller number of networking blades through an I/O bussuch as PCIe.
1 Gbps Ethernet switches with up to 48 ports are com-modity components. The cost to connect the servers within asingle rack – including switch ports, cables, and server NICs– costs less than $30/Gbps per server. However, networkswitches with higher port counts are needed to connect racksinto WSC clusters. These switches are up to 10 times moreexpensive, per port, than commodity 48 port switches. Thiscost discontinuity results in WSC networks being organizedinto a two-level hierarchy, where a limited portion of the band-width of rack-level switches (4-8 ports) is used for inter-rackconnectivity via cluster-level switches. This inter-rack com-munications bottleneck can be addressed through the use ofhigher-capacity interconnects such as Infiniband. Infinibandcan scale up to several thousand ports but costs significantlymore than even high-end Ethernet switches - approximately$500-$2,000 per port. Ethernet fabrics of similar scale arebeginning to appear on the market, but these still cost hun-dreds of dollars per server. Very large scale WSCs can ex-haust even the capacity of a two-layer hierarchy with highport-count switches at the cluster level. In this case, a thirdlayer of switches is required to connect clusters of racks.
Using this model, large-scale cloud infrastructures can beviewed as five-level hierarchies with an approximate resourcecount at each level: L0 is composed of individual servers. L1
5The terms cluster and cell are used interchangeably.
is composed of racks containing S servers connected by a rel-atively high-speed local network. L2 consists of clusters of Rracks of lower bandwidth compared to the intra-rack connec-tion bandwidth. L3 represents an individual WSC composedof a set of C clusters. At the highest level, L4, a cloud infras-tructure is composed of W WSCs for a total infrastructureserver count of I = W · C ·R · S.
Analysis of the size and organization of the largest scalecloud infrastructures currently in existence provides insightinto real-world values of W , C, R and S. For example, Ama-zon’s largest data center, US East, is located in Virginia, USA.A 2014 analysis used IP ranges to estimate that US East con-tained 6,382 racks of 64 servers each for a total server countof 408,448 [23]. US East is composed of three availabilityzones, each of which can be regarded as an independent WSC.Assuming an even distribution of racks between availabilityzones, we arrive at figure of approximately 136,000 servers peravailability zone. However, it is unclear whether the distribu-tion of resources between hierarchical levels corresponds withour model. It is also possible that a flatter or deeper network-ing hierarchy is used. Nevertheless, we can assume a disparitybetween intra- and inter-rack connectivity as full-bisection 10Gbps bandwidth within placement groups is advertised as aselling point for HPC instance types [2].
The disparity between intra- and inter-rack connectivitynecessitates that the concept of rack locality is accommo-dated during the architecture of software systems that aredeployed to WSCs. For example, the HDFS filesystem usedby Hadoop incorporates rack locality information for redun-dancy and performance purposes. Swift, the OpenStack ob-ject storage service, incorporates locality information so thatlocation-aware services such as HDFS can be run efficientlyon top of it. The inter-rack bottleneck also has implicationsfor the management of the infrastructure itself, in particularmonitoring.
Given the hierarchical topology of WSC networks and inter-rack bandwidth constraints, a distributed hierarchical man-agement scheme is a natural choice. Several hierarchical cloudmanagement schemes have been discussed in the literature[1, 3, 29]. As the operational details of most large-scale pub-lic clouds are not public, the management schemes used bythe largest providers – Amazon, Google, and Microsoft – canonly be surmised.
However, there is at least one large-scale cloud infrastruc-ture where some operational details are available. Rackspaceuse OpenStack to manage their public cloud infrastructureand are co-founders of and active contributors to the Open-Stack project [30]. By default, OpenStack Nova uses the Fil-ter Scheduler, which is centralized [24]. However, Rackspacehave contributed to the development of a distributed sched-uler, noting in the specification document6 that “Rackspacecurrently uses a distributed model for both scalability and highavailability and these same principles need to be brought intoNova to make it suitable for large scale deployments.”
The distributed scheduler is hierarchical in that it allowsthe infrastructure to be organized in into trees of nested zones.
6http://wiki.openstack.org/wiki/DistributedScheduler
4

At the time of writing, Rackspace advertise a total servercount of 110,453 [32], roughly an order of magnitude fewerthat those of the largest providers. The fact that Rackspaceuse a hierarchical management scheme lends support to theidea that the larger providers do also. We therefore postulatethat hierarchical management is the de facto approach to themanagement of large-scale cloud infrastructures.
The hierarchical approach to managing WSCs necessitatesthat service requests arriving at the top level must passthrough four levels before they can be satisfied. The deci-sion making processes at each hierarchical level is performedby controllers that oversee the logical unit at each level:
WSC Controllers (L3): maintain state information about theC cell beneath it.
Cell Controllers (L2): maintain state information on the Rracks beneath it.
Rack Controllers (L1): maintain state information on Sservers beneath it.
The hierarchical management of WSCs involves two dis-tinct activities: monitoring and control. Monitoring is theprocess of gathering the information required for control de-cisions. Control is the execution of service requests, alongwith housekeeping activities such as VM migration for powerefficiency purposes.
Controllers at Level 3 monitor relevant aspects of serverload, such as CPU and memory usage, and communicatethis information periodically via messages to the Level 2 con-trollers. In turn, the controllers at Levels 2 and Level 1 re-ceive state information from the levels below, aggregate it,and communicate this average load information to the levelabove. The WSC controller maintains the average load ofeach Level 1 (cell) controller beneath it.
Monitoring messages are sent periodically. Monitoring in-formation is by definition obsolete. The longer the monitor-ing period the more inaccurate the information is likely to be.However, shortening the monitoring period places more loadon the controllers and their networking links.
The hierarchical control model assumes that all service re-quests arrive first at the WSC controller before being routedthrough controllers at Levels 1 and 2 before it is fulfilled on aserver controller at Level 3. A controller can reject a servicerequest if the logic unit that it represents is overloaded. Theoptimal case is when none of the controllers a service requestis routed through are overloaded and three messages are sent:L3 → L2, L2 → L1 and L1 → L0.
As the load on the system increases, the number of mes-sages required to fulfill a service request (Nmsg) increases asmessages are rejected by overloaded controllers and servicerequests must be rerouted. If there are multiple WSCs in thecloud infrastructure, the worst case scenario is when no WSCcan find a cell which can find a rack which can a server fulfillthe request: Nmsg = NM − 1 where NM = W · C ·R · S.
4 Simulation of a HierarchicallyControlled Cloud Infrastructure
We first report on a series of simulation experiments de-signed to understand the effectiveness of hierarchical control.These experiments were conducted on the Amazon cloud us-ing c3.8xlarge7 EC2 instances. It is challenging to simulatesystems with 4 to 8 WSCs efficiently, the execution time foreach one of the simulation experiments reported in this sec-tion is about 24 hours and each simulation requires 5-6 dayswall clock time.
We wanted to understand how the scale and the load of thesystem, as well as, several parameters of the resource man-agement system affect the ability of the cloud infrastructureto respond to service requests. An important measure of thehierarchical resource management system effectiveness is thecommunication complexity for monitoring the system and forlocating a server capable to process a service request. Thecommunication complexity is expressed by the number of mes-sages at each level of an interconnection infrastructure withdifferent latencies and bandwidth at different levels.
We simulate hierarchical monitoring and control in a time-slotted system. In each time slot incoming service requestsare randomly assigned to one of the WSCs. Each WSC pe-riodically collects data from the cells, which in turn collectdata from racks, which collect data from individual servers.The communication complexity for this monitoring processincreases linearly with the size of the system. The more fre-quent the monitoring at each level takes place the more ac-curate the information is, but the larger the volume of dataand the interference with the “productive communication”,communication initiated by running applications. The com-munication bandwidth at each level is limited and when thesystem load increases the communication latency is likely toincrease significantly, as many applications typically exchangelarge volumes of data.
We assume a slotted time; in each reservation slot a batchof requests arrive and the individual requests are randomlyassigned to one of the WSCs. We experiment with two dif-ferent systems, the first has 4 WSCs and the second 8WSCs.A WSC has the following configuration: 24 cells, 100 racksper cell, 40 servers in each rack, and 4 processors per server.The system is homogeneous, all servers have the same capac-ity100vCPU. Thus, a WSC has 88, 000 servers and 352, 000processors. All simulation experiments are conducted for 200reservation slots and a random batch of service request arrivein each slot.
Our simulation models a system where load balancers ateach level monitor the system they control. When a requestis assigned to a WSC, the load balancer directs it to the cellwith the lowest reported load and the process repeats itselfat the cell level; the request is directed to the rack with thelowest reported load, which in turn directs it to server withthe lowest reported load. If this server rejects the requestthe rack load balancer redirects the request to the server withthe next lower load. If the rack cannot satisfy the request
7Compute-optimized instance with 32 vCPU and 60 GiB memory.
5

it informs the cell load balancer which in turn redirects therequest to the rack with the next lowest reported average load,and the process ends up with a rejection if none of the cellsof the WSC are able to find a server able to satisfy the type,duration, and intensity of the service request.
Our simulation environment is flexible. One first createsa configuration file which describes the system configuration,the network speed and server load and the parameters of themode, as shown below for the high initial load case.
----------------------------------------------------
High initial load simulation
----------------------------------------------------
% System configuration
static const int serverNum = 40;
static const int cpuNum = 4;
static const int rackNum = 100;
static const int cellNum = 25;
static const int WSCsNum = 4;
static const int servers_capacity =100;
% Network speeds and load parameters
static const int interRackSpeed = 1;
static const int intraRackSpeed = 10;
static const int MIN_LOAD = 80;
static const int MAX_LOAD = 85;
% Model parameters
static const int NUMBER_OF_TYPES = 100;
static const int vCPU_MAX_REQUES = 800;
static const int vCPU_MIN_REQUEST =10;
static const int vCPU_PER_SERVER = 10;
static const int MAX_SERVICE_TIME = 10;
static const int MONITORING_PERIOD = 10;
static const int SIMULATION_DURATION = 200;
static const int TYPES_FOR_SERVER = 5;
static const int TYPES_FOR_REQUEST = 5;
static const int RACK_CAP =
serverNum * servers_capacity;
static const int CLUS_CAP=
rackNum * RACK_CAP;
static const int WSC_CAP=
clusterNum * CLUS_CAP;
static const int SYSTEM_CAP=
WSCsNum * WSC_CAP;
------------------------------------------
The parameters of the simulation experiments have beenchosen as realistic as possible; the system configuration isderived from the data in [6], the amount of resources in aservice request has a broad range, between 10 and 800 vCPUs,while a single server can provide 10 vCPUs. The spectrumof service types offered is quite large, initially 500 types andthen reduced to 100. The duration of simulation is limited
to 200 reservation slots by practical considerations regardingcosts and time to get the results.
A service request is characterized by three parameters: (1)The service type; (2) The service time expressed as a numberof time slots; and (3) The service intensity expressed as thenumber of vCPUs needed.
We study the impact of the system size, the system load, themonitoring interval, the number of service types, the numberof service types supported by a server and of the service timeon important systems parameters such as:
- a. The number of messages exchanged at different levelsfor mapping the service requests. These numbers reflect theoverhead of the request processing process.
-b. The ability of the system to balance the load measured asthe coefficient of variation (the variance versus the average)of the system load per reservation slot.
-c. The rejection ratio, the ratio of service requests rejectedbecause there could be found no server able to match theservice type, the service intensity, and the service durationdemanded by the clients.
The simulation is conducted for two average initial systemloads: low, around 20% and high, around 80% of the system’scapacity. The total number of service requests for the lowand high initial system load are around (15 − 30) × 109 and(100−220×109, respectively. In each case we show the numberof WSCs, the initial and final system load for the low andhigh load, the initial and final coefficient of variation γ of theload, the rejection ratio (RR), and the number of messagesfor monitoring and control per service request at WSC level,Cell level, and Rack level.
For the first experiment the attributes of service requestsare uniformly distributed and the ranges are: (1− 100), (1−10), and (10− 800) for service type, service time, and serviceintensity, respectively. A server supports 5 different servicetypes randomly selected from a total of 500 possible servicetypes. The monitoring interval is 10 reservation slots; for laterexperiments it will increase to 20 and then to 50 reservationslots.
The results of our first simulation experiment in Table1 show that the rejection ratio, the coefficient of the vari-ation of the final load, and the average number of mes-sages required to map a service request to a server are morethan three fold larger in the case of higher load; indeed,7.1/2.2 = 3.22, 0.183/0.057 = 3.22, and 984/276 = 3.2. Athigher load more requests are rejected, load balancing is lesseffective, and the overhead for mapping a request is consider-ably higher. The increase in the number of messages meansa substantial increase of the communication costs and also alonger waiting time before a request enters the service.
Doubling the size of the system does not affect the statisticsfor the same average system load. For example, when theinitial average load is 22.50% the average number of messagesexchanged per service request is the same at the three levelsof the hierarchy for both system configurations. The rejectionratio varies little, 2.2 versus 1.9% and 7.1% versus 8.7% for 4and 8 WSCs, respectively.
Next we explore the effects of changing various parameters
6

Table 1: Hierarchical control - the simulation results for a system configuration with 4 WSCs. Shown are the initial andfinal system load for the low and high load, the initial and final coefficient of variation γ of the load, the rejection ratio (RR),and the average number of messages for monitoring and control per service request at WSC level, Cell level, and Rack level.
WSCs Initial/Final Initial/Final RR # service WSC Cell Rackload (%) γ (%) requests Msg/Req Msg/Req Msg/Req
4 22.50/19.78 0.007/0.057 2.2 29,568,832 0.98 3.18 271.9278.50/82.38 0.004/0.183 7.1 99,836,932 1.01 10.16 973.15
8 22.50/19.26 0.006/0.049 1.9 29,568,832 0.98 3.18 271.9278.50/81.98 0.005/0.213 8.7 215,861,712 1.01 11.36 1071.75
Table 2: Hierarchical control - instead of 500 service types a server supports only 100; all other parameters are identical tothe ones of the experiment with the results reported in Table 1.
WSCs Initial/Final Initial/Final RR # of service WSC Cell Rackload (%) γ (%) requests Msg/Req Msg/Req Msg/Req
4 22.50/21.15 0.003/0.051 1.9 28,994,955 1.00 3.53 337.3482.50/67.18 0.003/0.109 7.2 112,085,339 1.00 11.15 1,097.00
8 22.50/22.13 0.008/0.055 5.4 59,949,889 1.00 4.22 470.3582.50/81.63 0.006/0.155 4.2 213,581,511 1.00 10.72 1,038.96
Table 3: Hierarchical control - instead of 5 different service types a server offers only 2; all other parameters are identicalto the ones of the experiment with the results reported in Table 1.
WSCs Initial/Final Initial/Final RR # of service WSC Cell Rackload (%) γ (%) requests Msg/Req Msg/Req Msg/Req
4 22.50/21.15 0.003/0.051 1.7 29,105,016 0.99 3.22 276.3482.50/74.27 0.006/0.059 14.6 116,206,014 1.00 12.12 1255.40
8 22.50/16.27 0.006/0.035 1.3 57,750,971 0.99 3.18 268.2782.50/74.55 0.007/0.081 2.9 219,686,943 1.00 10.77 1,036.64
Table 4: Hierarchical control - the service time is uniformly distributed in the range (1 − 20) reservation slots; all otherparameters are identical to the ones of the experiment with the results reported in Table 1.
WSCs Initial/Final Initial/Final RR # of service WSC Cell Rackload (%) γ (%) requests Msg/Req Msg/Req Msg/Req
4 22.50/22.41 0.005/0.047 0.20 15,533,333 1.00 3.13 261.1182.50/80.28 0.003/0.063 2.10 97,312,617 1.00 3.41 1108.12
8 22.50/22.77 0.005/0.083 1.30 30,737,361 1.00 3.11 236.3082.50/79.90 0.005/0.134 4.10 117,184,440 1.00 10.63 1029.56
of the system model. Our experiments investigate the effectsof: (1) Doubling the number of WSCs from 4 to 8; (2) Reduc-ing the number of types of services from 500 to 100; (3) Re-ducing the number of types of services offered by each serverfrom 5 to 2; and (4) Increasing the monitoring interval to 50time slots and changing the distribution of the service time;initially it was uniformly distributed in the interval 1 − 10)time slots and this interval will be (1− 20) time slots.
Table 2 presents the results after reducing the total numberof service request types from 500 to 100. We see a reductionof the rejection ratio and of the number of messages at highload for the larger configuration of 8 WSCs compared to thecase in Table 1. We also notice that in this case the rejectionratio decreases from 7.4% to 4.2% when we increase the sizeof the system from 4 to 8 WSCs.
Table 3 presents the results when the number of service
7

Table 5: Hierarchical control - the monitoring interval is increased from 10 to 50 reservation slots all other parameters areidentical to the ones of the experiment with the results reported in Table 1.
WSCs Initial/Final Initial/Final RR # of service WSC Cell Rackload (%) γ (%) requests Msg/Req Msg/Req Msg/Req
4 22.50/21.07 0.003/0.033 1.00 29,625,667 0.99 3.21 270.0782.50/83.46 0.007/0.080 1.80 105,292,137 1.01 10.87 1040.63
8 22.50/19.16 0.005/0.030 1.30 58,006,110 1.00 3.37 304.8882.50/84.12 0.002/0.041 2.30 199,366,553 1.00 3.66 1005.87
Figure 1: Hierarchical control - time series of the average load of a cloud with eight WSCs. The monitoring interval is 20reservation slots and the service time is uniformly distributed in the range 1−20 reservation slots. The initial average systemload is: (Left) 20%; (Right) 80% of system capacity.
Figure 2: Hierarchical control - initial and final average load of a cloud with eight WSCs. The monitoring interval is 20reservation slots and the service time is uniformly distributed in the range 1−20 reservation slots. The initial average systemload is: (Left) 20%; (Right) 80% of system capacity.
8

types offered by a server is reduced from 5 to just 2. We seeagain a reduction of the rejection ratio at high load when wedouble the size of the system. The drastic reduction of thisratio, from 14.6 to 2.9 can be attributed to the fact that werandomly assign an incoming service request to one of theWSCs and the larger the number of WSCs the less likely isfor the request to be rejected. The number of messages atthe rack level is considerably larger for the smaller systemconfiguration at high load, 1255 versus 973 in the first casepresented in Table 1.
Next we set the monitoring interval to 20 reservation slotsand the service time is now uniformly distributed in the range1 − 20 reservation slots. The results in Table 4 show thatthe only noticeable effect is the reduction of the rejectionrate compared with the case in Table 1. In the followingexperiment we extended the monitoring interval from 10 to50 reservation slots. Recall that the service time is uniformlydistributed in the range 1 to 10 reservation slots; even whenthe monitoring interval was 10 reservation slots, this intervalis longer than the average service time thus, the informationavailable to controllers at different levels is obsolete. The re-sults in Table 5 show that increasing the monitoring intervalto 50 slots has little effect for the 4 WSC configuration at lowload, but it reduces substantially the rejection ratio and in-creases the number of messages at high load. For the 8 WSCconfiguration increasing the monitoring interval reduces therejection ratio at both low and high load, while the numberof messages changes only slightly.
Figures 1 and 2 refer to the case presented in Table 1 whenthe monitoring interval is 20 time slots and the service time isuniformly distributed in the 1− 20 slots range and there are8 WSCs. Figures 1(Left) and (Right) show the time seriesof the average system load for the low and the high initialload, respectively. We see that the actual system workloadhas significant variations from slot to slot; for example, athigh load the range of the average system load is from 58%to 85% of the system capacity. 2 show the initial and thefinal load distribution for the 8 WSCs; the imbalance amongWSCs at the end of the simulation is in the range of 1− 2%.
The results of the five simulation experiments are consis-tent, they typically show that at high load the number ofmessages, thus the overhead for request mapping increasesthree to four fold, at both cell and rack level and for bothsystem configurations, 4 and 8 WSCs.
5 Simulation of an Economic Modelof Cloud Resource Management
In this section we discuss the simulation of an economic modelfor cloud resource management based on a straightforwardbidding scheme. There is no monitoring and in each reser-vation slot all servers of a WSC bid for service. A bid con-sists of the service type(s) offered and the available capacityof the bidder. The overhead is considerably lower than thatof the hierarchical control; there is no monitoring and theonly information maintained by each WSC consists only ofthe set of unsatisfied bids at any given time. The servers are
autonomous but act individually, there is no collaborationamong them while self-organization and self-management re-quire agents to collaborate with each other.
At the beginning of a reservation slot servers with availablecapacity at least as large as a given threshold τ place bidswhich are then collected by each WSC. A bid is persistent,if is not successful in the current reservation slot it remainsin effect until a match with a service request is found. Thisstrategy to reduce the communication costs is justified be-cause successful bidding is the only way a server can increaseits workload.
We investigate the effectiveness of this mechanism forlightly loaded, around 20% average system load, and for heav-ily loaded, around 80% average system load. The thresholdsfor the two cases are different, τ = 30% for the former andτ = 15% for the latter. The choice for the lightly loadedcase is motivated by the desire to minimize the number ofmessages; a large value of τ , e.g., 40% would lower the rejec-tion ratio but increase the number of messages. In the heavilyloaded system case increasing the threshold, e.g., using a valueτ = 20%, would increase dramatically the rejection rate; in-deed, few servers would have 20% available capacity when theaverage system load is 80%.
To provide a fair comparison we repeat the measurementsreported in Section 4 under the same conditions but with bid-ding replacing the monitoring and hierarchical control. Weuse the same performance indicators as the ones reported inSection 4, those measuring communication complexity, the ef-ficiency of load balancing, and the rejection ratio. The resultsare shown in Tables 6 - 9.
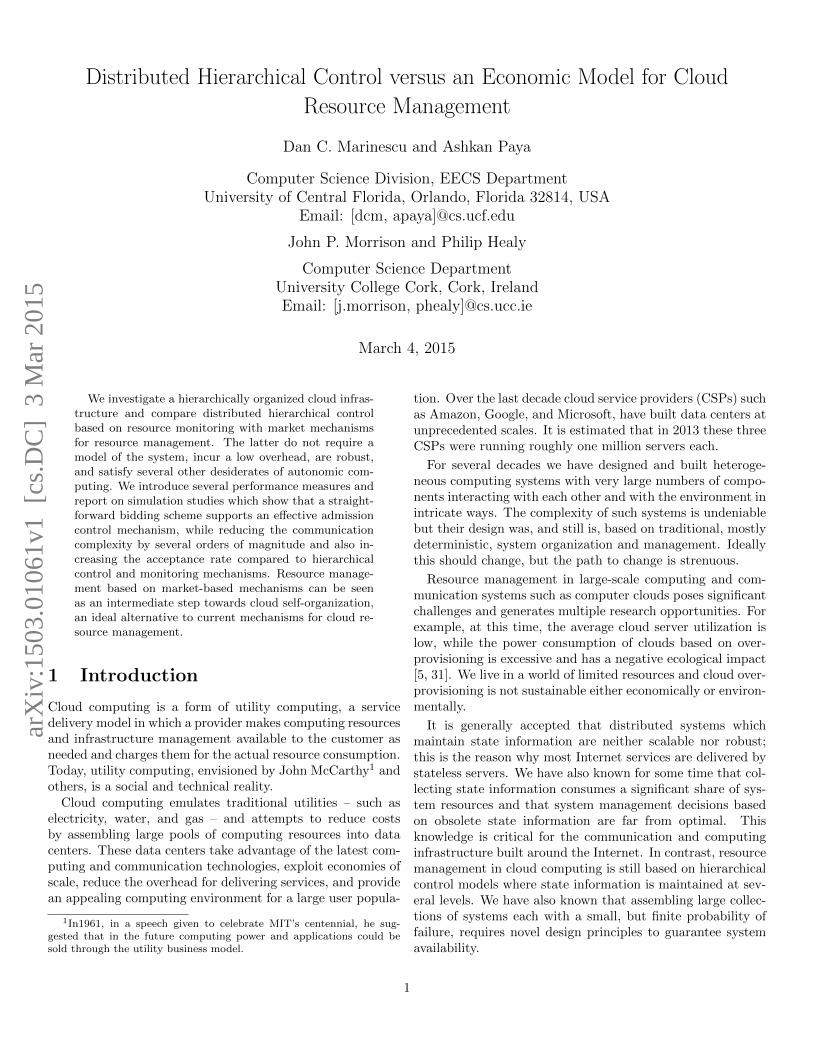
We notice a significant reduction of the communicationcomplexity, more than two orders of magnitude in case ofthe market-oriented mechanism. For example, at low averageload the average number of messages per reservation requestat the rack level is 0.987 (see Table 6) versus 271.92 reportedin Table 1 for the 4 and for the 8 WSCs case. At high averageload the same figures are: 4.155 versus 973.14 for the 4 WSCcase and 5.761 versus 1071.75 for the 8 WSC case. A sec-ond observation is that when the average load is 20% of thesystem capacity the communication complexity is constant,0.987, for both configurations, 4 and 8 WSCs, regardless ofthe choices of simulation parameters. At high average load,the same figure is confined to a small range, 4.078 to 6.734.
At low average load we also see a reduction of the averagerejection ratio for both 4 and 8 WSCs, 0.1 − 0.3 (see Tables6 - 8). The results in Table 9 show that increasing the dis-tribution of the service time from the 1− 10 to 1− 20 rangeincreases the rejection rate; this is most likely due to the factthat we simulate only the execution over 200 reservation slotsand requests with a large service time arriving during latherslots do not have time to complete. At high average systemload the average rejection ratio is only slightly better in case ofmarket-based versus hierarchical control. Lastly, the market-based mechanism performs slightly better than hierarchicalcontrol in terms of slot-by-slot load balancing, the coefficientof variation of the system load per slot γ ≤ 1.115
The number of different service types offered by the clouddoes not seem to affect the performance of the system and
9
Table 6: Market-based mechanism - simulation results for a system configuration with 4 WSCs. Shown are the initial andfinal system load for the low and high load, the initial and final coefficient of variation γ of the load, the rejection ratio (RR),and the average number of messages for monitoring and control per service request at WSC level, Cell level, and Rack level.
WSCs Initial/Final Initial/Final RR # service WSC Cell Rackload (%) γ (%) requests Msg/Req Msg/Req Msg/Req
4 22.50/23.76 0.007/0.067 .22 15,235,231 0.002 0.011 0.98782.50/80.32 0.004/0.115 5.44 63,774,913 0.003 0.042 4.155
8 22.50/22.47 0.006/0.033 .18 30,840,890 0.002 0.011 0.98782.50/81.30 0.005/0.154 7.23 89,314,886 0.003 0.054 5.761
Table 7: Market-based mechanism - instead of 500 service types the servers support only 100; all other parameters areidentical to the ones of the experiment with results reported in Table 6.
WSCs Initial/Final Initial/Final RR # of service WSC Cell Rackload (%) γ (%) requests Msg/Req Msg/Req Msg/Req
4 22.50/22.3 0.004/0.050 .18 15,442,372 0.002 0.011 0.98782.50/79.88 0.004/0.098 6.01 56,704,224 0.002 0.059 5.968
8 22.50/23.0 0.007/0.049 .3 31,091,427 0.002 0.011 0.98782.50/80.91 0.009/0.127 5.81 85,322,714 0.003 0.0.51 5.845
Table 8: Market-based mechanism - instead 5 different service types a server offers only 2; all other parameters are identicalto the ones for the experiment with results reported in Table 6.
WSCs Initial/Final Initial/Final RR # of service WSC Cell Rackload (%) γ (%) requests Msg/Req Msg/Req Msg/Req
4 22.50/20.94 0.007/0.056 .1 15,295,245 0.002 0.011 0.98782.50/77.83 0.008/0.133 10.1 49,711,936 0.003 0.063 6.734
8 22.50/22.33 0.007/0.063 .02 31,089,191 0.002 0.011 0.98782.50/78.18 0.008/0.142 3.61 71,873,449 0.002 0.059 6.098
Table 9: Market-based mechanism - the service time is uniformly distributed in the range (1 − 20) reservation slots; allother parameters are identical to the ones of the experiment with results reported in Table 6.
WSCs Initial/Final Initial/Final RR # of service WSC Cell Rackload (%) γ (%) requests Msg/Req Msg/Req Msg/Req
4 22.50/23.31 0.002/0.064 2.27 29,649,940 0.001 0.011 0.98882.50/84.05 0.007/0.101 3.75 99,247,883 0.002 0.042 6.329
8 22.50/18.93 0.007/0.038 2.94 59,467,830 0.001 0.011 0.98882.50/85.13 0.008/0.072 4.38 163,357,361 0.002 0.029 4.078
neither does the number of services supported by individualservers, as we can see from the results reported in Tables 7and 8. The organization is scalable, the results for 4 andfor 8 WSCs differ only slightly. This is expected because ofthe distributed scheme where each WSC acts independently,it receives an equal fraction of the incoming service requestsand matches them to the bids placed by the servers it controls.
Figures 3 and 4 refer to the case presented in Table 9 when
the monitoring interval is 20 time slots and the service time isuniformly distributed in the (1−20) slots range and there are8 WSCs. Figures 3(Left) and (Right) show the time seriesof the average system load for the low and the high initialload, respectively. The actual system workload has relativelysmall variations from slot to slot; for example, at high loadthe range of the average system load ranges from 77% to 82%of the system capacity. Figures 4 (Left) and (Right) show
10

Figure 3: Hierarchical control - time series of the average load of a cloud with eight WSCs. The monitoring interval is 20reservation slots and the service time is uniformly distributed in the range 1−20 reservation slots. The initial average systemload is: (Left) 20%; (Right) 80% of system capacity.
Figure 4: Hierarchical control - initial and final average load of a cloud with eight WSCs. The monitoring interval is 20reservation slots and the service time is uniformly distributed in the range 1−20 reservation slots. The initial average systemload is: (Left) 20%; (Right) 80% of system capacity.
the initial and the final load distribution for the 8 WSCs; theimbalance among WSCs at the end of the simulation is in therange of 1 − 3% at low load and between 80.1% and 80% athigh load.
6 Conclusions and Future Work
Low average server utilization [33] and its impact on the en-vironment [7], the increasing heterogeneity of cloud servers,and the diversity of services demanded by the cloud user com-munity are some of the reasons why it is imperative to devise
new resource management policies. These policies should sig-nificantly increase the average server utilization and the com-putational efficiency measured as the amount of computationsper Watt of power, make cloud computing more appealing andlower the costs for the user community, and last, but not least,simplify the mechanisms for cloud resource management.
Individual Cloud Service Providers believe that they havea competitive advantage due to the uniqueness of the addedvalue of their services [27] thus, are not motivated to discloserelevant information about the inner working of their systems.A rare glimpse at the architecture of the cloud is provided in
11

[6] and we have used this information to investigate a realisticmodel of the cloud infrastructure.
We defined several high-level performance measures for theresource management mechanism of a hierarchically organizedcloud including the communication complexity of the decisionmaking process, the ability to balance the load in time andrespond to incoming service requests. Admittedly, there areseveral other performance measures such as the robustness ofthe mechanisms, the ability to accommodate system changes,and so on but a more complex model of the system wouldmake simulation prohibitively costly and require a longer timeto obtain the results.
We choose to compare hierarchical control based on mon-itoring, a clear choice for a hierarchically organized system,with a bidding scheme whose appeal is its simplicity. Thissimplicity has important consequences; for example, the ad-mission control is implicit, when the system is heavily loadedthere are no bids. Moreover, failed servers are detected be-cause they do not participate in the bidding process, and soon. We used simulation to carry out our investigation simplybecause it is unfeasible to evaluate analytical models and ex-periments with systems at this scale are not possible. Even sothe simulations we conducted are computationally intensiveand it took days to get the results of a single experiment.
It was not unexpected to see that the average system loadaffects the performance of resource management mechanisms;the higher the load the larger the overhead due to communi-cation, the lower the ability to balance the load, and higherthe ratio of requests rejected. But our results show that thecommunication complexity is orders of magnitude lower forthe economic model than that of hierarchical control. Ouraim is a qualitative, rather than a quantitative analysis, anda discrepancy of orders of magnitude provides solid argumentsfor the advantages of one approach versus the other.
In some sense the hierarchic cloud resource management isscalable. Our results show that at low and at high load asystem with 8 WSCs has a similar behavior as the one withonly 4 WSCs; at high load both configurations are affected byincreased overhead. It is particularly significant the fact thatat high load the number of messages as the cell level increasesthree fold. Typically, computer clouds use 10 Gbps Ethernetnetworks; the contention for cell-level and WSC-level con-nectivity will further limit the ability of the hierarchical con-trol model to perform under stress and lower considerably thebandwidth available for applications.
The economic cloud resource management model using bid-ding considerably more performant than the hierarchic con-trol in virtually all aspects. The communication complexityis lower, it better balances the load among several WSCs,ensures a more even load distribution in time, requires lessspace to store the information required to perform the re-source management, it is robust, and some of the policiessuch as admission control are implicit. The most significantresult is that this model performs very well when the systemis heavily loaded, when the average server load is around 80%of its capacity.
The simulation time is prohibitive and would dramaticallyincrease for a heterogeneous cloud infrastructure model where
individual servers provide one type of service rather than sev-eral. Such a more realistic model is likely to make a hierar-chical control model even less attractive.
The economic model discussed in this paper should be seenas an intermediate step towards the ideal case when self-organization and self-management drive the cloud infrastruc-ture. Self-organization is the spontaneous emergence of globalcoherence out of local interactions. A self-organizing systemresponds to changes in the environment through adaptation,anticipation, and robustness. The system reacts to changesin the environment, predicts changes and reorganizes itselfto respond to them, or is robust enough to sustain a certainlevel of perturbations. Our future work is focused on cloudself-organization and self-management based on coalition for-mation and combinatorial auctions [28].
References
[1] B. Addis, D. Ardagna, B. Panicucci, M. Squillante, andL. Zhang. “A hierarchical approach for the resource man-agement of very large cloud platforms.” IEEE Transac-tions on Dependable and Secure Computing, 10(5):253–272, 2013.
[2] Amazon Web Services, Inc. Amazon Elastic ComputeCloud User Guide (API Version 2014-06-15), 2014.
[3] M. Andreolini, S. Casolari, and S. Tosi. “A hierarchicalarchitecture for on-line control of private cloud-based sys-tems.” In Proc. of 10th World Wide Web Internet Con-ference (WWWCONF2010), Timisoara, Romania, Octo-ber 2010.
[4] X. Bai, D. C. Marinescu, L. Boloni, H. J. Siegel, R.A. Daley, and I-J Wang. “A macroeconomic model forresource allocation in large-scale distributed systems.”Journal of Parallel and Distributed Computing (JPDC),68:182-199, 2008.
[5] L. A. Barroso and U. Hozle. “The case for energy-proportional computing.” IEEE Computer, 40(12):33–37, 2007.
[6] L. A. Barossso, J. Clidaras, and U.Hozle. The Data-center as a Computer; an Introduction to the Design ofWarehouse-Scale Machines. (Second Edition). Morgan& Claypool, 2013.
[7] M. Blackburn and A. Hawkins. “Un-used server survey results analysis.”www.thegreengrid.org/media/WhitePapers/Unused%20Server%20Study WP 101910 v1. ashx?lang=en(Accessed on December 6, 2013).
[8] R. Buyya and K. Bubendorfer, editors. Market-OrientedGrid and Utility Computing, Vol. 75. John Wiley & Sons,2009.
[9] V. Chang, G. Wills, and D. De Roure. “A review of cloudbusiness models and sustainability.” Proc. IEEE 3rd Int.Conf. on Cloud Computing, pp. 43–50, 2010.
12

[10] P. Cilliers. “Boundaries, hierarchies and networks incomplex systems.” Int. J. of Innovation Management,5(2):135–147, 2001.
[11] X. Dutreild, N. Rivierre, A. Moreau, J. Malenfant, andI. Truck. “From data center resource allocation to controltheory and back.” Proc. IEEE 3rd Int. Conf. on CloudComputing, pp. 410–417, 2010.
[12] M. Gell-Mann. “Simplicity and complexity in the de-scription of nature.” Engineering and Science, Caltech,LI(3):3–9, 1988.
[13] A. G. Ganek and T. A. Corbi. “The dawning ofthe autonomic computing era.” IBM Systems Journal,42(1):5-18, 2003. Also, https://www.cs.drexel.edu/ jsal-vage/Winter2010/CS576/autonomic.pdf.
[14] V. Gupta and M. Harchol-Balter. “Self-adaptive controlpolicies for resource-sharing systems.” Proc. 11th Int.Joint Conf. Measur. Modeling Comp. Syst. (SIGMET-RICS’09), pp. 311–322, 2009.
[15] J. O. Gutierrez-Garcia and K.- M. Sim. “Self-organizingagents for service composition in cloud computing.” ProcIEEE 2nd Int. Conf. on Cloud Computing Technologyand Science, pp. 59–66, 2010.
[16] K. R. Jackson, L. Ramakrishnan, K. Muriki, S. Canon,S. Cholia, J. Shalf, H. Wasserman, N. J. Wright. “Per-formance analysis of high performance computing appli-cations on the Amazon Web services cloud.” Proc. IEEESecond Int. Conf. on Cloud Computing Technology andScience, pp. 159–168, 2010.
[17] J. O . Kephart and D. M. Chase. “The vision of auto-nomic computing.” Computer, 36(1):41-50, 2003
[18] E. Kalyvianaki, T. Charalambous, and S. Hand. “Self-adaptive and self-configured CPU resource provisioningfor virtualized servers using Kalman filters.” Proc. 6thInt. Conf. Autonomic Comp. (ICAC2009), pp. 117–126,2009.
[19] J. Kephart, H. Chan, R. Das, D. Levine, G. Tesauro,F. Rawson, and C. Lefurgy. “Coordinating multiple auto-nomic managers to achieve specified power-performancetradeoffs.” Proc. 4th Int. Conf. Autonomic Computing(ICAC2007), pp. 100-109, 2007.
[20] J. Kephart. “The utility of utility.” Proc. Policy 2011,2011.
[21] D. Kusic, J. O. Kephart, N. Kandasamy, and G. Jiang.“Power and performance management of virtualizedcomputing environments via lookahead control.” Proc.5th Int. Conf. Autonomic Comp. (ICAC2008), pp. 3–12,2008.
[22] H C. Lim, S. Babu, J. S. Chase, and S. S. Parekh. “Au-tomated control in cloud computing: challenges and op-portunities.” Proc. First Workshop on Automated Con-trol for Datacenters and Clouds,, ACM Press, pp. 13–18,2009.
[23] H. Liu. Amazon EC2 grows 62% in 2 years. Blog post,February 2014.
[24] O. Litvinski and A. Gherbi. Experimental evaluation ofopenstack compute scheduler. Procedia Computer Sci-ence, 19:116–123, 2013.
[25] D. C. Marinescu, X. Bai, L. Boloni, H. J. Siegel, R. E. Da-ley, and I-J. Wang. “A macroeconomic model for resourceallocation in large-scale distributed systems.” Journal ofParallel and Distributed Computing, 68:182–199, 2008.
[26] D. C. Marinescu, H. J. Siegel, and J. P. Morrison. “Op-tions and commodity markets for computing resources.”Market Oriented Grid and Utility Computing, R. Buyyaand K. Bubendorf, Eds., Wiley, ISBN: 9780470287682,pp. 89–120, 2009.
[27] D. C. Marinescu. “Cloud Computing; Theory and Prac-tice.” Morgan Kaufmann, 2013.
[28] D. C. Marinescu, A. Paya, and J. P. Morrison. “Coali-tion formation and combinatorial auctions; applicationsto self-organization and self-management in utility com-puting.” http://arXiv:.org/pdf/1406.7487.pdf, 2014.
[29] H. Moens and F. D. Turck. “A scalable approach forstructuring large-scale hierarchical cloud managementsystems.” Proc. 9th Int. Conf. on Network and ServiceManagement (CNSM-2013), pp. 1–8, 2013.
[30] S. Patterson. Openstack vs. closed clouds the AOL fac-tor. White paper, 2011.
[31] A. Paya and D. C. Marinescu. “Energy-aware load bal-ancing and application scaling for the cloud ecosystem.”IEEE Trans. on Cloud Computing. 2015 (to appear).
[32] Rackspace. Rackspace announces strong third quarter.Press Release, November 2014.
[33] B. Snyder. “Server virtualization has stalled, despitethe hype.” http://www.infoworld.com/print/146901 (Ac-cessed on December 6, 2013).
[34] M. Stokely, J. Winget, E. Keyes, C. Grimes, andB. Yolken. “Using a market economy to provisioncompute resources across planet-wide clusters.” Proc.Int. Parallel and Distributed Processing Symp. (IPDPS2009), pp. 1–8, 2009.
[35] L. Tang, J. Dong, Y. Zhao, and L.-J. Zhang. “Enterprisecloud service architecture.” Proc. IEEE 3rd Int. Conf.on Cloud Computing, pp. 27–34, 2010.
[36] C. Tung, M. Steinder, M.Spreitzer, and G. Pacifici. “Ascalable application placement controller for enterprisedata centers.” Proc. 16th Int. Conf. World Wide Web(WWW2007), 2007.
13