
DISSERTATION o Attribution
149
COPYRIGHT AND CITATION CONSIDERATIONS FOR THIS THESIS/ DISSERTATION o Attribution — You must give appropriate credit, provide a link to the license, and indicate if changes were made. You may do so in any reasonable manner, but not in any way that suggests the licensor endorses you or your use. o NonCommercial — You may not use the material for commercial purposes. o ShareAlike — If you remix, transform, or build upon the material, you must distribute your contributions under the same license as the original. How to cite this thesis Surname, Initial(s). (2012) Title of the thesis or dissertation. PhD. (Chemistry)/ M.Sc. (Physics)/ M.A. (Philosophy)/M.Com. (Finance) etc. [Unpublished]: University of Johannesburg. Retrieved from: https://ujcontent.uj.ac.za/vital/access/manager/Index?site_name=Research%20Output (Accessed: Date).
-
Upload
khangminh22 -
Category
Documents
-
view
0 -
download
0
Transcript of DISSERTATION o Attribution

COPYRIGHT AND CITATION CONSIDERATIONS FOR THIS THESIS/ DISSERTATION
o Attribution — You must give appropriate credit, provide a link to the license, and indicate ifchanges were made. You may do so in any reasonable manner, but not in any way thatsuggests the licensor endorses you or your use.
o NonCommercial — You may not use the material for commercial purposes.
o ShareAlike — If you remix, transform, or build upon the material, you must distribute yourcontributions under the same license as the original.
How to cite this thesis
Surname, Initial(s). (2012) Title of the thesis or dissertation. PhD. (Chemistry)/ M.Sc. (Physics)/ M.A. (Philosophy)/M.Com. (Finance) etc. [Unpublished]: University of Johannesburg. Retrieved from: https://ujcontent.uj.ac.za/vital/access/manager/Index?site_name=Research%20Output (Accessed: Date).
POINT-OF-SALE DATA IN DEMAND PLANNING IN
CLOTHING INDUSTRY SUPPLY CHAINS
by
DOUGLAS NJABULO RAZA 201134897
DISSERTATION
Submitted in fulfilment of the requirements for the degree
of
Magister commercii
in
Logistics Management
Faculty of Management
UNIVERSITY OF JOHANNESBURG
Supervisor: Dr P.J. Kilbourn
November 2016

i
DECLARATION
DECLARATION
I certify that the minor dissertation/dissertation/thesis submitted by me for the degree Master’s
of Commerce (Logistics Management) at the University of Johannesburg is my independent
work and has not been submitted by me for a degree at another university.
DOUGLAS NJABULO RAZA
November 2016

ii
ACKNOWLEDGEMENTS My first acknowledgement goes to Jehovah God Almighty the giver and ‘sustainer’ of
strength and life. All glory and honour be to Him.
I thank my family, friends and colleagues who have been supportive at the various
stages of this study and I pray for blessings for each of you who had any form of
contribution to this research.
I also thank Linda Nontokozo Ndlovu who helped in the transcription of some of the
recorded interviews and who was also supportive and motivating at different points of
this study.
I would also like to thank my research supervisor, Dr Peter J. Kilbourn, who has been a
mentor and has guided me throughout the course of this study. With his support and
encouragement, I managed to overcome challenges and obstacles at various points of
this research.
My gratitude also goes to the Department of Transport and Supply Chain Management
at the University of Johannesburg for providing the space, personnel and resources to
ensure the continual progress and success of this project.
This study is dedicated to my late mother, Edith Tembi Tshuma, who was a pillar of
strength in all my academic endeavours.
‘True education means more than the pursual of a certain course of study. It means
more than a preparation for the life that now is. It has to do with the whole being and
with the whole period of existence possible to man.’
- E.G. White
iii
ABSTRACT In modern days’ dynamic and ever-changing consumer markets that are characterised
by the ‘empowered consumer’ and shorter product life cycles, supply chains need to be
value driven and consumer oriented. The South African clothing industry is one of the
industries that has a consumer market typified by this trend. A valuable feature in
consumer-oriented supply chains is an understanding of what the consumer needs are.
This is essential as consumers have become an increasingly fundamental part of the
value creation processes. Demand planning as a supply chain task provides the supply
chain members with an opportunity to better understand the nature of consumer
demand.
From the literature review it is evident that demand planning is a supply chain activity
concerned with effective management of demand and requires improving forecasts,
reducing costs, minimising risk, and increasing sales and profit. Demand planning is
fundamental in supply chain management (SCM) as it allows the supply chain members
to focus on the consumer and effectively and efficiently create optimal value. This
understanding of consumer demand ensures that the supply response is suited for the
demand thereof. In demand planning, point-of-sale (POS) data is an essential and
highly valuable input to the process thereof; however, literature suggests that POS-
based demand planning is one of the least utilised and often overlooked demand
planning approaches.
This study focused on the South African clothing retail industry; an industry that
accounted for 21% of South Africa’s total retail sales in 2014 and reported for having
experienced continual growth in the past few years. Effective SCM has also become a
critical issue in the clothing industry because high standards of customer service must
be maintained throughout the supply chain. Clothing manufacturers and retailers also
need to achieve a balance between their demand and supply processes and therefore
effective demand planning is an important activity in this industry.
The main purpose of the study was to determine the extent to which businesses in the
South African clothing retail industry use POS data in demand planning. Furthermore,
iv
the study sought to determine the nature of the demand planning process and the
systems employed for the collection and dissemination of POS data in the South African
clothing retail industry. Another purpose of the study was to determine the way POS
data is used in the demand planning process within this industry.
This study followed the grounded theory approach based on the collection of qualitative
data through interviews with employees of sampled companies in the South African
clothing retail industry. The respondents to these interviews were people who work as
demand planners in the respective companies. The study discusses the various issues
of the demand planning process performed by clothing retailers in South Africa and
more specifically the usage of POS data in the process thereof.
The overall findings were that companies within the South African clothing retail industry
make use of POS data and it plays a fundamental role in the demand planning process
and that POS data is considered an important input factor in the demand planning
process. However, the results of the study indicate that POS data cannot be applied in
the planning for all types of clothing products, and as much as POS data is a
fundamental factor in the demand planning process, there are other variables that also
form a critical part of the demand planning process.

v
TABLE OF CONTENTS DECLARATION ............................................................................................................... i ACKNOWLEDGEMENTS ............................................................................................... ii ABSTRACT ................................................................................................................... iii TABLE OF CONTENTS .................................................................................................. v
LIST OF FIGURES.......................................................................................................... x
LIST OF TABLES ......................................................................................................... xii LIST OF ACRONYMS .................................................................................................. xiii
CHAPTER 1: INTRODUCTION ...................................................................................... 1
1.1 Background ............................................................................................................ 1
1.1.1 Consumer focus and collaborative planning .................................................... 2
1.1.2 Demand forecasting and demand planning ..................................................... 3
1.1.3 Point-of-sale data in demand planning ............................................................ 5
1.1.4 The South African clothing industry ................................................................. 5
1.2 Definition of the problem statement ....................................................................... 6
1.3 Motivation and delineation of the study .................................................................. 8
1.4 Research questions ............................................................................................... 9
1.4.1 Main question .................................................................................................. 9
1.4.2 Investigative questions .................................................................................... 9
1.5 Objectives of the study ........................................................................................... 9
1.5.1 Primary objective ............................................................................................. 9
1.5.2 Secondary objectives ....................................................................................... 9
1.6 Limitations of the study ........................................................................................ 10
1.7 Research methodology ........................................................................................ 10
1.8 Study outline ........................................................................................................ 11
1.8.1 Chapter 2: Demand planning and the significance of POS data .................... 11
1.8.2 Chapter 3: The South African clothing retail industry ..................................... 11
1.8.3 Chapter 4: Research methodology ................................................................ 11
vi
1.8.4 Chapter 5: Research findings ........................................................................ 11
1.8.5 Chapter 6: Interpretation, conclusions and recommendations ....................... 12
CHAPTER 2: DEMAND PLANNING AND THE SIGNIFICANCE OF POS DATA ....... 14
2.1 Introduction .......................................................................................................... 14
2.2 The concept of demand planning ......................................................................... 14
2.3 Demand planning in supply chains ...................................................................... 16
2.3.1 The need for demand planning ...................................................................... 16
2.3.2 Collaboration and information sharing in demand planning ........................... 20
2.4 The process of demand planning ......................................................................... 24
2.5 The case for POS data in demand planning ........................................................ 26
2.5.1 POS data defined .......................................................................................... 27
2.5.2 The case for POS data-based demand planning ........................................... 30
2.5.3 Shortfalls of POS data ................................................................................... 33
2.6 Frameworks for the application POS data-based demand planning .................... 34
2.6.1 Multi-tiered causal analysis (MTCA) .............................................................. 34
2.6.2 POS data as a performance enhancing technique (PET) .............................. 35
2.7 Conclusion ........................................................................................................... 37
CHAPTER 3: THE SOUTH AFRICAN CLOTHING RETAIL INDUSTRY ..................... 40
3.1 Introduction .......................................................................................................... 40
3.2 The clothing industry ............................................................................................ 40
3.3 The global clothing supply chains ........................................................................ 41
3.3.1 Clothing industry liberalisation ....................................................................... 42
3.3.2 Global clothing industry supply chains ........................................................... 42
3.3.3 Retailing in the clothing industry .................................................................... 44
3.4 South African clothing supply chains ................................................................... 45
3.4.1 Historical background .................................................................................... 45
vii
3.4.2 The imports threat .......................................................................................... 46
3.5 The South African clothing retail industry ............................................................. 47
3.5.1 Retailing in South Africa................................................................................. 47
3.5.2 Clothing retailing ............................................................................................ 49
3.5.3 Clothing retail market contribution ................................................................. 50
3.5.4 Category performance ................................................................................... 51
3.5.5 Industry growth .............................................................................................. 52
3.5.6 Key industry players ...................................................................................... 53
3.6 Demand planning in the clothing retail industry .................................................... 55
3.6.1 POS data in clothing retail ............................................................................. 55
3.6.2 POS data collection and transmission technologies ...................................... 57
3.6.3 POS data usage in the South African clothing retail industry ......................... 57
3.7 Conclusion ........................................................................................................... 58
CHAPTER 4: RESEARCH METHODOLOGY .............................................................. 61
4.1 Introduction .......................................................................................................... 61
4.2 Research approach .............................................................................................. 62
4.3 Research strategy ................................................................................................ 63
4.3.1 Grounded theory ............................................................................................ 64
4.3.2 Case study approach ..................................................................................... 64
4.3.3 Literature review ............................................................................................ 65
4.4 Data collection: Interviews ................................................................................... 65
4.4.1 Semi-structured interviews ............................................................................. 67
4.4.2 Recording interview data ............................................................................... 67
4.5 Sampling .............................................................................................................. 68
4.5.1 Non-probability sampling ............................................................................... 69
4.5.2 Purposive sampling ....................................................................................... 70
4.5.3 Sampling frame .............................................................................................. 70
4.5.4 Sampling unit ................................................................................................. 71
4.6 Data analysis ....................................................................................................... 71
viii
4.6.1 Transcribing ................................................................................................... 72
4.6.2 Data analysis ................................................................................................. 72
4.7 Ethical considerations .......................................................................................... 73
4.8 Conclusion ........................................................................................................... 74
CHAPTER 5: DATA ANALYSIS AND PRESENTATION OF RESEARCH FINDINGS 77
5.1 Introduction .......................................................................................................... 77
5.2 Data capture and organisation ............................................................................. 77
5.3 Data analysis ....................................................................................................... 77
5.3.1 Approach to analytical rationale ..................................................................... 77
5.3.2 Analytical procedure: The grounded theory ................................................... 78
5.4 Computer-assisted qualitative data analysis software (CAQDAS) ....................... 79
5.4.1 Coding and data categorisation ..................................................................... 80
5.5 FINDINGS ............................................................................................................ 82
5.5.1 The positioning of a demand planner within the SA clothing retail companies ................................................................................................................................ 82
5.5.2 The role of a demand planner within the SA clothing retail companies .......... 84
5.5.3 Demand planning process in the SA clothing retail industry .......................... 85
5.5.4 Structure of SA clothing industry supply chains ............................................. 86
5.5.5 Nature of products sold within the SA clothing retail industry ........................ 87
5.5.6 The collection and dissemination of POS data .............................................. 88
5.5.7 The importance of demand planning in clothing retail .................................... 91
5.5.8 The usage of POS data ................................................................................. 92
5.5.9 The usage of POS data in demand planning ................................................. 94
5.5.10 Other organisational functions involved in the process ................................ 97
5.5.11 Problems in POS-based demand planning .................................................. 99
5.5.12 The future of POS data in demand planning in the SA clothing retail industry .............................................................................................................................. 100
5.6 CONCLUSION ................................................................................................... 101
ix
CHAPTER 6: CONCLUSION, INTERPRETATION AND RECOMMENDATIONS ..... 104
6.1 Introduction ........................................................................................................ 104
6.2 Literature review theoretical constructs .............................................................. 104
6.2.1 Demand planning and the role of POS data ................................................ 105
6.2.2 The South African clothing retail industry .................................................... 107
6.3 Research methodology ...................................................................................... 109
6.4 Interpretation of the research findings ................................................................ 109
6.4.1 Secondary objective 1 ................................................................................. 110
6.4.2 Secondary objective 2 ................................................................................. 110
6.4.4 Secondary objective 4 ................................................................................. 113
6.4.5 Secondary objective 5 ................................................................................. 113
6.5 Recommendations ............................................................................................. 113
6.6 Future research .................................................................................................. 117
6.7 Conclusion ......................................................................................................... 118
LIST OF SOURCES .................................................................................................... 120
ANNEXURE A: Letter of Non-disclosure ................................................................. 128
ANNEXURE B: Interview questionnaire .................................................................. 129

x
LIST OF FIGURES Figure 2.1: Relationship of supply chain, logistics and demand planning 15
Figure 2.2: Bullwhip effect – increased variability of orders up the supply chain 18
Figure 2.3: Collaborative demand planning process 22
Figure 2.4: CPFR model 23
Figure 2.5: Demand planning process 25
Figure 2.6: Supply chain relationships and POS data point of capture 27
Figure 2.7: Discrepancies between orders placed and actual sales 31
Figure 3.1: Apparel global value chain 43
Figure 3.2: The supply chain in the textile and clothing sector 43
Figure 3.3: Real annual percentage growth in retail sales (2003–2013) 47
Figure 3.4: Retail trade sales in South Africa: 2009–2014 49
Figure 3.5: Retail market shares: general dealers and CFT retailers 50
Figure 3.6: Retail trade sales for 2014 51
Figure 3.7: South African apparel retail industry category segmentation:
percentage share by value for 2014 52
Figure 3.8: Retail annual sales in 2014 by type of retailer 52
Figure 3.9: South African apparel retail industry value: $ billion, 2010–2014 53
Figure 4.1 Steps in the research process 61
Figure 4.2: The ‘research onion’ 62
Figure 4.3: Classification of qualitative research methods 66
xi
Figure 4.4: Sampling methods 69
Figure 5.1: Grounded theory analysis process 80
Figure 5.2: Various titles used for demand planners in clothing retail companies 83
Figure 5.3: Other roles of demand planners 85
Figure 5.4: Product groupings as experienced by planners in terms of level of
Volatility 87
Figure 5.5: Technologies used within demand planning in the industry 90
Figure 5.6: Summary of the responses on the importance of demand planning in
Retail 92
Figure 5.7: Other input factors in demand planning 97
Figure 5.8: The organisational functions involved in demand planning 98
xii
LIST OF TABLES Table 2.1: Sources of POS data 28
Table 2.2: Strengths and weaknesses of direct POS and syndicated POS 29
Table 2.3: Calculating expected demand from a POS plan 36
Table 3.1: Top ten retail companies in Africa 48
Table 4.1: Distinctions between quantitative and qualitative data 63
Table 4.2: Advantages and disadvantages of audio recording the interview 77
Table 4.3: Summary of the research methodology 75

xiii
LIST OF ACRONYMS ATC: Agreement on Textiles and Clothing
APICS: American Production and Inventory Control Society
ARP: Automatic Replenishment Programs
BOH: Beginning Inventory on Hand
CAQDAS: Computer-Assisted Qualitative Data Analysis Software
CFT: Clothing, Footwear and Textiles
CGCSA: Consumer Goods Council of South Africa
CPFR: Collaborative Planning, Forecasting and Replenishment
CPG: Consumer Packaged Goods
CSCMP: Council of Supply Chain Management Professionals
CTFL: Clothing, Textiles, Footwear and Leather
DF: Demand Forecasters
DC: Distribution Centre
EDI: Electronic Data Interchange
EOH: Ending Inventory on Hand
ERP: Enterprise Resource Planning
GDP: Gross Domestic Product
GVC: Global Value Chain
IRI: Information Resource Inc
KPI: Key Performance Indicators
MRP: Materials Requirement Planning
xiv
MTCA: Multi-Tiered Causal Analysis
NCRF: National Clothing Retail Federation of South Africa
PET: Performance Enhancing Technique
POS: Point of Sale
POPI: Protection of Personal Information
RDF: Replenishment and Demand Forecasting
SA: South Africa
SCM: Supply Chain Management
SIC: Standard Industrial Classification
SKU: Stock Keeping Units
ST: Sell Through
UPC: Universal Product Code
VMI: Vendor Managed Inventory
W&R Seta Wholesale and Retail Sector Education and Training Authority
WTO: World Trade Organisation
YDE: Young Designers Emporium
YTD: Year-To-Date
xv
1
CHAPTER 1: INTRODUCTION
1.1 Background
Supply chain management (SCM) as a business concept has gained prominence in
the business world over recent years. Introduced in early 1980, SCM has grown in
importance since the early 1990s (Habib, 2011). Furthermore, there has been a
notable transition in literature from the usage of the term ‘supply chain’ to the term
‘value chain’ (Jüttner, Christopher & Baker, 2007). This shift to ‘value chain’ signifies
a change from a supply focus to a demand focus whereby the supply chain is viewed
as a series of points where value for the consumer is being added. ‘Today, the value
orientation is more prevalent than ever before,’ according to Jüttner et al. (2007).
Thus, a global business environment in which consumers ‘have become an
increasingly fundamental part of the value creation processes requires a new
dominant logic for marketing’ (Tiu Wright, Denegri-Knott, Zwick & Schroeder,
2006:965).
This focus on consumer demand and value addition has made supply chain
members desire an understanding of consumer buying behaviour and consumer
demand patterns. This has not been an easy task for supply chain managers. It has,
as a result, pointed to the importance of demand planning as a supply chain activity.
Responding to volatility in market conditions, and the resulting customer demand
patterns, has proved to be the biggest challenge for supply chain executives and, not
surprisingly, become a key investment area (Butner, 2010:6).
The business context of our day is characterised by consumers with high demands
and who are highly discriminating. With consumer demand driving the markets and
its resulting effect on the sales and profitability of firms, there is a far greater need to
understand the nature of demand as well as the behaviour thereof. Consumer power
has become a cliché of modern consumer culture. This is evidenced in the
consumers’ ability to ignore, resist and adapt even the sleekest and most costly
multi-media assault, and this has resulted in the reiteration of statements such as
‘customers are too smart to be fooled’, ‘consumers see through bad marketing’, ‘the
customer is king’ or ‘the customer is always right’ (Tiu Wright et al., 2006:950).
2
Supply chains often fail because of a lack of understanding of the makeup and
nature of consumer demand. This failure to understand demand leads to
mismatched supply chain design (Blecker, Kersten & Meyer, 2009). Failure to match
supply and demand has several negative implications, which include the following:
Excess inventory due to low product sales and high product supply
Stock-outs due to low product supply and high demand
Wastages resulting in a mismatch between consumer preferences and supply
High amount of back orders which are more costly
High reverse logistics costs due to market rejected products.
The volatility of the demand requires quicker reaction and response from the supply
chain as a whole; this necessitates more swiftness on the supplier’s side and thus
the emergence of agile supply chains. ‘Agile supply chains are designed for
flexibility, emphasising the supply chain’s ability to respond rapidly to demand
changes, both in terms of volume and variety’ (Jüttner et al., 2007:6). The concept of
agile supply chains is even more important in the clothing retail industry, which will
be the focus of this study. ‘Clothing is increasingly considered as a perishable good
where time to market matters. This will render producers in more remote locations at
a disadvantage, particularly in the fashion segments of the clothing industry’
(Nordås, 2004:1).
This study seeks to discuss and explore the concept of demand planning and the
use of point-of-sale data in the clothing retail industry in South Africa – one of the
major retail sectors in South Africa. In addition to cost effectiveness, the competitive
advantage of firms in the clothing market segment is related to the ability to produce
designs that capture tastes and preferences, and even better, influence such tastes
and preferences (Nordås, 2004). This sustains the point that understanding
consumer demand and behaviour has become an indispensable tool to gaining
competitive advantage.
1.1.1 Consumer focus and collaborative planning
Consumer focus within supply chains has led businesses to focus on value creation
and this has resulted in business functions being more integrated with the mission of
3
collaboratively creating the product with the optimal value for the consumer. The
success or failure of supply chains is ultimately determined in the marketplace by the
end consumer (Christopher & Towill, 2001). Improved customer satisfaction can be
achieved in supply chains through market understanding. Businesses have the
objective of achieving the best performance from their supply chains through
different tools and strategies, which include accurate demand forecasting, inventory
and agile supply chain as the major components (You & Grossmann, 2008).
The value of collaboration in the business forecasting process cannot be understated
(Mael, 2011). The central focus of intra-firm and inter-firm collaboration is to achieve
the optimal service for the customer. This necessitates the sharing of information
and achieves full advantage of information sharing; as a result companies may need
to redesign their processes and facilities (Bowersox, Closs & Stank, 2000). A smooth
information flow from the front-end customer interaction back into production is
necessary, but on its own is insufficient. The required response action needs to be
determined and executed well to match the needs identified from the shared
information (Jüttner et al., 2007).
Collaboration to create optimal customer value has crossed business boundaries
resulting in inter-firm collaboration within the same supply chain, the product of this
being ‘integrated supply chains’. A key feature that has developed over time is the
idea that it is supply chains that compete, not companies (Christopher & Towill,
2001). The growing trend towards integrated supply chains shows the leveraged
benefits of businesses collaborating to attain the same goals (Bowersox et al.,
2000:4). Cooperative planning between trading partners facilitates better matching of
supply and demand. Partners within supply chains have moved from the tendency of
independently determining forecast to a practice of collaborating to develop realistic,
informed and detailed estimates that can be used to guide business operations
(Stank, Daugherty & Autry, 1999).
1.1.2 Demand forecasting and demand planning
Demand forecasting can be seen as a series of steps to establish the amount of
product and related information that consumers will need in the future, be it in the
short or long term (Pienaar & Vogt, 2012).The forecasting of how much future

4
demand there will be is a necessary activity within supply chains, and provides
vendors and manufacturers with the idea of how much inventory they should pre-
stock. Demand forecast establishes the volume of products, place and time horizon
in which they will be needed (Vlckova & Patak, 2010).
Demand forecasting and the subsequent setting of inventory levels is a complex task
due to the effect of promotions, changing demand patterns and competitive
pressures (Stank et al., 1999:76). There are therefore many factors to consider when
carrying out the process of forecasting and this includes both qualitative and
quantitative factors. Changes in market dynamics have brought many changes to the
forecasting strategy, one particular way being that the increased power of the
consumer has led the process of forecasting to become more demand driven and
less supply driven. Focus is more on demand pull rather than demand push
(Christopher & Towill, 2001).
A more specific activity in business collaborative planning, which is a development of
demand forecasting, is demand planning. Demand planning represents a set of
methodologies and information technologies for the use of demand forecasts in the
process of planning (Vlckova & Patak, 2010:1119). Vlckova and Patak (2010:1121)
state that different steps can be followed in demand planning and the demand
planning method of the company can be divided into six steps:
Understand essential forecast principles
Integrate systems for forecasting and planning
Identify key factors influencing the demand level
Identify and understand customer segments
Select appropriate forecasting techniques
Build a system for measuring performance and error rate of forecasts.
Demand planning is the key driver of the supply chain. Without knowledge of
demand, manufacturing has very little on which to develop production and inventory
plans for products among different warehouses and customers (Pienaar & Vogt,
2012). Overall, a demand-oriented approach to planning can greatly enhance
demand planning and improve overall costs and customer service efforts. Accurate
demand planning provides several benefits, for example, it allows manufacturing to
5
delay production of anticipatory stock. Furthermore, it can result in shorter, more
predictable order cycles for the retailer (Stank et al., 1999:82).
1.1.3 Point-of-sale data in demand planning
The usefulness of demand planning depends largely on the data and information
flows used in forecasting and planning (Andres, 2008). The key data needed for
supply chain planning at the retail level are the actual sales to consumers at each
retail outlet, which is called point of sale (POS) data. Of the three data streams,
namely shipment data, customer order and POS, POS is the best; this is because it
is free from order and demand variability and inventory decisions. Inventory
decisions can hide the underlying sales trend (Borgos, 2008).
POS data are the data of sales to end consumers – sale transactions recorded or
captured at the checkout counter. When a customer purchases a product, the teller
scans the product and that generates a till slip but beyond that, information is
recorded into the database. The recorded information contains the detail such as
place of purchase, product price, date and time of purchase (Andres, 2008). With the
present-day use of electronic cash registers, it has become possible to capture data
on individual retail transactions and store them in databases for subsequent analysis
(Borgos, 2008).
1.1.4 The South African clothing industry
The South African clothing industry is not an exception to the global phenomenon of
high competition; it has a complex set of dynamic linkages of value chains between
the producers and the retail outlets. ‘The South African domestic clothing market is
also similar in that it is dominated by a powerful retail sector whose market power
effectively subordinates the producers’ (Nattrass & Seekings, 2012). ‘The strong
impact of globalisation and delocalisation in the organisation of work is pressurising
the industry in terms of its competitiveness. Global competitiveness in terms of
quality, price and supply chain management are reducing the viability of the industry’
(Kruger & Ramdass, 2011:2562).
The South African clothing industry has large retail outlets. ‘Their products are
obtained from a range of sources such as China, low-wage producers in non-metro
6
South Africa and neighbouring countries’ (Nattrass & Seekings, 2012:20). Business
Partners (2014) claim that ‘In 2013, the Clothing, Textiles, Footwear and Leather
(CTFL) industry accounted for about 14% of manufacturing employment and
represented South Africa’s second largest source of tax revenue. The industry
contributes around 8% to the country’s gross domestic product (GDP)’.
For retail clothing business, present market changes and volatility require more
product variety, which generates demand uncertainty and supplier variability.
Managers are faced with great challenges with respect to supplier management,
product forecasting, inventory management, timely distribution and customer
satisfaction (Wu, 2004).
With the clothing industry making a significant contribution to GDP and employment
in South Africa, the topics of efficiency and customer service effectiveness become
more critical. This is substantiated by the fact that customers are the drivers of this
market and its profitability. As the industry is faced with high levels of demand
uncertainty, it is therefore necessary to delve into the subject of improving demand
plans and forecasts through the usage of POS data.
1.2 Definition of the problem statement
With high levels of demand volatility and difficult demand predictability experienced
in various consumer markets, the purpose and value of demand planning comes into
question. Because of this high level of volatility, figures of past performance in sales
quickly become obsolete and thus are not viable for use in forecasting future
demand. Businesses are faced with different inconsistencies that disturb customer
demand patterns and these inconsistencies range from financial to physical
constraints. As a result, the challenge of the transformation of historical sales
performance into a demand forecast for future activity is not sufficient to forecast
future events (Mael, 2011).
Supply chains today are complex and characterised by a high level of member
interdependencies which necessitates collaboration to reduce pressure from the
market. Businesses are facing pressures such as on-time-to-market, mass
customisation, lead-time extensions, capacity inflexibilities, and pressures on
7
working capital (Fay, 2010:32). It is therefore important for business to monitor the
factors that cause demand volatility and act proactively as volatility can completely
destabilise the supply chain (Mael, 2011).
Demand is a function of different factors; demand planning seeks to put these factors
in perspective and use them to determine the most likely demand patterns. These
factors are numerous and of these, some can be quantified, for example the inflation
rate, and some cannot, for example seasonality. This demonstrates that the process
of demand planning is not an easy task. Beyond predicting and estimating future
demand, demand planning seeks to influence demand with the intention of meeting
the sales and profit objectives. This presents a greater challenge as it may involve
influencing the factors that affect demand.
POS data is said to present the best reflection of customer demand over other types
of information like shipment data or orders received from retailers. These other types
of information tend to perpetuate backorders since stock-outs distort the shipment
history. Furthermore, visibility into true consumer demand is lost as there is a time
lag between shipments to the store and when POS occur. There is need, therefore,
for businesses to collect and use POS in their process of demand planning (Tolbert,
2008).
In the context of this study, the clothing retail industry can be said to be one of the
most complex markets for the demand planner due to its nature and the ever-
changing tastes, preferences and fashion trends. The attempt to align demand to
meet sales objectives is further complicated by the abstract definition of fashion
trends and the fact that one firm has little leverage in influencing market trends. POS
data is one tool in particular that retailers in this industry can potentially leverage in
order to deal with the predicament of high demand uncertainty.
The problem is that amid the ever-increasing importance and need for accuracy in
demand planning and the complexity of consumer markets, there is lack of
information and uncertainty about the use of POS data by South African clothing
retail firms in demand planning.

8
1.3 Motivation and delineation of the study
Timely information is one of the most valuable assets that firms possess, hence the
term knowledge asset management. The study focuses on POS data, which is one
of the types of information most valued by firms within consumer-driven supply
chains. The study should be able to assist supply chain members to leverage this
type of data to predict consumer demand and market trends, and so potentially gain
competitive advantage. Beyond this, the study will also compare the South African
demand planning methods and information management tools with those used by
the rest of the global competitors and recommend any necessary changes and
developments that can be made.
In the present day of complex economies and volatile markets such as pertain to the
clothing industry, information sharing has become inevitable among different supply
chain members. The study investigates the multi-directional flow of information,
which is upstream and downstream in supply chains, which should allow the
identification of the various information needs at each level of the supply chain and
how the information flows can be made more effective.
The study investigates current demand planning tools as practically used in the
supply chain. This investigation of the various methods allows deductions to be
made on the most useful tools in modern consumer markets. Furthermore, the study
identifies the information requirements for the effective use of these demand
planning tools. This allows all members in the respective supply chains to have the
same prioritisation in information disclosure and provision.
Research findings add value to the body of knowledge, no matter the how minute the
discovery is. In the same way, the findings of this study add more information to the
body of knowledge specifically in the field of SCM and demand planning.
The results of the study assist in providing further insight into the usefulness of POS
data in demand planning and bring to light the extent of the use of POS data in
demand planning by South African retail companies. From the literature review, it
appears that little research has been done on the usage of point of sale (POS) data
in demand planning within the South African clothing retail industry. This study seeks
to solve this problem.
9
1.4 Research questions
1.4.1 Main question
• To what extent do firms in the South African clothing industry use point-of-sale
data in demand planning and how can the use of point-of-sale data be
increased?
1.4.2 Investigative questions
• How is demand planning performed in the South African clothing retail
industry?
• What systems are employed for the collection and dissemination of point-of-
sale data in the South African clothing industry?
• How is point-of-sale data used in the demand planning process in the South
African clothing industry?
• How can the use of point-of-sale data be improved or enhance in demand
planning?
• What challenges and problems are faced by South African clothing retailers in
the collection, dissemination and usage of point-of-sale data in demand
planning?
1.5 Objectives of the study
The objectives of the study are as follows
1.5.1 Primary objective
• To determine the extent to which businesses in the South African clothing
retail industry use point-of-sale data in demand planning
1.5.2 Secondary objectives
• To determine the nature of the demand planning process as performed in the
South African clothing retail industry
10
• To determine the systems employed for the collection and dissemination of
point-of-sale data in the South African clothing industry
• To determine the way point-of-sale data is used in the demand planning
process within the South African clothing industry
• To determine ways improving the usage of point-of-sale data in demand
planning in a South African clothing retail context
• To find out the challenges and problems that are faced by South African
clothing retailers in the collection, dissemination and usage of point-of-sale
data in demand planning
1.6 Limitations of the study
The research findings and conclusions drawn will be based on the data collected
from the samples. The limitation associated with purposive sampling in this case is
that the sample may not be the best representation of the population thus results
cannot be generalised. However, the study is based on major clothing retailers and
consequently various industry players can benefit from the study by benchmarking
themselves to described practices and drawing valuable lessons.
Identification of businesses that form part of the sampling frame will be from memos
from associations under which these businesses are registered, for example, the
National Clothing Retail Federation of South Africa (NCRF). This could be a
limitation as not all companies are registered under these associations. However, the
companies registered with these associations form a major part of the South African
clothing retail industry.
1.7 Research methodology
A further literature review was done to define and describe the theoretical constructs
as well as to determine existing research on the subject matter to enable the
identification of the research gaps. Different types of literature were used including
journal articles, government reports, company documents and textbooks.
Qualitative research was done using face-to-face interviews to collect information on
the practice of demand planning as performed by demand planners in the South
African clothing retail industry, and the extent to which POS data is used in the
11
demand planning process. The collected information was thematically analysed
following the grounded theory approach to draw conclusions and recommendations.
1.8 Study outline
The study is set out as follows:
1.8.1 Chapter 2: Demand planning and the significance of POS data
This chapter describes the fundamental concepts that form part of the subject under
study. Existing views by other authors and researchers are presented and described.
It specifically addresses the process of demand planning and the POS data concept.
Covered in this is the role of demand planning in supply chains, the role of POS in
demand planning, the clothing industry and its contribution to effective demand
planning, and the South African clothing industry.
1.8.2 Chapter 3: The South African clothing retail industry
This chapter describes the South African clothing retail industry in detail. The nature,
structure and performance of the industry is discussed. A comparison is made
between local clothing supply chains and global clothing supply chains. Also
discussed is this chapter is the importance of effective SCM and effective demand
planning in this type of industry.
1.8.3 Chapter 4: Research methodology
The various aspects of the chosen research methodology including the research
approach, research design, sampling, and the data collection tool is discussed in this
chapter. The selection of the interview respondents is also discussed.
1.8.4 Chapter 5: Research findings
This chapter presents, describes and analyses the findings that are be made from
the primary data collected through the interviews. The data analysis procedure and
the results are discussed.

12
1.8.5 Chapter 6: Interpretation, conclusions and recommendations
This chapter makes interpretations, draws conclusions and makes recommendations
based on the findings made in Chapter 5. A discussion follows to show achievement
of the research objectives and to identify the areas for potential future research.
13
14
CHAPTER 2: DEMAND PLANNING AND THE SIGNIFICANCE OF POS DATA
2.1 Introduction
This chapter serves to describe and explain various concepts and issues
relevant to the study. Existing definitions, descriptions and claims from different
literature sources on the subject under study are discussed. The discussion
deals with the concept and role of demand planning in supply chains, the role of
POS within demand planning and its contribution to effective demand planning in
the South African clothing retail industry.
2.2 The concept of demand planning
There are several activities and processes that constitute supply chain management.
These SCM activities fall under three groupings, namely sourcing and procurement,
conversion, and logistics management (Pienaar & Vogt, 2012). The focus of this
study is on demand planning which falls under the grouping of logistics
management. Demand planning as an SCM activity is the process of using demand
forecasts to plan the supply chain response to meet the expected demand (Vlckova
& Patak, 2010).
‘Demand planning is a supply chain activity that uses sales forecast as one of
multiple inputs to create a demand plan aligned with financial goals and
inventory plans’ (PWC, 2012:2).
Viewing the process of demand planning as part of SCM emanates from the
cascading downwards of SCM-related processes. According to Pienaar and Vogt
(2012), demand planning is a logistics management activity; and logistics
management is by nature a part of the SCM concept. The descriptions by the
Council of Supply Chain Management Professionals (CSCMP) of supply chain
management and logistics management show how logistics management is related
to supply chain management and how demand planning is a logistics activity.
15
‘Supply chain management encompasses the planning and management of
all activities involved in sourcing and procurement, conversion, and all
logistics management activities’ (CSCMP, 2015).
‘Logistics management activities typically include inbound and outbound
transportation management, fleet management, warehousing, materials
handling, order fulfilment, logistics network design, inventory management,
supply/demand planning, and management of third party logistics services
providers’ (CSCMP, 2015).
From the descriptions above, the relationship between SCM, logistics management
and demand planning can be illustrated by Figure 2.1 below:
Figure 2.1: Relationship of supply chain, logistics and demand planning Source: Researcher’s illustration
A concept closely linked to demand planning is demand forecasting. For most
businesses demand forecasting is based on the mathematical extrapolation of prior
demand values into the future on the supposition that future demand will follow the
same patterns as in the past (Thomopoulos, 2015). While demand forecasting is
concerned with determining the quantities of a product that consumers will require in
the future, demand planning goes beyond this objective and challenges forecasts,
and seeks chances to grow customer demand through marketing events and
promotions to influence the forecasts to conform to the company strategy and
objectives (Blanchard, 2010).
Demand planning requires information input and insight contributions from different
functions of the business. The demand planning process is not performed on a silo
Supply Chain Management
Logistics Management
Demand Planning
16
basis or in isolation but involves a considerable amount of collaboration with other
departments including supply chain, sales, finance, marketing, operations and
consumer insights (Gallucci, 2015).
The output of demand planning has an impact on the various functions of the
business and thus it is expedient to involve these functions from the planning phase.
Representatives from the different organisational functions should be involved in the
demand planning process. To make the forecasts objective, the practice requires an
integration of numerous unbiased experts for obtaining required forecasts (Vlckova &
Patak, 2010:1121).
2.3 Demand planning in supply chains
This section is aimed at illustrating the need for effective demand planning and the
benefits that a supply chain can gain from its successful performance.
2.3.1 The need for demand planning
Businesses need to make a conscientious effort to understand the demand patterns
and consumer behaviour for their products or services; this will allow the design of
the appropriate response in supply to meet the expected demand. Consumer
demand presents multiple characteristics that businesses need to monitor and
understand, including seasonality, trend and degree of volatility. A white paper by
Hitachi Consulting (2009:1) identifies demand planning as one of the six key trends
causing a great impact on and transformation of the design of the supply chain and
the performance thereof.
Being able to predict and meet customer and consumer demand is a prerequisite for
any successful profitable business or supply chain. Companies therefore devote
substantial time, funds and effort in their pursuit of projecting demand so that
products can be available when and where they are needed (Lawless, 2014). The
complexity of present day consumer markets and the volatility of consumer demand
should be a great motivation for consumer-focused supply chains. Demand planning
presents a good opportunity for supply chain to focus on the consumer and create
optimal value. Having a demand-driven approach could assist members of the
supply chain to develop a customer-focused mind-set (Hitachi Consulting, 2009).
17
Supply chains are designed to suit the needs of the consumers. When the supply
chain is aligned to the consumer’s needs, every supply process works towards and
contributes to the same objective, thus creating optimal value for the consumer.
Bursa (2008:28) states that ‘the demand driven supply chain is a powerful weapon
for businesses of all sizes’, as companies are faced with dynamic market swings,
volatile fuel prices, unpredictable consumers, and high levels of global competition.
Demand planning allows businesses to understand the nature of consumer demand
and ensures that the supply response is suited to this demand. Failure to understand
the nature of demand for the business’s products results in a mismatch between
demand and supply; this could be an oversupply or a product shortage. The
mismatch causes the following efficiency and effectiveness problems:
Excess inventory due to low demand for the supplied product
Stock-outs due to low product supply and high demand
1. Excess inventory due to low demand for the supplied product
The lack of visibility of consumer demand or the existence of inaccurate demand
forecasts may result in overstocking at different points of the supply chain.
Inaccurate demand forecasts and lack of visibility in the supply chain leads to
overstocking as orders are amplified to guard against stock-outs. This continued
amplification of orders to prevent against stock-out results in high order and demand
variability. The increase in demand variability as one moves upstream of the supply
chain results in a phenomenon termed the bullwhip effect. Figure 2.2 below
illustrates this phenomenon.
18
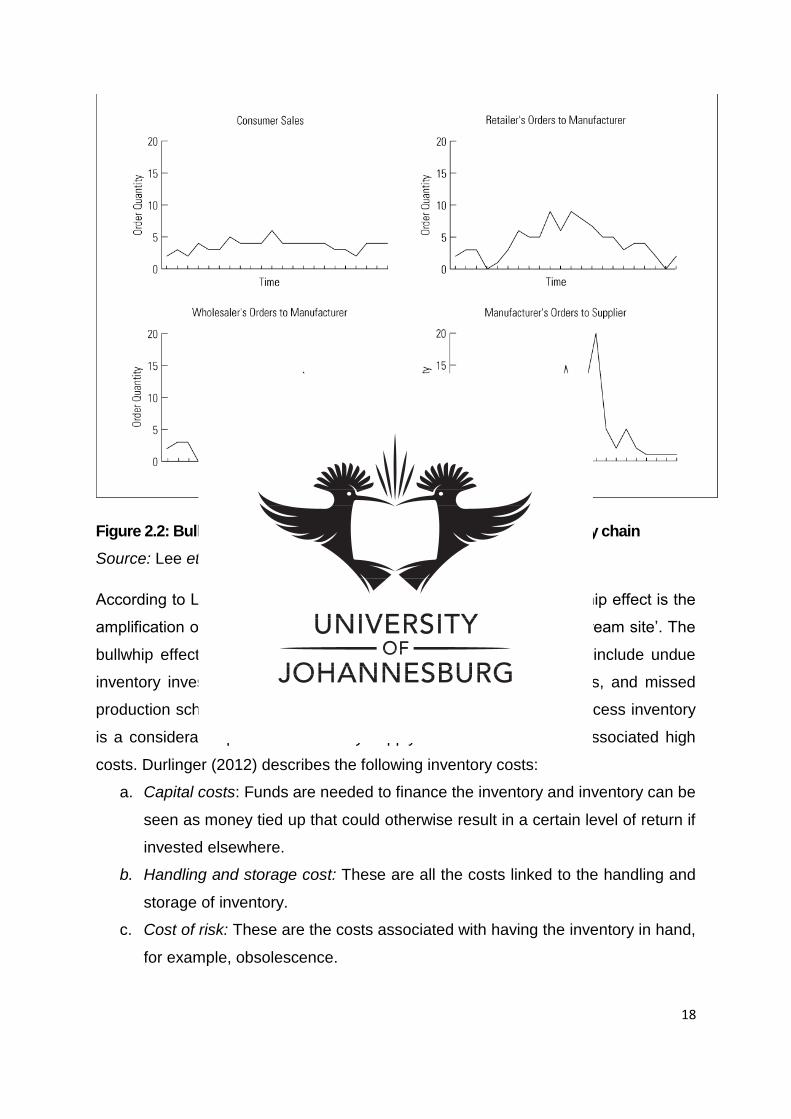
Figure 2.2: Bullwhip effect – increased variability of orders up the supply chain Source: Lee et al. (2004:1888)
According to Lee, Padmanabhan and Whang (2004:1887), ‘the bullwhip effect is the
amplification of demand variability from a downstream site to an upstream site’. The
bullwhip effect leads to tremendous supply chain inefficiencies that include undue
inventory investment, misguided capacity plans, poor transport plans, and missed
production schedules (Lee et al., 2004). It is important to note that excess inventory
is a considerable problem within any supply chain because of the associated high
costs. Durlinger (2012) describes the following inventory costs:
a. Capital costs: Funds are needed to finance the inventory and inventory can be
seen as money tied up that could otherwise result in a certain level of return if
invested elsewhere.
b. Handling and storage cost: These are all the costs linked to the handling and
storage of inventory.
c. Cost of risk: These are the costs associated with having the inventory in hand,
for example, obsolescence.
19
d. Reverse logistics costs owing to market rejected products: Unsold stock might
have to be moved back upstream in the supply chain to open shelf space for
other products.
2. Stock-outs due to low product supply and high demand
The other side of the coin to excess inventory is a stock-out. A stock-out results
when the ordered product or demand is greater than the available product or supply.
Like in the case of excess inventory, inaccurate demand forecasts and lack of
demand visibility may lead to inventory stock-outs. Understated demand forecasts
result in inventory shortage. Stock-outs are also associated certain costs, including:
a. Back order costs
When an order is placed and the available stock is not able to meet the order
requirements, the supplier will have to fulfil the unfulfilled part of the order at a
later time – this termed a back order. The cost of a back order would therefore
include the extra expense of handling and expediting orders that cannot be
fulfilled from the available stock (Pienaar & Vogt, 2012).
b. Cost of a lost sale
When an order cannot be readily met by a supplier, the customer may source
the product from another supplier, resulting in a lost sale. Pienaar and Vogt
(2012:215) state that ‘these costs can be measured in terms of the
contribution that is lost on that particular sale’.
c. Cost of a lost customer
Failure to meet the customer’s orders, especially if it persists, often results in
a customer permanently sourcing the product from other suppliers – the cost
of a lost customer. Congruent to the case of a lost sale would be the profit or
contribution that would have been gained from the orders that the customer
was going to place in the future (Pienaar & Vogt, 2012).
As a way of avoiding these costs, supply chain members have over time adopted
collaboration as a solution. Through different collaboration approaches and
initiatives, supply chain members aggressively work together to manage inventory.
‘The value of collaborative demand and supply planning between partners can be
understood through improved operational, financial benefits, process and
20
relationship benefits’ (Shepard, 2012:6). Instead of independently trying to estimate
demand patterns, supply chain members share information ahead of time and
collaborate to develop realistic, more accurate, informed and detailed estimates that
can be a guide to supply chain operations (Shepard, 2012).
2.3.2 Collaboration and information sharing in demand planning
Demand forecasts and demand plans have a direct impact on the objectives,
operations and tasks performed in the supply chain, from the sourcing and
procurement function to the final product distribution function. These different parts
of the supply chain are affected in the sense that the output from the process of
demand planning forms the basis of their objectives, which ultimately is to satisfy the
expected or planned demand.
In today’s volatile and complex state of consumer markets, if supply chains move
forward without a clear insight and a collaborative set of objectives and directions,
they will be faced with a high level of customer dissatisfaction, increased cost and
obsolescence, and ultimately a loss of revenue and market share (Fay 2010:32).
Consensus forecasting becomes necessary to be able to overlay judgement over the
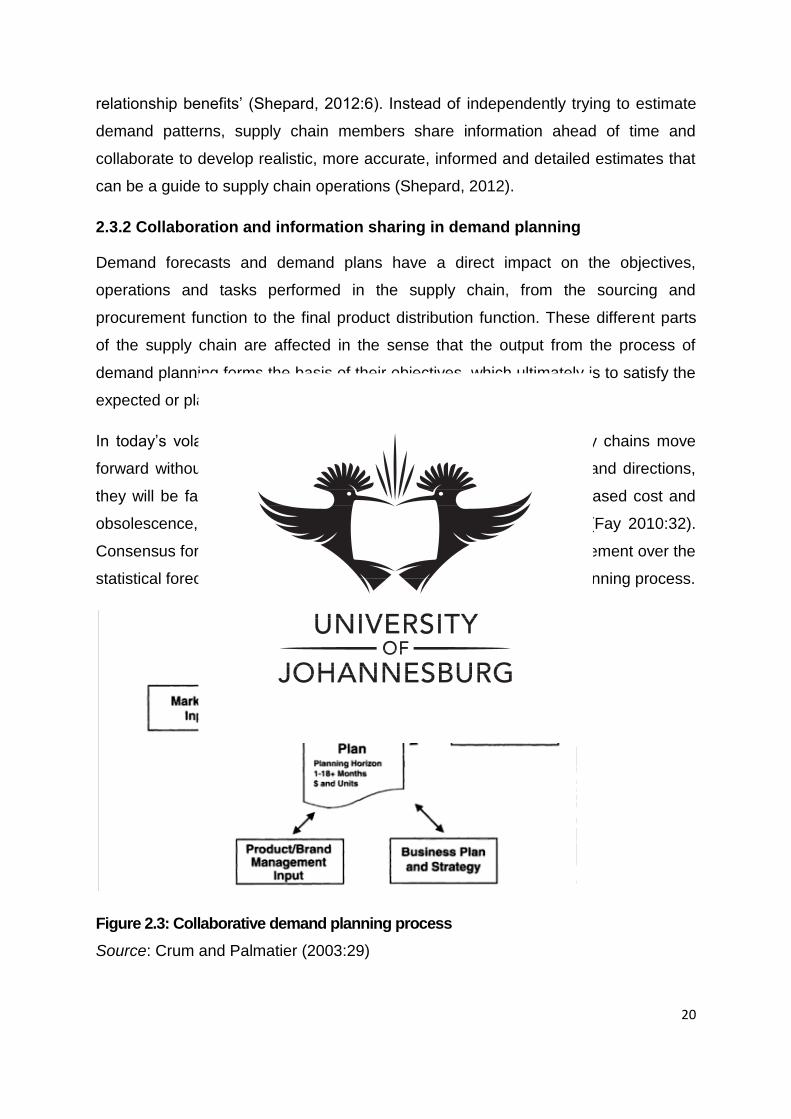
statistical forecasts. Figure 2.3 illustrates the collaborative demand planning process.
Figure 2.3: Collaborative demand planning process Source: Crum and Palmatier (2003:29)
21
The impact of these demand plans on different business functions brings into focus
the need to involve them from the beginning. Submitting arbitrary demand plans to
different members of the supply chain without involving them in the actual planning
process or without requesting their input can be catastrophic. This could be due to
one of the following major reasons:
Demand is dependent on many causal factors and thus a failure to integrate
these factors into the demand plan results in uninformed and highly
inaccurate forecasts and demand plans (Stank, Daugherty & Autry, 1999:76).
To improve forecasts, there is a need for cross-functional collaboration
because no one has all the information.
The motivation to adopt and implement demand plans by the rest of the
supply chain members largely depends on their involvement in the
development of these plans. Thus, plans that are developed by only one
member of the supply chain will not be quickly adopted by the rest of the
supply chain members (Shepard, 2012).
Based on available historical data, demand planners can mathematically determine
the demand forecast by using different forecasting techniques that already exist.
These statistical forecasts provide a solid foundation with which to work; however,
these forecasts will be highly inaccurate if other demand causal factors are not
factored in. Forecasts will be more valuable after the overlaying of knowledge that
systems cannot possibly know (Blanchard, 2010). Businesses in the supply chain
need to ‘deploy internal collaboration before external collaboration, recognising that
the closer you get to the true demand signal, the better the forecast will be’
(Blanchard, 2010:54).
Collaboration needs to be between the supply chain members as well as between
the different functions of the businesses within the supply chain. This will ensure that
the benefits of collaboration realised within the supply chain are also realised within
each supply partner’s organisation. Demand planning should be viewed as a sub-
activity to the overall sales and operations planning instead of a rather than a
separate unconnected activity. Businesses in the supply chain should “build an
integrated business plan that is a cross-company activity and which directs the rest
22
of the business forward for profitably meeting customer demand” (Blanchard,
2010:54).
Information sharing within the supply chain is a prerequisite to ensuring demand
visibility and ensuring effective demand planning. Demand visibility entails being able
to see undistorted and accurate demand such that there will be enough time to
respond to it. Schrieber (2005) contends that, the more visible the demand, the
better the chance of accurate demand forecasts. Visibility does not only imply the
ability to track inventories and materials in the supply chain but also that information
regarding available resources can be effectively evaluated and managed.
Different information sharing models exist and these include product information
sharing, process information sharing, resource information sharing and inventory
information sharing (Ma, Wang, Che, Huang & Xu, 2013). Ma et al. (2013) further
state that, despite the information-sharing model used, information sharing generally
results in a reduction of the magnitude of the bullwhip effect as there will be reduced
information distortion.
Different forms of collaborative initiatives exist and these can be implemented to
ensure that all the relevant members of the supply chain are involved in demand
planning. The following section discusses how some of these initiatives can facilitate
collaboration in demand planning:
Collaborative planning, forecasting, and replenishment (CPFR)
Vendor managed inventory (VMI)
Automatic replenishment programs (ARP)
1. Collaborative planning, forecasting, and replenishment (CPFR)
CPFR is, as the name says, a collaboration strategy where all supply chain members
are involved in the planning, forecasting and replenishment of materials and
information. CPFR is formally defined by The American Production and Inventory
Control Society (APICS) as:
23
‘A collaboration process whereby supply chain trading partners can jointly
plan key supply chain activities from production and delivery of raw materials
to production and delivery of final products to end customers.’
Dong, Huang, Sinha and Xu (2014) provide a CPFR model, illustrated in Figure 2.4,
which shows the involvement of different supply chain members in the planning and
replenishment processes.
Figure 2.4: CPFR model Source: Dong, Huang, Sinha and Xu (2014:248)
Forecasting demand is a challenging task as a result of the influence of promotions,
volatile consumer buying patterns, and competitive pressures (Shepard, 2012).
Different members of the supply chain possess different sets of information, each of
which is vital to the process of demand planning. Each partner has knowledge of the
causal factors contributing to demand levels. As such CPFR allows supply chain
members to have access and visibility to a single forecast value and also ensures
that all supply chain links can contribute their knowledge of causal factors (Ireland &
Crum, 2005). Over and above the improved visibility and forecast accuracy, CPFR
also yields the following benefits:
Supply chain relationships are strengthened
Problems can be identified and eliminated proactively
24
Further collaboration on future plans is promoted
Key performance metrics can be analysed
It allows supply chain members to better understand the consumer buying
behaviour (Ireland & Crum, 2005).
2. Vendor managed inventory (VMI)
This is a collaborative strategy that requires a great deal of downstream supply chain
visibility and information sharing between the retailer and the supplier of the
concerned products. VMI is a technique that was developed in the mid-1980s, and
rests the responsibility of inventory policy management as well as the replenishment
process on the product supplier (Barratt & Oliveira, 2001). This collaborative strategy
is only appropriate when there is trust and extensive information sharing between the
retailer and the supplier (Barratt & Oliveira, 2001). An effective VMI program will
enable the supplier to move products to the customer when the POS stock level
prompts a replenishment order (Tolbert, 2008).
3. Automatic replenishment programs (ARP)
This collaborative initiative is closely linked to the VMI initiative with regard to the
extent of downstream supply chain visibility. With ARP, the actual product needs at
the retailer’s point triggers the inventory restocking rather depending on long-term
forecast and layers of safety stock (Stank, Daugherty & Autry, 1999).
2.4 The process of demand planning
Different authors and researchers propose a variety of methodologies to be followed
in the process of demand planning; however, a recent approach proposed by Loretto
(2014) suggests that, to achieve effective demand planning, the steps depicted in
Figure 2.5 should be adopted.
25
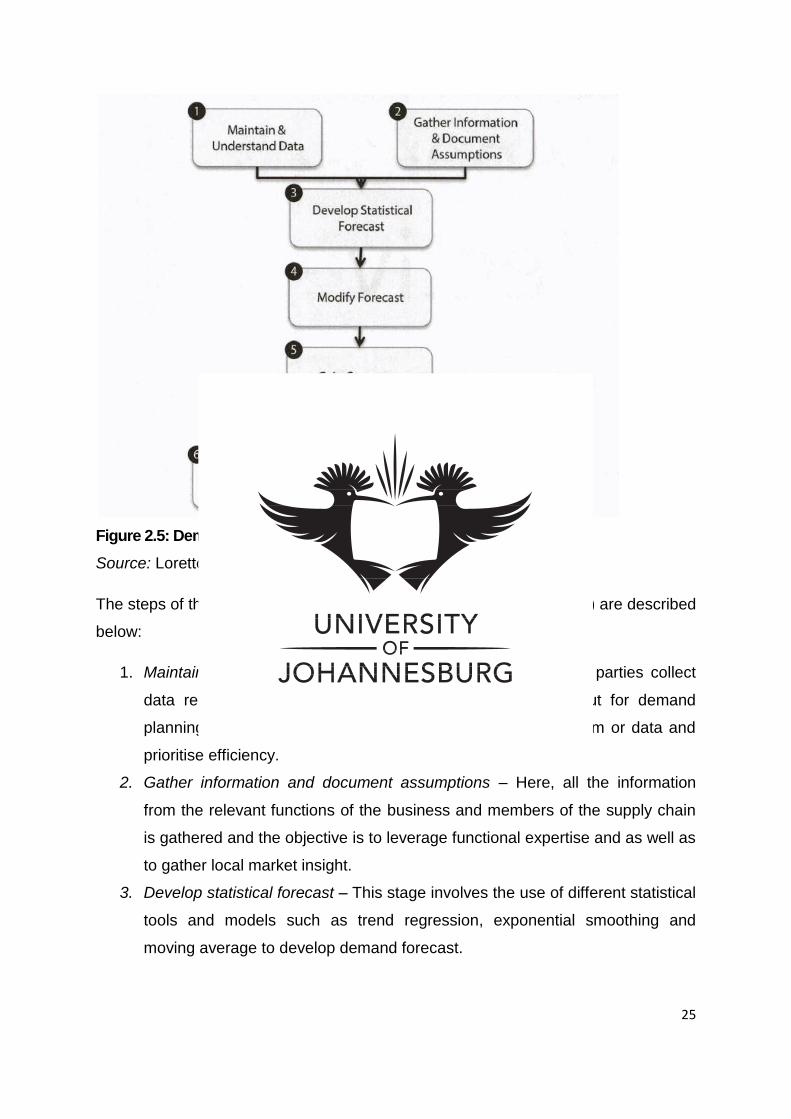
Figure 2.5: Demand planning process Source: Loretto (2014:6)
The steps of the demand planning process proposed by Loretto (2014) are described
below:
1. Maintain and understand data – At this stage, all concerned parties collect
data relevant to their function that will be provided as input for demand
planning. Here the objective is to leverage expertise on system or data and
prioritise efficiency.
2. Gather information and document assumptions – Here, all the information
from the relevant functions of the business and members of the supply chain
is gathered and the objective is to leverage functional expertise and as well as
to gather local market insight.
3. Develop statistical forecast – This stage involves the use of different statistical
tools and models such as trend regression, exponential smoothing and
moving average to develop demand forecast.
26
4. Modify forecast – After developing statistical forecasts, it is always necessary
to modify the forecast through judgement overlay. This involves the factoring-
in of the non-quantifiable factors that influence demand, then making the
necessary modifications.
5. Gain consensus – Having modified the initial statistical forecast, the parties
involved need to reach consensus on the final demand forecast. Different
insights are gained from the parties and the demand forecast is finalised.
In demand planning, there are two elements that comprise a consensus plan,
and these are base demand and activities or circumstances where the
baseline demand is the expected demand volume of a product if there are no
promotions and no outstanding situations that affect sales. On the other hand,
‘activities’ are generated internally through marketing and sales and are
related to total trend spend.
6. Communicate forecast – The final demand forecast is communicated to the
different functions of the business as well as the supply chain members so
that they can all plan and design their respective activities with a common
objective.
7. Manage demand – This involves exerting influence on demand to meet profit
objectives. It entails utilising local market knowledge to adapt to market
nuances.
8. Measure and track performance – Based on the adopted demand forecast
and related objectives, the performance of the supply chain members is
controlled to ensure that the set goals are met. This can be done by using key
performance indicators (KPIs).
2.5 The case for POS data in demand planning
The effectiveness of demand planning can be enhanced in many ways and this
section deals with one of them that can be used to achieve this objective, namely the
use of point-of-sale (POS) data. POS-based demand planning is one of the least
utilised and often overlooked forecasting approaches yet it is highly valuable, readily
available and a good source of forecasting data and insight (Borgos, 2008). Of the
several methods at the disposal of supply chain members to improve the planning
27
processes, POS data is one of the most effective. Leveraging POS data entails
integrating it as a fundamental component rather than as extra input data (Trepte &
Narayanaswamy, 2009).
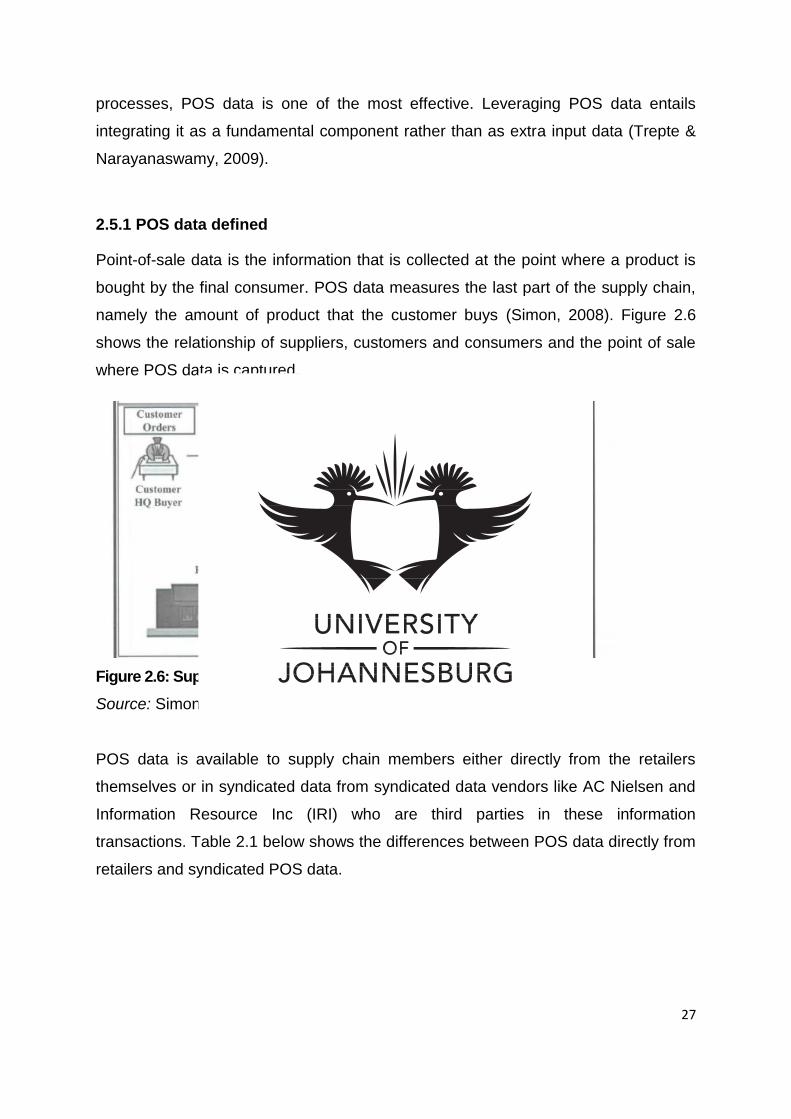
2.5.1 POS data defined
Point-of-sale data is the information that is collected at the point where a product is
bought by the final consumer. POS data measures the last part of the supply chain,
namely the amount of product that the customer buys (Simon, 2008). Figure 2.6
shows the relationship of suppliers, customers and consumers and the point of sale
where POS data is captured.
Figure 2.6: Supply chain relationships and POS data point of capture Source: Simon (2008:5)
POS data is available to supply chain members either directly from the retailers
themselves or in syndicated data from syndicated data vendors like AC Nielsen and
Information Resource Inc (IRI) who are third parties in these information
transactions. Table 2.1 below shows the differences between POS data directly from
retailers and syndicated POS data.
28
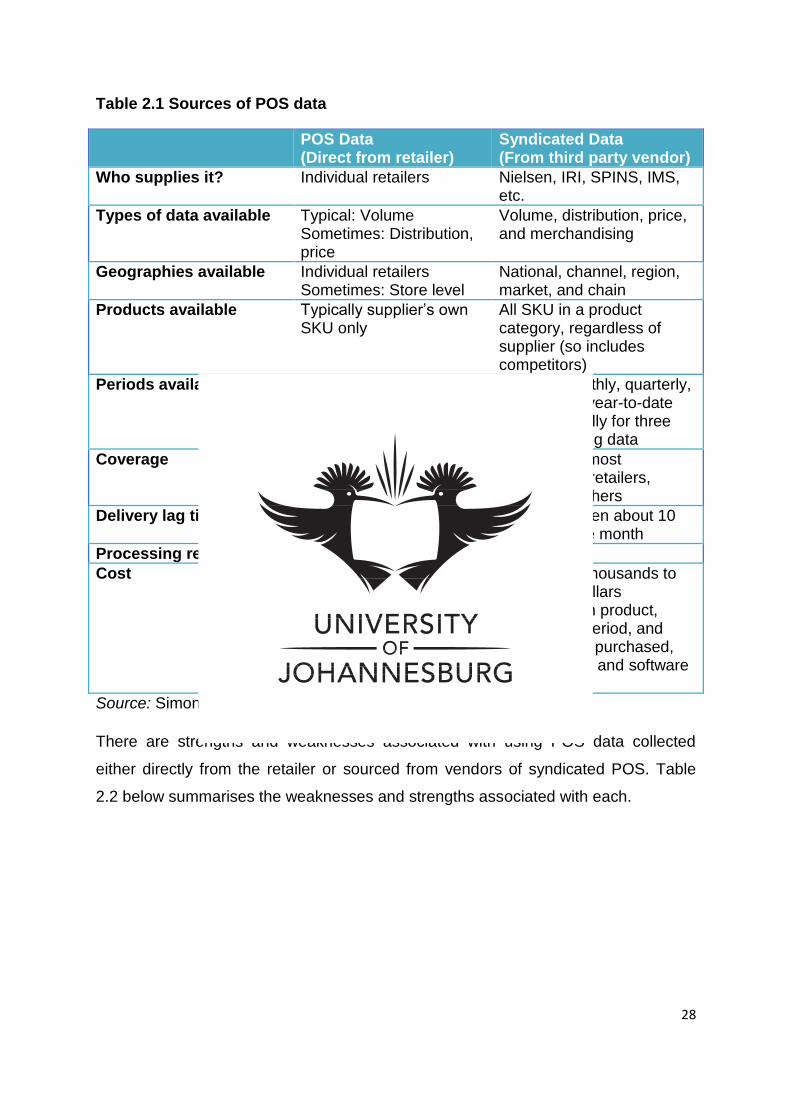
Table 2.1 Sources of POS data
POS Data (Direct from retailer)
Syndicated Data (From third party vendor)
Who supplies it? Individual retailers Nielsen, IRI, SPINS, IMS, etc.
Types of data available Typical: Volume Sometimes: Distribution, price
Volume, distribution, price, and merchandising
Geographies available Individual retailers Sometimes: Store level
National, channel, region, market, and chain
Products available Typically supplier’s own SKU only
All SKU in a product category, regardless of supplier (so includes competitors)
Periods available Varies from daily to quarterly, may contain comparisons to year ago period
Weekly, monthly, quarterly, annual, and year-to-date (YTD), typically for three years of rolling data
Coverage All stores All stores of most participating retailers, sample for others
Delivery lag time Varies between real time and one quarter
Varies between about 10 days and one month
Processing required Varies by retailer Minimal Cost Varies from $0 to
thousands of dollars Varies from thousands to millions of dollars depending on product, geography, period, and types of data purchased, delivery time, and software tools used
Source: Simon (2009:5)
There are strengths and weaknesses associated with using POS data collected
either directly from the retailer or sourced from vendors of syndicated POS. Table
2.2 below summarises the weaknesses and strengths associated with each.
29
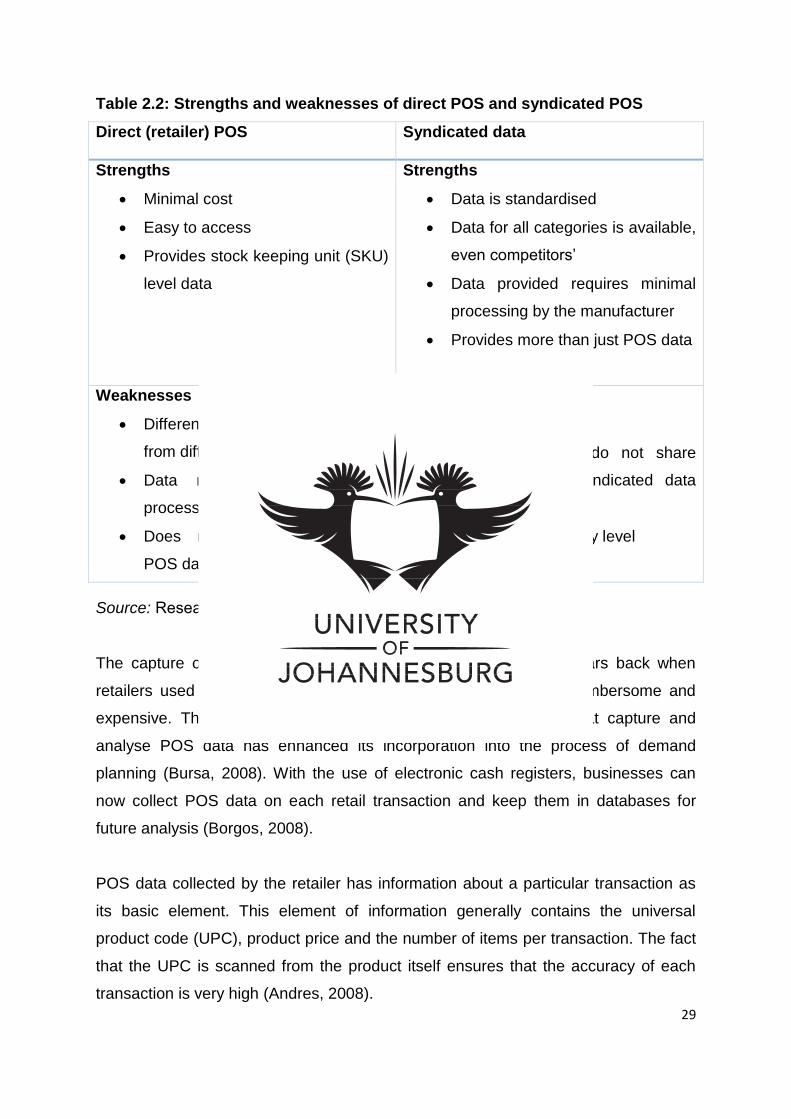
Table 2.2: Strengths and weaknesses of direct POS and syndicated POS
Direct (retailer) POS Syndicated data
Strengths
Minimal cost
Easy to access
Provides stock keeping unit (SKU)
level data
Strengths
Data is standardised
Data for all categories is available,
even competitors’
Data provided requires minimal
processing by the manufacturer
Provides more than just POS data
Weaknesses
Different standards and data fields
from different retailers
Data must be cleaned and
processed
Does not include competitors’
POS data
Weaknesses
Costly
Some customers do not share
their data with syndicated data
providers
Available in category level
Source: Researcher’s illustration
The capture of POS data today is much easier that it was 20 years back when
retailers used manual cash registers. Collecting POS data was cumbersome and
expensive. The implementation and availability of technologies that capture and
analyse POS data has enhanced its incorporation into the process of demand
planning (Bursa, 2008). With the use of electronic cash registers, businesses can
now collect POS data on each retail transaction and keep them in databases for
future analysis (Borgos, 2008).
POS data collected by the retailer has information about a particular transaction as
its basic element. This element of information generally contains the universal
product code (UPC), product price and the number of items per transaction. The fact
that the UPC is scanned from the product itself ensures that the accuracy of each
transaction is very high (Andres, 2008).
30
2.5.2 The case for POS data-based demand planning
Many researchers and industry specialists believe the potential advantage of POS
data is not being utilised to the full potential within the processes of forecasting and
demand planning (Tolbert, 2008). Although retailers are becoming increasingly
demanding, requiring improved performance from their suppliers and are willing to
share POS information, ‘only a few consumer goods manufacturers are taking full
advantage of it to improve their supply chain’ (Tolbert, 2008:33). The following
section discusses the reason supply chain members need to have POS data as an
essential input to the process of demand planning.
2.5.2.1 POS data is the best reflection of demand
Demand planners use different sets of information as inputs to their forecasts,
including previous shipments from the manufacturer’s warehouse or distribution
centre to the retailer; orders placed by customers (retailers); and POS data. Although
shipments made by the supplier are readily available in most enterprise resource
planning (ERP) systems, shipment data only reflect the supplier’s capability to
provide product shipment, not the exact retailer demand. Because of the shorter time
lag, POS data quickly reacts to fluctuations in causal factors, such as price or
weather, and thus allows the ‘determination of the parameters of the causal factors
with a high level of statistical significance’ (Andres, 2008:30).
Forecasting based on shipment figures perpetuates back orders ‘since stock-outs
distort the shipment history that is used to generate the sales forecasts’ (Tolbert,
2008:34). Suppliers need a closer monitoring of consumer demand, and leveraging
POS data is an excellent way of achieving this (Bursa: 2008). In addition, forecasting
based on orders placed by retailers to the supplier makes consumption changes
harder to detect because of the 'bullwhip effect’ that causes increased variability in
upstream order patterns (Lapide, 2005). Figure 2.7 demonstrates the differences
between orders placed and actual sales.
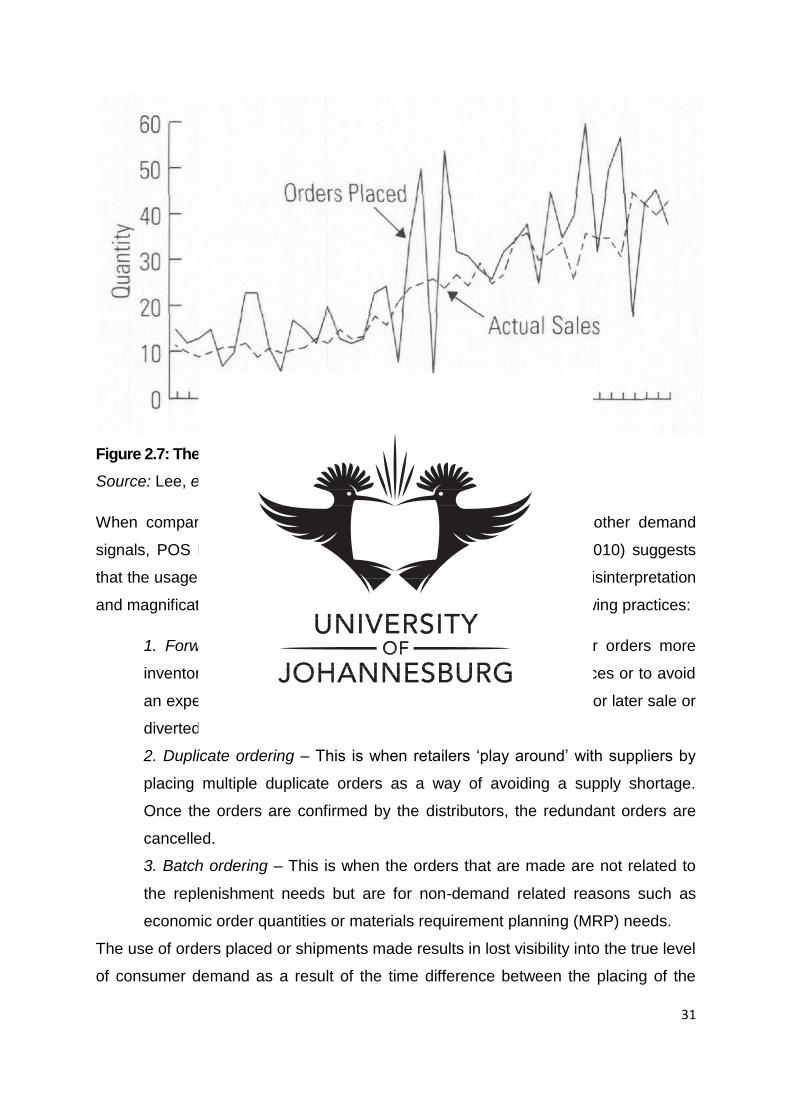
31
Figure 2.7: The discrepancies between orders placed and actual sales Source: Lee, et al. (2004:1889)
When compared to the analysis of purchase order, shipments or other demand
signals, POS has the closest alignment with real demand. Keifer (2010) suggests
that the usage of POS data shields supply chain members from the misinterpretation
and magnification of downstream demand signals created by the following practices:
1. Forward buying – This is a phenomenon where a retailer orders more
inventory than is required in order to take advantage of low prices or to avoid
an expected price increase. The excess inventory maybe held for later sale or
diverted to other locations.
2. Duplicate ordering – This is when retailers ‘play around’ with suppliers by
placing multiple duplicate orders as a way of avoiding a supply shortage.
Once the orders are confirmed by the distributors, the redundant orders are
cancelled.
3. Batch ordering – This is when the orders that are made are not related to
the replenishment needs but are for non-demand related reasons such as
economic order quantities or materials requirement planning (MRP) needs.
The use of orders placed or shipments made results in lost visibility into the true level
of consumer demand as a result of the time difference between the placing of the
32
order or shipments to the store and when points of sale occur (Lapide, 2005). In
comparison, the usage of POS data speeds up the reaction time to actual shifts in
consumer preferences (Tolbert, 2008:36). POS data is the closest representative of
the true consumer consumption of a product as it suffers minimal distortion caused
by consumer-level promotions and discounts (Lapide, 2005).
2.5.2.2 POS data improves forecast accuracy
The scanning and usage of the UPC significantly increases the accuracy of captured
information and thus the POS-based forecasts will also be more accurate. POS data
improves accuracy because scanning is far more precise than keying in numbers
from a pricing label. POS data gives a quick, near real-time look at the products
moving through a specific retail channel (Bursa, 2008). According to Bursa (2008),
supply chain members that have successfully integrated POS data into their demand
planning process have experienced increased accuracy in their demand projections,
lower inventory shortages and reduced overall costs.
2.5.2.3 POS data enhances the implementation of collaborative strategies
The usage of POS data in demand planning entails a high level of information and
coordination between members of the supply chain. It encourages the use of CPFR
and VMI programs as, with POS data, the manufacturer is no longer left predicting
when the retailer will place an order (Tolbert, 2008). Beyond providing the foundation
for the future and rationale for demand forecast, ‘POS data also helps to bring order
to the chaos in the demand planning process’ (Andres, 2008:38).
2.5.2.4 POS data is free from inventory decisions
The main strength of POS data above shipment data and/or purchase orders is that
it is not affected of inventory policies and decisions – unlike retailers, consumers
seldom make a conscious decision to grow or finish their home stock of a specific
product, ‘thus inventory decisions can hide the underlying sales trend’ (Andres,
2008:30). POS data is said to give a more accurate picture of future demand values
as it is unencumbered by inventory decisions and policies like batch sizing, shipping
quantities and lead times (Bursa 2008).
33
2.5.3 Shortfalls of POS data
Despite all the above-mentioned advantages that can be achieved by the usage of
POS data in demand planning, there are also drawbacks that are associated with it.
Some supply chains have not moved to the usage of POS data in demand planning
as their traditional planning systems are not well suited to support the use of such
data (Trepte & Narayanaswamy, 2009). Other than the issue of suitability, shortfalls
associated with using POS data in demand planning are listed below.
2.5.3.1 POS data is historical
As much as POS data provides the best signal of consumer demand when
compared to other sets of data, it is still historic in nature. Owing to this inherent
historic nature, POS data is therefore not necessarily indicative of what will occur in
the future. Demand patterns from the past will not guarantee an accurate
representation of future trends (Keifer, 2010).
2.5.3.2 POS cannot be used for new products
Naturally, there are no previous sales records for new products and as a result POS
data-based demand planning is impossible. As much as POS data provides good
reliability for post-launch replenishment cycles, it is not available to be used before
the launch when performing demand forecasts (Keifer, 2010). Nonetheless POS
data can provide an early indicator of what and how much of a product is selling; this
is important information for newly introduced products or short shelf-life products
(Bursa, 2008).
2.5.3.3 There is no single POS data format
Different retailers have different formats for their POS data and this can pose a
challenge to the supplier or manufacturer as there will be a need to process the data
to ensure it has the same format before being used in demand forecasting. Bursa
(2008), states that the format in which data is available can create problems for
demand planners as there is no single standard format, including EDI (electronic
data interchange), calendars, and selling horizons on the data from major retail
chains.
34
2.6 Frameworks for the application POS data-based demand planning
With all the above-mentioned benefits related to the integration of POS data into the
demand planning process, this last section describes two frameworks discussed by
Chase (2015) and Tribou (2010), namely the multi-tiered causal analysis framework
and the performance enhancing technique framework, respectively. These
frameworks propose the bases on how businesses can implement POS data-based
demand planning.
2.6.1 Multi-tiered causal analysis (MTCA)
MTCA is a forecasting technique that seeks to link consumer demand, which is
downstream data, to supply, which is upstream data, using a process of nesting
advanced analytical models (Chase, 2015). The downstream data would include
POS data collected directly from retailers or from syndicated data vendors like AC
Nielsen and Information Resource Inc. (IRI). Although MTCA is not a new concept,
its practice is still fairly new; technological advancements and improvements in data
collection, storage and processing all have played a huge role in its practical
adoption. The application of MTCA results in one forecast for both demand and
shipments unlike the traditional forecasting that has separate forecasts for both
(Chase, 2015).
The application of MTCA entails the execution of various ‘what-if’ scenarios in order
to influence and determine future consumer demand. MTCA links demand
(POS/syndicated scanner data) to supply (sales orders or shipments) by the use of
data and analytics (Chase, 2015). Chase (2015) also proposes a six-step process to
execute an effective MTCA procedure. This procedure shows how to apply MTCA to
sense, shape and predict demand and supply by the use of POS data or syndicated
data as well as shipment data at a large consumer packaged goods (CPG)
manufacturer. The brand manager, demand analyst and demand planner combine
their efforts in the following way: The responsibility of the brand manager is to
contribute through his knowledge of the market and its dynamics; the demand
analyst is to factor in his statistical experience and knowledge to use suitable
quantitative methods; and the demand planner is to bring in the overview and
expertise of demand and supply planning.
35
Chase (2015) proposed the steps summarised below to be followed in MTCA
process:
Step 1: Gather all the pertinent data for consumer demand and shipments.
This data includes POS data, marketing plans and periodic supply volumes.
Step 2: Build the consumer demand model using downstream data to sense
demand. Here, the demand analyst uses available POS data to arrive at
statistical consumer demand forecasts.
Step 3: Test the predictive ability of the model. This step entails
communication between the demand analyst and the brand manager to
determine the reasons for periods that lie outside the required statistical
confidence levels. Other causal variables are identified and factored into the
model.
Step 4: Refit the model using all the data.
Step 5: Run what-if scenarios to shape future demand. Here, the product
manager can shape demand by performing different ‘what-if’ simulations
using varying future values of different explanatory variables that can be
controlled.
Step 6: Link the consumer demand forecast to supply. Here the demand
analyst links the first tier (demand) to the second tier of the supply chain
(supply) through integrating consumer demand as one of the causal
(predictor) variables in the supply model.
2.6.2 POS data as a performance enhancing technique (PET)
PET is a methodology proposed by Tribou (2010) and he suggests that the use of
traditional methods in forecasting and demand planning, where forecasters use
historic order information to forecast demand, are not suitable for present-day
product characteristics. Products today are characterised by shorter life cycles; there
are now more frequent innovations, and the launch of new products. When
traditional forecasting is used on products with these new dynamic characteristics,
larger and larger forecasting errors occur (Tribou, 2010).
36
With this challenge of forecasting errors, being able to analyse inventory levels using
POS data from retailers or syndicated POS data vendors offers demand forecasters
a powerful platform for success. PET does not revolutionise the process of demand
planning but it is an evolution of the process (Tribou, 2010). The advantage of using
POS as a PET is that it is not a complex process and does not require the
installation of expensive forecasting software (Tribou, 2010).
The use of POS in demand planning forces the demand planner to understand the
sale patterns and why the actual demand varied from the plan (Tribou, 2010). Table
2.3 shows a spreadsheet of how POS data and inventory levels can be used to
determine expected demand. Each time period starts with inventory on hand
(Planned BOH); subtract from it sales, and add planned receipts to calculate the
inventory at the end of the period (Planned EOH), (which becomes the following
period's beginning on hand).
Table 2.3 Calculating expected demand from a POS plan
Source: Tribou (2010:21)
37
2.7 Conclusion
Demand planning is one of the SCM tasks; it involves the effective management of
demand and entails improving forecasts, reducing costs, minimising risk and
increasing sales profit. Demand planning includes but is not limited to forecasting.
Forecasting only has the objective of predicting future demand with the best possible
accuracy but is not concerned with the business strategy or sales objectives.
In a world where customers are the drivers of supply chains, the need to understand
customer demand has grown. This customer orientation of supply chains has led to
the increased importance of demand planning. Demand planning presents a good
opportunity for supply chains to focus on the consumer and create the optimal value.
Failure to understand and failure to predict demand can have various negative
impacts, the most serious being:
Excess inventory due to low demand for the supplied product
Stock-outs due to low product supply and high demand
Effective demand planning is not carried out as a silo process or function but it
involves all the relevant parties in the company and members of the supply chain.
The involvement of the different parties in this process ensures that all the factors or
variables that will potentially influence demand are considered and factored in
appropriately. Another motivation for this collaborative process is that supply chain
members are more likely to cooperate with the plans if they are part of their
development. Consensus demand plans are the result of this collaborative planning
process.
Authors differ on the steps to be followed in the demand planning process. One of
these (Loretto: 2014) has been discussed in this chapter and is viewed as ideal as it
includes the essentials of demand planning, which are the forecasting stage,
collaboration and information sharing.
The usage of POS data is one the proposed ways that can improve supply chain
effectiveness. POS data is the data collected at the purchase point in stores; it can
also be sourced from third-party syndicated data vendors. Various motivations exist
for the usage of POS data in demand planning, including:

38
POS data is the best reflection of demand.
POS data improves forecast accuracy.
POS data enhances the implementation of collaborative strategies.
POS data is free from inventory decisions.
Various frameworks have been developed to implement POS data-based demand
planning and in this chapter two of these frameworks were discussed namely multi-
tiered causal analysis and the performance enhancing technique.
Guided by the concepts described in this chapter, this study will aim to evaluate the
extent to which companies in the South African clothing retail industry make use of
POS data in their demand planning processes. In the next chapter, the South African
clothing retail industry is described and analysed in detail.

39
40
CHAPTER 3: THE SOUTH AFRICAN CLOTHING RETAIL INDUSTRY
3.1 Introduction
This chapter describes the industry relevant to this study, namely the clothing retail
industry and more specifically the South African clothing retail industry. The nature,
structure and performance of the industry is discussed. A comparison is made
between South African clothing supply chains and global clothing supply chains.
Lastly the chapter discusses the importance of effective supply chain management
and effective demand planning in this type of industry.
3.2 The clothing industry
Over the two past centuries, the clothing industry has made a major contribution to
the industrialisation process and it continues to play a crucial role in the economic
and social development of most countries (Palpacuer, Gibbon & Thomsen, 2005).
The focus of this study, which concerns POS data-based demand planning, is
relevant in this industry because it plays an important role in the supply chain. In this
regard, Caniato, Caridi, Castelli and Luca (2008:65) state that:
‘Supply chain management has become a critical issue in fashion markets
because high standards can and must be maintained throughout the supply
chain, from production, to the distribution, to the retail stores.’
The clothing or apparel industry includes businesses that design and sell clothing,
footwear and accessories. Over and above the manufacturers, the industry used to
have intermediaries who would design and source clothing items which would then
be sold to retailers (Moisanen, 2014). However, in the present day, the distinguishing
between wholesalers and retailers in this sector has become more difficult as more
firms in the sector own both froms of operations (Moisanen, 2014). In this study, the
clothing Industry will also be referred to as the apparel industry or fashion industry.
The main objective of this chapter is to describe and analyse the nature and makeup
of the South African clothing retail industry.
41
The global clothing industry is dynamic and has been characterised by major
changes and reconstructions in the past decade. Most of these changes were
brought about by the promulgation of the Agreement on Textiles and Clothing (ATC)
in 2005 by the World Trade Organisation (WTO) (Lu, Karpova & Fiore, 2011). The
ATC led to the abolishment of quota restrictions and protectionism that was in place
in most countries and led to a move towards liberalisation of the industry.
3.3 The global clothing supply chains
Over the years, globalisation has led to the growth and development of international
markets and the clothing industry has not been an exception to this phenomenon.
Over time, the clothing industry has become one of the most globalised industries.
This sector employs millions of workers around the world, particularly in low-income
countries such as Bangladesh and India (Fernandez-Stark, Frederick & Gereffi,
2011). Clothing production is generally a significant catalyst in national development,
and is usually one of the foundational industries for countries engaged in export-
oriented industrialisation as it is characterised by low fixed costs and labour-intensive
production (Fernandez-Stark, et al., 2011).
A report by the United Nations Labour Organisation claimed that three-quarters of
the world clothing exports are from low-income countries, and the industry is vital to
their employment creation and economic development (Fernandez-Stark, et al.,
2011). On the other hand, the biggest part of clothing industry output is consumed in
the developed countries. This phenomenon has been increasing as an effect of the
adoption and implementation of the ATC by the WTO. Spending in the international
clothing industry is dominated by three main regions: the United States, the
European Union and Japan (Gereffi & Frederick, 2010).
Global buyers within the global clothing industry supply chains have networks that
cut across a great number of countries and regions; apparel sales in developed
countries is largely provided by imports from developing countries (Palpacuer, et al.,
2005). Developing countries have competed and survived in the clothing value chain
because of their inherent characteristics which include the access to and availability
of low-cost labour, advantageous trade agreements, and closeness to consumers
(Fernandez-Stark, et al., 2011).
42
3.3.1 Clothing industry liberalisation
The international expansion of the clothing industry had previously been propelled by
trade policy; however, the ATC in 2005 by the WTO led to the phasing out of most
quotas that had been historically set up for the regulation of the industry (Fernandez-
Stark, et al., 2011). The biggest implication of the ATC implementation was that
retailers and other buyers had the freedom to source and purchase textiles and
apparel of any quantity from anywhere while subject only to tariff systems (Gereffi &
Frederick, 2010).
Protectionism within the clothing industry has continuously been on a decline in the
past several years, with more apparel importing countries eliminating their previously
stringent barriers to the clothing trade (Gereffi & Frederick, 2010). This liberalisation
of the clothing and textile industry through the ATC has been a cause for controversy
because this industry contributes to employment in developed countries, mainly in
regions where it might be difficult to find alternative jobs. On the other hand,
developing countries stand to gain from this trade liberalisation and hence they
easily accepted the ATC (Nordås, 2004).
3.3.2 Global clothing industry supply chains
International clothing supply chains comprise four elements, namely: textile materials
supply (component networks); manufacturing of finished products (production
networks); transportation services and logistics (export networks); and marketing
(marketing networks) (Lu et al., 2011). The interaction and cascading down of the
elements form what is termed the global value chain (GVC). The diagram in Figure
3.1 below, adapted from Gereffi and Frederick (2010), is an illustration the interaction
of these elements.
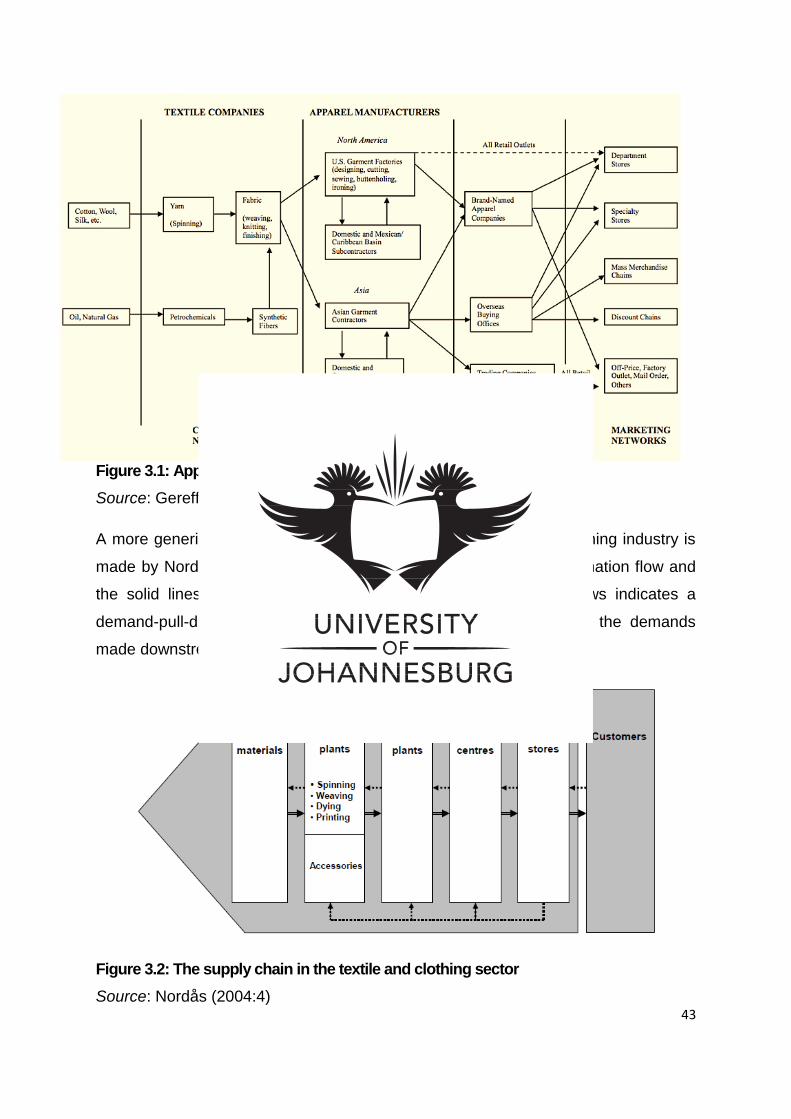
43
Figure 3.1: Apparel global value chain Source: Gereffi & Frederick (2010:5)
A more generic illustration of the supply chain for the textile and clothing industry is
made by Nordås (2004:4) – see Figure 3.2. Dotted lines show information flow and
the solid lines show the flow of goods. The direction of the arrows indicates a
demand-pull-driven system where production is done according to the demands
made downstream of the supply chain.
Figure 3.2: The supply chain in the textile and clothing sector Source: Nordås (2004:4)
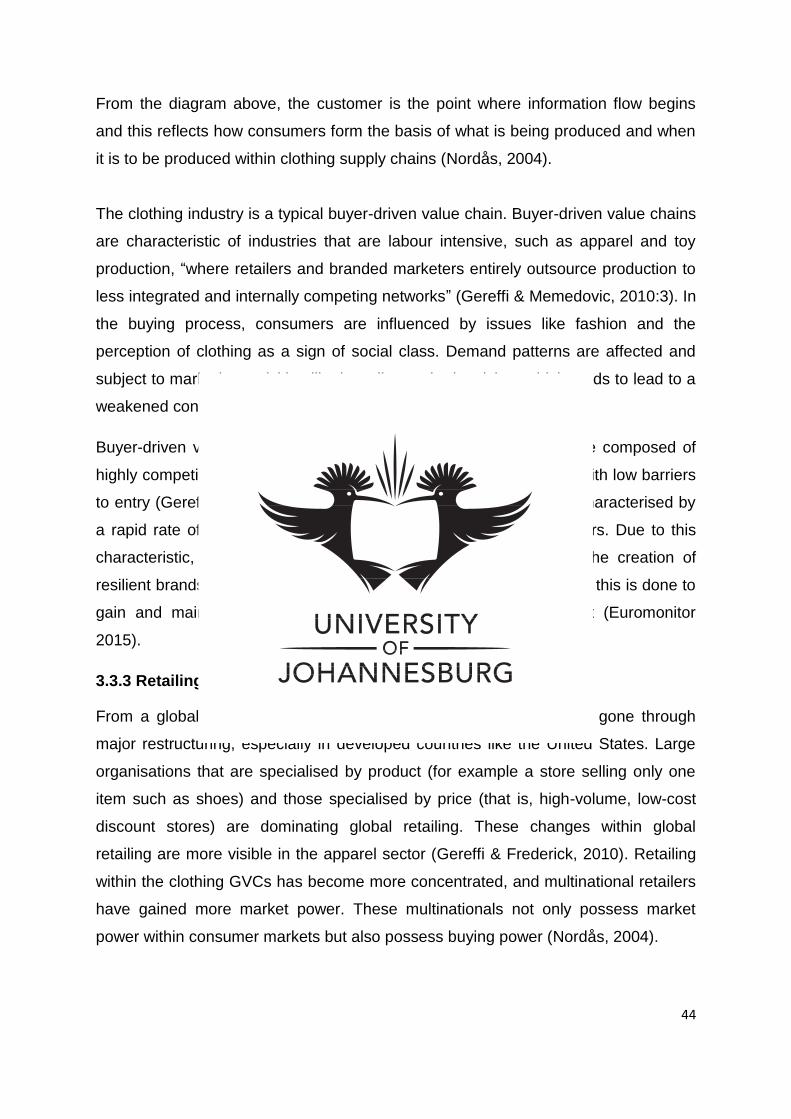
44
From the diagram above, the customer is the point where information flow begins
and this reflects how consumers form the basis of what is being produced and when
it is to be produced within clothing supply chains (Nordås, 2004).
The clothing industry is a typical buyer-driven value chain. Buyer-driven value chains
are characteristic of industries that are labour intensive, such as apparel and toy
production, “where retailers and branded marketers entirely outsource production to
less integrated and internally competing networks” (Gereffi & Memedovic, 2010:3). In
the buying process, consumers are influenced by issues like fashion and the
perception of clothing as a sign of social class. Demand patterns are affected and
subject to marketing activities like branding and advertising, which tends to lead to a
weakened consumer power (Euromonitor 2015).
Buyer-driven value chains, in contrast to producer-driven chains, are composed of
highly competitive and internationally decentralised factory systems with low barriers
to entry (Gereffi & Memedovic, 2010). The clothing industry is also characterised by
a rapid rate of change in the product preferences of individual buyers. Due to this
characteristic, industry players tend to attract customers through the creation of
resilient brands and by conducting intensive marketing campaigns. All this is done to
gain and maintain market share in this highly competitive market (Euromonitor
2015).
3.3.3 Retailing in the clothing industry
From a global perspective, the retailing sector has, over the years, gone through
major restructuring, especially in developed countries like the United States. Large
organisations that are specialised by product (for example a store selling only one
item such as shoes) and those specialised by price (that is, high-volume, low-cost
discount stores) are dominating global retailing. These changes within global
retailing are more visible in the apparel sector (Gereffi & Frederick, 2010). Retailing
within the clothing GVCs has become more concentrated, and multinational retailers
have gained more market power. These multinationals not only possess market
power within consumer markets but also possess buying power (Nordås, 2004).
45
Retailers and other downstream members of the global apparel supply chains are
gaining increasing power (Lu et al., 2011). Within the clothing industry supply chains,
‘lead firms’ are usually the marketers and merchandisers at the design and retail
ends of the chain (Lu et al., 2011). The clothing industry is one of the industries that
are demand focused, and it is highly consumer driven. Retailers have closer
interaction and interface with the consumer and thus have greater influence than
suppliers in this consumer-driven supply chain as they are in possession of valuable
information. Retailers within the clothing GVC are gaining prominence, especially
those in the low- to middle-priced markets (Nordås, 2004).
Furthermore and specifically with regard to the clothing industry, retailers and
marketers have the important design skills, information, bountiful budgets and
promotional campaigns needed to establish sustainable international brands to
appeal to the consumer (Lu et al., 2011). International retailers determine what is to
be produced, where it will be produced, by which manufacturer and the price thereof.
Often these lead firms to subcontract the production to an international network of
contract manufacturers located in developing countries as they have highly
competitive rates (Fernandez-Stark, et al. 2011).
Another global trend related to clothing retailing is that brand owners and marketers
are now resorting to in-house retailing and opening their own retail outlets.
Furthermore, brands which already have retail operations are likely to prioritise and
concentrate supply on their own retail outlets rather than meeting the needs of
external retail firms (Gereffi & Frederick, 2010). ‘Retailers used to be garment
manufacturers’ main customers, but now are often their competitors’ (Gereffi &
Memedovic, 2003:7).
3.4 South African clothing supply chains
3.4.1 Historical background
Historically, before the democratisation of South Africa, when the country was
disconnected from the world’s trading system, its clothing and textiles industry was
focused on supplying the domestic market and import substitution. There was a high
level of protectionism for the industry and inefficiencies were experienced. The result
46
of these inefficiencies was that the industry could not compete internationally and it
failed to develop significant export capacity. The industry was also characterised by
a concentration of the manufacture of low value-added products (Jauch & Traub-
Merz, 2006).
After the apartheid era, South Africa joined the World Trade Organisation (WTO) and
opened its industry to global trade. This change, as well as the depreciation of the
rand in the late 1990s and early 2000s, ensured that South Africa’s clothing industry
could compete globally. Exports increased but they were concentrated in low value-
added products (Jauch & Traub-Merz, 2006).
In relative terms, South Africa’s clothing industry is developed and provides a huge
amount of the country’s employment, forming part of South Africa’s top ten sources
of employment (PWC Report, 2012). However, the adoption over time of the
liberalisation of trade, especially through the WTO’s ATC, has led to a very rapid and
continued rise in imports, particularly from China (Jauch & Traub-Merz, 2006).
According to the PWC Report (2012), in 2012 about 90% of the clothing sold in the
country was imported.
3.4.2 The imports threat
Clothing manufacturers in South Africa compete with and are threatened by
international suppliers. In this clothing industry, some products are locally sourced
but the sector largely relies on imported products (PWC Report, 2012). The clothing
wholesale and manufacturing sectors in South Africa are now somewhat disjointed.
This phenomenon is caused by the fact that retailers are able to source their clothing
products directly from foreign suppliers. The liberalisation of international trade,
specifically through ATC by the WTO referred to above, resulted in the decrease of
local supplier power in the industry through competition exerted by producers located
in low-wage regions, most notably China and India (Euromonitor, 2015)
The textile industry in South Africa depends specifically on imports from China which
constituted 70% of the imports in 2012 (PWC Report, 2012:27). The increasing and
sustained surge in imports has caused an unparalleled crisis within the industry and
has led a great amount of lost employment (Jauch & Traub-Merz, 2006). To combat
this occurrence, the industry regulators implemented the ‘Proudly South African’

47
label in order to persuade shoppers to buy goods produced in South Africa. A further
regulation to promote this ‘buy local’ objective is that all textiles have to have labels
stating the country of origin (Ramdass, 2007).
3.5 The South African clothing retail industry
3.5.1 Retailing in South Africa
South Africa’s retail industry is strongly affected by global trends and the global
economy (Prinsloo, 2010). The clothing retail industry in South Africa is a part of a
growing national retail sector whose growth in the previous years had been
facilitated by a growth in the availability of retail space. The proliferation of shopping
centres in the country has had a major impact on the industry.
The South African retail sector is composed of formal or organised retailers as well
as informal retailers (Purushottam, 2011). The retail sector of the local economy
contributes about 14% to South Africa’s total gross domestic product (GDP)
(Prinsloo 2010:1). In 2012, the South African retail industry had an average growth of
3 per cent over the past eight years (Gauteng Treasury Quarterly Bulletin, 2012).
The diagram in Figure 3.3 below by StatsSA (2015) shows the retail trade sales
between the years 2003 and 2013.
Figure 3.3: Real annual percentage growth in retail sales (2003–2013) Source: StatsSA (2015)
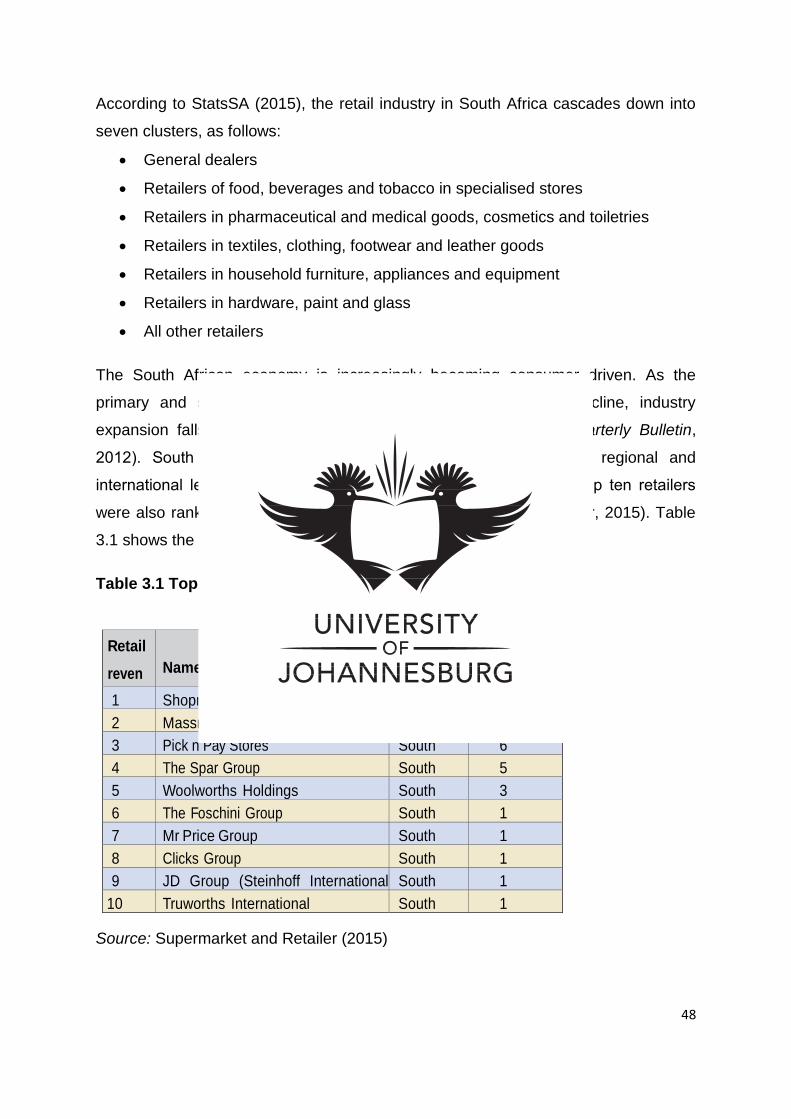
48
According to StatsSA (2015), the retail industry in South Africa cascades down into
seven clusters, as follows:
General dealers
Retailers of food, beverages and tobacco in specialised stores
Retailers in pharmaceutical and medical goods, cosmetics and toiletries
Retailers in textiles, clothing, footwear and leather goods
Retailers in household furniture, appliances and equipment
Retailers in hardware, paint and glass
All other retailers
The South African economy is increasingly becoming consumer driven. As the
primary and secondary sectors of the economy are on the decline, industry
expansion falls into the hands of retailers (Gauteng Treasury Quarterly Bulletin,
2012). South Africa’s retail industry generally competes well at regional and
international levels. This is shown by the fact that South Africa’s top ten retailers
were also ranked top ten in Africa in 2015 (Supermarket and Retailer, 2015). Table
3.1 shows the detail of these companies.
Table 3.1 Top ten retail companies in Africa
Retail revenue rank
Name of company
Country of origin
2013 retail revenue (US$m)
1 Shoprite Holdings South
Africa
9
825 2 Massmart Holdings South
Africa
7
530 3 Pick n Pay Stores South
Africa
6
343 4 The Spar Group South
Africa
5
167 5 Woolworths Holdings South
Africa
3
828 6 The Foschini Group South
Africa
1
594 7 Mr Price Group South
Africa
1
558 8 Clicks Group South
Africa
1
350 9 JD Group (Steinhoff International
Holdings)
South
Africa
1
141 10 Truworths International South
Africa
1
008 Source: Supermarket and Retailer (2015)
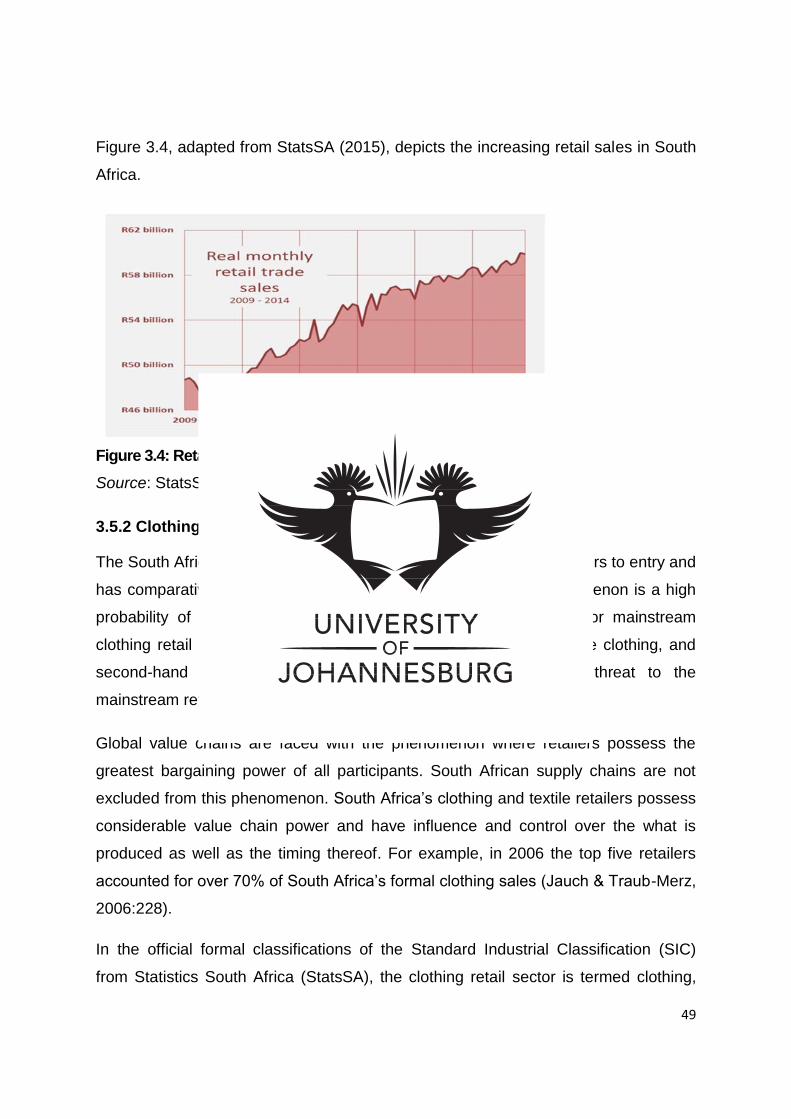
49
Figure 3.4, adapted from StatsSA (2015), depicts the increasing retail sales in South
Africa.
Figure 3.4: Retail trade sales in South Africa: 2009–2014 Source: StatsSA (2015)
3.5.2 Clothing retailing
The South African clothing retail industry is characterised by low barriers to entry and
has comparatively low capital requirement. The result of this phenomenon is a high
probability of new entrants into the clothing market. Substitutes for mainstream
clothing retail include customised tailoring, factory shops, homemade clothing, and
second-hand clothing; however, these present an insignificant threat to the
mainstream retailing market players (Euromonitor, 2015).
Global value chains are faced with the phenomenon where retailers possess the
greatest bargaining power of all participants. South African supply chains are not
excluded from this phenomenon. South Africa’s clothing and textile retailers possess
considerable value chain power and have influence and control over the what is
produced as well as the timing thereof. For example, in 2006 the top five retailers
accounted for over 70% of South Africa’s formal clothing sales (Jauch & Traub-Merz,
2006:228).
In the official formal classifications of the Standard Industrial Classification (SIC)
from Statistics South Africa (StatsSA), the clothing retail sector is termed clothing,
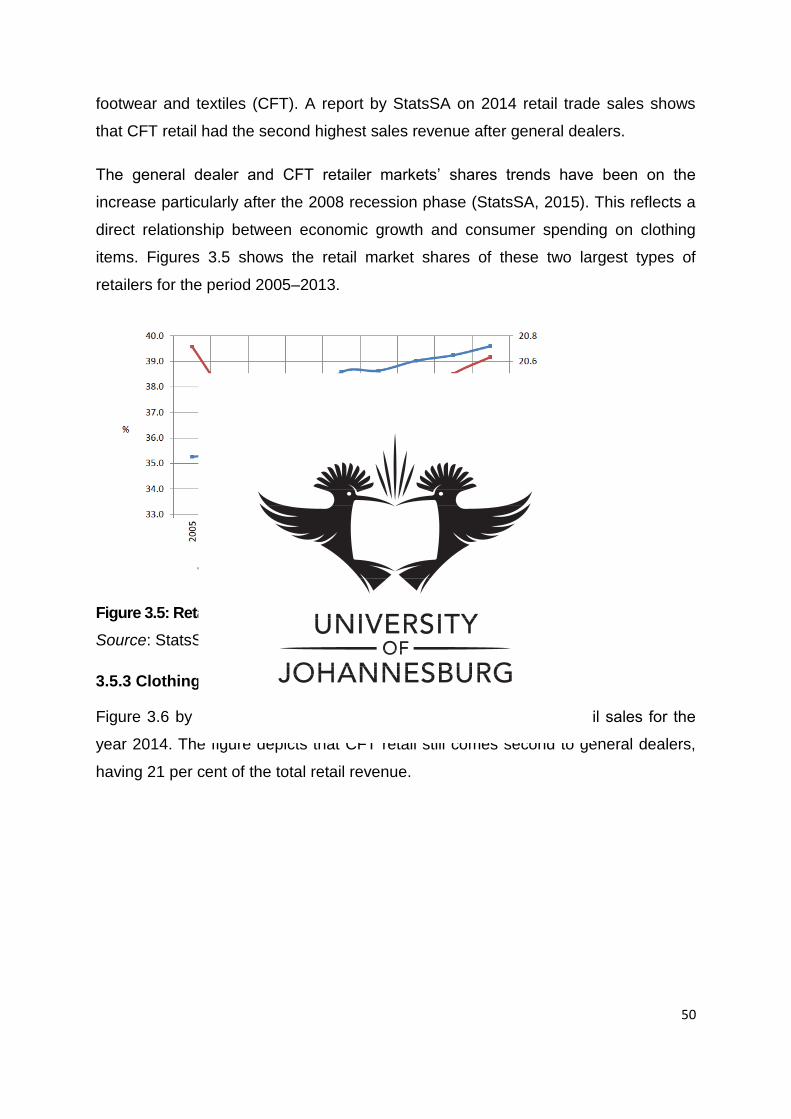
50
footwear and textiles (CFT). A report by StatsSA on 2014 retail trade sales shows
that CFT retail had the second highest sales revenue after general dealers.
The general dealer and CFT retailer markets’ shares trends have been on the
increase particularly after the 2008 recession phase (StatsSA, 2015). This reflects a
direct relationship between economic growth and consumer spending on clothing
items. Figures 3.5 shows the retail market shares of these two largest types of
retailers for the period 2005–2013.
Figure 3.5: Retail market shares: General dealers and CFT retailers Source: StatsSA, BMR calculations (2013)
3.5.3 Clothing retail market contribution
Figure 3.6 by StatsSA (2015) shows the share of South Africa’s retail sales for the
year 2014. The figure depicts that CFT retail still comes second to general dealers,
having 21 per cent of the total retail revenue.
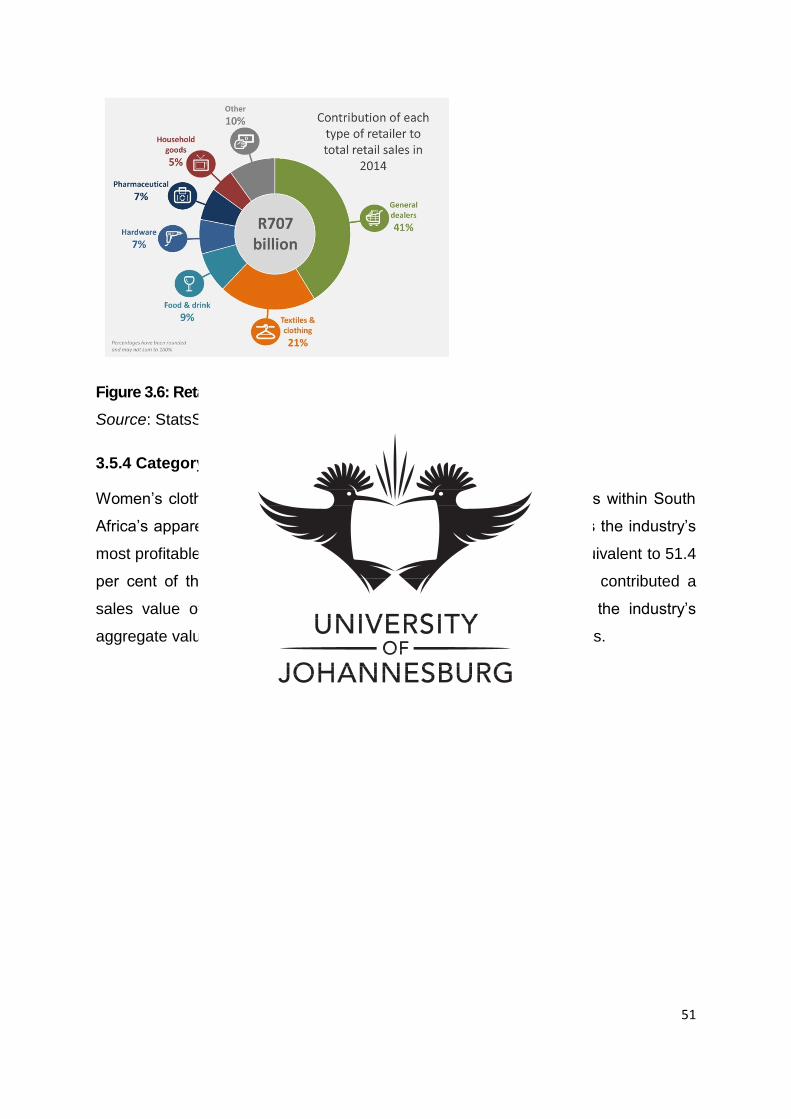
51
Figure 3.6: Retail trade sales for 2014 Source: StatsSA (2015)
3.5.4 Category performance
Women’s clothing has always generated the highest revenue in sales within South
Africa’s apparel industry. In 2014, the women’s clothing category was the industry’s
most profitable segment, with an overall sales value of $3.8 billion, equivalent to 51.4
per cent of the sector’s overall value. The men’s clothing category contributed a
sales value of $2.1 billion in 2014, equating to 28.2 per cent of the industry’s
aggregate value (Euromonitor, 2015). Figure 3.7 depicts these statistics.
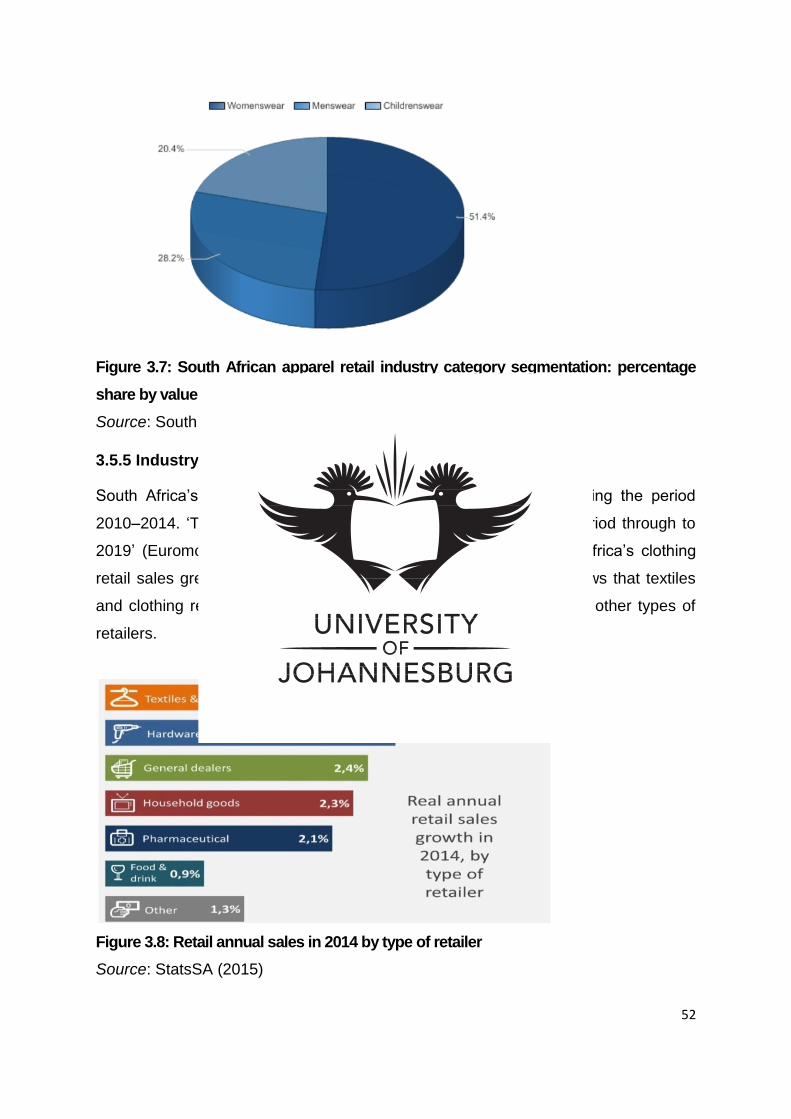
52
Figure 3.7: South African apparel retail industry category segmentation: percentage share by value for 2014 Source: South African Apparel Retail (2015)
3.5.5 Industry growth
South Africa’s clothing retail industry underwent strong growth during the period
2010–2014. ‘This trend is projected to continue over the forecast period through to
2019’ (Euromonitor, 2015:7). According to StatsSA (2015), South Africa’s clothing
retail sales grew by 3.5 per cent in 2014, and Figure 3.8 below shows that textiles
and clothing retail sales had the biggest growth compared to all the other types of
retailers.
Figure 3.8: Retail annual sales in 2014 by type of retailer Source: StatsSA (2015)
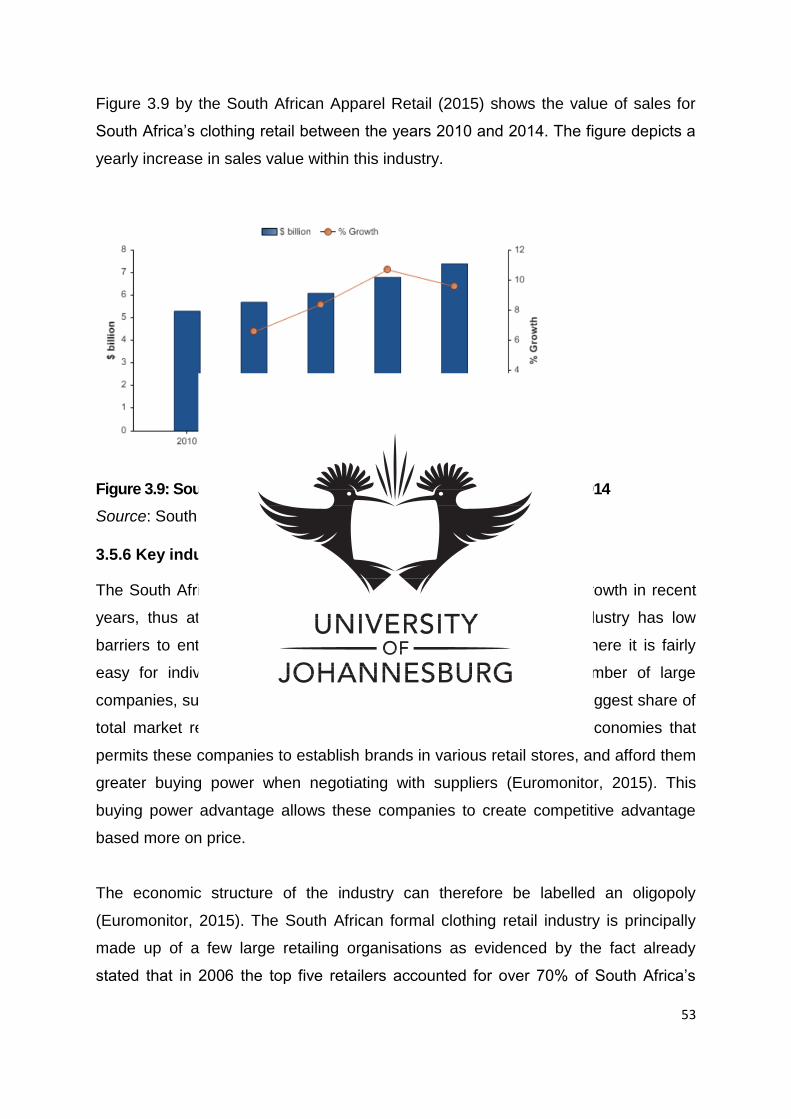
53
Figure 3.9 by the South African Apparel Retail (2015) shows the value of sales for
South Africa’s clothing retail between the years 2010 and 2014. The figure depicts a
yearly increase in sales value within this industry.
Figure 3.9: South African apparel retail industry value: $ billion, 2010–2014 Source: South African Apparel Retail (2015)
3.5.6 Key industry players
The South African clothing retail sector has experienced a healthy growth in recent
years, thus attracting new entrants. As already mentioned, the industry has low
barriers to entry. The start-up capital requirements are at a level where it is fairly
easy for individual companies to enter. Nonetheless, a small number of large
companies, such as Truworths and Edcon Holdings, account for the biggest share of
total market revenues. These large companies benefit from scale economies that
permits these companies to establish brands in various retail stores, and afford them
greater buying power when negotiating with suppliers (Euromonitor, 2015). This
buying power advantage allows these companies to create competitive advantage
based more on price.
The economic structure of the industry can therefore be labelled an oligopoly
(Euromonitor, 2015). The South African formal clothing retail industry is principally
made up of a few large retailing organisations as evidenced by the fact already
stated that in 2006 the top five retailers accounted for over 70% of South Africa’s
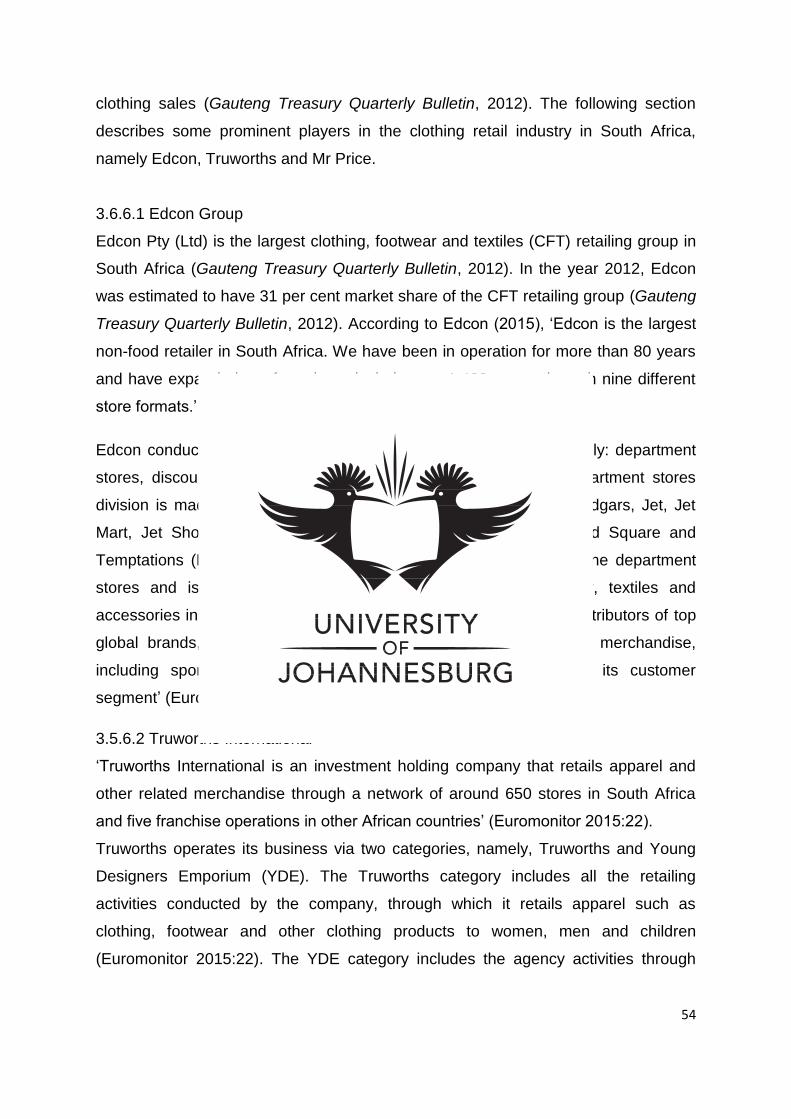
54
clothing sales (Gauteng Treasury Quarterly Bulletin, 2012). The following section
describes some prominent players in the clothing retail industry in South Africa,
namely Edcon, Truworths and Mr Price.
3.6.6.1 Edcon Group
Edcon Pty (Ltd) is the largest clothing, footwear and textiles (CFT) retailing group in
South Africa (Gauteng Treasury Quarterly Bulletin, 2012). In the year 2012, Edcon
was estimated to have 31 per cent market share of the CFT retailing group (Gauteng
Treasury Quarterly Bulletin, 2012). According to Edcon (2015), ‘Edcon is the largest
non-food retailer in South Africa. We have been in operation for more than 80 years
and have expanded our footprint to include over 1,400 stores through nine different
store formats.’
Edcon conducts its business through three business divisions, namely: department
stores, discount stores, and credit and financial services. The department stores
division is made up the following retail chains: Boardmans, CNA, Edgars, Jet, Jet
Mart, Jet Shoes, Blacksnow, Jet Home, Discom, Legit, Prato, Red Square and
Temptations (Euromonitor, 2015:21). Notably Edgars operates full-line department
stores and is ‘one of the leading retailers of clothing, footwear, textiles and
accessories in South Africa’. ‘It is also one of the leading national distributors of top
global brands, supplemented by a value-for-money range of core merchandise,
including sportswear and other commodity products relevant to its customer
segment’ (Euromonitor, 2015:21).
3.5.6.2 Truworths International
‘Truworths International is an investment holding company that retails apparel and
other related merchandise through a network of around 650 stores in South Africa
and five franchise operations in other African countries’ (Euromonitor 2015:22). Truworths operates its business via two categories, namely, Truworths and Young
Designers Emporium (YDE). The Truworths category includes all the retailing
activities conducted by the company, through which it retails apparel such as
clothing, footwear and other clothing products to women, men and children
(Euromonitor 2015:22). The YDE category includes the agency activities through
55
which the company retails clothing, footwear and related products (Euromonitor
2015:22).
3.5.6.3 Mr Price
The Mr Price Group is involved in the operation of retail chains. It includes six retail
chains namely; Mr Price Apparel, Mr Price Home, Mr Price Sport, Miladys, Sheet
Street, and Mr Price Money (Euromonitor, 2015:22). The Mr Price Group conducts
its business via three categories, namely, apparel, home and central services. Mr
Price’s apparel segment is engaged in retail clothing, sportswear, footwear, sporting
equipment and accessories. The company also offers sports-related products
through Mr Price Sport (Euromonitor, 2015).
3.6 Demand planning in the clothing retail industry
With high levels of competition in the retail environment, suppliers are faced with a
great amount of pressure to comply with high customer service level requirements
while achieving minimal costs. There is a need therefore for clothing manufacturers
and retailers to achieve a balance between their demand and supply processes.
Effective demand planning helps in the achievement of this balance (Waller &
Williams, 2011).
As retail environments have changed overtime, demand forecasting has become
even more critical part in effective demand management (Williams & Waller, 2011).
However, forecast accuracy has dropped overtime; ‘this drop is attributed, in part, to
the increased lack of familiarity with forecasting techniques and increased complexity
due to product proliferation’ (Williams & Waller, 2011). Caniato et al., (2008) state
that within supply chains, the retail point is gaining an important role in the demand
management process because it is the unique point of interface between a firm and
its customer.
3.6.1 POS data in clothing retail
Obtaining accurate sales forecasts is difficult in the clothing industry and is generally
considered to be difficult due to demand volatility in clothing products (Moisanen,
2014). The demand for clothing items is easily affected by several variables that
include seasonal weather changes, actions of opinion leaders and other changes like
variations within the state if the economy (Moisanen, 2014).
56
Thomassey (2014:9) holds that the clothing industry is ‘a fascinating sector for the
sales forecasters; the long time-to-market characteristic of the clothing industry
contrasts with the short life cycle of products, thus complicating the forecasting
process’. Achieving high customer service levels while incurring minimal costs
requires accurate demand forecasts, but the achievement of these forecasts is not
an easy task (Williams & Waller, 2011:17). Despite the above-mentioned difficulties
associated with predicting sales, accurate sales forecasting in the clothing industry is
considered important ‘due to the long lead times caused by the relatively recent
trend of sourcing production out to other countries’ (Moisanen, 2014:1). The South
African clothing industry is characterised by this observable fact. The usage of POS
data in demand planning and forecasting greatly improves the accuracy of these
forecasts. In a volatile clothing industry with complex consumers, POS data
becomes an indispensable tool (Williams & Waller, 2011).
To enable suppliers to provide frequent supplies and achieve minimal inventories,
retailers need to share POS data. This requires ‘frequent communication between
retailers and their suppliers’ (Nordas, 2004:5). Particularly in the context of this
study, South Africa has increasingly competitive markets. As a result, this has
necessitated supply chain members to focus on core competencies, and gain
competitive advantage by the implementation of effective supplier relationship
management programs (Dube, Muyengwa & Battle, 2012).
The accuracy of order forecasts made by retail stores to the retail company’s
distribution centres (DCs) can be improved by the collection and usage of POS data.
The forecasting of DC orders to the supplier is more difficult due to increased
variability upstream of the supply chain (Williams & Waller, 2010). ‘Shared POS data
can reduce the variability introduced into the demand forecast process’ (Williams &
Waller, 2011). ‘The development in data technology has made it possible for any
retail company to collect, supply and analyse POS data. Access to POS data makes
it possible to react to changes in demand considerably faster’ (Nordas, 2004:6).
Williams and Waller (2011:17) state that ‘recent literature suggests that suppliers use
shared point-of-sale (POS) data to reduce demand forecast error and subsequently
improve demand management processes’.
57
3.6.2 POS data collection and transmission technologies
Retailers have the barcoding system as well as complementary equipment at their
disposal for the collection of POS data in real time. This technology enables retailing
companies to monitor the products sold on a continuous basis. The equipment
ensures accuracy and precision in the capture of POS data and also enables
retailers to keep track of inventories (Nordas, 2004). Within clothing supply chains,
the development and implementation of the barcoding system and POS scanning
capabilities enabled the capture and provision of accurate real-time information on
product sales (Gereffi & Memedovic, 2003). Furthermore, the sharing of POS data
by retailers using electronic data interchange (EDI) systems and other data transfer
technologies has gained prominence (Dube, Muyengwa & Battle, 2012).
Technology, including the EDI used by the retailer to restock, ‘enabled a model of
frequent shipments by suppliers to fill ongoing replenishment orders by retailers,
based on real-time sales information collected at the retailer’s stores on a daily basis’
(Gereffi & Memedovic, 2003:4).
3.6.3 POS data usage in the South African clothing retail industry
Retailer stores replenish their inventory either directly from the supplier or the
retailer’s own DC. Clothing retailers in South Africa generally replenish their retail
stores from their own DC and, as described in Chapter 2, the effective usage of POS
data would benefit these supply chains through replenishment- and inventory-related
efficiencies (Dube, Muyengwa & Battle, 2012).
The concept of predicting sales, more commonly referred to as demand or sales
forecasting, in the rapidly changing apparel industry has been greatly researched
during the past two decades (Moisanen, 2014:2). Despite this reference to
substantial research, the author of this study could not find any evidence of research
done on the process of demand planning and the usage of POS data within the
South African clothing industry. It is therefore the objective of this study to research
and document the usage of POS data in the process of demand planning within the
South African clothing retail industry.
58
3.7 Conclusion
The clothing industry has historical importance through its role in the global
industrialisation process and continues to be of importance to many developing
countries by being a major source of employment. The global industry has gone
through several changes over time with the major being the liberalisation brought
about by the implementation of the Agreement on Textiles and Clothing (ATC) by the
World Trade Organisation in 2005. This liberalisation led to the abolishment of
protectionism policies by many countries and led to a more integrated global clothing
industry. The global clothing industry is characterised by greater production in low-
income countries while consumption is greatest in developed countries. The clothing
industry is a highly competitive and buyer-driven industry that consists mainly of raw
material producers, textile producers, apparel manufacturers and retailers.
The South African clothing industry is also a contributor to the global clothing
industry and was opened to the international markets at the end of the apartheid era.
South Africa largely plays a consumer role and this is seen in dependence on
imports of materials as well as finished products, especially from China. About 90%
of items sold in South Africa in 2012 were imported, with 70% of those sourced from
China. South African clothing retail is a part of a growing retail sector and accounts
for the second biggest share in retailing after general dealers. The structure of the
industry is oligopolistic in nature where five of the biggest retailers account for about
70% of market share. However, many small-scale retailers exist forming a smaller
part of the market share. Women’s clothing contributes the largest revenue in this
sector, accounting for 54% of the industry’s value.
Demand planning and sales forecasting are important activities of clothing industry
supply chains owing to the high levels of competition, the long lead times caused by
the trend of sourcing production and operations to other countries, and the cost
minimisation objective. The retail point is gaining an important role in the demand
management process because it is most often the unique point of interface between
a firm and its customer. However, there is a challenge in the development of these
forecasts owing to the volatility of demand for apparel products. The accuracy of
these sales predictions within the process of demand planning can be improved by
using POS data to determine these future sales. Several technologies, like the

59
barcoding system and EDI, have been developed to facilitate the implementation of
POS data-based demand planning within the industry.
In the next chapter, the research methodology used in the study to collect data and
analyse data is described.
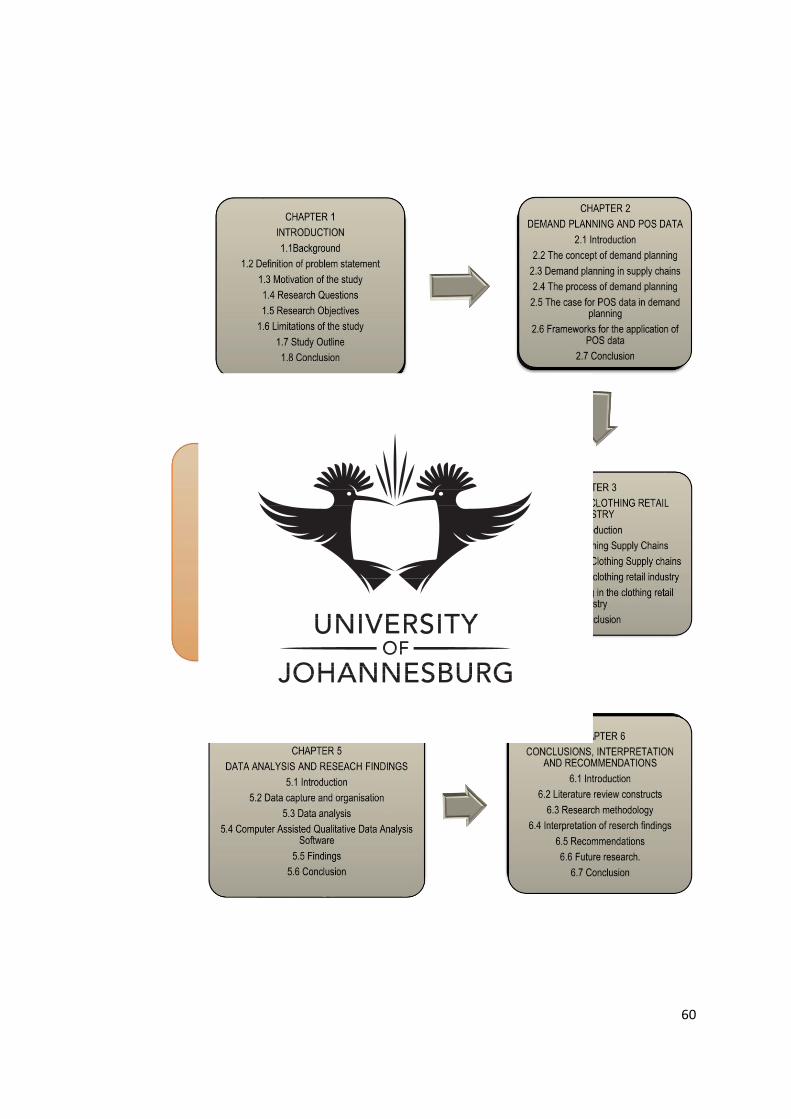
60
61
CHAPTER 4: RESEARCH METHODOLOGY
4.1 Introduction
The purpose of this chapter is to describe the research methodology used in the
study to collect and analyse data. The research approach, design, and the data
collection methods and tools are described and explained in the context of this
investigation. The study seeks to investigate the extent of the usage of POS data in
demand planning by companies in the South African clothing retail industry. The
research methodology was used in a manner aimed at meeting the research
objectives and ensuring the main and investigative questions were answered.
Different authors present different steps in conducting research. One of the simplest
and clearest research processes is presented by Sreejesh, Mohapatra and Anusree
(2014:14). They present a seven-step process of conducting research, as illustrated
in Figure 4.1.
Figure 4.1 Steps in the research process Source: Sreejesh, Mohapatra and Anusree (2014:14)
Saunders, Lewis and Thornhill (2009:108) make another vivid description of the
research process and the different stages the process should go through. The term
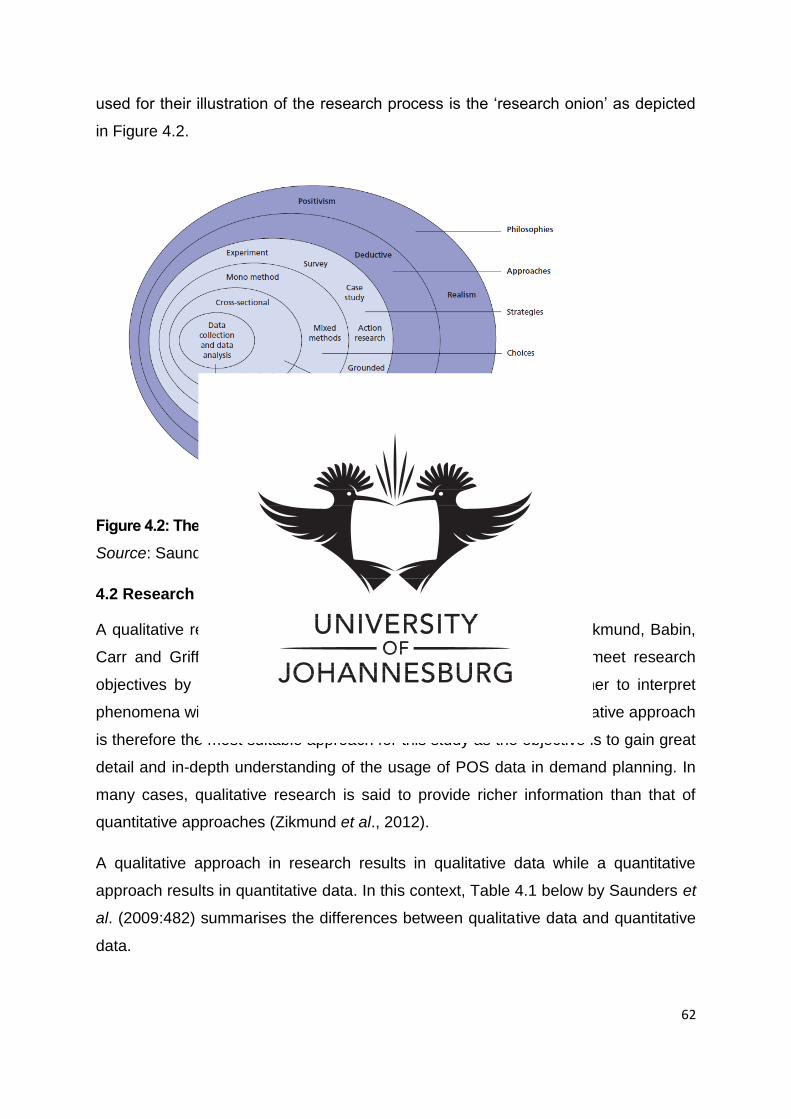
62
used for their illustration of the research process is the ‘research onion’ as depicted
in Figure 4.2.
Figure 4.2: The ‘research onion’ Source: Saunders, Lewis and Thornhill (2009:108)
4.2 Research approach
A qualitative research approach is used in this study. According to Zikmund, Babin,
Carr and Griffin (2012), a qualitative research approach seeks to meet research
objectives by the use of tools and methods that allow the researcher to interpret
phenomena without depending on numerical measurement. The qualitative approach
is therefore the most suitable approach for this study as the objective is to gain great
detail and in-depth understanding of the usage of POS data in demand planning. In
many cases, qualitative research is said to provide richer information than that of
quantitative approaches (Zikmund et al., 2012).
A qualitative approach in research results in qualitative data while a quantitative
approach results in quantitative data. In this context, Table 4.1 below by Saunders et
al. (2009:482) summarises the differences between qualitative data and quantitative
data.
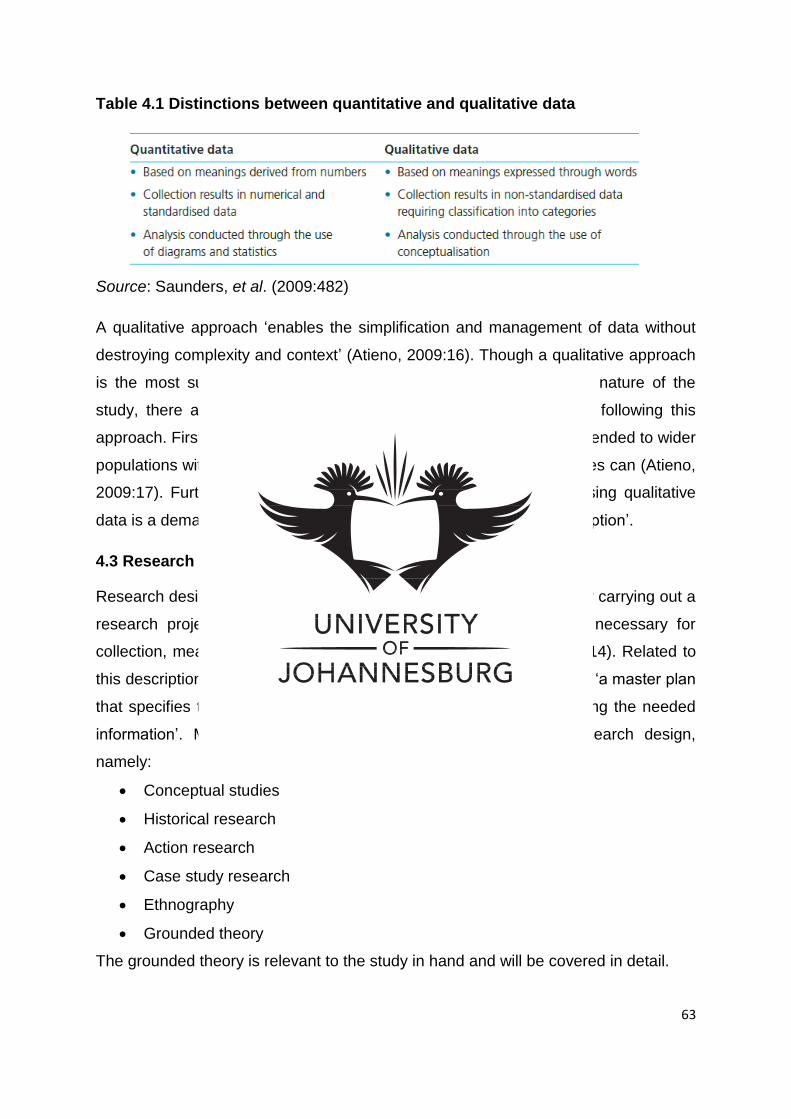
63
Table 4.1 Distinctions between quantitative and qualitative data
Source: Saunders, et al. (2009:482)
A qualitative approach ‘enables the simplification and management of data without
destroying complexity and context’ (Atieno, 2009:16). Though a qualitative approach
is the most suitable for this particular study due to the exploratory nature of the
study, there are some drawbacks which can be encountered when following this
approach. First, the findings from a qualitative approach cannot be extended to wider
populations with the same degree of certainty that quantitative analyses can (Atieno,
2009:17). Furthermore, Saunders et al. (2009:483) state that analysing qualitative
data is a demanding process and should not be considered an ‘easy option’.
4.3 Research strategy
Research design or research strategy is the framework or blueprint for carrying out a
research project in an efficient manner and provides the actions necessary for
collection, measurement and analysis of data (Sreejesh et al., 2014:14). Related to
this description, Zikmund et al. (2012:64) state that research design is ‘a master plan
that specifies the methods and procedures for collecting and analysing the needed
information’. Maree (2007) discusses six types of qualitative research design,
namely:
Conceptual studies
Historical research
Action research
Case study research
Ethnography
Grounded theory
The grounded theory is relevant to the study in hand and will be covered in detail.
64
4.3.1 Grounded theory
The research strategy or design for this study is the grounded theory. Saldana
(2011) states that the grounded theory is a strategy whereby the researcher
continually compares collected data units through a series of cumulative coding
cycles in order to determine emerging themes and categories. As described by
Stake (2010), the grounded theory research design is used when the main aim is to
build theories and draw conclusions about the population. The inductive nature of
this study therefore makes the grounded theory the most suitable research design or
strategy. However, like any research approach, grounded theory research has
advantages and disadvantages, as listed below.
Advantages
‘Grounded theory is a respected qualitative way of moving from individual
knowledge to collective knowledge’ (Stake, 2010:17).
The grounded theory approach gives priority to the data and the field under
study over theoretical assumptions (Flick, 2011).
The use of this procedure overcomes the main shortfall associated with the
deductive procedure. The latter has already been cited above as being likely
to introduce an untimely conclusion on the issues under investigation, with
the potential of the theoretical constructs departing widely from the views of
participants in a social setting (Saunders et al., 2011)
Disadvantages
‘The grounded theory strategy is an interpretive process, not a logico-
deductive one and researcher should treat it as a highly creative one’
(Saunders et al., 2009:149).
The grounded theory design is not easy; it requires that the researcher
obtains a tacit knowledge of, or feel for, their data (Saunders et al., 2009).
4.3.2 Case study approach
Another strategy that also could have been used is the case study strategy.
According to Zikmund et al. (2012), case studies involve the documentation of the
history of a particular person, group, organisation or event. A case study can also be
defined as a systemic enquiry into an event or a set of related events which aims to
65
describe and explain the occurrence of interest (Maree, 2007:75). The use of case
studies in the research design presents certain advantages and disadvantages
including the following:
Advantage
In comparison to other methods, ‘case studies have an advantage with
respect to the “depth” of the analysis, where depth can be understood as
empirical completeness and natural wholeness or as conceptual richness and
theoretical consistency’ (Given, 2008:69).
Disadvantage
Case studies can be narrow in scope and it becomes difficult to make
generalisations about the population (Adams, Khan, Raeside & White, 2007).
4.3.3 Literature review
As part of the research methodology, secondary research was done through a
literature study. Through this literature study, the research gap was identified and the
critical constructs for the study were defined. The following are the main motivations
for conducting a literature review:
To provide a sound theoretical overview of the existing research findings,
theories and models in terms of the specific research model
To situate and locate the research project and outline its context (Fox &
Bayat, 2008)
The literature review was restricted to formal documents, papers and books in the
discipline of commerce or business to ensure the relevance of the information
collected.
4.4 Data collection: Interviews
For this study, interviews were used to collect data. Saunders et al. (2013) simply
describe interviews as a purposeful discussion or conversation between two or more
people. Maree (2007) provides a broader definition: interviews entail a two-way
conversation whereby the interviewer asks the participants questions. These
questions are asked in order to gather data and to learn about an individual or an
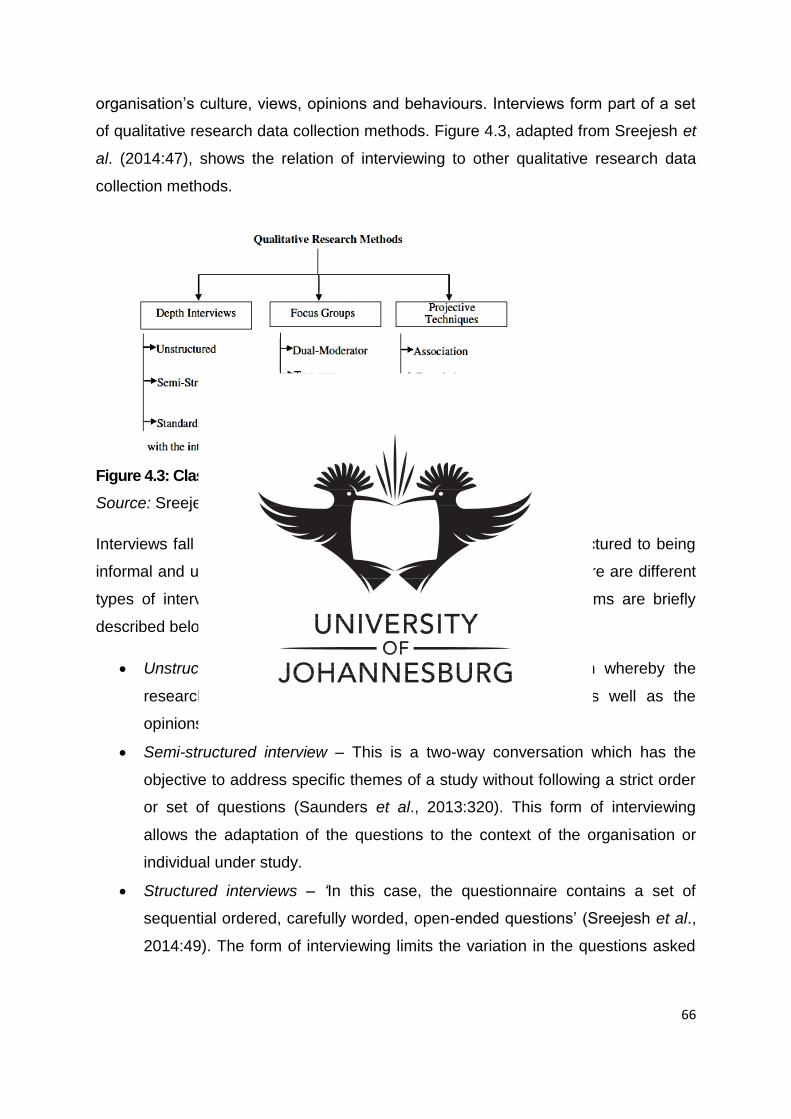
66
organisation’s culture, views, opinions and behaviours. Interviews form part of a set
of qualitative research data collection methods. Figure 4.3, adapted from Sreejesh et
al. (2014:47), shows the relation of interviewing to other qualitative research data
collection methods.
Figure 4.3: Classification of qualitative research methods Source: Sreejesh et al. (2014:47)
Interviews fall into the continuum of being highly formalised and structured to being
informal and unstructured conversations (Saunders et al., 2013). There are different
types of interviews that are used in research and the common forms are briefly
described below:
Unstructured/Open-ended interview – This is a conversation whereby the
researcher has the objective to explore the perceptions as well as the
opinions of the participant about a phenomenon (Maree, 2007).
Semi-structured interview – This is a two-way conversation which has the
objective to address specific themes of a study without following a strict order
or set of questions (Saunders et al., 2013:320). This form of interviewing
allows the adaptation of the questions to the context of the organisation or
individual under study.
Structured interviews – ‘In this case, the questionnaire contains a set of
sequential ordered, carefully worded, open-ended questions’ (Sreejesh et al.,
2014:49). The form of interviewing limits the variation in the questions asked
67
and promotes consistency. Despite this advantage, this choice limits flexibility
that could be needed to probe into participant differences.
4.4.1 Semi-structured interviews
For purposes of this study, semi-structured interviews were used. As already
mentioned a semi-structured interview is a two-way conversation without a strict set
of questions. In this context, the strengths and limitations for using semi-structured
interviews are described below:
Strengths
Since the structure and order of questions is not strictly adhered to, this form
of interviewing allows the researcher to address more specific issues
(Zikmund et al., 2012:151).
The use of this technique allows some amount of flexibility to the interview,
but still ensures that the interviewer keeps the interview limited to the topics
that are essential to the research (Sreejesh et al., 2014).
Zikmund et al. (2010) state that the responses from semi-structured interviews
are usually easier to interpret than other qualitative approaches.
Limitations
The effectiveness of semi-structured interviews depends on the skill of the
interviewer as there is a need to apply probing techniques (Sreejesh et al.,
2014:48).
‘The technique does not permit the interviewer to probe into unanticipated
issues cropping up during the interaction, which were not a part of the basic
checklist’ (Sreejesh et al., 2014:48).
4.4.2 Recording interview data
Table 4.2 below, adopted from Saunders et al. (2013:341), summarises the
advantages and disadvantages of audio-recording interviews.
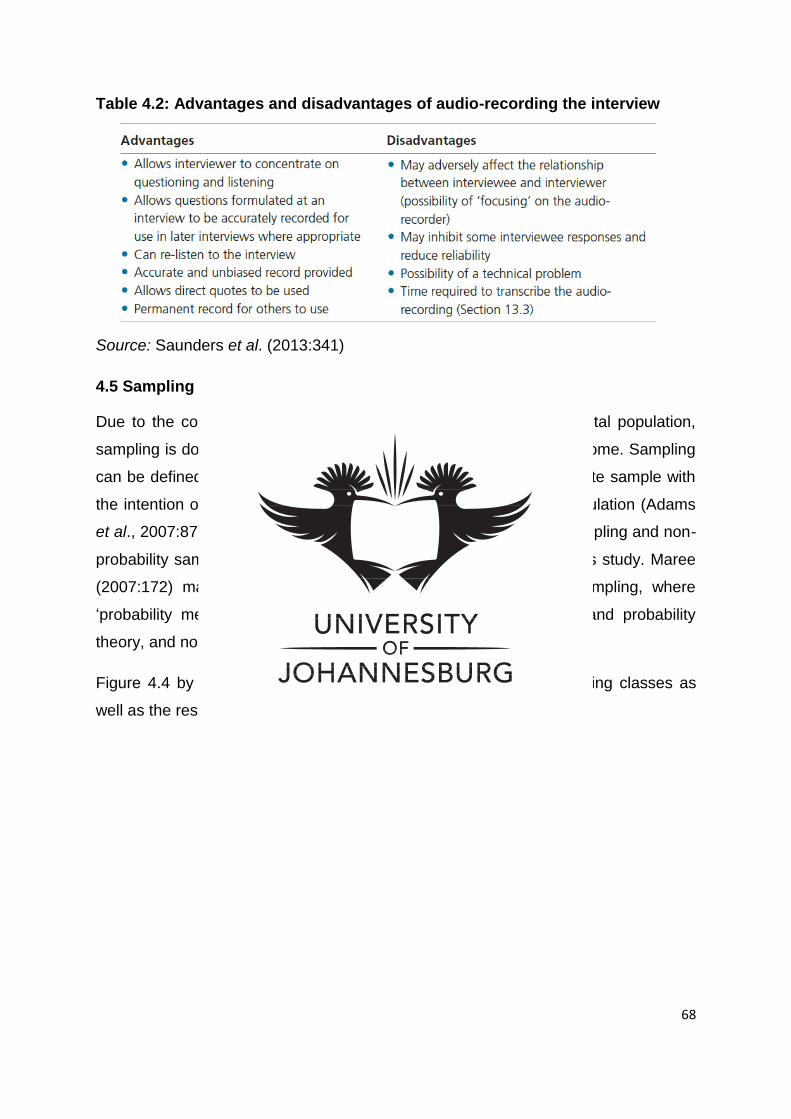
68
Table 4.2: Advantages and disadvantages of audio-recording the interview
Source: Saunders et al. (2013:341)
4.5 Sampling
Due to the constraints associated with performing a study on the total population,
sampling is done; in this way, time and cost restrictions can be overcome. Sampling
can be defined as the process or technique of selecting an appropriate sample with
the intention of finding out issues or characteristics of the whole population (Adams
et al., 2007:87). The two main classes of sampling are probability sampling and non-
probability sampling. Non-probability sampling will be used in this this study. Maree
(2007:172) makes a distinction between these two classes of sampling, where
‘probability methods are based on the principles of randomness and probability
theory, and non-probability methods are not’.
Figure 4.4 by Saunders (2009:213) shows a summary of the sampling classes as
well as the respective methods under each.
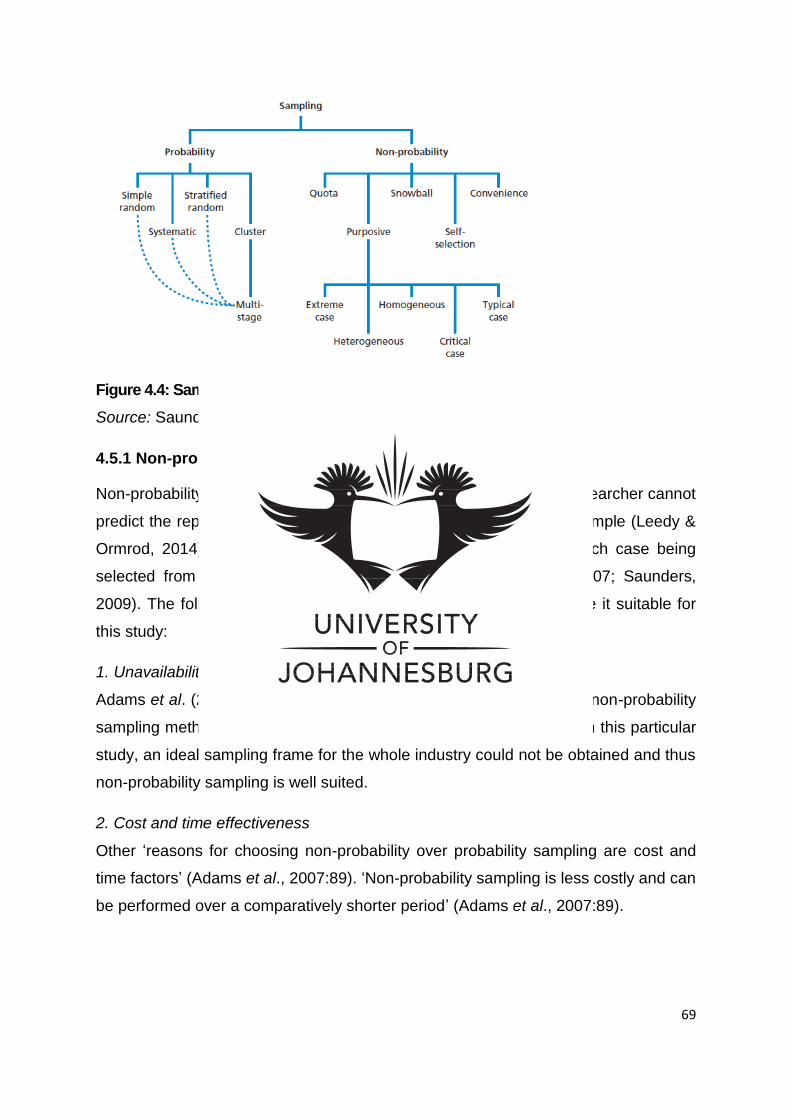
69
Figure 4.4: Sampling methods Source: Saunders (2009:213)
4.5.1 Non-probability sampling
Non-probability sampling can be described as sampling where the researcher cannot
predict the representation of each element in the population in the sample (Leedy &
Ormrod, 2014). With non-probability sampling, the probability of each case being
selected from the total population is not known (Adams et al., 2007; Saunders,
2009). The following characteristics of non-probability sampling make it suitable for
this study:
1. Unavailability of sampling frame
Adams et al. (2007) state that when a sampling frame is unavailable, non-probability
sampling methods are suitable to serve the objectives of the study. In this particular
study, an ideal sampling frame for the whole industry could not be obtained and thus
non-probability sampling is well suited.
2. Cost and time effectiveness
Other ‘reasons for choosing non-probability over probability sampling are cost and
time factors’ (Adams et al., 2007:89). ‘Non-probability sampling is less costly and can
be performed over a comparatively shorter period’ (Adams et al., 2007:89).
70
4.5.2 Purposive sampling
The different methods under non-probability sampling are depicted in Figure 4.3 and
of these, purposive sampling will be used. In purposive sampling, sampling units are
chosen for a particular purpose (Leedy & Ormrod, 2014:221). ‘Purposive sampling
allows the researcher to use his or her judgement in selecting cases that will best
enable him or her to answer the research questions as well as satisfy the objectives’
(Saunders, 2009:237).
Purposive sampling is also motivated by the idea that who a person is (in the context
of this study it will be a company) and where that person is located within a group is
important (Given, 2008:697). However, when using purposive sampling, it is required
that the researcher provides justification for the selection of particular sample
elements (Leedy & Ormrod, 2014:221). Furthermore, this sampling is said to be
appropriate if the researcher wishes to select cases that are particularly informative
(Saunders, 2009:237). The advantages as well as the disadvantages of using
purposive sampling are discussed below.
Advantages
Purposive sampling recognises the fact that some ‘well-placed articulate
informants will often advance the research far better than any randomly
chosen sample’ (Given, 2008:697).
Though to a limited extent, purposive sampling ‘can provide the researcher with the
justification to make generalisations from the sample that is being studied, whether
such generalisations are theoretical, analytical and/or logical in nature’ (Saunders,
2009:237).
Disadvantages
Samples created through purposive sampling cannot be considered as
statistically representative of the total population (Saunders, 2009:213).
Purposive sampling is highly prone to researcher bias (Given, 2008).
4.5.3 Sampling frame
A sampling frame is the list of elements from which the sample may be drawn
(Adams et al., 2007:88). An ideal sampling frame for this study would have been a
list with all South African clothing retail companies depicting their sales volume, thus
71
helping in the major or non-major demarcation. Such a list could not be obtained
because of the following reasons:
Protection of Personal Information (POPI) Act – Compliance with this Act
prevented some organisations like the Wholesale and Retail Sector Education
and Training Authority (W&R Seta), which could have provided this ‘ideal list’,
from disclosing their registered members and their related information.
Diversified business operations – Some organisations, like the Consumer
Goods Council of South Africa (CGCSA), could not provide the suitable list as
their classification of the different registered companies cut across and
beyond clothing retailing.
Saunders et al., (2009) suggests that “where no suitable list exists the researcher will
have to compile their own sampling frame, perhaps drawing upon existing lists”.
Owing to the above mentioned challenge of getting a complete list to be used as a
sampling frame, the sampling frame used for this study is a combination of list
obtained from the National Clothing Retail Federation of South Africa (NCRF) and
Silo. According to the NCFR website (2014), their organisation ‘represents the
interests of retailers who are the favoured destinations of millions of men, women
and children when choosing their clothing, footwear, fashion accessories, cosmetics
and related items’. The organisation claims its members account for more than R50
billion in sales revenue annually. This endorses the organisation’s membership as
being a good basis for the sampling frame. According to Silo website (2015), “Silo is
South Africa’s leading digital brand content provider and source of unified retail
intelligence, retail analytics and product analytics”.
4.5.4 Sampling unit
The ‘sampling unit can be described as a single element or group of elements
subject to selection in the sample’ (Adams et al., 2007:88). In the context of this
study, the sampling units are the major clothing retail companies in South Africa.
4.6 Data analysis
This section describes the data analysis process, that is, the transcription step
followed by the actual analysis to draw findings and interpretation.
72
4.6.1 Transcribing
During and after the interviewing stage, the audio-recorded interview was
transcribed. As defined by Saunders et al. (2009), transcribing is reproducing an
audio-recorded interview as a written (Word-processed) account using the actual
words. Transcriptions were made into Word files and the transcription was done
verbatim to overcome the following drawbacks associated with partial transcription
cited by Saunders et al. (2009):
The researcher will still have to listen to the entire recording carefully and the
filtering process can be cumbersome.
The researcher might miss certain things, and this means having to go back
to the audio-recording. This allows room for subjectivity in selecting important
parts.
4.6.2 Data analysis
After the captured data has been transcribed, the data is analysed. Qualitative data
can be analysed in different ways depending on the collection method and of the
type of data collected. In this study, grounded theory analysis was used. According
to Saldana (2011), grounded theory analysis is an analytical process whereby the
researcher continually compares small data units through a series of cumulative
coding cycles in order to determine a range of dimensions to the emerging themes
and categories.
One of the most important steps in grounded theory analysis is coding. According to
Yin (2011), the objective in coding the transcribed information is to move towards a
higher conceptual level. Coding is the process of reading carefully through
transcribed data, line by line, and dividing it into meaningful analytical units (Maree,
2007:105). Items that seem to be essentially similar are assigned the same code;
however, the uniqueness of each set of responses should not be ignored (Yin,
2011). As a supplement to the manual coding of data, computer-assisted qualitative
data analysis (CAQDA) was used.
The next chapter (Chapter 5) focuses on dealing with the research findings and
describes how the analysis process described above was practically implemented.
73
4.7 Ethical considerations
In any form of research performed, it is necessary to take ethical considerations into
account to ensure the application of moral behaviour during the research process
(Zikmund et al., 2013). Saunders et al. (2009:84) state ‘that ethics refers to the
appropriateness of your behaviour in relation to the rights of those who are the
subject of your work, or are affected by it’. Below is a discussion of some of these
issues and how the researcher complied with the requirements thereof.
Informed consent
Consent is given when research participants know and understand what the
researcher requires of them and agree to the research study (Zikmund et al., 2013).
For this study, the researcher ensured that the interview respondents gave their full
consent to participate in the interviews. Communication was made with potential
respondents, disclosing what the research is about and giving them the chance to
voluntarily give their consent. The communication included an interview consent
letter that clarified the nature of the interview and the related information. This letter
is shown in Annexure A).
Confidentiality and respondent anonymity
Another ethical issue considered was confidentiality. Confidentiality, as suggested by
Flick (2011), ensures that people who read the report should not be able to tell which
organisation or individual took part in the research. For this purpose, the specific
details were encrypted. The level of confidentiality observed in this study was
expressed in the interview consent letter, which clearly stated that ‘the information
gathered in the study will be treated with the strictest confidence’.
Anonymity is specifically about is ensuring that the information about the
respondents or companies is only used in a way which makes it impossible for other
persons to identify the participants, or for any institution to use it against the interests
of the participant (Flick, 2011). In this study, the researcher did not disclose any
information classified as sensitive personal data. By not disclosing the identity of the
respondents and sensitive personal data, the respondents are protected from any
issues such as victimisation or discrimination. When the respondent remains
anonymous, subjectivity by the respondent is also minimised (Saunders et al., 2012).
74
Scientific quality
Flick (2011) also lists the scientific quality of a study as an ethical issue, suggesting
that if a study does not add to the body of knowledge or the study is a duplication of
or is identical to a study done previously, then the study is unethical. To abide with
this ethical code, this study was decided on after a thorough literature review had
been done to identify a research gap in order to ensure that no similar study existed
on the same topic.
Objectivity
Objectivity is related to avoiding issues such as selective data collection, data
manipulation and data fabrication. Lack of objectivity can render the findings of a
study invalid and unreliable. Lack of objectivity in collection also affects the analysis
of the data; as Saunders et al. (2012:194) state, ‘Without objectively collected data,
your ability to analyse and report your work accurately will also be impaired.’
4.8 Conclusion
The different aspects of the research methodology described in this chapter were
selected through a series of steps in cognisance of the fact that there is no research
design, method or instrument that is suitable for every research circumstance. Thus,
choices made at each level of the research methodology were made after
consideration of the various strengths and limitations they present to the particular
circumstance. The choices made were those the researcher perceived as having the
best advantage to the research circumstance.
The research was done through a combination of primary and secondary research.
The secondary research was performed by consulting different forms of literature
primarily for identifying research gaps and defining the critical constructs of the
research. The primary research was done with the purpose of answering questions
that emanated from the literature study. The summary of the research methodology
for this primary research is depicted in Table 4.3.
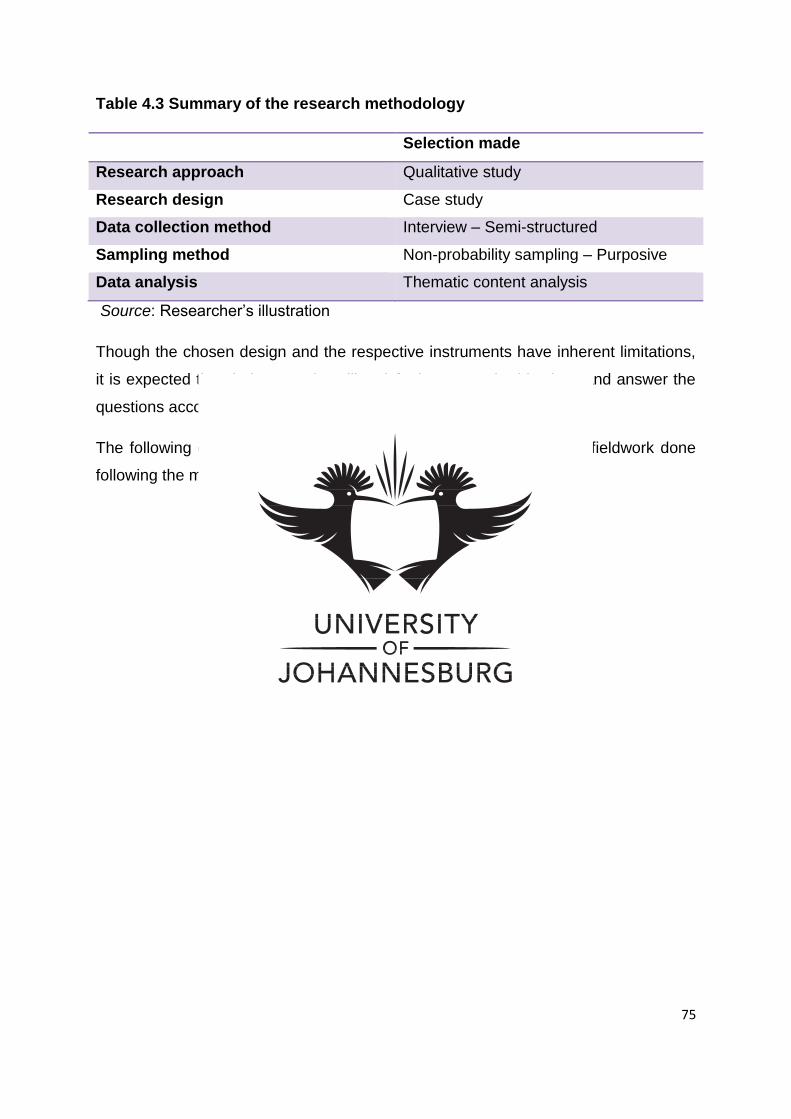
75
Table 4.3 Summary of the research methodology
Selection made
Research approach Qualitative study
Research design Case study
Data collection method Interview – Semi-structured
Sampling method Non-probability sampling – Purposive
Data analysis Thematic content analysis
Source: Researcher’s illustration
Though the chosen design and the respective instruments have inherent limitations,
it is expected that their strengths will satisfy the research objectives and answer the
questions accordingly.
The following chapter describes and analyses the findings from the fieldwork done
following the methodology discussed in this chapter.
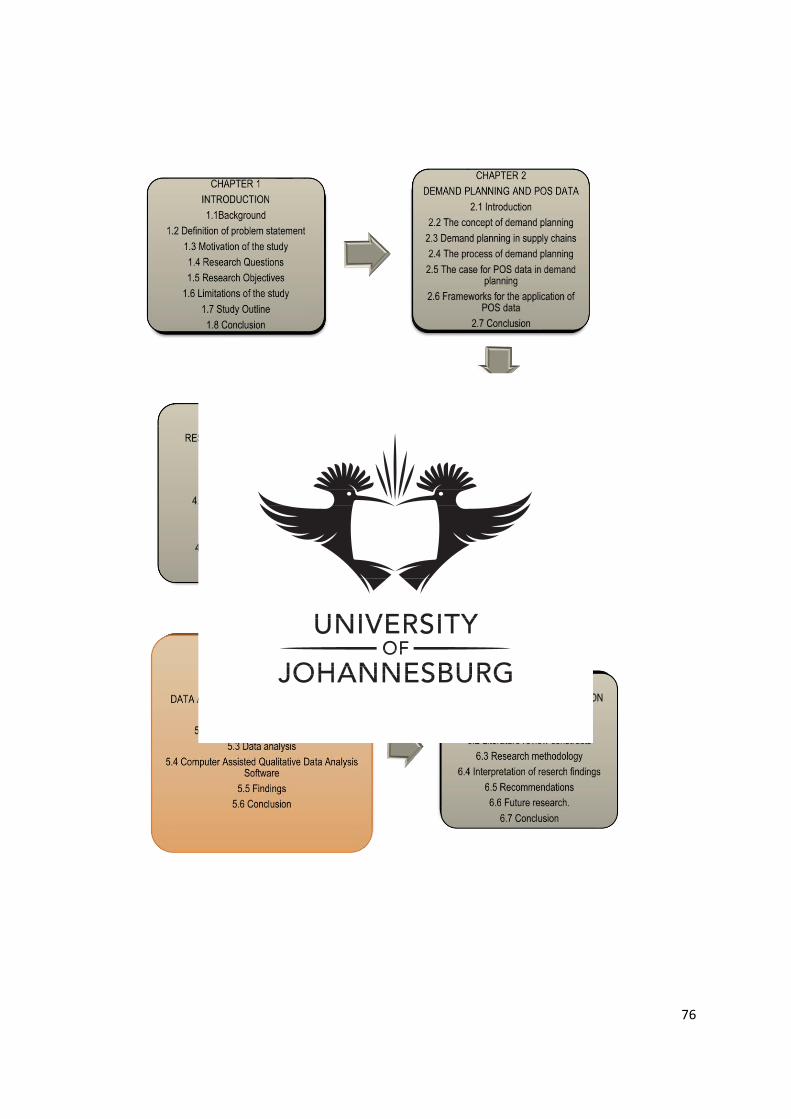
76
77
CHAPTER 5: DATA ANALYSIS AND PRESENTATION OF RESEARCH FINDINGS
5.1 Introduction
This chapter serves to describe and present the findings that emanate from the data
collected through primary research. The previous chapter described the
methodology followed in research design, sampling and the actual data collection.
This chapter starts with a description of the analysis performed to reach the findings
thereof.
5.2 Data capture and organisation
As stated in the previous chapter, the data was collected through semi-structured
interviews. The respondents, who work as demand planners in the companies that
form part of the sample, responded to the questions that are shown as an annexure
(Annexure B) to this study. All the interviews were digitally voice recorded as they
were being performed. These voice recordings were transcribed into text files
verbatim. The transcribed data was then analysed. The analysis followed is
described below.
5.3 Data analysis
Saldana (2011:89) states that the ‘purpose and outcome of analysing data is to
reveal to others, through fresh insights, that which has been observed and
discovered about a particular condition’. It can therefore be said that the process of
data analysis answers the question: what does the collected data say? For this study
the purpose was to reveal the role as well as the usage of point-of-sale data in
demand planning by major clothing retail companies in South Africa.
5.3.1 Approach to analytical rationale
Saunders et al. (2011) suggest that two possible approaches can be followed as
analytical rationales, namely the deductive approach and the inductive approach.
The deductive analytical rationale applies when the research objectives and the
related research questions stem or have been developed from already existing
theories. Deduction is what one generally draws and concludes from established
78
facts and evidence (Saldana: 2011). This approach has, however, been criticised as
there is the likelihood of introducing an untimely conclusion on the issues under
investigation and the potential of the theoretical constructs varying from the views of
participants in a social setting (Saunders et al., 2009).
On the other hand, the inductive analytical rationale, which is the analysis approach
followed in this study, applies when data is collected and explored in order to
observe the themes or issues that emanate from the data, and to discover which
issues to follow up and concentrate on (Saunders et al., 2011). The inductive
approach involves exploring and making inferences, transferring them from the
particular to the general, grounded on scrutiny and investigation of the collected
information (Saldana, 2011). This inductive analytical rationale is also referred to as
a grounded approach ‘because of the nature of the theory or explanation that
emerges as a result of the research’ (Saunders et al., 2009:490).
‘An inductive approach may also combine some elements of a deductive approach
as one seeks to develop a theoretical position and then test its applicability through
subsequent data collection and analysis’ (Saunders et al., 2009:490). Similarly, in
this study, as much as the analysis performed is oriented towards the inductive
analytical rationale, it will not be purely inductive. Reference will also be made to pre-
existing theoretical constructs. The following section discusses the grounded theory
procedure, which is the procedure to be followed under this inductive approach.
5.3.2 Analytical procedure: The grounded theory
The analytical procedure followed in the analysis of the collected data is termed the
grounded theory, which according to Saldana (2011) is an analytic process whereby
the researcher continually compares small data units through a series of cumulative
coding cycles in order to determine a range of dimensions to the emerging themes
and categories. ‘The classic grounded theory is often thought of as the best example
of the inductive approach’ (Saunders et al., 2011:148). The basic idea in this
procedure is, therefore, to look at the small detail from different sources of data in
order to get a bigger picture.
The use of this procedure overcomes the main shortfall associated with deductive
process which has was cited above as being the likelihood of introducing an untimely
79
conclusion on the issues under investigation and the potential of the theoretical
constructs departing widely from the views of participants in a social setting
(Saunders et al., 2011).
5.4 Computer-assisted qualitative data analysis software (CAQDAS)
The grounded theory analytical procedure was implemented with the help of
computer-assisted qualitative data analysis software (CAQDAS). Because the
analysis of qualitative data is a long, cumbersome and iterative process, analysis for
this study was facilitated by CAQDAS. CAQDAS has the following advantages, as
mentioned by Hesse-Biber (2010:23):
It is time effective and therefore analysis takes a shorter time.
It enhances the ability to work the data.
It assists in the development of an organising system.
It allows exploration of different possibilities of data analysis and
interpretation.
It facilitates secondary analysis of qualitative data sets.
Although the usage of CAQDAS has numerous advantages, it also has some
shortfalls, notably that the software may be difficult to use unless one has been
trained in using the particular software at one’s disposal. Furthermore, CAQDAS still
requires effort by the researcher in the interpretation of the coded information to
determine the emerging categories and themes.
The specific brand of CAQDAS that was nominated and used is ATLAS.ti. This
particular CAQDAS facilitates coding, theming and the creation of memos. Figure 5.1
illustrates the grounded theory analysis process followed using the CAQDAS
ATLAS.ti.
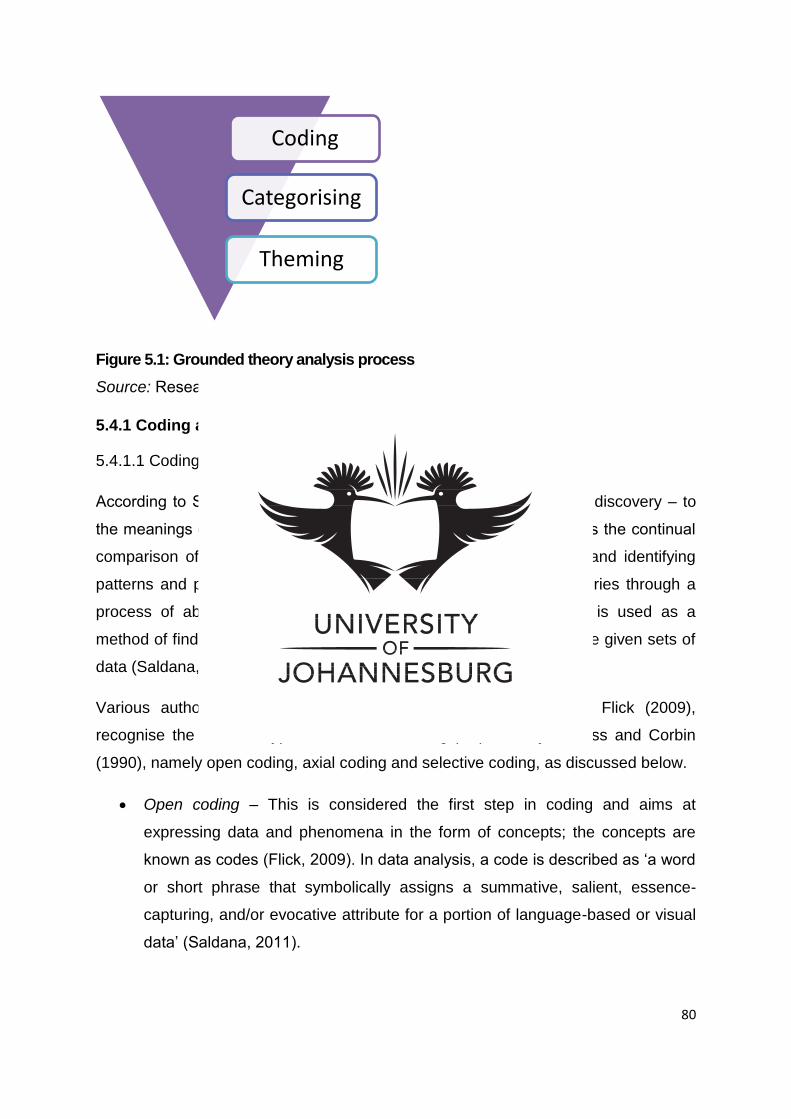
80
Figure 5.1: Grounded theory analysis process
Source: Researcher’s illustration
5.4.1 Coding and data categorisation
5.4.1.1 Coding
According to Saldana (2011:95) ‘coding is a heuristic – a method of discovery – to
the meanings of individual sections of data’. Coding therefore involves the continual
comparison of phenomena, cases, concepts and so on, searching and identifying
patterns and proceeding themes leading to the development of theories through a
process of abstraction (Flick, 2009:307). More simply put, coding is used as a
method of finding patterns, classes and categories emanating from the given sets of
data (Saldana, 2011).
Various authors including Saldana (2011), Saunders (2011) and Flick (2009),
recognise the different types of levels of coding proposed by Strauss and Corbin
(1990), namely open coding, axial coding and selective coding, as discussed below.
Open coding – This is considered the first step in coding and aims at
expressing data and phenomena in the form of concepts; the concepts are
known as codes (Flick, 2009). In data analysis, a code is described as ‘a word
or short phrase that symbolically assigns a summative, salient, essence-
capturing, and/or evocative attribute for a portion of language-based or visual
data’ (Saldana, 2011).
Coding
Categorising
Theming

81
Axial coding – This is the second level of coding and involves searching for
relationships between the categories of data that have emerged from open
coding and shows a process of theoretical development (Saunders, 2011).
Flick (2009) states that at this stage categories emanating from open coding
are refined and differentiated; furthermore, the relations between these
categories are elaborated.
Selective coding – Selective coding is done to ensure that the data analysis
process is integrated. This is done through the identification of one of these
principal categories, termed the central or key category, in order to relate the
other categories (Saunders, 2011). In this stage the emphasis is placed on
recognising and developing the relationships between the principal categories
that have emerged from this grounded theory analytical process (Saunders,
2011:96).
5.4.1.2 Theming the data
Unlike codes, which are most often single words or short phrases that symbolise a
datum, themes are extended phrases or sentences that summarise the manifest
apparent and underlying meanings of data (Saldana, 2011).
In this study, the above-mentioned coding and theming procedure was followed and
used to analyse and make sense of the collected qualitative data. The findings of this
procedure are described in the following section and have been grouped according
to the research objectives. The discussion covers the themes that emanated from
the findings under each objective:
• To determine the nature of the demand planning process as performed in the South African clothing retail industry
• The positioning of a demand planner within the South African clothing
retail companies
• The role of a demand planner within the South African clothing retail
companies
• Demand planning process in the SA clothing retail industry
82
• To determine the systems employed in the collection and dissemination of POS data within the South African clothing supply chains
• The structure of South African clothing industry supply chains
• The nature of products sold within the South African clothing retail
industry
• The collection and dissemination of POS data
• To determine the way POS data is used in the demand planning process within this industry
• The importance of demand planning in clothing retail
• The usage of POS data
• The usage of POS data in demand planning
• To find out the challenges and problems that are faced by South African clothing retailers in the collection, dissemination and usage of POS data in demand planning
• Other organisational functions involved in the process
• Problems faced in POS-based demand planning
• The future of POS data in demand planning
• To determine ways of improving the usage of POS data in demand planning in a South African clothing retail context
5.5 FINDINGS
The analysis was done from eight interview transcriptions of respondents from the
sample retail companies; one interview was done on each of the companies. In order
to protect company and respondent privacy and confidentiality, the companies and
respondents were allocated numbers and are referred to as Company 1 (C1),
Respondent 1 (R1), Company 2 (C2), and Respondent 2 (R2) respectively.
5.5.1 The positioning of a demand planner within the SA clothing retail companies
The term or title demand planner is not universally used in the South African clothing
retail supply chains. This was first experienced in the research process through the
difficulty faced in getting in contact with people performing the role of demand
83
planning. The titles used in these companies include demand planner, demand
forecaster, merchandise planner, retail planner and planner.
However, despite the differences in the titles, the role or work structure of the
individuals in these positions is largely the same. Some of the respondents used
different titles when referring to their role, switching from one name to another. For
the purposes of this description and narrative, the term ‘demand planner’ will be
used to refer to all the people working under these positions who were interviewed.
Figure 5.2 shows the various titles and implied titles of the people who perform the
demand planning role.
Figure 5.2: The various titles used for demand planners in clothing retail companies Source: Network illustration from analysis using Atlas.ti
For the majority of the clothing retail companies (six of the eight respondents), the
hierarchical position of demand planners lies on the middle management level. It
transpired that they report to strategic or executive level individuals. As an example,
the following statements were mentioned:
R4 – ‘It’s middle level. Demand planning is a middle management specialist role so
it’s performed at that level and then is aggregated upwards to the top line
executives and also spread downwards to your assistants.’
R1 – ‘It’s a tactical level, which falls under the middle management tier within the
company’s hierarchy.’
84
However, one of the respondents mentioned that the position occupied by their
demand planners is at an operational level, and this respondent was quoted saying:
R6 – ‘It’s a fairly junior position in the company. Very focused.’
5.5.2 The role of a demand planner within the SA clothing retail companies
The responsibilities or duties performed by the planners in the different companies
vary and the jurisdiction the planners have within their companies also varies. As
much as the tasks performed differ somewhat from company to company, there are
some common roles that most or all of the respondents said they perform. The role
that is notably common to all the demand planners is determining demand forecasts.
The following quotes of respondents show how forecasting is a common role
performed by demand planners:
R1 – ‘We look at data with the objective of optimising the forecasts going forward.’
R3 – ‘Our main function is to basically reforecast product for best potential sales in
the future season.’
R4 – ‘It entails forecasting for the replenishment of eligible products.’
R5 – ‘For those kind of programs, we do constant forecasting.’
R5 – ‘You review your forecasts on a frequent basis and amend as required
whether you are trading down or up.’
R7 – ‘To assist in creating a forecast that is reliable that is reflective of the current
trend.’
R8 – ‘We do forecasts and demand planning for the different buyers’ class
structures.’
Although forecasting forms the foundational role of the demand planners, their role is
not limited to that; demand planning is a broader concept. This distinction shows that
the role of the respondents in this study is not mere demand forecasting but demand
planning. This is because their roles go beyond determining forecasts in creating an
alignment between demand planning and company strategy.
Most of the respondents in this study displayed an understanding of the difference
between demand forecasting and demand planning. The quotes below show the
respondents’ understanding of the two concepts:

85
R1 – ‘Planners will sense the strategy for the product and take some of that into the
process and feed it into your forecast.’
R2 – ‘We forecast basic sales that we can achieve in the future season to maximise
growth and profit.’
R3 – ‘You review your forecasts on a frequent basis and amend as required whether
you are trading down or up.’
The statements above show that the demand planners are conscious of the fact that
the demand planning role goes beyond demand forecasting. Figure 5.3 shows the
various codes (in vivo codes) that were created from the descriptions made by the
respondents on their roles other than forecasting.
Figure 5.3: Other roles of demand planners Source: Network illustration from analysis using Atlas.ti
5.5.3 Demand planning process in the SA clothing retail industry
Literature discussed in Chapter 2 suggested that there are different models and
frameworks that are followed in the process of demand planning. Similar to this
sentiment, the analysis of the interviews done reveals that companies in the South
African clothing retail sector follow different steps in demand planning.
Despite the differences in the approaches followed by the different companies,
86
similarities were noted. First the process of demand planning is an iterative process
across most companies; it has a given series of steps where different input factors
are considered. Some respondents had this to say on the process that their
company follows in demand planning:
R6 – ‘So you review that constantly, is it up or down and the performance relevant to
the base and how you react according to it.’
R7 – ‘We have different inputs that make up or result in our forecast. So the steps in
the process include considering and using all your influencing inputs.’
Secondly, demand planning in the clothing industry depends on historical data, the
data that has been collected from previous sales. The past sales data gives a
general guide as to what the customer preferences are, and thus helps the demand
planning team to know which stock keeping units (SKUs) are selling and which are
not. As mentioned in Chapter 2, past sales data is the closest representative of the
true customer consumption of a product. The sales history would therefore be a
good starting point to understanding the customer demand and the replenishment
requirements thereof. Below are some of the comments made by the respondents
concerning sales history:
R1 – ‘We start off by understanding what needs to be on replenishment from a
business point of view and that is determined by the planners.’
R4 – ‘In demand planning, you start with your data, your history.’
R7 – ‘These inputs include previously collected information from past sales, which
serve as a guide and then we make various considerations, additions to this to
get our forecasts.’
5.5.4 Structure of SA clothing industry supply chains
Based on the information gathered, the South African clothing industry has a supply
chain that is characterised by much dependence on imported products. Notably, the
respondents mentioned China as the biggest contributor to the products that they
sell. These retail companies also source some of their products locally but the
quantity is said to be relatively much lower.
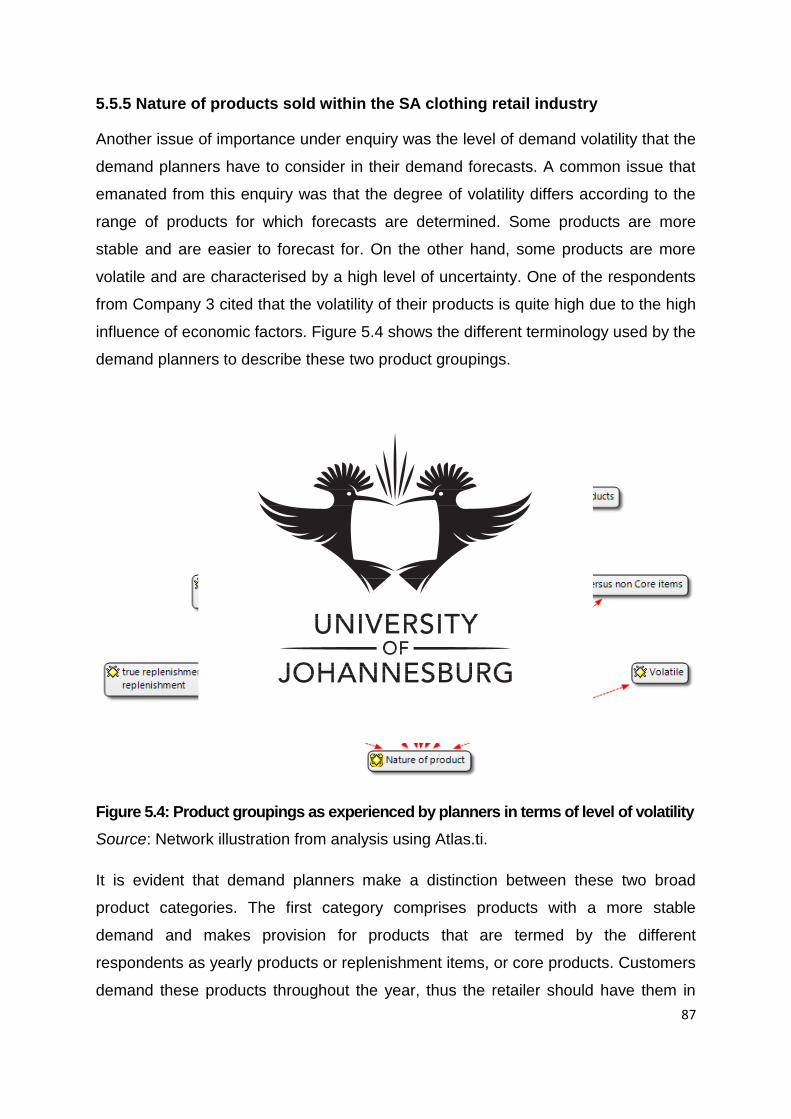
87
5.5.5 Nature of products sold within the SA clothing retail industry
Another issue of importance under enquiry was the level of demand volatility that the
demand planners have to consider in their demand forecasts. A common issue that
emanated from this enquiry was that the degree of volatility differs according to the
range of products for which forecasts are determined. Some products are more
stable and are easier to forecast for. On the other hand, some products are more
volatile and are characterised by a high level of uncertainty. One of the respondents
from Company 3 cited that the volatility of their products is quite high due to the high
influence of economic factors. Figure 5.4 shows the different terminology used by the
demand planners to describe these two product groupings.
Figure 5.4: Product groupings as experienced by planners in terms of level of volatility Source: Network illustration from analysis using Atlas.ti.
It is evident that demand planners make a distinction between these two broad
product categories. The first category comprises products with a more stable
demand and makes provision for products that are termed by the different
respondents as yearly products or replenishment items, or core products. Customers
demand these products throughout the year, thus the retailer should have them in
88
stock all year round. Some of the examples under this category include white or
black t-shirts, socks and underwear. One of the respondents described this category
of products in the following way:
R2 – ‘You have bread and butter lines, like basic shorts, basic t-shirts, basic polos
which we will continuously have in our store, so that’s easy peezy.’
The second category is the one that is more volatile and uncertain; the products
could be new to the market and therefore there is no historical reference point to
guide forecasts. Furthermore, these kinds of products could be what is termed
seasonal products or trend items or non-core. This category of products changes
over time and therefore is more volatile. One of the respondents described this
category of products in the following way:
R4 – ‘For the seasonal goods, we have minimal forecasting because that process
is generally led by fashions trends which are qualitative rather than
quantitative.’
5.5.6 The collection and dissemination of POS data
The POS data collection systems in all the respondents’ companies collect the
information of a particular sale at store level; the data scanning or collection systems
are linked to a central system where all the sales information from different stores is
aggregated and stored.
Although the general POS details such as the product item, price and size that are
collected at the point of purchase is similar from one company to the next, it was
noted that different companies have different output information on their systems. On
collection, the details are shown at SKU level, but when the planners pull data from
the system, the output would be aggregated in a way that is convenient to the user.
One respondent mentioned that the different departments can pull out the detail or
report that they need from the system. A respondent mentioned the following detail is
collected and contained by the database:
R4 – ‘It’s not only sales data that is captured. You have transfers, transfers in and
transfers out captured; you’ve got markdowns and promotions that are
89
captured. You’ve got obsolete stock write-offs as well as captured from the
POS system.’
In this collection, dissemination and usage of POS data, it is notable that technology
plays a fundamental role. Results suggest that modern-day demand planning
depends on the availability of suitable technology. The respondents cited the
following:
R1 – ‘Our processes depend on our systems, our technology, from software to
hardware. Technology is very important. Today we can do more electronically
compared to what could be done in the past manually.’
R4 – ‘Technology is crucial because, for example, the work that we do, it goes
across 525 stores, cross combinations that get to close to 2 million product
lines. So a human being cannot perform such a function to have 500 stores
having 2 million forecasts.’
R8 – ‘Technology and systems play a vital role from a data warehousing point-of-
view; the foundational kind of information that you can use as the basis for
any forecast or plan is what our database holds.’
Data analysis results suggest that the role of technology in the demand planning
process includes the following:
1. Data capturing – This is done when stock is received in stores and also when
a sale takes place. This is normally done through barcoding and the
complementary scanning system. The implementation of such systems can
ensure more accuracy.
2. Data dissemination – Technological systems have greatly improved the speed
of data transfer, for example, one of the respondents cited that they can see
the sales as they happen on a live system.
3. Data storage – The captured data is stored in a company database and can
be retrieved as and when needed. Clothing retail companies have thousands
of SKUs and it would be a very difficult task to store and retrieve this
information if the current technological systems were not in place.
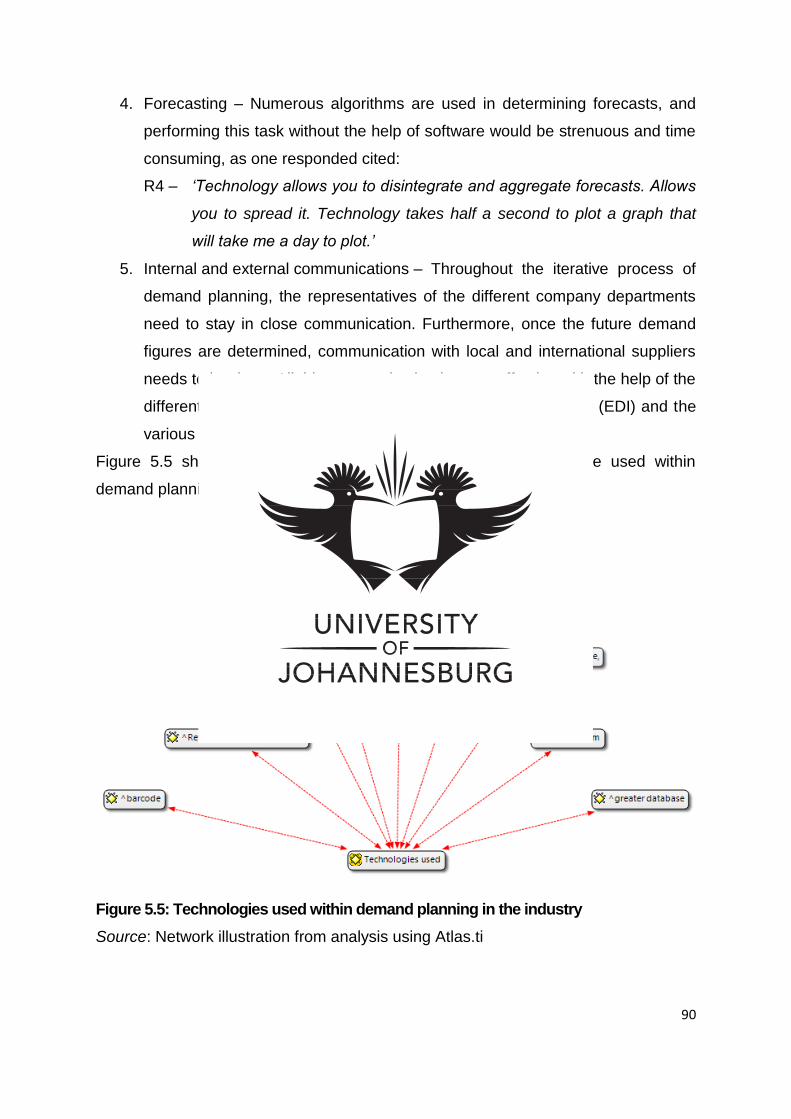
90
4. Forecasting – Numerous algorithms are used in determining forecasts, and
performing this task without the help of software would be strenuous and time
consuming, as one responded cited:
R4 – ‘Technology allows you to disintegrate and aggregate forecasts. Allows
you to spread it. Technology takes half a second to plot a graph that
will take me a day to plot.’
5. Internal and external communications – Throughout the iterative process of
demand planning, the representatives of the different company departments
need to stay in close communication. Furthermore, once the future demand
figures are determined, communication with local and international suppliers
needs to be done. All this communication is more effective with the help of the
different technological systems like electronic data interchange (EDI) and the
various online interfaces.
Figure 5.5 shows a summary of the various technologies that are used within
demand planning in the South African clothing retail industry.
Figure 5.5: Technologies used within demand planning in the industry Source: Network illustration from analysis using Atlas.ti

91
5.5.7 The importance of demand planning in clothing retail
Of the many reasons supporting the importance of demand planning within these
clothing retail companies, inventory positioning and availability stood out.
Respondents expressed this reason in different ways as shown below, and Figure
5.6 shows a summary of these responses.
R2 – ‘It’s actually vital because we have people that provide the buying team with
all the data to make the correct decisions whether it will be colour analysis,
whether it will be size analysis.’
R3 – ‘It’s crucial, l mean it’s all about getting the right type of stock at the right store
at the right time and that is basically what we do on a strategic level while at
the same time managing our working capital; we don’t want to spend too
much money.’
R5 – ‘It’s vitally important. Like I said one of the goals as a planner, the
responsibility and accountability first of all is to ensure that you get
merchandise to the right locations within the right volumes so that you can
capitalise and maximise your turnover opportunity.’
R8 – ‘It plays a very important role. In order to meet your customer demand, what
you need to ensure from an inventory management perspective is that you
are never in a stock out situation. So, you always want to ensure that if the
sales potential is there you want the stock to be there to support it.’
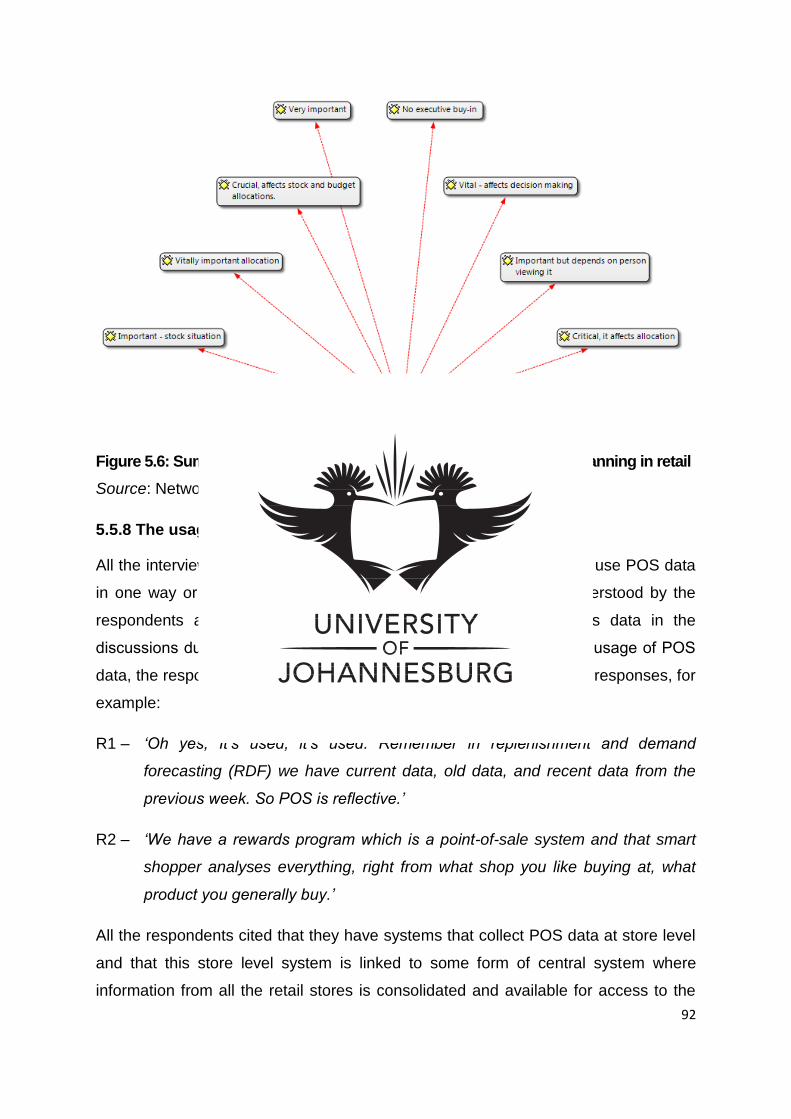
92
Figure 5.6: Summary of the responses on the importance of demand planning in retail Source: Network illustration from analysis using Atlas.ti
5.5.8 The usage of POS data
All the interviewed respondents cited that their companies collect and use POS data
in one way or another. The concept of POS data is universally understood by the
respondents and they referred to it either as POS data or sales data in the
discussions during the interview. When asked about their company’s usage of POS
data, the respondents had a strong affirmation and confidence in their responses, for
example:
R1 – ‘Oh yes, It’s used, it’s used. Remember in replenishment and demand
forecasting (RDF) we have current data, old data, and recent data from the
previous week. So POS is reflective.’
R2 – ‘We have a rewards program which is a point-of-sale system and that smart
shopper analyses everything, right from what shop you like buying at, what
product you generally buy.’
All the respondents cited that they have systems that collect POS data at store level
and that this store level system is linked to some form of central system where
information from all the retail stores is consolidated and available for access to the

93
different company functions. All the respondents cited that they have access to their
company’s POS database. The demand planning and other functions that are part of
their company can pull out the specific data they want that is relevant for their
planning or reporting requirements.
In as much as all of the respondents have access, the time lag in terms of availability
of the POS data to the demand planners varies from one company to the next. In the
interviews done, the longest time lag is one week and the shortest being the one
where they have a live system. The one-week time lag means that the store’s data is
only available as a weekly sales report and a live system implies that the demand
planners can observe sales as they happen.
R3 – ‘On a weekly basis we receive aggregated data of the sale information and we
have access to all of the information relevant for our reports as well as
forecasting.’
R4 – ‘The sale is captured as a sale and because data is transmitted live.’
The implication of the lag time on POS availability concerns stock response time and
supply chain visibility. The quicker the access to POS the more visible the supply
chain; on the other hand, the delay in access or availability of POS data to the
company’s functions and suppliers hampers supply chain visibility. Nevertheless, the
actual measure of visibility would be relative and subjective. More than half of the
respondents cited that they have a one-day time lag access to POS data from the
time a sale happens. For example:
R2 – ‘We get sales reports once a week, so basically we would analyse weekly
sales but we can get sales back daily. So if I needed to look at something
specific at any point in time, I can have all that information up right now.’
The second impact of the time lag in POS data access and availability is on
response to replenishment requirements at stores. For example, a weekly time lag
means that a stock out for a product in a particular store can be seen by planners or
allocators seven days after it has occurred. This means that response to stock
requirements will take longer and the period that elapses with a store having a stock
out represents lost opportunities and costs.
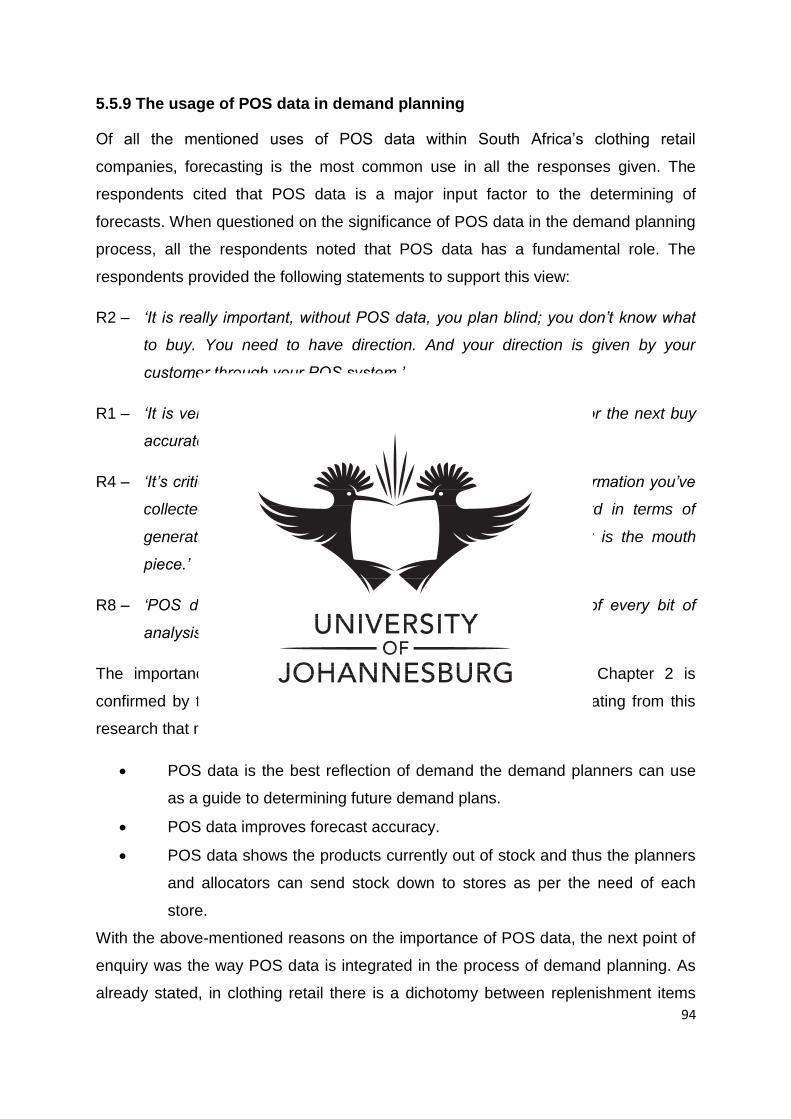
94
5.5.9 The usage of POS data in demand planning
Of all the mentioned uses of POS data within South Africa’s clothing retail
companies, forecasting is the most common use in all the responses given. The
respondents cited that POS data is a major input factor to the determining of
forecasts. When questioned on the significance of POS data in the demand planning
process, all the respondents noted that POS data has a fundamental role. The
respondents provided the following statements to support this view:
R2 – ‘It is really important, without POS data, you plan blind; you don’t know what
to buy. You need to have direction. And your direction is given by your
customer through your POS system.’
R1 – ‘It is very important; I mean how do we even forecast better for the next buy
accurately? So it is very important.’
R4 – ‘It’s critical because that forms your base data, so it is that information you’ve
collected from the point of sale that you use to go forward in terms of
generating your forecasts (......) So it is critical. In fact, that is the mouth
piece.’
R8 – ‘POS data is vitally important because it is the foundation of every bit of
analysis that we do.’
The importance of POS data in demand planning described in Chapter 2 is
confirmed by these respondents. The most important reasons emanating from this
research that make POS data fundamental in demand planning are:
POS data is the best reflection of demand the demand planners can use
as a guide to determining future demand plans.
POS data improves forecast accuracy.
POS data shows the products currently out of stock and thus the planners
and allocators can send stock down to stores as per the need of each
store.
With the above-mentioned reasons on the importance of POS data, the next point of
enquiry was the way POS data is integrated in the process of demand planning. As
already stated, in clothing retail there is a dichotomy between replenishment items

95
versus trend items; this distinction also affects the application or integration of POS
data into demand planning. POS data shows historic sales information and is most
suitable for replenishment items which have a continual demand. In this case, POS
data can be used as a guide to how much each store requires of the item in the next
delivery.
On the other hand, trend items are products that change from season to season or
from one period to the next. In this case POS data may not be the best reflection of
what the future demand for trend items could be. POS data may also not be relevant
for a new product item that has no historic sales data, and other factors will have to
be used to guide demand planning for such products. Lastly, POS data may also be
irrelevant for products where the stock keeping levels are dictated by the supplier, as
suppliers of big brands have leverage over retailers and may have the onus of
dictating how much of a product to allocate to retailers.
In the light of this difference, below are some quotes by the respondents on the
relevance of POS data for each product type:
R1 – ‘Trends, as you know, change over time and are more volatile. Your
replenishment items are more stable. We mainly forecast for replenishment
items.’
R1 – ‘For newer products you won’t have any POS data but you will have to get
your cue from the POS of the related products and plan accordingly.’
R5 – ‘We work obviously with all the big brands internationally like Nike, Adidas and
Converse. There’s not so much control in terms of original concept and
development on that front.’
Another source of information that is said to be useful in the process of demand
planning is third-party-sourced sales data within the overall industry. These different
third party companies are involved in the trade of sales and trends information, and
they may provide direction to the different companies on their market performance.
Companies can thus proceed in line with the direction that the market is taking. From
this study, it seems the role of third-party-sourced data is of minimal significance;

96
respondents were either using it minimally or not at all. For example, some
respondents mentioned the following:
R1 – ‘Our forecasts are largely based on the information we collect within our
stores and I am not sure about other departments but as demand forecasters
(DFs) we don’t use any. If the other departments do, it’s probably minimal.’
R2 – ‘I think in terms of us making paradigm shifts of strategic decisions, that kind
of data think so big hey. Because what we do is, we kind of involved in the
market already so we are out there, we know what must be we buy.’
R4 – ‘It is negligible but still important because it gives you that bearing in terms of
direction but not in terms actual forecasting.’
Over and above the POS data which is said to be the key input in demand planning,
there are other factors that are also considered in determining demand figures.
Findings show that the involvement of the different organisational functions means
that there are different input factors that are considered before agreeing on the final
future demand figures. When probed on what other factors are considered in
determining forecasts, all respondents confidently stated that POS data is not the
only input factor:
R2 – ‘You mostly use and analyse sales data then the buying department, they
travel overseas quite frequently and generally see the overseas trends which
they then bring in.’
R4 – ‘So there are various issues to consider in your adjustment. But remember
your product when you forecast for it, you have already compartmentalised it.
So when you forecast for men’s jeans, you not going to apply the same
thinking as boys’ jeans.’
R5 – ‘Different factors, qualitative and quantitative factors, exist that are factored in
the determination of forecast. For example, one of the qualitative factors that
we look at is the competitive landscape.’
From the information gathered, it can be seen that demand planning is not a mere
forecast of future demand based on historical sales, but is a collaborative and
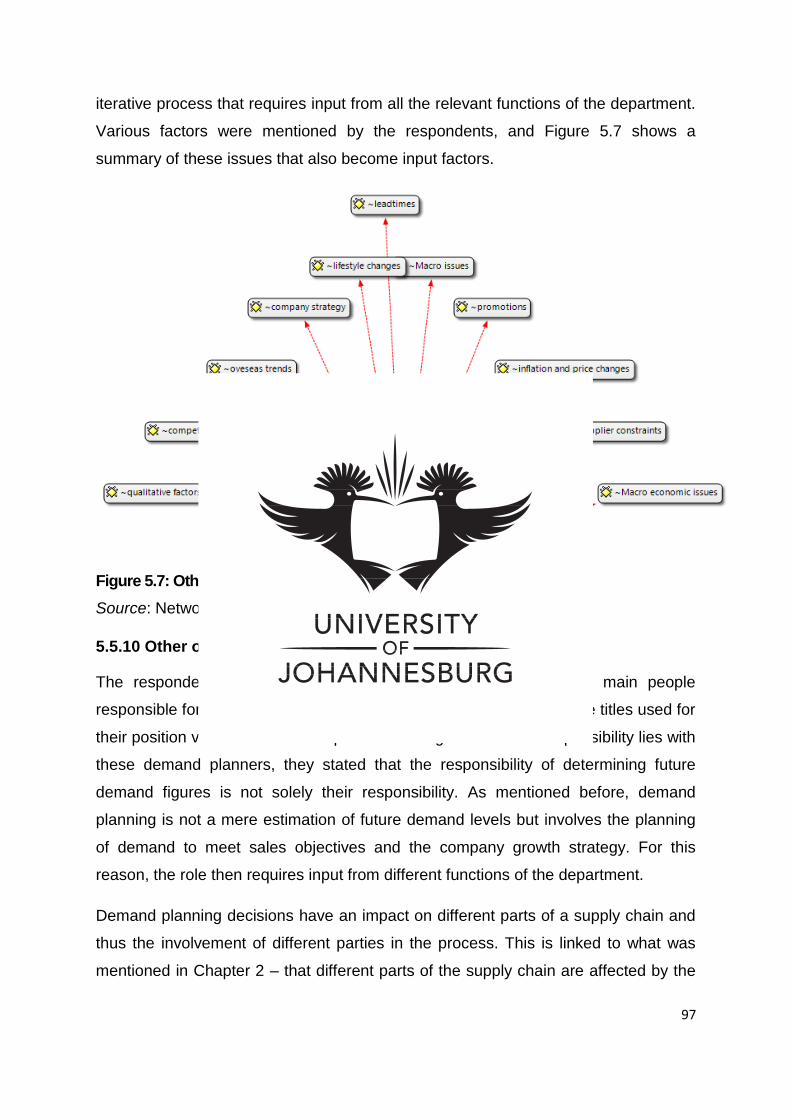
97
iterative process that requires input from all the relevant functions of the department.
Various factors were mentioned by the respondents, and Figure 5.7 shows a
summary of these issues that also become input factors.
Figure 5.7: Other input factors in demand planning Source: Network illustration from analysis using Atlas.ti
5.5.10 Other organisational functions involved in the process
The respondents that were interviewed for this research are the main people
responsible for the task of demand planning and as already stated, the titles used for
their position varies between companies. Although most of the responsibility lies with
these demand planners, they stated that the responsibility of determining future
demand figures is not solely their responsibility. As mentioned before, demand
planning is not a mere estimation of future demand levels but involves the planning
of demand to meet sales objectives and the company growth strategy. For this
reason, the role then requires input from different functions of the department.
Demand planning decisions have an impact on different parts of a supply chain and
thus the involvement of different parties in the process. This is linked to what was
mentioned in Chapter 2 – that different parts of the supply chain are affected by the
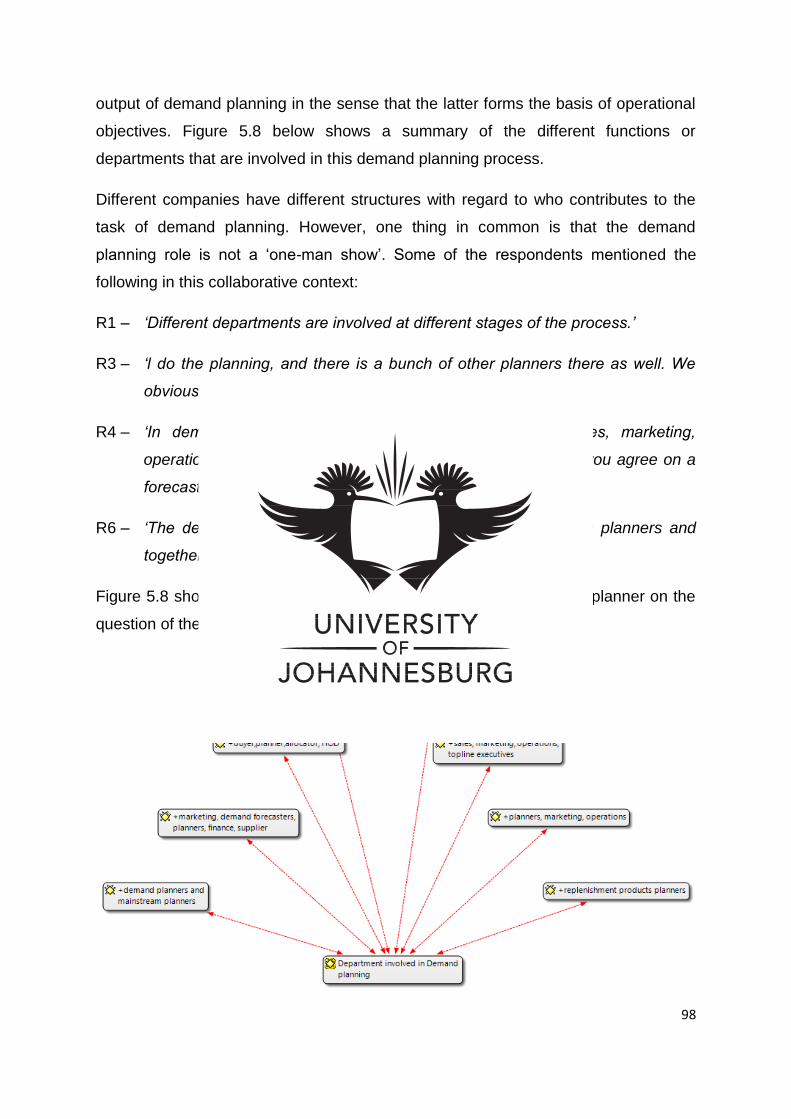
98
output of demand planning in the sense that the latter forms the basis of operational
objectives. Figure 5.8 below shows a summary of the different functions or
departments that are involved in this demand planning process.
Different companies have different structures with regard to who contributes to the
task of demand planning. However, one thing in common is that the demand
planning role is not a ‘one-man show’. Some of the respondents mentioned the
following in this collaborative context:
R1 – ‘Different departments are involved at different stages of the process.’
R3 – ‘l do the planning, and there is a bunch of other planners there as well. We
obviously report to a merchandise manager.’
R4 – ‘In demand planning, there is a lot of collaboration, sales, marketing,
operations and also top-line executives. You collaborate and you agree on a
forecast and you work on that forecast to go forward.’
R6 – ‘The demand planners work in collaboration with mainstream planners and
together they create the final plan.’
Figure 5.8 shows a summary of the responses given by the demand planner on the
question of the organisational functions involved in demand planning.
99
Figure 5.8: The organisational functions involved in demand planning Source: Network illustration from analysis using Atlas.ti
Demand planning thus requires a collaborative effort, whereby the various
department representatives give their input so that every demand function works
towards the same goal. This goes back to the argument by Fay (2010:32) mentioned
in Chapter 2 that, if supply chains move forward without a clear insight and a
collaborative set of objectives and direction, they will be faced with a high level of
customer dissatisfaction, increased cost and obsolescence, and ultimately a loss of
revenue and market share.
5.5.11 Problems in POS-based demand planning
The respondents cited that there are problems faced in the collection and usage of
POS data for demand planning purposes. Of the eight respondents, only one
claimed not to be facing any problems in this regard. The continuum of problems
differs from one company to another despite some commonalities.
A common problem cited in most companies is that of human intervention.
Respondents echoed that the collection of POS data is done and influenced by store
level staff.
R5 – ‘The risk of human influence … So in the event that you have sold items but
not acknowledge but you give to a customer without scanning, as a store
manager you can override it, you can say that wasn’t a sale, so I’m going to
“zerrorise” it.’
R7 – ‘Of course, there is human intervention.’
R8 – ‘Also the other problem that I think is not a unique problem with us but with
most retailers is the integrity of that information is only as good as the way it is
handled from the operational perspective in stores.’
Problems that could be linked to human interference include the inherent human
error; this may include among other things the double scanning of a product and the
mismatching of products and barcode tags. The mismatching of barcode tags is said
to happen when a product has a missing tag; in an attempt to solve this problem, a
100
staff member may decide to use the tag on another item with the same price. This
action may cause misleading data as a common price does not necessarily mean
common colour or size.
Another problem linked to human interference is the manipulation of data by store
level managers. This right of being able to manipulate store data can make the
system vulnerable to unethical tendencies and actions like fraud and pilferage. A
further problem faced at a demand planning level is the subjectivity and bias in the
interpretation of the collected information. Users of POS data must make sense of
the collected data by extrapolating various meanings of the data. One respondent
mentioned the following in this regard:
R2 – ‘Any data that you get is subjective and all dependent on interpretation. So if
you are an inexperienced planner you can misread your data and present
information that is incorrect.’
Respondents also mentioned system- and technology-related problems. The users
sometimes face technical problems associated with the operation of the systems and
technology. Some respondents mentioned the following on technological problems:
R4 – ‘Its transmission, downtimes, power outages, disconnection …’
R7 – ‘I’d be working and the system would freeze. So the capacity of the network or
computer or whatever should be that it can handle that kind of information …’
5.5.12 The future of POS data in demand planning in the SA clothing retail industry
Respondents highlighted some views on the future of the usage of POS data, in
terms of potential improvements as well as its future role in the process of demand
planning. One area of improvement, common to some respondents, is training and
education. There is need for training of the different personnel that deal with POS
data at any point, be it collection, analysis or usage. One of the respondents cited
that store level personnel need to be trained on the need to preserve the integrity of
POS data. There is also a need to train managers on the importance of POS-based
demand planning.
101
Another area with potential for improvement was that of the time lag between
collection and availability of POS data on the central system. Respondents cited that
sale figures in the POS data need to be readily accessible in a relatively shorter time
lag. Shorter time lags will allow quicker response to the stock requirements in the
respective stores, and will allow the demand planners to quickly sense any shifts in
consumer tastes and preferences as well as demand patterns for their products.
Shorter time lags take advantage of the real value of POS data, which is the fact that
POS data is as close to ‘actual demand’ figures that most companies can get.
Therefore, late access to this data defeats the purpose thereof. The quicker transfer
of POS data to the various members of the supply also enhances supply chain
visibility and integration.
The other area of possible improvement lies with the system and technology used to
collect and analyse POS data. First, it is suggested that the system should block
human manipulation of data on the system. This will ensure that the integrity of the
data is preserved. Furthermore, better systems are being developed and the old
systems are being upgraded. Companies within the clothing industry need to identify
systems, algorithms and software that are most suited for their needs so they can
better use POS data in their demand planning.
Improvement in the collection of customer-related information was also mentioned.
Although some of these companies already collect customer-related information
through their loyalty programmes, some of these retail companies do not. The
collection of customer-related information will help develop customer profiles and
store profiles in terms of the type of shoppers in a specific store, thereby assisting
planners to better forecast and improve the alignment of their plans.
5.6 CONCLUSION
This chapter has been dedicated to describing the analysis approach, the method of
analysis, and the steps followed in the analysis. It ended with a description of the
research findings.
An inductive analytical approach was followed since the theories, conclusions and
deductions were made from the data collected. The strengths and weaknesses of
this method were described. Because of this approach, coupled with the nature of
102
the collected data, the grounded theory analytical procedure was followed. This
theory approach meant that there was continual comparing of the data sets in order
to derive themes. To facilitate the application of the grounded theory procedure,
CAQDAS was used. The specific software used and referred to in the description of
the findings was Atlas.ti. With help of this software, grounded theory principles were
applied and implemented. Coding was done and these codes were used to identify
the commonalities which are the themes that have been described in the findings.
The research findings were structured in accordance with the research objectives
and research so that these objectives and questions could deliberately be addressed
by the findings emanating from the data collected. Many issues arose from the
analysis done and some of the notable ones include:
• The various roles of demand planners with the South African clothing retail
industry
• The demand planning process as performed in the South African clothing
retail industry
• The importance of demand planning
• The uses of POS data
• The fundamental role of POS data in demand planning
• The areas of potential improvements in the usage of POS data in demand
planning, for example technology and training of staff
As this chapter has provided a description of the findings, the next chapter is
dedicated to interpreting these results and checking whether the research objectives
have been achieved. The findings emanating from this chapter were further analysed
by following the grounded theory approach in order to draw conclusions, find
solutions and propose recommendations.
103
104
CHAPTER 6: CONCLUSION, INTERPRETATION AND RECOMMENDATIONS
6.1 Introduction
This study focuses on the usage of POS data in the demand planning process within
the South African clothing retail industry. Thus far, through literature review and
primary research, various issues relevant to demand planning have been discussed.
This chapter brings together the theoretical constructs and findings for interpreting
and drawing useful conclusions
Furthermore, recommendations are made on some of the problems as well as
opportunities identified from the study done.
6.2 Literature review theoretical constructs
In this study, various sources of information were consulted and referred to, including
journal articles, textbooks, websites and reports. The literature review culminated in
the identification and development of the theoretical constructs used in this study. A
relatively smaller amount of literature review was done in Chapter 1; however,
Chapters 2 and 3 had a more extensive literature review covering the usage of POS
data in demand planning and the nature of the South African clothing retail industry,
respectively.
Based on the literature review on demand planning and the usage of POS data
therein, a research gap or research problem was identified which focused on the lack
of information concerning the demand planning processes used by South African
retailers as well the influence of POS data within South African industries. With the
South African clothing retail industry as the focus area, the following research
objectives were developed:
Primary objective
• To determine the extent to which businesses in the South African clothing
retail industry use POS data in demand planning
Secondary objectives
105
• To determine the nature of the demand planning process as performed in the
South African clothing retail industry
• To determine the systems employed for the collection and dissemination of
POS data
• To determine the way POS data is used in the demand planning process
within this industry
• To determine ways improving the usage of POS data in demand planning in a
South African clothing retail context
• To find out the challenges and problems that are faced by South African
clothing retailers in the collection, dissemination and usage of POS data in
demand planning
The following section discusses the theoretical constructs that emanated from the
literature review; these constructs were used to guide and align the primary research
performed. First, the discussion focuses on the concept and sub-concepts of
demand planning and the role of POS data in demand planning. Furthermore, the
structure and characteristics of the global and South African clothing industry are
briefly discussed. The section also discusses the research methodology that was
followed to collect data to fulfil the research objectives.
6.2.1 Demand planning and the role of POS data
In Chapter 2, literature was reviewed with a focus on the demand planning process,
its framework as well as the use of POS data in the process. Through this review,
various issues came to the fore. First, demand planning was described as one of the
logistics or supply chain management activities concerned with future customer
demand issues such as forecasting, sales growth strategies, inventory efficiency and
related cost reductions. A distinction was made between demand planning and
forecasting where the latter is mostly concerned with mathematically extrapolating
prior demand values into the future, proposing that future demand will follow the
same patterns. Demand planning uses various input factors from the different
company departments; on the other hand, the output of demand planning also has
impact on the various functions.
Demand planning was said to be an important function within modern-day supply
chains and this is due to the following motivations:
106
Demand planning allows businesses to understand the nature of consumer
demand and ensures that the supply response is suited for this demand.
Demand planning presents a good opportunity for supply chains to focus on
the consumer and create the optimal value thereof.
Effective demand plans avoid the costs associated with a mismatch between
demand and supply, be it excess inventory costs or stock out costs.
Another issue discussed was the need for collaborative effort in demand planning.
Instead of independently trying to project demand patterns, supply chain members
and different organisational functions share information and work together in
determining future demand plans. Submitting arbitrary demand plans to different
members of the supply chain without involving them in the actual planning process is
considered bad demand planning practice. Collaboration between different functions
and supply chain members becomes necessary to overlay judgement over the
statistical forecasts. This involves the consideration of other qualitative and
quantitative factors that may not have been included in the primary forecasts but are
considered relevant in determining future plans. Various collaborative initiatives can
be followed in the demand planning process, including:
Collaborative planning, forecasting, and replenishment (CPFR)
Automatic replenishment programs (ARP)
Vendor managed inventory (VMI)
Seeing that this study is focused on POS-based demand planning, Chapter 2 also
discussed the role and importance of POS data in demand planning. POS data is
described as the information that is collected at the point where a product is bought
by the final consumer. The usage of POS in demand planning is said to improve the
effectiveness of the demand plans. Modern-day technologies have made the
collection of POS data much easier than before. POS data can either be sourced
directly from the point of purchase at store level or sourced from third-party vendors,
each of these having its own pros and cons. POS data contains details about a
particular sales transaction. The different transactions can be aggregated to show
the total sales quantities per product.
The suggested valuable role of POS data in the demand planning process lies in the
characteristics it possesses, including:
107
It is the best reflection of demand – POS data shields retailers and
suppliers from the misinterpretation and amplification of downstream
demand signals created by practices such as forward buying, duplicate
ordering and batch ordering (Keifer, 2010).
It improves forecast accuracy – POS data gives a quick, near real-time
look at the products moving through a specific retail channel.
It enhances the implementation of collaborative strategies – The usage of
POS data requires information sharing and coordination between
members of the supply chain and organisational functions; thus, it is said
to ‘help bring order to chaos’.
POS data is free from inventory decisions – Inventory decisions can hide
the underlying sales trend and thus cause misleading sales forecasts.
Despite these POS data characteristics which can enhance the demand planning
process, it is generally said that companies are not making full use of this valuable
data. Various ways were proposed as to how POS data can be integrated into the
demand planning process.
6.2.2 The South African clothing retail industry In Chapter 3, the focus was on describing the clothing industry, and more specifically
the South African clothing retail industry. Of note was that the global clothing supply
chains have been going through tremendous changes, especially after the
Agreement on Textiles and Clothing (ATC) in 2005. In short, the ATC led to the
abolishment of quota restrictions and protectionism that was in place in most
countries and led to a move towards liberalisation of the industry. This generally led
to a more open international clothing market. The clothing industry has a significant
economic influence in many countries especially in low-income Asian countries. It
contributes to employment creation and national development.
The structure of the global clothing supply chains is configured such that the major
production in this industry is done in low-income countries while the highest
consumption is in the developed countries. This concentration of production in
developing Asian countries is driven mainly by low labour cost. The clothing industry
is said to be a buyer-driven industry; it is highly competitive and has a fast pace of
108
change in the demands of individual buyers. To survive in this industry, competitors
create resilient brands and employ intensive marketing campaigns.
In the context of South Africa, the industry is largely dependent on imported
products, more specifically from China. Before South Africa joined the World Trade
Organisation (WTO), the industry was characterised by a high level of protectionism.
After South Africa joined the WTO, it opened its industry to global trade and now
provides a huge amount of the country’s employment. South Africa was also affected
by the ATC, which had a negative impact on local manufacturers as they now have
to compete with manufacturers located in low-wage regions, most notably China and
India. Some efforts to fight this phenomenon, such as the Proudly South African
campaign have not been effective enough in doing so.
This study focused on the retailing part of the clothing industry. The South African
retail sector is growing as evidenced by the proliferation of retail spaces through
shopping malls or centres. Clothing retailing is also a part of this growth. Of the
seven retail clusters, clothing retail is termed clothing, footwear and textiles (CFT)
and as of 2014 had the second highest share of total retail sales. It constituted 21%
of the total retail sales after general dealers. This CFT cluster also had the highest
growth rate, with women’s apparel dominating the cluster.
South African clothing retailing can be divided into mainstream retail and ‘alternative
retail’; the former includes the major formal clothing retailers like Edcon and Mr Price
Clothing, while the latter includes customised tailoring, factory shops, homemade
clothing, and second-hand clothing. The mainstream clothing retail sector in South
Africa can be considered an oligopoly as it is dominated by few big companies. On
the other hand, the alternative retail has many players that compete with each other
as well as with the mainstream retailing.
The need for effective demand planning in the clothing retail industry is justified and
motivated not only by the advantages that effective demand planning has but the
nature of the industry itself. The need to understand customer demand patterns in
this dynamic industry is the biggest motivation. In any industry, POS data can play a
huge role improving demand planning. It is said that in this volatile clothing industry
with complex consumers, POS data has become an indispensable tool. Thus, the
109
study focused on the role of POS data in demand planning within the South African
clothing retail industry.
6.3 Research methodology Chapter 4 concentrated on describing and justifying the research methodology
followed in this study. A summary of the research methodology in this research is
described in the following section.
This qualitative study on South Africa’s major clothing retail companies followed an
inductive approach. It was performed through a series of semi-structured interviews
based on a sample of eight major clothing retailers. The interviews were conducted
telephonically as well as face to face with the respondents who work as demand
planners in the companies that form the sample. The research design followed the
grounded theory strategy; this approach involves drawing conclusions and building
theories based on the collected data.
The collected data was then analysed following the inductive analytical rationale,
which is the method of drawing conclusions or developing theories based on the
collected information. In this rationale, the grounded theory approach was followed in
performing the actual analysis, which involved the comparison of various sets of data
then coding and capturing the themes that arose from this process.
Two levels of coding were performed, namely, open coding and axial coding. Coding
facilitated the searching and identification of patterns and proceeding themes that led
to the conclusions made. Performing the analysis process was facilitated by using a
CAQDAS product called Atlas.ti because of the various advantages it presents. The
themes and conclusions emanating from this analysis process were described in
Chapter 5 as research findings. The following section interprets the research findings
and shows how the findings met the research objectives.
6.4 Interpretation of the research findings This section interprets the research findings by showing how the research objectives
were met and by drawing conclusions and inferences. This section is categorised
according to the research objectives reported in Chapter 1. The achievement of
primary research objective is not covered separately owing to the fact that the
110
secondary objectives were determined so as to contribute to the achievement of the
primary objective.
6.4.1 Secondary objective 1 This objective had to do with determining the nature of the demand planning process
as performed in the South African clothing retail industry. The study fulfilled this
objective and identified various characteristics and issues on the demand planning
process followed in this industry.
First, the role of demand planners was determined. It was discovered that the people
who perform the role of demand planning within the clothing retail companies have
different titles in different companies. Nevertheless, the role and duties performed by
the people in this position is largely the same. For most of the companies, the role of
a demand planner lies within middle level management.
Of the many tasks that these demand planners perform, all them mentioned demand
forecasting as a pivotal task required of them. Most of the demand planners
mentioned that their position is understood and well defined, with clear reporting
lines; however, some mentioned the role of demand planning as a ‘floating role’
without definite executive management buy-in. Furthermore, the demand planners
showed that they have a clear understanding of the difference between forecasting
and demand planning.
Secondly, companies in the South African clothing retail sector follow different steps
or procedures in their demand planning process, just as the literature proposes.
Although the procedures followed differ from one company to the other, there are
some commonalities. First, the process is an iterative one involving the consideration
of different input factors and continuous revising of plans. Secondly, the historical
sales information plays a fundamental role in the demand planning process.
6.4.2 Secondary objective 2
This objective was concerned with determining the systems employed in the
collection and dissemination of POS data within South African clothing supply
chains. This objective was achieved, but first to understand this data dissemination
process, the structure of South African clothing industry supply chains and nature of
products sold within the industry were determined.
111
The South African clothing industry is largely dependent on imported products. The
literature review and the primary research done in this study point to the fact that
China is the largest contributor to these imports. Some of the products produced in
this industry are also manufactured locally; however, these constitute a small
percentage. Only one of the eight companies studied claimed to have an in-house
production capacity which is locally based.
The volatility of products affects the level of accuracy in forecasting – the more
volatile the product, the more difficult it is to forecast, and vice versa. The South
African clothing retail industry has two distinct types of products, namely,
replenishment and trend products. Trend products are more volatile while the
demand for replenishment items is more stable.
Concerning POS data collection, retail companies collect POS data of a particular
sale at store level. These data scanning or collection systems are linked to a central
system where all the sales information from different stores are aggregated and
stored. This central database is then made accessible to the various functions of the
company and they can pull reports and statistics as per their departmental needs.
Suppliers also have access to POS data but only for the products they supply.
Technology plays a vital role in POS data collection, storage and dissemination.
6.4.3 Secondary objective 3
The third secondary objective was to determine the way POS data is used in the
demand planning process within the clothing retail industry. This objective was
achieved by determining the importance of the demand planning process and the
role of POS data in this process.
Demand planning is an important task within clothing retail companies in South
Africa. Of all the reasons supporting its importance, the most important is the impact
of demand planning in the positioning of inventory.
Clothing retail companies in South Africa collect POS data at store level and this
information is then stored in a central system. The different users can retrieve the
stored information as and when needed. The availability of POS data to the different
supply chain members has an impact on supply chain visibility. The quicker the
sharing of this POS data to the supply chain members, the better the visibility.
112
Data collected at the point of purchase contains various details about a specific sale.
This information can be used for various purposes by the different company
functions. Various technologies are used in the collection and dissemination of this
data. Another notable source of data is third-party-sourced POS data, which is sales
information about the performance of the industry or competitors. As much as this
information is considered in the planning process, it has minimal influence.
Furthermore, it was discovered that the collected POS data is used for different
purposes; more relevant to this study was the usage of POS data in demand
planning. POS data is said to play a fundamental role in demand forecasts where it
is considered a major input factor. Forecasting and demand planning are mostly
about determining the future demand in order to ensure optimal inventory levels at
various points of the supply chain. POS data is most suitable for this because of the
advantages that have already been mentioned in the preceding subheading.
However, there are some situations where POS data is not relevant and these
include the following:
Trend items which are influenced by fashion trends and have no direct link to
previous sales data
New product lines that have not been previously sold by the company, so
there is no previous history
Supplier-dictated products. Some suppliers of big brands dictate the range of
products as well as the quantities that retailers should stock.
Over and above the usage of POS data, demand planning also considers other input
factors. The involvement of other company departments means various issues are
brought to the table. These factors include:
Sales objectives and company strategy
Competition and competitor activities
Promotions and other marketing activities
The economy – inflation and consumer buying power
Lead times
Supplier constraints
Social factors such as lifestyle changes
113
6.4.4 Secondary objective 4
The goal of the fourth secondary objective was identify the challenges and problems
faced by South African clothing retailers in the collection, dissemination and usage of
POS data in demand planning. This objective was achieved as the findings have
shown that companies in the clothing industry do face various challenges with POS
data in demand planning, as follows:
Human error
Human interference through the manipulation of information
Lack of training in the collection and capture of POS data
Technological and system failures in POS dissemination
Software issues in demand planning
Lack of management buy-in regarding the demand planning process
6.4.5 Secondary objective 5
The fifth secondary objective was to determine ways of improving the usage of POS
data in demand planning in a South African clothing retail context. This objective was
achieved by probing the respondents on the issue and by reviewing suggestions
from the literature. The following section discusses some of these possible
improvements.
6.5 Recommendations
The first recommendation is related to the first objective of the demand planning
process. As literature suggested, demand planning has a crucial role in today’s
consumer-driven supply chains and as such should be well performed and
continually monitored and re-evaluated. Furthermore, there needs to be clear
management buy-in. Top management should recognise demand planning for its
importance and provide enough support for it to function properly.
Another recommendation related to the first objective is that, seeing that companies
have different business configurations, organisational structures, competitive
philosophies and product types, there cannot be a standard ideal demand planning
framework or procedure to suit all. Companies need to develop their demand

114
planning procedure based on the different variables relevant to their own operating
environment and strategy.
Despite the differences in the procedure followed, there are some principles that
should be applied to any procedure. These include the following:
Continuous revision – Different factors influence forecasts and plans in
diverse ways and in varying degrees and times; thus, the process of
demand planning for a particular period should not be a once-off but
iterative to ensure the timely adjustments to any changes in any of the
affecting variables or input factors.
Collaboration – The task and process of demand planning should not be a
silo process but should involve the various members of the supply chain
and well as organisational functions. Demand plans and forecasts are
more effective when collaboratively developed. Furthermore, the adoption
of the plans will be easier and accuracy will be improved when all the
issues and variables have been considered to develop plans based on
consensus.
Better use of POS data – As mentioned in literature and in the findings,
POS data has inherent characteristics that enhance the demand planning
process. Organisations that engage in the process of forecasting and
demand planning should therefore use POS data to improve the
effectiveness thereof.
Better use of technology – Modern-day supply chains deal with thousands
of SKUs. To better control and manage this product proliferation, various
technological systems can be utilised to ensure effective and efficient
forecasting and demand planning. Companies should put in place modern
and relevant hardware and software to achieve this advantage.
Another recommendation is related to the dichotomous nature of products
within this industry. As different products have different levels of volatility
and demand behaviour patterns, there is a need to develop parallel
forecasting procedures or demand planning strategies for the various
product types. In the case of this industry, for replenishment items, a
continuous forecasting and replenishment system could be developed.
115
Because the demand is more certain and ongoing, replenishment can be
done on a frequent basis, thus ensuring optimal inventory positioning. An
example of such a system is one implemented by Woolworths
supermarkets where the company uses an automated inventory
replenishment system that allows continuous replenishment based on the
needs of each particular store in their supply chain (Tung, 2009).
The successful implementation of such a system could greatly improve the efficiency
and effectiveness of the supply chain. However, such a system would require an
agile transport system which could possibly result in an increase in transport costs.
As such, there is a need to make the necessary trade-off calculations to ensure such
a system reduces overall costs rather than increases them.
Another example of a well-functioning system is the one used by Zara. Zara has an
efficient and effective supply chain. The clothing store keeps a significant amount of
its production in-house and makes sure that its own factories reserve 85 per cent of
their capacity for in-season adjustments (Lu, 2014). Seeing that supply
responsiveness is vital in this industry, in-house production allows the company to be
flexible in the amount, frequency and variety of new products to be launched (Lu,
2014).
It has become clear that demand planning needs to be performed and considered an
important function within companies and supply chains. The following sequential
issues associated with inventory positioning support this view:
With poor demand planning and poor forecasts, there would be a
mismatch between demand and supply.
If demand plans are ignored or the process is performed poorly, this
mismatch in demand and supply results in poor inventory positioning.
Poor inventory positioning will have various negative impacts on the entire
supply chain. These may include missed sales opportunities, excess
inventory levels, stock obsolescence and back orders.
Another recommendation is that supply chains should make more use of POS data
in optimising their response to customer demand. The usage of POS data in the
116
planning process by companies in vital. This is supported by the research findings
that show the advantages associated with POS data, as follows.
POS data show how the company is performing in terms of sales as well
as the performance of different SKUs.
POS data serve as the best cue or guide for future demand levels.
POS data form the foundational data used in various forecasting
algorithms.
POS data show the stock replenishment requirements of the different store
outlets at a given time.
Supply chain visibility has an influence on the effectiveness and efficiency of supply
chains, and in recognition of this fact, it is important that POS data be shared with all
the relevant supply chain members as quickly as possible to enhance visibility.
POS data should contain as much data as possible about a particular sale. Rich
sales data will give more information about the nature of demand and thus allow
better suited plans and supply. The importance of rich sales data can be seen in
some companies that have implemented customer loyalty programmes; this allows
the creation of a customer profile and thus supply or replenishment for different
stores can be tailored for their customers with better precision.
Based on the inherent value and benefits of POS data in demand planning, it is
important for demand planners to source POS data as soon as possible after it has
been generated and use it to determine forecasts that will better represent future
demand. However, these forecasts should not be limited to POS data but should
factor in all the variables that influence customer demand and buying behaviour.
Another issue to consider in the improvement of demand planning is collaboration.
Literature suggested the high need for collaboration in the demand planning process,
and the demand planning process in the South African clothing process is in line with
this. However, beyond this intra-business collaboration, there is need for
collaboration with suppliers that are in the same supply chain. The practice by large
clothing manufacturers of dictating stock-holding or replenishment decisions could
result in various problems associated with a mismatch in demand and supply.
117
Lastly, considering the import-dependency of the industry, there are challenges
associated with such a configuration:
Suppliers dictate trends and standards.
Long lead times result in slower replenishment and poor response to
change in demand patterns.
Lost employment opportunities occur, whereas if the manufacture of these
products was based locally, it would create employment opportunities for
South Africans.
Considering the above-mentioned issues, a possible solution to this predicament is
the indigenisation of clothing manufacture by using more local suppliers and by
increasing local production. The South African government and clothing industry
stakeholders should consider the various ways of promoting local production of
clothing products. This will, however, require expertise, modern technologies as well
as large amounts of investment.
6.6 Future research
This research has identified the following prospective future research opportunities
that may require investigation in the future:
Optimising the collection of POS data – The timing and accuracy of POS data
collection is important in the demand planning process and thus there is a
need to research further in order to determine how the collection and
dissemination of POS data can be improved.
The usage of qualitative variables in demand planning – This study mainly
looked at the usage of POS data in the demand planning process. POS data
is quantitative in nature and many algorithms exist to facilitate the usage of
quantitative data in determining forecast. An issue in need of enquiry is the
inclusion of qualitative factors in forecasting.
The potential for local sourcing in the South African clothing industry – The
clothing retailers in South Africa depend on imported products. Dependence
on exports has various macro and micro negatives, and as a result, there is a
need for a further enquiry into the possibility of developing local product
supply.
118
6.7 Conclusion
This study was incited, driven and directed by the research gap identified after a
literature study revealed that no specific research has been done on the usage of
POS data by South African companies in demand planning. This qualitative study on
South Africa’s major clothing retail companies was performed through a series of
semi-structured interviews based on a sample of eight major clothing retailers. The
research design followed the grounded theory approach. The captured data was
analysed following the grounded theory approach facilitated by a CAQDAS called
Atlas.ti. Through this process of analysis, findings were drawn on the subject under
study.
The findings of this research show that demand planning is an important part in
management supply chains, as the influence and impact of its output on the various
members of the supply chain became clear. Demand planning affects inventory
positioning, replenishment decisions, ordering and production decisions. Considering
all of this, companies need to ensure that the process of demand planning is carried
out effectively and that different functions collaborate in this process to factor in all
the issues that influence demand. A key issue in this study was the role POS data
played in the process of demand planning.
Outcomes of this research showed that companies collect POS data and use it for
various purposes including having it as an input to the demand planning process.
POS data plays a fundamental role in the process of demand planning as both
secondary and primary research show that it is the foundational input in this process.
Furthermore, its importance is substantiated by the inherent characteristics it has
that enhance forecasting accuracy and planning effectiveness. However, POS data
is not used in isolation; there are other qualitative and quantitative factors that need
to be considered as inputs in the demand planning process.
Lastly, the role of POS in demand planning is expected to grow as customers are
becoming increasingly demanding. Companies should therefore invest and
implement robust POS collection and dissemination systems and technologies to
ensure that they can leverage the advantages of POS data. A company’s ability to

119
match product supply to customer demand leads to high levels of efficiency and
effectiveness; POS data can play a fundamental role in enhancing this ability.
120
LIST OF SOURCES Adams, J., Khan, H. T., Raeside, R., & White, D. I. (2007). Research methods for graduate business and social science students. SAGE Publications India. Andres, F. (2008). Demand planning and forecasting with POS data: A case study. Journal of business forecasting methods and systems 27(4):29. Atieno, O.P. (2009). An analysis of the strengths and limitation of qualitative and quantitative research paradigms. Problems of Education in the 21st Century, 13(1), 13-38. Barratt, M. & Oliveira, A. (2001). Exploring the experiences of collaborative planning initiatives. International Journal of Physical Distribution & Logistics Management, 31(4), pp.266-89.
Blanchard, D. (2010). Supply chain management best practices. John Wiley & Sons, New Jersey. Blecker, T., Kersten, W. & Meyer, M. (2009). High performance logistics: Methods and technologies. Erich Schmidt Verlag GmbH & Co KG. Borgos, M. (2008). More power with point of sales data. The Journal of Business Forecasting, 27(4):19. Bowersox, D.J., Closs, D.J. & Stank, T.P. (2000). Ten mega trends that will revolutionize supply chain logistics. Bursa, K. (2008). How to effectively manage demand with demand sensing and shaping using point of sales data. The Journal of Business Forecasting, 27(4):26. Available: http://connection.ebscohost.com/c/articles/37299793/how-effectively-manage-demand-demand-sensing-shaping-using-point-sales-data [Accessed 04 August 2015]. Butner, K. (2010). The smarter supply chain of the future. Strategy & Leadership, 38(1):22-31. Available: http://www.emeraldinsight.com/doi/abs/10.1108/10878571011009859 [Accessed 05 August 2015]. Business Partners (2014). The South African textile and clothing industry – an overview. Business Partners. Available: http://www.businesspartners.co.za/knowledge-hub/manufacturing-fund/posts/south-african-textile-clothing-industry-overview-3252/ [Accessed 13 March 2015].
121
Caniato, F., Caridi, M., Castelli, C. & Luca, L. (2008). Demand and retail management in luxury fashion industries. Research Journal of Textile and Apparel, 12(3), pp.65-76. Available: http://www.emeraldinsight.com/doi/abs/10.1108/RJTA-12-03-2008-B007 [Accessed 16 September 2015]. Chase, C. (2015). Using multi-tiered causal analysis to synchronize demand and supply. SAS Institute Inc. Available: https://support.sas.com/resources/papers/proceedings15/SAS1388-2015.pdf [Accessed 05 August 2015]. Christopher, M. & Towill, D. (2001). An integrated model for the design of agile supply chains. International Journal of Physical Distribution & Logistics Management, 31(4):235-46. Available: http://www.emeraldinsight.com/doi/abs/10.1108/09600030110394914 [Accessed 13 March 2015]. Crum, C. & Palmatier, G.E. (2003). Demand management best practices: Process, principles, and collaboration. J. Ross Publishing. CSCMP (2015). Definitions. Council of Supply Chain Management Professionals. Available: https://cscmp.org/supply-chain-management-definitions [Accessed 05 August 2015]. Dong, Y., Huang, X., Sinha, K.K. & Xu, K. (2014). Collaborative demand forecasting: Toward the design of an exception-based forecasting mechanism. Journal of Management Information Systems, 31(2):245-84. Dube, P., Muyengwa, G., & Battle, K. (2012, June). Study of collaborative planning, forecasting and replenishments in South African retail industry. In Computers and Industrial Engineering 42. Edcon (2015). About us - find out more about our group. Edcon Group Available: http://www.edcon.co.za/ [Accessed 04 August 2015]. Euromonitor (2015). Retailing in South Africa. Euromonitor Available: http://www.euromonitor.com/retailing-in-south-africa/report [Accessed 03 August 2015]. Fay, G. (2010). Demand sensing in volatile times. The Journal of Business Forecasting, 29(3):31. Fernandez-Stark, K., Frederick, S. & Gereffi, G. (2011). The Apparel Global Value Chain. Duke Center on Globalization Governance and Competitiveness. Flick, U. (2011). Introducing research methodology: A beginner’s guide to doing a research project. Sage.
122
Fox, W. & Bayat, M. S. (2008). A guide to managing research. Juta Publishers, Cape Town. Gallucci, J. (2015). 7 Behaviors of great demand planners. The Journal of Business Forecasting, 34(1):4. Available: https://www.questia.com/library/journal/1P3-3679188531/7-behaviors-of-great-demand-planners [Accessed 12 April 2015]. Gauteng Treasury Quarterly Bulletin, (2012). The Retail Industry on the Rise in South Africa. Available: http://www.treasury.gpg.gov.za/Documents/QB1%20The%20Retail%20Industry%20on%20the%20Rise.pdf [Accessed 16 September 2015]. Gereffi, G. & Frederick, S. (2010). The global apparel value chain, trade and the crisis: challenges and opportunities for developing countries. World Bank Policy Research Working Paper Series, Available: http://www19.iadb.org/intal/intalcdi/PE/2010/05413.pdf [Accessed 05 August 2015]. Gereffi, G., & Memedovic, O. (2003). The global apparel value chain: What prospects for upgrading by developing countries (pp. 1-40). Vienna: United Nations Industrial Development Organization. Available: http://www.ids.ac.uk/ids/global/pdfs/AppareF1.pdf [Accessed 13 March 2015]. Habib, M., 2011. Supply Chain Management (SCM): Theory and Evolution. INTECH Open Access Publisher. Available: http://cdn.intechopen.com/pdfs/17671/InTechSupply_chain_management_scm_theory_and_evolution.pdf [Accessed 12 March 2015]. Hesse-Biber, S. (2010). Qualitative approaches to mixed methods practice. Qualitative Inquiry, 16(6), 455-468. Hitachi Consulting (2009). Six key trends changing the supply chain management today. Hitachi Consulting. Available: http://www.sdcexec.com/news/10358095/six-key-trends-changing-the-supply-chain-management-today [Accessed 13 March 2015]. Ireland, R.K. & Crum, C., 2005. Supply chain collaboration: How to implement CPFR and other best collaborative practices. J. Ross Publishing. Jauch, H. & Traub-Merz, R. (Eds.). (2006). The future of the textile and clothing industry in Sub-Saharan Africa. Friedrich-Ebert-Stiftung, Division for International Development Cooperation, Africa Department.

123
Jüttner, U., Christopher, M. & Baker, S. (2007). Demand chain management integrating marketing and supply chain management. Industrial marketing management, 36(3):377-92. Available: http://citeseerx.ist.psu.edu/viewdoc/download;jsessionid=D6FBA19F43F06F051FD8D8123D573D54?doi=10.1.1.129.928&rep=rep1&type=pdf [Accessed 12 March 2015]. Keifer, S. (2010). Beyond point of sale: Leveraging demand signals for forecasting. The Journal of Business Forecasting, 29(2):14. Kruger, D. & Ramdass, K. (2010). 24th Annual SAIIE Conference Proceedings, South African Institute for Industrial Engineering. Lapide, L., 2005. Account level forecasting needs downstream data. The Journal of Business Forecasting, 24(2):17. Lawless, M. (2014). Predictive analytics: An opportunity for better demand planning and forecasting. The Journal of Business Forecasting, 33(4):44. Available: https://www.questia.com/library/journal/1P3-3601906371/predictive-analytics-an-opportunity-for-better-demand [Accessed 12 April 2015].
Lee, H.L., Padmanabhan, V. & Whang, S. (2004). Information distortion in a supply chain: The bullwhip effect. Management science, 50(12_supplement):1875-86.
Leedy, P.D. & Ormrod, J.E. (2014). 10th Ed. Practical Research, Planning and Design. Pearson: London. Loretto, R., 2014. A new approach to effective demand planning. Journal of Business Forecasting, 33(2). Lu, C. (2014) Zara supply chain analysis - the secret behind Zara's retail success. Available: https://www.tradegecko.com/blog/zara-supply-chain-its-secret-to-retail-success [Accessed 27 September 2016]. Lu, Y., Karpova, EE. & Fiore, A.M. (2011). Factors influencing international fashion retailers’ entry mode choice. Journal of Fashion Marketing and Management: An International Journal, 15(1), 58-75. Ma, Y., Wang, N., Che, A., Huang, Y. and Xu, J. (2013). The bullwhip effect under different information-sharing settings: a perspective on price-sensitive demand that incorporates price dynamics. International Journal of Production Research, 51(10):3085-16. Mael, C. (2011). The roller coaster ride of volatility. The Journal of Business Forecasting, 30(2):11.
124
Maree, K. (ed.) (2007). First steps in research. Van Schaik Publishers, Pretoria. Moisanen, J., (2014). Demand forecasting in the apparel industry. Available: http://urn.fi/URN:NBN:fi:amk-2014052910961 [Accessed 16 September 2015]. Nattrass, N. & Seekings, J. (2012). Differentiation within the South African clothing industry: Implications for wage setting and employment. Centre for Social Science Research. http://www.ncrfsa.org/ Accessed [13 March 2015]. NCRF (2015). NCRFSA - Home. Available: http://www.ncrfsa.org/ [Accessed 13 March 2015]. Nordås, H.K. (2004). The global textile and clothing industry post the agreement on textiles and clothing. World, 7(1,000). Available: https://www.wto.org/english/res_e/booksp_e/discussion_papers5_e.pdf [Accessed 13 March 2015] Palpacuer, F., Gibbon, P. & Thomsen, L. (2005). New challenges for developing country suppliers in global clothing chains: a comparative European perspective. World development, 33(3), pp.409-30. Available: http://www.sciencedirect.com/science/article/pii/S0305750X04002025 [Accessed 16 September 2015]. Pienaar, W.J. & Vogt, J.J. (2012). Business logistics management: A value chain perspective. Oxford University Press, London. Prinsloo, D.A. (2010). Classification and hierarchy of retail facilities in South Africa. Urban studies. Available: http://www.urbanstudies.co.za/wp-content/uploads/2016/07/New-Retail-Classification-2010.pdf [Accessed 22 September 2015]. Purushottam, N. (2011). Store attributes preference in selecting a store: a study of large scale retail stores in South Africa. Available: http://hdl.handle.net/10500/5654 [Accessed 22 September 2015]. PWC. (2012). Five steps to better demand plan clarity and accuracy. PWC Consulting Services. Available: https://www.pwc.com/us/en/operations-management/assets/demand-planning.pdf [Accessed 05 August 2015]. PWC Report, (2012). South African retail and consumer products outlook 2012-2016. PWC.
125
Available: https://www.pwc.co.za/en/assets/pdf/retail-and-consumer-products-outlook-2012-2016.pdf [Accessed 22 September 2015]. Ramdass, M.K. (2007). An engineering management framework for the SA clothing industry with a focus on KwaZulu-Natal (Doctoral dissertation, University of Johannesburg). Saldana, J. (2011). Fundamentals of Qualitative Research. New York: Oxford University Press. Saunders, M.N., Saunders, M., Lewis, P., et al. (2009). Research methods for business students, Pearson Education, India. Schrieber, J. (2005). Demand visibility improves demand forecasts. The Journal of Business Forecasting, 24(3):32. Available: http://search.proquest.com/openview/2cb89118bc1caab58a05f5e17dcf089c/1?pq-origsite=gscholar [Accessed 12 April 2015]. Shepard, D. (2012). Collaborative demand and supply planning between partners. Available: http://supplychainacuity.com/uploads/SCA_Collaboration_Monograph_February2012.pdf [Accessed 05 August 2015]. Silo (2015). Silo - Homepage. Available: http://www.silo.co.za/ [Accessed 13 March 2015]. Simon, R. (2008). The abcs of point of sales (POS) data. The Journal of Business Forecasting, 27(4):4. Sreejesh, S., Mohapatra, S. & Anusree, M.R. (2014). Business research methods. Springer International Publishing AG. Stake, R.E. (2010). Qualitative research: Studying how things work. Guilford Press. Stank, T. P., Daugherty, P.J. & Autry, C.W. (1999). Collaborative planning: Supporting automatic replenishment programs. Supply chain management: An international Journal, 4(2):75-85. Available: http://search.proquest.com/docview/216863102?accountid=13425 [Accessed 13 March 2015]. Statistics South Africa. (2015). Retail sector growth losing steam, Quarter 1 2015, Pretoria. Available: http://www.statssa.gov.za/?p=4163 [Accessed 22 September 2015] Strauss, A., & Corbin, J. (1990). Basics of qualitative research (Vol. 15). Newbury Park, CA: Sage.
126
Supermarket and Retailer (2015).Top ten retailers in Africa. Supermarket and Retail. Available: http://www.supermarket.co.za/SR_Downloads/S&R%202015-12%20Africa%20focus.pdf [Accessed 12 March]. Thomassey, S. (2014). Sales forecasting in apparel and fashion industry: A review. In Intelligent fashion forecasting systems: Models and applications (pp. 9-27). Springer Berlin Heidelberg. Thomopoulos, N.T. (2015). Demand forecasting for inventory control. In Demand Forecasting for Inventory Control (pp. 1-10). Springer International Publishing. Tiu Wright, L., Denegri-Knott, J., Zwick, D. & Schroeder, J.E. (2006). Mapping consumer power: An integrative framework for marketing and consumer research. European journal of marketing, 40(9/10):950-71. Available: http://www.emeraldinsight.com/doi/abs/10.1108/03090560610680952 [Accessed 12 March 2015].
Tolbert, F. (2008). Why point of sales data matters for demand management. The Journal of Business Forecasting, 27(4):33.
Trepte, K. & Narayanaswamy, R. (2009). Forecasting consumer products using prediction markets (Doctoral dissertation, Massachusetts Institute of Technology). Tribou, S., 2010. POS Planning – The ‘pet’ of forecasting. The Journal of Business Forecasting, 29(1):20. Available: http://search.proquest.com/openview/016e91dccec02f7ded09bc32a5c6eb62/1?pq-origsite=gscholar [Accessed 05 August 2015]. Tung, L. (2009). AutoStockR hits Big W, Dick Smith. Zdnet. Available: http://www.zdnet.com/article/autostockr-hits-big-w-dick-smith/ [Accessed 27 September 2016] . Vlckova, V. & Patak, M. (2010). The 6th International Scientific Conference ‘Business and Management 2010’. Selected paper. Conference proceedings. Williams, B.D. & Waller, M.A. (2011). Top‐down versus bottom‐up demand forecasts: the value of shared point‐of‐sale data in the retail supply chain. Journal of Business Logistics, 32(1), 17-26. Wu, J. (2004). Supply chain management in selected clothing retail businesses (Doctoral dissertation, North-West University). Available: http://dspace.nwu.ac.za/handle/10394/647 [Accessed 13 April 2015]. You, F. & Grossmann, I.E. (2008). Design of responsive supply chains under demand uncertainty. Computers & Chemical Engineering, 32(12):3090-3111. Available: https://cscmp.org/about-us/supply-chain-management-definitions [Accessed 05 August 2015].

127
Zikmund, W., Babin, B., Carr, J., et al. (2012). Business research methods. Cengage Learning, UK.

128
ANNEXURE A: Letter of Non-disclosure
129
ANNEXURE B: Interview questionnaire Main Question:
To what extent do firms in the South African Clothing Retail Industry use Point of
sale (POS) data in demand planning and how the usage can be increased?
Investigative Questions
1. What steps are followed in demand planning?
2. What systems are used in the collection and dissemination of POS data?
3. How is POS data used?
4. How can companies in the clothing retail industry gain more leverage through
the use of POS data?
SUMMARY: INTERVIEW QUESTIONAAIRE SECTIONS.
1. • COMPANY/ DEPARTMENT BACKGROUND
2. • THE DEMAND PLANNING PROCESS
3. • THE USAGE OF POS DATA
4. • THE COLLECTION OF POS DATA
5. • THE SHARING AND DISSEMINATION OF POS DATA
6. • THE ROLE OF POS DATA IN DEMAND PLANNING
7 • IMPROVEMENTS/FUTURE OF POS DATA USAGE
130
Interview Questions
Date:
Time:
Place:
INTRODUCTION
Good Morning Sir/Madam. My name is Douglas Njabulo Raza and I am a student at
the University of Johannesburg. I am doing research for my Masters dissertation on
the use of Point of sale data (which I will be referring to as POS data) in demand
planning by companies in the Clothing retail companies in South Africa.
1. COMPANY/ DEPARTMENT BACKGROUND
1.1 What is your company and what type of business are you in?
1.2 How is your supply chain structured?
1.3 Which department are you in and what is its basic function?
1.4 Is demand planning a defined task with clear processes in your company?
1.5 How volatile is the overall demand for the products you sell?
2. DEMAND PLANNING PROCESS
2.1 How important is the demand planning task within your supply chain?
2.2 Who performs the demand planning role for the company and at what level of the
organization’s hierarchy is the task performed?
2.3 Which departments/functions of the company are involved in the demand
planning process?
2.4 What basic steps are followed in the process of demand planning?
2.5 Which parts of your supply chain are driven by POS data based forecasts?
131
3. USAGE OF POS DATA
3.1 Does the company use POS data in demand planning, if so how?
3.2 At what level of aggregation (in terms of product grouping) is POS based
demand forecasting done?
3.3 Is POS data used in long term or short forecasting?
3.4 Which type of products is most suitable for POS data based demand planning?
4. COLLECTION OF POS DATA
4.1 What technologies and systems are used to collect POS data?
4.2 What detail is contained in the data collected?
4.3 Do you use any 3rd party sourced POS data in your demand planning?
4.4 If so, how is it important, if not, why?
4.5 How visible (in terms of time span) are the POS transactions to the demand
planners?
5. SHARING AND DISSEMINATION OF POS DATA
5.1 How is POS data disseminated?
5.2 Which parts of the supply chain have access to or use POS data?
5.3 Do you sell or give access of your POS data to third party organisations?
6. THE ROLE OF POS DATA IN DEMAND PLANNING
6.1 How big is the role of POS in determining forecasts in demand planning?
6.2 How is POS data integrated in demand planning to influence forecasts?
6.3 Which other factors are of significance in planning demand?

132
7. IMPROVEMENTS/FUTURE OF POS DATA USAGE
7.1 Are there any problems you face in the collection or dissemination of POS data?
7.2 How can the use of POS data be improved?
7.3 What is the role of technology in the whole process of demand planning?
7.4 What is the future of POS data within your supply chain?
That will be all and thank you for your time and assistance in this research. I will
make contact for any further questions that I may have.