dissertation moment stability analysis method for determining ...
236
DISSERTATION MOMENT STABILITY ANALYSIS METHOD FOR DETERMINING SAFETY FACTORS FOR ARTICULATED CONCRETE BLOCKS Submitted by Amanda L. Cox Department of Civil and Environmental Engineering In partial fulfillment of the requirements For the Degree of Doctor of Philosophy Colorado State University Fort Collins, Colorado Summer 2010
-
Upload
khangminh22 -
Category
Documents
-
view
6 -
download
0
Transcript of dissertation moment stability analysis method for determining ...

DISSERTATION
MOMENT STABILITY ANALYSIS METHOD FOR DETERMINING SAFETY
FACTORS FOR ARTICULATED CONCRETE BLOCKS
Submitted by
Amanda L. Cox
Department of Civil and Environmental Engineering
In partial fulfillment of the requirements
For the Degree of Doctor of Philosophy
Colorado State University
Fort Collins, Colorado
Summer 2010

ii
COLORADO STATE UNIVERSITY
June 17, 2010
WE HEREBY RECOMMEND THAT THE DISSERTATION PREPARED
UNDER OUR SUPERVISION BY AMANDA L. COX ENTITLED MOMENT
STABILITY ANALYSIS METHOD FOR DETERMINING SAFETY FACTORS FOR
ARTICULATED CONCRETE BLOCKS BE ACCEPTED AS FULFILLING IN PART
REQUIREMENTS FOR THE DEGREE OF DOCTOR OF PHILOSOPHY.
Committee on Graduate Work
Evan C. Vlachos
Steven R. Abt
Chester C. Watson
Advisor: Christopher I. Thornton
Department Head: Luis A. Garcia

iii
ABSTRACT OF DISSERTATION
MOMENT STABILITY ANALYSIS METHOD FOR DETERMINING SAFETY
FACTORS FOR ARTICULATED CONCRETE BLOCKS
Articulated concrete block (ACB) revetment systems are widely used for channel
lining and embankment protection. Current approaches for prediction of ACB system
stability are based on a moment stability analysis and utilize shear stress to account for all
hydrodynamic forces. Assumptions utilized in the moment stability analysis derivations
were identified and the applicability to channelized and steep-slope conditions was
investigated. The assumption of equal lift and drag forces was determined to be non-
conservative and the most influential to computed safety factors.
A database of twenty-four tests encompassing both channelized and overtopping
conditions was compiled from available data for three ACB systems. Safety factors were
computed using the current state-of-the-practice design methodology for each test. The
current design methodology proved accurate at predicting the point of instability for five
out of the nine total tested ACB installations. A new safety factor design methodology
was developed using a moment stability analysis coupled with the computation of
hydrodynamic forces using both boundary shear stress and flow velocity. Lift
coefficients were calibrated for each of the three ACB systems within the database.
Safety factors were computed using the new safety factor method and the calibrated lift

iv
coefficients. The new safety factor design method proved accurate at predicting stability
for eight of the nine total tested ACB installations.
Amanda L. Cox
Department of Civil and Environmental Engineering
Colorado State University
Fort Collins, CO 80523
Summer 2010

v
ACKNOWLEDGMENTS
I would like to express my gratitude to Dr. Christopher Thornton, my advisor, for
his dedication and support throughout my graduate studies. Without his professional
direction, this dissertation would not have been completed. Additionally, I would like to
express my appreciation to my committee members, Dr. Chester Watson, Dr. Steven Abt,
and Dr. Evan Vlachos, for the time and expertise they have devoted to my doctoral
studies. I would also like to thank Dr. Watson and Dr. Abt for the advice and guidance
they have provided. I am humbled to have been given the opportunity to work under the
direction of such distinguished advisors with renowned engineering experience.
A very special thank you goes to Gloria Garza for her reviewing and editing of
this document. She is much appreciated for her friendship, resourcefulness, and
reviewing expertise. Additionally, I would like to acknowledge Nathan Holste for his
assistance in developing the database.
I would like to extend great appreciation to my loving husband, Kevin, and
amazing daughters, Mariella and Clara. Without Kevin’s support, encouragement,
continual advice, and most of all love, I would not have completed this dissertation. He
is the foundation of my accomplishments. Furthermore, Mariella and Clara’s beautiful
spirits are my inspiration and have given me the determination to complete my goals. I
would also like to thank my father, Jim Lee, and mother, Doris Baker, for their constant
support in my educational endeavors. Finally, I would like to sincerely thank all of my
family members for their love and encouragement.

vi
TABLE OF CONTENTS
ABSTRACT OF DISSERTATION............................................................................. iii
ACKNOWLEDGMENTS .............................................................................................v
LIST OF FIGURES................................................................................................... viii
LIST OF TABLES........................................................................................................xi
LIST OF SYMBOLS..................................................................................................xiv
1 INTRODUCTION ...................................................................................................1
1.1 Introduction and General Background................................................................1
1.2 Research Objectives...........................................................................................3
2 LITERATURE REVIEW........................................................................................5
2.1 Embankment Testing and Analysis of Articulated Concrete Block
Systems .............................................................................................................5
2.1.1 CIRIA Embankment Testing ....................................................................6
2.1.2 FHWA Overtopping Research (Clopper and Chen, 1988) .........................7
2.1.3 FHWA ACB Stability for Overtopping Flow (Clopper, 1989) ..................9
2.1.4 Leech et al. (1999b)................................................................................12
2.1.5 Abt et al. (2001) ....................................................................................14
2.1.6 ASTM D7277 (2008) ACB Test Standard ..............................................15
2.1.7 ASTM D7276 (2008) ACB Analysis Standard........................................17
2.2 Factor of Safety Design Methods .....................................................................23
2.2.1 Stevens and Simons (1971).....................................................................23
2.2.2 Clopper (1991) .......................................................................................35
2.2.3 Julien (1998) ..........................................................................................46
2.2.4 Julien and Anthony (2002)......................................................................58
2.2.5 National Concrete Masonry Association (2006)......................................63
2.3 Summary .........................................................................................................74
3 EXAMINATION OF ASSUMPTIONS IN SAFETY FACTOR
DERIVATIONS .....................................................................................................75
3.1 Identification of Assumptions ..........................................................................75
3.2 Investigation of Assumptions...........................................................................79
3.3 Summary .........................................................................................................89
4 ACB TESTING DATABASE ................................................................................91
4.1 Introduction .....................................................................................................91
4.2 30S Dataset......................................................................................................91
4.3 Petraflex Dataset..............................................................................................96
vii
4.4 Corps Block Dataset ........................................................................................99
4.5 Summary .......................................................................................................101
5 HYDRAULIC ANALYSIS OF ACB TEST DATA............................................104
5.1 Example ASTM D7276 (2008) Hydraulic Analysis .......................................105
5.2 ASTM D7276 (2008) Hydraulic Analysis of 30S and Petraflex Data .............112
5.3 Hydraulic Analysis of Corps Block Data........................................................116
5.4 Summary .......................................................................................................118
6 EVALUATION OF CLOPPER (1991) AND NCMA (2006) METHODS
USING ACB TEST DATA ..................................................................................120
6.1 30S Clopper (1991) and NCMA (2006) SF Analysis......................................123
6.2 Petraflex Clopper (1991) and NCMA (2006) SF Analysis..............................127
6.3 Corps Block Clopper (1991) and NCMA (2006) SF Analysis ........................130
6.4 Summary .......................................................................................................135
7 DERIVATION OF NEW SAFETY FACTOR METHOD.................................136
7.1 Derivation of Submerged Weight Force Components.....................................138
7.2 Derivation of Side-slope Angle Perpendicular to Bed Slope...........................141
7.3 Derivation of Safety Factor Equations............................................................144
7.3.1 Safety Factor Equation for Rotation about Block Corner (Point
M) .......................................................................................................146
7.3.2 Safety Factor Equation for Rotation in the Flow Direction (Point
P) ........................................................................................................151
7.3.3 Safety Factor Equation for Rotation Perpendicular to the Flow
Direction (Point O)..............................................................................153
7.4 Safety Factor Equation for Blocks on a Channel Bed .....................................154
7.5 Summary .......................................................................................................156
8 ANALYSIS OF NEW SAFETY FACTOR EQUATIONS.................................160
8.1 30s New SF Analysis .....................................................................................161
8.2 Petraflex New SF Analysis ............................................................................163
8.3 Corps Block New SF Analysis .......................................................................164
8.4 Discussion of Considerations, Recommendations and Limitations .................166
8.5 Summary .......................................................................................................167
9 CONCLUSIONS AND RECOMMENDATIONS ..............................................168
9.1 Overview.......................................................................................................168
9.2 Conclusions ...................................................................................................171
9.3 Research Recommendations ..........................................................................172
REFERENCES ..........................................................................................................174
APPENDIX A HYDRAULIC DATA FROM CLOPPER AND CHEN (1988) .......177
APPENDIX B ACB BLOCK DIMENSIONS AND PHYSICAL
PROPERTIES......................................................................................................206
APPENDIX C HYDRAULIC DATA FOR CSU TESTING ....................................210

viii
LIST OF FIGURES
Figure 1.1: Sketches of an ACB Mat and Individual Blocks............................................2
Figure 2.1: Limiting Velocity versus Flow Duration for Plain and Reinforced
Grass (adapted from Hewlett et al. (1987))....................................................7
Figure 2.2: Sketches of the Five ACB Systems Tested during the Clopper (1989)
FHWA Research (adapted from Clopper (1989)).........................................11
Figure 2.3: Sketch of ASTM D7277 (2008) Test Setup.................................................15
Figure 2.4: Flow Chart of Step-forewater Analysis Method (adapted from ASTM
D7276 (2008)) ............................................................................................20
Figure 2.5: Sketch of Variables used in Momentum Shear-stress Equation
(adapted from ASTM D7276 (2008)). .........................................................22
Figure 2.6: Force Diagrams (adapted from Stevens and Simons (1971)) .......................25
Figure 2.7: Force Diagrams (adapted from Clopper (1991)) ..........................................37
Figure 2.8: Force Diagrams (adapted from Julien (1998)) .............................................47
Figure 2.9: Force Diagrams (adapted from Julien and Anthony (2002)) ........................60
Figure 2.10: Force Diagrams (adapted from NCMA (2006)).........................................65
Figure 3.1: Potential Relationships between the Stability Number and the
Boundary Shear Stress to Critical Shear-stress Ratio ...................................76
Figure 3.2: Calculated Safety Factors for Varying Shear Stress.....................................81
Figure 3.3: Calculated Safety Factors for Varying Bed Slopes ......................................81
Figure 3.4: Calculated Safety Factors for Varying Side Slopes......................................82
Figure 3.5: Comparison of Safety Factors without the Assumption of the
Relationship between Stability Number and Shear Stress ............................83
Figure 3.6: Safety Factor Comparison with 10% Non-conservative Critical Shear
Stress ..........................................................................................................84
Figure 3.7: Safety Factor Comparison without Trigonometric Simplifications ..............85
Figure 3.8: Safety Factor Comparison with β Equal to 48.3°........................................86
Figure 3.9: Safety Factor Comparison Using the Block Height for l3 ............................87
Figure 3.10: Safety Factor Comparison without the Assumption of Equal Lift and
Drag Forces (lift coefficient equal to 0.045) ................................................88
Figure 3.11: Lift Force and Drag Force Relationship to Velocity ..................................88

ix
Figure 4.1: Photograph of Installed 30S Blocks .............................................................. 92 Figure 4.2: Photograph of Installed Petraflex Blocks...................................................... 96 Figure 4.3: Photograph of Corps Blocks Installation....................................................... 99 Figure 5.1: Comparison of Measured Flow Depths to Best-fit WSP ............................ 106 Figure 5.2: Flow Velocity and Shear Stress versus Horizontal Station......................... 111 Figure 5.3: Energy Grade Line and Hydraulic Grade Line versus Horizontal
Station .......................................................................................................... 112 Figure 5.4: Comparison of Shear Stresses Computed from ASTM D7276 (2008)
to Shear Stresses Reported in Clopper and Chen (1988)............................. 115 Figure 5.5: Percent Difference between ASTM D7276 (2008) Shear Stresses and
Reported Values from Clopper and Chen (1988) versus Overtopping Flow Depth .................................................................................................. 115
Figure 6.1: 30S SF Computed from Clopper (1991) and NCMA (2006) Method with τc = 13.5 lbs/ft2 Calibrated from Clopper and Chen (1988) Data with ASTM D7276 (2008) Analysis............................................................ 126
Figure 6.2: 30S SF Computed from Clopper (1991) and NCMA (2006) Method with τc = 4.5 lbs/ft2 Calibrated from CSU Data at 0.230 Embankment Slope ............................................................................................................ 126
Figure 6.3: 30S SF Computed from Clopper (1991) and NCMA (2006) Method with τc = 4.7 lbs/ft2 Calibrated from CSU Data at 0.431 Embankment Slope ............................................................................................................ 127
Figure 6.4: Petraflex SF Computed from Clopper (1991) and NCMA (2006) Method with τc = 8.6 lbs/ft2 Calibrated from Clopper and Chen (1988) Data and ASTM D7276 (2008) Analysis .................................................... 129
Figure 6.5: Petraflex SF Computed from Clopper (1991) and NCMA (2006) Method with τc = 5.7 lbs/ft2 Calibrated from CSU Petraflex Data.............. 129
Figure 6.6: Corps Block SF Computed from Clopper (1991) and NCMA (2006) Methods with τc = 3.7 lbs/ft2 Calibrated from 0.200 ft/ft Bed-slope Data.............................................................................................................. 134
Figure 6.7: Corps Block SF Computed from Clopper (1991) and NCMA (2006) Methods with τc = 2.2 lbs/ft2 Calibrated from 0.143 ft/ft Bed-slope Data.............................................................................................................. 134
Figure 6.8: Corps Block SF Computed from Clopper (1991) and NCMA (2006) Methods with τc = 2.9 lbs/ft2 Calibrated from Channelized Corps Data..... 135
Figure 7.1: Coordinate System for Factor of Safety Equation Derivations................... 137 Figure 7.2: View of Block Normal to Side-slope Plane with Identified Pivot
Points ........................................................................................................... 137 Figure 7.3: Weight Force Components Normal and Perpendicular to the Direction
of the Bed Slope........................................................................................... 139
x
Figure 7.4: Channel Cross Section Normal to the Bed-slope View..............................140
Figure 7.5: Definition of 2θ ........................................................................................141
Figure 7.6: Cross-section V-V’ View (vertical)...........................................................143
Figure 7.7: Cross-section N-N’ View (normal to the bed slope) ..................................143
Figure 7.8: Channel Profile View Including Lengths O and O’ for 1θ and 2θ ,
Respectively..............................................................................................144
Figure 7.9: View of Block Normal to Side-slope Plane with Identified Cross-
section A-A’ and Angle β..........................................................................147
Figure 7.10: View of Block Normal to Side-slope Plane with Identified Force
Components ..............................................................................................148
Figure 7.11: Free-body Diagram for Rotation about Point M ......................................149
Figure 7.12: Free-body Diagram for Rotation about Point P........................................152
Figure 7.13: Free-body Diagram for Rotation about Point O .......................................154
Figure 8.1: 30S SF Computed from the New SF Method with CL = 0.0972
Calibrated from CSU 30S 0.230 ft/ft Bed-slope Data.................................162
Figure 8.2: Petraflex SF Computed from the New SF Method with CL = 0.0207
Calibrated from Clopper and Chen (1988) Data and ASTM D7276
(2008) Analysis.........................................................................................164
Figure 8.3: Corps Block SF Computed from the New SF Method with CL = 0.115
Calibrated from Channel Data ...................................................................166
Figure A.1: FHWA Petraflex 4.0-ft Overtopping Water-surface Profile (Clopper
and Chen, 1988) ........................................................................................180
Figure A.2: FHWA 30S 1.0-ft Overtopping Water-surface Profile (Clopper and
Chen, 1988) ..............................................................................................187
Figure A.3: FHWA 30S 2.0-ft Overtopping Water-surface Profile (Clopper and
Chen, 1988) ..............................................................................................196
Figure A.4: FHWA 30S 4.0-ft Overtopping Water-surface Profile (Clopper and
Chen, 1988) ..............................................................................................202
Figure A.5: FHWA 30S 96-cfs Overtopping Water-surface Profile (Clopper and
Chen, 1988) ..............................................................................................205
Figure B.1: 30S Block Dimensions and Physical Properties ........................................207
Figure B.2: Petraflex Block Dimensions and Physical Properties ................................208
Figure B.3: Corps Block Dimensions and Physical Properties.....................................209

xi
LIST OF TABLES
Table 2.1: Limiting Values of Shear Stress Reported in Clopper and Chen (1988) ..........9
Table 2.2: Critical Flow-velocity and Shear-stress Values Reported in Clopper
(1989) .........................................................................................................12
Table 2.3: Safety Factor Calculation Method According to Stevens and Simons
(1971) .........................................................................................................34
Table 2.4: Safety Factor Calculation Method According to Clopper (1991) ..................46
Table 2.5: Safety Factor Calculation Method According to Julien (1998)......................57
Table 2.6: Safety Factor Calculation Method According to Julien and Anthony
(2002) .........................................................................................................63
Table 2.7: Safety Factor Calculation Method According to the NCMA (2006)..............73
Table 3.1: Summary of the Sensitivity of Assumptions with Respect to the
Example......................................................................................................89
Table 4.1: Hydraulic Results for 30S FHWA Testing Reported in Clopper and
Chen (1988) ................................................................................................93
Table 4.2: Robeson et al. (2002) 30S Testing................................................................94
Table 4.3: 2009 CSU 30S Testing.................................................................................94
Table 4.4: Combined 30S Testing Dataset ....................................................................95
Table 4.5: Hydraulic Results for Petraflex FHWA Testing Reported in Clopper
and Chen (1988)..........................................................................................97
Table 4.6: Robeson et al. (2002) Petraflex Testing........................................................98
Table 4.7: Combined Petraflex Testing Dataset.............................................................98
Table 4.8: Corps Block Overtopping Testing Data......................................................100
Table 4.9: Corps Block Channelized Testing Data ......................................................101
Table 4.10: Entire ACB Database ...............................................................................102
Table 5.1: Hydraulic Data for CSU Petraflex Test (Robeson et al., 2002) on
0.501 Bed Slope at 10.0 cfs (8-21-2000)....................................................105
Table 5.2: Water-surface Profile Data and Computed Hydraulics for Optimal
Manning’s n (0.020)..................................................................................107
Table 5.3: ASTM D7276 (2008) Hydraulic Results for 30S Testing............................114
Table 5.4: ASTM D7276 (2008) Hydraulic Results for Petraflex Testing....................114
xii
Table 5.5: Results of the Corps Block Hydraulic Analysis ..........................................118
Table 5.6: Hydraulic Analysis Results for ACB Database ...........................................119
Table 6.1: Computed Critical Shear-stress Values for the 30S on a Horizontal
Plane .........................................................................................................123
Table 6.2: Computed 30S SF for Clopper (1991) and NCMA (2006) Method .............125
Table 6.3: Computed Critical Shear-stress Values for the Petraflex on a
Horizontal Plane........................................................................................127
Table 6.4: Computed Petraflex SF for Clopper (1991) and NCMA (2006) Method .....128
Table 6.5: Computed Critical Shear-stress Values for the Corps Block on a
Horizontal Plane........................................................................................130
Table 6.6: Computed Corps Block SF for Overtopping Tests for Clopper (1991)
and NCMA (2006) Method .......................................................................132
Table 6.7: Computed Corps Block SF for Channel Tests for Clopper (1991)
Method .....................................................................................................132
Table 6.8: Computed Corps Block SF for Channel Tests for NCMA (2006)
Method .....................................................................................................133
Table 7.1. Summary of New Safety Factor Equations .................................................158
Table 8.1: Computed 30S SF for the New SF Method.................................................162
Table 8.2: Computed Petraflex SF for the New SF Method.........................................164
Table 8.3: Computed Corps Block SF for the New SF Method ...................................165
Table A.1: Available Data for FHWA Petraflex Testing (Clopper and Chen,
1988) ........................................................................................................178
Table A.2: Available Velocity Data for FHWA Petraflex Testing (Clopper and
Chen, 1988) ..............................................................................................179
Table A.3: FHWA 30S 1.0-ft Overtopping Data (Clopper and Chen, 1988) ................181
Table A.4: FHWA 30S 1.0-ft Overtopping Velocity Data (Clopper and Chen,
1988) ........................................................................................................186
Table A.5: FHWA 30S 2.0-ft Overtopping Data (Clopper and Chen, 1988) ................188
Table A.6: FHWA 30S 2.0-ft Overtopping Velocity Data (Clopper and Chen,
1988) ........................................................................................................193
Table A.7: FHWA 30S 4.0-ft Overtopping Data (Clopper and Chen, 1988) ................197
Table A.8: FHWA 30S 4.0-ft Overtopping Velocity Data (Clopper and Chen,
1988) ........................................................................................................200
Table A.9: FHWA 30S 96-cfs Overtopping Data (Clopper and Chen, 1988) ...............203
Table A.10: FHWA 30S 96-cfs Overtopping Velocity Data (Clopper and Chen,
1988) ........................................................................................................204
Table C.1: Hydraulic Data for CSU 30S Test (Robeson et al., 2002) on 0.499
Bed Slope at 10.0 cfs (8-11-2000) .............................................................211

xiii
Table C.2: Hydraulic Data for CSU 30S Test on 0.431 Bed Slope at 8.0 cfs (6-
25-2009) ...................................................................................................211
Table C.3: Hydraulic Data for CSU 30S Test on 0.431 Bed Slope at 12.0 cfs (6-
25-2009) ...................................................................................................212
Table C.4: Hydraulic Data for CSU 30S Test on 0.230 Bed Slope at 10.0 cfs (6-
14-2009) ...................................................................................................213
Table C.5: Hydraulic Data for CSU 30S Test on 0.230 Bed Slope at 20.0 cfs (6-
15-2009) ...................................................................................................214
Table C.6: Hydraulic Data for CSU 30S Test on 0.230 Bed Slope at 30.0 cfs (6-
15-2009) ...................................................................................................215
Table C.7: Hydraulic Data for CSU Petraflex Test (Robeson et al., 2002) on
0.501 Bed Slope at 10.0 cfs (8-21-2000)....................................................216
Table C.8: Hydraulic Data for CSU 30S Test (Robeson et al., 2002) on 0.501
Bed Slope at 28.4 cfs (8-21-2000) .............................................................216

xiv
LIST OF SYMBOLS
θa = coefficient of the weight force acting in the direction normal to the
side-slope plane
A-A = cross section along particle rotation path
A-A’ = cross section along particle rotation path
A = cross-section flow area (ft2)
A = length adjacent of angles 1θ and 2θ
AB = block area parallel to direction of flow (ft2)
AN = area of the particle normal to the direction of flow (ft2)
b = block width normal to the flow direction (ft)
DC = drag force coefficient
CL = lift force coefficient
d = flow depth (ft)
md = maximum flow depth at uniform flow (ft)
sd = particle diameter (ft)
f = Darcy-Weisbach friction factor
FD = drag force (lbs)
'
DF = additional drag force caused by block protrusion (lbs)
FL = lift force (lbs)

xv
'
LF = additional lift force caused by block protrusion (lbs)
FS = submerged weight of the particle (lbs)
g = acceleration due to gravity (ft/s2)
PG = specific weight of Particle P
h1 = upstream water-surface elevations at station 1 (ft)
h2 = downstream water-surface elevations at station 2 (ft)
ih = water-surface elevation at station i (ft)
obsh = observed water-surface elevation at station ii (ft)
predh = predicted water-surface elevation at station ii (ft)
H = hypotenuse of right triangle created by θ1
H’ = hypotenuse of right triangle created by θ2
1i = initial station for analysis
ni = ending station for analysis
uK = units conversion coefficient, equal to 1.486 for U.S. Customary
Units and 1.0 for SI units
1l = moment arm for submerged weight force component parallel to the
embankment plane (ft)
'1l = moment arm for submerged weight force component within the
plane normal to Cross-section A-A (ft)
2l = moment arm for submerged weight force component normal to the
side-slope plane (ft)
U2l , U3l ,
U4l = moment arms for the untested block (ft)

xvi
T2l , T3l ,
T4l = moment arms for the tested block (ft)
3l = moment arm for the drag force component along the path of
motion (ft)
'3l = moment arm for the drag force component within the plane normal
to Cross-section A-A (ft)
4l = moment arm for the lift force (ft)
nl = block length normal to the bed slope (ft)
pl = block length parallel to the bed slope (ft)
L = length of control volume along the embankment (ft)
L = embankment length (ft)
M = lift force variable grouping
n = Manning’s resistance coefficient
N = drag force variable grouping
N-N’ = cross-section normal to the bed slope
O = length opposite of angle 1θ
O’ = length opposite of angle 2θ
P = wetted (roughened) perimeter (ft)
Particle P = cohesionless particle resting on a channel side slope
Point M = rotation point about the block corner
Point O = rotation point about the block edge laterally into the channel
Point P = rotation point about the block edge in the downstream direction
q = unit discharge (ft2/s)

xvii
Q = discharge (cfs)
npQ , = continuity discharge (cfs)
R = hydraulic radius (ft)
0S = embankment slope (ft/ft)
Sf = slope of the energy grade line (friction slope) (ft/ft)
Sf1 = upstream friction slope at station 1 (ft/ft)
Sf2 = downstream friction slope at station 2 (ft/ft)
Sfi = friction slope at station i (ft/ft)
SF = factor of safety
SFBED = safety factor for rotation of a block on the channel bed
SFM = safety factor for rotation about block corner (Point M)
SFO = safety factor for rotation about Point O
SFP = safety factor for rotation of a block on the channel bed
v1 = flow velocity at upstream end of control volume at station 1 (ft/s)
v2 = flow velocity at downstream end of control volume at station 2
(ft/s)
V = flow velocity (ft/s)
V-V’ = vertical cross section
iV = flow velocity at station i (ft/s)
mV = maximum velocity at uniform flow (ft/s)
npV , = average of point flow velocities collected at 20%, 60%, and 80%
of flow depth (ft/s)
w = width of the projecting surface normal to the direction of flow (ft)

xviii
WS = block submerged weight (lbs)
STW = submerged weight of the tested blocks (lbs)
SUW = submerged weight of the untested blocks (lbs)
SXW = block submerged weight force component parallel to the side-slope
plane along the x axis (lbs)
SYW = block submerged weight force component normal to the side-slope
plane along the y axis (lbs)
SZW = block submerged weight force component parallel to the side-slope
plane along the z axis (lbs)
y = flow depth measured perpendicular to embankment (ft)
y1 = flow depth at upstream end of control volume (ft)
y2 = flow depth at downstream end of control volume (ft)
iy = flow depth at station i (perpendicular to the embankment) (ft)
z = side slope (ft/ft)
iz = bed elevation at station i (ft)
Greek
α = bed-slope angle
β = angle of particle or block rotation measured in the side-slope plane
(radians)
γ = unit weight of water (lbs/ft3)
δ = angle between the drag force and the particle or block rotation path
measured in the side-slope plane (radians)

xix
Z∆ = height of the projecting surface (block protrusion) normal to the
direction of flow (ft)
λ = angle between horizontal and the streamline velocity vector
measured in the side-slope plane (radians)
η = stability number (Stevens and Simons, 1971)
'η = stability number for particles or blocks on a side slope (Stevens
and Simons, 1971)
0η = stability number (Julien, 1998; Julien and Anthony, 2002)
1η = stability number for particles on a side slope (Julien, 1998; Julien
and Anthony, 2002)
θ = resulting angle of the combined submerged weight force
components acting in the side-slope plane (radians) (Julien, 1998;
Julien and Anthony, 2002)
θ = side-slope angle (radians) (Stevens and Simons, 1971)
0θ = bed-slope angle (radians)
θ1 = side-slope angle measured from a vertical cross section (radians)
θ2 = side-slope angle measured perpendicular to the bed-slope plane
(radians)
Uθ = untested bed-slope angle (radians)
Tθ = tested bed-slope angle (radians)
ξ = optimizing variable for determining best-fit Manning’s n (ft)
ρ = density of water (slugs/ft3)

xx
0τ = boundary shear stress (lbs/ft2)
c*τ = critical Shields parameter
cτ = block critical shear stress on a horizontal plane (lbs/ft2)
TCθτ = critical shear stress for the tested bed slope (lbs/ft2)
CTτ = critical shear stress for the tested block (lbs/ft2)
CUτ = critical shear stress for an untested block (lbs/ft2)
φ = angle of repose (radians)

1
1.1 INTRODUCTION AND GENERAL BACKGROUND
With non-stationary technology and a continually changing environment, there is
a constant need to evaluate design methods and associated hypotheses. Articulated
concrete block (ACB) revetment systems are commonly used for erosion protection for
multiple applications. An ACB system, or mat, is a flexible interlocking matrix
composed of individual concrete blocks. The term “interlocking” refers to interlocking
block geometries or other connecting devices such as cables or ropes. Additionally, the
term “articulating” designates that the system can conform to changes in the subgrade
while staying interconnected. Figure 1.1 provides a sketch of an ACB system and
individual blocks. Typical applications of ACB systems include channel lining,
riverbank protection, dikes and levy protection, dam crest and spillways, and bridge
abutment protection. The history of ACB development and use within engineering dates
back to the mid-1970s when the former Soviet Union was testing and constructing
concrete block erosion revetment systems (Clopper, 1991). Use of ACB systems has
since been employed throughout the United States.
1 INTRODUCTION

2
Plan View – ACB Mat
Plan View - ACB
Side View - ACB
End View - ACB
Cables
Cables
Longitudinal
Cables
Figure 1.1: Sketches of an ACB Mat and Individual Blocks
Available design methods provided by Clopper (1991) and the National Concrete
Masonry Association (NCMA, 2006) for ACB systems have not been verified with full-
scale data. The Clopper (1991) and NCMA (2006) design methods compute a safety
factor using a moment stability analysis approach. Chapter 2 presents a literature review
that was conducted to identify: 1) the origin of the Clopper (1991) and NCMA (2006)

3
design methods, 2) ACB test data for analysis, and 3) hydraulic analysis techniques for
ACB performance testing data. An investigation of the assumptions used in the
development of the Clopper (1991) and NCMA (2006) design equations is presented in
Chapter 3 and the most influential assumptions are identified.
A database is presented in Chapter 4 which was developed from full-scale
laboratory tests. Three ACB systems were included in the database and testing
conditions provided a range of overtopping flow depths, embankment lengths, in addition
to both channelized and overtopping test conditions. Chapter 5 details the hydraulic
analysis of the developed database.
An assessment of the Clopper (1991) and NCMA (2006) design equations using
the database is provided in Chapter 6. The assessment demonstrates that the Clopper
(1991) and NCMA (2006) design equations were ineffective at predicting stability
conditions for the database. Chapter 7 details the derivation of a new safety factor design
method which was based on a moment stability analysis and eliminated numerous
assumptions associated with the Clopper (1991) and NCMA (2006) methods. An
assessment of the new safety factor methodology is presented in Chapter 8. The new
safety factor method proved successful at predicting stability for twenty-three of the
twenty-four total tests.
1.2 RESEARCH OBJECTIVES
The objectives of this research were to:
1. Investigate the applicability of existing design methods to predict ACB system
stability;

4
2. Identify assumptions used to formulate the equations utilized in the existing
design methods;
3. Determine the influence of the identified assumptions on the computed safety
factor value; and
4. Develop and verify a design methodology to predict ACB system stability for
channelized and steep-slope, high-velocity applications.

5
Literature is detailed herein that addresses embankment testing and analysis of
ACB revetment systems, and existing moment stability safety factor design
methodologies. Section 2.1 details ACB testing conducted by the Construction Industry
and Research Information Association (CIRIA), the Federal Highway Administration
(FHWA), and the United States Army Corps of Engineers (USACE) (Hewlett et al.,
1987; Clopper and Chen, 1988; Clopper, 1989; Abt et al., 2001). Furthermore, Section
2.1 addresses available testing and analysis protocols presented by Leech et al. (1999b),
American Society for Testing and Materials (ASTM) D7276 (2008), and ASTM D7277
(2008). Moment stability analysis safety factor design methods by Stevens and Simons
(1971), Clopper (1991), Julien (1998), Julien and Anthony (2002), and the NCMA (2006)
are reviewed in Section 2.2.
2.1 EMBANKMENT TESTING AND ANALYSIS OF
ARTICULATED CONCRETE BLOCK SYSTEMS
Due to the proprietary nature of ACB systems, it is difficult to identify the exact
origin of ACB research. Clopper (1991) documented that in the mid-1970s, the former
Soviet Union investigated the installation of ACB systems for embankment protection for
steep-slope applications (66 to 197 ft in height). The earliest documented block testing
2 LITERATURE REVIEW

6
studies were conducted in 1986 by the CIRIA in the United Kingdom at Jackhouse
Reservoir (Hewlett et al., 1987). The FHWA followed the CIRIA closely with controlled
laboratory testing of embankment protection systems in 1987 and 1988 (Clopper and
Chen, 1988; Clopper, 1989).
Leech et al. (1999b) developed test protocols for ACB protection systems. Abt et
al. (2001), following the protocols developed by Leech et al. (1999b), evaluated the
performance of a generic block for overtopping and channelized hydraulic conditions. In
2008, the ASTM published a standard for ACB performance testing (ASTM D7277,
2008), in addition to a standard for analysis and interpretation of ACB performance test
data (ASTM D7276, 2008). Subsequent sections detail relevant literature pertaining to
testing and analysis of ACB protection systems.
2.1.1 CIRIA EMBANKMENT TESTING
Hewlett et al. (1987) documented the CIRIA embankment testing conducted in
the United Kingdom at Jackhouse Reservoir. The CIRIA testing examined reinforced
grass erosion protection systems including geotextile reinforcement, concrete
reinforcement, and plain grass with no reinforcement. ACBs were classified as a
concrete-reinforced system. Hewlett et al. (1987) provided results of the CIRIA field
trials and conclude that the ArmortecTM
30S system, with established grass, was unstable
at flow velocities between 23 and 26 ft/s and the PetraflexTM
system with established
grass was stable up to a flow velocity of 26 ft/s. Recommendations for limiting velocity
values for various reinforced grass protection systems, including ACBs, are provided in
Hewlett et al. (1987). Figure 2.1 provides the limiting velocities versus flow duration for

7
plain and reinforced grass presented in Hewlett et al. (1987). Based on the CIRIA test
conditions, Hewlett et al. (1987) recommended limiting the maximum design velocity for
ACB systems with “good interblock restraint” to 26 ft/s (8.0 m/s).
Figure 2.1: Limiting Velocity versus Flow Duration for Plain and Reinforced Grass
(adapted from Hewlett et al. (1987))
2.1.2 FHWA OVERTOPPING RESEARCH (CLOPPER AND CHEN, 1988)
To develop preliminary design recommendations for the protection of
embankments against erosion induced by overtopping flow was the primary objective of

8
the FHWA research detailed in Clopper and Chen (1988). To meet that objective,
Clopper and Chen (1988) investigated previous studies including testing conducted by
the CIRIA (Hewlett et al., 1987) and available data on hydraulics of overtopping flow
and erosion damage of unprotected embankments. Additionally, hydraulic performance
testing of available protection systems was conducted. Embankment testing during the
Clopper and Chen (1988) FHWA research included two soil types (CL and SC-SM), soil
cement, gabion mattresses, Geoweb, Enkamat (7020), Enkamat (7020) with asphalt, and
cable-tied concrete block revetment systems. The resulting data were analyzed, and
flow-velocity and shear-stress values associated with each test condition were reported
along with the stability of each protection system. Appendix A provides the available
ACB data from testing reported in Clopper and Chen (1988).
Clopper and Chen (1988) concluded with recommendations for design of
protection systems. Table 2.1 provides the limiting value of shear stress reported by
Clopper and Chen (1988) for each protection system. Clopper and Chen (1988) provided
two methods for computing shear stress and stated that the larger of the two computed
shear stresses should be used for design. The first shear-stress computation method is
computed from Equation 2.1 using the maximum flow depth at uniform flow:
00 Sdmγτ = Equation 2.1
where
0τ = shear stress (lbs/ft2);
γ = unit weight of water (lbs/ft3);

9
md = maximum flow depth at uniform flow (ft); and
0S = embankment slope (ft/ft).
The second shear-stress method presented by Clopper and Chen (1988) computes shear
stress from Equation 2.2, which incorporates the uniform flow velocity:
2
08
1m
Vfρτ = Equation 2.2
where
f = Darcy-Weisbach friction factor;
ρ = density of water (slugs/ft3); and
m
V = maximum velocity at uniform flow (ft/s).
Table 2.1: Limiting Values of Shear Stress Reported in Clopper and Chen (1988)
Protection System
Limiting Shear Stress (lbs/ft
2)
Soil cement (8 percent) a > 45
Gabions (6-in. thick) 35
Gabions (4-in. thick) 10
Enkamat with 1-in. asphalt < 5
Enkamat with 3-in. asphalt 15
Armorflex Class 30 blocks 15
Petraflex-Vick blocks a > 30
Dycel 100 blocks < 7 a Maximum capacity of facility was reached with no indication of
failure
2.1.3 FHWA ACB STABILITY FOR OVERTOPPING FLOW (CLOPPER, 1989)
Results from the 1988 FHWA research on embankment protection systems
indicated that ACB systems were capable of protecting embankments with overtopping
conditions. However, the performance of the three systems investigated varied

10
considerably with the Petraflex-Vick block successful at preventing erosion during a 4-ft
overtopping test and the Dycel 100 block proving incapable of protecting adequately
during a 1-ft overtopping test. FHWA identified the need to further investigate the
efficacy of ACB systems for protecting embankments during overtopping flow. The
primary objective of the Clopper (1989) FHWA research was to provide detailed testing
and analysis to quantify the processes causing failure of ACB protection systems.
Overtopping tests were conducted on five ACB systems: 1) Armorflex Class 30
block, 2) Dycel 100, 3) Petraflex-Vick block, 4) concrete construction blocks, and 5)
concrete wedge-shaped overlapping blocks. Figure 2.2 provides sketches of the five
ACB systems tested during the Clopper (1989) research. Overtopping tests were
conducted utilizing either a rigid concrete embankment or an erodible soil embankment
(SC-SM). In addition to water-surface elevation and flow-velocity data, pressure
transducers were used in four locations to measure hydrodynamic pressure between the
geotextile and the subgrade. Variations in embankment geometry including a chamfered
crest were investigated.

11
(a) Armorflex Class 30
(b) Dycel 100
(c) Petraflex-Vick
(d) Construction Block
(e) Wedge Block
(f) Unit Weight for Systems
Figure 2.2: Sketches of the Five ACB Systems Tested during the Clopper (1989)
FHWA Research (adapted from Clopper (1989))
Results from the Clopper (1989) FHWA research are presented in Table 2.2. The
Armorflex 30S block proved to be stable for the 4-ft overtopping test with the chamfered
crest; whereas, it was not stable for the 4-ft overtopping condition without the chamfered

12
crest in the Clopper and Chen (1988) test. Since the Petraflex-Vick block did not fail
during the Clopper and Chen (1988) testing, it was not tested on the erodible
embankment during the Clopper (1989) tests.
Table 2.2: Critical Flow-velocity and Shear-stress Values Reported in Clopper
(1989)
Protection System
Critical Flow Velocity
(ft/s)
Critical Shear Stress
(lbs/ft2)
Armorflex Class 30 blocks >15 >34
Dycel 100 blocks <9 <12
Concrete construction blocks >17 >20
Wedge-shaped blocks >17 >25
2.1.4 LEECH ET AL. (1999B)
While hydraulic testing of block systems had been previously conducted, Leech et
al. (1999b) introduced a set of testing protocols for block systems intended to provide
comparable performance data to designers. Two block-testing protocols are detailed in
Leech et al. (1999b): one for overtopping system performance testing and one for
channelized system performance testing. Leech et al. (1999b) described overtopping
flow as lateral flow conditions typically associated with flow over dams, through
spillways and down embankments. Channelized flow is described by Leech et al.
(1999b) as flow conveyed through a channel resulting in flow parallel to the
embankment.
The presented overtopping test protocol was founded on the FHWA studies
documented in Clopper and Chen (1988) and Clopper (1989). Leech et al. (1999b)
indicated minimum test facility requirements of 4.0 ft channel width, 6.0 ft high
embankment, and a horizontal crest approach of 20.0 ft. Leech et al. (1999b) further

13
stated that the facility should be capable of variable embankment slopes (i.e., 2-
horizontal-to-1-vertical (2H:1V), 3H:1V, etc.). One key discrepancy in the testing
protocol from the FHWA testing was the specification for the use of a sand or silty sand
embankment material. Since locating a specific soil mixture can be difficult for multiple
testing facilities, specifying sand or silty-sand embankment material allows test results to
be comparable.
Leech et al. (1999b) described system installation, test procedures, and how to
evaluate block system stability. According to Leech et al. (1999b), each tested discharge
should be maintained for a 4-hr duration, and flow depths and velocities should be
collected hourly along the centerline of the slope at predetermined cross sections. Leech
et al. (1999b) provided the following definitions for block system failure:
1. Loss of a block or group of blocks that directly exposes the underlayer to the
flow or the separation of the block system from the subgrade. Separation may
result from erosion, settlement or liquefaction of the embankment soil,
movement or settlement of the drainage bedding system, suction or lifting of a
block(s) from the flow, or hydrodynamic loading of the system from the flow.
2. Loss of contact with the embankment soil beneath the block system by
gradual erosion along the slope, washout through joints, or washout through
open cells.
3. Loss of system integrity through block oscillation or loss of intimate contact
of the block with the filter.
14
The second protocol presented by Leech et al. (1999b) is for channelized
hydraulic testing of block systems. For channelized testing conditions, flow is conveyed
parallel to the embankment. Leech et al. (1999b) indicated that the channelized protocol
presented should be considered preliminary and stated that further research should be
conducted before a detailed standard is developed.
2.1.5 ABT ET AL. (2001)
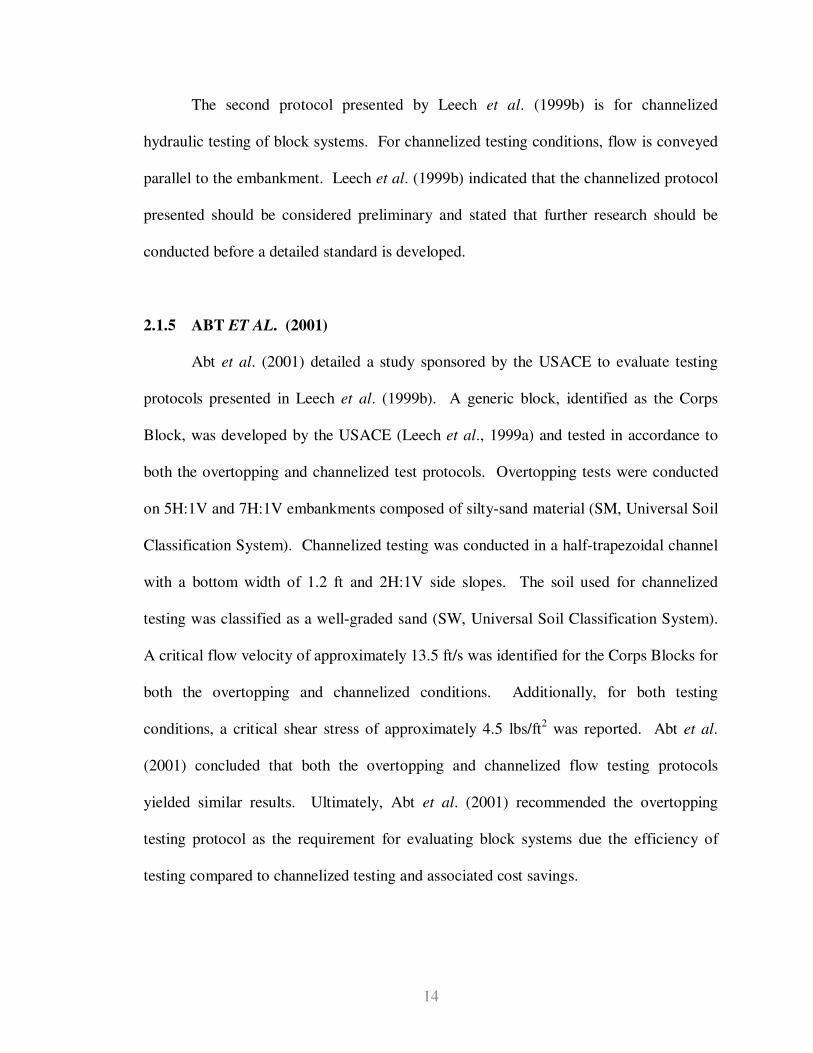
Abt et al. (2001) detailed a study sponsored by the USACE to evaluate testing
protocols presented in Leech et al. (1999b). A generic block, identified as the Corps
Block, was developed by the USACE (Leech et al., 1999a) and tested in accordance to
both the overtopping and channelized test protocols. Overtopping tests were conducted
on 5H:1V and 7H:1V embankments composed of silty-sand material (SM, Universal Soil
Classification System). Channelized testing was conducted in a half-trapezoidal channel
with a bottom width of 1.2 ft and 2H:1V side slopes. The soil used for channelized
testing was classified as a well-graded sand (SW, Universal Soil Classification System).
A critical flow velocity of approximately 13.5 ft/s was identified for the Corps Blocks for
both the overtopping and channelized conditions. Additionally, for both testing
conditions, a critical shear stress of approximately 4.5 lbs/ft2 was reported. Abt et al.
(2001) concluded that both the overtopping and channelized flow testing protocols
yielded similar results. Ultimately, Abt et al. (2001) recommended the overtopping
testing protocol as the requirement for evaluating block systems due the efficiency of
testing compared to channelized testing and associated cost savings.

15
2.1.6 ASTM D7277 (2008) ACB TEST STANDARD
ASTM D7277 (2008) is a standard test method for full-scale performance testing
of ACB revetment systems for hydraulic stability in open channels. Within ASTM
D7277 (2008), testing protocols are provided for system installation, test procedures,
measurement techniques, analysis techniques, and reporting requirements. The test
method presented is specific to steep-slope, high-velocity flow conditions.
Installation requirements include a silty-sand soil subgrade compacted to between
90 and 95% of standard effort density (ASTM D698, 2007). A minimum horizontal crest
length is specified as 6 ft followed by the sloped embankment. ASTM D7277 (2008)
identified a 2H:1V as the benchmark embankment slope, but indicated that other
embankment slopes may be used. ASTM D7277 (2008) specified that an appropriately
designed filter for the soil subgrade should be utilized and the ACB installed according to
the manufacturer’s recommendations. Figure 2.3 provides a sketch of a test setup from
ASTM D7277 (2008).
Figure 2.3: Sketch of ASTM D7277 (2008) Test Setup

16
ASTM D7277 (2008) defined a test as a 4-hr continuous uniform flow over a
revetment system. Hourly measurements of water-surface elevations and point velocities
are specified to be collected at 2- and 4-ft intervals, respectively.
Three methods of stability threshold assessment are identified in ASTM D7277
(2008):
1. Vertical displacement or loss of a block or group of blocks;
2. Loss of soil beneath the geotextile, resulting in voids; and
3. Liquefaction and mass slumping/sliding of the subsoil.
ASTM D7277 (2008) defined the stability threshold as any observations that one
or more blocks have lost solid contact with the subgrade. Required reported data include
measured data and calculated hydraulic conditions for each test. Measured data include
discharge, overtopping depth, bed elevations, water-surface elevations, and point flow
velocities. Computed data include discharge from continuity and flow depths.
Continuity discharge is computed using Equation 2.3 (ASTM D7277 (2008)):
( )npnp VAQ ,, = Equation 2.3
where
npQ , = continuity discharge (cfs);
A = cross-sectional flow area measurement normal to embankment surface
(ft2); and
npV , = average of point flow velocities collected at 20%, 60%, and 80% of flow
depth (ft/s).

17
Flow depths are computed accounting for slope correction by Equation 2.4 (ASTM
D7277 (2008)):
( ) ( )( )0arctancos* Szhyiii
−= Equation 2.4
where
i
y = flow depth at station i (perpendicular to the embankment) (ft);
i
h = water-surface elevation at station i (ft);
i
z = bed elevation at station i (ft); and
0S = embankment slope (ft/ft).
2.1.7 ASTM D7276 (2008) ACB ANALYSIS STANDARD
ASTM D7276 (2008) is a standard for analysis and interpretation of ACB
revetment system hydraulic test data collected under steep-slope, high-velocity conditions
in a rectangular open channel. ASTM D7276 (2008) is intended to be used in
conjunction with the ASTM D7277 (2008) standard for performance testing of ACB
revetment systems. Methods for computation of discharge, flow depths, friction slope,
cross-sectional averaged flow velocity, and boundary shear stress are detailed within
ASTM D7276 (2008). Furthermore, guidelines for qualitative assessment of stability are
also presented and are identical to those provided in ASTM D7277 (2008).
Calculation of continuity discharge and flow depth presented in ASTM D7276
(2008) are identical to those provided in ASTM D7277 (2008) which are detailed in
Equation 2.3 and Equation 2.4, respectively. ASTM D7276 (2008) presents Equation
2.5, Manning’s equation, for computation of friction slope at each measurement station:

18
( )
3/4
2
1
iu
ifi
yK
VnS
= Equation 2.5
where
fiS = friction slope at station i (ft/ft);
n = Manning’s resistance coefficient;
iV = flow velocity at station i (ft/s); and
uK = units conversion coefficient, equal to 1.486 for U.S. Customary Units and
1.0 for SI units.
ASTM D7276 (2008) indicated that the roughness of the flume walls is negligible
compared to the ACB roughness of the flume bed and consequently uses the flow depth
in place of the hydraulic radius within the Manning’s equation to compute friction slope.
ASTM D7276 (2008) specified the computation of an optimal value of Manning’s
roughness, n, using a step-forewater analysis. Equation 2.6 is provided by ASTM D7276
(2008) for the step-forewater analysis:
( )( ) ( )2121211222
1ff SS
Lvvvv
ghh +−−++= Equation 2.6
where
21 , hh = upstream and downstream water-surface elevations at stations 1
and 2, respectively (ft);
g = acceleration due to gravity (ft/s2);
21 , vv = upstream and downstream velocities at stations 1 and 2,
respectively (ft/s);

19
L = slope length between stations 1 and 2 (ft); and
21 , ff SS = upstream and downstream friction slopes at stations 1 and 2,
respectively, as defined by Equation 2.5 (ft/ft).
Using the step-forewater analysis, water-surface profiles are generated for a range of
Manning’s roughness values. The optimal Manning’s roughness value is identified from
the profile which generates the lowest ξ value as defined by Equation 2.7:
∑=
−=ni
ii
obspredhh
1
ξ Equation 2.7
where
ξ = optimizing variable for determining best-fit Manning’s n (ft);
1i = initial station for analysis;
n
i = ending station for analysis;
predh = predicted water-surface elevation at station ii (ft); and
obs
h = observed water-surface elevation at station ii (ft).
Figure 2.4 provides a flow chart of the ASTM D7276 (2008) step-forewater analysis
method.

20
Figure 2.4: Flow Chart of Step-forewater Analysis Method (adapted from ASTM
D7276 (2008))
Following the determination of the best-fit water-surface profile, cross-sectional
averaged flow-velocity and control volume averaged shear-stress values are computed.
Cross-sectional averaged flow velocities are computed at each station as the discharge

21
divided by the cross-sectional flow area, A, normal to the embankment surface. ASTM
D7276 (2008) states that if gradually-varied flow conditions exist, then boundary shear
stress, τ0, is computed using Equation 2.8:
( )( )fSyγτ =0 Equation 2.8
where
γ = unit weight of water (62.4 lbs/ft3);
y = flow depth measured perpendicular to embankment (ft); and
Sf = friction slope (ft/ft).
A method for boundary shear-stress computation from the momentum equation is also
provided by ASTM D7276 (2008). Equation 2.9 computes a shear-stress value over a
representative control volume of finite embankment length, L:
( ) ( )
−−−++=
12
22
2
2
1210
11cos
2
1sin
2 yyqyy
Lyy ρθ
γθ
γτ Equation 2.9
where
γ = unit weight of water (62.4 lbs/ft3);
21 , yy = flow depths at upstream and downstream ends of control volume,
respectively (ft);
21 , vv = flow velocity at upstream and downstream ends of control volume,
respectively (ft/s);
L = length of control volume along the embankment (ft);

22
ρ = unit mass of water (1.94 slugs/ft3); and
q = unit discharge (ft2/s).
A sketch of the variables used in Equation 2.9 to compute shear stress is presented in
Figure 2.5. ASTM D7276 (2008) identified reporting requirements including the
requirement to quantify the hydraulic conditions, peak flow velocity and shear stress at
the location of the stability threshold.
Figure 2.5: Sketch of Variables used in Momentum Shear-stress Equation (adapted
from ASTM D7276 (2008)).

23
2.2 FACTOR OF SAFETY DESIGN METHODS
Over the course of the past two decades, moment stability analysis methods
developed by Stevens and Simons (1971), Julien (1998), and Julien and Anthony (2002)
have been adapted and modified to generate design procedures applicable to engineered
armor units. The original application for the identified safety factor methods is to
produce safety factors for cohesionless particles, which exhibit a quasi-spherical shape,
on a channel side slope. Stevens and Simons (1971), Julien (1998), and Julien and
Anthony (2002) safety factor methods have been adapted to obtain design guidelines for
engineered armor units and are endorsed by the Harris County Flood Control District
(HCFCD) and the NCMA (Clopper, 1991; HCFCD, 2001; NCMA, 2006). Several
assumptions and simplifications were applied throughout the original and extrapolated
derivations which generate uncertainty in the computed safety factors. Clopper (1991)
and NCMA (2006) are the two primary safety methods used for design of ACB
protection systems. Each method for calculating a safety factor value is detailed in the
following sections.
2.2.1 STEVENS AND SIMONS (1971)
A method for determining safety factors for particles rotating out of a bank was
presented in Stevens and Simons (1971). The method was based on a moment stability
analysis and accounts only for contributions from the side slope when determining the
submerged weight force distribution. Stevens and Simons (1971) incorporated a
normalized Shields parameter to quantify incipient motion on a side slope. Furthermore,

24
the assumption that the moments created by the lift force and drag force are equal is
applied. This section presents the derivation for the Stevens and Simons (1971) method.
Figure 2.6(a) illustrates the forces acting on a cohesionless particle, P, resting on a
channel side slope, which are visible within a channel cross-section view. The angle θ is
the side-slope angle and S
W is the submerged weight of the particle as defined by the
particle weight minus the buoyancy force. The side-slope angle is related to the side
slope, z, by Equation 2.10:
( )z1tan 1−=θ Equation 2.10
When accounting only for the side slope and assuming the bed slope is horizontal, the
submerged weight force component parallel to the side slope is θsinS
W and the
submerged weight force component normal to the side-slope plane is θcosS
W as
depicted in Figure 2.6(a).

25
Particle P Top of
Bank Water
Surface
Bed θcos
SW
θsinS
W
SW θ
(a) Vertical Channel Cross-section View
3sin FWS
=θu
δλ
β
Particle P
A
A
Horizontal
(b) View Normal to Side Slope
3l1l
Particle P
O
A
A
(c) Section A-A
'
3l
δsind
F
βθ cossinS
W'
1lO
Particle P
(d) Section Normal to Section A-A
Figure 2.6: Force Diagrams (adapted from Stevens and Simons (1971))
26
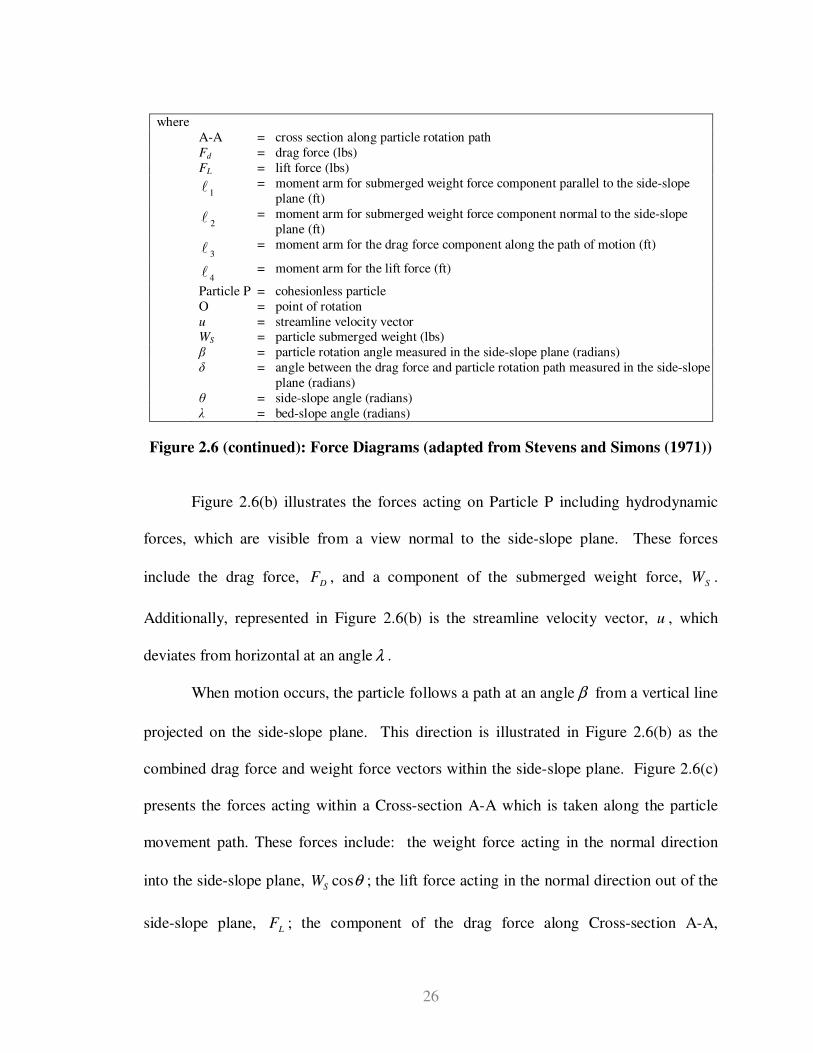
where
A-A = cross section along particle rotation path
Fd = drag force (lbs)
FL = lift force (lbs)
1l = moment arm for submerged weight force component parallel to the side-slope
plane (ft)
2l = moment arm for submerged weight force component normal to the side-slope
plane (ft)
3l = moment arm for the drag force component along the path of motion (ft)
4l = moment arm for the lift force (ft)
Particle P = cohesionless particle
O = point of rotation
u = streamline velocity vector WS = particle submerged weight (lbs)
β = particle rotation angle measured in the side-slope plane (radians)
δ = angle between the drag force and particle rotation path measured in the side-slope
plane (radians)
θ = side-slope angle (radians)
λ = bed-slope angle (radians)
Figure 2.6 (continued): Force Diagrams (adapted from Stevens and Simons (1971))
Figure 2.6(b) illustrates the forces acting on Particle P including hydrodynamic
forces, which are visible from a view normal to the side-slope plane. These forces
include the drag force, D
F , and a component of the submerged weight force, S
W .
Additionally, represented in Figure 2.6(b) is the streamline velocity vector, u , which
deviates from horizontal at an angle λ .
When motion occurs, the particle follows a path at an angle β from a vertical line
projected on the side-slope plane. This direction is illustrated in Figure 2.6(b) as the
combined drag force and weight force vectors within the side-slope plane. Figure 2.6(c)
presents the forces acting within a Cross-section A-A which is taken along the particle
movement path. These forces include: the weight force acting in the normal direction
into the side-slope plane, θcosS
W ; the lift force acting in the normal direction out of the
side-slope plane, L
F ; the component of the drag force along Cross-section A-A,

27
δcosD
F ; and the weight force component along Cross-section A-A parallel to the side-
slope plane, βθ cossinS
W .
A moment stability analysis was used to obtain an expression for the safety factor
which was defined as the ratio of resisting moments (moments that work to stabilize the
particle) to overturning moments (moments that work to set the particle in motion).
Equation 2.11 presents the safety factor (SF) equation for moment stability about Point O
within Cross-section A-A:
LDS
S
FFW
WSF
431
2
coscossin
cos
lll
l
++=
δβθ
θ Equation 2.11
where
1l = moment arm for submerged weight force component parallel to the side-
slope plane (ft);
2l = moment arm for submerged weight force component normal to the side-
slope plane (ft);
3l = moment arm for the drag force component along the path of motion (ft);
and
4l = moment arm for the lift force (ft).
where all other variables have been previously defined. Dividing Equation 2.11 by SW1l
produces Equation 2.12:
( )
S
L
S
D
W
F
W
FSF
1
4
1
3
12
coscossin
cos/
l
l
l
l
ll
++
=δ
βθ
θ Equation 2.12

28
where all the variables have been previously defined.
The expression 12 /tan ll=φ under static fluid conditions can be derived from
the safety factor equation (Equation 2.12) by setting the side-slope angle θ equal to the
angle of repose, φ , and the safety factor to 1.0. Equation 2.13 and Equation 2.14 present
the derivation for the expression 12 /tan ll=φ :
( )
( ) ( ) ( )( ) ( )
φφ
φδ
φ
φ
tan
/
sin
cos/
0cos00cossin
cos/1 1212
1
4
1
3
12 llll
l
l
l
l
ll==
++
=
SSWW
Equation 2.13
12 /tan ll=φ Equation 2.14
Equation 2.15 is obtained by substituting 12 /tan ll=φ into the safety factor equation,
Equation 2.12:
++
=
S
L
S
D
W
F
W
FSF
2
4
2
3
0
costancossin
tancos
l
l
l
lδφβθ
φθ Equation 2.15
For simplification, Stevens and Simons (1971) express the variable groupings associated
with the lift force and the drag force as single variables M and N , respectively.
Equation 2.16 and Equation 2.17 identify the single variables M and N , which
represent the lift force and drag force variable groupings:
S
L
W
FM
2
4
l
l= Equation 2.16
S
D
W
FN
2
3
l
l= Equation 2.17

29
In addition, Stevens and Simons (1971) define a variable identified as the stability
number for particles on a side slope, 'η , by Equation 2.18 to simplify the safety factor
expression:
δη cos' NM += Equation 2.18
After making the substitutions from Equation 2.16, Equation 2.17, and Equation 2.18 into
Equation 2.15, the main form of the Stevens and Simons (1971) safety factor equation is
attained:
φηβθ
φθ
tan'cossin
tancos
+=SF Equation 2.19
where all the variables have been previously defined.
The stability number for particles on a horizontal plane, η , (i.e., 0== δθ ), can
be obtained by setting 0=δ in Equation 2.18 as presented in Equation 2.20:
NM +=η Equation 2.20
Multiplying Equation 2.18 by NM +
η , which equals 1 by definition of Equation 2.20,
generates Equation 2.21:
NM
NM
+
+=
δηη
cos' Equation 2.21
After dividing the numerator and denominator by N and recognizing that
( )βλδ += sincos , Equation 2.22 can be obtained as an expression relating the stability

30
number for particles on a side slope, 'η , to the stability number for particles on a
horizontal plane, η :
( ) ( )
( )
+
++=
NM
NM
/1
sin/'
βληη Equation 2.22
Incipient motion corresponds to a safety factor of 1 when the flow is fully
turbulent over a hydraulically-rough horizontal surface (i.e., 0=θ and 0=δ ). Equation
2.23 can be derived by substituting these appropriate values corresponding to incipient
motion of a particle exposed to flow across a horizontal surface into the safety factor
Equation 2.19:
φη
φ
tan
tan1 ==SF Equation 2.23
Equation 2.23 reduces to identify that 1=η for incipient motion of a particle exposed to
flow across a horizontal surface. Also, by recognizing that when the flow is fully
turbulent along the bed, the Shields parameter for incipient motion has a value of 0.047
(Gessler, 1971; Meyer-Peter and Müller, 1948) as illustrated in Equation 2.24:
( )
047.01
* =−
=sP
c
cdG γ
ττ Equation 2.24
where
c*τ = critical Shields parameter;
c
τ = critical shear stress (lbs/ft2);
GP = specific weight of Particle P;

31
γ = unit weight of water (lbs/ft3); and
s
d = particle diameter (ft).
which can also be expressed in the form of Equation 2.25:
( )
11047.0
=− sP
c
dG γ
τ Equation 2.25
A relationship between η and the Shields parameter can be obtained for incipient motion
for particles exposed to flow across a horizontal bed as depicted by Equation 2.26:
( )
11047.0
=−
=sP
c
dG γ
τη Equation 2.26
Stevens and Simons (1971) subsequently presumed that for flow conditions other than
incipient motion, η can be determined by Equation 2.27, which uses the boundary shear
stress, 0τ , to replace the critical shear stress and can also be expressed in the form of a
ratio of the boundary shear stress to the critical shear stress:
( ) csP dG τ
ττη 00
1047.0=
−= Equation 2.27
To obtain an expression for β, Stevens and Simons (1971) assumed that the
moment components of the drag force and submerged weight component, θsinS
W ,
normal to Cross-section A-A are balanced. Figure 2.6(d) presents a view of the cross-
section normal to Cross-section A-A in which components of the drag force and of the
weight force are present. Equation 2.28 presents the expression for the equal moment
components:

32
βθδ sinsin'sin' 13 SDWF ll = Equation 2.28
where '1l and '3l are the moment arms corresponding to the drag force component and
the weight force component (ft), respectively, within the plane normal to Cross-section
A-A as illustrated in Figure 2.6(d). Stevens and Simons (1971) apply the assumption that
1313 '' llll ≈ to Equation 2.28. From which, Equation 2.29 can be obtained by
replacing δsin with ( )λβ +cos within Equation 2.28 since °=++ 90λβδ , and
dividing both sides of the equation by S
W2l :
( ) βθλβ sinsincos2
1
2
3
l
l
l
l=+
S
D
W
F Equation 2.29
Equation 2.29 can be further reduced by substituting N for the drag force variable
grouping on the left-hand side of the equation (from Equation 2.17) and substituting
φtan for 12 / ll (from Equation 2.14), producing Equation 2.30:
( ) βφ
θλβ sin
tan
sincos =+N Equation 2.30
Acknowledging that ( ) ( ) ( ) ( ) ( )λβλβλβ sinsincoscoscos −=+ and substituting within
Equation 2.30 produces Equation 2.31:
( ) ( ) ( ) ( ) βφ
θλβλβ sin
tan
sinsinsincoscos
N=− Equation 2.31
Dividing both sides of Equation 2.31 by βsin and solving for β generates Equation
2.32:

33
( ) ( )
+= − λ
φ
θλβ sin
tan
sincostan
1
N Equation 2.32
Finally, multiplying the bottom left term of the right-hand side of Equation 2.32 by
( ) η/NM + , which is equal to 1 by the definition of η , produces Equation 2.33:
( ) ( ) ( )
+
+= − λ
φη
θλβ sin
tan
sincostan
1
N
NM Equation 2.33
Stevens and Simons (1971) stated that assuming 224 ≈ll and 21≈DL
FF is
reasonable. Thereby, establishing the relationship 1≈NM , which imposes the
assumption that the moments created by the drag force, D
F3l , and the lift force, L
F4l ,
are equivalent. With this assumption, Equation 2.22 reduces to Equation 2.34:
( )
++=
2
sin1'
βληη Equation 2.34
and Equation 2.33 to Equation 2.35:
( ) ( )
+= − λ
φη
θλβ sin
tan
sin2costan
1 Equation 2.35
For calculation of safety factors of particles on the channel bed, where the bed-
slope angle is α , the downstream direction is equivalent to the oblique flow on a side
slope with αθ = and °= 90λ . Substituting these values into Equation 2.35 produces a
value of 0° for β . Accordingly, Equation 2.34 reduces to Equation 2.36, and Equation
2.19 reduces to Equation 2.37:

34
( )
ηηη =
°+°+=
2
090sin1' Equation 2.36
φηα
φα
tansin
tancos
+=SF Equation 2.37
In summary, Stevens and Simons (1971) present a method for determining a
safety factor for riprap stability by consecutively solving Equation 2.27, Equation 2.35,
Equation 2.34, and Equation 2.19. Table 2.3 summarizes the Stevens and Simons (1971)
safety factor equations and computation order. The Stevens and Simons (1971) method
was derived from a moment stability analysis and requires values for bed slope, side
slope, design shear stress, and particle diameter.
Table 2.3: Safety Factor Calculation Method According to Stevens and Simons
(1971)
Order of Calculation Equation
Equation Number
1 cτ
τη 0= Equation 2.27
2 ( ) ( )
+= − λ
φη
θλβ sin
tan
sin2costan
1 Equation 2.35
3 ( )
++=
2
sin1'
βληη Equation 2.34
4 φηβθ
φθ
tan'cossin
tancos
+=SF Equation 2.19

35
2.2.2 CLOPPER (1991)
Clopper (1991) presented a method to calculate safety factors for individual
rectangular armor units. This method was based on the Stevens and Simons (1971)
safety factor method with modifications to account for particle geometry. The derivation
for the safety factor calculation method given by Clopper (1991) is presented in this
section.
Figure 2.7(a) illustrates the forces acting on a rectangular armor unit resting on a
channel side slope, which are visible within a channel cross-section view. The angle θ is
the side-slope angle and S
W is the submerged weight of the block as defined by the block
weight minus the buoyancy force. When accounting only for the side slope and assuming
the bed slope is horizontal, the weight force component parallel to the side slope is
θsinS
W and the weight force component normal to the side-slope plane is θcosS
W as
depicted in Figure 2.7(a).
Figure 2.7(b) illustrates the forces acting on the block including hydrodynamic
forces that are visible from a view normal to the side-slope plane. These forces include
the drag force, D
F , and a component of the submerged weight force, S
W . The drag force
acts in the direction of the streamline velocity vector, which deviates from horizontal at
an angle λ .
Clopper (1991) identified that motion initiates along the vector R , which is
located at an angle β from a vertical line projected on the side-slope plane. This direction
is illustrated in Figure 2.7(b) as the combined drag force and weight force vectors within
the side-slope plane. Figure 2.7(c) presents the forces acting within a Cross-section A-A,
which is taken along vector R . These forces include: the weight force acting in the

36
normal direction into the side-slope plane, θcoss
W ; the lift force acting in the normal
direction out of the side-slope plane, L
F ; the component of the drag force along Cross-
section A-A, δcosD
F ; and the weight force component along Cross-section A-A
parallel to the side-slope plane, βθ cossinS
W .

37
Top of Bank Channel Bed
θcosSWθsinSW
θ
(a) Cross-section View
Top of Bank
= Channel Bed Slope
Horizontal
A
A’
R
DF
λ
λ
δ
θsinS
Wβ
(b) View Normal to Side Slope
θcosS
W
δcosD
F
Oβθ cossinS
W
LF
4l
1l
2l
3lA’
A
(c) Section A-A’
δsinD
F
3l
1lβθ sinsin
SW
(d) View Normal to Section A-A’
Figure 2.7: Force Diagrams (adapted from Clopper (1991))

38
where
A-A’ = cross section along block rotation path
FD = drag force (lbs)
FL = lift force (lbs)
1l = moment arm for submerged weight force component parallel to the side-slope plane
(ft)
2l = moment arm for submerged weight force component normal to the side-slope plane
(ft)
3l = moment arm for the drag force component along the path of motion (ft)
4l = moment arm for the lift force (ft)
O = point of rotation
R = vector located along the direction of block rotation
WS = block submerged weight (lbs) β = block rotation angle measured in the side-slope plane (radians)
δ = angle between drag force and the particle rotation path measured in the side-slope
plane (radians)
θ = side-slope angle (radians)
λ = channel-bed angle (radians)
Figure 2.7 (continued): Force Diagrams (adapted from Clopper (1991))
A moment stability analysis was used to obtain an expression for the safety factor
where the safety factor was defined as the ratio of resisting moments to overturning
moments. Equation 2.38 presents the safety factor equation for moment stability about
Point O within Cross-section A-A:
LDS
S
FFW
WSF
431
2
coscossin
cos
lll
l
++=
δβθ
θ Equation 2.38
where
1l = moment arm for submerged weight force component parallel to the side-
slope plane (ft);
2l = moment arm for submerged weight force component normal to the side-
slope plane (ft);

39
3l = moment arm for the drag force component along the path of motion (ft);
and
4l = moment arm for the lift force (ft).
Dividing Equation 2.38 by S
W1l produces Equation 2.39:
( )
S
L
S
D
W
F
W
FSF
1
4
1
3
12
coscossin
cos/
l
l
l
l
ll
++
=δ
βθ
θ Equation 2.39
where all the variables have been previously defined. Subsequently, Clopper (1991)
defined the stability number on a channel side slope, 'η , by Equation 2.40:
S
L
S
D
W
F
W
F
2
4
2
3 cos'
l
l
l
l+=
δη Equation 2.40
Equation 2.40 is substituted into Equation 2.39 to obtain the primary form of the safety
factor equation presented in Clopper (1991):
( )
( ) '/cossin
cos/
12
12
ηβθ
θ
ll
ll
+=SF Equation 2.41
where all the variables have been previously defined.
The stability number for particles on a horizontal plane, η , can be obtained by
setting 0=δ in Equation 2.40 as presented by Equation 2.42:
S
L
S
D
W
F
W
F
2
4
2
3
l
l
l
l+=η Equation 2.42
Equation 2.43 can be obtained by dividing Equation 2.40 by Equation 2.42:

40
S
L
S
D
S
L
S
D
W
F
W
F
W
F
W
F
2
4
2
3
2
4
2
3 cos'
l
l
l
l
l
l
l
l
+
+
=
δ
η
η Equation 2.43
For simplification, Clopper (1991) expresses the variable groupings associated with the
lift force and the drag force as single variables M and N , respectively. Equation 2.44
and Equation 2.45 identify the single variables M and N , which represent the lift force
and drag force variable groupings:
S
L
W
FM
2
4
l
l= Equation 2.44
S
D
W
FN
2
3
l
l= Equation 2.45
Equation 2.43 is modified to include the variables M and N as presented in Equation
2.46:
MN
MN
+
+=
δ
η
η cos' Equation 2.46
Solving Equation 2.46 for 'η produces Equation 2.47:
NM
NM
+
+=
δηη
cos' Equation 2.47
After dividing the numerator and denominator of the right-hand side of Equation 2.47 by
N and recognizing that ( )βλδ += sincos , Equation 2.48 is obtained as an expression
relating 'η to the stability number η :

41
( ) ( )
( )
+
++=
NM
NM
/1
sin/'
βληη Equation 2.48
Incipient motion corresponds to a safety factor of 1 when the flow is fully
turbulent over a hydraulically-rough horizontal surface (i.e., 0=θ and 0=δ ). Equation
2.49 is obtained by substituting these appropriate values corresponding to incipient
motion of a block exposed to flow across a horizontal surface into the safety factor
Equation 2.41:
( )
( )η12
121ll
ll==SF Equation 2.49
Equation 2.49 reduces to identify that 1=η for incipient motion of a block exposed to
flow across a horizontal surface. When flow is fully turbulent along the bed, the Shields
parameter for incipient motion has a value of 0.047 (Gessler, 1971; Meyer-Peter and
Müller, 1948) as illustrated in Equation 2.50:
( )
047.01
* =−
=sP
c
cdG γ
ττ Equation 2.50
where
c*τ = critical Shields parameter;
cτ = critical shear stress (lbs/ft2);
GP = specific weight of Particle P;
γ = unit weight of water (lbs/ft3); and
sd = particle diameter (ft).
which can also be expressed in the form of Equation 2.51:

42
( )
11047.0
=− sP
c
dG γ
τ Equation 2.51
A relationship between η and the Shields parameter can be formed for incipient motion
for a block exposed to flow across a horizontal bed as depicted by Equation 2.52:
( )
11047.0
=−
=sP
c
dG γ
τη Equation 2.52
Clopper (1991) maintained the same assumption as Stevens and Simons (1971) that for
flow conditions other than incipient motion, η can be determined by Equation 2.53
which uses the boundary shear stress, 0τ , to replace the critical shear stress and can also
be expressed in the form of a ratio of the boundary shear stress to the critical shear stress:
( ) csP dG τ
τ
γ
τη 00
1047.0=
−= Equation 2.53
To obtain an expression for β, Clopper (1991) assumed that the moment
components of the drag force and submerged weight component, θsinSW , normal to
Cross-section A-A are balanced. Figure 2.7(d) presents a view of the cross-section
normal to Cross-section A-A in which components of the drag force and of the weight
force are present. Equation 2.54 presents the expression for these equal moment
components:
βθδ sinsinsin 13 SD WF ll = Equation 2.54
where 1l and 3l are the moment arms corresponding to the drag force component and
the weight force component (ft), respectively, within the plane normal to Cross-section

43
A-A. Equation 2.55 is developed by replacing δsin with ( )λβ +cos within Equation
2.54 since °=++ 90λβδ , and dividing both sides of the equation by SW2l :
( ) βθλβ sinsincos2
1
2
3
l
l
l
l=+
S
D
W
F Equation 2.55
Equation 2.55 is further reduced by substituting N for the drag force variable grouping
on the left-hand side of the equation (from Equation 2.45), producing Equation 2.56:
( ) βθλβ sinsincos2
1
l
l=+N Equation 2.56
Acknowledging that ( ) ( ) ( ) ( ) ( )λβλβλβ sinsincoscoscos −=+ and substituting within
Equation 2.56 produces Equation 2.57:
( ) ( ) ( ) ( )N2
1 sinsinsinsincoscos
l
l βθλβλβ =− Equation 2.57
Dividing both sides of Equation 2.57 by βsin and solving for β generates Equation
2.58:
( ) ( )
+= − λ
θλβ sin
sincostan
2
11
Nl
l Equation 2.58
Finally, multiplying the bottom left term of the right-hand side of Equation 2.58 by
( ) η/1/ NNM + , which is equal to 1 by the definition of η , produces Equation 2.59
which is the final expression for β given in Clopper (1991):
( )( )
( )
+
+= − λ
η
θλβ sin
sin1costan
2
11
l
l NM Equation 2.59

44
Clopper (1991) stated that because it is difficult to determine the lift force, it
should be assumed to have the same value as the drag force, which is a conservative
estimate. With this assumption, the ratio of M and N rely solely on the corresponding
moment arms as demonstrated by Equation 2.60:
34
3
2
2
4ll
l
l
l
l==
D
S
S
L
F
W
W
FNM Equation 2.60
This assumption varies from the assumption made by Stevens and Simons (1971) that the
moments created by the lift and drag forces are equal.
Included in the Clopper (1991) safety factor formula are terms that account for
additional forces which occur when blocks are not perfectly installed. Under these
imperfect conditions, additional lift and drag forces, 'LF and 'DF , respectively, are
incurred from the impact of flow against the projecting face. Equation 2.61 displays the
formula for the additional lift and drag forces:
( ) 25.0'' wVzFFLD
∆== ρ Equation 2.61
where
ρ = density of water (slugs/ft3);
z∆ = height of the projecting surface normal to the direction of flow (ft);
w = width of the projecting surface normal to the direction of flow (ft); and
V = flow velocity (ft/s).
Equation 2.61 is derived from the drag force equation displayed in Equation 2.62
assuming the drag force coefficient, DC , has a value of 0.5 and the lift force is equal to
the drag force:

45
2' VACFNDD
ρ= Equation 2.62
where NA is the area of the particle normal to the direction of flow. Using a value of 0.5
for the drag force coefficient is a conservative method which assumes no energy losses
between the upstream approach velocity and the face of the projecting block. Adding
these forces to the safety factor equation produces Equation 2.63, which is the safety
factor formula for projecting blocks given by Clopper (1991):
( )
( ) ( )S
L
S
D
W
F
W
FSF
1
3
1
3
12
12
'sin
''/cossin
cos/
l
l
l
lll
ll
++++
=
βληβθ
θ Equation 2.63
In summary, Clopper (1991) presented a method for determining a safety factor
by consecutively solving Equation 2.60, Equation 2.53, Equation 2.59, Equation 2.48,
Equation 2.61, and Equation 2.63. Table 2.4 summarizes the Clopper (1991) safety
factor equations and computation order. Values for bed slope, side slope, block
geometry, block weight, specific gravity of block material, design velocity, design shear
stress, and critical shear stress are required to use the Clopper (1991) method.

46
Table 2.4: Safety Factor Calculation Method According to Clopper (1991)
Order of Calculation Equation
Equation Number
1
Equation 2.60
2 Equation 2.53
3 Equation 2.59
4 Equation 2.48
5 ( ) 25.0'' wVzFFLD
∆== ρ Equation 2.61
6
( )
( ) ( )S
L
S
D
W
F
W
FSF
1
3
1
3
12
12
'sin
''/cossin
cos/
l
l
l
lll
ll
++++
=
βληβθ
θ
Equation 2.63
2.2.3 JULIEN (1998)
A method to determine safety factors for cohesionless particles on channel side
slopes is given in Julien (1998). This method was based on the Stevens and Simons
(1971) method; however, it accounts for bed slope within the submerged weight force
distribution. A moment stability analysis is at the origin of the derivation, and with some
assumptions and simplifications, a practical safety factor method was derived. The Julien
(1998) method, like Stevens and Simons (1971), incorporated the element of a
normalized Shields parameter to quantify incipient motion on a side slope. This section
presents the derivation for the Julien (1998) safety factor method.
cτ
τη 0=
34 ll=NM
( )( )
( )
+
+= − λ
η
θλβ sin
sin1costan
2
11
l
l NM
( ) ( )( )
+
++=
NM
NM
/1
sin/'
βληη

47
Figure 2.8(a) illustrates the forces acting on a cohesionless Particle, P, resting on a
channel side slope which are visible within a channel cross-section view, where 1θ is the
side-slope angle; SF is the submerged weight of the particle; and θa is geometrically
defined by Equation 2.64 (Julien, 1998):
0
2
1
2sincos θθθ −=a Equation 2.64
where 0θ is the bed-slope angle. A complete derivation of Equation 2.64 is presented
following the introduction of all the force components.
Top of Bank
Bed θaFS
1sin θSF
1θ
SF
(a) Side-slope Gradient
(b) View Normal to Side Slope
Particle P
O’
O 3l2l
1l
1l
δcosD
F
LF
βθ cos12
aFS
−
θaFS
δsinDF
3l
1l
βθ sin12
aFS −
Particle P
O
(c) Section A-A (d) Section Normal to Section A-A
Figure 2.8: Force Diagrams (adapted from Julien (1998))
Streamline
A
δ
λ
β
dF
A 0sinθSF
1sin θSF
θ
u
0θ
Horizontal

48
where
aθ = coefficient of the weight force acting in the direction normal to the side-slope
plane
A-A = cross section along particle rotation path
Fd = drag force (lbs)
FL = lift force (lbs)
FS = particle submerged weight (lbs)
1l = moment arm for submerged weight force component parallel to the side-slope
plane (ft)
2l = moment arm for submerged weight force component normal to the side-slope
plane (ft)
3l = moment arm for the drag force component along the path of motion (ft)
4l = moment arm for the lift force (ft)
O = point of rotation
Particle P = cohesionless particle resting on a channel side slope
u = streamline velocity vector
β = particle rotation angle measured in the side-slope plane (radians)
δ = angle between the drag force and the particle rotation path measured in the side-
slope plane (radians)
θ = resulting angle of the combined weight force components acting in the side-slope
plane measured from a vertical line projected onto the side-slope plane (radians)
θ0 = bed-slope angle (radians)
θ1 = side-slope angle (radians)
λ = angle between horizontal and the streamline velocity vector measured in the side-slope plane (radians)
Figure 2.8 (continued): Force Diagrams (adapted from Julien (1998))
Figure 2.8(b) illustrates the forces acting on Particle P including hydrodynamic
forces, which are visible from a view normal to the side-slope plane. These forces
include the drag force, FD, and components of the submerged weight, SF . Additionally
represented in Figure 2.8(b) is the streamline velocity vector, u , which deviates from the
horizontal at an angle λ . Two weight force components are acting in this plane, 1sin θSF
and 0sin θSF , where the combination of these weight forces produces a single weight
force component within the side-slope plane, which acts at an angle θ from a vertical
line projected on the side-slope plane as illustrated in Figure 2.8(b). This angle θ is
geometrically defined by Equation 2.65:

49
=
= −−
1
01
1
01
sin
sintan
sin
sintan
θ
θ
θ
θθ
S
S
F
F Equation 2.65
The expression for the coefficient of the weight force acting in the direction
normal to the side-slope plane, θa , (Equation 2.64) as illustrated in Figure 2.8(b), is
derived using the two weight force components acting in the side-slope plane, 1sin θSF
and 0sinθSF . Each of the weight force components in the three orthogonal axes must
collectively produce the single weight force component which acts solely in the vertical
direction. This concept is represented mathematically by Equation 2.66:
( ) ( ) ( )22
0
2
1 sinsin θθθ aFFFF SSSS ++= Equation 2.66
SF can be removed from both sides of Equation 2.66 as presented in Equation 2.67:
2
0
2
1
2sinsin1 θθθ a++= Equation 2.67
Solving Equation 2.67 for θa produces Equation 2.68:
0
2
1
2sinsin1 θθθ −−=a Equation 2.68
After substituting the trigonometric identity 1
2
1
2 sin1cos θθ −= , into Equation 2.68,
Equation 2.69 is obtained as an expression for the coefficient of the weight force acting in
the direction normal to the side-slope plane, θa :
0
2
1
2sincos θθθ −=a Equation 2.69

50
When motion occurs, the particle follows a path at an angle β from a vertical line
projected on the side-slope plane. This direction is illustrated in Figure 2.8(b) as the
combined force vectors within the side-slope plane: DF , 1sin θSF , and 0sin θSF . Figure
2.8(c) presents the forces acting within Cross-section A-A which is taken along the
particle movement path. These forces include: the weight force acting in the normal
direction into the side-slope plane, θaFS ; the lift force acting in the normal direction out
of the side-slope plane, LF ; the component of the drag force along Cross-section A-A,
δcosDF ; and the weight force component along Cross-section A-A parallel to the side-
slope plane, βθ cos12
aFS − . The weight force along Cross-section A-A parallel to the
side-slope plane is attained by adding the two weight force vectors within the side-slope
plane, 1sin θSF and 0sin θSF as illustrated by Equation 2.70:
2
0
2
1
21sinsin θθθ aFF SS −=+ Equation 2.70
where θa was defined in Equation 2.64.
A moment stability analysis was used to obtain an expression for the safety factor
where the safety factor was defined as the ratio of resisting moments to overturning
moments. Equation 2.71 presents the safety factor equation for moment stability about
Point O within Cross-section A-A:
LDS
S
O
FFaF
aFSF
43
2
1
2
coscos1 lll
l
++−=
δβθ
θ Equation 2.71
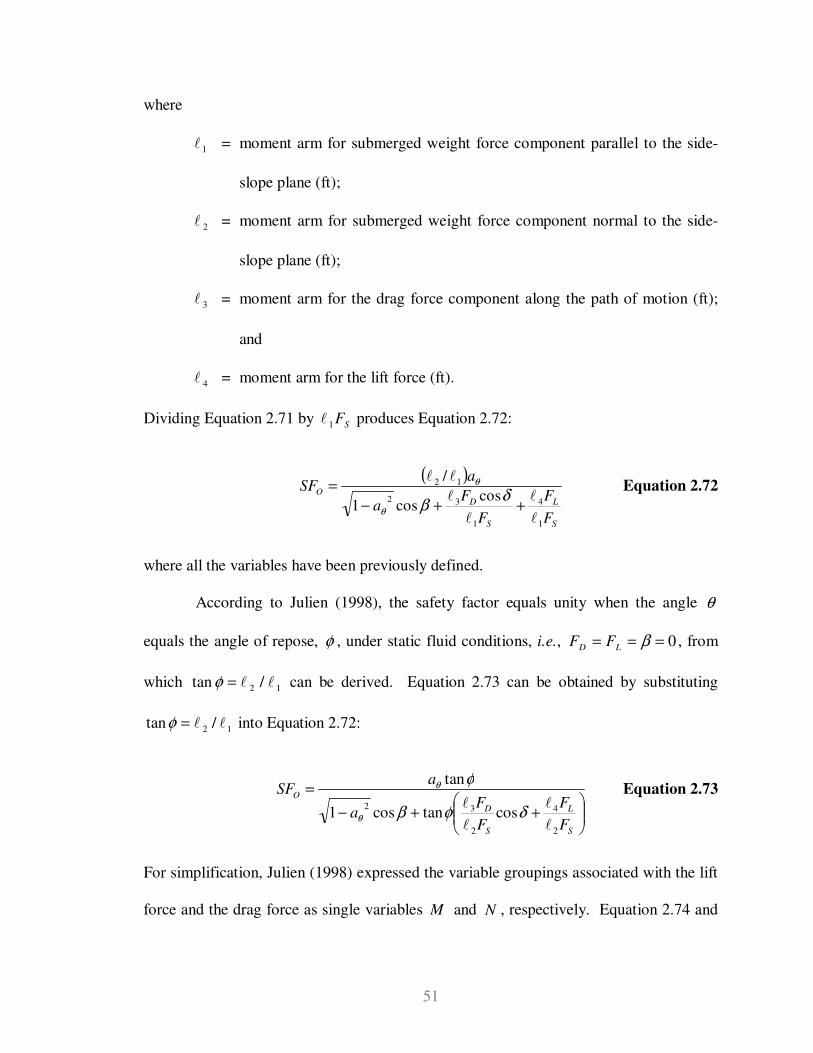
51
where
1l = moment arm for submerged weight force component parallel to the side-
slope plane (ft);
2l = moment arm for submerged weight force component normal to the side-
slope plane (ft);
3l = moment arm for the drag force component along the path of motion (ft);
and
4l = moment arm for the lift force (ft).
Dividing Equation 2.71 by SF1l produces Equation 2.72:
( )
S
L
S
DO
F
F
F
Fa
aSF
1
4
1
32
12
coscos1
/
l
l
l
l
ll
++−
=δ
βθ
θ Equation 2.72
where all the variables have been previously defined.
According to Julien (1998), the safety factor equals unity when the angle θ
equals the angle of repose, φ , under static fluid conditions, i.e., 0=== βLD FF , from
which 12 /tan ll=φ can be derived. Equation 2.73 can be obtained by substituting
12 /tan ll=φ into Equation 2.72:
++−
=
S
L
S
D
O
F
F
F
Fa
aSF
2
4
2
32costancos1
tan
l
l
l
lδφβ
φ
θ
θ Equation 2.73
For simplification, Julien (1998) expressed the variable groupings associated with the lift
force and the drag force as single variables M and N , respectively. Equation 2.74 and

52
Equation 2.75 identify the single variables M and N which represent the lift force and
drag force variable groupings:
S
L
F
FM
2
4
l
l= Equation 2.74
S
D
F
FN
2
3
l
l= Equation 2.75
In addition, Julien (1998) defined a variable identified as the stability number for
particles on a side slope, 1η , by Equation 2.76 to simplify the safety factor expression:
δη cos1 NM += Equation 2.76
After making substitutions from Equation 2.76, Equation 2.75, and Equation 2.74 into
Equation 2.73, the primary form of the Julien (1998) safety factor equation is attained as
presented in Equation 2.77:
φηβ
φ
θ
θ
tancos1
tan
1
2+−
=a
aSFO Equation 2.77
where all the variables have been previously defined.
The stability number for particles on a horizontal plane can be developed by
setting 0=δ in Equation 2.76 as presented in Equation 2.78:
NM +=0η Equation 2.78
where 0η is the stability number for particles on a horizontal plane. Multiplying the
right-hand side of Equation 2.76 by NM +
0η , which equals 1, generates Equation 2.79:

53
NM
NM
+
+=
δηη
cos01 Equation 2.79
After dividing the numerator and denominator on the right-hand side of Equation 2.79 by
N and recognizing that ( )θβλδ ++= sincos , Equation 2.80 can be obtained as an
expression relating the stability number for particles on a side slope, 1η , to the stability
number for particles on a horizontal plane, 0η :
( ) ( )
( )
+
+++=
NM
NM
/1
sin/01
θβληη Equation 2.80
Incipient motion corresponds to a safety factor of 1 when the flow is fully
turbulent over a hydraulically-rough horizontal surface (i.e., 00 =θ , 01 =θ , 0=δ , and
1=θa ). Equation 2.81 can be obtained by substituting these appropriate values
corresponding to incipient motion of a particle exposed to flow across a horizontal
surface into the safety factor equation (Equation 2.77):
φη
φ
tan
tan1
0
==OSF Equation 2.81
Equation 2.81 reduces to identify that 10 =η for incipient motion of a particle exposed to
flow across a horizontal surface. When flow is fully turbulent along the bed, the Shields
parameter for incipient motion has a value of 0.047 (Gessler, 1971; Meyer-Peter and
Müller, 1948) as illustrated in Equation 2.82:
( )
047.01
* =−
=sP
c
cdG γ
ττ Equation 2.82

54
where
c*τ = critical Shields parameter;
cτ = critical shear stress (lbs/ft2);
PG = specific weight of Particle P;
γ = unit weight of water (lbs/ft3); and
sd = particle diameter (ft).
This can also be expressed in the form of Equation 2.83:
( )
11047.0
=− sP
c
dG γ
τ Equation 2.83
A relationship between 0η and the Shields parameter can be obtained for incipient
motion for particles exposed to flow across a horizontal bed as depicted by Equation
2.84:
( )
11047.0
0 =−
=sP
c
dG γ
τη Equation 2.84
Julien (1998) subsequently presumed that for flow conditions other than incipient motion,
0η can be determined by Equation 2.85 which uses the boundary shear stress, 0τ , to
replace the critical shear stress and can also be expressed in the form of a ratio of the
boundary shear stress to the critical shear stress:
( ) csP dG τ
τ
γ
τη 00
01047.0
=−
= Equation 2.85

55
Julien (1998) presented alternative methods for calculating 0η , which come from
replacing the boundary shear stress with the reference velocity, the velocity against the
particle, or the average flow velocity.
To obtain an expression for β, Julien (1998) assumed that the moment
components of the drag force and submerged weight component, 2
1 θaFS − , normal to
Cross-section A-A are balanced. Figure 2.8(d) presents a view of the cross-section
normal to Cross-section A-A in which components of the drag force and of the weight
force are present. Equation 2.86 presents the expression for these equal moment
components:
βδ θ sin1sin2
13 aFF SD −= ll Equation 2.86
Equation 2.87 is developed by replacing δsin with ( )θλβ ++cos in Equation 2.86 since
°=+++ 90θλβδ , and dividing both sides of the equation by SF2l :
( ) βθλβ θ sin1cos2
2
1
2
3 aF
F
S
D −=++l
l
l
l Equation 2.87
Equation 2.87 can be further reduced by substituting N for the drag force variable
grouping on the left-hand side of the equation and substituting φtan for 12 / ll ,
producing Equation 2.88:
( ) βφ
θλβθ
sintan
1cos
2a
N−
=++ Equation 2.88

56
Acknowledging that ( ) ( ) ( ) ( ) ( )θλβθλβθλβ +−+=++ sinsincoscoscos and
substituting within Equation 2.88 produces Equation 2.89:
( ) ( ) ( ) ( ) βφ
θλβθλβθ
sintan
1sinsincoscos
2
N
a−=+−+ Equation 2.89
Dividing both sides of Equation 2.89 by βsin and solving for β provides Equation 2.90:
( ) ( )
++
−+= − θλ
φθλβ
θsin
tan
1costan
2
1
N
a Equation 2.90
Finally, multiplying the bottom left term of the right-hand side of Equation 2.90 by
( ) 0/ηNM + , which is equal to 1 by the definition of 0η , produces Equation 2.91 which
is the expression given for β in Julien (1998):
( )( )
( )
++
−++= − θλ
φηθλβ
θsin
tan
1costan
0
2
1
N
aNM Equation 2.91
Julien (1998) stated that the stability factor is not very sensitive to the ratio
NM / and suggests using a value of 1 (i.e., NM = ), which thereby reduces Equation
2.80 to Equation 2.92:
( )
+++=
2
sin101
θβληη Equation 2.92
and Equation 2.91 to Equation 2.93:

57
( ) ( )
++
−+= − θλ
φηθλβ
θsin
tan
12costan
0
2
1a
Equation 2.93
This simplification implies that the moments created by the lift force, LF4l , and the drag
force, DF3l , are equivalent.
In summary, by using the Julien (1998) method, a safety factor can be attained by
calculating consecutively Equation 2.64, Equation 2.65, Equation 2.85, Equation 2.93,
Equation 2.92, and Equation 2.77. Table 2.5 summarizes the Julien (1998) safety factor
equations and computation order. Values for bed slope, side slope, design shear stress,
and critical shear stress are required to use the Julien (1998) method.
Table 2.5: Safety Factor Calculation Method According to Julien (1998)
Order of Calculation Equation
Equation Number
1 0
2
1
2 sincos θθθ −=a Equation 2.64
2
= −
1
01
sin
sintan
θ
θθ Equation 2.65
3 ( ) csP dG τ
τ
γ
τη 00
01047.0
=−
= Equation 2.85
4 ( ) ( )
++
−+= − θλ
φηθλβ θ
sintan
12costan
0
2
1 a Equation 2.93
5 ( )
+++=
2
sin101
θβληη Equation 2.92
6 φηβ
φ
θ
θ
tancos1
tan
1
2+−
=a
aSFO Equation 2.77

58
2.2.4 JULIEN AND ANTHONY (2002)
Julien and Anthony (2002) presented a similar moment stability analysis as Julien
(1998); however, they provided more complex expressions for the weight force
distribution coefficient, θa , and the angle θ . These variables are illustrated in Figure
2.9(a) and Figure 2.9(b). According to Julien and Anthony (2002), the non-simplified
form of the weight force components 1sinθSF and 0sin θSF (Figure 2.8) from Julien
(1998) are 10 sincos θθSF and 01 sincos θθSF , respectively. The combination of these
weight forces produces a single weight force component within the side-slope plane
which acts at an angle θ from a vertical line projected on the side-slope plane as
illustrated in Figure 2.9(b). This angle θ is geometrically defined by Equation 2.94:
=
= −−
10
011
10
011
sincos
sincostan
sincos
sincostan
θθ
θθ
θθ
θθθ
S
S
F
F Equation 2.94
Furthermore, it can be determined that the fraction of the submerged weight normal to the
side slope, θa , is related to the bed slope and side slope by Equation 2.95:
0
2
1
2
1
2
0
2sincossincos1 θθθθθ −−=a Equation 2.95
This expression can be derived using the two weight force components acting in side-
slope plane, 01 cossin θθSF and 10 cossin θθSF . Each of the weight force components in
the three orthogonal axes must collectively produce the single weight force component
which acts solely in the vertical direction. This concept is represented mathematically by
Equation 2.96:

59
( ) ( ) ( )22
01
2
10 sincossincos θθθθθ aFFFF SSSS ++= Equation 2.96
SF can be removed from both sides of Equation 2.96 as presented in Equation 2.97:
2
0
2
1
2
1
2
0
2sincossincos1 θθθθθ a++= Equation 2.97
By solving Equation 2.97 for θa , Equation 2.98 is obtained as the expression for the
coefficient of the weight force acting in the direction normal to the side-slope plane:
0
2
1
2
1
2
0
2sincossincos1 θθθθθ −−=a Equation 2.98
According to Julien and Anthony (2002), if the side-slope angle and the bed-slope angle
are small (less than 20°), then θa can be approximated by Equation 2.99:
0
2
1
2sincos θθθ −=a Equation 2.99
and θ can be approximated by Equation 2.100:
= −
1
01
sin
sintan
θ
θθ Equation 2.100
These are the expressions for θa and θ which are used in the Julien (1998) method.

60
Top of Bank
Bed θaFS
1sin θSF
1θ
SF
δ
λ
βA 01 sincos θθsF
10 sincos θθsF
θ
u
A
0θDownstream
(a) Side-slope Gradient (b) View Normal to Side Slope
Particle P
O’
O 3l2l
1l
1l
δcosDF
LF
βθ cos12
aFS −
θaFS
δsinDF
3l
1l
βθ sin12
aFS −
Particle P
O
(c) Section A-A (d) Section Normal to Section A-A
where
aθ = coefficient of the weight force acting in the direction normal to the side-slope plane
A-A = cross section along particle rotation path
Fd = drag force (lbs) FL = lift force (lbs)
FS = particle submerged weight (lbs)
1l = moment arm for submerged weight force component parallel to the side-slope plane
(ft)
2l = moment arm for submerged weight force component normal to the side-slope plane
(ft)
3l = moment arm for the drag force component along the path of motion (ft)
4l = moment arm for the lift force (ft)
O = point of rotation
Particle P = cohesionless particle resting on a channel side slope
u = streamline velocity vector β = particle rotation angle measured in the side-slope plane (radians)
δ = angle between the drag force and the particle rotation path measured in the side-
slope plane (radians)
θ = resulting angle of the combined weight force components acting in the side-slope
plane measured from a vertical line projected onto the side-slope plane (radians)
θ0 = bed-slope angle (radians)
θ1 = side-slope angle (radians)
λ = angle between horizontal and the streamline velocity vector measured in the side-
slope plane (radians)
Figure 2.9: Force Diagrams (adapted from Julien and Anthony (2002))

61
Following the derivation for the Julien (1998) method presented in Section 2.2.3,
the safety factor equation can be obtained as presented in Equation 2.101:
φηβ
φ
θ
θ
tancos1
tan
1
2+−
=a
aSFO Equation 2.101
where the stability number for particles on a side slope, 1η , can be calculated from
Equation 2.102:
( ) ( )
( )
+
+++=
NM
NM
/1
sin/01
θβληη Equation 2.102
The angle in the direction of particle movement, β , can be computed by Equation 2.103:
( )( )
( )
++
−++= − θλ
φηθλβ
θsin
tan
1costan
0
2
1
N
aNM Equation 2.103
The stability number for particles on a horizontal surface, 0η , can be calculated by
Equation 2.104:
( ) csP dG τ
τ
γ
τη 00
01047.0
=−
= Equation 2.104
and the variables M and N are defined by Equation 2.105 and Equation 2.106,
respectively:
S
L
W
FM
2
4
l
l= Equation 2.105

62
S
D
W
FN
2
3
l
l= Equation 2.106
Analogous to the Julien (1998) derivation, the Julien and Anthony (2002) derivation used
the concept that 12 /tan ll=φ . Additionally, the derivation utilized the assumption that
the stability number, 0η , for flow conditions other than incipient motion is linearly
related to the boundary shear stress. A safety factor can be attained using the Julien and
Anthony method by calculating consecutively Equation 2.95, Equation 2.94, Equation
2.104, Equation 2.103, Equation 2.102, and Equation 2.101. Table 2.6 summarizes the
Julien and Anthony (2002) safety factor equations and computation order. Values for bed
slope, side slope, design shear stress, and critical shear stress are required to use the
Julien and Anthony (2002) method.

63
Table 2.6: Safety Factor Calculation Method According to Julien and Anthony
(2002)
Order of Calculation Equation
Equation Number
1 0
2
1
2
1
2
0
2 sincossincos1 θθθθθ −−=a Equation 2.95
2
= −
10
011
sincos
sincostan
θθ
θθθ Equation 2.94
3 ( ) csP dG τ
τ
γ
τη 00
01047.0
=−
= Equation 2.104
4 ( )( )
( )
++
−++= − θλ
φηθλβ
θsin
tan
1costan
0
2
1
N
aNM Equation 2.103
5 ( ) ( )
( )
+
+++=
NM
NM
/1
sin/01
θβληη Equation 2.102
6 φηβ
φ
θ
θ
tancos1
tan
1
2+−
=a
aSFO Equation 2.101
2.2.5 NATIONAL CONCRETE MASONRY ASSOCIATION (2006)
The NCMA (2006) presented a similar method to determine safety factors for
individual blocks within a system. This method combined components of both the Julien
and Anthony (2002) and the Julien (1998) safety factor methods with modifications to
account for block geometry. The derivation for the safety factor calculation method
provided in NCMA (2006) is presented in this section.
Figure 2.10(a) illustrates the forces acting on a block resting on a channel side
slope which are visible within a channel cross-section view. The angle 1θ is the side-

64
slope angle and SF is the submerged weight of the particle as defined by the block
weight minus the buoyancy force. The variable θa is geometrically defined by Equation
2.107 (Julien, 1998):
0
2
1
2sincos θθθ −=a Equation 2.107
where 0θ is the bed-slope angle. A complete derivation of Equation 2.107 is presented in
Section 2.2.3.

65
Top of Bank Channel Bed
θaFS
1sinθSF
1θSF
(a) Cross-section View
A
A’
DF
λ
δ
1sinθ
SF
β
0sinθSF
θ
u
0θ
(b) View Normal to Side Slope
θaFS
δcosDF
Oβθ cos12
aFS
−
LF
4l
1l
2l
3l
(c) Section A-A’
δsinDF
3l
1l
βθ sin12
aFS −
(d) View Normal to Section A-A’
Figure 2.10: Force Diagrams (adapted from NCMA (2006))

66
where
aθ = coefficient of the weight force acting in the direction normal to the side-slope plane
A-A’ = cross section along particle rotation path
FD = drag force (lbs)
FL = lift force (lbs)
FS = block submerged weight (lbs)
1l = moment arm for submerged weight force component parallel to the side-slope plane (ft)
2l = moment arm for submerged weight force component normal to the side-slope plane (ft)
3l = moment arm for the drag force component along the path of motion (ft)
4l = moment arm for the lift force (ft)
O = point of rotation u = streamline velocity vector
β = angle of block rotation measured in the side-slope plane (radians)
δ = angle between the drag force and the block rotation path measured in the side-slope
plane (radians)
θ = resulting angle of the combined weight force components acting in the side-slope plane
measured from a vertical line projected onto the side-slope plane (radians)
θ0 = bed-slope angle (radians)
θ1 = side-slope angle (radians)
Figure 2.10 (continued): Force Diagrams (adapted from NCMA (2006))
Figure 2.10(b) illustrates the forces acting on the block, including hydrodynamic
forces, which are visible from a view normal to the side-slope plane. These forces
include the drag force, DF , and components of the submerged weight, SF . Additionally
represented in Figure 2.10(b) is the streamline velocity vector, u , which deviates from
horizontal at an angle 0θ . Two weight force components are acting in this plane where
the combination of these weight forces produces a single weight force component within
the side-slope plane that acts at an angle θ from a vertical line projected on the side-
slope plane as illustrated in Figure 2.10(b). Julien (1998) defined the forces as 1sin θSF
and 0sin θSF as displayed in Figure 2.10(b) whereas Julien and Anthony (2002) defined
the forces as 01 cossin θθSF and 10 cossin θθSF . The method presented by NCMA
(2006) used the Julien (1998) definition to calculate the value of θa and the Julien and

67
Anthony definition to compute the angle θ . Equation 2.108 presents the expression
relating the angle θ to the side-slope angle, 1θ , and the bed-slope angle, 0θ :
= −
01
101
cossin
cossintan
θθ
θθθ Equation 2.108
When motion occurs, the block follows a path at an angle β from a vertical line
projected on the side-slope plane. This direction is illustrated in Figure 2.10(b) as the
combined force vectors within the side-slope plane: DF , 1sin θSF , and 0sin θSF . Figure
2.10(c) presents the forces acting within a Cross-section A-A which is taken along the
block movement path. These forces include: the weight force acting in the normal
direction into the side-slope plane, θaFs ; the lift force acting in the normal direction out
of the side-slope plane, LF ; the component of the drag force along Cross-section A-A,
δcosDF ; and the weight force component along Cross-section A-A parallel to the side-
slope plane, βθ cos12
aFS − . The weight force along Cross-section A-A parallel to the
side-slope plane is attained by adding the two weight force vectors within the side-slope
plane, 1sin θSF and 0sin θSF , as illustrated by Equation 2.109:
2
0
2
1
21sinsin θθθ aFF SS −=+ Equation 2.109
where θa was defined in Equation 2.107.
A moment stability analysis is used to obtain an expression for the safety factor
where the safety factor is defined as the ratio of resisting moments to overturning
moments. Equation 2.110 presents the safety factor equation for moment stability about
a block within Cross-section A-A:

68
LDS
S
O
FFaF
aFSF
43
2
1
2
coscos1 lll
l
++−=
δβθ
θ Equation 2.110
where
1l = moment arm for submerged weight force component parallel to the side-
slope plane (ft);
2l = moment arm for submerged weight force component normal to the side-
slope plane (ft);
3l = moment arm for the drag force component along the path of motion (ft);
and
4l = moment arm for the lift force (ft).
Dividing Equation 2.110 by SF1l produces Equation 2.111:
( )
S
L
S
DO
F
F
F
Fa
aSF
1
4
1
32
12
coscos1
/
l
l
l
l
ll
++−
=δ
βθ
θ Equation 2.111
where all the variables have been previously defined. For simplification, the variable
groupings associated with the lift force and the drag force are expressed as single
variables M and N , respectively. Equation 2.112 and Equation 2.113 identify the
single variables M and N which represent the lift force and drag force variable
groupings, respectively:
S
L
F
FM
2
4
l
l= Equation 2.112

69
S
D
F
FN
2
3
l
l= Equation 2.113
In addition, the variable identified by Julien (1998) as the stability number for particles
on a side slope, 1η , is utilized to simplify the safety factor expression. 1η is defined in
relation to the variable groupings M and N by Equation 2.114:
δη cos1 NM += Equation 2.114
After making the substitutions from Equation 2.114, Equation 2.113, and Equation 2.112
into Equation 2.111, the primary form of the NCMA (2006) safety factor equation is
obtained as presented in Equation 2.115:
( )
( ) 112
2
12
/cos1
/
ηβθ
θ
ll
ll
+−=
a
aSFO Equation 2.115
where all the variables have been previously defined.
The stability number for blocks on a horizontal plane, 0η , can be obtained by
setting 0=δ in Equation 2.114 as presented in Equation 2.116:
NM +=0η Equation 2.116
Multiplying Equation 2.116 by NM +
0η , which equals 1, produces Equation 2.117:
NM
NM
+
+=
δηη
cos01 Equation 2.117
After dividing the numerator and denominator of the right-hand side of Equation 2.117
by N and recognizing that ( )θβθδ ++= 0sincos , Equation 2.118 can be obtained as an

70
expression relating the stability number for particles on a side slope, 1η , to the stability
number 0η :
( ) ( )
( )
+
+++=
NM
NM
/1
sin/ 001
θβθηη Equation 2.118
As described in Section 2.2.1, the stability number for a discrete particle on a side-slope
plane, 0η , can be related to the boundary shear stress by Equation 2.119:
cτ
τη 0
0 = Equation 2.119
To obtain an expression for β, NCMA (2006) made the same assumption as Julien
(1998) and Stevens and Simons (1971) that the moment components of the drag force and
submerged weight component, 2
1 θaFS − , normal to Cross-section A-A are balanced.
Figure 2.10(d) presents a view of the cross-section normal to Cross-section
A-A in which components of the drag force and of the weight force are present. Equation
2.120 presents the expression for these equal moment components:
βδ θ sin1sin2
13 aFF SD −= ll Equation 2.120
Equation 2.121 can be obtained by replacing δsin with ( )θθβ ++ 0cos in Equation
2.120 since °=+++ 900 θθβδ , and dividing both sides of the equation by SF2l :
( ) βθθβ θ sin1cos2
2
10
2
3 aF
F
S
D −=++l
l
l
l Equation 2.121

71
Equation 2.121 can be further reduced by substituting N for the drag force variable
grouping on the left-hand side of the equation producing Equation 2.122:
( ) βθθβ θ sin1cos2
2
10 aN −=++
l
l Equation 2.122
Acknowledging that ( ) ( ) ( ) ( ) ( )θθβθθβθθβ +−+=++ 000 sinsincoscoscos and
substituting within Equation 2.122 produces Equation 2.123:
( ) ( ) ( ) ( ) βθθβθθβ θsin
1sinsincoscos
2
2
1
00N
a
l
l −=+−+ Equation 2.123
Dividing both sides of Equation 2.123 by βsin and solving for β provides Equation
2.124:
( ) ( )
++
−+= − θθθθβ θ
0
2
2
1
0
1sin
1costan
N
a
l
l Equation 2.124
Multiplying the bottom left term of the right-hand side of Equation 2.124 by
( ) 0/ηNM + , which is equal to 1 by the definition of 0η , produces Equation 2.125:
( )( )
( )
++
−++= − θθ
ηθθβ θ
0
20
2
1
0
1sin
1costan
N
aNM
l
lEquation 2.125
Lastly, multiplying the bottom left term of the right-hand side of Equation 2.125 by N
N
1
1
generates Equation 2.126, the expression used for β in NCMA (2006):

72
( )( )
( )( )
++
−++= − θθ
ηθθβ θ
0
012
2
0
1 sin11
costanll
aNMEquation 2.126
NCMA (2006) assumed that the drag and lift forces have the same value. With
this assumption the ratio of M and N relies solely on the corresponding moment arms
as demonstrated by Equation 2.127:
34
3
2
2
4ll
l
l
l
l==
D
S
S
L
F
F
F
FNM Equation 2.127
The assumption that the drag and lift forces are equal varies from the assumption made
by Julien (1998) that the moments created by the lift and drag forces are equal.
Like the method given by Clopper (1991), NCMA (2006) included the terms
displayed in Equation 2.61 that account for additional drag and lift forces which occur
when blocks are not perfectly installed. Adding the additional lift and drag forces to the
safety factor equation produces Equation 2.128, which is the safety factor formula given
in NCMA (2006):
( )
( ) ( )S
L
S
DO
F
F
F
Fa
aSF
1
30
1
3112
2
12
'sin
'/cos1
/
l
l
l
lll
ll
++++−
=
βθηβθ
θ Equation 2.128
In summary, NCMA (2006) presented a method for determining a safety factor by
calculating consecutively Equation 2.127, Equation 2.119, Equation 2.107, Equation
2.108, Equation 2.126, Equation 2.118, Equation 2.61, and Equation 2.128. Table 2.7
summarizes the NCMA (2006) safety factor equations and computation order. Values for
bed slope, side slope, block geometry, block weight, specific gravity of block material,

73
design velocity, design shear stress, and critical shear stress are required to use the
NCMA (2006) method.
Table 2.7: Safety Factor Calculation Method According to the NCMA (2006)
Order of Calculation Equation
Equation Number
1 34 ll=NM Equation 2.127
2 cτ
τη 0
0 = Equation 2.119
3 0
2
1
2 sincos θθθ −=a Equation 2.107
4
= −
01
101
cossin
cossintan
θθ
θθθ Equation 2.108
5 ( )( )
( )( )
++
−++= − θθ
ηθθβ θ
0
012
2
0
1 sin11
costanll
aNM Equation 2.126
6 ( ) ( )
( )
+
+++=
NM
NM
/1
sin/ 001
θβθηη Equation 2.118
7 ( ) 25.0'' wVzFF LD ∆ρ== Equation 2.61
8
( )
( ) ( )S
L
S
DO
F
F
F
Fa
aSF
1
30
1
3112
2
12
'sin
'/cos1
/
l
l
l
lll
ll
++++−
=
βθηβθ
θ Equation 2.128

74
2.3 SUMMARY
Testing and evaluation of ACB protection systems has been conducted by CIRIA,
FHWA, USACE, and Colorado State University (CSU) dating back to the late 1980s.
Overtopping hydraulic conditions is the primary form of testing ACB armored
embankments with the exception of Abt et al. (2001) which included testing of
channelized flow conditions. The current state-of-the-practice for testing and evaluation
of ACB protection systems is the ASTM D7277 (2008) testing standard and
corresponding ASTM D7276 (2008) standard for analysis and interpretation of ACB test
data.
To obtain design guidelines for ACB protection systems, safety factor methods
developed for riprap design have been tailored to engineered armor units. From the
literature review, two safety factor methods for ACB protection systems were identified:
1) Clopper (1991) and 2) NCMA (2006). Within both derivations, a moment stability
analysis was used in conjunction with a stability number for hydrodynamic forces. The
current state-of-the practice for ACB system hydraulic design is NCMA (2006).

75
Throughout the safety factor (SF) derivations presented in Section 2.2, a
significant number of assumptions were used to develop the safety factor computation
methods. As with many areas of engineering, simplifications can be necessary to
describe the mechanics of a phenomenon simply due to the large number of variables and
availability of appropriate input values for computation. Given that the moment stability
analysis methods were extrapolated outside of the original application, the employed
assumptions need to be identified and investigated for the appropriate use for ACB
design. Chapter 3 identifies each of the assumptions applied in the safety factor
derivations and provides an investigation of the relevance of each assumption.
3.1 IDENTIFICATION OF ASSUMPTIONS
One assumption identified for Clopper (1991) and NCMA (2006) is that for flow
conditions other than incipient motion, η can be expressed in the form of a ratio of the
boundary shear stress to the critical shear stress. Since the critical shear stress is a
constant, this assumption implies a linear relationship between the stability number and
the boundary shear stress. Recalling that the stability number, η, is related to the drag
3 EXAMINATION OF ASSUMPTIONS IN SAFETY
FACTOR DERIVATIONS

76
force and lift force, Equation 3.1 expresses the relationship imposed between these forces
and the boundary shear stress:
cS
D
S
L
W
F
W
F
τ
τη 0
2
3
2
4 =+=l
l
l
l Equation 3.1
This relationship assumes that the lift and drag forces are solely dependent upon the
boundary shear stress. When the boundary shear stress is 0, the value of the stability
number, η, is 0; and, as previously established, when the boundary shear stress is equal to
the critical shear stress, the value of the stability number is unity. Figure 3.1 illustrates
the assumed linear relationship, but also presents other potential relationships that satisfy
these specific known values.
Figure 3.1: Potential Relationships between the Stability Number and the
Boundary Shear Stress to Critical Shear-stress Ratio
Critical shear-stress values are required to use both calculation methods. Having
an accurate value for the critical shear stress is crucial considering it is used for the
τ0/τc = η0.6
τ0/τc = η
τ0/τc = η1.5
0
0.2
0.4
0.6
0.8
1
1.2
1.4
0 0.2 0.4 0.6 0.8 1 1.2 1.4
η
τ0/ τc
Power (Series2) Linear (Series1) Power (Series3)

77
computation of the stability number, η. An extrapolation method is given to obtain the
critical shear-stress value for a block on a given slope from a known value for the same
block on a different slope. Equation 3.2 provides the extrapolation formula to obtain the
critical shear stress for a block on an untested slope, UCθτ (NCMA, 2006):
−
−=
TT
UUTCUC
θθ
θθττ θθ
sincos
sincos
12
12
ll
ll Equation 3.2
where
TCθτ = critical shear stress for the tested bed slope (lbs/ft2);
Uθ = untested bed slope (radians);
Tθ = tested bed slope (radians);
2l = moment arm corresponding to the weight force component normal to the
bed surface (ft); and
1l = moment arm corresponding to the weight force component parallel to the
bed surface (ft).
In addition, an extrapolation formula is given to obtain the critical shear stress for an
untested block, CUτ , from a value known for a similar tested block. This formula is
provided in Equation 3.3 (NCMA, 2006):
( )( )
+
+=
UUTST
TTUSUCTCU
W
W
432
432
lll
lllττ Equation 3.3

78
where
CTτ = critical shear stress for the tested block (lbs/ft2);
SUW , STW = submerged weight of the untested and tested blocks (lbs),
respectively;
U2l , U3l , U4l = moment arms for the untested block (ft); and
T2l , T3l , T4l = moment arms for the tested block (ft).
Clopper (1991) and NCMA (2006) safety factor methods use trigonometric
simplifications for the weight force distributions, which are only suitable for small bed
slopes. Clopper (1991) derived expressions for the weight force distributions do not
account for the bed slope. As a result, the Clopper (1991) method produces non-
conservative safety factor predictions at higher bed slopes. Conversely, the NCMA
(2006) method over accounts for the bed slope and generates conservative predictions at
higher bed slopes.
An additional shared assumption is that the lift force and drag force are
equivalent. This is considered a conservative assumption by Clopper (1991); however,
there is no evidence to verify that this assumption is conservative. Without a known lift
coefficient for the block, calculating the lift force is not feasible.
For Clopper (1991) and NCMA (2006), a value is calculated for the block
movement direction angle, β; however, the corresponding movement arms for the forces
acting along the cross section taken at the angle β are specified as half of the block
diagonal. Rotation about a computed direction angle, β, other than the angle to the block
corner or the edge of a block is impossible. Furthermore, the moment arms employed
imply that the block rotates about the block corner which has a defined angle, β, from the

79
block geometry. Dependent on conditions, rotation may initiate about the downstream
edge of the block or the inside edge of the block facing the center of the channel.
Calculating safety factors for rotation about each of the three potential rotation points is
necessary to determine the critical rotation mode.
To obtain an expression for β, Clopper (1991) and NCMA (2006) assume that the
moment components of the drag force and submerged weight component normal to the
direction of flow are balanced. This excludes the lift force and a component of the
weight force which also create moments for rotation in this cross section. Since the angle
β is defined by the armor unit geometry, this assumption is unnecessary.
A value of eight-tenths of the armor unit height is specified to be appropriate for
the moment arm corresponding to the drag force in both calculation methods. According
to NCMA (2006), this value is a good estimate which accounts for both the drag force on
the top surface of the block and the drag force on the body of the block. Accounting for
the drag force acting on the side of the block assumes there is significant interstitial flow
within the revetment system.
3.2 INVESTIGATION OF ASSUMPTIONS
An example scenario was developed to investigate the assumptions outlined in the
preceding chapter. The example revetment is composed of a rectangular-shaped block
with an assumed perfect installation. It has a submerged weight of 37.3 lbs; a critical
shear stress of 22.4 lbs/ft2 for a horizontal plane; and values of 1l , 2l , 3l , and 4l as
0.198 ft, 0.971 ft, 0.317 ft, and 0.971 ft, respectively. For this example, the shear stress is
5.26 lbs/ft2, the side slope is 3 ft/ft and the bed slope is 0.50 ft/ft. An evaluation of the
80
stability of the example block under these normal flow conditions produces a safety
factor value of 3.37 using the method presented in Clopper (1991), and a value of 2.42
using the method presented in NCMA (2006). Figure 3.2 presents Clopper (1991) and
NCMA (2006) safety factor values computed for the example with varying shear stresses
between 0.5 to 10.5 lbs/ft2, while keeping all other variables constant. Figure 3.3
presents Clopper (1991) and NCMA (2006) safety factor values computed for the
example with varying bed slopes between 0.005 to 1.0 ft/ft, while keeping all other
variables constant. Figure 3.4 presents Clopper (1991) and NCMA (2006) safety factor
values computed for the example with varying side slopes between 1 to 10 ft/ft, while
keeping all other variables constant. This section discusses each of the assumptions and
evaluates the resulting influence on the safety factor prediction for the given example.

81
0
2
4
6
8
10
12
14
0 2 4 6 8 10 12
Shear Stress (lbs/ft2)
Safe
ty F
acto
r
Clopper (1991) NCMA (2006)
Figure 3.2: Calculated Safety Factors for Varying Shear Stress
0
2
4
6
8
10
12
14
0 0.2 0.4 0.6 0.8 1 1.2
Bed Slope (ft/ft)
Safe
ty F
acto
r
Clopper (1991) NCMA (2006)
Figure 3.3: Calculated Safety Factors for Varying Bed Slopes

82
0
2
4
6
8
10
12
14
0 2 4 6 8 10 12
Side Slope (ft/ft)
Safe
ty F
acto
r
Clopper (1991) NCMA (2006)
Figure 3.4: Calculated Safety Factors for Varying Side Slopes
Removing the assumption that the stability number is equal to the ratio of the
boundary shear stress to the critical shear stress in the example results in safety factors of
3.19 and 2.30 for the Clopper (1991) method and the NCMA (2006) method,
respectively. The value of the stability number was computed maintaining the
assumption that the lift and drag forces are equal and calculating the drag force using the
product of the shear stress and block surface area parallel to the flow direction. Using the
stability number assumption produces a 6% difference, which is non-conservative, for the
Clopper (1991) method and 5% difference, which is non-conservative, for the NCMA
(2006) method. Figure 3.5 illustrates the influence of this assumption for a range of
shear-stress values from 0.5 to 10.5 lbs/ft2.

83
0
2
4
6
8
10
12
14
0 2 4 6 8 10 12
Shear Stress (lbs/ft2)
Sa
fety
Fa
cto
r
-7%
-6%
-5%
-4%
-3%
-2%
-1%
0%
Pe
rce
nt
Diffe
ren
ce
Clopper (1991) NCMA (2006)
Clopper (1991) w/o Assumption NCMA (2006) w/o Assumption
Clopper (1991) % Difference NCMA (2006) % Difference
Figure 3.5: Comparison of Safety Factors without the Assumption of the
Relationship between Stability Number and Shear Stress
Assuming the critical shear stress is actually 10% less than the extrapolated value
for the example block, the safety factor would be 3.10 (8% difference) and 2.25 (7%
difference) for the Clopper (1991) and NCMA (2006) methods, respectively. Figure 3.6
illustrates the influence of this assumption for a range of shear-stress values from 0.5 to
10.5 lbs/ft2.

84
0
2
4
6
8
10
12
14
0 2 4 6 8 10 12
Shear Stress (lbs/ft2)
Sa
fety
Facto
r
-10%
-9%
-8%
-7%
-6%
-5%
-4%
-3%
-2%
-1%
0%
Perc
ent D
iffe
rence
Clopper (1991) NCMA (2006)
Clopper (1991) w/o Assumption NCMA (2006) w/o Assumption
Clopper (1991) % Difference NCMA (2006) % Difference
Figure 3.6: Safety Factor Comparison with 10% Non-conservative Critical Shear
Stress
Without trigonometric simplifications for the weight force distribution, the safety
factor values are 2.67 and 2.67 for the Clopper (1991) method and the NCMA (2006)
method, respectively. Therefore, using trigonometric simplifications for the example
results in a non-conservative 21% difference for the Clopper (1991) method and a
conservative 10% difference for the NCMA (2006) method. Figure 3.7 illustrates the
influence of this assumption for a range of bed slopes from 0.005 to 1.0 ft/ft.

85
0
2
4
6
8
10
12
14
0 0.2 0.4 0.6 0.8 1 1.2
Bedslope (ft/ft)
Sa
fety
Fa
cto
r
-40%
-30%
-20%
-10%
0%
10%
20%
30%
Pe
rcen
t D
iffe
ren
ce
Clopper (1991) NCMA (2006)
Clopper (1991) w/o Assumption NCMA (2006) w/o Assumption
Clopper (1991) % Difference NCMA (2006) % Difference
Figure 3.7: Safety Factor Comparison without Trigonometric Simplifications
When using a value of 48.3° for β, which is the angle to the block corner for the
example block, safety factor values were calculated to be 3.40 and 2.81 for the Clopper
(1991) method and NCMA (2006) method, respectively. Using the calculated value for
β produces a conservative 2% and 17% difference for the Clopper (1991) method and
the NCMA (2006) method, respectively. The degree of error associated with calculating
the angle β using the given formulas varies with hydraulics. Figure 3.8 displays a
comparison of the calculated safety factors for a range of shear stresses between 0.5 to
10.5 lbs/ft2 computed using a value of 48.3° for the angle β.

86
0
2
4
6
8
10
12
14
16
0 2 4 6 8 10 12
Shear Stress lbs/ft2
Safe
ty F
acto
r
0%
5%
10%
15%
20%
25%
30%
35%
40%
45%
Pe
rcen
t D
iffe
rence
Clopper (1991) NCMA (2006)
Clopper (1991) w/o Assumption NCMA (2006) w/o AssumptionClopper (1991) % Difference NCMA (2006) % Difference
Figure 3.8: Safety Factor Comparison with ββββ Equal to 48.3°
Using the block height for the moment arm corresponding to the drag force
should produce a more conservative prediction given the mechanics of the moment
stability analysis; however, using the two methods with a moment arm equal to the block
height produced safety factor values of 3.39 (0.6% difference) and 2.42 (0.0% difference)
for the Clopper (1991) method and the NCMA (2006) method, respectively. The
conservative prediction associated with using eight-tenths of the block height comes from
the mechanics of the combined formulas. While changing 3l has very little effect on the
stability number, η, it increases β thereby decreasing βcos and ultimately increasing the
safety factor. Although the assumption proved slightly conservative, it illustrates the
flawed mechanics of the combined formulas given the original form of the safety factor

87
equation (Equation 2.38). Figure 3.9 provides a comparison of the safety factor values
computed using the block height for l3.
0
2
4
6
8
10
12
14
0 2 4 6 8 10 12
Shear Stress lbs/ft2
Sa
fety
Facto
r
0.00%
0.10%
0.20%
0.30%
0.40%
0.50%
0.60%
0.70%
0.80%
0.90%
1.00%
Perc
ent
Diffe
ren
ce
Clopper (1991) NCMA (2006)Clopper (1991) w/o Assumption NCMA (2006) w/o Assumption
Clopper (1991) % Difference NCMA (2006) % Difference
Figure 3.9: Safety Factor Comparison Using the Block Height for llll3
Calculating a safety factor for the example assuming a lift coefficient of 0.045,
results in a value of 2.06 (-39% difference) for the Clopper (1991) method and a value of
1.58 (-35% difference) for the NCMA (2006) method. A comparison of the safety factors
computed without the assumption of equal lift and drag forces for a constant shear-stress
value and a range of velocities of 2.98 to 23.70 ft/s is given by Figure 3.10. Furthermore,
Figure 3.11 presents the relationship between the lift and drag forces for a range of flow
velocities from 3 to 24 ft/s for the example. The theoretical analysis indicates that
assuming the lift and drag forces are equal is a reasonable assumption for cases with
velocities less than approximately 10 ft/s.

88
0
1
2
3
4
5
6
7
8
9
0 5 10 15 20 25
Velocity (ft/s)
Safe
ty F
acto
r
-150%
-100%
-50%
0%
50%
100%
150%
200%
Perc
ent D
iffe
rence
Clopper (1991) NCMA (2006)
Clopper (1991) w/o Assumption NCMA (2006) w/o Assumption
Clopper (1991) % Difference NCMA (2006) % Difference
Figure 3.10: Safety Factor Comparison without the Assumption of Equal Lift and
Drag Forces (lift coefficient equal to 0.045)
0
5
10
15
20
25
30
35
40
0 5 10 15 20 25
Velocity (ft/s)
Fo
rce
(lb
s)
-40%
-20%
0%
20%
40%
60%
80%
100%
120%
140%
160%
Pe
rce
nt
Diffe
ren
ce
Lift Force Drag Force % Diff
Figure 3.11: Lift Force and Drag Force Relationship to Velocity

89
The relative influence on computed safety factors for each assumption has been
investigated. Table 3.1 provides a summary of the results from the comparisons to the
example scenario. The assumption of equal lift and drag forces has been identified as the
most influential for this high-velocity, steep-slope bed example. Furthermore, this
assumption is non-conservative, which can have drastic consequences if misapplied.
Other unsuitable assumptions include the trigonometric simplifications and the
computation of the angle β .
Table 3.1: Summary of the Sensitivity of Assumptions with Respect to the Example
Comparison with Examplea
Clopper (1991) NCMA (2006)
Description Safety Factor
Percent Difference
Safety Factor
Percent Difference
Original Methods 3.37 - 2.42 -
Assuming the lift coefficient is 0.045 2.06 -38.9% 1.58 -34.7%
Without trigonometric simplifications 2.67 -20.8% 2.67 10.3%
Assuming critical shear stress is 10% less than the extrapolated value
3.10 -8.0% 2.25 -7.0%
Using a value of 48.3° for β 3.44 2.1% 2.84 17.4%
Without assumption of relationship between stability number and shear stress
3.19 -5.3% 2.30 -5.0%
Using the block height for the moment arm corresponding to the drag force
3.39 0.6% 2.42 0.0%
a Shear stress of 5.26 lbs/ft
2, side slope of 3 ft/ft, and bed slope of 0.50 ft/ft
3.3 SUMMARY
From the literature review, two primary safety factor methods were identified:
Stevens and Simons (1971) and Julien (1998). Within both derivations, the moment
stability analysis was used in conjunction with the stability number for hydrodynamic

90
forces. The original application for both methods was to produce safety factors for
cohesionless particles, which exhibit a quasi-spherical shape, on a channel side slope.
The Stevens and Simons (1971) and Julien (1998) safety factor methods have
been adapted and modified to generate design procedures applicable to engineered armor
units (Clopper, 1991; HCFCD, 2001; NCMA, 2006). As detailed in Section 3.1,
additional assumptions and simplifications were incorporated which add uncertainty to
the level of accuracy and conservatism for the block safety factor design method. For
example, Clopper (1991) presents an extrapolation of the safety factor method developed
by Stevens and Simons (1971) for mild-slope, low-velocity hydraulic conditions to the
high-velocity, steep-slope conditions associated with dam overtopping environments. In
addition, NCMA (2006) endorses a particle stability analysis method developed for
subcritical flow regimes (Julien, 1998; Julien and Anthony, 2002) for channels designed
to convey supercritical flow.
Through the investigation of assumptions presented in Section 3.2, the most
unsuitable assumption for the high-velocity, steep-slope example was identified as the
assumption of equal lift and drag forces. Trigonometric simplifications and the
computation of the angle β were also identified as inapt assumptions affecting the
computed safety factor for the example by as much as 20.8% and 17.4%, respectively.
Based on the theoretical investigation of assumptions used in the Clopper (1991) and
NCMA (2006) safety factor method derivation, the need to evaluate the Clopper (1991)
and NCMA (2006) safety factor method using full-scale data was identified.

91
4.1 INTRODUCTION
Datasets from ACB testing were necessary to evaluate the ability of the Clopper
(1991) and NCMA (2006) safety factor design methods to predict stable and unstable
conditions. Three datasets were developed from testing of three ACB systems: 1) 30S, 2)
Petraflex-Vick (hereafter referred to as Petraflex), and 3) the Corps Block. In addition to
the 30S and Petraflex data available in Clopper and Chen (1988), 30S, Petraflex, and
Corps Block data were available from testing previously conducted at CSU (Abt et al.,
2001; Robeson et al., 2002). Since the majority of overtopping tests were conducted on a
2H:1V embankment slope, two additional installations were tested on the 30S block at a
bed slope of 0.230 ft/ft and 0.431 ft/ft to develop a more comprehensive dataset. All
hydraulic testing performed at CSU was conducted in accordance to ASTM D7277
(2008).
4.2 30S DATASET
The 30S dataset included testing reported in Clopper and Chen (1988), testing
reported in Robeson et al. (2002), and two supplemental tests conducted at the CSU
Hydraulics Laboratory in the summer of 2009. 30S block properties are provided in
4 ACB TESTING DATABASE

92
Appendix B and Figure 4.1 presents a photograph of the 30S block installed in an
overtopping test channel.
Figure 4.1: Photograph of Installed 30S Blocks

93
Testing of the 30S system was conducted for the FHWA in 1987 and reported in
Clopper and Chen (1988). The 30S system was installed with cables on a 13-ft long soil
embankment with a slope of 0.442 ft/ft. Clopper and Chen (1988) tested the 30S system
at 1-ft, 2-ft, and 4-ft overtopping depths. Table 4.1 presents the hydraulic results from
the 30S overtopping testing reported in Clopper and Chen (1988). Additionally,
Appendix A provides the available water-surface elevation, bed-elevation, and flow-
velocity data for the Clopper and Chen (1988) 30S tests. As reported in Clopper and
Chen (1988), system instability was observed during the 4-ft overtopping test. Based on
the results of the Clopper and Chen (1988) analysis, a limiting shear-stress value of 15
lbs/ft2 was reported for the 30S system on the tested embankment. No limiting value for
velocity was reported in Clopper and Chen (1988).
Table 4.1: Hydraulic Results for 30S FHWA Testing Reported in Clopper and
Chen (1988)
Test ID No.
Block Name
Over- topping Depth
(ft)
Test Date
S0
(ft/ft) Q
(cfs) V
a (ft/s)
τ0 a
(lbs/ft2)
Manning's n
a
System Condition
1 30S 1.0 9/1/1987 0.442 13.8 12.9 7.0 0.044 Stable
2 30S 2.0 9/9/1987 0.442 34.0 15.1 12.0 0.073 Stable
3 30S 4.0 9/11/1987 0.442 90.5 16.2 36.0 0.064 Unstable
a Maximum values reported in Clopper and Chen (1988)
Testing was performed in 2000 by CSU on one installation of the 30S system on a
20-ft long, 2H:1V soil embankment (Robeson et al., 2002). One test at a 1-ft overtopping
depth was conducted for the CSU 30S installation. Table 4.2 provides testing
information pertaining to the 2000 CSU 30S test. Additionally, Appendix C provides the
flow-depth, bed-elevation, and flow-velocity data for the Robeson et al. (2002) 30S test.
Shear stress and velocity values were not reported by Robeson et al. (2002) and therefore

94
are not presented in Table 4.2. System instability was observed during the 1-ft
overtopping test. 30S blocks were physically removed from the test section during the 1-
ft overtopping test.
Table 4.2: Robeson et al. (2002) 30S Testing
Test ID No.
Block Name
Overtopping Depth
(ft)
Test Date
S0
(ft/ft) Q
(cfs) Notes
System Condition
4 30S 1.0 8/11/2000 0.499 10.0 Cabled Unstable
Two supplemental 30S installations were tested at the CSU Hydraulics
Laboratory in 2009 to provide 30S overtopping performance data for a wider range of
embankment slopes. Testing was conducted in two flumes, a 40-ft long, 6-ft wide flume
which was reconfigured to a 4-ft wide rectangular channel and a 30-ft long, 4-ft wide
rectangular flume. Table 4.3 provides testing information pertaining to the 2009 CSU 30S
tests. Additionally, Appendix C provides the flow-depth, bed-elevation, and flow-
velocity data for the 2009 CSU 30S tests.
Table 4.3: 2009 CSU 30S Testing
Test ID No.
Block Name
Overtopping Depth
(ft)
Test Date
S0
(ft/ft) Q
(cfs) Notes
System Condition
5 30S 1.0 6/14/2009 0.230 10.0 Not Cabled Stable
6 30S 1.6 6/15/2009 0.230 20.0 Not Cabled Stable
7 30S 2.0 6/15/2009 0.230 30.0 Not Cabled Unstable
8 30S 0.9 6/25/2009 0.431 8.0 Not Cabled Stable
9 30S 1.2 6/25/2009 0.431 12.0 Not Cabled Unstable
For the 40-ft long channel, 30S blocks were installed on a soil embankment with a
slope of 0.230 ft/ft. Testing was conducted at 1.0-ft, 1.6-ft, and 2.0-ft overtopping
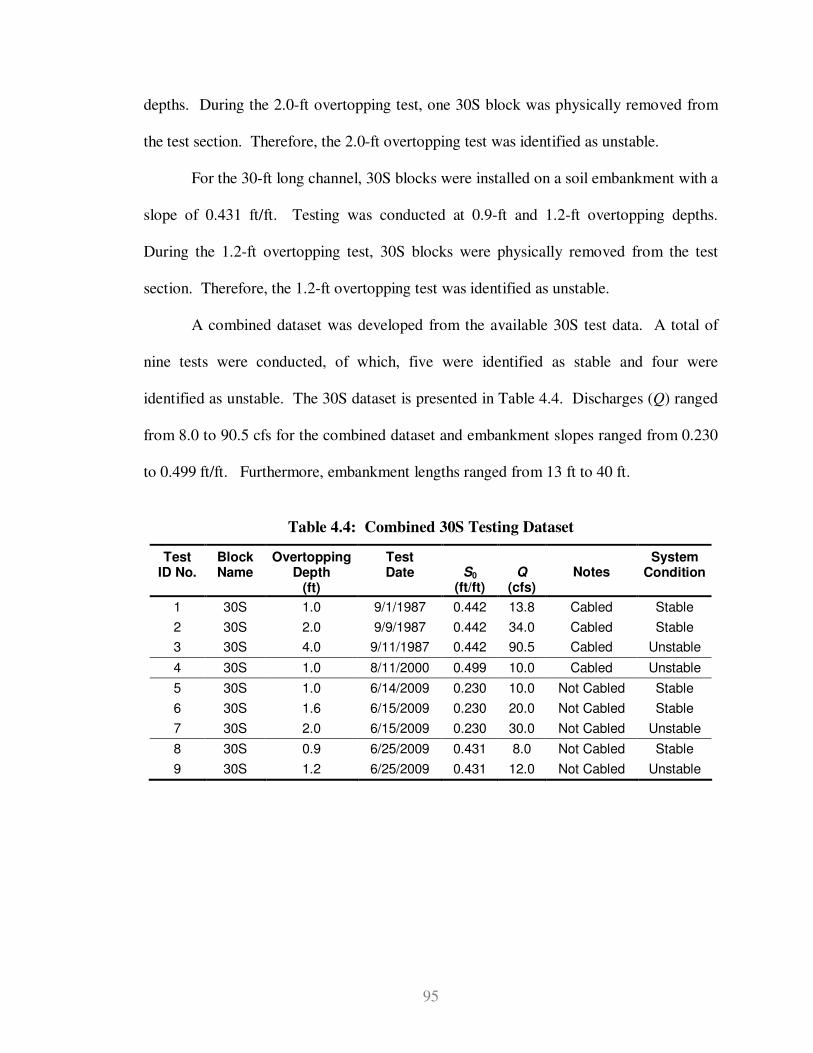
95
depths. During the 2.0-ft overtopping test, one 30S block was physically removed from
the test section. Therefore, the 2.0-ft overtopping test was identified as unstable.
For the 30-ft long channel, 30S blocks were installed on a soil embankment with a
slope of 0.431 ft/ft. Testing was conducted at 0.9-ft and 1.2-ft overtopping depths.
During the 1.2-ft overtopping test, 30S blocks were physically removed from the test
section. Therefore, the 1.2-ft overtopping test was identified as unstable.
A combined dataset was developed from the available 30S test data. A total of
nine tests were conducted, of which, five were identified as stable and four were
identified as unstable. The 30S dataset is presented in Table 4.4. Discharges (Q) ranged
from 8.0 to 90.5 cfs for the combined dataset and embankment slopes ranged from 0.230
to 0.499 ft/ft. Furthermore, embankment lengths ranged from 13 ft to 40 ft.
Table 4.4: Combined 30S Testing Dataset
Test ID No.
Block Name
Overtopping Depth
(ft)
Test Date
S0
(ft/ft) Q
(cfs) Notes
System Condition
1 30S 1.0 9/1/1987 0.442 13.8 Cabled Stable
2 30S 2.0 9/9/1987 0.442 34.0 Cabled Stable
3 30S 4.0 9/11/1987 0.442 90.5 Cabled Unstable
4 30S 1.0 8/11/2000 0.499 10.0 Cabled Unstable
5 30S 1.0 6/14/2009 0.230 10.0 Not Cabled Stable
6 30S 1.6 6/15/2009 0.230 20.0 Not Cabled Stable
7 30S 2.0 6/15/2009 0.230 30.0 Not Cabled Unstable
8 30S 0.9 6/25/2009 0.431 8.0 Not Cabled Stable
9 30S 1.2 6/25/2009 0.431 12.0 Not Cabled Unstable

96
4.3 PETRAFLEX DATASET
The Petraflex dataset included testing reported in Clopper and Chen (1988) and
Robeson et al. (2002). Petraflex block properties are provided in Appendix B and Figure
4.2 presents a photograph of the Petraflex block installed in an overtopping test channel.
Figure 4.2: Photograph of Installed Petraflex Blocks

97
Testing of the Petraflex system was conducted for the FHWA in 1987 and
reported in Clopper and Chen (1988). Petraflex blocks were installed with cables on a
13-ft long soil embankment with a slope of 0.437 ft/ft. Clopper and Chen (1988) tested
the Petraflex system at 1.0-ft, 2.0-ft, and 4.0-ft overtopping depths. Table 4.5 presents
the hydraulic results from the Petraflex overtopping testing reported in Clopper and Chen
(1988). Additionally, Appendix A provides the available water-surface elevation, bed-
elevation, and flow-velocity data for the Clopper and Chen (1988) Petraflex tests.
System instability was not observed during the FHWA Petraflex testing. Based on the
results of the Clopper and Chen (1988) analysis, a limiting shear-stress of greater than 30
lbs/ft2 was reported for the Petraflex system on the tested embankment. No limiting
value for velocity was reported in Clopper and Chen (1988).
Table 4.5: Hydraulic Results for Petraflex FHWA Testing Reported in Clopper and
Chen (1988)
Test ID No.
Block Name
Over-topping Depth
(ft)
Test Date
S0
(ft/ft) Q
(cfs) V
a
(ft/s) τ0
a
(lbs/ft2)
Manning’s n
a
System Condition
10 Petraflex 1.0 n/a 0.437 13.5 10.0 10.0 0.053 Stable
11 Petraflex 2.0 n/a 0.437 34.0 14.7 12.0 0.068 Stable
12 Petraflex 4.0 9/22/1987 0.437 96.0 16.9 32.0 0.080 Stable
n/a = not available a Maximum values reported in Clopper and Chen (1988)
Overtopping testing was performed in 2000 by CSU on the Petraflex system
installed on a 20-ft long, 2H:1V soil embankment (Robeson et al., 2002). CSU tested the
Petraflex system at 1.0-ft and 2.0-ft overtopping depths in a 4-ft wide rectangular flume.
Table 4.6 provides testing information pertaining to the 2000 CSU Petraflex tests.
Additionally, Appendix C provides the water-surface elevation, bed-elevation, and flow-
velocity data for the Robeson et al. (2002) Petraflex tests. Shear stress and velocity

98
values were not reported by Robeson et al. (2002) and therefore are not presented in
Table 4.6. During the 2.0-ft overtopping test, gullies had formed under the Petraflex
blocks resulting in loss of intimate contact between the blocks and the subgrade.
Therefore, the 2.0-ft overtopping test was identified as unstable.
Table 4.6: Robeson et al. (2002) Petraflex Testing
Test ID No.
Block Name
Overtopping Depth
(ft)
Test Date
S0
(ft/ft) Q
(cfs) Notes
System Condition
13 Petraflex 1.0 8/21/2000 0.501 10.0 Cabled Stable
14 Petraflex 2.0 8/21/2000 0.501 28.4 Cabled Unstable
A combined dataset was developed from the available Petraflex test data. A total
of five tests were conducted, of which, four were identified as stable and one was
identified as unstable. The Petraflex dataset is presented in Table 4.7. Discharges ranged
from 10.0 to 96.0 cfs for the combined dataset and embankment slopes ranged from
0.437 to 0.501 ft/ft. Furthermore, embankment lengths ranged from 13 ft to 20 ft.
Table 4.7: Combined Petraflex Testing Dataset
Test ID No.
Block Name
Overtopping Depth
(ft)
Test Date
S0
(ft/ft) Q
(cfs) Notes
System Condition
10 Petraflex 1.0 n/a 0.437 13.5 Cabled Stable
11 Petraflex 2.0 n/a 0.437 34.0 Cabled Stable
12 Petraflex 4.0 9/22/1987 0.437 96.0 Cabled Stable
13 Petraflex 1.0 8/21/2000 0.501 10.0 Cabled Stable
14 Petraflex 2.0 8/21/2000 0.501 28.4 Cabled Unstable
n/a = not available

99
4.4 CORPS BLOCK DATASET
Additional testing data were available from the USACE Corps Block testing
presented in Abt et al. (2001). Testing of the Corps Block included both overtopping and
channelized conditions. Corps Block properties are provided in Appendix B and Figure
4.3 presents a photograph of the Corps Block being installed in the overtopping test
channel. Overtopping tests were conducted in a 40-ft long, 4-ft wide flume that was
configured with a crest length of 20 ft and a sloped section of 20 ft. Channelized testing
was conducted in a half-trapezoidal channel with a bottom width of 1.2 ft and 2H:1V side
slopes.
Figure 4.3: Photograph of Corps Blocks Installation

100
Overtopping tests reported by Abt et al. (2001) included two embankment slopes:
5H:1V and 7H:1V. Table 4.8 presents the hydraulic results from the Corps Block
overtopping testing reported in Abt et al. (2001). Testing was conducted on the 5H:1V
installation at 1.0-ft and 2.0-ft overtopping depths. Abt et al. (2001) identified the 2.0-ft
overtopping test as a failure condition for the 5H:1V embankment slope. Testing was
conducted on the 7H:1V Corps Block installation at 1.0-ft, 1.2-ft and 2.0-ft overtopping
depths. Both the 1.2-ft and 2.0-ft overtopping tests were reported as failure conditions by
Abt et al. (2001) for the 7H:1V embankment slope.
Table 4.8: Corps Block Overtopping Testing Data
Test ID No.
Block Name
Over- topping Depth
(ft) S0
(ft/ft) Q
(cfs)
Flow Depth
(ft)
Flow Velocity
(ft/s)
Shear Stress (lbs/ft
2)
System Condition
15 Corps Block 1.0 0.200 11.0 0.28 13.6 3.46 Stable
16 Corps Block 2.0 0.200 28.5 0.49 17.3 4.92 Failure
17 Corps Block 1.0 0.143 9.75 0.25 12.8 2.07 Stable
18 Corps Block 2.0 0.143 25.0 0.65 16.5 4.79 Failure
19 Corps Block 1.2 0.143 13.0 n/a 14.5 n/a Failure
n/a = not available
Channelized tests reported in Abt et al. (2001) included six tests with
progressively increasing discharges. Table 4.9 presents the hydraulic results from the
Corps Block channelized testing reported in Abt et al. (2001). Abt et al. (2001) identified
the 112.0 cfs and 125.0 cfs tests as “failure transition” and “failure,” respectively. Test
ID 25 was not used within the dataset since flow depth and shear stress values were not
available and instability was identified at the conclusion of the previous test, Test ID 24.

101
Table 4.9: Corps Block Channelized Testing Data
Test ID No.
Block Name
S0
(ft/ft)
Side Slope (H/V)
Q (cfs)
Flow Depth
(ft)
Flow Velocity
(ft/s)
Shear Stress (lbs/ft
2)
System Condition
20 Corps Block 0.030 2.0 29.0 2.0 6.5 3.74 Stable
21 Corps Block 0.030 2.0 50.0 2.1 7.9 3.93 Stable
22 Corps Block 0.030 2.0 80.0 2.3 11.5 4.21 Stable
23 Corps Block 0.030 2.0 100.0 2.3 13.2 4.31 Stable Transition
24 Corps Block 0.030 2.0 112.0 2.5 14.0 4.68 Failure Transition
25 Corps Block 0.030 2.0 125.0 n/a 14.8 n/a Failure
4.5 SUMMARY
A database of twenty-four tests was developed from available testing data for the
purpose of evaluating the NCMA (2006) safety factor design method. Table 4.10
provides a summary of the entire ACB database. Three ACB systems were included in
the database: 1) 30S, 2) Petraflex, and 3) the Corps block. Both overtopping and channel
hydraulic conditions are represented in the database.

102
Table 4.10: Entire ACB Database
Test ID No.
Block Name
Test
Condition
Over-topping Depth
(ft) S0
(ft/ft)
Side
Slope (H/V)
Q (cfs)
System Condition
1 30S Overtopping 1.0 0.442 n/a 13.8 Stable
2 30S Overtopping 2.0 0.442 n/a 34.0 Stable
3 30S Overtopping 4.0 0.442 n/a 90.5 Unstable
4 30S Overtopping 1.0 0.499 n/a 10.0 Unstable
5 30S Overtopping 1.0 0.230 n/a 10.0 Stable
6 30S Overtopping 1.6 0.230 n/a 20.0 Stable
7 30S Overtopping 2.0 0.230 n/a 30.0 Unstable
8 30S Overtopping 0.9 0.431 n/a 8.0 Stable
9 30S Overtopping 1.2 0.431 n/a 12.0 Unstable
10 Petraflex Overtopping 1.0 0.437 n/a 13.5 Stable
11 Petraflex Overtopping 2.0 0.437 n/a 34.0 Stable
12 Petraflex Overtopping 4.0 0.437 n/a 96.0 Stable
13 Petraflex Overtopping 1.0 0.501 n/a 10.0 Stable
14 Petraflex Overtopping 2.0 0.501 n/a 28.4 Unstable
15 Corps Block Overtopping 1.0 0.200 n/a 11.0 Stable
16 Corps Block Overtopping 2.0 0.200 n/a 28.5 Unstable
17 Corps Block Overtopping 1.0 0.143 n/a 9.8 Stable
18 Corps Block Overtopping 2.0 0.143 n/a 25.0 Unstable
19 Corps Block Overtopping 1.2 0.143 n/a 13.0 Unstable
20 Corps Block Channel n/a 0.030 2.0 29.0 Stable
21 Corps Block Channel n/a 0.030 2.0 50.0 Stable
22 Corps Block Channel n/a 0.030 2.0 80.0 Stable
23 Corps Block Channel n/a 0.030 2.0 100.0 Stable
24 Corps Block Channel n/a 0.030 2.0 112.0 Unstable
n/a = not applicable
Nine total overtopping tests on four different installations composed the 30S
dataset. Discharges ranged from 8.0 to 90.5 cfs, embankment slopes ranged from 0.230
to 0.499 ft/ft, and embankment lengths ranged from 13 to 40 ft for the combined 30S
dataset.
The Petraflex dataset was composed of five total overtopping tests on two
different installations. Discharges ranged from 10.0 to 96.0 cfs, embankment slopes

103
ranged from 0.437 to 0.501 ft/ft, and embankment lengths ranged from 13 ft to 20 ft for
the combined Petraflex dataset.
The Corps Block dataset was composed of eleven total tests including five
overtopping tests and six channelized tests. Discharges ranged from 9.75 to 28.5 cfs,
embankment slopes ranged from 0.143 to 0.200 ft/ft, and a constant 20-ft embankment
length for the Corps Block overtopping dataset. The Corps Block channelized dataset
had discharges ranging from 29.0 to 125.0 cfs.

104
Data from the database detailed in Chapter 4 were analyzed using ASTM D7276
(2008), Guide for Analysis and Interpretation of Test Data for Articulating Concrete
Block (ACB) Revetment Systems in Open Channel Flow. Section 2.1.7 provided a review
of the ASTM D7276 (2008) standard guide and details the analysis methods for
computation of hydraulic parameters. Although flow-velocity and shear-stress values
were reported for the FHWA 30S and Petraflex tests in Clopper and Chen (1988), all
available data for FHWA 30S and Petraflex tests were reanalyzed according to the
ASTM D7276 (2008) standard to maintain a consistent analytical method for evaluating
the Clopper (1991) and NCMA (2006) safety factor equations. Water-surface elevation
and bed-elevation data were not provided in Abt et al. (2001). Abt et al. (2001) reported
hydraulic analysis was retained for the overtopping testing and the channelized testing
hydraulic analysis was slightly modified such that shear stress was computed using
hydraulic radius instead of flow depth. Using the hydraulic radius associated with the
roughened perimeter is a more accurate method for computing boundary shear stress.
Chapter 5 provides: 1) an example of shear-stress and flow-velocity calculations using
the ASTM D7276 (2008) method, 2) hydraulic results from the ASTM D7276 (2008)
analysis of the database, and 3) a hydraulic assessment and additional analysis of the Abt
et al. (2001) data.
5 HYDRAULIC ANALYSIS OF ACB TEST DATA

105
5.1 EXAMPLE ASTM D7276 (2008) HYDRAULIC ANALYSIS
An example of shear-stress and flow-velocity computations using ASTM D7276
with the Petraflex 1.0-ft overtopping test data on the 0.501 ft/ft embankment slope is
provided in this section. Bed elevations, water-surface elevations, channel geometry, and
discharge are required to conduct the forewater analysis used to determine the optimum
Manning’s n value representing the collected data. Table 5.1 presents the bed and water-
surface elevations collected during the 1.0-ft overtopping test. Following the steps
outlined in Figure 2.4, an optimum Manning’s n value of 0.020 was determined. Figure
5.1 provides a graphical comparison of the water-surface profile (WSP) generated by the
0.020 Manning’s n value and the collected water-surface data. A value of 0.875 was
computed for the coefficient of determination, R2, for the WSP fit to the collected flow-
depth data.
Table 5.1: Hydraulic Data for CSU Petraflex Test (Robeson et al., 2002) on 0.501
Bed Slope at 10.0 cfs (8-21-2000)
Station along Slope
(ft)
Horizontal Station
(ft)
Bed Elevation
(ft)
Flow Depth
(ft)
Vertical Depth
(ft)
Continuity Velocity
(ft/s)
20.85 17.80 101.50 0.28 0.32 6.05
22.86 19.51 100.64 0.23 0.27 7.30
25.04 21.38 99.67 0.16 0.19 10.41
27.05 23.09 98.82 0.16 0.19 10.27
29.23 24.95 97.89 0.17 0.20 9.76
31.24 26.67 97.03 0.16 0.19 10.41
33.42 28.53 96.11 0.17 0.20 9.64
35.43 30.25 95.28 0.15 0.18 11.00
37.61 32.11 94.35 0.15 0.18 10.85
39.62 33.83 93.47 0.17 0.19 10.10
41.80 35.69 92.47 0.15 0.18 10.85

106
0.00
0.05
0.10
0.15
0.20
0.25
0.30
0.35
15 20 25 30 35 40
Horizontal Station (ft)
Ve
rtic
al F
low
De
pth
(ft
)
Measured Data
Model Data n = 0.020
Figure 5.1: Comparison of Measured Flow Depths to Best-fit WSP
Local cross-sectional averaged flow velocities and shear stresses were computed
using the best-fit theoretical WSP and Equation 2.3 and Equation 2.9, respectively. Table
5.2 provides the best-fit theoretical WSP data and corresponding computed local shear
stresses and flow velocities. A plot of shear stress and flow velocity versus horizontal
station is presented in Figure 5.2 and Figure 5.3 presents the hydraulic grade line and
energy grade line versus horizontal station along the embankment. Normal depth was not
achieved on the 20-ft long embankment. The maximum computed local shear stress and
flow velocity was 4.49 lbs/ft2 and 15.3 ft/s, respectively. For the purpose of quantifying
hydraulic conditions experienced by individual blocks, shear-stress and flow-velocity
values were averaged over a control volume length of one block located directly
upstream of the last restrained block. For the Petraflex example, the block length along

107
the flow direction was 1.32 ft and thus the length of the control volume was 1.32 ft.
Control volume averaged shear-stress and flow-velocity values for the Petraflex 1.0-ft
overtopping test were 4.43 lbs/ft2 and 15.2 ft/s, respectively.
Table 5.2: Water-surface Profile Data and Computed Hydraulics for Optimal
Manning’s n (0.020)
Hori- zontal Station
(ft)
Bed
Elevation (ft)
HGL (ft)
Vertical Flow
Depth (ft)
Flow
Depth (ft)
Flow
Velocity (ft/s)
EGL (ft)
Local EGL
Slope (ft/ft)
Shear- stress
Momentum (lbs/ft
2)
17.80 101.48 101.81 0.32 0.29 8.67 102.91 n/a n/a
17.90 101.43 101.75 0.32 0.28 8.85 102.90 n/a n/a
18.00 101.38 101.69 0.31 0.28 9.01 102.90 0.08 1.28
18.10 101.33 101.64 0.30 0.27 9.18 102.89 0.09 1.33
18.20 101.28 101.58 0.30 0.27 9.33 102.88 0.09 1.39
18.30 101.23 101.53 0.29 0.26 9.48 102.87 0.10 1.44
18.40 101.18 101.47 0.29 0.26 9.63 102.86 0.10 1.50
18.50 101.13 101.42 0.29 0.26 9.77 102.85 0.11 1.55
18.60 101.08 101.37 0.28 0.25 9.91 102.84 0.11 1.60
18.70 101.03 101.31 0.28 0.25 10.04 102.82 0.12 1.66
18.80 100.98 101.26 0.27 0.25 10.17 102.81 0.12 1.71
18.90 100.93 101.21 0.27 0.24 10.29 102.80 0.13 1.76
19.00 100.88 101.15 0.27 0.24 10.42 102.78 0.13 1.81
19.10 100.83 101.10 0.27 0.24 10.54 102.77 0.14 1.86
19.20 100.78 101.05 0.26 0.23 10.65 102.76 0.14 1.90
19.30 100.73 100.99 0.26 0.23 10.76 102.74 0.15 1.95
19.40 100.68 100.94 0.26 0.23 10.87 102.73 0.16 2.00
19.50 100.63 100.89 0.25 0.23 10.98 102.71 0.16 2.05
19.60 100.58 100.84 0.25 0.23 11.08 102.69 0.17 2.09
19.70 100.53 100.78 0.25 0.22 11.18 102.68 0.17 2.14
19.80 100.48 100.73 0.25 0.22 11.28 102.66 0.18 2.18
19.90 100.43 100.68 0.25 0.22 11.38 102.64 0.18 2.23
20.00 100.38 100.63 0.24 0.22 11.47 102.62 0.19 2.27
20.10 100.33 100.57 0.24 0.22 11.56 102.60 0.19 2.31
20.20 100.28 100.52 0.24 0.21 11.65 102.58 0.20 2.36
20.30 100.23 100.47 0.24 0.21 11.73 102.56 0.20 2.40
20.40 100.18 100.42 0.24 0.21 11.82 102.54 0.21 2.44
20.50 100.13 100.37 0.23 0.21 11.90 102.52 0.21 2.48
20.60 100.08 100.32 0.23 0.21 11.98 102.50 0.22 2.52
20.70 100.03 100.26 0.23 0.21 12.06 102.48 0.22 2.56
20.80 99.98 100.21 0.23 0.21 12.14 102.46 0.23 2.60
20.90 99.93 100.16 0.23 0.20 12.21 102.43 0.23 2.64
21.00 99.88 100.11 0.23 0.20 12.28 102.41 0.23 2.67
21.10 99.83 100.06 0.23 0.20 12.35 102.38 0.24 2.71
21.20 99.78 100.01 0.23 0.20 12.42 102.36 0.24 2.75
21.30 99.73 99.96 0.22 0.20 12.49 102.34 0.25 2.78

108
Hori- zontal Station
(ft)
Bed
Elevation (ft)
HGL (ft)
Vertical Flow
Depth (ft)
Flow
Depth (ft)
Flow
Velocity (ft/s)
EGL (ft)
Local EGL
Slope (ft/ft)
Shear- stress
Momentum (lbs/ft
2)
21.40 99.68 99.90 0.22 0.20 12.56 102.31 0.25 2.82
21.50 99.63 99.85 0.22 0.20 12.62 102.28 0.26 2.85
21.60 99.58 99.80 0.22 0.20 12.69 102.26 0.26 2.88
21.70 99.53 99.75 0.22 0.20 12.75 102.23 0.27 2.92
21.80 99.48 99.70 0.22 0.20 12.81 102.20 0.27 2.95
21.90 99.43 99.65 0.22 0.19 12.87 102.18 0.27 2.98
22.00 99.38 99.60 0.22 0.19 12.92 102.15 0.28 3.01
22.10 99.33 99.55 0.22 0.19 12.98 102.12 0.28 3.05
22.20 99.28 99.49 0.21 0.19 13.03 102.09 0.29 3.08
22.30 99.23 99.44 0.21 0.19 13.09 102.06 0.29 3.11
22.40 99.18 99.39 0.21 0.19 13.14 102.03 0.29 3.14
22.50 99.13 99.34 0.21 0.19 13.19 102.00 0.30 3.16
22.60 99.08 99.29 0.21 0.19 13.24 101.97 0.30 3.19
22.70 99.03 99.24 0.21 0.19 13.29 101.94 0.31 3.22
22.80 98.98 99.19 0.21 0.19 13.34 101.91 0.31 3.25
22.90 98.93 99.14 0.21 0.19 13.38 101.88 0.31 3.27
23.00 98.88 99.09 0.21 0.19 13.43 101.85 0.32 3.30
23.10 98.83 99.04 0.21 0.19 13.47 101.82 0.32 3.33
23.20 98.78 98.99 0.21 0.18 13.52 101.78 0.32 3.35
23.30 98.73 98.94 0.21 0.18 13.56 101.75 0.33 3.38
23.40 98.68 98.88 0.21 0.18 13.60 101.72 0.33 3.40
23.50 98.63 98.83 0.20 0.18 13.64 101.68 0.33 3.43
23.60 98.58 98.78 0.20 0.18 13.68 101.65 0.34 3.45
23.70 98.53 98.73 0.20 0.18 13.72 101.62 0.34 3.47
23.80 98.48 98.68 0.20 0.18 13.76 101.58 0.34 3.49
23.90 98.43 98.63 0.20 0.18 13.79 101.55 0.35 3.52
24.00 98.38 98.58 0.20 0.18 13.83 101.51 0.35 3.54
24.10 98.33 98.53 0.20 0.18 13.87 101.48 0.35 3.56
24.20 98.28 98.48 0.20 0.18 13.90 101.44 0.36 3.58
24.30 98.23 98.43 0.20 0.18 13.93 101.41 0.36 3.60
24.40 98.18 98.38 0.20 0.18 13.97 101.37 0.36 3.62
24.50 98.13 98.33 0.20 0.18 14.00 101.33 0.37 3.64
24.60 98.08 98.28 0.20 0.18 14.03 101.30 0.37 3.66
24.70 98.03 98.23 0.20 0.18 14.06 101.26 0.37 3.68
24.80 97.98 98.18 0.20 0.18 14.09 101.22 0.37 3.70
24.90 97.93 98.13 0.20 0.18 14.12 101.18 0.38 3.72
25.00 97.88 98.07 0.20 0.18 14.15 101.15 0.38 3.73
25.10 97.83 98.02 0.20 0.18 14.18 101.11 0.38 3.75
25.20 97.78 97.97 0.20 0.18 14.20 101.07 0.38 3.77
25.30 97.73 97.92 0.20 0.18 14.23 101.03 0.39 3.79
25.40 97.68 97.87 0.20 0.18 14.26 100.99 0.39 3.80
25.50 97.63 97.82 0.20 0.18 14.28 100.95 0.39 3.82
25.60 97.58 97.77 0.20 0.17 14.31 100.91 0.39 3.83
25.70 97.53 97.72 0.20 0.17 14.33 100.87 0.40 3.85
25.80 97.48 97.67 0.19 0.17 14.36 100.84 0.40 3.86
25.90 97.43 97.62 0.19 0.17 14.38 100.80 0.40 3.88

109
Hori- zontal Station
(ft)
Bed
Elevation (ft)
HGL (ft)
Vertical Flow
Depth (ft)
Flow
Depth (ft)
Flow
Velocity (ft/s)
EGL (ft)
Local EGL
Slope (ft/ft)
Shear- stress
Momentum (lbs/ft
2)
26.00 97.38 97.57 0.19 0.17 14.40 100.76 0.40 3.89
26.10 97.33 97.52 0.19 0.17 14.42 100.71 0.40 3.91
26.20 97.28 97.47 0.19 0.17 14.45 100.67 0.41 3.92
26.30 97.23 97.42 0.19 0.17 14.47 100.63 0.41 3.94
26.40 97.18 97.37 0.19 0.17 14.49 100.59 0.41 3.95
26.50 97.13 97.32 0.19 0.17 14.51 100.55 0.41 3.96
26.60 97.08 97.27 0.19 0.17 14.53 100.51 0.41 3.97
26.70 97.03 97.22 0.19 0.17 14.55 100.47 0.42 3.99
26.80 96.98 97.17 0.19 0.17 14.57 100.43 0.42 4.00
26.90 96.93 97.12 0.19 0.17 14.58 100.38 0.42 4.01
27.00 96.88 97.07 0.19 0.17 14.60 100.34 0.42 4.02
27.10 96.83 97.02 0.19 0.17 14.62 100.30 0.42 4.03
27.20 96.77 96.97 0.19 0.17 14.64 100.26 0.42 4.05
27.30 96.72 96.92 0.19 0.17 14.65 100.21 0.43 4.06
27.40 96.67 96.86 0.19 0.17 14.67 100.17 0.43 4.07
27.50 96.62 96.81 0.19 0.17 14.69 100.13 0.43 4.08
27.60 96.57 96.76 0.19 0.17 14.70 100.09 0.43 4.09
27.70 96.52 96.71 0.19 0.17 14.72 100.04 0.43 4.10
27.80 96.47 96.66 0.19 0.17 14.73 100.00 0.43 4.11
27.90 96.42 96.61 0.19 0.17 14.75 99.96 0.44 4.12
28.00 96.37 96.56 0.19 0.17 14.76 99.91 0.44 4.13
28.10 96.32 96.51 0.19 0.17 14.78 99.87 0.44 4.14
28.20 96.27 96.46 0.19 0.17 14.79 99.82 0.44 4.15
28.30 96.22 96.41 0.19 0.17 14.80 99.78 0.44 4.16
28.40 96.17 96.36 0.19 0.17 14.82 99.73 0.44 4.16
28.50 96.12 96.31 0.19 0.17 14.83 99.69 0.44 4.17
28.60 96.07 96.26 0.19 0.17 14.84 99.65 0.44 4.18
28.70 96.02 96.21 0.19 0.17 14.85 99.60 0.45 4.19
28.80 95.97 96.16 0.19 0.17 14.87 99.56 0.45 4.20
28.90 95.92 96.11 0.19 0.17 14.88 99.51 0.45 4.20
29.00 95.87 96.06 0.19 0.17 14.89 99.47 0.45 4.21
29.10 95.82 96.01 0.19 0.17 14.90 99.42 0.45 4.22
29.20 95.77 95.96 0.19 0.17 14.91 99.38 0.45 4.23
29.30 95.72 95.91 0.19 0.17 14.92 99.33 0.45 4.23
29.40 95.67 95.86 0.19 0.17 14.93 99.28 0.45 4.24
29.50 95.62 95.81 0.19 0.17 14.94 99.24 0.45 4.25
29.60 95.57 95.76 0.19 0.17 14.95 99.19 0.46 4.25
29.70 95.52 95.71 0.19 0.17 14.96 99.15 0.46 4.26
29.80 95.47 95.66 0.19 0.17 14.97 99.10 0.46 4.27
29.90 95.42 95.61 0.19 0.17 14.98 99.06 0.46 4.27
30.00 95.37 95.56 0.19 0.17 14.99 99.01 0.46 4.28
30.10 95.32 95.51 0.19 0.17 15.00 98.97 0.46 4.29
30.20 95.27 95.46 0.19 0.17 15.01 98.92 0.46 4.29
30.30 95.22 95.40 0.19 0.17 15.02 98.87 0.46 4.30
30.40 95.17 95.35 0.19 0.17 15.02 98.83 0.46 4.30
30.51 95.12 95.30 0.19 0.17 15.03 98.78 0.46 4.31

110
Hori- zontal Station
(ft)
Bed
Elevation (ft)
HGL (ft)
Vertical Flow
Depth (ft)
Flow
Depth (ft)
Flow
Velocity (ft/s)
EGL (ft)
Local EGL
Slope (ft/ft)
Shear- stress
Momentum (lbs/ft
2)
30.61 95.07 95.25 0.19 0.17 15.04 98.73 0.47 4.31
30.71 95.02 95.20 0.19 0.17 15.05 98.69 0.47 4.32
30.81 94.97 95.15 0.19 0.17 15.06 98.64 0.47 4.32
30.91 94.92 95.10 0.19 0.17 15.06 98.59 0.47 4.33
31.01 94.87 95.05 0.19 0.17 15.07 98.54 0.47 4.33
31.11 94.82 95.00 0.19 0.17 15.08 98.50 0.47 4.34
31.21 94.77 94.95 0.19 0.17 15.08 98.45 0.47 4.34
31.31 94.72 94.90 0.19 0.17 15.09 98.40 0.47 4.35
31.40 94.67 94.85 0.19 0.17 15.10 98.36 0.47 4.35
31.50 94.62 94.80 0.19 0.17 15.10 98.31 0.47 4.36
31.60 94.57 94.75 0.19 0.17 15.11 98.26 0.47 4.36
31.71 94.52 94.70 0.18 0.17 15.12 98.22 0.47 4.37
31.81 94.47 94.65 0.18 0.17 15.12 98.17 0.47 4.37
31.91 94.42 94.60 0.18 0.17 15.13 98.12 0.47 4.37
32.01 94.37 94.55 0.18 0.17 15.13 98.07 0.47 4.38
32.11 94.32 94.50 0.18 0.17 15.14 98.03 0.48 4.38
32.21 94.27 94.45 0.18 0.17 15.14 97.98 0.48 4.38
32.31 94.22 94.40 0.18 0.17 15.15 97.93 0.48 4.39
32.41 94.17 94.35 0.18 0.16 15.15 97.88 0.48 4.39
32.51 94.12 94.30 0.18 0.16 15.16 97.83 0.48 4.40
32.61 94.06 94.25 0.18 0.16 15.16 97.79 0.48 4.40
32.71 94.01 94.20 0.18 0.16 15.17 97.74 0.48 4.40
32.81 93.97 94.15 0.18 0.16 15.17 97.69 0.48 4.41
32.90 93.92 94.10 0.18 0.16 15.18 97.64 0.48 4.41
33.00 93.87 94.05 0.18 0.16 15.18 97.60 0.48 4.41
33.10 93.82 94.00 0.18 0.16 15.19 97.55 0.48 4.41
33.20 93.77 93.95 0.18 0.16 15.19 97.50 0.48 4.42
33.30 93.72 93.90 0.18 0.16 15.20 97.45 0.48 4.42
33.40 93.67 93.85 0.18 0.16 15.20 97.40 0.48 4.42
33.51 93.61 93.80 0.18 0.16 15.20 97.35 0.48 4.43
33.61 93.56 93.75 0.18 0.16 15.21 97.31 0.48 4.43
33.71 93.51 93.70 0.18 0.16 15.21 97.26 0.48 4.43
33.81 93.46 93.65 0.18 0.16 15.22 97.21 0.48 4.43
33.91 93.41 93.60 0.18 0.16 15.22 97.16 0.48 4.44
34.00 93.36 93.55 0.18 0.16 15.22 97.11 0.48 4.44
34.10 93.31 93.50 0.18 0.16 15.23 97.07 0.48 4.44
34.20 93.27 93.45 0.18 0.16 15.23 97.02 0.49 4.44
34.30 93.21 93.40 0.18 0.16 15.23 96.97 0.49 4.45
34.40 93.16 93.35 0.18 0.16 15.24 96.92 0.49 4.45
34.51 93.11 93.30 0.18 0.16 15.24 96.87 0.49 4.45
34.61 93.06 93.25 0.18 0.16 15.24 96.82 0.49 4.45
34.71 93.01 93.20 0.18 0.16 15.25 96.77 0.49 4.45
34.80 92.96 93.15 0.18 0.16 15.25 96.72 0.49 4.46
34.90 92.91 93.10 0.18 0.16 15.25 96.68 0.49 4.46
35.00 92.86 93.05 0.18 0.16 15.25 96.63 0.49 4.46
35.10 92.81 93.00 0.18 0.16 15.26 96.58 0.49 4.46

111
Hori- zontal Station
(ft)
Bed
Elevation (ft)
HGL (ft)
Vertical Flow
Depth (ft)
Flow
Depth (ft)
Flow
Velocity (ft/s)
EGL (ft)
Local EGL
Slope (ft/ft)
Shear- stress
Momentum (lbs/ft
2)
35.20 92.76 92.95 0.18 0.16 15.26 96.53 0.49 4.46
35.30 92.72 92.90 0.18 0.16 15.26 96.48 0.49 4.47
35.40 92.67 92.85 0.18 0.16 15.27 96.43 0.49 4.47
35.50 92.62 92.80 0.18 0.16 15.27 96.39 0.49 4.47
35.59 92.57 92.75 0.18 0.16 15.27 96.34 0.49 4.47
35.69 92.52 92.70 0.18 0.16 15.27 96.29 0.49 4.47
35.80 92.47 92.65 0.18 0.16 15.28 96.24 0.49 4.47
35.90 92.42 92.60 0.18 0.16 15.28 96.19 0.49 4.48
36.00 92.37 92.55 0.18 0.16 15.28 96.14 0.49 4.48
36.10 92.32 92.50 0.18 0.16 15.28 96.09 0.49 4.48
36.20 92.27 92.45 0.18 0.16 15.28 96.04 0.49 4.48
36.30 92.22 92.40 0.18 0.16 15.29 95.99 0.49 4.48
36.39 92.17 92.35 0.18 0.16 15.29 95.95 0.49 4.48
36.49 92.12 92.30 0.18 0.16 15.29 95.90 0.49 4.49
36.59 92.07 92.25 0.18 0.16 15.29 95.85 0.49 4.49
36.70 92.02 92.20 0.18 0.16 15.29 95.80 0.49 4.49
HGL = hydraulic grade line; EGL = energy grade line; n/a = not available
0
2
4
6
8
10
12
14
16
18
15 20 25 30 35 40
Horizontal Station (ft)
Flo
w V
elo
city (
ft/s
)
0.0
0.5
1.0
1.5
2.0
2.5
3.0
3.5
4.0
4.5
5.0
Sh
ea
r S
tre
ss (
lbs/f
t2)
Flow Velocity
Shear Stress
Figure 5.2: Flow Velocity and Shear Stress versus Horizontal Station

112
90
92
94
96
98
100
102
104
15 20 25 30 35 40
Horizontal Station (ft)
Ele
va
tio
n (
ft)
Energy Grade Line
Hydraulic Grade Line
Bed Elevation
Figure 5.3: Energy Grade Line and Hydraulic Grade Line versus Horizontal
Station
5.2 ASTM D7276 (2008) HYDRAULIC ANALYSIS OF 30S AND
PETRAFLEX DATA
The ASTM D7276 (2008) standard guide for interpretation was used to compute
control volume averaged shear-stress and flow-velocity values from all available WSP
data. Table 5.3 and Table 5.4 provide the results of the ASTM D7276 hydraulic analysis
for the 30S and Petraflex, respectively. Figure 5.4 provides a graphical comparison of
the shear-stress values computed from the ASTM D7276 (2008) standard and the shear-
stress values reported in Clopper and Chen (1988). Additionally, Figure 5.5 provides a
plot of the percent difference between the ASTM D7276 computed shear stresses and the
reported shear-stress values in Clopper and Chen (1988) as a function of overtopping

113
depth. For the 1.0-ft and 2.0-ft overtopping FHWA 30S tests, the computed ASTM
D7276 shear-stress values were 1% greater and 14% less than the reported FHWA shear-
stress values, respectively. However, shear stresses computed for the 4.0-ft overtopping
FHWA 30S and Petraflex tests were an average of 72% less than the values reported by
Clopper and Chen (1988). Shear stresses and flow velocities for the FHWA Petraflex
1.0-ft and 2.0-ft overtopping tests were approximated by using the 0.029 Manning’s n
value computed from the 4.0-ft overtopping depth test with a theoretical 1.0-ft and 2.0-ft
overtopping depth flow profile. Shear-stress discrepancies at higher overtopping depths
illustrate the sensitivity of computed shear-stress values to the computation method,
embankment length, and associated draw-down toward normal depth. With
advancements in computing technology and the resulting capability to perform complex
forewater computations, the necessity to obtain a best-fit profile and compute shear stress
using the momentum equation is clear.

114
Table 5.3: ASTM D7276 (2008) Hydraulic Results for 30S Testing
Test ID No.
Block Name
Overtopping Depth
(ft)
Test Date
S0
(ft/ft) Q
(cfs)
Flow Depth a
(ft) V
a (ft/s)
τ0 a
(lbs/ft2)
Manning's n
System Condition
1 30S 1.0 9/1/1987 0.442 13.8 0.29 12.1 7.1 0.035 Stable
2 30S 2.0 9/9/1987 0.442 34.0 0.57 14.9 10.3 0.039 Stable
3 30S 4.0 9/11/1987 0.442 90.5 1.11 20.4 12.6 0.035 Unstable
4 30S 1.0 8/11/2000 0.499 10.0 0.14 17.6 2.5 0.013 Unstable
5 30S 1.0 6/14/2009 0.230 10.0 0.24 10.5 3.3 0.026 Stable
6 30S 1.6 6/15/2009 0.230 20.0 0.34 14.7 4.0 0.022 Stable
7 30S 2.0 6/15/2009 0.230 30.0 0.44 17.2 4.7 0.021 Unstable
8 30S 0.9 6/25/2009 0.431 8.0 0.15 13.7 3.6 0.020 Stable
9 30S 1.2 6/25/2009 0.431 12.0 0.20 15.0 4.9 0.022 Unstable a Values averaged over a control volume length of one block located directly upstream of the last restrained block
Table 5.4: ASTM D7276 (2008) Hydraulic Results for Petraflex Testing
Test ID No.
Block Name
Overtopping Depth
(ft)
Test Date
S0
(ft/ft) Q
(cfs)
Flow Depth a
(ft) V
a (ft/s)
τ0 a
(lbs/ft2)
Manning's n
System Condition
10 Petraflex 1.0 n/a 0.437 13.5 0.27 b 12.3 b 5.0 b 0.029 b Stable
11 Petraflex 2.0 n/a 0.437 34.0 0.55 b 15.3 b 6.2 b 0.029 b Stable
12 Petraflex 4.0 9/22/1987 0.437 96.0 1.26 19.0 7.0 0.029 Stable
13 Petraflex 1.0 8/21/2000 0.501 10.0 0.16 15.2 4.5 0.020 Stable
14 Petraflex 2.0 8/21/2000 0.501 28.4 0.40 17.8 10.2 0.031 Unstable
n/a = not available a Values averaged over a control volume length of one block located directly upstream of the last restrained block
b Values approximated using theoretical 1.0-ft and 2.0-ft overtopping depth flow profiles with the 4.0-ft overtopping depth Manning’s n value of 0.029

115
0
5
10
15
20
25
30
35
40
0 5 10 15 20 25 30 35 40
ττττ0 reported by Clopper and Chen (1988) (lbs/ft2)
ττ ττ 0 A
STM
D7
27
6 (
lbs/
ft2)
FHWA 1988 30S Data
FHWA 1988 Petraflex Data
1:1
Figure 5.4: Comparison of Shear Stresses Computed from ASTM D7276 (2008) to
Shear Stresses Reported in Clopper and Chen (1988)
-10%
0%
10%
20%
30%
40%
50%
60%
70%
80%
90%
0 1 2 3 4 5
Overtopping Flow Depth (ft)
Pe
rce
nt
Dif
fere
nce
( ττ ττ0
Clo
pp
er
an
d C
he
n (
19
88
) -
ττ ττ 0 A
ST
M D
72
76)/
ττ ττ 0 C
lop
pe
r a
nd
Ch
en
(1
98
8)
FHWA 1988 30S Data
FHWA 1988 Petraflex Data
Figure 5.5: Percent Difference between ASTM D7276 (2008) Shear Stresses and
Reported Values from Clopper and Chen (1988) versus Overtopping Flow Depth

116
5.3 HYDRAULIC ANALYSIS OF CORPS BLOCK DATA
Water-surface profile and bed-elevation data were not reported in Abt et al.
(2001). Therefore, conducting the ASTM D7276 (2008) analysis standard on the Corps
Block dataset was not possible. Abt et al. (2001) computed shear stress using Equation
5.1 for both the overtopping and channelized data analysis:
fdSγτ =0 Equation 5.1
where
0τ = shear stress (lbs/ft2);
γ = unit weight of water (62.4 lbs/ft3);
d = flow depth (ft); and
Sf = slope of the energy grade line (friction slope) (ft/ft).
Shear-stress and flow-velocity values for the overtopping tests reported in Abt et al.
(2001) were used in the assessment of the Clopper (1991) and NCMA (2006) safety
factor equation. For the 1.2-ft overtopping test, the block system failed prior to
acquisition of flow data and Abt et al. (2001) do not report flow-depth or shear-stress
values for the 1.2-ft overtopping test. To obtain a 1.2-ft overtopping shear-stress value
for the Clopper (1991) and NCMA (2006) safety factor assessment, a linear interpolation
of the shear-stress values reported for the 1.0-ft and 2.0-ft overtopping flow depths was
conducted based on discharge. The linear interpolation resulted in a shear-stress value of
2.65 lbs/ft2 for the 1.2-ft overtopping test.
Shear-stress values for the channelized testing were recomputed using Equation
5.2 from the reported Abt et al. (2001) data:

117
fRSγτ =0 Equation 5.2
where
0τ = shear stress (lbs/ft2);
γ = unit weight of water (62.4 lbs/ft3);
R = hydraulic radius (ft); and
Sf = slope of the energy grade line (friction slope) (ft/ft).
The hydraulic radius in Equation 5.2 was computed using Equation 5.3:
P
AR = Equation 5.3
where
R = hydraulic radius (ft);
A = cross-section flow area (ft2); and
P = wetted (roughened) perimeter (ft).
Since the ACB system roughness was considerably greater than the concrete flume wall
roughness, the length corresponding to the concrete flume wall was not included in the
wetted perimeter. Table 5.5 provides the final hydraulic analysis results for both the
overtopping and channelized Corps Block tests. The 125.0-cfs channelized test was
excluded from the data used in the Clopper (1991) and NCMA (2006) safety factor
assessment since flow-depth and shear-stress data were not available and the system was
previously identified as unstable at the 112.0-cfs test.

118
Table 5.5: Results of the Corps Block Hydraulic Analysis
Test ID No.
Test Condition
S0
(ft/ft)
Side Slope (H/V)
Q (cfs)
Flow Depth
(ft)
Flow Velocity
(ft/s)
Shear Stress (lbs/ft
2)
System Condition
15 Overtopping 0.200 n/a 11.0 0.28 13.6 3.5 Stable
16 Overtopping 0.200 n/a 28.5 0.49 17.3 4.9 Unstable
17 Overtopping 0.143 n/a 9.8 0.25 12.8 2.1 Stable
18 Overtopping 0.143 n/a 25.0 0.65 16.5 4.8 Unstable
19 Overtopping 0.143 n/a 13.0 - 14.5 2.7 a Unstable
20 Channel 0.030 2.0 29.0 2.0 6.5 2.2 Stable
21 Channel 0.030 2.0 50.0 2.1 7.9 2.3 Stable
22 Channel 0.030 2.0 80.0 2.3 11.5 2.5 Stable
23 Channel 0.030 2.0 100.0 2.3 13.2 2.5 Stable
24 Channel 0.030 2.0 112.0 2.5 14.0 2.6 Unstable
n/a = not applicable a Computed from linear interpolation, based on discharge, of 1.0-ft and 2.0-ft overtopping
data on 0.143 ft/ft embankment
5.4 SUMMARY
Hydraulic analysis was conducted on the database to provide shear-stress and
flow-velocity values for the assessment of the NCMA (2006) safety factor equation. An
example of the ASTM D7276 (2008) analysis was presented using data from the CSU
1.0-ft overtopping Petraflex test. Using the ASTM D7276 (2008) analysis standard,
flow-velocity and shear-stress values were computed for the 30S and Petraflex datasets.
Due to lack of water-surface profile data for the Corps Block testing, hydraulic values
reported by Abt et al. (2001) were retained for the overtopping testing. Shear-stress
values for the channelized tests were recomputed using hydraulic radius, instead of flow
depth, in the simplified shear-stress equation. A combined summary of the 30S,
Petraflex, and Corps Block hydraulic analysis results is provided in Table 5.6. The
hydraulic analysis results were used in the evaluation of the NCMA (2006) safety factor
method presented in Chapter 6.
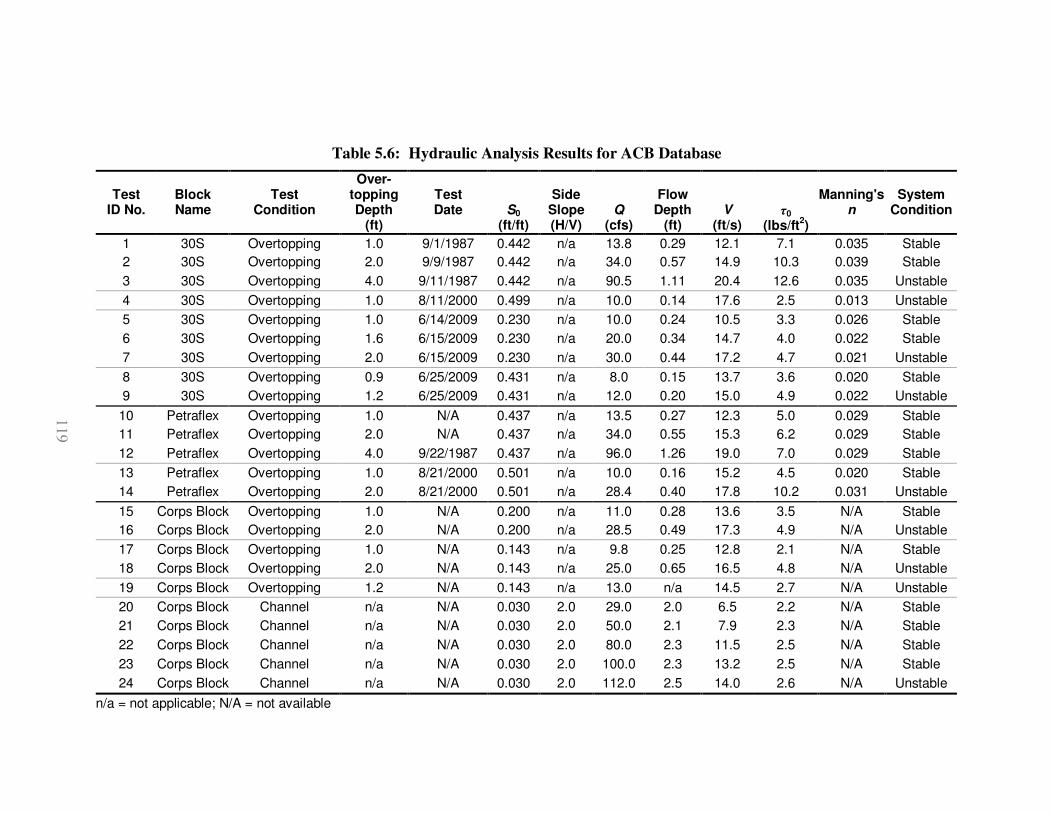
119
Table 5.6: Hydraulic Analysis Results for ACB Database
Test ID No.
Block Name
Test
Condition
Over-topping Depth
(ft)
Test Date
S0
(ft/ft)
Side
Slope (H/V)
Q (cfs)
Flow Depth
(ft) V
(ft/s) τ0
(lbs/ft2)
Manning's n
System Condition
1 30S Overtopping 1.0 9/1/1987 0.442 n/a 13.8 0.29 12.1 7.1 0.035 Stable
2 30S Overtopping 2.0 9/9/1987 0.442 n/a 34.0 0.57 14.9 10.3 0.039 Stable
3 30S Overtopping 4.0 9/11/1987 0.442 n/a 90.5 1.11 20.4 12.6 0.035 Unstable
4 30S Overtopping 1.0 8/11/2000 0.499 n/a 10.0 0.14 17.6 2.5 0.013 Unstable
5 30S Overtopping 1.0 6/14/2009 0.230 n/a 10.0 0.24 10.5 3.3 0.026 Stable
6 30S Overtopping 1.6 6/15/2009 0.230 n/a 20.0 0.34 14.7 4.0 0.022 Stable
7 30S Overtopping 2.0 6/15/2009 0.230 n/a 30.0 0.44 17.2 4.7 0.021 Unstable
8 30S Overtopping 0.9 6/25/2009 0.431 n/a 8.0 0.15 13.7 3.6 0.020 Stable
9 30S Overtopping 1.2 6/25/2009 0.431 n/a 12.0 0.20 15.0 4.9 0.022 Unstable
10 Petraflex Overtopping 1.0 N/A 0.437 n/a 13.5 0.27 12.3 5.0 0.029 Stable
11 Petraflex Overtopping 2.0 N/A 0.437 n/a 34.0 0.55 15.3 6.2 0.029 Stable
12 Petraflex Overtopping 4.0 9/22/1987 0.437 n/a 96.0 1.26 19.0 7.0 0.029 Stable
13 Petraflex Overtopping 1.0 8/21/2000 0.501 n/a 10.0 0.16 15.2 4.5 0.020 Stable
14 Petraflex Overtopping 2.0 8/21/2000 0.501 n/a 28.4 0.40 17.8 10.2 0.031 Unstable
15 Corps Block Overtopping 1.0 N/A 0.200 n/a 11.0 0.28 13.6 3.5 N/A Stable
16 Corps Block Overtopping 2.0 N/A 0.200 n/a 28.5 0.49 17.3 4.9 N/A Unstable
17 Corps Block Overtopping 1.0 N/A 0.143 n/a 9.8 0.25 12.8 2.1 N/A Stable
18 Corps Block Overtopping 2.0 N/A 0.143 n/a 25.0 0.65 16.5 4.8 N/A Unstable
19 Corps Block Overtopping 1.2 N/A 0.143 n/a 13.0 n/a 14.5 2.7 N/A Unstable
20 Corps Block Channel n/a N/A 0.030 2.0 29.0 2.0 6.5 2.2 N/A Stable
21 Corps Block Channel n/a N/A 0.030 2.0 50.0 2.1 7.9 2.3 N/A Stable
22 Corps Block Channel n/a N/A 0.030 2.0 80.0 2.3 11.5 2.5 N/A Stable
23 Corps Block Channel n/a N/A 0.030 2.0 100.0 2.3 13.2 2.5 N/A Stable
24 Corps Block Channel n/a N/A 0.030 2.0 112.0 2.5 14.0 2.6 N/A Unstable
n/a = not applicable; N/A = not available

120
NCMA (2006) provides a safety factor equation which represents the state-of-the-
practice for ACB system design. However, the Clopper (1991) safety factor design
method has been extensively employed for ACB system design as well. Previously,
limited data have been available for assessing the validity of the Clopper (1991) and
NCMA (2006) safety factor equations. Available datasets were exclusively for
overtopping tests and primarily had 2H:1V embankment slopes. Three ACB systems
were included in the developed database: 1) 30S, 2) Petraflex, and 3) the Corps Block.
Twenty-four tests encompassing both overtopping and channelized conditions composed
the database.
Clopper (1991) safety factors for channelized conditions were computed using
Equation 6.1:
( )
( ) '/cossin
cos/
12
12
ηβθ
θ
ll
ll
+=SF Equation 6.1
where
SF = factor of safety;
θ = side-slope angle;
'η = stability number defined by Equation 2.48;
6 EVALUATION OF CLOPPER (1991) AND NCMA (2006)
METHODS USING ACB TEST DATA

121
β = block rotation angle defined by Equation 2.59 (radians);
2l = block length measured from the block center to the block corner (ft); and
1l = one-half of the block height (ft).
Additionally, NCMA (2006) safety factors for channelized conditions were computed
using Equation 6.2:
( )
( ) 112
2
12
cos1
/
ηβθ
θ
ll
ll
+−=
a
aSF Equation 6.2
where
SF = factor of safety;
θa = weight force component defined by Equation 2.107;
1η = stability number defined by Equation 2.118;
β = block rotation angle defined by Equation 2.126 (radians);
2l = block length measured from the block center to the block corner (ft); and
1l = one-half of the block height (ft).
Since the database was developed from tests conducted in a controlled laboratory setting,
Equation 6.1 and Equation 6.2 exclude the additional lift and drag forces attributed to
protrusion on an individual block above adjacent blocks.
For overtopping conditions, the Clopper (1991) and NCMA (2006) safety factor
equations are identical. Equation 6.3 provides the Clopper (1991) and NCMA (2006)
safety factor equation for blocks on a channel bed:
( )
( )( )
( )( )c
SFττθ
θ
ηθ
θ
012
12
12
12
sin
cos/
sin
cos/
ll
ll
ll
ll
+=
+= Equation 6.3

122
where
SF = factor of safety;
θ = bed-slope angle = arctan(S0) (radians);
η = stability number for blocks on a channel bed;
0τ = boundary shear stress (lbs/ft2);
cτ = block critical shear stress on a horizontal plane (lbs/ft2);
2l = one-half of the block length along the flow direction (ft); and
1l = one-half of the block height (ft).
Consistent with the channelized testing, Equation 6.3 excludes the additional lift and drag
forces attributed to protrusion on an individual block above adjacent blocks.
Critical shear stress at horizontal values, τc, were computed for each stable test
directly preceding an unstable test. Equation 6.3 was set equal to a safety factor of 1 and
solved for τc to derive the expression for computing a critical shear-stress value at
horizontal as presented in Equation 6.4:
( )
( )
−=
θθττ
sincos/ 12
120
ll
ll
c Equation 6.4
where
cτ = block critical shear stress on a horizontal plane (lbs/ft2);
0τ = boundary shear stress on a sloped embankment (lbs/ft2);
2l = one-half of the block length along the flow direction (ft);
1l = one-half of the block height (ft); and
θ = bed-slope angle (radians).

123
6.1 30S CLOPPER (1991) AND NCMA (2006) SF ANALYSIS
Using Equation 6.3, the Clopper (1991) and NCMA (2006) safety factor equation
for overtopping conditions, safety factors were computed for each test presented in Table
5.3. Initially, critical shear-stress values at horizontal, τc, were computed using Equation
6.4 for each stable test preceding an unstable test. Table 6.1 provides the computed τc
30S values. Computed critical shear-stress values for the 30S on a horizontal plane
ranged from 4.5 to 13.5 lbs/ft2. According to Clopper (1991) and NCMA (2006), a
unique value of critical shear stress on a horizontal plane should exist.
Table 6.1: Computed Critical Shear-stress Values for the 30S on a Horizontal Plane
Test ID No.
Block Name
Overtopping Depth
(ft)
Test Date
S0
(ft/ft) Q
(cfs) V
(ft/s) τ0
(lbs/ft2)
NCMA τc
(lbs/ft2)
2 30S 2.0 9/9/1987 0.442 34.0 14.9 10.3 13.5
6 30S 1.6 6/15/2009 0.230 20.0 14.7 4.0 4.5
8 30S 0.9 6/25/2009 0.431 8.0 13.7 3.6 4.7
Safety factors were computed for the 30S data using each of the critical shear-
stress values presented in Table 6.1. Table 6.2 provides a summary of the computed
safety factor values. Plots of bed slope versus 30S computed safety factors for the 13.5,
4.5, and 4.7 lbs/ft2 τc values are presented in Figure 6.1, Figure 6.2, and Figure 6.3,
respectively. The following summarizes the ability of each critical shear-stress value to
predict system stability for the 30S dataset:

124
• τc = 13.5 lbs/ft2 correctly predicted the point of instability for 25% of the
tested installations:
o Computed safety factor values for stable tests ranged from 1.00 to 2.96
o Correctly predicted 100% of stable tests
o Computed safety factor values for unstable tests ranged from 0.85 to 2.59
o Correctly predicted 25% of unstable tests
• τc = 4.5 lbs/ft2 correctly predicted the point of instability for 25% of the tested
installations:
o Computed safety factor values for stable tests ranged from 0.38 to 1.19
o Correctly predicted 40% of stable tests
o Computed safety factor values for unstable tests ranged from 0.31 to 1.27
o Correctly predicted 75% of unstable tests
• τc = 4.7 lbs/ft2 correctly predicted the point of instability for 50% of the tested
installations:
o Computed safety factor values for stable tests ranged from 0.39 to 1.22
o Correctly predicted 60% of stable tests
o Computed safety factor values for unstable tests ranged from 0.32 to 1.30
o Correctly predicted 75% of unstable tests

125
Table 6.2: Computed 30S SF for Clopper (1991) and NCMA (2006) Method
Test ID No.
Block Name
Overtopping Depth
(ft) S0
(ft/ft) V
(ft/s) τ0
(lbs/ft2)
System Condition
SF (τc = 13.5 lbs/ft2)
SF (τc = 4.5 lbs/ft2)
SF (τc = 4.7 lbs/ft2)
1 30S 1.0 0.442 12.1 7.1 Stable 1.36 0.54 0.55
2 30S 2.0 0.442 14.9 10.3 Stable 1.00 0.38 0.39
3 30S 4.0 0.442 20.4 12.6 Unstable 0.85 0.31 0.32
4 30S 1.0 0.499 17.6 2.5 Unstable 2.59 1.27 1.30
5 30S 1.0 0.230 10.5 3.3 Stable 2.96 1.19 1.22
6 30S 1.6 0.230 14.7 4.0 Stable 2.55 1.00 1.03
7 30S 2.0 0.230 17.2 4.7 Unstable 2.25 0.87 0.89
8 30S 0.9 0.431 13.7 3.6 Stable 2.22 0.98 1.00
9 30S 1.2 0.431 15.0 4.9 Unstable 1.81 0.75 0.77
Orange cells identify tests used to calibrate τc values

126
0.0
0.5
1.0
1.5
2.0
2.5
3.0
3.5
0.0 0.1 0.2 0.3 0.4 0.5 0.6
Bed Slope (ft/ft)
SF
CSU Stable
CSU Unstable
FHWA 1988 Stable
ASTM D7276 Analysis
FHWA 1988 Unstable
ASTM D7276 Analysis
SF = 1
Figure 6.1: 30S SF Computed from Clopper (1991) and NCMA (2006) Method with
ττττc = 13.5 lbs/ft2 Calibrated from Clopper and Chen (1988) Data with ASTM D7276
(2008) Analysis
0.0
0.2
0.4
0.6
0.8
1.0
1.2
1.4
0.0 0.1 0.2 0.3 0.4 0.5 0.6
Bed Slope (ft/ft)
SF
CSU Stable
CSU Unstable
FHWA 1988 Stable
ASTM D7276 Analysis
FHWA 1988 Unstable
ASTM D7276 Analysis
SF = 1
Figure 6.2: 30S SF Computed from Clopper (1991) and NCMA (2006) Method with
ττττc = 4.5 lbs/ft2 Calibrated from CSU Data at 0.230 Embankment Slope

127
0.0
0.2
0.4
0.6
0.8
1.0
1.2
1.4
0.0 0.1 0.2 0.3 0.4 0.5 0.6
Bed Slope (ft/ft)
SF
CSU Stable
CSU Unstable
FHWA 1988 Stable
ASTM D7276 Analysis
FHWA 1988 Unstable
ASTM D7276 Analysis
SF = 1
Figure 6.3: 30S SF Computed from Clopper (1991) and NCMA (2006) Method with
ττττc = 4.7 lbs/ft2 Calibrated from CSU Data at 0.431 Embankment Slope
6.2 PETRAFLEX CLOPPER (1991) AND NCMA (2006) SF
ANALYSIS
Using Equation 6.3, the Clopper (1991) and NCMA (2006) safety factor equation
for overtopping conditions, safety factors were computed for each test presented in Table
5.4. Initially, critical shear-stress values at horizontal, τc, were computed using Equation
6.4 for each stable test preceding an unstable test. Table 6.3 provides the computed
Petraflex τc values. Computed critical shear-stress values for the Petraflex system on a
horizontal plane ranged from 5.7 to 8.6 lbs/ft2.
Table 6.3: Computed Critical Shear-stress Values for the Petraflex on a Horizontal
Plane
Test ID No.
Block Name
Overtopping Depth
(ft)
Test Date
S0
(ft/ft) Q
(cfs) V
(ft/s) τ0
(lbs/ft2)
NCMA τc
(lbs/ft2)
12 Petraflex 4.0 9/22/1987 0.437 96.0 19.0 7.0 8.6
13 Petraflex 1.0 8/21/2000 0.501 10.0 15.2 4.5 5.7

128
Safety factors were computed for the Petraflex data using both of the critical
shear-stress values. Table 6.4 provides a summary of the computed safety factor values.
Plots of bed slope versus computed safety factors for the 8.6 and 5.7 lbs/ft2 τc values are
presented in Figure 6.4 and Figure 6.5, respectively. The following summarizes the
ability of each critical shear-stress value to predict system stability for the Petraflex
dataset:
• τc = 8.6 lbs/ft2 correctly predicted the point of instability for 100% of the
tested installations:
o Computed safety factor values for stable tests ranged from 1.00 to 1.42
o The computed safety factor value for the unstable test was 0.69
• τc = 5.7 lbs/ft2 correctly predicted the point of instability for 50% of the tested
installations:
o Computed safety factor values for stable tests ranged from 0.69 to 1.00
o The computed safety factor value for the unstable test was 0.47
Table 6.4: Computed Petraflex SF for Clopper (1991) and NCMA (2006) Method
Test ID No.
Block Name
Over-topping Depth
(ft) S0
(ft/ft) V
(ft/s) τ0
(lbs/ft2)
System Condition
SF (τc = 8.6 lbs/ft
2)
SF (τc = 5.7 lbs/ft
2)
10 Petraflex 1.0 0.437 12.3 5.0 Stable 1.34 0.93
11 Petraflex 2.0 0.437 15.3 6.2 Stable 1.12 0.77
12 Petraflex 4.0 0.437 19.0 7.0 Stable 1.00 0.69
13 Petraflex 1.0 0.501 15.2 4.5 Stable 1.42 1.00
14 Petraflex 2.0 0.501 17.8 10.2 Unstable 0.69 0.47
Orange cells identify tests used to calibrate τc values

129
0.0
0.5
1.0
1.5
0.42 0.44 0.46 0.48 0.50 0.52
Bed Slope (ft/ft)
SF
CSU Stable
CSU Unstable
FHWA 1988 StableASTM D7276 Analysis
SF = 1
Figure 6.4: Petraflex SF Computed from Clopper (1991) and NCMA (2006) Method with τc = 8.6 lbs/ft2 Calibrated from Clopper and Chen (1988) Data and
ASTM D7276 (2008) Analysis
0.0
0.2
0.4
0.6
0.8
1.0
1.2
0.42 0.44 0.46 0.48 0.50 0.52Bed Slope (ft/ft)
SF
CSU Stable
CSU Unstable
FHWA 1988 StableASTM D7276 Analysis
SF = 1
Figure 6.5: Petraflex SF Computed from Clopper (1991) and NCMA (2006) Method with τc = 5.7 lbs/ft2 Calibrated from CSU Petraflex Data

130
6.3 CORPS BLOCK CLOPPER (1991) AND NCMA (2006) SF
ANALYSIS
Safety factors were computed for the tests presented in Table 5.5 using the
Clopper (1991) safety factor equation for channel conditions, Equation 6.1; the NCMA
(2006) safety factor equation for channel conditions, Equation 6.2; and the Clopper
(1991) and NCMA (2006) safety factor equation for overtopping conditions, Equation
6.3. Initially, critical shear-stress values at horizontal, τc, were computed for each stable
test preceding an unstable test. Table 6.5 provides the computed Corps Block τc values.
Computed critical shear-stress values for the Corps Block system on a horizontal plane
ranged from 2.2 to 3.7 lbs/ft2.
Table 6.5: Computed Critical Shear-stress Values for the Corps Block on a
Horizontal Plane
Test ID No.
Block Name
Over- topping Depth
(ft) S0
(ft/ft)
Side Slope (H/V)
Q (cfs)
V (ft/s)
τ0 (lbs/ft2)
NCMA τc
(lbs/ft2)
15 Corps Block 1.0 0.200 n/a 11.0 13.6 3.5 3.7
17 Corps Block 1.0 0.143 n/a 9.8 12.8 2.1 2.2
23 Corps Block n/a 0.030 2.0 100.0 13.2 2.5 2.9
n/a = not applicable
Safety factors were computed for the Corps Block data using each of the critical
shear-stress values. Table 6.6 provides a summary of the Corps Block computed safety
factor values for the overtopping tests. Additionally, Table 6.7 and Table 6.8 provide
computed safety factors for the channelized tests for the Clopper (1991) and NCMA
(2006) methods, respectively. Plots of bed slope versus computed safety factors for the
3.7, 2.2, and 2.9 lbs/ft2 τc values are presented in Figure 6.6, Figure 6.7, and Figure 6.8,

131
respectively. The following summarizes the ability of each critical shear-stress value to
predict system stability for the Corps Block dataset:
• τc = 3.7 lbs/ft2 correctly predicted the point of instability for 33% of the tested
installations:
o Computed safety factor values for stable tests ranged from 1.00 to 1.67
o Correctly predicted 100% of stable tests
o Computed safety factor values for unstable tests ranged from 0.71 to 1.32
o Correctly predicted 50% of unstable tests
• τc = 2.2 lbs/ft2 correctly predicted the point of instability for 33% of the tested
installations:
o Computed safety factor values for stable tests ranged from 0.60 to 1.00
o Correctly predicted 17% of stable tests
o Computed safety factor values for unstable tests ranged from 0.42 to 0.79
o Correctly predicted 100% of unstable tests
• τc = 2.9 lbs/ft2 correctly predicted the point of instability for 33% of the tested
installations:
o Computed safety factor values for stable tests ranged from 0.78 to 1.30
o Correctly predicted 83% of stable tests
o Computed safety factor values for unstable tests ranged from 0.55 to 1.03
o Correctly predicted 75% of unstable tests

132
Table 6.6: Computed Corps Block SF for Overtopping Tests for Clopper (1991) and NCMA (2006) Method
Test ID No.
Block Name
S0
(ft/ft) V
(ft/s) τ0
(lbs/ft2)
System Condition
SF (τc = 3.7 lbs/ft2)
SF (τc = 2.2 lbs/ft2)
SF (τc = 2.9 lbs/ft2)
15 Corps Block 0.200 13.6 3.5 Stable 1.00 0.60 0.78
16 Corps Block 0.200 17.3 4.9 Unstable 0.71 0.42 0.55
17 Corps Block 0.143 12.8 2.1 Stable 1.67 1.00 1.30
18 Corps Block 0.143 16.5 4.8 Unstable 0.75 0.44 0.58
19 Corps Block 0.143 14.5 2.7 Unstable 1.32 0.79 1.03
Orange cells identify tests used to calibrate τc values
Table 6.7: Computed Corps Block SF for Channel Tests for Clopper (1991) Method
Test ID No.
Block Name
S0
(ft/ft)
Side Slope (H/V)
V (ft/s)
τ0 (lbs/ft2)
System Condition
SF (τc = 3.7 lbs/ft2)
SF (τc = 2.2 lbs/ft2)
SF (τc = 2.9 lbs/ft2)
20 Corps Block 0.030 2.0 6.5 2.2 Stable 1.69 0.99 1.30
21 Corps Block 0.030 2.0 7.9 2.3 Stable 1.63 0.95 1.25
22 Corps Block 0.030 2.0 11.5 2.5 Stable 1.51 0.88 1.16
23 Corps Block 0.030 2.0 13.2 2.5 Stable 1.51 0.88 1.16
24 Corps Block 0.030 2.0 14.0 2.6 Unstable 1.41 0.82 1.08

133
Table 6.8: Computed Corps Block SF for Channel Tests for NCMA (2006) Method
Test ID No.
Block Name
S0
(ft/ft)
Side Slope (H/V)
V (ft/s)
τ0 (lbs/ft2)
System Condition
SF (τc = 3.7 lbs/ft2)
SF (τc = 2.2 lbs/ft2)
SF (τc = 2.9 lbs/ft2)
20 Corps Block 0.030 2.0 6.5 2.2 Stable 1.41 0.86 1.11
21 Corps Block 0.030 2.0 7.9 2.3 Stable 1.36 0.83 1.07
22 Corps Block 0.030 2.0 11.5 2.5 Stable 1.27 0.77 1.00
23 Corps Block 0.030 2.0 13.2 2.5 Stable 1.27 0.77 1.00
24 Corps Block 0.030 2.0 14.0 2.6 Unstable 1.19 0.72 0.94
Orange cell identifies test used to calibrate τc value

134
0.0
0.2
0.4
0.6
0.8
1.0
1.2
1.4
1.6
1.8
0.00 0.05 0.10 0.15 0.20 0.25
Bed Slope (ft/ft)
SF
CSU OT Sta bl e
CSU OT Unstabl e
SF = 1
CSU Channel Sta bl e -
NCMA (2006)
CSU Channel Unsta bl e
- NCMA (2006)
CSU Channel Sta bl e -
Cl opper (1991)
CSU Channel Unsta bl e
- Clopper (1991)
Figure 6.6: Corps Block SF Computed from Clopper (1991) and NCMA (2006)
Methods with ττττc = 3.7 lbs/ft2 Calibrated from 0.200 ft/ft Bed-slope Data
0.0
0.2
0.4
0.6
0.8
1.0
1.2
0.00 0.05 0.10 0.15 0.20 0.25
Bed Slope (ft/ft)
SF
CSU OT Stable
CSU OT Uns tabl e
SF = 1
CSU Channel Stable -
NCMA (2006)
CSU Channel Uns table -
NCMA (2006)
CSU Channel Stable -
Clopper (1991)
CSU Channel Uns table -
Clopper (1991)
Figure 6.7: Corps Block SF Computed from Clopper (1991) and NCMA (2006)
Methods with ττττc = 2.2 lbs/ft2 Calibrated from 0.143 ft/ft Bed-slope Data

135
0.0
0.2
0.4
0.6
0.8
1.0
1.2
1.4
0.00 0.05 0.10 0.15 0.20 0.25
Bed Slope (ft/ft)
SF
CSU OT Stabl e
CSU OT Uns table
SF = 1
CSU Channel Stabl e -
NCMA (2006)
CSU Channel Unstable -
NCMA (2006)
CSU Channel Stabl e -
Clopper (1991)
CSU Channel Unstable -
Clopper (1991)
Figure 6.8: Corps Block SF Computed from Clopper (1991) and NCMA (2006)
Methods with ττττc = 2.9 lbs/ft2 Calibrated from Channelized Corps Data
6.4 SUMMARY
Safety factors were computed using the Clopper (1991) and NCMA (2006) safety
factor equations for the tests within the database. The Clopper (1991) and NCMA (2006)
safety factor equations proved inadequate at predicting system stability for the 30S and
Corps Block datasets. For the Petraflex dataset, which was limited to tested
embankments slopes of 0.437 and 0.501 ft/ft, the Clopper (1991) and NCMA (2006)
method was successful at predicting stability with the τc value of 8.6 lbs/ft2. Based on the
results of the Clopper (1991) and NCMA (2006) safety factor calculations for ACB data,
the need to develop a design methodology capable of predicting ACB system stability for
both high-velocity, steep-slope and channelized applications was identified.

136
A new factor of safety equation was derived by investigating the ratio of the sum
of resisting moments (moments that work to stabilize the block) to the sum of overturning
moments (moments that work to set the block in motion). Results from the investigation
of assumptions related to existing safety factor equations identified the most influential
assumption as the non-conservative assumption of equal lift and drag forces. Therefore,
a lift coefficient was employed to compute the lift force in a new safety factor equation.
Other assumptions, including the weight force distribution simplification and
computation of the rotation angle, were excluded in the derivation of a new safety factor
equation.
A right-hand coordinate system was applied to the block system as defined by
Figure 7.1 for the factor of safety analysis. Weight force components acting along the x,
y, and z axis were derived and used during the safety factor derivations. Factor of safety
equations were derived for incipient motion rotating about three separate points: 1) pivot
Point P in the positive x direction, 2) pivot Point O in the positive z direction, and 3)
pivot Point M on the corner of the block as illustrated in Figure 7.2. Subsequent sections
present the derivation of the weight force components and the derivation of the new
safety factor equation.
7 DERIVATION OF NEW SAFETY FACTOR METHOD

137
Flow
z
x
y
Figure 7.1: Coordinate System for Factor of Safety Equation Derivations
x
z
Pivot Point O
Pivot Point M
Toe of Side Slope
Pivot Point P
Figure 7.2: View of Block Normal to Side-slope Plane with Identified Pivot Points

138
7.1 DERIVATION OF SUBMERGED WEIGHT FORCE
COMPONENTS
For the moment analysis, the components of the submerged weight in each of the
directions of the three-dimensional coordinate system (x, y, and z) were derived:
a. SXW – weight force component parallel to the side-slope plane in the x
direction:
0sin θSSX WW = Equation 7.1
where 0θ is the angle of the bed slope.
b. SYW – weight force component normal to the side-slope plane in the y
direction:
20 coscos θθSSY WW = Equation 7.2
where 2θ is the angle resulting from the projection of the bed slope ( 0θ ) on
the side-slope face and is mathematically defined by Equation 7.3:
( )012 costanarctan θθθ = Equation 7.3
where 0θ is the bed-slope angle and 1θ is the side-slope angle.
c. SZW – weight force component parallel to the side-slope plane in the positive
z direction:
20 sincos θθSSZ WW = Equation 7.4
Derivations for each of the submerged weight components are presented in this section.

139
The weight force component acts in the negative vertical direction from the center
of mass of the block as illustrated in Figure 7.3. Two components can be used to
represent the total weight force: one along the direction of the bed slope and one normal
to the bed slope. As shown in Figure 7.3, the weight force component in the x direction,
SXW , is 0sinθSW .
where
WS = block submerged weight (lbs)
θ0 = bed-slope angle (radians)
Figure 7.3: Weight Force Components Normal and Perpendicular to the Direction
of the Bed Slope
To obtain an expression for the weight force components in the y and z direction,
SYW and SZW , respectively, the component perpendicular to the direction of flow in the
horizontal-vertical plane, 0cosθSW (Figure 7.3), was further investigated. Figure 7.4
presents the 0cosθSW component in the z-y plane. 0sinθSW is not shown in Figure 7.4
since it is located solely in the x axis which is normal to the z-y plane. As Figure 7.4
Flow Direction
horizontal
vertical
horizontal
toe of side slope
0θ
0cosθSW0θ
SW
0sinθSW

140
illustrates, 20 coscos θθSSY WW = and 20 sincos θθSSZ WW = , where 2θ is the angle
between the bed slope and the side slope from a cross section normal to the bed-slope
surface. Figure 7.5 illustrates the location of the 2θ dimension.
where
WS = block submerged weight (lbs)
θ0 = bed-slope angle (radians)
θ2 = side-slope angle measured along a cross section normal to the bed-slope (radians) y, z = y and z axes of the three-dimensional coordinate system
Figure 7.4: Channel Cross Section Normal to the Bed-slope View
Channel Bed
Top of Bank
z y
0cosθS
W2θ
2θ20 sincos θθSW20 coscos θθSW

141
where
V-V’ = vertical cross-section
N-N’ = cross-section normal to the bed-slope plane
θ2 = angle between the bed-slope and the side-slope from a cross section
normal to the bed-slope plane (radians)
Figure 7.5: Definition of 2θ
7.2 DERIVATION OF SIDE-SLOPE ANGLE PERPENDICULAR TO
BED SLOPE
An equation for the side-slope angle normal to the bed slope, θ2, as an expression
of the side slope, 1θ and the bed slope, 0θ , was derived. Figure 7.6 presents a vertical
cross-section view (V-V’ from Figure 7.5) of the channel and defines the location of the
side slope, 1θ . Figure 7.7 presents a cross-section view normal to the bed slope (N-N’
from Figure 7.5) and defines the location of 2θ . Given the lengths adjacent, A, and
opposite, O, of the angle 1θ , as defined by Figure 7.6, the relationship presented in
Equation 7.5 can be produced:
V'
Channel Bed
Top of Bank
Flow Direction
V N
N'
2θ

142
A
O=1tanθ Equation 7.5
Furthermore, given the length adjacent, A, and opposite, O’, of the angle 2θ , as defined
by Figure 7.7, the relationship presented in Equation 7.6 can be produced:
A
O'tan 2 =θ Equation 7.6
Solving Equation 7.5 for A and substituting into Equation 7.6 generates Equation 7.7:
O
O 1
2
tan'tan
θθ = Equation 7.7
As shown in Figure 7.8, the relationship presented in Equation 7.8 exists between the
lengths opposite of 1θ and 2θ :
0cos' θOO = Equation 7.8
Substituting Equation 7.8 into Equation 7.7 and solving for 2θ provides Equation 7.9,
which is an expression for the side-slope angle normal to the bed slope, 2θ , in terms of
the bed-slope angle, 0θ , and the vertical side-slope angle, 1θ :
( )102 tancosarctan θθθ = Equation 7.9

143
where
A = length adjacent of angle θ1
H = hypotenuse of right triangle created by θ1
O = length opposite of angle θ1
θ1 = vertical side-slope angle (radians)
Figure 7.6: Cross-section V-V’ View (vertical)
where
A = length adjacent of angle 2θ
H’ = hypotenuse of right triangle created by 2θ
O’ = length opposite of angle 2θ
θ2 = angle between the bed-slope and the side-slope from a cross section normal
to the bed-slope plane (radians)
Figure 7.7: Cross-section N-N’ View (normal to the bed slope)
Channel Bed
Top of Bank
2θ
'H'O
A
Channel Bed
Top of Bank
1θ
A
HO

144
where
O = length opposite of angle θ1
O’ = length opposite of angle θ2
θ0 = bed-slope angle (radians)
Figure 7.8: Channel Profile View Including Lengths O and O’ for 1θ and 2θ ,
Respectively
7.3 DERIVATION OF SAFETY FACTOR EQUATIONS
Factor of safety equations were derived for rotation about the three points
illustrated in Figure 7.2. For a given block and flow conditions, the three safety factor
equations can be used to determine the critical rotation point.
Drag and lift force values for each derivation are computed by the same method.
An expression for the drag force exerted on a block was obtained from the average
boundary shear-stress equation and the block surface area. The drag force acting on the
block surface was calculated by the product of the average boundary shear stress, 0τ , and
vertical
horizontal
flow direction 0θ
0θ
'OO

145
surface area of the block face parallel to direction of flow, BA . Equation 7.10 presents
the expression for drag force exerted on a block.
BD AF 0τ= Equation 7.10
where
DF = drag force (lbs);
0τ = boundary shear stress (lbs/ft2); and
BA = block area parallel to direction of flow (ft2).
According to dimensional analysis, the lift force is defined by Equation 7.11 (Wilcox,
2000):
2
2
1VACF BLL ρ= Equation 7.11
where
LF = lift force (lbs);
LC = lift coefficient;
ρ = mass density of water (slugs/ft3);
BA = block area parallel to direction of flow (ft2); and
V = flow velocity (ft/s).
Additional lift and drag forces caused by a protruding block were computed using
Equation 7.12, which is consistent with the method presented in NCMA (2006):
2'' 5.0 VZbFF LD ρ∆== Equation 7.12

146
where
'
DF = additional drag force caused by block protrusion (lbs);
'
LF = additional lift force caused by block protrusion (lbs);
Z∆ = height of block protrusion above ACB system (ft);
b = block width normal to the flow direction (ft);
ρ = mass density of water (slugs/ft3); and
V = flow velocity (ft/s).
7.3.1 SAFETY FACTOR EQUATION FOR ROTATION ABOUT BLOCK
CORNER (POINT M)
The location of the cross section used to calculate the safety factor equation for
movement about the block corner (Point M), A-A’, is presented in Figure 7.9. The angle
β can be calculated from given block dimensions as expressed by Equation 7.13:
=
n
p
l
larctanβ Equation 7.13
where lp is the block length parallel to the bed slope and ln is the block length normal to
the bed slope as illustrated in Figure 7.9.

147
where
A-A’ = cross section along block rotation path for rotation about the block corner
nl = block length normal to the bed-slope (ft)
pl = block length parallel to the bed-slope (ft)
M point of rotation for rotation about the block corner
β = angle of block rotation measured in the side-slope plane (radians)
x, z = x and z axes of the three-dimensional coordinate system
Figure 7.9: View of Block Normal to Side-slope Plane with Identified Cross-section
A-A’ and Angle ββββ
The drag force acts in the direction of flow along the x axis. As illustrated by
Figure 7.10, the components of the WSX, WSZ, and FD forces in the direction of Cross-
section A-A’ were calculated and are expressed by Equation 7.14, Equation 7.15, and
Equation 7.16, respectively:
( )βsin)'( SXAASX WW =− Equation 7.14
( )βcos)'( SZAASZ WW =− Equation 7.15
( )βsin)'( DAAD FF =− Equation 7.16
x
z
M
Toe of Side Slope
lp
ln
β
A’
A

148
where
A-A’ = cross section along block rotation path for rotation about the block corner
FD = drag force (lbs)
WSX = block submerged weight component along the x axis (lbs)
WSZ = block submerged weight component along the z axis (lbs) β = angle of block rotation measured in the side-slope plane (radians)
x, z = x and z axes of the three-dimensional coordinate system
Figure 7.10: View of Block Normal to Side-slope Plane with Identified Force
Components
A free-body diagram of the block Cross-section A-A’ is presented in Figure 7.11
with corresponding moment arms. The moment arm between the block corner and the
WSY weight force component, l7, which acts along the direction of the A-A’ can be
calculated from the block dimensions using Equation 7.17:
22
7 5.0 np lll += Equation 7.17
x
z
Toe of Side Slope
β
A’
A
WSZ
WSX FD

149
where
lp = block length parallel to the bed slope (ft); and
ln = block length normal to the bed slope as illustrated in Figure 7.9 (ft).
where
β = angle of block rotation measured in the side-slope plane (radians) FD = drag force (lbs)
FL = lift force (lbs)
1l = moment arm for submerged weight force component parallel to the side-slope plane
(ft)
3l = block height and moment arm for the drag force component along the path of motion
(ft)
7l = moment arm for the weight force component normal to the side-slope plane (ft)
8l = moment arm for the lift force (ft)
M = rotation point about the block corner
WSX = block submerged weight component along the x axis (lbs)
WSY = block submerged weight component along the y axis (lbs)
WSZ = block submerged weight component along the z axis (lbs)
Figure 7.11: Free-body Diagram for Rotation about Point M
Equation 7.18 presents the safety factor equation for rotation about pivot Point M,
which was derived by taking the ratio of resisting moments to overturning moments
illustrated in Figure 7.11:
( ) ( ) ( )'sin'cossin 831
7
LLDDSZSX
SY
goverturnin
resisting
MFFFFWW
W
M
MSF
+++++==
lll
l
βββ
Equation 7.18
FDsinβ FL
WSXsinβ + WSZcosβ WSY
l3 l1
l8
l7
M

150
where
SX
W = block submerged weight component along the x axis (lbs);
SY
W = block submerged weight component along the y axis (lbs);
SZ
W = block submerged weight component along the z axis (lbs);
D
F = drag force (lbs);
'
DF = additional drag force due to block protruding above adjacent blocks
(lbs);
L
F = lift force (lbs);
'
LF = additional lift force due to block protruding above adjacent blocks (lbs);
and
i
l = corresponding moment arms as illustrated in Figure 7.11 (ft).
After substituting Equation 7.1, Equation 7.2, and Equation 7.4 for WSX, WSY, and WSZ in
Equation 7.18, respectively, Equation 7.19 is derived as the safety factor equation for
rotation about Point M:
( ) ( ) ( )'sin'cossincossinsin
coscos
832001
207
LLDDSS
S
MFFFFWW
WSF
+++++=
lll
l
ββθθβθ
θθ
Equation 7.19
where
WS = block submerged weight (lbs);
θ0 = bed-slope angle (radians); and
θ2 = side-slope angle normal to the bed slope as defined by Equation 7.3
(radians).

151
7.3.2 SAFETY FACTOR EQUATION FOR ROTATION IN THE FLOW
DIRECTION (POINT P)
A free-body diagram for incipient failure in the positive x direction, rotation about
Point P, is presented in Figure 7.12. Equation 7.20, which conservatively ignores inter-
block restraint, is the safety factor equation for rotation in the x-y plane:
( ) ( )'
4
'
31
2
LLDDSX
SY
goverturnin
resisting
PFFFFW
W
M
MSF
++++==
lll
l Equation 7.20
where
SX
W = block submerged weight component along the x axis (lbs);
SY
W = block submerged weight component along the y axis (lbs);
D
F = drag force (lbs);
'
DF = additional drag force due to block protruding above adjacent blocks
(lbs);
L
F = lift force (lbs);
'
LF = additional lift force due to block protruding above adjacent blocks (lbs);
and
i
l = corresponding moment arms as illustrated in Figure 7.12 (ft).
After substituting Equation 7.1 and Equation 7.2 for WSX and WSY in Equation 7.20,
respectively, Equation 7.21 is derived as the safety factor equation for rotation about
Point P:
( ) ( )''sin
coscos
4301
202
LLDDS
S
PFFFFW
WSF
++++=
lll
l
θ
θθ Equation 7.21

152
where
WS = block submerged weight (lbs);
θ0 = bed-slope angle (radians); and
θ2 = side-slope angle normal to the bed slope as defined by Equation 7.3
(radians).
The moment arm associated with the lift force, l4, is equal to the moment arm for the
weight force in the y direction, l2, where 2l = ½ × lp.
where
FD = drag force (lbs)
FL = lift force (lbs)
1l = moment arm for submerged weight force component parallel to the side-slope plane
(ft)
2l = moment arm for submerged weight force component normal to the side-slope plane
(ft)
3l = block height and moment arm for the drag force (ft)
4l = moment arm for the lift force (ft)
P = rotation point about the block edge in the downstream direction
WSX = block submerged weight component along the x axis (lbs)
WSY = block submerged weight component along the y axis (lbs)
x, y = x and y axes of the three-dimensional coordinate system
Figure 7.12: Free-body Diagram for Rotation about Point P
y
FD FL
WSX WSY
l3 l1
l4
l2
P
x

153
7.3.3 SAFETY FACTOR EQUATION FOR ROTATION PERPENDICULAR TO
THE FLOW DIRECTION (POINT O)
A free-body diagram for incipient failure in the positive z direction, rotation about
Point O, is presented in Figure 7.13. Equation 7.22, which conservatively ignores inter-
block restraint, represents the safety factor equation for rotation in the z-y plane:
( )'
61
5
LLSZ
SY
goverturnin
resisting
OFFW
W
M
MSF
++==
ll
l Equation 7.22
where
SZ
W = block submerged weight component in the z direction (lbs);
SY
W = block submerged weight component in the y direction (lbs);
LF = lift force (lbs);
'
LF = additional lift force due to protruding block (lbs); and
il = corresponding moment arms as illustrated in Figure 7.13 (ft).
After substituting Equation 7.1 and Equation 7.4 for WSX and WSZ in Equation 7.22,
respectively, Equation 7.23 is derived as the safety factor equation for rotation about
Point O:
( )'sincos
coscos
6201
205
LLS
S
OFFW
WSF
++=
ll
l
θθ
θθ Equation 7.23
where
WS = block submerged weight (lbs);
θ0 = bed-slope angle (radians); and

154
θ2 = side-slope angle normal to the bed slope as defined by Equation 7.3
(radians).
The moment arm associated with the lift force, l6, is equal to the moment arm for the
weight force in the y direction, l5, where 5l = ½ × ln.
where
FL = lift force (lbs)
1l = moment arm for submerged weight force component parallel to the side-slope
plane (ft)
5l = moment arm for the weight force component in the y direction (ft)
6l = moment arm for the lift force (ft)
O = rotation point about the block edge laterally into the channel
WSY = block submerged weight component along the y axis (lbs)
WSZ = block submerged weight component in the z direction (lbs)
x, y = x and y axes of the three-dimensional coordinate system
Figure 7.13: Free-body Diagram for Rotation about Point O
7.4 SAFETY FACTOR EQUATION FOR BLOCKS ON A
CHANNEL BED
The factor of safety equation for a block on the channel bed can be directly
derived from Equation 7.21 by setting the side-slope angle, θ1, to 0. When the side-slope
y
FL
WSZ WSY
l1
l6
l5
O
z

155
angle is 0, the corresponding side-slope angle normal to the bed slope is 0 as illustrated in
Equation 7.24:
( )( ) ( ) 00arctancos0tanarctan 02 === θθ Equation 7.24
Equation 7.25, Equation 7.26 and Equation 7.27 present the WSX, WSY, and WSZ weight
force components, respectively, for a block on the channel bed which can be derived by
substituting 0 for θ2 in Equation 7.1, Equation 7.2, and Equation 7.4:
0sin θSSX
WW = Equation 7.25
0cosθSSY
WW = Equation 7.26
0=SZ
W Equation 7.27
Rotation about Point P is the critical concern for incipient failure for a block on the
channel bed since that rotation is in the direction of flow and in the plane of the only
weight force components. Substituting 0 for θ2 in Equation 7.21 results in Equation 7.28,
which is the SF equation for a block on the channel bed:
( ) ( )''sin
cos
4301
02
LLDDS
S
BEDFFFFW
WSF
++++=
lll
l
θ
θ Equation 7.28
where
WS = block submerged weight (lbs);
θ0 = bed-slope angle (radians);
D
F = drag force (lbs);

156
'
DF = additional drag force due to block protruding above adjacent blocks
(lbs);
L
F = lift force (lbs);
'
LF = additional lift force due to block protruding above adjacent blocks (lbs);
and
i
l = corresponding moment arms as illustrated in Figure 7.12 (ft).
7.5 SUMMARY
Safety factor equations were derived for stability of a rectangular particle on a
channel side slope and stability on a channel bed. Computation of the lift force for the
safety factor method uses the flow velocity with a lift coefficient specific to a given
rectangular particle. Additionally, expressions for computation of the weight force
distribution which correctly account for the bed-slope contribution are utilized. Channel
side-slope safety factor equations were derived for rotation about three locations on the
block: 1) rotation about the block corner (Point M), 2) rotation about the block edge in
the downstream direction (Point P), and 3) rotation about the block edge laterally into the
channel (Point O). To derive the safety factor equation for blocks on a channel bed, the
side-slope angle was set to 0 in the channel side-slope safety factor equation for rotation
about Point P. Table 7.1 provides a summary of the derived safety factor equations.
Values for bed slope, side slope, block geometry, block weight, specific gravity of block
material, design velocity, design shear stress, and calibrated lift coefficient are required to
use the new safety factor method. Since the only calibrated parameter within the derived

157
safety factor equation is the lift coefficient, it accounts for inter-block friction which is
not represented in the moment stability model.

158
Table 7.1. Summary of New Safety Factor Equations
Equation Equation Number
( )012 costanarctan θθθ = Equation 7.3
BD
AF 0τ= Equation 7.10
2
2
1VACF BLL ρ= Equation 7.11
2'' 5.0 VZbFFLD
ρ∆== Equation 7.12
=
n
p
l
larctanβ Equation 7.13
Channel Side-slope SF Equation for Rotation about the Block Corner (Point M):
( ) ( ) ( )'sin'cossincossinsin
coscos
832001
207
LLDDSS
SM
FFFFWW
WSF
+++++=
lll
l
ββθθβθ
θθ Equation 7.19
Channel Side-slope SF Equation for Rotation about the Block Edge in the Flow Direction (Point P):
( ) ( )''sin
coscos
4301
202
LLDDS
SP
FFFFW
WSF
++++=
lll
l
θ
θθ Equation 7.21
Channel Side-slope SF Equation for Rotation about the Block Edge Laterally into the Channel (Point O):
( )'sincos
coscos
6201
205
LLS
SO
FFW
WSF
++=
ll
l
θθ
θθ Equation 7.23
Channel Bed SF Equation for Rotation about the Block Edge in the Flow Direction (Point P):
( ) ( )''sin
cos
4301
02
LLDDS
S
BEDFFFFW
WSF
++++=
lll
l
θ
θ Equation 7.28

159
Table 7.1 (continued): Summary of New Safety Factor Equations
where
2θ = side-slope angle perpendicular to the bed-slope plane (radians);
0θ = vertical side-slope angle = arctan(1/z) (radians);
1θ = bed-slope angle = arctan(S0) (radians);
D
F = drag force (lbs);
0τ = boundary shear stress (lbs/ft2);
B
A = block area parallel to direction of flow (ft2);
L
F = lift force (lbs);
L
C = lift coefficient;
ρ = mass density of water (slugs/ft3);
V = flow velocity (ft/s);
'
DF = additional drag force caused by block protrusion (lbs);
'
LF = additional lift force caused by block protrusion (lbs);
Z∆ = height of block protrusion above ACB system (ft);
b = block width normal to the flow direction (ft);
β = angle to block corner (radians);
pl = block length parallel to the bed slope (ft);
nl = block length normal to the bed slope (ft);
WS = block submerged weight (lbs); and
il = moment arms corresponding to forces (ft).

160
An assessment of the safety factor equations developed in Chapter 7 was
conducted using the database presented in Chapter 4. A lift coefficient was calibrated for
each block and safety factors were computed for all tests using the equations presented in
Table 7.1.
For overtopping hydraulic test conditions, Equation 7.28 was used to determine
the value of L
C for each block. Lift coefficients were calculated by setting the SF equal
to 1 and using the flow velocity and boundary shear stress measured for the stable test
condition prior to identified failure. Substituting Equation 7.11 into Equation 7.28 and
setting SF equal to 1 generates Equation 8.1 for L
C :
( )
++
==2
4301
02
2
1sin
cos1
VACFW
WSF
BLDS
SBED
ρθ
θ
lll
l Equation 8.1
Since the database was developed from tests conducted in a controlled laboratory setting,
Equation 8.1 excludes the additional lift and drag forces attributed to block protrusion
above adjacent blocks. Equation 8.2 presents the formula for computing a lift coefficient,
CL, which was derived by solving Equation 8.1:
2
4
30102
5.0
sincos
VA
FWWC
B
DSSL
ρ
θθ
l
lll −−= Equation 8.2
8 ANALYSIS OF NEW SAFETY FACTOR EQUATIONS

161
For channelized hydraulic test conditions, the critical point of rotation was initially
identified by evaluating Equation 7.19, Equation 7.21, and Equation 7.23 for the
minimum safety factor using lift coefficients determined from the overtopping data
assessment. Subsequently, a lift coefficient was computed from the safety factor
equation with the minimum computed safety factor by setting the safety factor equal to 1
and solving for CL.
8.1 30S NEW SF ANALYSIS
Using the derived safety factor calculation equations provided in Table 7.1, safety
factors were computed for each 30S test presented in Table 5.3. Initially, the lift
coefficient, CL, was computed for all stable tests which directly preceded an unstable test
by using the computed shear stress and flow velocity on the embankment and assuming a
safety factor value of 1. A lift coefficient value of 0.0972 was determined to be the
optimum value to represent the stability conditions within the dataset.
Safety factors were computed for the 30S data using the 0.0972 lift coefficient
value. Table 8.1 provides a summary of the computed safety factor values. A plot of bed
slope versus 30S computed safety factors is presented in Figure 8.1. The following
summarizes the ability of the new safety factor equation to predict system stability for the
30S dataset:
• CL = 0.0972 correctly predicted the point of instability for 75% of the tested
installations:
o Computed safety factor values for stable tests ranged from 0.74 to 1.71
o Correctly predicted 80% of stable tests

162
o Computed safety factor values for unstable tests ranged from 0.46 to 0.84
o Correctly predicted 100% of unstable tests
The new safety factor equation proved successful in predicting stability for eight out of
the nine 30S tests.
Table 8.1: Computed 30S SF for the New SF Method
Test ID No.
Block Name
Overtopping Depth
(ft) S0
(ft/ft) V
(ft/s) τ0
(lbs/ft2)
System Condition
SF (CL = 0.0972)
1 30S 1.0 0.442 12.1 7.1 Stable 1.05
2 30S 2.0 0.442 14.9 10.3 Stable 0.74
3 30S 4.0 0.442 20.4 12.6 Unstable 0.46
4 30S 1.0 0.499 17.6 2.5 Unstable 0.66
5 30S 1.0 0.230 10.5 3.3 Stable 1.71
6 30S 1.6 0.230 14.7 4.0 Stable 1.00
7 30S 2.0 0.230 17.2 4.7 Unstable 0.76
8 30S 0.9 0.431 13.7 3.6 Stable 1.00
9 30S 1.2 0.431 15.0 4.9 Unstable 0.84
Orange cell identifies test used to calibrate CL value
0.0
0.2
0.4
0.6
0.8
1.0
1.2
1.4
1.6
1.8
0.0 0.1 0.2 0.3 0.4 0.5 0.6
Bed Slope (ft/ft)
SF
CSU Stable
CSU Unstable
FHWA 1988 Stable
ASTM D7276 Analysis
FHWA 1988 Unstable
ASTM D7276 Analysis
SF = 1
Figure 8.1: 30S SF Computed from the New SF Method with CL = 0.0972
Calibrated from CSU 30S 0.230 ft/ft Bed-slope Data

163
8.2 PETRAFLEX NEW SF ANALYSIS
Using the new safety factor calculation equations provided in Table 7.1, safety
factors were computed for the Petraflex tests. Initially, the lift coefficient, CL, was
computed for all stable tests which directly preceded an unstable test by using the
computed shear stress and flow velocity on the embankment and assuming a safety factor
value of 1. A lift coefficient value of 0.0207 was determined to be the optimum value to
represent the stability conditions within the dataset.
Safety factors were computed for the Petraflex data using the 0.0207 lift
coefficient value. Table 8.2 provides a summary of the computed safety factor values. A
plot of bed slope versus Petraflex computed safety factor is presented in Figure 8.2. The
following summarizes the ability of the new safety factor equation to predict system
stability for the Petraflex dataset:
• CL = 0.0207 correctly predicted the point of instability for 100% of the tested
installations:
o Computed safety factor values for stable tests ranged from 1.00 to 1.76
o The computed safety factor values for the unstable test was 0.91
The new safety factor equation proved successful in predicting stability for all of the
Petraflex tests.

164
Table 8.2: Computed Petraflex SF for the New SF Method
Test ID No.
Block Name
Over- topping Depth
(ft) S0
(ft/ft) V
(ft/s) τ0
(lbs/ft2)
System Condition
SF (CL = 0.0207)
10 Petraflex 1.0 0.437 11.7 5.8 Stable 1.76
11 Petraflex 2.0 0.437 15.0 7.5 Stable 1.33
12 Petraflex 4.0 0.437 19.0 7.0 Stable 1.00
13 Petraflex 1.0 0.501 15.2 4.5 Stable 1.41
14 Petraflex 2.0 0.501 17.8 10.2 Unstable 0.91
Orange cell identifies test used to calibrate CL value
0.0
0.5
1.0
1.5
2.0
0.42 0.44 0.46 0.48 0.50 0.52
Bed Slope (ft/ft)
SF
CSU Stable
CSU Unstable
FHWA 1988 Stable
ASTM D7276 Analysis
SF = 1
Figure 8.2: Petraflex SF Computed from the New SF Method with CL = 0.0207
Calibrated from Clopper and Chen (1988) Data and ASTM D7276 (2008) Analysis
8.3 CORPS BLOCK NEW SF ANALYSIS
Using the derived safety factor equations provided in Table 7.1, safety factors
were computed for the Corps Block tests. Initially, the lift coefficient, CL, was computed
for all stable tests which directly preceded an unstable test by using the computed shear
stress and flow velocity on the embankment and assuming a safety factor value of 1. A
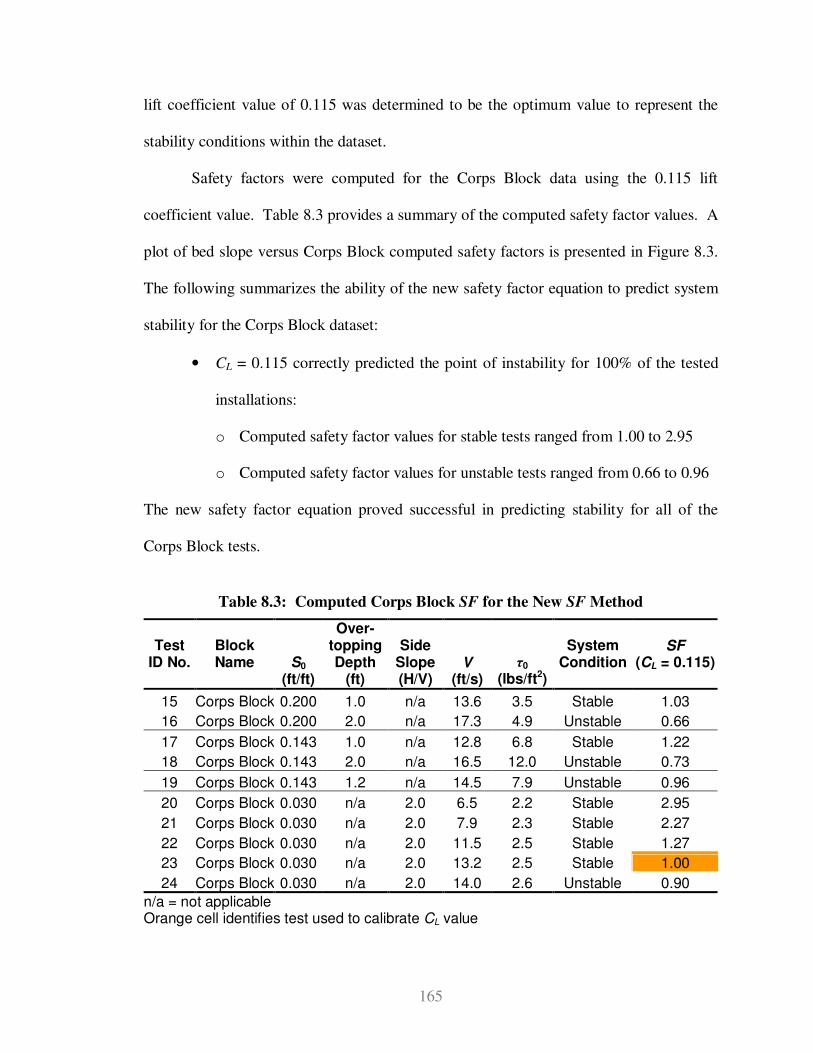
165
lift coefficient value of 0.115 was determined to be the optimum value to represent the
stability conditions within the dataset.
Safety factors were computed for the Corps Block data using the 0.115 lift
coefficient value. Table 8.3 provides a summary of the computed safety factor values. A
plot of bed slope versus Corps Block computed safety factors is presented in Figure 8.3.
The following summarizes the ability of the new safety factor equation to predict system
stability for the Corps Block dataset:
• CL = 0.115 correctly predicted the point of instability for 100% of the tested
installations:
o Computed safety factor values for stable tests ranged from 1.00 to 2.95
o Computed safety factor values for unstable tests ranged from 0.66 to 0.96
The new safety factor equation proved successful in predicting stability for all of the
Corps Block tests.
Table 8.3: Computed Corps Block SF for the New SF Method
Test ID No.
Block Name
S0
(ft/ft)
Over-topping Depth
(ft)
Side Slope (H/V)
V (ft/s)
τ0 (lbs/ft2)
System Condition
SF (CL = 0.115)
15 Corps Block 0.200 1.0 n/a 13.6 3.5 Stable 1.03
16 Corps Block 0.200 2.0 n/a 17.3 4.9 Unstable 0.66
17 Corps Block 0.143 1.0 n/a 12.8 6.8 Stable 1.22
18 Corps Block 0.143 2.0 n/a 16.5 12.0 Unstable 0.73
19 Corps Block 0.143 1.2 n/a 14.5 7.9 Unstable 0.96
20 Corps Block 0.030 n/a 2.0 6.5 2.2 Stable 2.95
21 Corps Block 0.030 n/a 2.0 7.9 2.3 Stable 2.27
22 Corps Block 0.030 n/a 2.0 11.5 2.5 Stable 1.27
23 Corps Block 0.030 n/a 2.0 13.2 2.5 Stable 1.00
24 Corps Block 0.030 n/a 2.0 14.0 2.6 Unstable 0.90
n/a = not applicable
Orange cell identifies test used to calibrate CL value

166
0.0
0.5
1.0
1.5
2.0
2.5
3.0
3.5
0.00 0.05 0.10 0.15 0.20 0.25
Bed Slope (ft/ft)
SF
CSU Stable
CSUUnstable
SF = 1
CSU ChannelStable
CSU ChannelUnstable
Figure 8.3: Corps Block SF Computed from the New SF Method with CL = 0.115 Calibrated from Channel Data
8.4 DISCUSSION OF CONSIDERATIONS, RECOMMENDATIONS
AND LIMITATIONS
The moment stability analysis approach is a simplified model of a complex
physical phenomenon. Inter-block friction is not represented in the moment stability
analysis and is encompassed within the calibrated lift coefficient, CL. Therefore,
coefficient extrapolations based on varying block thicknesses, block footprints, and block
weights should not be employed without further research and verification.
Performance testing at overtopping depth intervals smaller than 1.0 ft is
recommended based on the database safety factor evaluation. As illustrated by the CSU
Petraflex data in Figure 8.2 where the 1.0-ft and 2.0-ft overtopping test safety factors
were 1.41 and 0.91, respectively, there can be a large gap between safety factors
computed from 1.0-ft overtopping depth intervals. Since the system critical condition is
within these two overtopping depths and lift coefficients must be computed from a stable

167
condition, testing at smaller intervals, such as 0.5-ft, would provide a more precise
identification of the lift coefficient.
Verification of the developed safety factor equation was limited to the database
limitations. A summary of the database limitations is provided by the following:
• Overtopping embankment slopes ranged from 0.230 to 0.501 ft/ft;
• Overtopping depths ranged from 1.0 to 4.0 ft;
• One channelized condition with a side slope of 2H:1V; and
• Exclusively non-vertical interlocking blocks.
8.5 SUMMARY
Safety factors were computed using the safety factor method developed in
Chapter 7 for the tests within the database. Calibrated lift coefficients for the 30S,
Petraflex, and Corps Block systems were 0.0972, 0.0207, and 0.115, respectively. The
new safety factor equations proved successful in predicting system stability for twenty-
three out of the total twenty-four tests, which is a 96% success rate. The stable 2.0-ft
overtopping FHWA 30S test was conservatively predicted as unstable.
168
9.1 OVERVIEW
The focus of the presented research was to evaluate existing ACB design methods
with a full-scale database and develop a comprehensive design methodology applicable
to channelized and overtopping hydraulic conditions. Existing ACB design methods,
Clopper (1991) and NCMA (2006), compute a safety factor using a moment stability
analysis approach. To date, verification of the Clopper (1991) and NCMA (2006)
method has not been conducted with a database encompassing both channelized data and
overtopping data with a range of bed slopes and embankment lengths.
A literature review revealed that testing and evaluation of ACB protection
systems has been conducted by CIRIA, FHWA, USACE, and CSU dating back to the late
1980s. Overtopping hydraulic conditions were the primary form of testing ACB armored
embankments with the exception of Abt et al. (2001) which tested channelized flow
conditions. Further results from the literature review include the identification of ASTM
D7277 (2008) and ASTM D7276 (2008) as the current state-of-the-practice for testing
and evaluation of ACB protection systems and NCMA (2006) as the current state-of-the-
practice for ACB system hydraulic design.
Clopper (1991) and NCMA (2006) present extrapolations of safety factor methods
developed by Stevens and Simons (1971), Julien (1998) and Julien and Anthony (2002)
for mild-slope, low-velocity hydraulic conditions to high-velocity, steep-slope conditions
9 CONCLUSIONS AND RECOMMENDATIONS

169
associated with embankment overtopping environments. Through the investigation of
assumptions, the most unsuitable assumption for the high-velocity, steep-slope example
was identified as the assumption of equal lift and drag forces, which was determined to
be non-conservative for velocity values greater than approximately 10 ft/s.
Trigonometric simplifications and the computation of the angle β were also identified as
inapt assumptions for the investigated example.
A database was developed for the purpose of evaluating the Clopper (1991) and
NCMA (2006) safety factor design methods. The database included three ACB systems:
1) 30S, 2) Petraflex, and 3) the Corps Block. The 30S dataset was composed of nine total
overtopping tests on four different installations. Discharges ranged from 8.0 to 90.5 cfs,
embankment slopes ranged from 0.230 to 0.499 ft/ft, and embankment lengths ranged
from 13 ft to 40 ft for the combined 30S dataset.
The Petraflex dataset was composed of five total overtopping tests on two
different installations. Discharges ranged from 10.0 to 93.0 cfs, embankment slopes
ranged from 0.437 to 0.501 ft/ft, and embankment lengths ranged from 13 ft to 20 ft for
the combined Petraflex dataset.
The Corps Block dataset was composed of eleven total tests including five
overtopping tests and six channelized tests. Discharges ranged from 9.8 to 28.5 cfs,
embankment slopes ranged from 0.143 to 0.200 ft/ft, and a constant 20-ft embankment
length for the Corps Block overtopping dataset. The Corps Block channelized dataset
had discharges ranging from 29.0 to 125.0 cfs.
Hydraulic analysis was conducted on the database to provide shear-stress and
flow-velocity values for the assessment of the Clopper (1991) and NCMA (2006) safety

170
factor equations. Subsequently, safety factors were computed using the Clopper (1991)
and NCMA (2006) safety factor equations for the tests within the database. Both the
Clopper (1991) and NCMA (2006) safety factor equations proved inadequate at
predicting system stability for the 30S and Corps Block datasets. The Clopper (1991)
and NCMA (2006) methods were both successful at predicting stability for 100% of the
Petraflex dataset, which was a limited dataset with tested embankments slopes of 0.437
and 0.501 ft/ft. Both the Clopper (1991) and NCMA (2006) safety factor methods
predicted the point of instability correctly for five out of the nine tested installations,
which is a 56% success rate.
A new methodology for safety factor computation was developed for stability of a
rectangular particle on a channel side slope and on a channel bed. Computation of the lift
force for the safety factor method uses the flow velocity with a calibrated lift coefficient.
Additionally, expressions for computation of the weight force distribution which
correctly account for the bed-slope contribution were utilized. Table 7.1 provided a
summary of the new safety factor equations.
Safety factors were computed using the new safety factor method for the tests
within the database. Calibrated lift coefficients for the 30S, Petraflex, and Corps Block
systems were determined to be 0.0972, 0.0207, and 0.115, respectively. Collectively, the
new safety factor method predicted the point of instability correctly for eight out of the
nine tested installations, which is an 89% success rate. Additionally, the new safety
factor equations proved successful at predicting system stability for 96% of the individual
tests; twenty-three tests were predicted correctly out of the total twenty-four tests.

171
9.2 CONCLUSIONS
Conclusions for the ACB safety factor research are as follows:
• The shear-stress value computed using the current state-of-the-practice
analysis method (ASTM D7276, 2008) was less than 1% different than the
shear-stress value reported for the 30S 1.0-ft overtopping test in Clopper and
Chen (1988).
• The shear-stress value computed using the current state-of-the-practice
analysis method (ASTM D7276, 2008) was 14% less than the shear-stress
value reported for the 30S 2.0-ft overtopping test in Clopper and Chen (1988).
• Shear-stress values computed using the current state-of-the-practice analysis
method (ASTM D7276, 2008) were an average of 72% less than the shear-
stress values reported for the 30S and Petraflex 4.0-ft overtopping tests in
Clopper and Chen (1988).
• Clopper (1991) and NCMA (2006) safety factor equations proved inadequate
at predicting system stability for the 30S dataset by correctly predicting the
point of instability for a maximum of two out of the four 30S installations.
• Clopper (1991) and NCMA (2006) safety factor equations proved successful
at predicting system stability for the Petraflex dataset by correctly predicting
the point of instability for each of the two Petraflex installations.
• Clopper (1991) and NCMA (2006) safety factor equations proved inadequate
at predicting system stability for the Corps Block dataset by correctly
predicting the point of instability for a maximum of one out of the three Corps
Block installations.

172
• New safety factor equations were developed which incorporated a lift
coefficient for the computation of the lift force. A summary of the new safety
factor equations was provided in Table 7.1.
• The new safety factor equations proved successful at predicting system
stability by correctly predicting the point of instability for eight out of the nine
total combined 30S, Petraflex, and Corps Block installations.
• Performance testing at overtopping depth intervals smaller than 1.0 ft is
recommended to allow for lift coefficient determination with greater
precision.
9.3 RESEARCH RECOMMENDATIONS
The developed safety factor equation provides a tool for design and assessment of
ACB stability; however, as technology evolves and environmental conditions change, the
applicability of the design method should be reevaluated. Several areas of further related
research have been identified from this study. Although the database used for evaluating
the safety factor equations included multiple blocks and varying hydraulic conditions, a
more detailed database could provide further advancements in the moment stability
analysis assessment. Specifically, the addition of more channelized performance data
would improve the existing database.
Furthermore, lift coefficient extrapolations based on varying block thicknesses,
block footprints, and block weights should be further researched. Theoretical
extrapolations could be developed similar to the extrapolations presented in NCMA

173
(2006). However, considering the context of the lift coefficient within the safety factor
equation, developed extrapolations should be verified using test data.
Another area of recommended research is evaluating the sensitivity of ACB
system performance to varying underlying filter layers. Filter layers can be composed of
geotextile, graded granular media, or both. Effects of varying filter designs are not
addressed in current literature.
Finally, further research is recommended on the hydraulic evaluation of
overtopping data. Multiple ACB tests have been conducted and reported shear-stress
values were observed to vary more than 200% dependent upon the overtopping flow
depth and analysis method. Research providing “typical” shear-stress values for a range
of embankment lengths, Manning’s roughnesses, and overtopping flow depth would
prove invaluable for engineers interpreting reported performance data.

174
Abt, S.R., Leech, J.R., Thornton, C.I., Lipscomb, C.M. (2001). Articulated Concrete
Block Stability Testing. Journal of the American Water Resources Association,
37(1):27-34, February.
ASTM D698 (2007). Standard Test Methods for Laboratory Compaction Characteristics
of Soil Using Standard Effort (12 400 ft-lbf/ft3 (600 kN-m/m
3)).
ASTM D7276 (2008). Guide for Analysis and Interpretation of Test Data for
Articulating Concrete Block (ACB) Revetment Systems in Open Channel Flow.
ASTM D7277 (2008). Test Method for Performance Testing of Articulating Concrete
Block (ACB) Revetment Systems for Hydraulics Stability in Open Channel Flow.
Clopper, P.E., Chen, Y.H. (1988). Minimizing Embankment Damage During
Overtopping Flow. FHWA Report No. FHWA-RD-88-181.
Clopper, P.E. (1989). Hydraulic Stability of Articulated Concrete Block Revetment
Systems during Overtopping Flow. FHWA Report No. FHWA-RD-89-199.
Clopper, P.E. (1991). Protecting Embankment Dams with Concrete Block Systems.
Hydro Review, X(2), April.
Gessler, J. (1971). Critical Shear Stress for Sediment Mixtures. Trans. XIV Congress
IAHR, Paris, Vol. III.
Harris County Flood Control District (HCFCD) (2001). Design manual for Articulating
Concrete Block Systems. September, 66 p.
REFERENCES

175
Hewlett, H.W.M., Borman, L.A., Bramley, M.E. (1987). Design of Reinforced Grass
Waterways. Construction Industry Research and Information Association,
Report 116, London, UK.
Julien, P.Y. (1998). Erosion and Sedimentation. Cambridge University Press,
Cambridge, UK.
Julien, P.Y., Anthony, D.J. (2002). Bed Load Motion and Grain Sorting in a
Meandering Stream. Journal of Hydraulic Research, 40(2):125-134.
Leech, J.R., Abt, S.R., Thornton, C.I., Lipscomb, C.M. (1999a). Development of a
Circular Shaped, Articulated Concrete Block and Uniform Testing Procedures for
Articulated Concrete Blocks. Draft Technical Report, U.S. Army Engineer
Waterways Experiment Station, Vicksburg, Mississippi.
Leech, J.R., Abt, S.R., Thornton, C.I., Combs, P.G. (1999b). Developing Confidence in
Concrete Revetment Products for Bank Stabilization. Journal of the American
Water Resources Association, 35(4):877-885, August.
Meyer-Peter, E., Müller, R. (1948). Formulas for Bed-load Transport. Proceedings of
3rd
Meeting IAHR, Stockholm, pp. 39-64.
National Concrete Masonry Association (NCMA) (2006). Design Manual for
Articulating Concrete Block (ACB) Revetment Systems. 76 p.
Robeson, M.D., Thornton, C.I., Lipscomb, C.M. (2002). Articulated Concrete Block
Data Report. Colorado State University Report submitted to Armortec Erosion
Control Solutions, January.

176
Stevens, M.A., Simons, D.B. (1971). Stability Analyses for Coarse Granular Material on
Slopes. In: Vol. 1, Chapter A, River Hydraulics, H.W. Shen (Ed.), Water
Resources Publications, Littleton, Colorado.
Wilcox, D.C. (2000). Basic Fluid Mechanics. Second Edition, DWC Industries, Inc., La
Canada, CA.

177
APPENDIX A
HYDRAULIC DATA FROM CLOPPER AND CHEN (1988)

178
Table A.1: Available Data for FHWA Petraflex Testing (Clopper and Chen, 1988)

179
Table A.2: Available Velocity Data for FHWA Petraflex Testing (Clopper and
Chen, 1988)

180
Figure A.1: FHWA Petraflex 4.0-ft Overtopping Water-surface Profile (Clopper
and Chen, 1988)

181
Table A.3: FHWA 30S 1.0-ft Overtopping Data (Clopper and Chen, 1988)

182
Table A.4 (continued): FHWA 30S 1.0-ft Overtopping Data (Clopper and Chen,
1988)

183
Table A.5 (continued): FHWA 30S 1.0-ft Overtopping Data (Clopper and Chen,
1988)

184
Table A.6 (continued): FHWA 30S 1.0-ft Overtopping Data (Clopper and Chen,
1988)

185
Table A.7 (continued): FHWA 30S 1.0-ft Overtopping Data (Clopper and Chen,
1988)
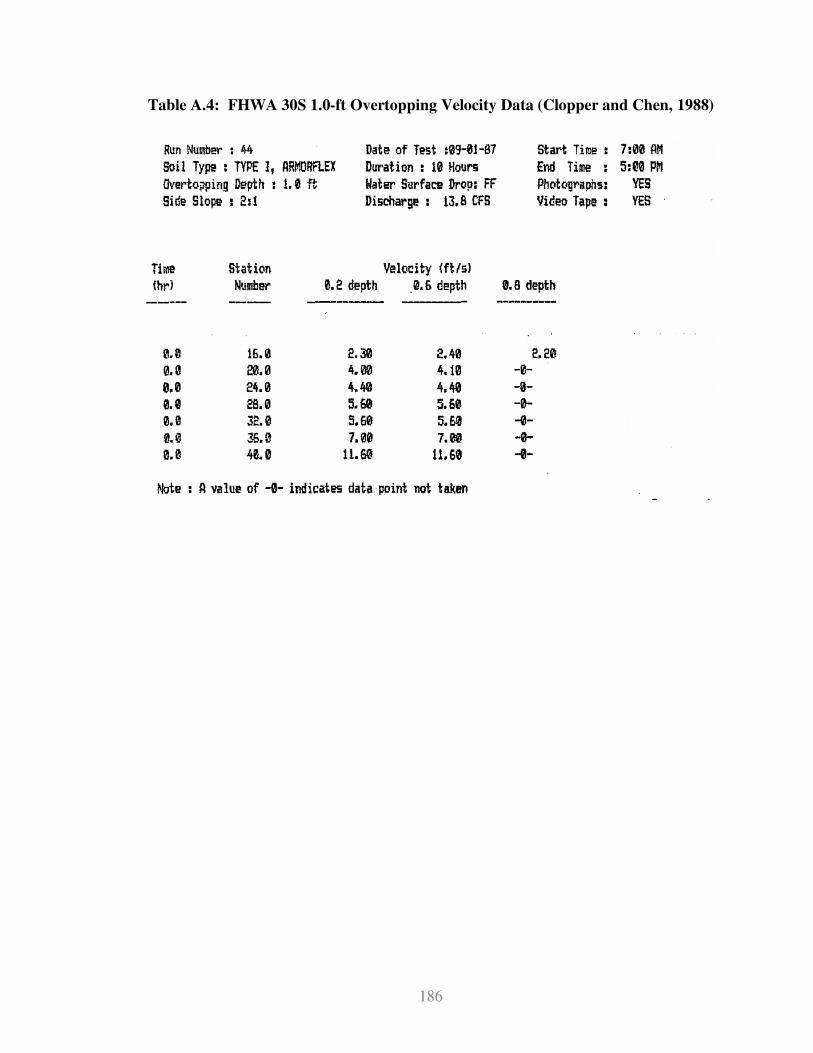
186
Table A.4: FHWA 30S 1.0-ft Overtopping Velocity Data (Clopper and Chen, 1988)

187
Figure A.2: FHWA 30S 1.0-ft Overtopping Water-surface Profile (Clopper and Chen, 1988)

188
Table A.5: FHWA 30S 2.0-ft Overtopping Data (Clopper and Chen, 1988)

189
Table A.5 (continued): FHWA 30S 2.0-ft Overtopping Data (Clopper and Chen,
1988)

190
Table A.5 (continued): FHWA 30S 2.0-ft Overtopping Data (Clopper and Chen,
1988)

191
Table A.5 (continued): FHWA 30S 2.0-ft Overtopping Data (Clopper and Chen,
1988)

192
Table A.5 (continued): FHWA 30S 2.0-ft Overtopping Data (Clopper and Chen,
1988)

193
Table A.6: FHWA 30S 2.0-ft Overtopping Velocity Data (Clopper and Chen, 1988)

194
Table A.6 (continued): FHWA 30S 2.0-ft Overtopping Velocity Data (Clopper and
Chen, 1988)

195
Table A.6 (continued): FHWA 30S 2.0-ft Overtopping Velocity Data (Clopper and
Chen, 1988)

196
Figure A.3: FHWA 30S 2.0-ft Overtopping Water-surface Profile (Clopper and Chen, 1988)

197
Table A.7: FHWA 30S 4.0-ft Overtopping Data (Clopper and Chen, 1988)

198
Table A.7 (continued): FHWA 30S 4.0-ft Overtopping Data (Clopper and Chen,
1988)
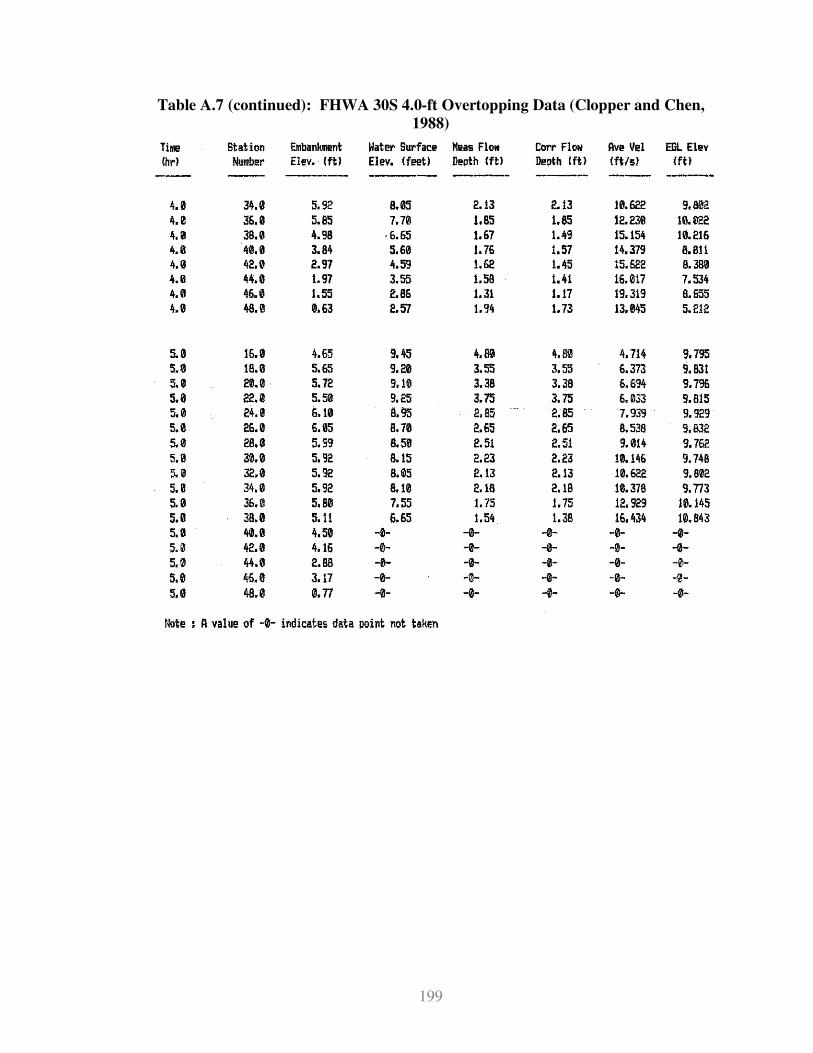
199
Table A.7 (continued): FHWA 30S 4.0-ft Overtopping Data (Clopper and Chen,
1988)

200
Table A.8: FHWA 30S 4.0-ft Overtopping Velocity Data (Clopper and Chen, 1988)
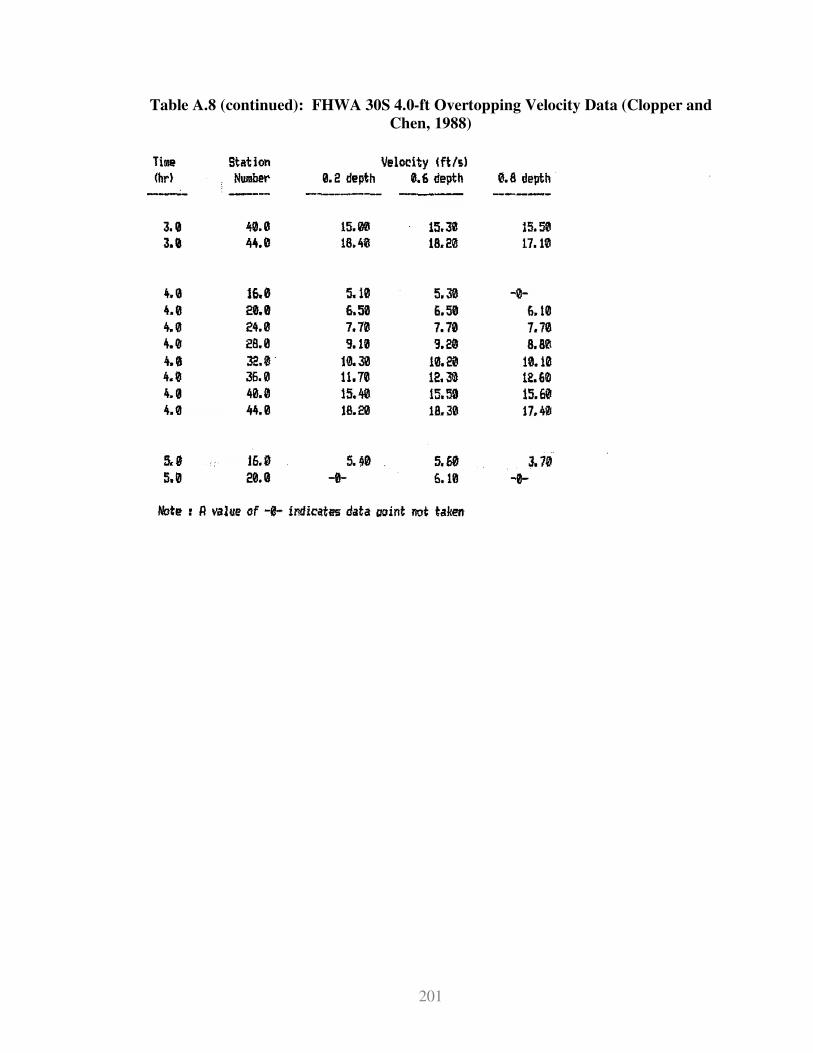
201
Table A.8 (continued): FHWA 30S 4.0-ft Overtopping Velocity Data (Clopper and
Chen, 1988)

202
Figure A.4: FHWA 30S 4.0-ft Overtopping Water-surface Profile (Clopper and Chen, 1988)

203
Table A.9: FHWA 30S 96-cfs Overtopping Data (Clopper and Chen, 1988)

204
Table A.10: FHWA 30S 96-cfs Overtopping Velocity Data (Clopper and Chen,
1988)

205
Figure A.5: FHWA 30S 96-cfs Overtopping Water-surface Profile (Clopper and Chen, 1988)

206
APPENDIX B
ACB BLOCK DIMENSIONS AND PHYSICAL PROPERTIES

207
Figure B.1: 30S Block Dimensions and Physical Properties

208
Figure B.2: Petraflex Block Dimensions and Physical Properties

209
Figure B.3: Corps Block Dimensions and Physical Properties

210
APPENDIX C
HYDRAULIC DATA FOR CSU TESTING
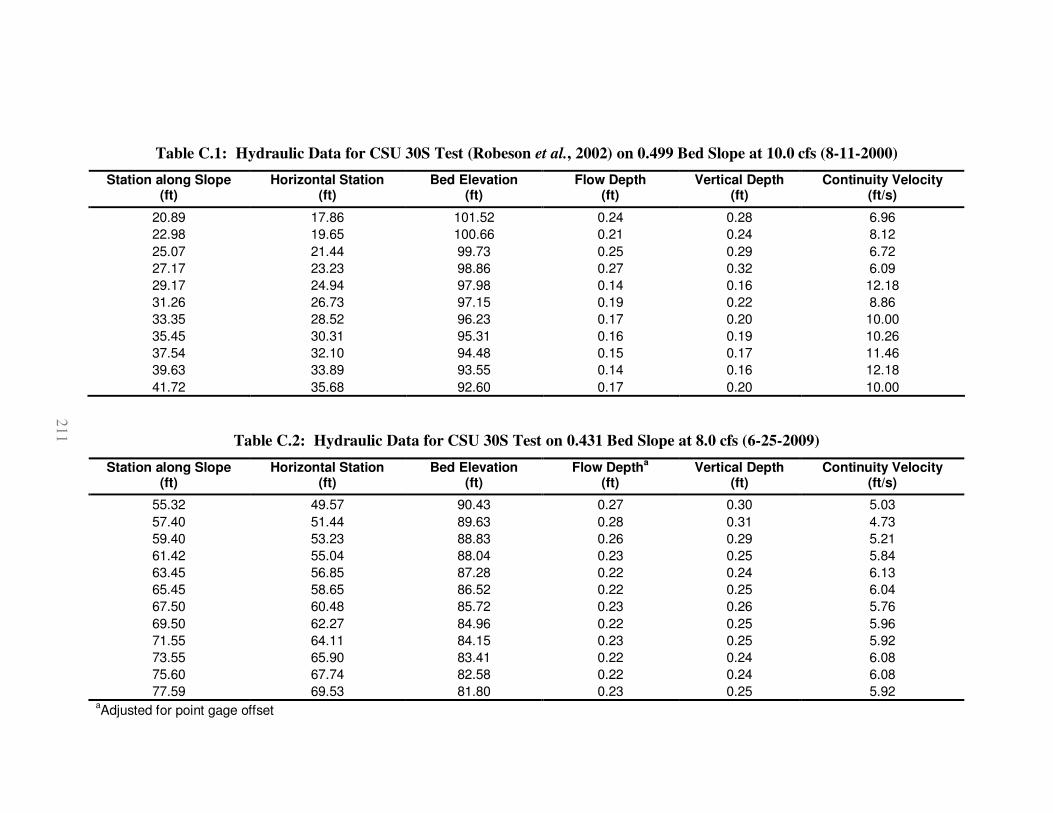
211
Table C.1: Hydraulic Data for CSU 30S Test (Robeson et al., 2002) on 0.499 Bed Slope at 10.0 cfs (8-11-2000)
Station along Slope (ft)
Horizontal Station (ft)
Bed Elevation (ft)
Flow Depth (ft)
Vertical Depth (ft)
Continuity Velocity (ft/s)
20.89 17.86 101.52 0.24 0.28 6.96
22.98 19.65 100.66 0.21 0.24 8.12
25.07 21.44 99.73 0.25 0.29 6.72
27.17 23.23 98.86 0.27 0.32 6.09
29.17 24.94 97.98 0.14 0.16 12.18
31.26 26.73 97.15 0.19 0.22 8.86
33.35 28.52 96.23 0.17 0.20 10.00
35.45 30.31 95.31 0.16 0.19 10.26
37.54 32.10 94.48 0.15 0.17 11.46
39.63 33.89 93.55 0.14 0.16 12.18
41.72 35.68 92.60 0.17 0.20 10.00
Table C.2: Hydraulic Data for CSU 30S Test on 0.431 Bed Slope at 8.0 cfs (6-25-2009)
Station along Slope (ft)
Horizontal Station (ft)
Bed Elevation (ft)
Flow Deptha
(ft) Vertical Depth
(ft) Continuity Velocity
(ft/s)
55.32 49.57 90.43 0.27 0.30 5.03
57.40 51.44 89.63 0.28 0.31 4.73
59.40 53.23 88.83 0.26 0.29 5.21
61.42 55.04 88.04 0.23 0.25 5.84
63.45 56.85 87.28 0.22 0.24 6.13
65.45 58.65 86.52 0.22 0.25 6.04
67.50 60.48 85.72 0.23 0.26 5.76
69.50 62.27 84.96 0.22 0.25 5.96
71.55 64.11 84.15 0.23 0.25 5.92
73.55 65.90 83.41 0.22 0.24 6.08
75.60 67.74 82.58 0.22 0.24 6.08
77.59 69.53 81.80 0.23 0.25 5.92 aAdjusted for point gage offset

212
Table C.3: Hydraulic Data for CSU 30S Test on 0.431 Bed Slope at 12.0 cfs (6-25-2009)
Station along Slope (ft)
Horizontal Station (ft)
Bed Elevation (ft)
Flow Deptha
(ft) Vertical Depth
(ft) Continuity Velocity
(ft/s)
55.32 49.57 90.44 0.24 0.27 5.51
57.40 51.44 89.64 0.19 0.22 6.90
59.40 53.23 88.84 0.20 0.23 6.57
61.42 55.04 88.05 0.18 0.20 7.26
63.45 56.85 87.29 0.20 0.23 6.57
65.45 58.65 86.53 0.20 0.23 6.57
67.50 60.48 85.72 0.20 0.23 6.57
69.50 62.27 84.97 0.19 0.22 6.90
71.55 64.11 84.15 0.19 0.22 6.90
73.55 65.90 83.42 0.20 0.23 6.57
75.60 67.74 82.59 0.19 0.22 6.90
77.59 69.53 81.81 0.21 0.24 6.26 aAdjusted for point gage offset

213
Table C.4: Hydraulic Data for CSU 30S Test on 0.230 Bed Slope at 10.0 cfs (6-14-2009)
Station along Slope (ft)
Horizontal Station (ft)
Bed Elevation (ft)
Flow Depth (ft)
Vertical Depth (ft)
Continuity Velocity (ft/s)
9.27 9.01 97.93 0.29 0.30 5.79
11.27 10.96 97.48 0.31 0.31 5.45
13.28 12.91 97.03 0.28 0.29 6.00
15.28 14.86 96.58 0.25 0.25 6.72
17.28 16.81 96.13 0.24 0.24 7.06
19.29 18.76 95.69 0.24 0.25 6.96
21.29 20.71 95.24 0.25 0.26 6.64
23.29 22.66 94.79 0.24 0.25 6.86
25.30 24.61 94.34 0.24 0.25 6.82
27.30 26.56 93.89 0.24 0.24 7.01
29.31 28.51 93.44 0.24 0.24 7.01
31.31 30.45 93.00 0.24 0.25 6.82
33.31 32.40 92.55 0.24 0.25 6.91
35.32 34.35 92.10 0.09 0.09 19.27

214
Table C.5: Hydraulic Data for CSU 30S Test on 0.230 Bed Slope at 20.0 cfs (6-15-2009)
Station along Slope (ft)
Horizontal Station (ft)
Bed Elevation (ft)
Flow Depth (ft)
Vertical Depth (ft)
Continuity Velocity (ft/s)
9.27 9.01 97.93 0.53 0.55 3.14
11.27 10.96 97.48 0.53 0.54 3.17
13.28 12.91 97.03 0.46 0.48 3.59
15.28 14.86 96.58 0.38 0.39 4.36
17.28 16.81 96.13 0.40 0.41 4.14
19.29 18.76 95.69 0.42 0.43 3.98
21.29 20.71 95.24 0.40 0.42 4.12
23.29 22.66 94.79 0.39 0.40 4.32
25.30 24.61 94.34 0.37 0.38 4.51
27.30 26.56 93.89 0.34 0.35 4.91
29.31 28.51 93.44 0.33 0.34 5.11
31.31 30.45 93.00 0.33 0.34 5.06
33.31 32.40 92.55 0.34 0.35 4.91
35.32 34.35 92.10 0.36 0.37 4.62

215
Table C.6: Hydraulic Data for CSU 30S Test on 0.230 Bed Slope at 30.0 cfs (6-15-2009)
Station along Slope (ft)
Horizontal Station (ft)
Bed Elevation (ft)
Flow Depth (ft)
Vertical Depth (ft)
Continuity Velocity (ft/s)
9.27 9.01 97.93 0.80 0.83 2.07
11.27 10.96 97.48 0.70 0.72 2.37
13.28 12.91 97.03 0.63 0.65 2.65
15.28 14.86 96.58 0.56 0.57 2.98
17.28 16.81 96.13 0.53 0.54 3.15
19.29 18.76 95.69 0.53 0.54 3.15
21.29 20.71 95.24 - - -
23.29 22.66 94.79 - - -
25.30 24.61 94.34 - - -
27.30 26.56 93.89 - - -
29.31 28.51 93.44 - - -
31.31 30.45 93.00 - - -
33.31 32.40 92.55 - - -
35.32 34.35 92.10 - - -

216
Table C.7: Hydraulic Data for CSU Petraflex Test (Robeson et al., 2002) on 0.501 Bed Slope at 10.0 cfs (8-21-2000)
Station along Slope (ft)
Horizontal Station (ft)
Bed Elevation (ft)
Flow Depth (ft)
Vertical Depth (ft)
Continuity Velocity (ft/s)
20.85 17.80 101.50 0.28 0.32 6.05
22.86 19.51 100.64 0.23 0.27 7.30
25.04 21.38 99.67 0.16 0.19 10.41
27.05 23.09 98.82 0.16 0.19 10.27
29.23 24.95 97.89 0.17 0.20 9.76
31.24 26.67 97.03 0.16 0.19 10.41
33.42 28.53 96.11 0.17 0.20 9.64
35.43 30.25 95.28 0.15 0.18 11.00
37.61 32.11 94.35 0.15 0.18 10.85
39.62 33.83 93.47 0.17 0.19 10.10
41.80 35.69 92.47 0.15 0.18 10.85
Table C.8: Hydraulic Data for CSU 30S Test (Robeson et al., 2002) on 0.501 Bed Slope at 28.4 cfs (8-21-2000)
Station along Slope (ft)
Horizontal Station (ft)
Bed Elevation (ft)
Flow Depth (ft)
Vertical Depth (ft)
Continuity Velocity (ft/s)
20.85 17.80 101.48 0.64 0.75 2.60
22.86 19.51 100.62 0.55 0.65 3.00
25.04 21.38 99.65 0.47 0.55 3.55
27.05 23.09 98.81 0.46 0.54 3.62
29.23 24.95 97.89 0.43 0.50 3.90
31.24 26.67 96.95 0.27 0.32 6.10
33.42 28.53 96.11 0.30 0.35 5.58
35.43 30.25 95.29 0.28 0.33 5.92
37.61 32.11 94.35 0.37 0.43 4.54
39.62 33.83 93.48 0.43 0.50 3.90
41.80 35.69 92.49 0.51 0.60 3.25