Disproving the CIRC-report: Cyclists’ Time Trial Performances in the Tour de France Flattened in...
18
1. Introduction Prompted by the International Cycling Union (UCI), the sport’s governing body, the executive committee of the Cycling Independent Reform Commission (CIRC) published its report on variables that led to the doping culture in pro- fessional road racing and the status of the doping problem in the sport today (Marty, Nicholson & Haas, 2015). e CIRC-report concluded that the use of red blood cell-aug- menting doping agents, such as erythropoietin (or epo) and blood transfusions, resulted in 10–15% improvements in cyclists’ performances in the so-called ‘epo era’. is most controversial period in professional cycling commenced in the late 1980s. It ended in 2001, when UCI executed the first (invalid) epo testing on cyclists’ urine samples collected in the Tour of Flanders, the famous, Belgian one-day clas- sic race. Marty et al. (2015) further stated that the cycling world rapidly adjusted to the more stringent anti-doping measures put into practice by the World Anti-Doping Agen- cy (WADA) between 2001–2007. However, because tests for autologous blood transfusions were not yet developed in this period and out of competition controls were still emerging, these measures did not acutely challenge the doping prob- Disproving the CIRC-report: Cyclists’ Time Trial Performances in the Tour de France Flattened in the Epo Era and Improved in the 2010s Hein F. M. Lodewijkx Faculty of Psychology and Educational Sciences Open University of the Netherlands Heerlen, the Netherlands Corresponding author: [email protected]; [email protected] Abstract e 2015 report of the Cycling Independent Reform Commission (CIRC) contends that cyclists’ use of epo doping resulted in 10–15% performance gains in the epo era (late 1980s–2001), suggesting that performances delivered in cycling races in these years will be superior to preceding years (the SPA, or superior performances assumption). Due to progressively stricter anti-doping testing in the 2000–2010s, the report further states that riders’ performances in this period decreased relative to the epo years (the DPA, or decline in performances assumption). We examined both assumptions by subjecting winning riders’ mean km/h performances, realized in time trials on flat and rolling courses in the Tour de France (1934– 2013), to time-series analyses (ARIMA). We additionally assessed annual progress rates in performance (%) by computing differences in riders’ mean km/h per year. ARIMA explained R 2 = 0.996 of the variation in the rates. Cyclical performance sequences (partial ρlag 2= -0.87, p ≤ 0.001) indicated that decisions of the Tour organizers to regularly alternate the lengths of the trials accounted for differences in riders’ achievements. As a single variable, competition year explained 92% (r = 0.96) in these differences with an annual growth of 0.45% (p ≤ 0.01). Larger distances weakly and negatively influenced riders’ progress in performance, b = -2% (p = 0.08). e epo vs. non-epo years yielded no significant growth differences, b = 0.10% (p = 0.74), while the progress in the 2000–2010s did not decline compared to the foregoing years, b = 0% (p = 0.93). Strongly contradicting the CIRC-report, the rapid growth in performance did not start in the 1990s, but in the 1980s. A significant quadratic relationship (R 2 = 0.50, p ≤ 0.05) further revealed a reversal of the SPA and DPA: Riders’ progress in performance flattened aſter the mid–1990s and improved again in the 2010s. Speculatively, findings suggest that the use of epo doping might have blocked riders’ performances. is would explain why riders’ time trial feats tend to improve in the 2010s, that is, aſter the introduction and subsequent successful deterrent effect of the Athlete Biological Passport (ABP) in professional road racing. Keywords: Doping; Performance enhancement; Professional cycling; Time trials lem in cycling. is changed in 2008, when UCI introduced the Athlete Biological Passport (ABP), which, among others, scrutinizes longitudinal changes in bio-markers of athletes’ blood profiles. Consequently, the epo-induced 10–15% per- formance gains gradually became a “thing of the past” (ibid., p. 56-57). e report further suggested that, owing to the progressively stricter anti-doping policy, riders’ performanc- es gradually declined in the 2000s and 2010s compared to the epo era. From these conclusions two assumptions can be derived that will be examined in this contribution. When consider- ing the proposed, potent epo-induced performance gains, it is obvious to expect that accomplishments achieved by rid- ers in actual competitions in the epo era will be superior to performances realized by cyclists in foregoing years (the su- perior performances assumption, or SPA). Given the strict- er anti-doping testing executed in the cycling world in the 2000s and the efficacious, deterrent function of the ABP, a downturn in cyclists’ performances in these years can also be expected (the decline in performances assumption, or DPA). However, archival studies (El Helou, Berthelot, ibaut, Tafflet, Massif, Campion et al., 2010; Lodewijkx, 2014, 2015; Lippi, Matiuzzi & Sanchis–Gomar, 2014; Perneger, 2010;
Transcript of Disproving the CIRC-report: Cyclists’ Time Trial Performances in the Tour de France Flattened in...
1. Introduction
Prompted by the International Cycling Union (UCI), the sport’s governing body, the executive committee of the Cycling Independent Reform Commission (CIRC) published its report on variables that led to the doping culture in pro-fessional road racing and the status of the doping problem in the sport today (Marty, Nicholson & Haas, 2015). The CIRC-report concluded that the use of red blood cell-aug-menting doping agents, such as erythropoietin (or epo) and blood transfusions, resulted in 10–15% improvements in cyclists’ performances in the so-called ‘epo era’. This most controversial period in professional cycling commenced in the late 1980s. It ended in 2001, when UCI executed the first (invalid) epo testing on cyclists’ urine samples collected in the Tour of Flanders, the famous, Belgian one-day clas-sic race. Marty et al. (2015) further stated that the cycling world rapidly adjusted to the more stringent anti-doping measures put into practice by the World Anti-Doping Agen-cy (WADA) between 2001–2007. However, because tests for autologous blood transfusions were not yet developed in this period and out of competition controls were still emerging, these measures did not acutely challenge the doping prob-
Disproving the CIRC-report: Cyclists’ Time Trial Performances in the Tour de France Flattened in the Epo Era and Improved in the 2010s
Hein F. M. Lodewijkx
Faculty of Psychology and Educational SciencesOpen University of the Netherlands
Heerlen, the Netherlands
Corresponding author: [email protected]; [email protected]
Abstract
The 2015 report of the Cycling Independent Reform Commission (CIRC) contends that cyclists’ use of epo doping resulted in 10–15% performance gains in the epo era (late 1980s–2001), suggesting that performances delivered in cycling races in these years will be superior to preceding years (the SPA, or superior performances assumption). Due to progressively stricter anti-doping testing in the 2000–2010s, the report further states that riders’ performances in this period decreased relative to the epo years (the DPA, or decline in performances assumption). We examined both assumptions by subjecting winning riders’ mean km/h performances, realized in time trials on flat and rolling courses in the Tour de France (1934–2013), to time-series analyses (ARIMA). We additionally assessed annual progress rates in performance (%) by computing differences in riders’ mean km/h per year. ARIMA explained R2 = 0.996 of the variation in the rates. Cyclical performance sequences (partial ρlag 2= -0.87, p ≤ 0.001) indicated that decisions of the Tour organizers to regularly alternate the lengths of the trials accounted for differences in riders’ achievements. As a single variable, competition year explained 92% (r = 0.96) in these differences with an annual growth of 0.45% (p ≤ 0.01). Larger distances weakly and negatively influenced riders’ progress in performance, b = -2% (p = 0.08). The epo vs. non-epo years yielded no significant growth differences, b = 0.10% (p = 0.74), while the progress in the 2000–2010s did not decline compared to the foregoing years, b = 0% (p = 0.93). Strongly contradicting the CIRC-report, the rapid growth in performance did not start in the 1990s, but in the 1980s. A significant quadratic relationship (R2 = 0.50, p ≤ 0.05) further revealed a reversal of the SPA and DPA: Riders’ progress in performance flattened after the mid–1990s and improved again in the 2010s. Speculatively, findings suggest that the use of epo doping might have blocked riders’ performances. This would explain why riders’ time trial feats tend to improve in the 2010s, that is, after the introduction and subsequent successful deterrent effect of the Athlete Biological Passport (ABP)in professional road racing.
Keywords: Doping; Performance enhancement; Professional cycling; Time trials
lem in cycling. This changed in 2008, when UCI introduced the Athlete Biological Passport (ABP), which, among others, scrutinizes longitudinal changes in bio-markers of athletes’ blood profiles. Consequently, the epo-induced 10–15% per-formance gains gradually became a “thing of the past” (ibid., p. 56-57). The report further suggested that, owing to theprogressively stricter anti-doping policy, riders’ performanc-es gradually declined in the 2000s and 2010s compared to the epo era.
From these conclusions two assumptions can be derived that will be examined in this contribution. When consider-ing the proposed, potent epo-induced performance gains, it is obvious to expect that accomplishments achieved by rid-ers in actual competitions in the epo era will be superior to performances realized by cyclists in foregoing years (the su-perior performances assumption, or SPA). Given the strict-er anti-doping testing executed in the cycling world in the 2000s and the efficacious, deterrent function of the ABP, a downturn in cyclists’ performances in these years can also be expected (the decline in performances assumption, or DPA).
However, archival studies (El Helou, Berthelot, Thibaut, Tafflet, Massif, Campion et al., 2010; Lodewijkx, 2014, 2015; Lippi, Matiuzzi & Sanchis–Gomar, 2014; Perneger, 2010;
VanBreda, Benders & Kuipers, 2013) which all examined de-velopments in professional cyclists’ accomplishments in the epo years and beyond, yielded indecisive findings concern-ing the two assumptions. As will be argued, studies report-ing findings in support of the SPA and / or DPA are weakly designed. To illustrate and corroborate our comments, we subjected winning riders’ performances, realized in time tri-als on flat and rolling courses in the Tour de France from 1934 to 2013, to time-series analyses. Contradicting the CIRC-report, results yielded a reversal of the SPA and DPA. The rapid progress in performance in the Tour did not evolve in the 1990s, but rather in the 1980s, and riders’ progress in performance flattened after the mid–1990s and improved again in the 2010s.
Below, we will first elucidate our methodological critique on the archival studies after which we shall summarize main results of our own research. We will than present reasons as to why time-series analyses are more appropriate to statisti-cally appraise the rate of progress in cyclists’ performances over the years compared to regression and related analyses. This will be followed by a presentation and discussion of re-sults of the time-series analyses we conducted.
2. Previous archival research
El Helou and co-workers (2010) studied mean kilometers per hour (km/h) performances of riders who achieved the first ten places in the final standings of eleven European rac-es from 1892 to 2008, which included all renowned, one-day classic races such as Paris-Roubaix, as well as the three major European tours, i.e., the Tour de France, Giro d’Itiala, and Vuelta a España. They reported that cyclists’ performances increased with 6.38% in the epo years (1993–2008) relative to the pre-epo years (1946–1992). Note that these findings are inconsistent with the DPA, since the researchers did not ob-serve a decline in performance in the 2000s. Perneger (2010) investigated mean km/h performances of the fifth-ranking riders in the general classifications of the three major stage races in the period 1990–2009. He found that, between 1990 and 2004, riders’ speed increased with 0.16 km/h per year, but observed a decrease of 0.22 km/h per year since 2004. However, again his findings do not agree with observations of El Helou and colleagues and they were also far from con-clusive. The trend he reported was strongest for the Vuelta, modest for the Tour, and absent in the Giro. Consistent with Marty et al. (2015), Perneger attributed the rise in speed to illicit doping practices and the decline since 2004 to success-es of the more stringent measures implemented by WADA and UCI. In disagreement with El Helou et al. and Perneger, however, Lippi and colleagues (2014) reported that winning riders’ ultimate km/h performances in the three Grand Tours did not in- or decline, but rather, flattened between 2001 and 2013. In line with Perneger though, they also concluded that this could be the consequence of the sterner anti-doping testing executed in the last 15 years. Last, VanBreda et al. (2013) analyzed all individual time trials longer than 15 km in the Tour de France since 2000. They argue that time trial performances are nearly perfectly and linearly related to rid-ers’ maximal oxygen uptake (VO2max) and the correspond-ing power output (W). Therefore, they assessed time differ-ences between the first-, second-, and fiftieth-ranking riders in the trials and compared their results to data relating to the
proposed ergogenic effects of epo, reported by Heuberger et al. (2012). In strong disagreement with conclusions drawn by Perneger, Lippi et al., and the CIRC-report, they main-tain that the (assumed) illicit use of epo doping conceivably could still have led to performance enhancement in the trials since 2000. Yet, the study did not distinguish between riders who were, or were not, involved in doping practices in these years, a variable which is essential to draw valid conclusions. Besides, similar time differences realized by riders in, for ex-ample, the 1970s or 1980s would falsify their conclusion. It is also imaginable that not the winners, but rather the sec-ond- and fiftieth-ranking riders resorted to pharmacological support to boost their performances.
2.1. Comments
Unmistakably, the studies offer conflicting results and contradictory conclusions concerning the SPA and DPA. The reasons can be sought in various methodological and / or statistical issues: They used incorrect dependent variables, were weakly designed, and built upon restricted ranges of observations.
The studies either utilized mean km/h performances (El Helou et al., 2010; Lippi et al., 2014; Perneger, 2010) or time performances (VanBreda et al., 2013) as the single variable to evaluate developments in riders’ performances over the years. They did not use alternative measures to appraise these advances, as we did in our research. We assessed, for instance, the annual rate of progress in riders’ accomplish-ments (Lodewijkx, 2014) or appraised riders’ W/kg, that is, the ratio between cyclists’ power output expressed in watts (W) and their body mass in kg (Lodewijkx, 2015). As will be delineated below, the use of these alternative measures results in different conclusions concerning these develop-ments. Furthermore, none of the studies adequately includ-ed confounding variables in their design. In all our archival studies we took account of several of these confounders, such as the distances of the races, to control for their influence on riders’ accomplishments. Again, the lack or inadequate use of control variables may lead to misrepresentations concern-ing riders’ development in performance in the epo era and the years thereafter. What is more, three studies examined riders’ final km/h performances (El Helou et al., 2010; Lippi et al., 2014; Perneger, 2010), while one study (VanBreda et al., 2013) examined time trial performances. As proposed by Perneger (2010) and Lodewijkx (2014), selecting final performances as the measure to assess developments in rid-ers’ achievements over the years is invalid, because the very same performances are the result of joint and coordinated labors of the total group of riders participating in the three-week, multi-stage cycling races. Accordingly, these group efforts can be considered contaminating variables which may strongly hinder a valid evaluation of individual riders’ final km/h performances. As suggested by VanBreda et al. (2013; Lodewijkx, 2014; Lodewijkx & Bos, 2014; Lodewijkx & Verboon, 2013, 2014) time trial performances demand the utmost of individual riders’ stamina and aerobic exercise ca-pacity. Consequently, achievements in these individual races against the clock are better suited to identify developments in riders’ sportive feats over the years than final stage-race performances. Last, the studies conducted by Perneger and VanBreda et al. examined limited ranges of observations, i.e.,
H. F. M. Lodewijkx Disproving the CIRC-report 2
the 1990–2004 and 2000–2013 periods, respectively. In our studies, we scrutinized all stage race and time trial wins in the three Grand Tours from the inception of the races up to 2011 / 2013. This enabled us, first, to evaluate the evolution in riders’ performances with advancing years and, second, to statistically assess performance differences between riders in the epo era vs. directly bordering periods, such as the 1980s and the 2000s. Aforesaid studies do not allow, or did not ex-amine such indispensable comparisons and, once again, this may result in biased conclusions concerning riders’ rate of progress in the epo era and the years beyond.
3. Our own research
We evaluated, among others, the growth in winning rid-ers’ mean km/h and time achievements in stage races and time trials by appraising the progress rates (%) in their per-formances per year. Analyses yielded virtually identical re-sult on both performance measures. So, the presentation of main findings of the studies will be restricted to km/h per-formances. Considering stage races, findings revealed that the winners increased their speed with approximately 52% in about 100 years (0.52% per year), i.e., from the 1900s to the 2010s excluding the years of the two world wars. How-ever, regarding the SPA, findings showed that the progress rate in the epo era was consistent with the rate observed in all other time periods (1903–2011). As regards achievements in time trials on flat and rolling courses from 1933 to 2013 (Mkmh = 0.42% per year, SD = ±6.46%) findings substantiat-ed results of the stage races. The growth in speed in the epo years did not differ significantly from the growth observed in the 1980s and 2000s. Furthermore, the advancement in the epo era was no exception to the overall, historic variability in speed progress in time trials observed in the three ma-jor tours. Accordingly, all these observations imply that the variability in riders’ progress in performance in stage races and time trials in the epo era is strongly consistent with the variability observed over the years, thereby invalidating the SPA.
The studies also did not support the DPA. Rather than a downturn or flattening in speed in the 2000s and beyond, results revealed a linear growth from the early years of the races up to the present era in both stage races and time tri-als. None of riders’ achievements in the epo years proved to be outliers. What is more, Lodewijkx (2014) argued that the findings of his research agreed with results of two meta–analyses of epo studies (Heuberger et al., 2012; Lodewijkx, Brouwer, Kuipers & Van Hezewijk, 2013) from which the authors concluded that the performance-enhancing effects of red blood cell-augmenting doping agents (i.e., epo and blood doping) on riders’ aerobic performances and associ-ated speeds realized in actual races are far from decisive and most probably are overrated.
3.1. Comments
However, critics could argue that all archival studies conducted up to now —indeed, including our own— are subject to several, major methodological flaws, thereby nulli-fying findings and conclusions relating to the SPA and DPA. To illustrate, all studies disregarded the variation in course altitudes in addition to improvements in road and race con-
ditions over time. Performances delivered by riders prior to the advent of clipless pedals in 1985 and aerobars in 1989 cannot be compared to performances achieved by riders in later years who raced with disk wheels and with advanced, aerodynamic bikes and equipment tested in wind tunnels (Glaskin, 2012). The most important weakness perhaps con-cerns the use of riders’ mean km/h and time performances and the associated growth rates as the criteria to evaluate the SPA and DPA. It can be argued that these measures are inad-equate to critically appraise riders’ achievements, since they do not assess individual riders’ aerobic fitness (VO2max) and the associated power output (W). The latter variables are commonly considered to reliably and validly estimate riders’ athletic efforts in actual cycling competitions (Faria, Park-er & Faria, 2005; Jeukendrup, Craig & Hawley, 2000; Lucia, Hoyos & Chicharro, 2001; Lucia, Earnest & Arribas, 2003).
To rebut these comments, we emphasize that VanBreda et al. (2013) unequivocally state that time performances re-alized in individual races against the clock do validly mea-sure riders’ aerobic fitness and power output. Moreover, Lodewijkx (2015) assessed riders’ performances using said valid measures in a cycling race in which the influence of confounders is restricted. The race concerns the mountain time trial up Col d’Èze, often the closing stage of the French seven-day stage race Paris-Nice. The course of the trial did not change from its inception in 1969 until the present day. As to the performance measure, we assessed the power out-put rate (W/kg) delivered by riders in this race uphill from 1969 to 2013 (N = 30). Results yielded trivial differences in W/kg between riders: Epo years M = 5.58 (SD = ±0.19) vs. pre-epo years M = 5.54 (SD = ±0.18), F < 1. This finding ei-ther suggests that we tend to overestimate achievements re-alized by riders in the epo era as well as the influence of aforesaid confounding variables on their accomplishments, or that we strongly underrate the athletic capacities of rid-ers who demonstrated their sportive feats before the epo era. Whatever the reason, given the soundness of the power out-put rate to evaluate individual riders’ climbing efforts over the years, findings of this study, once more, render the SPA doubtful.
4. Time series
Nearly all studies described above based their conclu-sions on regression and related analyses, which essentially examine deviations from the central tendency in the data, also known as the mean model. Compared to these analy-ses, time series offer an alternate approach to evaluate de-velopments in riders’ sportive achievements by examining autocorrelations. These self-correlations permit to estimate sequences or cyclical patterns in riders’ performances over the years and refer to the dependency in the series of ob-servations at different points in time, which are termed lags. Taking riders’ performances as an example, the lag 1 auto-correlation coefficient is similar to the autocorrelation be-tween performances delivered by riders at immediate neigh-boring points in time, say between 1990 and 1989 (ρYt, Yt-1). The lag 2 autocorrelation coefficient refers to the correlation between performances two years apart, e.g., between 1991 and 1989 (ρYt, Yt-2).
Tabachnick and Fidell (2001) describe three reasons why time-series analyses are more appropriate than regression
H. F. M. Lodewijkx Disproving the CIRC-report 3

and related analyses to examine successive series of obser-vations. First, they are more suitable in cases in which it is plausible to assume that the variables under study are in-deed subject to dependent, recurring patterns. If this is true, the assumption of independent errors of these variables is violated. When evaluating historic developments in riders’ achievements, the chances are strong that both features will apply to the variables that are commonly used to appraise these developments, that is, the distances of the races and the corresponding performances realized by riders in these rac-es. Accordingly, this may lead researchers to make Type I– errors. By disregarding the recurring patterns or by labeling them as ‘noise’ or error variance, they mistakenly conclude that a distinctive progress in performance is extant, while in reality this is not the case.
Second, time-series analyses further permit researchers to test effects of interventions. In our case two interventions apply. The first relates to the SPA and involves a comparison of performances of riders in the epo years vs. the non-epo years. Since El Helou et al. (2010) reported a significant in-crease in performance in 1993, we consider this year as the critical start-up of the epo era. As will be argued, this era ends in 2003. The second intervention concerns the DPA, which relates to performances demonstrated by riders in Perneger’s years vs. the preceding years. Perneger conclud-ed that performances of the fifth-ranking riders in the three Grand Tours declined since 2004. Therefore we chose 2004 as the starting point of this period that lasts until today.
Third, in all archival studies hitherto conducted a sound appraisal of the SPA and DPA may be hindered by strong-ly confounding interrelationships between three variables: (1) The years in which riders competed which measures the evolution in performance over time. (2) The distances of the races with which riders were confronted over the years. (3) Riders per sé who gave in to doping use, for example in the epo years, regarded as discrete cases. This means that, independent of the other two variables, the rider variable as such may impact performance. Thus, we are facing the problem how to disentangle the influence of these correlated sources of variation on performance. Time-series analyses resolve this problem, while regression and related analy-ses do not. In preceding sections, we already described the strong linear trends between competition year and winning riders’ achievements in time trials and stage races. In terms of time-series analysis, these trends are considered nonsta-tionary series. Contrariwise, stationary series are character-ized by a constant variance in consecutive observations that hover around a constant mean level. Series of observations can be made stationary in several ways. One way is to spec-ify sequences or cycles in the series, for example, via lagged autocorrelations. Another way is to apply the differencing method, which entails computing differences (or progress rates) between adjacent pairs of observations in the series. Differencing results in de-trending the data, meaning that extant linear trends are removed from the series. It also possible to apply both techniques to make series stationary. Considering the present thesis, time-series analysis thus en-ables us to statistically and independently assess and control for the influence of competition year, trial distances, and cy-clical patterns in these variables on riders’ performances per sé over time. In so doing, the status of the SPA and DPA can be examined in a more valid way.
5. Research questions
Previously, we contended that time trial performance are more sound to evaluate cyclists’ achievements over the years than ultimate, first-ranking performances in stage races. In the current study we therefore focused exclusively on the for-mer variable to re-address the validity of the SPA and DPA. To this end we subjected these performances, realized by riders in the Tour de France, to time-series analyses. Based on the arguments presented above in these analyses we will examine the influence of six discrete sources of variation that may account for differences in riders’ achievements: (1) The SPA; (2) the DPA; (3) competition year; (4) the distances of the time trials; (5) cyclical patterns in riders’ trial distances and performances over time; and, (6) riders per sé, that is, performance differences between individual riders as such that are not accounted for by the other sources of variation we presented.
6. Method
6.1. Design and sample
We retrieved first-ranking mean km/h and time perfor-mances delivered by riders in time trials in the Tour between 1934 and 2013 and the associated trial distances from the re-cords of Magnier, Picq, Debreilly, Zingoni, Haffreingue, and Bey (2014). Similar to previous research (Lodewijkx & Bos, 2014; Lodewijkx & Verboon, 2013, 2014) we excluded team time trials, mountain time trials (racing uphill) and pro-logues, because they are considered different sub-disciplines in cycling. The total number of time trials amounted to N = 129, but the number of trials varied per year. During WW II and its aftermath (1940-1946) no Tours were organized, in some years (e.g., in 1964 and 1969) three trials were pro-grammed, while in 1936 the race organizers did not schedule any trial. Hence, the series of distances and performances in the Tour show some gaps. Because the series are non-season-al, they did not need any seasonal adjustment.
6.2. Data transformation
Since the year in which riders competed constitutes the unit of analysis in the current study, we aggregated the tri-als per year. Owing to the gaps in the series, the aggregation resulted in N = 72 years to evaluate the research questions. It is good practice in time-series analysis to smooth and transform the variables under study by applying natural log-arithms. This allows one to interpret ensuing findings more easily in terms of percentage change, or progress rates. After the logarithmic transformation, we de-trended the data by applying first-order differencing. Again, the resultant find-ings can be interpreted as progress rates (∆%) in perfor-mances and distances per year.
6.3. Analyses
We first examined as to whether the series of observa-tions are characterized by linear trends and / or recurring patterns or whether they can be regarded stationary. There-fore we will present and discuss descriptive statistics of the variables we scrutinized. They can be seen in Table 1. Figure
H. F. M. Lodewijkx Disproving the CIRC-report 4

Tab
le 1
. Des
crip
tive
Stat
istic
s of D
evel
opm
ents
in R
ider
s’ D
istan
ces a
nd P
erfo
rman
ces i
n Ti
me
Tria
ls in
the
Tour
de
Fran
ce (1
934-
2013
, N=
72)
Obs
erve
d va
lues
N
atur
al lo
garit
hm (L
n)Fi
rst-o
rder
diff
eren
ce (L
n)
Var
iabl
esFi
rst
(193
4)La
st(2
013)
Tota
l pr
ogre
ss
Ave
rage
pr
ogre
ss
per y
ear
Firs
t(1
934)
Last
(201
3)
Tota
lpr
ogre
ss
(%)
Ave
rage
pr
ogre
sspe
r yea
r (∆
%)
95%
-CI
SDSE
Mea
n km
/h35
.51
51.8
816
.37
0.23
0***
3.57
3.95
380.
53**
*0.
29 -
0.78
1.04
0.12
Mea
n tim
e (s
econ
ds)
8687
2899
-578
8-8
1.53
9.07
7.97
-110
-1.5
5-3
.59
-0.5
08.
651.
03
Dist
ance
(km
)87
.66
40.6
4-4
7.02
-0.6
624.
473.
70-7
7-1
.08
-3.0
8 -0
.91
8.43
1.01
***
p≤
0.00
1 by
one
-sam
ple
t-tes
t
H. F. M. Lodewijkx Disproving the CIRC-report 5

AB
C
DE
F
Com
petit
ion
year
Figu
re 1
.Rel
atio
nshi
ps b
etw
een
com
petit
ion
year
and
ride
rs’ d
istan
ces a
nd p
erfo
rman
ces
in ti
me
trial
s in
the
Tour
de
Fran
ce, r
evea
ling
linea
r tre
nds a
nd c
yclic
al p
atte
rns.
Pane
l A, B
,and
C p
rese
nt u
ntra
nsfo
rmed
var
iabl
es, P
anel
D, E
, and
F th
e co
rres
pond
ing
annu
al p
rogr
ess r
ates
(%)o
f the
logg
ed a
nd d
iffer
ence
d va
riabl
es. V
ertic
al s
olid
lin
es in
dica
te th
e be
ginn
ing
of th
e ep
o er
a(1
993)
, hor
izon
tal b
roke
n lin
es th
e 95
%-c
onfid
ence
inte
rval
s(±2
SD).
-.2-.10.1.2.3% Change distance (Ln, first-order difference)
1933
1943
1953
1963
1973
1983
1993
2003
2013
3540455055Mean km/h
1933
1943
1953
1963
1973
1983
1993
2003
2013
-.020.02.04.06% Change mean km/h (Ln, first-order difference)
1933
1943
1953
1963
1973
1983
1993
2003
2013
200040006000800010000Mean time (seconds)
1933
1943
1953
1963
1973
1983
1993
2003
2013
Yf
ii
-.20.2.4% Change mean time (Ln, first-order difference)
1933
1943
1953
1963
1973
1983
1993
2003
2013
20406080100Distance trial (km)
1933
1943
1953
1963
1973
1983
1993
2003
2013
H. F. M. Lodewijkx Disproving the CIRC-report 6

1 (Panel A to F) shows the associated developments of the (transformed) variables over the years.
To identify recurring sequences in the data, the ACF-plots (Auto Correlation Function) and PACF-plots (Partial Auto Correlation Function) of the series should be inspect-ed. If the plots indeed suggest the existence of nonstationary cycles or trends in the data, this will inform us which steps we have to undertake to make the series stationary. These steps can be specified in the ARIMA (p, d, q) time-series model (Auto Regressive, Integrated, Moving Average model; Box & Jenkins, 1976; Tabachnick & Fidell, 2001) which addi-tionally allows to estimate the influence of the six sources of variation we distinguished. Specifics concerning the p, d, and q parameters will be outlined in the Results sections, because they depend on findings of the preliminary analyses.
In the final ARIMA model we specified, riders’ perfor-mances served as the dependent variables. To examine the SPA, we dummy-coded riders who performed in the epo years (= 1; 1993-2003) vs. the non-epo years (= 0; ≤ 1992 and ≥ 2004). As to the DPA, we dummy-coded riders who performed in Perneger’s years (= 1; 2004–2013) and com-pared these performances to performances realized by riders in preceding years (= 0).1 We additionally included compe-tition year, trial distances, and lagged autocorrelations of the variables as predictors in the equation. Last, the Ljung-Box Q statistic, produced by ARIMA, estimates differences in riders’ performances predicted by the variables in the model vs. the actual performances delivered by the riders. Because we controlled for the influence of other variables in the mod-el, this χ2-statistic thus evaluates the effect of riders per sé on the dependent variables. If the value of the statistic is not sig-nificant, all performance differences between riders as such are explained by the variables incorporated in the model. If it still is significant, unaccounted performance differences between riders are still present, which conceivably may be explained by their doping use. We examined research ques-tions using IBM-SPSS © (version 22, 2014).
7. Results
7.1. Stationary vs. nonstationary series
Panel A in Figure 1 presents the robust, linear relation-ship obtained between competition year and riders’ mean km/h performances, r(72) = 0.96 (p ≤ 0.001, R2 = 0.92). As can be seen in Table 1, riders’ speed grew with 16.37 km/h from 1934 to 2013. In natural logarithm units this rise amounts to 38%. Panel B and C in Figure 1 show the rela-tionships between competition year and riders’ mean time performances, r(72) = -0.54 (p ≤ 0.001, R2 = 0.29), and trial distances, r(72) = -0.35 (p ≤ 0.01, R2 = 0.12). Compared to km/h performances, these correlations are less strong. Table 1 further indicates that the distances of the trials declined with 47.02 km (-77%) and the same holds true for riders’ mean time performances, which grew faster with -5788 sec-onds (-110%). Furthermore, Panel B, C, E, and F in Figure 1 reveal nearly perfect relationships between trial distances and riders’ mean time performances: Untransformed vari-ables, r = 0.97 (p ≤ 0.001, R2 = 0.94,); logged and differenced variables, r = 0.99 (p ≤ 0.001, R2 = 0.98). The last column in Table 1 shows the findings of the de-trended, logged vari-ables, designating annual progress rates. Panel D, E and F of
Figure 1 present the relationships between competition year and the rates with 95%-confidence intervals. They lead to the following observations.
(1). None of the rates in riders’ distances and performanc-es in the epo years can be considered outliers (zs ≤ 1.31).
(2). We succeeded to remove the linear trends from the series of observations. The correlations with competition year are now much weaker (df = 71): Progress in km/h r = -0.29 (p ≤ 0.05, R2 = 0.084); in time r = 0.14 (p = 0.25, R2 = 0. 019), and in distance r = 0.10 (p = 0.40, R2 = 0.01).
(3.) Considering mean km/h performances, Table 1 shows that the analyses yielded a yearly increase of 0.203 km/h, which equals a significant progress of ∆ = 0.53% per year (p ≤ 0.001). As to mean time performances, riders raced -81.53 seconds faster per year, but the annual progress of ∆ = -1.55% is not significant (p = 0.14). The distances decreased with -0.662 km per year, which amounts to non-significant annual decline of ∆ = -1.08% (p = 0.28). The table and pan-els further reveal that the latter null results can be explained by the strong variation obtained on both variables (2SD = ±16.8–17.3%). This variability also explains the weaker cor-relations we found between both variables and competition year. To compare, the yearly rates in riders’ mean km/h per-formances vary between 2SD = ±2.08%.
(4). Panel D, E, and F further indicate the existence of recurring sequences in the rates. As to km/h performances, they center on 0% (indicating no progress), but with positive changes (indicating faster performances and thus progress) as well as negative changes (indicating slower performances or a decline in progress). Panel D additionally shows that, up to 1993, riders’ progress in km/h is superior compared to the preceding years. However, inconsistent with the SPA and DPA, after these years the rates decline and then hover around zero, revealing hardly any progress. In the 2010s, the rates improve again. The rates involving mean time perfor-mances and trial distances are the reversed mirror image of the rates in riders’ mean km/h, showing similar, cyclical pat-terns with faster mean time performances in the years after 1993. Yet, Panel F indicates that these faster rates are almost perfectly associated with a downturn in trial distances in the very same years (r = 0.99).
These findings lead us to conclude that an examination of our research questions using riders’ time performances as the criterion has no added value, because the variation in these performances is almost entirely determined by the dis-tances of the time trials (R2 = 0.98).2 In addition, the variables we analyzed show linear trends as well as recurring patterns over time. From this we can derive that the developments in riders’ distances and performances in the French time trials are nonstationary. This raises the question whether the ob-served, cyclical distance-performance relationships may ac-count for the better performances demonstrated by riders up to 1993 and the flattening in their performance in the years thereafter. The ARIMA (p, d, q) model permits to statistically evaluate this question.
7.2. Cyclical patterns
The p parameter in the model estimates the autocor-relations or cyclical patterns in the data. The d parameter presents the linear trend in the series and it is the same as differencing. In our case d = 1, because we applied first-or-
H. F. M. Lodewijkx Disproving the CIRC-report 7
ACF(ρ) PACF(ρ)
Lags
mea
n km
/hLa
gs d
istan
ce
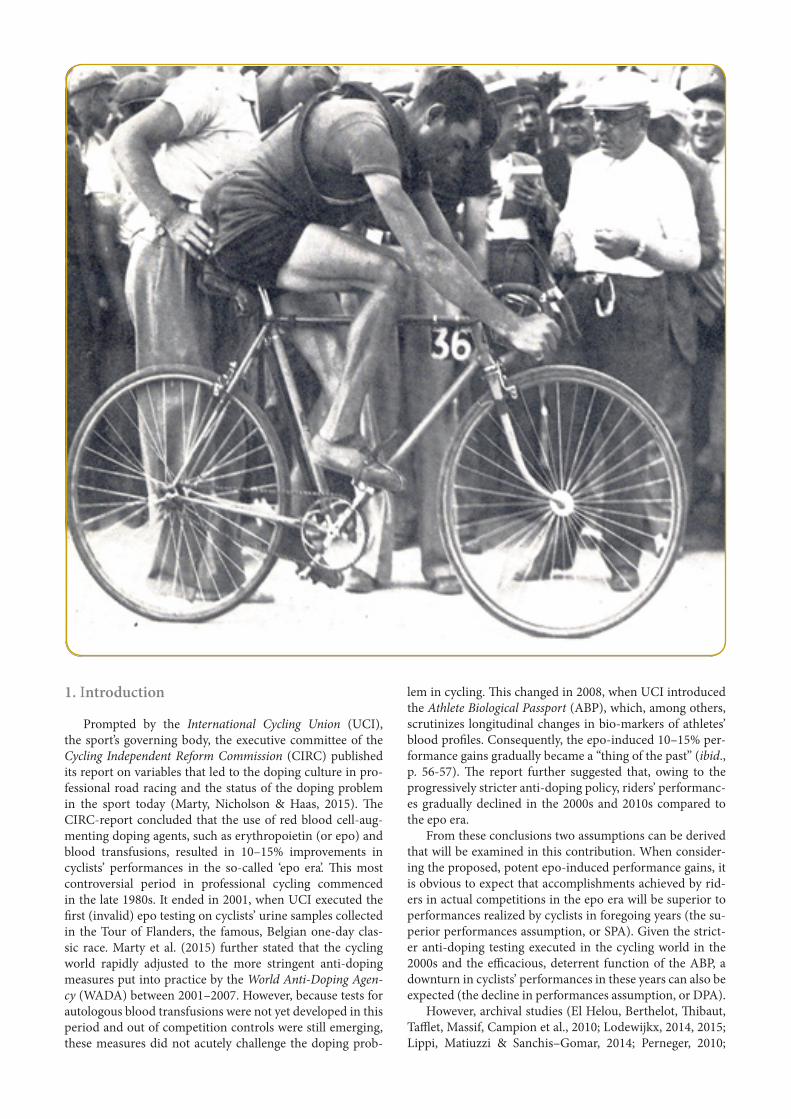
Figu
re 2
. AC
F an
d PA
CF
plot
s pre
sent
ing
lagg
ed a
utoc
orre
latio
ns o
f rid
ers’
dist
ance
s and
mea
n km
/h
perfo
rman
cesw
ith 9
5%-c
onfid
ence
inte
rval
s.
-0.40-0.200.000.200.400.60
010
2030
40L
-0.500.000.501.00
010
2030
40
-1.00-0.500.000.501.00 g_
010
2030
40
-1.00-0.500.000.501.00ata autocoeatos o og_
010
2030
40
H. F. M. Lodewijkx Disproving the CIRC-report 8

Table 2. Summary of Results of ARIMA-models
Models1 Variables Stationary R2 R2 Ljung-Box Q Estimate SE
A2Mean km/h 0.00 0.00 490.88 *** 45.40 *** 0.46
Trial distance 0.00 0.00 299.85 *** 53.15 *** 2.11
B2Mean km/h 0.00 0.00 475.93 *** 3.81 *** 0.01
Trial distance 0.00 0.00 362.75 *** 3.92 *** 0.04
C3Mean km/h 0.00 0.986 46.83 *** 0.53 *** 0.12
Trial distance 0.00 0.902 65.79 *** -1.08 1.01
D4
Mean km/h 0.544 0.994 19.89 1.70 1.10
ρ lag 1 - - - 0.95 *** 0.034
Trial distance 0.501 0.943 86.11 *** -2.10 2.80
ρ lag 1 - - - 0.78 *** 0.076
E4
Mean km/h 0.603 0.995 8.66 0.60 *** 0.20
ρ lag 2 - - - -0.89 *** 0.053
Trial distance 0.737 0.970 18.11 -1.10 1.00
ρ lag 2 - - - -0.78 *** 0.073
F4
Mean km/h 0.658 0.996 9.37 - -Epo vs. non-epo years (SPA)
- - - 0.10 0.20
Perneger’s vs. preceding years (DPA)
- - - 0.00 0.30
Competition year - - - 0.45 ** 0.20
Trial distance - - - -2.00 ‡ 1.10
ρ lag 2 - - - -0.87 *** 0.06
Notes:1 The specified models are: A. ARIMA (0, 0, 0): Untransformed variables. B. ARIMA (0, 0, 0): Natural logarithms. C. ARIMA (0, 1, 0): Natural logarithms, first-order difference. D. ARIMA (1, 1, 0): Natural logarithms, first-order difference, first-order autoregression (lag 1). E. ARIMA (2, 1, 0): Natural logarithms,first-order difference, second-order autoregression (lag 2). F. ARIMA (2, 1, 0): Natural logarithms, first-order difference, second-order autoregression (lag 2), four predictor variables.2 Estimates in Model A refer to observed mean km/h performances or mean distances of the trials in km. Model B presents the corresponding means in natural logarithm units. 3 Estimates of Model C are equivalent to average progress rates (∆%) presented in Table 1, last column.4 Estimates in Model C to Model F refer to average progress rates (∆%), except for the autocorrelations.
‡ p ≤ 0.10; ** p ≤ 0.01; *** p ≤ 0.001
H. F. M. Lodewijkx Disproving the CIRC-report 9

der differencing to de-trend the data. The q parameter es-timates moving averages and examines whether preceding (or lagged) residual performances are predictive of riders’ performances in later years. As already noted, inspection of ACF- and PACF-plots is necessary to estimate the values of the p and q parameters. Tabachnick and Fidell (2001) strong-ly recommend to only inspect the first two lags in the plots, because, generally, two lags are sufficient to identify cycles in the series of observations as a whole.
Figure 2 presents the plots produced for riders’ distanc-es and km/h performances. The ACF-plots show significant positive spikes beyond the bounds of the 95%-confidence interval at the first lag. The PACF-plots relate to patterns of autocorrelations in the series after partialing out the effect of autocorrelations at intervening lags. For instance, the plot may reveal the partial autocorrelation that remains between performances realized in 1989 and 1991 after controlling for the autocorrelation between 1989 and 1990. As can be seen in Figure 2, the PACF-plots show two significant spikes at the first two lags. The first spikes are positive and the second spikes are negative, revealing negative, partial autocorrela-tions between observations two lags apart. These findings designate that the two variables have an autoregressive signa-ture and that a p = 2 cycle should be included in the ARIMA model to estimate riders’ progress in km/h performance. Owing to the autoregressive pattern in the series, we set the moving average parameter to q = 0.
Taken together, the plots indeed offer evidence for sig-nificant, recurring distance-performance sequences in the series of observations. When considering the distances of the trials, the positive lag 1 autocorrelation means that the length of the trials riders had to tackle in immediate adjacent years did not differ a great deal. Yet, the negative partial lag 2 autocorrelation designates that the Tour organizers tended to adjust the distances of the trials in the third year. They ei-ther became larger or shorter, dependent upon the distances that were programmed two years before. From this we can derive that this recurring pattern might partially explain rid-ers’ progress in performance over time, including the prog-ress realized by riders up to 1993. This inference will be put to the test in the different ARIMA models we specified, the findings of which can be found in Table 2.
7.3. ARIMA models
In Model A we started with an unspecified ARIMA (0, 0, 0) model, using the untransformed variables as the de-pendent variables. In Model B, C, D, and E we consecutively scrutinized transformed variables and autocorrelations. We ended our analyses with Model F. This concerns a fully spec-ified ARIMA (p = 2, d = 1, q = 0) model, in which we addi-tionally tested the influence of all the sources of variation we discerned on riders’ progress in performance.
Going from Model A to Model F, Table 2 shows that the R2stationary increases from 0.00 to 0.658, while the amounts of variation explained by the variables in the models rise from R2 = 0.00 to R2 = 0.996. For Models A to C, the values of the Ljung-Box Q statistic are all significant. However, as could be expected on the basis of the ACF- and PACF-plots, they gradually reach non-significance in later models. In Model E, in which we included the cycle of the lag 2 autocorrela-tions, the Q statistic is not significant anymore (ps ≥ 0.23).
This is also true for Model F. Accordingly, consistent with arguments put forward above, the ARIMA (2, 1, 0) parame-ters we specified in Model E and F indeed appear to validly predict the differences and recurring patterns in riders’ prog-ress rates. Consequently, the rates become stationary.
Additional findings support these conclusions. In line with foregoing results, Table 2 shows that the first-order dif-ferencing we applied in Model C indeed did not result in a stationary series, since the R2stationary = 0.00. However, consis-tent with results produced by the ACF-plots, the series be-come stationary (R2stationary = 0.501–0.544) after including the lag 1 autocorrelations in Model D, which are positive and significant, ρ = 0.78 and ρ = 0.95, respectively. In Model E we entered the lag 2 autocorrelations in the analyses. This increased the R2stationary = 0.603 for km/h performances and R2stationary = 0.737 for trial distances. The analyses addition-ally yielded significant, negative partial autocorrelations for riders’ km/h performances (ρ = -0.89) and trial distances (ρ = -0.78).
7.4. Answering the research questions
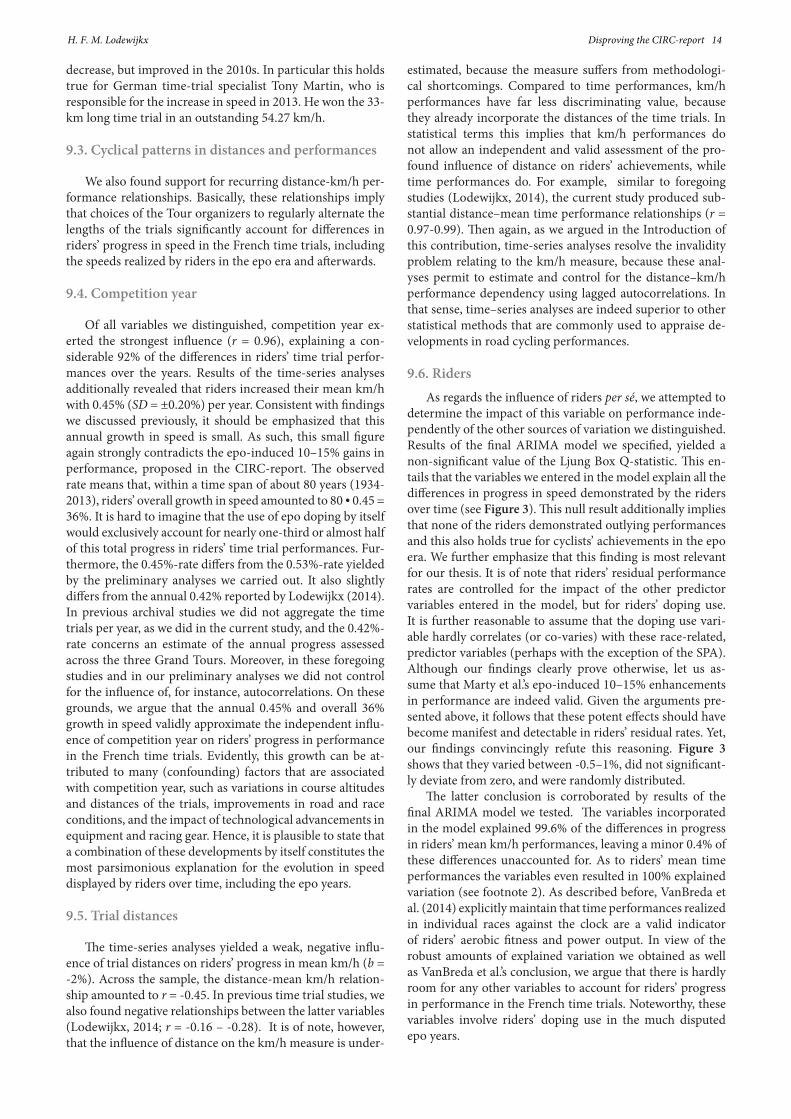
This leaves us to present the influence of the six sources of variation we discerned on riders’ progress in performance. Results can be found in Model F in Table 2. Inconsistent with the SPA, findings indicated that the progress rate in the epo years does not differ significantly from the rate in the non-epo years, b = 0.10% (p = 0.74). In disagreement with the DPA, the b = 0% (p = 0.93) reveals that the progress in performance of riders in Perneger’s years did not decline, but rather equaled the progress realized by riders in preceding years. Competition year yielded a significant, annual growth of ∆ = 0.45%. Larger distances of the trials negatively, but weakly, influenced riders’ progress in km/h over time, b = -2% (p = 0.08). The partial lag 2 autocorrelation (ρ = -0.87) provides evidence for significant cyclical patterns in riders’ progress over the years. Regarding the effect of riders per sé, the value of the Ljung-Box Q is not significant (p = 0.90). Thus, the variables specified in Model F explain all the dif-ferences in riders’ growth in performance over time. Riders’ residual km/h rates are displayed in Figure 3. The variables included in Model F explained a substantial R2 = 0.996 of the differences in the evolution in rider’s time trial achievements with R2stationary = 0.658.
8. Supplementary analyses: Closer examination of theSPA and DPA
ARIMA produced no statistical evidence for the SPA and DPA. To closer examine the validity of these results, we con-ducted supplementary analyses and subjected rider’s mean km/h performances and corresponding progress rates to ANOVAs. We did not include control variables in the anal-yses and compared the epo to the non-epo years, Perneger’s to the preceding years, and Perneger’s years to the epo years. Findings are summarized in Table 3.
Considering mean km/h performances, the table shows that riders in the epo years raced significantly faster relative to riders in the non-epo years, b = +5.18 km/h (+11.6%). The same effect holds for riders in Perneger’s vs. the preced-ing years, b = +5.61 km/h (+12.6%). However, in strong dis-agreement with the SPA and DPA, riders in Perneger’s years
H. F. M. Lodewijkx Disproving the CIRC-report 10

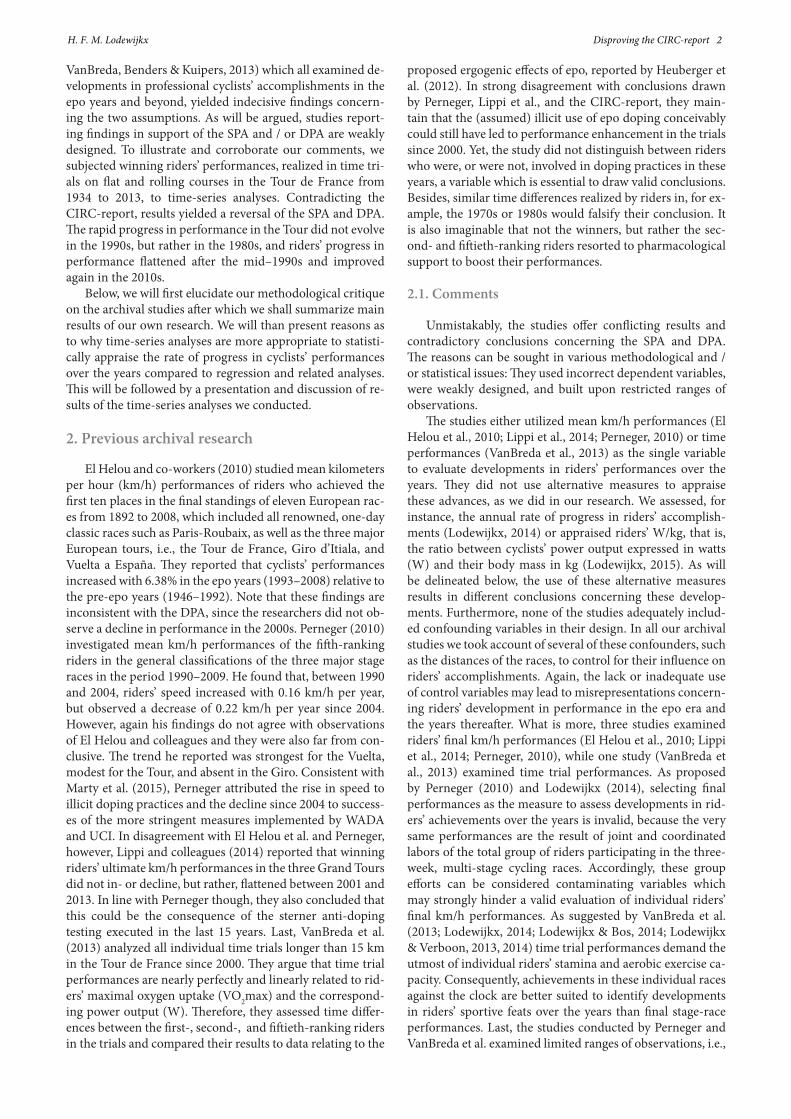
Riders as casesFigure 3. Relationship between riders as cases and their residual progress rates (%) in
mean km/h. The vertical solid line marks the start of the epo years (1993).
-.01
0.0
1.0
2.0
3.0
4R
esid
ual p
rogr
ess
rate
(%) i
n m
ean
km/h
1933 1943 1953 1963 1973 1983 1993 2003 2013
A
B
Competition year
Figure 4. Relationships between competition year, trial distances (right Y-axis) and mean km/h performances (left Y-axis) demonstrated by riders in time trials in the Tour de France between 1975-2013. The solid lines presentkm/h performances and the broken lines trial distances. Panel A shows the untransformed values of the variables, Panel B the corresponding annual progress rates (%). The vertical solid line marks the start of the epo years (1993).
2030
4050
60D
ista
nce
trial
(km
)
4446
4850
52P
redi
cted
mea
n km
/h
1975 1980 1985 1990 1995 2000 2005 2010 2015
-.05
0.0
5.1
.15
% C
hang
e di
stan
ce tr
ial
-.01
0.0
1.0
2.0
3%
Cha
nge
mea
n km
/h
1975 1980 1985 1990 1995 2000 2005 2010 2015
H. F. M. Lodewijkx Disproving the CIRC-report 11

Tab
le 3
. AN
OV
A S
umm
ary
and
Com
paris
ons o
f Mea
n K
m/h
Per
form
ance
s and
Cor
resp
ondi
ng A
vera
ge P
rogr
ess R
ates
of R
ider
s in
the
Epo
vs. N
on-E
po
Yea
rs, P
erne
ger’
s vs.
the
Prec
edin
g Y
ears
, and
Per
nege
r’s v
s. th
e Ep
o Y
ears
.
Non
-epo
yea
rs(N
= 60
/61)
Epo
year
s(N
= 11
)D
iffer
ence
Prec
edin
g ye
ars
(N=
61/6
2)
Pern
eger
’sye
ars
(N=
10)
Diff
eren
ceD
iffer
ence
epo
vs
. Per
nege
r’s
year
s
Var
iabl
esM
(SD
)M
(SD
)B
(SE)
M(S
D)
M(S
D)
B(S
E)B
(SE)
Mea
n km
/h44
.61
(3.7
3)49
.79
(0.2
0)+5
.18
(1.1
3)a
44.6
2 (3
.64)
50.2
3 (0
.62)
+5.6
1 (1
.16)
c+0
.439
(0.2
0)e
Ave
rage
pr
ogre
ss ra
te (%
an
nual
cha
nge
in m
ean
km/h
)
0.60
(1.0
8)0.
16 (0
.64)
-0.4
0 (0
.30)
b0.
55 (1
.07)
0.41
(0.8
4)-0
.10
(0.4
0)d
+0.3
0 (0
.30)
f
Not
es:
aF(
1,70
) = 2
0.99
, p≤
0.00
1, η
p2=
0.23
bF(
1,69
) = 1
.70,
p=
0.20
, ηp2
= 0.
02c
F(1,
70) =
23.
29, p
≤ 0.
001,
ηp2
= 0.
25d
F(1,
69) =
0.1
5, p
= 0.
70, η
p2=
0.02
eF(
1,19
) = 4
.97,
p≤
0.05
, ηp2
= 0.
21f
F(1,
19) =
0.6
1, p
= 0.
45, η
p2=
0.03
H. F. M. Lodewijkx Disproving the CIRC-report 12
also significantly outperformed riders in the epo years, b = +0.439 km/h (+0.88%). As to the progress rates, ANOVAs produced no significant main effects: Epo vs. non-epo years, b = -0.40%; Perneger’s vs. preceding years, b = -0.10%; and Perneger’s vs. the epo years, b = +0.30%. The negative rates entail that riders’ progress in speed diminishes with proceed-ing years. However, in line with findings concerning km/h performances, the positive rate obtained for the comparison between Perneger’s vs. the epo years again indicates slightly faster performances for riders in Perneger’s period. Scrutiny of the corresponding standard errors in Table 3 show that the absence of significant main effects can be explained by the fact that the variability in the rates of riders in the epo and Perneger’s years does not deviate from the variability in the rates obtained across comparison groups.
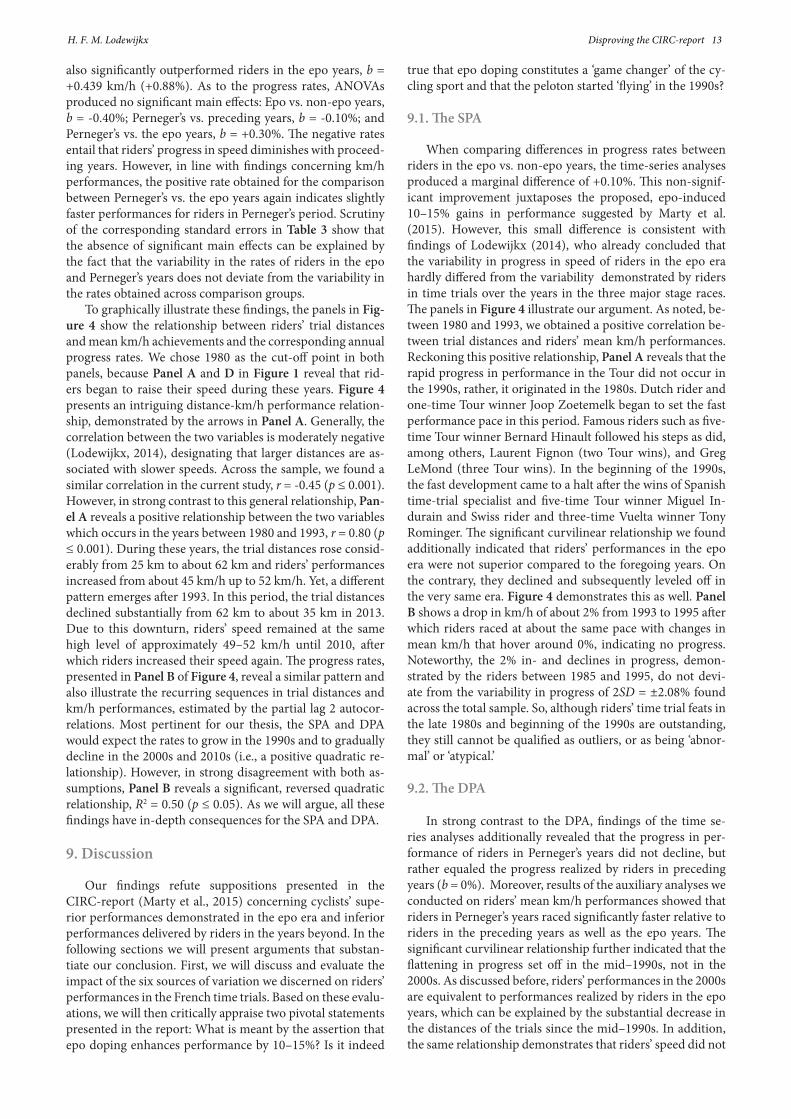
To graphically illustrate these findings, the panels in Fig-ure 4 show the relationship between riders’ trial distances and mean km/h achievements and the corresponding annual progress rates. We chose 1980 as the cut-off point in both panels, because Panel A and D in Figure 1 reveal that rid-ers began to raise their speed during these years. Figure 4 presents an intriguing distance-km/h performance relation-ship, demonstrated by the arrows in Panel A. Generally, the correlation between the two variables is moderately negative (Lodewijkx, 2014), designating that larger distances are as-sociated with slower speeds. Across the sample, we found a similar correlation in the current study, r = -0.45 (p ≤ 0.001). However, in strong contrast to this general relationship, Pan-el A reveals a positive relationship between the two variables which occurs in the years between 1980 and 1993, r = 0.80 (p ≤ 0.001). During these years, the trial distances rose consid-erably from 25 km to about 62 km and riders’ performances increased from about 45 km/h up to 52 km/h. Yet, a different pattern emerges after 1993. In this period, the trial distances declined substantially from 62 km to about 35 km in 2013. Due to this downturn, riders’ speed remained at the same high level of approximately 49–52 km/h until 2010, after which riders increased their speed again. The progress rates, presented in Panel B of Figure 4, reveal a similar pattern and also illustrate the recurring sequences in trial distances and km/h performances, estimated by the partial lag 2 autocor-relations. Most pertinent for our thesis, the SPA and DPA would expect the rates to grow in the 1990s and to gradually decline in the 2000s and 2010s (i.e., a positive quadratic re-lationship). However, in strong disagreement with both as-sumptions, Panel B reveals a significant, reversed quadratic relationship, R2 = 0.50 (p ≤ 0.05). As we will argue, all these findings have in-depth consequences for the SPA and DPA.
9. Discussion
Our findings refute suppositions presented in the CIRC-report (Marty et al., 2015) concerning cyclists’ supe-rior performances demonstrated in the epo era and inferior performances delivered by riders in the years beyond. In the following sections we will present arguments that substan-tiate our conclusion. First, we will discuss and evaluate the impact of the six sources of variation we discerned on riders’ performances in the French time trials. Based on these evalu-ations, we will then critically appraise two pivotal statements presented in the report: What is meant by the assertion that epo doping enhances performance by 10–15%? Is it indeed
true that epo doping constitutes a ‘game changer’ of the cy-cling sport and that the peloton started ‘flying’ in the 1990s?
9.1. The SPA
When comparing differences in progress rates between riders in the epo vs. non-epo years, the time-series analyses produced a marginal difference of +0.10%. This non-signif-icant improvement juxtaposes the proposed, epo-induced 10–15% gains in performance suggested by Marty et al. (2015). However, this small difference is consistent with findings of Lodewijkx (2014), who already concluded that the variability in progress in speed of riders in the epo era hardly differed from the variability demonstrated by riders in time trials over the years in the three major stage races. The panels in Figure 4 illustrate our argument. As noted, be-tween 1980 and 1993, we obtained a positive correlation be-tween trial distances and riders’ mean km/h performances. Reckoning this positive relationship, Panel A reveals that the rapid progress in performance in the Tour did not occur in the 1990s, rather, it originated in the 1980s. Dutch rider and one-time Tour winner Joop Zoetemelk began to set the fast performance pace in this period. Famous riders such as five-time Tour winner Bernard Hinault followed his steps as did, among others, Laurent Fignon (two Tour wins), and Greg LeMond (three Tour wins). In the beginning of the 1990s, the fast development came to a halt after the wins of Spanish time-trial specialist and five-time Tour winner Miguel In-durain and Swiss rider and three-time Vuelta winner Tony Rominger. The significant curvilinear relationship we found additionally indicated that riders’ performances in the epo era were not superior compared to the foregoing years. On the contrary, they declined and subsequently leveled off in the very same era. Figure 4 demonstrates this as well. Panel B shows a drop in km/h of about 2% from 1993 to 1995 after which riders raced at about the same pace with changes in mean km/h that hover around 0%, indicating no progress. Noteworthy, the 2% in- and declines in progress, demon-strated by the riders between 1985 and 1995, do not devi-ate from the variability in progress of 2SD = ±2.08% found across the total sample. So, although riders’ time trial feats in the late 1980s and beginning of the 1990s are outstanding, they still cannot be qualified as outliers, or as being ‘abnor-mal’ or ‘atypical.’
9.2. The DPA
In strong contrast to the DPA, findings of the time se-ries analyses additionally revealed that the progress in per-formance of riders in Perneger’s years did not decline, but rather equaled the progress realized by riders in preceding years (b = 0%). Moreover, results of the auxiliary analyses we conducted on riders’ mean km/h performances showed that riders in Perneger’s years raced significantly faster relative to riders in the preceding years as well as the epo years. The significant curvilinear relationship further indicated that the flattening in progress set off in the mid–1990s, not in the 2000s. As discussed before, riders’ performances in the 2000s are equivalent to performances realized by riders in the epo years, which can be explained by the substantial decrease in the distances of the trials since the mid–1990s. In addition, the same relationship demonstrates that riders’ speed did not
H. F. M. Lodewijkx Disproving the CIRC-report 13
decrease, but improved in the 2010s. In particular this holds true for German time-trial specialist Tony Martin, who is responsible for the increase in speed in 2013. He won the 33-km long time trial in an outstanding 54.27 km/h.
9.3. Cyclical patterns in distances and performances
We also found support for recurring distance-km/h per-formance relationships. Basically, these relationships imply that choices of the Tour organizers to regularly alternate the lengths of the trials significantly account for differences in riders’ progress in speed in the French time trials, including the speeds realized by riders in the epo era and afterwards.
9.4. Competition year
Of all variables we distinguished, competition year ex-erted the strongest influence (r = 0.96), explaining a con-siderable 92% of the differences in riders’ time trial perfor-mances over the years. Results of the time-series analyses additionally revealed that riders increased their mean km/h with 0.45% (SD = ±0.20%) per year. Consistent with findings we discussed previously, it should be emphasized that this annual growth in speed is small. As such, this small figure again strongly contradicts the epo-induced 10–15% gains in performance, proposed in the CIRC-report. The observed rate means that, within a time span of about 80 years (1934-2013), riders’ overall growth in speed amounted to 80 • 0.45 = 36%. It is hard to imagine that the use of epo doping by itself would exclusively account for nearly one-third or almost half of this total progress in riders’ time trial performances. Fur-thermore, the 0.45%-rate differs from the 0.53%-rate yielded by the preliminary analyses we carried out. It also slightly differs from the annual 0.42% reported by Lodewijkx (2014). In previous archival studies we did not aggregate the time trials per year, as we did in the current study, and the 0.42%-rate concerns an estimate of the annual progress assessed across the three Grand Tours. Moreover, in these foregoing studies and in our preliminary analyses we did not control for the influence of, for instance, autocorrelations. On these grounds, we argue that the annual 0.45% and overall 36% growth in speed validly approximate the independent influ-ence of competition year on riders’ progress in performance in the French time trials. Evidently, this growth can be at-tributed to many (confounding) factors that are associated with competition year, such as variations in course altitudes and distances of the trials, improvements in road and race conditions, and the impact of technological advancements in equipment and racing gear. Hence, it is plausible to state that a combination of these developments by itself constitutes the most parsimonious explanation for the evolution in speed displayed by riders over time, including the epo years.
9.5. Trial distances
The time-series analyses yielded a weak, negative influ-ence of trial distances on riders’ progress in mean km/h (b = -2%). Across the sample, the distance-mean km/h relation-ship amounted to r = -0.45. In previous time trial studies, we also found negative relationships between the latter variables (Lodewijkx, 2014; r = -0.16 – -0.28). It is of note, however, that the influence of distance on the km/h measure is under-
estimated, because the measure suffers from methodologi-cal shortcomings. Compared to time performances, km/h performances have far less discriminating value, because they already incorporate the distances of the time trials. In statistical terms this implies that km/h performances do not allow an independent and valid assessment of the pro-found influence of distance on riders’ achievements, while time performances do. For example, similar to foregoing studies (Lodewijkx, 2014), the current study produced sub-stantial distance–mean time performance relationships (r = 0.97-0.99). Then again, as we argued in the Introduction of this contribution, time-series analyses resolve the invalidity problem relating to the km/h measure, because these anal-yses permit to estimate and control for the distance–km/h performance dependency using lagged autocorrelations. In that sense, time–series analyses are indeed superior to other statistical methods that are commonly used to appraise de-velopments in road cycling performances.
9.6. Riders As regards the influence of riders per sé, we attempted to
determine the impact of this variable on performance inde-pendently of the other sources of variation we distinguished. Results of the final ARIMA model we specified, yielded a non-significant value of the Ljung Box Q-statistic. This en-tails that the variables we entered in the model explain all the differences in progress in speed demonstrated by the riders over time (see Figure 3). This null result additionally implies that none of the riders demonstrated outlying performances and this also holds true for cyclists’ achievements in the epo era. We further emphasize that this finding is most relevant for our thesis. It is of note that riders’ residual performance rates are controlled for the impact of the other predictor variables entered in the model, but for riders’ doping use. It is further reasonable to assume that the doping use vari-able hardly correlates (or co-varies) with these race-related, predictor variables (perhaps with the exception of the SPA). Although our findings clearly prove otherwise, let us as-sume that Marty et al.’s epo-induced 10–15% enhancements in performance are indeed valid. Given the arguments pre-sented above, it follows that these potent effects should have become manifest and detectable in riders’ residual rates. Yet, our findings convincingly refute this reasoning. Figure 3 shows that they varied between -0.5–1%, did not significant-ly deviate from zero, and were randomly distributed.
The latter conclusion is corroborated by results of the final ARIMA model we tested. The variables incorporated in the model explained 99.6% of the differences in progress in riders’ mean km/h performances, leaving a minor 0.4% of these differences unaccounted for. As to riders’ mean time performances the variables even resulted in 100% explained variation (see footnote 2). As described before, VanBreda et al. (2014) explicitly maintain that time performances realized in individual races against the clock are a valid indicator of riders’ aerobic fitness and power output. In view of the robust amounts of explained variation we obtained as well as VanBreda et al.’s conclusion, we argue that there is hardly room for any other variables to account for riders’ progress in performance in the French time trials. Noteworthy, these variables involve riders’ doping use in the much disputed epo years.
H. F. M. Lodewijkx Disproving the CIRC-report 14

10. Conclusions: Comments on the CIRC-report
10.1. Individual differences determine performances
In line with our critique on previous archival studies, the current study demonstrates that it is definitely hazardous to use mean km/h or time performances as the single variable to evaluate developments in riders’ performances over the years. The inclusion of race-related, control variables in the time-series analyses we conducted, led to results that clearly refuted the SPA and DPA. The same conclusion also applies to our recommendation to use annual progress rates as an al-ternative measure to assess riders’ evolution in speed. Find-ings of our auxiliary analyses illustrate this argument. When exclusively focusing on mean km/h performances this would lead to the false conclusion that riders in the epo years real-ly raced significantly faster relative to riders in the non-epo years. It is of note that El Helou et al. (2010) used similar incorrect comparisons on the basis of which they provide ev-idence in favor of the SPA. However, we also saw that riders in Perneger’s years significantly outperformed riders in pre-ceding as well the epo years. When considering the robust, linear relationship we obtained between competition year and riders’ mean km/h performances these findings are not particularly surprising. However, results pertaining to the annual progress rates place all these effects in a complete-ly different perspective. The analyses yielded no significant main effects on these rates for all the different comparison groups we examined. This means that performance differ-ences within the groups are stronger than the differences be-tween the groups. Principally, these findings entail that indi-vidual differences between riders are the main determinant of the variability in performance progress demonstrated in the French time trials over the years. These differences may be affected by variables we did not account for in our analy-ses, such as variations in course altitudes, road and race con-ditions of the trials or by improvements and innovations in equipment and racing gear. However, the pivotal implication of these findings is that these individual differences dwarf the differences between the SPA and DPA groups we scru-tinized. These observations agree with conclusions drawn by Lodewijkx (2014) and disconfirm conclusions of Marty et al. (2015), El Helou et al. (2010), Lippi et al. (2014), and Perneger (2010).
10.2. Performance gains of 10–15%?
The 0.10% progress in performance realized by riders in the epo vs. the non-epo years as well as the small, annual growth in riders’ time trial speeds we discussed previously, already formed the impetus for us to question the validity of Marty et al.‘s (2015) suggestion that the use of epo doping would enhance riders’ performances by 10–15%. Even when taking extreme values of ±4SD in the normal distribution as the criterion, findings in Table 3 show that the progress in mean km/h achieved by riders in the epo years would vary between ±2.56% at the maximum, while for riders in the non-epo years the variation amounts to ±4.32%. Again, note that these rates are lower for riders in the epo years. The plainspoken reason is that riders race faster over the years, making it harder for them to make a substantial difference in progress in our modern times. All these observations imply
that posing 10–15% doping-induced enhancements in per-formance is unrealistic.
Apart from these improbable, huge improvements, the way in which Marty et al. (2015) assessed these gains is also questionable. The authors did not define or operationalize these gains in such a way that they can be empirically tested. What do they mean when they write about ‘performance’? Which comparison or control groups were used to deter-mine these ‘gains’? Moreover, ‘gains’ in what: VO2max, pow-er output, efficiency / economy, km/h performances, time performances, W/kg, time to exhaustion, endurance capaci-ty, improvements in the time riders can race at maximum or sub-maximal aerobic capacity? These are all essential queries that the report leaves unanswered.
10.3. Generality of laboratory findings?
The CIRC-report not only lacks precise and valid defini-tions, conceptualizations, and operationalizations of afore-said variables. It is also deficient when it comes to a sys-tematic and critical appraisal of studies which investigated effects of RBC-augmenting doping aids on improvements in cyclists’ performances. The report further mistakenly gen-eralizes these effects to achievements realized by riders in actual races. While the epo studies vary as regards scientif-ic rigor, the findings do sketch a much more diffuse picture concerning these effects than suggested in the report. For instance, in their qualitative studies, former UCI chairman Verbruggen (2001) and Vandeweghe (2013), president of the Flanders Cycling Federation (WBV), both maintain that epo doping improved cyclists’ ‘endurance capacity’ by as much as 20%. El Helou and colleagues (2010) summarized findings of laboratory studies on the basis of which they estimated increases of 6.3–6.9% in VO2max attributable to epo ad-ministration. In their qualitative meta-analysis of laboratory studies, Lundby and Olsen (2011) concluded that —if par-ticipants’ hematocrit (Ht) levels were artificially increased by epo treatment from pre-test baseline values to around Ht = 50% post test— VO2max was estimated to improve by 8–12%. For laboratory studies examining effects of blood doping the increases in VO2max were estimated to vary be-tween 5–10% (Bytomski, Moorman III & MacAuley, 2010; Lundby, Robach & Saltin, 2012). However, in their system-atic meta-analysis of seventeen epo studies, Lodewijkx et al. (2013) reported 6–7% improvements in VO2max and 7–8% increases in the related power output measure (W). Last, in their qualitative meta-analysis, Heuberger et al. (2012) ar-rived at 7–9.7% increases in VO2max due to epo treatment. The same scholars, however, are very critical about the epo doping-performance relationship. They concluded that this relationship has no “scientific basis” and that “the reported studies have many shortcomings regarding translation of the results to professional cycling endurance performance” (ibid., p. 1406). Lundby, Robach and Saltin (2012) arrive at a similar, though much less pertinent, conclusion when it comes down to extrapolations of some performance-en-hancing effects of epo observed in laboratory situations to performances of elite athletes in actual competitions.
Combined, the estimated performance-enhancing effects of epo and blood doping thus appear to vary hugely between 5–20% with an average improvement of M = 8.9% (SD = ±4.21%). Yet, these gains are predominantly observed on
H. F. M. Lodewijkx Disproving the CIRC-report 15

VO2max, the assessment of which took place in laboratory situations, not in actual races, among participants that were mainly non-athletes. The problem is that laboratory situa-tions have limited external and ecological validity and that the status of VO2max as the single, most valid indicator of cyclists’ actual performances is questionable.
As already suggested by some of the sources referred to above, it is generally agreed upon that improvements in aerobic fitness found in laboratory experiments among non-athletes cannot be directly (and linearly) generalized to achievements realized by world-class professional cyclists in competitions that last three weeks (Hopkins, Hawley & Burke, 1999). Perhaps we are wrong in our judgment, but we believe that Marty et al. (2015, p. 33) do tend to engage in such incorrect extrapolations. Regarding these extrapo-lations, some studies even argue that effects of epo doping are strongly overrated. For instance, in their meta-analysis of laboratory studies Lodewijkx et al. (2013) reported an en-hancement in power output of M = 26W due to epo treat-ment, while the largest epo-induced gain in VO2max equaled an increase in speed of about 1 km/h. Perneger (2010) re-ported a similar small improvement in speed. Unfortunately, research additionally shows that VO2max is a poor predictor of cyclists’ accomplishments, in particular if they compete at world-class level (Heuberger et al., 2012). Thus, although increases in VO2max are found in laboratory situations, this does not imply that, therefore, they will directly and linearly affect riders’ performances in actual competitions. The rea-son is that VO2max is a prerequisite, but not the only variable involved in cycling. For example, efficiency —the economy between work output (speed) and oxygen cost— is unrelated to VO2max but has been shown to strongly influence riders’ competitive accomplishments (Lucia, Hoyos, Pérez, Santalla & Chicharro, 2002). A more comprehensive discussion of the VO2max-performance association is beyond the scope of the present study. We refer to Heuberger et al. (2012), Lodewijkx et al. (2013), and Lucia, Hoyos, Pérez, Santalla, Earnest, and Chicharro (2004) for reviews. However, reck-oning our comments, the conclusion is warranted that Marty et al. (2015) are biased in their conclusions by taking the ‘epo doping-performance’ relationship too much for granted. Evidently, expressing doubts about this relationship would strongly defy the rationale of the report.
10.4. A ‘flying’ peloton?
Marty et al. (2015, p. 33) further write that “former riders and other actors in the sport identified the late 1980s or ear-ly 1990s as the period when epo was introduced, and when the peloton started ‘flying.’ ” In view of the history of doping scandals that plagued the cycling world the last decades, we have no reason to doubt the first part of this statement. Yet, we have serious reservations concerning the second part, because it merely builds on subjective, anecdotal evidence. Similar to the unrealistic, ill-defined and falsely generalized performance gains, the report does not offer any detailed, rigorous statistical data in support of this ’flying.’ Again, it is obvious that inconsistent data would challenge the purpose of the CIRC-report. In strong contrast to their claim, how-ever, our statistical findings indicated that the ‘flying’ halted in the mid–1990s and that the fast evolution in speed in the Tour de France took place in the 1980s, not in the 1990s. The
latter finding agrees with results of Lodewijkx and Brouwer (2012), who investigated developments in winning riders’ fi-nal performances in the three major stage races from 1903 to 2011. To account for the fast progress in the 1980s, the study referred to reforms presented by Brewer (2002) in his formative, socio-historical analysis of professional cycling. We refer to his paper and to Lodewijkx and Brouwer (2011, 2012) for a comprehensive synopsis of these reforms. Here, we will briefly re-iterate them. They relate to four different domains: Changes in the social dynamics and associated in-ter- and intra-team relations in the professional group of rid-ers; changes associated with a deeper commercialization and globalization of the sport, resulting in stronger financial in-centives for riders to compete; fast developments and inno-vations in training regimes and methods, racing equipment and bikes; and, last, the finalization of a competitive rankings system in professional cycling, developed by UCI. Brewer ar-gues that a mixture of these reforms resulted in progressive improvements in the athletic capacities and performances of the professional riders from the 1980s onward. Ultimate-ly, they culminated in a more brutal competition between riders and, consequently, in higher speeds and faster races. These races include the time trials that were programmed in the Tour de France in the 1980s.
10.5. Did epo somehow block riders’ performances?
Brewer additionally distinguished a fifth domain: Rider preparation, or the tendency in the professional group of rid-ers to resort to progressively potent pharmacological means and methods to enhance performance, for instance in the epo era. Yet, we found a reversal of the SPA and DPA. This leads us to close this paper with a fairly bold speculation. Taken together, all our observations sketch a rather intrigu-ing picture of the effects of epo doping on riders’ sportive achievements in the epo years. It almost seems as if the use of this doping agent did not boost, but somehow blocked rid-ers’ performances. This might also be the reason why riders’ time trial feats tend to improve bit by bit in the 2010s. Note-worthy, this development occurred after UCI introduced the Athlete Biological Passport (ABP) in professional road rac-ing in 2008. Because of the continuous monitoring of rid-ers’ blood values, the passport is said to have a successful deterring and preventive effect (Schumacher & d’Onofrio, 2012; Zorzoli & Rossi, 2010). According to the CIRC-report, the passport constitutes the most effective instrument devel-oped up to now to curb the doping problem in cycling. Reck-oning our findings, this statement might be correct. Quite ironically, however, the consequences of the ABP for riders’ performances may be opposite to what the report describes.
Footnotes
1. Due to multi-collinearity, it is no use to include a direct compar-ison of Perneger’s vs. the epo years in ARIMA, because this variable correlates r = 1.00 with the two dummy-coded variables. Moreover, inclusion of this variable would strongly diminish the number of observations, thereby preventing to estimate the influence of the other variables on riders’ performances over time. Therefore, we ex-plored performance difference between Perneger’s vs. the epo years in supplementary analyses.
2. The final ARIMA–model we specified for riders’ mean time
H. F. M. Lodewijkx Disproving the CIRC-report 16

performances produced the following results, corroborating find-ings on mean km/h performances. The effect of the SPA was not significant, b = 0.30% (p = 0.45) and this also holds for the effect of the DPA, b = 0.10% (p = 0.78). The influence of competition year yielded a significant, faster annual progress of ∆ = -0.26% (p ≤ 0.05). Trial distances had a profound influence, b = 1.02% (p ≤ 0.001) and so did the partial lag 2 autocorrelation, ρ = -0.65 (p ≤ 0.001). As regards the effect of riders per sé, the value of the Ljung-Box Q = 14.31, df = 16, was not significant (p = 0.22). Ultimately, the variables included in the final model explained virtually all the differences in progress in riders’ mean time performances, R2
stationary = 0.994 and R2 = 1.00.
ReferencesBox, G. E. P. & Jenkins G. M. (1976, rev. ed.). Time series analy-
sis: Forecasting and control. Oakland (CA): Holden-Day. Brewer B. F. (2002). Commercialization in professional cycling
1950-2001: Institutional transformations and the rationalization of “doping.” Sociology of Sport Journal, 19: 276-301.
Bytomski, J. R., Moorman III, C. T., & MacAuley, D. (2010). Oxford American handbook of sports medicine. Oxford: Oxford Uni-versity Press.
El Helou, N., Berthelot, G., Thibault, V., Tafflet, M., Nassif, H. et al. (2010). Tour de France, Giro, Vuelta, and classic European races show a unique progression of road cycling speed in the last 20 years. Journal of Sports Science, 28: 789–796.
Faria, E. W., Parker, D. L., & Faria, I. E. (2005). The science of cycling: Training and physiology – Part I. Sports Medicine, 34(4): 285–312.
Glaskin, M. (2012). Cycling science. Chicago: The University of Chicago Press.
Heuberger, J. A. A. C., Cohen-Tervaert, J. M., Schepers, F. M. L., Vliegenthart. A. D. B., Rotmans, J. I., Daniels, J. M. A., Burggraaf, J. & Cohen, A. F. (2012). Erythropoietin doping in cycling: Lack of evidence for efficacy and a negative risk–benefit. British Journal of Clinical Pharmacology, doi:10.1111/bcp.12034. http://onlinelibrary.wiley.com/doi/10.1111/bcp.12034/abstract
Hopkins, W.G., Hawley, J.A., & Burke, L. M. (1999). Design and analysis of research on sport performance enhancement. Medicine and Science in Sports and Exercise, 31: 472–485.
Jeukendrup, A. E., Craig, N. P., & Hawley, J. A. (2000). The bio-energetics of world class cycling. Journal of Science and Medicine in Sports, 3(4): 414–433.
Lippi, C., Matiuzzi, C., & Sanchis–Gomar, F. (2014). Mean speed in professional cycling: No evidence of decline. Performance Enhancement & Health, 3: 45-48. http://dx.doi.org/10.1016/j.peh.2014.07.002
Lodewijkx H.F.M., & Brouwer B. (2011). Some empirical notes on the ‘epo epidemic’ in professional cycling. Research Quarterly for Exercise and Sport, 82 (4): 593-608.
Lodewijkx H.F.M., & Brouwer B. (2012). Tour, Giro Vuelta: Rapid progress in cycling performance starts in the 1980s. Interna-tional Journal of Sports Science, 2(3): 24-31. Online available: http://article.sapub.org/10.5923.j.sports.20120203.02.html
Lodewijkx, H. F. M., Brouwer, B., Kuipers, H., & Van Hezewi-jk, R. (2013). Overestimated effect of epo administration on aero-bic exercise capacity: A meta–analysis. American Journal of Sports Science and Medicine, 1 (2): 17–27. Online available: http://pubs.sciepub.com
Lodewijkx, H.F.M., & Verboon, P. (2013). Lance Armstrong’s era of performance – Part I: Are his time trial performances much different from other winners? Journal of Athletic Enhancement, 2:1. http://dx.doi.org/10.4172/2324-9080.1000106
Lodewijkx, H.F.M. (2014). The epo fable in professional cy-
cling: Facts, fallacies, and fabrications. Journal of Sports Medicine and Doping Studies, 4(3): 141. http://dx.doi.org/10.4172/2161–0673.100014.
Lodewijkx, H. F. M, & Bos, A. E. R. (2014). Lance Armstrong’s era of performance – Part II: Revisiting his time trial wins. Amer-ican Journal of Sports Science and Medicine, 2(5): 194–201. http://dx.doi.org/10.12691/ajssm–2–5–4.
Lodewijkx H. F. M. & Verboon, P. (2014). The Texas Sharp-shooter in the Three Grand Tours (1933–2013): No Evidence for Superior Time Trial Performances in the ‘Epo Era.’ Open Access Library Journal, 1, e1045. http://dx.doi.org/10.4236/oalib.1101045.
Lodewijkx, H. F. M. (2015). Professional cyclists’ power output on Col d’Èze (Paris–Nice, 1969–2013): Again no distinctive perfor-mances in the “epo era”. Manuscript submitted for publication. Bre-da (The Netherlands): Open University of The Netherlands.
Lucia, A., Hoyos, J. & Chicharro, H.L. (2001). Physiology of professional road cycling. Sports Medicine, 31(5): 325–337.
Lucia, A., Hoyos, J., Pérez, M., Santalla, A., & Chicharro, J. L. (2002). Inverse relationship between VO2max and economy/efficiency in world-class cyclists. Medicine and Science in Sports and Exercise, 34: 2079-2084.
Lucia, A., Earnest, C., & Arribas, C. (2003). The Tour de France: a physiological review. Scandinavian Journal of Medicine and Sci-ence in Sport, 13: 275–283.
Lucia, A., Hoyos, J., Pérez, M., Santalla, A., Earnest, C. P., & Chicharro, J. l. (2004). Which laboratory variable is related with time trial performance in the Tour de France? British Journal of Sports Medicine, 38: 636-640.
Lundby, C., & Olsen, N. V. (2011). Effects of recombinant hu-man erythropoietin in normal humans. Journal of Physiology, 589: 1265–1271.
Lundby, C., Robach, P., & Saltin, B. (2012). The evolving science of detection of ‘blood doping.’ British Journal of Pharmacology, 165: 1306–1315.
Magnier, D., Picq, P., Debreilly, M., Zingoni, P., & Haffreingue H. (2014) Cycling remembered. [In French: Mémoires du cyclisme]. Retrieved from the internet http://www.memoire–du–cyclisme.eu, November, 2014.
Marty, D., Nicholson, P., & Haas, U. (2015). Cycling Indepen-dent Reform Commission (CIRC). Report to the president of the Union Cycliste Internationale. Lausanne (Switzerland): UCI.
Perneger, T. V. (2010). Speed trends of major cycling races: Does slower mean cleaner? International Journal of Sports Medicine, 31: 261–264.
Schumacher, Y. O., & d’Onofrio, G. (2012). Scientific exper-tise and the Athlete Biological Passport: Three years of experience. Clinical Chemistry, 58 (6): 979–985.
Tabachnick, B.G., & Fidell, L.S. (2001). Using multivariate statistics (4th ed.). Boston: Allyn and Bacon / Pearson Education Company.
VanBreda, E., Benders, J. & Kuipers, H. (2013). Little soldiers in their cardboard cells. British Journal of Clinical Pharmacology, 77(3): 580–58, DOI:10.1111/bcp.12187.
Vandeweghe, H. (2013). Who has faith in cyclists anymore? [In Dutch: Wie gelooft de coureurs nog?]. Ghent (Belgium): Borgerhoff & Lamberigts.
Verbruggen, H. (2001). The EPO epidemic in sport. Bloodline Reviews, 1: 3-4.
Zorzoli, M., & Rossi, F. (2010). Implementation of the biolog-ical passport: The experience of the International Cycling Union. Drug Test Analysis, 2: 542–547.
H. F. M. Lodewijkx Disproving the CIRC-report 17
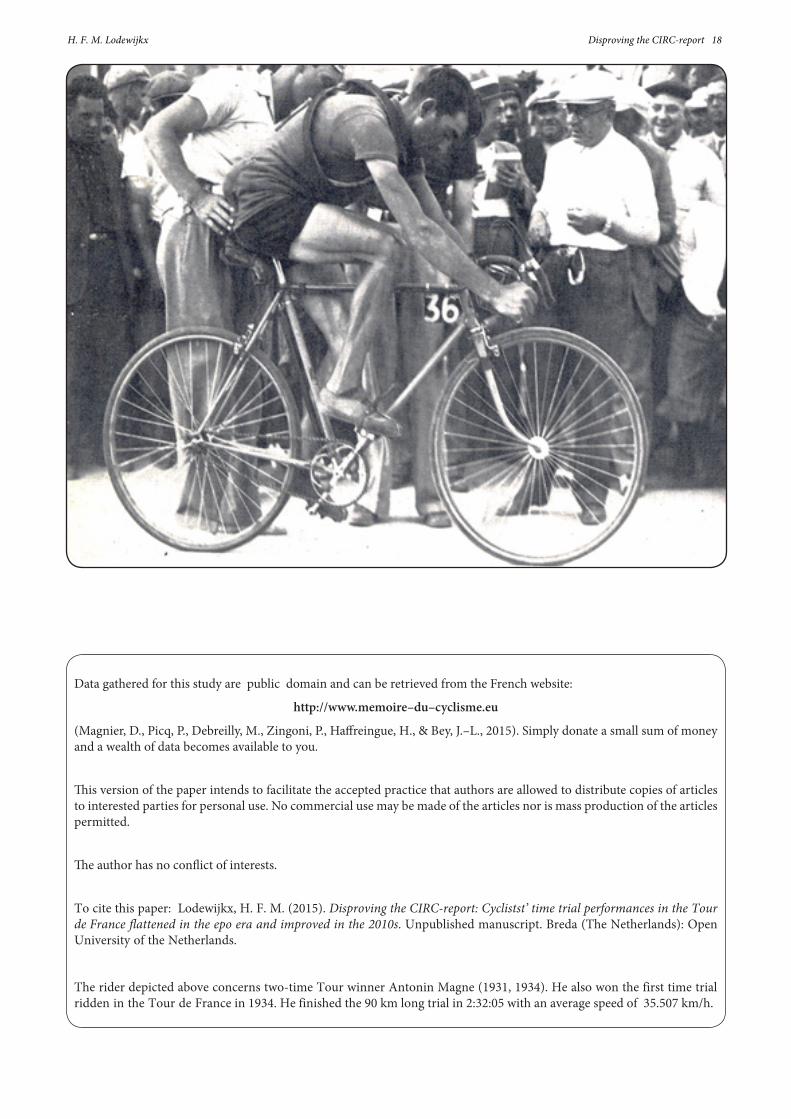
Data gathered for this study are public domain and can be retrieved from the French website:
http://www.memoire–du–cyclisme.eu
(Magnier, D., Picq, P., Debreilly, M., Zingoni, P., Haffreingue, H., & Bey, J.–L., 2015). Simply donate a small sum of money and a wealth of data becomes available to you.
This version of the paper intends to facilitate the accepted practice that authors are allowed to distribute copies of articles to interested parties for personal use. No commercial use may be made of the articles nor is mass production of the articles permitted.
The author has no conflict of interests.
To cite this paper: Lodewijkx, H. F. M. (2015). Disproving the CIRC-report: Cyclistst’ time trial performances in the Tour de France flattened in the epo era and improved in the 2010s. Unpublished manuscript. Breda (The Netherlands): Open University of the Netherlands.
The rider depicted above concerns two-time Tour winner Antonin Magne (1931, 1934). He also won the first time trial ridden in the Tour de France in 1934. He finished the 90 km long trial in 2:32:05 with an average speed of 35.507 km/h.
H. F. M. Lodewijkx Disproving the CIRC-report 18