Postoperative resveratrol administration improves prognosis ...
Strength training improves performance and pedaling
characteristics in elite cyclists
Running head: “Strength training in elite cyclists”
Bent R. Rønnestad1, Joar Hansen1, Ivana Hollan2, and Stian Ellefsen1
1Section for Sport Science, Lillehammer University College, Lillehammer, Norway
2Hospital for Rheumatic Diseases, Lillehammer, Norway
Corresponding author:
Bent R. Rønnestad
Lillehammer University College
PB. 952, 2604 Lillehammer
Norway
E-mail: [email protected] Phone: +47 61288193 Fax: +47 61288200
1
Abstract
The purpose was to investigate the effect of 25 weeks heavy strength training in young elite
cyclists. Nine cyclists performed endurance training and heavy strength training (ES) while
seven cyclists performed endurance training only (E). ES, but not E, resulted in increases in
isometric half squat performance, lean lower body mass, peak power output during Wingate
test, peak aerobic power output (Wmax), power output at 4 mmol·L-1 [la-], mean power output
during 40-min all-out trial and earlier occurrence of peak torque during the pedal stroke
(p<0.05). ES achieved superior improvements in Wmax and mean power output during 40-min
all-out trial compared to E (p<0.05). The improvement in 40-min all-out performance was
associated with the change towards achieving peak torque earlier in the pedal stroke (r=0.66,
p<0.01). Neither of the groups displayed alterations in VO2max or cycling economy. In
conclusion, heavy strength training leads to improved cycling performance in elite cyclists as
evidenced by a superior effect size of ES training vs. E training on relative improvements in
power output at 4 mmol·L-1 [la-], peak power output during 30-s Wingate test, Wmax, and mean
power output during 40-min all-out trial.
Key words: AEROBIC POWER OUTPUT, PEAK POWER OUTPUT, CONCURRENT
TRAINING, WEIGHT TRAINING, ENDURANCE PERFORMANCE
2
INTRODUCTION
Incorporation of strength training into cyclists’ preparatory period has received increasing
attention during the last years. The general finding is that concurrent strength and endurance
training improves various factors related to cycling performance (Aagaard et al. 2011; Barrett-
O'Keefe et al. 2012; Hausswirth et al. 2010; Koninckx et al. 2010; Rønnestad et al. 2010a;
Rønnestad et al. 2010c; Rønnestad et al. 2011a; Sunde et al. 2010). However, only one of
these studies was performed on elite cyclists and the strength training intervention lasted for
16 weeks (Aagaard et al. 2011), while the others studies typically lasted 8-12 weeks. Thus,
there is need for further investigation of the effect of adding heavy strength training to
endurance training in elite cyclists. It seems likely that better trained athletes require longer
periods with increased strength before they experience a positive impact on endurance
performance (Aagaard & Raastad 2012; Millet et al. 2002).
We have previously reported an additive effect of incorporating heavy strength training on
time-trial performance in well-trained cyclists (Rønnestad et al. 2010c; Rønnestad et al.
2011a). However, the mechanisms behind this improvement in time-trial performance are
somewhat unclear. It might be related to an improved cycling economy, as observed after
adding strength training to the ongoing endurance training in moderate trained cyclists (Sunde
et al. 2010). However, this has not been reported in any of the abovementioned studies on
well-trained and elite, measured during short-time submaximal power outputs (Aagaard et al.
2011; Rønnestad et al. 2010a; Rønnestad et al. 2010c). Furthermore, increase in type IIA
proportion at the expense of type IIX fibers have been observed in elite cyclists and can also
contribute to improved time trial performance (Aagaard et al. 2011). It is well known that
adding strength training to the endurance training can increase maximal strength and rate of
force development in cyclists (Aagaard et al. 2011; Hausswirth et al. 2010; Koninckx et al.
3
2010; Rønnestad et al. 2010a; Sunde et al. 2010). In theory, this may improve pedaling
characteristics by increasing peak torque in the pedal stroke, reducing time to peak torque and
reducing the pedaling torque relative to maximal strength, which in turn may allow for higher
power output and/or increased blood flow. Indeed, in a cross-sectional study of cyclists with
similar maximal oxygen consumption (VO2max) and peak aerobic power output (Wmax)
demonstrated lowered electromyography (EMG) activity during the pedal stroke was
observed in those with higher maximal strength (Bieuzen et al. 2007). To our best knowledge,
no prior studies have investigated the effects of adding strength training to ongoing endurance
training on the temporal torque profile during the pedal stroke.
The purpose of the present study was to investigate the hypothesis that a 10-week strength
development period would increase lower body muscle strength and that this adaptation
would be maintained by a subsequent 15-week strength maintenance period consisting of one
strength training session every 7-10 days. It was further hypothesized that this relative long
time with maintained strength training adaptations would have positive effects on pedal stroke
characteristics and sustained power output performance (mean power output in a 40-min all-
out trial). Also determinants of long-term endurance cycling performance, such as cycling
economy and power output at a blood lactate concentration ([la-]) of 4 mmol·L-1, were
measured. In addition, we also hypothesized that the improvements in muscle strength would
lead to improvement in vigorous aspects of road cycling races, measured as maximal power
output in a Wingate test and Wmax.
METHODS
Participants
4
Sixteen elite cyclists competing at the national (n=8) or international level (n=8) and fulfilled
at least two of Jeukendrup et al.`s (Jeukendrup et al. 2000) descriptions of an elite cyclist
completed the study. The study was approved by the local Ethical Committee of Lillehammer
University College and was carried out in accordance with the Declaration of Helsinki. All
cyclists gave written informed consent. Prior to study start we reasoned that the risk for
withdrawals was larger among cyclists performing combined endurance and strength training
and therefore chose to allocate more cyclists to strength training than the control group.
However, there were no differences between groups and three cyclists from each group
dropped out from the study. The cyclists were randomly distributed to either adding heavy
strength training to the ongoing endurance training (ES, n=9, age: 19.1±1.7 years, body mass:
66.0±8.0 kg, height: 178±7 cm, VO2max: 78±6 ml∙kg-1∙min-1) or endurance training only (E,
n=7, age: 20.1±1.6 years, body mass: 74.3±7.5 kg, height: 183±9 cm, VO2max: 73±5 ml∙kg-
1∙min-1). The study was initiated two weeks after finalization of the racing season and lasted
for 25 weeks. Pre-tests were performed two weeks after the last race of the season was
finished.
Experimental design
A 10-week strength development period with two strength training sessions per week was
performed and followed by a 15 week strength maintenance period with one strength training
session per 7-10 days (25 weeks). Isometric half-squat performance was measured at three
time points: 1) pre-intervention, 2) after the strength development period (10 weeks) and 3)
after the strength maintenance period (15 weeks). Lean lower body mass, mean power output
during 40-min all-out, VO2max, Wmax, 30-s Wingate test, cycling economy, pedal stroke
characteristics, and power output at 4 mmol·L-1 [la-] was measured before the intervention and
after 25 training weeks.
5
Training
Paragraph number 6
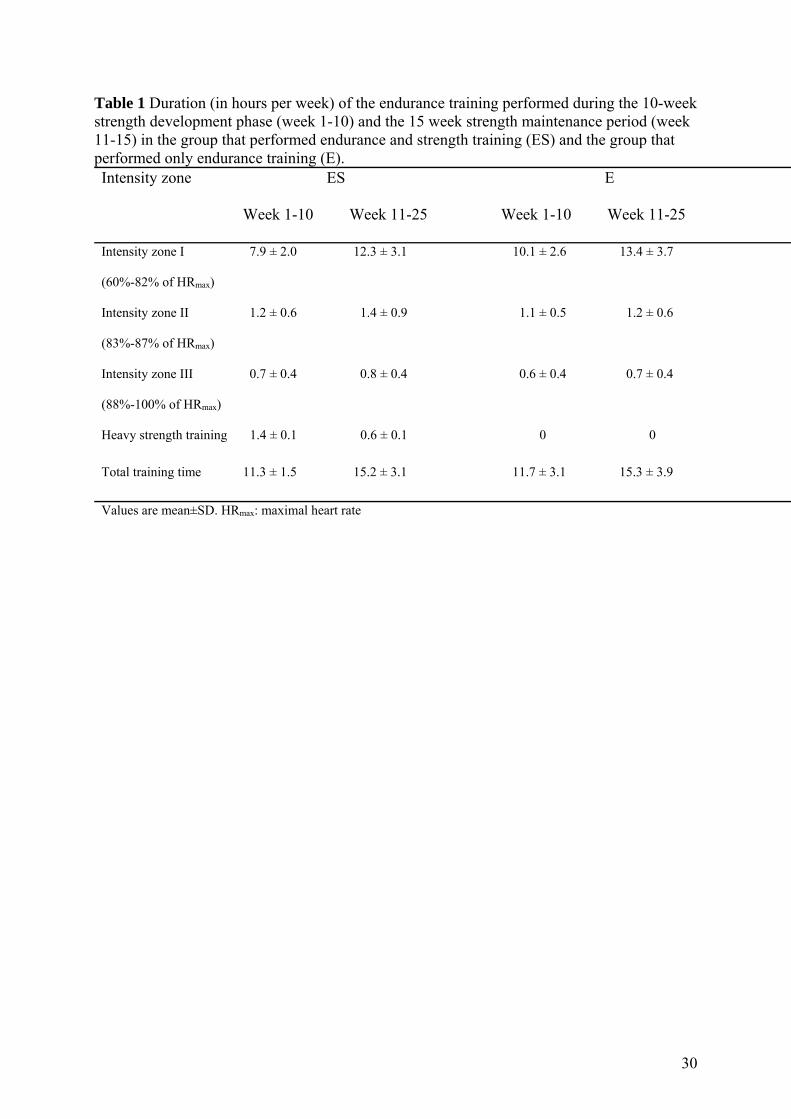
Endurance training duration and intensity were calculated based on heart rate (HR)
recordings. Endurance training was divided into three HR zones: 1) 60%-72%, 2) 73%-87%,
and 3) 88%-100% of maximal HR. The weekly duration of the endurance training and the
distribution of this training within the three intensity zones were similar between groups in the
10-week strength development period and the subsequent 15-week strength maintenance
period (Table 1). No significant difference between ES and E was found when comparing
total training duration (included the strength training). The reason to no differences in total
training volume is a non-significant larger endurance training volume in E (Table 1).
(Insert Table 1 about here)
The heavy strength training that was performed in ES group targeted leg muscles and was
planned to be performed twice per week during the preparatory period and once per week
during the competition period. Adherence to the strength training was high, with ES cyclists
completing 19.4±0.7 of the planned 20 strength training sessions during the 10-week strength
development period. Furthermore, during the 15 weeks strength maintenance period they
performed 12.5±1.5 strength training sessions. This corresponds to one session every ~8 days
that agreed well with the planned protocol. The strength training regimen was designed to
improve cycling performance by emphasizing cycling-specific exercises as described
elsewhere (Rønnestad et al. 2010c). Thus, strength-training exercises were performed with a
knee angle between 90° and close to full extension. In addition, since cyclists work each leg
6
alternately during cycling, they were instructed to perform two of the four exercises
unilaterally.
The heavy strength training was conducted with focus on maximal effort in the concentric
phase (duration around 1 s), while the eccentric phase was performed more slowly (duration
2-3 s). At the start of each strength training session, cyclists performed a ~10-min warm-up at
self-selected intensity on a cycle ergometer, followed by 2-3 warm-up sets of half squat with
gradually increasing load. The performed exercises were: half squat, unilateral leg press,
standing unilateral hip flexion, and ankle plantar flexion. All cyclists were supervised by an
investigator at all workouts during the first two weeks and thereafter at least once every
second week throughout the strength development period. During the first three weeks,
cyclists trained with 10 repetition maximum (RM) sets at the first session and 6RM sets at the
second session. During the following three weeks, sets were adjusted to 8RM and 5RM,
respectively. During the final four weeks of the preparatory period, sets were adjusted to 6RM
and 4RM, respectively. The cyclists were encouraged to increase their RM loads continually
throughout the intervention period and were allowed assistance on the last repetition. The
number of sets in each exercise was always three, separated by 2 min rest periods. During the
strength maintenance period one strength training session was performed every 7-10 days
with the order of exercises and number of sets being the same as during the first 10-week
period. In this maintenance period, strength training was not performed until failure. The
cyclists performed five repetitions with maximal effort in the concentric phase with a load
corresponding to 8-10RM and 2 min rest period between each set and exercise was used for
all exercises. We have previously shown that this strength training regime is sufficient to
maintain developed strength in well-trained cyclists (Rønnestad et al. 2010c).
7
Testing
Testing before and after the 25-week intervention period was completed as follows: day 1)
measurement of lean lower-body mass, day 2) maximal strength test and 30-s Wingate test,
day 3) incremental cycle tests for determination of blood lactate profile followed by a VO2max
test, and day 4) 40-min all-out trial. The cyclists were instructed to refrain from intense
exercise the day preceding testing. They were also instructed to prepare for the trial as if it
was a competition, and to consume the same type of meal before each test. They were not
allowed to eat during the hour preceding a test or trial or to consume coffee or other products
containing caffeine during the preceding three hours. All cycling tests were performed under
similar environmental conditions (19-21˚C) and included a fan for cooling. For each
individual cyclist, testing was performed at the same time of day to avoid influence of
circadian rhythm. All cycling tests, except the 40-min all-out trial which was performed on
the cyclists’ own bike, was performed on the same electromagnetically braked cycle
ergometer (Lode Excalibur Sport, Lode B. V., Groningen, The Netherlands). In accordance
with the manufacturer’s guidelines, the cycle ergometer is calibrated by the manufacturer
once a year. The ergometer was adjusted according to each cyclist’s preference for seat
height, horizontal distance between tip of seat and bottom bracket, and handlebar position.
The crank arm length on the Lode cycle ergometer was individually adjusted in order to be
identical with the crank arm length on their own bike and equipped with the cyclists own clip
pedals.
Lean lower-body mass
Lean lower-body mass was determined by dual-energy x-ray absorptiometry using a Lunar
Prodigy densiometer (Prodigy Advance PA+302047, Lunar, San Francisco, USA), performed
in a highly standardized manner. Cyclists were instructed to refrain from training for the 24
8
hours preceding the measurement. They were also instructed to avoid ingestion of food or
liquid for the 3 hours preceding the measurement.
Strength test
Maximal strength in leg extensors was measured as maximal vertical ground reaction force
against a force plate (SG-9, Advanced Mechanical Technologies, Newton, Mass., USA,
sampling frequency of 1 KHz) during an isometric half squat. This test was performed using a
custom built rack located over the force plate and bolted to the floor. Three maximal
voluntary isometric squats were performed with 1 min recovery between each attempt. Each
lift was performed for 3 seconds, during which all athletes were given strong verbal
encouragement. To ensure similar knee and hip angles during all tests, each athlete’s squat
depth was carefully monitored and marked on a scale on the rack. Similarly, placement of the
feet was monitored for each athlete to ensure identical test positions during all tests. All test
sessions were conducted using the same equipment with identical positioning of the athletes
relative to the equipment and monitored by the same investigator. The best attempt out of
three was reported as the isometric strength and used for statistical calculations.
Wingate test
After maximal strength testing before and after the entire 25 week intervention, a 15 min
warm-up (including 2-3 submaximal sprints and a 1-min rest) on the Lode cycle ergometer
was performed. The 30-s all-out Wingate test started while pedaling at 60 rpm without
braking resistance. Then, following a 3-s countdown, braking resistance was applied to the
flywheel and remained constant throughout the 30-s all-out test. Braking resistance was set to
0.8 Nm·kg-1 body mass. The cadence was sampled at 5 Hz and matching power output values
were calculated (Lode Ergometry Manager 9.3.1.0). Peak power output was presented as the
9
highest power output achieved at any time during the Wingate test. Mean power output was
presented as the average power output sustained throughout the 30 s. Cyclists remained seated
throughout the test and strong verbal encouragement was provided throughout. Cyclists were
instructed to pedal as fast as possible from the start and not to conserve energy for the last part
of the test.
Blood lactate profile test
A blood lactate profile was determined for each cyclist by plotting [la-] vs. power output
during submaximal continuous incremental cycling by a test described elsewhere (Rønnestad
et al. 2010a). Briefly, the test started without warm-up, with 5 min cycling at 125 W. Power
output was increased by 50 W every 5 min. At the end of each 5-min bout, blood was sampled
from a fingertip and were analyzed for whole blood [la-] using a Biosen C-Line lactate
analyzer (EKF diagnostic GmbH, Barleben, Germany). This continuous protocol was
terminated when [la-] of 4 mmol·L-1 or higher was measured. VO2, respiratory exchange ratio
(RER), and HR were measured during the last 3 min of each bout, and mean values were used
for statistical analysis. HR was measured using a Polar S610i heart rate monitor (Polar,
Kempele, Finland). VO2 was measured (30 s sampling time) using a computerized metabolic
system with mixing chamber (Oxycon Pro, Erich Jaeger, Hoechberg, Germany). The gas
analyzers were calibrated with certified calibration gases of known concentrations before
every test. The flow turbine (Triple V, Erich Jaeger, Hoechberg, Germany) was calibrated
before every test with a 3 l, 5530 series, calibration syringe (Hans Rudolph, Kansas City,
USA). Gross efficiency was calculated by the measured VO2 values and their matching RER
values to establish the energy expended and divide this by the power output and multiply by
100. Rating of perceived exertion (RPE) was recorded 4 min and 50 s into each bout, using
Borg’s 6-20 scale (Borg 1982). For each cyclist, the power output at 4 mmol·L-1 [la-] was
10
calculated from the relationship between [la-] and power output using linear regression.
Cyclists initially selected their preferred pedal cadence, which they were then required to hold
constant throughout all testing sessions.
Pedal force measurements
The torque generated at the crank axle was measured by strain gauges developed and bonded
on to the crank arm by the Lode cycle ergometer manufacturer. The torque acting
perpendicular to the crank was recorded at every 2º. The peak torque (mean of the highest
propulsive torque during the downstroke phase), angle of peak torque (in degrees), and
minimum torque (mean of the highest resistive torque during the upstroke phase, mainly
caused by the weight of the limb moving upwards) were averaged from both legs. Crank
angle was referenced to 0° at the top dead center and 180° at the bottom dead center and zero
adjustment calibration in Lode software was performed prior to every test (Lode Ergometry
Manager 9.3.1.0). The crank torque data was recorded as the average from 1.5 to 4.5 min
during the 5-min exercise period from the blood lactate profile that had the closest power
output to the power output at 4 mmol·L-1 [la-] (4.3 ± 0.4 W·kg-1 for the ES group and 4.3 ± 0.4
W·kg-1 for the E group). This power output was chosen due the experience that power output
at 4 mmol·L-1 [la-] is quite close to the mean power output during an 40-min all-out trial and
we wanted to relate the crank torque data to performance in the 40-min all-out trial. At post-
test, individual crank torque measurements were performed at the same power output and
using the same cadence as during the pretest.
VO2max test
After termination of the submaximal blood lactate profile test, the cyclists rested for 10
minutes before completing another incremental cycling test for determination of VO2max as
described elsewhere (Rønnestad et al. 2011a). Briefly, the cyclists completed a 10-min warm-
11
up followed by a 1-min rest. The test was then initiated with 1 min of cycling at a power
output corresponding to 3 W·kg–1 (rounded down to the nearest 50 W). Power output was
subsequently increased by 25 W every minute until exhaustion. VO2max was calculated as the
average of the two highest 30-s VO2 measurements. Wmax was calculated as the mean power
output during the last 2 min of the incremental test.
40 min all-out trial
The 40-min all-out trial was performed on the last test day and was initiated following a 20-
min individual warm-up, concluded by 2-3 submaximal sprints. The cyclists used their own
road racing bicycle connected to the same electromagnetically braked roller (Computrainer
LabTM, Racer Mate Inc, Seattle, WA, USA) at pre- and post-test. Similar and proper tire
pressure was ensured. After 15-min of the warm-up was the roller calibrated to quantify and
adjust wheel-ergometer rolling resistance to 2.5-3.5 lbs, as prescribed by the manufacturer.
This procedure was repeated just prior to start of the trial, whereupon the cyclists were asked
to rate their perceived feeling of wellbeing in the legs using a 9 point scale, going from very
very good to very very heavy (Rønnestad et al. 2012b). The cyclists were allowed to freely
adjust power output throughout the trial, and were allowed to freely change gearing and pedal
frequency, as if riding on the road. They were continuously provided feedback regarding
remaining time and instantaneous power output. The cyclists were instructed to cycle at as
high average power output as possible. Performance was measured as the average power
output during the trial. The cyclists were allowed to occasionally stand in the pedals during
the trial and to drink water ad libitum.
Statistical analysis
12
All data in the text, figures, and tables are presented as mean ± standard deviation. To test for
differences between groups at pre-intervention, unpaired Student’s t-tests were used. For each
group, measurements of maximal strength at pre-intervention, after 10 weeks, and after 25
weeks were compared using one-way repeated measures ANOVA. If the ANOVA reached
significance, a Tukey’s HSD test was performed for post hoc analysis. To test for differences
between groups in relative changes in maximal strength, two-way repeated measures ANOVA
(time of intervention and group as factors) with Bonferroni post hoc tests were performed to
evaluate differences. Due to the small sample size and expectations of small changes in these
elite cyclists, within and between group analyses on changes in cycling specific tests were
performed with paired and unpaired t-tests, respectively, and by calculation of effect size.
Effect sizes for the key performance/physiological adaptation measures were calculated as
Cohen’s d to compare the practical significance of the performance improvements among the
two groups. The criteria to interpret the magnitude of the effect size were; 0.0-0.2 trivial, 0.2-
0.6 small, 0.6-1.2 moderate, 1.2-2.0 large and >2.0 very large (Hopkins et al. 2009).
Correlation analyses were performed using the Pearson product-moment method and
correlation coefficients were interpreted according to Hopkins et al. (2009); r<0.1 = trivial,
0.1-0.3 = small, 0.3-0.5 = moderate, 0.5-0.7 = large, 0.7-0.9 = very large, 0.9 = nearly perfect,
and 1.0 = perfect. Multifactor regression analysis was performed on selected variables.
ANOVA analyses were performed in GraphPad Prism 5 (GraphPad Software Inc., CA, USA).
Student’s two-tailed t-tests were performed in Excel 2003 (Microsoft Corporation, Redmond,
WA, USA). All analyses resulting in p≤0.05 were considered statistically significant. P values
between 0.06 and 0.10 are described as tendencies.
RESULTS
Comparison of groups at pre-intervention

13
There were no significant differences between ES and E at pre-intervention except for body
mass. Therefore, maximal strength, VO2, and power output measurements are presented
relative to body mass.
Maximal strength, body mass, lean lower-body mass, and Wingate test
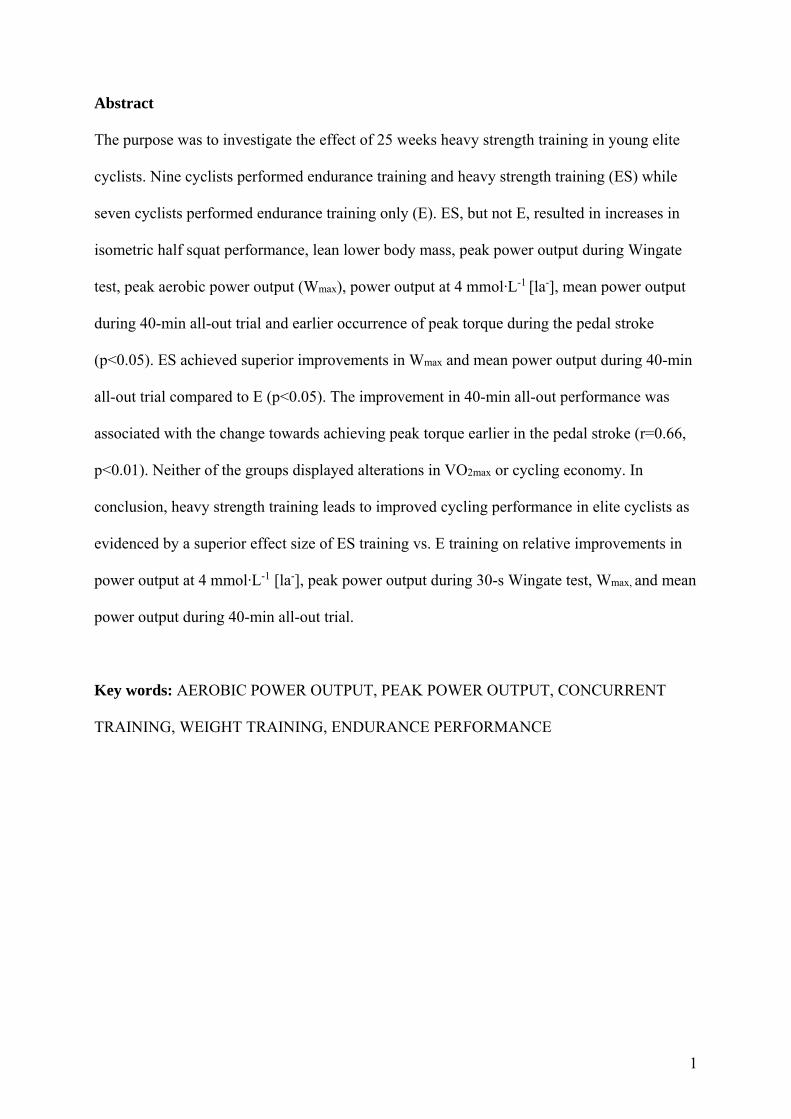
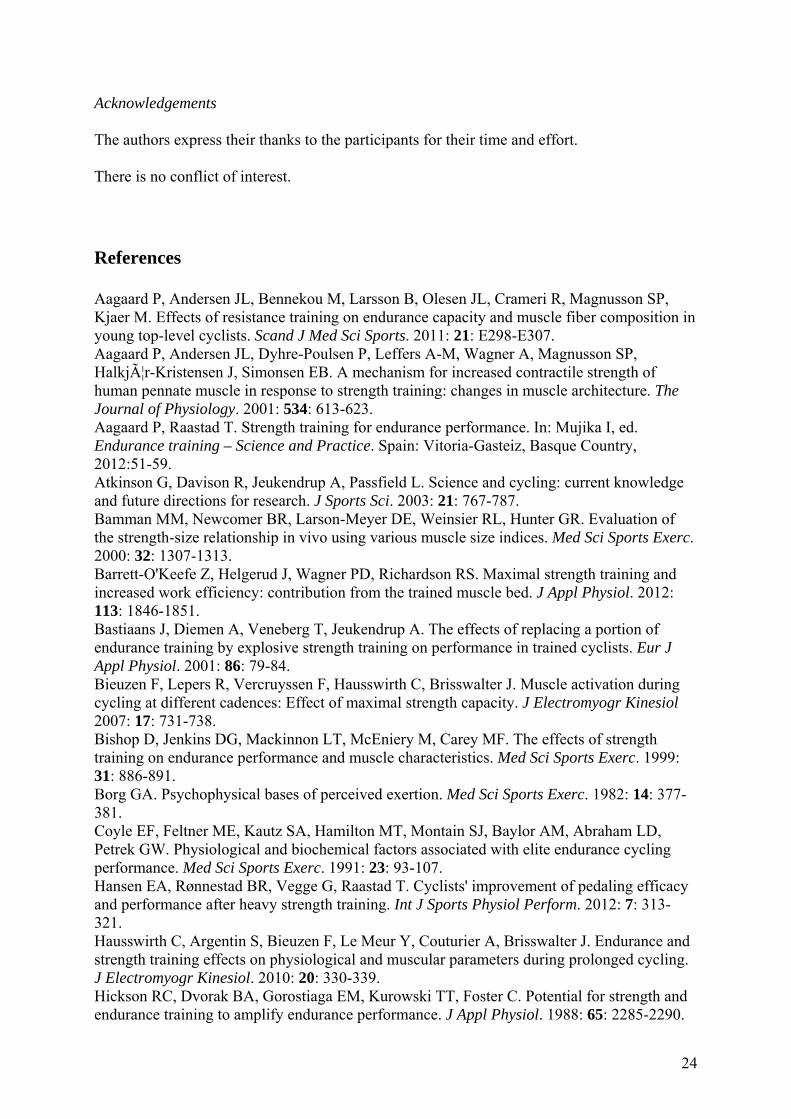
ES increased maximal strength in isometric half squat by 20±12% during the 10 weeks of
strength development (p<0.01). The increased strength was preserved during the following 15
week strength maintenance period (Figure 1). Maximal strength remained unchanged in E
from pre- to post-intervention (Figure 1). The change in maximal strength during the strength
development period and ultimately during the entire 25 weeks was larger in ES than in E
(p<0.01). Accordingly, an effect size analysis revealed a very large practical effect of ES
compared to E training (effect size=2.12). Overall body mass was slightly increased from pre-
intervention to 25 weeks in both ES (from 65.8±8.1 kg to 66.9±8.0 kg, p<0.05) and E (from
74.6±7.1 kg to 75.9±7.2 kg, p<0.05). Lean lower-body mass increased from pre- to post-
intervention by 2±1% in ES (from 19782±2944 to 20131±3066 g, p<0.05), while there was no
change in E (21599±3008 g vs 21728±2822 g, respectively, p>0.05). No statistical significant
difference were apparent in change of lean lower body mass between groups. However, an
effect size analysis revealed a small practical effect of ES compared to E (effect size=0.43).
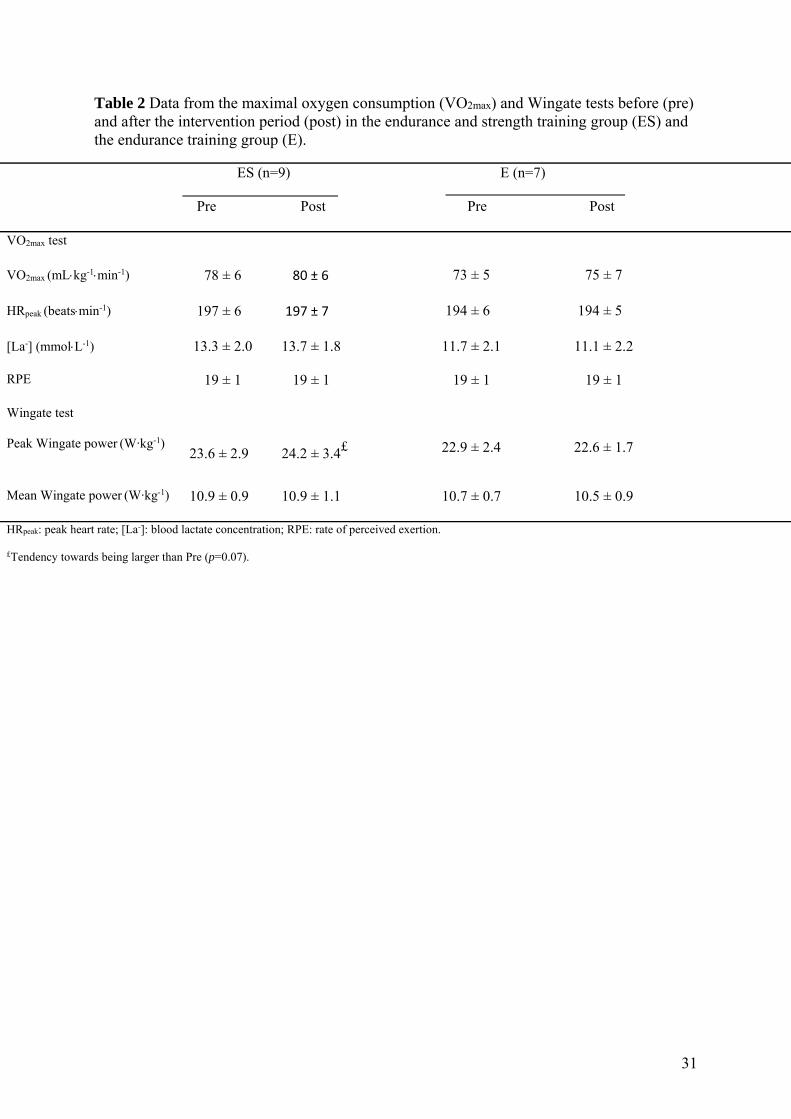
Peak power output in the 30-s Wingate test tended to increase by 2±3% in ES from pre- to
post-intervention (p=0.07, Table 2), while no change occurred in E. An effect size analysis
revealed a moderate effect of ES on peak power output compared to E (effect size=0.76).
Neither of the groups showed significant changes in mean power output in the 30-s Wingate
test (Table 2).
(Insert Figure 1 about here)
14
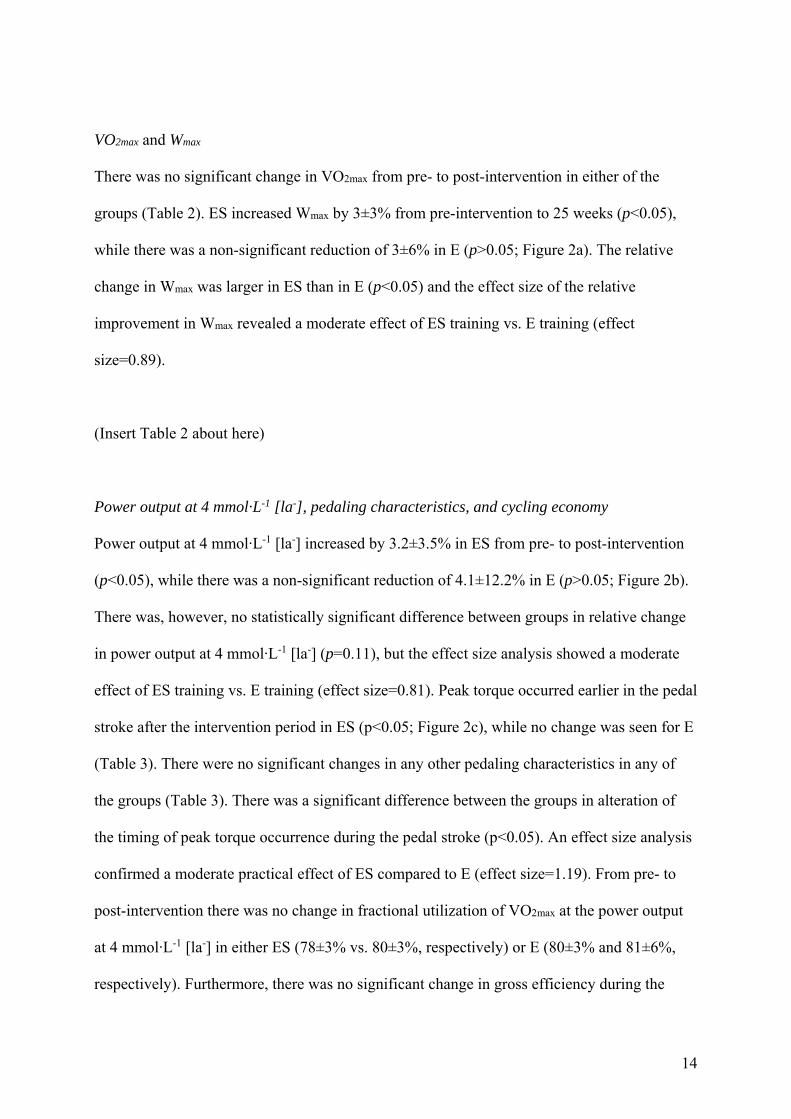
VO2max and Wmax
There was no significant change in VO2max from pre- to post-intervention in either of the
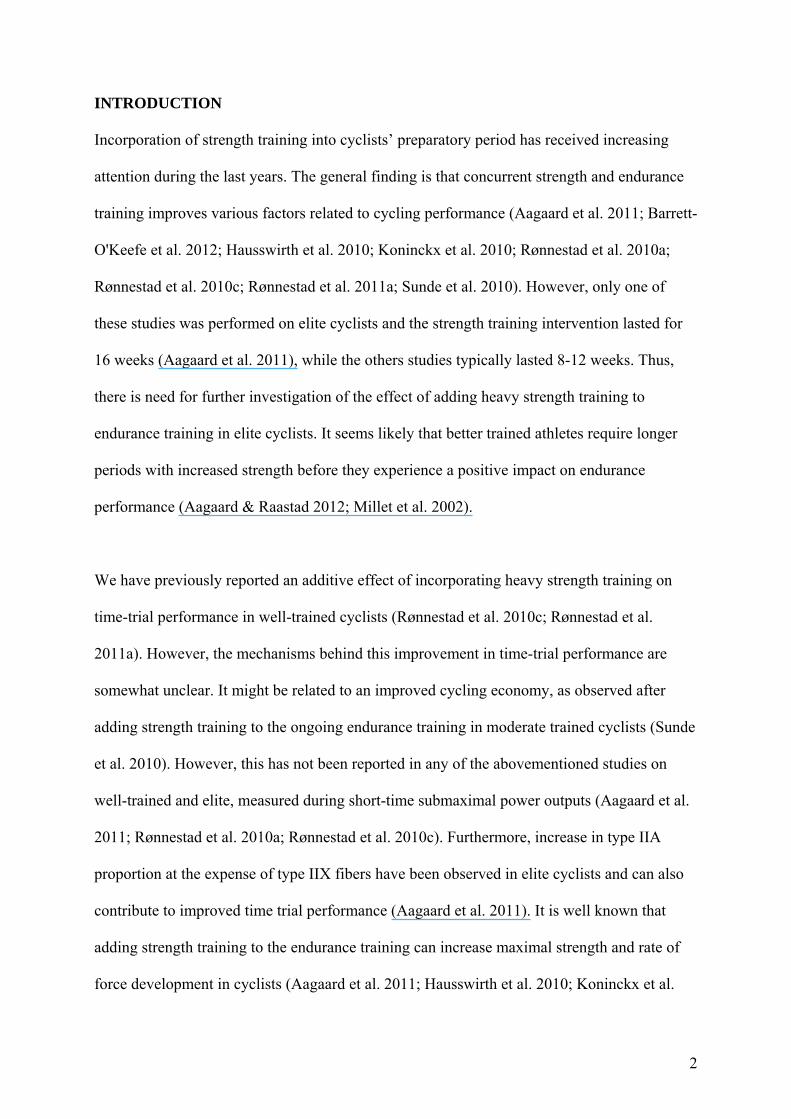
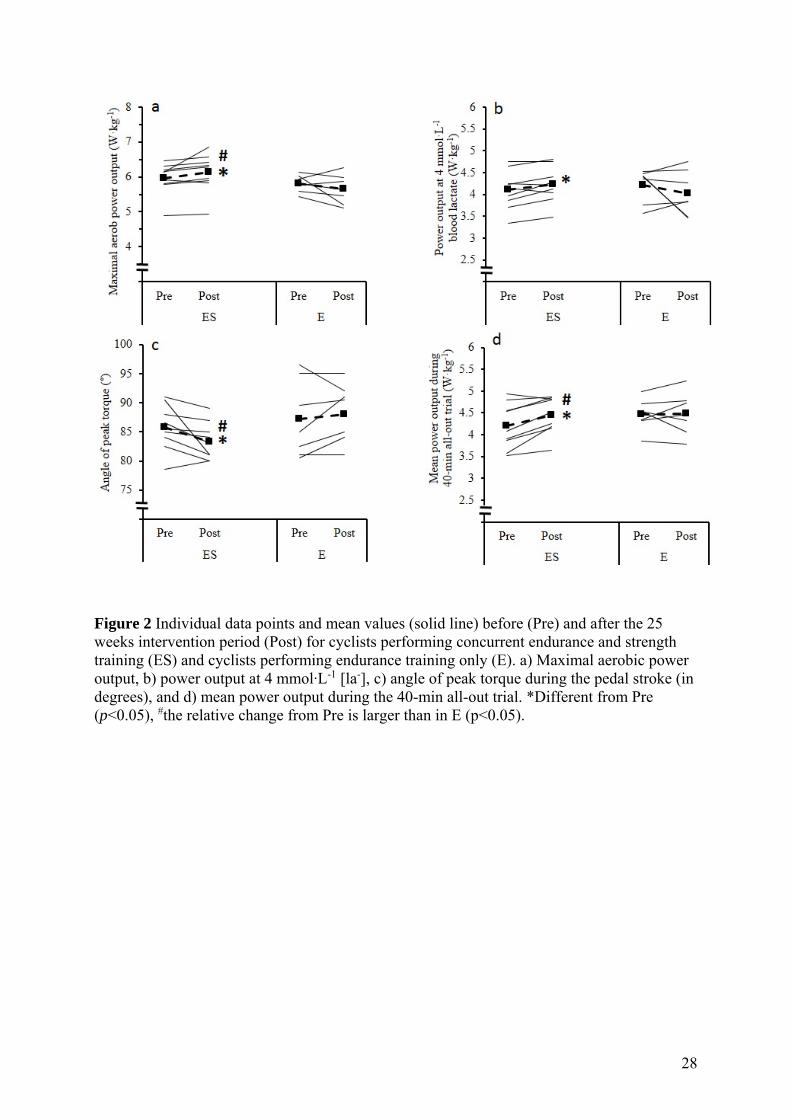
groups (Table 2). ES increased Wmax by 3±3% from pre-intervention to 25 weeks (p<0.05),
while there was a non-significant reduction of 3±6% in E (p>0.05; Figure 2a). The relative
change in Wmax was larger in ES than in E (p<0.05) and the effect size of the relative
improvement in Wmax revealed a moderate effect of ES training vs. E training (effect
size=0.89).
(Insert Table 2 about here)
Power output at 4 mmol·L-1 [la-], pedaling characteristics, and cycling economy
Power output at 4 mmol·L-1 [la-] increased by 3.2±3.5% in ES from pre- to post-intervention
(p<0.05), while there was a non-significant reduction of 4.1±12.2% in E (p>0.05; Figure 2b).
There was, however, no statistically significant difference between groups in relative change
in power output at 4 mmol·L-1 [la-] (p=0.11), but the effect size analysis showed a moderate
effect of ES training vs. E training (effect size=0.81). Peak torque occurred earlier in the pedal
stroke after the intervention period in ES (p<0.05; Figure 2c), while no change was seen for E
(Table 3). There were no significant changes in any other pedaling characteristics in any of
the groups (Table 3). There was a significant difference between the groups in alteration of
the timing of peak torque occurrence during the pedal stroke (p<0.05). An effect size analysis
confirmed a moderate practical effect of ES compared to E (effect size=1.19). From pre- to
post-intervention there was no change in fractional utilization of VO2max at the power output
at 4 mmol·L-1 [la-] in either ES (78±3% vs. 80±3%, respectively) or E (80±3% and 81±6%,
respectively). Furthermore, there was no significant change in gross efficiency during the
15
intervention period in any of the groups. The gross efficiency at a power output of 125 W, 175
W, 225 W, was 16.7±1.2%, 18.4±1.2%, and 19.2±0.8%, respectively, as mean values across
groups and time points of intervention.
(Insert Table 3 about here)
(Insert Figure 2 about here)
Power output in the 40-min all-out trial
Mean power output during the 40-min all-out trial increased from pre- to post-intervention in
ES (6.5±5.7%, p<0.01, Figure 2d), while no change occurred in E (Figure 2d). The relative
increase in mean power output was larger in ES than in E (p=0.05), which was confirmed
through an effect size analysis as a moderate effect of ES compared to E (effect size=1.04).
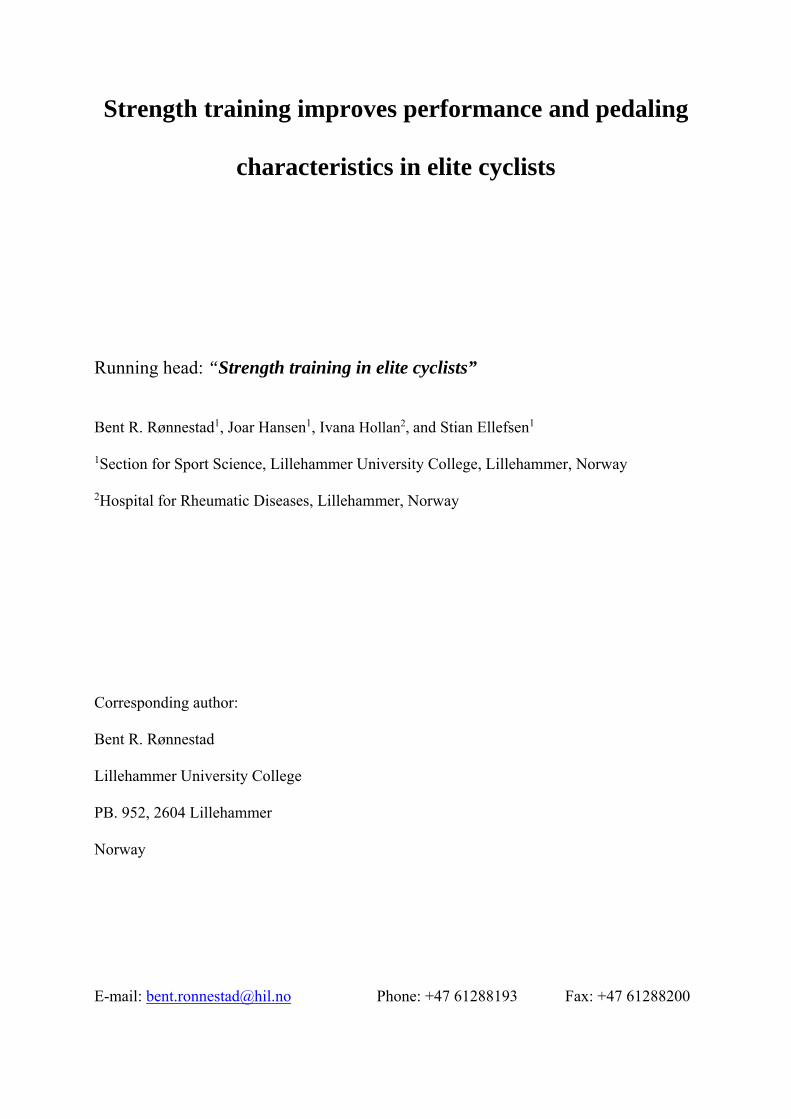
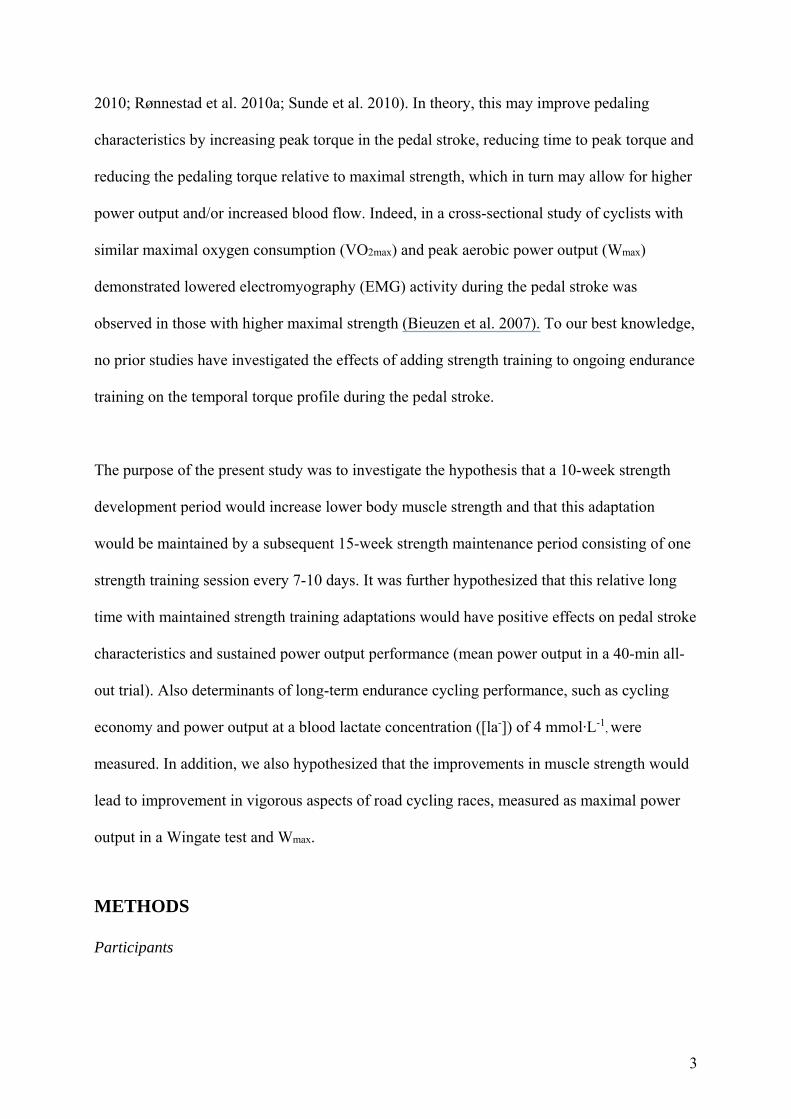
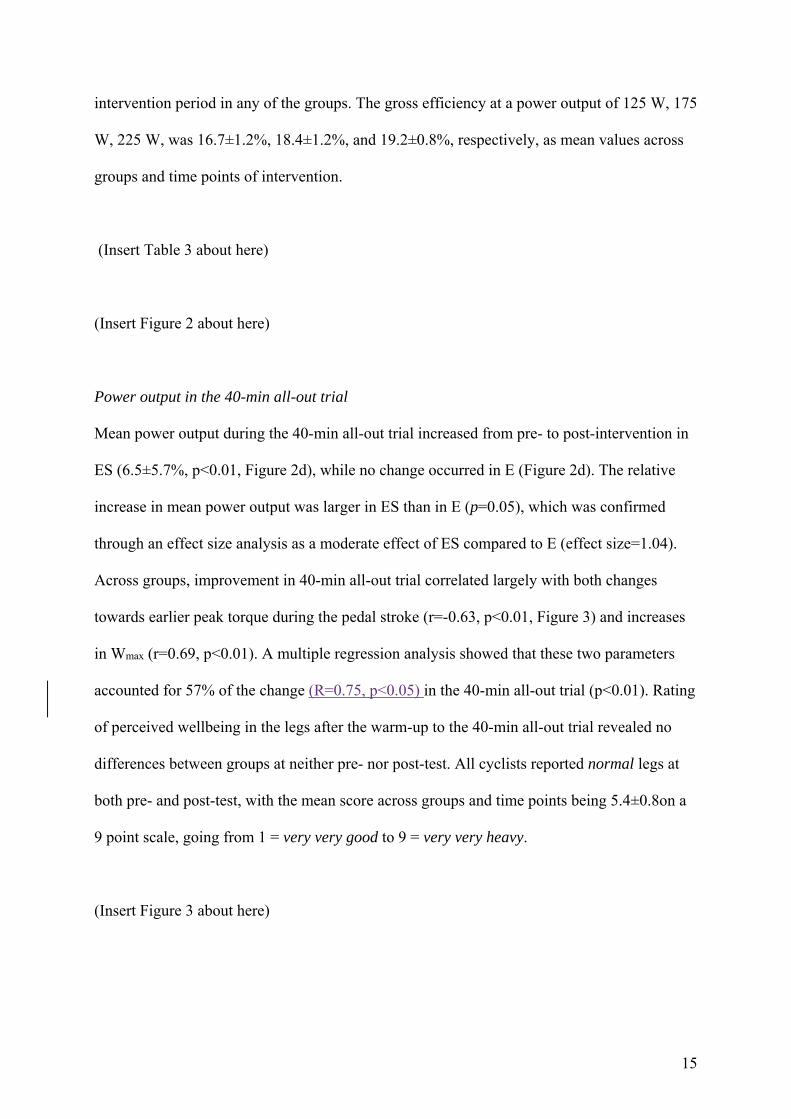
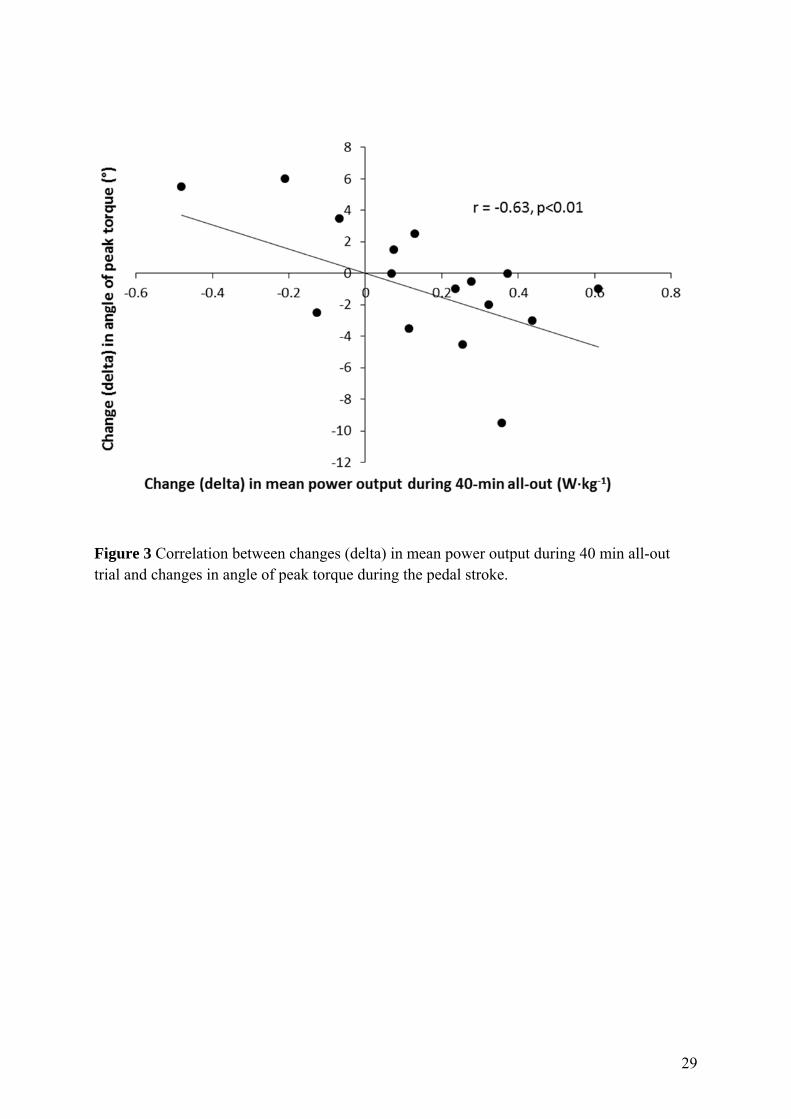
Across groups, improvement in 40-min all-out trial correlated largely with both changes
towards earlier peak torque during the pedal stroke (r=-0.63, p<0.01, Figure 3) and increases
in Wmax (r=0.69, p<0.01). A multiple regression analysis showed that these two parameters
accounted for 57% of the change (R=0.75, p<0.05) in the 40-min all-out trial (p<0.01). Rating
of perceived wellbeing in the legs after the warm-up to the 40-min all-out trial revealed no
differences between groups at neither pre- nor post-test. All cyclists reported normal legs at
both pre- and post-test, with the mean score across groups and time points being 5.4±0.8on a
9 point scale, going from 1 = very very good to 9 = very very heavy.
(Insert Figure 3 about here)
16
DISCUSSION
The novel finding of this study was that elite cyclists performing 10-week strength
development period followed by 15-week strength maintenance period achieved superior
improvements in Wmax and mean power output during 40-min all-out trial compared to the
control cyclists. The improvement in 40-min all-out performance was largely correlated with
changes towards earlier peak torque during the pedal stroke. Furthermore, the effect size of
the relative improvement in power output at 4 mmol·L-1 [la-], peak power output during 30-s
Wingate test, Wmax, and mean power output during 40-min all-out trial, revealed a moderate
effect of ES training vs. E training.
Strength, lean lower-body mass, and power output in Wingate test
Two strength-training sessions per week, as performed during the initial 10 weeks of the
intervention, increased leg strength by ~20%. This is in agreement with previous findings on
trained- to well-trained endurance athletes with a similar strength-training period (Osteras et
al. 2002; Rønnestad et al. 2010a; Sunde et al. 2010). Furthermore, the observed maintenance
effect is in agreement with observations from cyclists and soccer players showing that one
strength training session per week maintains maximal strength developed during a preceding
period of strength training (Rønnestad et al. 2010c; Rønnestad et al. 2011b). The 2% increase
in lean lower-body mass may be interpreted as some of the strength increase is due to
increased muscle mass. Measurement of lean mass is not able to distinguish between
different muscle groups (and their cross sectional area) in the lower-body and it is therefore
possible that the increase in main target muscles of the strength training is even larger or to
the contrary lower. Regional differences in muscle cross-sectional area adaptations to strength
training have been observed (e.g. Häkkinen et al. 2001) and it has been shown that the largest
cross-sectional area of a muscle determines the maximum strength of the muscle (Bamman et
17
al. 2000). That being said, the present increase in lean mass is in agreement with the
observation of 3% increase in lean body mass in elite cyclists (Aagaard et al. 2011), and a
4.5% increase in thigh muscle cross-sectional area has been observed in well-trained cyclists
(Rønnestad et al. 2010a) due to concurrent strength and endurance training. These minor gains
are substantially lower than the ~9-11% increase in cross-sectional area observed in studies
employing similar strength training, but without endurance training (Aagaard et al. 2001;
McCarthy et al. 2002; Rønnestad et al. 2012a). In the present study, both groups
demonstrated a small ~1 kg increase in total body weight from pre- to post-testing. This is
likely to be explained by a general tendency towards having a slightly lowered body weight
in-season (i.e. at the pre-test) as compared to the beginning of the next competitive season
(i.e. post-test). Elite endurance athletes have also previously been reported to have lower body
weight during in the competitive season (Losnegard et al. 2013).
Peak power output usually occurs during the first 5 s of an all-out Wingate test. Thus, peak
power output is mainly dependent on the size of the involved muscle mass and maximal leg
strength (Izquierdo et al. 2004). The observed increase in lean mass in the lower-body and leg
strength in ES in the current study may thus explain the observed tendency towards increased
peak power output. Correspondingly, the finding of no change in peak power output in E can
probably be explained by the lack of change in lean mass in the lower-body or leg strength.
The effect size showed a moderate practical effect of performing strength training on Wingate
peak power output. Evidently, this finding has practical implications, since the ability to
generate high power output during a short period of time is an important aspect of overall
cycling performance (Atkinson et al. 2003).
VO2max, Wmax, power output at 4 mmol·L-1 [la-], and pedaling characteristics
18
The lack of effect of heavy strength training on VO2max is in accordance with existing
literature (e.g. Aagaard et al. 2011; Osteras et al. 2002; Rønnestad et al. 2010a; Sunde et al.
2010). Due to the elite level of the present cyclists, no change in VO2max was expected during
the intervention period. Despite no change in VO2max, ES increased Wmax, while no changes
occurred in E and the effect size revealed a moderate practical effect of ES training on the
development of Wmax. This is interesting, since Wmax is considered particularly valuable for
distinguishing endurance performance in elite cyclists (Lucia et al. 1998). The importance of
Wmax is further underlined by the present finding of a large correlation between changes in
Wmax and change in mean power output during the 40-min all-out trial (r=0.69, p<0.01). In
line with these findings in elite cyclists, concurrent endurance and heavy strength training
have previously been shown to increase Wmax or time to exhaustion at Wmax in cyclists at
lower performance levels (Hickson et al. 1988; Rønnestad et al. 2010a; Sunde et al. 2010).
However, this positive effect in cyclists was not observed by using low-resistance explosive
strength training (Bastiaans et al. 2001) nor after short-term (6 weeks) strength training (Levin
et al. 2009).
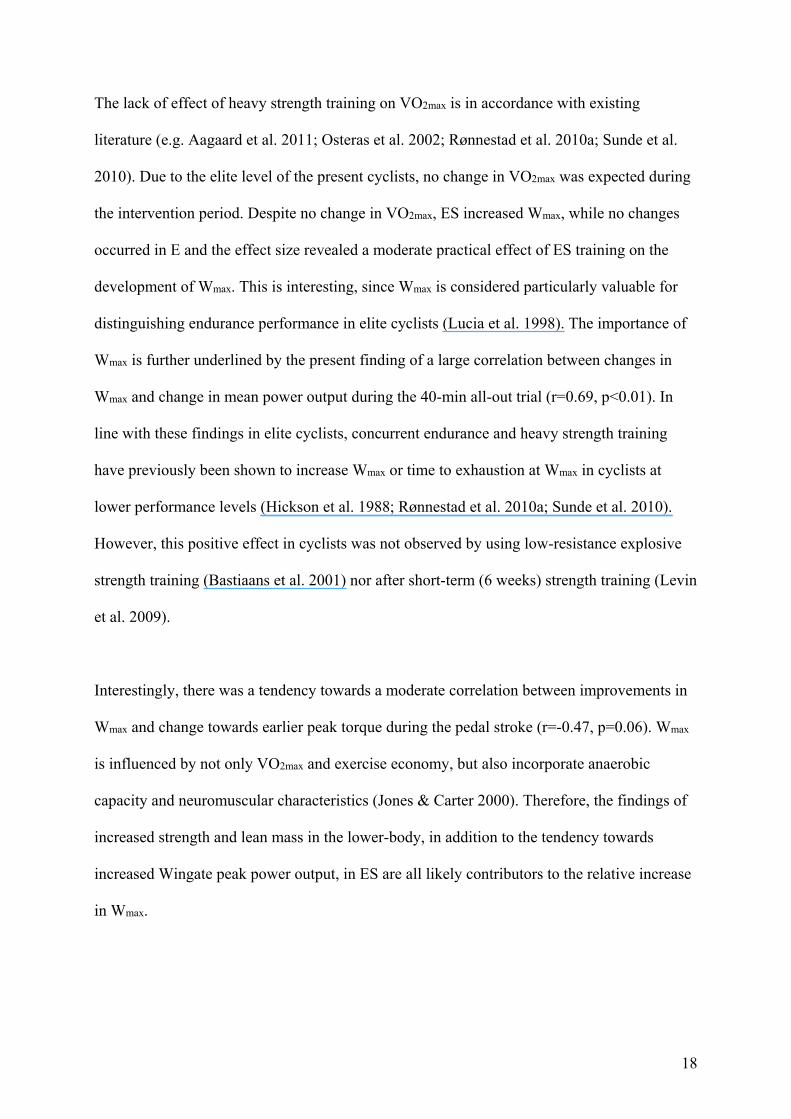
Interestingly, there was a tendency towards a moderate correlation between improvements in
Wmax and change towards earlier peak torque during the pedal stroke (r=-0.47, p=0.06). Wmax
is influenced by not only VO2max and exercise economy, but also incorporate anaerobic
capacity and neuromuscular characteristics (Jones & Carter 2000). Therefore, the findings of
increased strength and lean mass in the lower-body, in addition to the tendency towards
increased Wingate peak power output, in ES are all likely contributors to the relative increase
in Wmax.

19
Some studies report improved power output at a certain [la-] of concurrent strength and
endurance training (Koninckx et al. 2010; Rønnestad et al. 2010a; Rønnestad et al. 2010c),
while others report no effect (Aagaard et al. 2011; Bishop et al. 1999; Sunde et al. 2010). The
present study observed increased power output at 4 mmol·L-1 [la-] in ES and the effect size
analysis revealed a moderate practical effect of ES compared to E. The change in power
output at 4 mmol·L-1 [la-] correlated largely with a change towards earlier peak torque during
the pedal stroke (r=-0.50, p=0.05). To our knowledge, this is the first study to investigate the
effect of heavy strength training on when peak torque occurs during the pedal stroke in elite
cyclists.
It is interesting to note that 25 weeks of combined strength and endurance training led to
earlier occurrence of peak torque during the pedal stroke, while endurance training only did
not. The effect size of the changes showed that ES had a moderate practical effect. In
hypothesis, an earlier peak torque at the standardized submaximal power output might allow
for larger blood flow in working muscles by shortening the time frame with relative high
force production during each pedal stroke, thus increasing the duration of the blood flow-
friendly relaxation phase. Indeed, blood volume in musculus vastus lateralis during a pedal
stroke is at its lowest during peak torque in the downstroke and at its highest during the
upward relaxation phase (Takaishi et al. 2002). In theory, an increased blood flow will lead to
increased delivery of O2 and substrates to working muscles and thus contribute to increased
power output at a fixed [la-], but not necessarily improved exercise economy. In accordance
with our results, Aagaard et al. (2011) hypothesized that a potential explanation for their
finding of strength training induced improvement in 45-min all-out performance in elite
cyclists was a greater force–time integral (i.e. faster achievement of peak torque) during the
pedal stroke. The earlier occurrence of peak torque during the pedal stroke in ES can be
20
argued to be due to increased rate of force development (Aagaard et al. 2011). Concurrent
strength- and endurance training has also been shown to positively affect muscle-tendon
stiffness (Millet et al. 2002) and it might be suggested that a more efficient force transmission
due to a more optimal muscle-tendon stiffness could have contributed to the earlier timing of
peak pedal stroke torque observed in the present study.
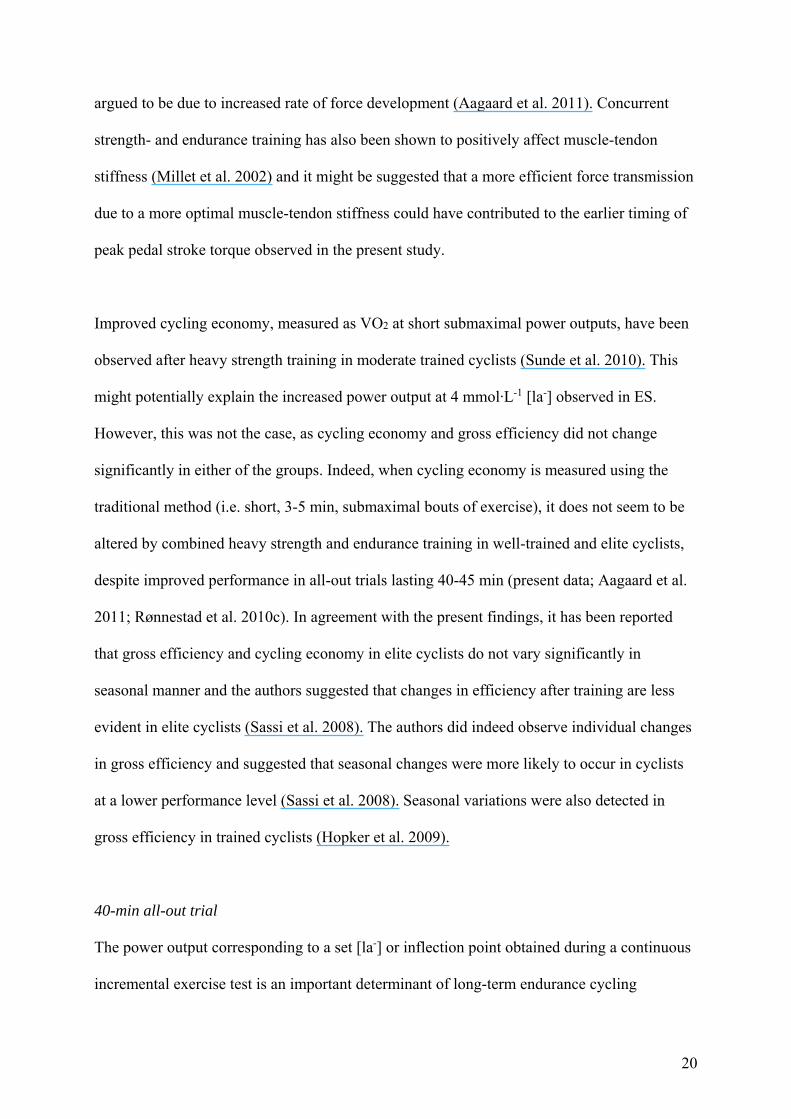
Improved cycling economy, measured as VO2 at short submaximal power outputs, have been
observed after heavy strength training in moderate trained cyclists (Sunde et al. 2010). This
might potentially explain the increased power output at 4 mmol·L-1 [la-] observed in ES.
However, this was not the case, as cycling economy and gross efficiency did not change
significantly in either of the groups. Indeed, when cycling economy is measured using the
traditional method (i.e. short, 3-5 min, submaximal bouts of exercise), it does not seem to be
altered by combined heavy strength and endurance training in well-trained and elite cyclists,
despite improved performance in all-out trials lasting 40-45 min (present data; Aagaard et al.
2011; Rønnestad et al. 2010c). In agreement with the present findings, it has been reported
that gross efficiency and cycling economy in elite cyclists do not vary significantly in
seasonal manner and the authors suggested that changes in efficiency after training are less
evident in elite cyclists (Sassi et al. 2008). The authors did indeed observe individual changes
in gross efficiency and suggested that seasonal changes were more likely to occur in cyclists
at a lower performance level (Sassi et al. 2008). Seasonal variations were also detected in
gross efficiency in trained cyclists (Hopker et al. 2009).
40-min all-out trial
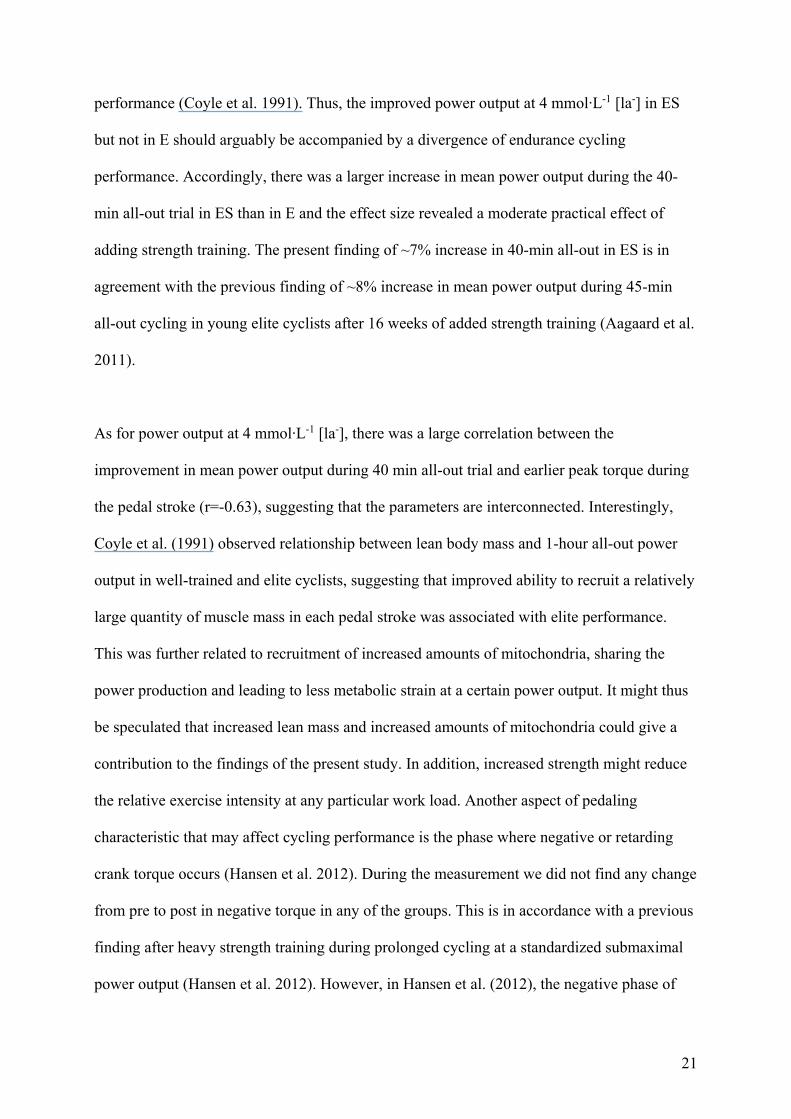
The power output corresponding to a set [la-] or inflection point obtained during a continuous
incremental exercise test is an important determinant of long-term endurance cycling
21
performance (Coyle et al. 1991). Thus, the improved power output at 4 mmol·L-1 [la-] in ES
but not in E should arguably be accompanied by a divergence of endurance cycling
performance. Accordingly, there was a larger increase in mean power output during the 40-
min all-out trial in ES than in E and the effect size revealed a moderate practical effect of
adding strength training. The present finding of ~7% increase in 40-min all-out in ES is in
agreement with the previous finding of ~8% increase in mean power output during 45-min
all-out cycling in young elite cyclists after 16 weeks of added strength training (Aagaard et al.
2011).
As for power output at 4 mmol·L-1 [la-], there was a large correlation between the
improvement in mean power output during 40 min all-out trial and earlier peak torque during
the pedal stroke (r=-0.63), suggesting that the parameters are interconnected. Interestingly,
Coyle et al. (1991) observed relationship between lean body mass and 1-hour all-out power
output in well-trained and elite cyclists, suggesting that improved ability to recruit a relatively
large quantity of muscle mass in each pedal stroke was associated with elite performance.
This was further related to recruitment of increased amounts of mitochondria, sharing the
power production and leading to less metabolic strain at a certain power output. It might thus
be speculated that increased lean mass and increased amounts of mitochondria could give a
contribution to the findings of the present study. In addition, increased strength might reduce
the relative exercise intensity at any particular work load. Another aspect of pedaling
characteristic that may affect cycling performance is the phase where negative or retarding
crank torque occurs (Hansen et al. 2012). During the measurement we did not find any change
from pre to post in negative torque in any of the groups. This is in accordance with a previous
finding after heavy strength training during prolonged cycling at a standardized submaximal
power output (Hansen et al. 2012). However, in Hansen et al. (2012), the negative phase of

22
the pedal stroke was found to be shortened by ~14% and the mean power output was
increased by 7% following ES in a 5-min all-out trial following 3 h of prolonged cycling.
Unfortunately, in the current study we did not measure the negative phase in such an all-out
setting, but one might speculate that the hip flexion exercise could positively contribute to the
observed performance improvement.
It has been suggested that strength training by increasing strength of type I muscle fibers
delays their time to exhaustion, thereby delaying activation of the less efficient type II muscle
fibers, in turn increasing endurance performance (Rønnestad & Mujika 2013). Strength
training increases maximal force, and therefore peak force or muscle fiber tension developed
in each movement cycle at the same absolute exercise intensity decreases to a lower
percentage of the maximal values. This might potentially induce less constriction of the blood
flow. On the other hand, a recent study on moderately trained cyclists by Barrett-O`Keefe et
al. (2012), showed that 8 weeks of heavy strength training improved work economy at a
cadence of 60 rpm, reducing muscular blood flow, while maintaining muscular arterial-
venous oxygen difference. The latter indicates that improvement in muscular efficiency is an
important mechanism behind improved work economy and improved endurance performance.
A cross-sectional study of cyclists with similar VO2max and Wmax, reported lower EMG
activity in cyclists with higher maximal strength (Bieuzen et al. 2007). Indications of
postponed activation of type II muscle fibers have been found in well-trained cyclists. After
12 weeks of strength training, a larger improvement in cycling economy was observed in the
strength-training group than in the control group during the last hour of 185-min submaximal
cycling (Rønnestad et al. 2011a). This was accompanied by reduced heart rate, RPE, [la-], and
improved performance in a 5-min all-out trial performed immediately following the 185 min
23
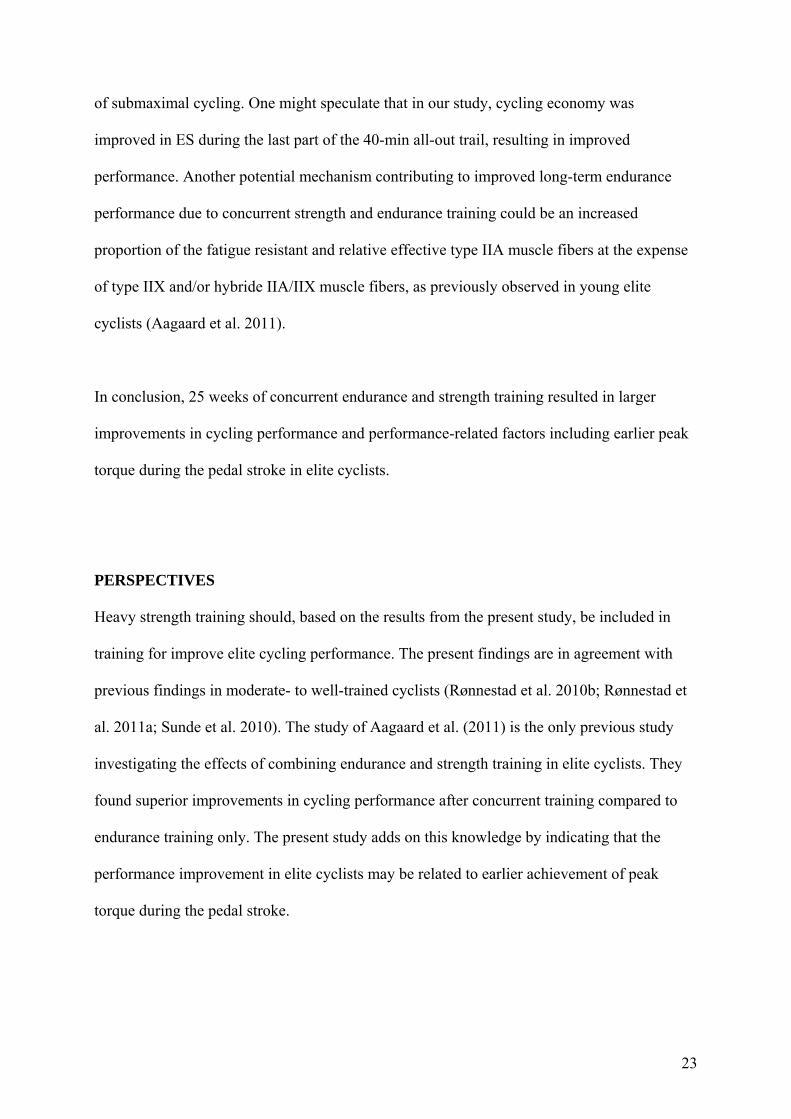
of submaximal cycling. One might speculate that in our study, cycling economy was
improved in ES during the last part of the 40-min all-out trail, resulting in improved
performance. Another potential mechanism contributing to improved long-term endurance
performance due to concurrent strength and endurance training could be an increased
proportion of the fatigue resistant and relative effective type IIA muscle fibers at the expense
of type IIX and/or hybride IIA/IIX muscle fibers, as previously observed in young elite
cyclists (Aagaard et al. 2011).
In conclusion, 25 weeks of concurrent endurance and strength training resulted in larger
improvements in cycling performance and performance-related factors including earlier peak
torque during the pedal stroke in elite cyclists.
PERSPECTIVES
Heavy strength training should, based on the results from the present study, be included in
training for improve elite cycling performance. The present findings are in agreement with
previous findings in moderate- to well-trained cyclists (Rønnestad et al. 2010b; Rønnestad et
al. 2011a; Sunde et al. 2010). The study of Aagaard et al. (2011) is the only previous study
investigating the effects of combining endurance and strength training in elite cyclists. They
found superior improvements in cycling performance after concurrent training compared to
endurance training only. The present study adds on this knowledge by indicating that the
performance improvement in elite cyclists may be related to earlier achievement of peak
torque during the pedal stroke.
24
Acknowledgements
The authors express their thanks to the participants for their time and effort.
There is no conflict of interest.
References
Aagaard P, Andersen JL, Bennekou M, Larsson B, Olesen JL, Crameri R, Magnusson SP, Kjaer M. Effects of resistance training on endurance capacity and muscle fiber composition in young top-level cyclists. Scand J Med Sci Sports. 2011: 21: E298-E307. Aagaard P, Andersen JL, Dyhre-Poulsen P, Leffers A-M, Wagner A, Magnusson SP, Halkjær-Kristensen J, Simonsen EB. A mechanism for increased contractile strength of human pennate muscle in response to strength training: changes in muscle architecture. The Journal of Physiology. 2001: 534: 613-623. Aagaard P, Raastad T. Strength training for endurance performance. In: Mujika I, ed. Endurance training – Science and Practice. Spain: Vitoria-Gasteiz, Basque Country, 2012:51-59. Atkinson G, Davison R, Jeukendrup A, Passfield L. Science and cycling: current knowledge and future directions for research. J Sports Sci. 2003: 21: 767-787. Bamman MM, Newcomer BR, Larson-Meyer DE, Weinsier RL, Hunter GR. Evaluation of the strength-size relationship in vivo using various muscle size indices. Med Sci Sports Exerc. 2000: 32: 1307-1313. Barrett-O'Keefe Z, Helgerud J, Wagner PD, Richardson RS. Maximal strength training and increased work efficiency: contribution from the trained muscle bed. J Appl Physiol. 2012: 113: 1846-1851. Bastiaans J, Diemen A, Veneberg T, Jeukendrup A. The effects of replacing a portion of endurance training by explosive strength training on performance in trained cyclists. Eur J Appl Physiol. 2001: 86: 79-84. Bieuzen F, Lepers R, Vercruyssen F, Hausswirth C, Brisswalter J. Muscle activation during cycling at different cadences: Effect of maximal strength capacity. J Electromyogr Kinesiol 2007: 17: 731-738. Bishop D, Jenkins DG, Mackinnon LT, McEniery M, Carey MF. The effects of strength training on endurance performance and muscle characteristics. Med Sci Sports Exerc. 1999: 31: 886-891. Borg GA. Psychophysical bases of perceived exertion. Med Sci Sports Exerc. 1982: 14: 377-381. Coyle EF, Feltner ME, Kautz SA, Hamilton MT, Montain SJ, Baylor AM, Abraham LD, Petrek GW. Physiological and biochemical factors associated with elite endurance cycling performance. Med Sci Sports Exerc. 1991: 23: 93-107. Hansen EA, Rønnestad BR, Vegge G, Raastad T. Cyclists' improvement of pedaling efficacy and performance after heavy strength training. Int J Sports Physiol Perform. 2012: 7: 313-321. Hausswirth C, Argentin S, Bieuzen F, Le Meur Y, Couturier A, Brisswalter J. Endurance and strength training effects on physiological and muscular parameters during prolonged cycling. J Electromyogr Kinesiol. 2010: 20: 330-339. Hickson RC, Dvorak BA, Gorostiaga EM, Kurowski TT, Foster C. Potential for strength and endurance training to amplify endurance performance. J Appl Physiol. 1988: 65: 2285-2290.
25
Hopker J, Coleman D, Passfield L. Changes in Cycling Efficiency during a Competitive Season. Med Sci Sports Exerc. 2009: 41: 912-919. Hopkins WG, Marshall SW, Batterham AM, Hanin J. Progressive Statistics for Studies in Sports Medicine and Exercise Science. Med Sci Sports Exerc. 2009: 41: 3-12. Häkkinen K, Pakarinen A, Kraemer WJ, Häkkinen A, Valkeinen H, Alen M. Selective muscle hypertrophy, changes in EMG and force, and serum hormones during strength training in older women. Journal of Applied Physiology. 2001: 91: 569-580. Izquierdo M, Ibanez J, Hakkinen K, Kraemer WJ, Ruesta M, Gorostiaga EM. Maximal strength and power, muscle mass, endurance and serum hormones in weightlifters and road cyclists. J Sports Sci. 2004: 22: 465-478. Jeukendrup AE, Craig NP, Hawley JA. The bioenergetics of world class cycling. Journal of Science and Medicine in Sport. 2000: 3: 414-433. Jones AM, Carter H. The effect of endurance training on parameters of aerobic fitness. Sports Med. 2000: 29: 373-386. Koninckx E, Van Leemputte M, Hespel P. Effect of isokinetic cycling versus weight training on maximal power output and endurance performance in cycling. Eur J Appl Physiol. 2010: 109: 699-708. Levin GT, McGuigan MR, Laursen PB. Effect of concurrent resistance and endurance training on physiologic and performance parameters of well-trained endurance cyclists. J Strength Cond Res. 2009: 23: 2280-2286. Losnegard T, Myklebust H, Spencer M, Hallén J. Seasonal Variations in V[Combining Dot Above]O2max, O2-Cost, O2-Deficit, and Performance in Elite Cross-Country Skiers. J Strength Cond Res. 2013: 27: 1780-1790 1710.1519/JSC.1780b1013e31827368f31827366. Lucia A, Pardo J, Durantez A, Hoyos J, Chicharro JL. Physiological differences between professional and elite road cyclists. Int J Sports Med. 1998: 19: 342-348. McCarthy JP, Pozniak MA, Agre JC. Neuromuscular adaptations to concurrent strength and endurance training. Med Sci Sports Exerc. 2002: 34: 511-519. Millet GP, Jaouen B, Borrani F, Candau R. Effects of concurrent endurance and strength training on running economy and VO2 kinetics. Med Sci Sports Exerc. 2002: 34: 1351-1359. Osteras H, Helgerud J, Hoff J. Maximal strength-training effects on force-velocity and force-power relationships explain increases in aerobic performance in humans. Eur J Appl Physiol. 2002: 88: 255-263. Rønnestad BR, Hansen EA, Raastad T. Effect of heavy strength training on thigh muscle cross-sectional area, performance determinants, and performance in well-trained cyclists. Eur J Appl Physiol. 2010a: 108: 965-975. Rønnestad BR, Hansen EA, Raastad T. Effect of heavy strength training on thigh muscle cross-sectional area, performance determinants, and performance in well-trained cyclists. European Journal of Applied Physiology. 2010b: 108: 965-975. Rønnestad BR, Hansen EA, Raastad T. In-season strength maintenance training increases well-trained cyclists' performance. Eur J Appl Physiol. 2010c: 110: 1269-1282. Rønnestad BR, Hansen EA, Raastad T. Strength training improves 5-min all-out performance following 185 min of cycling. Scand J Med Sci Sports. 2011a: 21: 250-259. Rønnestad BR, Hansen EA, Raastad T. High volume of endurance training impairs adaptations to 12 weeks of strength training in well-trained endurance athletes. Eur J Appl Physiol. 2012a: 112: 1457-1466. Rønnestad BR, Hansen J, Ellefsen S. Block periodization of high-intensity aerobic intervals provides superior training effects in trained cyclists. Scand J Med Sci Sports. 2012b: n/a-n/a. Rønnestad BR, Mujika I. Optimizing strength training for running and cycling endurance performance: A review. Scand J Med Sci Sports. 2013: n/a-n/a.
26
Rønnestad BR, Nymark BS, Raastad T. Effects of in-season strength maintenance training frequency i professional soccer players. J Strength Cond Res. 2011b: 25: 2653-2660. Sassi A, Impellizzeri FM, Morelli A, Menaspa P, Rampinini E. Seasonal changes in aerobic fitness indices in elite cyclists. Appl Physiol Nutr Metab. 2008: 33: 735-742. Sunde A, Storen O, Bjerkaas M, Larsen MH, Hoff J, Helgerud J. Maximal strength training improves cycling economy in competitive cyclists. J Strength Cond Res. 2010: 24: 2157-2165. Takaishi T, Sugiura T, Katayama K, Sato Y, Shima N, Yamamoto T, Moritani T. Changes in blood volume and oxygenation level in a working muscle during a crank cycle. Med Sci Sports Exerc. 2002: 34: 520-528.
27
Figures
Figure 1 Maximal strength in isometric half squat at before the intervention period (pre), after the 10-week strength development period (10 weeks), and after the 15 week strength maintenance period (post) for the cyclists performing endurance training and strength training (ES) and the cyclists performing endurance training only (E). *Larger than at Pre (p<0.01), #the relative change from Pre is larger than in E (p<0.01).
28
Figure 2 Individual data points and mean values (solid line) before (Pre) and after the 25 weeks intervention period (Post) for cyclists performing concurrent endurance and strength training (ES) and cyclists performing endurance training only (E). a) Maximal aerobic power output, b) power output at 4 mmol·L-1 [la-], c) angle of peak torque during the pedal stroke (in degrees), and d) mean power output during the 40-min all-out trial. *Different from Pre (p<0.05), #the relative change from Pre is larger than in E (p<0.05).
29
Figure 3 Correlation between changes (delta) in mean power output during 40 min all-out trial and changes in angle of peak torque during the pedal stroke.
30
Table 1 Duration (in hours per week) of the endurance training performed during the 10-week strength development phase (week 1-10) and the 15 week strength maintenance period (week 11-15) in the group that performed endurance and strength training (ES) and the group that performed only endurance training (E). Intensity zone ES
Week 1-10 Week 11-25
E
Week 1-10 Week 11-25
Intensity zone I
(60%-82% of HRmax)
7.9 ± 2.0 12.3 ± 3.1 10.1 ± 2.6 13.4 ± 3.7
Intensity zone II
(83%-87% of HRmax)
1.2 ± 0.6 1.4 ± 0.9 1.1 ± 0.5 1.2 ± 0.6
Intensity zone III
(88%-100% of HRmax)
0.7 ± 0.4 0.8 ± 0.4 0.6 ± 0.4 0.7 ± 0.4
Heavy strength training 1.4 ± 0.1 0.6 ± 0.1 0 0
Total training time 11.3 ± 1.5 15.2 ± 3.1 11.7 ± 3.1 15.3 ± 3.9
Values are mean±SD. HRmax: maximal heart rate
31
Table 2 Data from the maximal oxygen consumption (VO2max) and Wingate tests before (pre) and after the intervention period (post) in the endurance and strength training group (ES) and the endurance training group (E).
ES (n=9)
Pre Post
E (n=7)
Pre Post
VO2max test
VO2max (mLkg-1min-1) 78 ± 6 80 ± 6 73 ± 5 75 ± 7
HRpeak (beatsmin-1) 197 ± 6 197 ± 7 194 ± 6 194 ± 5
[La-] (mmolL-1) 13.3 ± 2.0 13.7 ± 1.8 11.7 ± 2.1 11.1 ± 2.2
RPE 19 ± 1 19 ± 1 19 ± 1 19 ± 1
Wingate test
Peak Wingate power (W·kg-1)
23.6 ± 2.9 24.2 ± 3.4£
22.9 ± 2.4 22.6 ± 1.7
Mean Wingate power (W·kg-1) 10.9 ± 0.9 10.9 ± 1.1 10.7 ± 0.7 10.5 ± 0.9
HRpeak: peak heart rate; [La-]: blood lactate concentration; RPE: rate of perceived exertion.
£Tendency towards being larger than Pre (p=0.07).
32
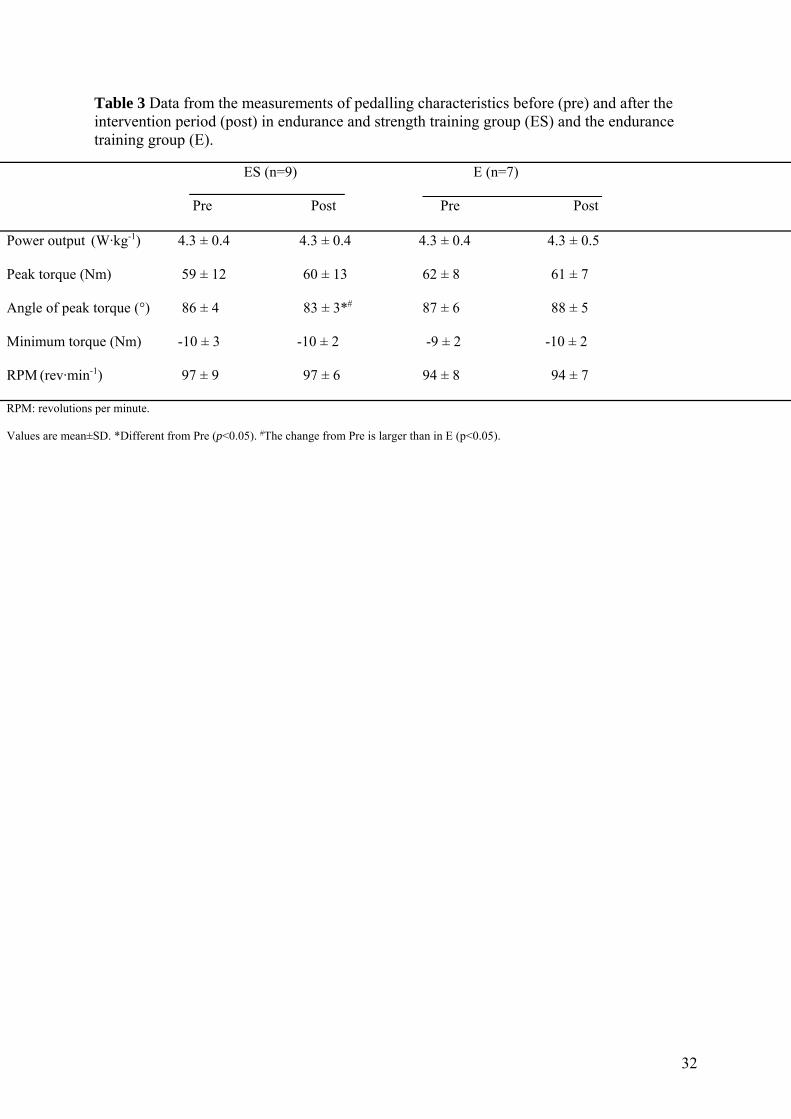
Table 3 Data from the measurements of pedalling characteristics before (pre) and after the intervention period (post) in endurance and strength training group (ES) and the endurance training group (E).
ES (n=9)
Pre Post
E (n=7)
Pre Post
Power output (W·kg-1) 4.3 ± 0.4 4.3 ± 0.4 4.3 ± 0.4 4.3 ± 0.5
Peak torque (Nm) 59 ± 12 60 ± 13 62 ± 8 61 ± 7
Angle of peak torque (°) 86 ± 4 83 ± 3*# 87 ± 6 88 ± 5
Minimum torque (Nm) -10 ± 3 -10 ± 2 -9 ± 2 -10 ± 2
RPM (rev·min-1) 97 ± 9 97 ± 6 94 ± 8 94 ± 7
RPM: revolutions per minute.
Values are mean±SD. *Different from Pre (p<0.05). #The change from Pre is larger than in E (p<0.05).
Copyright © 2022 FDOKUMEN