Display Content Change Rate Analysis for Power Saving in ...
11
Display Content Change Rate Analysis for Power Saving in Transmissive Panels Raghu Bankapur 1 , Krishna Kishor Jha 2 and Vaisakh P. S. 3 1 Technical Lead, Multimedia & Systems Division, Samsung R&D Institute India Bangalore Pvt. Ltd, 16/1, 8th Cross, Muni Reddy Layout, Mahadevapura, 560048, Bangalore, Karnataka, India 2 Technical Lead, Multimedia & Systems Division, Samsung R&D Institute India Bangalore Pvt. Ltd, #303, Thirunaga Wings, 2nd Cross, Byrasandra, C V Raman Nagar, 560093, Bangalore, Karnataka, India 3 Technical Manager, Multimedia & Systems Division, Samsung R&D Institute India Bangalore Pvt. Ltd, 2870, Phoenix Building, Bagmance Constellation Business Park, Doddenakundi, 560037, Bangalore, Karnataka, India Keywords: Backlight Control, Color Distribution Coefficient, Content Change Rate Coefficient, Luminance, Panel Tuning Lookup Table, Self-Organizing Map. Abstract: Energy conservation to protract battery life is a major challenge for sustained richer user experience in mobile devices. This paper presents Content Change Rate Coefficient (CCRC) and image Color Distribution Coefficient (CDC) based method to govern backlight scaling and image luminosity adjustment to reduce power consumption in backlight module. The existing methods intending to achieve similar results have significant shortcomings like inter-frame brightness distortion, flickering effects, clipping artifacts, color distortion. These problems are addressed in proposed technique and user's visual perception is not compromised while ensuring image fidelity (less than 6.2% degradation) and reduces nearly 80mA current consumption. Proposed method derives Aggressiveness Coefficient from color distribution and content change rate to address above problems. Method is prototyped on Samsung Galaxy Tab AS and Galaxy Mega2 and experimental results clearly show 16% reduction in current consumption and 88% reduction in flickering artifacts, which is active phone usage time getting extended by ~1hr for an average usage of 20hrs. 1 INTRODUCTION Users of portable consumer electronics products, such as mobile phones, tablets, GPS etc. reckon to operate these devices for a longer period of time. So these product manufacturers always strive towards constantly optimizing their power consumption to meet this objective. Transmissive panel is one of the most common Liquid Crystal Display (LCD) screen, which requires a backlight as the light source and there is no reflective film in the back of LCD screen. These types of LCDs are preferred over other display technologies in wide range of consumer products because of low cost, manufacturing ease, light weight, high resolution, good color performance and other advantages. However, there are some downsides i.e. low image contrast ratio and constant power consumption irrespective of image displayed. In typical LCDs, the image is displayed by controlling the LC transparency with constant backlight luminance. The image contrast ratio for such display panels is impoverished because the light is not blocked completely at the lowest gray level. In LCD based products power is primarily attributed to backlight, nearly 90% (Carroll and Heiser, 2010); because the backlight always operates with the constant luminance regardless of input image and content based backlight control is considered as one of the most effective technique for power saving in LCD panels. Several methods are proposed in the literature (Tsai et al., 2009; Kerofsky and Daly, 2006; Chen et al., 2013; Choi et al., 2002; Raman and Hekstra, 2005; Cheng et al., 2004; Hsiu et al., 2011) that leverage this and reduce power consumption. However, they are prone to multiple artifacts (Hsiu et al., 2011) like inter-frame brightness distortion, frequent flickering effects, clipping at saturated pixels, color distortion etc. due to irresolute operation. 446 Bankapur, R., Jha, K. and S., V. Display Content Change Rate Analysis for Power Saving in Transmissive Panels. DOI: 10.5220/0005733404460456 In Proceedings of the 5th International Conference on Pattern Recognition Applications and Methods (ICPRAM 2016), pages 446-456 ISBN: 978-989-758-173-1 Copyright c 2016 by SCITEPRESS – Science and Technology Publications, Lda. All rights reserved
-
Upload
khangminh22 -
Category
Documents
-
view
3 -
download
0
Transcript of Display Content Change Rate Analysis for Power Saving in ...

Display Content Change Rate Analysis for Power Saving in Transmissive Panels
Raghu Bankapur1, Krishna Kishor Jha2 and Vaisakh P. S.3 1Technical Lead, Multimedia & Systems Division, Samsung R&D Institute India Bangalore Pvt. Ltd, 16/1, 8th Cross,
Muni Reddy Layout, Mahadevapura, 560048, Bangalore, Karnataka, India 2Technical Lead, Multimedia & Systems Division, Samsung R&D Institute India Bangalore Pvt. Ltd, #303, Thirunaga
Wings, 2nd Cross, Byrasandra, C V Raman Nagar, 560093, Bangalore, Karnataka, India 3Technical Manager, Multimedia & Systems Division, Samsung R&D Institute India Bangalore Pvt. Ltd, 2870, Phoenix
Building, Bagmance Constellation Business Park, Doddenakundi, 560037, Bangalore, Karnataka, India
Keywords: Backlight Control, Color Distribution Coefficient, Content Change Rate Coefficient, Luminance, Panel Tuning Lookup Table, Self-Organizing Map.
Abstract: Energy conservation to protract battery life is a major challenge for sustained richer user experience in mobile devices. This paper presents Content Change Rate Coefficient (CCRC) and image Color Distribution Coefficient (CDC) based method to govern backlight scaling and image luminosity adjustment to reduce power consumption in backlight module. The existing methods intending to achieve similar results have significant shortcomings like inter-frame brightness distortion, flickering effects, clipping artifacts, color distortion. These problems are addressed in proposed technique and user's visual perception is not compromised while ensuring image fidelity (less than 6.2% degradation) and reduces nearly 80mA current consumption. Proposed method derives Aggressiveness Coefficient from color distribution and content change rate to address above problems. Method is prototyped on Samsung Galaxy Tab AS and Galaxy Mega2 and experimental results clearly show 16% reduction in current consumption and 88% reduction in flickering artifacts, which is active phone usage time getting extended by ~1hr for an average usage of 20hrs.
1 INTRODUCTION
Users of portable consumer electronics products, such as mobile phones, tablets, GPS etc. reckon to operate these devices for a longer period of time. So these product manufacturers always strive towards constantly optimizing their power consumption to meet this objective.
Transmissive panel is one of the most common Liquid Crystal Display (LCD) screen, which requires a backlight as the light source and there is no reflective film in the back of LCD screen. These types of LCDs are preferred over other display technologies in wide range of consumer products because of low cost, manufacturing ease, light weight, high resolution, good color performance and other advantages. However, there are some downsides i.e. low image contrast ratio and constant power consumption irrespective of image displayed. In typical LCDs, the image is displayed by
controlling the LC transparency with constant backlight luminance. The image contrast ratio for such display panels is impoverished because the light is not blocked completely at the lowest gray level. In LCD based products power is primarily attributed to backlight, nearly 90% (Carroll and Heiser, 2010); because the backlight always operates with the constant luminance regardless of input image and content based backlight control is considered as one of the most effective technique for power saving in LCD panels. Several methods are proposed in the literature (Tsai et al., 2009; Kerofsky and Daly, 2006; Chen et al., 2013; Choi et al., 2002; Raman and Hekstra, 2005; Cheng et al., 2004; Hsiu et al., 2011) that leverage this and reduce power consumption. However, they are prone to multiple artifacts (Hsiu et al., 2011) like inter-frame brightness distortion, frequent flickering effects, clipping at saturated pixels, color distortion etc. due to irresolute operation.
446Bankapur, R., Jha, K. and S., V.Display Content Change Rate Analysis for Power Saving in Transmissive Panels.DOI: 10.5220/0005733404460456In Proceedings of the 5th International Conference on Pattern Recognition Applications and Methods (ICPRAM 2016), pages 446-456ISBN: 978-989-758-173-1Copyright c© 2016 by SCITEPRESS – Science and Technology Publications, Lda. All rights reserved

The present paper proposed a unique method to effectively overcome these defects comparable to conventional methods, while maintaining the richer user experience. Most importantly, proposed method conserves power. In particular we make below three contributions addressing following research questions.
First, how to minimize inter-frame brightness distortion and frequent flickering effects? A Content Change Rate based Coefficient (CCRC) is derived to restrict frequent backlight modifications to reduce flickering effects and inter-frame distortion by 88%. This is presented in section 3.1, 4.2, 5.2.
Second, how to minimize color distortion and clipping at saturated pixels? An image classification model to classify image into color rich and simple UI with 93% accuracy is modelled. The pixel level modifications to displayed image are based on this classification to ensure minimum color distortion. This is presented in section 3.2, 5.1.
Third, how to maximize power saving without compromising user experience? A content change rate and color distribution coefficient based algorithm is modelled to achieve high power saving when content on the display is Simple UI (not color rich) and less dynamic. This is presented in section 4. User study shows that more than 25% of content on display is less dynamic. Also the present algorithm saves 16% power with more than 93.8% Structural SIMilarity (SSIM) (Wang et al., 2004) accuracy. The experimental results for proposed method are discussed in section 5.
Figure 1 shows block diagram of proposed technique. It consists of revised display subsystem with an additional content change and color distribution analysis block and backlight and image intensity control block. Content change analysis and color distribution analysis block quantifies Content Change Rate Coefficient (CCRC) and Color
Figure 1: Block diagram for proposed technique.
Distribution Coefficient (CDC) respectively and other block modulate image intensity and backlight level based on CCRC and CDC.
2 LCD AND PERCEIVED LUMINANCE
Before stating algorithm, it is necessary to understand relation between brightness, backlight, power consumption and intensity of image. For LCD based products, major power consumption is attributed to backlight and it is the main source for brightness of the LCD, which is measured in lux. There are different techniques to control brightness of display such as backlight and intensity.
The optical light flow in LCD subsystem (Raman and Hekstra, 2005) is illustrated in Figure 2, where in backlight is main source of light (Backlight Luminance BL) and fragmentary directed light pass through pixel depends on intensity value.
Figure 2: Transmissive property of TFT LCD.
The perceived intensity of an image is denoted by (1)
I = βLYfr (1)Where β is the transmittance of LCD Panel, L is backlight luminance and Yfr is the average luminance value of the frame (Raman and Hekstra, 2005). ‘L’ can be controlled linearly by Backlight Level (BL) and the ‘Yfr’ can be controlled by increasing/decreasing the Luma component for the frame called Image Intensity Level (IL). Concurrent adjusting of intensity and backlight level in proper way leads to energy conservation, but just modifying these above mentioned parameters may cause defects in displayed image.
So there are two parameters that contribute to the final luminance and hence, same brightness perception can be produced by multiple combinations of backlight and pixel’s intensity value. Multiple experiments were done to find relation between perceived brightness, backlight level, image intensity along with differences in power consumed. Figure 3 shows brightness variation w.r.t backlight
Display Content Change Rate Analysis for Power Saving in Transmissive Panels
447

level at multiple intensity of image. From this figure, it’s evident that same luminance level can be achieved from a range of backlight levels and modifying image intensity. For instance, brightness value of 100 lux can be achieved either by backlight level 250 or 130 with intensity increase from 0(I 0) to 25(I 25).
Figure 3: Brightness Vs Backlight Level at different Intensity level.
Power consumption variation with respect to increase in backlight level and intensity of image is further explained in figure 4. While power consumption is directly proportional to backlight values, increase in pixels intensity has negligible impact, less than 5mA. For instance, reducing backlight level from 250 to 130, there is around 110mA power reduction. And as illustrated in Table 1 for luminance values of 100, 75 and 50, considerable power can be saved by manipulating pixel intensity and backlight simultaneously, ensuring similar perceived brightness. For instance, 100lux luminance intensity can be produced from device by any pixel intensity and backlight level combinations like (250, 0), (205, 4), (170, 8) etc. And all these combinations drain different amount of currents. Like, by reducing backlight level from 250 to 170 and increasing intensity value from 0 to 8, 75mA current consumption is reduced without degrading image perception to the eye.
It is shown that controlling backlight and intensity concurrently lead to power benefit, however these techniques suffer from drawbacks like inter-frame brightness distortion, flickering effects, clipping artifacts, color distortion etc. This present work tries to redress these associated drawbacks and suggests a novel method of content change rate and color distribution based backlight and intensity control. Significance of content change and color distribution analysis is discussed in next section.
Figure 4: Power consumed vs Backlight level at different intensity level.
Table 1: Luminance at different intensity and Backlight level.
Luminance Backlight Level(BL)
Intensity Level(IL)
Current consumption
100
250 0 330 205 4 280 170 8 255
75
210 0 305 175 4 258 150 8 235
50
150 0 235
130 4 220 100 8 190
3 KEY CONCEPTS IN PROPOSED METHOD
This section discusses about two of the main inventions done during this research work. First one is display content analysis which is prime discovery done to avoid defects like inter frame flicker and distortion and second is avoidance of color distortion for color rich images. Next sub sections discuss detail about these inventions.
3.1 Display Content Change Analysis and Its Significance
Display content adjustment and backlight control is done dynamically based on image characteristics. This is because every image has different color distribution and any such adjustment of pixels intensity in saturated images will lead to quality degradation and clipping artifacts.
In conventional techniques, for use cases where screen is changing at 30fps or continuously updating, intensity and backlight adjustment coefficient is calculated on per frame basis and on every frame
ICPRAM 2016 - International Conference on Pattern Recognition Applications and Methods
448
backlight is adjusted by different amount. As a result, flicker and inter frame distortion become prominent and thus resulted in bad user experience.
The study on the use cases where Display content is static with over 50 users was done. It was found that, on an average in more than 25% of use time, frame is idle or display updates at low frequency. Also in these use cases limited color variations are present. Like during call when speaker mode is ON, or while reading Pdfs books, messaging etc., display is static for majority of time and also contents have limited color distributions. In these cases per frame backlight control is not required and hence flickers and distortion can be avoided by gradual backlight adjustment.
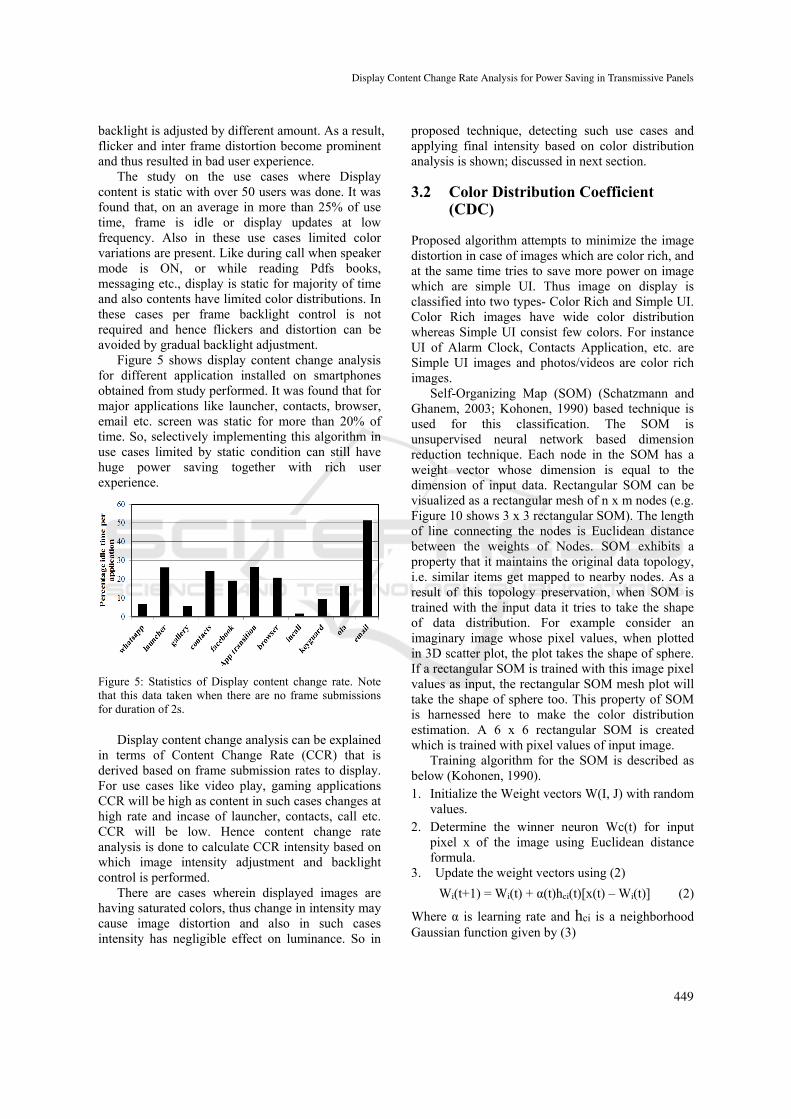
Figure 5 shows display content change analysis for different application installed on smartphones obtained from study performed. It was found that for major applications like launcher, contacts, browser, email etc. screen was static for more than 20% of time. So, selectively implementing this algorithm in use cases limited by static condition can still have huge power saving together with rich user experience.
Figure 5: Statistics of Display content change rate. Note that this data taken when there are no frame submissions for duration of 2s.
Display content change analysis can be explained in terms of Content Change Rate (CCR) that is derived based on frame submission rates to display. For use cases like video play, gaming applications CCR will be high as content in such cases changes at high rate and incase of launcher, contacts, call etc. CCR will be low. Hence content change rate analysis is done to calculate CCR intensity based on which image intensity adjustment and backlight control is performed.
There are cases wherein displayed images are having saturated colors, thus change in intensity may cause image distortion and also in such cases intensity has negligible effect on luminance. So in
proposed technique, detecting such use cases and applying final intensity based on color distribution analysis is shown; discussed in next section.
3.2 Color Distribution Coefficient (CDC)
Proposed algorithm attempts to minimize the image distortion in case of images which are color rich, and at the same time tries to save more power on image which are simple UI. Thus image on display is classified into two types- Color Rich and Simple UI. Color Rich images have wide color distribution whereas Simple UI consist few colors. For instance UI of Alarm Clock, Contacts Application, etc. are Simple UI images and photos/videos are color rich images.
Self-Organizing Map (SOM) (Schatzmann and Ghanem, 2003; Kohonen, 1990) based technique is used for this classification. The SOM is unsupervised neural network based dimension reduction technique. Each node in the SOM has a weight vector whose dimension is equal to the dimension of input data. Rectangular SOM can be visualized as a rectangular mesh of n x m nodes (e.g. Figure 10 shows 3 x 3 rectangular SOM). The length of line connecting the nodes is Euclidean distance between the weights of Nodes. SOM exhibits a property that it maintains the original data topology, i.e. similar items get mapped to nearby nodes. As a result of this topology preservation, when SOM is trained with the input data it tries to take the shape of data distribution. For example consider an imaginary image whose pixel values, when plotted in 3D scatter plot, the plot takes the shape of sphere. If a rectangular SOM is trained with this image pixel values as input, the rectangular SOM mesh plot will take the shape of sphere too. This property of SOM is harnessed here to make the color distribution estimation. A 6 x 6 rectangular SOM is created which is trained with pixel values of input image.
Training algorithm for the SOM is described as below (Kohonen, 1990). 1. Initialize the Weight vectors W(I, J) with random
values. 2. Determine the winner neuron Wc(t) for input
pixel x of the image using Euclidean distance formula.
3. Update the weight vectors using (2) Wi(t+1) = Wi(t) + α(t)hci(t)[x(t) – Wi(t)] (2)
Where α is learning rate and hci is a neighborhood Gaussian function given by (3)
Display Content Change Rate Analysis for Power Saving in Transmissive Panels
449

hci = exp(− || ||( ) ) (3)
In above equation || − || is the distance between the position(x, y) of winning node and ith node in the rectangular SOM map.
The neighborhood radius (o(t)) and learning rate (α (t)) also decays with time, with below decay function (4).
L(t) = L0exp(- ) (4)
Where N is total iteration count, and t is current iteration number. 4. Repeat steps 2 and 3 until total iteration count is
reached. Fig. 8 shows the 3D scatter plot of color pixel values (RGB) in Color rich image (Fig. 6). It also shows the SOM (black mesh) which is obtained after training. It can be seen how the SOM has taken the shape of input distribution (green dots). Also a similar map is constructed for a Simple UI image (Fig. 7) shown in Fig. 9. It can be seen in SOM of Fig. 9 it is mostly concentrated in one region and considerably lesser stretched as it has less number of colors. Whereas in Figure 8, the SOM is stretched more showing that the distribution of color in Fig. 6 is more. A similar observation is made with a set of 1000 images in which 500 were simple UI ones- will be discussed in results section.
Figure 6: Color Rich Image. Figure 7: Simple UI.
Figure 8: SOM for Color rich Image.
Figure 9: SOM for Simple UI.
Based on this, it is inferred that the stretch of the SOM correctly represents the color distribution in
the image. This observation of difference in Color distribution and hence the spread of SOM, is used as an objective criteria to classify Color rich and Simple UI images. The Color Distribution Metric (CDM) can be derived from (5) = ∑ ∑ DL(I,J) + DT (I,J)+ DB (I,J)+ DR(I,J)
(5)
Where DL,DB,DR,DT are the Euclidean distance of weights in SOM from node (I,J) in SOM map from left, top, bottom and right node respectively. Figure 10 shows the location DL,DB,DR,DT of nodes in SOM.
Figure 10: 3 x 3 Rectangular SOM showing position of DL,DB,DR,DT nodes of (5).
CDM represents the amount by which the SOM map is spread and hence a high value of CDM implies color rich image and whereas low represents less number of colors and hence Simple UI.
CDC is derived from CDM using (6), T is the CDM threshold for Color Rich image. The value of T is determined experimentally as it depends on the resolution of the image.
CDC = 1 – ≤0 > (6)
Performance: In order to reduce the running time of the proposed CDC calculation the display image is scaled down to 180x320 size. Since the primary purpose is to determine the color distribution scaling down the image still retains its color property. Average running time for CDC computation was measured to be 7ms.
This CDC value is used in the algorithm explained in next section to compute the aggressiveness of the algorithm.
ICPRAM 2016 - International Conference on Pattern Recognition Applications and Methods
450

4 PROPOSED METHOD
As explained in section 2, same luminance can be achieved at lower power consumption by concurrently reducing backlight level and increase in intensity. This section discusses about proposed algorithm that explains when and by what amount the intensity and backlight values need to change. It also explains use of Color Distribution Coefficient (CDC) and Content Change Rate (CCR) to minimize the artifacts occurring due to change in backlight and intensity level.
Figure 11 shows algorithm flow for proposed technique. Algorithm starts with loading panel tuned look up table when device boots. On frame update Content Change Rate Coefficient (CCRC) and CDC is computed. User is provided with authority to set Aggressiveness ( ) based on power saving requirement. During this research we invented Effective aggressiveness ( ) formula which is function of CCRC, CDC and . Based on effective aggressiveness new IL and BL are calculated and applied to system. In following sub-sections each of these blocks are explained in detail.
4.1 Generating Panel Tuned Look-up Table (LUX_TABLE)
The method to create lux table is depicted in Figure 12. Creating LUX_TABLE involves below two steps- Step 1: Display uniform gray image on display for tuning brightness table. Gray Image is taken for readings since RGB distribution is uniform in gray color image. Step 2: Measure Luminescence (Lux) for all backlight levels from bl=0 to bl=255 and Intensity Levels varying from il=0 to il=25 and fill LUX_TABLE [255][25] table accordingly. For backlight level bl=0 and Intensity Level il=0 measured lux value LUX_TABLE [0] [0] is filled in the table as shown in Table 2.
Table 2: Lux mapping table.
Intensity
Backlight il=0 il=1 … il=25
bl=0 LUX_TABLE [0][0]
LUX_ TABLE [0][1]
…LUX_ TABLE [0][25]
…… ….. ……. … ….
bl=255 LUX_ TABLE [255][0]
LUX_ TABLE [255][1]
…LUX_ TABLE [255][25]
Figure 11: Flowchart for proposed technique.
Figure 12: Generating LUX_TABLE.
Setup for generating Panel Tuned look-up table consists of Display Color Analyzer (Konica Minolta CA-310) and a laptop with tuning tool installed. Test device is kept in closed environment (Black box) to avoid surrounding luminance interference as shown in Figure 13.
Tuning tool enables mapping different backlight levels and intensity levels and Color analyzer enables measurement of amount of light coming out from test device. Luminance recorded from color analyzer is tabulated to use in proposed algorithm.
Display Content Change Rate Analysis for Power Saving in Transmissive Panels
451
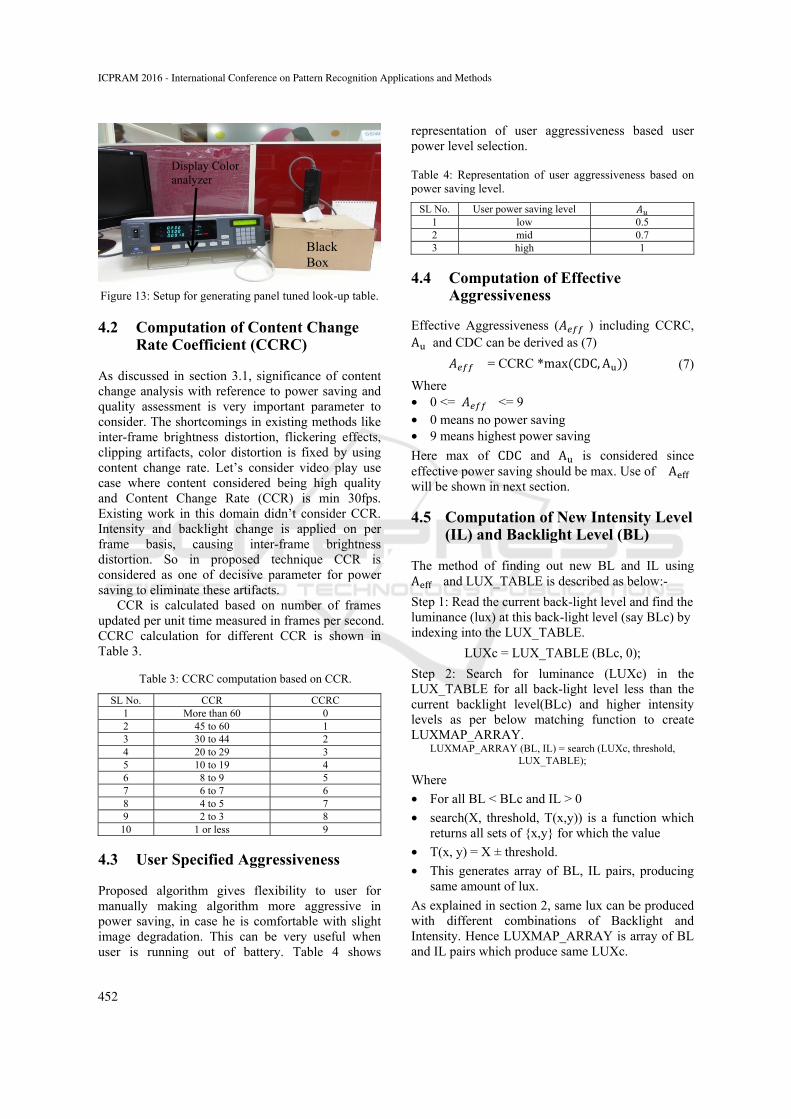
Figure 13: Setup for generating panel tuned look-up table.
4.2 Computation of Content Change Rate Coefficient (CCRC)
As discussed in section 3.1, significance of content change analysis with reference to power saving and quality assessment is very important parameter to consider. The shortcomings in existing methods like inter-frame brightness distortion, flickering effects, clipping artifacts, color distortion is fixed by using content change rate. Let’s consider video play use case where content considered being high quality and Content Change Rate (CCR) is min 30fps. Existing work in this domain didn’t consider CCR. Intensity and backlight change is applied on per frame basis, causing inter-frame brightness distortion. So in proposed technique CCR is considered as one of decisive parameter for power saving to eliminate these artifacts.
CCR is calculated based on number of frames updated per unit time measured in frames per second. CCRC calculation for different CCR is shown in Table 3.
Table 3: CCRC computation based on CCR.
SL No. CCR CCRC 1 More than 60 0 2 45 to 60 1 3 30 to 44 2 4 20 to 29 3 5 10 to 19 4 6 8 to 9 5 7 6 to 7 6 8 4 to 5 7 9 2 to 3 8 10 1 or less 9
4.3 User Specified Aggressiveness
Proposed algorithm gives flexibility to user for manually making algorithm more aggressive in power saving, in case he is comfortable with slight image degradation. This can be very useful when user is running out of battery. Table 4 shows
representation of user aggressiveness based user power level selection.
Table 4: Representation of user aggressiveness based on power saving level.
SL No. User power saving level 1 low 0.5 2 mid 0.7 3 high 1
4.4 Computation of Effective Aggressiveness
Effective Aggressiveness ( ) including CCRC, A and CDC can be derived as (7)
= CCRC *max(CDC, A )) (7)Where • 0 <= <= 9 • 0 means no power saving • 9 means highest power saving Here max of CDC and A is considered since effective power saving should be max. Use of A will be shown in next section.
4.5 Computation of New Intensity Level (IL) and Backlight Level (BL)
The method of finding out new BL and IL using A and LUX_TABLE is described as below:- Step 1: Read the current back-light level and find the luminance (lux) at this back-light level (say BLc) by indexing into the LUX_TABLE.
LUXc = LUX_TABLE (BLc, 0); Step 2: Search for luminance (LUXc) in the LUX_TABLE for all back-light level less than the current backlight level(BLc) and higher intensity levels as per below matching function to create LUXMAP_ARRAY.
LUXMAP_ARRAY (BL, IL) = search (LUXc, threshold, LUX_TABLE);
Where • For all BL < BLc and IL > 0 • search(X, threshold, T(x,y)) is a function which
returns all sets of {x,y} for which the value • T(x, y) = X ± threshold. • This generates array of BL, IL pairs, producing
same amount of lux. As explained in section 2, same lux can be produced with different combinations of Backlight and Intensity. Hence LUXMAP_ARRAY is array of BL and IL pairs which produce same LUXc.
Display Color analyzer
Black Box
ICPRAM 2016 - International Conference on Pattern Recognition Applications and Methods
452
Step 3: Select the {BL, IL} pair from LUXMAP_ARRAY by indexing the array at Aeff, as shown in below equation.
[BLn, ILn] = LUXMAP_ARRAY [Aeff] Where • BLn is new backlight level to be applied • ILn is new Intensity level to be applied New calculated BLn and ILn levels are applied to backlight subsystem and display frame to get better power saving without compromising on the quality.
5 EXPERMENTAL RESULTS AND DISSCUSSION
5.1 Color Distribution Coefficient
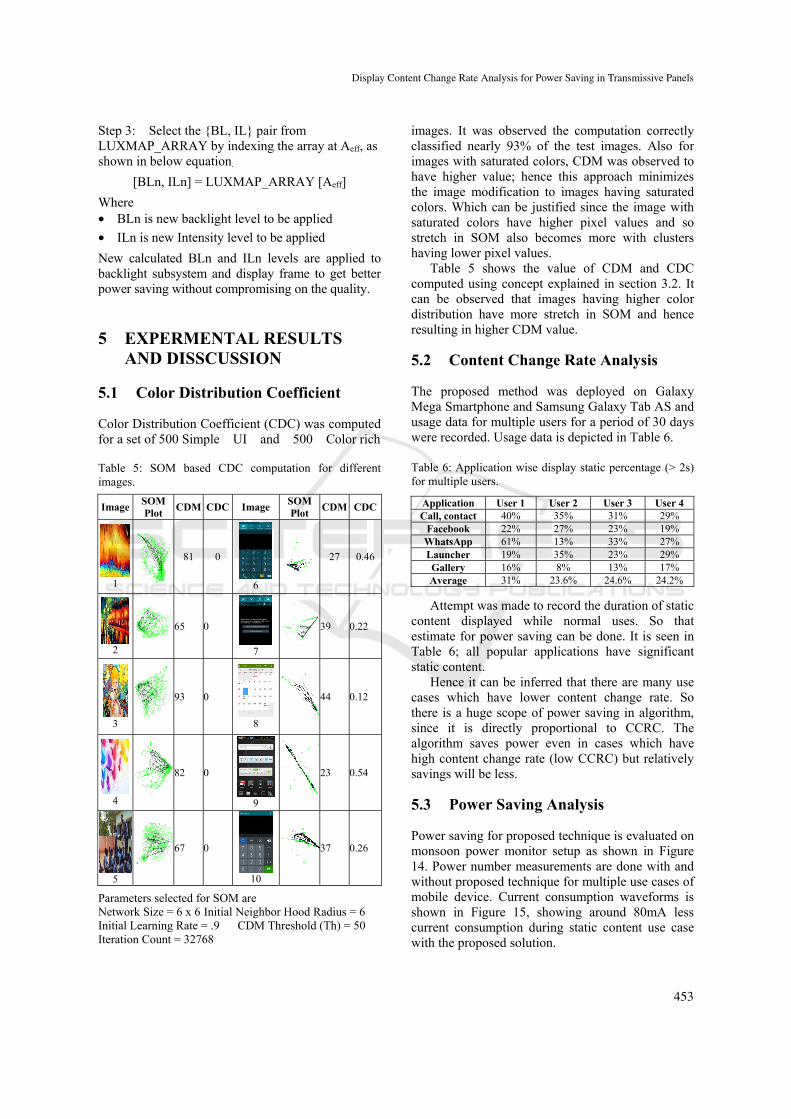
Color Distribution Coefficient (CDC) was computed for a set of 500 Simple UI and 500 Color rich
Table 5: SOM based CDC computation for different images.
Image SOM Plot CDM CDC Image SOM
Plot CDM CDC
1
81 0
6
27 0.46
2
65 0
7
39 0.22
3
93 0
8
44 0.12
4
82 0
9
23 0.54
5
67 0
10
37 0.26
Parameters selected for SOM are Network Size = 6 x 6 Initial Neighbor Hood Radius = 6 Initial Learning Rate = .9 CDM Threshold (Th) = 50 Iteration Count = 32768
images. It was observed the computation correctly classified nearly 93% of the test images. Also for images with saturated colors, CDM was observed to have higher value; hence this approach minimizes the image modification to images having saturated colors. Which can be justified since the image with saturated colors have higher pixel values and so stretch in SOM also becomes more with clusters having lower pixel values.
Table 5 shows the value of CDM and CDC computed using concept explained in section 3.2. It can be observed that images having higher color distribution have more stretch in SOM and hence resulting in higher CDM value.
5.2 Content Change Rate Analysis
The proposed method was deployed on Galaxy Mega Smartphone and Samsung Galaxy Tab AS and usage data for multiple users for a period of 30 days were recorded. Usage data is depicted in Table 6.
Table 6: Application wise display static percentage (> 2s) for multiple users.
Application User 1 User 2 User 3 User 4 Call, contact 40% 35% 31% 29%
Facebook 22% 27% 23% 19% WhatsApp 61% 13% 33% 27% Launcher 19% 35% 23% 29% Gallery 16% 8% 13% 17% Average 31% 23.6% 24.6% 24.2%
Attempt was made to record the duration of static content displayed while normal uses. So that estimate for power saving can be done. It is seen in Table 6; all popular applications have significant static content.
Hence it can be inferred that there are many use cases which have lower content change rate. So there is a huge scope of power saving in algorithm, since it is directly proportional to CCRC. The algorithm saves power even in cases which have high content change rate (low CCRC) but relatively savings will be less.
5.3 Power Saving Analysis
Power saving for proposed technique is evaluated on monsoon power monitor setup as shown in Figure 14. Power number measurements are done with and without proposed technique for multiple use cases of mobile device. Current consumption waveforms is shown in Figure 15, showing around 80mA less current consumption during static content use case with the proposed solution.
Display Content Change Rate Analysis for Power Saving in Transmissive Panels
453
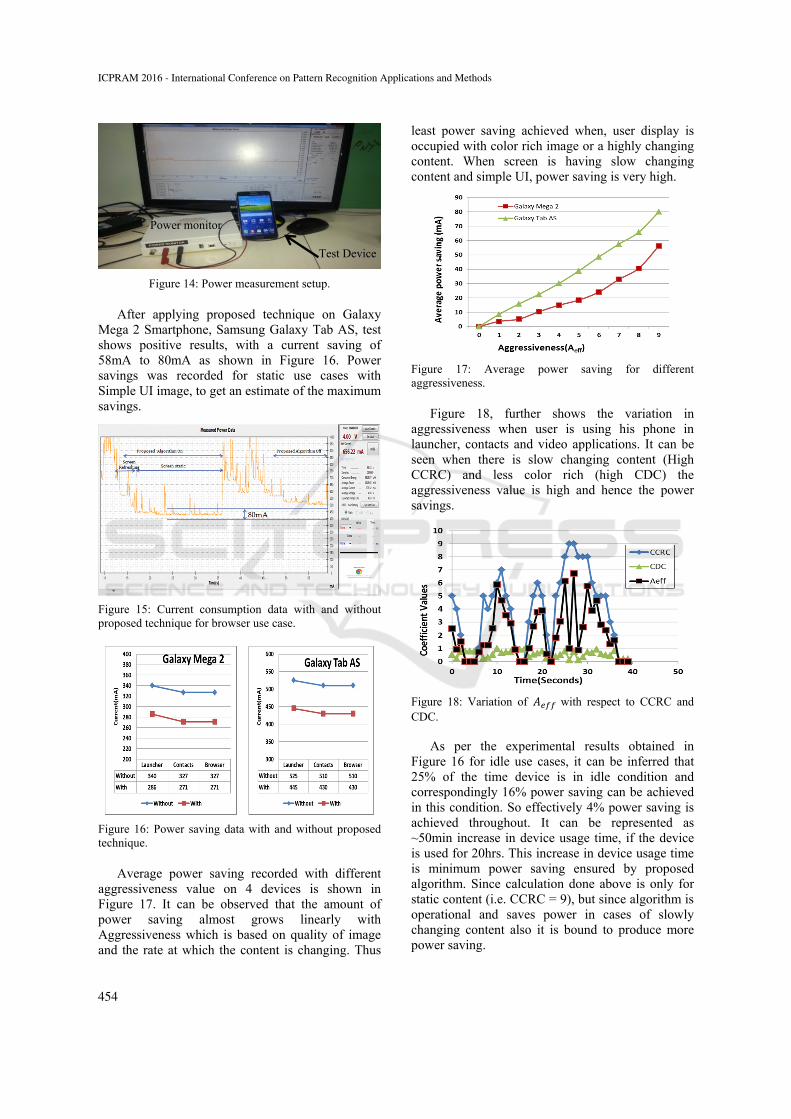
Figure 14: Power measurement setup.
After applying proposed technique on Galaxy Mega 2 Smartphone, Samsung Galaxy Tab AS, test shows positive results, with a current saving of 58mA to 80mA as shown in Figure 16. Power savings was recorded for static use cases with Simple UI image, to get an estimate of the maximum savings.
Figure 15: Current consumption data with and without proposed technique for browser use case.
Figure 16: Power saving data with and without proposed technique.
Average power saving recorded with different aggressiveness value on 4 devices is shown in Figure 17. It can be observed that the amount of power saving almost grows linearly with Aggressiveness which is based on quality of image and the rate at which the content is changing. Thus
least power saving achieved when, user display is occupied with color rich image or a highly changing content. When screen is having slow changing content and simple UI, power saving is very high.
Figure 17: Average power saving for different aggressiveness.
Figure 18, further shows the variation in aggressiveness when user is using his phone in launcher, contacts and video applications. It can be seen when there is slow changing content (High CCRC) and less color rich (high CDC) the aggressiveness value is high and hence the power savings.
Figure 18: Variation of with respect to CCRC and CDC.
As per the experimental results obtained in Figure 16 for idle use cases, it can be inferred that 25% of the time device is in idle condition and correspondingly 16% power saving can be achieved in this condition. So effectively 4% power saving is achieved throughout. It can be represented as ~50min increase in device usage time, if the device is used for 20hrs. This increase in device usage time is minimum power saving ensured by proposed algorithm. Since calculation done above is only for static content (i.e. CCRC = 9), but since algorithm is operational and saves power in cases of slowly changing content also it is bound to produce more power saving.
Test Device
Power monitor
ICPRAM 2016 - International Conference on Pattern Recognition Applications and Methods
454
Further section discusses the quality assessment of the proposed algorithm.
5.4 Quality Analysis
Quality analysis for different intensity and backlight levels are evaluated based on Structural SIMilarity (SSIM) (Wang et al., 2004). Figure 19 shows experimental set-up, which consists of a mounted Full HD Smartphone device to capture images of test device with proposed algorithm running. Test device is placed in closed container to avoid surrounding light interference and test device is connected to laptop via USB and controlled using Android Debugger Bridge (ADB) command shell interface.
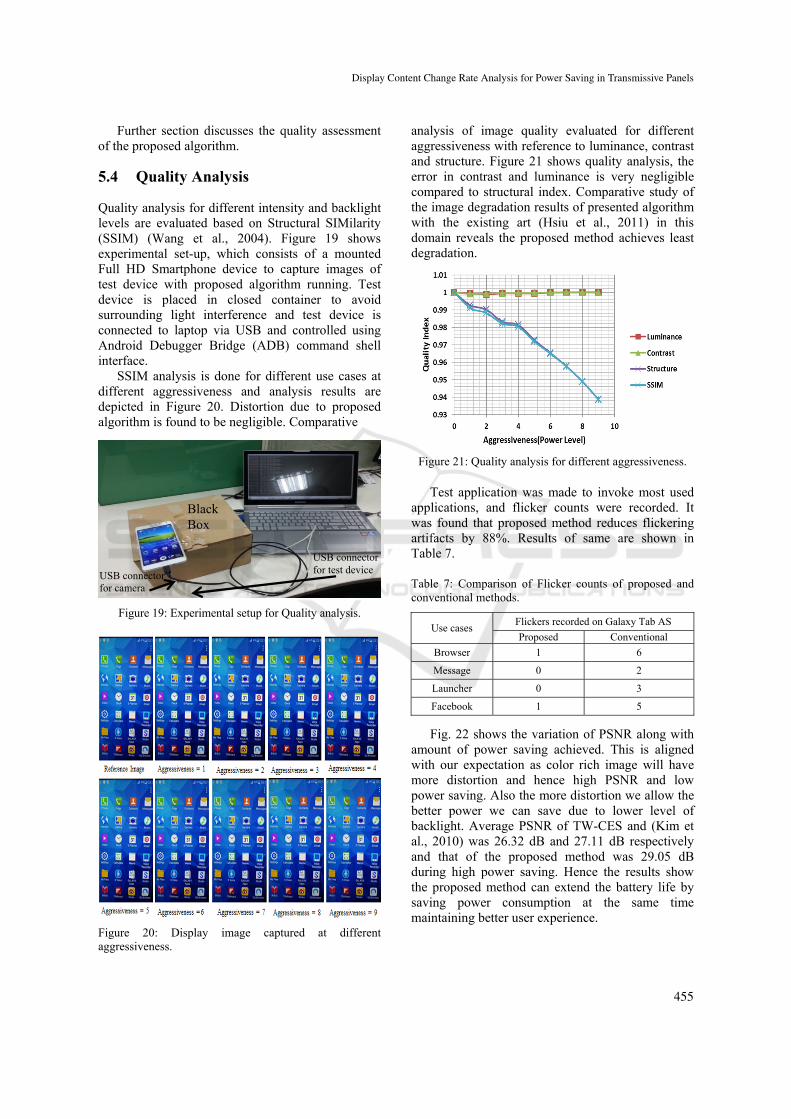
SSIM analysis is done for different use cases at different aggressiveness and analysis results are depicted in Figure 20. Distortion due to proposed algorithm is found to be negligible. Comparative
Figure 19: Experimental setup for Quality analysis.
Figure 20: Display image captured at different aggressiveness.
analysis of image quality evaluated for different aggressiveness with reference to luminance, contrast and structure. Figure 21 shows quality analysis, the error in contrast and luminance is very negligible compared to structural index. Comparative study of the image degradation results of presented algorithm with the existing art (Hsiu et al., 2011) in this domain reveals the proposed method achieves least degradation.
Figure 21: Quality analysis for different aggressiveness.
Test application was made to invoke most used applications, and flicker counts were recorded. It was found that proposed method reduces flickering artifacts by 88%. Results of same are shown in Table 7.
Table 7: Comparison of Flicker counts of proposed and conventional methods.
Use cases Flickers recorded on Galaxy Tab AS Proposed Conventional
Browser 1 6
Message 0 2
Launcher 0 3
Facebook 1 5
Fig. 22 shows the variation of PSNR along with amount of power saving achieved. This is aligned with our expectation as color rich image will have more distortion and hence high PSNR and low power saving. Also the more distortion we allow the better power we can save due to lower level of backlight. Average PSNR of TW-CES and (Kim et al., 2010) was 26.32 dB and 27.11 dB respectively and that of the proposed method was 29.05 dB during high power saving. Hence the results show the proposed method can extend the battery life by saving power consumption at the same time maintaining better user experience.
Black Box
USB connector for test device USB connector
for camera
Display Content Change Rate Analysis for Power Saving in Transmissive Panels
455

Figure 22: PSNR measurement for different power saving.
6 CONCLUSIONS
The paper proposed a technique which is based on Display content change analysis; Color distribution, Backlight scaling and Intensity compensation to achieve power saving in LCD class of displays. The paper presented a 93% accurate image classification method using Self Organizing Map to compute the color distribution coefficient, which is used to reduce chromatic distortion. It also showed significance of low content change rate in mobile devices and how they can be used to eliminate the problems like inter-frame brightness distortion and flickering by 88%, which are common problems for all image luminosity compensated backlight scaling methods. The proposed algorithm is prototyped on Samsung Galaxy Tab AS and Galaxy Mega 2 and power saving which is illustrated is encouraging. The Structural similarity metric is used as image distortion metric to evaluate the image distortion which was found to be negligible and not perceivable by human eye. The results show the proposed method can extend the battery life significantly by saving power consumption while maintaining good user experience.
In future CDC computation algorithm will be enhanced. Also contrast modification along with intensity modification can improve the visual quality more better which will be evaluated in the further work of this research.
ACKNOWLEDGEMENTS
The authors would like to thank Mahammadrafi Maniyar, Rajib Basu and Dibyadarshi Debadas from
System Software Team of Samsung R&D Institute India Bangalore for providing support in this work.
REFERENCES
Carroll, A. and Heiser, G., 2010, June. An Analysis of Power Consumption in a Smartphone. In USENIX annual technical conference (Vol. 14).
Tsai, P.S., Liang, C.K., Huang, T.H. and Chen, H.H., 2009. Image enhancement for backlight-scaled TFT-LCD displays. Circuits and Systems for Video Technology, IEEE Transactions on, 19(4), pp.574-583.
Kerofsky, L. and Daly, S., 2006. Brightness preservation for LCD backlight dimming. Journal of the Society for Information Display, 14(12), pp.1111-1118.
Chen, M., Huajun, P.E.N.G., Qiu, G., Hung, C.K. and Zhang, W., Hong Kong Applied Science and Technology Research Institute Company Limited, 2013.LCD backlight dimming, LCD/image signal compensation and method of controlling an LCD display. U.S. Patent 8,514,166.
Choi, L., Shim, H. and Chang, N., 2002. Low-power color TFT LCD display for hand-held embedded systems. In Low Power Electronics and Design, 2002. ISLPED'02. Proceedings of the 2002 International Symposium on (pp. 112-117). IEEE.
Raman, N. and Hekstra, G.J., 2005. Content based contrast enhancement for liquid crystal displays with backlight modulation. Consumer Electronics, IEEE Transactions on, 51(1), pp.18-21.
Cheng, W.C., Hou, Y. and Pedram, M., 2004, February. Power minimization in a backlit TFT-LCD display by concurrent brightness and contrast scaling. In Proceedings of the conference on Design, automation and test in Europe-Volume 1 (p. 10252). IEEE Computer Society.
Hsiu, P.C., Lin, C.H. and Hsieh, C.K., 2011, August. Dynamic backlight scaling optimization for mobile streaming applications. In Proceedings of the 17th IEEE/ACM international symposium on low-power electronics and design (pp. 309-314). IEEE Press.
Schatzmann, J. and Ghanem, M., 2003. Using self-organizing maps to visualize clusters and trends in multidimensional datasets. Department of Computing Data Mining Group, Imperial College, London, p.132.
Kohonen, T., 1990. The self-organizing map. Proceedings of the IEEE,78(9), pp.1464-1480.
Wang, Z., Bovik, A.C., Sheikh, H.R. and Simoncelli, E.P., 2004. Image quality assessment: from error visibility to structural similarity. Image Processing, IEEE Transactions on, 13(4), pp.600-612.
Kim, T.H., Choi, K.S. and Ko, S.J., 2010. Backlight power reduction using efficient image compensation for mobile devices. Consumer Electronics, IEEE Transactions on, 56(3), pp.1972-1978.
ICPRAM 2016 - International Conference on Pattern Recognition Applications and Methods
456