Disparity disambiguation by fusion of signal- and symbolic-level information
13
Machine Vision and Applications (2012) 23:65–77 DOI 10.1007/s00138-010-0266-z ORIGINAL PAPER Disparity disambiguation by fusion of signal- and symbolic-level information Jarno Ralli · Javier Díaz · Sinan Kalkan · Norbert Krüger · Eduardo Ros Received: 2 October 2009 / Revised: 24 March 2010 / Accepted: 29 March 2010 / Published online: 2 May 2010 © Springer-Verlag 2010 Abstract We describe a method for resolving ambiguities in low-level disparity calculations in a stereo-vision scheme by using a recurrent mechanism that we call signal-symbol loop. Due to the local nature of low-level processing it is not always possible to estimate the correct disparity values produced at this level. Symbolic abstraction of the signal produces robust, high confidence, multimodal image fea- tures which can be used to interpret the scene more accu- rately and therefore disambiguate low-level interpretations by biasing the correct disparity. The fusion process is capa- ble of producing more accurate dense disparity maps than the low- and symbolic-level algorithms can produce inde- pendently. Therefore we describe an efficient fusion scheme Electronic supplementary material The online version of this article (doi:10.1007/s00138-010-0266-z) contains supplementary material, which is available to authorized users. J. Ralli (B ) · J. Díaz · E. Ros Departamento de Arquitectura y Tecnología de Computadores, Escuela Técnica Superior de Ingeniería Informatica y de Telecomunicacíon, Universidad de Granada, Calle Periodista Daniel Saucedo Aranda s/n, 18071 Granada, Spain e-mail: jarno@ralli.fi; [email protected] J. Díaz e-mail: [email protected] E. Ros e-mail: [email protected] S. Kalkan KOVAN Research Lab, Department of Computer Engineering, Middle East Technical University, 06531 Ankara, Turkey e-mail: [email protected] N. Krüger Cognitive Vision Lab, The Maersk Mc-Kinney Moller Institute, University of Southern Denmark, Niels Bohrs Alle 1, 5230 Odense M, Denmark e-mail: [email protected] that allows symbolic- and low-level cues to complement each other, resulting in a more accurate and dense disparity rep- resentation of the scene. Keywords Disparity fusion · Feed-back loop · Disparity disambiguation · Low- and symbolic-level fusion · Signal-symbol loop 1 Introduction Visual perception is a complex process that transforms image signals into cognitive information. The complexity of the vision system is due to multiple levels of abstraction that must be taken into account when interpreting the image scene. In order to understand the vision system better we can represent schematically the different levels of the pro- cess. Vision researchers tend to classify vision algorithms and representations into three levels: low (sensory/signal), middle (symbolic) and high (knowledge based) [3, 22, 28]. Low-level vision deals with local operations such as spa- tiotemporal filters to extract low-level cues. In biological systems this is done by cells in the retina and the primary visual cortex. From a set of basic spatiotemporal filters of different sizes and temporal characteristics, low-level vision models generate information about stereopsis, motion within the scene, local contrast and so on. Low-level operations on the image signal are local in nature and can produce sev- eral possible interpretations due to the lack of a more global scene interpretation. At middle-level vision, visual cues and segmentation mechanisms are integrated, thus allowing the efficient and constructive combination of different visual modalities (motion, stereo, orientation and so on) or the seg- mentation of abstracted information such as independently moving objects (IMOs) [5, 19, 27]. High-level vision is a 123
-
Upload
independent -
Category
Documents
-
view
1 -
download
0
Transcript of Disparity disambiguation by fusion of signal- and symbolic-level information

Machine Vision and Applications (2012) 23:65–77DOI 10.1007/s00138-010-0266-z
ORIGINAL PAPER
Disparity disambiguation by fusion of signal- and symbolic-levelinformation
Jarno Ralli · Javier Díaz · Sinan Kalkan ·Norbert Krüger · Eduardo Ros
Received: 2 October 2009 / Revised: 24 March 2010 / Accepted: 29 March 2010 / Published online: 2 May 2010© Springer-Verlag 2010
Abstract We describe a method for resolving ambiguitiesin low-level disparity calculations in a stereo-vision schemeby using a recurrent mechanism that we call signal-symbolloop. Due to the local nature of low-level processing it isnot always possible to estimate the correct disparity valuesproduced at this level. Symbolic abstraction of the signalproduces robust, high confidence, multimodal image fea-tures which can be used to interpret the scene more accu-rately and therefore disambiguate low-level interpretationsby biasing the correct disparity. The fusion process is capa-ble of producing more accurate dense disparity maps thanthe low- and symbolic-level algorithms can produce inde-pendently. Therefore we describe an efficient fusion scheme
Electronic supplementary material The online version of thisarticle (doi:10.1007/s00138-010-0266-z) contains supplementarymaterial, which is available to authorized users.
J. Ralli (B) · J. Díaz · E. RosDepartamento de Arquitectura y Tecnología de Computadores,Escuela Técnica Superior de Ingeniería Informatica y deTelecomunicacíon, Universidad de Granada,Calle Periodista Daniel Saucedo Aranda s/n, 18071 Granada, Spaine-mail: [email protected]; [email protected]
J. Díaze-mail: [email protected]
E. Rose-mail: [email protected]
S. KalkanKOVAN Research Lab, Department of Computer Engineering,Middle East Technical University, 06531 Ankara, Turkeye-mail: [email protected]
N. KrügerCognitive Vision Lab, The Maersk Mc-Kinney Moller Institute,University of Southern Denmark, Niels Bohrs Alle 1,5230 Odense M, Denmarke-mail: [email protected]
that allows symbolic- and low-level cues to complement eachother, resulting in a more accurate and dense disparity rep-resentation of the scene.
Keywords Disparity fusion · Feed-back loop ·Disparity disambiguation · Low- and symbolic-levelfusion · Signal-symbol loop
1 Introduction
Visual perception is a complex process that transforms imagesignals into cognitive information. The complexity of thevision system is due to multiple levels of abstraction thatmust be taken into account when interpreting the imagescene. In order to understand the vision system better wecan represent schematically the different levels of the pro-cess. Vision researchers tend to classify vision algorithmsand representations into three levels: low (sensory/signal),middle (symbolic) and high (knowledge based) [3,22,28].Low-level vision deals with local operations such as spa-tiotemporal filters to extract low-level cues. In biologicalsystems this is done by cells in the retina and the primaryvisual cortex. From a set of basic spatiotemporal filters ofdifferent sizes and temporal characteristics, low-level visionmodels generate information about stereopsis, motion withinthe scene, local contrast and so on. Low-level operations onthe image signal are local in nature and can produce sev-eral possible interpretations due to the lack of a more globalscene interpretation. At middle-level vision, visual cues andsegmentation mechanisms are integrated, thus allowing theefficient and constructive combination of different visualmodalities (motion, stereo, orientation and so on) or the seg-mentation of abstracted information such as independentlymoving objects (IMOs) [5,19,27]. High-level vision is a
123

66 J. Ralli et al.
cognitive processing stage, where scenes are interpreted viamore specific sub-tasks, such as object recognition, predic-tion and comparison with already perceived scenarios. Weuse the terms low- or signal-level algorithm when referringto algorithms that work at the signal-level (i.e., in a pixel-wise representation) without trying to arrive at a higher-leveldescription of the scene and the terms middle- or symbolic-level to refer to algorithms that arrive at a higher descrip-tion of the scene using semantically meaningful and discretesymbolic descriptors. Even though at this level, reasoningbased on the symbolic descriptors takes place, we are still farfrom high-level processes where actual scene understandinghappens.
In this paper we propose a disambiguation mechanism forcreating coherent disparity estimations by fusing signal- andsymbolic-level information, i.e., fusing estimations of dif-ferent level of abstraction within a cross-validation scheme.There are several kinds of disambiguation mechanism used indisparity calculation algorithms [25], both local and global,such as: aggregation of evidence, search for salient fea-tures [13,14], combination of both monocular and binocu-lar cues [15] and so on. Where our work differs from earlierstudies is that before disambiguation we arrive at a sym-bolic-level scene description using robust, cross-validated,biologically motivated, multimodal image features that weshall refer to as primitives in the rest of the paper [12,16,18].Our main contributions in this paper are as follows: firstlywe show that the proposed disambiguation mechanism cangreatly enhance quality of the resulting disparity estimations:coherency is increased by accepting those feedback valuesthat fit the evidence suggested by the data and by rejectingthose that are not consistent with the low-level data-drivenestimations. Secondly we show that hardware implementa-tions suffering from numerical restrictions will also benefitfrom the proposed scheme.
Our system consists of two parallel data streams precededby a process that transforms the signal into harmonic repre-sentation [23]. By harmonic representation we mean a mul-tichannel, band-pass representation of the image, achievedby filtering operations with complex valued band-pass ker-nels. From this perspective the visual stimulus is representedlocally by phase, energy and orientation on several scales[23]. The two parallel data streams are the following: a sig-nal-level process that calculates the dense disparity map; anda symbolic-level process that arrives at a scene reconstruc-tion using perceptual grouping constraints for the multimodalprimitives.
Figure 1 illustrates the parallel data streams, bothusing a common harmonic representation with color infor-mation, and the feedback signal from the symbolic-level tothe signal-level. Due to the lack of a more general inter-pretation of the scene, the low-level process is prone toerror when several different interpretations are possible.
Fig. 1 Both the signal- and symbolic-level disparity calculation pro-cesses, which are based on the harmonic representation obtained byharmonic transformation
The symbolic-level process, on the other hand, generatesa more robust and descriptive representation of the scene,capable of refining the estimates for a better overall seman-tic coherence. Coherent interpretation at this level is pos-sible through semantic reasoning using concepts such asco-linearity, co-colority, co-planarity and so on [18]. Thedense signal-level disparity is disambiguated by feeding thesymbolic-level information back into the low-level process[10,11] and by biasing those low-level interpretations that arecoherent with the symbolic-level. Since the feedback takesplace at several image scales (multiscale), the sparse sym-bolic-level information is propagated spatially, thus beingcapable of guiding the low-level process over a far greaterarea than the original density [20]. We refer to the sym-bolic-level information used in the disambiguation as feed-back maps. The system presented in this paper has only one‘direction’ of feedback (from symbolic- to signal-level) andextending the feedback into the other direction (signal- tosymbolic-level) is left for future work.
1.1 Signal-symbol loop
As mentioned above, we use the concept of signal-symbolloop as a feedback mechanism by which discrete symbolicdescriptors obtained from the harmonic representation arefed back into the signal-level so as to enhance the extractionof desired features. To the best of our knowledge the termsignal-symbol loop was first introduced in [11] to describea way of dealing with three dilemmas that computer visionencounters when interpreting a scene. It is argued that suchinterpretations require the original signal to be turned intosemantic tokens or symbols, which, however, involves a num-ber of problems. The first problem (known as the interpre-tation/decision dilemma) is of particular relevance in thecontext of this paper. It deals with the need to interpret theinput signal, which in turn requires binary decisions. Thesedecisions concern, for example, setting thresholds for edgedetection or discrete selection of feature positions. Moreover,decisions about which features are relevant for a specifictask often need to be made. Without making further assump-tions about the input signal or the task in hand, these deci-sions are difficult to justify. Hence it is important that they
123
Disparity disambiguation by fusion of signal- and symbolic-level information 67
become verified and guided by higher level processes thatoperate on the symbolic level. In [11] it is argued that feed-back mechanisms in terms of signal-symbol loops can mod-erate between the different levels of information and beused for enhancing the image signal to detect desired fea-tures and disambiguate unclear interpretations of the localcues. In [10] a first example is given for the applicationof a signal-symbol loop in the context of taking advan-tage of the regularity of rigid motion for edge detection.In this paper we give a further example by addressing theinteraction of sparse and dense stereo by signal-symbolloops.
1.2 Hardware based real-time low-level processing
Low-level stages (extraction engines of primitives) can beefficiently implemented through special purpose hardwaresuch as reconfigurable devices [1–3]. However, in orderto maximize on-chip parallel processing capabilities onlyrestricted fixed point arithmetics are allowed in the model.Furthermore, the models are usually simplified in order toadapt better to the technological substrate in which they willbe implemented. Therefore these kinds of low-level process-ing engines produce noisier results than their respective soft-ware (SW) implementations. In this work we study if thesignal-symbol fusion mechanisms (described in this paper)help to enhance the system accuracy by constructively inte-grating higher level information and thus allowing designswith lower resource requirements and power consumption(critical in embedded systems).
1.3 Structure of the document
We proceed by describing briefly both the low- and sym-bolic-level algorithms followed by a description of the fusionprocess. As low-level algorithm we have chosen a methodthat is based on the phase component of a band-pass filteredimage due to the robustness of the phase information. Wecannot overstress the fact that we are not trying to come upwith a new stereo algorithm but to validate our concept thatby fusing information from several different visual repre-sentation levels more robust and meaningful interpretationscan be achieved. After this we demonstrate quantitativelyresults of the fusion process using several well-known stereoimages. Testing was done by using both a SW implementa-tion and a simulation of hardware implementation (FPGA) ofthe system. Due to increasing interest, both in the scientificcommunity as well as in the commercial sector, in imple-menting artificial vision systems solving complex tasks inreal-time, we feel that such results should be of interest toanyone implementing real-time vision systems on chip. Afterpresenting the results we proceed to conclusions, future workand acknowledgments.
2 Method
In this section we describe the low-level method used for gen-erating the disparity estimations, followed by a description ofthe symbolic-level process used for generating robust, sparse,feature-based, disparities employing multimodal primitives.After the low- and symbolic-level algorithms have been cov-ered, the fusion process will be introduced.
2.1 Low-level algorithm description
For the dense, low-level disparity estimation we have used amethod based on the phase component of band-pass filteredversions of the stereo images (input). Phase information wasused for reasons of efficiency and stability [3,6,23,24,26].Fleet and Jepson showed the stability of the phase com-ponent with respect to small geometric deformations [7],making phase more robust than amplitude for computing dis-parity based on binocular cues. If the cameras have almostidentical orientation and the baseline is not too big whilstthe distance to the object being observed is sufficient thenthe geometric deformations induced by motion parallax dueto a change of viewpoint will be small. In this case, thephase-based estimations obtained might be expected to beaccurate.
The model used is inspired by the optical-flow calculationmodel of Gautama and van Hulle [8] and by the single-scaledisparity calculation of Solari et al. [26]. The final modelcombines the advantages of both methods, using a coarse-to-fine multiresolution computation scheme with warping[23]. In the chosen implementation, disparity is calculatedbased on the phase-difference between stereo images fil-tered by a bank of seven Gabor filters with different orienta-tions, without explicitly calculating the phase, thus renderingthe method both hardware-friendly and suitable for real-timecomputations [2,3]. In addition to the above-mentioned prop-erties (density, efficiency and stability in the face of smallgeometric deformations), the phase-difference method worksexplicitly at sub-pixel accuracy. The stages of the algorithmare the following:
1. If on the coarsest scale skip this stage, otherwise-expansion of results to current scale:Dk(x) = expand(Dk+1(x))
-warping of right stereo image:Ir (x) = war p(Ir (x + Dk(x)))
2. Convolution of the input images I kr (x) and I k
l (x) with theGabor filters to obtain the Gabor filter responses. Eachimage scale is convolved with the same set of filters,tuned to seven different orientations and with a spatialfrequency peak of 0.25.
3. Filtering out those responses that are below a givenenergy threshold: those responses that do not tune well
123

68 J. Ralli et al.
Table 1 Implementation detailsfor Xilinx Virtex XC4VFX1000FPGA
LUTs Slice flip flops Slices DSP Block RAM Freq. Frac.(50,560) (50,560) (25,280) (128) (232) (MHz) (bits)
15,810 11,693 12,464 80 16 60.0 2
with the filters, corresponding to low energy, are consid-ered unreliable and thus are filtered out.
4. Disparity calculation using remaining responses (thosethat have not been filtered out). Since there are seven fil-ters each image position receives several disparity esti-mations.
5. Choosing the disparity estimation for each image posi-tion using median filter, as indicated by (1), in order toobtain Dk
new(x).6. Merge valid disparity estimations
Dk(x) = merge(Dk(x), Dknew(x)).
7. If not at the final scale return to 1.
where I kl (x) and I k
r (x) are the left and right stereo imagesand Dk(x) is the disparity map corresponding to scale (res-olution) k and position x = (x, y). Disparity estimation foreach image position is chosen using a median filter, as indi-cated by (1)
Dk(x) = median(Dkθ (x, d P; f0)) (1)
where Dk(x) is the final resulting disparity for each imageposition x = (x, y) and Dk
θ (x, d P; f0) are the disparityresponses corresponding to filter orientation θ and scale k,where d P is the phase difference, f0 is the peak frequencyof the filter.
2.1.1 Hardware implementation
In this section we describe how the low-level algorithm, with-out fusion at this stage, has been implemented in a hard-ware design. The reason for including this part is that wehave studied effectiveness of the proposed fusion scheme ina simulation of the hardware implementation and by com-bining this information with the results, feasibility of imple-menting the fusion in the hardware can be estimated. Thehardware architecture was implemented in a Xilinx VirtexXC4VFX1000 FPGA using a high-level-hardware (high-level HDL) description language which permits descriptionof the functionality at the algorithmic level.
The system consists of two different main stages:
Stage 1: rectification and image pyramid creation.Stage 2: processing loop, coarse-to-fine scale.
With rectification we mean stereo-rectification usingepipolar geometry and by image pyramid we refer to a mul-
tiresolution strategy. The design aims at a fine-pipelinedcircuit benefitting from high parallelism of the FPGA cir-cuit. The initial processing circuits for left- and right imagesare replicated and work in parallel. Nevertheless inside theseprocessing blocks the work is done sequentially, combiningstages where possible: image rectification and first down-scaling are done simultaneously as soon as enough rectifiedpixels are available. As soon as the image pyramids havebeen created, processing loop starts from the coarsest scale,advancing towards the finest, by repeating sequentially thesame block.
The main steps of the processing loop are:
1. Expansion of results to next scale,Dk(x) = expand
(Dk+1(x)
).
2. Warping of input images as per expanded disparity.3. Disparity calculation for current scale, Dk
new(x).4. Merging of disparity estimations,
Dk(x) = merge(Dk
new(x), Dk(x)).
The architecture works at a data rate of one pixel per clockcycle. Table 1 displays the amount of resources consumed bythe implementation. The implementation uses a fixed-pointrepresentation and the number of bits used for representingfractions is given in Table 1.
2.2 Symbolic-level algorithm description
The multimodal visual primitives are local, multimodalvisual feature descriptors that were described in [12]. Theyare semantically and geometrically meaningful descriptionsof local image patches, motivated by the hyper-columnarstructures in V1 [9].
Primitives can be edge-like or homogeneous and either 2Dor 3D. In this work, only edge-like primitives are relevant andfor other definitions the reader should consult [12].
An edge-like 2D primitive is defined by Eq. 2:
π = (x, θ, ω, (cl , cm, cr )), (2)
where x is the image position of the primitive; θ is the 2D ori-entation; ω represents the contrast transition; and (cl , cm, cr )
is the representation of the color, corresponding to the left(cl ), the middle (cm) and the right side (cr ) of the primitive.Figure 2 shows the extracted primitives for an example scene.
A 2D edge primitive π is a 2D feature, which can be usedto find correspondences in a stereo framework to create 3D
123

Disparity disambiguation by fusion of signal- and symbolic-level information 69
Fig. 2 Extracted primitives (b) for the example image in a. Magnifiedprimitives in d and edge primitives in c for the marked region of interestin b
edge primitives (as introduced in [17]) the formula for whichis given in Eq. 3:
� = (X,�,�, (cl , cm, cr )), (3)
where X is the 3D position; � is the 3D orientation; � isthe phase (i.e., contrast transition); and, (cl , cm, cr ) is therepresentation of the color, corresponding to the left (cl ), themiddle (cm) and the right side (cr ) of the 3D primitive.
2.3 Fusion process
The density of sparse algorithms is considerably lower thanthat of dense algorithms, typically well below 15%. Withoutpropagating the sparse symbolic-level disparity, before feed-ing back at the signal-level, such low-density maps would beable to disambiguate only locally over a very limited area thusmaking the improvements depend directly upon both accu-racy and the density of the symbolic-disparity. In a multiscaleapproach, however, fusion is done at each scale, meaning thatthe sparse disparity map has to be scaled down to match thedownscaled image sizes. We scale the symbolic-level dispar-ity map down using median filtering (ignoring positions thatdo not contain disparity values), which results in the naturalpropagation of the disparities. Nevertheless, before scalingdown the symbolic-level disparity, it is densified by apply-ing voting mask propagation (VMP) [20]. Ralli et al. showin their VMP paper that significant densification of a sparse-disparity is possible, producing only a very minor increasein error, using mask propagation with a voting scheme (cf.[20]). Once the disparity map provided by the symbolic-level
algorithm is densified by applying VMP and scaled down,it is used for disambiguation of the interpretations gener-ated by the low-level algorithm by biasing the correspondingnearest (most similar) value and thus maximizing the coher-ency. If the difference between the most similar low- andsymbolic-level values is above a given rejection thresholdthen the symbolic-level value is discarded and a decision ismade as indicated by (1). The pseudo-code of the fusion pro-cess is given below:
IF min(Dsym(x) − Dlowθ (x, θ)) > thr OR (Dsym(x) = ∅)
THEND = median(Dlow
θ (x))
ELSED = nearest (Dsymbol(x), Dlow
θ (x))
ENDIF
where Dsymbol(x) is the symbolic-level disparity approxi-mation, Dlow
θ (x) are the energy-filtered, low-level dispar-ity approximations as per orientations, thr is the rejectionthreshold, ∅ is an empty set and the function nearest (A, B)
returns the value from B that is nearest to A (nearest inEuclidean sense). Therefore, if there are no symbolic-leveldisparity approximations or the difference between the clos-est symbolic- and low-level disparities is greater than therejection threshold, then the disparity is chosen normally asdefined by (1). If the difference between the closest symbolic-level and low-level disparity is below the rejection threshold,then the closest low-level disparity is chosen. This selectionmechanism can be understood as biasing the closest low-level disparity value in such a way as to have more likeli-hood of being chosen. Biasing can be done in other ways,possibly using either a cost function or a reliability measurefor instance. Since the disparities provided by the symbolic-level are based on multimodal visual primitives that alreadyhave local support [11,18], there is no need to aggregatelocal evidence in the fusion process when biasing the dispar-ity calculated by the low level. If aggregation of evidence isneeded, because the multimodal visual primitives arrive at ahigher scene description the aggregation of evidence shouldbe carried out at this level by grouping the primitives intogroups describing the same objects and/or object contours,for example [18]. Figures 3 and 4 display data flow withoutand with fusion.
3 Experiments
The proposed fusion model was tested both quantitativelyusing well-known benchmark images from the Middle-bury (http://vision.middlebury.edu/stereo/data) database and
123

70 J. Ralli et al.
Fig. 3 System data flowwithout fusion (shown for 1scale only)
Fig. 4 System data flow withfusion (shown for 1 scale only)
qualitatively using images from the DRIVSCO (http://www.pspc.dibe.unige.it/~drivsco/) project. In the Middlebury casethe results are given in two different ways: (a) using meanaverage error (MAE) and/or percentage of correct disparitiesand density of the resulting disparity map and (b) analyz-ing which image structures benefit and how much from thefusion. By analyzing how different image structures ben-efit from fusion we gain more insight about behavior ofthe fusion process. In the DRIVSCO case the results areevaluated only qualitatively since no ground truth exists forthe used sequence. However, the improvements are clearlyvisible.
3.1 Performance metrics
Formulae of the used performance metrics are given inEqs. (4)–(6).
MAE := 1
N
N∑
i=1
abs(D (x(i)) − Dgt (x(i))
)(4)
C := #{i | abs
(D (x(i)) − Dgt (x(i))
) ≤ 1}
100
N(5)
D := 100N
M(6)
where x(i) = (x(i), y(i)) , D (x(i)) and Dgt (x(i)) are thecalculated and ground-truth disparity values with N and Mbeing the number of defined disparities, correspondingly.M AE stands for MAE, C for percentage of correct dispari-ties and D for density.
3.2 Qualitative results
The proposed fusion method can also be used with densefeedback maps that reflect the general geometrical structureof the scene. Here we show that when working with sucha dense feedback the rejection mechanism (of the fusionmethod) is capable of rejecting those values that do not fitthe evidence suggested by the data and thus correct valuesare still generated for such locations. As is shown by Ralliet al. [21] using such knowledge of the geometrical structureof the scene can greatly enhance the results where, due tolack of meaningful structure, the low-level algorithm fails togenerate correct approximations. In the example given here,without loss of generality, we do not generate feedback mapsusing, e.g., a symbolic process but use information that isknown a priori: geometrical structure of the road. Figure 5shows the results for frames 380, 390 and 400 of the DRIV-SCO scene using the SW model with energy threshold of 0.The reason for testing only with the SW model is twofold:firstly, it generates more dense disparity maps thus making
123

Disparity disambiguation by fusion of signal- and symbolic-level information 71
Fig. 5 Results for the DRIVSCO scene using the SW model. a Feed-back map; b, e, h left stereo-image; c, f, i disparity without feedback;d, g, j disparity with feedback
it easier to see effects of the fusion; secondly, the hardwaremodel has been tuned to a particular hardware thus limitingthe fractions to 2 bits therefore affecting the fusion process.However by using more bits for representing the fractionsthe two models will converge.
In Fig. 5 the top row displays the used feedback map thatreflects shape of the road (modeled as a plane) while rowstwo to four display the results: middle column shows theresulting disparities without the feedback while right col-umn shows the results using the feedback. Since the asphaltedroad, for most parts, does not contain meaningful structure forthe phase-based method to generate correct approximations,these locations have erroneous values. By using geometri-cal knowledge correct approximations are generated also forthese locations. In areas where the feedback is not supportedby the data it gets rejected and thus correct values are gener-ated for these locations (e.g., bushes beside the road and theapproaching car).
3.3 Quantitative results
Both the models, SW and a simulation of the hardware (HW),were tested. The reason for testing with simulation of a HWis that in real implementations (especially those targetingfor real-time) efficiency versus size trade-offs need to betaken into account. One such crucial trade-off, from a HWresources usage point of view is the type and precision ofnumerical representation. In the simulation numerical accu-
Table 2 Numerical values of the feedback maps
Original Densified by VMP
MAE C (%) D (%) MAE C (%) D (%)
Cones
Symbolic 1.48 78.32 0.13 1.45 78.80 1.41
GT(Sym.) 0.00 100.00 0.13 0.29 97.16 1.40
GT 0.00 100.00 5.01 0.41 97.18 32.42
Lamp1
Symbolic 2.94 81.84 0.21 3.48 72.29 2.31
GT(Sym.) 0.00 100.00 0.21 1.70 93.00 2.29
GT 0.00 100.00 4.96 0.72 96.36 22.68
Monopoly
Symbolic 2.15 89.92 0.32 3.37 85.84 3.48
GT(Sym.) 0.00 100.00 0.32 1.39 96.47 3.45
GT 0.00 100.00 5.01 0.50 97.43 24.48
Plastic
Symbolic 4.18 70.79 0.11 4.07 72.74 1.24
GT(Sym.) 0.00 100.00 0.11 1.60 92.44 1.23
GT 0.00 100.00 3.79 0.66 96.04 13.34
MAE, C and D denote ‘mean average error’, ‘correct disparities’ and‘density’ correspondingly while Lamp1 refers to Lampshade1
racy is modified so that it matches the proposed one (as perTable 1). The results are given for four different cases: (a) nofeedback (b) feedback from the symbolic process (c) feed-back where positions correspond to the ones created usingthe symbolic process but with values taken from ground truthand (d) feedback where positions correspond to edges foundin the image (sharp transitions) and values are taken fromground truth while the density is kept at around 5%. Thefeedback maps correspond to the ones given in Table 2. Thesecond case (b) allows us to study the behavior of the sys-tem using a particular feedback created by the symbolic-pro-cess while the third (c) and fourth (d) allows us to study thebehavior of the system using optimal feedback having dif-ferent densities. A fixed number of seven image scales (withscale factor of 0.5) is used in all the cases, which is enough torecover the whole disparity range, while the energy thresh-old of the low-level algorithm (see Sect. 2.1) runs from 1 to3E-7. By using a range of energy threshold, instead of a fixedvalue, the response of the system with respect to correlationbetween accuracy and density can be evaluated. No post-pro-cessing of any kind is applied upon the resulting disparitymaps, which makes it possible to estimate the performanceof the proposed fusion method. First the results for the SWand then for the hardware model are given. Figure 6 showsthe left frame for each of the stereo images used for testing.
Table 2 shows numerical values of the used feedbackmaps. The left-hand side columns display the values forthe original maps while the right-hand side columns display
123

72 J. Ralli et al.
(a) (b)
(c) (d)
Fig. 6 Test images (left frame). a Cones, b Lampshade1, c Monopolyand d Plastic. Black circles indicate positions for which the symbolicprocess has generated disparity estimations (see Table 2)
the values for the maps used in the experiments (densifiedusing VMP [20]). GT(Sym.) and GT refer to the optimalfeedback maps based on the ground-truth: in GT(Sym.) casethe positions correspond to those of the symbolic feedbackwhereas in GT case positions correspond to image edges.
3.3.1 Software model
Figure 7 displays the results for Cones, Lampshade1, Monop-oly and Plastic stereo images in respective order. As it canbe observed, using optimal feedback [GT(Sym.) and GT] theerror reduces significantly in all the cases. With symbolic-feedback, results depend on the quality of the feedback sig-nal: in the Cones and Plastic cases the error is substantially
reduced whereas in the Lampshade1 the error has increasedinsignificantly using the symbolic feedback. A more detailedstudy of how different image structures have benefited fromthe fusion (see Table 3) reveals that for both the edge-likeand homogeneous structures the error has actually increasedslightly whereas for corner-like structures is has decreasedslightly. From this it can be concluded that the symbolicprocess has produced erroneous estimations for edge-likestructures which (due to downscaling during the multiscaleprocessing) propagate into the neighboring homogeneouszones. Using feedback has very small effect on the densityof the resulting disparity map, as can be observed from thefigures. The conclusion is that using this type of fusion sig-nificant improvement is possible, however, as expected, theresults depend on the quality of the feedback signal. Rejectionmechanism of the fusion process makes it relatively robustwith respect to errors of the feedback signal.
3.3.2 Hardware model
Figure 8 displays the results for Cones, Lampshade1, Monop-oly and Plastic stereo-images in respective order. As it canbe observed the error decreases significantly in all the casesusing feedback from the symbolic process. As the error of thefeedback used [GT(Sym.) and GT] decreases the improve-ment becomes even more significant. This is to be expectedsince the error in general produced by HW (or simulation) ishigher due to lack of precision in the calculation process andthus it benefits more from external feedback. Effect of fusion
10−8
10−6
10−4
10−2
100
0
0.5
1
1.5
2
2.5
3
3.5SW(cones), MAE
THR
MA
E
10−8
10−6
10−4
10−2
100
0102030405060708090
100SW(cones), density
THR
Den
sity
WOSym.GT(Sym.)GT
(a)
10−8
10−6
10−4
10−2
100
0123456789
10SW(lampshade1), MAE
THR
MA
E
10−8
10−6
10−4
10−2
100
0102030405060708090
100SW(lampshade1), density
THR
Den
sity
WOSym.GT(Sym.)GT
(b)
10−8
10−6
10−4
10−2
100
0
2
4
6
8
10
12
14SW(monopoly), MAE
THR
MA
E
10−8
10−6
10−4
10−2
100
0102030405060708090
100SW(monopoly), density
THR
Den
sity
WOSym.GT(Sym.)GT
(c)
10−8
10−6
10−4
10−2
100
0
1
2
3
4
5
6
7
8SW(plastic), MAE
THR
MA
E
10−8
10−6
10−4
10−2
100
0102030405060708090
100SW(plastic), density
THR
Den
sity
WOSym.GT(Sym.)GT
(d)
Fig. 7 Software results for a Cones, b Lampshade1, c Monopoly, d Plastic. THR is the energy threshold
123

Disparity disambiguation by fusion of signal- and symbolic-level information 73
Table 3 Performance of theproposed method (labeled‘guided’) for different imagestructures (energy threshold3E-7). Each cell shows theaverage error and standarddeviation (SD) of the error. WO,SYM, GT(Sym.) and GTrespectively denote ‘withoutfeedback’, ‘symbolic feedback’,‘ground truth symbolicfeedback’ and ‘ground truthfeedback’
Case Homogen. Edge-like Corner-like Total
Avg. SD Avg. SD Avg. SD Avg. SD
Cones-HW-WO 13.1 24.4 10.4 18.2 10.5 19.7 12.7 23.7
Cones-HW-SYM 10.2 21.8 7.0 13.8 7.5 16.1 9.8 21.0
Cones-HW-GT(Sym.) 10.3 21.8 6.9 13.9 7.4 15.9 9.8 21.0
Cones-HW-GT 3.0 8.0 2.9 7.7 2.5 7.1 2.9 7.9
Lamp1-HW-WO 19.8 20.7 10.9 9.4 8.9 9.9 19.7 20.6
Lamp1-HW-SYM 17.0 19.0 10.3 9.6 7.5 9.8 16.9 19.0
Lamp1-HW-GT(Sym.) 17.1 19.2 10.0 9.1 7.4 10.0 17.0 19.1
Lamp1-HW-GT 9.0 12.9 7.5 8.2 3.7 5.7 8.9 12.8
Monop-HW-NG 12.7 16.3 9.7 16.8 7.6 14.4 11.8 16.3
Monop-HW-SYM 11.2 15.3 6.4 12.0 5.0 9.3 10.0 14.6
Monop-HW-GT(Sym.) 10.9 15.2 5.5 11.1 4.4 8.5 9.5 14.4
Monop-HW-GT 9.4 14.0 3.8 10.1 1.8 5.2 7.9 13.3
Plastic-HW-NG 13.8 15.1 5.3 8.4 0.7 1.0 13.7 15.1
Plastic-HW-SYM 12.8 14.4 4.2 6.6 0.4 0.3 12.7 14.4
Plastic-HW-GT(Sym.) 12.2 14.5 3.9 6.3 0.4 0.6 12.1 14.5
Plastic-HW-GT 10.8 14.5 3.1 5.8 0.3 1.5 10.7 14.5
Cones-SW-WO 2.7 6.9 3.9 8.2 3.6 7.9 2.9 7.1
Cones-SW-SYM 2.4 6.0 3.4 6.5 3.1 6.7 2.5 6.1
Cones-SW-GT(Sym.) 2.4 6.1 3.3 6.6 3.1 6.7 2.6 6.2
Cones-SW-GT 2.0 5.3 2.8 6.2 3.1 6.8 2.1 5.5
Lamp1-SW-WO 9.0 11.7 9.6 9.5 9.3 13.8 9.0 11.7
Lamp1-SW-SYM 9.1 11.9 9.7 10.1 9.1 13.6 9.1 11.8
Lamp1-SW-GT(Sym.) 8.7 11.6 9.5 9.6 9.2 13.6 8.7 11.6
Lamp1-SW-GT 7.8 11.0 7.0 8.7 9.3 12.5 7.8 11.0
Monop-SW-WO 15.4 21.4 6.9 14.7 3.9 9.2 13.3 20.2
Monop-SW-SYM 15.2 21.3 6.8 14.6 3.6 8.9 13.1 20.1
Monop-SW-GT(Sym.) 14.8 21.2 5.4 13.0 2.6 6.8 12.5 19.9
Monop-SW-GT 14.4 21.2 4.4 12.2 1.5 4.4 12.0 19.9
Plastic-SW-WO 7.2 10.5 3.6 6.8 0.3 0.1 7.1 10.5
Plastic-SW-SYM 6.9 10.4 3.3 6.5 0.3 0.1 6.8 10.3
Plastic-SW-GT(Sym.) 6.8 10.6 3.2 6.3 0.3 0.1 6.8 10.5
Plastic-SW-GT 6.3 9.8 2.9 6.0 0.2 0.1 6.3 9.8
upon density is almost negligible. We have also conductedexperiments with an even more restricted model (only onebit for fraction) and the results are consistent with the resultsshown above.
3.3.3 Performance gain for different image structures
In this section, we evaluate the performance gain over dif-ferent image structures: in other words, which image struc-tures benefit and to what degree from the fusion of low- andsymbolic-level disparities. To classify homogeneous, edge-like and corner-like image structures we use a continuousclassification scheme called intrinsic dimensionality (iD) [4].
The method according to [4] assigns three confidences toeach image point for being homogeneous, edge-like and cor-ner-like. In [4], these confidences are interpreted to span atriangle the corners of which correspond to the ideal imagestructures (i.e., homogeneous, edge-like and corner-like), andthe non-ideal image structures are located inside the triangleaccording to their confidences. Figure 9 shows an exampleiD triangle and how a set of image structures map onto it.
The performance gain analysis for different image struc-tures is done using the smallest tested threshold for low-levelalgorithm, which is 3E-7. Figure 10 provides the distributionof disparity error over the iD triangle for the Lampshade1HW results. We believe that this is a good way to analyze
123

74 J. Ralli et al.
10−8
10−6
10−4
10−2
100
02468
1012141618
HW(cones), MAE
THR
MA
E
10−8
10−6
10−4
10−2
100
0102030405060708090
100HW(cones), density
THR
Den
sity
WOSym.GT(Sym.)GT
(a)
10−8
10−6
10−4
10−2
100
02468
101214161820
HW(lampshade1), MAE
THR
MA
E
10−8
10−6
10−4
10−2
100
0102030405060708090
100HW(lampshade1), density
THR
Den
sity
WOSym.GT(Sym.)GT
(b)
10−8
10−6
10−4
10−2
100
0
2
4
6
8
10
12HW(monopoly), MAE
THR
MA
E
10−8
10−6
10−4
10−2
100
0102030405060708090
100HW(monopoly), density
THR
Den
sity
WOSym.GT(Sym.)GT
(c)
10−8
10−6
10−4
10−2
100
0
5
10
15
20
25HW(plastic), MAE
THRM
AE
10−8
10−6
10−4
10−2
100
0102030405060708090
100HW(plastic), density
THR
Den
sity
WOSym.GT(Sym.)GT
(d)
Fig. 8 Hardware results for a Cones, b Lampshade1, c Monopoly, d Plastic
Fig. 9 The intrinsic dimensionality triangle and how a set of imagestructures map onto it. For more information about how the axes of thetriangle were extracted cf. [4]
the performance of different methods upon different imagestructures, since it is not a discrete measurement. We can seefrom Fig. 10 that the performance improves for almost everyimage structure.
By taking the maximum of the iD confidences of imagestructures we can get discrete labels. For example, if we haverespectively the following homogeneous, edge-like and cor-ner-like confidences for an image pixel, we can give the dis-crete label ‘homogeneous’ to that pixel: 0.5, 0.3, 0.2. Table 3
confirms an improvement in the performance when the low-level disparity estimation process is guided by disparity fromthe symbolic-level process. Results generated by the SW andthe HW models are not directly comparable since for thesame energy threshold (due to numerical presentation) bothof the models produce disparity maps with different densities.Therefore, in the case of Monopoly for example, error pro-duced by the SW model is higher than that produced by theHW model but the densities are not the same (see Figs. 7, 8).
As it can be observed from Fig. 10 practically all imagestructures benefit from the feedback.
4 Conclusions
We have described a fusion process for disambiguatinglow-level disparity estimations, produced by an algorithmgenerating several possible local interpretations of the scenedisparity for each image position. Disambiguation is done byusing an external disparity map generated by a symbolic-levelprocess which is used to bias those low-level estimations thatare similar to the symbolic-ones. Any external disparities forwhich there is no support in the actual signal is considered tobe unreliable and hence will be rejected automatically. Sincedisambiguation is done at several image scales, a combina-tion of VMP [20] and median filter scaling increases spatialsupport of the external disparity map used at the fusion stage.Thus no explicit segmentation, diffusion or similar schemesare needed. Other important observations are:
123
Disparity disambiguation by fusion of signal- and symbolic-level information 75
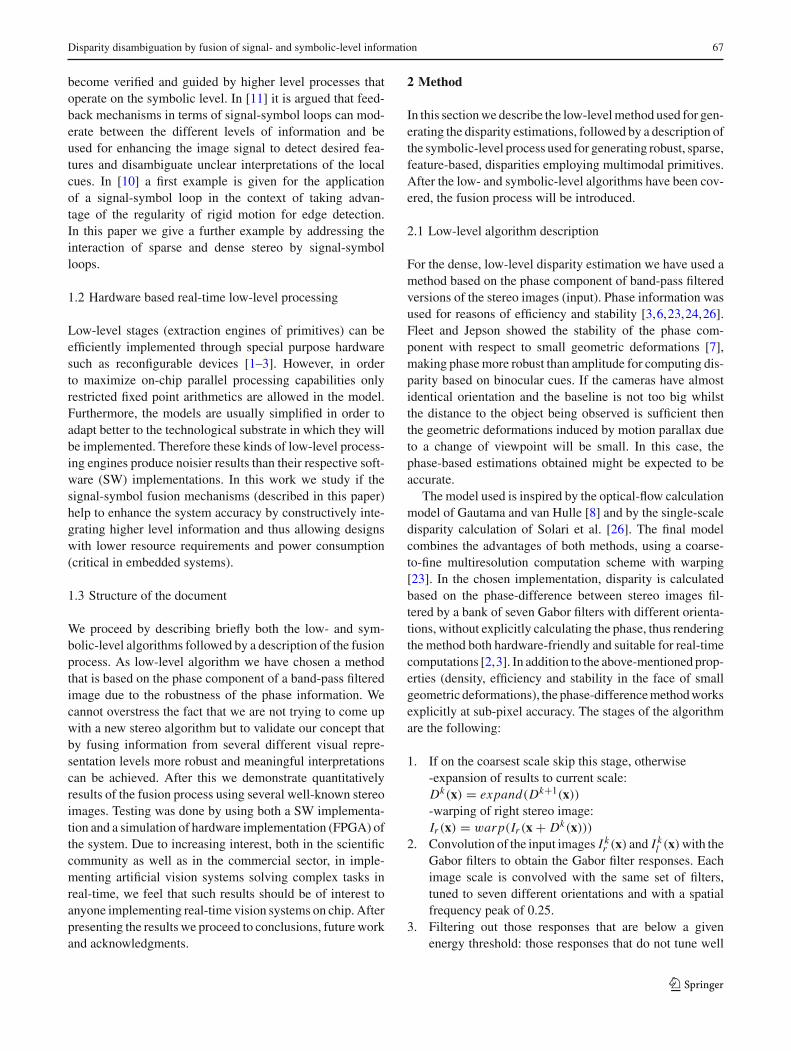
Fig. 10 Results for Monopoly(HW model). a No feedback,b symbolic feedback, c GT(Sym.), d GT. The distributionof disparity errors for differentimage structures. Dark graytones indicate lower error whilewhite tones indicate higher error
0
0.5
(a) (b)
(c) (d)
1
0
0.5
1
0
5
10
15
20
25
Edge
Corner
Homog.
Texture
0
0.5 1
0
0.5
1
0
5
10
15
20
25
Edge
Corner
Homog.
Texture
0 0.5 1 0
0.5
1
0
5
10
15
20
25
Edge
Corner
Homog.
Texture
0 0.5 1 0
0.5
1
0
5
10
15
20
25
Edge
Corner
Homog.
Texture
– The scheme will deliver more accurate dense disparityestimations by using the middle-level cues. The exactaccuracy gain depends on the images used.
– The density is not very much affected by the fusion andthus it remains almost the same, but the error decreases.Thus at constant error level, a higher density is obtainedafter densification and fusion mechanisms.
– All image structures seem to benefit from the fusion,especially edge- and corner-like ones. Homogeneousstructures are improved to a lesser extent because thesymbolic-level process does not produce any cues forhomogeneous areas.
– The proposed fusion scheme in particular enhances esti-mations produced by a hardware implementation (sim-ulation) with restricted numerical precision so that theresults become more similar with those produced by aSW implementation without any numerical restrictions.
In summary, the proposed scheme enhances the accuracyof the disparity estimations, reducing significantly the MAEin the evaluated images compared to the non-fusion scheme.The proposed fusion mechanism particularly enhances accu-racy of low-level estimations generated by hardware basedengines for real-time on-chip implementations with restrictedaccuracy.
4.1 Future work
Future work will involve (a) devising a way of accumulat-ing more evidence at the symbolic-level temporally and usethe accumulated, temporally coherent data for fusion and
(b) including feedback from signal- to symbolic-level. Thesetemporally robust, coherent, symbolic-level cues could beused for rejecting those low-level estimations that correspondto image areas of low-energy, thus improving further the dis-parity map when the low-level algorithm cannot produce reli-able estimations.
Acknowledgments This work was supported by the EU researchproject DRIVSCO (IST-016276-2) and the Spanish Grants DINAM-VISION (DPI2007-61683) and RECVIS (TIN2008-06893-C03-02)and Andalucía’s regional projects (P06-TIC-02007 and TIC-3873). Wethank A. L. Tate for revising our English text.
Appendix
The phase-based method can be summarized mathematicallyas follows [23].
1. Image convolution using Gabor filters.The image pair is convolved with a bank of seven Gaborfilters, each with a different orientation. The complex-valued Gabor filters are denoted by (7).
h(x; f0, θ) = hc(x; f0, θ) + ihs(x; f0, θ) (7)
where f0 denotes the peak frequency, θ its orientationin reference to the horizontal axis and hc() and hs()
denote the even (real) and odd (imaginary) parts. Thefilters have been designed to respond to high frequen-cies, meaning that they can detect small spatial details.The filter responses (band-pass signals) are generated by
123

76 J. Ralli et al.
convoluting an input image with a filter as defined in (8).
Q(x; θ) = I ∗ h(x; f0, θ) = C(x; θ) + i S(x; θ) (8)
where I denotes an input image, ∗ denotes convolutionand C(x; θ) and S(x; θ) are the even and odd responsescorresponding to a filter with an orientation θ .
2. Disparity calculation based on multi-oriented filters.Due to limitations caused by filter design, the maxi-mum disparity is limited to approximately ±5 pixels perscale. With no loss of generality, we assume that theinput images are rectified and thus only horizontal trans-lation exists. Horizontal movement (disparity) is cal-culated by projecting the translation to the horizontal(epipolar) axis, as defined in (9).
Dθ (x, d P; fo) = d P(x)/2π f0
cos(θ), d P ∈ −π π
d P(x; θ) = arctan2(C R SL − C L SR, C LC R + SL SR)
(9)
where Dθ (x, d P; f0) is the disparity; d P(x) refers tothe phase difference and the superscripts L and R referto left and right images (C and S refer to the evenand odd responses); f0 is the peak frequency of thefilter and θ refers to the orientation of the filter. Inour case, the peak frequency f0 is 0.25 for all thefilters and the filters have the following orientations:θ = {0, π
8 , 2π8 , 3π
8 , 5π8 , 6π
8 , 7π8 }. Since there are seven
different filters, each image position x receives sevenestimations.
3. Confidence threshold.To filter out those responses that do not tune wellwith the underlying image structure, a method based onfilter-response energy is used for thresholding. Theenergy response of a filter is calculated as defined in (10).
E(x, θ) = C2(x, θ) + S2(x, θ) (10)
where E(x, θ) denotes the energy corresponding to afilter with an orientation θ . A mask for removing filterresponses below a given threshold is obtained by (11).
m(x, θ) =
⎧⎪⎪⎨
⎪⎪⎩
1 if EL (x,θ)max(EL (θ))
≥ thr
AND ER(x,θ)max(ER(θ))
≥ thr
0 otherwise
(11)
where m(x, θ) denotes the mask value for each imageposition x corresponding to filter orientation θ, E{L ,R}(x, θ) is the energy response where the subscripts L andR refer to left and right images and max(E{L ,R}(θ))
denotes the maximum energy response correspondingto filter orientation θ (for all x) and thr is the threshold.The filter responses that correspond to a mask value 1are kept while the rest are discarded.
4. Choosing the disparity value.After those filter responses that correspond to low energyhave been filtered out the disparity is chosen as definedin (12).
D(x) =
⎧⎪⎨
⎪⎩
median(Dlowθ (x)) if dist > thr
nearest (Dsymbol(x),
Dlowθ (x)) otherwise
(12)
dist := min(Dsymbol(x) − Dlowθ (x, θ))
Dlowθ (x)) := Dθ (x, d P; fo)
where Dsymbol(x) is the symbolic-level disparity approx-imation, Dlow
θ (x) are the energy-filtered, low-level dis-parity approximations as per orientations, thr is therejection threshold and the function nearest (A, B)
returns the value from B that is nearest to A (nearestin Euclidean sense).
5. Multiscale disparity calculation.In order to calculate disparities over large ranges, acoarse-to-fine image-pyramid approach is used: resultscalculated at a coarse scale are propagated onto a higherscale (expansion) after which the right image is warpedas per the expanded disparity as defined in (13).
Dk(x) = expand(Dk+1(x))
IR((x)) = war p(IR(x + Dk(x)))(13)
where both the operators expand() and war p() arebased on bilinear interpolation.
References
1. Darabiha, A., MacLean, W., Rose, J.: Reconfigurable hardwareimplementation of a phase-correlation stereoalgorithm. Mach. Vis.Appl. 17(2), 116–132 (2006)
2. Díaz, J.: Multimodal bio-inspired vision system. High performancemotion and stereo processing architecture. PhD thesis, Universityof Granada, Spain (2006)
3. Díaz, J., Ros, E., Carillo, R., Prieto, A.: Real-time system for high-image-resolution disparity. IEEE Trans. Image Process. 16, 280–285 (2006)
4. Felsberg, M., Kalkan, S., Krüger, N.: Continuous characterizationof image structures of different dimensionality. Image Vis. Com-put. 27(6), 628–636 (2009)
5. Fitzgibbon, A.W., Zisserman, A.: Multibody Structure and Motion:3-D Reconstruction of Independently Moving Objects. LectureNotes in Computer Science, vol. 1842, pp. 891–906 (2000)
6. Fleet, D., Jepson, A.: Phase-based disparity measurement. Comput.Vis. Graph. Image Process. 53(2), 198–210 (1991)
123

Disparity disambiguation by fusion of signal- and symbolic-level information 77
7. Fleet, D., Jepson, A.: Stability of phase information. IEEE Trans.Pattern Anal. Mach. Intell. 15(12), 1253–1268 (1993)
8. Gautama, T., Hulle, M.V.: A phase-based approach to the estima-tion of the optical flow field using spatial filtering. IEEE TransNeural Netw. 13, 1127–1136 (2002)
9. Hubel, D., Wiesel, T.: Anatomical demonstration of columns in themonkey striate cortex. Nature 221, 747–750 (1969)
10. Kalkan, S., Yan, S., Krüger, V., Wörgötter, F., Krüger, N.: A signal-symbol loop mechanism for enhanced edge extraction. In: Inter-national Conference on Computer Vision Theory and ApplicationsVISAPP’08, pp. 214–221 (2008)
11. Krüger, N.: Three dilemmas of signal- and symbol-based represen-tations in computer vision. In: Proceedings of the Workshop Brain,Vision and Artificial Intelligence, vol. 3704, pp. 167–176 (2005)
12. Krüger, N., Lappe, M., Wörgötter, F.: Biologically motivated multi-modal processing of visual primitives. Interdiscip. J. Artif. Intell.Simul. Behav. 1(5), 417–427 (2004)
13. Lee, M., Medioni, G., Mordohai, P.: Inference of segmented over-lapping surfaces from binocular stereo. IEEE Trans. Pattern Anal.Mach. Intell. 24, 824–837 (2002)
14. Medioni, G., Lee, M., Tang, C.: A Computational Framework forSegmentation and Grouping. Elsevier, Amsterdam (2000)
15. Mordohai, P., Medioni, G.: Stereo using monocular cues withinthe tensor voting framework. IEEE Trans. Pattern Anal. Mach. In-tell. 28, 968–982 (2006)
16. Pugeault, N.: Early Cognitive Vision: Feedback Mechanisms forthe Disambiguation of Early Visual Representation. Vdm VerlagDr. Müller, Germany (2008)
17. Pugeault, N., Wörgötter, F., Krüger, N.: Multi-modal scene recon-struction using perceptual grouping constraints. In: Proceedings ofthe 5th IEEE Computer Society Workshop on Perceptual Orga-nization in Computer Vision, New York City, 22 June 2006 (inconjunction with IEEE CVPR 2006)
18. Pugeault, N., Wörgötter, F., Krüger, N.: Multi-modal scene recon-struction using preceptual grouping constraints. In: Proceedings of
the 5th IEEE Computer Society Workshop on Perceptual Organi-zation in Computer Vision, pp. 195–195 (2006)
19. Qian, G., Chellappa, R., Zheng, Q.: Bayesian algorithms forsimultaneous structure from motion estimation of multiple inde-pendently moving objects. IEEE Trans. Image Process. 14, 94–109 (2005)
20. Ralli, J., Díaz, J., Ros, E.: A method for sparse disparity densi-fication using voting mask propagation. J. Vis. Commun. ImageRepresent. 21(1), 67–74 (2010)
21. Ralli, J., Díaz, J., Ros, E.: Spatial and temporal constraints in varia-tional correspondence methods. IEEE Trans. Image Process. (2010,submitted)
22. Rares, A., Reinders, M., Hendriks, E.: Image interpretation sys-tems. Tech. rep., mCCWS project Technical Report (MCCWS2.1.1.3.C) (1999)
23. Sabatini, S., Gastaldi, G., Solari, F., Pauwels, K., van Hulle, M.,Diaz, J., Ros, E., Pugeault, N., Krüger, N.: Compact (and accurate)early vision processing in the harmonic space. In: VISAPP (1),vol. 1, pp. 213–220 (2007)
24. Sabatini, S., Gastaldi, G., Solari, F., Pauwels, K., Van Hulle, M.,Diaz, J., Ros, E., Pugeault, N., Krüger, N.: A compact harmoniccode for early vision based on anisotropic frequency channels.Comput. Vis. Image Underst. (2010, accepted)
25. Scharstein, D., Szeliski, R.: A taxonomy and evaluation of densetwo-frame stereo correspondence algorithms. Int. J. Comput.Vis. 47(1–3), 7–42 (2002)
26. Solari, F., Sabatini, S., Bisio, G.: Fast technique for phase-baseddisparity estimation with no explicit calculation of phase. Electron.Lett. 37(23), 1382–1383 (2001)
27. Tang, Y.L., Kasturi, R.: Tracking moving objects during low alti-tude flight. Mach. Vis. Appl. 9, 20–31 (1996)
28. Weems, C.C.: Architectural requirements of image understandingwith respect to parallel processing. In: Proceedings of the IEEE,vol. 79, no. (4), pp. 537–547 (1991)
123