Discussion Analysis and formulation of flow through combined v-notch-gate-device
11
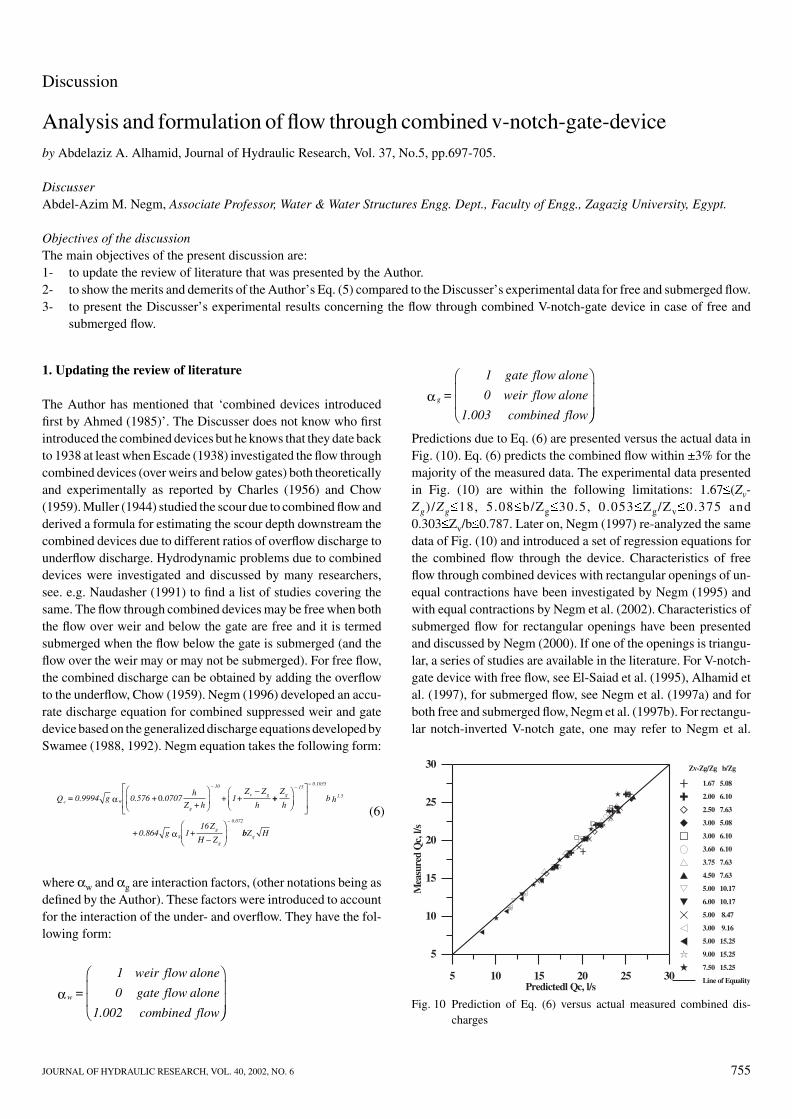
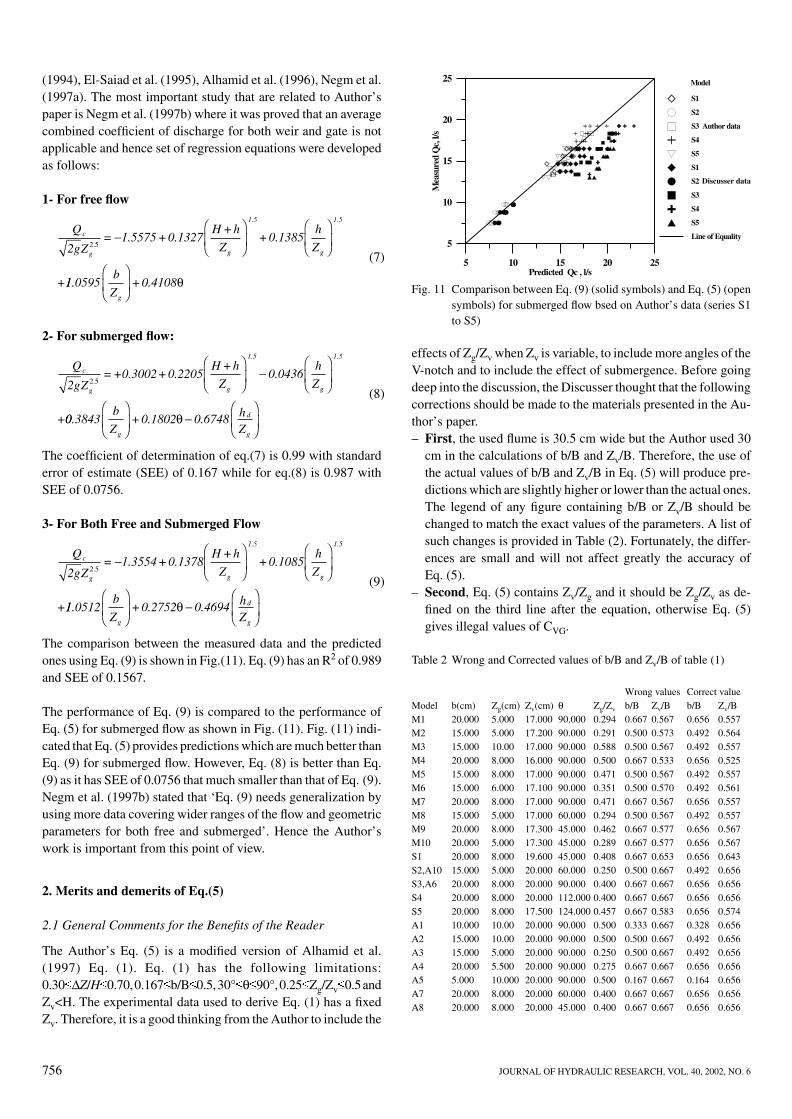
JOURNAL OF HYDRAULIC RESEARCH, VOL. 40, 2002, NO. 6 755 c w 0.1035 10 g 15 v g Q = 0.9994 g 0.576 + .0707 h Z +h + 1+ Z Z h α − − − − 0 + Z h b h + 0.864 g 1+ 16Z H Z g 1.5 g 0.072 g g − − α bZ H g (6) 5 10 15 20 25 30 Predictedl Qc, l/s 5 10 15 20 25 30 Measured Qc, l/s Zv-Zg/Zg b/Zg 1.67 5.08 2.00 6.10 2.50 7.63 3.00 5.08 3.00 6.10 3.60 6.10 3.75 7.63 4.50 7.63 5.00 10.17 6.00 10.17 5.00 8.47 3.00 9.16 5.00 15.25 9.00 15.25 7.50 15.25 Line of Equality Fig. 10 Prediction of Eq. (6) versus actual measured combined dis- charges w = 1 weir flow alone 0 gate flow alone 1.002 combined flow α g = 1 gate flow alone 0 weir flow alone 1.003 combined flow α Discussion Analysis and formulation of flow through combined v-notch-gate-device by Abdelaziz A. Alhamid, Journal of Hydraulic Research, Vol. 37, No.5, pp.697-705. Discusser Abdel-Azim M. Negm, Associate Professor, Water & Water Structures Engg. Dept., Faculty of Engg., Zagazig University, Egypt. Objectives of the discussion The main objectives of the present discussion are: 1- to update the review of literature that was presented by the Author. 2- to show the merits and demerits of the Author’s Eq. (5) compared to the Discusser’s experimental data for free and submerged flow. 3- to present the Discusser’s experimental results concerning the flow through combined V-notch-gate device in case of free and submerged flow. 1. Updating the review of literature The Author has mentioned that ‘combined devices introduced first by Ahmed (1985)’. The Discusser does not know who first introduced the combined devices but he knows that they date back to 1938 at least when Escade (1938) investigated the flow through combined devices (over weirs and below gates) both theoretically and experimentally as reported by Charles (1956) and Chow (1959). Muller (1944) studied the scour due to combined flow and derived a formula for estimating the scour depth downstream the combined devices due to different ratios of overflow discharge to underflow discharge. Hydrodynamic problems due to combined devices were investigated and discussed by many researchers, see. e.g. Naudasher (1991) to find a list of studies covering the same. The flow through combined devices may be free when both the flow over weir and below the gate are free and it is termed submerged when the flow below the gate is submerged (and the flow over the weir may or may not be submerged). For free flow, the combined discharge can be obtained by adding the overflow to the underflow, Chow (1959). Negm (1996) developed an accu- rate discharge equation for combined suppressed weir and gate device based on the generalized discharge equations developed by Swamee (1988, 1992). Negm equation takes the following form: where α w and α g are interaction factors, (other notations being as defined by the Author). These factors were introduced to account for the interaction of the under- and overflow. They have the fol- lowing form: Predictions due to Eq. (6) are presented versus the actual data in Fig. (10). Eq. (6) predicts the combined flow within ±3% for the majority of the measured data. The experimental data presented in Fig. (10) are within the following limitations: 1.67 (Z v - Z g )/ Z g 18, 5.08 b/Z g 30.5, 0.053 Z g /Z v 0.375 and 0.303 Z v /b 0.787. Later on, Negm (1997) re-analyzed the same data of Fig. (10) and introduced a set of regression equations for the combined flow through the device. Characteristics of free flow through combined devices with rectangular openings of un- equal contractions have been investigated by Negm (1995) and with equal contractions by Negm et al. (2002). Characteristics of submerged flow for rectangular openings have been presented and discussed by Negm (2000). If one of the openings is triangu- lar, a series of studies are available in the literature. For V-notch- gate device with free flow, see El-Saiad et al. (1995), Alhamid et al. (1997), for submerged flow, see Negm et al. (1997a) and for both free and submerged flow, Negm et al. (1997b). For rectangu- lar notch-inverted V-notch gate, one may refer to Negm et al.
Transcript of Discussion Analysis and formulation of flow through combined v-notch-gate-device
JOURNAL OF HYDRAULIC RESEARCH, VOL. 40, 2002, NO. 6 755
c w
0.103510
g
15
v gQ = 0.9994 g 0.576 + .0707
h
Z +h+ 1+
Z Z
hα
−− −
−0 ++
Z
hb h
+0.864 g 1+16Z
H Z
g 1.5
g
0.072
g
g
−
−
α bbZ Hg
(6)
5 10 15 20 25 30Predictedl Qc, l/s
5
10
15
20
25
30
Mea
sure
dQ
c,l/s
Zv-Zg/Zg b/Zg
1.67 5.08
2.00 6.10
2.50 7.63
3.00 5.08
3.00 6.10
3.60 6.10
3.75 7.63
4.50 7.63
5.00 10.17
6.00 10.17
5.00 8.47
3.00 9.16
5.00 15.25
9.00 15.25
7.50 15.25
Line of Equality
Fig. 10 Prediction of Eq. (6) versus actual measured combined dis-charges
w =
1 weir flow alone
0 gate flow alone
1.002 combined flow
α
g =
1 gate flow alone
0 weir flow alone
1.003 combined flow
α
Discussion
Analysis and formulation of flow through combined v-notch-gate-deviceby Abdelaziz A. Alhamid, Journal of Hydraulic Research, Vol. 37, No.5, pp.697-705.
DiscusserAbdel-Azim M. Negm, Associate Professor, Water & Water Structures Engg. Dept., Faculty of Engg., Zagazig University, Egypt.
Objectives of the discussionThe main objectives of the present discussion are:1- to update the review of literature that was presented by the Author.2- to show the merits and demerits of the Author’s Eq. (5) compared to the Discusser’s experimental data for free and submerged flow.3- to present the Discusser’s experimental results concerning the flow through combined V-notch-gate device in case of free and
submerged flow.
1. Updating the review of literature
The Author has mentioned that ‘combined devices introducedfirst by Ahmed (1985)’. The Discusser does not know who firstintroduced the combined devices but he knows that they date backto 1938 at least when Escade (1938) investigated the flow throughcombined devices (over weirs and below gates) both theoreticallyand experimentally as reported by Charles (1956) and Chow(1959). Muller (1944) studied the scour due to combined flow andderived a formula for estimating the scour depth downstream thecombined devices due to different ratios of overflow discharge tounderflow discharge. Hydrodynamic problems due to combineddevices were investigated and discussed by many researchers,see. e.g. Naudasher (1991) to find a list of studies covering thesame. The flow through combined devices may be free when boththe flow over weir and below the gate are free and it is termedsubmerged when the flow below the gate is submerged (and theflow over the weir may or may not be submerged). For free flow,the combined discharge can be obtained by adding the overflowto the underflow, Chow (1959). Negm (1996) developed an accu-rate discharge equation for combined suppressed weir and gatedevice based on the generalized discharge equations developed bySwamee (1988, 1992). Negm equation takes the following form:
where αw and αg are interaction factors, (other notations being asdefined by the Author). These factors were introduced to accountfor the interaction of the under- and overflow. They have the fol-lowing form:
Predictions due to Eq. (6) are presented versus the actual data inFig. (10). Eq. (6) predicts the combined flow within ±3% for themajority of the measured data. The experimental data presentedin Fig. (10) are within the following limitations: 1.67 (Zv-Zg)/Zg 18, 5.08 b/Zg 30.5, 0.053 Zg/Zv 0.375 and0.303 Zv/b 0.787. Later on, Negm (1997) re-analyzed the samedata of Fig. (10) and introduced a set of regression equations forthe combined flow through the device. Characteristics of freeflow through combined devices with rectangular openings of un-equal contractions have been investigated by Negm (1995) andwith equal contractions by Negm et al. (2002). Characteristics ofsubmerged flow for rectangular openings have been presentedand discussed by Negm (2000). If one of the openings is triangu-lar, a series of studies are available in the literature. For V-notch-gate device with free flow, see El-Saiad et al. (1995), Alhamid etal. (1997), for submerged flow, see Negm et al. (1997a) and forboth free and submerged flow, Negm et al. (1997b). For rectangu-lar notch-inverted V-notch gate, one may refer to Negm et al.
756 JOURNAL OF HYDRAULIC RESEARCH, VOL. 40, 2002, NO. 6
c
g
1.5
g
1.5
g
Q
2gZ= 1.5575 +0.1327
H +h
Z+0.1385
h
Z
+
2 5.−
11.0595b
Z+0.4108
g
θ
(7)
c
g
1.5
g
1.5
g
Q
2gZ=+0.3002+0.2205
H +h
Z0.0436
h
Z
+
2 5.
−
00.3843b
Z+0.1802 0.6748 h
Zg
d
g
−
θ
(8)
c
g
1.5
g
1.5
g
Q
2gZ= 1.3554+0.1378
H +h
Z+0.1085
h
Z
+
2 5.−
11.0512b
Z+0.2752 0.4694 h
Zg
d
g
−
θ
(9)
5 10 15 20 25Predicted Qc , l/s
5
10
15
20
25
Mea
sure
dQ
c,l/s
Model
S1
S2
S3 Author data
S4
S5
S1
S2 Discusser data
S3
S4
S5
Line of Equality
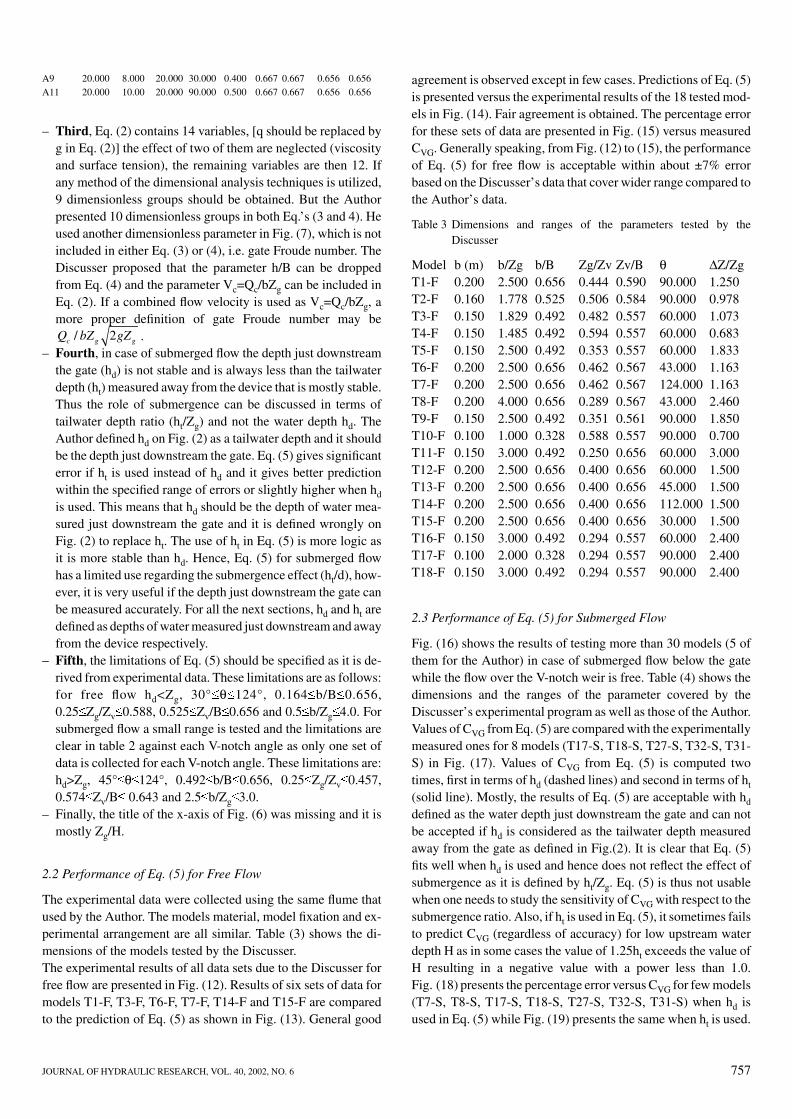
Fig. 11 Comparison between Eq. (9) (solid symbols) and Eq. (5) (opensymbols) for submerged flow bsed on Author’s data (series S1to S5)
(1994), El-Saiad et al. (1995), Alhamid et al. (1996), Negm et al.(1997a). The most important study that are related to Author’spaper is Negm et al. (1997b) where it was proved that an averagecombined coefficient of discharge for both weir and gate is notapplicable and hence set of regression equations were developedas follows:
1- For free flow
2- For submerged flow:
The coefficient of determination of eq.(7) is 0.99 with standarderror of estimate (SEE) of 0.167 while for eq.(8) is 0.987 withSEE of 0.0756.
3- For Both Free and Submerged Flow
The comparison between the measured data and the predictedones using Eq. (9) is shown in Fig.(11). Eq. (9) has an R2 of 0.989and SEE of 0.1567.
The performance of Eq. (9) is compared to the performance ofEq. (5) for submerged flow as shown in Fig. (11). Fig. (11) indi-cated that Eq. (5) provides predictions which are much better thanEq. (9) for submerged flow. However, Eq. (8) is better than Eq.(9) as it has SEE of 0.0756 that much smaller than that of Eq. (9).Negm et al. (1997b) stated that ‘Eq. (9) needs generalization byusing more data covering wider ranges of the flow and geometricparameters for both free and submerged’. Hence the Author’swork is important from this point of view.
2. Merits and demerits of Eq.(5)
2.1 General Comments for the Benefits of the Reader
The Author’s Eq. (5) is a modified version of Alhamid et al.(1997) Eq. (1). Eq. (1) has the following limitations:0.30 ∆Z/H 0.70,0.167 b/B 0.5,30° θ 90°,0.25 Zg/Zv 0.5andZv<H. The experimental data used to derive Eq. (1) has a fixedZv. Therefore, it is a good thinking from the Author to include the
effects of Zg/Zv when Zv is variable, to include more angles of theV-notch and to include the effect of submergence. Before goingdeep into the discussion, the Discusser thought that the followingcorrections should be made to the materials presented in the Au-thor’s paper.– First, the used flume is 30.5 cm wide but the Author used 30
cm in the calculations of b/B and Zv/B. Therefore, the use ofthe actual values of b/B and Zv/B in Eq. (5) will produce pre-dictions which are slightly higher or lower than the actual ones.The legend of any figure containing b/B or Zv/B should bechanged to match the exact values of the parameters. A list ofsuch changes is provided in Table (2). Fortunately, the differ-ences are small and will not affect greatly the accuracy ofEq. (5).
– Second, Eq. (5) contains Zv/Zg and it should be Zg/Zv as de-fined on the third line after the equation, otherwise Eq. (5)gives illegal values of CVG.
Table 2 Wrong and Corrected values of b/B and Zv/B of table (1)
Wrong values Correct valueModel b(cm) Zg(cm) Zv(cm) θ Zg/Zv b/B Zv/B b/B Zv/BM1 20.000 5.000 17.000 90.000 0.294 0.667 0.567 0.656 0.557M2 15.000 5.000 17.200 90.000 0.291 0.500 0.573 0.492 0.564M3 15.000 10.00 17.000 90.000 0.588 0.500 0.567 0.492 0.557M4 20.000 8.000 16.000 90.000 0.500 0.667 0.533 0.656 0.525M5 15.000 8.000 17.000 90.000 0.471 0.500 0.567 0.492 0.557M6 15.000 6.000 17.100 90.000 0.351 0.500 0.570 0.492 0.561M7 20.000 8.000 17.000 90.000 0.471 0.667 0.567 0.656 0.557M8 15.000 5.000 17.000 60.000 0.294 0.500 0.567 0.492 0.557M9 20.000 8.000 17.300 45.000 0.462 0.667 0.577 0.656 0.567M10 20.000 5.000 17.300 45.000 0.289 0.667 0.577 0.656 0.567S1 20.000 8.000 19.600 45.000 0.408 0.667 0.653 0.656 0.643S2,A10 15.000 5.000 20.000 60.000 0.250 0.500 0.667 0.492 0.656S3,A6 20.000 8.000 20.000 90.000 0.400 0.667 0.667 0.656 0.656S4 20.000 8.000 20.000 112.000 0.400 0.667 0.667 0.656 0.656S5 20.000 8.000 17.500 124.000 0.457 0.667 0.583 0.656 0.574A1 10.000 10.00 20.000 90.000 0.500 0.333 0.667 0.328 0.656A2 15.000 10.00 20.000 90.000 0.500 0.500 0.667 0.492 0.656A3 15.000 5.000 20.000 90.000 0.250 0.500 0.667 0.492 0.656A4 20.000 5.500 20.000 90.000 0.275 0.667 0.667 0.656 0.656A5 5.000 10.000 20.000 90.000 0.500 0.167 0.667 0.164 0.656A7 20.000 8.000 20.000 60.000 0.400 0.667 0.667 0.656 0.656A8 20.000 8.000 20.000 45.000 0.400 0.667 0.667 0.656 0.656
JOURNAL OF HYDRAULIC RESEARCH, VOL. 40, 2002, NO. 6 757
A9 20.000 8.000 20.000 30.000 0.400 0.667 0.667 0.656 0.656A11 20.000 10.00 20.000 90.000 0.500 0.667 0.667 0.656 0.656
– Third, Eq. (2) contains 14 variables, [q should be replaced byg in Eq. (2)] the effect of two of them are neglected (viscosityand surface tension), the remaining variables are then 12. Ifany method of the dimensional analysis techniques is utilized,9 dimensionless groups should be obtained. But the Authorpresented 10 dimensionless groups in both Eq.’s (3 and 4). Heused another dimensionless parameter in Fig. (7), which is notincluded in either Eq. (3) or (4), i.e. gate Froude number. TheDiscusser proposed that the parameter h/B can be droppedfrom Eq. (4) and the parameter Vc=Qc/bZg can be included inEq. (2). If a combined flow velocity is used as Vc=Qc/bZg, amore proper definition of gate Froude number may be
.Q bZ gZc g g/ 2– Fourth, in case of submerged flow the depth just downstream
the gate (hd) is not stable and is always less than the tailwaterdepth (ht) measured away from the device that is mostly stable.Thus the role of submergence can be discussed in terms oftailwater depth ratio (ht/Zg) and not the water depth hd. TheAuthor defined hd on Fig. (2) as a tailwater depth and it shouldbe the depth just downstream the gate. Eq. (5) gives significanterror if ht is used instead of hd and it gives better predictionwithin the specified range of errors or slightly higher when hd
is used. This means that hd should be the depth of water mea-sured just downstream the gate and it is defined wrongly onFig. (2) to replace ht. The use of ht in Eq. (5) is more logic asit is more stable than hd. Hence, Eq. (5) for submerged flowhas a limited use regarding the submergence effect (ht/d), how-ever, it is very useful if the depth just downstream the gate canbe measured accurately. For all the next sections, hd and ht aredefined as depths of water measured just downstream and awayfrom the device respectively.
– Fifth, the limitations of Eq. (5) should be specified as it is de-rived from experimental data. These limitations are as follows:for free flow hd<Zg, 30° θ 124°, 0.164 b/B 0.656,0.25 Zg/Zv 0.588, 0.525 Zv/B 0.656 and 0.5 b/Zg 4.0. Forsubmerged flow a small range is tested and the limitations areclear in table 2 against each V-notch angle as only one set ofdata is collected for each V-notch angle. These limitations are:hd>Zg, 45° θ 124°, 0.492 b/B 0.656, 0.25 Zg/Zv 0.457,0.574 Zv/B 0.643 and 2.5 b/Zg 3.0.
– Finally, the title of the x-axis of Fig. (6) was missing and it ismostly Zg/H.
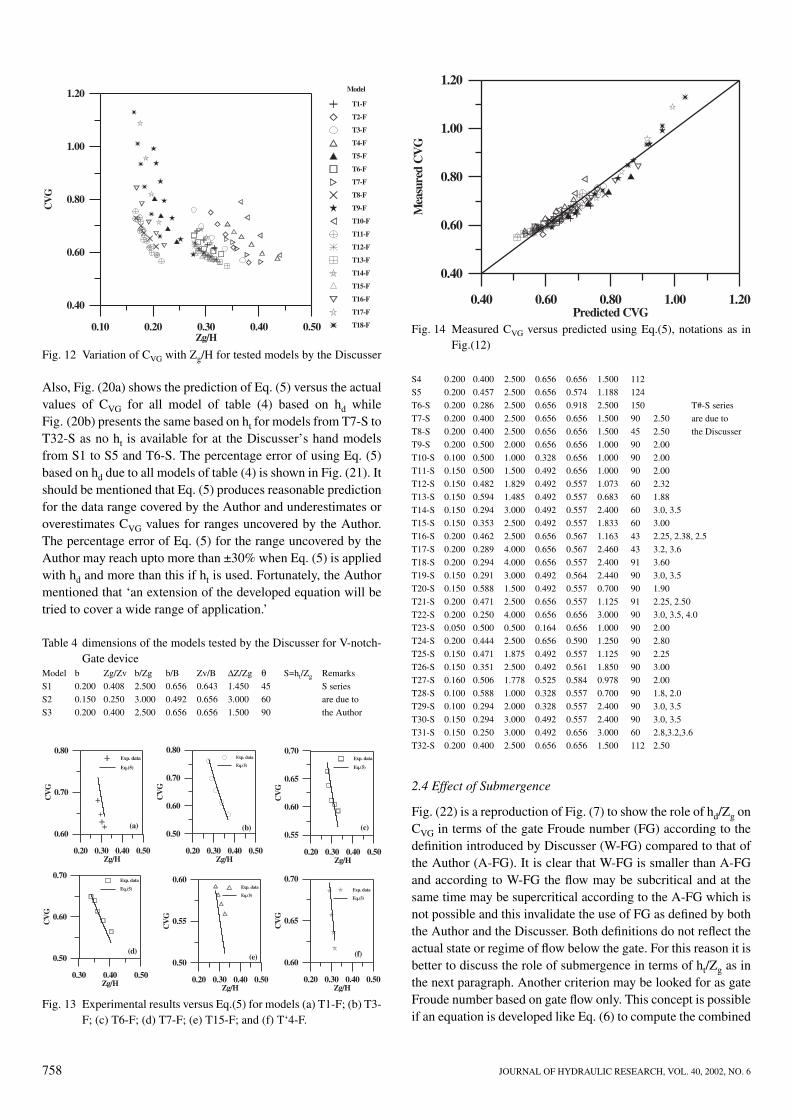
2.2 Performance of Eq. (5) for Free Flow
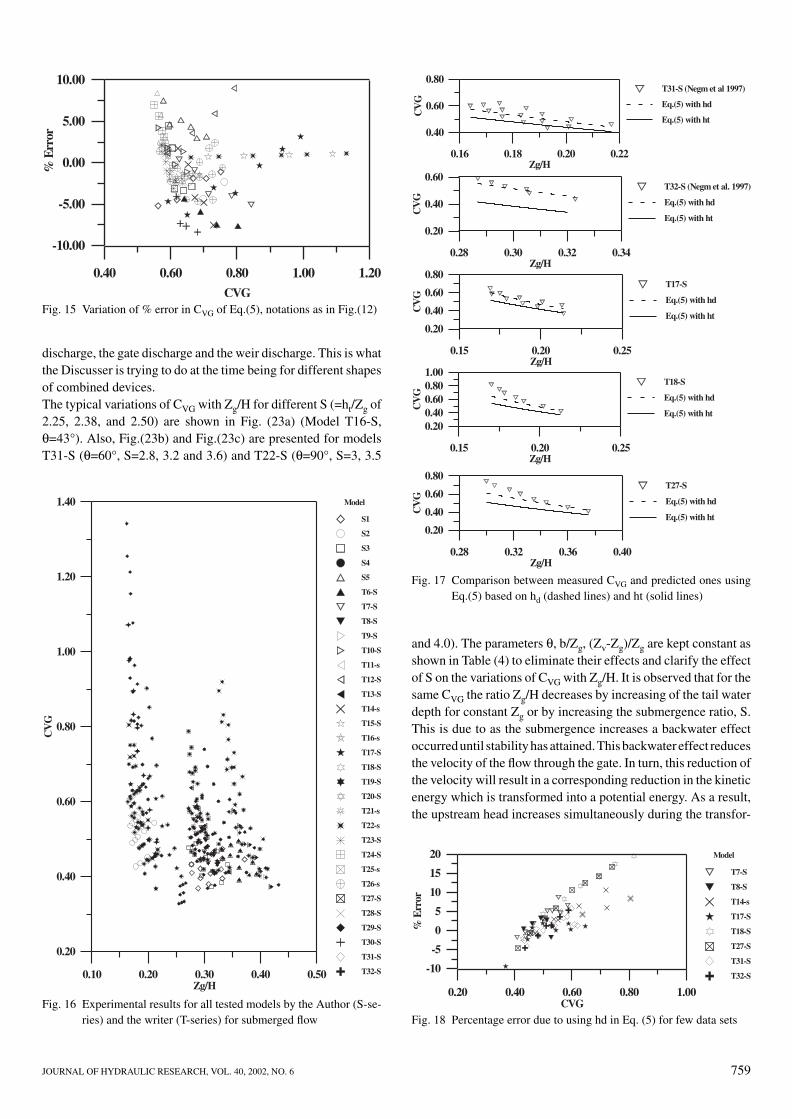
The experimental data were collected using the same flume thatused by the Author. The models material, model fixation and ex-perimental arrangement are all similar. Table (3) shows the di-mensions of the models tested by the Discusser.The experimental results of all data sets due to the Discusser forfree flow are presented in Fig. (12). Results of six sets of data formodels T1-F, T3-F, T6-F, T7-F, T14-F and T15-F are comparedto the prediction of Eq. (5) as shown in Fig. (13). General good
agreement is observed except in few cases. Predictions of Eq. (5)is presented versus the experimental results of the 18 tested mod-els in Fig. (14). Fair agreement is obtained. The percentage errorfor these sets of data are presented in Fig. (15) versus measuredCVG. Generally speaking, from Fig. (12) to (15), the performanceof Eq. (5) for free flow is acceptable within about ±7% errorbased on the Discusser’s data that cover wider range compared tothe Author’s data.
Table 3 Dimensions and ranges of the parameters tested by theDiscusser
Model b (m) b/Zg b/B Zg/Zv Zv/B θ ∆Z/ZgT1-F 0.200 2.500 0.656 0.444 0.590 90.000 1.250T2-F 0.160 1.778 0.525 0.506 0.584 90.000 0.978T3-F 0.150 1.829 0.492 0.482 0.557 60.000 1.073T4-F 0.150 1.485 0.492 0.594 0.557 60.000 0.683T5-F 0.150 2.500 0.492 0.353 0.557 60.000 1.833T6-F 0.200 2.500 0.656 0.462 0.567 43.000 1.163T7-F 0.200 2.500 0.656 0.462 0.567 124.000 1.163T8-F 0.200 4.000 0.656 0.289 0.567 43.000 2.460T9-F 0.150 2.500 0.492 0.351 0.561 90.000 1.850T10-F 0.100 1.000 0.328 0.588 0.557 90.000 0.700T11-F 0.150 3.000 0.492 0.250 0.656 60.000 3.000T12-F 0.200 2.500 0.656 0.400 0.656 60.000 1.500T13-F 0.200 2.500 0.656 0.400 0.656 45.000 1.500T14-F 0.200 2.500 0.656 0.400 0.656 112.000 1.500T15-F 0.200 2.500 0.656 0.400 0.656 30.000 1.500T16-F 0.150 3.000 0.492 0.294 0.557 60.000 2.400T17-F 0.100 2.000 0.328 0.294 0.557 90.000 2.400T18-F 0.150 3.000 0.492 0.294 0.557 90.000 2.400
2.3 Performance of Eq. (5) for Submerged Flow
Fig. (16) shows the results of testing more than 30 models (5 ofthem for the Author) in case of submerged flow below the gatewhile the flow over the V-notch weir is free. Table (4) shows thedimensions and the ranges of the parameter covered by theDiscusser’s experimental program as well as those of the Author.Values of CVG from Eq. (5) are compared with the experimentallymeasured ones for 8 models (T17-S, T18-S, T27-S, T32-S, T31-S) in Fig. (17). Values of CVG from Eq. (5) is computed twotimes, first in terms of hd (dashed lines) and second in terms of ht
(solid line). Mostly, the results of Eq. (5) are acceptable with hd
defined as the water depth just downstream the gate and can notbe accepted if hd is considered as the tailwater depth measuredaway from the gate as defined in Fig.(2). It is clear that Eq. (5)fits well when hd is used and hence does not reflect the effect ofsubmergence as it is defined by ht/Zg. Eq. (5) is thus not usablewhen one needs to study the sensitivity of CVG with respect to thesubmergence ratio. Also, if ht is used in Eq. (5), it sometimes failsto predict CVG (regardless of accuracy) for low upstream waterdepth H as in some cases the value of 1.25ht exceeds the value ofH resulting in a negative value with a power less than 1.0.Fig. (18) presents the percentage error versus CVG for few models(T7-S, T8-S, T17-S, T18-S, T27-S, T32-S, T31-S) when hd isused in Eq. (5) while Fig. (19) presents the same when ht is used.
758 JOURNAL OF HYDRAULIC RESEARCH, VOL. 40, 2002, NO. 6
0.10 0.20 0.30 0.40 0.50Zg/H
0.40
0.60
0.80
1.00
1.20
CV
G
Model
T1-F
T2-F
T3-F
T4-F
T5-F
T6-F
T7-F
T8-F
T9-F
T10-F
T11-F
T12-F
T13-F
T14-F
T15-F
T16-F
T17-F
T18-F
Fig. 12 Variation of CVG with Zg/H for tested models by the Discusser
0.20 0.30 0.40 0.50Zg/H
0.50
0.60
0.70
0.80
CV
G
Exp. data
Eq.(5)
(b)
0.20 0.30 0.40 0.50Zg/H
0.60
0.70
0.80
CV
G
Exp. data
Eq.(5)
(a)
0.20 0.30 0.40 0.50Zg/H
0.55
0.60
0.65
0.70
CV
G
Exp. data
Eq.(5)
(c)
0.30 0.40 0.50Zg/H
0.50
0.60
0.70
CV
G
Exp. data
Eq.(5)
(d)
0.20 0.30 0.40 0.50Zg/H
0.50
0.55
0.60
CV
G
Exp. data
Eq.(5)
(e)
0.20 0.30 0.40 0.50Zg/H
0.60
0.65
0.70
CV
G
Exp. data
Eq.(5)
(f)
Fig. 13 Experimental results versus Eq.(5) for models (a) T1-F; (b) T3-F; (c) T6-F; (d) T7-F; (e) T15-F; and (f) T‘4-F.
0.40 0.60 0.80 1.00 1.20Predicted CVG
0.40
0.60
0.80
1.00
1.20
Mea
sure
dC
VG
Fig. 14 Measured CVG versus predicted using Eq.(5), notations as inFig.(12)
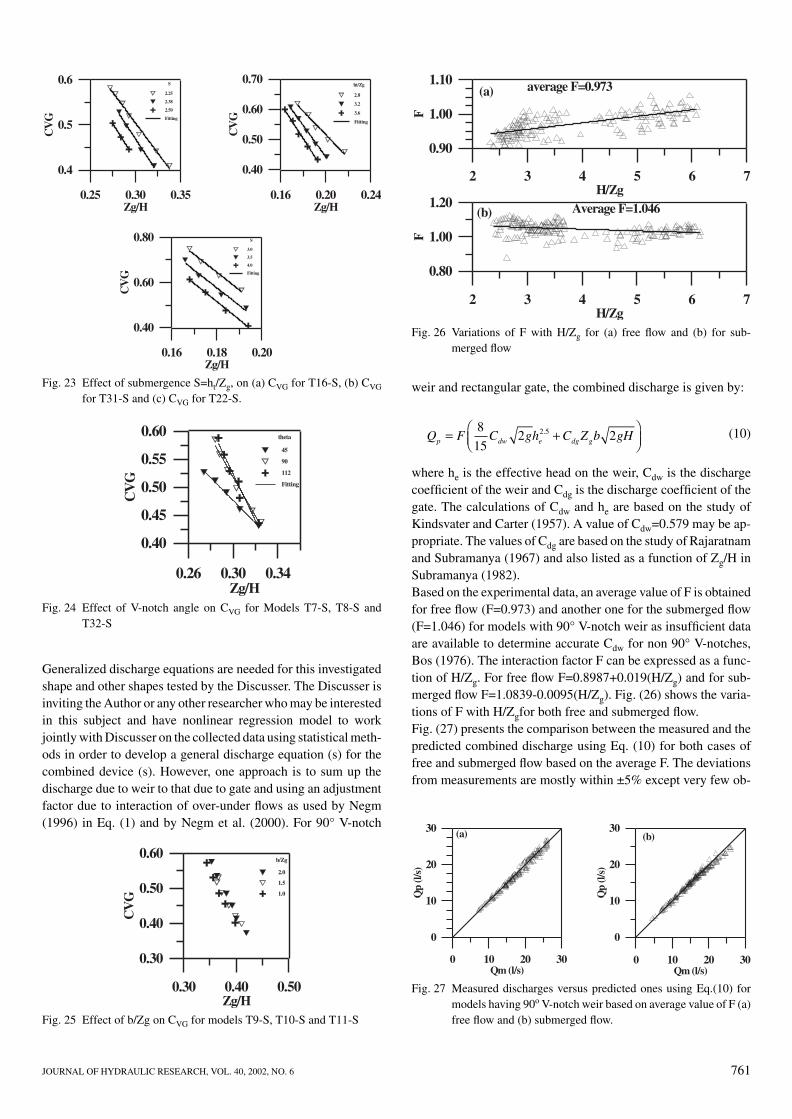
Also, Fig. (20a) shows the prediction of Eq. (5) versus the actualvalues of CVG for all model of table (4) based on hd whileFig. (20b) presents the same based on ht for models from T7-S toT32-S as no ht is available for at the Discusser’s hand modelsfrom S1 to S5 and T6-S. The percentage error of using Eq. (5)based on hd due to all models of table (4) is shown in Fig. (21). Itshould be mentioned that Eq. (5) produces reasonable predictionfor the data range covered by the Author and underestimates oroverestimates CVG values for ranges uncovered by the Author.The percentage error of Eq. (5) for the range uncovered by theAuthor may reach upto more than ±30% when Eq. (5) is appliedwith hd and more than this if ht is used. Fortunately, the Authormentioned that ‘an extension of the developed equation will betried to cover a wide range of application.’
Table 4 dimensions of the models tested by the Discusser for V-notch-Gate device
Model b Zg/Zv b/Zg b/B Zv/B ∆Z/Zg θ S=ht/Zg Remarks
S1 0.200 0.408 2.500 0.656 0.643 1.450 45 S series
S2 0.150 0.250 3.000 0.492 0.656 3.000 60 are due to
S3 0.200 0.400 2.500 0.656 0.656 1.500 90 the Author
S4 0.200 0.400 2.500 0.656 0.656 1.500 112
S5 0.200 0.457 2.500 0.656 0.574 1.188 124
T6-S 0.200 0.286 2.500 0.656 0.918 2.500 150 T#-S series
T7-S 0.200 0.400 2.500 0.656 0.656 1.500 90 2.50 are due to
T8-S 0.200 0.400 2.500 0.656 0.656 1.500 45 2.50 the Discusser
T9-S 0.200 0.500 2.000 0.656 0.656 1.000 90 2.00
T10-S 0.100 0.500 1.000 0.328 0.656 1.000 90 2.00
T11-S 0.150 0.500 1.500 0.492 0.656 1.000 90 2.00
T12-S 0.150 0.482 1.829 0.492 0.557 1.073 60 2.32
T13-S 0.150 0.594 1.485 0.492 0.557 0.683 60 1.88
T14-S 0.150 0.294 3.000 0.492 0.557 2.400 60 3.0, 3.5
T15-S 0.150 0.353 2.500 0.492 0.557 1.833 60 3.00
T16-S 0.200 0.462 2.500 0.656 0.567 1.163 43 2.25, 2.38, 2.5
T17-S 0.200 0.289 4.000 0.656 0.567 2.460 43 3.2, 3.6
T18-S 0.200 0.294 4.000 0.656 0.557 2.400 91 3.60
T19-S 0.150 0.291 3.000 0.492 0.564 2.440 90 3.0, 3.5
T20-S 0.150 0.588 1.500 0.492 0.557 0.700 90 1.90
T21-S 0.200 0.471 2.500 0.656 0.557 1.125 91 2.25, 2.50
T22-S 0.200 0.250 4.000 0.656 0.656 3.000 90 3.0, 3.5, 4.0
T23-S 0.050 0.500 0.500 0.164 0.656 1.000 90 2.00
T24-S 0.200 0.444 2.500 0.656 0.590 1.250 90 2.80
T25-S 0.150 0.471 1.875 0.492 0.557 1.125 90 2.25
T26-S 0.150 0.351 2.500 0.492 0.561 1.850 90 3.00
T27-S 0.160 0.506 1.778 0.525 0.584 0.978 90 2.00
T28-S 0.100 0.588 1.000 0.328 0.557 0.700 90 1.8, 2.0
T29-S 0.100 0.294 2.000 0.328 0.557 2.400 90 3.0, 3.5
T30-S 0.150 0.294 3.000 0.492 0.557 2.400 90 3.0, 3.5
T31-S 0.150 0.250 3.000 0.492 0.656 3.000 60 2.8,3.2,3.6
T32-S 0.200 0.400 2.500 0.656 0.656 1.500 112 2.50
2.4 Effect of Submergence
Fig. (22) is a reproduction of Fig. (7) to show the role of hd/Zg onCVG in terms of the gate Froude number (FG) according to thedefinition introduced by Discusser (W-FG) compared to that ofthe Author (A-FG). It is clear that W-FG is smaller than A-FGand according to W-FG the flow may be subcritical and at thesame time may be supercritical according to the A-FG which isnot possible and this invalidate the use of FG as defined by boththe Author and the Discusser. Both definitions do not reflect theactual state or regime of flow below the gate. For this reason it isbetter to discuss the role of submergence in terms of ht/Zg as inthe next paragraph. Another criterion may be looked for as gateFroude number based on gate flow only. This concept is possibleif an equation is developed like Eq. (6) to compute the combined
JOURNAL OF HYDRAULIC RESEARCH, VOL. 40, 2002, NO. 6 759
0.40 0.60 0.80 1.00 1.20CVG
-10.00
-5.00
0.00
5.00
10.00
%E
rror
Fig. 15 Variation of % error in CVG of Eq.(5), notations as in Fig.(12)
0.10 0.20 0.30 0.40 0.50Zg/H
0.20
0.40
0.60
0.80
1.00
1.20
1.40
CV
G
Model
S1
S2
S3
S4
S5
T6-S
T7-S
T8-S
T9-S
T10-S
T11-s
T12-S
T13-S
T14-s
T15-S
T16-s
T17-S
T18-S
T19-S
T20-S
T21-s
T22-s
T23-S
T24-S
T25-s
T26-s
T27-S
T28-S
T29-S
T30-S
T31-S
T32-S
Fig. 16 Experimental results for all tested models by the Author (S-se-ries) and the writer (T-series) for submerged flow
0.16 0.18 0.20 0.22Zg/H
0.40
0.60
0.80
CV
G
T31-S (Negm et al 1997)
Eq.(5) with hd
Eq.(5) with ht
0.28 0.30 0.32 0.34Zg/H
0.20
0.40
0.60
CV
G
T32-S (Negm et al. 1997)
Eq.(5) with hd
Eq.(5) with ht
0.15 0.20 0.25Zg/H
0.20
0.40
0.60
0.80
CV
G
T17-S
Eq.(5) with hd
Eq.(5) with ht
0.28 0.32 0.36 0.40Zg/H
0.20
0.40
0.60
0.80
CV
G
T27-S
Eq.(5) with hd
Eq.(5) with ht
0.15 0.20 0.25Zg/H
0.200.400.600.801.00
CV
G
T18-S
Eq.(5) with hd
Eq.(5) with ht
Fig. 17 Comparison between measured CVG and predicted ones usingEq.(5) based on hd (dashed lines) and ht (solid lines)
0.20 0.40 0.60 0.80 1.00CVG
-10
-5
0
5
10
15
20
%E
rror
Model
T7-S
T8-S
T14-s
T17-S
T18-S
T27-S
T31-S
T32-S
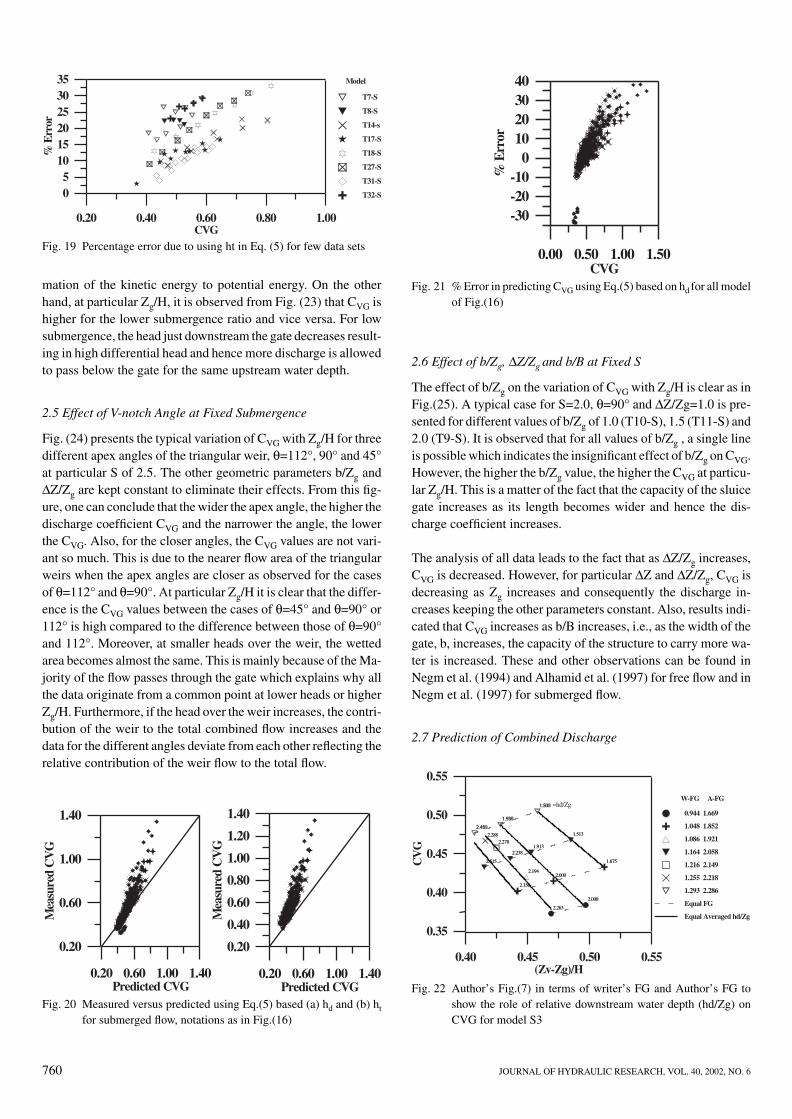
Fig. 18 Percentage error due to using hd in Eq. (5) for few data sets
discharge, the gate discharge and the weir discharge. This is whatthe Discusser is trying to do at the time being for different shapesof combined devices.The typical variations of CVG with Zg/H for different S (=ht/Zg of2.25, 2.38, and 2.50) are shown in Fig. (23a) (Model T16-S,θ=43°). Also, Fig.(23b) and Fig.(23c) are presented for modelsT31-S (θ=60°, S=2.8, 3.2 and 3.6) and T22-S (θ=90°, S=3, 3.5
and 4.0). The parameters θ, b/Zg, (Zv-Zg)/Zg are kept constant asshown in Table (4) to eliminate their effects and clarify the effectof S on the variations of CVG with Zg/H. It is observed that for thesame CVG the ratio Zg/H decreases by increasing of the tail waterdepth for constant Zg or by increasing the submergence ratio, S.This is due to as the submergence increases a backwater effectoccurreduntil stability has attained.This backwater effect reducesthe velocity of the flow through the gate. In turn, this reduction ofthe velocity will result in a corresponding reduction in the kineticenergy which is transformed into a potential energy. As a result,the upstream head increases simultaneously during the transfor-
760 JOURNAL OF HYDRAULIC RESEARCH, VOL. 40, 2002, NO. 6
0.20 0.40 0.60 0.80 1.00CVG
05
101520253035
%E
rror
Model
T7-S
T8-S
T14-s
T17-S
T18-S
T27-S
T31-S
T32-S
Fig. 19 Percentage error due to using ht in Eq. (5) for few data sets
0.20 0.60 1.00 1.40Predicted CVG
0.20
0.40
0.60
0.80
1.00
1.20
1.40
Mea
sure
dC
VG
0.20 0.60 1.00 1.40Predicted CVG
0.20
0.60
1.00
1.40
Mea
sure
dC
VG
Fig. 20 Measured versus predicted using Eq.(5) based (a) hd and (b) ht
for submerged flow, notations as in Fig.(16)
0.00 0.50 1.00 1.50CVG
-30-20-10
010203040
%E
rror
Fig. 21 % Error in predicting CVG using Eq.(5) based on hd for all modelof Fig.(16)
0.40 0.45 0.50 0.55(Zv-Zg)/H
0.35
0.40
0.45
0.50
0.55
CV
G
W-FG A-FG
0.944 1.669
1.048 1.852
1.086 1.921
1.164 2.058
1.216 2.149
1.255 2.218
1.293 2.286
Equal FG
Equal Averaged hd/Zg
=hd/Zg
2.450
1.938
1.500
2.515
2.2381.913
1.513
2.350
2.000
1.675
2.263
2.000
2.194
2.2782.288
1.500
1.513
1.675
1.938
1.913
2.000
2.000
2.263
2.2882.278
2.238
2.194
2.515
2.350
2.450
Fig. 22 Author’s Fig.(7) in terms of writer’s FG and Author’s FG toshow the role of relative downstream water depth (hd/Zg) onCVG for model S3
mation of the kinetic energy to potential energy. On the otherhand, at particular Zg/H, it is observed from Fig. (23) that CVG ishigher for the lower submergence ratio and vice versa. For lowsubmergence, the head just downstream the gate decreases result-ing in high differential head and hence more discharge is allowedto pass below the gate for the same upstream water depth.
2.5 Effect of V-notch Angle at Fixed Submergence
Fig. (24) presents the typical variation of CVG with Zg/H for threedifferent apex angles of the triangular weir, θ=112°, 90° and 45°at particular S of 2.5. The other geometric parameters b/Zg and∆Z/Zg are kept constant to eliminate their effects. From this fig-ure, one can conclude that the wider the apex angle, the higher thedischarge coefficient CVG and the narrower the angle, the lowerthe CVG. Also, for the closer angles, the CVG values are not vari-ant so much. This is due to the nearer flow area of the triangularweirs when the apex angles are closer as observed for the casesof θ=112° and θ=90°. At particular Zg/H it is clear that the differ-ence is the CVG values between the cases of θ=45° and θ=90° or112° is high compared to the difference between those of θ=90°and 112°. Moreover, at smaller heads over the weir, the wettedarea becomes almost the same. This is mainly because of the Ma-jority of the flow passes through the gate which explains why allthe data originate from a common point at lower heads or higherZg/H. Furthermore, if the head over the weir increases, the contri-bution of the weir to the total combined flow increases and thedata for the different angles deviate from each other reflecting therelative contribution of the weir flow to the total flow.
2.6 Effect of b/Zg, ∆Z/Zg and b/B at Fixed S
The effect of b/Zg on the variation of CVG with Zg/H is clear as inFig.(25). A typical case for S=2.0, θ=90° and ∆Z/Zg=1.0 is pre-sented for different values of b/Zg of 1.0 (T10-S), 1.5 (T11-S) and2.0 (T9-S). It is observed that for all values of b/Zg , a single lineis possible which indicates the insignificant effect of b/Zg on CVG.However, the higher the b/Zg value, the higher the CVG at particu-lar Zg/H. This is a matter of the fact that the capacity of the sluicegate increases as its length becomes wider and hence the dis-charge coefficient increases.
The analysis of all data leads to the fact that as ∆Z/Zg increases,CVG is decreased. However, for particular ∆Z and ∆Z/Zg, CVG isdecreasing as Zg increases and consequently the discharge in-creases keeping the other parameters constant. Also, results indi-cated that CVG increases as b/B increases, i.e., as the width of thegate, b, increases, the capacity of the structure to carry more wa-ter is increased. These and other observations can be found inNegm et al. (1994) and Alhamid et al. (1997) for free flow and inNegm et al. (1997) for submerged flow.
2.7 Prediction of Combined Discharge
JOURNAL OF HYDRAULIC RESEARCH, VOL. 40, 2002, NO. 6 761
0.30 0.40 0.50Zg/H
0.30
0.40
0.50
0.60
CV
G
b/Zg
2.0
1.5
1.0
Fig. 25 Effect of b/Zg on CVG for models T9-S, T10-S and T11-S
0.16 0.20 0.24Zg/H
0.40
0.50
0.60
0.70
CV
G
ht/Zg
2.8
3.2
3.6
Fitting
0.16 0.18 0.20Zg/H
0.40
0.60
0.80
CV
G
S
3.0
3.5
4.0
Fitting
0.25 0.30 0.35Zg/H
0.4
0.5
0.6
CV
G
S
2.25
2.38
2.50
Fitting
Fig. 23 Effect of submergence S=ht/Zg, on (a) CVG for T16-S, (b) CVG
for T31-S and (c) CVG for T22-S.
0.26 0.30 0.34Zg/H
0.40
0.45
0.50
0.55
0.60
CV
G
theta
45
90
112
Fitting
Fig. 24 Effect of V-notch angle on CVG for Models T7-S, T8-S andT32-S
2 3 4 5 6 7H/Zg
0.90
1.00
1.10
F
(a) average F=0.973
2 3 4 5 6 7H/Zg
0.80
1.00
1.20
F
(b) Average F=1.046
Fig. 26 Variations of F with H/Zg for (a) free flow and (b) for sub-merged flow
0 10 20 30Qm (l/s)
0
10
20
30
Qp
(l/s)
(b)
0 10 20 30Qm (l/s)
0
10
20
30
Qp
(l/s)
(a)
Fig. 27 Measured discharges versus predicted ones using Eq.(10) formodels having 90o V-notch weir based on average value of F (a)free flow and (b) submerged flow.
Q F C gh C Z b gHp dw e dg g= +
8
152 22 5. (10)
Generalized discharge equations are needed for this investigatedshape and other shapes tested by the Discusser. The Discusser isinviting the Author or any other researcher who may be interestedin this subject and have nonlinear regression model to workjointly with Discusser on the collected data using statistical meth-ods in order to develop a general discharge equation (s) for thecombined device (s). However, one approach is to sum up thedischarge due to weir to that due to gate and using an adjustmentfactor due to interaction of over-under flows as used by Negm(1996) in Eq. (1) and by Negm et al. (2000). For 90° V-notch
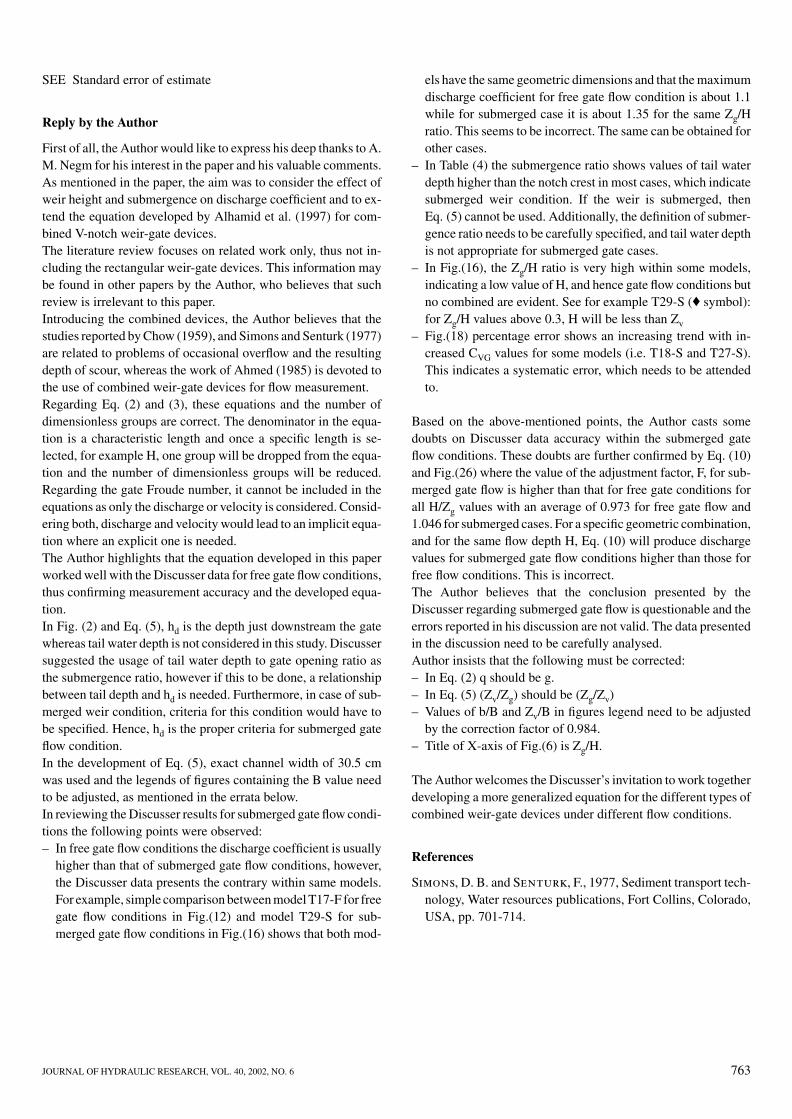
weir and rectangular gate, the combined discharge is given by:
where he is the effective head on the weir, Cdw is the dischargecoefficient of the weir and Cdg is the discharge coefficient of thegate. The calculations of Cdw and he are based on the study ofKindsvater and Carter (1957). A value of Cdw=0.579 may be ap-propriate. The values of Cdg are based on the study of Rajaratnamand Subramanya (1967) and also listed as a function of Zg/H inSubramanya (1982).Based on the experimental data, an average value of F is obtainedfor free flow (F=0.973) and another one for the submerged flow(F=1.046) for models with 90° V-notch weir as insufficient dataare available to determine accurate Cdw for non 90° V-notches,Bos (1976). The interaction factor F can be expressed as a func-tion of H/Zg. For free flow F=0.8987+0.019(H/Zg) and for sub-merged flow F=1.0839-0.0095(H/Zg). Fig. (26) shows the varia-tions of F with H/Zgfor both free and submerged flow.Fig. (27) presents the comparison between the measured and thepredicted combined discharge using Eq. (10) for both cases offree and submerged flow based on the average F. The deviationsfrom measurements are mostly within ±5% except very few ob-
762 JOURNAL OF HYDRAULIC RESEARCH, VOL. 40, 2002, NO. 6
servations.
References
[1] Ahmed, F.H. (1985), Characteristics of discharge of thecombined flow through sluice gate and over weirs, Journalof Engineering and Technology, Iraq, Vol 3, No. 2, pp. 49-63,, (in Arabic).
[2] Alhamid, A.A., Negm, A.M. and Al-Brahim, A.M.(1997), Discharge equation for proposed self-cleaning de-vice, Journal of King Saud University, Engineering Science,Riyadh, Saudi Arabia. Vol.9, No.1, pp.13-24.
[3] Alhamid, A.A., Husain, D and Negm, A.M. (1996), Dis-charge equation for combined flow over rectangular weirsand below inverted triangular weirs, Arab Gulf Journal forScientific Research, Riyadh, Saudi Arabia, Vol. 14, No.3,pp. 595-607.
[4] Bos, M.G. (Editor) (1976), Discharge measurement struc-tures, Oxford & IBH publishing Co., New Delhi.
[5] Charles, J., (1956), Engineering fluid mechanics, Trans-lated from the German by P.O. Wolf, Blackie & Son Ltd.,London and Glasgow, pp 157-169.
[6] Chow, V.T. (1959), Open-channel hydraulics, McGraw HillBook Company, New York, pp.507-510.
[7] El-Saiad, A.A., Negm, A.M. and Waheed El-Din, U.(1995), Simultaneous flow over weirs and below gates, CivilEngineering Research Magazine, Civil Engineering Depart-ment, Faculty of Engineering, Al-Azhar University, Cairo,Egypt, Vol. 17, No. 7, pp. 62-71.
[8] Kindsvater, C.E. and Carter, R.W. (1957), ‘Dischargecharacteristics of thin plate weirs’, J. of Hyd. Div., Proc.ASCE, Vol.83, Dec., pp.1-36.
[9] Naudascher, E. (1991), Hydrodynamic forces, IAHR Hy-draulic Structures Design Manuals Series, No. 3, AABalkema, Rotterdam.
[10] Negm, A.M., El-Saiad, A.A., Alhamid, A.A., andHusain, D. (1994), Characteristics of simultaneous flowover weir and below inverted V-notches, Civil EngineeringResearch Magazine, Civil Engineering Department, Facultyof Engineering, Al-Azhar University, Cairo, Egypt, Vol. 16,No. 9, pp. 786-799.
[11] Negm, A.M. (1995), Characteristics of combined flow overweirs and under gate with unequal contractions. In Advancesin Hydro-science and Engineering, CHES & IRTCES, Edi-tors, Vol. II, Part A, Proc. 2nd. Int. Conf. on Hydro-scienceand Engineering, ICHE-’95, 22-26 March, Tsighua Univer-sity Press, Beijing, China, pp. 285-292.
[12] Negm, A.M. (1996), Discharge prediction model for simul-taneous underflow-overflow, Proc. 6th Int. Symp. on FlowModelling and Turbulence Meaurements, Florida, USA, 8-10, Sep., Balkema Publishers, pp.665-670.
[13] Negm, A.M. (1997), Characteristics of combined flow overweirs and below gates, Sudan Engineering Sociaty Journal,Vol. 44, No. 34, Jan., pp. 30-37.
[14] Negm, A.M.; El-Saiad, A.A.; and Saleh, O.K. (1997a),Characteristics of combined flow over weirs and below sub-
merged gates, Proc. of Al-Mansoura Engineering 2nd Int.Conf. (MEIC’97), 1-3 April, Faculty of Engineering, Al-Mansoura University, Al-Mansoura, Egypt, VolIII-B,pp.259-272.
[15] Negm, A.M., Abdel-Aal, G.M., Matin, A.M. andAlhamid, A.A. (1997b), Discharge equation for free andsubmerged flow through combined weir, Proc. of Al-AzharEng. 3rd Int. Conf. (AEIC-97), Dec. 19-22, Faculty of Eng.,Al-Azhar University, Cairo, Egypt, pp.456-470.
[16] Negm, A.M.(2000), Characteristics of simultaneous over-flow -submerged underflow: (unequal contractions), Engi-neering Bulletin, Faculty of Engineering, Ain Shams Uni-versity, Vol.35 No.1, March, 2000, pp.137-154.
[17] Negm, A.M., Abdel-Aal, G.M., and El-Saiad, A.A.(2000), ‘Generalized discharge equation for proposed simul-taneous flow structures’, Proc. Al-Azhar Eng. 6th Int. Conf.,AEIC, Cairo, Egypt, Sep. 1-4, pp.247-257.
[18] Negm, A.M., Al-Brahim, A.M., and Alhamid, A.A.(2002), ‘Combined flow over weirs and under gates’, Jour-nal of Hydraulic Research, Vol. 40, no. 3, pp.359-366.
[19] Rajaratnam, N. and Subramanya, K. (1967), Flowequation for the sluice gate, J. of Irrigation and DrainageDiv., Proc. ASCE, Sept., pp. 167-186.
[20] Subramanya, K. (1982), Flow in open channels, TataMcGraw-Hill Publishing Co. Ltd., New Delhi, First RevisedEdition, 7th reprint (1992).
[21] Swamee, P.K. (1988), Generalized rectangular weirs equa-tions, Proc. ASCE, Journal Hydraulic Engineering, Vol. 114,No. 8, August, pp. 945-949.
[22] Swamee, P.K. (1992), Sluice-gate discharge equations,Journal of Irrigation and Drainage Engineering, Proc.ASCE, Vol 118, No. 1, Jan./Feb., pp. 57-60.
Notations
The following symbols are used in this discussion:b width of rectangular gateF defined interaction factor {F=Qm/(Qw+Qg)}FG gate Froude number.hd water depth just downstream the gate.ht tailwater depth away from the gate.Q discharge (p for prediction , m for measured, w for weir and
g for gate).R2 coefficient of determination of a regression equation.S submergenece ratio, ht/Zg.
Abbreviations
F Free Flow,S Submerged Flow,T Triangular,W Weir,G Gate,R Rectangular,W-FG Discusser’s defined FG= ,Q bZ gZc g g/ 2A-FG Author defined FG
JOURNAL OF HYDRAULIC RESEARCH, VOL. 40, 2002, NO. 6 763
SEE Standard error of estimate
Reply by the Author
First of all, the Author would like to express his deep thanks to A.M. Negm for his interest in the paper and his valuable comments.As mentioned in the paper, the aim was to consider the effect ofweir height and submergence on discharge coefficient and to ex-tend the equation developed by Alhamid et al. (1997) for com-bined V-notch weir-gate devices.The literature review focuses on related work only, thus not in-cluding the rectangular weir-gate devices. This information maybe found in other papers by the Author, who believes that suchreview is irrelevant to this paper.Introducing the combined devices, the Author believes that thestudies reported by Chow (1959), and Simons and Senturk (1977)are related to problems of occasional overflow and the resultingdepth of scour, whereas the work of Ahmed (1985) is devoted tothe use of combined weir-gate devices for flow measurement.Regarding Eq. (2) and (3), these equations and the number ofdimensionless groups are correct. The denominator in the equa-tion is a characteristic length and once a specific length is se-lected, for example H, one group will be dropped from the equa-tion and the number of dimensionless groups will be reduced.Regarding the gate Froude number, it cannot be included in theequations as only the discharge or velocity is considered. Consid-ering both, discharge and velocity would lead to an implicit equa-tion where an explicit one is needed.The Author highlights that the equation developed in this paperworked well with the Discusser data for free gate flow conditions,thus confirming measurement accuracy and the developed equa-tion.In Fig. (2) and Eq. (5), hd is the depth just downstream the gatewhereas tail water depth is not considered in this study. Discussersuggested the usage of tail water depth to gate opening ratio asthe submergence ratio, however if this to be done, a relationshipbetween tail depth and hd is needed. Furthermore, in case of sub-merged weir condition, criteria for this condition would have tobe specified. Hence, hd is the proper criteria for submerged gateflow condition.In the development of Eq. (5), exact channel width of 30.5 cmwas used and the legends of figures containing the B value needto be adjusted, as mentioned in the errata below.In reviewing the Discusser results for submerged gate flow condi-tions the following points were observed:– In free gate flow conditions the discharge coefficient is usually
higher than that of submerged gate flow conditions, however,the Discusser data presents the contrary within same models.For example, simple comparison between model T17-F for freegate flow conditions in Fig.(12) and model T29-S for sub-merged gate flow conditions in Fig.(16) shows that both mod-
els have the same geometric dimensions and that the maximumdischarge coefficient for free gate flow condition is about 1.1while for submerged case it is about 1.35 for the same Zg/Hratio. This seems to be incorrect. The same can be obtained forother cases.
– In Table (4) the submergence ratio shows values of tail waterdepth higher than the notch crest in most cases, which indicatesubmerged weir condition. If the weir is submerged, thenEq. (5) cannot be used. Additionally, the definition of submer-gence ratio needs to be carefully specified, and tail water depthis not appropriate for submerged gate cases.
– In Fig.(16), the Zg/H ratio is very high within some models,indicating a low value of H, and hence gate flow conditions butno combined are evident. See for example T29-S (� symbol):for Zg/H values above 0.3, H will be less than Zv
– Fig.(18) percentage error shows an increasing trend with in-creased CVG values for some models (i.e. T18-S and T27-S).This indicates a systematic error, which needs to be attendedto.
Based on the above-mentioned points, the Author casts somedoubts on Discusser data accuracy within the submerged gateflow conditions. These doubts are further confirmed by Eq. (10)and Fig.(26) where the value of the adjustment factor, F, for sub-merged gate flow is higher than that for free gate conditions forall H/Zg values with an average of 0.973 for free gate flow and1.046 for submerged cases. For a specific geometric combination,and for the same flow depth H, Eq. (10) will produce dischargevalues for submerged gate flow conditions higher than those forfree flow conditions. This is incorrect.The Author believes that the conclusion presented by theDiscusser regarding submerged gate flow is questionable and theerrors reported in his discussion are not valid. The data presentedin the discussion need to be carefully analysed.Author insists that the following must be corrected:– In Eq. (2) q should be g.– In Eq. (5) (Zv/Zg) should be (Zg/Zv)– Values of b/B and Zv/B in figures legend need to be adjusted
by the correction factor of 0.984.– Title of X-axis of Fig.(6) is Zg/H.
The Author welcomes the Discusser’s invitation to work togetherdeveloping a more generalized equation for the different types ofcombined weir-gate devices under different flow conditions.
References
Simons, D. B. and Senturk, F., 1977, Sediment transport tech-nology, Water resources publications, Fort Collins, Colorado,USA, pp. 701-714.
764 JOURNAL OF HYDRAULIC RESEARCH, VOL. 40, 2002, NO. 6
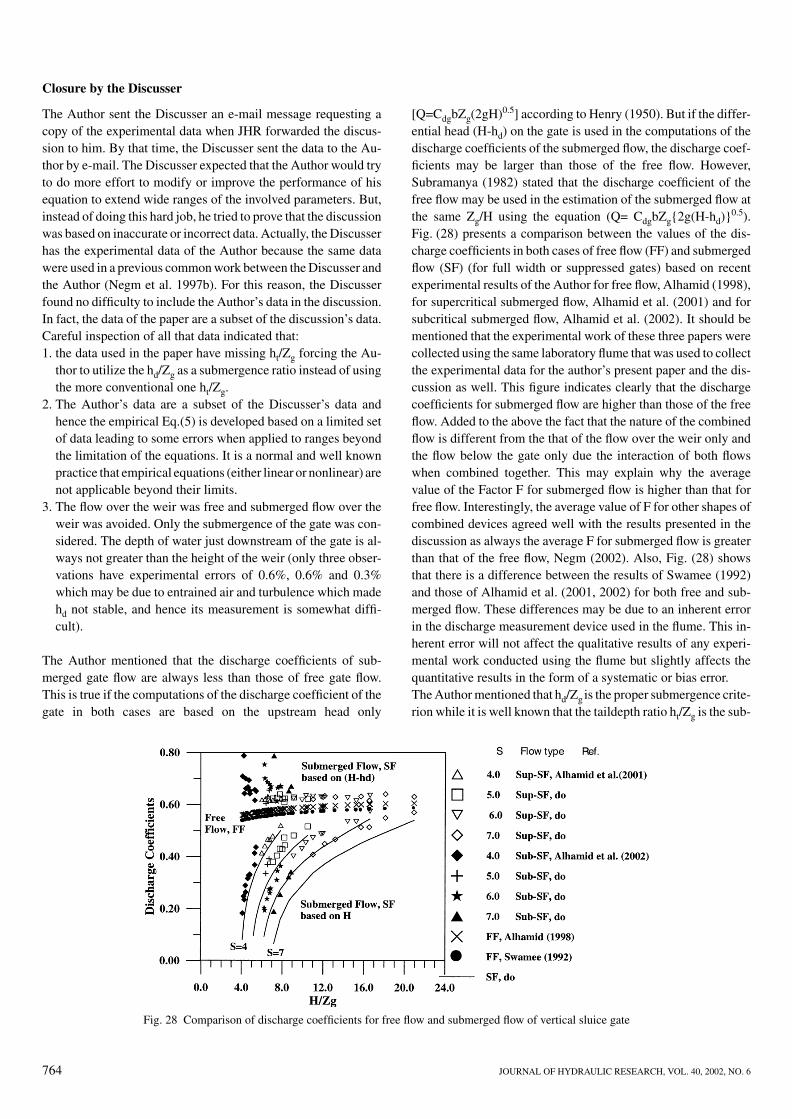
Fig. 28 Comparison of discharge coefficients for free flow and submerged flow of vertical sluice gate
Closure by the Discusser
The Author sent the Discusser an e-mail message requesting acopy of the experimental data when JHR forwarded the discus-sion to him. By that time, the Discusser sent the data to the Au-thor by e-mail. The Discusser expected that the Author would tryto do more effort to modify or improve the performance of hisequation to extend wide ranges of the involved parameters. But,instead of doing this hard job, he tried to prove that the discussionwas based on inaccurate or incorrect data. Actually, the Discusserhas the experimental data of the Author because the same datawere used in a previous common work between the Discusser andthe Author (Negm et al. 1997b). For this reason, the Discusserfound no difficulty to include the Author’s data in the discussion.In fact, the data of the paper are a subset of the discussion’s data.Careful inspection of all that data indicated that:1. the data used in the paper have missing ht/Zg forcing the Au-
thor to utilize the hd/Zg as a submergence ratio instead of usingthe more conventional one ht/Zg.
2. The Author’s data are a subset of the Discusser’s data andhence the empirical Eq.(5) is developed based on a limited setof data leading to some errors when applied to ranges beyondthe limitation of the equations. It is a normal and well knownpractice that empirical equations (either linear or nonlinear) arenot applicable beyond their limits.
3. The flow over the weir was free and submerged flow over theweir was avoided. Only the submergence of the gate was con-sidered. The depth of water just downstream of the gate is al-ways not greater than the height of the weir (only three obser-vations have experimental errors of 0.6%, 0.6% and 0.3%which may be due to entrained air and turbulence which madehd not stable, and hence its measurement is somewhat diffi-cult).
The Author mentioned that the discharge coefficients of sub-merged gate flow are always less than those of free gate flow.This is true if the computations of the discharge coefficient of thegate in both cases are based on the upstream head only
[Q=CdgbZg(2gH)0.5] according to Henry (1950). But if the differ-ential head (H-hd) on the gate is used in the computations of thedischarge coefficients of the submerged flow, the discharge coef-ficients may be larger than those of the free flow. However,Subramanya (1982) stated that the discharge coefficient of thefree flow may be used in the estimation of the submerged flow atthe same Zg/H using the equation (Q= CdgbZg{2g(H-hd)}
0.5).Fig. (28) presents a comparison between the values of the dis-charge coefficients in both cases of free flow (FF) and submergedflow (SF) (for full width or suppressed gates) based on recentexperimental results of the Author for free flow, Alhamid (1998),for supercritical submerged flow, Alhamid et al. (2001) and forsubcritical submerged flow, Alhamid et al. (2002). It should bementioned that the experimental work of these three papers werecollected using the same laboratory flume that was used to collectthe experimental data for the author’s present paper and the dis-cussion as well. This figure indicates clearly that the dischargecoefficients for submerged flow are higher than those of the freeflow. Added to the above the fact that the nature of the combinedflow is different from the that of the flow over the weir only andthe flow below the gate only due the interaction of both flowswhen combined together. This may explain why the averagevalue of the Factor F for submerged flow is higher than that forfree flow. Interestingly, the average value of F for other shapes ofcombined devices agreed well with the results presented in thediscussion as always the average F for submerged flow is greaterthan that of the free flow, Negm (2002). Also, Fig. (28) showsthat there is a difference between the results of Swamee (1992)and those of Alhamid et al. (2001, 2002) for both free and sub-merged flow. These differences may be due to an inherent errorin the discharge measurement device used in the flume. This in-herent error will not affect the qualitative results of any experi-mental work conducted using the flume but slightly affects thequantitative results in the form of a systematic or bias error.The Author mentioned that hd/Zg is the proper submergence crite-rion while it is well known that the taildepth ratio ht/Zg is the sub-
JOURNAL OF HYDRAULIC RESEARCH, VOL. 40, 2002, NO. 6 765
mergence criterion because the discharge coefficient of sub-merged gate flow is mainly described by H/Zg and ht/Zg, Henery(1950), and Alhamid et al. (2001, 2002).
References
Alhamid, A.A. (1998), Coefficient of discharge for free flowsluice gates, J. King Saud Univ., Eng. Sci. (1), pp. 33-48.
Alhamid, A.A, Negm, A.M., Abdel-Aal, G.M. and Matin,M.A. (2001), Effect of taildepth variation on submergedsupercritical flow below silled gates, CERM, Faculty of Engi-neering, Al-Azhar University, Cairo, Egypt, Jan., Vol.23, No1,pp. 199-220.
Alhamid, A.A., Negm, A.M., Abdel-Aal, G.M., and Matin,
M.A. (2002), Effect of submergence and slopes of under-gatesill on discharge characteristics of submerged subcritical flow,Egyptian Journal of Engineering Science and Technology,EJEST, Oct., Vol.6, No.1, pp.61-82.
Henry, H. (1950), Discussion on diffusion of submerged jets,Trans. ASCE, Vol. 115, pp. 687-697.
Negm, A.M. (2002), Modeling of submerged simultaneous flowthrough combined weirs and gates devices, 5th Int. Conf. OnHydroscience and Engineering, ICHE2002, Sept. 18-21, War-saw, Poland.
Subramanya, K. (1982), Flow in open channels, Tata McGraw-Hill Publishing Co. Ltd., New Delhi, 1st revised ed., 7th reprint(1992), p.256.