Discrete wetland groundwater discharges revealed with a three-dimensional temperature model and...
15
1 23 Hydrogeology Journal Official Journal of the International Association of Hydrogeologists ISSN 1431-2174 Hydrogeol J DOI 10.1007/s10040-015-1242-5 Discrete wetland groundwater discharges revealed with a three-dimensional temperature model and botanical indicators (Boxford, UK) Andrew R. House, James P. R. Sorensen, Daren C. Gooddy, Andrew J. Newell, Ben Marchant, J. Owen Mountford, Peter Scarlett, et al.
-
Upload
independentresearcher -
Category
Documents
-
view
1 -
download
0
Transcript of Discrete wetland groundwater discharges revealed with a three-dimensional temperature model and...
1 23
Hydrogeology JournalOfficial Journal of the InternationalAssociation of Hydrogeologists ISSN 1431-2174 Hydrogeol JDOI 10.1007/s10040-015-1242-5
Discrete wetland groundwater dischargesrevealed with a three-dimensionaltemperature model and botanicalindicators (Boxford, UK)
Andrew R. House, James P. R. Sorensen,Daren C. Gooddy, Andrew J. Newell, BenMarchant, J. Owen Mountford, PeterScarlett, et al.

1 23
Your article is protected by copyright and
all rights are held exclusively by Springer-
Verlag Berlin Heidelberg. This e-offprint is
for personal use only and shall not be self-
archived in electronic repositories. If you wish
to self-archive your article, please use the
accepted manuscript version for posting on
your own website. You may further deposit
the accepted manuscript version in any
repository, provided it is only made publicly
available 12 months after official publication
or later and provided acknowledgement is
given to the original source of publication
and a link is inserted to the published article
on Springer's website. The link must be
accompanied by the following text: "The final
publication is available at link.springer.com”.
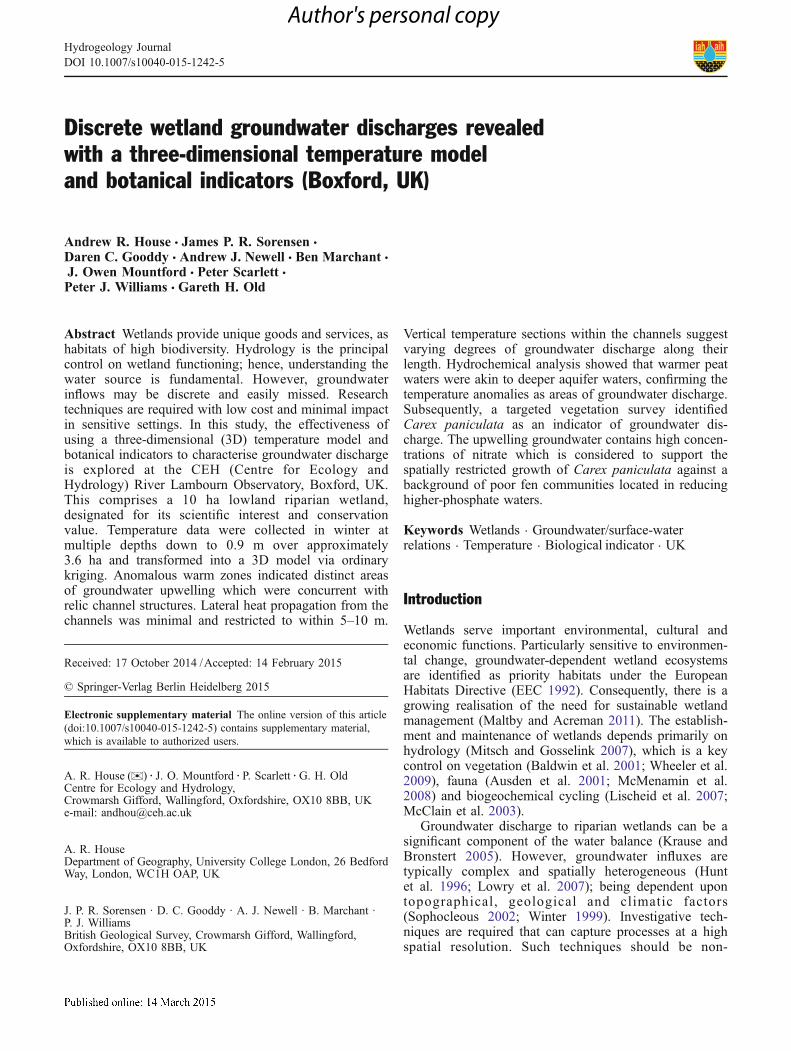
Discrete wetland groundwater discharges revealedwith a three-dimensional temperature modeland botanical indicators (Boxford, UK)
Andrew R. House & James P. R. Sorensen &
Daren C. Gooddy & Andrew J. Newell & Ben Marchant &J. Owen Mountford & Peter Scarlett &Peter J. Williams & Gareth H. Old
Abstract Wetlands provide unique goods and services, ashabitats of high biodiversity. Hydrology is the principalcontrol on wetland functioning; hence, understanding thewater source is fundamental. However, groundwaterinflows may be discrete and easily missed. Researchtechniques are required with low cost and minimal impactin sensitive settings. In this study, the effectiveness ofusing a three-dimensional (3D) temperature model andbotanical indicators to characterise groundwater dischargeis explored at the CEH (Centre for Ecology andHydrology) River Lambourn Observatory, Boxford, UK.This comprises a 10 ha lowland riparian wetland,designated for its scientific interest and conservationvalue. Temperature data were collected in winter atmultiple depths down to 0.9 m over approximately3.6 ha and transformed into a 3D model via ordinarykriging. Anomalous warm zones indicated distinct areasof groundwater upwelling which were concurrent withrelic channel structures. Lateral heat propagation from thechannels was minimal and restricted to within 5–10 m.
Vertical temperature sections within the channels suggestvarying degrees of groundwater discharge along theirlength. Hydrochemical analysis showed that warmer peatwaters were akin to deeper aquifer waters, confirming thetemperature anomalies as areas of groundwater discharge.Subsequently, a targeted vegetation survey identifiedCarex paniculata as an indicator of groundwater dis-charge. The upwelling groundwater contains high concen-trations of nitrate which is considered to support thespatially restricted growth of Carex paniculata against abackground of poor fen communities located in reducinghigher-phosphate waters.
Keywords Wetlands . Groundwater/surface-waterrelations . Temperature . Biological indicator . UK
Introduction
Wetlands serve important environmental, cultural andeconomic functions. Particularly sensitive to environmen-tal change, groundwater-dependent wetland ecosystemsare identified as priority habitats under the EuropeanHabitats Directive (EEC 1992). Consequently, there is agrowing realisation of the need for sustainable wetlandmanagement (Maltby and Acreman 2011). The establish-ment and maintenance of wetlands depends primarily onhydrology (Mitsch and Gosselink 2007), which is a keycontrol on vegetation (Baldwin et al. 2001; Wheeler et al.2009), fauna (Ausden et al. 2001; McMenamin et al.2008) and biogeochemical cycling (Lischeid et al. 2007;McClain et al. 2003).
Groundwater discharge to riparian wetlands can be asignificant component of the water balance (Krause andBronstert 2005). However, groundwater influxes aretypically complex and spatially heterogeneous (Huntet al. 1996; Lowry et al. 2007); being dependent upontopographical, geological and climatic factors(Sophocleous 2002; Winter 1999). Investigative tech-niques are required that can capture processes at a highspatial resolution. Such techniques should be non-
Received: 17 October 2014 /Accepted: 14 February 2015
* Springer-Verlag Berlin Heidelberg 2015
Electronic supplementary material The online version of this article(doi:10.1007/s10040-015-1242-5) contains supplementary material,which is available to authorized users.
A. R. House ()) : J. O. Mountford : P. Scarlett :G. H. OldCentre for Ecology and Hydrology,Crowmarsh Gifford, Wallingford, Oxfordshire, OX10 8BB, UKe-mail: [email protected]
A. R. HouseDepartment of Geography, University College London, 26 BedfordWay, London, WC1H OAP, UK
J. P. R. Sorensen · D. C. Gooddy · A. J. Newell · B. Marchant ·P. J. WilliamsBritish Geological Survey, Crowmarsh Gifford, Wallingford,Oxfordshire, OX10 8BB, UK
Hydrogeology JournalDOI 10.1007/s10040-015-1242-5
Author's personal copy
destructive and minimally invasive due to the sensitivityof many wetland environments; furthermore, resourcerestrictions often compel economical approaches.
Temperature is a useful natural groundwater tracerwhich can identify small-scale zones of groundwaterdischarge (Anderson 2005; Conant 2004). A significantbody of research is centred on identifying and quantifyinglocalised groundwater flux in the hyporheic zone (Briggset al. 2012; Constantz et al. 1994; Hannah et al. 2009;Keery et al. 2007; Krause et al. 2012; Schmidt et al.2007). Small-scale variability in temperature has beenconsidered along the horizontal plane of a cross-fault ditch(Bense and Kooi 2004); however, applications to wetlandsare fewer, with temperature observations in such studiesalso restricted to a limited number of point measurements(Bravo et al. 2002; Hunt et al. 1996).
Botanical indicators of groundwater also have thepotential to provide a cost-effective means of sitecharacterisation (Lewis 2012). Nevertheless, links be-tween phreatophytes (plants which draw water from thewater table) and groundwater discharge are moreestablished in arid and semi-arid regions than more humidregions (Batelaan et al. 2003). Plants have been regardedas indicators of groundwater discharge in the Netherlands(Grootjans et al. 1988; Klijn and Witte 1999; Lucassenet al. 2006; Schot et al. 1988; van Diggelen et al. 1988;Wassen et al. 1988; Wierda et al. 1997) and Minnesota,USA (Almendinger and Leete 1998; Batelaan et al. 2003;Glaser et al. 1990; Goslee et al. 1997; Rosenberry et al.2000). Research in the UK has focussed on general waterrequirements of wetland plant communities and species(Gowing et al. 2002; Newbold and Mountford 1997;Wheeler et al. 2009). Specifically, botanical indicators forgroundwater are not defined in the UK.
This report aims to demonstrate the potential of 3Dtemperature models in effective and economical concep-tualisation of groundwater/surface-water interaction, witha focus on lowland riparian wetlands. The potential ofbotanical indicators of groundwater discharge is alsofurther explored.
Study area
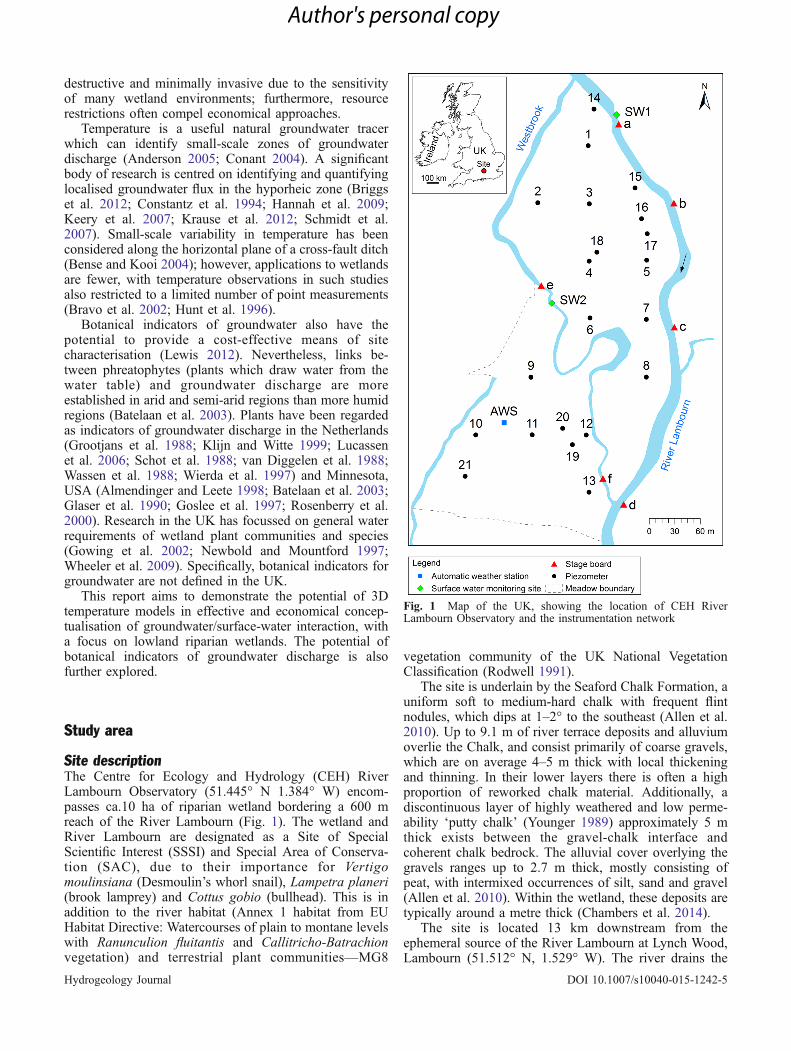
Site descriptionThe Centre for Ecology and Hydrology (CEH) RiverLambourn Observatory (51.445° N 1.384° W) encom-passes ca.10 ha of riparian wetland bordering a 600 mreach of the River Lambourn (Fig. 1). The wetland andRiver Lambourn are designated as a Site of SpecialScientific Interest (SSSI) and Special Area of Conserva-tion (SAC), due to their importance for Vertigomoulinsiana (Desmoulin’s whorl snail), Lampetra planeri(brook lamprey) and Cottus gobio (bullhead). This is inaddition to the river habitat (Annex 1 habitat from EUHabitat Directive: Watercourses of plain to montane levelswith Ranunculion fluitantis and Callitricho-Batrachionvegetation) and terrestrial plant communities—MG8
vegetation community of the UK National VegetationClassification (Rodwell 1991).
The site is underlain by the Seaford Chalk Formation, auniform soft to medium-hard chalk with frequent flintnodules, which dips at 1–2° to the southeast (Allen et al.2010). Up to 9.1 m of river terrace deposits and alluviumoverlie the Chalk, and consist primarily of coarse gravels,which are on average 4–5 m thick with local thickeningand thinning. In their lower layers there is often a highproportion of reworked chalk material. Additionally, adiscontinuous layer of highly weathered and low perme-ability ‘putty chalk’ (Younger 1989) approximately 5 mthick exists between the gravel-chalk interface andcoherent chalk bedrock. The alluvial cover overlying thegravels ranges up to 2.7 m thick, mostly consisting ofpeat, with intermixed occurrences of silt, sand and gravel(Allen et al. 2010). Within the wetland, these deposits aretypically around a metre thick (Chambers et al. 2014).
The site is located 13 km downstream from theephemeral source of the River Lambourn at Lynch Wood,Lambourn (51.512° N, 1.529° W). The river drains the
Fig. 1 Map of the UK, showing the location of CEH RiverLambourn Observatory and the instrumentation network
Hydrogeology Journal DOI 10.1007/s10040-015-1242-5
Author's personal copy
Chalk of the Berkshire Downs and is characterised by alarge baseflow component. At Shaw, 5 km downstream ofthe observatory, the river has a base flow index of 0.96and mean discharge of 1.73 m3/s (Marsh and Hannaford2008). The wetlands to the west of the river are dissectedby the Westbrook Channel, which separates the site into anorthern and southern meadow.
Historic maps dating back to the 1880s show a networkof predominantly linear conduits, sluices and aqueductscharacteristic of a managed water meadow system(Everard 2005). In particular, a channel through the northmeadow displays a sinuosity and irregularity indicative ofnatural origin. Most of these channels have naturallyinfilled and are absent from current maps.
Initial conceptual modelWetland water levels have been inferred to be principallycontrolled by the River Lambourn and Westbrook stage(Atkins 2005; Musgrave 2006; Old et al. 2014). Ground-water contributions are regarded as more significant in thesouth meadow, though the possibility of groundwaterupwellings at the northernmost extent of the site has beensuggested from hydrochemical analysis (Musgrave 2006).Such deductions were, however, based on an arbitrarilypositioned transect and cluster of randomly locatedpiezometers in each meadow.
The low permeability ‘putty’ chalk is considered to actas a confining layer to the Chalk aquifer, and its unevendistribution has implications for exchange betweengroundwater and surface water (Chambers et al. 2014).Studies at a nearby site 100 m upstream of theObservatory, part of the Lowland Catchment Research(LOCAR) programme (Wheater et al. 2007), haveindicated variable hydraulic connection between theChalk, gravels and surface water (Abesser et al. 2008;Allen et al. 2010; Lapworth et al. 2009). The extent of theinteraction remains unclear.
Methods
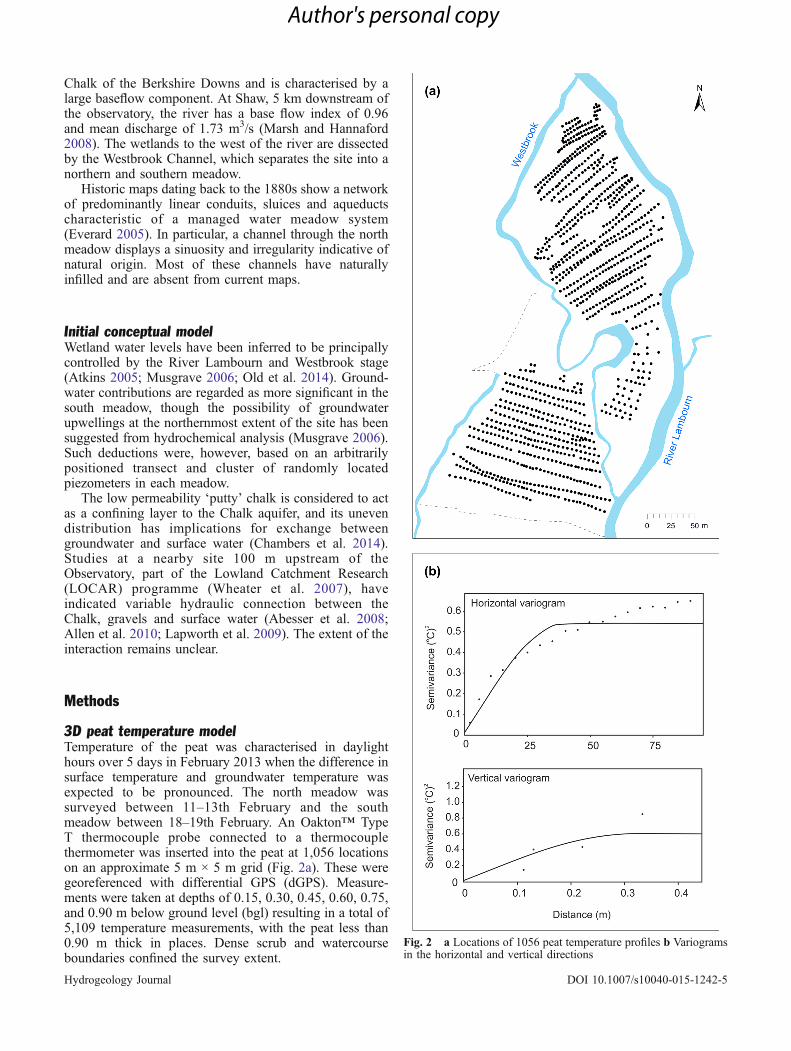
3D peat temperature modelTemperature of the peat was characterised in daylighthours over 5 days in February 2013 when the difference insurface temperature and groundwater temperature wasexpected to be pronounced. The north meadow wassurveyed between 11–13th February and the southmeadow between 18–19th February. An Oakton™ TypeT thermocouple probe connected to a thermocouplethermometer was inserted into the peat at 1,056 locationson an approximate 5 m × 5 m grid (Fig. 2a). These weregeoreferenced with differential GPS (dGPS). Measure-ments were taken at depths of 0.15, 0.30, 0.45, 0.60, 0.75,and 0.90 m below ground level (bgl) resulting in a total of5,109 temperature measurements, with the peat less than0.90 m thick in places. Dense scrub and watercourseboundaries confined the survey extent.
Fig. 2 a Locations of 1056 peat temperature profiles b Variogramsin the horizontal and vertical directions
Hydrogeology Journal DOI 10.1007/s10040-015-1242-5
Author's personal copy
Temperature data were imported into the 3D visualisa-tion and analysis application Paradigm SKUA 2011.3™.This is a powerful modelling package widely used in theearth sciences, allowing the integration and analysis ofborehole, geophysical and other subsurface data. A 3Dgrid was constructed which encapsulated the temperaturemeasurement points and had cell dimensions of 1 m × 1 min the horizontal plane and 0.05 m in the vertical direction.The north and south meadows were kept separate. Thegrid was positioned so that the temperature measurementpoints coincided with the centre of grid cells. It wasdeformed to align each layer of cells parallel to theundulating surface topography. Measured temperaturevalues were assigned to the grid cell in which theyoccurred and, following variogram modelling (Fig. 2b),were interpolated throughout the gridded volume usingordinary kriging (Webster and Oliver 2007).
The spherical 3D variogram model was estimatedwithin Paradigm SKUA 2011.3™ by the method ofmoments. The software includes the capability to includeanisotropy in the variogram model. This is where theexpected squared difference between a pair of observa-tions is a function of both the length and the direction ofthe vector which separates the measurement locations. Incontrast, isotropic models assume that the variogram ispurely a function of the length of the vector.
In the horizontal plane, any directional-dependenceappeared to be caused by a single feature in the northernmeadow. The temperature was less variable parallel to thisthan perpendicular to it. Since the feature dissected themeadow, it was not possible to represent this anisotropyby a geometric distortion (stretching or contraction) of thevariogram range in a single direction. Any attempt to doso would have led to artefacts in the predicted temperaturesurface. There was a clear difference between thevariograms in the horizontal and vertical planes; thus,the estimated model was isotropic in the horizontal planewith geometric anisotropy in the vertical plane (Websterand Oliver 2007). The estimated spherical variograms areshown in Fig. 2b. The estimated nugget and sill variancesare 0.01 (°C)2 and 0.52 (°C)2, respectively. The range ofthe model is 35.5 m in the horizontal direction and 0.3 min the vertical direction.
Site instrumentationAn existing gridded piezometer array was numbered 1–13(Fig. 1). Supplemental piezometers were added in May2013 to target observed temperature anomalies (locations14–19; Fig. 1). All locations comprise separate peat andgravel piezometers, with the exception of location 8 wherethe peat was too thin to complete an installation. Gravelpiezometers are screened approximately 2.5–3.5 m bgl,whilst peat piezometers are screened across the entire peatthickness. Chalk boreholes are also located at sites 3, 20and 21; these are screened at 9.5–10.0, 8.0–9.0 and 5.0–6.0 m bgl, respectively.
Groundwater heads are routinely measured manuallyby dipping observed water levels. Moreover, gravel
groundwater temperatures are monitored every 5 minusing either In-Situ Level Troll® 500s or SWS Divers®installed to a consistent depth of 3 m bgl in piezometers1–13. The River Lambourn temperature is measured every15 min at monitoring site SW1, with a Druck® PDCR1830 (Fig. 1). Channel stage is regularly observed at fourstage boards along the River Lambourn (a–d) and two inthe Westbrook (e–f). Continuous 15 minute averaged airtemperature data and subsurface temperature at 0.1, 0.3and 0.5 m depths are recorded at an automatic weatherstation (AWS) using CS215™ and 107-LC™ temperaturesensors, respectively.
Water sampling and analysisGroundwater samples were collected in May 2013 fromall gravel and chalk piezometers once stable fieldmeasurements were obtained for dissolved oxygen (DO),pH, specific electrical conductance (SEC), redox potential(Eh) and temperature. These measurements were collectedusing Mettler-Toledo™ probes contained within a flow-through cell to inhibit any contact with the atmosphere.Samples from all peat piezometers were obtained follow-ing a single purge, as the transmissivity of the peat wastoo low to sustain continuous abstraction with a peristalticpump (0.1–0.5 l/min) in piezometers 1–13. Hence, onlyfield measurements of pH and SEC were collected in thepeat. Surface water samples were also obtained from theRiver Lambourn at SW1 and Westbrook at SW2 (Fig. 1).
Laboratory sample preparation and analysis wereperformed following the procedures outlined by Nealet al. (2011). Major anions and dissolved metals weredetermined via Dionex™ liquid chromatography and ICP-OES, respectively. Alkalinity was determined by titrationwith hydrochloric acid. Dissolved organic carbon (DOC)analysis was undertaken with a Thermalox™ C analyserfollowing acidification and sparging. Total phosphorus(TP) was determined by the method of Eisenreich et al.(1975). Soluble reactive phosphate (SRP) and ammonium-nitrogen were determined colorimetrically.
Linking vegetation coverage to hydrologyVegetation species were identified at a subset of thetemperature survey positions to identify potential botani-cal indicators of groundwater upwelling. The temperaturesurvey positions were selected by stratified randomsampling (De Gruijter et al. 2006) where the stratacomprised deciles of the observed temperature at 0.15 mdepth (Table 1). Twelve of the positions within eachstratum were selected at random. Vegetation species wereidentified at these 120 locations in addition to thelocations of the paired piezometers.
The survey was conducted with a 2 m2 quadrat in July2013 when stands were mature enough to allow easieridentification. Each quadrat was aligned north–south andlocated at its southwest corner using dGPS. For eachquadrat, individual species and their percentage coverwere indentified. These results were then used to allocate
Hydrogeology Journal DOI 10.1007/s10040-015-1242-5
Author's personal copy
the location to a particular community of the NationalVegetation Classification (NVC; Rodwell 1991) using theTABLEFIT procedure (Hill 1996). This establishes thedegree of agreement between species coverage in eachquadrat and the association tables in British plantcommunities. Only where goodness of fit values were atleast 50 %, were samples allocated. Further, the positionsof all Carex paniculata, easily recognisable in densetussocks up to 1.5 m tall and 1 m in diameter, wererecorded and matched to the local temperature decile.
Results
Temperature
3D peat temperature modelOverall temperature ranges between 2.1 and 10.3 °C in thepeat, with a mean temperature of 6.4 °C (σ=1.7 °C). In thenorth meadow, the mean temperature was 6.5 °C(σ=1.76 °C), whilst in the south, mean temperature waslower at 6.0 °C (σ=1.32 °C). The model shows discretewarm temperature anomalies (>9 °C) correlating withhistorical channels (Fig. 3), which have infilled and are nolonger present (Fig. 1). In the north meadow the anomalieslargely correspond to the path of the sinuous relic channel,whilst the main anomaly in the south meadow lies withina relic channel draining to the Westbrook. The anomaliesare tightly constrained with heat only propagating 5–10 mlaterally from the channel centre.
Temperature gradients vary widely across the site, andcross-sections through the model show they are relativelyconstant with depth at some of the strongest temperatureanomalies (Fig. 3c). Overall the mean temperatureincreases from 4.7 °C at 0.15 m to 7.9 °C at 0.9 m, whileσ drops from 1.3 to 0.9 °C. The decreasing σ with depthreflects a decreasing range from between 2.1 °C and10.0 at 0.15 m, down to between 5.7 and 10.3 °C at 0.9 m.
Awarm temperature anomaly is located at the source ofthe main relic channel in the north meadow, with furtheranomalies spread along its course (Fig. 3d). Anomalieswithin the peat frequently extend toward the surface, butthen gradually dissipate with distance. Greatest changes intemperature occur at shallow depths. Below 0.7 m warmanomalies are persistent along the entire channel lengthbefore dispersing at around 370 m from the source.
Logged air, river, peat and gravel temperatureAir temperature ranges during the peat temperaturesurveys were −0.3 to 2.6 °C and −5.0 to 10.6 °C for thenorth and south meadows respectively (Fig. 4). Thesefluctuations were significantly dampened through the peat
depth, with total variations of only 0.8, 0.3, and 0.1 °C at0.1, 0.3 and 0.5 m bgl, respectively.
Groundwater temperature within the gravels rangedfrom 9.4 to 10.2 °C between piezometers in the northmeadow, with the exception of piezometer 6, which wasaround 7.3 °C. There appears to be a temperature gradientacross the meadow with the warmest water located furthernorth. Within the south meadow, the gravel groundwaterwas cooler at 8.3–9.0 °C, while the River Lambourntemperature varied between 7.7 and 8.2 °C, with a meanof 7.9 °C, during the north meadow survey. During thesouth meadow survey the variation was 7.3 to 9.4 °C, witha mean of 8.4 °C.
Piezometric surface elevations (heads)Vertical upward head gradients from gravel to peat persistat sites 14–19 (Fig. 5), which are drilled into the relicchannels containing the warm temperature anomalies.Upward gradients also exist at sites 5 and 12, which arein close proximity to these channels, whilst elsewhere,predominantly downward gradients are present. Withinthe north meadow, there also appear to be highergroundwater heads in the peat and gravels in the vicinityof the relic channel. Chalk heads are higher than adjacentgravel and peat heads in the north meadow, but lower inthe south meadow.
Peat and gravel heads are significantly higher than theadjacent River Lambourn and Westbrook levels in thenorth meadow. In the south meadow, there is nosignificant gradient towards Westbrook. Generally,groundwater head contours follow a south-westerlydirection at an overall gradient of 0.003 in peat, gravel,and chalk (Fig. 5).
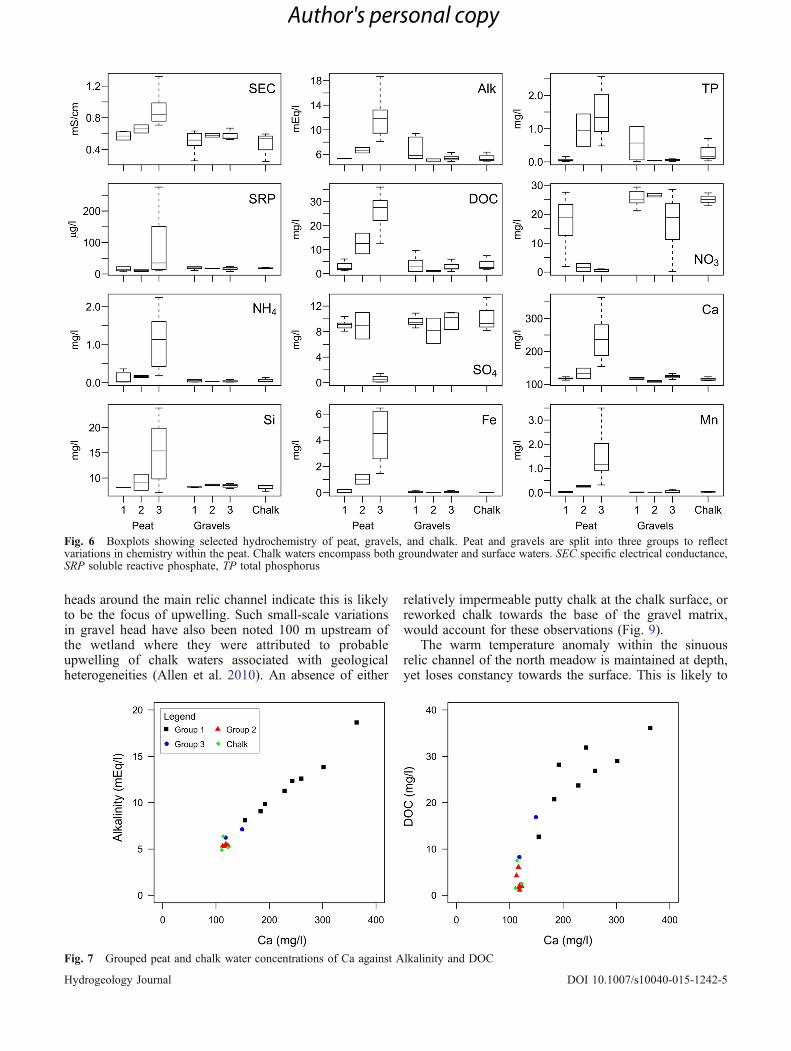
HydrochemistryWater chemistry from the peat piezometers falls into threedistinct groups, initially distinguished on the basis of theirSEC (Fig. 6). Group 1 comprises piezometers 14–19targeting the temperature anomalies, where peat waterchemistry is akin to the chalk waters. Group 3 encom-passes piezometers 1 and 4–13 where peat waters arecharacterised by elevated alkalinity, Ca, DOC, Si, NH4,TP, SRP, Fe and Mn, whilst they are depleted with respectto SO4 and NO3. Group 2 includes piezometers 2 and 3,which are considered intermediate waters between groups1 and 2. pH does not vary between groups with a mean of7.1, 7.0 and 7.1 for groups 1, 2 and 3, respectively.
There are strong positive correlations between alkalin-ity, DOC and Ca in group 3 (Fig. 7). Group 1 and chalkwaters, in contrast, are clustered, with group 2 watersfalling between. Gravel groundwater is reasonably well
Table 1 Boundaries of temperature deciles
Decile 1 2 3 4 5 6 7 8 9 10
Min temperature (°C) 0 3.4 3.7 4.0 4.2 4.4 4.6 4.9 5.5 6.8Max temperature (°C) 3.39 3.69 3.99 4.19 4.39 4.59 4.89 5.49 6.79 10.0
Hydrogeology Journal DOI 10.1007/s10040-015-1242-5
Author's personal copy
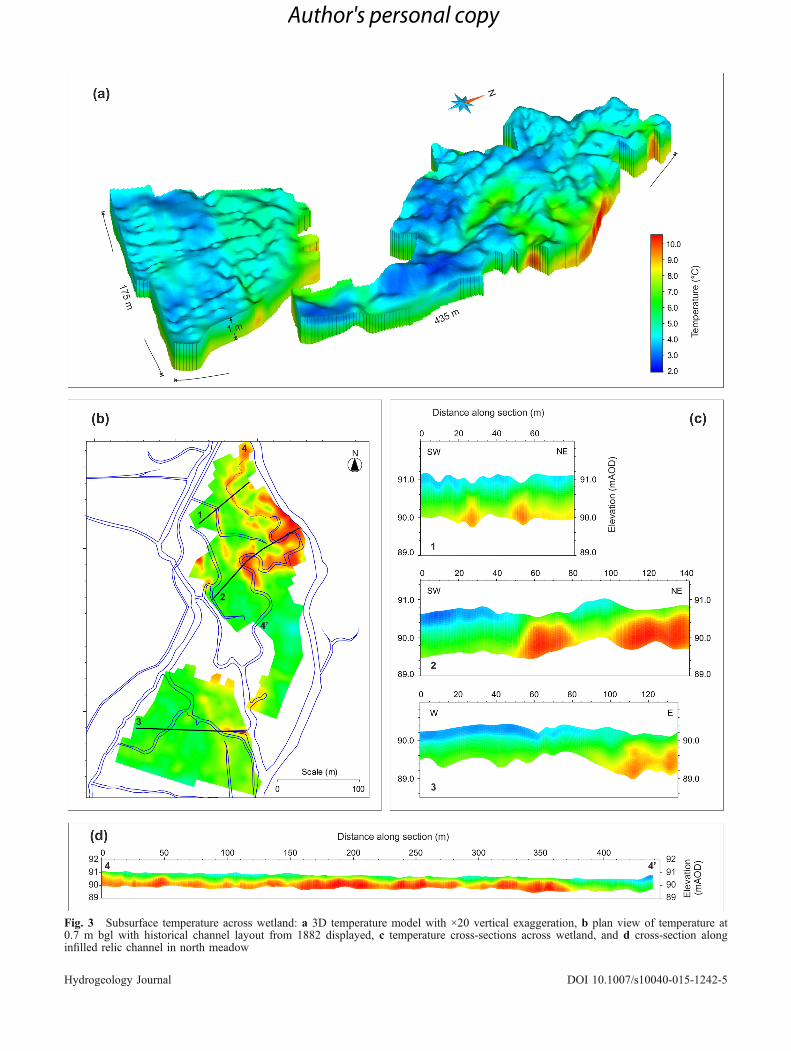
Fig. 3 Subsurface temperature across wetland: a 3D temperature model with ×20 vertical exaggeration, b plan view of temperature at0.7 m bgl with historical channel layout from 1882 displayed, c temperature cross-sections across wetland, and d cross-section alonginfilled relic channel in north meadow
Hydrogeology Journal DOI 10.1007/s10040-015-1242-5
Author's personal copy
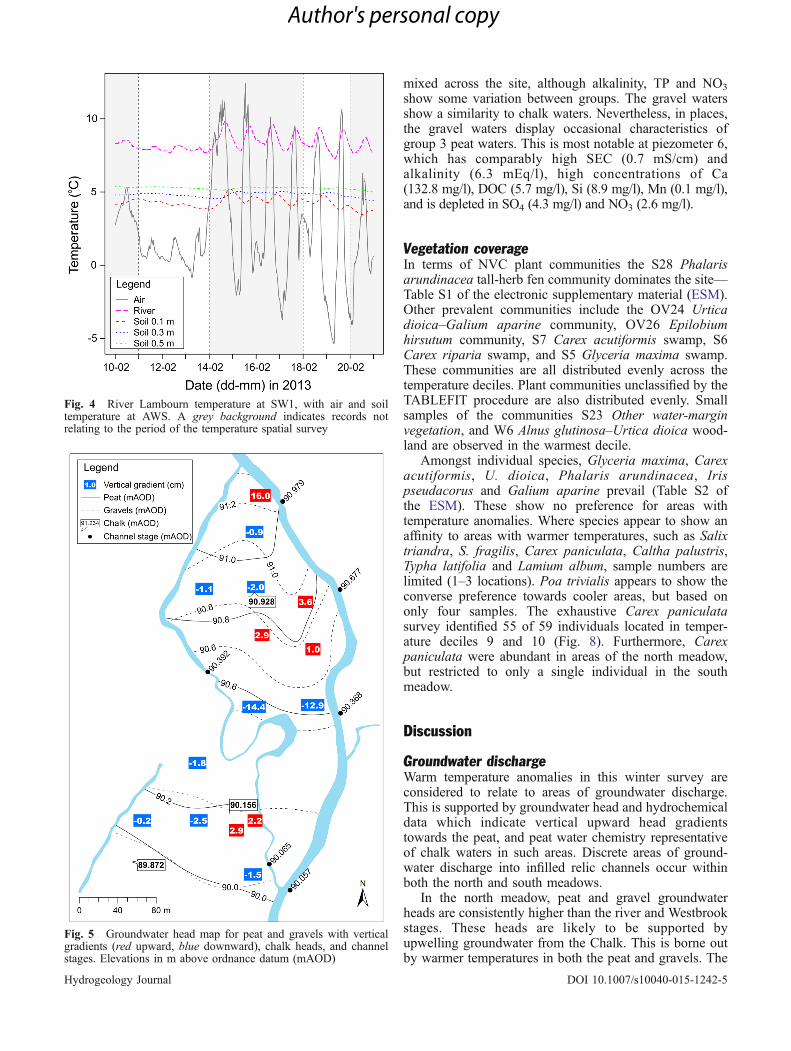
mixed across the site, although alkalinity, TP and NO3
show some variation between groups. The gravel watersshow a similarity to chalk waters. Nevertheless, in places,the gravel waters display occasional characteristics ofgroup 3 peat waters. This is most notable at piezometer 6,which has comparably high SEC (0.7 mS/cm) andalkalinity (6.3 mEq/l), high concentrations of Ca(132.8 mg/l), DOC (5.7 mg/l), Si (8.9 mg/l), Mn (0.1 mg/l),and is depleted in SO4 (4.3 mg/l) and NO3 (2.6 mg/l).
Vegetation coverageIn terms of NVC plant communities the S28 Phalarisarundinacea tall-herb fen community dominates the site—Table S1 of the electronic supplementary material (ESM).Other prevalent communities include the OV24 Urticadioica–Galium aparine community, OV26 Epilobiumhirsutum community, S7 Carex acutiformis swamp, S6Carex riparia swamp, and S5 Glyceria maxima swamp.These communities are all distributed evenly across thetemperature deciles. Plant communities unclassified by theTABLEFIT procedure are also distributed evenly. Smallsamples of the communities S23 Other water-marginvegetation, and W6 Alnus glutinosa–Urtica dioica wood-land are observed in the warmest decile.
Amongst individual species, Glyceria maxima, Carexacutiformis, U. dioica, Phalaris arundinacea, Irispseudacorus and Galium aparine prevail (Table S2 ofthe ESM). These show no preference for areas withtemperature anomalies. Where species appear to show anaffinity to areas with warmer temperatures, such as Salixtriandra, S. fragilis, Carex paniculata, Caltha palustris,Typha latifolia and Lamium album, sample numbers arelimited (1–3 locations). Poa trivialis appears to show theconverse preference towards cooler areas, but based ononly four samples. The exhaustive Carex paniculatasurvey identified 55 of 59 individuals located in temper-ature deciles 9 and 10 (Fig. 8). Furthermore, Carexpaniculata were abundant in areas of the north meadow,but restricted to only a single individual in the southmeadow.
Discussion
Groundwater dischargeWarm temperature anomalies in this winter survey areconsidered to relate to areas of groundwater discharge.This is supported by groundwater head and hydrochemicaldata which indicate vertical upward head gradientstowards the peat, and peat water chemistry representativeof chalk waters in such areas. Discrete areas of ground-water discharge into infilled relic channels occur withinboth the north and south meadows.
In the north meadow, peat and gravel groundwaterheads are consistently higher than the river and Westbrookstages. These heads are likely to be supported byupwelling groundwater from the Chalk. This is borne outby warmer temperatures in both the peat and gravels. The
Fig. 4 River Lambourn temperature at SW1, with air and soiltemperature at AWS. A grey background indicates records notrelating to the period of the temperature spatial survey
Fig. 5 Groundwater head map for peat and gravels with verticalgradients (red upward, blue downward), chalk heads, and channelstages. Elevations in m above ordnance datum (mAOD)
Hydrogeology Journal DOI 10.1007/s10040-015-1242-5
Author's personal copy
heads around the main relic channel indicate this is likelyto be the focus of upwelling. Such small-scale variationsin gravel head have also been noted 100 m upstream ofthe wetland where they were attributed to probableupwelling of chalk waters associated with geologicalheterogeneities (Allen et al. 2010). An absence of either
relatively impermeable putty chalk at the chalk surface, orreworked chalk towards the base of the gravel matrix,would account for these observations (Fig. 9).
The warm temperature anomaly within the sinuousrelic channel of the north meadow is maintained at depth,yet loses constancy towards the surface. This is likely to
Fig. 6 Boxplots showing selected hydrochemistry of peat, gravels, and chalk. Peat and gravels are split into three groups to reflectvariations in chemistry within the peat. Chalk waters encompass both groundwater and surface waters. SEC specific electrical conductance,SRP soluble reactive phosphate, TP total phosphorus
Fig. 7 Grouped peat and chalk water concentrations of Ca against Alkalinity and DOC
Hydrogeology Journal DOI 10.1007/s10040-015-1242-5
Author's personal copy
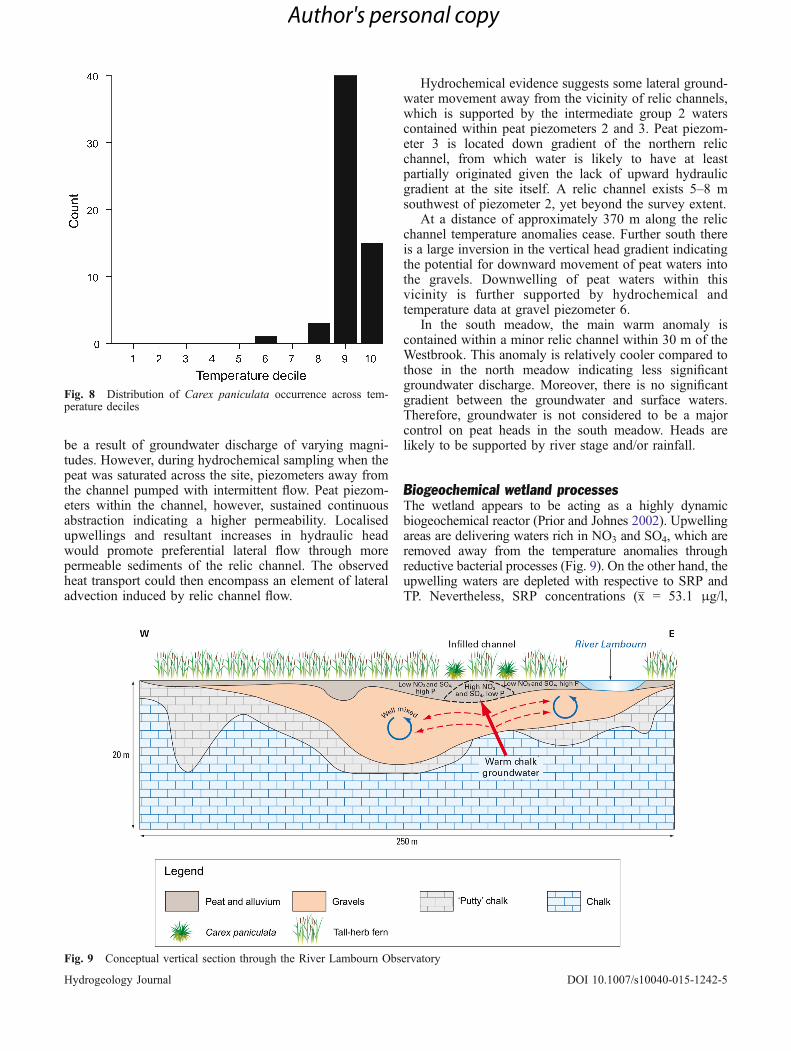
be a result of groundwater discharge of varying magni-tudes. However, during hydrochemical sampling when thepeat was saturated across the site, piezometers away fromthe channel pumped with intermittent flow. Peat piezom-eters within the channel, however, sustained continuousabstraction indicating a higher permeability. Localisedupwellings and resultant increases in hydraulic headwould promote preferential lateral flow through morepermeable sediments of the relic channel. The observedheat transport could then encompass an element of lateraladvection induced by relic channel flow.
Hydrochemical evidence suggests some lateral ground-water movement away from the vicinity of relic channels,which is supported by the intermediate group 2 waterscontained within peat piezometers 2 and 3. Peat piezom-eter 3 is located down gradient of the northern relicchannel, from which water is likely to have at leastpartially originated given the lack of upward hydraulicgradient at the site itself. A relic channel exists 5–8 msouthwest of piezometer 2, yet beyond the survey extent.
At a distance of approximately 370 m along the relicchannel temperature anomalies cease. Further south thereis a large inversion in the vertical head gradient indicatingthe potential for downward movement of peat waters intothe gravels. Downwelling of peat waters within thisvicinity is further supported by hydrochemical andtemperature data at gravel piezometer 6.
In the south meadow, the main warm anomaly iscontained within a minor relic channel within 30 m of theWestbrook. This anomaly is relatively cooler compared tothose in the north meadow indicating less significantgroundwater discharge. Moreover, there is no significantgradient between the groundwater and surface waters.Therefore, groundwater is not considered to be a majorcontrol on peat heads in the south meadow. Heads arelikely to be supported by river stage and/or rainfall.
Biogeochemical wetland processesThe wetland appears to be acting as a highly dynamicbiogeochemical reactor (Prior and Johnes 2002). Upwellingareas are delivering waters rich in NO3 and SO4, which areremoved away from the temperature anomalies throughreductive bacterial processes (Fig. 9). On the other hand, theupwelling waters are depleted with respective to SRP andTP. Nevertheless, SRP concentrations (x = 53.1 μg/l,
Fig. 8 Distribution of Carex paniculata occurrence across tem-perature deciles
Fig. 9 Conceptual vertical section through the River Lambourn Observatory
Hydrogeology Journal DOI 10.1007/s10040-015-1242-5
Author's personal copy
σ=76.4 μg/l) suggest that P is not a limiting nutrient for thewetland ecosystem. These biogeochemical processes andnutrient fluxes create distinct chemical environments, whichhave implications for ecological response.
The reductive processes and chemical observations canbe explained through Eqs. (1)–(6). High alkalinity andreducing conditions away from the upwelling waters may beexplained in part through the oxidation of organic matter:
CH2Oþ O2→CO2 þ H2O ð1Þ
This dissociates to:
CO2 þ H2O→HCO3 þ Hþ ð2Þ
The free proton is then able to liberate calcium fromthe calcite in the peaty matrix:
CaCO3 þ Hþ→HCO−3 þ Ca2þ ð3Þ
The much lower NO3 concentrations away from theupwelling waters provide some evidence for denitrification:
5CH2Oþ 4NO−3→2N2 þ 4HCO−
3 þ CO2 þ H2O ð4Þ
and nitrate reduction to ammonia (DNRA) with higherNH4
+ and DOC concentrations:
4NO−3 þ 4H2 þ 2Hþ→3H2Oþ NHþ
4 ð5Þ
which both further contribute to the alkalinity. Although anumber of studies have supported the premise that highorganic carbon availability favours DNRA over denitrifica-tion (Megonigal et al. 2003), the higher proportion of NH4
+
is likely due to mineralisation of organic N in the peat.Denitrification could also produce N2O as the final product.
Similarly, lower SO4 concentrations could be frombacterial sulphate reduction:
2CH2Oþ SO−4→H2Sþ 2HCO−
3 ð6Þ
which, again, adds to an increase in the alkalinity. Similarsequences of redox chemistry have been observed in othercalcium carbonate environments when stimulated by highloadings of organic carbon (Gooddy et al. 2002).
Botanical indicators of groundwater dischargeThe NVC plant communities identified for the site arespecies poor and collectively typical of mesotrophic toeutrophic soils and waters. There is little discerniblepreference to water source as indicated by temperature.
Some individual species seem to correspond to areas ofgroundwater discharge in the main vegetation survey, butsample numbers are low. These include Caltha palustriswhich has been recognised elsewhere as a possibleindicator of groundwater discharge (Klijn and Witte1999; Rosenberry et al. 2000; Wierda et al. 1997).
The affiliation of Carex paniculata to warm tempera-ture anomalies is marked. An explicit association betweenthe presence of the species and temperature is, however,doubtful. Carex paniculata is part of a widespreadEuropean temperate element in the UK flora, as definedby Preston and Hill (1997). There is little suggestion thatthe species has a tight temperature requirement, thoughEllenberg (1988) has it as an Bindicator of fairly warmconditions from lowland to high mountain sites, butespecially in submontane to temperate regions^. Theoccurrence of this sedge is more likely to be determinedby other factors linked to the temperature pattern.
The upwelling areas deliver waters relatively low inminerals Ca, Si, Fe and Mn, and nutrients TP and SRP, yetrich in NO3 and SO4 (Fig. 9). A preference for Carexpaniculata to Ca poor groundwater with higher NO3 andSO4 concentrations has been shown on the Pleistocenesands of central and northeast Netherlands (Grootjanset al. 1988; Wassen et al. 1988). Furthermore, Carexpaniculata has been shown to prefer waters with low Caand relatively high NH4 concentrations on the graveldeposits of the River Meuse in southeast Netherlands(Lucassen et al. 2006). However, groundwater Ca con-centrations are higher across the study site, given itssetting within a chalk valley, than those found in theNetherlands, by around 30–70 mg/l, as are Si concentra-tions by 3 mg/l. Fe and Mn concentrations are compar-atively lower, by around 1–12 and 1.7 mg/l, respectively.
At this site, it is considered that nutrient rather thanmineral supply is likely to be the limiting factor for Carexpaniculata, particularly given it is a sizeable species withhigh nutrient demands. Furthermore, it is plausible that NO3,rather than P, is the limiting nutrient for Carex paniculatadistribution. Addition of N to calcareous fens has beenshown to increase the biomass of some Carex species,without changing the species composition (Pauli et al. 2002).Increased P has also been found to promote the growth ofpoor fen species, especially more competitive grasses, to theexclusion of other species (Hoek et al. 2004). These findingsare consistent with evidence ofCarex paniculata surroundedby a variety of poor fen species to situations with the influxof base-rich groundwater and eutrophication (Rodwell 1991;Sinker 1962). This suggests the species may have potentialas an indicator of groundwater discharge across lowlandchalk wetlands, as chalk groundwater is generally high inNO3 throughout much of Western Europe due to historicalagricultural loadings (Aguilar et al. 2007; Wang et al. 2012).
The value of Carex paniculata as an indicator specieslies in its use for initial hydrological site appraisals anddirecting further study. The presence of the species or ofgroundwater does not guarantee the other, despite themajority of stands found in the groundwater dependentnorth meadow. Rather, tussocks of Carex paniculata
Hydrogeology Journal DOI 10.1007/s10040-015-1242-5
Author's personal copy
indicate adjacent conditions arising from a distinctchemical environment. These may result from groundwa-ter discharge in a particular geological context or fromanother supply mechanism (Wheeler 1999). Furthermore,other factors than water source are influential, principallylight availability (Goslee et al. 1997), along with soilconditions, air quality and seed availability. Supportinginformation is invariably required. Wider areas may becharacterised as potential areas of groundwater discharge,although it is not possible to delineate discrete areas byvegetation alone.
Value and limitations of a high-resolution 3Dtemperature modelA detailed 3D temperature model could be a useful precursorto the targeted deployment of sensor arrays. One-dimensional vertical temperature arrays are becomingincreasingly commonplace as a means of estimating ground-water fluxes (Anibas et al. 2009; Voytek et al. 2013). Suchestimates require profile time series to solve analytical fluxrepresentations (Briggs et al. 2012; Hatch et al. 2006).Sensors could be positioned to sample temperature gradientsrepresentatively across an entire site to estimate totalgroundwater influx. Furthermore, their deployment couldalso be based upon an understanding of the flow field, whichis important to avoid misinterpretation of temperature timeseries (Cuthbert and Mackay 2013). For example, at this sitethere is evidence for non-vertical flows which have beenconsidered the greatest source for error when implementing1D solutions (Lautz 2010).
Temperature data may be gathered simply and eco-nomically over large areas. In this study, the totalequipment cost was GBP 250 and a team of two covered0.1 ha/h. Limitations of the technique include the need fora high water-table elevation and penetrable soils, althoughthese are often distinguishing features of wetlands.Furthermore, it is possible that groundwater dischargemay exhibit seasonality or dynamically respond to intenseprecipitation events, which would not be captured in asingle temperature survey.
Other approaches to detect groundwater upwellinginclude water budgeting (Acreman and Miller 2006),intrusive investigation, and remote sensing by thermal ormultispectral imaging (Becker 2006). Water budgetinglacks spatial definition and requires quantifiable boundaryflows which are often not applicable to wetlands. Standardintrusive exploratory techniques include drilling and trialpitting which are disruptive to sensitive ecosystems andare spatially restricted (Baines et al. 2002). The influenceof air temperature at the ground surface renders remotesensing uncertain, as groundwater temperature signals areseen to fade noticeably in the upper 0.5 m. Moreover,commonly used satellite techniques do not possess therequisite spatial resolution and have limited penetration ofthe subsurface (Becker 2006). The method presented isable to encapsulate the necessary scale, depth andresolution with minimal intrusive impact.
Conclusions
A high spatial resolution 3D temperature model provides arapid, economical tool for detailed investigation withminimal intrusive impact. It is applicable worldwideprovided there is a sufficient contrast between air andgroundwater temperatures at the time of the study. Thetemperature model, here, delineates discrete areas ofgroundwater discharge in areas which had not previouslybeen considered to be groundwater dependent, withimplications for future sustainable management of thesite. The lateral continuity of the temperature anomaliesrevealed upwelling was generally associated with infilledrelic channel structures. Such features are likely to bewidespread within riparian lowland wetlands given thedynamic nature of river channels and could be pivotal inthe hydrological conceptualisation of many sites. Further-more, vertical temperature sections within the relicchannels indicate the magnitude of groundwater dischargevaries along their length.
A temperature model is an effective precursor to thetargeted installation of more costly monitoring, e.g. anarray of piezometers in this instance. Such targetedpiezometer arrays should be favoured in these heteroge-neous riparian settings where data from dense randomclusters or gridded arrays have been demonstrated to beinsufficient for successful site characterisation.
The new site conceptualisation also revealed the preva-lence of Carex paniculata in areas of deeper groundwaterupwelling suggesting that it could be a useful botanicalindicator of groundwater dependence. This correlation isconsidered to be a result of the relatively NO3 and SO4 rich,Ca and P poor, waters associated with the deeper ground-water, as opposed to a causal link to temperature itself.Carexpaniculata is likely limited by N rather than P. Surroundingreducing waters low in NO3 and SO4 and high in P promotepoor fen communities. A need for hydrochemical orhydrogeological supporting information limits the use ofCarex paniculata as an indicator species to preliminary sitewalkovers. Nevertheless, in similar geological settings, thespecies may help determine further investigativerequirements.
Acknowledgements Thanks go to Henry Holbrook for illustrationof Fig. 9. Funding for the study was provided by the NaturalEnvironment Research Council (NERC). J. Sorensen, D. Gooddy,A. Newell, B. Marchant and P. Williams publish with thepermission of the Executive Director of the British GeologicalSurvey.
References
Abesser C, Shand P, Gooddy D, Peach D (2008) The role of alluvialvalley deposits in groundwater–surface water exchange in aChalk river. IAHS, Wallingford, UK
Acreman M, Miller F (2006) Hydrological impact assessment ofwetlands. Proceedings of the International Symposium onGroundwater Sustainability (ISGWAS) Alicante, Spain, January2006
Hydrogeology Journal DOI 10.1007/s10040-015-1242-5
Author's personal copy
Aguilar JB, Orban P, Dassargues A, Brouyère S (2007) Identifica-tion of groundwater quality trends in a chalk aquifer threatenedby intensive agriculture in Belgium. Hydrogeol J 15:1615–1627
Allen DJ, Darling WG, Gooddy DC, Lapworth DJ, Newell AJ,Williams AT, Allen D, Abesser C (2010) Interaction betweengroundwater, the hyporheic zone and a Chalk stream: a casestudy from the River Lambourn, UK. Hydrogeol J 18:1125–1141
Almendinger JE, Leete JH (1998) Regional and local hydrogeologyof calcareous fens in the Minnesota River Basin, USA.Wetlands 18:184–202
Anderson MP (2005) Heat as a ground water tracer. Ground Water43:951–968
Anibas C, Fleckenstein JH, Volze N, Buis K, Verhoeven R, Meire P,Batelaan O (2009) Transient or steady‐state? Using verticaltemperature profiles to quantify groundwater–surface waterexchange. Hydrol Process 23:2165–2177
Atkins (2005) Habitats Directive Stage 3 appropriate assessment:Kennet and Lambourn Floodplain SAC. Atkins, Surrey, UK
Ausden M, Sutherland WJ, James R (2001) The effects of floodinglowland wet grassland on soil macroinvertebrate prey ofbreeding wading birds. J Appl Ecol 38:320–338
Baines D, Smith DG, Froese DG, Bauman P, Nimeck G (2002)Electrical resistivity ground imaging (ERGI): a new tool formapping the lithology and geometry of channel‐belts andvalley‐fills. Sedimentology 49:441–449
Baldwin A, Egnotovich M, Clarke E (2001) Hydrologic change andvegetation of tidal freshwater marshes: field, greenhouse, andseed-bank experiments. Wetlands 21:519–531. doi:10.1672/0277-5212(2001)021[0519:hcavot]2.0.co;2
Batelaan O, De Smedt F, Triest L (2003) Regional groundwaterdischarge: phreatophyte mapping, groundwater modelling andimpact analysis of land-use change. J Hydrol 275:86–108
Becker MW (2006) Potential for satellite remote sensing of groundwater. Ground Water 44:306–318
Bense V, Kooi H (2004) Temporal and spatial variations of shallowsubsurface temperature as a record of lateral variations ingroundwater flow. J Geophys Res 109:B04103
Bravo HR, Jiang F, Hunt RJ (2002) Using groundwater temperaturedata to constrain parameter estimation in a groundwater flowmodel of a wetland system. Water Resour Res 38:1153
Briggs MA, Lautz LK, McKenzie JM, Gordon RP, Hare DK (2012)Using high resolution distributed temperature sensing toquantify spatial and temporal variability in vertical hyporheicflux. Water Resour Res 48, W02527
Chambers J, Wilkinson P, Uhlemann S, Sorensen J, Roberts C,Newell A, Ward W, Binley A, Williams P, Gooddy D (2014)Derivation of lowland riparian wetland deposit architectureusing geophysical image analysis and interface detection. WaterResour Res 50:5886–5905
Conant B (2004) Delineating and quantifying ground waterdischarge zones using streambed temperatures. Groundwater42:243–257
Constantz J, Thomas CL, Zellweger G (1994) Influence of diurnalvariations in stream temperature on streamflow loss andgroundwater recharge. Water Resour Res 30:3253–3264
Cuthbert M, Mackay R (2013) Impacts of nonuniform flow onestimates of vertical streambed flux. Water Resour Res49(1):19–28
De Gruijter J, Brus DJ, Bierkins MFP, Knotters M (2006) Samplingfor natural resource monitoring. Springer, Berlin
EEC (1992) Habitats Directive 92/43/EEC. EEC, BrusselsEisenreich S, Bannerman R, Armstrong D (1975) A simplified
phosphorus analysis technique. Environ Lett 9:43–53Ellenberg H (1988) Vegetation ecology of Central Europe, 4th edn.
(English translation of BVegetation mitteleuropas mit denAlpen^). Cambridge University Press, Cambridge
Everard M (2005) Water meadows. Forest Text, WalesGlaser PH, Janssens JA, Siegel DI (1990) The response of
vegetation to chemical and hydrological gradients in the LostRiver peatland, northern Minnesota. J Ecol 1021–1048
Gooddy D, Clay J, Bottrell S (2002) Redox-driven changes inporewater chemistry in the unsaturated zone of the chalk aquiferbeneath unlined cattle slurry lagoons. Appl Geochem 17:903–921
Goslee S, Brooks R, Cole C (1997) Plants as indicators of wetlandwater source. Plant Ecol 131:199–206
Gowing D, Lawson C, Youngs E, Barber K, Rodwell J, Prosser M,Wallace H, Mountford J, Spoor G, Brand-Hardy DR (2002) Thewater regime requirements and the response to hydrologicalchange of grassland plant communities. DEFRA-commissionedproject BD1210, Institute of Water and Environment, Silsoe,UK
Grootjans A, Van Diggelen R, Wassen M, Wiersinga W (1988) Theeffects of drainage on groundwater quality and plant speciesdistribution in stream valley meadows. Vegetatio 75:37–48
Hannah DM, Malcolm IA, Bradley C (2009) Seasonal hyporheictemperature dynamics over riffle bedforms. Hydrol Process23:2178–2194
Hatch CE, Fisher AT, Revenaugh JS, Constantz J, Ruehl C (2006)Quantifying surface water–groundwater interactions using timeseries analysis of streambed thermal records: method develop-ment. Water Resour Res 42
Hill M (1996) TABLEFIT Version 1.0: for identification ofvegetation types: program manual. Institute of TerrestrialEcology, Penicuik, UK
Hoek D, Mierlo Anita J, Groenendael JM (2004) Nutrient limitationand nutrient‐driven shifts in plant species composition in aspecies‐rich fen meadow. J Veg Sci 15:389–396
Hunt RJ, Krabbenhoft DP, Anderson MP (1996) Groundwaterinflow measurements in wetland systems. Water Resour Res32:495–507
Keery J, Binley A, Crook N, Smith JW (2007) Temporal and spatialvariability of groundwater–surface water fluxes: developmentand application of an analytical method using temperature timeseries. J Hydrol 336:1–16
Klijn F, Witte J-PM (1999) Eco-hydrology: groundwater flow andsite factors in plant ecology. Hydrogeol J 7:65–77
Krause S, Bronstert A (2005) An advanced approach for catchmentdelineation and water balance modelling within wetlands andfloodplains. Adv Geosci 5:1–5
Krause S, Blume T, Cassidy N (2012) Investigating patterns andcontrols of groundwater up-welling in a lowland river bycombining fibre-optic distributed temperature sensing withobservations of vertical head gradients. Hydrol Earth Syst SciDiscuss 9:337–378
Lapworth D, Gooddy D, Allen D, Old G (2009) Understandinggroundwater, surface water, and hyporheic zone biogeochemicalprocesses in a Chalk catchment using fluorescence properties ofdissolved and colloidal organic matter. J Geophys ResBiogeosci (2005–2012) 114, G00F02
Lautz LK (2010) Impacts of nonideal field conditions on verticalwater velocity estimates from streambed temperature timeseries. Water Resour Res 46, W01509
Lewis J (2012) The application of ecohydrological groundwaterindicators to hydrogeological conceptual models. Ground Water50:679–689
Lischeid G, Kolb A, Alewell C, Paul S (2007) Impact of redox andtransport processes in a riparian wetland on stream water qualityin the Fichtelgebirge region, southern Germany. Hydrol Process21:123–132
Lowry CS, Walker JF, Hunt RJ, Anderson MP (2007) Identifyingspatial variability of groundwater discharge in a wetland streamusing a distributed temperature sensor. Water Resour Res 43(10)
Lucassen EC, Smolders AJ, Boedeltje G, Munckhof PJJ, Roelofs J(2006) Groundwater input affecting plant distribution bycontrolling ammonium and iron availability. J Veg Sci17:425–434
Maltby E, Acreman MC (2011) Ecosystem services of wetlands:pathfinder for a new paradigm. Hydrol Sci J 56:1341–1359
Marsh T, Hannaford J (2008) UK Hydrometric register. Centre forEcology and Hydrology, Wallingford, UK
Hydrogeology Journal DOI 10.1007/s10040-015-1242-5
Author's personal copy
McClain ME, Boyer EW, Dent CL, Gergel SE, Grimm NB,Groffman PM, Hart SC, Harvey JW, Johnston CA, Mayorga E(2003) Biogeochemical hot spots and hot moments at theinterface of terrestrial and aquatic ecosystems. Ecosystems6:301–312
McMenamin SK, Hadly EA, Wright CK (2008) Climatic changeand wetland desiccation cause amphibian decline in Yellow-stone National Park. Proc Natl Acad Sci 105:16988–16993
Megonigal JP, Hines M, Visscher P (2003) Anaerobic metabolism:linkages to trace gases and aerobic processes. Treat Geochem8:317–424
Mitsch WJ, Gosselink JG (2007) Wetlands. Wiley, HobokenMusgrave H (2006) Water sources to floodplain wetlands in the
Lambourn catchment. Open University, UKNeal C, Rowland P, Scholefield P, Vincent C, Woods C, Sleep D
(2011) The Ribble/Wyre observatory: major, minor and traceelements in rivers draining from rural headwaters to theheartlands of the NW England historic industrial base. Sci TotalEnviron 409:1516–1529. doi:10.1016/j.scitotenv.2011.01.018
Newbold C, Mountford JO (1997) Water level requirements ofwetland plants and animals. English Nature, Peterborough, UK
Old G, Naden P, Rameshwaran P, Acreman M, Baker S, Edwards F,Sorensen J, Mountford O, Gooddy D, Stratford C (2014)Instream and riparian implications of weed cutting in a chalkriver. Ecol Eng 71:290–300
Pauli D, Peintinger M, Schmid B (2002) Nutrient enrichment incalcareous fens: effects on plant species and communitystructure. Basic Appl Ecol 3:255–266
Preston CD, Hill MO (1997) The geographical relationships ofBritish and Irish vascular plants. Bot J Linn Soc 124:1–120
Prior H, Johnes P (2002) Regulation of surface water quality in aCretaceous Chalk catchment, UK: an assessment of the relativeimportance of instream and wetland processes. Sci TotalEnviron 282:159–174
Rodwell J (1991) British plant communities, vols 1–5. JNCC,Peterborough, UK
Rosenberry DO, Striegl RG, Hudson DC (2000) Plants as indicatorsof focused ground water discharge to a northern Minnesota lake.Ground Water 38:296–303
Schmidt C, Conant B Jr, Bayer-Raich M, Schirmer M (2007)Evaluation and field-scale application of an analytical method toquantify groundwater discharge using mapped streambedtemperatures. J Hydrol 347:292–307
Schot P, Barendregt A, Wassen M (1988) Hydrology of the wetlandNaarderemeer: influence of the surrounding area and impact onvegetation. Agric Water Manag 14:459–470
Sinker C (1962) The North Shropshire meres and mosses: abackground for ecologists. Headley, Kent, UK
Sophocleous M (2002) Interactions between groundwater andsurface water: the state of the science. Hydrogeol J 10:52–67
van Diggelen R, Grootjans A, Wierda A, Burkunk R, HoogendoornJ (1988) Prediction of vegetation changes under differenthydrological scenarios. In: Hydrological basis of ecologicallysound management of soil and groundwater. IAHS Publ. no.202, IAHS, Wallingford, UK, pp 71–80
Voytek EB, Drenkelfuss A, Day‐Lewis FD, Healy R, Lane JW,Werkema D (2013) 1DTempPro: analyzing temperature profilesfor groundwater/surface‐water exchange. Ground Water.doi:10.1111/gwat.12051
Wang L, Stuart M, Bloomfield J, Butcher A, Gooddy D, McKenzieA, Lewis M, Williams A (2012) Prediction of the arrival of peaknitrate concentrations at the water table at the regional scale inGreat Britain. Hydrol Process 26:226–239
Wassen M, Barendregt A, Bootsma M, Schot P (1988) Groundwaterchemistry and vegetation of gradients from rich fen to poor fenin the Naardermeer (the Netherlands). Vegetatio 79:117–132
Webster R, Oliver MA (2007) Geostatistics for environmentalscientists. Wiley, Chichester, UK
Wheater H, Peach D, Binley A (2007) Characterising groundwater-dominated lowland catchments: the UK Lowland CatchmentResearch Programme (LOCAR). Hydrol Earth Syst Sci 11:108–124
Wheeler BD (1999) Water and plants in freshwater wetlands. In:Eco-hydrology: plants and water in terrestrial and aquaticenvironments. Routledge, London, pp 127–180
Wheeler B, Shaw S, Tanner K (2009) A wetland framework forimpact assessment at statutory sites in England and Wales.Environment Agency R&D Technical Report, EnvironmentAgency, Bristol, UK
Wierda A, Fresco L, Grootjans A, Rv D (1997) Numericalassessment of plant species as indicators of the groundwaterregime. J Veg Sci 8:707–716
Winter TC (1999) Relation of streams, lakes, and wetlands togroundwater flow systems. Hydrogeol J 7:28–45
Younger P (1989) Devensian periglacial influences on the develop-ment of spatially variable permeability in the Chalk of southeastEngland. Q J Eng Geol Hydrogeol 22:343–354
Hydrogeology Journal DOI 10.1007/s10040-015-1242-5
Author's personal copy