Discovery of a low order drug-cell response surface for applications in personalized medicine
13
This content has been downloaded from IOPscience. Please scroll down to see the full text. Download details: IP Address: 130.37.210.210 This content was downloaded on 29/11/2014 at 18:38 Please note that terms and conditions apply. Discovery of a low order drug-cell response surface for applications in personalized medicine View the table of contents for this issue, or go to the journal homepage for more 2014 Phys. Biol. 11 065003 (http://iopscience.iop.org/1478-3975/11/6/065003) Home Search Collections Journals About Contact us My IOPscience
-
Upload
independent -
Category
Documents
-
view
0 -
download
0
Transcript of Discovery of a low order drug-cell response surface for applications in personalized medicine

This content has been downloaded from IOPscience. Please scroll down to see the full text.
Download details:
IP Address: 130.37.210.210
This content was downloaded on 29/11/2014 at 18:38
Please note that terms and conditions apply.
Discovery of a low order drug-cell response surface for applications in personalized medicine
View the table of contents for this issue, or go to the journal homepage for more
2014 Phys. Biol. 11 065003
(http://iopscience.iop.org/1478-3975/11/6/065003)
Home Search Collections Journals About Contact us My IOPscience
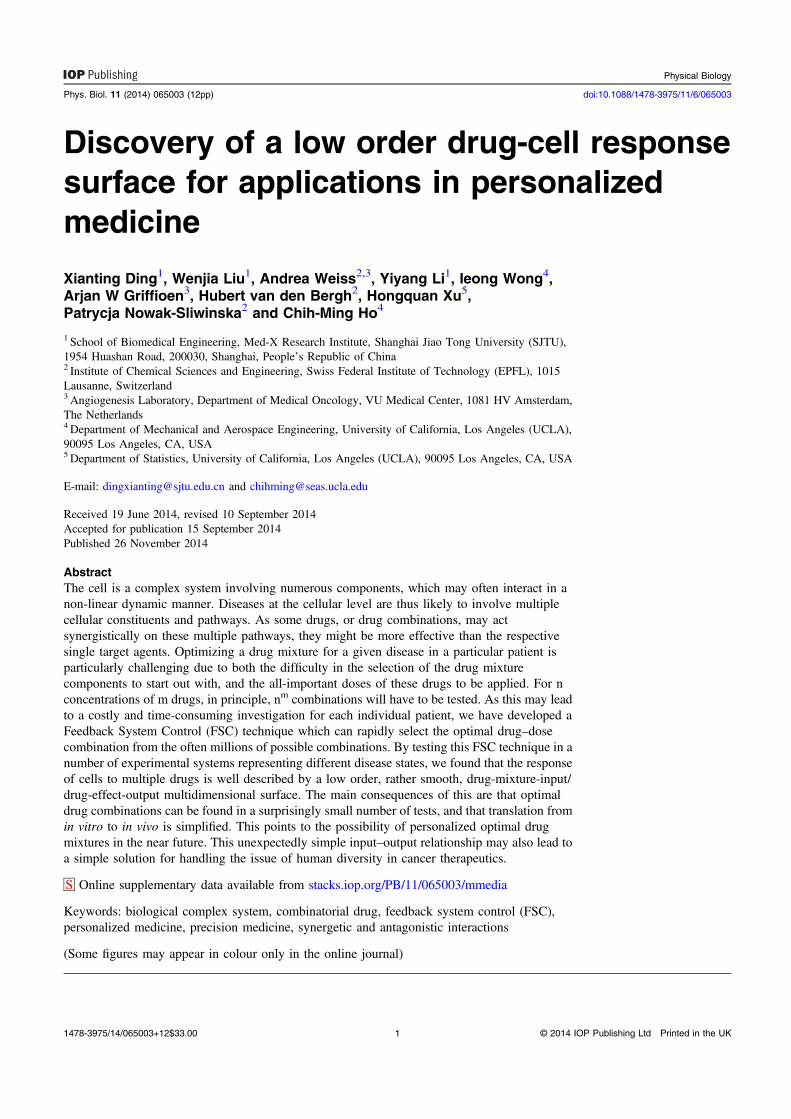
Discovery of a low order drug-cell responsesurface for applications in personalizedmedicine
Xianting Ding1, Wenjia Liu1, Andrea Weiss2,3, Yiyang Li1, Ieong Wong4,Arjan W Griffioen3, Hubert van den Bergh2, Hongquan Xu5,Patrycja Nowak-Sliwinska2 and Chih-Ming Ho4
1 School of Biomedical Engineering, Med-X Research Institute, Shanghai Jiao Tong University (SJTU),1954 Huashan Road, 200030, Shanghai, People’s Republic of China2 Institute of Chemical Sciences and Engineering, Swiss Federal Institute of Technology (EPFL), 1015Lausanne, Switzerland3Angiogenesis Laboratory, Department of Medical Oncology, VU Medical Center, 1081 HV Amsterdam,The Netherlands4Department of Mechanical and Aerospace Engineering, University of California, Los Angeles (UCLA),90095 Los Angeles, CA, USA5Department of Statistics, University of California, Los Angeles (UCLA), 90095 Los Angeles, CA, USA
E-mail: [email protected] and [email protected]
Received 19 June 2014, revised 10 September 2014Accepted for publication 15 September 2014Published 26 November 2014
AbstractThe cell is a complex system involving numerous components, which may often interact in anon-linear dynamic manner. Diseases at the cellular level are thus likely to involve multiplecellular constituents and pathways. As some drugs, or drug combinations, may actsynergistically on these multiple pathways, they might be more effective than the respectivesingle target agents. Optimizing a drug mixture for a given disease in a particular patient isparticularly challenging due to both the difficulty in the selection of the drug mixturecomponents to start out with, and the all-important doses of these drugs to be applied. For nconcentrations of m drugs, in principle, nm combinations will have to be tested. As this may leadto a costly and time-consuming investigation for each individual patient, we have developed aFeedback System Control (FSC) technique which can rapidly select the optimal drug–dosecombination from the often millions of possible combinations. By testing this FSC technique in anumber of experimental systems representing different disease states, we found that the responseof cells to multiple drugs is well described by a low order, rather smooth, drug-mixture-input/drug-effect-output multidimensional surface. The main consequences of this are that optimaldrug combinations can be found in a surprisingly small number of tests, and that translation fromin vitro to in vivo is simplified. This points to the possibility of personalized optimal drugmixtures in the near future. This unexpectedly simple input–output relationship may also lead toa simple solution for handling the issue of human diversity in cancer therapeutics.
S Online supplementary data available from stacks.iop.org/PB/11/065003/mmedia
Keywords: biological complex system, combinatorial drug, feedback system control (FSC),personalized medicine, precision medicine, synergetic and antagonistic interactions
(Some figures may appear in colour only in the online journal)
Physical Biology
Phys. Biol. 11 (2014) 065003 (12pp) doi:10.1088/1478-3975/11/6/065003
1478-3975/14/065003+12$33.00 © 2014 IOP Publishing Ltd Printed in the UK1

1. Introduction
The perturbation of cell homeostasis due to genetic and/orepigenetic changes can result in aberrant proteins or cellorganelles. These can lead to uncontrolled cell growth, pro-viding the underlying basis for most morbid and mortal ill-nesses. Modern drug discovery mainly aims to identify noveldrug molecules which directly bind and inhibit such aberrantmolecular cell targets [1, 2]. One of the main challenges ofdrug discovery, therefore, is to identify such drug targets in acomplex cellular system.
Biological systems, on a cellular, organ or body level,can be considered as complex systems [3]. Complex biolo-gical systems, however, are very different from other types ofsystems, such as an engineering system. A complex systemconsists of a large number of building blocks, e.g. proteins,mRNA, organelles. In biological systems, some of thesefunctional molecules are self-organized into pathways [4, 5].In contrast, engineering systems are assembled with parts thatare manufactured by following the first principle [6]. Thesystem’s functionality is well defined according to the designgoal. On the other hand, cellular system level responsesemerge from a network of regulatory and signaling pathwaysand are adaptive within a large dynamic range [7]. Obviously,sorting out an aberrant cellular component for drug targetingin the midst of a complex system is like finding a needle in ahaystack. Even if a target is identified and a drug is developedto inhibit it, single drug treatment often leads to drug resis-tance [8, 9]. Furthermore, in many diseases it is common forthere to be more than one disease causing target due to non-linear interactions between signaling pathways. Thereforecombinations of synergetic drugs targeted to several pathwaysand administered at low dose could represent an efficacioustreatment strategy [10, 11].
The efficacy of a drug combination not only depends onthe selection of the drugs, but also on the dose ratios amongthe drugs [10]. M drugs with N dose levels will generate NM
possible combinations. A brute force search for an optimaldrug combination in such a large parameter space is a pro-hibitive task. The recently developed Feedback SystemControl (FSC) technique [12] can direct biosystems toward adesired phenotypic outcome-based combinatorial drug sti-mulation. FSC can home in on an optimal drug combinationwith several orders of magnitude less experimental effortsthan testing all of the NM possibilities. FSC takes a top-downsystems approach by focusing on improving a phenotypebased on varying the combinatorial input stimuli. Thismethod completely avoids the bottom-up approach frequentlyused in biology, where one attempts to predict and control cellbehavior based on an understanding of how the differentsignaling pathways and molecules interact. It is surprising thattypically less than 15 iteration loop tests, with a few tens oftests per iteration, can identify the optimal combination frommillions or more alternatives. FSC is a platform technologywhich has been demonstrated in the eradication of cancers[13], inhibition of viral infection [10], the maintenance ofhuman embryonic stem cells (hESC) [11], the reformulation
of Chinese herbal medicine [14], and the differentiation ofmesenchymal stem cells [15].
Even though it took a long time and a lot of effort, manynew targeted drugs and their combinations have been intro-duced to the clinic in the past three decades. Unfortunately, apatient’s response to most targeted drugs remains fairly low incancer treatments. For example, the response for lung cancerpatients is about 25% and only 10% for hepatoma [16]. Manyreasons contribute to these unsatisfactory results. Patientdiversity and cancer heterogeneity are among some of thefactors influencing the efficacy of cancer therapies [17].Genetic profiles of individual patients with the same diseasevary across gender, race, etc and causes diversities of pro-teomic networks through transduction. The current clinicalpractice for chemotherapy is to use the same regimen forpatients with the same type of disease [18, 19], therefore, alow response is observed.
With the rapid development of micro/nano technologybased diagnostic instruments, fast and affordable geneticanalyses have become available and this has enabled thedevelopment of genotypic personalized medicine (GPM)[20, 21]. GPM is based on the principle of customizing singletargeted or combinatorial drugs for a group of patients withsimilar gene profiles and can result in better therapeutic out-comes. These strategies, however, disregard the fact thatdisease can also be independently caused by epigenetic sti-mulations [22, 23]. Therapeutic procedures can obviously bemuch more precise, if they include consideration of diseasephenotypes. However, phenotypic personalized medicine(PPM) needs to have a quantitative efficacy–drug relationshipa priori.
In this paper, we will present the results from investi-gations of four biological models, including non-small-celllung cancer (NSCLC) treatment, Herpes Simplex Virus type 1(HSV-1) eradication, mesenchymal stem cell osteogenesisinduction, and cancer treatment by angiogenesis inhibition. Inthese studies, we show that the efficacy–drug dose relation-ships of each system are simple and smooth. This findingcomes from one of the fundamental characteristics of complexsystems. Due to the process of evolution, organisms havedeveloped in such a way that they are robust and adaptive toenvironmental stimulations. That is, the bio-complex systemresponse surface to extracellular stimulations must be verysmooth. This is the reason why we can easily locate anoptimal drug combination in a biological system afterapproximately 15 iterations of the FSC technique. By testinga small group of subjects, the efficacy–drug surface can beestablished. With this quantitatively defined relationship,PPM can be practiced with great confidence.
2. Results
2.1. Non-small-cell lung cancer (NSCLC) reduction
The authors of this study [13] aimed to optimize the combi-nation of three anti-cancer drugs: AG490, a Janus Kinase 2inhibitor; U0126, a MEK1 and MEK2 inhibitor; and
2
Phys. Biol. 11 (2014) 065003 X Ding et al
Indirubin-3′-monoxime, which is an antimitotic CDK/GSUinhibitor. Compounds like the latter are sometimes used as aningredient in Chinese medicine. As a measurement of theefficacy of the combination treatment and its ‘selectivity’, theATP levels of both an NSCLC cell line (A549) and of anormal primary lung fibroblast (AG02603), are measuredafter exposure to a large number of combinations of the threeabove-mentioned agents for 72 h. It is argued that the threeselected drugs target distinct but nevertheless somewhatconnected intracellular pathways related to cell survival andproliferation. Eight doses were selected for each of the threedrugs resulting in 512 possible combinations. The authors testall these combinations and report the results in this study.
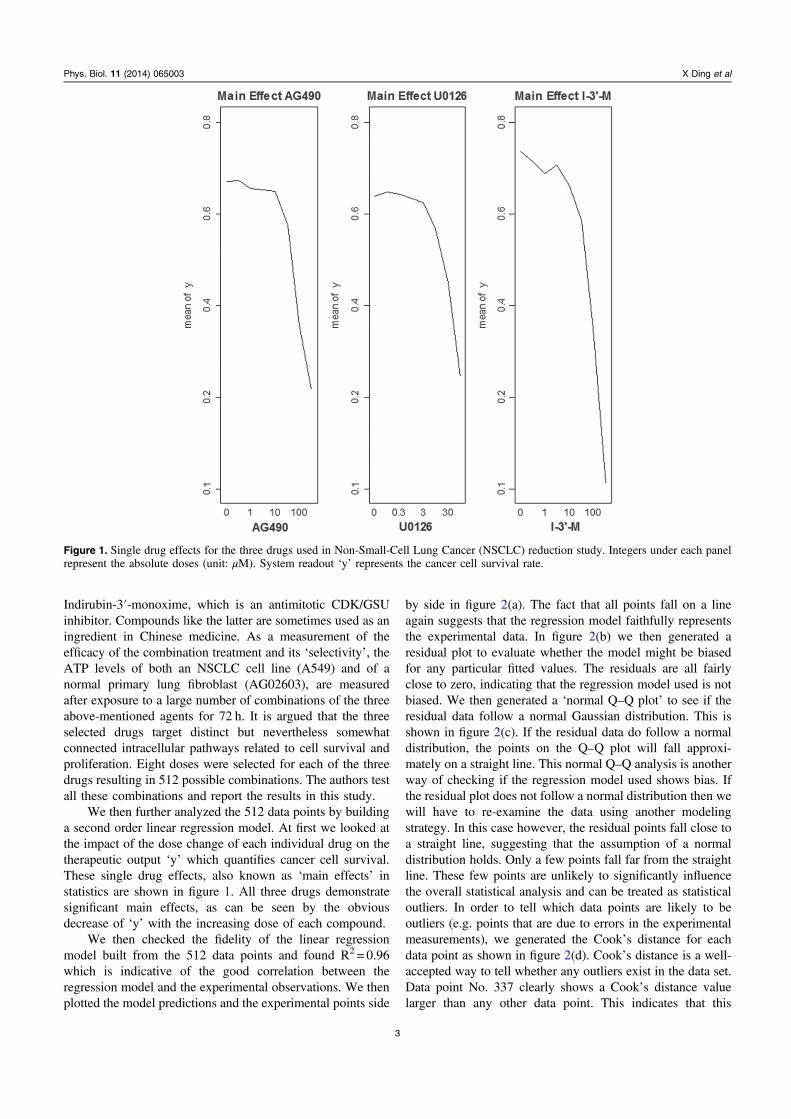
We then further analyzed the 512 data points by buildinga second order linear regression model. At first we looked atthe impact of the dose change of each individual drug on thetherapeutic output ‘y’ which quantifies cancer cell survival.These single drug effects, also known as ‘main effects’ instatistics are shown in figure 1. All three drugs demonstratesignificant main effects, as can be seen by the obviousdecrease of ‘y’ with the increasing dose of each compound.
We then checked the fidelity of the linear regressionmodel built from the 512 data points and found R2 = 0.96which is indicative of the good correlation between theregression model and the experimental observations. We thenplotted the model predictions and the experimental points side
by side in figure 2(a). The fact that all points fall on a lineagain suggests that the regression model faithfully representsthe experimental data. In figure 2(b) we then generated aresidual plot to evaluate whether the model might be biasedfor any particular fitted values. The residuals are all fairlyclose to zero, indicating that the regression model used is notbiased. We then generated a ‘normal Q–Q plot’ to see if theresidual data follow a normal Gaussian distribution. This isshown in figure 2(c). If the residual data do follow a normaldistribution, the points on the Q–Q plot will fall approxi-mately on a straight line. This normal Q–Q analysis is anotherway of checking if the regression model used shows bias. Ifthe residual plot does not follow a normal distribution then wewill have to re-examine the data using another modelingstrategy. In this case however, the residual points fall close toa straight line, suggesting that the assumption of a normaldistribution holds. Only a few points fall far from the straightline. These few points are unlikely to significantly influencethe overall statistical analysis and can be treated as statisticaloutliers. In order to tell which data points are likely to beoutliers (e.g. points that are due to errors in the experimentalmeasurements), we generated the Cook’s distance for eachdata point as shown in figure 2(d). Cook’s distance is a well-accepted way to tell whether any outliers exist in the data set.Data point No. 337 clearly shows a Cook’s distance valuelarger than any other data point. This indicates that this
Figure 1. Single drug effects for the three drugs used in Non-Small-Cell Lung Cancer (NSCLC) reduction study. Integers under each panelrepresent the absolute doses (unit: μM). System readout ‘y’ represents the cancer cell survival rate.
3
Phys. Biol. 11 (2014) 065003 X Ding et al
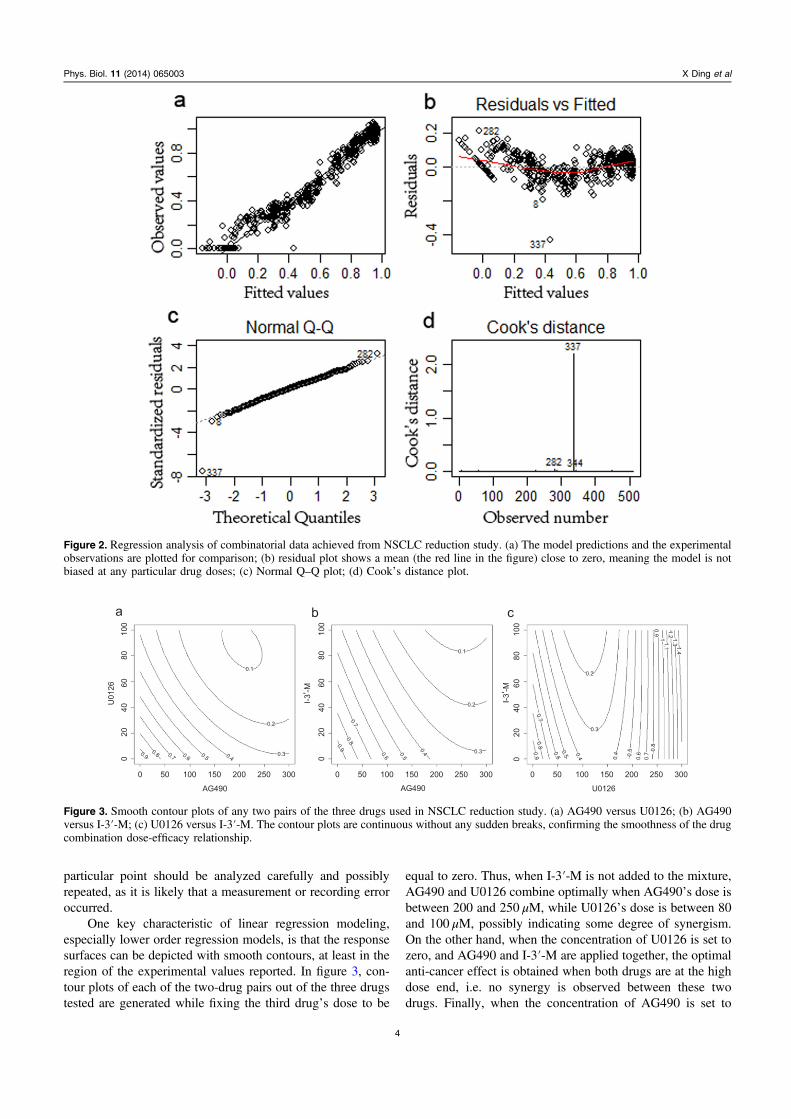
particular point should be analyzed carefully and possiblyrepeated, as it is likely that a measurement or recording erroroccurred.
One key characteristic of linear regression modeling,especially lower order regression models, is that the responsesurfaces can be depicted with smooth contours, at least in theregion of the experimental values reported. In figure 3, con-tour plots of each of the two-drug pairs out of the three drugstested are generated while fixing the third drug’s dose to be
equal to zero. Thus, when I-3′-M is not added to the mixture,AG490 and U0126 combine optimally when AG490’s dose isbetween 200 and 250 μM, while U0126’s dose is between 80and 100 μM, possibly indicating some degree of synergism.On the other hand, when the concentration of U0126 is set tozero, and AG490 and I-3′-M are applied together, the optimalanti-cancer effect is obtained when both drugs are at the highdose end, i.e. no synergy is observed between these twodrugs. Finally, when the concentration of AG490 is set to
Figure 2. Regression analysis of combinatorial data achieved from NSCLC reduction study. (a) The model predictions and the experimentalobservations are plotted for comparison; (b) residual plot shows a mean (the red line in the figure) close to zero, meaning the model is notbiased at any particular drug doses; (c) Normal Q–Q plot; (d) Cook’s distance plot.
0 50
2040
6080
100
0
2040
6080
100
0
2040
6080
100
0
100 150 200 250 300 0 50 100 150 200 250 300 0 50 100 150 200 250 300
AG490AG490 U0126
U01
26
a b c
I-3י -M
I-3י -M
0.1
0.2
0.2
0.2
0.3
0.3
0.30.4
0.4 0.4 0.40.5
0.5
0.5 0.5
0.6
0.6
0.6 0.60.7
0.7
0.7
0.70.8
0.8 0.8
0.8
0.9
0.9 0.9
0.9
0.1
11.2 1.3 1.4
1.1
Figure 3. Smooth contour plots of any two pairs of the three drugs used in NSCLC reduction study. (a) AG490 versus U0126; (b) AG490versus I-3′-M; (c) U0126 versus I-3′-M. The contour plots are continuous without any sudden breaks, confirming the smoothness of the drugcombination dose-efficacy relationship.
4
Phys. Biol. 11 (2014) 065003 X Ding et al
zero, and we look at U0126 and I-3′-M being used together,the optimal anti-cancer effect occurs when the U0126 con-centration is between 100 and 150 μM, and either higher orlower doses of this compound lead to a less optimal readout.The three contour plots generated all appear to be quitesmooth in the domain of the concentrations tested, confirmingthat the relation between the three chosen anti-cancer drugscan be expressed with a simple second order linear regressionmodel.
2.2. Herpes simplex Virus type 1 (HSV-1) infection
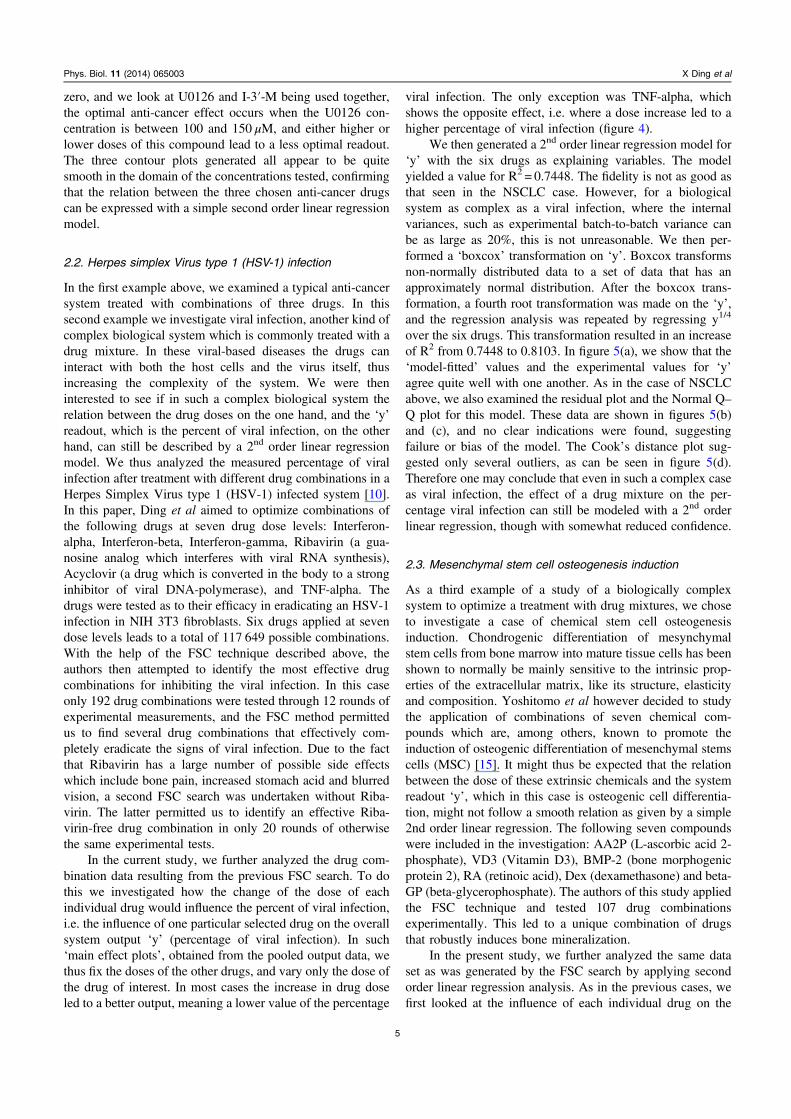
In the first example above, we examined a typical anti-cancersystem treated with combinations of three drugs. In thissecond example we investigate viral infection, another kind ofcomplex biological system which is commonly treated with adrug mixture. In these viral-based diseases the drugs caninteract with both the host cells and the virus itself, thusincreasing the complexity of the system. We were theninterested to see if in such a complex biological system therelation between the drug doses on the one hand, and the ‘y’readout, which is the percent of viral infection, on the otherhand, can still be described by a 2nd order linear regressionmodel. We thus analyzed the measured percentage of viralinfection after treatment with different drug combinations in aHerpes Simplex Virus type 1 (HSV-1) infected system [10].In this paper, Ding et al aimed to optimize combinations ofthe following drugs at seven drug dose levels: Interferon-alpha, Interferon-beta, Interferon-gamma, Ribavirin (a gua-nosine analog which interferes with viral RNA synthesis),Acyclovir (a drug which is converted in the body to a stronginhibitor of viral DNA-polymerase), and TNF-alpha. Thedrugs were tested as to their efficacy in eradicating an HSV-1infection in NIH 3T3 fibroblasts. Six drugs applied at sevendose levels leads to a total of 117 649 possible combinations.With the help of the FSC technique described above, theauthors then attempted to identify the most effective drugcombinations for inhibiting the viral infection. In this caseonly 192 drug combinations were tested through 12 rounds ofexperimental measurements, and the FSC method permittedus to find several drug combinations that effectively com-pletely eradicate the signs of viral infection. Due to the factthat Ribavirin has a large number of possible side effectswhich include bone pain, increased stomach acid and blurredvision, a second FSC search was undertaken without Riba-virin. The latter permitted us to identify an effective Riba-virin-free drug combination in only 20 rounds of otherwisethe same experimental tests.
In the current study, we further analyzed the drug com-bination data resulting from the previous FSC search. To dothis we investigated how the change of the dose of eachindividual drug would influence the percent of viral infection,i.e. the influence of one particular selected drug on the overallsystem output ‘y’ (percentage of viral infection). In such‘main effect plots’, obtained from the pooled output data, wethus fix the doses of the other drugs, and vary only the dose ofthe drug of interest. In most cases the increase in drug doseled to a better output, meaning a lower value of the percentage
viral infection. The only exception was TNF-alpha, whichshows the opposite effect, i.e. where a dose increase led to ahigher percentage of viral infection (figure 4).
We then generated a 2nd order linear regression model for‘y’ with the six drugs as explaining variables. The modelyielded a value for R2 = 0.7448. The fidelity is not as good asthat seen in the NSCLC case. However, for a biologicalsystem as complex as a viral infection, where the internalvariances, such as experimental batch-to-batch variance canbe as large as 20%, this is not unreasonable. We then per-formed a ‘boxcox’ transformation on ‘y’. Boxcox transformsnon-normally distributed data to a set of data that has anapproximately normal distribution. After the boxcox trans-formation, a fourth root transformation was made on the ‘y’,and the regression analysis was repeated by regressing y1/4
over the six drugs. This transformation resulted in an increaseof R2 from 0.7448 to 0.8103. In figure 5(a), we show that the‘model-fitted’ values and the experimental values for ‘y’agree quite well with one another. As in the case of NSCLCabove, we also examined the residual plot and the Normal Q–Q plot for this model. These data are shown in figures 5(b)and (c), and no clear indications were found, suggestingfailure or bias of the model. The Cook’s distance plot sug-gested only several outliers, as can be seen in figure 5(d).Therefore one may conclude that even in such a complex caseas viral infection, the effect of a drug mixture on the per-centage viral infection can still be modeled with a 2nd orderlinear regression, though with somewhat reduced confidence.
2.3. Mesenchymal stem cell osteogenesis induction
As a third example of a study of a biologically complexsystem to optimize a treatment with drug mixtures, we choseto investigate a case of chemical stem cell osteogenesisinduction. Chondrogenic differentiation of mesynchymalstem cells from bone marrow into mature tissue cells has beenshown to normally be mainly sensitive to the intrinsic prop-erties of the extracellular matrix, like its structure, elasticityand composition. Yoshitomo et al however decided to studythe application of combinations of seven chemical com-pounds which are, among others, known to promote theinduction of osteogenic differentiation of mesenchymal stemscells (MSC) [15]. It might thus be expected that the relationbetween the dose of these extrinsic chemicals and the systemreadout ‘y’, which in this case is osteogenic cell differentia-tion, might not follow a smooth relation as given by a simple2nd order linear regression. The following seven compoundswere included in the investigation: AA2P (L-ascorbic acid 2-phosphate), VD3 (Vitamin D3), BMP-2 (bone morphogenicprotein 2), RA (retinoic acid), Dex (dexamethasone) and beta-GP (beta-glycerophosphate). The authors of this study appliedthe FSC technique and tested 107 drug combinationsexperimentally. This led to a unique combination of drugsthat robustly induces bone mineralization.
In the present study, we further analyzed the same dataset as was generated by the FSC search by applying secondorder linear regression analysis. As in the previous cases, wefirst looked at the influence of each individual drug on the
5
Phys. Biol. 11 (2014) 065003 X Ding et al
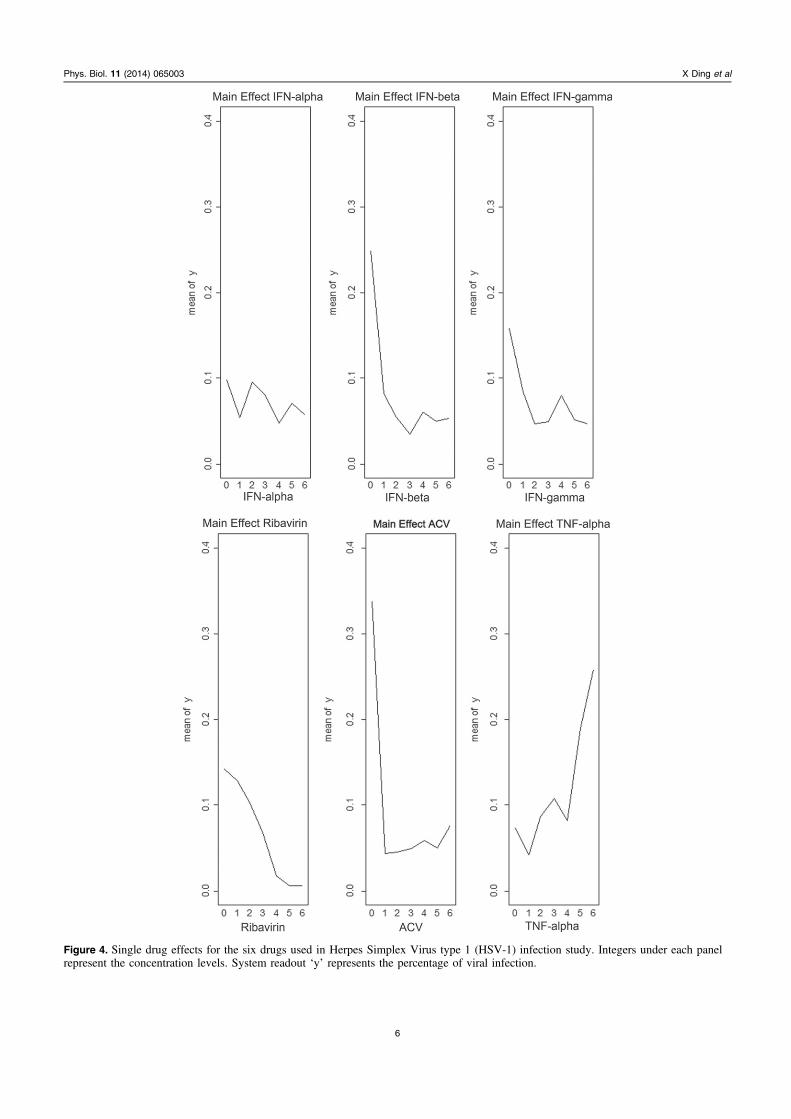
Figure 4. Single drug effects for the six drugs used in Herpes Simplex Virus type 1 (HSV-1) infection study. Integers under each panelrepresent the concentration levels. System readout ‘y’ represents the percentage of viral infection.
6
Phys. Biol. 11 (2014) 065003 X Ding et al
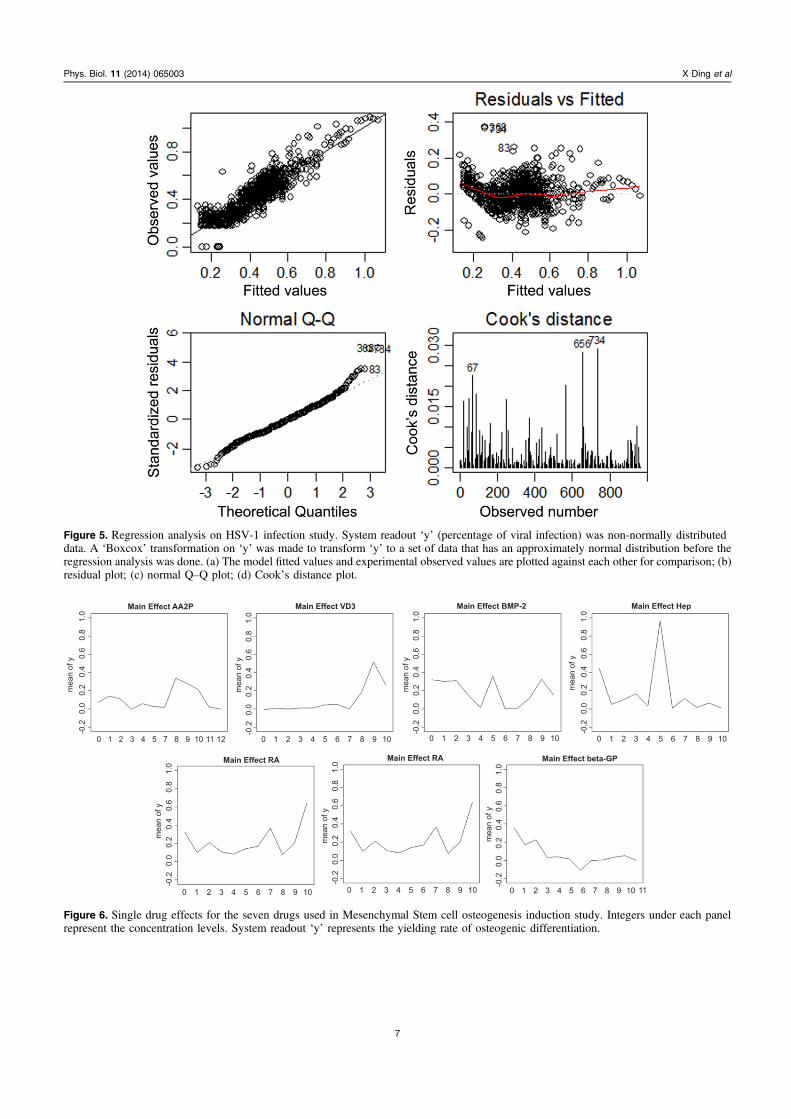
Figure 5. Regression analysis on HSV-1 infection study. System readout ‘y’ (percentage of viral infection) was non-normally distributeddata. A ‘Boxcox’ transformation on ‘y’ was made to transform ‘y’ to a set of data that has an approximately normal distribution before theregression analysis was done. (a) The model fitted values and experimental observed values are plotted against each other for comparison; (b)residual plot; (c) normal Q–Q plot; (d) Cook’s distance plot.
0 1 2 3 4 5 7 8 9 10 11 12 0 1 2 3 4 5 6 7 8 9 10
0 1 2 3 4 5 6 7 8 9 10 0 1 2 3 4 5 6 7 8 9 10 0 1 2 3 4 5 6 7 8 9 10 11
0 1 2 3 4 5 6 7 8 9 10 0 1 2 3 4 5 6 7 8 9 10
-0.2
0.0
0.2
0.4
0.6
0.8
1.0
-0.2
0.0
0.2
0.4
0.6
0.8
1.0
-0.2
0.0
0.2
0.4
0.6
0.8
1.0
-0.2
0.0
0.2
0.4
0.6
0.8
1.0
-0.2
0.0
0.2
0.4
0.6
0.8
1.0
-0.2
0.0
0.2
0.4
0.6
0.8
1.0
-0.2
0.0
0.2
0.4
0.6
0.8
1.0
mea
n of
y
mea
n of
y
mea
n of
y
mea
n of
y
mea
n of
y
mea
n of
y
mea
n of
y
Main Effect AA2P Main Effect VD3 Main Effect BMP-2 Main Effect Hep
Main Effect RA Main Effect RA Main Effect beta-GP
Figure 6. Single drug effects for the seven drugs used in Mesenchymal Stem cell osteogenesis induction study. Integers under each panelrepresent the concentration levels. System readout ‘y’ represents the yielding rate of osteogenic differentiation.
7
Phys. Biol. 11 (2014) 065003 X Ding et al
output ‘y’. This is shown in figure 6. It is interesting to notethat in this particular example of a complex biological system,when the concentrations of the other chemicals are fixed, theinfluence of the individual concentrations of each singlecompound on ‘y’ appears to be quite diverse. No simple trendcan be observed for any of these individual compounds. Thisobservation led us to believe that the optimal chemical mix-ture for osteogenesis would be a rather unique combination ofcompounds, in other words that the relation between ‘y’ andthe doses of the compounds would not follow a well-defined2nd order linear regression model (i.e. the surface would notbe smooth but rather be characterized by a quite localizedextreme value).
Yet, to our surprise, the 2nd order linear regression modelgenerated based on the tested data points showed an R2 valueof 0.7444, which was much higher than our expectation.When we examined the residual plots and Normal Q–Q plots,we observed a pattern in the residual plots, which indicatedthe residuals did not obtain a mean of zero (supplementary
figure 1(b)). When we further looked at the Cook’s distanceplot (supplementary figure 1(d)), we found data point No. 45was a clear outlier. We then repeated the whole analysis byremoving data point No. 45. Indeed, the experimentalobservations and the model predictions basically agree withone another, as can be seen from figure 7(a). Furthermore,upon examination of the residual plots and the Normal Q–Qplots (shown in figures 7(b) and (c)), we did not observe aclear residual distribution, indicating that even though therewas only modest fidelity, the second order linear regressionmodel was an acceptable approximation to the experimentaldata. Figure 7(d) shows that Cook’s distance analysis did notindicate any new outliers either.
2.4. Cancer angiogenesis inhibition
After examining the input–output relation for the efficacy ofmultiple drug treatments in vitro in the three different com-plex biological systems described above, we found that the
Figure 7. Regression analsyis on mesenchymal stem cell osteogenesis induction study. (a) The model fitted values and experimental observedvalues are plotted against each other for comparison; (b) residual plot; (c) normal Q–Q plot; (d) Cook’s distance plot.
Table 1. Single drug concentration table used in anti-angiogenesis study (unit in table: μM).
Anginex Avastin Axitinib Erlotinibanti-
HMGB1 Sunitinibanti-
vimentin RAPTA-C BEZ-235
0 0 0 0 0 0 0 0 01 0.05 0.3 0.5 1 0.4 1 100 0.15 0.5 1 1 5 1 5 300 0.510 1 10 2 10 2 10 500 150 5 50 5 20 4 20 1000 2100 10 100 10 40 10 40 2000 4
8
Phys. Biol. 11 (2014) 065003 X Ding et al
system’s response can, in each case, be fairly well modeledwith a smooth second order equation. If this finding could beuniversally true for other complex biological systems, it maybe possible to identify optimal drug combinations by testing alimited number of data points, which are then fitted with a
second order response function. This function can then beused to find the optimal drug combination.
In order to test this rather bold hypothesis, we tried tofind an optimal combination of a fairly small number of anti-angiogenic drugs (if possible four or less), starting from nine
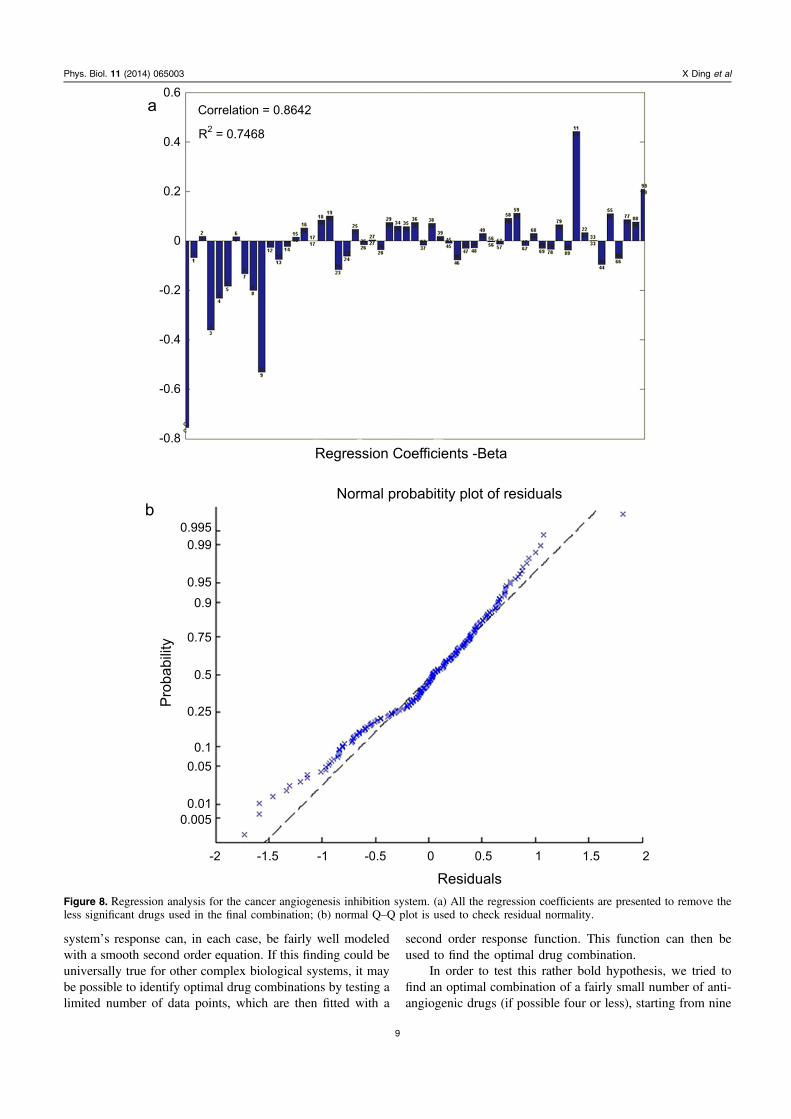
Figure 8. Regression analysis for the cancer angiogenesis inhibition system. (a) All the regression coefficients are presented to remove theless significant drugs used in the final combination; (b) normal Q–Q plot is used to check residual normality.
9
Phys. Biol. 11 (2014) 065003 X Ding et al
such substances. The starting compounds were carefullyselected for their known or presumed complementary anti-angiogenic activity. The drugs chosen were Anginex (1),Avastin (2), Axitinib (3), Erlotinib (4), Anti-HMGB1 anti-body (5), Sunitinib (6), Anti-Vimentin antibody (7), RAPTA-C (8), and BEZ-235 (9). As, up to this date, such treatmentshave been only partially successful with the single compo-nents listed above, it is now hoped that by using the FSCtechnique an effective angiostatic combination of some of theabove listed drugs might be found. If, furthermore, thiscombination would benefit from a significant degree ofsynergism, it cannot be excluded that the treatment wouldalso imply the use of much lower drug doses than are nor-mally applied with the single compounds. Reduced drugdoses may also carry the potential for having fewer sideeffects and reduced driving force for the development of drugresistance. Four drug concentrations were assigned to each ofthe nine starting compounds thus creating 49 = 262144 pos-sible drug combinations (table 1).
Immortalized human macrovascular endothelial cells(ECRF24) were used in this study. We first applied the FSCtechnique to optimize these nine drugs over ten iterations. TheFSC search optimization will be published in a separatepaper, as the present article focuses mainly on the analysis ofthe cell survival response to the different drug doses. In eachof the ten iteration steps, 19 drug combinations were tested,giving a total of 190 data points. Like before, we used thesepoints to build a second order linear regression model. Asexpected, the predictions from the regression model and thedata points showed a high correlation of 0.8642. The R2 valueequals 0.7468.
Based on the regression model shown in equation (1)below (see the method section), where the output y is afunction of k drugs, we then tried to find the optimal drugcombination by looking carefully at all the single drugcoefficients (β i), all the drug–drug interaction coefficients(β ij), and all the single drug quadratic regression coefficients(β ii) which are plotted in figure 8(a). Since the model and theexperimental data showed a very good correlation, we thenused figure 8(a) to help us eliminate less important drugs. Wealso take into account that, as shown in figure 8(b), the normalQ–Q plot shows that there seems to be no violation of thenormality hypothesis for the residuals distribution. The y-axisof figure 8(a) is such that the more negative the values of thecoefficients plotted along the y-axis imply a better contribu-tion to lowering endothelial cell replication, and thus a higherangiostatic effect. Anginex (1) showed a relatively low singledrug effect (β 1) but a much higher 2nd order effect (β 11),meaning Anginex (1) is not likely to be a highly effectivedrug when used individually. Furthermore, Anginex (1) didnot show the desired very low values in figure 8(a) for theinteraction with the other drugs. These observations may beinterpreted as minimal ‘synergies’ between Anginex and theother drugs (i.e. low values of Beta ik). Based on these rea-sons, we could confidently drop Anginex (1) from the drugmixture. Moreover, Avastin (2) and Sunitinib (6) did haveslightly positive coefficients (β 2 and β 6) in figure 8(a)(although this may not be statistically very significant), which
is indicative of their not very good single drug contributionsto the angiostatic effect. As the model is run with real con-centrations of each drug, single drug effects are quiteimportant. We therefore dropped drugs (2) and (6). The Anti-HMGB1 antibody (5) has a quite negative coefficient for itssingle drug effect (β 5). However, unfortunately this drugshowed mainly ‘antagonistic-like’ effects (the β 5k coeffi-cients are largely positive or around zero in figure 8(a) withother drugs, and it had a rather positive value for the quadraticterm (β 55). Therefore, drug (5) was also dropped from thedrug combination. Finally, the Anti-Vimentin antibody (7)also shows a good single drug effect, but a fairly positive 2nd
order effect, as well as mainly small coefficients for theinteractions with other drugs, indicating slight ‘synergism’ orslight ‘antagonism’. We therefore also dropped drug (7) atthis point. These procedures lead us to the optimal combi-nation including the following four drugs: Axitinib (3),Erlotinib (4), RAPTA-C (8) and BEZ-235 (9). Axitinib waseliminated from this mixture, for, among others, reasons oftoxicity.
Thus the final optimal drug combination consisted ofdrug (4) (10 μM)+ (8) (100 μM)+ (9) (0.02 μM). This com-bination, at these rather low concentrations was sufficientlypotent to inhibit more than 90% of the endothelial cell pro-liferation. Note that the EC50 values (the values that gave50% survival) of drug (4), (8), (9) are approximately 20 μM,500 μM and 0.05 μM, respectively, while the drug doses usedin combination were much lower, being reduced by a factor of2–5 from the EC50 values. This fact confirms the successfulapplication of 2nd order linear regression modeling inselecting a small group of very well-interacting angiostaticcompounds from the original nine. It also points to the pos-sibility of rapidly designing effective drug combinations, anopportunity that will be further tested in vivo and in pre-clinical models in the near future. One may speculate thatsuch a rapid and not excessively expensive method of indi-vidual drug optimization may be quite useful in the case ofcancers which change rapidly as a function of time.
3. Discussion
The diseased state in a cell commonly involves a number ofabnormal signaling pathways. It is therefore unlikely that asingle drug could inhibit all of the aberrantly activated path-ways involved in a disease and its progression. Although insome cases, individual drugs can show satisfying efficacy inthe treatment of a disease, the toxicity induced when drugs areused at high dose, and drug resistance accumulated fromlong-term drug administration, still often limit single-drugregimens as effective long-lasting treatment options. Analternate approach is to use drug combinations that can targetmultiple diseased cellular nodes simultaneously. The synergyamong drugs in an effective combination can lead to reduceddose, relieved side-effects and increased efficacy. In all of thecases we studied, optimized drug combinations were superiorto their single-drug counterparts.
10
Phys. Biol. 11 (2014) 065003 X Ding et al
The FSC approach usually identifies the optimal drugcombination in less than 15 rounds of experimental efforts, bytesting only 2% or less of the total possible search space. Thispaper, by investigating four different biological systems,demonstrates that although biological systems are internallycomplex, the drug dose-efficacy relationships can frequentlybe expressed by low order input–output multi-dimensionalsurfaces. This finding not only explains the puzzle of whyFSC is effective in drug combination optimization, but alsoserves as the foundation for the idea that a small number ofwell-designed experimental tests are adequate to form a rea-sonable response surface for predicting optimal drug combi-nations and doses.
In a biological system with multiple factors, experimen-tally testing all the possible drug combinations can be a verylaborious, time consuming and costly process. If the responseof a biological system can be described with a smoothfunction, then we only need to perform a small number oftests in order to build up a reliable model for this input–outputrelationship. This will then allow the rapid examination of theentire search space. This suggests that to optimize combina-tions of multiple factors in a bio-complex system, we maystart with only a few tests and examine whether the bio-system’s response is smooth or not. If so, the optimal com-bination could be faithfully designed by building up thesmooth response surface of the system with relatively few testdata points.
Clinically, tumor progression at different time points andat different locations may dictate the effectiveness of the sametherapy. Even within the same tumors, multiple subtypescould also require distinct treatments. This fact emphasizesthe necessity of applying combinatorial drugs to treat thelethal disease. Tumors, as well as the other complicated dis-eases, often involve multiple subtypes/strains or pathogenesisintracellular signaling pathways. This complexity varies withtime and location as well. It is extremely challenging for onesingle compound to deal with such complexities. Drugcombinations often tackle the problem from different angles,and therefore are believed to be a more universal and effectivesolution. The aim of the paper is to reveal the fact thatalthough biological systems are internally complex, the rela-tionships between drug doses and phenotypic systemresponses often follow relatively simple patterns. Further-more, these patterns can often be modeled faithfully usingsecond order regression analysis. In order to verify this con-clusion, the authors have tested the hypothesis in four dif-ferent biological systems. These biological systems wereselected to be ‘on purposely’ different to cover a relativelylarge area of interest for biological research.
Genotypic personalized medicine (GPM) has beenextensively discussed recently. GPM diagnoses and cate-gorizes patients based on their genotypic traits, and then treatsthem based on targeted strategies. GPM has greatly improvedresponse rates to treatment in cancer patients. Yet, epigeneticstimulation can also independently lead to disease. Therefore,genetic investigations only address part of the problemunderlying diseased states. For this reason, developing ther-apeutic strategies based on phenotypic clues may in fact be a
more direct route to evaluating the efficacy of a treatment.However, in order to practice phenotypic personalized med-icine (PPM), quantitative efficacy-drug relationships need tobe understood a priori. The work presented here demonstratesthe fact that a low order drug–cell response surface may wellcommonly exist in biological systems, indicating that the FSCapproach could be an invaluable route towards PPMoptimization.
4. Method
4.1. Regression modeling
Regression modeling is done with R© and MATLAB© pro-gramming languages.
For a bio-complex system with k drugs, a standard formof the linear regression model is as follows:
∑ ∑ ∑ ∑β β β β ε= + + + += = = = +
y x x x x (1)i
k
i i
i
k
ii i
i
k
j i
k
ij i j01 1
2
1 1
where β0, βi, βii and βij are the intercept, linear, quadratic andbilinear (or interaction) terms [24, 25]. In this study, a fullmodel with all the coefficients (including intercept, linear,quadratic and interaction terms) in a 2nd order linearregression model was built for each case.
A stepwised linear regression analysis was done in Rprogramming to remove those drugs that contributed thestatistically non-significant regression terms to form a cleanerfinal regression model. Fitted values and experimentallyobserved values are plotted side-by-side to evaluate the fitnessof the regression model. The residual plot was generated toevaluate whether the regression model is biased for any par-ticular fitted values. The Cook’s distance plot was generatedto reveal possible outliers in the experiment, if any. Finally, aseries of transformation (log/square-root/square transforma-tion) on the system readout was made to increase the judgingefficiency (P-value) of the regression model.
4.2. Data sets
Three datasets were selected in this study based on previouslypublished literature [10, 13, 15]. In all of these three cases, theFSC technique was applied to identify optimized drug cock-tails to tackle different biological questions. This paper aimedto study why the FSC technique could be implemented soeffectively to optimize drug combinations, so we elected toonly analyze data sets that were generated using the FSC drugcocktail search practice. The data set in the anti-angiogenesisstudy was generated by the authors in a separate experimentto validate the findings from the study of the first threedata sets.
4.3. Drugs acquisition for anti-angiogenesis study
Anginex® was provided by Peptx (Excelsior, MN, USA).Erlotinib and Axitinib were obtained from LC laboratories(Woburn, MA, USA), Sunitinib was from Pfizer Inc. (New
11
Phys. Biol. 11 (2014) 065003 X Ding et al
York, NY, USA) and BEZ235 was from Chemdea LLC(Ridgewood, USA). Anti-Vimentin monoclonal mouse anti-body (clone V9) was purchased from Dako (Glostrup, Den-mark) and anti-HMGB1 antibody was purchased from SantaCruz Biotechnology (Heidelberg, Germany). Avastin® waspurchased from Genentech (San Francisco, CA, USA).RAPTA-C was synthesized and purified based on a previouspublication [26].
4.4. Cell culture and maintenance for the anti-angiogenesisstudy
Immortalized human macrovascular endothelial cells(ECRF24) were cultured in a cell culture medium containing50% DMEM, 10% FBS and 50% RPMI 1640 supplementedwith an addition of 1% antibiotics (Life Technologies,Carlsbad, California, USA).
4.5. Cell viability assay for anti-angiogenesis study
Cells were seeded at a density of 2.5 × 10³ cells/well on a 96-well culture plate. Cells were given a 72 h incubation timewith the drug combinations. Drugs were premixed in theculture medium. Cell viability was calculated using theCellTiter-Glo luminescent cell viability assay (Promega,Madison, WI, USA).
Acknowledgment
This work was supported by the National Natural ScienceFoundation of China (81301293) and National Science andTechnology Major Projects for ‘Major New Drugs Innovationand Development’ (2014ZX09507008). The authors wouldlike to acknowledge the Institute of Chemical Sciences andEngineering at EPFL for providing the design of experimentas well as the experimental data for the cancer angiogenesisinhibition project.
References
[1] Imming P, Sinning C and Meyer A 2002 Drugs, their targetsand the nature and number of drug targets Nat. Rev. DrugDiscov. 5 821–34
[2] Zheng C J, Han L Y, Yap C W, Ji Z L, Cao Z W and Chen Y Z2002 Therapeutic targets: progress of their exploration andinvestigation of their characteristics Pharmacol. Rev. 58 259–79
[3] Ambrosini E and Aloisi F 2002 Chemokines and glial cells: acomplex network in the central nervous system Neurochem.Res. 29 1017–38
[4] Steinman R M 2002 The dendritic cell system and its role inimmunogenicity Annu. Rev. Immunol. 9 271–96
[5] Fields S and Song O K 2002 A novel genetic system to detectprotein protein interactions Nature 340 245–6
[6] Steward D V 2002 The design structure-system—a method formanaging the design of complex-systems IEEE Trans. Eng.Manage. 28 71–4
[7] Alon U 2002 Biological networks: the tinkerer as an engineerScience 301 1866–7
[8] Fitzgerald J B, Schoeberl B, Nielsen U B and Sorger P K 2002Systems biology and combination therapy in the quest forclinical efficacy Nat. Chem. Biol. 2 458–66
[9] De Clercq E 2002 Antiviral drugs in current clinical useJ. Clin. Virol. 30 115–33
[10] Ding X T, Sanchez D J, Shahangian A, Al-Shyoukh I,Cheng G H and Ho C M 2002 Cascade search for HSV-1combinatorial drugs with high antiviral efficacy and lowtoxicity Int. J. Nanomed. 7 2281–92
[11] Tsutsui H, Valamehr B, Hindoyan A, Qiao R, Ding X T,Guo S L, Witte O N, Liu X, Ho C M and Wu H 2002 Anoptimized small molecule inhibitor cocktail supports long-term maintenance of human embryonic stem cells Nat.Commun. 2 167
[12] Wong P K, Yu F Q, Shahangian A, Cheng G H, Sun R andHo C M 2002 Closed-loop control of cellular functionsusing combinatory drugs guided by a stochastic searchalgorithm Proc. Natl. Acad. Sci. USA 105 5105–10
[13] Al-Shyoukh I, Yu F Q, Feng J Y, Yan K R, Dubinett S,Ho C M, Shamma J S and Sun R 2002 Systematicquantitative characterization of cellular responses inducedby multiple signals Bmc. Syst. Biol. 5 88
[14] Yu H, Zhang W L, Ding X T, Zheng K Y Z, Ho C M,Tsim K W K and Lee Y K 2002 Optimizing combinations offlavonoids deriving from astragali radix in activating theregulatory element of erythropoietin by a feedback systemcontrol scheme Evid-Based Compl. Alt. 2013 541436
[15] Honda Y, Ding X T, Mussano F, Wiberg A, Ho C M andNishimura I 2002 Guiding the osteogenic fate of mouse andhuman mesenchymal stem cells through feedback systemcontrol Sci. Rep-Uk 3 3420
[16] Depierre A, Lemarie E, Dabouis G, Garnier G, Jacoulet P andDalphin J C 2002 A phase-ii study of navelbine(vinorelbine) in the treatment of non small-cell lung-cancerAm. J. Clin. Oncol-Canc. 14 115–9
[17] Shackleton M, Quintana E, Fearon E R and Morrison S J 2002heterogeneity in cancer: cancer stem cells versus clonalevolution Cell 138 822–9
[18] Ford D et al 2002 Genetic heterogeneity and penetranceanalysis of the BRCA1 and BRCA2 genes in breast cancerfamilies Am. J. Hum. Genet. 62 676–89
[19] Klein C A, Blankenstein T J F, Schmidt-Kittler O, Petronio M,Polzer B, Stoecklein N H and Riethmuller G 2002 Geneticheterogeneity of single disseminated tumour cells in minimalresidual cancer Lancet. 360 683–9
[20] Wheeler D A et al 2002 The complete genome of anindividual by massively parallel DNA sequencing Nature452 872–U5
[21] Hood L, Heath J R, Phelps M E and Lin B Y 2002 Systemsbiology and new technologies enable predictive andpreventative medicine Science 306 640–3
[22] Zhang H Y, Zhao Y M, Zhao C L, Yu S, Duan D Y and Xu Q Y2002 Long-term expansion of human neural progenitor cellsby epigenetic stimulation in vitro Neurosci. Res. 51 157–65
[23] Vescovi A L et al 2002 Isolation and cloning of multipotentialstem cells from the embryonic human CNS andestablishment of transplantable human neural stem cell linesby epigenetic stimulation Exp. Neurol. 156 71–83
[24] Ding X T, Xu H Q, Hopper C, Yang J and Ho C M 2002 Useof fractional factorial designs in antiviral drug studies Qual.Reliab. Eng. Int. 29 299–304
[25] Jaynes J, Ding X T, Xu H Q, Wong W K and Ho C M 2002Application of fractional factorial designs to study drugcombinations Stat. Med. 32 307–18
[26] Allardyce C S, Dyson P J, Ellis D J and Heath S L 2002 [Ru(η6-p-cymene)Cl2(pta)] (pta=1,3,5-triaza-7-phosphatricyclo[3.3.1.1]decane): a water soluble compound that exhibitspH dependent DNA binding providing selectivity fordiseased cells Chem. Commun. 2001 1396–7
12
Phys. Biol. 11 (2014) 065003 X Ding et al