Discount rates for use in cost benefit analysis of AEMO's 2022 ...
72
Discount rates for use in cost benefit analysis of AEMO's 2022 Integrated System Plan A report prepared for AEMO July 2021 Synergies Economic Consulting Pty Ltd www.synergies.com.au
-
Upload
khangminh22 -
Category
Documents
-
view
2 -
download
0
Transcript of Discount rates for use in cost benefit analysis of AEMO's 2022 ...

Discount rates for use in cost benefit analysis of AEMO's 2022 Integrated
System Plan
A report prepared for AEMO
July 2021
Synergies Economic Consulting Pty Ltd www.synergies.com.au
Brisbane Level 8, 10 Felix Street Brisbane QLD 4000 P 61 7 3227 9500 F 61 7 3221 0404
Perth L12, 172 St Georges Terrace Perth WA 6000 P 61 407 348 612 F 61 7 3221 0404
Sydney Suite 518, 377 Kent Street Sydney NSW 2000 P 61 2 8915 6235 F 61 7 3221 0404
Melbourne Level 9, 440 Collins Street Melbourne VIC 3000 P 61 3 8692 7272 F 61 7 3221 0404
Darwin Level 1, 48-50 Smith St Mall Darwin NT 0800 P 61 419 412 369 F 61 7 3221 0404
W www.synergies.com.au
Disclaimer
Synergies Economic Consulting (Synergies) has prepared this report exclusively for the use of the
party or parties specified in the report (the client) for the purposes specified in the report
(Purpose). The report must not be used by any person other than the client or a person authorised
by the client or for any purpose other than the Purpose for which it was prepared.
The report is supplied in good faith and reflects the knowledge, expertise and experience of the
consultants involved at the time of providing the report.
The matters dealt with in this report are limited to those requested by the client and those matters
considered by Synergies to be relevant for the Purpose.
The information, data, opinions, evaluations, assessments and analysis referred to in, or relied
upon in the preparation of, this report have been obtained from and are based on sources believed
by us to be reliable and up to date, but no responsibility will be accepted for any error of fact or
opinion.
To the extent permitted by law, the opinions, recommendations, assessments and conclusions
contained in this report are expressed without any warranties of any kind, express or implied.
Synergies does not accept liability for any loss or damage including without limitation,
compensatory, direct, indirect or consequential damages and claims of third parties, that may be
caused directly or indirectly through the use of, reliance upon or interpretation of, the contents
of the report.

DISCOUNT RATES FOR USE IN COST BENEFIT ANALYSIS OF AEMO'S 2022 INTEGRATED SYSTEM PLAN Page 3 of 72
Executive Summary
The purpose of this report is to recommend an appropriate real discount rate for private
sector investment in Australia’s National Electricity Market (NEM), as well as a
reasonable upper and lower bound for this rate.
Our recommended discount rate range will inform AEMO’s selection of an appropriate
discount rate for use in the cost benefit analysis (CBA)that it will undertake for the 2022
Integrated System Plan (ISP). The ISP is a whole-of-system plan encompassing various
mixes of generation, transmission and storage investments under five different scenarios
that provides an integrated roadmap for the efficient development of the NEM over the
next 20 years and beyond.1 The scenarios differ with respect to assumptions about the
growth in grid-scale renewable generation, the uptake of distributed energy resources
(small scale renewables like rooftop solar PV), and the level and breadth of Australia’s
decarbonisation policies.
AEMO is subject to binding and discretionary guidance from the Australian Energy
Regulator (AER) in using discount rates for its ISP CBA and we have ensured our
recommended discount rate range fully complies with this guidance.2
Our approach
Our central discount rate is a WACC-based estimate reflecting an average investor view
about required returns on investments in the NEM. It has been estimated based on what
is known as the social opportunity cost of capital, which recognises that any given
investment may occur at the expense of alternative investments in the economy because
capital is constrained but mobile.
This is important in the context of the ISP given potential future Australian and
international investors in the NEM will be selecting amongst a wide range of energy and
non-energy investment opportunities across the world. Hence, only future ISP-related
investments that are assessed to provide a net social benefit should proceed because they
would be consistent with achieving productive use of scarce resources (economic
efficiency) and the National Electricity Objective, which focusses on efficient investment
in, and efficient operation and use of, electricity services for the long term interests of
electricity consumers.
1 The five scenarios are: Steady Progress; Net Zero 2050; Slow Change; Step Change; and Hydrogen Superpower.
2 AER (2020), Cost benefit analysis guidelines, Guidelines to make the Integrated System Plan actionable, August.

DISCOUNT RATES FOR USE IN COST BENEFIT ANALYSIS OF AEMO'S 2022 INTEGRATED SYSTEM PLAN Page 4 of 72
We recommend that this central discount rate should be applied to both costs (to
annualise the costs and derive the Net Present Value of these costs) and benefits in
AEMO’s CBA modelling. Sensitivity testing should be undertaken using the lower and
upper bound discount rates across all five modelled scenarios in the ISP having regard
to different combinations of generation and transmission investment in each case.
In accordance with the AER’s CBA Guidelines, the lower and upper bound discount
rates have been determined as follows:
• Lower bound discount rate – the most recent regulated weighted average cost of
capital (WACC) as determined by the AER for transmission and/or distribution
networks.
• Upper bound discount rate – a WACC-based estimate reflecting a more risk
sensitive view about required returns on private investments in the NEM,
including generation and storage investments.
Our recommended discount rate range
Table 1 presents our recommended discount rate range.
Table 1 Discount rate estimates for lower, central and upper bounds
Parameter Lower bound estimate (AER)
Central estimate Upper bound estimate
Risk-free rate 1.63% 1.63% 1.63%
Capital structure 60% 50% 50%
Gamma 0.585 0.25 0.00
Corporate tax rate 30% 30% 30%
CAPM Parameters
Market risk premium (MRP) 6.10% 8.20% 8.10%
Asset beta 0.24 0.50 0.60
Equity beta 0.6 1.00 1.20
SL CAPM return on equity 5.29% 9.83% 11.35%
Debt Parameters
Debt beta 0.00 0.00 0.00
Debt risk premium (BBB+ rating for lower bound; BBB rating for central and upper bound)
1.28% 1.45% 1.45%
Debt raising costs 0.10% 0.10% 0.10%
Return on debt (pre-tax) 3.01% 3.18% 3.18%
Inflation 2.00% 2.23% 2.23%

DISCOUNT RATES FOR USE IN COST BENEFIT ANALYSIS OF AEMO'S 2022 INTEGRATED SYSTEM PLAN Page 5 of 72
Parameter Lower bound estimate (AER)
Central estimate Upper bound estimate
Post-tax nominal vanilla WACC 3.92% 6.51% 7.27%
Pre-tax real WACC 2.18% 5.58% 7.30%
Note: The AER’s latest WACC decisions have been adjusted to reflect an on-the-day cost of debt calculation
Source: Various AEMO and AER publicly available documentation
In accordance with the AER’s CBA Guidelines, our lower bound estimate is a simple
average of the AER’s most recent regulatory determinations for the Victorian
distribution network service providers (all released on 30 April 2021) and AusNet
Services transmission network (released on 30 June 2021).
To the extent that AEMO chooses to apply rounding to our discount rate estimates, we
recommend rounding to the nearest half per cent as follows:
• Lower bound – 2.0%
• Central case – 5.5%
• Upper bound – 7.5%.
The key assumptions underpinning our central discount rate are as follows:
• Risk free rate is based on 10-year Commonwealth bond (1.63% at 31 May 2021 based
on a 20-day average).
• Debt risk premium assumes a BBB credit rating (1.45% at 31 May 2021 based on a
20-day average).
• Market risk premium (MRP) (8.2% for a gamma of 0.25) is based on an average of
the Wright and Ibbotson backward-looking approaches (the volatility of the
forward-looking Dividend Discount Model approach means it has been used as a
cross check only).
• Asset beta of 0.50 (based on an average asset beta of our domestic and international
sample of 42 Electric Utilities, 9 Independent Power Producers & Energy Traders
and 19 Renewable Electricity listed entities sourced from the Global Industry
Classification Standard, which is a globally recognised classification system).3
• Capital structure based on gearing level of 50% using the same sample as for our
asset beta calculation.
3 Consistent with the practice of financial practitioners and most Australian economic regulators (except for the QCA),
we assume a debt beta of zero.

DISCOUNT RATES FOR USE IN COST BENEFIT ANALYSIS OF AEMO'S 2022 INTEGRATED SYSTEM PLAN Page 6 of 72
• Equity beta of 1.00 (based on our asset beta of 0.50, gearing of 50%, and the Brealey-
Myers formula to de-lever and re-lever the equity beta estimates to standardise the
gearing ratio across the sample).
• Forward-looking cost of debt based on BBB credit rating (3.18% at 31 May 2021
including debt risk premium of 1.45% noted above).
• Gamma of 0.25 informed by reference to dividend drop-off studies, which estimate
the value of distributed imputation tax credits (theta) by observing the change in
stock prices when the dividend and imputation credit separate from the share. This
value aligns with IPART’s current estimate of gamma.4
• Inflation of 2.23% based on the differential of yields between nominal and indexed
Treasury bonds (‘the break-even method’).
• Australian statutory tax rate of 30%.
Our upper bound estimate is based on the same parameters as the central estimate,
except for:
• Market risk premium (8.1% for a gamma of 0), based on the same averaging
approach as used for the central estimate but adjusted to recognise that the marginal
investor is foreign and gains no tax benefit from the dividend component of the
excess return on the market.
• Asset beta of 0.60 (based on the 75th percentile asset beta asset beta of our sample
and specifically referable to renewable generators).
• Equity beta of 1.20 (based on an asset beta of 0.60, gearing of 50%, and applying the
Brealey-Myers formula).
• Gamma of zero reflecting an assumption that the marginal investor in the NEM is
an international investor who gains no benefit from franking tax credits.
In presenting these assumptions, we note that several are not the same as those in the
AER’s 2018 Rate of Return Instrument and reflected in its recent regulatory
determinations and the lower bound discount rate presented above. However, we note
that the AER’s CBA Guidelines are not prescriptive regarding the cost of capital
methodology that we use to calculate the central and upper bound discount rates.
Rather, the key requirement is that our estimates reflect a discount rate consistent with
private sector investments in the NEM, which we consider that they do.
4 IPART (2018), Review of our WACC Method, (February), pp 75-83

DISCOUNT RATES FOR USE IN COST BENEFIT ANALYSIS OF AEMO'S 2022 INTEGRATED SYSTEM PLAN Page 7 of 72
Comparison of discount rates
Table 2 compares our recommended discount rates with AEMO’s previous discount rate
assumptions.
Table 2 Comparison of real discount rate ranges
Discount rate AEMO’s 2020 ISP discount rate
AEMO’s 2021 Inputs, Assumptions and
Scenarios
Synergies’ recommended discount rates (rounded)
Central 5.9% 4.8% 5.58%
Upper bound N/A N/A 7.30%
Lower bound (AER) N/A N/A 2.18%
Slow Change scenario 7.9% 3.8% 5.58% (as per Central rate)
Note: The AER’s latest WACC decisions have been adjusted to reflect an on-the-day cost of debt calculation
Source: Various AEMO and AER publicly available documentation
Table 2 indicates that our recommended central discount rate of 5.6% is somewhat
higher but consistent with AEMO’s 2021 estimate of 4.8%. As noted above, we have
recommended that AEMO should apply the same central discount rates across its five
modelled scenarios.
External discount rate benchmarks
Australian policy makers have generally applied discount rates in CBA applied to major
public infrastructure projects based on the social opportunity cost of capital as we have
done. However, in applying this approach, a default discount rate of 7% in real pre-tax
terms has become entrenched since around 1989, with an upper bound estimate of 10%
and a lower bound estimate of either 3% or 4%.
We have found no substantiation of this 7% estimate in the recent government agency
CBA documents that we have reviewed for this report, including the Office of Best
Practice Regulation in its most recent cost benefit analysis guidance.5 However, it is
reasonable to assume that it primarily reflects the materially higher government bond
rates applying in the late 20th century compared to now.
We concur with other practitioners, including the Grattan Institute, that a central
discount rate of 7% (in pre-tax real terms) as currently applied by several Australian
government agencies (including Infrastructure Australia) is too high given our
assessment of the systematic risks associated with private sector investments in
Australia’s NEM and contemporary international (including Australian) financial and
5 Office of Best Practice Regulation (2020), Cost benefit analysis, Guidance Note, (March), pp 7-8

DISCOUNT RATES FOR USE IN COST BENEFIT ANALYSIS OF AEMO'S 2022 INTEGRATED SYSTEM PLAN Page 8 of 72
share market conditions.6 We note that the 7% discount rate estimate has no regard for
systematic risk in the Australian electricity sector, which is what our application of the
social opportunity cost of capital approach to estimating the discount rate requires us to
do.
6 Grattan Institute (2018), Unfreezing discount rates, Transport infrastructure for tomorrow, February

DISCOUNT RATES FOR USE IN COST BENEFIT ANALYSIS OF AEMO'S 2022 INTEGRATED SYSTEM PLAN Page 9 of 72
Contents
Executive Summary 3
Our approach 3
Our recommended discount rate range 4
Comparison of discount rates 7
Contents 9
1 Introduction 11
2 Purpose of CBA and role of discount rate 13
2.1 Different approaches to calculating discount rates 13
2.2 Current Australian discount rate practice 14
3 Background 19
3.1 Role of CBA in ISP 19
3.2 Key requirements imposed on AEMO 20
3.3 AEMO’s 2020 ISP discount rates 21
3.4 Proposed 2021 ISP discount rates 21
4 Key technical issues for resolution 23
4.1 Discount rate for generation and transmission investments 23
4.2 How should benefits be assessed in NPV terms? 24
4.3 Differential discount rates for alternative scenarios? 24
4.4 Different discount rates for investments involving government funding?
25
4.5 Capturing modelled benefits and costs 26
4.6 Summary of recommended approach 27
5 Establishing recommended discount rate range 28
5.1 Summary of proposed discount range 28
5.2 Key differences between estimates 29
5.3 Comparison to other contemporary Australian discount rates 32
5.4 Conclusion 34

DISCOUNT RATES FOR USE IN COST BENEFIT ANALYSIS OF AEMO'S 2022 INTEGRATED SYSTEM PLAN Page 10 of 72
A. Discount rate estimation details 35
B. List of beta comparators 54
Figures and Tables
Figure 1 Commonwealth Government bond yields, 1995-present 16
Figure 2 Post-tax TMRs implied by independent expert reports 40
Figure 3 AER’s inflation forecasting approach’s performance compared to break
even approach 53
Table 1 Discount rate estimates for lower, central and upper bounds 4
Table 2 Comparison of real discount rate ranges 7
Table 3 Discount rate assumptions adopted by statutory bodies in Australia 15
Table 4 Discount rate estimates for lower, central and upper bounds 28
Table 5 Recent AER WACC determinations 31
Table 6 MRP estimate 39
Table 7 Asset beta estimates by sub-industry 43
Table 8 Gearing estimates by sub-industry 44
Table 9 Credit ratings for selected listed energy businesses 45
Table 10 Gamma positions adopted by Australian regulators 47
Table 11 Proportion of equity ownership – Institutions & Strategic Holders &
Individuals/Insiders 50
Table 12 Proportion of equity ownership – Unlisted infrastructure transactions 50
Table 13 May 2021 break-even inflation estimates 53
Table B.1 Summary of beta comparators 54

AEMO
DISCOUNT RATES FOR USE IN COST BENEFIT ANALYSIS OF AEMO'S 2022 INTEGRATED SYSTEM PLAN Page 11 of 72
1 Introduction
Synergies has been engaged to provide advice to AEMO in support of the establishment
of a discount rate to be used in the cost benefit analysis (CBA) for the 2022 Integrated
System Plan (ISP), as well as upper and lower bounds for the purpose of sensitivity
testing. Our recommended discount rate must be developed having regard to the
Australian Energy Regulator’s (AER’s) CBA requirements, including being consistent
with private enterprise investment in the electricity sector across Australia’s National
Electricity Market (NEM).7
In developing the discount rate range, AEMO is seeking guidance on:
• the suitable underlying assumptions for these rates, including the investment/asset
type that has been used;
• whether the discount rates are appropriate across all scenarios that AEMO is
modelling, most notably in relation to differing economic growth and
decarbonisation assumptions;
• to what extent the discount rates should be used to manage uncertainty over
predicted costs and benefits and if so, clearly and transparently provide reasoning
and supporting evidence;
• the appropriate discount rate to be applied to calculate annuity amounts of costs
and benefits for the term of AEMO’s cash flow analysis, including the suitability of
a single discount rate to be applied in calculating the equivalent annuities for
generation and transmission investments; and
• whether investments under government contracts should be treated differently.
As part of the development of this final report, Synergies has attempted to thoroughly
address feedback on our draft report received from AEMO’s ISP Consumer Panel, AER
staff, Clean Energy Finance Corporation (CEFC) and Transmission Network Service
Providers (TNSPs), via the Executive Joint Planning Committee.
The remainder of this report is structured as follows:
• Chapter 2 briefly explains the purpose of applying CBA and associated discount
rates in the context of major infrastructure investments and specifically the ISP;
7 AER (2020), Cost benefit analysis guidelines, Guidelines to make the Integrated System Plan actionable, August
AEMO
DISCOUNT RATES FOR USE IN COST BENEFIT ANALYSIS OF AEMO'S 2022 INTEGRATED SYSTEM PLAN Page 12 of 72
• Chapter 3 summarises relevant information that AEMO must have regard to in its
use of discount rates in the CBA applied to the ISP, including the requirements of
the AER’s CBA Guidelines;
• Chapter 4 presents our analysis of key technical issues identified by AEMO (noted
above) that require resolution in determining the discount rate range;
• Chapter 5 presents our recommended central, upper and lower bound discount
rates; and
• Attachment A provides additional details of how we have calculated our
recommended discount rates;
• Attachment B provides a list of the entities used in the development of our asset
beta and gearing ratio assumptions to estimate the return on equity component of
the recommended discount rates.

AEMO
DISCOUNT RATES FOR USE IN COST BENEFIT ANALYSIS OF AEMO'S 2022 INTEGRATED SYSTEM PLAN Page 13 of 72
2 Purpose of CBA and role of discount rate
Cost benefit analysis is an important tool used for appraising the net economic impact
of an investment project or program (such as the ISP) based on a comparison of its
economic benefits and costs.
CBA can assist to determine whether the investment represents an efficient use of
resources through provision of a net benefit when seen from a societal perspective,
including the investment proponents, consumers of the service provided by the
investment, and society more generally.
In the context of the NEM, the National Electricity Objective (NEO) is focussed on
promoting efficient investment in, and efficient operation and use of, electricity services
for the long term interests of consumers of electricity. This objective provides the societal
perspective to the CBA that is being applied to the ISP.
2.1 Different approaches to calculating discount rates
In CBA, the discount rate reflects the time value of money and allows present and future
cost and benefits to be considered on an equivalent basis, where future cash flows are
discounted back to present dollar terms. This is particularly important where the costs
and benefits extend over a long period as is the case with the ISP, which is modelled out
to 2050.
2.1.1 Alternative time preference and social opportunity cost approaches
The need to discount the identified costs and benefits of the ISP can be viewed from two
main perspectives, both of which focus on the opportunity cost of the respective cost and
benefit cash flows:
• Time preference, including private time preference and social time preference.
• Social opportunity cost of capital (also known as producer rate of discount).8
Following CBA valuation principles, the rate of discount of future consumption should
reflect the consumption time preferences of individuals. This private time preference
recognises that society values current consumption over future consumption and that
an individual will require compensation for forgoing present consumption. In other
words, a dollar today is worth more to someone than a dollar tomorrow.
8 Abelson P. and Dalton T. (2018), Choosing the Social Discount Rate for Australia,
http://www.appliedeconomics.com.au/publications/papers/cost-benefit-analysis/2017-choosing-social-discount-rate-for-australia.htm#TopOfPage

AEMO
DISCOUNT RATES FOR USE IN COST BENEFIT ANALYSIS OF AEMO'S 2022 INTEGRATED SYSTEM PLAN Page 14 of 72
Social time preference is a variant on private time preference and attempts to derive
time-based weights that maximise social welfare rather than private welfare over time.
In contrast, the social opportunity cost of capital recognises that any given investment
may occur at the expense of alternative investments in the economy, as capital is
constrained but mobile. This is important in the context of the ISP given potential future
Australian and international investors in the NEM will be selecting amongst a wide
range of energy and non-energy investment opportunities across the world. Hence, only
future ISP-related investments that are assessed to provide a net social benefit should
proceed because they would be consistent with achieving productive use of scarce
resources (economic efficiency) and the NEO.
Following normal valuation principles, the forecast stream of consumption benefits
should be discounted by the consumer private rate of discount (PTPR), or possibly by
the social rate of discount (STPR) where the impacts are intergenerational. In contrast,
economic efficiency requires that the return on each investment project should be at least
as high as the return on alternative projects in the private or public sector.
In a perfectly competitive capital market, the PTPR would equal the investor's
opportunity cost of capital for the relevant investment project. However, the opportunity
cost of capital typically exceeds time preference rates due to market distortions such as
tax on returns to capital, risk associated with general economic conditions (i.e. systematic
risk) and transaction costs.9
While there are differing views amongst CBA practitioners on whether a time preference
or opportunity cost of capital approach is most appropriate, using a discount rate based
on the opportunity cost of capital would align closely with the efficiency basis of the
NEO and is also the preferred conceptual basis of discount rates used by Australian
government agencies, including for major public and private infrastructure projects. For
this reason, we will use the opportunity cost of capital approach to determine our
recommended discount rate.
Australian CBA practice regarding discount rates is discussed further in the next section.
2.2 Current Australian discount rate practice
As noted above, Australian policy makers have generally applied discount rates in CBA
that are based on the social opportunity cost of capital.
9 NSW Treasury (2017), NSW Government Guide to Cost-Benefit Analysis, March, p 43

AEMO
DISCOUNT RATES FOR USE IN COST BENEFIT ANALYSIS OF AEMO'S 2022 INTEGRATED SYSTEM PLAN Page 15 of 72
As shown in Table 3 below, a 7% real pre-tax WACC with an upper bound of 10%, and
a lower bound of either 3% or 4%, has been endorsed by various government statutory
bodies citing past precedent for support.10 In practice, this has become the default
discount rate range used for CBA applied to major public infrastructure projects in
Australia over a long period.11 We have found no substantiation of the 7% estimate in
the government agency CBA documents that we have reviewed.
Table 3 Discount rate assumptions adopted by statutory bodies in Australia
Statutory body Discount rate assumptions
Infrastructure Australia - Assessment Framework (2021)
Infrastructure Australia requests appraisal summary results be presented for the following real discount rates:
- 4 per cent per annum
- 7 per cent per annum (for the central case)
- 10 per cent per annum
Australian Government – Office of Best Practice Regulation (OBPR) – March 2020 CBA Guidance Note
OBPR requires the calculation of net present values (NPVs) at an annual real discount rate of 7 per cent.
For sensitivity analysis, NPVs should also be calculated with real discount rates of 3 per cent and 10 per cent.
OBPR noted that this is consistent with NSW Treasury precedent, as well as a 2003 United States Office of Management and Budget report.
(Based on a 2010 Productivity Commission research paper, OBPR will also accept analyses that use a central real discount rate of 8 per cent, with sensitivity analysis at 3 per cent and 10 per cent.)
Victorian Department of Treasury and Finance - 2013 Technical Guidelines on Economic Evaluation
4% discount rate for provision of goods and services in traditional core public service delivery areas where benefits are not easily quantifiable in monetary terms (e.g. education, public health and justice).
7% discount rate when benefits are more easily monetized (e.g. public transport, roads and housing).
Otherwise, commercial investments require consultation with the Department to determine the appropriate discount rate.
NSW Government - Guide to Cost-Benefit Analysis (2017)
The recommended social discount rate is 7 per cent (in real terms). Sensitivity testing should be undertaken at 3 per cent and 10 per cent (in real terms).
Building Queensland - Cost Benefit Analysis Guide, Supplementary Guidance Release 2 (2016)
Central case is to be calculated using a discount rate of 7 per cent, with 4 and 10 per cent applied to sensitivity testing.
Source: Infrastructure Australia, Australian Government – Office of Best Practice Regulation (OBPR), Victorian Department of Treasury
and Finance, NSW Government, Building Queensland.
10 A real pre-tax WACC means that the cost of capital is expressed in inflation-adjusted and before tax-adjusted terms.
11 In fact, a standard discount rate of 7 per cent was first incorporated into official guidance back in 1989, when the NSW Government stipulated this rate for cost-benefit analysis and cost-effectiveness analysis. Refer: Douglas, N. and Brooker, T. (2013). “A Review of Transport Project Appraisal in NSW Australia”. Australasian Transport Research Forum 2013. Available from: https://www.australasiantransportresearchforum.org.au/sites/default/files/ 2013_douglas_brooker.pdf.
AEMO
DISCOUNT RATES FOR USE IN COST BENEFIT ANALYSIS OF AEMO'S 2022 INTEGRATED SYSTEM PLAN Page 16 of 72
Internationally, approaches and discount rates vary, but fall broadly under two
categories:
• Social opportunity cost of capital approaches that result in a base discount rate of
around 7-8%. These include New Zealand (8%), Canada (8%) and the US Office of
Management and Bureau (7%).
• Social time preference rate approaches that result in a base discount rate under 5%.
These include the UK (3.5%), US Environmental Protection Agency (2-3%),
European Commission (3%), France (4.5%) and Sweden (3.5%).
Despite the long-standing Australian practice of a 7% real discount rate, we consider that
there are now strong grounds for using a lower discount rate, especially given financial
market conditions that have presented since the Global Financial Crisis and persist.
In this regard, Australian government bond yields have fallen dramatically in recent
years, even before the onset of the COVID-19 pandemic, as shown in Figure 1 below.
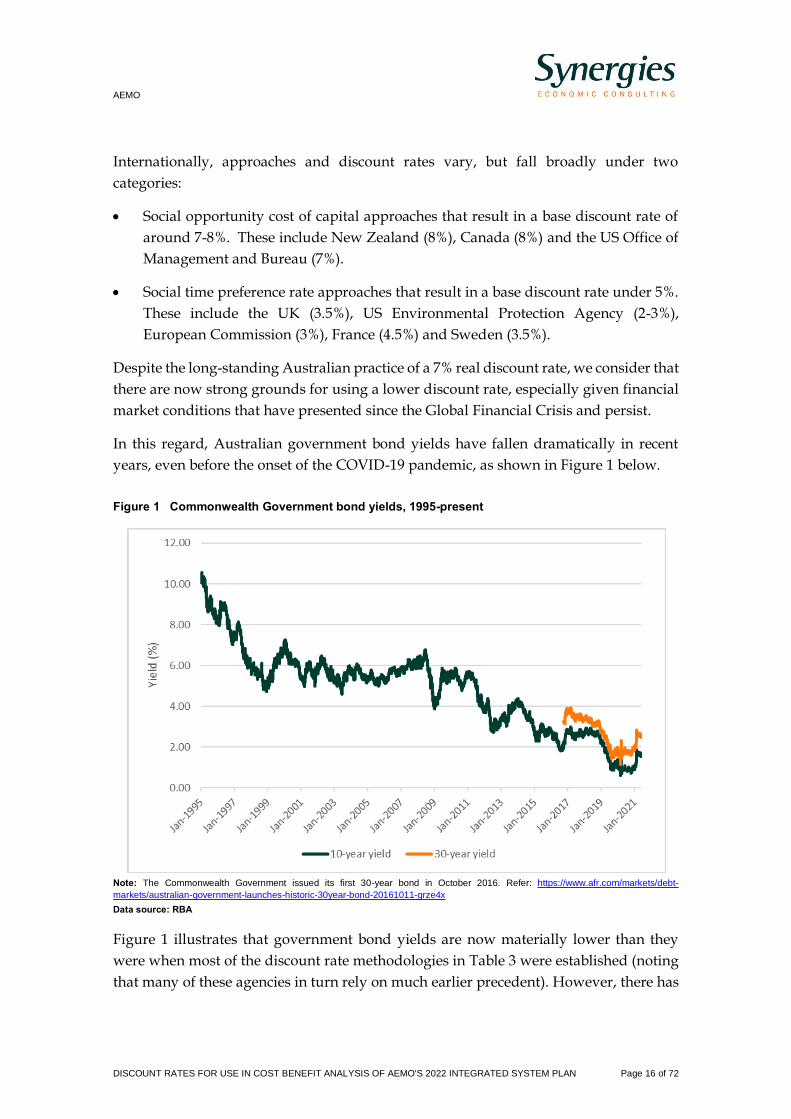
Figure 1 Commonwealth Government bond yields, 1995-present
Note: The Commonwealth Government issued its first 30-year bond in October 2016. Refer: https://www.afr.com/markets/debt-
markets/australian-government-launches-historic-30year-bond-20161011-grze4x
Data source: RBA
Figure 1 illustrates that government bond yields are now materially lower than they
were when most of the discount rate methodologies in Table 3 were established (noting
that many of these agencies in turn rely on much earlier precedent). However, there has

AEMO
DISCOUNT RATES FOR USE IN COST BENEFIT ANALYSIS OF AEMO'S 2022 INTEGRATED SYSTEM PLAN Page 17 of 72
been no corresponding fall in the discount rates that government agencies apply in their
CBA analysis. As a result, the impact of lower borrowing costs is not being reflected in
Australian public project evaluations.
It should be noted that a 7% real discount rate values $100 of consumption in 20 years’
time as equivalent to only $26 today (compared to $34 today if a 5.58% real discount rate
is used), which implies a large discount on the value of future consumption compared
to current consumption. In other words, it assumes a high real cost for both foregone
consumption (the private or social time preference rate) and foregone investment (the
social opportunity cost of capital), whereas foregone consumption is recognised to have
a lower real cost than foregone investment.
When time preference rates are applied to benefits foregone, as well as to benefits gained,
an investment project (or program) will show a positive net benefit only if the project
passes the relevant social opportunity cost discount rate test. Hence, it is simpler to
apply a social opportunity cost discount rate, but it must be reflective of the current
opportunity cost of capital given prevailing financial and share market conditions.12 A
7% real discount rate originally set around 1989 is unlikely to meet this intent.
There are several implications of not reducing the discount rate in line with changing
financial and share market conditions. Firstly, an unnecessarily high discount rate will
mispresent the opportunity cost of capital such that some projects will be assessed as not
worth pursuing when they would be assessed as worthwhile under a lower discount
rate.
Another implication of persistently high discount rates is that they may distort the
ranking of potential projects.13 Consequently, projects with longer lives may be assigned
a lower priority than would have been the case with a lower discount rate. Projects with
deferred benefits are usually the most disadvantaged by a higher discount rate. This is
of specific relevance to the ISP, where large amounts of investment are required to
deliver benefits that will accrue to electricity consumers in the long term.
2.2.1 Basis of social opportunity cost of capital for ISP’s CBA
As previously noted, the social opportunity cost of capital approach establishes a
discount rate for a project with reference to what would have been the next-best
alternative with the same risk. The weighted average cost of capital (WACC) reflects the
12 Abelson P. (2019), Cost Benefit Analysis, unpublished
13 Terrill, M. and Batrouney, H. (2018). Unfreezing discount rates: transport infrastructure for tomorrow. Grattan Institute. Available from: https://grattan.edu.au/wp-content/uploads/2018/02/900-unfreezing-discount-rates.pdf

AEMO
DISCOUNT RATES FOR USE IN COST BENEFIT ANALYSIS OF AEMO'S 2022 INTEGRATED SYSTEM PLAN Page 18 of 72
weighted average return on a company’s debt and equity financing and is the preferred
method of estimating the social opportunity cost of capital in Australia.
In terms of the WACC, notwithstanding its technical limitations, the most used model
to value the equity return for cost of capital and valuation purposes is the Capital Asset
Pricing Model (CAPM). Its key components are the risk free rate and equity risk
premium (measured in terms of the riskiness of the investment relative to market risk).
Australian Government bond yields are used as a proxy for the risk-free rate when
estimating the return on equity and debt. In a 2018 report on the implications of high
discount rates, the Grattan Institute concluded that “there is no justification for
government authorities to assume that the risk-free component of their discount rate is
greater than the current real yield on 10-year Commonwealth bonds.”14 The less heavily
traded and newer 30-year Commonwealth bond yield, which is possibly more relevant
for long-life assets (such as those in the ISP), is also at comparatively low levels.
The equity risk premium assumes that a specific investment reflects systematic (non-
diversifiable) risk, which is based on the relationship between the returns on the
investment compared to the market return over time. The component of the equity risk
premium relating to the market is the market risk premium and the component specific
to the investment is its equity beta reflecting its assumed gearing (ratio of det funding)
and underpinned by an asset beta solely reflecting its business risk.
In the context of the ISP and the AER’s CBA Guidelines, the key implication is that the
equity risk premium and specifically the equity and asset betas should reflect a ‘private
investment in the electricity sector across the NEM’.
The CBA and associated discount rate requirements AEMO must have regard to in
relation to the ISP are discussed in Chapter 3 of our report. Our application of the social
opportunity cost of capital approach to determine the discount rate range for AEMO’s
ISP CBA is then discussed in Chapter 4 of our report with additional details provided
on our approach in Attachment A.
14 Terrill, M. and Batrouney, H. (2018). Unfreezing discount rates: transport infrastructure for tomorrow. Grattan
Institute, p.14. Available from: https://grattan.edu.au/wp-content/uploads/2018/02/900-unfreezing-discount-rates.pdf
AEMO
DISCOUNT RATES FOR USE IN COST BENEFIT ANALYSIS OF AEMO'S 2022 INTEGRATED SYSTEM PLAN Page 19 of 72
3 Background
In developing the discount rate(s) for its ISP CBA, AEMO is subject to binding
requirements under section 3.2.1 of the AER’s CBA Guideline, as well as supplementary
discretionary guidance provided by the AER.
This chapter identifies the nature of this guidance, which Synergies must have regard to
in recommending our discount rates for the 2022 ISP.
3.1 Role of CBA in ISP
The ISP is a co-ordinated whole-of-system plan that provides a roadmap for the efficient
development of the National Electricity Market (NEM) entailing combinations of
sequenced electricity generation and transmission network investments in the long term
interests of consumers, in the period up to 2050.
This investment plan is modelled using a scenario planning approach, with alternative
scenarios investigating different spreads of the drivers for future needs and investments
in the energy system. This includes influences such as the growth in grid-scale renewable
generation, the uptake of distributed energy resources (DER), which are smaller scale
renewables like rooftop solar PV, and the level and breadth of Australia’s
decarbonisation policies.15
In 2019, as part of a broader reform led by the Energy Security Board (ESB), the
Australian Energy Regulator (AER) developed guidelines to make the ISP actionable,
including a new cost benefit analysis guideline.16 The guidelines will come into effect
through AEMO’s 2022 ISP.
The ISP ‘actions’ key projects by triggering Regulatory Investment Test (RIT–T)
applications. The RIT–T is a cost benefit analysis that transmission businesses must
perform and consult on before making major investments in their networks. Cost benefit
analysis also forms an important part of AEMO’s demonstration of the net benefits of
the ISP.
15 The five scenarios are: Steady Progress; Net Zero 2050; Slow Change; Step Change; and Hydrogen Superpower.
Attachment A provides more details on each of these scenarios.
16 AER (2020), Cost benefit analysis guidelines, Guidelines to make the Integrated System Plan actionable, August

AEMO
DISCOUNT RATES FOR USE IN COST BENEFIT ANALYSIS OF AEMO'S 2022 INTEGRATED SYSTEM PLAN Page 20 of 72
3.2 Key requirements imposed on AEMO
3.2.1 Binding guidance
The AER’s CBA Guideline requires that the discount rate in the ISP is required to be
appropriate for analysis of ‘private investment in the electricity sector across the NEM’.
To this end, the benchmark entity used to estimate the discount rate and WACC should
be a private entity that is making investments in the NEM.
Further, the discount rate must be expressed as a real, pre-tax rate given ISP modelling
is undertaken in real dollar terms.
Our discount rate range has been developed in accordance with this binding guidance
and is discussed in Chapter 5 and Attachment A of our report.
3.2.2 Discretionary guidance
We have also had close regard to the AER’s discretionary guidance in developing our
discount rate range. Key aspects of the discretionary guidance are that:
• the discount rate should reflect the systematic risk associated with expected cost
and market benefit cash flow streams over the life of the projects in any assumed
ISP development path;
− our use of the social opportunity cost of capital approach discussed in
Chapter 2 is consistent with discount rates being reflective of systematic risks
of expected ISP-related cost and market benefit cash flow streams;
• the lower bound discount rate should be the regulated cost of capital based on
the AER’s most recent regulatory determination at the time of the final ISP;
− our lower bound discount rate is based on the AER’s Victorian distribution
network final determinations released on 30 April 2021 and AusNet Services
draft transmission determination released on 30 June 2021, which is discussed
in section 5.2.3 of our report;
• the discount rate should not generally be used to manage uncertainty over
predicted costs and benefits, with best practice suggesting that such uncertainty
should be captured through sensitivity testing and scenario analysis;
− we concur with the AER’s view and explain our reasons in section 4.2 of our
report; and
• the choice of discount rate should promote competitive neutrality between
network and non-network options in a development path;

AEMO
DISCOUNT RATES FOR USE IN COST BENEFIT ANALYSIS OF AEMO'S 2022 INTEGRATED SYSTEM PLAN Page 21 of 72
− we interpret this guidance to mean that the central discount rate should be set
at a level that has a neutral effect on network and non-network options
identified in the ISP development paths, which in practice means setting the
central discount rate above the regulated cost of capital approved by the AER
for transmission (and distribution) network service providers;
▪ we discuss this issue further in section 4.5 of our report.
3.3 AEMO’s 2020 ISP discount rates
AEMO used the following WACC-based discount rates in its CBA for the 2020 ISP:17
• 5.90% (real, pre-tax) applied to electricity generation and transmission costs to
create annualised cost estimates for projects of varying sizes and timing across
the assumed planning period;
• 5.90% (real, pre-tax) applied as the discount rate in the CBA modelling to
determine net benefits of the identified development paths for all scenarios
except Slow Change;
• 7.90% (real, pre-tax) for the Slow Change scenario to reflect in AEMO’s words a
‘more challenging’ economic environment;
o this two percentage point uplift was not substantiated by AEMO other
than that this scenario’s settings are associated with lesser available
capital and weaker investment.
The RIT-T is an electricity transmission network investment planning CBA framework
that all networks must apply when planning network augmentations and replacements.
Importantly, the ISP includes transmission network projects that already have been, or
will in future be, subject to the RIT-T CBA framework. In other words, there is a
consistency issue associated with the ISP and RIT-T CBA frameworks.18
3.4 Proposed 2021 ISP discount rates
In December 2020, AEMO released its Draft 2021 Inputs, Assumptions and Scenarios
Report regarding the development of its 2021 ISP.
AEMO indicated that it proposed to apply the same methodology in calculating a
proposed update to the discount rate as in the 2020 ISP, although it has changed several
17 All CBA modelling is undertaken in real not nominal terms.
18 The RIT-T does not apply to electricity generation investments.

AEMO
DISCOUNT RATES FOR USE IN COST BENEFIT ANALYSIS OF AEMO'S 2022 INTEGRATED SYSTEM PLAN Page 22 of 72
parameters to reflect current market conditions, including updating the risk-free rate,
forecast inflation and cost of debt to the values provided in the AER’s December 2020
Rate of Return Annual Update. AEMO’s proposed 2021 discount rate values are:
• a real, pre-tax WACC of 4.8%; and
• a lower real, pre-tax WACC of 3.8% for the Slow Growth scenario
− this can be contrasted with the 2 percentage point uplift for Slow Change
scenario in the 2020 ISP.

AEMO
DISCOUNT RATES FOR USE IN COST BENEFIT ANALYSIS OF AEMO'S 2022 INTEGRATED SYSTEM PLAN Page 23 of 72
4 Key technical issues for resolution
The purpose of this chapter is to assess and present our position on several key technical
issues identified by AEMO that require resolution in determining the discount rate for
the 2022 ISP.
4.1 Discount rate for generation and transmission investments
The key issue is whether two discount rates are required to accurately capture the
different systematic risks and uncertainties of ISP investments in generation/storage
and transmission network recognising the AER’s requirement that the CBA should relate
to ‘private enterprise investment in the electricity sector across the NEM’.
A related issue is the AER’s discretionary guidance that the choice of discount rate(s)
should promote competitive neutrality between network and non-network options in a
development path.
In performing CBA there is an inevitable trade-off between accuracy (which can
sometimes be unrealistic to achieve given data limitations) and efficacy (in the sense of
avoiding unnecessary complexity). The key factor driving discount rates for current
purposes will be systematic risk – hence if there are material differences between the
systematic risk of classes of investment (say between generation and transmission), then
these differences could, in principle, be reflected in the discount rates for those classes.
Based on our analysis, generation and/or storage investments, including the latter that
could be used as a non-network option to meet an identified network investment need,
and that are made in a competitive market exhibit higher systematic risk than regulated
transmission investments. However, the use of two discount rates is likely to be
problematic given the ISP represents various combinations of transmission and
generation investment such that the systematic risks associated with the ISP is likely to
fall somewhere between those of transmission and generation/storage investments. We
are also aware that Australian RIT-T precedent has been to apply a single discount rate
in CBAs applied to transmission investments that is higher than the regulated WACC,
reflecting the potential for competitive non-network solutions to be identified in the
CBA.
Given these considerations, we believe it is open to AEMO to use a single or dual
discount rate framework for the ISP. However, we recommend use of a single discount
rate in annualising and calculating the NPV of the ISP’s transmission and
generation/storage net benefits recognising that different mixes of generation/storage
and transmission investments will be modelled by AEMO for the optimal investment
pathways across the various scenarios. In practice, it is more important to test net benefit

AEMO
DISCOUNT RATES FOR USE IN COST BENEFIT ANALYSIS OF AEMO'S 2022 INTEGRATED SYSTEM PLAN Page 24 of 72
sensitivities using the discount range rather than attempting to apply different discount
rates within modelled scenarios based on assumed different mixes of investment type.
In so doing, we also consider this approach will be consistent with promoting
competitive neutrality between network and non-network options in a development
path provided the central discount rate estimate is higher than the AER’s regulated
WACC.
4.2 How should benefits be assessed in NPV terms?
In general, it should be noted that the estimated future benefits are avoided costs
reflecting identification of an optimal ISP investment path compared to a base case ISP
investment path under each scenario (so in essence its differential costs that are under
consideration as the demand of different scenarios and the reliability associated with
meeting that demand are uniform).
However, benefits can differ between scenarios because the parameters that vary across
scenarios may influence the need, timing, and value of investments. The question is how
these benefits are addressed between scenarios.
It has also been contended that the benefits under different scenarios are inherently more
uncertain. However, uncertainty surrounding the benefits should be addressed by
estimating the mean benefit and where appropriate sensitivity testing and scenario
analysis – uncertainty in and of itself does not affect the discount rate.
Hence, we recommend the discount rate for these benefits should be the same
opportunity cost of capital-based discount rate applied to costs noting that the
application of upper and lower bound discount rates provides sensitivity testing of the
respective benefits between alternative scenarios.
4.3 Differential discount rates for alternative scenarios?
The key issue is whether adjustments should be made to social discount rates to reflect
different assumptions in the different modelled ISP scenarios, including a different
discount rate in the Slow Change scenario compared to the other scenarios (reflecting
potentially beta sensitivity or risk differences).
In our view, all else being the same, from a first principles perspective, it is likely that
higher growth in an asset class relative to the economy as a whole can indicate greater
systematic risk for that class – although this factor is unlikely to be large in and of itself
and be affected by many other factors in practice. Moreover, measuring (and properly
isolating) the impact of differential growth on beta is very problematic in practice.

AEMO
DISCOUNT RATES FOR USE IN COST BENEFIT ANALYSIS OF AEMO'S 2022 INTEGRATED SYSTEM PLAN Page 25 of 72
Moreover, it is but one of many factors that could cause beta values (or gearing) to
change. Hence, adjustment for the differing assumptions about the expected rate of
growth is not recommended. As noted above, in our view, the most appropriate
approach will be to adopt a single discount rate for costs (ie transmission, generation)
and benefits and maintain it, subject to any sensitivity analysis that is undertaken.
4.4 Different discount rates for investments involving government funding?
Another issue is whether ISP-related infrastructure investments made under
government contracts should be treated differently in the ISP’s CBA.
Again, this depends on a first principles analysis, but all else being the same, it is possible
that Government contracts can lower risk for generation and transmission investments.
To what extent relative to a typical bankable project will vary with the project and again
it would be difficult to distinguish discount rates on this factor alone.
However, more importantly, as discussed in section 2.1.1 of our report, regardless of
whether ISP investment projects are funded privately or by government, these
investments will use finite societal financial and non-financial resources that could have
been directed to other uses, including investments in other sectors of the Australian (or
international) economy. In other words, there is an opportunity cost associated with ISP
investments regardless of funding source. Hence, applying different discount rates
would be contrary to the social opportunity cost basis of the discount rates that we are
estimating.
The Office of Best Practice provides support for our position:19
While it is true that the government can raise funds at the lower bond rate, it is the
opportunity cost of those funds (the alternative uses to which the funds could have
been put) that is important, rather than the funding costs, in considering the social
impact.
Further to the issue of potential government-funded ISP investment projects, the ISP
Consumer Panel has drawn our attention to the NSW Electricity Roadmap and the cost
of capital estimates developed by National Australia Bank (NAB) that are being applied
in the process.20 We have reviewed the NAB report and provide our observations about
its cost of capital estimates in section 5.3.3 of our report.
19 Office of Best Practice (2020), Cost benefit analysis, Guidance Note, (March), p 14
20 NAB (2020), NSW Electricity Infrastructure Roadmap, Weighted Average Cost of Capital Report (November)

AEMO
DISCOUNT RATES FOR USE IN COST BENEFIT ANALYSIS OF AEMO'S 2022 INTEGRATED SYSTEM PLAN Page 26 of 72
However, it is important to note that the underlying private investment de-risking
assumptions inherent in the NAB cost of capital estimates due to the proposed Electricity
Roadmap regulatory framework are not relevant in estimating a social opportunity cost
of capital discount rate because the NSW framework will essentially partly re-allocate
the systematic risks of investments in the NSW electricity sector to NSW taxpayers
and/or electricity consumers but will not reduce or remove these risks. What is required
here is a discount rate appropriate for the whole of the NEM.
Given the above analysis, it is recommended that no adjustment be made to discount
rates to reflect the government funding factor or to reflect investments made under the
NSW Electricity Roadmap.
4.5 Capturing modelled benefits and costs
AEMO sought our advice on how best to apply the recommended discount rate range
in its 2022 ISP cost benefit analysis, including the potential need for a terminal value to
be applied, recognising that AEMO currently annualises generation and transmission
costs in its cost benefit analysis and that the primary source of modelled benefits is
avoided annualised costs.
We consider that AEMOs current annualisation of costs and benefits across the assumed
planning period (by including a return on and of capital of the investments in each year
of the period) is a reasonable substitute for use of a terminal value in its cost benefit
analysis, subject to choosing an appropriate length of planning period.
We consider the choice of ISP planning period is likely to be most critical in ensuring
that most costs and benefits are captured (recognising the diminishing effect of
discounting as the period lengthens) and that relativities of identified costs and benefits
between modelled optimal development paths do not change materially. This suggests
that AEMO may need to consider a longer planning period if this captures the time when
a preferred option stabilises in terms of its net benefits. We are aware of different
assessment periods being applied across RIT-Ts including up to 50 years for the 2014
QNI RIT-T undertaken by Transgrid and Powerlink.
Overall, we consider that AEMO should maintain its current annualisation approach
subject to exercising judgment regarding the length of modelled planning period
necessary to ensure capture of most net benefits across identified optimal development
paths assuming a steady state.

AEMO
DISCOUNT RATES FOR USE IN COST BENEFIT ANALYSIS OF AEMO'S 2022 INTEGRATED SYSTEM PLAN Page 27 of 72
4.6 Summary of recommended approach
It is possible to adopt a single discount rate or dual discount rate approach (in which
different discount rates are applied to different classes of investment expenditure).
However, a dual discount rate will introduce material complexity for what might be a
limited gain in accuracy in practice. On balance, a single discount rate is preferred (with
upper and lower bounds for sensitivity purposes).
On the assumption that a single discount rate is preferred, it should be applied to both
costs (to annualise the costs and derive the NPV of these costs) and benefits in the CBA.
Sensitivity testing should be undertaken using the lower and upper bound discount
rates across scenarios having regard to different combinations of generation and
transmission investment in identified optimal development paths compared to the base
case. This is particularly the case given the divergent views of stakeholders on the
appropriate discount rate range.
In accordance with the AER’s CBA Guidelines, the central, lower and upper bound
discount rates would be determined as follows:
• Central discount rate – a WACC-based estimate reflecting an average investor
view about required returns on investments in the NEM.
• Lower bound discount rate – a recent regulated WACC as determined by the
AER for electricity transmission or distribution networks.
• Upper bound discount rate – a WACC estimate reflecting a more risk sensitive
view about required returns on private investments in the NEM, including
generation and storage investments.
Recognising that there is more than one way to calculate discount rates, if the sensitivity
analysis reveals that the choice of discount rate is important (ie it changes the sign of the
investment project’s or program’s net present value or its ranking against alternative
projects), then more consideration should be given to the choice of an appropriate rate.21
21 Productivity Commission (2010), Valuing the Future: the social discount rate in cost-benefit analysis, Visiting
Researcher Paper, Mark Harrison, April, p 14
AEMO
DISCOUNT RATES FOR USE IN COST BENEFIT ANALYSIS OF AEMO'S 2022 INTEGRATED SYSTEM PLAN Page 28 of 72
5 Establishing recommended discount rate range
The purpose of this chapter is to summarise how we have developed our recommended
discount rate range. A more detailed explanation of the basis of our calculations is
presented in Attachment A of this paper.
5.1 Summary of proposed discount range
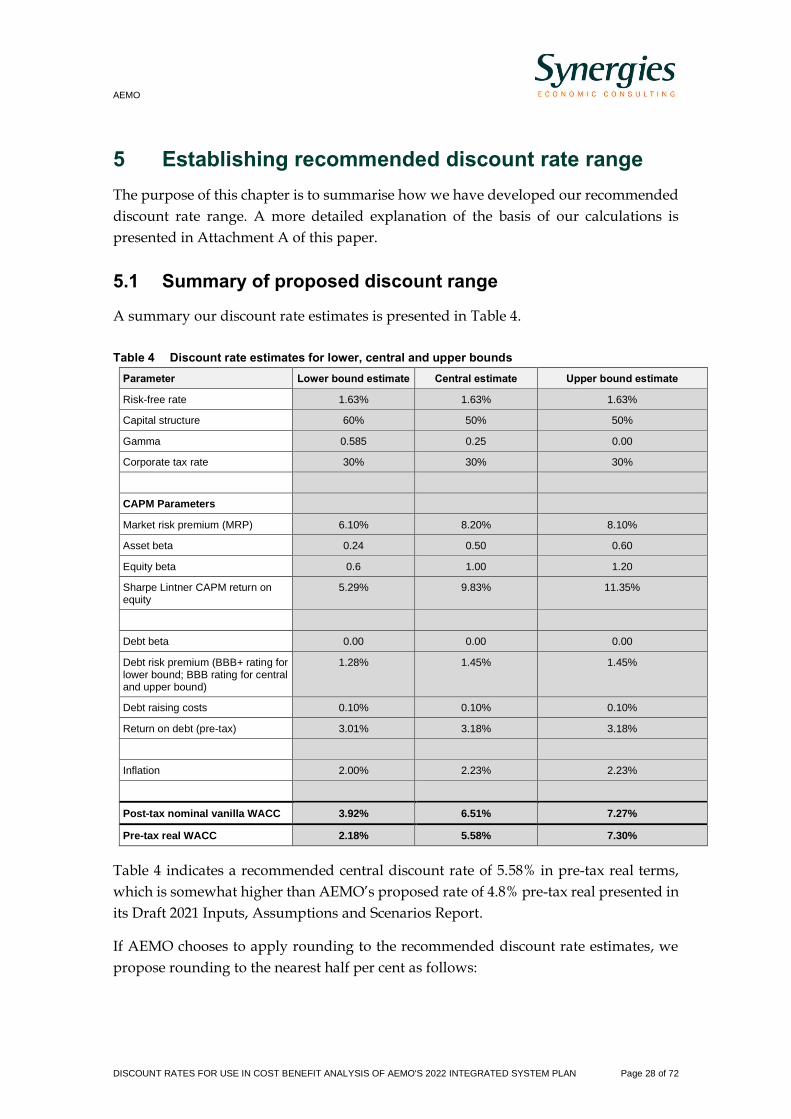
A summary our discount rate estimates is presented in Table 4.
Table 4 Discount rate estimates for lower, central and upper bounds
Parameter Lower bound estimate Central estimate Upper bound estimate
Risk-free rate 1.63% 1.63% 1.63%
Capital structure 60% 50% 50%
Gamma 0.585 0.25 0.00
Corporate tax rate 30% 30% 30%
CAPM Parameters
Market risk premium (MRP) 6.10% 8.20% 8.10%
Asset beta 0.24 0.50 0.60
Equity beta 0.6 1.00 1.20
Sharpe Lintner CAPM return on equity
5.29% 9.83% 11.35%
Debt beta 0.00 0.00 0.00
Debt risk premium (BBB+ rating for lower bound; BBB rating for central and upper bound)
1.28% 1.45% 1.45%
Debt raising costs 0.10% 0.10% 0.10%
Return on debt (pre-tax) 3.01% 3.18% 3.18%
Inflation 2.00% 2.23% 2.23%
Post-tax nominal vanilla WACC 3.92% 6.51% 7.27%
Pre-tax real WACC 2.18% 5.58% 7.30%
Table 4 indicates a recommended central discount rate of 5.58% in pre-tax real terms,
which is somewhat higher than AEMO’s proposed rate of 4.8% pre-tax real presented in
its Draft 2021 Inputs, Assumptions and Scenarios Report.
If AEMO chooses to apply rounding to the recommended discount rate estimates, we
propose rounding to the nearest half per cent as follows:

AEMO
DISCOUNT RATES FOR USE IN COST BENEFIT ANALYSIS OF AEMO'S 2022 INTEGRATED SYSTEM PLAN Page 29 of 72
• Lower bound – 2.0%
• Central case – 5.5%
• Upper bound – 7.5%.
5.2 Key differences between estimates
5.2.1 Central estimate
The objective of the central estimate of the discount rate is the best estimate of the
opportunity cost of capital of the “average” investment expected in the ISP – which is
likely to be heavily influenced by renewable generation investments.
The key assumptions underpinning our central discount rate are as follows:
• Risk free rate is based on 10-year Commonwealth bond (1.63% at 31 May 2021 based
on 20-day average).
• The debt risk premium assumes a BBB credit rating (1.45% at 31 May 2021 based on
20-day average).
• Market risk premium (MRP) of 8.20% based on an average of the Wright and
Ibbotson backward-looking approaches (the volatility of forward-looking Dividend
Discount Model approaches means it has been used as a cross check only).
• Asset beta of 0.50 (based on an average asset beta of our domestic and international
sample and specifically referable to renewable generators).22
• Capital structure based on gearing level of 50% using the same sample as for our
asset beta calculation.
• Equity beta of 1.00 (based on an asset beta of 0.50, gearing of 50%, and the Brealey-
Myers formula).
• Forward-looking cost of debt based on BBB credit rating (3.18% as at 31 May 2021
including debt risk premium of 1.45% as noted above).
• Gamma of 0.25 representing IPART’s current estimate.
• Inflation of 2.23% based on the differential between nominal and indexed Treasury
bonds (the break-even method)
22 Consistent with the practice of financial practitioners and most Australian economic regulators (except for the QCA),
we assume a debt beta of zero.

AEMO
DISCOUNT RATES FOR USE IN COST BENEFIT ANALYSIS OF AEMO'S 2022 INTEGRATED SYSTEM PLAN Page 30 of 72
• Tax rate of 30%
As previously noted, these assumption result in a central estimate of 5.58% (pre-tax real).
5.2.2 Upper bound estimate
The upper bound estimate represents a plausible (and reasonable) upper bound estimate
of risks associated with private investments in the NEM over the ISP time period.
We have decided that the upper bound estimate be based on the same parameters as the
Central estimate, except for:
• Market risk premium of 8.1% based on an average of the Wright and Ibbotson
backward-looking approaches but reflecting an adjustment for a gamma value of
zero (noted below).
• Asset beta of 0.60 (based on the 75th percentile asset beta of our sample and
specifically referable to renewable generators).
• Equity beta of 1.20 (based on an asset beta of 0.60, gearing of 50%, and the Brealey-
Myers formula).
• Gamma value of zero reflecting an assumption that the marginal investor in the
NEM is an international investor who gains no benefit from Australian franking tax
credits.
These assumptions produce an upper bound discount rate estimate of 7.3% in pre-tax
real terms.
5.2.3 Lower bound estimate
In contrast to the upper bound estimate, the lower bound estimate is prescribed in the
AER CBA Guidelines to be the WACC estimate approved in the AER’s most recent
regulatory determination at the time of the final ISP.23
In the past 6 months, the AER released final regulatory determinations (including
WACC decisions) for five Victorian distribution network service providers and a draft
regulatory determination for the AusNet Services transmission network as follows:24
• Citipower (Distribution)
23 AER (2020), Cost benefit analysis guidelines, Guidelines to make the Integrated System Plan actionable, p 10
24 The five final determinations for the Victorian distribution networks are dated 30 April 2021 and the final determination for AusNet (transmission) is dated 30 June 2021.
AEMO
DISCOUNT RATES FOR USE IN COST BENEFIT ANALYSIS OF AEMO'S 2022 INTEGRATED SYSTEM PLAN Page 31 of 72
• Powercor (Distribution)
• Jemena (Distribution)
• AusNet Services (Distribution)
• United Energy (Distribution)
• AusNet Services (Transmission).
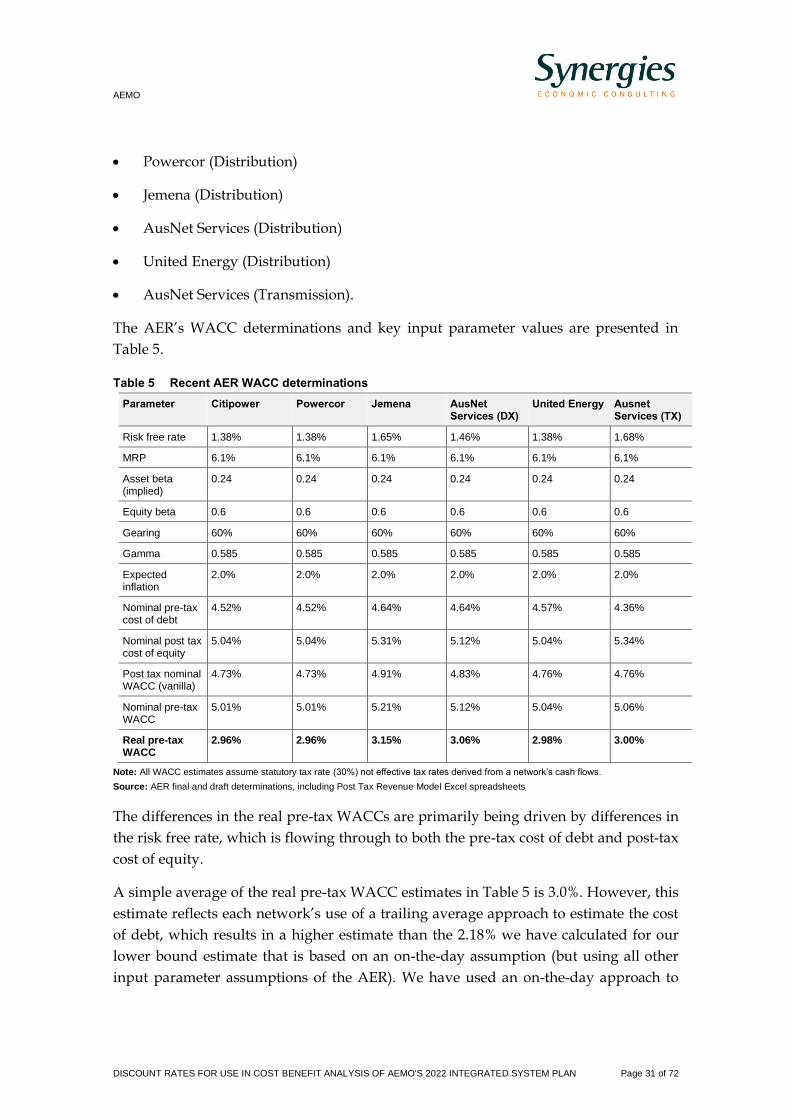
The AER’s WACC determinations and key input parameter values are presented in
Table 5.
Table 5 Recent AER WACC determinations
Parameter Citipower Powercor Jemena AusNet Services (DX)
United Energy Ausnet Services (TX)
Risk free rate 1.38% 1.38% 1.65% 1.46% 1.38% 1.68%
MRP 6.1% 6.1% 6.1% 6.1% 6.1% 6.1%
Asset beta (implied)
0.24 0.24 0.24 0.24 0.24 0.24
Equity beta 0.6 0.6 0.6 0.6 0.6 0.6
Gearing 60% 60% 60% 60% 60% 60%
Gamma 0.585 0.585 0.585 0.585 0.585 0.585
Expected inflation
2.0% 2.0% 2.0% 2.0% 2.0% 2.0%
Nominal pre-tax cost of debt
4.52% 4.52% 4.64% 4.64% 4.57% 4.36%
Nominal post tax cost of equity
5.04% 5.04% 5.31% 5.12% 5.04% 5.34%
Post tax nominal WACC (vanilla)
4.73% 4.73% 4.91% 4.83% 4.76% 4.76%
Nominal pre-tax WACC
5.01% 5.01% 5.21% 5.12% 5.04% 5.06%
Real pre-tax WACC
2.96% 2.96% 3.15% 3.06% 2.98% 3.00%
Note: All WACC estimates assume statutory tax rate (30%) not effective tax rates derived from a network’s cash flows.
Source: AER final and draft determinations, including Post Tax Revenue Model Excel spreadsheets
The differences in the real pre-tax WACCs are primarily being driven by differences in
the risk free rate, which is flowing through to both the pre-tax cost of debt and post-tax
cost of equity.
A simple average of the real pre-tax WACC estimates in Table 5 is 3.0%. However, this
estimate reflects each network’s use of a trailing average approach to estimate the cost
of debt, which results in a higher estimate than the 2.18% we have calculated for our
lower bound estimate that is based on an on-the-day assumption (but using all other
input parameter assumptions of the AER). We have used an on-the-day approach to

AEMO
DISCOUNT RATES FOR USE IN COST BENEFIT ANALYSIS OF AEMO'S 2022 INTEGRATED SYSTEM PLAN Page 32 of 72
calculate the risk free rate for the regulated WACC based on the assumption this is a
forward-looking rate for future ISP investments rather than a backward-looking
financing assumption which is implied by the trailing average approach.
5.3 Comparison to other contemporary Australian discount rates
5.3.1 The use of an on-the-day approach
Synergies received feedback that our central and upper bound discount rates were based
on use of an on-the-day risk free rate that does not reflect private sector experience of
setting hurdle rates driven by a discount rate that is not hostage to interest rate cycles
and changes in the cost of equity. Rather, decisions are informed by looking at the likely
cost of capital over the life of the project. We agree that this view has merit and have
addressed this perspective through the application of the Wright method (with a 50%
weighting) in estimating the market risk premium in our central and upper bound
discount rates. This method effectively assumes that investors are seeking a stable return
on equity over time regardless of interest rate cycles. We prefer using this approach
linked directly to the market risk premium estimate than applying what can be fairly
arbitrary uplifts to the risk free rate to achieve the same objective.
Incorporating the Wright approach in the assessment of the market risk premium
addresses the potential concern that our central and upper bound discount rates are too
low because they are reliant on a historically low risk free rate and hence are not
reflective of an investor’s perspective in making long-term investments in the Australian
electricity sector today and into the future. In practice, it is not possible to forecast with
perfect foresight what cost of capital investors will be targeting over the course of the
ISP planning period. However, we consider that our approach to estimating the market
risk premium that assumes a relatively stable long-term view of required equity returns
is a reasonable one. The lower bound regulated cost of capital estimate does not reflect
this longer-term perspective.
5.3.2 Use of different values for market wide parameters
Synergies received feedback questioning the use of different values for market-wide
parameters in our discount rate range, such as the market risk premium and gamma. It
favoured the use of the same values for market-wide parameters with differences
between discount rates in our range solely reflective of risk differences (ie beta
differences). We recognise these concerns but consider that our approach is valid being
reflective of the judgements and contested views that prevail in relation to cost of capital
estimation.

AEMO
DISCOUNT RATES FOR USE IN COST BENEFIT ANALYSIS OF AEMO'S 2022 INTEGRATED SYSTEM PLAN Page 33 of 72
5.3.3 Feedback on other parameters
Synergies also received feedback that:
• the equity beta assumption of 1.3 for our upper bound estimate seemed too high;
• the market risk premium assumptions above 8% for our central and upper bound
estimates were high compared to the 6-7% assumption generally considered
appropriate in Australia;
• our inflation forecast of 2% was low compared to the mid-point of the Reserve Bank
of Australia’s target inflation band of 2.5%; and
• the gearing assumption used in our central estimate should be 55% not 50%.
Our positions in relation to each of the parameter values above were discussed above.
However, we note that our equity beta assumption for the upper bound estimate is now
1.2 (down from 1.3 in the draft report) and our inflation forecast is now 2.23% (up from
2.0% in our draft report).
5.3.4 NSW Electricity Roadmap cost of capital estimates
NAB was appointed by the NSW Department of Planning, Industry and Environment
(DPIE) to report on the impact of policy proposals on investment certainty in the energy
industry as part of the NSW Electricity Infrastructure Roadmap.25 Drawing on results
from a survey of equity investors conducted by KPMG and the DPIE in July 2020, the
post-tax cost of equity among investors was 8.50%-9.80%, based on gearing of between
65% and 67.5%. The survey included investors for a range of technologies (e.g. wind,
solar PV and new build gas) and a range of counterparties (e.g. investment grade
retailers and sovereign or near-sovereign).
Despite these survey findings, NAB considered that a post-tax cost of equity assumption
of 12% was “reasonably reflective of the higher level of risk borne by equity for projects
fully exposed to the NEM price around the time of the survey.”26 This figure aligns with
the post-tax cost of equity in our upper bound estimate. In particular, NAB concluded
that the cashflow certainty and protections provided by the NSW Renewable Energy
Zones (REZ) could warrant an increase in gearing of between 5% and 10%. Once this
factor is taken into consideration, our proposed gearing ratio of 50% and post-tax cost of
equity range of 9.8%-11.3% for the central and upper bound estimates is broadly in line
with the findings of the NAB analysis.
25 NAB (2020). NSW Electricity Infrastructure Roadmap – Weighted Average Cost of Capital Report, November.
26 NAB (2020), p 5
AEMO
DISCOUNT RATES FOR USE IN COST BENEFIT ANALYSIS OF AEMO'S 2022 INTEGRATED SYSTEM PLAN Page 34 of 72
Consequently, while the NAB report provides useful insights into the views of market
practitioners in the sector, potential differences in risk profile mean that the precise
parameter positions contained within it are not directly applicable to the task of
determining a discount rate range for the ISP. Rather, our discount rate range is
intended to reflect a long-term position not overly affected by current evolving policy
initiatives in any particular jurisdiction. It is possible that current policy initiatives will
reduce WACC for private investment in the electricity sector relative to longer term
positions given the risk allocations inherent in the current initiatives. Overall, we
consider that our assessment is not incompatible with NAB’s position.
5.4 Conclusion
We consider that a central discount rate of 7% and upper bound estimate of 10% (in pre-
tax real terms) as currently applied by several Australian government agencies
(including Infrastructure Australia) are too high given our assessment of the systematic
risks associated with private sector investments in Australia’s NEM and contemporary
international (including Australian) financial and share market conditions.27
We are satisfied that our central and upper bound estimates of 5.58% and 7.30%
respectively are reasonably based. Our recommended lower bound estimate is 2.18% as
per the most recent AER regulatory determinations.
Date of estimation of discount
Given the 2022 ISP will not be released till June 2022, we agree with feedback received
that the discount range that we have estimated in this report should be updated closer
to the June 2022 release date to reflect the latest financial and share market data.
Working backwards from June 2022 and recognising that AEMO will need time to apply
the updated estimates in its cost benefit analysis, we recommend the update should be
based on data reported at December 2021.
The market-based parameters that would need to be updated are as follows:
• risk free rate
• debt risk premium
• asset and equity betas
• market risk premium.
27 Grattan Institute (2018), Unfreezing discount rates, Transport infrastructure for tomorrow, February

AEMO
DISCOUNT RATES FOR USE IN COST BENEFIT ANALYSIS OF AEMO'S 2022 INTEGRATED SYSTEM PLAN Page 35 of 72
A. Discount rate estimation details
The purpose of this attachment is to provide more details on the methodology and
assumptions that we have used to calculate our discount rate estimates.
A.1 WACC formulation
As noted in Chapter 3 of this report, AEMO’s CBA uses real pre-tax cash flows.28 To
ensure alignment of cash flows and discount rates, a pre-tax real WACC must be
estimated.
Consistent with Australian regulatory practice, our pre-tax real WACC is based on the
“forward” or “market” transformation, which calculates a pre-tax real WACC by first
converting the WACC from post-tax to pre-tax terms, before deflating the pre-tax
nominal WACC to a pre-tax real WACC. 29
A.1.1 Post tax nominal vanilla WACC
The approach most commonly applied to estimate WACC in Australian regulatory
regimes is the post-tax nominal ‘vanilla’ WACC. In other words, the rate of return
estimate is expressed as a weighted sum of the post-tax return on equity and the pre-tax
return on debt in inflation-adjusted and after-tax terms. This is the WACC formulation
that the AER uses in its revenue determinations for distribution and transmission
networks.
Under the post-tax nominal ‘vanilla’ WACC formula, tax is modelled as a cost in the
cash flows rather than forming part of the WACC calculation. It is expressed as follows:
Post-tax nominal vanilla WACC =
Where:
Re = post-tax return on equity
Rd = pre-tax return on debt
D = proportion of debt (gearing) within the assumed capital structure
E = proportion of equity within the assumed capital structure
28 The cashflows in the ISP modelling are unlevered rather than levered, hence the relevant discount rate is the post-tax
nominal vanilla WACC rather than the post-tax nominal cost of equity.
29 This contrasts with the so-called “reverse” transformation, which first deflates the post-tax nominal WACC into a post-tax real WACC before converting from post-tax to pre-tax terms.
DE
D
DE
ERR de +
++

AEMO
DISCOUNT RATES FOR USE IN COST BENEFIT ANALYSIS OF AEMO'S 2022 INTEGRATED SYSTEM PLAN Page 36 of 72
A.1.2 Pre-tax real WACC
In CBA it is not uncommon to use a pre-tax real formulation, which is expressed as
follows:
Pre-tax real WACC =
Where:
Re = post-tax return on equity
Rd = pre-tax return on debt
D = proportion of debt (gearing) within the assumed capital structure
E = proportion of equity within the assumed capital structure
tc = corporate tax rate
= gamma (value of imputation credits)
A.2 Cost of equity formulation
The cost of equity will be estimated using the Sharpe-Lintner CAPM (SL CAPM), which
is expressed as follows:
Re = Rf + e * [E(Rm) - Rf]
Where:
Rf = the risk-free rate of return
E(Rm) = the expected return on the market
[E(Rm) – Rf] = the market risk premium
e = equity beta (measures systematic risk)
It is widely adopted among Australian regulators and financial practitioners.
A.2.1 Risk-free rate
The risk-free rate is typically set by reference to short-term average of government bond
yields. At 31 May 2021, the 20-day average of the 10-year Commonwealth Government
bond yield is 1.63%. We note that 10-year Australian Government bond yields are likely
to be affected by yield control at the short end of the curve (3-year bonds are effectively
targeted/set by the RBA at 0.25%). This implies the 10-year bond is likely to be around
40-50 basis points higher than the current reported value.
1 + 𝑅𝑒
(1− 𝑡𝑐[1− 𝛾])∗
𝐸𝐸 + 𝐷
+ 𝑅𝑑 ∗𝐷
𝐸 + 𝐷
1 + 𝑖𝑛𝑓𝑙𝑎𝑡𝑖𝑜𝑛− 1

AEMO
DISCOUNT RATES FOR USE IN COST BENEFIT ANALYSIS OF AEMO'S 2022 INTEGRATED SYSTEM PLAN Page 37 of 72
There is also a growing market for 30-year bonds in Australia, but the market is not yet
as deep as that for 10-year bonds. At 31 May 2021, the 20-day average of the 30-year
Commonwealth Government bond yield is 2.60%. Whilst this is almost 100 basis points
higher than the 10-year rate, we note that our approach to the MRP (specifically the
weighting on the Wright methodology, which varies inversely with the risk-free rate)
mitigates any impact of understating the risk-free rate for a long-term investment
horizon.
We note that independent expert reports frequently apply uplifts to the
contemporaneous risk-free rate to account for the current low interest rate environment.
That being said, practitioner adjustments to the risk-free rate (as are often seen in
independent expert reports) are often arbitrary.
It is, however, possible to account for abnormally low interest rates via market risk
premium (MRP) approaches, such as the Wright MRP as used in our report. Applying
this approach means that the uplift often seen in independent expert reports tends to
align our estimates of the total market return with those found in independent expert
reports and, in this way, can be used as a cross check for the total market return.
Risk free rate estimate
It is proposed to estimate the risk free rate by reference to the 10 year Commonwealth
bond rate for both the central case and the upper bound estimate based on a 20-day
average to 31 May 2021.
A.2.2 Market risk premium (MRP)
The market risk premium (MRP) refers to the return on the market in excess of the risk-
free rate. A range of methods have been developed in the literature to estimate the MRP,
falling broadly into two approaches – historical and forward looking.
Historical methods
• Ibbotson approach: based on a long-term average of historical excess returns. This
results in a relatively stable MRP over time, which may be inappropriate when the
risk free rate is below its long-run average, as has been the case since the GFC. This
is the historical method most frequently favoured by Australian economic
regulators.
• Wright approach: based on a long-term average of the return on the market. To
calculate the MRP, the risk-free rate is subtracted from the market return. This
results in a relatively stable return on equity over time, which is more consistent

AEMO
DISCOUNT RATES FOR USE IN COST BENEFIT ANALYSIS OF AEMO'S 2022 INTEGRATED SYSTEM PLAN Page 38 of 72
with evidence from financial markets. Some Australian economic regulators have
been reluctant to endorse this approach.
Because the Wright approach looks to the average of the overall return on equity (rather
than just the excess return or MRP as is the case with the Ibbotson approach), in times of
very low interest rates (such as those prevailing at present), the Wright approach
generates a higher MRP than the Ibbotson approach. The Wright and Ibbotson
approaches are essentially two extreme and contested interpretations of the value of the
MRP. We consider the reality is likely to lie somewhere between them. Hence, applying
equal weights to each approach represents a reasonable and pragmatic position.
Forward looking methods
Dividend Discount Models (DDMs) are based on the premise that the value (or price) of
a stock is determined solely by the cashflows (usually in the form of dividends) that it
provides to shareholders. As a consequence, it is possible to solve for the discount rate
that equates this cashflow stream with the current stock price. Likewise, this reasoning
can be extended to a market index, such as the All Ordinaries. DDMs can be sensitive to
their underlying assumptions, especially long-term GDP growth, inflation, dividend
growth rates, and the period of convergence to long-run trends.
Backward looking approaches (Ibbotson and Wright) look back at long term average
returns. In contrast, forward looking approaches have the advantage of incorporating
market data more relevant to the period of investigation in future but are volatile. As
such, backward looking approaches tend to be more stable than forward looking
approaches.
We have estimated the MRP by reference to the average of the Ibbotson and Wright MRP
approaches – whilst purely backward looking – because it reflects a long term and
reasonably stable estimate of the MRP.
MRP estimate
We have estimated the MRP by reference to the average of the Ibbotson and Wright MRP
approaches for both the central case and the upper bound estimate as shown in Table 6.
The MRP estimates differ slightly depending on our gamma assumption, because this
impacts the extent to which imputation credit yields (that form part of market returns)
are valued by investors.

AEMO
DISCOUNT RATES FOR USE IN COST BENEFIT ANALYSIS OF AEMO'S 2022 INTEGRATED SYSTEM PLAN Page 39 of 72
Table 6 MRP estimate
Methodology Central discount rate (0.25 gamma)
Upper bound discount rate (zero gamma)
Weighting
Ibbotson MRP 6.58% 6.45% 50%
Wright MRP 9.93% 9.80% 50%
Weighted Average MRP 8.2% 8.1%
Note: The MRP estimates are based on arithmetic averaging of data from 1883-present, incorporating NERA’s adjustment for market
return estimates before 1958. For the central discount rate MRP estimate, the gamma of 0.25 consists of a theta of 0.35 and a distribution
rate of 0.7 (consistent with IPART).
Source: Synergies calculations. These estimates contrast with Australian regulatory estimates of the MRP, which currently range between
5.9% and 7.2%.
We note that 10-year Australian Government bond yields are likely to be affected by
yield control at the short end of the curve (3-year bonds are effectively targeted/set by
the RBA at 0.25%). This implies the 10-year bond is likely to be around 40-50 basis points
higher than the current reported value. This, along with the 30-year bond premium (of
around 100 basis points), highlights that an MRP greater than 7% as we have
recommended for our central and upper bound discount rates is not inconsistent with
the historical total market return.
Cross-checks using DDMs
The most recent published regulatory DDM estimates come from IPART’s February 2021
biannual WACC update. IPART adopts three DDMs, the Damodaran approach, the
Bank of England (2002) approach and the Bank of England (2010) approach. The average
of these three approaches (which have estimates of 9.06%, 8.58%, and 8.76%,
respectively) is 8.8%, which is significantly above the average of the Wright and Ibbotson
approaches.
Cross-checks using financial practitioner evidence
Because financial practitioners frequently exercise discretion in adopting risk-free rates
in excess of contemporary government bond yields, total market returns (i.e. the sum of
the risk-free rate and MRP) applied by financial practitioners are likely to provide the
clearest indication of market outcomes. This is because financial practitioners may adopt
a lower MRP in conjunction with a higher risk-free rate, which makes comparisons solely
on the basis of MRPs potentially misleading. We have used data on independent expert
reports extracted from the Connect 4 database to generate estimates of the post-tax total
market return (risk-free rate plus MRP), which is also equivalent to the post-tax return
on equity for an entity with an equity beta of 1.0.30
30 Specifically, for the Australian sample, Synergies has investigated all 481 independent expert reports relating
specifically to acquisitions, takeovers, divestments, demergers and merger schemes from 1 January 2013 to 31 December 2020.30 Of these 512 reports, only 245 (48%) made explicit reference to the use of a WACC or discount rate, and of these only 192 (38%) provide a detailed description of their WACC methodology.
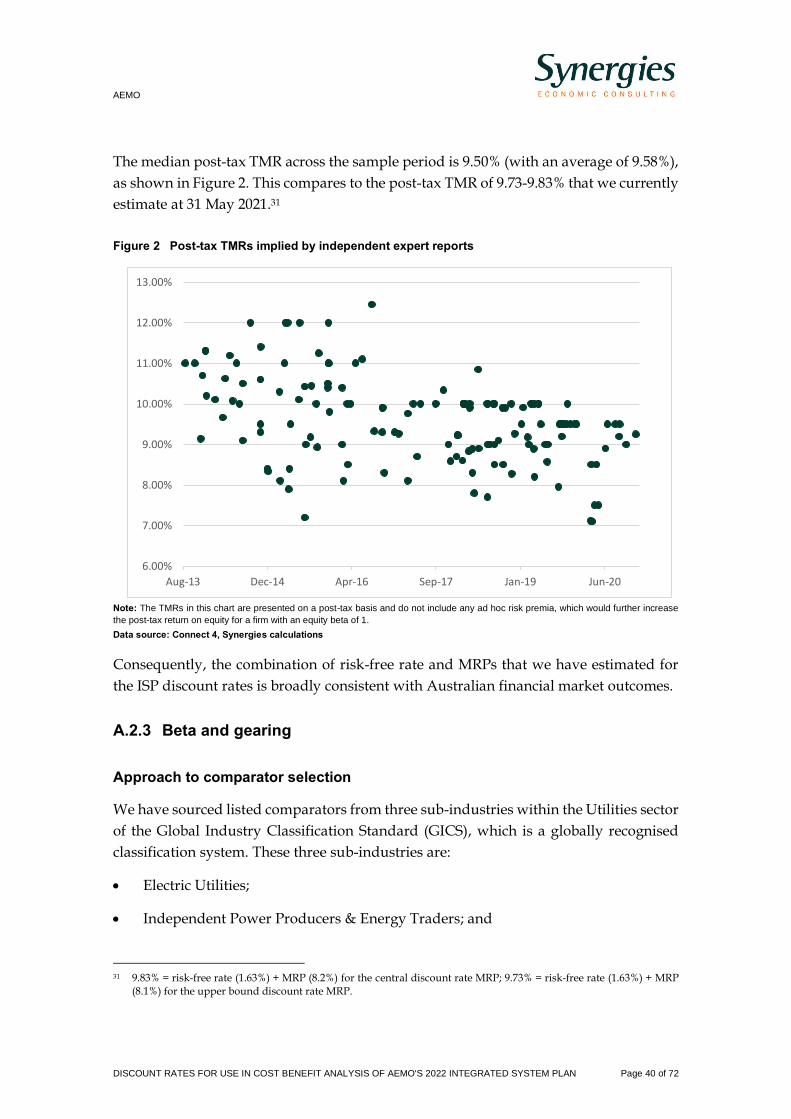
AEMO
DISCOUNT RATES FOR USE IN COST BENEFIT ANALYSIS OF AEMO'S 2022 INTEGRATED SYSTEM PLAN Page 40 of 72
The median post-tax TMR across the sample period is 9.50% (with an average of 9.58%),
as shown in Figure 2. This compares to the post-tax TMR of 9.73-9.83% that we currently
estimate at 31 May 2021.31
Figure 2 Post-tax TMRs implied by independent expert reports
Note: The TMRs in this chart are presented on a post-tax basis and do not include any ad hoc risk premia, which would further increase
the post-tax return on equity for a firm with an equity beta of 1.
Data source: Connect 4, Synergies calculations
Consequently, the combination of risk-free rate and MRPs that we have estimated for
the ISP discount rates is broadly consistent with Australian financial market outcomes.
A.2.3 Beta and gearing
Approach to comparator selection
We have sourced listed comparators from three sub-industries within the Utilities sector
of the Global Industry Classification Standard (GICS), which is a globally recognised
classification system. These three sub-industries are:
• Electric Utilities;
• Independent Power Producers & Energy Traders; and
31 9.83% = risk-free rate (1.63%) + MRP (8.2%) for the central discount rate MRP; 9.73% = risk-free rate (1.63%) + MRP
(8.1%) for the upper bound discount rate MRP.
6.00%
7.00%
8.00%
9.00%
10.00%
11.00%
12.00%
13.00%
Aug-13 Dec-14 Apr-16 Sep-17 Jan-19 Jun-20

AEMO
DISCOUNT RATES FOR USE IN COST BENEFIT ANALYSIS OF AEMO'S 2022 INTEGRATED SYSTEM PLAN Page 41 of 72
• Renewable Electricity
In order to identify relevant comparators for ISP investment we applied a range of
quantitative and qualitative filters.
First, we restricted the sample to those firms from countries with an FTSE Developed
classification. This ensures that we are sourcing comparators from countries with robust
financial markets, and which are similar to Australia in terms of their economic
development. We acknowledge that some Australian regulators, such as the AER and
ERA, have opted to rely solely on domestic comparators when estimating beta in energy
determinations. Nevertheless, reliance on international comparators is widespread
among Australian economic regulators, with regulators such as IPART and the QCA
drawing on comparators from a broad selection of countries when estimating beta for
water and transport businesses.32 Moreover, the number of available comparators for the
renewable electricity and generation sectors are significantly constrained if the sample
is restricted to the Australian market. Our view is that limiting the sample to Australian
entities deprives the analysis of the useful information that the broader sample
incorporating international comparators reveals.
Next, we filtered out companies with a market capitalisation of less than $US200 million,
as firms smaller than this threshold may be subject to thin trading, which may lead to
unreliable beta estimates that mask the true degree of underlying systematic risk. We
also applied two statistical significance filters. Firms were removed from consideration
if they had a t-statistic less than 2 or an R-squared less than 0.1.
In addition to these quantitative filters, we also investigated company descriptions for
each comparator, and removed those firms that we deemed unsuitable on qualitative
grounds (e.g. the firm derives a large share of its revenue from non-energy business
areas).
This filtering procedure left us with 70 comparators across three sub-industries,
consisting of:
• 42 Electric Utilities;
• 9 Independent Power Producers & Energy Traders; and
• 19 Renewable Electricity firms.
Asset beta estimates
32 IPART (2020). Estimating equity beta for the weighted average cost of capital, August; QCA (2021). Rate of return
review – Draft report, June, p.91.

AEMO
DISCOUNT RATES FOR USE IN COST BENEFIT ANALYSIS OF AEMO'S 2022 INTEGRATED SYSTEM PLAN Page 42 of 72
The systematic risk (or beta) of a firm is the measure of how the changes in the returns
to a company’s stock are related to the changes in returns to the market as a whole.
There are two key determinants of an entity’s equity beta:
• business risk arising from the sensitivity of an entity’s cash flow to overall economic
activity, where more cyclical cash flows are associated with higher betas; and
• financial risk arising from capital structure, where a higher level of debt introduces
financial risk and implies a higher beta.
The asset beta represents only the systematic risk of the ungeared entity (and as such
includes no financial risk and only business risk). The equity beta incorporates both the
business risk and the financial risk for an entity.
In practice, we observe equity betas (from the estimated betas of listed companies), but
we want to compare asset betas (to understand the fundamental systematic risk of a
business without regard to the impact of gearing). To do this, we adjust equity betas to
remove the financial risk component arising from the debt that is used to finance the
entity’s assets.
To convert an equity beta to an asset beta (and vice versa), a de-levering (re-levering)
formula needs to be applied. Different regulators use different formulae for this process.
In practice, so long as the de-levering and re-levering of the comparator set is consistent,
the impact of the formula used for the on the final beta estimate is generally not
significant.
The resulting equity betas were de-levered to produce an asset beta using the Brealey-
Myers approach as follows:33
Where
e = equity beta
a = asset beta
D/E = debt-to-equity ratio
The average gearing levels for each business were calculated using annual data over the
five-year period (using the ratio of long-term debt to market value of equity). The
resulting asset beta estimates for each of the three sub-industries as well as all firms in
33 The Brealey-Myers approach is used by the AER and ERA in energy determinations. Consistent with the practice of
financial practitioners and most Australian economic regulators (except for the QCA), we assume a debt beta of zero.
( )EDae /1* +=

AEMO
DISCOUNT RATES FOR USE IN COST BENEFIT ANALYSIS OF AEMO'S 2022 INTEGRATED SYSTEM PLAN Page 43 of 72
the sample are shown in Table 7. Asset betas have been estimated using both monthly
and weekly returns.
Table 7 Asset beta estimates by sub-industry
Electric Utilities Independent Power Producers & Energy Traders
Renewable Electricity
All firms
Monthly Weekly Monthly Weekly Monthly Weekly Monthly Weekly
Average 0.41 0.47 0.40 0.47 0.41 0.45 0.41 0.46
80th percentile 0.54 0.62 0.50 0.68 0.58 0.65 0.55 0.63
75th percentile 0.50 0.59 0.46 0.65 0.51 0.57 0.50 0.61
60th percentile 0.39 0.48 0.40 0.43 0.39 0.37 0.39 0.47
50th percentile (median) 0.36 0.43 0.27 0.36 0.27 0.35 0.32 0.38
40th percentile 0.31 0.37 0.25 0.36 0.25 0.35 0.28 0.36
25th percentile 0.27 0.33 0.25 0.35 0.21 0.31 0.25 0.33
20th percentile 0.25 0.27 0.24 0.32 0.19 0.29 0.23 0.27
Source: Refinitiv (Thomson Reuters), Synergies analysis
Whilst each sample contains a wide range of beta estimates, there is a clear overlap
between 0.4 and 0.6 for each of the samples. In addition, it is noted that asset beta
estimates based on weekly returns tend to be higher than those based on monthly
returns.
For the central case, we propose reliance be placed on the average and 60th percentile
asset betas for the sample (around 0.50 after rounding).
For an upper bound estimate of the discount rate, we consider that the 75th percentile is
likely to be more informative than averages or medians. The 75th percentile generally
ranges between 0.5 and 0.65 across the various samples.
The full list of beta comparators is presented in Attachment 5.4B.
Given the relatively small number of suitable listed Australian comparators with a
market capitalisation in excess of $US200 million, we also investigated Australian firms
with market capitalisations below this threshold. While most were confirmed to be
inappropriate on statistical or qualitative grounds (validating the use of the filter), one
potentially suitable comparator that emerged was Genex Power Limited, which had a
market capitalisation slightly below $US200 million at the time of writing. It has a 5-year
monthly asset beta of 0.69, and a weekly asset beta of 0.79.
While these beta estimates are consistent with our assumptions for the central and upper
bound discount rates, we recognise limited weight should be placed on data for a single
entity whose beta will reflect potentially atypical firm-specific factors. It is precisely this
relative paucity of listed Australian comparators (with market capitalisations either

AEMO
DISCOUNT RATES FOR USE IN COST BENEFIT ANALYSIS OF AEMO'S 2022 INTEGRATED SYSTEM PLAN Page 44 of 72
above or below $US200 million) that reinforces the necessity of drawing on international
beta comparators.34
Beta estimate
It is proposed to use an asset beta of 0.50 for the central case and 0.60 for the upper bound
estimate. Based on the Brealey-Myers levering formula and our assumption of 50%
gearing (discussed in the next section), the resulting equity betas are 1.00 for the central
case and 1.20 for the upper bound estimate.
A.2.4 Gearing
We have estimated our gearing assumption using the same comparator set as for the
beta analysis. The results are show in Table 8.
Table 8 Gearing estimates by sub-industry
Electric Utilities Independent Power Producers & Energy
Traders
Renewable Electricity
All firms
Average 42% 52% 54% 47%
80th percentile 65% 69% 68% 67%
75th percentile 61% 69% 65% 65%
60th percentile 48% 63% 63% 57%
50th percentile (median)
41% 51% 61% 49%
40th percentile 33% 49% 60% 41%
25th percentile 26% 42% 44% 30%
20th percentile 23% 39% 34% 25%
Source: Refinitiv (Thomson Reuters), Synergies analysis
The average gearing ratio based on all firms in the comparator set is 47%, while the
median is 49%. As a general proposition, firms with higher risk will generally be less
capable of sustaining large debt burdens. The 20th and 40th percentiles generally range
between 20 and 40% gearing ratios, although the 40th percentile for Renewable Electricity
is 60%.
Gearing estimate
For the purposes of this exercise, we have adopted an average gearing level of 50% for
both the central case and the upper bound estimate.
34 AusNet Services is another potential Australian comparator. However, its asset beta estimate of 0.08 was not
statistically significant and was therefore removed through our filtering process.

AEMO
DISCOUNT RATES FOR USE IN COST BENEFIT ANALYSIS OF AEMO'S 2022 INTEGRATED SYSTEM PLAN Page 45 of 72
A.2.5 Cost of debt
Cost of debt methods broadly fall under two categories: on-the-day or trailing average.
Also relevant is any market evidence of the cost of debt in the sector.
Considering that the purpose of this exercise is to determine discount rates for future
investment, we consider that an on-the-day estimate is fit-for-purpose, as historical debt
portfolios are likely to be less relevant.
Credit rating
A common starting point for the notional credit rating assumption is BBB, or minimum
investment grade. The most common notional credit rating assumption applied to
regulated entities in Australia is either BBB or BBB+.
Credit ratings for a selection of potentially relevant firms are listed in Table 9.
Table 9 Credit ratings for selected listed energy businesses
Company Credit rating
AGL Energy Baa2 (Moody’s) – equivalent to BBB
Origin Baa2 (Moody’s) – equivalent to BBB
Spark A- (Standard & Poor’s) for Victoria and SA Power Networks; Baa2 (Moody’s) for TransGrid
Tilt Renewables No external credit rating
Iberdrola BBB+ (Standard & Poor’s)
Source: Refinitiv (Thomson Reuters); Spark Infrastructure (accessed from: https://www.sparkinfrastructure.com/about/corporate-
governance/financial-management); Tilt Renewables 2021 Annual Report (p.128) (accessed from:
https://issuu.com/tiltrenewables/docs/tilt13985_tilt_annual_report_14_web_v2?fr=sZWFhMDE1ODI1NTc)
It is also appropriate that the credit rating assumption used for the DRP should be
consistent with the gearing assumption. In Australian regulatory practice, the adoption
of an investment grade credit rating for an efficient benchmark entity is generally
uncontentious.
While we acknowledge that the AER assumes a credit rating of BBB+ in its distribution
and transmission determinations, we consider that a credit rating of BBB is more
appropriate for prospective ISP investment.
Debt margin estimate
For the purposes of our central and upper bound estimates, we have adopted a forward
looking 10-year term for the cost of debt and a credit rating of BBB for both the central
case and the upper bound estimate.
At 31 May 2021, the on-the-day cost of debt for a long term (10 year) BBB rated bond is
3.18%, based on a risk-free rate of 1.63%, a debt risk premium (DRP) of 1.45%, and debt
AEMO
DISCOUNT RATES FOR USE IN COST BENEFIT ANALYSIS OF AEMO'S 2022 INTEGRATED SYSTEM PLAN Page 46 of 72
raising costs of 0.10%.35 This compares to a DRP of 1.28% assuming a BBB+ credit rating,
which we have assumed for the lower bound estimate.36
For comparison, a 10-year BBB trailing average estimate is currently 5.29%, while a 10-
year BBB+ trailing average is currently 5.00%. Trailing averages currently allowed by
the AER are currently somewhat lower than this, principally as the full transition from
the on-the-day to the trailing average approach is not quite completed for regulated
networks. For example, in the latest April 2021 determinations for Victorian distribution
networks, Powercor’s trailing average was 4.52%.37
A.2.6 Gamma (value of imputation credits)
Under a dividend imputation system, corporate tax paid prior to the distribution of
dividends can be credited against the tax payable on the dividends at a shareholder level.
In other words, dividend imputation means that corporate tax is a prepayment of
personal tax withheld at a company level. However, under Australia’s dividend
imputation system, only domestic shareholders can avail themselves of imputation
credits. This means that it is unlikely that imputation credits are valued at their ‘full face’
amount by all investors.
In Australian regulatory WACC frameworks, the value of imputation credits is usually
denoted by gamma (). Gamma is the product of two inputs which must be estimated:
• the proportion of tax paid that has been distributed to shareholders as franking
credits (the distribution rate); and
• the value an investor places on $1 of franking credits, referred to as the value of
distributed franking credits (often referred to as theta or the utilisation rate).
Gamma must take a value between zero and one depending on the assumptions made
about the distribution rate and theta.
A lower value for gamma results in a higher pre-tax return on capital.
The determination of gamma has been highly contentious in a regulatory context. The
key issue rests on whether gamma has a ‘market’ value interpretation or ‘non-market’
35 The DRP is based on an average of RBA and Refinitv (Thomson Reuters) data.
36 To approximate at BBB+ rating, the AER applies a two-thirds weighting to BBB rated DRP data, and a one-third weighting to A rated DRP data.
37 AER (2021). Powercor distribution determination 2021 to 2026 – Final decision - Attachment 3: Rate of return, 30 April, p.6. Note that the trailing average cost of debt estimates may differ slightly between the Victorian networks depending on their choice of averaging periods.

AEMO
DISCOUNT RATES FOR USE IN COST BENEFIT ANALYSIS OF AEMO'S 2022 INTEGRATED SYSTEM PLAN Page 47 of 72
utilisation interpretation. Market approaches seek to ascribe the actual value that
investors place on imputation credits, whereas non-market utilisation approaches focus
more on the proportion of credits that are redeemed. Non-market approaches result in a
higher gamma, which reduces the allowed return on capital when specified in pre-tax
terms.
According to finance theory and independent expert reports, imputation credits actually
have no value (i.e. gamma is zero) because in open but relatively small capital markets
like Australia, the marginal investor will be an international investor who gains no value
from imputation credits and hence whose expected return on equity is not affected by
the operation of the Australian tax imputation system.
We first summarise regulatory precedent before considering the views of market
practitioners.
A.2.7 Regulatory precedent
.
Table 1010 below provides an overview of the approaches and positions that are
currently adopted by Australian regulators.
Table 10 Gamma positions adopted by Australian regulators
Regulator Gamma Justification provided by regulator
IPART 0.25 Market approach based on dividend drop-off studies
AER 0.585 Non-market approach based on the equity ownership methodology.
ERA 0.50 Non-market approach based on the equity ownership methodology.
QCA 0.484 Non-market approach based on the equity ownership methodology.
ACCC 0.585 Non-market approach based on the equity ownership methodology.
OTTER 0.40 Based on previous AER gamma position
ESC 0.50 Non-market approach based on the equity ownership methodology.
ESCOSA 0.50 Non-market approach based on the equity ownership methodology.
Source: Various regulatory decisions, Synergies analysis
Most Australian economic regulators give primary weight to the equity ownership
approach, although various approaches are used to estimate theta. IPART is the only
Australian regulator to currently rely on dividend drop-off studies.
Financial market evidence
In financial markets, there is substantial evidence that imputation credits are not
assigned any value by independent experts in a valuation context. In surveys of financial

AEMO
DISCOUNT RATES FOR USE IN COST BENEFIT ANALYSIS OF AEMO'S 2022 INTEGRATED SYSTEM PLAN Page 48 of 72
practitioners, those who assign a non-zero value to gamma are overwhelmingly in the
minority.
In response to a 2014 AER draft decision for TransGrid, Grant Samuel wrote that:38
We have always made it clear in our reports that we do not believe that day to day
market prices of Australian equities incorporate any particular value for franking
credits attached to any future income stream and we have never made any adjustment
for dividend imputation (in either the cash flows or the discount rate) in any of our
500 plus public valuation reports.
Furthermore, in a 2015 Independent Expert’s Report for Asciano, Grant Samuel puts
forward the perspective of financial markets, arguing that:39
The evidence gathered to date as to the value of the market attributes to franking
credits is insufficient to rely on for valuation purposes. The studies that measure the
value attributed to franking credits are based on the immediate value of franking
credits distributed and do not address the risk and other issues associated with the
ability to utilise them over the longer term. More importantly, Grant Samuel does not
believe that such adjustments are widely used by acquirers of assets at present.
Grant Samuel expanded further on its gamma position in an October 2019 independent
expert report for Bellamy’s Australia. It observed that:40
While acquirers are attracted by franking credits, there is no clear evidence that they
will actually pay extra for a company with them.
Lonergan Edwards has highlighted the influence of foreign investors on the value of
imputation credits:41
Given free capital flows between developed countries and the small size of the
Australian stock market (as a percentage of global markets), the cost of capital of listed
companies (other than perhaps regulated infrastructure assets) should be assessed in
a global context ignoring Australian imputation. This is the approach generally
adopted by independent experts.
38 Grant Samuel (2015). Response to AER draft decision, 12 January, p.5.
39 Grant Samuel (2015). Independent Expert’s Report, Asciano, 30 September, p.315.
40 Grant Samuel (2019). Independent Expert’s Report, Bellamy’s Australia, 30 October, p.59.
41 Lonergan Edwards (2020). Proposed acquisition of OptiComm Ltd, 6 August, p.81
AEMO
DISCOUNT RATES FOR USE IN COST BENEFIT ANALYSIS OF AEMO'S 2022 INTEGRATED SYSTEM PLAN Page 49 of 72
Likewise, BDO adopted a gamma of zero in an independent expert report for Stanmore
Coal on the basis that the marginal investor is foreign:42
This assumption has been made with reference to the fact that imputation credits for
Australian companies are available to domestic investors only and that not all
investors in Stanmore are Australian. The marginal investor is likely to be an investor
who is not entitled to claim imputation credits.
Financial practitioner surveys
Market surveys are also valuable in understanding the approach of financial
practitioners to the valuation of imputation credits. The most recent KPMG 2019
Valuation Practices Survey examined the practices of 59 respondents in relation to the
treatment of imputation credits.43 92% of practitioners surveyed did not incorporate a
gamma factor into the discount rate. This aligns with the views set out in the
independent expert reports summarised above.
Among those practitioners that did incorporate a non-zero gamma, the average rate
applied was 36.4% (i.e. a theta of 0.364), which approximately coincides with the theta
of 0.35 based on dividend drop-off studies, and which informs IPART’s gamma
methodology. The survey also made clear that the proportion of financial practitioners
who adopt a theta value in the range implied by non-market approaches (approximately
0.55 to 0.65 based on current regulatory precedent) are very much in the minority
(around 25%). Overall, the evidence from independent expert reports and valuation
surveys highlights the difference between financial practitioners, who represent the
relevant workably competitive financial markets, and economic regulators regarding the
value of imputation credits. Only a small minority of financial practitioners adopt a non-
zero value for gamma, and of those who do, very few apply a value consistent with
Australian regulatory assumptions.
International investor interests in Australian transport and energy infrastructure
Table 11 11 below indicates the significant proportion of foreign equity ownership of
Australian transport and energy infrastructure.
42 BDO (2020). Stanmore Coal Limited - Independent Expert’s Report and Financial Services Guide, 29 April, p.50.
43 KPMG (2020). What’s it worth? – KPMG Valuation Practices Survey 2019. (No survey has been published for 2020 at the time of writing).

AEMO
DISCOUNT RATES FOR USE IN COST BENEFIT ANALYSIS OF AEMO'S 2022 INTEGRATED SYSTEM PLAN Page 50 of 72
Table 11 11 Proportion of equity ownership – Institutions & Strategic Holders &
Individuals/Insiders
Proportion of Institutions and Strategic Holders & Individuals /
Insiders
Company Domestic Foreign
Qube Holdings 52% 48%
Port of Tauranga 96% 4%
Aurizon Holdings 42% 58%
Sydney Airport 48% 52%
Auckland International Airport
48% 52%
Transurban 46% 54%
Atlas Arteria 36% 64%
Spark 39% 61%
APA Group 57% 43%
Min 36% 4%
Max 96% 64%
Median 48% 52%
Average 52% 48%
Source: Capital IQ data as at 20 May 2020
A similar picture for unlisted infrastructure transactions since 2015 (based on InfraDeals
data) is shown in Table 12.
Table 1212 Proportion of equity ownership – Unlisted infrastructure transactions
Transaction Sub-Sector Date Equity Providers Domestic Foreign
WestConnex Toll Road System (Green & Brownfield)
Oct-18 Transurban, CPPIB, AustralianSuper, ADIA
71% 29%
Loy Yang B Generation Dec-17 Alinta (Chow Tai Fook Enterprises Limited)
0% 100%
NSW Endeavour Energy
Distribution May-17 Macquarie Infrastructure, AMP (REST), bcIMC, QIA
57% 43%
DUET Distribution Apr-17 CKI 0% 100%
Alinta Energy Utility Mar-17 Chow Tai Fook Enterprises Limited 0% 100%
NSW Ausgrid Distribution Dec-16 AustralianSuper, IFM 100% 0%
GRail Rail Dec-16 G&W, Macquarie Infrastructure 49% 51%
Port of Melbourne Ports Oct-16 Future Fund, CIC, OMERS, NPS, CalPERS, GIPA, QIC
31% 69%
Asciano (Pacific National)
Rail Aug-16 GIP II, CPPIB, CIC, GIC, bcIMC 0% 100%
Asciano (Ports) Ports Aug-16 Qube, Brookfield, GIC, bcIMC, QIA 50% 50%
AirportLinkM7 Roads Apr-16 Transurban, AustralianSuper, ADIA 88% 13%

AEMO
DISCOUNT RATES FOR USE IN COST BENEFIT ANALYSIS OF AEMO'S 2022 INTEGRATED SYSTEM PLAN Page 51 of 72
Transaction Sub-Sector Date Equity Providers Domestic Foreign
Pacific Hydro Renewables Jan-16 China State Power Investment Corporation
0% 100%
NSW TransGrid Transmission Dec-15 Spark, Hastings, CDPQ, ADIA, Wren House
35% 65%
Iona Gas Storage Energy Dec-15 QIC, QSuper 100% 0%
Median 43% 57%
Average 47% 53%
Note: Fund managers have been classified based on the location of their head office where their underlying investor details are confidential.
Source: InfraDeals
The data in Table 11 11 and Table 12 highlights at least 50% foreign ownership of major
listed and unlisted infrastructure assets in Australia. In these circumstances, it is clear
foreign investors unable to access any value from imputation credits are likely to be
influential.
It is acknowledged that domestic shareholders derive benefits from dividend
imputation. However, in a valuation context, these shareholders are infra-marginal –
they do not set the relevant price for Australian assets.
Based on our review of Australia’s top 20 renewable energy developers, it suggests the
majority are foreign owned. This lends support to the prominence of foreign investment
in the sector and that the marginal investor in the NEM is likely to be a foreign investor.
Gamma estimate
We have adopted a gamma of 0.25 for the central estimate and a gamma of zero for the
upper bound estimate.
The gamma of 0.25 for the central estimate is based on IPART’s current estimate of
gamma, which uses a market-based approach informed by dividend drop-off studies. In
our view, if a non-zero gamma value is to be adopted, dividend drop-off studies are the
most robust methodology available, because the non-market methodologies used by
other Australian regulators fail to recognise the potential for individual eligible investors
to value imputation credits at less than their nominal dollar value, notwithstanding
evidence to the contrary. Moreover, the equity ownership approach does not reflect a
market-based approach despite every other relevant parameter informing the WACC
being based on a market proxy.
The gamma of zero for the upper bound discount rate estimate reflects the
overwhelming practice of Australian financial practitioners, especially instances where
the marginal investor is assumed to be foreign, which is evident in the Australian energy
sector.
AEMO
DISCOUNT RATES FOR USE IN COST BENEFIT ANALYSIS OF AEMO'S 2022 INTEGRATED SYSTEM PLAN Page 52 of 72
A.2.8 Inflation
In its April 2021 determinations for Victorian networks, the AER adopted an inflation
estimate of 2.0%, based on a combination of RBA forecasts and an assumed linear glide
path to the 2.5% midpoint of the RBA’s target band.
Alternatively, inflation can be estimated using the breakeven approach. The break-even
methodology calculates inflation based on the difference between the forward-looking
yields on nominal long-term government bonds (which provides the nominal risk-free
rate) and the yield on indexed bonds (which reflects a market-based estimate of the real
risk-free rate).
Although, it is used less frequently by Australian economic regulators (currently only
the ERA and ESC) compared to RBA-based forecasting methodologies, it is nevertheless
transparent and replicable. All the bond data used for its application are publicly
available on the RBA’s website.
The ISP Consumer Panel noted that our draft report failed to acknowledge the
contentious nature of inflation forecasting and that the AER’s 2020 review of its inflation
forecasting approach rejected the use of market-based measures because of ‘biases and
distortions’ that ‘remain material and unquantified’.44
Detailed analysis of the AER’s criticisms of market-based measures is beyond the scope
of this project. However, the chart below shows the respective forecasting performance
of the AER’s pre-2020 and new forecasting approaches relative to the breakeven
approach and mid-point of the RBA’s target inflation band since 2009. We consider the
chart shows flaws in both of the AER’s forecasting approaches due to their unduly heavy
reliance on the mid-point of the RBA’s inflation band as a guide to inflation expectations,
when there is no historical evidence to suggest that this has been the case.
44 AER (2020), Regulatory treatment of inflation, Final Position, (December), p 52

AEMO
DISCOUNT RATES FOR USE IN COST BENEFIT ANALYSIS OF AEMO'S 2022 INTEGRATED SYSTEM PLAN Page 53 of 72
Figure 3 AER’s inflation forecasting approach’s performance compared to break even approach
Data source: ABS CPI Series, AER regulatory determinations, RBA Statement on Monetary Policy
Based on the above figure, we see no reason to change our position that a market-based
measure of inflation is more likely to provide an unbiased estimate of expected inflation
than the AER’s new inflation forecasting approach. This is because the former is
informed by investors’ actual expectations in financial markets, as represented by the
yields they require to be adequately compensated for expected inflation.
In this regard, we note that all other parameters used to develop our central and upper
bound discount rate estimates use market data and that there is no reason to depart from
this approach in determining our inflation estimate.
Break-even inflation estimates for May 2021 are shown in Table 13. Both the 5-year and
10-year estimates sit slightly above the AER’s most recent inflation estimate of 2.0%.
Table 13 May 2021 break-even inflation estimates
Forecasting horizon Break-even estimate
5-year inflation forecast 2.18%
10-year inflation forecast 2.23%
Note: These estimates follow the ERA’s methodology and are based on a 20-day average to 31 May 2021, consistent with the ERA’s
averaging period for gas and electricity determinations (and our averaging period for other parameters such as the risk-free rate and the
cost of debt).
Source: Synergies analysis using RBA data.
Inflation estimate
Based on the evidence in this section, we have adopted an inflation estimate of 2.23%.
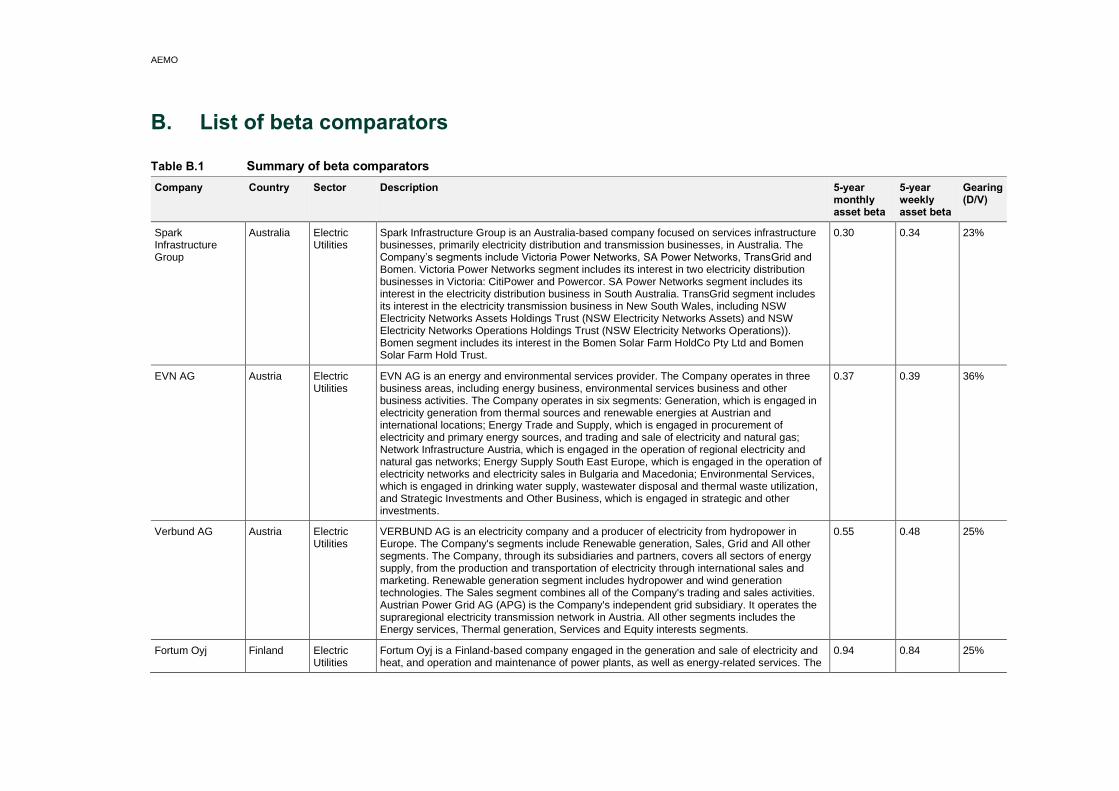
AEMO
B. List of beta comparators
Table B.1 Summary of beta comparators
Company Country Sector Description 5-year monthly asset beta
5-year weekly asset beta
Gearing (D/V)
Spark Infrastructure Group
Australia Electric Utilities
Spark Infrastructure Group is an Australia-based company focused on services infrastructure businesses, primarily electricity distribution and transmission businesses, in Australia. The Company’s segments include Victoria Power Networks, SA Power Networks, TransGrid and Bomen. Victoria Power Networks segment includes its interest in two electricity distribution businesses in Victoria: CitiPower and Powercor. SA Power Networks segment includes its interest in the electricity distribution business in South Australia. TransGrid segment includes its interest in the electricity transmission business in New South Wales, including NSW Electricity Networks Assets Holdings Trust (NSW Electricity Networks Assets) and NSW Electricity Networks Operations Holdings Trust (NSW Electricity Networks Operations)). Bomen segment includes its interest in the Bomen Solar Farm HoldCo Pty Ltd and Bomen Solar Farm Hold Trust.
0.30 0.34 23%
EVN AG Austria Electric Utilities
EVN AG is an energy and environmental services provider. The Company operates in three business areas, including energy business, environmental services business and other business activities. The Company operates in six segments: Generation, which is engaged in electricity generation from thermal sources and renewable energies at Austrian and international locations; Energy Trade and Supply, which is engaged in procurement of electricity and primary energy sources, and trading and sale of electricity and natural gas; Network Infrastructure Austria, which is engaged in the operation of regional electricity and natural gas networks; Energy Supply South East Europe, which is engaged in the operation of electricity networks and electricity sales in Bulgaria and Macedonia; Environmental Services, which is engaged in drinking water supply, wastewater disposal and thermal waste utilization, and Strategic Investments and Other Business, which is engaged in strategic and other investments.
0.37 0.39 36%
Verbund AG Austria Electric Utilities
VERBUND AG is an electricity company and a producer of electricity from hydropower in Europe. The Company's segments include Renewable generation, Sales, Grid and All other segments. The Company, through its subsidiaries and partners, covers all sectors of energy supply, from the production and transportation of electricity through international sales and marketing. Renewable generation segment includes hydropower and wind generation technologies. The Sales segment combines all of the Company's trading and sales activities. Austrian Power Grid AG (APG) is the Company's independent grid subsidiary. It operates the supraregional electricity transmission network in Austria. All other segments includes the Energy services, Thermal generation, Services and Equity interests segments.
0.55 0.48 25%
Fortum Oyj Finland Electric Utilities
Fortum Oyj is a Finland-based company engaged in the generation and sale of electricity and heat, and operation and maintenance of power plants, as well as energy-related services. The
0.94 0.84 25%

AEMO
Company Country Sector Description 5-year monthly asset beta
5-year weekly asset beta
Gearing (D/V)
Company operates, along with its subsidiaries, in four business segments: Power, comprising the Company’s power generation, physical operation and trading, as well as expert services for power producers; Heat, consisting of combined heat and power generation (CHP), district heating and cooling activities and business-to-business heating solutions; Russia, including power and heat generation and sales in Russia, and Electricity Solutions, responsible for Fortum’s electricity sales. The Company operates in Finland, Sweden, Norway, the Russian Federation, Poland, Lithuania, Latvia, Estonia, India and the United Kingdom, among others.
Electricite de France SA
France Electric Utilities
Electricite de France SA (EDF SA) is a France-based electricity producer, marketer and distributor. The Company generates energy using nuclear technology, as well as thermal, hydroelectric and other renewable sources. It is involved in energy generation and energy sales to industries, local authorities and residential consumers. In addition, EDF SA manages low and medium-voltage public distribution network and involves in electricity transmission network. It also provides energy services, such as district heating and thermal energy services. The group is present in France, Belgium, the United States, Poland, Italy, China, Vietnam and other countries worldwide. The Company has such subsidiaries Dalkia (including Citelum), under Dalkia's brand and SINOP Energy Company, among others.
0.31 0.37 65%
Electricite de Strasbourg SA
France Electric Utilities
Electricite de Strasbourg SA is a France-based distributor of electricity and gas. The Company operates, maintains, develops and renews an electrical network in Alsace region under the brand ESR. It is organized in three business areas: electricity distribution, engaged in network management; electricity and gas marketing, active in production activities and energy marketing; and energy service, bringing together other activities of the Company and its subsidiaries, such real estate services and geothermal energy, among others. Electricite de Strasbourg SA operates through a number of subsidiaries, including Fipares SA, ES Energies Strasbourg SA, Sofidal SA, Ecotral SA and Calorest SAS, among others. The Company’s main shareholder is EDF Developpement Environnement SA (EDEV).
0.43 0.34 1%
Lechwerke AG Germany Electric Utilities
Lechwerke AG is a Germany-based electric utility holding company. The Company's core business is the supply of electricity and associated services to customers in Bavaria and in parts of Baden-Wuerttemberg in Germany. It distributes electricity through low, medium and high voltage grid, generates electricity through numerous hydroelectric power stations and is engaged in electricity trading, electricity and gas sales and energy efficiency services. It operates its five main subsidiaries, including LEW Verteilnetz GmbH, LEW Netzservice GmbH, LEW Service & Consulting GmbH, Bayerische Elektrizitaetswerke GmbH, Elektrizitaetswerk Landsberg GmbH, Ueberlandswerk Krumbach GmbH and Lew TelNet GmbH. The Company is majority owned by RWE AG.
0.28 0.22 0%
CK Infrastructure Holdings Ltd
Hong Kong Electric Utilities
CK Infrastructure Holdings Limited, formerly Cheung Kong Infrastructure Holdings Limited, is a company mainly engaged in the development, investment and operation of infrastructure businesses. Its operations include electricity generation, transmission and distribution, gas distribution, transportation, water treatment and distribution, waste management and waste-to-energy, as well as infrastructure materials. Its transportation business includes the operation of
0.86 0.59 12%

AEMO
Company Country Sector Description 5-year monthly asset beta
5-year weekly asset beta
Gearing (D/V)
airport car parks, as well as toll roads and bridges. Its infrastructure materials business includes the production and sale of cement, concrete and aggregates. In addition, the Company is also involved in oil pipelines and storage business. The Company’s portfolio now spans Hong Kong, Mainland China, the United Kingdom, the Netherlands, Portugal, Australia, New Zealand and Canada.
CLP Holdings Ltd Hong Kong Electric Utilities
CLP Holdings Limitedis an investment holding company mainly engaged in the generation and supply of electricity. The Company operates a portfolio of generating assets, harnessing a wide range of fuels including coal, gas, nuclear, wind, hydro and solar. Its business also includes transmission and distribution, and electricity and gas retail activities. Along with subsidiaries, the Company operates its business through five segments: the Hong Kong segment, the Mainland China segment, the India segment, the Southeast Asia and Taiwan segment, and the Australia segment. The Hong Kong segment operates a vertically-integrated regulated business. It is involved of generation, distribution and provision of electricity supply.
0.32 0.26 18%
Power Assets Holdings Ltd
Hong Kong Electric Utilities
Power Assets Holdings Ltd is an investment holding company mainly engaged in the energy and utility-related businesses. The Company operates its business through three segments. The Investment segment is involved in the investment in power and utility-related businesses. The Investment in HKEI segment is involved in the investment in generation and supply of electricity business in Hong Kong. The All Other Activities segment is engaged in the other activities carried out by the Company. The Company’s business insists of generation of thermal and renewable power, the transmission of electricity and oil as well as the distribution of electricity and gas. The Company distributes its products within the domestic market and to overseas markets, including United Kingdom, Australia, New Zealand, Thailand, the Netherlands, Portugal and Canada.
0.62 0.39 5%
Enel SpA Italy Electric Utilities
Enel SpA is an Italy-based multinational power company and an integrated operator in the global power, gas and renewables markets. It is active in Europe and is present in more than 30 countries, producing energy with over 86 gigawatt (GW) of installed capacity. Enel distributes electricity through a network of over 2.2 million kilometers, supplying 74 million business and household end users globally. Enel's renewables arm Enel Green Power supplies energy with more than 46 GW of wind, solar, geothermal and hydropower plants installed in Europe, the Americas, Africa, Asia and Oceania. Enel X is Enel's global business line focusing on energy-related products and services including distribution systems and batteries, smart lighting and energy and electric mobility.
0.38 0.48 49%
Terna Rete Elettrica Nazionale SpA
Italy Electric Utilities
Terna Rete Elettrica Nazionale SpA is an Italy-based company engaged in the utility sector. It is an independent grid operator for the transmission of electricity. It deals with the management of electrical systems through the operation of the grid, efficiency of infrastructures and their maintenance through engineering and management of plants and grid developments. It ensures a balance of deliveries and withdrawals between the supply of energy and consumption by end users. The Company is diversified into two operating segments. The Core Business includes the development, operation and maintenance of the
0.20 0.33 47%
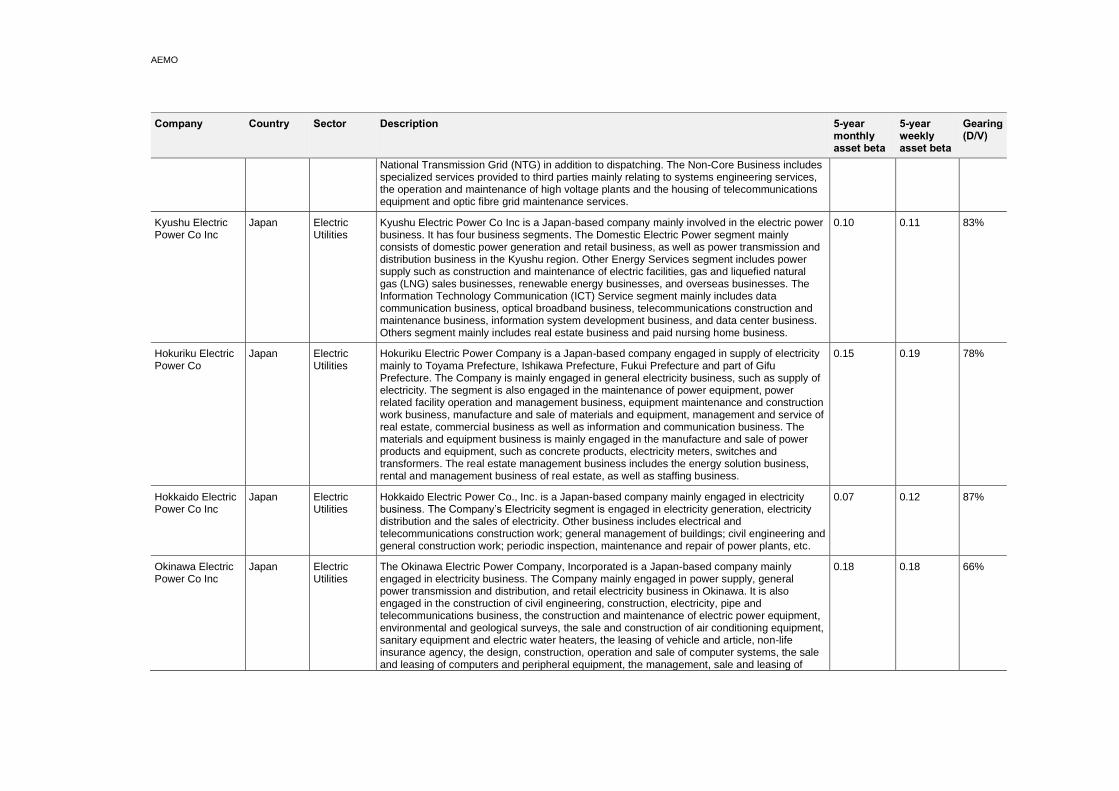
AEMO
Company Country Sector Description 5-year monthly asset beta
5-year weekly asset beta
Gearing (D/V)
National Transmission Grid (NTG) in addition to dispatching. The Non-Core Business includes specialized services provided to third parties mainly relating to systems engineering services, the operation and maintenance of high voltage plants and the housing of telecommunications equipment and optic fibre grid maintenance services.
Kyushu Electric Power Co Inc
Japan Electric Utilities
Kyushu Electric Power Co Inc is a Japan-based company mainly involved in the electric power business. It has four business segments. The Domestic Electric Power segment mainly consists of domestic power generation and retail business, as well as power transmission and distribution business in the Kyushu region. Other Energy Services segment includes power supply such as construction and maintenance of electric facilities, gas and liquefied natural gas (LNG) sales businesses, renewable energy businesses, and overseas businesses. The Information Technology Communication (ICT) Service segment mainly includes data communication business, optical broadband business, telecommunications construction and maintenance business, information system development business, and data center business. Others segment mainly includes real estate business and paid nursing home business.
0.10 0.11 83%
Hokuriku Electric Power Co
Japan Electric Utilities
Hokuriku Electric Power Company is a Japan-based company engaged in supply of electricity mainly to Toyama Prefecture, Ishikawa Prefecture, Fukui Prefecture and part of Gifu Prefecture. The Company is mainly engaged in general electricity business, such as supply of electricity. The segment is also engaged in the maintenance of power equipment, power related facility operation and management business, equipment maintenance and construction work business, manufacture and sale of materials and equipment, management and service of real estate, commercial business as well as information and communication business. The materials and equipment business is mainly engaged in the manufacture and sale of power products and equipment, such as concrete products, electricity meters, switches and transformers. The real estate management business includes the energy solution business, rental and management business of real estate, as well as staffing business.
0.15 0.19 78%
Hokkaido Electric Power Co Inc
Japan Electric Utilities
Hokkaido Electric Power Co., Inc. is a Japan-based company mainly engaged in electricity business. The Company’s Electricity segment is engaged in electricity generation, electricity distribution and the sales of electricity. Other business includes electrical and telecommunications construction work; general management of buildings; civil engineering and general construction work; periodic inspection, maintenance and repair of power plants, etc.
0.07 0.12 87%
Okinawa Electric Power Co Inc
Japan Electric Utilities
The Okinawa Electric Power Company, Incorporated is a Japan-based company mainly engaged in electricity business. The Company mainly engaged in power supply, general power transmission and distribution, and retail electricity business in Okinawa. It is also engaged in the construction of civil engineering, construction, electricity, pipe and telecommunications business, the construction and maintenance of electric power equipment, environmental and geological surveys, the sale and construction of air conditioning equipment, sanitary equipment and electric water heaters, the leasing of vehicle and article, non-life insurance agency, the design, construction, operation and sale of computer systems, the sale and leasing of computers and peripheral equipment, the management, sale and leasing of
0.18 0.18 66%

AEMO
Company Country Sector Description 5-year monthly asset beta
5-year weekly asset beta
Gearing (D/V)
land and buildings, aquaculture, wind power generation, the sale of natural gas, the installation of private power generation systems.
Mercury NZ Ltd New Zealand
Electric Utilities
Mercury NZ Limited, formerly Mighty River Power Limited, is engaged in energy retail business. The Company is an electricity retailor and generator, which is engaged in providing energy services to homes, businesses and industrial customers throughout New Zealand. The Company's segments include Energy Markets and Other Segments. The Energy Markets segment encompasses activities associated with the production, sale and trading of energy and related services and products, and generation development activities. The Other Segments includes metering and international geothermal development and operations. The Company sells electricity, through multiple retail brands, including GLOBUG, Tiny Mighty and Bosco. Its generation consists of two fuel sources: hydro and geothermal. It operates approximately nine hydro plants along the Waikato River. The Company supplies metering infrastructure and services to the utility sector across New Zealand.
0.75 0.81 18%
Genesis Energy Ltd
New Zealand
Electric Utilities
Genesis Energy Limited is an energy company involved in the generation of electricity, retailing and trading of energy, and the development and procurement of fuel sources. The Company operates through four segments: Customer experience, Energy management, Oil and gas, and Corporate. The Customer experience segment is engaged in supplying of energy (electricity, gas and liquefied petroleum gas (LPG)) and related services to end user customers. The Energy management segment is engaged in the generation and trading of electricity and related products. The segment includes electricity sales to the wholesale electricity market, derivatives entered into to fix the price of electricity, and wholesale gas and coal sales. The Oil and gas segment is engaged in the exploration, development, production and sale of gas, LPG and light oil. The Corporate segment is engaged in new generation investigation and development, fuel management, information systems and property management, among others.
0.81 0.76 30%
Contact Energy Ltd
New Zealand
Electric Utilities
Contact Energy Limited is an energy generator and digital retailer, which is engaged in providing electricity, natural gas and liquefied petroleum gas (LPG), and broadband services. It generates electricity through hydro, geothermal and thermal sources. The Company operates through two segments: Generation segment and Customer segment. The Generation segment is engaged in the business of selling electricity to the wholesale electricity market and to the Customer segment. The Customer segment delivers, services and distributes energy to customers. It sells electricity, gas and LPG products and services to residential, small business, commercial and industrial customers. The Company's stations include Ahuroa and Stratford in Taranaki; Ohaaki, Poihipi and Te Rapa in Waikato, Te Huka and Te Mihi in Taupo Wairakei in Taupo, and Whirinaki in Hawke’s Bay. It is also involved in the development of geothermal energy projects.
0.84 0.97 22%
Infratil Ltd New Zealand
Electric Utilities
Infratil Limited is a New Zealand-based infrastructure investment company. The Company owns and operates infrastructure businesses and investments in New Zealand, Australia, the United States and Europe. The Company operates through five segments: Trustpower, Tilt
0.51 0.37 56%

AEMO
Company Country Sector Description 5-year monthly asset beta
5-year weekly asset beta
Gearing (D/V)
Renewables, Wellington International Airport, Associate Companies and Other. Trustpower and Tilt Renewables are renewable generation investments. Wellington International Airport is an airport investment. Associates companies include CDC Data Centres, Vodafone New Zealand, RetireAustralia, Longroad Energy and Galileo Green Energy.
Tauron Polska Energia SA
Poland Electric Utilities
Tauron Polska Energia SA is a Poland-based company active in the energy sector. The Company’s business is divided into five operating segments: Mining, including coal mining; Generation, including generation of electricity using conventional sources, such as combined heat and power generation, and generation of electricity using joint combustion of biomass and other energy acquired thermally; Renewable Sources of Energy, including generation of electricity using renewable sources; Sale of Energy and Other Energy Market Products, including wholesale trading in electricity, trading in emission allowances and energy certificates and sale of electricity to domestic end users or entities which further resell electricity; and Distribution. On August 12, 2014, the Company sold Przedsiebiorstwo Swiadczen Zdrowotnych i Promocji Zdrowia Elvita Jaworzno III to Towarzystwo Funduszy Inwestycyjnych PZU SA (TFI PZU). It operates Brzeszcze mine through Nowe Brzeszcze Grupa Tauron.
0.39 0.36 68%
Enea SA Poland Electric Utilities
Enea SA is a Poland-based company active in the energy sector. It is engaged in the production and distribution of electricity. The Company’s business is divided into three segments: Trading, Distribution, and Production. Enea SA provides energy from fossil fuels and renewable sources, including biomass co-combustion and hydroelectric stations. In addition, the Company is involved in the construction, extension, modernization and renovation of power grids and installations; designing, construction, production and sales of electric devices and equipment, and services related to the maintenance of street lights and low-voltage grids, among others. Enea SA is the parent company of the Enea SA Group comprises a number of subsidiaries. The Company’s major shareholder is the Polish State. It operates through Lubelski Wegiel Bogdanka SA.
0.53 0.47 63%
PGE Polska Grupa Energetyczna SA
Poland Electric Utilities
PGE Polska Grupa Energetyczna SA is a Poland-based company active in the power sector. The Company is involved in production, sale and distribution of electricity. The main areas of the Company's activity comprise six business lines: Conventional Power Generation, Wholesale, Retail, Distribution, Renewable power generation and Nuclear power generation. PGE Polska Grupa Energetyczna SA is a vertically integrated group which includes lignite mines (therein KWB Belchatow), power plants and cogeneration plants (including power plants that produce energy from renewable sources, wind power and hydropower plants), distribution system operators, retail sales companies, a wholesale trading company, as well as a company active in telecommunications industry.
1.10 1.08 30%
EDP Energias de Portugal SA
Portugal Electric Utilities
EDP Energias de Portugal SA is a Portugal-based utility company. Its segments are Long Term Contracted Generation in Iberia, which includes the activity of electricity generation of plants with contractual stability compensation and special regime generation plants in Portugal and Spain; Liberalized Activities in Iberia, which includes the activity of unregulated generation
0.47 0.46 57%

AEMO
Company Country Sector Description 5-year monthly asset beta
5-year weekly asset beta
Gearing (D/V)
and supply of electricity in Portugal and Spain, and gas in Spain; Regulated Networks in Iberia, which includes the activities of electricity distribution in Portugal and Spain, gas distribution in Spain, and last resort supplier; EDP Renovaveis, which includes power generation activity through renewable energy resources, and EDP Brasil, which includes the activities of electricity generation, distribution and supply in Brazil. It also operates in related areas, such as engineering, laboratory tests and property management.
Korea Electric Power Corp
South Korea
Electric Utilities
Korea Electric Power Corp is a Korea-based company principally engaged in the sale and delivery of electricity. The Company operates its business through four segments. The Electricity Sale Business segment is engaged in the sale and delivery of electricity and the development of power resources, among others. The Nuclear Power Business segment is engaged in the nuclear power, hydropower and pumped power generation business. The Thermal Power Business segment is engaged in power generation business such as bituminous coal, anthracite coal, liquefied natural gas (LNG) and others. The Other Business segment is involved in the design of power plants, the maintenance of power generation facilities, the supply of nuclear fuel, the provision of power information and communications technologies (ICT) services, the operation of renewable and solar power generation businesses, and the emission of greenhouse gases.
0.26 0.21 69%
Korea District Heating Corp
South Korea
Electric Utilities
Korea District Heating Corp is a Korea-based company mainly engaged in the supply of electricity. The Company directly sells power generated through new and renewable energy such as cogeneration plants and solar power to users in the power market or district heating supply area. The Company also supplies heat or heat and electricity, such as cogeneration plants, heat-only boilers, and resource recovery facilities, to users in residential, commercial or industrial complexes. In addition, the Company produces and supplies heat or heat and electricity using new and renewable energy and unused energy such as photovoltaic, solar, wind, biomass, incineration heat, landfill gas, waste heat, sewage heat, and waste. The Company also engages in monitoring, diagnosis and inspection business and call center operation business of heat transfer pipe facilities, and facility maintenance business such as security, security and cleaning of business facilities.
0.19 0.15 76%
Acciona SA Spain Electric Utilities
Acciona SA is a Spain-based holding company primarily engaged in the renewable utilities sector. The Company's activities are divided into five business segments: Energy, responsible for the renewable energy production, distribution and commercialization, as well as construction of wind farms; Infrastructure Construction, including construction and engineering activities, as well as transport and hospital concessions; Water, offering construction of desalination and water treatments plants, drinking water stations, as well as management of water cycle process; Service, providing facility services, airport handling services, waste collection and treatment, as well as logistics services, among others, and Other Activities, including fund management, stock brokerage, wine production, activities related to Acciona Trasmediterranes business and other investments. The Company operates worldwide through numerous subsidiaries.
0.33 0.33 57%

AEMO
Company Country Sector Description 5-year monthly asset beta
5-year weekly asset beta
Gearing (D/V)
Endesa SA Spain Electric Utilities
Endesa SA is a Spain-based holding company engaged in the business of electricity and gas generation, distribution, and sale, as well as related services. Its segments include Generation, along with Supply; Distribution, and Structure, including the balances and transactions of holding companies and financing companies. It is engaged in electricity business in its industrial and commercial areas. It is also engaged in the exploitation of primary energy resources; the provision of industrial services, particularly in the areas of telecommunications, water and gas, and investing in other companies. It generates, distributes and sells electricity mainly in Spain and Portugal. It also supplies electricity and gas to other European markets, in particular Germany, France, Belgium and the Netherlands, from its platform in Spain and Portugal. It is engaged in supplying value added services and products to customers. It distributes electricity to the consumption points.
0.36 0.57 18%
Iberdrola SA Spain Electric Utilities
IBERDROLA, S.A. is engaged in carrying out electricity and gas activities in Spain and abroad. The Company's segments include Network business, Deregulated business, Renewable business and Other businesses. The Company's Network business segment includes all the energy transmission and distribution activities, and any other regulated activity originated in Spain, the United Kingdom, the United States and Brazil. Its Deregulated business segment includes electricity generation and sales businesses, as well as gas trading and storage businesses carried on by the Company in Spain, Portugal, the United Kingdom and North America. Its Renewable business segment includes activities related to renewable energies in Spain, the United Kingdom, the United States and the rest of the world. Its Other businesses segment includes the engineering and construction businesses and the non-power businesses. The Company offers its customers power and natural gas, both in the wholesale and retail markets.
0.29 0.40 40%
Red Electrica Corporacion SA
Spain Electric Utilities
Red Electrica Corporacion SA is a Spain-based company engaged in the energy sector. The Company, through Red Electrica de Espana SAU (REE), focuses on the management of the Spanish high-voltage transmission grid, as well as is responsible for its development, maintenance and improvement of the network’s installations. Its activities also include the coordination among generation, transmission and distribution process of electric energy. In addition, the Company manages and leases telecommunications infrastructure, in particular fiber optic cables. The Company is a parent of the Red Electrica Group and operates through its subsidiaries and affiliates in a number of countries, such as Spain, the Netherlands, Luxembourg, Peru, Chile and France.
0.26 0.36 33%
SSE PLC UK Electric Utilities
SSE PLC is an energy company. The Company is engaged in the generation, transmission, distribution and supply of electricity, in the production, storage, distribution and supply of gas and in other energy services. Its segments include Electricity Transmission, Electricity Distribution, Gas Distribution, Renewables, Thermal Generation, Gas Storage, Business Energy, Airtricity, Enterprise and Energy Portfolio Management (EPM). It owns, maintains and invests in the electricity transmission network in the north of Scotland. It holds shares in Scotia Gas Networks, which operates two regulated gas distribution networks in Scotland and the
0.39 0.59 34%
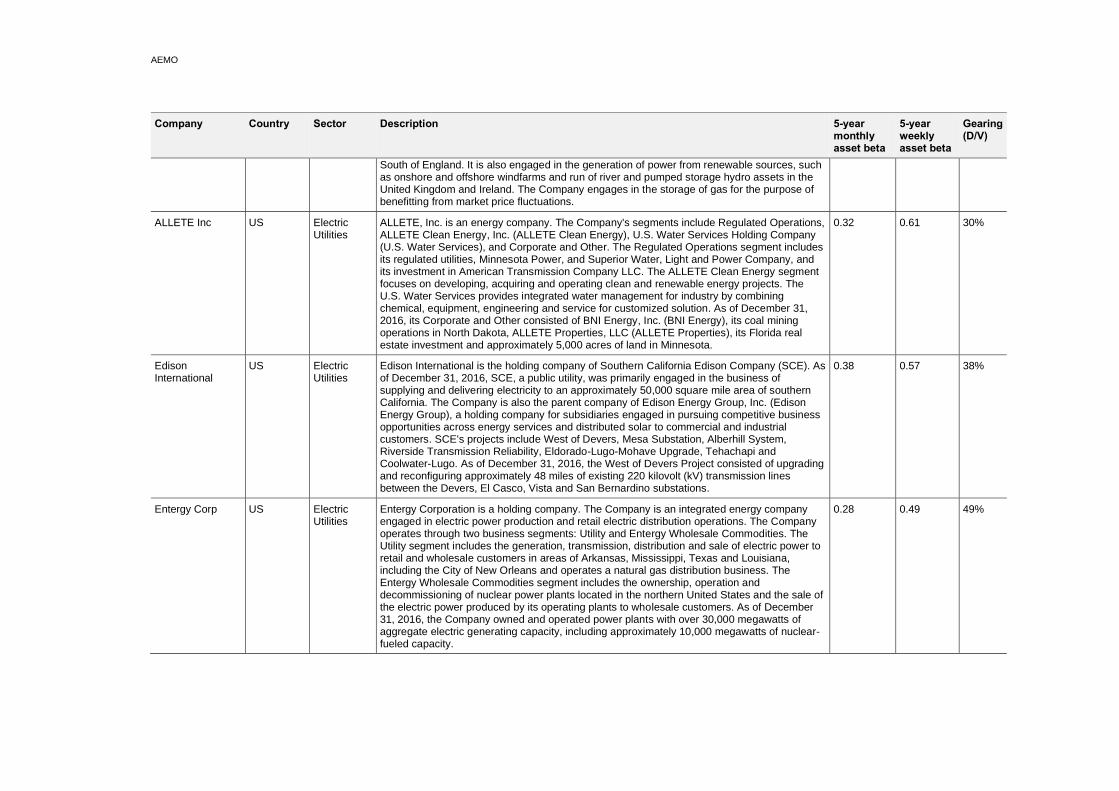
AEMO
Company Country Sector Description 5-year monthly asset beta
5-year weekly asset beta
Gearing (D/V)
South of England. It is also engaged in the generation of power from renewable sources, such as onshore and offshore windfarms and run of river and pumped storage hydro assets in the United Kingdom and Ireland. The Company engages in the storage of gas for the purpose of benefitting from market price fluctuations.
ALLETE Inc US Electric Utilities
ALLETE, Inc. is an energy company. The Company's segments include Regulated Operations, ALLETE Clean Energy, Inc. (ALLETE Clean Energy), U.S. Water Services Holding Company (U.S. Water Services), and Corporate and Other. The Regulated Operations segment includes its regulated utilities, Minnesota Power, and Superior Water, Light and Power Company, and its investment in American Transmission Company LLC. The ALLETE Clean Energy segment focuses on developing, acquiring and operating clean and renewable energy projects. The U.S. Water Services provides integrated water management for industry by combining chemical, equipment, engineering and service for customized solution. As of December 31, 2016, its Corporate and Other consisted of BNI Energy, Inc. (BNI Energy), its coal mining operations in North Dakota, ALLETE Properties, LLC (ALLETE Properties), its Florida real estate investment and approximately 5,000 acres of land in Minnesota.
0.32 0.61 30%
Edison International
US Electric Utilities
Edison International is the holding company of Southern California Edison Company (SCE). As of December 31, 2016, SCE, a public utility, was primarily engaged in the business of supplying and delivering electricity to an approximately 50,000 square mile area of southern California. The Company is also the parent company of Edison Energy Group, Inc. (Edison Energy Group), a holding company for subsidiaries engaged in pursuing competitive business opportunities across energy services and distributed solar to commercial and industrial customers. SCE's projects include West of Devers, Mesa Substation, Alberhill System, Riverside Transmission Reliability, Eldorado-Lugo-Mohave Upgrade, Tehachapi and Coolwater-Lugo. As of December 31, 2016, the West of Devers Project consisted of upgrading and reconfiguring approximately 48 miles of existing 220 kilovolt (kV) transmission lines between the Devers, El Casco, Vista and San Bernardino substations.
0.38 0.57 38%
Entergy Corp US Electric Utilities
Entergy Corporation is a holding company. The Company is an integrated energy company engaged in electric power production and retail electric distribution operations. The Company operates through two business segments: Utility and Entergy Wholesale Commodities. The Utility segment includes the generation, transmission, distribution and sale of electric power to retail and wholesale customers in areas of Arkansas, Mississippi, Texas and Louisiana, including the City of New Orleans and operates a natural gas distribution business. The Entergy Wholesale Commodities segment includes the ownership, operation and decommissioning of nuclear power plants located in the northern United States and the sale of the electric power produced by its operating plants to wholesale customers. As of December 31, 2016, the Company owned and operated power plants with over 30,000 megawatts of aggregate electric generating capacity, including approximately 10,000 megawatts of nuclear-fueled capacity.
0.28 0.49 49%

AEMO
Company Country Sector Description 5-year monthly asset beta
5-year weekly asset beta
Gearing (D/V)
Idacorp Inc US Electric Utilities
IDACORP, Inc. is a holding company. The Company's principal operating subsidiary is Idaho Power Company (Idaho Power). The Company's segment is utility operations. The utility operations segment's primary source of revenue is the regulated operations of Idaho Power. Idaho Power is an electric utility engaged in the generation, transmission, distribution, sale and purchase of electric energy and capacity. Idaho Power is the parent of Idaho Energy Resources Co. (IERCo), a joint venturer in Bridger Coal Company, which mines and supplies coal to the Jim Bridger generating plant owned in part by Idaho Power. Its subsidiaries also include IDACORP Financial Services, Inc., an investor in affordable housing and other real estate investments, and Ida-West Energy Company, an operator of small hydroelectric generation projects. As of December 31, 2016, Idaho Power provided electric utility service to approximately 535,000 general business customers in southern Idaho and eastern Oregon.
0.35 0.59 29%
NRG Energy Inc US Electric Utilities
NRG Energy, Inc. (NRG) is an integrated power company. The Company generates electricity and provide energy solutions and natural gas to residential, small business, and commercial and industrial customers through its diverse portfolio of retail brands. The Company's segments are Texas, East and West/Other. The Company’s Texas segment includes all activity related to customer, plant and market operations in Texas. Its East segment include all the customer operations related to energy solutions in North America. The Company’s West/Other segment include the operations of Cottonwood power plant and other solar generating assets.
0.25 0.36 70%
OGE Energy Corp US Electric Utilities
OGE Energy Corp. (OGE Energy) is an energy and energy services provider offering physical delivery and related services for both electricity and natural gas primarily in the south central United States. The Company operates through two segments: electric utility and natural gas midstream operations. The electric utility segment generates, transmits, distributes and sells electric energy in Oklahoma and western Arkansas. Its operations are conducted through Oklahoma Gas and Electric Company (OG&E). OG&E is an electric utility in Oklahoma and its franchised service territory includes Fort Smith, Arkansas and the surrounding communities. The natural gas midstream operations segment represents the Company's investment in Enable Midstream Partners, LP (Enable) through subsidiaries, and ultimately OGE Enogex Holdings LLC (OGE Holdings). Enable's assets and operations are organized into two segments: gathering and processing, and transportation and storage.
0.46 0.77 29%
PG&E Corp US Electric Utilities
PG&E Corporation is a holding company. The Company's primary operating subsidiary is Pacific Gas and Electric Company (the Utility), which operates in northern and central California. The Utility is engaged in the sale and delivery of electricity and natural gas to customers. The Utility generates electricity and provides electricity transmission and distribution services throughout its service territory in northern and central California to residential, commercial, industrial, and agricultural customers. The Utility provides bundled services (electricity, transmission and distribution services) to various customers in its service territory. The Utility owns approximately 18,000 circuit miles of interconnected transmission
0.63 0.77 54%

AEMO
Company Country Sector Description 5-year monthly asset beta
5-year weekly asset beta
Gearing (D/V)
lines operating at voltages ranging from 60 kilovolt (kV) to 500 kV. It also operates 35 electric transmission substations with a capacity of approximately 66,000 megavolt ampere (MVA).
PNM Resources Inc
US Electric Utilities
PNM Resources, Inc. (PNMR) is an investor-owned holding company with approximately two regulated utilities providing electricity and electric services in New Mexico and Texas. PNMR's electric utilities are Public Service Company of New Mexico (PNM) and Texas-New Mexico Power Company (TNMP). It operates in three segments: PNM, TNMP, and Corporate and Other. The Company, through its Website provides information, including news releases, notices of Webcasts, and filings. PNM is an electric utility that provides electric generation, transmission and distribution service to its rate-regulated customers. TNMP is a regulated utility operating in Texas. TNMP provides transmission and distribution services in Texas under the provisions of Texas Electric Choice Act (TECA) and the Texas Public Utility Regulatory Act. The Corporate and Other segment includes PNMR holding company activities, related to corporate level debt and PNMR Services Company.
0.29 0.62 43%
PPL Corp US Electric Utilities
PPL Corporation (PPL) is a utility holding company. Through its subsidiaries, PPL delivers electricity to customers in the United Kingdom, Pennsylvania, Kentucky, Virginia and Tennessee; delivers natural gas to customers in Kentucky, and generates electricity from power plants in Kentucky. PPL operates through U.K. Regulated Segment, Kentucky Regulated Segment and Pennsylvania Regulated Segment. The U.K. Regulated Segment consists of PPL Global, which includes PPL WPD Limited's (WPD) regulated electricity distribution operations, the results of hedging the translation of WPD's earnings from British pound sterling into United States dollars, and certain costs, such as the United States income taxes, administrative costs and allocated financing costs. Kentucky Regulated segment consists of the operations of Louisville Gas and Electric Company (LG&E) and KU Energy LLC (LKE). The Pennsylvania Regulated segment consists of PPL Electric Utilities Corporation (PPL Electric).
0.42 0.62 46%
Southern Co US Electric Utilities
The Southern Company (Southern Company) is a holding company. The Company owns all of the stock of the traditional electric operating companies and the parent entities of Southern Power Company (Southern Power) and Southern Company Gas, and owns other direct and indirect subsidiaries. The Company owns all of the common stock of Alabama Power Company (Alabama Power), Georgia Power Company (Georgia Power), and Mississippi Power Company (Mississippi Power), each of which is an operating public utility company. The primary business of the Southern Company system is electricity sales by the traditional electric operating companies and Southern Power and the distribution of natural gas by Southern Company Gas. The Company's segments include Gas distribution operations, Gas marketing services, Wholesale gas services, Gas Pipeline investments and All other.
0.25 0.49 44%
Clearway Energy Inc
US Electric Utilities
Clearway Energy, Inc is a renewable energy company. The Company's segments include Conventional and Renewables. Its conventional projects include Carlsbad, El Segundo, GenConn Devon, GenConn Middletown, Marsh Landing and Walnut Creek. The utility scale solar projects include Agua Caliente, Alpine, Avenal, Avra Valley, Blythe, Borrego, Buckthorn
0.25 0.26 64%

AEMO
Company Country Sector Description 5-year monthly asset beta
5-year weekly asset beta
Gearing (D/V)
Solar, CVSR, Desert Sunlight 250, Desert Sunlight 300, Kansas South, Kawailoa, Oahu Solar Projects, Roadrunner, Rosamond Central, TA High Desert and Utah Solar Portfolio. Its distributed solar projects include DGPV Fund Projects, Solar Power Partners (SPP) Projects and Other DG Projects. The thermal projects include CA Fuel Cell, ECP Uptown Campus, Energy Center Pittsburgh, Energy Center Caguas, Paxton Creek Cogen, Princeton Hospital, Tucson Convention Center and University of Bridgeport.
TransAlta Corp Canada Independent Power Producers & Energy Traders
TransAlta Corp is a power generating company. The Company owns, operates and manages a portfolio of assets representing approximately 8,273 megawatts (MW) of capacity and uses a range of generation fuels comprised of coal, natural gas, water, solar and wind. Its segments include Generation Segments and Energy Marketing Segment. Generation Segments include six segments: Canadian Coal, United States (US) Coal, Canadian Gas, Australian Gas, Wind and Solar and Hydro. Its Energy Marketing segment is engaged in the wholesale trading of electricity and other energy-related commodities and derivatives. Energy Marketing manages available generating capacity as well as the fuel and transmission needs of the generation segments by utilizing contracts of various durations for the forward sales of electricity and for the purchase of natural gas and transmission capacity.
0.46 0.45 65%
Capital Power Corp
Canada Independent Power Producers & Energy Traders
Capital Power Corporation is a North American power producing company. The Company develops, acquires, operates and optimizes power generation from a range of energy sources. The Company is engaged in the operation of electrical generation facilities within Canada, including Alberta, British Columbia and Ontario, and in the United States, including North Carolina, New Mexico and Kansas. It also holds a portfolio of wind and solar development sites in the United States. It owns over 3,200 megawatts (MW) of power generation capacity at approximately 20 facilities across North America and owns approximately 370 MW of capacity through its interest in the Sundance C power purchase arrangement (Sundance PPA). It also owns natural gas, wind, and solid fuel facilities and has a range of generation facilities in development or construction in Canada and the United States. Its facilities include Clover Bar Energy Centre 1, 2 and 3, Genesee 3, Clover Bar Landfill Gas and K2 Wind.
0.43 0.65 42%
China Power International Development Ltd
Hong Kong Independent Power Producers & Energy Traders
China Power International Development Limited is an investment holding company principally engaged in the sales of electricity to regional and provincial power grid companies. The Company is also engaged in the provision for power generation and related services. The Company operates its business through two segments: Generation and Sales of Coal-fired Electricity segment and Generation and Sales of Hydropower Electricity segment.
0.17 0.24 70%
China Resources Power Holdings Co Ltd
Hong Kong Independent Power Producers & Energy Traders
China Resources Power Holdings Company Limited is a Hong Kong-based investment holding company principally engaged in the investment, development and operation of power plants. The Company operates through three segments. Thermal Power segment is engaged in the investment, development, operation and management of coal-fired power plants and gas-fired power plants, as well as the sales of heat and electricity. Renewable Energy segment is engaged in wind power generation, hydroelectric power generation and photovoltaic power
0.23 0.35 51%

AEMO
Company Country Sector Description 5-year monthly asset beta
5-year weekly asset beta
Gearing (D/V)
generation, as well as the sales of electricity. Coal Mining segment is engaged in the mining of coal mines, as well as the sales of coal. The Company mainly operates businesses in China.
ERG SpA Italy Independent Power Producers & Energy Traders
ERG SpA is an Italy-based independent power producer active in the renewable energy sector, which generates energy mostly from wind, solar, hydroelectric and thermoelectric sources. The Company’s activities are divided into three segments: Non-Programmable sources, Programmable sources and Corporate. The Non-Programmable sources segment manages the operations of the wind power production; the Programmable sources segment includes the operations of the thermoelectric and hydroelectric power generation; and the Corporate segment focuses on the administrative activities. The Company operates through its subsidiaries in Europe, mainly in Italy, France and Germany.
0.27 0.36 49%
Electric Power Development Co Ltd
Japan Independent Power Producers & Energy Traders
Electric Power Development Co Ltd is mainly engaged in electricity generation business. The Company operates in four business segments. The Electricity segment engages in power generation business including hydroelectric power generation, thermal power generation and wind power generation, as well as provision of electricity. The Electricity-Related segment engages in design, installation, maintenance and repair of electrical power equipment, the port operation of fuel and coal ash, the coal mine development, the import of coal, the procurement and manufacture of biomass fuel, the operation of public health facilities, as well as the provision of computer services. The Overseas Operation segment is in the operation of electrical power generation investment business and other related businesses, engineering and consulting businesses in overseas. The Others segment engages in new electricity business, environment-related business and others.
0.25 0.27 72%
KG Eco Technology Services Co Ltd
South Korea
Independent Power Producers & Energy Traders
KG Eco Technology Services Co., Ltd. is a Korea-based company principally engaged in the manufacture and sale of steam. The Company operates its business through four segments. The Environment and Energy Business segment operates waste incinerators and produces steam through incinerators and boilers. The Bio Business segment manufactures bio heavy oil. The New Material Business segment produces high purity copper oxide, general copper oxide, copper sulfate and others. The Common segment engaged in the investment property business.
0.56 0.81 14%
Drax Group PLC UK Independent Power Producers & Energy Traders
Drax Group PLC is a United Kingdom-based energy generator. The Company operates a portfolio of renewable biomass and hydro assets to provide renewable and low-carbon generation and system support services. It operates through three segments: Generation, Customers and Pellet Production. The Generation segment includes its power generation activities in the United Kingdom (UK). The Customers segment is engaged in the supply of electricity and gas to business customers in the UK. The Pellet Production segment is engaged in the production of sustainable compressed wood pellets at its processing facilities in the United States (US). The Customers segment supplies renewable electricity to businesses through Haven Power and Opus Energy. Haven Power supplies and manages electricity for large industrial and commercial sector customers, as well as small businesses.
1.02 0.74 33%

AEMO
Company Country Sector Description 5-year monthly asset beta
5-year weekly asset beta
Gearing (D/V)
Opus Energy provides a market for excess power from energy sources, such as wind, solar, hydro and anaerobic digestion.
AES Corp US Independent Power Producers & Energy Traders
The AES Corporation is a holding company. The Company, through its subsidiaries, operates a diversified portfolio of electricity generation and distribution businesses. The Company is organized into four market-oriented strategic business units (SBUs): US and Utilities (United States, Puerto Rico and El Salvador); South America (Chile, Colombia, Argentina and Brazil); MCAC (Mexico, Central America and the Caribbean), and Eurasia (Europe and Asia). It has two lines of business: generation and utilities. The generation business owns and/or operates power plants to generate and sell power to customers, such as utilities, industrial users, and other intermediaries. The Company's utilities business owns and/or operates utilities to generate or purchase, distribute, transmit and sell electricity to customers in the residential, commercial, industrial and governmental sectors within a defined service area.
0.25 0.35 69%
TransAlta Renewables Inc
Canada Renewable Electricity
TransAlta Renewables Inc. is a Canada-based company that owns a portfolio of renewable and natural gas power generation facilities and other infrastructure assets. The Company has interests in approximately 23 wind facilities, 13 hydroelectric facilities, seven natural gas generation facilities, one solar facility, one natural gas pipeline, and one battery storage project, representing an ownership interest of over 2,537 megawatts of owned generating capacity, located in the provinces of British Columbia, Alberta, Ontario, Quebec, New Brunswick, the States of Wyoming, Massachusetts, Minnesota and the State of Western Australia. Its facilities include South Hedland Power Station, Southern Cross, Sarnia, Parkeston, Fortescue River Gas Pipeline, Akolkolex, Appleton, Bone Creek, Galetta, Moose Rapids, Taylor Hydro, Waterton, Big Level, Le Nordais, New Richmond, Summerview 1, Wolfe Island and Kent Hills.
0.49 0.75 22%
Boralex Inc Canada Renewable Electricity
Boralex Inc is a Canada-based power producer that develops, constructs and operates renewable energy power stations. The Company's segments include wind, hydroelectric, thermal and solar. It operates an asset base with a capacity of approximately 1,260 megawatts (MW), of which over 1,090 MW are under its control, consisting of approximately 490 MW in Canada, over 520 MW in France and over 80 MW in the Northeastern United States. It operates approximately 870 MW wind power portfolio of assets in France and Canada. It also owns the rights to portfolio of wind power projects in France. It is also a wind power operator in Canada with an installed capacity of approximately 550 MW in Quebec and Ontario.
0.22 0.39 60%
Brookfield Renewable Partners LP
Canada Renewable Electricity
Brookfield Renewable Partners L.P. is the owner and operator of a portfolio of assets that generate electricity from renewable resources. The Company operates as a pure-play renewable power platform. Its segments include Hydroelectric, Wind, Solar, Storage & Other, and Corporate. It operates renewable power generating assets, which include conventional hydroelectric facilities and wind facilities located in North America, Colombia, Brazil and Europe. The Company’s portfolio consists of approximately 19,400 megawatts (MW) of capacity and 5, 274 generating facilities in North America, South America, Europe and Asia. It
0.20 0.27 70%

AEMO
Company Country Sector Description 5-year monthly asset beta
5-year weekly asset beta
Gearing (D/V)
has over 18,000 MW renewable power generation development pipeline diversified across 27 markets in over 17 markets.
Northland Power Inc
Canada Renewable Electricity
Northland Power Inc. is a Canada-based power producer. The Company is focused on developing, building, owning and operating clean and green power infrastructure assets in Canada, Europe and other selected global jurisdictions. Its segments include Offshore Wind, Thermal, On-shore Renewable and Other. Offshore Wind segment includes Gemini and Nordsee One operating facilities. Thermal segment includes Iroquois Falls, Kingston, Kirkland Lake, North Battleford, Spy Hill and Thorold operating facilities. On-shore Renewable segment includes Cochrane Solar, Grand Bend, Jardin, McLean's, Mont Louis and Solar operating facilities. Its facilities produce electricity from clean-burning natural gas and renewable resources, such as wind, solar and biomass. The Company owns or has a net economic interest in approximately 2,014 megawatts (MW) of power-producing facilities with a total operating capacity of approximately 2,429 MW.
0.17 0.35 61%
Albioma SA France Renewable Electricity
Albioma SA is a France-based independent power producer. The Company specializes in the design, construction, management and operation of electrical power cogeneration plants. The Company is principally engaged in the production of energy from combined bagasse and coal power plants located in the French overseas departments, fuel oil thermal power plant and gas-powered plants. Furthermore, it produces renewable energy resources. The Company also operates around five wind farms in France and is active in the solar energy sector. The Company operates via its subsidiaries in the French overseas departments in the Caribbean and Indian Ocean Regions, as well as in mainland France, Italy and Spain.
0.25 0.35 53%
Encavis AG Germany Renewable Electricity
Encavis AG, formerly Capital Stage AG, is a Germany-based producer of electricity from renewable energy sources. The Company invests in solar and wind parks, which it also operates. The Company divides its activities into four segments: Solar Parks, which is engaged in acquisition and operation of ground mounted photovoltaic (PV) parks; Wind Parks, engaged in acquisition and operation of onshore wind parks; Institutional Clients, which, through Encavis Asset Management AG, offers customized portfolios or fund solutions for investments in renewable energies, and Technical Services, responsible for technical operation and maintenance of PV parks. The Company focuses on the acquisition of finished solar and wind parks that are already connected to the power supply system. The Company operates more than 160 solar and more than 60 wind parks across Europe, in Germany, Italy, France and the United Kingdom, among others, with a total windparks in Germany, Italy, France and the United Kingdom.
0.16 0.32 61%
China Datang Corp Renewable Power Co Ltd
Hong Kong Renewable Electricity
China Datang Corporation Renewable Power Co., Limited is mainly engaged in power generation and the sales of electricity. The Company operates its business through four segments: Sales of Electricity, Provision of Services Under Energy Performance Contracts, Provision of Services Under Concession Arrangements and Other Revenues. The Other Revenues segment mainly represents rental income from power plant facilities, repair and maintenance services.
0.14 0.16 87%

AEMO
Company Country Sector Description 5-year monthly asset beta
5-year weekly asset beta
Gearing (D/V)
Beijing Enterprises Clean Energy Group Ltd
Hong Kong Renewable Electricity
Beijing Enterprises Clean Energy Group Limited is an investment holding company principally engaged in the investment, development, construction, operation and management of photovoltaic power businesses, wind power businesses, clean heat supply businesses and other clean energy businesses in the People's Republic of China (PRC). The Company's business activities include the sales of electricity generated by photovoltaic and wind power plants; the provision of entrusted management services for photovoltaic and wind power plant projects; the provision of clean heat supply services by using different clean energies to produce low emission heat; and the provision of engineering, procurement, construction and technical consultancy services for clean energy projects.
0.65 0.37 67%
China Longyuan Power Group Corp Ltd
Hong Kong Renewable Electricity
China Longyuan Power Group Corporation Limited is a Hong Kong-based investment holding company principally engaged in the operation of power plants and the generation of electric power. The Company operates its businesses through two segments. The Wind Power segment is engaged in the construction, management and operation of wind power plants, as well as the generation of electric power for sales to power grid companies. The Coal Power segment is engaged in the construction, management and operation of coal power plants, as well as the generation of electric power for sales to power grid companies. This segment is also engaged in the trading of coal. Other businesses of the Company include the manufacture and sales of power equipment, the provision of consulting services, the provision of maintenance and training services to wind power enterprises, as well as other renewable power generation.
0.47 0.52 51%
Energix Renewable Energies Ltd
Israel Renewable Electricity
Energix Renewable Energies Ltd is an Israel-based Company engaged in the alternative energy sector. The Company invests in wind energy projects.
0.53 0.62 32%
Enlight Renewable Energy Ltd
Israel Renewable Electricity
Enlight Renewable Energy Ltd is an Israel-based investment company active in the renewable energy sector. It specializes in initiating, developing, constructing and operating clean electricity production projects from renewable energy sources, such as solar and wind. Among the Company’s projects are Kibbutz Alonim Site; Moshav Yonatan Site; Moshav Ramat Magshimim Site; Emek Sara Site, Beer Sheva Industrial Area; Haplada Site, Arad Industrial Area; Hanapach Site, Carmiel; Hod Hashron Municipality; Kibbutz Cramim, Solar Farm; Odakim Municipality; Kiryat Yam Municipality; Kiryat Bialik Municipality and Israeli Ministry of Defense.
0.30 0.30 72%
Falck Renewables SpA
Italy Renewable Electricity
Falck Renewables SpA is an Italy-based company primarily engaged in the renewable energy sector. The Company is an independent power producer from renewable sources through wind farms, waste-to-energy (WtE) process, biomass and photovoltaic plants. It is also engaged in the waste treatment and disposal. Additionally, the Company is involved in the operation and maintenance of third party renewable energy power plants. It operates across Europe through numerous subsidiaries. The Company through Energy Team SpA is also active as a manufacturer of totalizing fluid meters and counting devices for the energy industry.
0.27 0.36 60%

AEMO
Company Country Sector Description 5-year monthly asset beta
5-year weekly asset beta
Gearing (D/V)
Alerion Clean Power SpA
Italy Renewable Electricity
Alerion Clean Power SpA is an Italy-based holding company primarily engaged in the utilities industry. The Company is involved in the electrical power generation from renewable energy. Alerion Clean Power SpA produces electricity mainly in wind farms, as well as in solar energy panels and biomass energy plants. The Company’s power plants are located in Romania, Bulgaria and in the domestic market, including Agrigento, Callari, Castel di Lucio, Ordona nad Licodia, among others. Alerion Clean Power SpA operates through numerous direct subsidiaries, including Alerion Energie Rinnovabili SpA, Alerion Bioenergy Srl, Alerion Servizi Tecnici e Sviluppo Srl, Durini 18 Srl and Alerion Real Estate Srl in liquidazione.
0.24 0.22 64%
eREX Co Ltd Japan Renewable Electricity
eREX Co.,Ltd. is a Japan-based power producer and supplier (PPS), engaged in the electric power distribution via power grid owned by general electric utilities. The Company’s electric power businesses include electric power retail, electric market trading and power supplies development. In its electric power retail business, it involves in the retail of electric power in an inexpensive price than electric utilities. In its power supplies development business, it involves in the planning, design and construction of power-generating equipment.
0.98 0.86 24%
Meridian Energy Ltd
New Zealand
Renewable Electricity
Meridian Energy Limited is engaged in the business of generation, trading and retailing of electricity, and the sale of complementary products and services. The Company operates through three segments: Wholesale, Retail and International. The Wholesale segment includes activity associated with its New Zealand generation of electricity and its sale into the wholesale electricity market; purchase of electricity, and development of renewable electricity generation opportunities. The Retail segment includes activity associated with retailing of electricity and complementary products through its two brands: Meridian and Powershop in New Zealand. The International segment includes activity associated with its generation of electricity and sale into the wholesale electricity market; retailing of electricity through the Powershop brand in Australia, and licensing of the Powershop platform in the United Kingdom. The Company supplies electricity to power homes, businesses and farms.
1.18 1.08 13%
EDP Renovaveis SA
Spain Renewable Electricity
EDP Renovaveis SA, also known as EDPR, is a Spain-based company active in the renewable energy sector. The Company concentrates on the production of energy from renewable resources. The Company's activities comprise the development, operation and maintenance of such electric power stations as hydroelectric, wind, solar, tidal, biomass and waste plants, among others. It operates in Spain, Portugal, Belgium, France, Italy, Poland, Romania, the United Kingdom, Brasil, the United States, as well as Canada.
0.66 0.69 36%
Arise AB Sweden Renewable Electricity
Arise AB, formerly Arise Windpower AB, is a Sweden-based company active in the renewable energy sector. The Company is engaged in the marketing of electricity generated using its own wind turbines. Its operations are divided into two operating segments: Wind Power Operations and Other Wind Power Development. As of December 31, 2011, the Company’s project portfolio consisted of three operational Generation One projects in Oxhult, Rabelov and Brunsmo, three Generation Two projects in Froslida, Idhult, Kaphult, as well as four Generation Three projects in Sodra Karra, Blekhem, Gettnabo and Skappentorp. As of December 31, 2011, it had 22 Generation One turbines, 24 Generation Two turbines and 19
0.41 0.35 63%

AEMO
Company Country Sector Description 5-year monthly asset beta
5-year weekly asset beta
Gearing (D/V)
Generation Three turbines. As of December 31, 2011, the Company had 17 wholly owned subsidiaries, such as Arise Elnat AB, Arise Service AB, Arise Kran AB, Arise Wind Farm 1 AB and Arise Wind Farm 2 AB, among others.
Atlantica Sustainable Infrastructure PLC
US Renewable Electricity
Atlantica Sustainable Infrastructure PLC, formerly Atlantica Yield plc, is an infrastructure company. The Company owns and manages renewable energy, natural gas, transmission and transportation infrastructures and water assets. It has operating facilities in North America, including United States, Canada and Mexico; South America, including Peru, Chile and Uruguay, and EMEA, including Spain, Algeria and South Africa. It operates in business sectors, such as Renewable energy, Efficient natural gas, Electric transmission and Water. Its portfolio consists of approximately 25 assets with 1,496 megawatts (MW) of aggregate renewable energy installed generation capacity, 343 MW of efficient natural gas-fired power generation capacity, 10.5 cubic meter (M) ft per day of water desalination and approximately 1,166 miles of electric transmission lines.
0.18 0.23 70%
Nextera Energy Partners LP
US Renewable Electricity
Nextera Energy Partners LP is a United States-based company. The Company owns, operates and acquires contracted clean energy projects. The Company operates in wind and solar projects in the U.S and natural gas infrastructure assets in Texas and Pennsylvania. The Company's project portfolio of clean, contracted renewable energy assets (initial portfolio) included approximately 4859 megawatts (MW) of wind and solar energy generating facilities located in the United States and Canada.
0.26 0.35 64%
Source: Synergies analysis, Refinitiv (Thomson Reuters)
DIS
CO
UN
T R
AT
ES
F
OR
U
SE
IN
C
OS
T B
EN
EF
IT A
NA
LY
SIS
O
F A
EM
O'S
2022 IN
TE
GR
AT
ED
S
YS
TE
M P
LA
N 29/0
7/2
02
1
09:3
8:0
0
PA
GE
71 o
f 72

DISCOUNT RATES FOR USE IN COST BENEFIT ANALYSIS OF AEMO'S 2022 INTEGRATED SYSTEM PLAN Page 72 of 72