Digital tabletops and collaborative learning
237
Digital Tabletops and Collaborative Learning Thesis by Ahmed N. S. Kharrufa In Partial Fulfillment of the Requirements for the Degree of Doctor of Philosophy School of Computing Science Newcastle University Newcastle upon Tyne, UK 2010
Transcript of Digital tabletops and collaborative learning

Digital Tabletops and CollaborativeLearning
Thesis by
Ahmed N. S. Kharrufa
In Partial Fulfillment of the Requirements
for the Degree of
Doctor of Philosophy
School of Computing Science
Newcastle University
Newcastle upon Tyne, UK
2010

ii
Abstract
People collaborate around tables at home, school and work. Digital tabletop technology presents
an opportunity to bring computer support to these traditional face-to-face collaborative settings.
This thesis principally addresses the challenge of designing digital tabletop applications for small
group learning in the classroom and makes contributions in two distinct, but closely related ar-
eas: (i) interaction techniques for digital tabletops; and (ii) the design and evaluation of a digital
tabletop-based system for supporting collaborative learning. A review of previous literature com-
bined with a preliminary observational study on collaboration around traditional tables indentifies
a number of requirements for tabletop interaction. These include the need for fluid interaction
techniques that allow control of interface object attributes when these objects are moved between
tabletop territories. Attribute gates are proposed as a solution to this problem through utilizing
a novel, crossing-based, interaction technique. A recognition of the territorial focus in existing
interaction techniques, and their limiting assumption that users work at relatively fixed locations
around the table, led to the identification of another challenge, supporting the mobility of users
around the shared workspace of the table. TANGISOFT is presented as a hybrid tangible-soft key-
board designed specifically for applications that require mobile users with moderate text entry
requirements. The investigation of the potential of tabletop technology to support collaborative
learning was carried out through the design, development, and evaluation of Digital Mysteries.
From an interaction design perspective, the design aimed to utilize the unique affordances of
tabletops in terms of combining the benefits of traditional tables and digital technology. From a
learning perspective, the design aimed to support higher-level thinking skills, feedback, reflection,
and metacognition by focusing on activities that promote these skills and supporting effective col-
laboration. The evaluation of Digital Mysteries demonstrated that the design was successful in
encouraging the targeted learning activities. The design process and validation of Digital Myster-
ies embody a significant contribution to the development of our understanding of digital tabletop
technology at the application level, and collaborative learning applications in particular. This un-
derstanding is summarized in the form of general guidelines for designing collaborative learning
applications for digital tabletop technology.

iii
Publications arising from this thesis
The following published papers are based wholly or in part on work contained in this thesis (note
my change of surname used in publications from Sulaiman to Kharrufa in 2009)
Kharrufa, A. S., Olivier, P., & Leat, D. (2010). Learning Through Reflection at the Tabletop: A
Case Study with Digital Mysteries. In Proceedings of the World Conference on Educational
Multimedia, Hypermedia and Telecommunications (Toronto, Canada, June 29-July 2, 2010)
pp. 665-674. (Chapters 5 and 6).
Kharrufa, A. S. & Olivier, P. (2010). Exploring the requirements of tabletop interfaces for educa-
tion. International Journal of Learning Technology, Vol. 5, No. 1, pp. 42-62. (Chapter 2).
Sulaiman, A., Olivier, P., & Heslop, P. (2009). TangiSoft: A Tangible Direct-Touch Tabletop
Keyboard. In Proceedings of the World Conference on Educational Multimedia, Hyper-
media and Telecommunications (Honolulu, HA, USA, June 22-26, 2009) pp. 918-926.
(Chapter 4).
Sulaiman, A., & Olivier, P. (2008). Attribute gates. In Proceedings of the 21st Annual ACM
Symposium on User interface Software and Technology (Monterey, CA, USA, October 19 -
22, 2008). UIST ’08. ACM, New York, NY, pp. 57-66. (Chapter 3).

iv
To the memory of my father, Prof. Najib S. Kharrufa.
Thank you for implanting in me the passion for learning.
To my wife, Zena. Thank you for your patience, understanding, and support.
Most of all, thank you for overlooking my chaotic desk for more than three years.

v
Acknowledgements
First, I would like to thank my supervisors, professors Patrick Olivier and David Leat for their
guidance and support. Special thanks to Professor Olivier for being my academic mentor as well
as my supervisor and for putting so much effort in reviewing the thesis to make sure it is presented
in the best way possible.
I would also like to thank Diwan Software Ltd. for sponsoring this research. I owe my deepest
gratitude to Dr. Ibrahim Allawi, Majed Allawi, and Adil Allawi for making this research possible
and for their continual support, and encouragement.
Thanks are also due to Anne de A’Echevarria and Anna Reid for helping in arranging and
conducting the studies at the Bedlingtonshire Community High School. Special thanks to Anna
Reid for conducting some of the studies by herself in order to provide the most natural setting
for the studies without the presence of external observers. I am thankful to the administration of
Bedlingtonshire Community High School where all the case studies for mysteries were conducted,
and of course special thanks to the students who participated in the studies.
I would also like to acknowledge the contribution of Promethean Limited for providing the
multi-pen Activboards. Thanks are also due to Doug Lamond for turning these Activeboards into
nice looking tables.
From Space 2 in Culture Lab, special thanks to Phil Heslop for helping with many of the
studies and for proof reading the thesis, and to Guy Schofield for helping with the art work and
video demonstration for Digital Mysteries. Thanks are also due to Tom Bartindale, James Thomas,
and Jon Hook for their help in conducting some of the studies; and to Robyn Taylor for lending
me her voice for the video demonstrations. I am grateful to Rafid Abdullah for his help in the final
stages of submitting the thesis. I would also like to extend my thanks to everyone in Space 2 for
providing help whenever needed.
Finally, I would like to show my gratitude to my family, and specially my mother, for their
encouragement and support. I would also like to thank my friends who, despite being scattered all
around the globe, showed their cyber-encouragement through the Internet.

vi
Contents
Abstract ii
Acknowledgements v
1 Introduction 11.1 Overview . . . . . . . . . . . . . . . . . . . . . . . . . . . . . . . . . . . . . . 1
1.2 Research context . . . . . . . . . . . . . . . . . . . . . . . . . . . . . . . . . . 3
1.2.1 Collaboration . . . . . . . . . . . . . . . . . . . . . . . . . . . . . . . . 3
1.2.2 Collaborative learning . . . . . . . . . . . . . . . . . . . . . . . . . . . 3
1.2.3 Computer support . . . . . . . . . . . . . . . . . . . . . . . . . . . . . 4
1.2.4 Computer support for collaborative learning . . . . . . . . . . . . . . . . 4
1.2.5 Single display groupware . . . . . . . . . . . . . . . . . . . . . . . . . . 5
1.3 Theories on CSCW . . . . . . . . . . . . . . . . . . . . . . . . . . . . . . . . . 6
1.3.1 Activity theory . . . . . . . . . . . . . . . . . . . . . . . . . . . . . . . 7
1.3.2 Distributed cognition . . . . . . . . . . . . . . . . . . . . . . . . . . . . 8
1.4 Digital tabletops . . . . . . . . . . . . . . . . . . . . . . . . . . . . . . . . . . . 9
1.4.1 Traditional tables as tools for collaboration . . . . . . . . . . . . . . . . 9
1.4.2 Digital tabletops as tools for collaboration . . . . . . . . . . . . . . . . 10
1.4.3 Design challenges for digital tabletops . . . . . . . . . . . . . . . . . . . 12
1.5 Research objectives . . . . . . . . . . . . . . . . . . . . . . . . . . . . . . . . . 12
1.6 Results and contributions . . . . . . . . . . . . . . . . . . . . . . . . . . . . . . 13
2 Literature Review 152.1 Introduction . . . . . . . . . . . . . . . . . . . . . . . . . . . . . . . . . . . . . 15
2.2 Work practices around tables . . . . . . . . . . . . . . . . . . . . . . . . . . . . 16
2.2.1 Spatial considerations . . . . . . . . . . . . . . . . . . . . . . . . . . . 18
2.2.1.1 Space and location . . . . . . . . . . . . . . . . . . . . . . . . 18
2.2.1.2 Orientation . . . . . . . . . . . . . . . . . . . . . . . . . . . . 21
2.2.1.3 Ownership and access rights . . . . . . . . . . . . . . . . . . 22
2.2.1.4 Scale . . . . . . . . . . . . . . . . . . . . . . . . . . . . . . . 22
2.2.1.5 Table size, group size, and the issue of reach . . . . . . . . . . 23

vii
2.2.1.6 Implications on digital tabletops design . . . . . . . . . . . . . 24
2.2.2 Communication . . . . . . . . . . . . . . . . . . . . . . . . . . . . . . . 27
2.2.2.1 Conversation . . . . . . . . . . . . . . . . . . . . . . . . . . . 27
2.2.2.2 Body position . . . . . . . . . . . . . . . . . . . . . . . . . . 27
2.2.2.3 Gaze and gesture . . . . . . . . . . . . . . . . . . . . . . . . . 27
2.2.2.4 Implications on digital tabletops design . . . . . . . . . . . . . 30
2.2.3 Tools . . . . . . . . . . . . . . . . . . . . . . . . . . . . . . . . . . . . 31
2.2.3.1 Table, pens and highlighters . . . . . . . . . . . . . . . . . . . 32
2.2.3.2 Hands and bimanual action . . . . . . . . . . . . . . . . . . . 32
2.2.3.3 Paper (documents and summary page) . . . . . . . . . . . . . 32
2.2.3.4 Implications on digital tabletops design . . . . . . . . . . . . 33
2.2.3.5 Two-handed interaction . . . . . . . . . . . . . . . . . . . . . 33
2.2.3.6 Tangible interaction . . . . . . . . . . . . . . . . . . . . . . . 34
2.2.3.7 Interaction techniques . . . . . . . . . . . . . . . . . . . . . . 34
2.3 Work on design guidelines . . . . . . . . . . . . . . . . . . . . . . . . . . . . . 36
2.4 Tabletops and learning . . . . . . . . . . . . . . . . . . . . . . . . . . . . . . . 38
2.5 Tabletop hardware . . . . . . . . . . . . . . . . . . . . . . . . . . . . . . . . . . 43
2.6 Summary . . . . . . . . . . . . . . . . . . . . . . . . . . . . . . . . . . . . . . 44
3 Attribute Gates 473.1 Introduction . . . . . . . . . . . . . . . . . . . . . . . . . . . . . . . . . . . . . 47
3.2 Motivation . . . . . . . . . . . . . . . . . . . . . . . . . . . . . . . . . . . . . . 49
3.3 The conceptual basis of Attribute Gates . . . . . . . . . . . . . . . . . . . . . . 51
3.3.1 Activity theory and chunking . . . . . . . . . . . . . . . . . . . . . . . . 51
3.3.2 Crossing-based interfaces . . . . . . . . . . . . . . . . . . . . . . . . . 52
3.3.3 Targeting and steering . . . . . . . . . . . . . . . . . . . . . . . . . . . 53
3.4 Attribute Gates: interaction . . . . . . . . . . . . . . . . . . . . . . . . . . . . . 53
3.4.1 Grid Gates . . . . . . . . . . . . . . . . . . . . . . . . . . . . . . . . . 54
3.4.2 Polar Gates . . . . . . . . . . . . . . . . . . . . . . . . . . . . . . . . . 54
3.4.3 Promoting awareness . . . . . . . . . . . . . . . . . . . . . . . . . . . . 56
3.4.4 Putting activity theory into practice . . . . . . . . . . . . . . . . . . . . 57
3.5 Attribute Gates: spatial configuration . . . . . . . . . . . . . . . . . . . . . . . . 59
3.6 Related work . . . . . . . . . . . . . . . . . . . . . . . . . . . . . . . . . . . . 62
3.7 Evaluation . . . . . . . . . . . . . . . . . . . . . . . . . . . . . . . . . . . . . . 64
3.7.1 Accuracy (sender) . . . . . . . . . . . . . . . . . . . . . . . . . . . . . 66
3.7.2 Awareness (receiver) . . . . . . . . . . . . . . . . . . . . . . . . . . . . 66
3.7.3 Performance . . . . . . . . . . . . . . . . . . . . . . . . . . . . . . . . 66
3.7.4 Participant views . . . . . . . . . . . . . . . . . . . . . . . . . . . . . . 67

viii
3.8 Discussion . . . . . . . . . . . . . . . . . . . . . . . . . . . . . . . . . . . . . . 67
4 TANGISOFT 724.1 Introduction . . . . . . . . . . . . . . . . . . . . . . . . . . . . . . . . . . . . . 72
4.2 Motivation . . . . . . . . . . . . . . . . . . . . . . . . . . . . . . . . . . . . . . 73
4.3 Activity theory, tangible and two-handed interaction . . . . . . . . . . . . . . . . 77
4.4 Design . . . . . . . . . . . . . . . . . . . . . . . . . . . . . . . . . . . . . . . . 78
4.4.1 Direct-touch input . . . . . . . . . . . . . . . . . . . . . . . . . . . . . 78
4.4.2 The keyboard as a tangible tool . . . . . . . . . . . . . . . . . . . . . . 79
4.4.3 Printed layout on paper . . . . . . . . . . . . . . . . . . . . . . . . . . . 79
4.4.4 Paper augmentation . . . . . . . . . . . . . . . . . . . . . . . . . . . . . 79
4.4.5 Comments on the design . . . . . . . . . . . . . . . . . . . . . . . . . . 79
4.5 Related work . . . . . . . . . . . . . . . . . . . . . . . . . . . . . . . . . . . . 80
4.6 Implementation . . . . . . . . . . . . . . . . . . . . . . . . . . . . . . . . . . . 82
4.7 Exploring the use of TANGISOFT . . . . . . . . . . . . . . . . . . . . . . . . . . 84
4.7.1 Observations and analysis . . . . . . . . . . . . . . . . . . . . . . . . . 86
4.8 Discussion . . . . . . . . . . . . . . . . . . . . . . . . . . . . . . . . . . . . . . 94
5 Tabletops and Learning - Digital Mysteries 965.1 Theoretical background . . . . . . . . . . . . . . . . . . . . . . . . . . . . . . . 97
5.1.1 Cognitive skills . . . . . . . . . . . . . . . . . . . . . . . . . . . . . . . 97
5.1.2 Metacognition, reflection, and feedback . . . . . . . . . . . . . . . . . . 98
5.1.3 Collaboration . . . . . . . . . . . . . . . . . . . . . . . . . . . . . . . . 101
5.1.4 Ill-defined and well-defined tasks . . . . . . . . . . . . . . . . . . . . . 102
5.2 Mysteries . . . . . . . . . . . . . . . . . . . . . . . . . . . . . . . . . . . . . . 103
5.3 Computer support . . . . . . . . . . . . . . . . . . . . . . . . . . . . . . . . . . 106
5.3.1 The added value of technology . . . . . . . . . . . . . . . . . . . . . . . 106
5.3.2 Tabletops and computer supported collaborative learning . . . . . . . . . 108
5.3.3 Evaluating the benefits of computer support . . . . . . . . . . . . . . . . 109
5.4 Distributed cognition as a design framework . . . . . . . . . . . . . . . . . . . . 110
5.4.1 The Tools . . . . . . . . . . . . . . . . . . . . . . . . . . . . . . . . . . 111
5.4.2 Representation states . . . . . . . . . . . . . . . . . . . . . . . . . . . . 111
5.5 Mysteries: from Paper to Digital . . . . . . . . . . . . . . . . . . . . . . . . . . 112
5.5.1 First iteration: design . . . . . . . . . . . . . . . . . . . . . . . . . . . . 112
5.5.2 First iteration: trials and observations . . . . . . . . . . . . . . . . . . . 114
5.5.2.1 General layout and externalization . . . . . . . . . . . . . . . 114
5.5.2.2 Breakdown moments . . . . . . . . . . . . . . . . . . . . . . 115
5.5.2.3 Common observations between paper and Digital Mysteries . . 116
5.5.3 Second iteration: design . . . . . . . . . . . . . . . . . . . . . . . . . . 116

ix
5.5.3.1 Interaction technique . . . . . . . . . . . . . . . . . . . . . . 116
5.5.3.2 Externalization and cognitive-tools . . . . . . . . . . . . . . . 117
5.5.3.3 Structuring the task . . . . . . . . . . . . . . . . . . . . . . . 119
5.5.3.4 Supporting collaboration . . . . . . . . . . . . . . . . . . . . 120
5.5.3.5 Scaffolding, feedback and reflection . . . . . . . . . . . . . . 123
5.5.4 Second iteration: trials and observations . . . . . . . . . . . . . . . . . . 123
5.5.4.1 Interaction technique . . . . . . . . . . . . . . . . . . . . . . 123
5.5.4.2 Externalization and task structure . . . . . . . . . . . . . . . . 124
5.5.4.3 Collaboration . . . . . . . . . . . . . . . . . . . . . . . . . . 125
5.5.4.4 Scaffolding, feedback, and reflection . . . . . . . . . . . . . . 125
5.5.4.5 Other observations . . . . . . . . . . . . . . . . . . . . . . . . 125
5.5.5 Third (and final) iteration: design . . . . . . . . . . . . . . . . . . . . . 125
5.5.5.1 Improvements in the grouping stage . . . . . . . . . . . . . . 126
5.5.5.2 Improvements in the sequencing stage . . . . . . . . . . . . . 127
5.5.5.3 Collaboration . . . . . . . . . . . . . . . . . . . . . . . . . . 130
5.5.5.4 The new reflection stage . . . . . . . . . . . . . . . . . . . . . 131
5.6 Summary . . . . . . . . . . . . . . . . . . . . . . . . . . . . . . . . . . . . . . 132
6 Evaluating Digital Mysteries 1356.1 Evaluation . . . . . . . . . . . . . . . . . . . . . . . . . . . . . . . . . . . . . . 135
6.2 Externalization: making thinking visible . . . . . . . . . . . . . . . . . . . . . . 136
6.3 Promoting discussions . . . . . . . . . . . . . . . . . . . . . . . . . . . . . . . 154
6.4 Feedback, reflection, metacognition, and repeated use . . . . . . . . . . . . . . . 156
6.4.1 The grouping stage . . . . . . . . . . . . . . . . . . . . . . . . . . . . . 156
6.4.2 The sequencing stage . . . . . . . . . . . . . . . . . . . . . . . . . . . . 157
6.4.3 The reflection stage . . . . . . . . . . . . . . . . . . . . . . . . . . . . . 158
6.4.4 Repeated use . . . . . . . . . . . . . . . . . . . . . . . . . . . . . . . . 159
6.5 Encouraging equitable collaboration . . . . . . . . . . . . . . . . . . . . . . . . 160
6.6 Interaction techniques and utilizing the physical properties of the table . . . . . . 163
6.7 Structuring the task . . . . . . . . . . . . . . . . . . . . . . . . . . . . . . . . . 165
6.8 Conclusion . . . . . . . . . . . . . . . . . . . . . . . . . . . . . . . . . . . . . 165
7 Discussion 1677.1 Results and contributions . . . . . . . . . . . . . . . . . . . . . . . . . . . . . . 167
7.1.1 Interaction techniques . . . . . . . . . . . . . . . . . . . . . . . . . . . 167
7.1.2 Designing for collaborative learning applications . . . . . . . . . . . . . 168
7.2 Related work . . . . . . . . . . . . . . . . . . . . . . . . . . . . . . . . . . . . 171
7.3 Limitations of the current research . . . . . . . . . . . . . . . . . . . . . . . . . 173
7.4 Design guidelines . . . . . . . . . . . . . . . . . . . . . . . . . . . . . . . . . . 174

x
7.5 Recommendations for future research . . . . . . . . . . . . . . . . . . . . . . . 176
Bibliography 180
A Mysteries data 194A.1 Will Kyle skip school on Friday? and why? . . . . . . . . . . . . . . . . . . . . 195
A.1.1 The slips . . . . . . . . . . . . . . . . . . . . . . . . . . . . . . . . . . 195
A.1.2 The meta-data . . . . . . . . . . . . . . . . . . . . . . . . . . . . . . . . 200
A.2 Why did Vicky get clamped? . . . . . . . . . . . . . . . . . . . . . . . . . . . . 201
A.2.1 The slips . . . . . . . . . . . . . . . . . . . . . . . . . . . . . . . . . . 201
A.2.2 The meta-data . . . . . . . . . . . . . . . . . . . . . . . . . . . . . . . . 202
A.3 Who killed king Ted? . . . . . . . . . . . . . . . . . . . . . . . . . . . . . . . . 203
A.3.1 The slips . . . . . . . . . . . . . . . . . . . . . . . . . . . . . . . . . . 203
A.3.2 The meta-data . . . . . . . . . . . . . . . . . . . . . . . . . . . . . . . . 207
A.4 Should Annie leave Windy Creek or should she stay? And why? . . . . . . . . . 208
A.4.1 The slips . . . . . . . . . . . . . . . . . . . . . . . . . . . . . . . . . . 208
A.4.2 The meta-data . . . . . . . . . . . . . . . . . . . . . . . . . . . . . . . . 210
A.5 Why did Oliver decide to join up? . . . . . . . . . . . . . . . . . . . . . . . . . 211
A.5.1 The slips . . . . . . . . . . . . . . . . . . . . . . . . . . . . . . . . . . 211
A.5.2 The meta-data . . . . . . . . . . . . . . . . . . . . . . . . . . . . . . . . 214
A.6 Why is the village shop in Hensford closing? . . . . . . . . . . . . . . . . . . . 215
A.6.1 The slips . . . . . . . . . . . . . . . . . . . . . . . . . . . . . . . . . . 215
A.6.2 The meta-data . . . . . . . . . . . . . . . . . . . . . . . . . . . . . . . . 218
A.7 Who was responsible for the death of Alice White? . . . . . . . . . . . . . . . . 219
A.7.1 The slips . . . . . . . . . . . . . . . . . . . . . . . . . . . . . . . . . . 219
A.7.2 The meta-data . . . . . . . . . . . . . . . . . . . . . . . . . . . . . . . . 222

xi
List of Figures
1.1 Working around digital and traditional tables. . . . . . . . . . . . . . . . . . . . . 1
1.2 The structure of an activity within the community. . . . . . . . . . . . . . . . . . 8
2.1 The division of the table space into personal, public and storage spaces. . . . . . . 18
2.2 Working individually with papers positioned near table edges. . . . . . . . . . . . 19
2.3 Collaborating: leaning forward with papers, including personal ones, pushed slightly
toward the centre. . . . . . . . . . . . . . . . . . . . . . . . . . . . . . . . . . . . 19
2.4 Public document position. . . . . . . . . . . . . . . . . . . . . . . . . . . . . . . 20
2.5 Orientation and reorientation. . . . . . . . . . . . . . . . . . . . . . . . . . . . . 21
2.6 Leaning backward: idle-state. . . . . . . . . . . . . . . . . . . . . . . . . . . . . 28
2.7 Special handling of the public document. . . . . . . . . . . . . . . . . . . . . . . 28
2.8 Gestures: The use of stylised actions to indicate a state transition. . . . . . . . . . 29
2.9 Throwing the public document to another participant . . . . . . . . . . . . . . . . 30
3.1 Setting attributes using Grid Gates and Polar Gates. . . . . . . . . . . . . . . . . . 48
3.2 Setting attributes using traditional contextual menus. . . . . . . . . . . . . . . . . 50
3.3 Activity levels: a good user interface element helps shift more actions into opera-
tions, which helps the user to focus on the higher level activity. . . . . . . . . . . . 52
3.4 The steps for setting attributes using Grid Gates. . . . . . . . . . . . . . . . . . . 55
3.5 The steps for setting only the read-only attribute. The user passes through the space
between the other attribute values to keep the original settings. . . . . . . . . . . . 56
3.6 The steps for setting attributes using Polar Gates. . . . . . . . . . . . . . . . . . . 57
3.7 Making use of the memory feature of Polar Gates. . . . . . . . . . . . . . . . . . 58
3.8 A worst-case scenario for setting a sequence of attributes using a grid gate. . . . . 59
3.9 A graph showing the indexes of difficulty for steering and targeting. . . . . . . . . 61
3.10 The path for setting a sequence of attributes using Polar Gates. . . . . . . . . . . . 61
3.11 Configuration of the multi-pen surface and the two participants for the user study. . 64
3.12 Receiver errors (by participant) for each interaction technique. . . . . . . . . . . . 67
3.13 Average timings for the sender task for each attribute setting (by interaction tech-
nique). . . . . . . . . . . . . . . . . . . . . . . . . . . . . . . . . . . . . . . . . 68
3.14 Average timings for each participant (by interaction technique). . . . . . . . . . . 69

xii
3.15 A modified version of polar gate that allows setting scale attributes in the inner ring,
and applying rotation to an object by rotating the outer ring. . . . . . . . . . . . . 70
3.16 A modified, one-level, version of Polar Gates that is used with Digital Mysteries. . 71
4.1 The TANGISOFT direct-touch keyboard. . . . . . . . . . . . . . . . . . . . . . . . 73
4.2 A student entering text using a rotated soft keyboard from the side of the table while
working on Digital Mysteries. . . . . . . . . . . . . . . . . . . . . . . . . . . . . 75
4.3 Writing the word the using Quikwriting (Perlin, 1998), SHARK (Zhai and Kristens-
son, 2003), and Dasher (Ward et al., 2000) techniques. . . . . . . . . . . . . . . . 77
4.4 The two layouts used in BubbleTYPE (Hinrichs et al., 2008). . . . . . . . . . . . . 81
4.5 The adaptive keyboard proposed by Hinrichs et al. (2008). . . . . . . . . . . . . . 81
4.6 The SLAP keyboard (Weiss et al., 2009) . . . . . . . . . . . . . . . . . . . . . . . 82
4.7 Alternative designs for the tangible keyboard. . . . . . . . . . . . . . . . . . . . . 83
4.8 The calibration process. . . . . . . . . . . . . . . . . . . . . . . . . . . . . . . . 83
4.9 Text copying application. . . . . . . . . . . . . . . . . . . . . . . . . . . . . . . . 85
4.10 The soft keyboard used in the study. . . . . . . . . . . . . . . . . . . . . . . . . . 86
4.11 Number of rotation actions for each participant. . . . . . . . . . . . . . . . . . . . 87
4.12 Number of translation actions for each participant. . . . . . . . . . . . . . . . . . 87
4.13 Users with the same static behaviour. . . . . . . . . . . . . . . . . . . . . . . . . 88
4.14 Users with same dynamic behaviour. . . . . . . . . . . . . . . . . . . . . . . . . . 89
4.15 Users who showed different behaviour in terms of rotation only. . . . . . . . . . . 90
4.16 Users who showed different behaviour in terms of both location and orientation. . . 91
4.17 Static users: enduring higher cognitive load to avoid physical movement. . . . . . 92
4.18 Dynamic users: same dynamic behaviour for both tangible and soft keyboard. . . . 92
4.19 (Left) TANGISOFT: moving near the phrase and rotating the keyboard. (Right) Soft
keyboard: the position and rotation of the keyboard is kept relatively constant. . . . 92
5.1 Moseley et al.’s (2005) integrated model for understanding thinking and learning . 97
5.2 Sample slips of the Windy Creek mystery. The mystery contains 20 slips, and the
question is “Should Annie leave Windy Creek or should she stay? And why?” . . . 104
5.3 Slip manipulation icons for the first version of Digital Mysteries. . . . . . . . . . . 113
5.4 A screen capture for the first version of Digital Mysteries showing slips in normal
size (which is not always readable) and one enlarged slip in the middle. . . . . . . 113
5.5 Paper Mysteries: first iteration (at the final stage of solving the mystery for the two
groups). . . . . . . . . . . . . . . . . . . . . . . . . . . . . . . . . . . . . . . . . 115
5.6 Digital Mysteries: first iteration (at the final stage of solving the mystery). . . . . . 115
5.7 Slip manipulation with a crossing-based polar menu. . . . . . . . . . . . . . . . . 117
5.8 The three display sizes for a slip. . . . . . . . . . . . . . . . . . . . . . . . . . . . 118
5.9 The polar menu and the tools introduced in version 2 of Digital Mysteries. . . . . . 119

xiii
5.10 The group, note, and sticky tape cognitive tools. . . . . . . . . . . . . . . . . . . . 119
5.11 The introductory dialogs that are displayed at the beginning of each stage. . . . . . 121
5.12 A screen capture showing the statistics dialog, grouped slips, the participation pie
chart at the top left corner, and the soft keyboard. . . . . . . . . . . . . . . . . . . 122
5.13 A custom made tabletop with a Promethean Activboard embedded inside it. . . . . 124
5.14 The grouping stage showing the group rating traffic light. . . . . . . . . . . . . . . 126
5.15 A sample xml file that is included with each mystery to provide meta-data about the
mystery. . . . . . . . . . . . . . . . . . . . . . . . . . . . . . . . . . . . . . . . . 127
5.16 Grouping feedback. . . . . . . . . . . . . . . . . . . . . . . . . . . . . . . . . . . 127
5.17 The manipulation tools, cognitive tools, and commands provided at the final version
of Digital Mysteries. . . . . . . . . . . . . . . . . . . . . . . . . . . . . . . . . . 128
5.18 Sequence evaluation dialog. . . . . . . . . . . . . . . . . . . . . . . . . . . . . . 128
5.19 Feedback upon selecting the piles layout. . . . . . . . . . . . . . . . . . . . . . . 129
5.20 Feedback upon selecting the linear layout. . . . . . . . . . . . . . . . . . . . . . . 129
5.21 The answer dialog requires the students to write down their answer and indepen-
dently confirm it, opening space for discussion to agree on one answer . . . . . . . 130
5.22 Reflection stage control dialog. . . . . . . . . . . . . . . . . . . . . . . . . . . . . 132
6.1 Screenshots at the end of the grouping and sequencing stages for group 1, trial 1:
Windy Creek. . . . . . . . . . . . . . . . . . . . . . . . . . . . . . . . . . . . . . 138
6.2 Screenshots at the end of the grouping and sequencing stages for group 1, trial 2:
Oliver Hopkins. . . . . . . . . . . . . . . . . . . . . . . . . . . . . . . . . . . . . 139
6.3 Screenshots at the end of the grouping and sequencing stages for group 1, trial 3:
The Village Shop. . . . . . . . . . . . . . . . . . . . . . . . . . . . . . . . . . . . 140
6.4 Screenshots at the end of the grouping and sequencing stages for group 1, trial 4:
Alice White. . . . . . . . . . . . . . . . . . . . . . . . . . . . . . . . . . . . . . 141
6.5 Screenshots at the end of the grouping and sequencing stages for group 2, trial 1:
Windy Creek. . . . . . . . . . . . . . . . . . . . . . . . . . . . . . . . . . . . . . 142
6.6 Screenshots at the end of the grouping and sequencing stages for group 2, trial 2:
Oliver Hopkins. . . . . . . . . . . . . . . . . . . . . . . . . . . . . . . . . . . . . 143
6.7 Screenshots at the end of the grouping and sequencing stages for group 2, trial 3:
The Village Shop. . . . . . . . . . . . . . . . . . . . . . . . . . . . . . . . . . . . 144
6.8 Screenshots at the end of the grouping and sequencing stages for group 2, trial 4:
Alice White. . . . . . . . . . . . . . . . . . . . . . . . . . . . . . . . . . . . . . 145
6.9 Screenshots at the end of the grouping and sequencing stages for group 3 solving
Windy Creek mystery. . . . . . . . . . . . . . . . . . . . . . . . . . . . . . . . . 146
6.10 Screenshots at the end of the grouping and sequencing stages for group 4 solving
Windy Creek mystery. . . . . . . . . . . . . . . . . . . . . . . . . . . . . . . . . 147

xiv
6.11 Screenshots at the end of the grouping and sequencing stages for group 5 solving
Windy Creek mystery. . . . . . . . . . . . . . . . . . . . . . . . . . . . . . . . . 148
6.12 Screenshots at the end of the grouping and sequencing stages for group 6 solving
Windy Creek mystery. . . . . . . . . . . . . . . . . . . . . . . . . . . . . . . . . 149
6.13 Examples of discussions around grouping (group 1 solving Windy Creek). . . . . . 155
6.14 Examples of discussions around naming a group (group 2 solving Windy Creek). . 155
6.15 Examples of discussions around grouping (group 4 solving Windy Creek). . . . . . 156
6.16 Discussion around creating notes (group 1 solving The Village Shop). . . . . . . . 156
6.17 Examples of how the act of creating a note attracts attention of the other students. . 156
6.18 Discussion around the type of the sticky tape to use to mark a relation between two
slips. . . . . . . . . . . . . . . . . . . . . . . . . . . . . . . . . . . . . . . . . . 156
6.19 A sample of the type of reflective discussions made possible by the reflection stage
(group 1, trial 2). . . . . . . . . . . . . . . . . . . . . . . . . . . . . . . . . . . . 159
6.20 The reflection dialog showing the short duration of stage one (group 2, trial 3). . . 160
6.21 Discussions during the reflection stage and their effect in subsequent trials (group
2, trial 3). . . . . . . . . . . . . . . . . . . . . . . . . . . . . . . . . . . . . . . . 160
6.22 Screen-shot for group 4 as they select the finish command and respond to the se-
quence evaluation dialog. . . . . . . . . . . . . . . . . . . . . . . . . . . . . . . . 161
6.23 An estimate of the participation level of each student based on the time the pen
was being dragged on the table (each member’s participation as a proportion of the
group as a whole). . . . . . . . . . . . . . . . . . . . . . . . . . . . . . . . . . . 163
6.24 Image of a trial illustrating how students worked from all sides of the table, used
orientation, and leaned on the table. . . . . . . . . . . . . . . . . . . . . . . . . . 164
6.25 Discussion about the strategies to use at stages 2 and 3 for group 1, (trial 1) while
solving “Windy Creek” mystery. . . . . . . . . . . . . . . . . . . . . . . . . . . . 165
7.1 A basic visualization showing users’ actions with time. . . . . . . . . . . . . . . . 170

xv
List of Tables
2.1 Summary of the reviewed literature and the main conclusions. . . . . . . . . . . . 45
4.1 Number of rotation and translation actions for each participant for the tangible and
the soft keyboards. . . . . . . . . . . . . . . . . . . . . . . . . . . . . . . . . . . 86
6.1 Group names, notes, and the answers for groups 1, 2, and 3 solving Windy Creek
mystery: Should Annie leave Windy Creek or should she stay? and why? . . . . . 150
6.2 Group names, notes, and the answers for groups 4, 5, and 6 solving the Windy
Creek mystery: Should Annie leave Windy Creek or should she stay? and why? . . 151
6.3 The number of attempts, the groups created, and the answers for the six groups
solving Windy Creek mystery: Should Annie leave Windy Creek or should she stay?
and why? . . . . . . . . . . . . . . . . . . . . . . . . . . . . . . . . . . . . . . . 152
6.4 The number of attempts, the groups created, and the answer for groups 1 and 2
while solving the rest of the mysteries. . . . . . . . . . . . . . . . . . . . . . . . . 153
6.5 Number of groups and notes created, and the corresponding number of discussion
activities. . . . . . . . . . . . . . . . . . . . . . . . . . . . . . . . . . . . . . . . 154
6.6 Features of digital mysteries compared to desktop and paper realizations. . . . . . 166

1
Chapter 1
Introduction
1.1 Overview
Figure 1.1: Working around a digital table (left). Working around a traditional tabletop (right).
Collaboration around tables is a common activity that people perform while studying, having
meetings, brainstorming, and when they engage in a number of other group activities. Digital
tabletop technology has recently attracted significant interest from human-computer interaction
researchers as it presents the opportunity to bring computer support to these traditional face-to-
face collaborative settings. This research is principally concerned with digital tabletops technology
and specifically its support for small group collaborative learning (Figure 1.1).
Research on digital tabletops started with the pioneering work of Wellner in 1993. Wellner
introduced the concept of digital tabletops by building a single-user table (the DigitalDesk) that
introduced a number of novel interaction ideas for tabletop computing such as projecting digital
contents on of the table surface, capturing hand movements to interact with these digital contents,
and allowing for digitising parts of the table surface using high-resolution cameras. Subsequent
research has focused on understanding specific aspects of interaction at digital tabletops such as the
use of space (e.g. Scott, 2003; Scott et al., 2004), orientation (e.g. Kruger et al., 2003; Wigdor and
Balakrishnan, 2005), table size and reach (e.g. Ryall et al., 2004; Toney and Thomas, 2006b), and
group dynamics (e.g. Morris et al., 2006a; Tang et al., 2006). Early applications were generally
small and developed with the goal of exploring the specific aspects of the interaction that was

2
being investigated (Kruger et al., 2002). Only in recent years has more substantial research at the
application level started to emerge, and more specifically applications addressing problem solving
and learning (e.g. Piper et al., 2006; Hilliges et al., 2007; Rick and Rogers, 2008; Piper and Hollan,
2009; Morgan and Butler, 2009). Nevertheless, work on both the interaction techniques and the
applications level is still far from complete and there are a number of aspects that merit further
investigation.
This thesis reports a number of contributions in two distinct, but closely related areas: (i) inter-
action techniques for digital tabletops, and (ii) the design and evaluation of a digital tabletop-based
system for supporting collaborative learning. A state-of-the-art review and a preliminary observa-
tional study on collaboration around traditional tables gave rise to a number of requirements for
tabletop interaction (Chapter 2). These included the need for fluid interaction techniques that allow
control of interface object attributes such as the orientation, scale, and access rights when these
objects are moved between tabletop territories. I introduce Attribute Gates, a novel crossing-based
interaction technique, as a solution to this problem (Chapter 3). In practice the territorial focus
of many tabletop interaction techniques makes a limiting assumption that users work at relatively
fixed locations (around the table). In recognition of this limitation, this research places a particu-
lar emphasis on supporting mobility of users around a shared working space (tabletop). Working
around a shared space, according to findings of Tang et al. (2006), is more suited to tightly coupled
collaborative work than a partitioned space with a personal area allocated for each user. The sup-
port of users’ mobility brings into focus another problem: the need for a light-weight, mobile, text
entry technique. I present TANGISOFT which is a hybrid tangible-soft keyboard designed specifi-
cally for applications that require mobile users with moderate text entry requirements (Chapter 4).
The second broad area of contribution of the thesis relates to the potential of tabletops to support
collaborative learning. I investigate this issue through the development of Digital Mysteries, a dig-
ital adaptation of the mysteries paper-based learning tool (Chapter 5). A thorough iterative design
and evaluation process is used to develop the Digital Mysteries collaborative learning application
with the goal of exploiting the unique affordances of digital tabletops (Chapters 5 and 6).
A distinctive characteristic of this research, both in its interaction techniques design and col-
laborative learning application development, is its strong and explicit reliance on applicable theory.
As this research explores the potential of the digital tabletop as a new tool for collaborative learn-
ing, distributed cognition and activity theory, with their strong emphasis on the use of tools, are
chosen as theoretical frameworks for analysis and design of different aspects of this work.
I approach this research as a computer scientist and interaction designer. This perspective in-
fluences how I address the problem of supporting learning, and how I translate human-computer
interaction and learning theories into practice. A consequence of this is that the support for col-
laborative learning, and the validation of the success of this support, are not realized by targeting
learning per-se; but by targeting, and validating, the activities that encourage and increase the prob-
ability of effective learning as identified by theories of collaborative learning (Chapters 5 and 6).

3
1.2 Research context
This research into digital tabletops technology and its support for collaborative learning is grounded
in both pragmatic definitions for collaboration and collaborative learning, and a perspective on
how digital technology supports collaboration in general, and collaborative learning specifically.
1.2.1 Collaboration
In general terms, collaboration and cooperation refer to the act of working with one or more
members of a group to create a common outcome (Bannon and Schmidt, 1989). Although the
difference between the terms collaboration and cooperation is not very well established within
human-computer interaction, I follow Roschelle and Teasley (1995) and Dillenbourg (1999) in
using the term cooperation to refer to the horizontal division of work, that is, where work is divided
into sub-tasks that are completed individually and then assembled together; and collaboration
to refer to the vertical division of work, that is, where work is done by all the group members
together synchronously. In learning sciences the stress is on collaborative work related to co-
construction of knowledge and mutual engagement (Lipponen, 2002) and this is made clear in
the widely quoted definition of collaboration provided by (Roschelle and Teasley, 1995, pp.70)
“Collaboration is a coordinated, synchronous activity that is the result of a continued attempt to
construct and maintain a shared conception of a problem”. Definitions of collaboration, however,
are generally not specific as to the value of parameters such as the number of people involved
in the collaboration (i.e. two or more), whether the participants are co-located or distant, and the
time span of the activity (i.e. as short as minutes, or as long as years). In the context of tabletop
research, the term collaboration is used to refer to co-located settings involving small groups of
two to five users, synchronously collaborating with a time span from a few minutes to a few hours.
1.2.2 Collaborative learning
Collaborative learning is used as an umbrella term to cover all activities involving collaboration
within an educational or problem solving context (Dillenbourg, 1999). The benefits of collabo-
ration for learning are well established (Roschelle and Teasley, 1995; Chickering and Ehrmann,
1996; Boyle, 1997; Dillenbourg, 1999; Stahl, 2006). The second principle of Chickering & Gam-
son’s seven principles of good practice (Chickering and Gamson, 1987) states that:
Learning is enhanced when it is more like a team effort than a solo race. Good learn-
ing, like good work, is collaborative and social, not competitive and isolated. Working
with others often increases involvement in learning. Sharing one’s own ideas and re-
sponding to others’ reactions sharpens thinking and deepens understanding.
When people collaborate within an educational context, they engage in certain learning group
activities that do not occur in individual learning contexts, for example, explanation to others,

4
disagreements, and mutual regulation. Consequently, these group activities trigger group learning
mechanisms, such as knowledge elicitation and internalization; in addition to triggering learning
mechanisms that usually occur in individual learning, such as induction, deduction, and compila-
tion (Dillenbourg, 1999). Collaborative learning involves these group activities that do not occur
in individual learning. Dillenbourg (1999) noted that although these extra learning mechanisms
occur more frequently in collaborative learning than in individual learning, there is no guarantee
that they will occur. Computer support can play an important role in increasing the probability
that such useful group learning activities will occur. This approach to computer supported col-
laborative learning (the focus on useful group activities) releases application designers from the
obligation to immerse themselves in learning theory, and affords a more practical approach to
designing software that supports collaborative learning.
1.2.3 Computer support
Situations involving activities engaged in by more than one person and supported by comput-
ers, are described by the term Computer Supported Cooperative Work (CSCW). Though the term
cooperation (and not collaboration) is used, it refers to the broader definition of any jointly un-
dertaken activity, regardless of the type of division of labour, social status, or the type of task
distribution across time and space (Bannon and Schmidt, 1989). Johansen (1998) categorized four
kinds of CSCW systems in terms of time and space:
1. Same time (synchronous), same place (e.g. meeting support tools)
2. Same time, different-places (e.g. video conferencing)
3. Different time, different-places (e.g. e-mail)
4. Different time, same place (e.g. Internet-based corporate workflow systems)
Only categories (1) and (2) conform to the definition of collaboration introduced in Section
1.2.1. Of these, only (1) applies to co-located settings. In the context of digital tabletops learning
research, it is possible to use an even more restrictive definition of CSCW which limits the type of
work to learning.
1.2.4 Computer support for collaborative learning
Computer supported collaborative learning (CSCL) focuses on how technology can support and
enhance peer interaction and group-based learning, and facilitate sharing and distribution of knowl-
edge and expertise (Lipponen, 2002). A distinguishing characteristic of CSCL research is that
it is mainly conducted in real world, such as schools, rather than laboratory controlled experi-
ments that are the reserve of traditional HCI (Lipponen, 2002). Initial research in the field of
CSCL distinguished two classes of computer support: tools to facilitate face-to-face collaboration

5
around a computer between students in small groups; and the provision of a networked environ-
ment for collaboration through computers (Crook, 1994). However, recent research in CSCL has
mostly been confined to networked environments where the learners collaborate synchronously
or asynchronously, co-located or distant, but rarely in face-to-face settings (Hilliges et al., 2007;
Lehtinen, 2003). In fact, CSCL and face-to-face collaboration are often presented as mutually
exclusive (Resta and Laferriere, 2007). Moreover, CSCL tends not to emphasize small groups
(i.e. 2-5 learners) despite the realities of modern classroom organization and teaching practices.
Stahl (2006) refers to such group sizes as the “engine of knowledge building”, and contrasts this
with the two prevalent metaphors of learning (Sfard, 1998), the acquisition metaphor (relating to
the individual) and the participation metaphor (relating to the community), both of which over-
look the small group.
While there is a general consensus as to the benefits of collaboration for learning (Roschelle
and Teasley, 1995; Chickering and Ehrmann, 1996; Boyle, 1997; Dillenbourg, 1999; Stahl, 2006),
regardless of whether it is supported by technology or not, the benefits that computer support
brings to collaborative learning is still under debate (Lipponen, 2002; Lehtinen, 2003). Since the
value of collaborative learning is undisputed, with face-to-face collaboration considered the most
natural and valuable form, then it is hardly surprising that the benefits of CSCL, which largely
excludes face-to-face collaboration, are not as well established.
Nevertheless, Resta and Laferriere (2007) report a number of positive outcomes arising from
CSCL, including the development of higher order thinking skills; increased student satisfaction
with the learning experience; improved productivity; and improved academic achievement. Dig-
ital tabletops have the unique potential to bring computer support to face-to-face collaborative
learning. More generally, applications that bring people physically together around a single dis-
play while undertaking a collaborative task are referred to as single display groupware.
1.2.5 Single display groupware
Stewart et al. (1999) used the term single display groupware (SDG) to refer to technologies that
physically bring small groups together and enhance their interaction as opposed to networked
collaborative settings. They explored how technology designers can improve collaboration by
explicitly designing computer support for collaboration at a single display, with a view to en-
abling and enriching multi-user interactions; reducing or eliminating conflict; encouraging peer
learning and teaching (by eliminating competition and enabling multiple-synchronous input); and
strengthening communication skills. Such settings, nevertheless, bring new challenges as allowing
multi-synchronous input may give rise to new conflicts and frustrations, lead to reduced collabora-
tion because of the ability to work in parallel, and increase task completion times since it is more
difficult to enforce a leadership structure. Such concerns, and principally that of reduced collab-
oration as a result of multiple input channels, have been investigated by a number of researchers

6
(e.g. Marshall et al., 2008; Birnholtz et al., 2007; Do-Lenh et al., 2009; Hornecker et al., 2007)
and will be discussed in greater details in Chapter 2.
My work narrows the scope of SDG to those of large, horizontal displays. Rogers and Lind-
ley (2004) compared collaboration in two classes of large-display settings: vertical and horizontal
interactive display surfaces. They investigated how the physical affordance of each setting encour-
ages or discourages certain behaviours (social affordances). Rogers and Lindley considered the
conventional way for people to work in a co-located group to be around a table with technology
and paper-based materials. They argued that unless for making presentations, the shoulder-to-
shoulder style of collaboration around whiteboards puts people in a different physical workspace
than the one they feel comfortable with and usually leads to one person taking control over the
collaborative session (see also Everitt et al., 2006; Kruger et al., 2002, 2003). On the other hand,
the horizontal surface of the table affords face-to-face collaboration, which brings a democratic
quality to the interactions (i.e. socially comfortable). Their final conclusion was that the physical
affordances of tabletops, compared to vertical surfaces, encouraged group members to exchange
more roles, explore more ideas, and enhanced awareness, thus making it more productive for
collaboration and sharing of work.
1.3 Theories on CSCW
The study of group and organizational work has a number of associated theories, frameworks, and
descriptive methods. In relation to the analysis and design of collaborative systems, the most rel-
evant to CSCW are conversation analysis (Wooffitt, 1990; Mazur, 2004; Norman and Thomas,
1991), situated action (Nardi, 1995), activity theory (Kuutti, 1995; Bødker, 1989; Kaptelinin,
1995; Fjeld et al., 2002; Halverson, 2002; Nardi, 1995), and distributed cognition (Hollan et al.,
2000; Rogers and Ellis, 1994; Norman, 1993; Halverson, 2002; Nardi, 1995). Conversation anal-
ysis (CA) was developed for the detailed analysis of tacit organized reasoning procedures that
inform the production and recognition of naturally spoken language. CA examines a wide range
of phenomena including how conversations start and end, how turn taking is structured, and the
semantics of corrections (Wooffitt, 1990; Norman and Thomas, 1991). Interaction with, and
through, artefacts (including technology) was not part of the original method, yet CA has been
utilized in HCI research in two areas (Mazur, 2004): using CA to analyse computer mediated
communication (CMC) such as e-mail, digital video conferencing, and chats (Mazur, 2004); and
using CA to analyse interaction, to inform interface design, where the interface itself is considered
as a conversational partner (Norman and Thomas, 1991). By contrast, theories such as situated
action (Nardi, 1995) emphasize the activity of people as they emerge in moment-by-moment reac-
tions to the environment. The unit of analysis of SA is the relation between the individual and the
environment. On the other hand, CA’s focus is entirely on the conversation and thus technology
(and other aspects of the environment) can only be included in the analysis by considering it as a

7
conversational partner or medium. Rogers and Ellis (1994) argued that existing frameworks de-
veloped without reference to cognitive, social and organizational dimensions of the interaction, do
not present an adequate means of studying the dynamics of collaborative activities. This observa-
tion is particularly salient for frameworks related to technology enhanced collaborative learning.
Two theories that explicitly address the cognitive, social and organizational aspects are activity
theory (AT) and distributed cognition (DC). Nardi (1995) contrasted the applicability of situated
action, activity theory, and distributed cognition for system design. While the focus of her work
was on demonstrating the advantages of activity theory and its similarities to DC, she highlighted
the weaknesses of the situated action model, in terms of disregarding persistent structures such
as the artefacts, institutions and cultural values, and ignoring the subjective elements and motives
of the people involved in the activity. On the other hand, Halverson (2002) compared AT and
DC, and pointed out that neither of these theories alone address all the factors that need to be
considered in the analysis and design of CSCW systems. Both Nardi and Halverson agree on the
broad similarities between the two theories and the (rather superficial) differences. However, as
described in Section 1.3.1 and Section 1.3.2 the theories have meaningful differences in terms of
the aspects of the activity, environment, tools and setting that they bring into focus (and those that
they obscure). Therefore I have used both AT and DC for analysis and design, and I introduce
relevant aspects of each theory as required throughout the thesis.
After reviewing digital tabletop literature, it was rather interesting to note that most of the
researchers approached the analysis and design of their systems based on traditional groupware
design guidelines and on notes taken from observational studies on the use of traditional tables,
rather than relying on recent theories of CSCW like DC and AT.
1.3.1 Activity theory
Activity theory (AT) (Kuutti, 1995; Bødker, 1989; Kaptelinin, 1995; Fjeld et al., 2002; Halverson,
2002; Nardi, 1995) focuses on human activity as the basic unit of analysis. An activity is described
as the minimal meaningful context which is directed to an object in order to transform it into an
outcome. The inclusion of context in the definition of the activity is to imply that one should not
study individual actions in isolation, but include the effects of artefacts, community, rules, division
of labour, and history, and consider these as part of the activity. In this sense, AT considers the
activity to be the context (Nardi, 1995). An activity is bounded to a goal or an object and therefore
it is possible to differentiate between activities according to their objects. It is performed by a
subject (human) whose motivation lead to the initiation of the activity. Motivation is important
in AT as it is the driving force behind the activity and is considered to be the factor that makes a
group work together rather than competing against each other. The object is usually transformed
during the course of the activity into the desired outcome. The object and the outcome are not
necessarily physical entities, they could be design concepts, plans, or ideas. The artefact plays an
important role in AT. It mediates between the subject and the object. As with the object, an artefact

8
Figure 1.2: The structure of an activity within the community (an annotated version based onKuutti (1995)).
is not necessarily a physical tool, and in some cases the mediation can be done through language
only. An activity may be conducted by a group, which in turn works within a community. The
group and the community affect the way the activity is carried out, and thus must not be neglected.
Moreover, it is also important to look at the history, not only of the activity, but also of tools and
their uses. Activities and tools develop over time and have mutual effect on each other. Activities
help in creating and transforming tools, and as tools develop, they impact upon people and the
way they carry out activities. The tool can even be viewed as an embodiment of cultural and
experiential aspects of a group activity as its form and use is usually the result of many years
of development. Figure 1.2 is an annotated version of Kuutti’s (1995) illustration of the basic
structure of an activity.
1.3.2 Distributed cognition
In the theory of distributed cognition (DC) (Hollan et al., 2000; Rogers and Ellis, 1994; Norman,
1993; Halverson, 2002; Nardi, 1995) the main unit of analysis is the functional system. A func-
tional system consists of the people and the resources used, and their relationship to each other
within the work environment. This unit of analysis is not bound by spatial or social factors, but
rather by the functional relations of the elements involved. This may expand the unit in space and
time regardless of other considerations such as roles and social status of the people involved. DC
focuses on understanding interactions between people and technology to explain how cognition is
distributed in the work setting. This distribution may be across members of the working group,
across people and external resources, and across time (Hollan et al., 2000). A DC analysis of a

9
certain work practice must include the functional system, the inputs and outputs of the functional
system, the intermediate representational forms leading to the final outcome, the goal, the back-
ground of the activity, the available resources, and any environmental factors that contributes to
the accomplishment of the task (Perry, 2003.)
The approach used by DC to understand these interactions between people and technology
is to study the transformations undergone by representation states during the whole process. DC
shows a clear emphasis on representation states and the importance of representation states to cog-
nition. Representation states are not bound to material things, they may be mental representations
in the minds of people, audio representations expressed by conversations, or physical movements
like gestures. Representation states are transformed by tools. An idea in the mind may be trans-
formed into a sketch by the use of paper and a pen. By describing a representation to another
using the phone as a tool, for example, the representation is transformed to an audio presentation.
DC theory in this regard considers tools and humans as equals in the functional system. DC also
pays attention to the historical and cultural factors that have given rise to the current work practice.
People make use of past experiences in carrying out their tasks and in improving the tools used
for the task. People from different cultures may carry out the same task differently using different
tools and this is an important factor to consider in DC. Cognitive activities refer to the computa-
tions taking place while representation states are propagated across media (i.e. individual memory,
paper, or computer display) (Rogers and Ellis, 1994). Analysis of group work is put in the heart
of the theory. Although a functional system may consist of one person, the general case involves
a group and not simply a single individual. By taking the cognitive approach, DC recognizes the
importance of knowledge building and knowledge propagation among the group. Lehtinen (2003)
observed that designing applications that allow the use of cognitive tools and multiple represen-
tation forms, helps learners by reducing cognitive processing load, thereby allowing them to take
on more challenging problems than otherwise possible. DC, like AT, focuses on the importance
of identifying breakdown situations and the importance of such situations to learning and sharing
knowledge among group members (Rogers and Ellis, 1994; Norman, 1993).
1.4 Digital tabletops
1.4.1 Traditional tables as tools for collaboration
Traditional tables are still the preferred way for small groups of people to meet and collabo-
rate (Kruger et al., 2002; Shen et al., 2003; Scott et al., 2004). Both DC and AT draw our attention
to the table as a tool with unique affordances that aid in collaborative task completion and collab-
orative learning. These include the following:
Social affordance: The social affordances of tables provide the most convenient collaborative
work environment by allowing people to have fluid, face-to-face, barrier free, communication.
10
This also means that tables provide a good collaborative learning environment which sets pre-
conditions that allow for activities that are conducive to learning, such as conversation, argumen-
tation, and collaborative object creation (Kruger et al., 2002, 2003; Morris et al., 2004; Scott et al.,
2004; Shen et al., 2003).
Large horizontal space: DC theory draws attention to the importance of space in the reduction
of cognitive load on humans (Hollan et al., 2000; and Norman, 1993). The large horizontal surface
of the table allows people to spread, pile, and organize materials so as to offload some of the
cognitive effort. Moreover, the surface of a table allows people to structure and mediate group
collaboration (Tang, 1991; Kruger et al., 2003; Scott, 2003; Scott et al., 2004).
Physical support: The horizontal surface of the table allows people to lean on it and place paper
and other objects on top of it (Kruger et al., 2002).
Prior experience: Tables are tools that have been developed and used over thousands of years
and thus carry with them certain cultural assumptions. For example, the shape of the table, whether
round, square, or rectangular and where people sit or stand around it give rise to a number of cul-
turally determined assumptions as to its use. In general, round tables usually imply equality of the
participants, as opposed to rectangular tables where people sitting at the ends often have higher
social status than people on the sides (Pease, 1981; Kruger et al., 2002). Moreover, coordination
and interaction among people working around tables are governed by well established social pro-
tocols (“standards of polite behaviour” (Kruger et al., 2002, 2003; Morris et al., 2004; Scott et al.,
2004; Shen et al., 2003)) that in most cases are enough to prevent conflicts and lead to productive
collaboration.
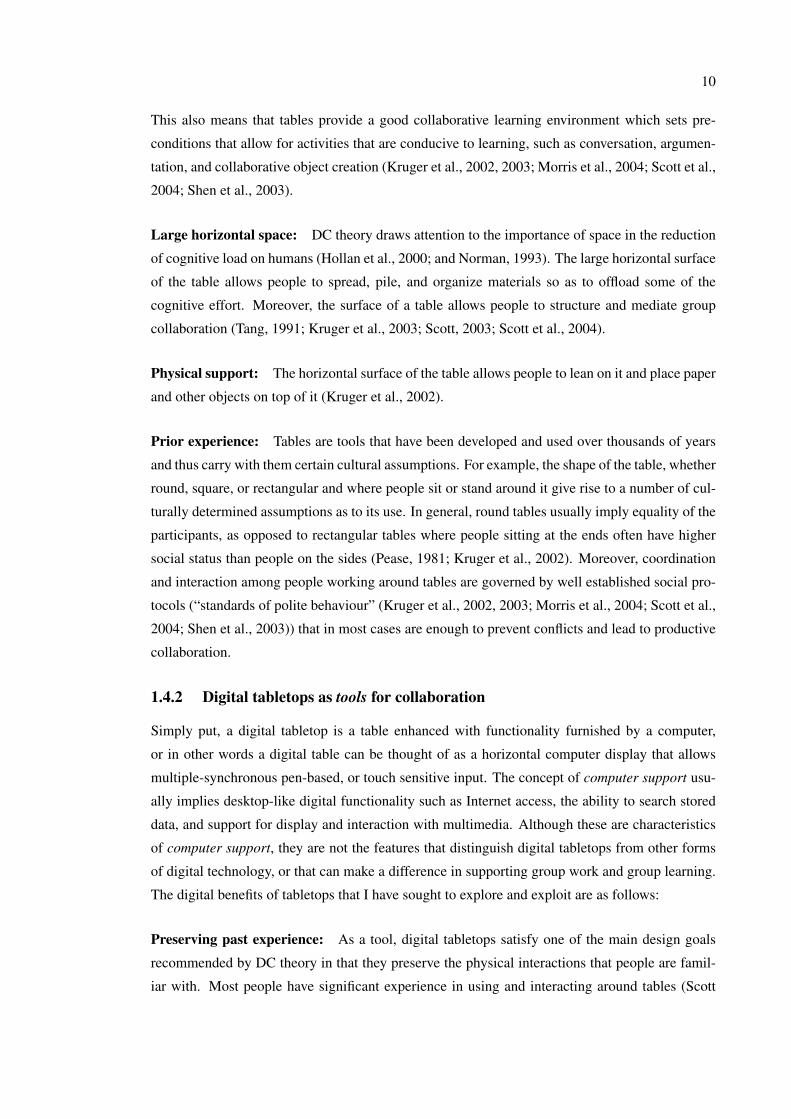
1.4.2 Digital tabletops as tools for collaboration
Simply put, a digital tabletop is a table enhanced with functionality furnished by a computer,
or in other words a digital table can be thought of as a horizontal computer display that allows
multiple-synchronous pen-based, or touch sensitive input. The concept of computer support usu-
ally implies desktop-like digital functionality such as Internet access, the ability to search stored
data, and support for display and interaction with multimedia. Although these are characteristics
of computer support, they are not the features that distinguish digital tabletops from other forms
of digital technology, or that can make a difference in supporting group work and group learning.
The digital benefits of tabletops that I have sought to explore and exploit are as follows:
Preserving past experience: As a tool, digital tabletops satisfy one of the main design goals
recommended by DC theory in that they preserve the physical interactions that people are famil-
iar with. Most people have significant experience in using and interacting around tables (Scott

11
et al., 2004). Supporting traditional tables with digital technologies allows designers to leverage
people’s past experience and assumptions of tables. This is significantly different from many cur-
rent collaborative technologies (e.g. networks or shared computer displays) which force people to
collaborate within less familiar physical and technical settings.
Direct manipulation: In tabletop interaction techniques, the action space and the perception
space coincide, allowing for literally direct manipulation of objects. This stands in contrast to
traditional desktop interaction where a user performs actions using an input device, such as a
mouse, and perceives output on a different space (the screen). A number of researchers have
pointed out the importance of matching these two spaces and the shortcomings of forcing users to
use two spaces (Fjeld et al., 2002; Hutchins et al., 1985; Sluis et al., 2004).
Structuring the task: Computer support allows us to impose structure on a collaborative task.
This can be as simple as subdividing a large task into smaller manageable subtasks. Structuring
has proven particularly useful in the learning context, for example, in enforcing learning scenarios
(Dillenbourg, 1999; Boyle, 1997; Jermann et al., 2001).
Structuring the interaction: Computer support makes it possible to enforce roles and inter-
action rules between collaborators. Relying on social protocols alone to coordinate interaction
and resolve conflicts around tables, is not always sufficient, and a technologically mediated in-
tervention is sometimes required (Morris et al., 2004). Structured interaction can also be utilized
to increase the probability of useful learning activities, such as the promotion of explanation and
disagreement (Dillenbourg, 1999; Jermann et al., 2001).
Logging: Computer support allows for archiving of collaborative work sessions for future refer-
ence or for supporting reflection (Nunes et al., 2003; Collins and Brown, 1988). Logging can also
be used for post-hoc evaluation of a groups’ interaction with a tabletop system, by researchers and
designers, teachers and facilitators, or the learners themselves.
Feedback: Computer support allows the provision of feedback on different parameters of table-
top use, including levels of interaction by participants, results and progress (Hattie and Timperley,
2007; Dillenbourg, 1999; Jermann et al., 2001). Providing appropriate and timely feedback is
widely considered to be one of the most valuable means of supporting teaching and learning (Hat-
tie and Timperley, 2007; Hattie, 2005).

12
1.4.3 Design challenges for digital tabletops
As large, horizontal, interactive surfaces with simultaneous multi-user input, digital tabletops im-
pose software design challenges that dramatically differ from those of groupware, or shared dis-
plays with a single input channel. These differences can be grouped into three categories:
Digital tabletop requirements shared with all SDG settings: Following Stewart et al. (1999):
(1) The support of multiple simultaneous inputs by the user interface introduces challenges with
respect to both accessing user interface controls (Morris et al., 2006b) (e.g. menus and dialogs)
and common user interface objects (Scott et al., 2003; Tang et al., 2006) (e.g. a design plan); (2)
The provision of private or shared feedback on users’ actions (Morris et al., 2006a); and (3) The
provision of a shared navigation space (Tang et al., 2006). This list is by no means comprehensive
as there are still a number of other issues arising form multi-user simultaneous interaction such
as the obscuration of display areas by interface components being viewed by others (Ryall et al.,
2004; Zanella and Greenberg, 2001; Tse et al., 2004) and possible conflicts in copy/paste or undo
operations.
Requirements of large surfaces: A number of requirements are shared between large interac-
tive whiteboards and digital tabletops: (1) The provision of mechanisms to allow users to reach
distant objects and user interface elements (Morris et al., 2006b; Ryall et al., 2004; Baudisch et al.,
2003; Gei, 1998); and (2) Making distant areas of the display visible (Ryall et al., 2004).
Requirements of horizontal surfaces: The horizontal orientation is unique to tabletops and
gives rise to a numbers of unique requirements relating to the management of (1) orientation (Kruger
et al., 2003; Wigdor and Balakrishnan, 2005; Vernier et al., 2002); and (2) use of space. Depend-
ing on the nature of the target application and the user group, there can also be issues that arise if
the interactive surface is divided into territories (Scott, 2003; Scott et al., 2004).
Although addressing these issues poses a significant challenge, the face-to-face nature of in-
teraction at digital tabletops minimizes the effects of a number of core concerns that have been
identified in CSCW research and practice, including awareness, and coordination (Rogers and
Lindley, 2004).
1.5 Research objectives
The principal objectives of this research are as follows:
1. To gain an understanding of the use of traditional tabletops in learning contexts and iden-
tify primary design requirements for applications to support learning around tabletops. I
approached this objective by reviewing literature related to collaboration around tables in

13
addition to conducting observational studies of people collaborating around traditional ta-
bles in educational contexts. I used distributed cognition theory as the framework for the
analysis supported by the knowledge gained from the literature reviewed.
2. To identify weaknesses and propose solutions for tabletop interactions that have not yet been
fully addressed by previous research. Based on the understanding gained from the previous
investigation and while working on the other research objectives, I identified, and proposed
solutions for two issues in interacting with digital tabletops that have not been thoroughly
addressed by other researchers: (a) a practical and fluid way for setting the attributes of
orientation, scale, and access rights while moving objects between territories, or generally
any number of attributes in one fluid action; and (b) the problem of text entry with tabletops
(in particular for more mobile users).
3. To explore how digital tabletop technology can support face-to-face collaborative learning,
and the potential of this new technology in bridging the gap between face-to-face collabo-
ration and CSCL.
4. To build and evaluate a full-scale application that puts the understanding and interaction
designs developed into practice. I achieved this objective by following an iterative design
process and making design choices that are fully grounded in theories of HCI and learning.
5. To propose a set of design guidelines for tabletop learning applications based on the findings
of my research.
1.6 Results and contributions
My Principal contributions are in the development of tabletop interaction techniques and table-
top learning application design. For interaction techniques, I introduce Attribute Gates, and
TANGISOFT. Attribute Gates is a novel crossing-based interaction technique that allows a number
of attributes to be set in one fluid movement. This technique is devised to address a specific prob-
lem for tabletop interaction, the modification of scale, rotation, and access right attributes while
moving objects between tabletop territories. Modified versions of this technique have other uses
as demonstrated in the final Digital Mysteries application. TANGISOFT addresses the problem
of text entry. It is a hybrid tangible–soft keyboard specifically designed for mobile users around
tabletops and allows tangible, two-handed, direct-touch interaction.
On the a application level, I introduce Digital Mysteries as a successful adaptation of the
paper-based mysteries learning tool. I present a theory-grounded iterative design process and show
how the reliance on theory can help both in making the right design choices, and in simplifying
the validation of the design goals. The development process and validation of Digital Mysteries
significantly contributes to the development of our understanding of digital tabletop technology

14
at the application level, in particular for applications targeting learning. My theory-driven design
approach and validation technique should help designers and software engineers both to develop
and validate successful learning applications without the need for expertise in pedagogical theory,
and to overcome the difficulties associated with measuring learning. Finally, I conclude with a
number of guidelines for designing collaborative learning applications for digital tabletops that
focus on promoting useful collaboration and higher level thinking for the students.
A distinctive characteristic of this research is its focus on the use of the tabletop space as one
large shared space acted on by mobile users. In contrast to the recommendation made by Hinrichs
et al. (2005) that large display interfaces should not be designed to assume fixed spaces but should
support mobile users at the display, most of the previous tabletop research and design guidelines
make the assumption that users work from fixed positions (a limitation sometimes imposed by the
hardware setting used), doing tasks that require the division of the tabletop space into territories.
I found that many of the recommendations given for such settings do not hold for shared collab-
orative spaces. While my work started with an observational study that used such a setting, and
started with proposing interaction techniques for such settings, during the course of my research,
my design priorities shifted to the provision of a shared space setting with truly mobile users.
In presenting the context and contributions of my research, I have organized the thesis as
follows: Chapter 2 reviews previous digital tabletop work. The first part of the review, which is
related to different partial aspects of tabletop research, is contextualized within an observational
study conducted on a number of students doing a learning-related collaborative task around a
traditional table. This allowed me to address all aspects of interaction including verbal and non-
verbal communication and the tools used in the collaboration. The second part of the review
considers design guidelines for tabletop systems at different levels of abstraction. Finally, I review
complete tabletop systems, in particular those related to learning and problem solving.
Chapters 3 and 4 describe two novel interaction techniques developed in response to particular
challenges for collaborative work at digital tabletops. Chapter 3 presents the Attribute Gates
technique, both Grid Gates and Polar Gates, and demonstrate how activity theory can be used to
inform the design of digital tabletop interaction techniques. Chapter 4 describes TANGISOFT text
entry technique and shows how such hybrid designs can satisfy the goals of maintaining direct-
touch interaction and the provision of mobility and two-handed interaction.
Chapter 5 introduces tabletops’ support for collaborative learning. It also introduces Paper
Mysteries as the learning tool of choice to be adapted to tabletop technology and introduces both
the desired learning goals and theories to be employed to guide the design and validation process.
This chapter then describes the iterative design process that I followed with a detailed description
of the features of the final design. Chapter 6 provides validation of the final design and how it
satisfies the targeted learning outcomes. Finally, Chapter 7 presents a set of design guidelines for
tabletop learning applications and suggests a number of issues and directions for future research
on the support of collaborative learning at digital tabletops.

15
Chapter 2
Literature Review
2.1 Introduction
Research into digital tabletops started with Wellner’s pioneering work on the DigitalDesk in
1993 (Wellner, 1993). Instead of making the computer analogous to a physical desk by using
the desktop metaphor, Wellner suggested that the desk should be enhanced to provide digital
functionalities. Although the DigitalDesk supported the connection of two systems remotely to
allow for remote collaboration, its main focus, however, was on single user interaction with phys-
ical desks rather than face-to-face collaboration around tables. Nevertheless, the introduction of
the DigitalDesk was the starting point for digital tabletops research, their benefits, and potential
applications for both single, but mostly multi-user co-located interaction. Wellner’s DigitalDesk
used top projection, and two cameras, one for capturing the whole table space and detecting user
input (through hand movements), and the other for providing a small high resolution capture re-
gion in which views could be digitized. This configuration equipped the DigitalDesk with three
important characteristics: (1) electronic images could be projected onto the desk and onto physical
paper documents; (2) image processing enabled input from both pens and bare fingers; and (3) the
system was able to capture paper documents placed in the hi-resolution camera zone. Although
DigitalDesk did not address the issue of face-to-face co-located collaboration, it supported many
advanced functions that remain active topics of investigation including tangible interaction, the
augmentation of tangible objects (in this case paper) with digital data, and support for two-handed
interaction.
This chapter presents a review of the main directions that tabletop research has taken since
Wellner’s initial proposal. It is worth mentioning at this point that when I started this research in
early 2007, it was possible to explicitly include almost all the literature related to tabletop inter-
action in a review of the field. However, with the introduction of the “Interactive Tabletops and
Surfaces” conference in 2006 (and other smaller research events on digital tabletops) the number
of tabletop related publications increased significantly. Consequently, this review of tabletop re-
search only addresses topics in tabletop interaction more narrowly associated with the problem
of designing collaborative learning applications for digital tabletops. The review is divided into

16
four parts: part one covers work practices around traditional tables and how research on digital
tabletops has translated these practices into digital interaction techniques; part two addresses the
literature related to general design guidelines for tabletop applications; part three reviews full sys-
tems that have targeted learning rather than simpler archetypal tasks, such as image sharing and
browsing; and part four discusses existing tabletop hardware. Throughout this review, unless oth-
erwise specified, the term table is used to refer to traditional tables, and the term tabletops to refer
to digital tabletops.
2.2 Work practices around tables
Understanding the factors that make existing collaboration at a table so effective is central to the
design of new tabletop technology. Tang (1991) called for interface designers to “observe how
people collaborate then build software that facilitates collaboration based on those observations,
giving the users the ‘tools’ that are ‘naturally’ defined in face-to-face interaction”. Bly (1988),
followed by Tang (1991), made careful observations on how people collaborate in design tasks
around tables in face-to-face settings with the aim of informing the design of distributed collab-
orative technology. These widely cited observations informed much of the subsequent research
(e.g. use of the table space (Scott et al., 2004), orientation (Kruger et al., 2003), and collaborative
coupling (Tang et al., 2006)). With respect to the table space, Tang and Bly found that the ability
to share the drawing space on the table improves the collaborative experience and structuring of
the group activities, as compared to other distant settings (telephone link and media link). Activ-
ities around the drawing surface, and the close proximity allowed for by the table space, play a
role in focusing attention, drawing collaborators together, aiding in the expression of ideas, pro-
moting a high degree of awareness, improving coordination, and allowing for parallel interaction
on the drawing space. In addition, Tang observed that the spatial orientation among collaborators
and the drawing space also played a role in coordination and in defining regions and ownership
on the surface. With respect to the process of the collaborative task, they observed that the pro-
cess itself contained more information than is contained in the final output. The process usually
involved rapid switching between activities, and that the use of gestures during the process, as
afforded by the table setting, played an important role in collaboration by adding to the content of
the discussion.
While Bly (1988) and Tang (1991) made general observations on collaboration around tables
with the aim of informing distributed collaborative environments, recent observational studies
that aimed at informing tabletop design were narrow in scope and focused on certain aspects
of collaboration or targeted tasks which might readily translate into digital equivalents, such as
sharing photographs. For this reason, my initial goal was to conduct an observational study of a
more general scope into how people collaborate around traditional tables. This was not undertaken
in the expectation of making new findings, but rather to help in better understanding the previous

17
studies and to provide a context that manifests the relations between these studies. Literature
related to work practices around traditional and digital tables is provided within the context of
this observational study, which was designed to make visible the widest range of tabletop work
practices.
Summary creation study: The task for the study was to collaboratively summarize a five page
document. This activity was undertaken in three distinct stages: in stage 1 participants were
asked to read and annotate their documents individually (20 minutes allocated); in stage 2 the
participants, as a group, were asked to combine their notes onto a single new clean copy of the
original document (20 minutes allocated); and in stage 3, as a group, participants were asked to
use the annotations from the new version of the document to write a single summary of between
20-30 lines (10 minutes allocated). To motivate the group, participants were told that they would
have to make a 5-minute presentation based on their summary. Two groups participated in the
study, one group of three male students, and another group of three male students and one female
student. All participants were volunteer postgraduate research students with no specific knowledge
of collaborative interaction (age range 24-30 years). The participants knew each other well and
were members of the same university laboratory. The study was conducted around a round table
with four chairs. Three cameras were used to record video and sound throughout the study from
three different angles and distances. All participants were provided with a copy of the document
that was the subject of the study activity, a highlighter pen, a writing pen, and a set of Post-it notes.
Each group was also provided with a set of blank pages with which to create the final summary.
The instructions were given at the place of the study just before starting the task, and participants
were given enough time to read the instructions before starting.
I chose distributed cognition (DC) and activity theory (AT) to inform the analysis (Chapter 1).
Halverson (2002) compared the theories underpinning analysis techniques to pairs of dark glasses
that when used, bring some objects into focus and obscure others. DC helped in defining the broad
scope of the analysis to include in addition to the tools and how they transformed representation
states; the use of space (orientation included) and its role in cognition; and other factors that
we broadly classified as communication, including aspects of conversation, body position, how
documents are handled in public space, gaze, and gestures. AT, on the other hand, helped in
analysing some fine-grained interactions using the notions of actions and operations as explained
in the analysis.
The observations are divided into three categories: spatial considerations, communication
(verbal and non-verbal), and tools. For each category I first present the observations from the
study to set the context, followed by literature that explains and expands on these observations,
and conclude with accounts from the literature that address the corresponding design implications.

18
2.2.1 Spatial considerations
Spatial considerations include issues that relate to the table space and objects in this space. The ta-
ble space issues include its size and how the space is divided. Issues related to objects in the space
are either directly related to space like an object’s location and orientation, or indirectly related to
space like an object’s ownership and scale which are linked to its location and orientation.
Figure 2.1: The table was divided into personal spaces in front of each participant, storage spacesto the left of the personal spaces, and a public space in the middle (Stage 3: writing the summary).
2.2.1.1 Space and location
Table space plays an important role in structuring group activities (Bly, 1988; Tang, 1991; Scott
et al., 2004). Scott et al. (2004) thoroughly examined how this table space was used and partitioned
and the role that this partitioning plays in the collaborative process. Participants in this study, in
correspondence with the findings of Scott et al., divided the space into three areas: the spaces
directly in front of them were used as personal spaces (as identified by Tang (1991); Vernier et al.
(2002); Kruger et al. (2003)), the space in the middle of the table as a public (group) space for
collaborative tasks (as identified by Kruger et al. (2003); Vernier et al. (2002)), and the space
to the left of their personal spaces as storage spaces. This was apparent through all the stages
of the task (Figure 2.1). The position of paper on the table was related to how the table was

19
divided. When a participant was working individually on a local copy, papers were placed in the
personal space, near the edges of the table (Figure 2.2). When collaborating, even the local copies
of the documents were pushed slightly toward the centre (Figure 2.3). On the other hand, the
public document was mostly placed in the central area when it was the subject of discussion, but
it was pulled toward a participant, in a position that is almost between the public and the personal
space, when that participant needed to work on it. As an example, Figure 2.4 shows a participant
making the first annotation at the beginning of the collaboration stage (Stage 2); he worked on
the public document in the public space (Figure 2.4(a)) until no other participant showed clear
interest in participating directly in writing; only then did he pull the document closer to his space
and changed its orientation to suit him better (Figure 2.4(b)).
Figure 2.2: Working individually with papers positioned near table edges (Stage 1: annotating thelocal copies).
Figure 2.3: Collaborating: leaning forward with papers, including personal ones, pushed slightlytoward the centre (Stage 2: annotating the public document).
Scott et al. (2004) carried out a detailed analysis on the use of space at traditional tables
through two observational studies, the first in a casual setting with three different collaborative
games tasks, and the second in a formal setting involving a layout planning task. Their analysis
showed that (1) personal spaces are used to ease comprehension, as a reserve area for personal

20
Figure 2.4: Public document position: (a) at the very beginning of stage 2, and (b) after a shortperiod of time at the same stage.
use and for personal artefacts, and as areas for trying out things that might later be moved to
the public space; (2) group territory comprises the rest of the space and is used to perform the
principal collaborative tasks, such as providing assistance and sharing resources either by handing
them off to others, or by leaving them there for others to take at a later time; and (3) storage
territories, which are more problematic to characterize in that they sit above the other areas, are
usually mobile in nature, and have accessibility properties that depend upon their location. As
their name implies, storage areas are for storage and for grouping of items that may need to be
moved together. They may also inherit some functional properties from the territory that they lie
within. The partitioning of the table space, and the act of moving objects between these partitions
are found to be important factors in helping people coordinate their tasks and social interaction.
Beside using the table space to form territories, it is possible to understand the way people
use the space in each of these territories, and more generally the use of space in everyday ac-
tivities (Kirsh, 1995). A table space can be used to serve three functions: to simplify choice
(e.g. putting important objects in more accessible places than less important ones), to simplify
perception (e.g. clustering objects in space into groups of similar properties so they are easier to
keep track of), and to simplify internal computation (e.g. actually trying different letter arrange-
ments in Scrabble, rather than doing the computations internally). Krish also explained the role
of space in making thinking visible (externalization) and highlighted the importance of such ex-
ternal representations in supporting cognition. He argued that people have developed better skills
in dealing with external representations than with internal ones: “Space is a resource that must be
managed, much like time, memory, and energy. When we use space well we can often bring the
time and memory demands of our tasks down to workable levels. We can increase the reliability
of execution, and the number of jobs we can handle at once” (Kirsh, 1995, pp.32). This notion of
distributing cognition between internal and external representation, and the role of space as a tool
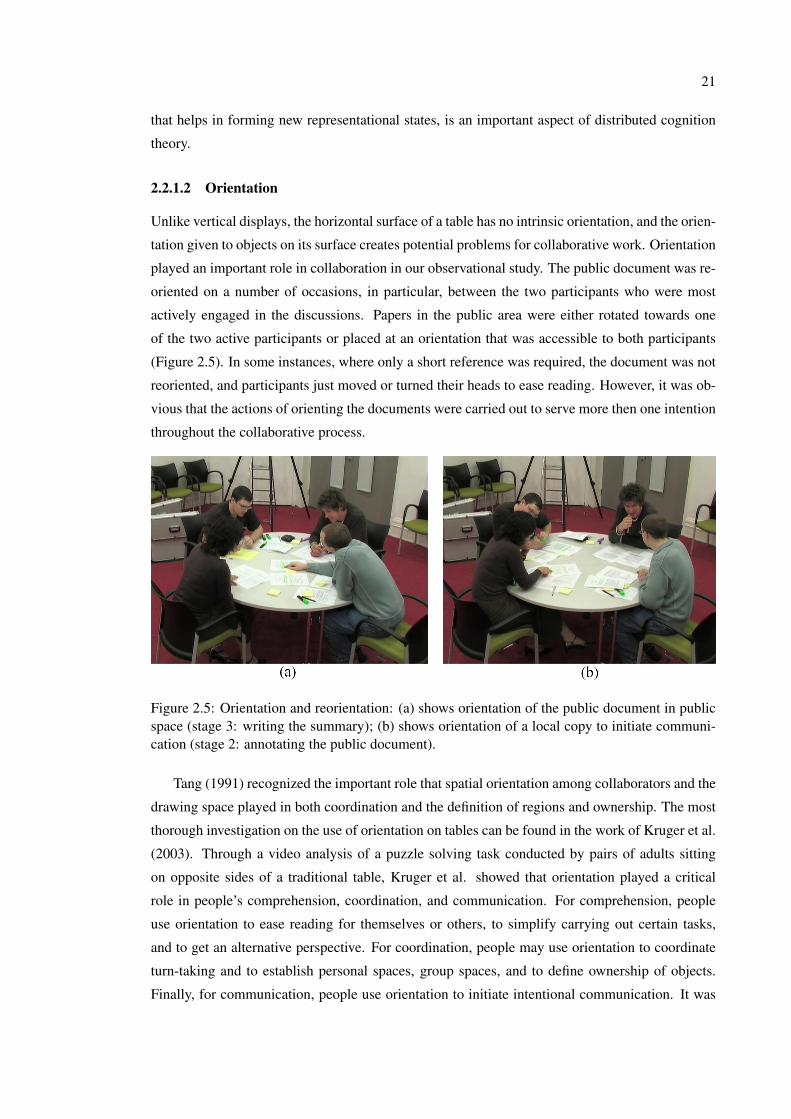
21
that helps in forming new representational states, is an important aspect of distributed cognition
theory.
2.2.1.2 Orientation
Unlike vertical displays, the horizontal surface of a table has no intrinsic orientation, and the orien-
tation given to objects on its surface creates potential problems for collaborative work. Orientation
played an important role in collaboration in our observational study. The public document was re-
oriented on a number of occasions, in particular, between the two participants who were most
actively engaged in the discussions. Papers in the public area were either rotated towards one
of the two active participants or placed at an orientation that was accessible to both participants
(Figure 2.5). In some instances, where only a short reference was required, the document was not
reoriented, and participants just moved or turned their heads to ease reading. However, it was ob-
vious that the actions of orienting the documents were carried out to serve more then one intention
throughout the collaborative process.
Figure 2.5: Orientation and reorientation: (a) shows orientation of the public document in publicspace (stage 3: writing the summary); (b) shows orientation of a local copy to initiate communi-cation (stage 2: annotating the public document).
Tang (1991) recognized the important role that spatial orientation among collaborators and the
drawing space played in both coordination and the definition of regions and ownership. The most
thorough investigation on the use of orientation on tables can be found in the work of Kruger et al.
(2003). Through a video analysis of a puzzle solving task conducted by pairs of adults sitting
on opposite sides of a traditional table, Kruger et al. showed that orientation played a critical
role in people’s comprehension, coordination, and communication. For comprehension, people
use orientation to ease reading for themselves or others, to simplify carrying out certain tasks,
and to get an alternative perspective. For coordination, people may use orientation to coordinate
turn-taking and to establish personal spaces, group spaces, and to define ownership of objects.
Finally, for communication, people use orientation to initiate intentional communication. It was

22
also observed that the use of orientation to initiate communication or define ownership of objects
was so well understood that it was rarely accompanied by additional communication (e.g. speech
or gesture).
The effect of orientation on readability of text in tabletop displays is another important avenue
of investigation. The effect of orientation on tasks, such as reading small pieces of text, and
searching for labels, was found to be less dramatic than expected (Wigdor and Balakrishnan,
2005). For this reason there is not a pressing requirement to sacrifice useful design features for
the sake of orienting text for optimal readability. In support of this conclusion, observations from
the summary creation study and from other researchers (Ryall et al., 2006; Morris et al., 2006b)
also showed that people often interact with, and comprehend, short textual information at odd
orientations without reorienting it towards themselves.
2.2.1.3 Ownership and access rights
Participants moved documents between their personal spaces and the central public space, and
oriented them towards themselves and towards others depending on whether they were working
on the documents individually or discussing them publicly. This demonstrated a strong relation
between the location and orientation of objects, and their ownership and access rights.
When people (and specifically adults) work from fixed positions, with the table space divided
into territories, they rarely, if at all, attempt to access objects placed in another person’s personal
territory (Ryall et al., 2004). Sharing of resources is usually mediated by the use of the public
space. Private documents, that are not meant to be seen by others, are kept away from the table
(e.g. in a briefcase). This behaviour is not enforced by any external restriction but is dictated
by social protocols (Scott et al., 2004; Shen et al., 2003; Kruger et al., 2003). Ownership, and
consequently the access rights of objects, are not a visible attributes like location and orientation,
but ones that can be determined by one or more of the following factors: (1) orientation of the
object, that is, if an object is oriented towards oneself then this is a claim of ownership, and if
it is oriented toward the public space or another person, then it is declared as accessible (Kruger
et al., 2003; Ringel et al., 2004); (2) location of the document with respect to personal, public and
storage spaces (Scott et al., 2004; Ringel et al., 2004); and (3) in the case of digital documents,
by its scale (Ringel et al., 2004; Shen et al., 2003).
2.2.1.4 Scale
In working with physical objects around a traditional table (unlike digital tabletops) there is no
control over the scale of objects placed on the table, apart from newly created writings or drawings.
Therefore, the summary creation study did not reveal any observations in this regard. Nevertheless,
scale of objects is an important attribute that can relate to its position on the table. People often
draw or write text in a smaller scale in their personal areas than in public ones (Tang, 1991).

23
Accordingly, Shen et al. (2003) suggested changing the scale of the document as a method of
controlling ownership so that when the document is made small it is made personal, and when
enlarged it is made public.
2.2.1.5 Table size, group size, and the issue of reach
Table size, group size, and the area of reach for people working around the table can affect the
size and shape of personal territories, which consequently affects the size and shape of the other
territories (Scott et al., 2004; Toney and Thomas, 2006a,b). From the perspective of reach (Toney
and Thomas, 2006a,b), the table is divided physically and psychologically into two main areas:
a reachable area (which is further subdivided into a working space near the body and within
bimanual reach, and a storage space a bit farther out); and the rest of the table (the area beyond
reach). Applying this to a group around a table, it was observed that the group space is formed
by the intersection of all the users’ reachable spaces. The summary creation study was conducted
around a round table with two groups of either three or four participants. The table had a diameter
of 1.5m which left enough room for the participants to divide the table into personal, storage,
and public spaces. Estimating that the personal territories occupied a depth of 40-50cm of the
table space, this left an inner circle of about 50-70cm for the public area. Had the table been any
smaller, there would have not been extra space in the middle for the public document, and had
it been any larger there would have possibly been reach and interaction problems. This means
that, as a general rule, any size that leaves space for partitioning with reasonable overlap between
reachable areas in the public space can be considered appropriate.
Ryall et al. (2004) investigated the effects of table size and group size on different aspects of
interaction around digital tabletops using a poetry assembling task on a multi-touch table. Their
findings can be categorized into table size related, group size related, and their combined effects.
The table size was found to have no effect on the speed of completing the task or the distribution
of work. Group size, on the other hand, did have a significant affect where larger groups were
significantly faster then smaller groups, yet they were more suspicious of one another and felt a
greater need to emphasize one’s contribution to the task. Group size also greatly affected how
the shared resource were positioned, oriented, and used; and the way in which the group moved
between parallel and collective modes (i.e. the coupling style). Finally, in the combined effect, it
was found that a smaller table did not penalize larger groups and a larger table did not penalize
smaller groups; subjects’ perceived an effect of the table size on the task but not the effect of group
size; and that small variations in the task design (distribution of resources) affected the distribution
of labour and strategy that the group employed.
Another observation was that subjects seemed reluctant to reach for objects near other partic-
ipants. Ryall et al. (2004) did comment that this observation conflicted with the findings of Bly
(1988) which stated that many interactions occurred on shared clusters in the design space, and
explained this difference by the fact that their task was divisible, while Bly’s task was not. Based

24
on this distinction, Ryall et al. came to the conclusion that whether a task is divisible or not had
an affect on group behaviour. My observations from the summary creation study confirmed the
observation of Ryall et al., but observations from the Digital Mysteries studies (which was not di-
visible, see Chapters 5 and 6) agree with that of Bly’s. This does seem to reinforce the conclusion
that whether the task is divisible or not affects such behaviour, but this difference is probably more
accurately attributed to whether the task was designed to be carried out by people sitting in fixed
positions, and thus forming personal spaces, or designed to be carried out by people standing and
moving freely around the table, with the possibility for tight coupling in certain sub-tasks. The
task conducted by Ryall et al. was a group activity to assemble target poems, and since the set-
ting required participants to carry out the task sitting in fixed positions around the table, personal
spaces were implicitly formed. If the same task was to be carried out by participants standing
around the table with the freedom to move around, one might expect the same task to result in
moments of deep coupling with participants working on shared clusters in the design space.
2.2.1.6 Implications on digital tabletops design
Most research contribution relating to the design implications of space-related issues address only
one or two of the object attributes discussed above (location, orientation, ownership, and scale).
Nevertheless, the findings and recommendations presented can be generalized to apply to all the
attributes. For example, many of the design recommendations regarding orientation also apply
to location, ownership and scale, and so on. For this reason I have chosen to group all research
concerned with such space-related issues into one section and, in some cases, traded being specific
about what each paper targets with unifying the findings and recommendations to present them in
a more useful form.
Proposed design guidelines for supporting territoriality and different object attributes are di-
vided into system level and territory level guidelines. On the system level (Scott, 2003; Kruger
et al., 2003), systems must allow for
• free and lightweight techniques for the adjustment of territory sizes, default attributes, and
attributes of items regardless of the default value,
• easy override of default actions associated with each territory, and
• the provision of clear feedback of actions.
At the territories level (Scott et al., 2004), territories should provide
• visibility and transparency of action (i.e. in contrast to using laptops as personal territories),
• functionality in the appropriate locality, and
• the ability to group items and tools.

25
Kruger et al. (2003) in their investigation of the issue of orientation, made the important ob-
servation that only slightly more than half the rotations resulted in alignment with the general
orientation of the associated territory, and the remaining rotations were arbitrary. Generalizing,
this suggests that if a system supports automatic settings for objects’ attributes depending on their
location, it must also allow for easy lightweight override of this automatic behaviour.
Shen et al. (2003) and Scott et al. (2004) discussed the issue of ownership and access rights of
objects. Shen et al. suggested three modes of object sharing: private (not visible, not accessible),
personal (visible, not accessible), and public (visible and accessible). The original owner of the
document should maintain explicit control about distribution and replication of the document even
when it is placed in the public space. The system should make such ownership information clearly
visible. The ownership attribute is rather different from location, orientation, and scale, in that
it is not an inherently observable attribute. Providing explicit ownership information on tabletop
content can provide context by increasing awareness about others contributions. When moving
an object between territories, it is desirable to be able to set whether the object’s accessibility is
changed, or whether a copy of the object should be created. Adding such options, consequently,
may interfere with the fluidity of collaboration due to the extra actions required to specify the
required setting. The issue of fluidly changing the different attributes of objects while moving
them between tabletop territories is the subject of Chapter 3, where the Attribute Gates interaction
technique is proposed as a solution.
The importance of being able to fluidly change the access rights of documents was emphasized
by Ringel et al. (2004) who proposed four techniques: release, relocate, reorient, and resize.
The release technique is based on the timing of holding and releasing a document between two
users. For the relocate technique the document’s access rights change with changes in its location
between personal and public spaces; for reorient it depends on its orientation on the table; and
for resize it depends on its size with the accessibility changing from personal to public when the
size of the document increases above a specified threshold. A user study showed that the relocate
technique was both the most efficient technique and was perceived to be the easiest to use. This
finding can be extrapolated to hypothesize that relocate could be a more efficient way to control the
other attributes of orientation and scale depending on the settings of the targeted territory. This is,
to a certain extent, what Vernier et al. (2002) suggested in their work on visualization techniques
for circular tabletop interfaces where they gave a number of suggestions regarding orientation and
scale. For orientation they worked on two levels, a global level at which all the table space is
rotated, and a document level at which individual documents can be rotated automatically as they
are relocated either in the direction of the centre of the table, or to face a certain magnet point.
As for scaling, they proposed two modes depending on whether users are working independently
or are sharing objects: a central focus mode for sharing where documents are larger in the middle
and smaller at the edges, and a black hole mode for working independently where documents get
smaller the closer they get to the middle of the table.

26
Other research on tools has sought to resolve issues related to managing space coordination,
and attribute settings of groups of objects simultaneously (Storage bins (Scott et al., 2005), Table-
Trays (Pinelle et al., 2008) , and interface currents (Hinrichs et al., 2005)). These three techniques
allow for adding/removing items, and for manipulating the location, size, and orientation of the
container region. They help in managing the space by allowing for partitioning the workspace and
reducing clutter; and help in coordination by facilitating group interaction, and sharing and access
of resources. Interface currents were intended as group or storage spaces, and were principally de-
signed to solve the problems of reach, access, and sharing of objects by providing regions (pools)
or paths (streams) that rotate/flow in a controlled speed and direction (similar to Lazy Suzan ta-
bles and conveyor belts). Storage bins are similar to pool shaped interface currents. They have
the ability to change their shape, but without the flow effect, and are basically aimed to provide
mobile storage mechanisms. TableTrays, on the other hand, have fixed rectangular shapes and, in
addition to providing storage, provide more functionality by allowing cut/copy/paste operations
that enable the transfer and replication of contents. All of these techniques were found to be useful
in facilitating task coordination and group interaction, managing the workspace, reducing clutter,
and easing access and sharing of resources. The three techniques addressed the issues of orienta-
tion and scale differently. For example and with regards to rotation, storage bins used the rotate
and translate mechanism (Kruger et al., 2005), interface currents depended on the flow effect for
orientation, and TableTrays supported rotation by twisting the stylus around the z-access. Storage
bins and interface currents automatically resized contents when dropped inside them, while Table-
Trays depended on manual resizing and provided an option to restore the size of an item that had
been manually resized while in the tray to its original size when taken out of the tray.
Another important issue that is related to utilizing table space and the location of objects on
that space is the placement of controls (such as menus and buttons) on the table, and whether
these should be centralized and shared in the public space or replicated for each user (Morris
et al., 2006b). Using a picture labelling application in two modes, one that used centralized polar
menus in the public area and another that used replicated copies of rectangular menus placed on
the edges of the table in front of each of four users, Morris et al. found that users overwhelmingly
preferred the replicated controls over the centralized ones. Two explanations for this were sug-
gested, firstly, that users showed aversion to the physical proximity with team mates’ hands that
the shared centralized design imposed (Ryall et al. (2006) also reported that people using direct
touch tables showed concerns about their arms or hands accidentally bumping with one another),
secondly, users had a preference to leave the central area of the table clear for other collaborative
tasks rather than filling it with controls. Based on these findings, and the type of task involved, it
was recommended that applications should provide a set of controls for each user, and that these
controls should be placed on the edges near the user if possible, or allow for controls to be moved
as the user requires. This recommendation, assumed users working from fixed positions, yet for
mobile users, a contextual-menu, or a centralized menu option would seem to be more appropriate.

27
2.2.2 Communication
Collaboration around tables is different from collaboration at other devices, mainly because of the
unrestricted, face-to-face style of work that tables afford. This style of collaboration leaves open
a space for direct human interaction and a greater reliance on verbal and non verbal communi-
cation channels. To understand how people collaborate, it is thus necessary to observe not only
the actions that are directly related to the accomplishment of a task, but also hidden aspects of
communication, or even the absence of actions, that might have contributed (Hollan et al., 2000).
My observations included conversation, body position, gaze and gestures.
2.2.2.1 Conversation
Inevitably, conversation was the principal means of collaboration. Notably, most of the conversa-
tion took place between two participants in each group who undertook the majority of the work.
Following Morris and Winograd (2004), it is possible to categorize the different types of conversa-
tion in collaborative tasks according to whether they are related to the details of the task, planning
of the task, or management of the resources at hand. Talk that is related to annotating or summa-
rizing (details of the task) was the main component of conversation, though at the beginning of
each stage participants spent some time discussing how to proceed. In stage 2, the initial discus-
sion was about who was going to do the actual annotation, and for stage 3, it was about who was
going to dictate and who was to do the transcription. Because of the small group size, the small
number of shared resources, and the size of the table used, no conflicts or explicit coordination
effort were expected or observed. Access was simply coordinated through the usual “standards of
polite behaviour” (Morris et al., 2004).
2.2.2.2 Body position
Posture at the table conveyed implicit information about the coupling styles of participants. Dur-
ing stage 1, while working individually, all participants at some stage adopted an up-right posture,
and leaned slightly on the table (Figure 2.2). During collaboration, all participants leaned more
significantly toward the centre of the table (Figure 2.3). The contrasting position of leaning back-
ward indicated task completion, or disengagement from the task (Figure 2.6). Interesting postures
were observed while handling the public document when placed in the public space (Figure 2.7)
during attempts to increase the awareness of others of the type and location of action.
2.2.2.3 Gaze and gesture
Three of the functions of gaze that are identified by Knapp and Daly (2002) were observed during
the collaborative stages: (1) information gathering; (2) looking at the face of another person to
establish an obligation to interact or to signal turn-taking (regulating the flow of communication);

28
Figure 2.6: Leaning backward: idle-state (stage 1: finished annotating the local copy)
Figure 2.7: Special handling of the public document (stage 2: annotating the public document)
and (3) looking at others after making a suggestion in an anticipation of a non-verbal reply (mon-
itoring feedback). Deictic gestures (i.e. pointing) played a major role in promoting awareness and
coordination. Participants pointed to the public copy, to their local copies, and to a lesser extent,
to the local copies of other participants to attract focus to a certain page or a certain position on a
page (Figure 2.5). Certain actions were exaggerated to draw attention to the participant’s status or
change of status. For example, aligning pages and/or capping the pen in a particularly demonstra-

29
tive manner to declare a completion of a task (Figure 2.8), and tapping on the table with the pen
or fingers to indicate involvement in the task. Gestures and actions were also used in coordinating
turn-taking (Tang, 1991). In one case a participant even threw the public document to another
participant across the table informing him that it was his turn (Figure 2.9).
Figure 2.8: Gestures: The use of stylised actions to indicate a state transition.
Gutwin and Greenberg (2000) and Pinelle et al. (2003) considered such verbal and non-verbal
behaviours to be part of the low level actions and interactions that must be carried out to complete
a shared task, and called them the mechanics of collaboration. Gutwin et al. divided group
work into task related work (which applies to individual work as well as group work), and team
related work. Team related work can be further categorized according to whether it relates to
social and group dynamics, or the mechanics of collaboration. Our interest in this section is
in the mechanics of collaboration, which can be either communication or coordination (see the
updated categorization (Pinelle et al., 2003)). Communication can be explicit or implicit through
the gathering of information. Some of the actions discussed previously, such as verbal, gestural,
and manifested (exaggerated) actions, fall into explicit communication; while actions intended to
increase ones awareness about the process by observing other people in the a group, their activities,
and changes made to objects in the space fall into implicit communication (i.e. information that
is communicated through observation and not stated explicitly). Coordination is required when

30
Figure 2.9: Throwing the public document to another participant
managing access to resources or when transferring objects. When such coordination is not done
physically, it will be through one of the communication techniques discussed, such as verbally,
through body position and movements, or using gaze and gestures. The mechanics of collaboration
identify observable, low-level interactions that can help in analysing collaboration and breaking it
down into specific actions that can be evaluated one at a time.
2.2.2.4 Implications on digital tabletops design
The variety of functions served by verbal and non-verbal communication highlights the impor-
tance of enabling barrier free communication between collaborators around a table. Gutwin and
Greenberg (2000) considered the degree to which a groupware system supports the mechanics of
collaboration to be a measure of its usability. They suggested the mechanics of collaboration as
a discount evaluation method for shared-workspace distributed groupware systems. Traditional
tables provide a barrier-free communication environment with natural support for awareness and
verbal and non-verbal actions (Rogers and Lindley, 2004; Tang, 1991; Bly, 1988). Therefore,
groupware systems based around tables rank high in their support for the mechanics of collabora-
tion. Digital tabletop interaction designers must take care not to introduce features or obligations
on users that hinder these channels of communication (e.g. visual or auditory barriers). Poten-

31
tial visual barriers include the use of personal devices such laptops in front of each participant.
The presence of the vertical screen can affect both explicit communication by hiding some of
the communicative gestures, such as pointing (Scott et al., 2003), and implicit communication by
reducing awareness about others, their activities, and changes made to objects on these personal
screens or on areas obscured by these screens. Auditory interference can be introduced when
providing public or private audio feedback. For example, private instructions provided through
headphones negatively affect implicit communication (information gathering) and may result in
responses on the part of the receiver that are distracting and unintelligible to collaborators. More-
over, private and public feedback that is not timed appropriately contribute to breakdowns in the
interaction (Morris, 2006; Scott et al., 2003).
The analysis so far has been guided by distributed cognition theory to bring into focus different
aspects of the interaction. As mentioned in section 2.2, it is useful to apply activity theory (AT)
for the detailed analysis of the verbal and nonverbal behaviour to lead to the same conclusions
regarding the provision of the barrier-free communication environment. Verbal and non-verbal
behaviour of users can be categorized into conscious actions that serve a specific goal and sub-
conscious operations that result in as reactions to different conditions (refer to section 1.3.1). Ac-
cording to AT, subconscious operations transform into conscious actions because of breakdowns
in the process or when a tool that is used in the interaction brings focus to itself rather than to the
process. Consequently, it is possible to study the categories of actions and their frequency, and
how the introduction of new circumstances (such as introducing personal devices or audio feed-
back) affect the distribution and frequency of actions and operations. As an example, observing a
person’s gesture and reacting to it is usually done subconsciously, but if the gesture was obscured
by a visual barrier forcing the observer to take an intentional action to observe it, such as moving
aside or explicitly asking the action initiator to repeat or explain what they have done, then this
is an indication to a breakdown in the interaction process which requires a modification to the
design. A similar analysis can be applied to the provision of audio feedback and whether it leads
to breakdowns in the process that shift subconscious operation to conscious actions or not.
2.2.3 Tools
Tools or artefacts (Norman, 1993) play an important role in any collaborative process serving both
as cognitive tools and tools to support coordination. Distributed cognition places a significant em-
phasis on tools (Hollan et al., 2000) and equates them to humans as agents in the cognitive process.
Tools are also important to other analytical frameworks such as Activity Theory (Halverson, 2002)
which considers them as mediators between the subject (the human) and the object (the desired
outcome). The tools in this study were the table, the pens and highlighters, and the papers (the
document and the summary page). The participants’ use of their hands is also considered under
this heading.

32
2.2.3.1 Table, pens and highlighters
The table itself provided physical support for the participants and the collection of tools. Its
relatively large size allowed for the division of its surface into territories and allowed participants
to freely move and spread their pages in different spatial arrangements. The pens were used for
more than just writing and on a number of occasions they were used to indicate the participants’
state or state transition. As already discussed, an exaggerated action of uncapping and capping
the highlighter was used to mark the start or end of an action; and holding the pen advertised the
participants continued engagement in an activity even when that activity did not require them to
write anything. The pens were also used as pointing devices and for coordination, for example,
handing the pen or highlighter to another participant to request action.
2.2.3.2 Hands and bimanual action
Although, as expected, all the annotation and writing was performed with the participants’ dom-
inant hands, non-dominant hands were used frequently to hold documents close to participants
while reading, to move and rotate the documents, flip pages, and to set pages in suitable positions
and orientations while writing and annotating. For two-handed operations, one hand is typically
used as the anchor for the action of the other (Guiard, 1987; Buxton and Myers, 1986). Such dif-
ferentiation between the use of the dominant and non-dominant hands has the potential to inform
the design of input devices suitable for the types of tasks carried out by each hand. In contrast to
desktop and laptop systems, the coincidence of the action and perception spaces of digital tabletops
means that they have a particular potential to support bimanual input (Balakrishnan and Hinckley,
1999). Whether using the hands, pens or both, the two inputs can have the same reference frame.
The potential to support bimanual action can reduce cognitive load for low-level manipulation
tasks thereby helping users focus on high-level tasks (Hinckley et al., 1998; Leganchuk et al.,
1998). Techniques specifically designed for bimanual input (e.g. ToolGlass (Bier et al., 1993))
have the potential to facilitate fluid tool switching.
2.2.3.3 Paper (documents and summary page)
The way in which people use paper while reading, annotating, and writing, individually and collab-
oratively around a table, is likely to impact significantly on the design of effective digital tabletops.
As physical objects, the sheets of paper played an important role in task coordination where par-
ticipants pushed or oriented one or more sheets towards another as a request for action. As already
described, one participant even threw the document across the table to another person as a request
to take action (Figure 2.9). The fact that paper is easy to move, navigate through, spread and
spatially arrange, are major advantages over electronic document alternatives (O’Hara and Sellen,
1997). Paper documents also have an inherit ability to support the promotion of awareness. Others

33
can easily observe and comprehend actions taken on, and with, paper, and be aware of the owner’s
actions and intentions.
2.2.3.4 Implications on digital tabletops design
Interaction with tangible objects, like paper, on traditional tables is carried out through hands and
tools, such as pens. With digital tabletops, on the other hand, interaction can be through pens,
touch, and mice, and in each of these cases interaction can be through single or parallel input.
The interaction objects are mostly digital, and in some cases tangible. Moreover, interaction
can be one-handed, or two-handed depending on the input technology used. Due to this variety
in input options, there are a number of issues that need to be addressed: (1) the affordance of
two handed interaction on digital tabletops as compared to two-handed interaction with physical
objects; (2) the support of tangible interaction on digital tabletops; and (3) the effects of the type
of input technology, and whether it supports single or parallel interaction, on different aspects of
the interaction.
2.2.3.5 Two-handed interaction
Useful insights can be drawn from Terrenghi et al.’s (2007) study of the affordances of manipu-
lating physical versus digital media on a tabletop. For their investigation, Terrenghi et al. used
a tabletop system that used bottom projection and a camera to support of multi-touch input. The
system allowed for manipulating digital objects using physical interaction metaphors in terms of
rotation and translation and did not support scaling as this is not possible in the physical world.
Participants were given puzzles as well as photo sorting tasks in both physical and digital set-
tings with digital objects made to resemble the physical ones in terms of size and high resolution.
While, as expected, people performed the same subtasks in both cases (getting an overview of
content, comparing objects, focusing on objects and so on), the means by which these subtasks
were carried out differed. The most relevant findings were that participants predominantly used
one-handed interaction with digital media, although bi-manual interaction was allowed, and that
even when both hands were used, they were used in a symmetric manner. This was in contrast
to the way participants handled the physical media where they used both hands in an asymmet-
ric manner in correspondence with previous findings in bimanual interaction (Guiard, 1987). It
is important to point out that some of these differences in handling digital and physical objects
may have been caused by the novelty of the technology as the study was conducted over very
short periods (less than 10 minutes), or limitations of the implementation employed. This can be
inferred from the fact that users reported high level of frustration when using the digital version,
particularly for the puzzle task which required the manipulation of small objects. The reason for
this frustration, which may have had strong implications on the differences in behaviour observed
around digital and physical objects, was not reported and therefore it remains unknown whether

34
the difference in behaviour were caused by the specifics of the implementation, the novelty of the
technology, or merely as a result of interacting with digital media. Nevertheless, it is still useful
to consider the recommendation that simply allowing two-handed interaction on the tabletop may
not always be enough, and that different techniques must be provided in the digital case to achieve
the same task with physical media. Terrenghi et al. suggested either supporting techniques that
require asymmetric two-handed interaction like ToolGlass (Bier et al., 1993) or allowing for hy-
brid physical-digital user interfaces. The inability to translate all aspects of tangible interaction
to the digital world has lead other researchers to focus on bringing tangible interaction to digital
tabletops rather than trying to enforce physical characteristics into virtual objects.
2.2.3.6 Tangible interaction
Bricks (Fitzmaurice et al., 1995) and MetaDesk (Ullmer and Ishii, 1997) were two pioneering
attempts in bringing graspable (Fitzmaurice et al., 1995), or tangible (Ullmer and Ishii, 1997)
characteristics to user interfaces and both were demonstrated as part of a physical desk setting
(ActiveDesk and MetaDesk). Bricks aimed at utilizing the richer handling afforded by physical
objects as compared to virtual ones like facilitating two-handed interaction, spatial reasoning, par-
allel position and orientation, and collaborative use. This was through physical controls (small
physical bricks) that played the role of physical handles to operations like selection, resizing,
moving and rotation. MetaDesk, in addition to the brick-like physical controls, introduced more
complex tangible user interface components like a passive lens (a transparent wooden frame aug-
mented with digital data), and active lens (a movable small display in a 3D space), trays (menus),
and instruments (other widgets like sliders) with the aim of shifting from traditional user interfaces
to ones with more tangible characteristics. Further work on tangible user interfaces for tabletops
proceeded in different directions, such as improving the tracking technology (Patten et al., 2001),
or introducing tangible musical interfaces (Jorda et al., 2007; Bartindale et al., 2009). Some re-
search even involved enabling the table to move certain tangible objects on its surface with the aim
of studying how mechanical constraints can be used to control the digital computations reflected
by the positions of these movable objects (Patten and Ishii, 2007). A modern version of Bricks
and MetaDesk is realized by the Slap widgets (Weiss et al., 2009) which are transparent silicon
widgets that can be visually tracked by the table and augmented with any type of digital data. The
sample Slap widgets demonstrated were knobs, buttons, sliders, and a keyboard.
2.2.3.7 Interaction techniques
A number of researchers investigated the impact of different input technologies on the nature of
interaction around shared displays (Ha et al., 2006; Marshall et al., 2008; Hornecker et al., 2008;
Forlines et al., 2007; Muller-Tomfelde and Schremmer, 2008). For tabletops, single mouse, multi-
ple mouse, and direct touch (stylus or fingers) inputs have been explored. Ha et al. (2006) focused

35
on how direct (touch and stylus) and indirect (mice) input differed in relation to the naturalness
of interactions, ergonomics, territoriality, gestures, and awareness of intentions and actions. Their
main findings were that direct touch supported more natural interaction and increased coordi-
nation compared to mouse input. However, direct touch was more tiring and could have reach
problems for large interfaces. Marshall et al. (2008) studied the effects of different types of input
(touch/mice) and the number of inputs (single/multi) on physical interaction and verbal participa-
tion. In simple terms, they found that multi-touch surfaces increased physical interaction equity,
but had no impact on verbal participation. Finally, Hornecker et al. (2008) found that multi-touch
interaction improved awareness, compared with multi-mouse interaction, and lead to more fluid
interaction. They also observed that even though multi-touch interaction gave rise to more action
interference (than multi-mouse) these were usually quickly resolved and did not cause breakdowns
in the interaction. It is interesting that although no existing tabletop system uses mice as the in-
put technique, these papers compare mice with direct input techniques. A comparison between
stylus input and touch input, which are the two dominant input techniques for current tabletop
systems, and a combination of stylus and touch would have been much more useful to tabletop
system designers in providing guidelines for choosing a suitable technology for a specific context.
Brandl et al. (2008) investigated pen and touch input but in two handed interaction where they
experimented with touch and touch, pen and pen, and pen and touch, and their results suggested
that pen and touch (pen for the dominant hand, and touch for the non-dominant hand) is superior
in terms of speed, accuracy, and user preference.
While the previous work established many benefits of multi-touch over multi-mouse, other re-
search (Birnholtz et al., 2007; Do-Lenh et al., 2009; Hornecker et al., 2007) compared multi-input
in general (touch or mice) with a single access point (single-touch or one mouse) on a shared
display. Their results supported the concerns of Stewart et al. (1999) regarding the support of par-
allel interaction: although multi-access points lead to more equitable interaction, they also lead to
more parallel work, and that single mouse interaction lead to higher quality discussions than multi-
access points. Moreover, while multi-input encouraged shy people to participate and reduced the
dominance of one person, it reduced the effect of learning from the higher achievers. Unlike Birn-
holtz et al. (2007) and Do-Lenh et al. (2009) whose results were based on adult users, Harris et al.
(2009); Rick et al. (2009a) compared multiple-touch and single-touch collaborative interaction by
children (7-10 years) and reported different findings. Using OurSpace, a layout design application,
Harris et al. and Rick et al. reported that the equity and frequency of interaction were found to be
the same in both single- and multi-touch, and that the type of discussions, rather than their qual-
ity, was what varied between the two conditions. In the multi-touch condition discussions were
found to be more task focused, and in single-touch condition conversations were more focused on
turn-talking and coordination. Single-touch, however, was reported to promote higher awareness
of action in some cases. Such findings may reflect negatively on tabletop systems, but one should
keep in mind that these findings are based on studies that compared working on basically the same

36
application but with single or multiple inputs. To utilize the advantages of tabletops, applications
should be designed to utilize all their unique affordances and integrate built-in rules that reduce
possible negative effects. A fair comparison can only be made with applications that are designed
to best utilize the unique features of both settings – such comparisons have yet to be conducted.
Conclusions as to the comparative advantages of touch and stylus interaction with tabletops
can be drawn from the observations reported by Ryall et al. (2006) on people using direct-touch
tabletop systems in the wild (in a variety of contexts). The relevant findings can be categorized
into input-technique-related issues, and issues related to the physical set-up of the table. For the
former, it was observed that some people were hesitant to touch the table at the same time as others,
particularly at the start of an interaction among group members that did not know each other.
Users, and in particular adult users, were concerned that their arms or hands might accidentally
bump with those of others (a similar observation was reported by Morris et al. (2006b)).Touch-
based tables suffered the problems of accidental touch, the low finger resolution, and hygiene-
related concerns. Moreover, even though the tables used supported multi-touch, users used single-
finger interaction in a manner similar to the more familiar stylus or touch-screen interfaces. As
a result, some people preferred to use a stylus (or other input devices) as an alternative to touch
input. In relation to the physical setup of the table, Ryall et al. found that people tended to lean
on the table with their elbows. Therefore, and to keep interaction on the table natural, they stated
the importance of allowing for this behaviour either by providing a suitable elbowroom around the
edges, or by ignoring this class of touches. Finally, the size, height, and the shape of the table, and
whether users were required to stand or sit around the table were found to greatly impact on the
characteristic of users’ interactions and therefore these factors must be taken into account when
designing a tabletop system for a specific task.
In addition to work exploring interaction tools and techniques, there is a large body of research
that addresses more specific issues as to detailed aspects of different interaction techniques. For
example, mechanisms for controlling the translation and orientation of objects using a single point
of touch input (Kruger et al., 2005), improving handoff techniques for digital objects on the ta-
ble (Jun et al., 2008), making use of the contact shape information on direct-touch surface to
mimic the physical world and allow for a level of tangible interaction (Cao et al., 2008; Wilson
et al., 2008), supporting flicking gestures using computer vision (Sato et al., 2008), and many
others.
2.3 Work on design guidelines
A number of researchers have explicitly suggested general design principles and guidelines for de-
signing digital tabletop systems (Wallace and Scott, 2008; Scott et al., 2003; Morris, 2006). There
is little overlap between these proposals as they address distinct issues, often at different levels of
abstraction. Wallace and Scott adopted the most abstract position and concerned themselves with

37
the factors that are external to the table itself, and how they should reflect on the software user
interface, the physical form, and connectedness. These included social and cultural factors, type
of activity, duration or temporal factors, ecological factors, and the motivation behind the activity;
which in simple terms are answers to the questions of who, what, when, where, and why? The
effect on the user interface is primarily reflected in its complexity and the type of interaction tech-
niques it utilizes. With regard to the physical form, these external factors affect the dimensions,
shape, angle of display and the aesthetic design of the table. For connectedness, the guidelines
make reference to the awareness of the system of external devices and the connectability of these
devices to the system, or between themselves through the system. For example, for infrequent
users in a formal setting, the user interface should be as simple as possible to reduce the possibil-
ity of making mistakes and causing embarrassment, and it should also allow for connecting and
using personal devices for working on private data. For professional users who are expected to use
the table frequently, a more sophisticated user interface can be used. Likewise, a table in a coffee
shop has different ergonomic requirements than that in an office or a classroom.
Scott et al.’s widely cited guidelines (Scott et al., 2003) are less abstract, and can be summa-
rized as follows:
• Supporting interpersonal interaction: The system should not cause conversation or visual
breakdowns while the users are interacting. Natural interaction can also be supported with
an appropriate and friendly physical design for the table.
• Supporting fluid transition between activities: This can be in terms of software tools, or
hardware/software tools as in switching between using a physical keyboard and a stylus.
• Supporting transitions between personal and group work: Dividing the table space in per-
sonal and public areas is suggested as a way to support this.
• Supporting transitions between tabletop collaboration and external work: Work generated
externally should be easy to incorporate in the tabletop environment and vice versa.
• Supporting the use of physical objects: Physical objects include pen, paper and/or tangible
objects augmented with digital data.
• Providing shared access to physical and digital objects: Shared access to physical and dig-
ital objects should be provided where it helps in maintaining group focus and facilitates
awareness.
• Form and configuration: Consideration should be paid to the appropriate arrangement of
users and the table shape and size, in relation to the task at hand.
• Supporting simultaneous user actions: Parallel interaction should be allowed by all users,
rather than restricting access to one user at a time.

38
The recommendations of Morris (2006) are at the lowest level of abstraction and can be cat-
egorized as relating to regions, clutter reduction, access permissions, group dynamics, working
style, and usability metrics. Her design recommendations can be summarized as follows:
• Regions: Provide a central area for sharing resources, visually distinguish different tabletop
regions, place user controls on the table edges, and allow for structuring the space like
providing regions for trash.
• Clutter reduction: Consider the use of individual targeted audio as an alternative to visual
representations when appropriate, and provide personal storage areas that can be closed and
restored in a fluid manner.
• Access permissions: Provide means for fluidly controlling the access rights of documents,
and if possible make these access rights visible to increase awareness.
• Group dynamics: Provide private and public, audio and visual feedback to increase aware-
ness and regulate participation levels, consider the location of controls as this also has an
effect on participation, enforce a structure on the interaction as this can help users with
special needs, and prevent individual users from executing global level actions that affects
others.
• Work style: Provide private audio feedback to help facilitate smooth transitions between
tightly and loosely coupled activities, and provide global controls that can only be executed
collaboratively to increase team spirit.
• Usability: Focus on design issues that are related to promoting effective collaboration rather
than speed and efficiency.
2.4 Tabletops and learning
Early research on digital tabletops focused on specific issues like the use of orientation, space, and
interaction techniques. Applications developed in these initial explorations of the design space
were rather simple and focused at specific interface issues. From 2006 onwards, contributions at
the application level began to emerge, some of which specifically investigated learning support
and problem solving using digital tabletop interfaces (Piper et al., 2006; Rick and Rogers, 2008;
Rick et al., 2009a; Piper and Hollan, 2009; Morgan and Butler, 2009; Do-Lenh et al., 2009; Fleck
et al., 2009). All these contributions motivated the use of tabletops in terms of their unique char-
acteristic of bringing computer support to face-to-face style of collaboration, the higher levels of
engagement of users (compared to other media), and the potential benefits of new types of educa-
tional applications based on tabletops. However, there have been relatively few studies that have
incorporated explicit educational goals, grounded in pedagogical theory, and conducted in realistic

39
settings. Rather than focusing on the sorts of issues educational practitioners and researchers are
concerned with, such as comprehension and higher level thinking skills, tabletop learning research
has to date tended to be exploratory in nature, focusing on specific applications, such as layout
design and the physical manipulation of virtual objects (Piper and Hollan, 2009; Do-Lenh et al.,
2009).
Rick et al. (Rick and Rogers, 2008; Rick et al., 2009b) adapted a desktop learning application
to a multi-touch surface. In their work, they used learning theory to motivate the transformation
from desktop to tabletop, guide the design process, and inform the evaluation. Their collaborative
learning application (DigiTile) aimed at helping children with age range (9-12) to collaboratively
learn about fractions. The implementation used a small (81cm diagonal) DiamondTouch table (Di-
etz and Leigh, 2001) and required its two users to sit next to each other at one side of the table.
Their system used a standard menu bar at the top and a set of replicated toolbars on each side
with a shared area in the middle. The design targeted a number of important educational con-
cepts, such as allowing for different perspectives of the data, supporting learning by doing, and
encouraging collaboration. With respect to collaboration, they experimented with two different
ways of allocating resources between participants: shared resources with each child having a full
set of the required resources on her side, or split resources with each child having only half of the
required resources. The evaluation of the system was based on pre- and post-tests. The results
showed significant improvement in knowledge about fractions after using DigiTile, but no signifi-
cant difference between the different resource allocation strategies. Rick et al. (2009b) reported an
interesting observation related to the distribution of work on multi-touch surfaces (refer to section
2.2.3.7), where they observed that even though parallel interaction was permitted in DigiTile, the
more difficult the task was, the more the children worked jointly on solving it. While in their work
Rick and Rogers (2008) specifically raised a question regarding adapting applications to new me-
dia, “could the new application benefit significantly from the move to the new interface?”, their
implementation still had a number of similarities to a desktop setting with its shoulder-to-shoulder
style of interaction, fixed horizontal orientation, and a menu bar for initiating commands. Allow-
ing for simultaneous direct touch interaction on a horizontal surface, does enforce a different style
of interaction than that with a single (desktop) computer display, but the applications still leaves
many of the tabletop characteristics (the new interface) un-utilized.
Piper et al.’s (2006) work on SIDES targeted a very specific audience, adolescents with As-
perger’s syndrome in social group therapy. The aim of the application was to encourage the
practice of effective group work skills, such as negotiation, turn-taking, active listening, and per-
spective taking. This involved four players seated in fixed positions around a tabletop each with
a similar set of voting tools that generate action level events only when all of the participants
pressed them simultaneously. Enforcing collaboration in this manner mitigated against individual
decisions and encouraged social interaction. The pedagogical design was based on constructivist
learning theory and on Vygotsky’s theory (Vygotskiı et al., 1978) that learning is a social process

40
with roots in social interaction. Through an account of an iterative design process starting with
interviews, and moving to paper prototypes, Piper et al. demonstrated that such a tabletop game
provided a motivating experience which helped member of this challenging user group learn ef-
fective group work skills. When the computer enforced the coordination rules, the emphasis of the
therapist’s role changed to being one of helping the clients reflect on the activity and tie it to their
experiences in real life. While the application was carefully designed to utilize the affordances of
the technology in coordinating collaboration, generalizing the reported observations must be done
with care due to the specific nature of the targeted audience.
Morgan and Butler (2009) assessed the potential impact of multi-touch technology on cogni-
tion and learning using three theories: social-cultural theory (for dialog and collaborative layer);
distributed cognition (DC) theory (for shared digital workspace layer); and situated cognition (for
the cognitive activity context). In DC, they considered the tabletop as the mediating artefact be-
cause it holds a representation of the current state of the solution to the problem and as in Hilliges
et al. (2007), they referred to the table’s characteristic of preserving this state and thus freeing
cognitive load from the students. The preservation of the representation state is, however, not the
only thing to shape the cognitive activity, but also the tools available and the structures that control
the collaborative process. Mediating artefacts can be considered as tools that regulate activity by
organizing a division of task and coordinating collaboration. Morgan and Butler proposed con-
cept mapping and story boarding applications for the purpose of their investigation. The proposed
designs were based on the concepts of working from fixed positions, the division of tasks, and
roles assignment. While highlighting the importance of identifying students to allow for monitor-
ing contribution, Morgan and Butler also discussed the difficulties in doing that with multi touch
tables and suggested solutions based on area of interaction and the division of tasks and roles.
Do-Lenh et al. (2009) investigated the effect of tabletops with tangible interfaces on collabo-
rative learning. They compared a concept mapping task performed around a traditional computer
display using one mouse/keyboard for input, with a tabletop application that supported tangible
interaction, and measured the differences between individual and group learning gains. Based on
pre-tests and post-tests, their results showed no significant effect on individual learning gains, but
also showed that groups using the traditional computer setting learned significantly more from
their partners than in tabletop setting. Their analysis of the results showed that the traditional
computer setting with its one point of access helped in transferring knowledge from more achiev-
ing to less achieving students, and thus such a setting might be preferable in cases where the level
of initial knowledge between group members is significantly different. They justified this in that,
for tabletop conditions, high-expertise students failed to dominate the conversation and thus had
less positive effect on their partners. This indicates that the equal level of participation afforded by
tabletops, if not utilized correctly, may have negative effects on group learning in groups with vari-
ant levels of initial knowledge. On the other hand, such equal level of participation is considered
to be an advantage if the goal is to reduce the effect of dominant students. Finally the analy-

41
sis showed that collaboration in tabletop condition was mixed between explanation, group work,
and individual work, while in computer case there was a division of roles and more coordinated
collaboration.
Piper and Hollan (2009) focused on tabletops as a studying tool for pairs of students (under-
graduates in this case) and compared it to studying on paper. Their main goal was to investigate
two issues: the effect of large, horizontal, multi-user displays on cognition and social activities
in shared studying environments; and the pedagogical benefits gained from tabletops beyond the
motivating context that they provide. Piper and Hollan distinguished their work from others by
firstly focusing on the effect of using digital tabletops versus paper on study practices, like partic-
ipation and cooperation, rather than focusing on the application, which was intentionally made as
simple and as basic as possible; and secondly by studying the interaction over multiple-sessions
to observe behavioural patters over time and ensure that the observed behaviours are not results
of first time use. With regard to the second point, they brought into focus the effect of novelty of
the medium and observed its effect in causing much off-task behaviour; and pointed out a short-
coming of other research that made conclusions based on first-time encounter with such a new
medium. As mentioned, the application used was very basic and mirrored the tools that students
need while reading from paper. Each student had her own draw and erase buttons in addition to
some commands in a shared menu. Their findings showed that students with paper material made
more detailed notes and worked serially, while students with the tabletop display repeated activ-
ities more, worked in parallel, and performed better on exams. They also stated the potential of
tabletop technology in logging students interaction during the session for later use by the teacher
or the students, and the potential of providing scaffolding by the application. Finally, and although
their task involved two users only, they indicated that that the size of the DiamondTouch table used
(81cm diagonal) proved to be rather small.
Both Do-Lenh et al. (2009) and Piper and Hollan (2009) used basic applications for the table-
top versions that, other than allowing parallel interaction, were not specifically designed to utilize
the affordances of the technology, and did not arise from an iterative design process that might
have addressed any observed shortcomings. Conclusions based on such limited implementations
cannot be generalized as comments on the potential of tabletop technology to support collabo-
rative learning, but can provide useful insights on some aspects of such support (those that are
particular to the implementation).
The OurSpace application (Fleck et al., 2009; Rick et al., 2009a; Harris et al., 2009) was
implemented and used to investigate different aspects of collaborative interaction and collaborative
learning for children around tabletops. While the focus in Rick et al. (2009a) and Harris et al.
(2009) was on issues of contrasting single touch and multi touch (see Section 2.2.3.7) and the
use of space, the focus in Fleck et al. (2009) was on examining the coupling of verbal interaction
and physical action in collaborative learning tasks around tabletops. The OurSpace application
was implemented on a DiamondTouch table (81cm diagonal), and was designed to allow groups

42
of three children (aged 7-10) to plan their classroom layout. The hardware and the software
design forced the children to work from fixed positions around three sides of the table. The
investigation uncovered that physical and verbal aspects work in parallel during collaboration
and highlighted the importance of gesturing while talking for the learning process. They also
found evidence that such physical disagreements as blocking and undoing each others work, which
might appear as negative behaviour, could actually lead to learning when interpreted as parallels
of verbal negotiation. In light of these findings, Fleck et al. stated that quantitative comparative
studies (e.g Do-Lenh et al., 2009; Piper and Hollan, 2009; Rick et al., 2009b) may miss some
aspects of the interaction that are significant to the learning process. They also argued against
designs that enforce territoriality and restrict access to certain resources as these will reduce the
positive learning outcomes that may result from physical interference. Finally, with regards to
single versus multi-touch input, they stated that even when children were allowed unrestricted
parallel interaction, collaborators could still manage periods of effective collaboration. These
results emphasized the important context that the tabletop setting provides to collaborative learning
when it is designed to provide unrestricted physical, visual, and auditory setting.
Among the issues discussed by Piper and Hollan (2009) is that of embodied cognition, that
is the engagement of our bodies and how this might help, or constrain, how we reason about ab-
stract concepts. They categorized the act of tracing an answer graph with a finger as embodied
cognition, and their analysis showed that such a process could have attributed to the better results
gained from interacting with tabletops due to the richer understanding and internalization of ab-
stract concepts resulting from such embodied cognition. Fleck et al. (2009) also uncovered the
importance of combining verbal with physical action around the table for collaborative learning
applications and argued against enforcing restrictions in the form of fixed territorial design or
limiting access to resources. Before that, Tang et al. (2006) highlighted the importance of using
gestures while collaborating around traditional tables and the important role gestures play in col-
laboration by adding to the content of the discussion. Despite such findings, all the settings in the
reviewed research that targeted learning and problem solving assumed participants working from
fixed positions accompanied by different levels of enforced territoriality and restricted access to
resources, a limitation imposed either by the hardware (such as the case with DiamondTouch ta-
bles), or by the case study design itself. Furthermore, while face-to-face style of collaboration is
a distinguishing feature of tabletop interaction over shoulder-to-shoulder style of traditional SDG
systems, the settings used in Rick and Rogers (2008), Piper and Hollan (2009), and Do-Lenh et al.
(2009) required users to sit side by side to overcome problems of orientation or limited table size.
This means that although findings from such studies can be generalized to other tabletop settings,
questions remain as to the impact of the un-utilized benefits of using a shared space, freedom of
movement around the table, and face-to-face interaction, particularly in relation to awareness of
the actions of others.

43
A number of other researchers targeted educational aspects of tabletops for kindergarten chil-
dren or early primary levels where the focus is on playing or learning basic skills, such as reading
(Khandelwal and Mazalek, 2007; Sluis et al., 2004; Cappelletti et al., 2004). The problem space
for children of this age differs from that targeting older students (Sluis et al., 2004).
2.5 Tabletop hardware
The two most common tabletop technologies that are used in many tabletop systems are Diamond-
Touch tables (Dietz and Leigh, 2001), and the FTIR technology (Han, 2005). DiamondTouch ta-
bles technology uses location dependant electric fields which are capacitively coupled through the
users and chairs (or floor mats) to receivers that can identify the location of the touch and the user.
This technology supports multiple touch points from a single user and allows for multi-users to
interact simultaneously with the system with the advantage of being able to distinguish between
users. The table requires front projection, and can tolerate physical objects being put on its surface.
DiamondTouch tables come mainly in two display sizes 81cm and 107cm. Due to their ability to
distinguish between users, and the limited number of commercially available tabletop alternatives,
many researchers used DiamondTouch tables in their exploratory studies (e.g. Piper et al., 2006;
Rick and Rogers, 2008; Piper and Hollan, 2009; Wigdor et al., 2007). Nevertheless the technology
does have some limitations specially when used with young children who tend to put both of their
hands on the table during the interaction, and who frequently place their feet incorrectly on the
mat (Mansor et al., 2008). To be able to distinguish between users, DiamondTouch tables require
that users complete a circuit by sitting on their chairs or standing on a special mat, but this also
means that users cannot move freely around the table or change their positions; that is why all
systems that used this technology assumed users with fixed positions and therefore demonstrated
a strong notion of territoriality.
The other multi-touch technique is known as FTIR (short for frustrated total internal reflec-
tion) (Han, 2005). In the original system implemented by Han (2005), a sheet of acrylic (6.4mm
thick) is edge-lit by infrared light. The phenomena of total internal reflection keeps the light
trapped within the sheet, except at points where the fingers touch the table causing the light to
scatter out through the sheet in the opposite direction. The scattered light is detected by an infrared
video camera and, with the use of simple image processing, the points of touch are extracted. Since
its introduction as a technology for multi-touch tabletops, FTIR is increasingly being adopted by
researchers (e.g. Morgan and Butler, 2009; Weiss et al., 2009; Kaltenbrunner and Bencina, 2007)
as it became easy and inexpensive to build multi-touch tabletops and in different form factors.
FTIR tabletops use rear-projection and can be built for any size. The main problem with tabletops
based on this technology is that it is not possible to distinguish between the users touching the
table.

44
For the purpose of this research, I chose a pen-based tabletop technology as it combines the
features of distinguishing between users, and allowing for free unrestricted movement around the
table. The table used was a pre-production prototype of the multi-pen horizontal Promethean
Activboard. Activboard uses passive electromagnetic digitizing technology located underneath a
solid front projection surface which allows people to safely lean on it, giving it the affordances
of a real physical table. The digitizing technology is a specially designed electromagnetic grid
which allows high level of accuracy by cross-checking three separate sets of co-ordinates. This
electromagnetic grid reacts to a battery-free, wire-free mouse pen. The pen looks and feels like a
real pen and, through the use of time multiplexing, the system can read and distinguish input from
three pens simultaneously.
2.6 Summary
The recent increase in the number of studies investigating applications and interaction techniques
for digital tabletops reflects the importance of this technology and its potential to support face-to-
face collaboration. A look at previous research also reveals the wide scope of issues that relate to
this technology. These range from fine details of interaction techniques with the tabletop surface,
to general aspects of human behaviour related to group collaboration around the technology. Such
a wide scope of issues requires extensive investigation, and the relative novelty of the technology
means that our understanding of the technology is still in its infancy, particularly in relation to full
scale applications deployed “in the wild”.
Table 2.1 summarizes the issues reviewed in this chapter an highlights the main conclusions.
Previous research has been more concerned with applications that require a division of the table
space than those requiring a shared space. Consequently, more research is focused on territoriality
and working around the table from fixed positions, than on working on shared spaces with no con-
straints on users’ movements. Other researchers have decided to avoid the problem of orientation
that arises from working around a horizontal surface by designing applications that require users
to work next to each other on one side of the table. When this setting is combined with a relatively
small table (e.g. Piper and Hollan (2009) and Rick et al. (2009b) where the table size was 81cm
in diagonal), it will force users to work in close proximity to each other in a shoulder-to-shoulder
desktop-like setting rather than the face-to-face setting uniquely afforded by the tabletop. Based
on observations of unstructured collaborative use of tabletops, Ryall et al. (2006) observed that
a table size of 107cm diagonal is a good minimum size, and that a size of 80cm diagonal lead
to conflicts in the process. Yet, the tables used in the studies of Rick et al. (2009b), Piper and
Hollan (2009), and Fleck et al. (2009) had an 81cm diagonal dimension. It should be noted that
although this observation was not based on rigorous investigation, and that as they reported, be-
haviour between adults and children differs, it does indicate possible disadvantages of using small
tables for collaborative tasks. It would be useful to investigate the effects of users working next
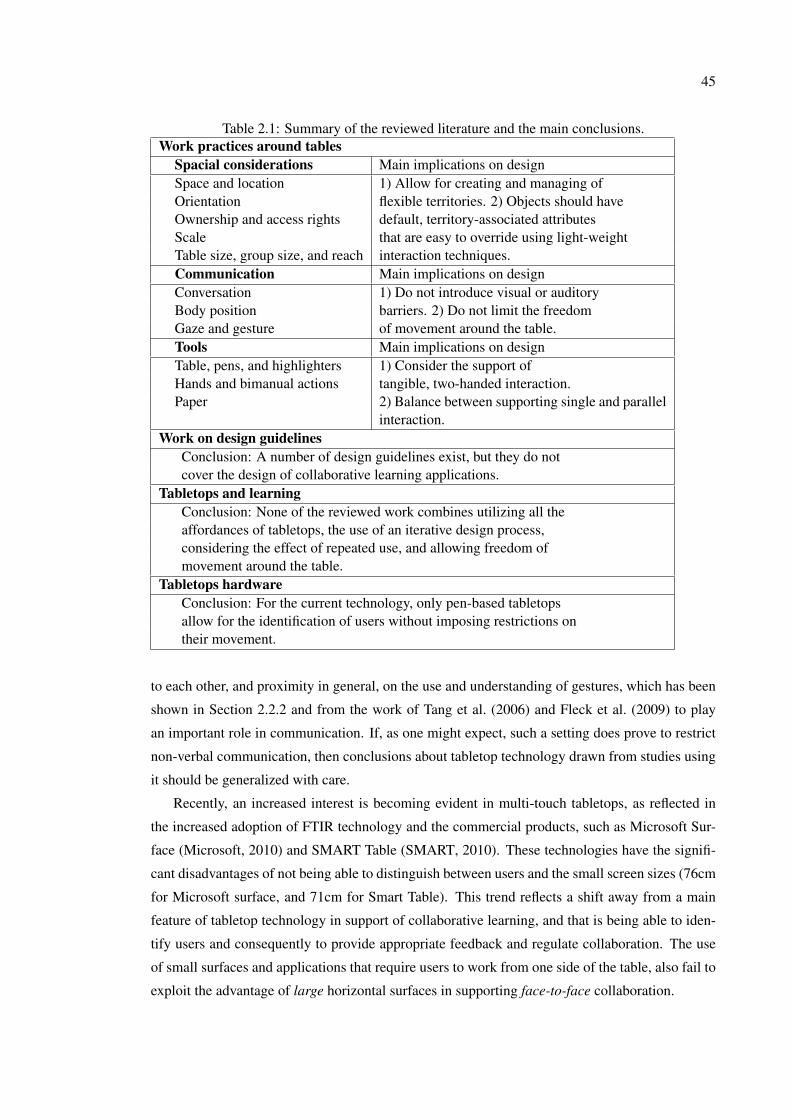
45
Table 2.1: Summary of the reviewed literature and the main conclusions.Work practices around tables
Spacial considerations Main implications on designSpace and location 1) Allow for creating and managing ofOrientation flexible territories. 2) Objects should haveOwnership and access rights default, territory-associated attributesScale that are easy to override using light-weightTable size, group size, and reach interaction techniques.Communication Main implications on designConversation 1) Do not introduce visual or auditoryBody position barriers. 2) Do not limit the freedomGaze and gesture of movement around the table.Tools Main implications on designTable, pens, and highlighters 1) Consider the support ofHands and bimanual actions tangible, two-handed interaction.Paper 2) Balance between supporting single and parallel
interaction.Work on design guidelines
Conclusion: A number of design guidelines exist, but they do notcover the design of collaborative learning applications.
Tabletops and learningConclusion: None of the reviewed work combines utilizing all theaffordances of tabletops, the use of an iterative design process,considering the effect of repeated use, and allowing freedom ofmovement around the table.
Tabletops hardwareConclusion: For the current technology, only pen-based tabletopsallow for the identification of users without imposing restrictions ontheir movement.
to each other, and proximity in general, on the use and understanding of gestures, which has been
shown in Section 2.2.2 and from the work of Tang et al. (2006) and Fleck et al. (2009) to play
an important role in communication. If, as one might expect, such a setting does prove to restrict
non-verbal communication, then conclusions about tabletop technology drawn from studies using
it should be generalized with care.
Recently, an increased interest is becoming evident in multi-touch tabletops, as reflected in
the increased adoption of FTIR technology and the commercial products, such as Microsoft Sur-
face (Microsoft, 2010) and SMART Table (SMART, 2010). These technologies have the signifi-
cant disadvantages of not being able to distinguish between users and the small screen sizes (76cm
for Microsoft surface, and 71cm for Smart Table). This trend reflects a shift away from a main
feature of tabletop technology in support of collaborative learning, and that is being able to iden-
tify users and consequently to provide appropriate feedback and regulate collaboration. The use
of small surfaces and applications that require users to work from one side of the table, also fail to
exploit the advantage of large horizontal surfaces in supporting face-to-face collaboration.

46
Consequently, throughout this research, my approach in addressing some of the identified gaps
in tabletop research has been on emphasizing the importance of utilizing the unique characteristics
of tabletops through designs that are well grounded into theories of interaction design and collab-
orative learning. Attribute Gates (Chapter 3) present an alternative to using traditional contextual
menus by using crossing-based interaction (a technique specially suited to direct-touch surfaces),
to integrate changing object settings with movement action. The design of Attribute Gates also
takes into consideration its use in a collaborative environment and thus is designed to promote
awareness of action. TANGISOFT (Chapter 4) focuses on the issue of text-entry on tabletops and
introduces a tool that is a hybrid between a soft and a tangible keyboard with the main goal of
utilizing two-handed interaction and allowing for free movement around the table while using the
tool. TANGISOFT is particularly useful for problems with shared space or when the application
provides one text-entry tool to be exchanged between users where ease of moving and handling
the tool (shareability) is a main requirement. Digital Mysteries (Chapters 5 and 6) is a full applica-
tion designed to investigate the support of tabletops for collaborative learning. Digital Mysteries
can be distinguished from other applications targeting learning on tabletops in the way it aims to
utilize all the affordances of the technology. Digital Mysteries falls into the shared-space cate-
gory of application. It was implemented and validated using a large table (with effective display
size of 165cm× 120cm) where students are allowed to move freely around the table without any
restrictions imposed by the technology and the software implementation on visual and auditory
communication. The application was designed to be orientation independent and used a modified
version of the Polar Gates technique (described in Chapter 3) as an interaction technique. The use
of pen-based interaction allowed for the identification of different students at the table (by the pen
they were using) and thus the design encouraged effective collaboration by providing participation
level feedback and balanced between allowing parallel interaction and single point interaction. In
the design and evaluation of Digital Mysteries, I sought to overcome the shortcomings of previous
research targeting the support of the technology for collaborative learning. This was done by care-
fully selecting the type of problem for the investigation, relying on theories of interaction design
and learning in the design, improving the design through an iterative design process, and making
conclusions based on a through qualitative analysis for groups of different ability levels and with
repeated use of the application to overcome the novelty effect of the technology.

47
Chapter 3
Attribute Gates
3.1 Introduction
When people work around a digital tabletop, the tabletop’s surface is typically divided into per-
sonal, public, and storage territories (Scott, 2003; Scott et al., 2004). The different types of use
and privacy requirements of these territories impose different values for the attributes of scale,
orientation, and access rights of objects placed inside them. For example, an object placed in a
personal territory is usually scaled up to an appropriate size for the task at hand, set to have full
access rights, and oriented towards the owner of that personal territory. When the object is moved
to the public space to be discussed with others, it might be made even larger, set to read-only,
and oriented away from the owner. Likewise, when an object is moved to a storage area, it is
usually scaled down, and set to have access rights and orientation depending on whether the stor-
age area is personal or public. The large number of attribute value combinations needed reflects
the varied nature of the objects used and work performed at tables. It has been suggested that
the values of these attributes could be set automatically depending on defaults values set to each
territory (Vernier et al., 2002; Kruger et al., 2003; Scott, 2003; Ringel et al., 2004). For example,
objects are oriented automatically in the direction of the centre of the table, and are scaled down
when placed in the public area. It must be noted that this division of the tabletop space mostly
applies to settings that require people to work around a table from fixed position as opposed to
settings that allow people to work and move freely around the table.
A number of techniques have been proposed for setting each of these attributes. For orien-
tation, these include automatic rotation (following the default orientation of the corresponding
territory), manual rotation, or the use of rotate-and-translate techniques (Kruger et al., 2003,
2005; Scott, 2003; Vernier et al., 2002). Proposals for scale also include two automatic modes
that scale up or down with respect to the centre of the workspace (depending on whether users
are sharing objects or working independently), a fish-eye mode which scales objects up as they
get closer to the middle of the table, and a black hole mode which reduces the size of objects the
closer they get to the middle of the table (Vernier et al., 2002). Similarly, when objects are moved

48
between territories, their access rights can change between fully accessible or read-only, or a copy
of the original object can be created (Morris, 2006; Ringel et al., 2004; Shen et al., 2003).
Input techniques for digital tabletops are either pen- or finger-based. Neither of these input
methods are well suited to traditional point-and-click techniques developed originally for mouse
input. Point-and-click interaction has a tendency to segment any operation into a series of discrete
actions. This contrasts with pen input, which encourages a fluid, stroke-based style of interac-
tion (Apitz and Guimbretiere, 2004). Crossing-based interfaces have been proposed as an alterna-
tive to point-and-click techniques for pen-based input (Accot and Zhai, 2002). For example, the
CrossY application for tablet PCs (Apitz and Guimbretiere, 2004), and the Interactive Mural for
interactive whiteboards (Winograd and Guimbretiere, 1999). The FlowMenu (Guimbretiere and
Winograd, 2000) developed initially for the Interactive Mural has also been used in digital table-
top systems where it was found to be an improvement on traditional point-and-click based context
menus (Scott, 2003). Other characteristics of tabletops, that have implications on their interface
components, include their large-horizontal surface and the multi-user interaction. Attribute Gates
are designed to reflect all these special characteristics.
Attribute Gates1 (Figure 3.1) are user interface elements designed to be used for pen- or finger-
based interaction on large horizontal interactive surfaces to set a sequence of scale, orientation,
and access right attributes in one fluid operation.
Figure 3.1: Grid Gates (left): the dashed curve shows the user crossing two gates (read-only, androtate and translate) and heading for the third (reduce size). Polar Gates (right): the dashed curveshows the user crossing to a gate in the inner ring (read/write) and rotating the ring towards a gatein the second ring (manual rotate) and moving outward to the third (reduce size)
The motivation of Attribute Gates came from the need to change a number of different settings
when moving objects between territories on the table (e.g. Kruger et al., 2003; Vernier et al., 2002;1A video about Attribute Gates can be found at http://portal.acm.org/citation.cfm?id=1449726&dl=&coll=portal

49
Scott, 2003; Ringel et al., 2004). The design of Attribute Gates was inspired both by the notion of
task levels in activity theory, and by crossing-based interfaces. The collaborative nature of digital
tabletops requires components to promote the mutual awareness of users. This is a particular
concern for multi-user environments, yet is often ignored in the adaptation of desktop interface
components to tabletops. Promoting awareness is another requirement that affected the design of
both the interaction and the spatial aspects of Attribute Gates. Moreover, the spatial properties of
Attribute Gates have been optimised through the application of targeting and steering laws derived
from Fitts’ law (Fitts, 1954) and consideration of the large horizontal surface of a digital tabletop
on which they are intended to be used. I have designed two types of Attribute Gates, grid and
polar, and have conducted a number of user studies to evaluate users’ performance, in terms of
speed, accuracy and mutual awareness, compared to traditional contextual menus.
3.2 Motivation
As discussed in Chapter 2, Kruger et al. (2004) and Scott (2003) suggested a number of design
guidelines for the rotation of objects on digital tabletops. These emphasized the importance of sup-
porting both lightweight free rotation techniques, and automatic rotation performed by the system.
Morris’s (2006) guidelines for designing digital tabletop systems included a requirement for pro-
viding a means of dynamically changing objects’ access rights on the tabletop, and recommended
making these access rights visible to increase awareness, thereby enabling users to regulate partic-
ipation levels and prevent confusion. Kruger et al. (2004) noted that even for systems that support
automatic orientation, there are many situations in which users need a different orientation to the
system’s default and Scott (2003) generalized this recommendation to incorporate scaling. It is
possible to hypothesize that a similar generalization can be made about the access rights settings.
Despite the fact that it has been made clear by a number of researchers that a tabletop inter-
face must provide default settings for the attributes of orientation, scale, and access rights, and
allow for lightweight techniques for manually controlling them and override the system’s defaults,
only a few actual methods by which this can be achieved have been proposed. Scott (2003) pre-
sented an approach to rotation whereupon moving an object, the system automatically shows a
preview of the proposed action. The user could then invoke a context menu (Scott actually used
a FlowMenu (Guimbretiere and Winograd, 2000)) offering options to accept-the-default, ignore-
the-default, free-rotate, or rotate left, top, bottom, or right. This technique only addresses the
rotation attribute and lacks the fluid and lightweight characteristics that are desirable. Indeed, the
lack of practical alternatives means that tabletop application designers, who are not interested in
developing their own interaction techniques, have little option but to adopt traditional desktop-
based user interface elements (most likely contextual menus).
A user moving an object from her personal space to the public space, for example, might
reasonably wish to set its attributes to read-only, manual rotate, and enlarge. To use a traditional

50
contextual menu to set the values of these attributes would typically incorporate three distinct com-
mands: (access-rights, scale, and rotation) with sub-commands for the different settings of each
attribute (assuming a discrete set of values for each). So a user would need to do the following:
1. Right-click on the object; select access-rights from the contextual menu; then select the
read-only subcommand (Figure 3.2(left)).
2. Right-click a second time on the object, select rotation from the contextual menu, then select
the manual rotate subcommand (Figure 3.2(middle)).
3. Right-click a third time on the object; select scaling form the contextual menu; then select
the enlarge subcommand (Figure 3.2(right)).
4. Start moving the object to the public space.
Thus the user needs to select a total of six commands and subcommands to change the at-
tributes. This is at best off-putting, and at worst encourages the user to settle for inappropriate
defaults. The provision of a means for setting the orientation, size, and access right attributes in
one fluid operation, integrated with the act of moving objects between tabletop territories, is the
principal design goal of Attribute Gates.
Figure 3.2: Three menu invocations are required for setting the read-only, manual-rotate, andenlarge attribute values using traditional contextual menus with each menu invocation involvingselecting a submenu, then the desired command. The selected command disappears as soon as itis selected leaving a very short opportunity for others to make note of the selection.
The access rights attribute, unlike the orientation and scale attributes, is usually only visible
when a user browses an object’s properties. Thus, Morris (2006) recommended that access-rights
be made visible to reduce confusion. While this is a possible option for system designers, the
design of Attribute Gates, however, seeks to promote awareness about the action of setting this
attribute, as well as the other attributes.
Finally, in creating a user interface component specifically for digital tabletops, I have sought
to exploit the unique characteristics of large horizontal surfaces that use pen or finger input. With
the large footprint of the digital tabletop, and the coincidence of the action and perception spaces,
targeting objects and steering along deliberate paths is considerably easier than on a tablet PC (Ac-
cot and Zhai, 2001), or mouse-based desktop or laptop computers.

51
3.3 The conceptual basis of Attribute Gates
There is a substantial theoretical and empirical interaction design literature that can be used to both
explain the role and utility of Attribute Gates, and configure their spatial layout and dimensions.
Attribute Gates were designed to both optimise the targeting and steering effort in combination
with the operationalization of actions proposed by activity theory
3.3.1 Activity theory and chunking
Activity theory (Kuutti, 1995; Bødker, 1989; Kaptelinin, 1995; Fjeld et al., 2002; Halverson, 2002;
Nardi, 1995) is a useful framework for analysing physical and co-located collaborative interaction
settings. The definitions of activity, action, and operation, the task levels they represent, and
the transition between them, forms the basis of the following analysis (Figure 3.3). Activity is
defined as the minimal meaningful context that is directed to an object in order to transform it
into an outcome. It is the basic unit of analysis, driven by a motive, and is carried out by a
series of actions. An action is a conscious act with a direct defined goal that usually consists
of a number of operations. An operation is the subconscious act that might once have been an
action done consciously, but with practice and repetition became a routine act (was turned into
an operation). Thus, when a person with little experience of using a QWERTY keyboard wants
to type text, locating each letter is an action in itself. However, when this user gains experience,
typing becomes a series of operations performed subconsciously.
Individuals new to a certain activity need to think about every step of the process. Such a
process is undertaken through a series of well thought out actions, with clear specific intentions
behind each. In such cases, no operations are involved and focus shifts from the high-level task
to trivial low-level tasks. After practice and repetition, appropriate actions are performed subcon-
sciously, and this transformation to operations (in users’ heads) allows them to focus on higher
level tasks. As more actions are turned into operations, it becomes easier to stop worrying about
the details and concentrate on the desired outcome as the individual will subconsciously trigger
the appropriate sequence of operations depending on the conditions at hand. Kaptelinin (1995)
observed that by looking at whether a subject’s behaviour, in a specific situation, is oriented to-
ward a motive, a goal, or is in response to a specific condition, one can better understand and
predict the subject’s behaviour. Moreover, activity theory brings into consideration such issues as
whether the user’s focus is on the tool or the goal (the tools must keep its user’s focus on the goal
and not draw attention to itself). So if a user wants to move an object between two territories and
change its attributes, the tool to change these attributes should not capture the user’s attention (as
is the case with having to select six command/subcommands in contextual menus).
In simple terms, activity theory tells us that good user interface components should move
actions into operations, or at least allow for this move as experience increases. Buxton’s (1995)
work on chunking is strikingly similar to activity theory. In discussing the differences between

52
Figure 3.3: Activity levels: a good user interface element helps shift more actions into operations,which helps the user to focus on the higher level activity.
the levels of detail that novices and experts attend to, he describes how for novices, finding a
character on the keyboard or remembering the name of a command, requires valuable cognitive
resources (which can be performed by experts automatically). Where activity theory describes the
progression from novice to expert in terms of carrying out more actions as operations, Buxton’s
notion of chunking refers to the amount of a problem that can be performed automatically (i.e. as
an operation) and thus he proposes gluing a number of subtasks into one task (chunk). According
to Buxton, the three subtasks required to select a command from a contextual menu (right-click
to show the contextual menu, moving the pointer to the required command, then clicking on the
command) can be glued together if a simple modification is made where the user presses and holds
the right button, moves to the desired command, then releases the mouse button. In this case the
muscular tension of pressing the mouse button is the glue. Such gluing brings subtasks into one
chunk that corresponds more closely to the user’s model of the task.
3.3.2 Crossing-based interfaces
Accot and Zhai (2002) proposed crossing as an alternative to point-and-click interfaces, espe-
cially for pen-based interaction. Crossing allows the initiation of a command by simply crossing
a specific target (i.e. an object at a spatial location) without the need to point or click on interface
components. Accot and Zhai found that target crossing could be more efficient, or at least as effi-
cient, as pointing. They provided a number of guidelines for designing crossing-based interfaces
and recommended that whenever possible, the target to be crossed should be orthogonal to the
direction of movement. Selecting a command using the crossing technique, unlike point and click,

53
is one indivisible task. By appropriately positioning commands, it is possible to issue (cross)
multiple commands in one operation, thus satisfying the design recommendations suggested by
activity theory (e.g. Kuutti (1995))
Although crossing-based interfaces were originally proposed for pen-input, they are similarly
appropriate for finger-based interaction. This is particularly true for finger-based interaction with
large surfaces, where the size of the interactive surface can comfortably tolerate the size of finger-
tips (as compared to pen-input).
3.3.3 Targeting and steering
Attribute Gates use the crossing principle. Setting attributes involves steering between elements
and crossing others. The layout of these elements may be optimised (to increase ease of use and
efficiency) by the application of targeting and steering laws derived from Fitts’ law (Fitts, 1954).
A number of variations of Fitts’ original law have been introduced to address different aspects
of user interface design. Accot and Zhai (1997) extended Fitts’ law through the introduction of
an equation to calculate the time required for steering inside a path and validated the accuracy of
the equation experimentally. Assuming a path of fixed width W and of length D, the time (T )
required to move inside that path is
T = a+ b
(D
W
)(3.1)
In equation (3.1), a and b are empirically determined constants that are characteristic of a user,
and the ratio D/W is the index of difficulty. Steering time has a linear relation with the ratio
D/W , unlike Fitts’ original formulation, in which the targeting time has a logarithmic relation to
D/W . Accot and Zhai have demonstrated how this law can be used to estimate the time required
to select and navigate through commands in a multi-level menu structure. Although an earlier
investigation of steering tasks had been conducted by Drury (1971), it was for the study of vehicle
guidance tasks in linear and circular paths, and consequently had to include such extra parameters
as the risk factor. The function proposed by Accot and Zhai is simpler and more relevant to the
task at hand.
3.4 Attribute Gates: interaction
One or more of the scale, orientation, and access rights attributes are likely to be required to be
changed when moving an object between territories. Attribute Gates make the process of setting a
sequence of such attributes a fluid operation integrated with the movement, thus requiring no shift
of focus from the main activity. Gates are laid out so as to group and position mutually exclusive
attributes together; spatially sequence different groups; and allow users to set an attribute simply

54
by crossing it while a document or an object is being dragged towards its destination. The design
of the gates makes use of two key characteristics of digital tabletops:
• The coincidence of action and perception space which provides the user with a sense of
control over the operation.
• The large surface area of the table which allows the user to easily move across the desired
attributes without the need for careful manoeuvring.
Furthermore, integrating attribute value assignment with movement (which is the key element)
means that users are not forced to change their focus or type of action, or perform additional
actions (such as right clicks). Two types of Attribute Gates are proposed, each of which has
different spatial characteristics: Grid Gates and Polar Gates.
3.4.1 Grid Gates
In Grid Gates, each group of mutually exclusive attributes is placed in a row. Each attribute is
represented by a thin rectangular area, and the rectangles are separated by empty space. The
overall layout is a grid of rectangles (Figure 3.4).
For example, to move an object from the personal space to the public space, and set its at-
tributes to read-only, manual rotate, and enlarge, the user needs to press and hold on the object
for half-a-second (this duration was chosen on the basis of informal experimentation) to display
the Grid Gates (Figure 3.4(1)). Next the user needs to pass the dragging point through (over)
the required gates. In this case these are the read-only (Figure 3.4(2)), manual rotate (Figure
3.4(3)), and finally enlarge gates (Figure 3.4(4)). When the object is positioned as required, and
as soon as the user releases pen pressure, the gates disappear. If the user wants to set only one
or two attributes, she can pass through the empty space of the other rows, or row, to maintain the
default values (Figure 3.5). Also, if the user wants to change one of the attributes after setting
it, and before the gates disappear, she can re-cross the new required setting (passing through the
empty spaces for the others attributes). A user can still move an object without displaying the
gates if none of its attributes are to be changed by dragging the object normally without the initial
half-a-second pause
3.4.2 Polar Gates
In Polar Gates, groups of mutually exclusive attributes are arranged in concentric rings (Figure
3.6). An important behaviour of the polar gate is that when a ring is rotated, it rotates the inner
rings only, leaving the outer rings unchanged. By not resetting the orientation of the rings between
activations, the polar gate effectively “remembers” its last setting.
Reconsidering our example for Polar Gates, to move an object from personal space to public
space, and set its attributes to read-only, manual rotate, and enlarge, the user starts by pressing and

55
Figure 3.4: The steps for setting the read-only, manual-rotate, and enlarge attribute values usingGrid Gates. The gates appear when the user presses and holds on the object for half-a-secondbefore starting to move it, and disappears when the object is released.
holding on the object for half-a-second. This displays the polar gate centred around the pen’s tip.
The user then steers towards the read-only gate (Figure 3.6(1)), rotates the ring towards the manual
rotate gate (Figure 3.6(2)), moves over that gate (Figure 3.6(3)) then rotates the ring towards the
enlarge gate (which will rotate the inner ring also as in Figure 3.6(4)). When passing over the
enlarge gate (Figure 3.6(5)) the user can rotate the outer ring, and consequently the entire pattern,
in the direction of the public space and then continue moving the object to its final destination
(Figure 3.6(6)). The gate disappears when the user releases the pen pressure (when the object is
in its desired location).
When another object is to be moved, and the polar gate is displayed again, it shows the most
recently used setting (by that user), with the segments aligned in the direction of the last targeted
location. If the user wants to move another object to the public space using the most recent setting,
she simply needs to move in a straight line towards the public space, and thus passing through the
same set of attributes as the previous time (Figure 3.7). An empty segment is added to each ring
allowing the user to keep whatever default value has been assigned to the object (functionally, this

56
Figure 3.5: The steps for setting only the read-only attribute. The user passes through the spacebetween the other attribute values to keep the original settings.
corresponds to moving through the empty space within Grid Gates). As with the Grid Gates, a
user can move an object without displaying the gates by dragging it to its new position without the
initial half a second pause.
3.4.3 Promoting awareness
The requirement to promote awareness, while attributes are set, is met by the combined effects of
keeping the gates visible throughout the movement process, clearly marking the gates that are set,
and the gates’ relatively large footprint (Figures 3.4 and 3.6). Moreover, to increase awareness
of the access rights attribute, it is included as the first row in Grid Gates and the first ring in
Polar Gates, the result of which is that the selected setting for the access rights attribute remains
visible for a longer period than scale and rotation. This distinguishes Attribute Gates from other
interaction techniques, for example a contextual menu, in which the reference to the selected
setting disappears immediately after the selection leaving very little opportunity for collaborators
to make note of the assigned attribute (Figure 3.2).

57
Figure 3.6: The steps for setting the read-only, manual-rotate, and enlarge attribute values usingPolar Gates.
3.4.4 Putting activity theory into practice
Two main concepts of activity theory incited and guided the design of Attribute Gates (Kaptelinin,
1995; Kuutti, 1995):

58
Figure 3.7: Making use of the memory feature of Polar Gates. Setting the read-only, manualrotate, and enlarge attributes by moving through a straight line.
1. A good user interface design should keep the focus of the user on the main goal. According
to the notion of AT, a goal is achieved by carrying out a certain action. Any other sub-
actions that are not central to the goal, but that need to be carried out to achieve this goal as
reactions to the current condition of the system, should be integrated with the main action
whenever possible in a manner that does not shift the user’s focus away from the main goal.
2. When a certain sequence of actions is regularly repeated, it is usually internalized by the
user. A good user interface design should make use of this fact and, using the notion of AT,
shifts such sequence of actions into operations.
With regard to the first point, when the goal of the user is to move an object between two
territories, setting all, or some, of the attributes of scale, orientation, and access rights is just a
sub-action that should not capture the user’s attention. Therefore, as the main action in this case is
movement, the design of Attribute Gates integrated the setting of these attributes inside this action
and the three attributes can be set while the object is being moved toward its final destination
through utilizing the concept of the crossing-based interfaces.
The second point brings into focus the concept of internalizing actions (or changing actions
into operations) with repeated use. The two types of Attribute Gates proposed make use of this
concept in two different ways: Grid Gates has a fixed layout which, with repeated use, is inter-
nalized by the user. This means that the user can set different attribute combinations using an

59
internalized, gesture-like movement that only require minimal visual attention. On the other hand,
Polar Gates do not have a fixed layout, but instead has a memory feature that makes it remember
the last attribute setting combination. This is achieved by aligning the selected settings in one
line, and thus can later be crossed in one straight movement towards the final destination (Figure
3.7). With Polar Gates, the internalization of the repeated action is carried out by the interaction
technique itself and not the user, and repeated here refers to consecutively repeated action, and
not long term repeated use. Providing the two options of Grid Gates and Polar Gates, with one
focusing on long term repeated use, and the other on consecutive repeated action, gives designers
the freedom to choose between two different alternatives depending on the requirements of the
application at hand.
3.5 Attribute Gates: spatial configuration
Selecting a sequence of attributes using Grid Gates involves a number of targeting and steering
operations. Figure 3.8 shows the steps required to select a sequence of gates. The worst-case
scenario involves movement between attributes located at opposite extremes of the grid. Using the
laws of targeting and steering derived from Fitts’ law (Accot and Zhai, 1997, 2001; Fitts, 1954),
it is possible to optimise the layout of Grid Gates so as to reduce effort and increase efficiency.
Figure 3.8: A worst-case scenario for setting a sequence of attributes using a grid gate.

60
The layout parameters for the grid gate are the width (w) which is the target for Fitts’ law, the
row height (h) which is the path width for the steering law, and the maximum horizontal distance
between the first and the last gate (d in Figure 3.8). The width of the empty space between two
adjacent gates is set equal to the width of the gate (w) because when no gate is to be set in a specific
row, this empty space will itself be the target. This makes d equal to 4w (one full gate, two empty
spaces, and two half gates). It is possible to make use of similar calculations made by Dixon et al.
(2008) for optimising crossing based dialogs where one of their cases closely resembles moving
through path 2 and crossing target 3 (Figure 3.8). When the row height is small, the dominating
factor becomes the steering index of difficulty for which
IDsteering =pathlength
pathwidth=
4wh
(3.2)
On the other hand, increasing the distance between rows eventually makes the targeting law
the dominant factor, with an index of difficulty
IDtargetting = log2
(A
W+ 1)
= log2
(√h2 + (4w)2
w+ 1
)
= log2
√( hw
)2
+ 16 + 1
(3.3)
Dixon et al. (2008) found that a path width of 40 pixels (with 0.24mm pixel pitch) is the width
at which dominance switches between steering and targeting. This was for a target width of 18
pixels, which in our case corresponds to a w/h ratio of about 0.5. Figure 3.9 shows a plot of
the indices of difficulty for steering and targeting based on equations (3.2) and (3.3) for different
w/h ratios. From the graph it is clear that an increasing (w/h) ratio decreases the targeting
index of difficulty, and when the ratio exceeds approximately 0.25 further increases do not have
a significant effect on the targeting index of difficulty. On the other hand, the steering index of
difficulty increases linearly with this ratio. Based on Dixon et al. (2008), we find that when the
w/h ratio is about 0.5 the steering law starts to dominate, and steering starts to slow down the
task. From this, we can conclude that a w/h ratio of between 0.25 and 0.5, in other words a row
height twice to four times the gate width, should give the best performance.
We can use the same reasoning to select the layout parameters for Polar Gates. Selecting
attributes using Polar Gates also involves a sequence of targeting and steering operations (Figure
3.10). The dominating factor for both targeting and steering is the width of the ring (w). Increasing
w does not affect targeting as it increases the distance and the target width at the same time.
Therefore the effect of w on steering, and not targeting, needs to be considered. Increasing w

61
Figure 3.9: A graph showing the indexes of difficulty for steering and targeting.
increases the width for steering but at the same time increases the rings’ circumferences and hence
increases the distance. The steering law can be used to understand how w affects the steering
index of difficulty.
Figure 3.10: The path for setting a sequence of attributes using Polar Gates.
The distance for steering a full ring of index i from its centre is

62
d = 2π(r0 + (i− 1)w +
w
2
)(3.4)
Where r0 is the inner radius for the first ring. The index of difficulty is given by
d
w= 2π
(r0 + (i− 1)w + w
2
)w
= 2π(r0w
+ i− 0.5)
(3.5)
This shows that although increasing the width increases the distance, its overall effect is to
reduce steering time. r0 should also be made as small as possible.
In summary, for Grid Gates, it is better to make the distance between rows between two and
four times the gate’s (the target) width, and for Polar Gates it is better to keep the inner radius small
and to use a large ring width (i.e. increase w in Figure 3.10). In both cases these improvements
increase the overall size of the gates, so there must be a limit on how large the gates should be.
Accot and Zhai (2001) have studied the impact of scale on steering tasks and their general
conclusion was that best performance is achieved when the size is large enough to utilize all parts
of the upper limb (i.e. arm, hand, and fingers) but not so large so as to place most of the effort
required on the arms only, or so small as to place most of the effort required on the fingers only.
Their studies where conducted using a graphics tablet with size of 455mm× 303mm. With digital
tabletops, unlike tablets, it is possible to increase the size to a degree that utilizes the arm, hand
and fingers. Increasing the size also increases awareness about the attributes being selected, but
one should be careful not to make the gates too large that they slow down the performance (i.e. not
to place most of the effort on the arms only (Accot and Zhai, 2001)), or take up too much of the
display space.
The initial design for the gates was driven by aesthetic considerations. This involved using a
narrow gap between rows and focusing on wide gates, similarly for Polar Gates, the inner area was
made rather large, with narrower rings and a smaller overall size to reduce the gate’s footprint. Af-
ter applying the steering and targeting laws, it became clear that these were poor design decisions.
Applying these guidelines, and doing some initial tests, demonstrated noticeable improvements in
the usability of the gates.
3.6 Related work
Accot and Zhai (2002) investigated crossing-based interfaces as an alternative to point-and-click
interfaces, and showed that the time required for goal crossing was shorter, or at least the same,
as for point-and-click. These studies were conducted using a tablet input device connected to a
desktop PC (with a standard display). In this setting the action and perception spaces are different
– this is not the case for digital tabletops and tablet PCs. Accot and Zhai suggested a number
of crossing-based interactions such as using directional goal crossing to turn a switch on or off
depending on the crossing direction, performing double clicking by crossing a goal twice, or

63
checking a number of options in one go if they are placed in a sequence (this is similar to the Grid
Gates).
CrossY (Apitz and Guimbretiere, 2004) is a crossing-based drawing application designed for
tablet PCs. It introduced a number of new ideas on how to utilize the crossing technique in a
complete application by investigating the aspects of expressiveness, fluid command composition,
efficiency, and visual footprint. In terms of expressiveness an attempt was made to mimic all
the standard point-and-click user interface components like buttons, scrollbars, menus, dialog
boxes, and other windows management tools. Crossing was used to perform a range of operations
including setting the pen width and colour, find and replace, and scrolling. Apitz and Guimbretiere
emphasized the unique and fundamental support of crossing based interfaces in allowing for fluid
command composition. Initial user studies on the application showed that users found the interface
to be intuitive and better suited for the application at hand than point-and-click. The crossing
technique was found to be as expressive as the point-and-click technique, yet more flexible by
incorporating shape and direction of the strokes.
The concept of showing commands in a polar layout and activating them by passing over them
is not completely new. A number of contextual polar menus have been previously suggested: Pie
menu (Hopkins, 1991) was the first to introduce the concept of menu items positioned around a
circle to utilize the two-dimensional surface of interaction. The targeted command is identified
by its relative direction to the point of click, however, in the original version activation of the
command was achieved by clicking and not crossing. The assumption that with continual use,
users would internalize the positions of the commands leading to improved performance, is an
important concept behind the design of pie menus. Many variations of pie menus have been
proposed, some of which present only minor variation (i.e. flavours (Hopkins, 1991)) while others
introduced new types of menus. All the variations address the issue of improved performance with
use and moving from visual search for the command, to a directional based, gesture-like style of
interaction. Marking menus (Kurtenbach, 1993) build on pie menus and allow the selection of a
command by drawing a mark in its direction. A more complicated sequence of commands and
subcommands is activated by more complicated, zig-zag like, marks. Control menus (Pook et al.,
2000) extend this concept by allowing the setting of attributes of a selected command based on the
direction and distance of movement, for example, selecting a zoom command then the zoom value.
FlowMenu (Guimbretiere and Winograd, 2000), unlike the others, is specifically designed for
pen-input on large, originally vertical, interactive surfaces. FlowMenu also builds on the marking
menu but focuses on combining command selection, text and data entry (usually parameters of
the selected command) into single fluid strokes. FlowMenu was used with CrossY (Apitz and
Guimbretiere, 2004) and was also used by Scott (2003) in a digital tabletop interface. Many of
the menu types mentioned relate to the notions of the crossing-based interface, the polar layout,
and that it is possible to make a number of consecutive menu selections without the pen having to
leave the active surface. However, the number of consecutive command selections always involved

64
commands and sub-commands and not sets of mutually exclusive commands. If we imagine using
FlowMenu to set the scale, rotation, and access right attributes, for example, we would still need
to use the menu three times, once for each attribute.
3.7 Evaluation
I designed a user study to compare ease of use, performance, and mutual awareness for the two
types of Attribute Gates with standard contextual menus on a pen-based digital tabletop. The
study was conducted with a pre-production prototype of the multi-pen Promethean Activboard
(Figure 3.11). As with other studies of tabletop interface elements, I used a mixture of precision
and timing measures, as well as reflection by our participants, both to document users’ experience
of Attribute Gates and to contrast their use with standard interface elements.
Figure 3.11: Configuration of the multi-pen surface and the two participants for the user study.The sender is on the left, and the receiver is on the right. The small dialog box to the left of thesender (which was shielded from the receiver) shows the required settings for the current object.
The application used in the study involved two users, the sender (the user on the left in Figure
3.11) and the receiver (the user on the right in Figure 3.11). To the left of the sender, the application
provided a prompt as to the attributes to be applied to the current object. This involved setting three
values for each of the following attributes:

65
• Access rights (read-only/read-write/duplicate).
• Orientation (manual/to-centre/rotate-and-translate).
• Scale (enlarge/no-change/shrink).
The sender’s task was to apply these settings to the current object, and place the object in one
of three locations in the public space in the centre of the table according to the value of the scale
attribute. The Attribute Gates and the contextual menu appeared when the sender pressed and
held the pen tip on the object for half-a-second (as already described, this duration was chosen on
the basis of informal experimentation). The gates disappeared when the pressure on the pen tip is
released. The contextual menu disappeared after the selection of each subcommand.
Orientation and scale settings have a direct effect on the appearance of the object, unlike the
access rights settings. For this reason, the receiver’s task was to monitor the value of the access
rights attribute applied by the sender, and to move the object from the shared space to a second
set of locations (in her personal space) according to the observed value of this attribute. With
Attribute Gates, the access rights attribute set by the sender stays visible as long as the gate is
visible, unlike the case with contextual menus where the menu disappears after clicking on the
required setting. As can be seen in Figure 3.11, in front of the receiver are four square-shaped
areas. Three of these correspond to the three access rights settings available for the sender, and a
question mark labels the fourth area. The receiver was asked not to guess the value of an attribute.
In cases where she was unsure of the value, she should put the object in the area labelled with
the question mark. A barrier was placed on the tabletop to prevent the receiver from seeing the
access right setting prompt provided to the sender (not shown in Figure 3.11). Although senders
and receivers worked in parallel, they were asked neither to support nor hinder each other.
Each sender/receiver pair was required to perform the experiment on three sets of 10 objects,
using a different attribute assignment interaction technique for each set (grid gate, polar gate, and
contextual menu in different order for each participant). The actions required by a sender de-
pended on the attribute assignment. That is, for Grid and Polar Gates, different attribute value
combinations require different ranges of movement. Consequently, the sequence of attribute val-
ues to be assigned was repeated for each interaction technique. Three of the setting combinations
(for object 2, 6 and 7) were deliberately set to values that were the same as their predecessor.
This allowed for the exploration of the potential benefit of the self-configuring characteristic of
the Polar Gates.
Eight sender-receiver pairs of experienced computer users took part in the study. The pairs
were allowed to practice the task using all three of the interaction techniques without a time limit.
When they felt confident with all the techniques they commenced the study (practice times varied
between 4 and 10 minutes). The training and trial sessions were both supervised. I measured the
following properties for each trial (i.e. for each assignment of attribute values):

66
1. Time taken for the sender to apply the setting, measured from the initial selection of the
object to the placement of the object in the central public space.
2. Sender’s accuracy in assigning the attribute values.
3. Accuracy of the receiver’s judgement as to the value of the access right attribute (the value
actually set by the sender).
3.7.1 Accuracy (sender)
Results of the study show that the senders accurately assigned the attributes using all the tech-
niques, with only one user making a single erroneous assignment.
3.7.2 Awareness (receiver)
When senders used the Attribute Gates, receivers demonstrated greater awareness of the sender’
choice of access rights attribute value. Figure 3.12 shows the distribution of errors across the
participants for each interaction technique. Only one receiver made one error under the Attribute
Gates conditions. By contrast, in the contextual menu condition nearly 19% of trials resulted in
either an incorrect judgement by receivers, or the receivers indicated that they were unsure of
the access right attribute value. These cases were distributed across 6 of the 8 receivers, which
indicates that it is related to some aspect of the interaction technique (rather than the participants
themselves).
3.7.3 Performance
An analysis of variance showed that participants performed the sender’s task significantly faster
using Attribute Gates (Figure 3.13). The average times in seconds for completing the task for each
type were as follows: Grid Gates=5.9, Polar Gates = 7, and contextual menus=13.1. Comparing
between Grid Gates and contextual menus showed F1,18 = 67.9, p = 1.60E − 07; and between
Polar Gates and contextual menus F1,18 = 32.3, p = 2.15E − 05.
There was not a significant difference between the Polar Gates and the Grid Gates (F1,18 =
2.2, p = 0.16). Grid Gates, on average, led to a slightly better performance than the Polar Gates
(Grid Gates=5.9 seconds and Polar Gates = 7 seconds) except for the cases of repeated attribute
assignments of object indices 2, 6, and 7 (Figure 3.13). Object index 2 repeated the settings of
object index 1, and object indices 6 and 7 repeated the settings of object index 5. For these cases,
the participants made use of the Polar Gates memory feature and hence just had to pass through
a straight line to repeat the previous settings, performing slightly faster than for the Grid Gates.
Figure 3.14 shows the average time for each participant for setting all the attributes using each of
the interaction techniques. This clearly shows that the performance of participants when using the
contextual menus was consistently worse.

67
Figure 3.12: Receiver errors (by participant) for each interaction technique.
3.7.4 Participant views
In an unstructured interview with the participants, they were asked for their comments and pref-
erences. Despite the relatively poor performance of participants with the contextual menus, two
participants expressed a preference for these, including one participant whose performance with
the Attribute Gates was faster than any other participant. This may have been due to the fact that
these two participants felt more familiar with the use of contextual menus despite the fact that
they performed better with the new techniques. The remaining participants, however, preferred
Attribute Gates with varying preferences between the grid and polar layouts. A number of partic-
ipants identified that the projection from above, and the resulting obscuration of attributes made
the Polar Gates harder to use.
3.8 Discussion
The two configurations of Attribute Gates were developed in response to the analysis of the re-
quirements of an interaction technique to integrate the action of setting multiple attributes with the
movement of objects between territories in tabletop interfaces. Attribute Gates are motivated by

68
Figure 3.13: Average timings for the sender task for each attribute setting (by interaction tech-nique). Each bar represents the average time of the eight participants for setting the indicatedobject.
the notion of task levels in activity theory and crossing-based interfaces. Their spatial configura-
tion was optimised using targeting and steering laws derived from Fitts’ law.
Both Polar and Grid Gates are crossing-based interfaces that allow users to concurrently move
interface objects and set their attributes in one smooth action. Conventional design wisdom for
tabletop interfaces would suggest that, in the absence of readily accessible toolbars and system
menus, contextual menus should be used to set object attributes. An evaluation of both forms of
Attribute Gates demonstrated significant advantages over standard contextual menus in terms of
user performance and mutual awareness.
Polar Gates and Grid Gates differ in a number of ways. Firstly, Grid Gates maintain the spatial
location of the gates themselves. Although not examined in our study, a prolonged evaluation may
demonstrate an additional benefit as users internalize these positions and use more automatic free
flowing strokes. While faster setting of attributes may impinge on mutual awareness, bystanders
will gain similar familiarity with these positions and movements.
Polar Gates, deliberately maintain the configuration of last use with a view to exploiting the
fact that attribute combinations are often repeated for a specific user engaged in a particular task.

69
Figure 3.14: Average timings for each participant (by interaction technique). Each bar representsthe average time for setting all the objects for one participant using one of the techniques.
The benefit of this persistence of state was demonstrated in the user study, for which the Polar
Gates slightly outperformed the Grid Gates for repeated states, with no observed negative impact
on mutual awareness.
A final observation is that the use of a physical metaphor in Polar Gates (manipulating the con-
centric rings) encouraged users’ steering behaviour. In simple terms, the mechanism of the Polar
Gates was more readily understood by users. Though the metaphor of the Grid Gates was clear,
the freedom of movement afforded between gates resulted in Grid Gates requiring more practice
time than for Polar Gates. Another important advantage of Polar Gates is that they are orientation
independent. This is an important feature characterizing components specifically designed for
tabletops where users around the table view components from different angles.
There is a number of possible enhancements to Polar Gates, such as the use of a temporary
switch gate which if passed through, marks the current action as temporary and should not be
remembered. This is useful when a single temporary setting is required while repeatedly applying
identical settings. Also, it is possible to add gates to save and load different settings where an
outer ring can contain gates like save setting1, save setting2 and so on, paired with an inner ring
with load setting1, load setting2.

70
Although designed for the specific problem of setting access rights, orientation, and scale
when moving objects between territories, Attribute Gates have broader applicability. They can be
used to set any sequence of mutually exclusive attributes in one fluid stroke. Polar Gates differ
from other polar menus (Hopkins, 1991; Guimbretiere and Winograd, 2000; Pook et al., 2000)
in a number of respects: they introduce the concept of a number of concentric rings to allow for
multi-level mutually exclusive commands to be set in one stroke, which is made possible by the
use of the rotatable rings. Polar Gates are also distinct in their incorporation of a memory feature
by which the last configuration is preserved. As will be seen in Digital Mysteries application in
Chapter 5, a two-ring version of the Polar Gates is used. The inner ring controls the scaling of
objects with four options (enlarge, iconify, normal, and keep) and an outer ring directly controls
rotation. The outer ring only corresponds to one command (Figure 3.15) and rotating the ring
will rotate the object, acting like a rotation control knob. This setting allows the participants to
scale and rotate an object in one fluid action, and it was found to be very easy to use by the many
children who took part in Digital Mysteries studies. Moreover, although the original design of
the Attribute Gates integrates setting attributes with object movement, the modified version used
in Digital Mysteries, due to its different requirements, did not involve moving the object as the
dragging point moved.
Figure 3.15: A modified version of polar gate that allows setting scale attributes in the inner ring,and applying rotation to an object by rotating the outer ring.
As previously described, the orientation independence of Polar Gates makes them very appro-
priate to use with the tabletop’s horizontal surface. Even a one-level polar menu with the memory
feature can have a significant benefit (Figure 3.16). A user using a menu with four scale com-
mands (e.g. left for normal size, right for maximize, down for iconify, and up for no-change), will
internalize this setting and start changing the scale by directional movements without looking at
the actual commands. Now if the user moves her location to another side of the table, she just

71
needs to re-orient the polar menu the first time it is activated from the new location to maintain the
relative directions according to her new position. The menu will remember this orientation until it
is re-oriented again and thus allows for directional interaction even for settings with mobile users.
Figure 3.16: A modified, one-level, version of Polar Gates that is used with Digital Mysteries.Rotating the ring in this version is only useful when the user changes her position around thetable.

72
Chapter 4
TANGISOFT
4.1 Introduction
The majority of computer supported activities require some amount of text entry by the user. This
requirement varies from word-processors that are first and foremost a means of text-entry and edit-
ing, to web-browsers that intermittently require input of a URL, text for search queries, or online
form entries. Yet, despite the important role of text entry, very little research has been conducted
on text entry methods for digital tabletops (Hinrichs et al., 2007). Many text-entry techniques
have been proposed for small mobile and pen-based devices, but these have very different char-
acteristics, and thus requirements, from tabletops. Tabletops have the unique characteristics of
being large-horizontal displays that support direct-touch and multiple, simultaneous, co-located
users. While work related to text entry on other devices is useful, different techniques specifically
tailored to the different contexts of use of tabletops are still required.
An extensive literature search yielded only three techniques, BubbleType (Hinrichs et al.,
2008), an adaptive text input interface proposed by Hirche et al. (2008), and the SLAP key-
board (Weiss et al., 2009) which are identified to have specifically been designed for tabletops.
Each of these proposals has a different type of use and users, and is not generally applicable to the
full gamut of tabletop applications. Indeed, it is clear that no text entry technique is suitable for
all tabletop applications, for example, while a physical keyboard might seem like the best choice
for applications requiring extensive text entry, it is not the best choice for applications that require
frequent switching between direct interaction (with the table) and short text entry tasks. Likewise,
while the soft keyboard maintains direct touch interaction and combines it with other desirable
features such as being collapsible and digitally flexible, it is not suited for applications requiring
extensive text entry, and does not allow for the level of user mobility required in some applications.
I have designed a new input device, the TANGISOFT keyboard (Figure 4.1) that is a hybrid of a
physical and a soft keyboard. The TANGISOFT keyboard seeks to combine the separate advantages
of tangible and direct-touch interaction. The design reflects the general context-related consider-
ations stated by Wallace and Scott (2008), the special requirements for text-entry techniques for
digital tabletops (Hinrichs et al., 2007), and follows the guidelines set out by Scott et al. (2003)

73
relating to interpersonal interaction, fluid transition between activities, use of physical objects, and
multi-user concurrent interaction. In simple terms, the device is a piece of paper with a printed
keyboard layout that can be tracked by the system. Text is entered by direct-touch on the printed
keys. The tangible qualities include the ability to move the keyboard by hand and the presenta-
tion of a virtual digital layout physically. The soft (virtual) characteristics include the direct-touch
interaction and augmentation of the printed keys by projected digital information (highlighting).
Figure 4.1: The TANGISOFT direct-touch keyboard. Users handled the tangible keyboard in twodifferent ways. The grey projection indicates the position of the pen, and the blue projectiondemonstrates the possibility of highlighting the next predicted keys.
4.2 Motivation
Ryall et al. (2006), Wigdor et al. (2007), Hinrichs et al. (2007, 2008), and Hirche et al. (2008)
have discussed the issue of text-entry on digital tabletops. By observing users’ experience while
interacting with multi-touch tabletop applications in four different real-world contexts, Ryall et al.
(2006) made note of the challenges of using bare fingers for text entry and identified the issues
resulting from the use of virtual keyboards and graffiti-style input. For example, although virtual
keyboards were feasible, they were tedious to use in some instances, and that graffiti-style input
was impractical when large amounts of text entry were required because people tended to draw
large, and clumsy shapes with their fingers. Therefore, Ryall et al. suggested the use of auxiliary
input sources such as wireless keyboards and PDAs. By contrast, Wigdor et al. (2007) observed a
single tabletop user in a conventional office setting and found that the soft keyboard was adequate
and did not impact the content of the composed text. Maintaining the direct touch interaction was
a significant factor in this, as compared to using a physical keyboard which disrupts the interaction
style. Despite the contradicting observations, both studies recommended that the requirements for
text entry at the tabletop need further exploration. Hinrichs et al. (2007) carried out this further
exploration and proposed a set of desirable characteristics for digital tabletops regarding text entry
and a corresponding set of evaluation criteria.
Context of use is an important factor in the design of applications or interaction techniques for
tabletop systems. As summarized in Chapter 2 (Section 2.3), Wallace and Scott (2008) provided

74
general guidelines as to the effects of the context of use on the design of the user interface com-
ponents’ complexity and interaction, the physical form, and connectedness of tabletop systems
in general. The factors considered in the context of use were social and cultural factors, type of
activity, duration of the activity, ecological factors, and motivational factors. Their guidelines are
based on answers to the questions of who?, what?, when?, where?, and why?. Hinrichs et al.
(2007) used a similar context-based analysis approach to investigate specifically the issue of text-
entry on tabletops. Their guidelines were based on answers to the questions of what?, who?, how?,
and how often (when)? and provided an evaluation criteria on that basis. Their criteria depended
on the visual appearance, performance, environmental factors, and simultaneous interaction.
These criteria have a particular relevance for my work and therefore I will explain each in
more detail.
Visual appearance: Visual appearance is important because it can influence the performance
of text-entry. It can be defined in terms of the overall character arrangement (e.g. rectangular,
or circular) and the character layout (where specific characters are located within the general
arrangement – QWERTY as apposed to Dvorak (Dvorak et al., 1936) for example).
Performance: Two qualities affect performance: efficiency (speed, accuracy, and visual and
cognitive attention), and ease of learning. These two factors often conflict with each other.
Environmental factors: Some of the tabletop specific factors that affect text entry include space
requirements (the footprint of the keyboard which if large can cause clutter, and collapsibility1),
rotatability (the ability to enter text from different angles), direct-touch interaction (a text entry
should, if possible, maintain direct-touch interaction and maintain fluid transition between activi-
ties), and mobility (a text entry technique should not hinder people’s ability to move freely around
the table and enter text from any location and orientation).
Simultaneous interaction: A text entry technique should allow for simultaneous interaction by
allowing shareability (i.e. ease of handing-over or acquiring the device) or duplicability of the text
entry device depending on the specific application requirements.
My research into tabletop interaction was conducted in the context of the application of dig-
ital tabletops in the education of 12-14 year old children. When working on Digital Mysteries,
students frequently need to type in words or short phrases while manipulating virtual paper slips.
I observed how children used Digital Mysteries and, based on the previous criteria, identified a
set of requirements for the text entry technique to be used. The application is intended to be used
by children for short sessions (an average of one hour per session) in possibly weekly or even
monthly sessions. Since text entry is not the main activity, and when required is only for short1collapsibility of an object refers to the ability to minimize the area it occupies on the surface.

75
phrases, the text entry technique to be used needs to prioritise ease of learning and familiarity over
efficiency.
Moreover, the design of Digital Mysteries requires one keyboard for all students (to encourage
collaboration) rather than one for each. Therefore, space requirement is not a main concern in the
design as long as the input device does not clutter the interface, yet this one input device needs to
be easily sharable between students. The application supports, and even encourages, students to
move around the table and thus the text entry technique must not hinder mobility and must allow
for text-entry from any angle (Figure 4.2).
Finally, maintaining direct touch interaction is essential as students frequently need to enter
short amounts of text and thus they frequently need to switch between their main task and text
entry. Allowing quick switching between tasks (or in other words maintaining direct-touch inter-
action), efficient use of space, rotatability, mobility, and shareability, are desirable characteristics
shared with many collaborative tabletop applications (Hinrichs et al., 2007).
Figure 4.2: A student entering text using a rotated soft keyboard from the side of the table whileworking on Digital Mysteries.
Having identified the requirements for the specific application at hand, it is possible to evaluate
the common devices and techniques for text entry according to the criteria established by Hinrichs
et al. (2007).
Physical keyboards: Despite being the preferred choice for applications requiring significant
amounts of text entry, physical keyboards are external, usually large, devices that rank low in their

76
support for mobility, rotatability, and shareability. Moreover, as external devices, they do not allow
for the fluid transition between activities required (Hinrichs et al., 2007).
Mobile devices with physical keyboards: Due to their mobile nature, PDAs and mobile phones
with embedded physical keyboards can be considered as text entry devices that are rotatable and
shareable. Nevertheless, they do not maintain the direct-touch interaction style, and require a level
of familiarity that depends on the text entry technique they adopt. A factor that was not included
by Hinrichs et al. (2007), is the degree to which use of a device promotes awareness. Making
students aware of each other’s intentions and actions is important to the collaborative learning
process. Text entry using such devices can easily go unnoticed if attention is not being paid to the
person entering the text, or to where the text is being inserted in the display.
Handwriting: As the most familiar text entry method, handwriting does not require any learn-
ing (although this depends of the ages of children concerned) and does not have limitations with
respect to mobility. Handwriting maintains direct touch interaction but has the disadvantage of
being the slowest text entry technique (with speed range of 15-25 WPM (MacKenzie and Souko-
reff, 2002)). Moreover, for digital tabletops, the low input resolution of these devices can have a
negative impact on the accuracy and speed of handwriting recognition (Hinrichs et al., 2007).
Gestural alphabets: A number of gestural alphabets, such as Graffiti (Blickenstorfer, 1995),
have been developed to increase the speed and accuracy of handwriting. In the design of such
gestural alphabets efficiency (speed and accuracy of entry) is traded with ease of learning.
Soft keyboards: Graphically rendered keyboards maintain direct-touch interaction and can, to
some degree, be implemented to support mobility, rotatability, shareability, and collapsibility.
However, soft keyboards make significant demands on users in terms of their visual attention, and
exhibit worse text entry performance (speed and accuracy) than physical keyboards due to the lack
of tactile feedback and the use of single-touch in some implementations.
Gesture-based keyboards: These are quite uncommon and usually present novel techniques
that require considerable amount of learning and getting used to. Examples of such techniques
are Quikwriting (Perlin, 1998), SHARK (Zhai and Kristensson, 2003), and Dasher (Ward et al.,
2000). In Quikwriting, letters are arranged in zones around a central resting area. Text entry is
done by dragging the stylus from the resting area to one of the outer zones then to a second outer
zone or back to the central area (Figure 4.3(a)). SHARK augments an optimised stylus based
keyboard by gestures. Each word has a unique movement pattern (shorthand symbol) determined
by the optimised keyboard layout (Figure 4.3(b) shows the keyboard layout, and the shorthand
symbol for the word the). While novice users will need the keyboard for visual guidance, expert
users can rely only on shorthand gesturing. Dasher, combines adaptive language modelling with

77
a dynamically modified display. The initial state shows all the letters on the right of the display.
After the user moves the stylus towards the first letter in the word, the technique makes it easier to
select the next most probable letters as shown in Figure 4.3(c).
Figure 4.3: Writing the word the using: (a) Quikwriting (Perlin, 1998) , (b) SHARK (Zhai andKristensson, 2003), and (c) Dasher (Ward et al., 2000) techniques.
This comparison of text entry solutions highlights the fact that no existing technique meets
the requirements of all applications. From this observation came the idea of designing a keyboard
that aims at making use of the advantages of soft keyboards specifically in terms of familiarity
and direct-touch interaction, and add to it tangible characteristics that will improve its support for
mobility, rotatability, and shareability (as recommended by other design guidelines on tabletops
and two-handed interactions (Scott et al., 2003; Terrenghi et al., 2007)).
4.3 Activity theory, tangible and two-handed interaction
Mobility refers to both the ease of changing the location of the keyboard and its orientation, and
implies support for shareability as it will be easy to hand-over and acquire the keyboard. One
of the main goals of the proposed design was to allow for a high level of mobility. With a soft
keyboard, the user has to perform a sequence of drag and rotate operations to place the keyboard
in an appropriate location and orientation, and, as with other direct manipulations, this is usually
done with the dominant hand. Through the lens of activity theory, this sequence of drag and
rotate operations interrupts and shifts the focus away from the main text-entry activity. With
two-handed interaction, the non-dominant hand is usually used to set the frame of reference for
the dominant hand. For example, when writing on a sheet of paper, the non-dominant hand is
usually used to position the paper and orient it in relation to the dominant hand which controls the
writing instrument (O’Hara and Sellen, 1997; Guiard, 1987; Buxton, 1994). By allowing the non-
dominant hand to set the location and orientation of the keyboard, we can address the mobility
problem and reduce the cognitive load for low-level manipulation tasks, thereby helping users
focus on the main tasks (Buxton and Myers, 1986; Hinckley et al., 1998; Leganchuk et al., 1998).

78
As it turns out, simply allowing two-handed interaction for a soft keyboard does not seem to solve
the problem as it was observed that people continue to dominantly use one hand when interacting
with virtual objects (Terrenghi et al., 2007). This has been attributed to the lack of tangibility
of virtual objects; the virtual nature of a soft keyboard appears not to afford non-dominant hand
manipulation.
Physical affordances are significantly richer than their virtual counterparts (Fitzmaurice et al.,
1995; Terrenghi et al., 2007; Rekimoto et al., 2001). These include the facilitation of people’s
sophisticated skills for manipulating objects, in this case two-handed concurrent position and ori-
entation control. Such capabilities are particularly salient in tabletop settings due to the large
horizontal space within which users may orient themselves differently at different times during
the same session. Fitzmaurice et al. (1995) highlighted a number of advantages of tangible inter-
face elements that we sought to exploit in TANGISOFT, including
1. encouraging two-handed-interaction,
2. making interface elements more direct and manipulable,
3. exploiting our experience of working with physical objects,
4. taking advantage of spatial reasoning skills, and
5. affording multi-person, collaborative use.
Adding tangible characteristics allows bimanual use of TANGISOFT. Positioning the keyboard
at the right location and orientation is carried out as a one subconscious operation not affecting
the main text-entry activity.
4.4 Design
The principal design choices TANGISOFT were
1. the use of direct-touch input,
2. the design of a keyboard as a tangible tool (allowing for two-handed interaction),
3. the use of a printed, rather than virtual keyboard layout, and
4. the augmentation of the physical paper with projected digital information.
4.4.1 Direct-touch input
The overhead of switching between tasks, in this case any task and a writing task, must be kept
to a minimum. Observations of users performing tasks on traditional and digital tables have high-
lighted both the fluent mix of activities and frequent rapid switching between tasks such as drawing

79
and writing (Tang, 1991; Bly, 1988; Scott et al., 2003). Such fluid transitions are hindered by the
need to change between a direct-touch interaction and the use of a physical keyboard for text entry.
Maintaining direct-touch input for text entry is an important component in the facilitation of fluid
transitions between activities at the tabletop (Scott et al., 2003; Hinrichs et al., 2007).
4.4.2 The keyboard as a tangible tool
The use of soft keyboards in digital tabletop systems often requires users to change the location
and orientation of the keyboard, in particular, foregrounding and backgrounding (or hiding) it
when switching between tasks. Such move, rotate and display operations, when performed uni-
manually, are executed sequentially thereby impose a significant additional load on the user. By
contrast, bimanual interaction with objects allows for such task performance at a natural level of
chunking, thereby leveraging significant cognitive advantages (Leganchuk et al., 1998; Hinckley
et al., 1998; Buxton and Myers, 1986). Full utilization of such bimanual interaction can only
be made possible by adding tangible (or graspable) qualities (Fitzmaurice et al., 1995; Terrenghi
et al., 2007; Rekimoto et al., 2001).
4.4.3 Printed layout on paper
Instead of using a projected layout as in soft keyboards, TANGISOFT uses a printed keyboard and
users press on the printed keys to input a character. Using the printed layout increases the tangible
character of the device (as compared to simply having a physical handle on a virtual keyboard).
The use of printed media allows very high resolution display of the characters, which addresses
the characteristically low resolution of most existing tabletop projection systems.
4.4.4 Paper augmentation
Casting a keyboard as a tangible tool does not preclude the incorporation of additional digital
properties. In particular, the flat paper layout allows the projection of digital information over
the physical layout. Digital augmentation of the printed keyboard allows us to highlight the key
that the stylus is moving over, and change the highlighting as that key is pressed. This provides
important feedback to the user as to which key is actually being pressed and improves accuracy.
The digital information augmented on the keyboard can even be in the form of highlighting for the
predicted next possible characters which might be useful in some cases.
4.4.5 Comments on the design
The distinctive design feature of TANGISOFT is the hybrid design that gives tangible affordances
(like two-handed manipulation) to virtual techniques (like soft-keyboards), yet maintains the direct-
touch interaction. The conceptual design of TANGISOFT is layout independent. That is, although
the QWERTY layout was used in the trials, due to its familiarity to most people, there is nothing

80
intrinsic to the design that prevents the use of other layouts, or even certain types of gesture based
keyboards such as SHARK (Zhai and Kristensson, 2003). Therefore, issues of efficiency are not
addressed here as efficiency is largely dependant on the used layout. In the case of a QWERTY
keyboard layout, TANGISOFT becomes as familiar as a traditional soft keyboard and as efficient.
4.5 Related work
Since the pioneering work of Wellner (1993) on the DigitalDesk, a wide range of design issues for
tabletops have been explored and guidelines for designing collaborative systems on digital table-
tops proposed (Scott et al., 2003; Morris, 2006; Wallace and Scott, 2008). Only a small number of
projects have considered the problem of text entry for tabletops (Ryall et al., 2006; Wigdor et al.,
2007). Indeed, the analysis of Hinrichs et al. (2007) is the only systematic account of the prob-
lems and requirements of text entry on digital tabletops, and it establishes a criteria for evaluating
existing approaches. The only text entry techniques designed specifically for digital tabletops are
BubbleType (Hinrichs et al., 2008), the adaptive text input interface proposed by Hirche et al.
(2008), and the SLAP keyboard (Weiss et al., 2009).
BubbleType is designed for a walk-up-and-use scenario in a public space. This means that
people with diverse computer expertise and ages are expected to use the table, mostly for short
periods of time. Such contextual factors require the text entry technique to be approachable (i.e.
invites people to use it), as easy to use as possible, and even fun. The visual appearance of
the technique and its integration within the overall application was also an important factor in the
design. After an iterative design process that started with a circular layout, then a number of curved
branches, the final design comprised two possible layouts, BubbleQWERTY and BubbleCircle
(Figure 4.4). BubbleQWERTY, which followed the QWERTY layout, was found to be more
comfortable to use than the circular layout and thus was the design adopted in the initial trials.
Although designed for two-handed interaction, the keyboard could still be used with one finger or
even in pen-based tabletop interfaces. The initial trials showed that people did not have difficulty
using the keyboard as it was basically a fancy looking soft keyboard using the familiar QWERTY
layout, but it also showed that most people typed on the keyboard using one finger rather than
two hands. The design of BubbleType targeted a very specific context of use. Moreover, the
design fixed the keyboard position and did not allow it to be moved or rotated. Thus, while the
design process of BubbleType demonstrated good design practises following the guidelines stated
by Hinrichs et al. (2007), BubbleType was not intended as a general solution to the problem of
text entry for tabletops and it did not actually introduce any new interaction design concepts.
The approach to text entry proposed by Hirche et al. (2008) was designed specifically for two-
handed text entry on multi-touch multi-finger tables. The technique relies on a small number of
buttons with prediction and hints to minimize finger movement and draws on aspects of a 10-key
phone keypad. The main motivations were to overcome the problem of locating keys on the flat

81
Figure 4.4: The two layouts used in BubbleTYPE. BubbleQWERTY (left) and BubbleCircle(right) (Hinrichs et al., 2008)
and featureless surface of the tabletop and to reduce the visual attention required during typing.
The proposed keyboard adapts its position, size, and orientation based on the initial placement of
the fingers when the keyboard is activated. No formal results for performance and ease of learning
have been reported, but due to its novelty, a certain level of practice is required. The technique
specifically targets mutli-touch multi-finger tables and is not appropriate for single touch and pen-
based tabletops.
Figure 4.5: The adaptive keyboard proposed by Hinrichs et al. (2008).

82
Weiss et al.’s (2009) SLAP widgets, which allow a tangible cast of transparent silicon to
be augmented with digital information, shares some of the tangible-virtual design qualities of
TANGISOFT. A SLAP keyboard (Figure 4.6) is in fact one of the proposed widgets introduced
with the aim of maintaining the tactile nature of physical keyboard yet allow for digital informa-
tion to be projected on the transparent keys. As part of a widget set, however, this work does
not provide any detailed analysis as to the usability of the SLAP keyboard. Like the adaptive
keyboard, the SLAP keyboard was designed exclusively for multi-touch interaction.
Figure 4.6: The SLAP keyboard (Weiss et al., 2009)
Approaches to text entry, and direct touch in particular, in settings other than tabletops have
been thoroughly studied, including the use of optimized keyboard layouts (MacKenzie and Zhang,
1999), improving text entry with prediction (Magnien et al., 2004), gestural alphabets (Goldberg
and Richardson, 1993; Blickenstorfer, 1995), and gesture based techniques (Zhai and Kristensson,
2003; Perlin, 1998; Ward et al., 2000). The hybrid design of TANGISOFT can still be used with
many of these direct-touch techniques to enhance them with tangible characteristics.
4.6 Implementation
TANGISOFT has been developed for a top-projected (1024×768 resolution) pre-production proto-
type of the multi-pen horizontal Promethean Activboard. As explained in Section 2.5, Activboard
uses a technology that allows people to safely lean on it, giving it an important affordance of a real
physical table. The table reacts to a battery-free, wire-free mouse pen which looks and feels like a
real pen and, through the use of time multiplexing, the system can read and distinguish input from
three pens simultaneously.
For TANGISOFT, one pen is used for the actual direct touch interaction, and the sensors from
two other pens are used for tracking. A QWERTY layout is printed on a piece of paper and tracked
with these two sensors (Figure 4.7).
The TANGISOFT keyboard needs to be calibrated, and this is done by first placing it in a
vertical position (Figure 4.8(left)) to establish the width and position of the keyboard with respect

83
Figure 4.7: Two alternative designs for the tangible keyboard were tested. Placing the sensorsat opposite ends of the keyboard (increasing the distance between them) reduced both alignmenterrors and sensor-sensor interference.
to the tracking pens for vertical orientation. In the second step (Figure 4.8(right)) the keyboard is
placed horizontally and the width and height are calibrated for horizontal orientation.
Figure 4.8: The calibration process: step 1 (left) sets the vertical values; step 2 (right) sets thehorizontal values.
Figure 4.7 shows the different possible configurations of the sensors. During implementation,
it was found that placing the sensors in close proximity gives rise to a level of interference that
results in inaccurate location readings. Placing sensors on opposite sides of the keypad reduces
both the impact of error inherent in the tracking, as well as the interference between the sensors.

84
As already explained, the proposed design does not concern itself with the specifics of the
possible keyboard layouts. Nevertheless, the choice of an optimal keyboard size cannot be made
completely independently of the layout to be used. In considering Fitts’ law (in the optimization
of keyboard size) I came to a similar conclusion as to that of MacKenzie and Zhang (2001) and
that is increasing key size to make targeting easier, involves a proportional increase in the overall
keyboard size, and thus the travelling distance to reach keys, leading to an index of difficulty that
is independent of the key size and keyboard size. MacKenzie and Zhang measured the speed for
two keyboard sizes (10cm and 18cm from keys ‘Q’ to ‘P’) and found no significant difference in
speed, although the error rate was significantly higher for the smaller keyboard. Another factor to
consider in determining the size of a keyboard designed for digital tabletops is the overall area that
the keyboard occupies. Since tabletops are multi-user environments it is inappropriate to have the
keyboard of one user covering a large area of either the shared space or a user’s personal space.
The initial size of the keyboard as used in the pilot studies was 11.8 × 4.0cm. The final
design, however, was made larger (20.0 × 6.8cm) to reduce both interference and sensitivity to
small alignment errors, and in response to recommendations from more than 10 participants who
participated in the pilot studies. Users who tried the small prototype indicated that the smaller
keyboard required too much directed effort to target the required keys (which corresponds with
the findings of MacKenzie and Zhang (2001)). Finally, the printed area of a key was reduced to a
size smaller than the actual hit area to guide the users to target the central region of a key thereby
increasing TANGISOFT’s robustness to small errors in alignment. The final keyboard design was
pasted on card and laminated to give it a more rigid, tool-like, physical quality.
Although I implemented TANGISOFT on a top-projected pen-based tabletop, the keyboard
can be used with bottom projected and touch-based surfaces. This can be done by printing the
keyboard layout on a semi-transparent paper that can be tracked by the system. If the semi-
transparent layer prevents-touch interaction, the tangible part then should only consist of a handle
that can be manipulated using the non-dominant hand, and attach to this handle a virtual keyboard
layout. This does reduce the overall tangible sense of the keyboard but it still allows for bi-manual
interaction.
4.7 Exploring the use of TANGISOFT
The main design hypothesis for TANGISOFT was that the tangible character and two-handed in-
teraction afforded by the keyboard promotes mobility. This makes TANGISOFT more suited to
digital tabletops than a traditional soft keyboard. This is particularly true for tasks that require
users to physically move around the table, or when the text entry tool is a shared artefact and is
frequently exchanged between users.
In designing an observational study to evaluate the design, I ran a number of pilot studies to
explore the relationship between the nature of applications and the mobility requirements they

85
Figure 4.9: Text copying application.
place on users. One application required participants to label a number of images spread across
the table. The images where movable, and participants mostly moved the images close to them and
entered very short labels. Another set-up required participants to copy multi-sentence paragraphs
of text placed at different fixed locations on the table. Due to the length of the text to be copied
in each instance, participants were forced to move the keyboard (both tangible and soft keyboard)
near to the location of the source paragraph. The eventual design was positioned between these
two extremes.
The task used in the final observational study required participants to copy short phrases of
3-5 words located and oriented differently across the tabletop. 14 short phrases had to be copied
in a fixed order, requiring participants to shift between relatively distant locations on the table.
The orientations of the phrases ranged from 0◦ to 180◦ (Figure 4.9). When faced with this task,
the hypothesis was that participants would be more likely to move the keyboard if the action was
sufficiently lightweight.
Ten participants (8 males and 2 females, ages between 22 and 35 years, all experienced com-
puter users) were observed using TANGISOFT and a soft keyboard. Subjects were trained on both
keyboards until they reported feeling comfortable with the interaction technique (training sessions
ranged from 5 to 10 minutes). The study application logged the location and orientation of the
keyboard as each phrase was entered. Sessions were also filmed to allow for evaluation of the use
of the non-dominant hand and handling styles when moving and typing.
To allow for a fair comparison between the two techniques I implemented a special soft key-
board that could be dragged from its border and rotated from its for corner. This differs from the

86
standard (non-rotatable) soft keyboards in both Windows or the Activboard software suite. The
soft keyboard used a similar layout to that printed on the tangible keyboard (Figure 4.10).
Figure 4.10: The soft keyboard used in the study.
4.7.1 Observations and analysis
I analyzed the logs for each of the participants and calculated the number of times each participant
moved or rotated the keyboard. I counted rotations that were equal to or greater than 3◦ and
the translations that were equal to or greater than 3 pixels (on the tabletop translations of 3 pixels
usually corresponded to deliberate actions). Table 4.1 and figures 4.11 and 4.12 present the results.
Table 4.1: Number of rotation and translation actions for each participant for the tangible and thesoft keyboards. The table is ordered to show different behaviour patterns
Initial angle Rotations TranslationsSubject Tngbl Soft Tngbl Soft Tngbl Soft
1 0 0 0 0 1 12 1 0 0 0 3 03 13 0 7 5 6 64 -6 0 14 13 13 135 18 0 13 13 12 136 28 0 6 0 12 127 16 0 13 5 13 138 29 0 11 3 13 49 -2 0 10 0 11 310 0 0 11 0 11 0
Although it is tempting to perform significance tests on the mean values, a careful examination
of the distribution of the data suggests that a more holistic analysis is more appropriate. I con-
sidered the data itself in Table 4.1 (Figures 4.11 and 4.12), the video recordings of participants’
behaviour, and the plots of the position and orientation of the keyboard for each sentence (Figures

87
Figure 4.11: Number of rotation actions for each participant.
Figure 4.12: Number of translation actions for each participant.
4.13, 4.14, 4.15, and 4.16). My analysis of the data revealed three qualitatively distinct categories
of users (and user behaviour):
• Same static behaviour (static users). This type of user fixed the position and orientation of
both keyboards (soft and tangible) throughout the whole session (Figure 4.17). The first two
participants in Table 4.1 exhibited this behaviour, and Figure 4.13 shows their position and
orientation graphs for the keyboard location and orientation for each of the phrases.
• Same dynamic behaviour (fully dynamic users). This type of user translated and rotated
both keyboards (soft and tangible) to similar degrees, and even moved around the table
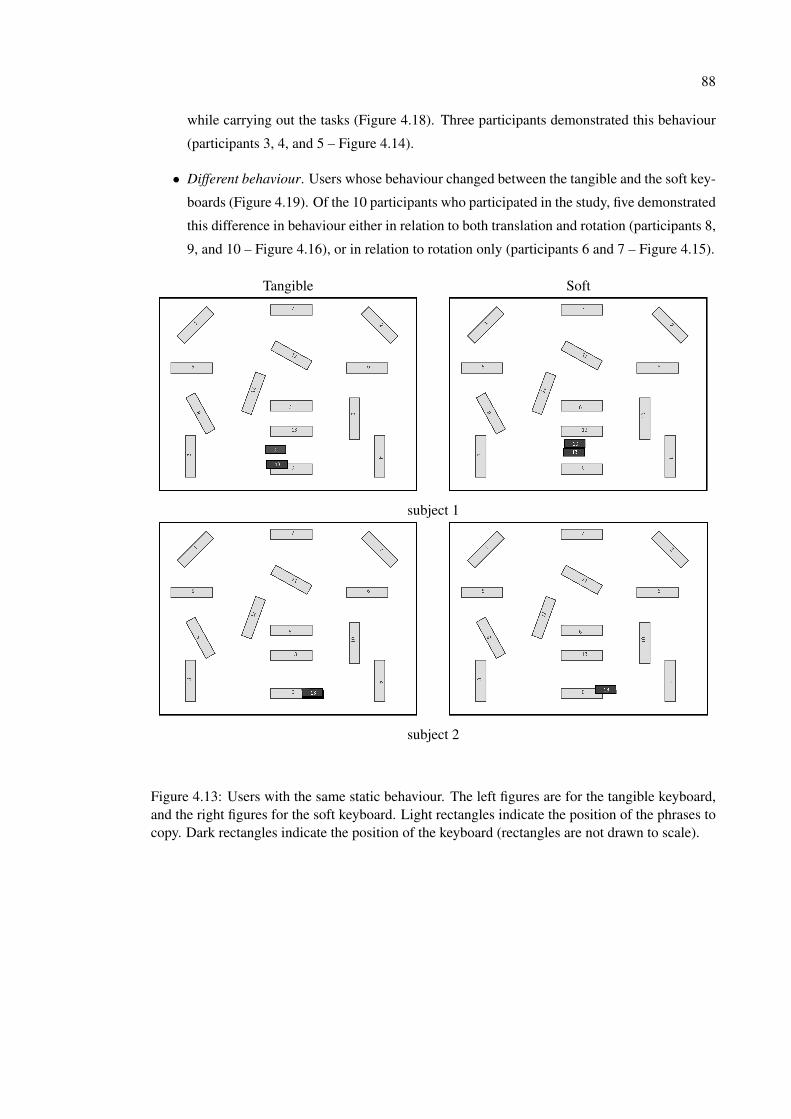
88
while carrying out the tasks (Figure 4.18). Three participants demonstrated this behaviour
(participants 3, 4, and 5 – Figure 4.14).
• Different behaviour. Users whose behaviour changed between the tangible and the soft key-
boards (Figure 4.19). Of the 10 participants who participated in the study, five demonstrated
this difference in behaviour either in relation to both translation and rotation (participants 8,
9, and 10 – Figure 4.16), or in relation to rotation only (participants 6 and 7 – Figure 4.15).
Tangible Soft
subject 1
subject 2
Figure 4.13: Users with the same static behaviour. The left figures are for the tangible keyboard,and the right figures for the soft keyboard. Light rectangles indicate the position of the phrases tocopy. Dark rectangles indicate the position of the keyboard (rectangles are not drawn to scale).

89
Tangible Soft
subject 3
subject 4
subject 5
Figure 4.14: Users with same dynamic behaviour. The left figures are for the tangible keyboard,and the right figures for the soft keyboard. Light rectangles indicate the position of the phrases tocopy. Dark rectangles indicate the position of the keyboard (rectangles are not drawn to scale).

90
Tangible Soft
subject 6
subject 7
Figure 4.15: Users who showed different behaviour in terms of rotation only. The left figures arefor the tangible keyboard, and the right figures for the soft keyboard. Light rectangles indicate theposition of the phrases to copy. Dark rectangles indicate the position of the keyboard (rectanglesare not drawn to scale).

91
Tangible Soft
subject 8
subject 9
subject 10
Figure 4.16: Users who showed different behaviour in terms of both location and orientation.Light rectangles indicate the position of the phrases to copy. Dark rectangles indicate the positionof the keyboard (rectangles are not drawn to scale).
These results show that the type of user is more significant than the characteristics of the text
entry technique. If a user prefers not to move while working, she may go to extraordinary lengths
to avoid changing her position at the table. The two participants in this category rotated their heads
(Figure 4.17) and endured significant cognitive load in trying to understand rotated phrases. At the
other extreme are users who are dynamic by nature almost regardless of the physical effort required

92
Figure 4.17: Static users: enduring higher cognitive load to avoid physical movement.
Figure 4.18: Dynamic users: same dynamic behaviour for both tangible and soft keyboard.
Figure 4.19: (Left) TANGISOFT: moving near the phrase and rotating the keyboard. (Right) Softkeyboard: the position and rotation of the keyboard is kept relatively constant.
(Figure 4.18). The third category of users, who will move if it is afforded by the tool at hand, are
the most appropriate category for which to assess the benefits of tools such as TANGISOFT. The
affordances of TANGISOFT as a tangible tool meant that it required less effort to move it around,

93
and thus transformed participants from static users of the soft keyboard to dynamic users of the
tangible keyboard.
Another interesting finding was that for the first phrase, which was horizontal and not rotated,
all users kept the soft keyboard in its default (also horizontal) orientation and started typing. For
the tangible keyboard, 6 out of the 10 participants started typing the first phrase with an orientation
that ranged from −6◦ to 29◦ CCW. This small adjustment of the tangible keyboard puts it at a
more comfortable orientation for text entry. In this single observation an advantage of the tangible
keyboard over the soft keyboard was observed in terms of ease of movement and the amount of
effort required to put the tangible keyboard in the most appropriate position.
None of the users moved or rotated the soft keyboard more than the tangible keyboard. This
lead to conclude that the tangible characteristics of TANGISOFT, and its affordances for two-
handed interaction, did promote mobility. This result was more marked for rotation as with tangi-
ble keyboard translation and rotation are carried out as one integrated action. By contrast, for the
soft keyboard, re-positioning was carried out as a series of translate actions followed by rotate ac-
tions. Some users had to repeat the translate-rotate actions sequence a number of times to position
the keyboard as desired and many ignored the rotation action (probably to reduce overall effort).
This demonstrates that the design of the tangible keyboard allowed for chunking (Buxton and My-
ers, 1986) two actions (or in some case longer sequence of actions) into one, thereby satisfying
our design goal.
After the study the participant were asked a number of direct questions as to their preferences:
1. Which keyboard was easier to move around the table?
2. What is your preferences as to the size of the tangible keyboard: smaller, this size, or larger?
3. Did you feel that looking at the printed keyboard layout of the tangible keyboard was more
comfortable for your eyes than looking at the soft keyboard layout?
For question (1), concerning mobility, 7 out of 10 rated the tangible keyboard as easier to
move than the soft keyboard. One participant commented that it “could just be pushed or pulled
and rotated at the same time instead of needing to drag the pen”. One participant rated the two
keyboards the same as he did not move either of them, and only two participants considered the
soft keyboard to be easier to move around. Of these two participants one commented that “Both are
easy to move - but the fact you don’t need to hold the soft keyboard in place means the ease of use
is overall greater/better”. These results correspond with previous findings as to the advantages of
two-handed interaction (Leganchuk et al., 1998; Buxton and Myers, 1986; Hinckley et al., 1998).
Regarding the size of the keyboard, 9 of the 10 participants felt the tangible keyboard was the
appropriate size, and only one suggested that a larger size would be better.
Concerning the difference between the projected and printed keys, 5 of 10 participants reported
that the printed layout was more comfortable to look at, for example: “generally easier to read,

94
less pixelated so letters were clearer, shadows of my hand didn’t affect the tangible keyboard”;
and “The tangible keyboard is obviously far better to look at especially when scanning for a key
or quickly glancing. However soft keyboard was still usable”. Two participants felt that there was
no difference between the keyboards, and three described that the soft keyboard was better, for
example: “The material of the tangible keyboard seemed to diffuse the light, where I could see
through the edges of the soft keyboard” and “the soft keyboard was better for the length of time I
used it for – but this may alter after hours of use”.
The final set of observations is related to how the participants handled TANGISOFT. Most
participants held the tangible keyboard with their non-dominant hand, pressing their fingertips on
the round blank area to the left of the keyboard. They kept their hand in this position while typing
to prevent the keyboard from slipping, and pushed and rotated the keyboard in one action to the
next location. In some cases, the keyboard was held by its lower edge instead of the left blank
area. One participant used two hands to move the keyboard, with each hand holding one of the two
handles. Two other participants used the two hands in only isolated cases. 9 of the 10 participants
fixed the keyboard while typing using their non-dominant hand, and only one participant did not
(instead keeping his non-dominant hand free). This same participant moved the keyboard using
his left non-dominant hand holding the keyboard by its left handle. Finally, when moving the
keyboard to distant locations, one participant pushed the keyboard away such that it slid across the
tabletop.
4.8 Discussion
The analysis shows that TANGISOFT was successful in converting the conscious action of putting
the keyboard in an appropriate position to a subconscious operation. As a result, and with the
maintenance of direct-touch interaction, text entry can be more readily integrated into the larger
task at hand, making it an appropriate tool for applications requiring mobility and frequent text
entry. Moreover, TANGISOFT successfully addressed all of its principal design goals: ease of
learning, the maintenance of direct-touch interaction, use of space, rotatability, mobility, and the
provision of simultaneous interaction.
From observations of both the pilot and main studies, and from discussions with the partici-
pants in these studies, TANGISOFT proved to be easy to learn and use since it did not introduce
new concepts and utilized the participants’ previous experience of using soft keyboards. Direct-
touch was maintained by the hybrid design and the use of a printed layout removed the limitation
of the projector resolution (especially true for large projected surfaces). Although a component
of the rationale for the printed layout was to allow for smaller keyboards than is possible with
current projector resolutions (or large tables), the pilot studies showed that users did not prefer
small sized keyboards because hitting the correct keys was harder. So for the final study a larger

95
keyboard (20.0 × 6.8cm) was used which the participants’ confirmed was the appropriate size
(though this is also a function of the resolution of the tracking technology).
The case studies showed that TANGISOFT promoted mobility and afforded fluid translation
and rotation with the non-dominant and dominant hands alike. Additionally, it is possible to have
as many tangible keyboards as the tracking technology admits. TANGISOFT supports pushing,
pulling, and sliding on the surface, so even if one keyboard is to be shared among many users,
it is easy to move a tangible keyboard around the surface of the table. For these reasons, I claim
that TANGISOFT does satisfy the design criteria and affords for more fluid interaction than soft
keyboards.
The implementation of TANGISOFT can be modified for different tabletop technologies. For
example, the tangible layout can be tracked using visual tracking. The layout can be printed on
transparent card to maintain transparency for back-projected keyboards. For tabletop technologies
that are touch-based and cannot sense finger tapping on a physical card, it is possible to track a
tangible handle but project the keyboard layout on the surface and not use a physical card. This
way, many of the tangible characteristics can be maintained. Although projecting the layout on the
table surface (and not a card) may reduce some of its tangible characteristics, and the benefit of
having a high resolution layout, this can give the keyboard some other soft keyboard characteristics
such as being collapsible, scalable, and having ability to dynamically change layout.
The concepts of the hybrid-design can be implemented not just for text entry but can be gen-
eralized to work with other control pallets, such as the ToolGlass (Bier et al., 1993). Changing
commands in the pallet can be achieved either by maintaining a blank surface on which any con-
tent can be projected (to maintain the full tangible characteristics), or by using a tangible handle
only, and projecting the content on the adjacent surface directly.
Two conclusions, pertaining to tangible interaction in general (and not just text entry), can
be drawn from the results of this design study. Firstly, that it is the nature of the user that is the
dominant factor in determining the style of use in terms of mobility and two-handed interaction.
Some users exhibit consistently static or dynamic behaviour regardless of the tool. Only for certain
classes of users, does the difference in behaviour become apparent. However, this does not mean
that the other classes of users do not make use of the affordances of TANGISOFT. Indeed, as can
be seen from the responses of such users to the mobility questions, they did appreciate the extra
mobility afforded even if the effect of such tools on their behaviour was not observable.
Secondly, Terrenghi et al. (2007) explored two-handed interaction with physical and digital
photos and came to the conclusion that although the digital photos afforded two-handed manipu-
lation, people dominantly used one hand with the digital photos, and two hands with the physical
ones. Their recommendation of hybrid physical and digital designs over a purely digital one aligns
with our findings. One can therefore reasonably contend that the benefits gained by TANGISOFT,
in terms of mobility and better integration with higher level tasks, cannot be simply achieved by
allowing two-handed interaction with a soft keyboard.
96
Chapter 5
Tabletops and Learning - DigitalMysteries
A distinguishing characteristic of tabletop technology is its natural support for face-to-face col-
laboration. From a learning perspective, my approach for investigating the support of tabletops
for learning is to focus on higher level thinking skills, reflection, and metacognition, all of which
benefit greatly from being practised in a collaborative environment. Improvement in learning is
achieved by designing for encouraging effective learning activities, and validation is carried out by
verifying the occurrence of such activities. This is in contrast with approaches to designing learn-
ing applications by targeting basic, measurable, thinking skills and performing pre- and post-tests
to validate the effectiveness of the application.
As we move toward the design of intelligent machines, rigor is absolutely essential.
It can’t be the cold, objective rigor of the engineer, for this focuses only on what can
be measured as opposed to what is important. (Norman, 2007, pp. 173)
On the other hand, from a computing science perspective, I am seeking to utilize certain affor-
dances of tabletops: multi-synchronous input, direct-touch interaction, the large-horizontal sur-
face, and the barrier free face-to-face style of collaboration. The aim is to produce a model for
learning applications that is specific to tabletops and one that is not a direct adaptation from other
computer-based settings. Simply allowing parallel input for desktop applications, such as drawing
applications, puzzle solving or map browsing, and running them on a multi-touch table does not
transform them into true collaborative learning applications.
In this chapter, I first discuss the theoretical background to thinking skills, focusing on metacog-
nition, reflection, and the provision of feedback. This is followed by a discussion that links collab-
oration to these skills. I end this introduction to the theory of thinking skills with a classification
of learning tasks and their relation to thinking skills which paves the way for selecting the type
of tasks that are appropriate to the targeted educational and technological setting. I have chosen
the Paper Mysteries collaborative learning tool (Section 5.2) as the learning task for carrying out
this investigation. Using an iterative design process, I moved from Paper Mysteries through three

97
iterations to Digital Mysteries, which was evaluated in 22 trials conducted at a school over an 18
month period. A distinctive feature of this work is that the design process, the design choices,
and the implementation framework are all thoroughly grounded in theories of both collaborative
interaction and learning.
5.1 Theoretical background
5.1.1 Cognitive skills
Figure 5.1: Moseley et al.’s (2005) integrated model for understanding thinking and learning
Different researchers define and categorize cognitive skills differently (e.g. Moseley et al.,
2005; Schraw et al., 2006; Kitchener, 1983). I have chosen the model introduced by Moseley
et al. (2005) as it is both the result of an extensive review and evaluation of 35 different frame-
works and taxonomies for understanding thinking, and is aligned with my focus on higher-level
thinking skills, reflection and metacognition. This model divides thinking into two layers, the
cognitive skills, and the strategic and reflective thinking (Figure 5.1). Cognitive skills are conse-
quently divided into three categories: information gathering, building understanding, and higher
level (productive) thinking. These three categories are considered to be the pre-monitored, basic
cognitive skills on which knowledge of the world is built (Kitchener, 1983). The upper-layer of
strategic and reflective thinking corresponds to metacognition and reflection. As can be seen in
Figure 5.1, the model distinguishes the skills in this layer from the lower layer cognitive skills in
that they can be employed at any of the three phases of the lower layer. The mysteries learning tool
chosen, and the design of the digital version, target most of the learning skills in this model with
focus on the productive learning skills, as well as the higher layer metacognitive and reflection
skills. I will revisit this model in sections 5.2, 5.5.3.3, and 5.6 to show the strong correspondence

98
it has to the stages students should progress through in solving Paper Mysteries and the structure
enforced by the design of Digital Mysteries.
5.1.2 Metacognition, reflection, and feedback
Metacognition is used to refer to “the knowledge about and regulation of one’s cognitive activities
in the learning process” (Veenman et al., 2006, pp. 3). It is considered to be the higher-order
agent that monitors and controls the cognitive system, and be part of that system at the same
time. Metacognition can be categorized into two classes (Veenman et al., 2006; Schraw et al.,
2006): metacognitive knowledge and metacognitive regulation skills. Metacognitive knowledge
involves knowing about ourselves as learners (like our memory limitations); about the learning
strategies that we have found useful for different situations (like note-taking, summarizing, and
how to memorize a list of words); and knowing about the level of understanding about a subject,
or performance and strategy during a learning task. This knowledge, however, is not necessarily
accurate. Metacognitive skills, on the other hand, refer to the ability to plan, monitor, and control
one’s actions during a learning task and acts as the feedback mechanism that regulates and guides
progression towards the successful completion of a task. According to Veenman et al. (2006,
pp. 6), evidence of metacognitive behaviour can be observed in such verbalization as “this is
difficult for me, let’s do it step by step” or “wait, I don’t know what this word means.” Or it may
be inferred from planned behaviours such as doing things step-by-step.
Researchers of metacognition found, as reported by Veenman et al. (2006), that while intel-
lectual ability uniquely accounts for 10% of variance in learning, metacognitive skills accounts
for 17%, and both predictors share 20% of variance in learning for students of different ages and
backgrounds, and for different tasks. The implication for this, as Veenman et al. point out, is that
an adequate level of metacognitive skills can compensate for students’ cognitive limitations. Such
skills can be instructed by (1) embedding metacognitive instructions into learning tasks design,
(2) making students aware of the usefulness of these skills, and (3) prolonged training on these
skills to guarantee their application.
Reflection, on the other hand, is considered by some researchers to be “the ultimate expres-
sion of education” (Boyle, 1997), as it helps in making students aware of their thinking process
(metacognition) and problem solving strategies (Boyle, 1997; Collins and Brown, 1988; Baker
and Lund, 1997). With reflection, students can derive abstractions about their thinking process
and compare it with their earlier performances, or to the performances of others. This enables
them to identify weaknesses and areas for improvement that greatly increase the benefits gained
from any problem solving process. If mistakes and weaknesses in problem solving are not high-
lighted and discussed, students are likely to repeat them in later attempts. This is where feedback
comes into play. Feedback is defined by Hattie and Timperley (2007, pp. 81) as the “informa-
tion provided by an agent (e.g. teacher, peer, book, parent, self, experience) regarding aspects of
one’s performance or understanding”, and considered it to be “among the most critical influences
99
on student learning.” In education literature, the terms “reflection”and “feedback”are sometimes
used interchangeably. While Hattie and Timperley (2007) considered information provided by
oneself as feedback (which, in many cases, can be considered as an act of reflection); others, like
Collins and Brown (1988) considered the process of providing information by a teacher regarding
the performance of a task and how to improve it, as reflection. I use the term feedback to refer
to information provided by an external agent (e.g. teacher, peer, technology, book, parent, experi-
ence) which can usually lead to self reflection; and use reflection for the personal act of thinking
back on a process or a task, whether induced by an external or internal agent.
Hattie and Timperley (2007) identified three important questions that should be targeted by
feedback (and consequently by reflection) regarding a learning task:
• What are the goals?
• What progress is being made toward the goals?
• What activities need to be undertaken to improve the progress?
According to Hattie and Timperley, the answers to these questions improve learning when
there is a difference between what the learners understood, and what they were supposed to under-
stand, which as a consequence may lead to increased effort, motivation, or engagement to reduce
this gap. While from the work of Collins and Brown (1988), Nunes et al. (2003), and Baker and
Lund (1997) on reflection, I identified three types of reflective feedback in terms of “when” and
“how” this reflective feedback is provided (post-activity, inter-activity, and part-of-activity); Hattie
and Timperley (2007) identified three important types of feedback (and consequently reflection)
in terms of the level of feedback (related to task, process, or self-regulation).
Task related feedback involves information about how well a task is being accomplished, such
as pointing out correct/incorrect answers and what more/different information is required. This
type of feedback is more powerful when learners have incorrect interpretations rather than simply
a lack of understanding and, if provided properly, may lead to the development of more effec-
tive and efficient strategies for processing and understanding material. Process related feedback
involves the actual processes that learners use in accomplishing the task, such as their strategies
in error detection/correction, and the provision of reflective feedback that can lead to reworking,
restrategizing, or knowledge reconstruction. The advantage of process-level feedback over task
level is in its role in enhancing deeper learning. The self-regulation related feedback relates to
how learners monitor, direct, and regulate their actions towards achieving their learning goals. Its
importance comes from the fact that it leads learners to seek, accept, and accommodate feedback
information, making them better learners.
In terms of when and how reflective prompts are provided, and from literature on reflection,
I have identified three classes: post-activity, inter-activity, and part-of-activity. These can target
any or all of the task-, process-, or self-regulatory levels. Post-activity refers to the provision of

100
a “playback” of a certain problem solving activity after the completion of the task in order to
identify strengths and weaknesses in the process (Collins and Brown, 1988). Collins and Brown
categorized four types of post-activity-reflection:
Imitation: The feedback agent here is typically a teacher who imitates what the student did
highlighting the correct and incorrect aspects and the critical moments in the process. An obvious
weakness in this approach is its dependence on the accuracy of the teacher’s imitation, and how
confident the student is about the teacher’s imitation.
Replay: A conventional video playback of the process. If supervised by a teacher (as with
imitation) correct and incorrect aspects and critical moments in the process can be highlighted.
Abstracted replay: Recordings of only critical aspects of the process, and possibly from differ-
ent perspectives. This type is particularly useful when too much data is involved, thus an abstract
replay helps in keeping the student’s focus on the important aspects of the process. The important
issue here is in finding out the right level and type of abstraction.
Spatial reification: This is a form of a static visualization of the process that displays time spa-
tially allowing the student and the teacher to identify critical aspects and moments of the process
quickly.
Although it is clear that a teacher could use video playback to provide the first two types
of reflection support, it is difficult to envisage how this might be integrated into a real-world
classroom context. However, other digital technologies, have the potential to play a very useful
role in providing all four classes of support.
Inter-activity reflective feedback refers to the induction of moments of reflection (that is, the
opportunity to pause and think about a certain action or decision) during the activity (Nunes et al.,
2003). Nunes et al. identified the types of activities that allow the integration of reflection support
to be those that comprise problems that do not have a direct path leading to the solution and
involve multiple steps and strategies. This is basically because problem solving inherently requires
reflection to make decisions about which steps to take as well as why and when they must be
employed. The benefit of such multi-stage, multi-path types of problems is that they admit the
observation of the problem solving process itself, and the construction of a set of common error
patterns. This potentially makes it possible for a digital system to identify problems and intervene
at appropriate times (usually at the boundaries between steps). Nunes et al. suggested that such
tasks should be followed with activities that encourage students to think about (reflect on) their
overall problem solving process so as to maximize the benefit gained by the learner from the
session. This can be achieved through any combination of the types of reflection that Collins and
Brown (1988) identified.

101
Part-of-activity reflection involves designing tasks to include reflective interactions as part of
the activity. In collaborative learning, such interactions include explanation, justification, and
evaluation, which are more likely to occur in collaborative tasks than in individual learning (Baker
and Lund, 1997; Dillenbourg, 1999), with peers normally playing the role of the feedback agent.
The type of problems specified by Nunes et al. (2003) can still apply to collaborative problem
solving tasks, with the additional requirement that the task be chosen to allow a space for the
above types of reflective interactions to occur.
Reflection and metacognition correspond to the “strategic and reflective thinking” element of
the model suggested by Moseley et al. (2005). As can be seen in Figure 5.1, these skills can be
employed on any of the three basic categories of cognitive skills; and feedback can be considered
as the mechanism that helps in triggering reflective thinking and metacognition.
In addition to cognition, and metacognition, other researchers (e.g. Kitchener, 1983; Schraw
et al., 2006) add a third type which Kitchener (1983) referred to as epistemic cognition (or meta-
metacognition). Kitchener considered epistemic cognition to be the highest monitory cognitive
level that individuals invoke to monitor the epistemic nature of problems, and is affected by indi-
viduals’ knowledge of the limits, certainty, and criteria of knowing. While, according to Kitchener
(1983), metacognition leads one to chose and use the different cognitive skills to accomplish a
given task, epistemic cognition leads one to interpret the nature of the problem in the task and to
consider the limits of any strategy in solving that task. Epistemic cognition is affected by the per-
sonal underlying epistemic beliefs which range from absolutism to relativism. Absolutism , which
is common among adolescents, is grounded in the belief that knowledge is absolute and that the
truth of any claim can be determined with absolute certainty. By contrast, relativism is grounded in
the recognition that interpretation of knowledge and truth depends on the context (Kitchener, 1983;
Schraw et al., 1995). Epistemic cognition is not a skill that can be easily taught or encouraged by
technology, but it is worth noting that many researchers consider it an aspect of metacognition
(Kitchener, 1983).
5.1.3 Collaboration
In Chapter 1 (Section 1.2) I talked about collaboration in terms of division of labour and how
collaboration can be supported by computers. In this subsection, I discuss collaboration from a
pure learning perspective. Learning, as several prominent theories have argued, is fundamentally a
social activity (Roschelle and Teasley, 1995) making collaboration a natural rich environment for
learning. The benefits of collaboration, and specifically between groups of peers cannot be over-
emphasized (Schraw et al., 2006; Soller, 2001; Boyle, 1997; Roschelle and Teasley, 1995; Stahl,
2006; Dillenbourg, 1999; Chickering and Ehrmann, 1996; Lehtinen, 2003). Peer collaboration, in
addition to maintaining students’ motivation, encourages verbal communication, externalization
of ideas (explaining and justifying opinions and reasoning), negotiation, and asking each others
questions. Such activities prompt for reflection, metacognition, and self-regulation. Schraw et al.

102
(2006) emphasized the advantage of collaboration between peers as opposed to teacher-student
collaboration as the former enable students to discuss strategies in the novice’s zone of proximal
development.
The construction, transmission and comprehension of explanations during group work are
important processes in the acquisition of knowledge (Ploetzner et al., 1999; Dillenbourg, 1999;
Schraw et al., 2006; Soller, 2001). This is because the individual providing an explanation has
to make explicit to others some assumptions which otherwise remain implicit, and, during ex-
planation, may identify some missing knowledge. Such missing knowledge can subsequently be
filled by deductive and/or inductive learning mechanisms (Ploetzner et al., 1999). Further more,
when an individual is explaining to others, partners may identify further missing knowledge or
inconsistencies, require further clarification, or present an alternative point of view. While these
extra activities resulting from group discussions might lead to the assumption that explaining to
others is more beneficial than explaining to oneself, Ploetzner et al. (1999) found no empirical
evidence that supports this hypothesis. I do argue, however, that students reading individually do
not usually build explanations for themselves, in contrast to collaboration, where the setting forces
the students to build such explanations, resulting in benefits to both the student explaining, and
the students receiving the explanation. Such group activities, which occur as a result of collabora-
tion, trigger group learning mechanisms that do not usually occur in individual learning settings,
including knowledge elicitation, grounding (creating common ground between collaborators), in-
ternalization (from social plane to inner plane), and the reduction of cognitive load (due to the
division of the task) (Dillenbourg, 1999).
It is important to mention that, while talk is considered as the most important resource for
collaboration, students are not wholly dependant on it in building and maintaining their shared
understandings. Non-verbal actions, and specially gestures, do also play an important role in
presenting new ideas and signalling acceptance of the ideas of others (Roschelle and Teasley,
1995). For this reason, Roschelle and Teasley (1995) identified the computer’s role in supporting
collaborative learning to be that of mediating and providing motivation for collaboration, without
negatively impacting on learners’ ability to talk and observe each other’s gestures.
5.1.4 Ill-defined and well-defined tasks
The choice of the right type of collaborative learning tasks for any learning situation is important.
The relation between the type of task and the thinking skills used for accomplishing it has been
investigated by a number of researchers (Kitchener, 1983; Schraw et al., 1995; Nunes et al., 2003).
Two basic types of tasks can be readily identified (Kitchener, 1983; Schraw et al., 1995): well-
defined tasks, and ill-defined tasks. According to Kitchener, well defined problems are defined
as “problems for which there are absolutely correct and knowable solutions” (Kitchener, 1983,
pp. 223), and hence they are constrained by having only one correct final solution, and that the
solution is guaranteed by following a specific procedure. Ill-defined problems, on the other hand,

103
are defined as “problems for which there are conflicting assumptions, evidence, and opinion which
may lead to different solutions” (Kitchener, 1983, pp. 223). Schraw et al. (1995) investigated
the relation between the type of problem and learners’ thinking skills and concluded that the
performance of learners on well-defined tasks was not related to their performance on ill-defined
tasks; and that the epistemic beliefs of the learners (absolutism and relativism, as discussed briefly
in Section 5.1.2) significantly impact on their performance on ill-defined tasks, but not on well-
defined ones. Learners holding the assumption that knowledge is absolute fail to recognize the
possibility of more than one correct solution for ill-defined tasks and try to solve such tasks using
the same strategies they use for well-defined ones.
As previously explained in Section 5.1.2, Nunes et al. (2003) suggested multi-step ill-defined
problems to allow for inter-activity reflection at step boundaries. At such points, past decisions can
be reflected upon, and upcoming decisions considered in advance. Moreover, ill-defined collabo-
rative tasks have been found to encourage part-of-activity reflection better than individual learning
tasks, due to the important feedback provided by peers in this type of problem solving (Baker and
Lund, 1997; Dillenbourg, 1999). If we are to design an application for fostering higher level-
thinking, reflection, and metacognition, and one that affords opportunities for providing useful
feedback, we must carefully choose learning tasks that are ill-defined, inherently collaborative
tasks, rather than well-defined ones.
5.2 Mysteries
Mysteries is a learning tool that “provides evidence of pupils’ cognitive processes through the
observation and analysis of pupils’ manipulation of data slips to solve the mystery” (Leat and
Nicholas, 2000, pp. 103). Mysteries falls into the collaborative, ill-defined category of problems.
With its design and open question, mysteries aims to promote higher-order thinking skills, reflec-
tion, and metacognition; and consequently serves as an assessment tool for these skills.
Paper Mysteries are usually solved by groups of two to four students. The information of the
mystery is often presented in 15-30 slips of paper (Figure 5.2) with one open question (e.g. “Should
Annie leave Windy Creek or should she stay? And why?”), which may be supplemented by closed
questions (e.g. “Has the population of Windy Creek increased or decreased since 1939?”). Stu-
dents are encouraged to use as much of the data as possible in formulating their answer. The data
in these slips can relate to a wide range of matters such as geographic, physical, and human aspects
of the subject, and normally includes the following:
• A narrative thread, which is usually about people doing things or things happening to people
to capture students’ attention.
• Contextual place/time information (referred to as trigger factors).

104
Figure 5.2: Sample slips of the Windy Creek mystery. The mystery contains 20 slips, and thequestion is “Should Annie leave Windy Creek or should she stay? And why?”
• Abstract information that is more challenging for the students to incorporate in their expla-
nation.
• Irrelevant information (referred to as red herrings). Students do not always identify the red
herrings as such, and they are included with the intention of increasing the openness and
ambiguity of the task.
Leat and Nicholas (2000) reported that researchers investigating the process of solving mys-
teries and the quality of written work about the mystery, found a relationship between the way
in which the students manipulated the mystery slips and the quality of their written work. This
lead to the conclusion that the very process of moving and grouping the data slips reflected the
cognitive processes of the students. It was also found that mysteries worked best when the task
did not have a single right answer and when the teacher played a role in supporting groups and
individuals who struggled to make progress. With many groups (but not all), the task of solving
the mystery was divided into three stages clearly marked by sudden changes in the way data was
organized. This, in some cases, was accompanied by a change of thinking before data items were
moved. Although a particular group can miss a stage, compress stages or work on two stages
simultaneously, the stages that students normally progress through are as follows:

105
The display (reading) stage: At this stage students familiarize themselves with the data. This
is done in a number of ways such as distributing the slips among the students and reading them
aloud in turns before laying them on the table, or just spreading them out on the table. The main
goal of this stage is to comprehend the data items. The thinking skills used in this stage relate to
those in the information gathering element in Figure 5.1.
The setting (grouping) stage: In this stage, the students usually organize the data into groups
with common characteristics. The variety of strategies adopted in making the associations may
reflect the cognitive abilities of the students. In general, Leat and Nicholas (2000) found that the
number of data items which the groups fail to attach a meaning to was inversely related to overall
ability level of the group; all groups, regardless of their achievement level, created a reject pile;
and that lower achieving groups tended to jump into conclusions at this stage and usually formed
large reject piles. In this stage, students are encouraged to find interpretations of data items that
go beyond their literal meaning. The accumulation of meaning attached to each item is reflected
in the physical manipulation of data items to form groups. The skills used in this stage relate to
those in the building understanding element in Figure 5.1.
The sequencing and webbing stage: Not all groups demonstrate this stage. However, the ma-
jority of the groups start to identify relations between sets of data items and between single items.
In some cases these relations are laid out in simple linear sequences comprising a casual expla-
nation. More able groups constructed relations that are non-linear, webbed patterns representing
multiple inter-relationships. In this stage, and in looking for relations between the data slips, stu-
dents use inferences that interpolate and extrapolate beyond the given data. The skills used in this
stage relate to those in the productive thinking element in Figure 5.1.
Some groups of higher achieving students progress to two additional stages that are more diffi-
cult to clearly distinguish from the webbing stage, these are the reworking and the abstract stages.
In the reworking stage some groups start to rework their layout and reconsider slips from the reject
piles. In the abstract stage the physical manipulation ceases, but as a result of having internalized
the information content of the data items, discussion continues to explore new relationships and
hypotheses.
Leat and Nicholas (2000) also used a stimulated recall session, conducted after the task, in
which a video recording for the session is played back to students and they are asked to comment
on what they were doing and thinking as they worked. This serves to both assess, and raise
students’ awareness of, metacognitive skills. This stage corresponds to the reflective thinking
skills in Figure 5.1.
In summary, “With mysteries, the physical act of moving a data item to join another to form
part of a set, a casual chain or a link between factors has to be explained to the group and often
justified. Reasoning has to be externalized, creating the conditions for shared reasoning” (Leat and

106
Nicholas, 2000, pp. 117). This means that, the process of solving mysteries encourages students
to use, and make visible, higher-order thinking skills; making it possible for teachers to observe
the development of understanding by the students during the process.
Based on observations of students’ difficulties at certain stages of solving mysteries, a number
of specific cases have been identified, and interpretations and possible interventions proposed (see
Leat and Nicholas (2000) for a detailed description of these). For example, when it is observed
during the setting (grouping) stage that students are unable to group data items, one possible
explanation is that students have inability to identify more important characteristics to inform
classification and an inability to utilize prior knowledge. Possible interventions include helping
students identify common characteristics between slips by giving them examples, and refreshing
students’ memory of past learning. Another example is when students end the sequencing stage
with unsorted groups of slips, this can be interpreted as an inability of the students to identify
sequences of events or causal relationships, and a possible action to take is to ask students about
what happened before or after a certain event in the mystery.
5.3 Computer support
5.3.1 The added value of technology
The previous sections provide a technology-independent background on learning skills, types of
learning problems and their relation to learning skills and collaboration. Technology can play
an important role in developing learning skills and improving the quality of collaboration. With
regards to feedback and reflection, for example, (Collins and Brown, 1988, pp. 4) emphasized the
importance of computer support as “a powerful, motivating, and as yet untapped tool for focusing
the students’ attention directly on their own thought processes”. Based on the well established
benefits of feedback, reflection, and metacognition to learning (Section 5.1.2), one of the main
goals of the design of the digital version of mysteries was to provide adequate reflective feedback
at the right points in time within the process. Moreover, although solving a paper mystery includes
a degree of externalization of thinking (as reflected by the layout of paper slips on the table),
in order to make students attend to their thinking process strong support is required from the
teacher throughout the process, ideally followed by a stimulated recall (video playback) session.
This is unlikely to be a practical option in most classroom settings and is an area where digital
technology, and in our case digital tabletop technology, has the potential to make a significant
impact (Nunes et al., 2003; Collins and Brown, 1988). With computer support it is also possible to
enforce a structure to learning tasks. When students are faced with a large problem solving task,
instructional design principles based on behavioural learning theory emphasize the importance of
dividing the tasks into smaller intermediate targets (Boyle, 1997). Teaching students to divide the
task of solving a mystery into smaller sub-tasks with distinguished sub-goals, helps in shaping
the students’ problem solving behaviour and encourages them to transfer this approach to solving

107
other problems. Computer support allows the enforcement of a structure on the task to help achieve
this desired behaviour. Structuring the task also plays an important role in inter-activity reflection
by making it possible to provide feedback and reflective feedback prompts at appropriate moments
in the process.
Another obvious potential contribution that digital technology can make to learning practices
is in the provision of coaching. Based on Vygotsky’s theories (Vygotskiı et al., 1978), the two
primary processes in coaching are scaffolding and fading (Boyle, 1997). Contrary to my previous
discussion of feedback, which is indeed considered as part of scaffolding, scaffolding support in
coaching is used to refer to things from the teacher’s perspective, rather than that of the learner. In
other words, with regard to coaching and scaffolding, we are interested in the roles that technology
can play to reduce the load on the teacher (rather than the student). The concept of scaffolding
is strongly related to Vygotsky’s notion of the Zone of Proximal Development (ZPD). The ZPD
refers to the difference between what a child can achieve alone and what she can achieve under
the guidance of an adult or in collaboration with more able peers. The term scaffolding refers
to this guiding role of the adult, which normally includes acquiring and maintaining the child’s
interest, establishing and maintaining focus on the task goals, providing a structure to the task,
highlighting the important features that a child might overlook, demonstrating how to achieve
goals, and helping in controlling frustrations by children when faced with complex tasks (Leat
and Nicholas, 2000; Stahl, 2006). Fading is a closely related term and refers to the progressive
reduction in the level of support, to the point where a child can solve the problem alone.
One of the key issues in computer support is the provision of scaffolding at the right time (Stahl,
2006). Applications must identify breakdowns and provide suitable information accordingly. In-
formation provided at the wrong time is perceived as an undesirable interruption and will more
likely be ignored. The design of Digital Mysteries takes this into consideration and makes use
of the enforced task structure by providing tips only when students perform a task incorrectly
and at stage boundaries. Consequently, such tips will not appear for more able students, or more
precisely, such support will fade as the students improve their problem solving strategies. It is im-
portant, however, to balance between providing structure and support for low achieving students,
and avoiding gratuitous structure and interruptions for higher achieving students.
When it comes to supporting collaboration, although the parallel interaction afforded by table-
tops is likely to lead to more equitable participation, this may not always be desirable. In some
cases, single point interaction can promote higher quality discussions; and while multi-input en-
courages shy learners to participate and reduces the dominance of one member of a group, it
reduces the likelihood of lower achieving students learning from the higher achievers (Birnholtz
et al., 2007; Do-Lenh et al., 2009; Hornecker et al., 2007). The design of Digital Mysteries tar-
gets this issue by striking a balance between parallel and single input, increasing the awareness of
participation levels, and forcing collaboration at certain moments in the interaction.

108
Computer support can also play an important role in making the students’ cognitive processes
more accessible to interpretations by themselves, and by external observers. Stahl (2006) con-
sidered the study of group cognition to be considerably easier than studying individual cognition
since students in a group “must display to each other enough that everyone can judge where
there are agreements and disagreements, conflicts or misunderstandings, confusions and insights”
(pp. 222). Although his primary focus was on network-based environments (synchronous and
asynchronous), Stahl’s account of group cognition manifests the concept of externalization as a
catalyst for useful learning. This view on the positive consequences of collaboration in making
learner’s thinking accessible is also shared by a number of other researchers (e.g. Roschelle and
Teasley, 1995; Lehtinen, 2003; Van Der Linden et al., 2000). The implication for tabletop tech-
nology is that the more an application encourages and helps students externalize their thinking, by
making it visible on the table or through discussion, the greater the probability that students will
need to explain their thinking, thereby promoting the positive learning mechanisms introduced in
Section 5.1.3. Consequently, a fundamental motivation underpinning the design of Digital Mys-
teries is the provision of tools for the students that encourage them to make visible on the table
(i.e. visible to others) as much of their thinking as possible.
5.3.2 Tabletops and computer supported collaborative learning
As argued in Section 1.2.4, the current paradigm of CSCL research excludes face-to-face collab-
orative settings and instead focuses on synchronous, or asynchronous networked environments
(Hilliges et al., 2007; Lehtinen, 2003). This demonstrates a significant shift from early research
conducted in the 1990s (Crook, 1994; Roschelle and Teasley, 1995) where the role computers
could play as tools for supporting small groups collaborating around shared computer displays
was investigated. Tabletop technology provides an opportunity to reintegrate the challenge of
providing computer support for face-to-face collaborative learning within CSCL research.
The class of computer support that I seek to explore was best described by Stahl (2006) and can
be summarized as follows: the focus is on the group rather than the individual; the activity is that of
constructing new knowledge rather than on working on, or transmission of known facts; learning
is supported by computers rather than taking place in isolation; the interaction is collaborative and
not competitive or accidental; and finally its orientation is on discussion, debate, argumentation,
and deep understanding and not on drills or practising elementary facts.
My goal is to utilize the unique affordances of tabletops that distinguish the technology from
traditional computer-based learning settings in the following:
• Supporting learners’ thinking skills in particular their higher order thinking skills, metacog-
nition and reflection. This is achieved by:
– Selection of an appropriate class of collaborative task. I have selected Paper Mysteries
which is inherently a collaborative task that focuses on higher level thinking skills and

109
metacognition. At the same time, mysteries satisfies the criteria suggested by Nunes
et al. (2003), Baker and Lund (1997), and Dillenbourg (1999) for supporting inter-
activity and post activity feedback and reflection opportunities.
– Supporting reflection, which (with the help of the supervisor) can make the students
aware of their metacognitive skills.
– Supporting activities and behaviours which, according to the theories of learning, in-
crease the probability that useful learning mechanisms occur. For example, encourag-
ing externalization and structuring the task.
• Providing useful and timely feedback to the students.
• Reducing the level of support required from teachers and classroom assistants by the provi-
sion of scaffolding and fading.
• Encouraging effective collaboration by switching between multi-synchronous input, single
input, and enforced collaboration, in addition to visualizing participation levels.
The design also ensures that it does not impose any restrictions on the students’ non-verbal
communication. This is achieved by selecting a technology that does not limit the students’ move-
ment (i.e. force students to sit or stand in fixed positions as in the DiamondTouch table (Dietz and
Leigh, 2001)), and by using interaction techniques that are orientation independent and that can
be used from any location.
5.3.3 Evaluating the benefits of computer support
Studies investigating the impact of thinking skills (Higgins et al., 2004; McGuinness, 1999) showed
clear evidence of their positive effect on students’ achievements in both curriculum and non-
curriculum measures. These studies emphasized the need to teach thinking skills in the curriculum
with a metacognitive prospective, and to encourage collaborative learning. Higgins et al. (2004)
made the important point that the improvement in the students may not be immediately apparent,
and that there may be a significant delay before the effects start to be reflected in tests and exams.
Crook (1994) made similar claims in relation to the evaluation of the impact of computer tech-
nology within education, that such evaluation should go beyond input-output tests and should be
measured within the broader patterns of use. Accordingly, I chose not to base the evaluation of
the developed tabletop application on pre-test and post-test learning measures. Instead I sought to
validate that the application satisfies its design goals in encouraging activities that utilize and teach
thinking skills (e.g. encourage externalization of thought and therefore increase the opportunities
for useful discussions); encouraging collaboration; and providing reflective feedback.

110
5.4 Distributed cognition as a design framework
Digital Mysteries is a collaborative learning tool used by a small group of students working around
a digital tabletop. This group of students is usually supervised, and possibly assessed, by a teacher.
The elements involved in this case include the students, the tabletop, and the teacher. The desired
outcome is not just the final solution of the problem, but also the building of knowledge during
the process. To inform the design of such a complex system, it is not possible to think in terms of
traditional HCI design guidelines, or even digital tabletop design guidelines as these mostly focus
on the interaction aspects of the design and overlook the cognitive, social, and organizational
aspects that are involved (Rogers and Ellis, 1994). Looking at this system from the perspective
of distributed cognition theory (described in Section 1.3.2) (Hollan et al., 2000; Rogers and Ellis,
1994; Norman, 1993; Halverson, 2002; Nardi, 1995), on the other hand, brings into focus the
functional system, its inputs and outputs, the intermediate representational forms, the goal and
background of the activity, the available resources, and any environmental factors that contribute
to the accomplishment of the task (Perry, 2003). When designing a system for a classroom, we
cannot realistically control the people or the environment, but we can control the elements of the
resources that include the tools, and the representation states involved. The aim is that with a
good design, the system will positively affect the people and the work environment leading to
better interactions and enhanced learning. Distributed cognition theory (DC) was therefore used
to guide the design and evaluation of Digital Mysteries. Halverson (2002) highlighted the weak
descriptive power of DC, compared to such theories as activity theory, which limits its rhetorical
force when used to communicate a work setting or an implementation that is guided by the theory.
He also highlighted the difficulty in applying the theory to actual settings. Therefore, even thought
the effect of DC on the design of Digital Mysteries might not be very clear, its underlying concepts
motivated different aspects of the design and evaluation of the application. Among the aspects of
DC that had direct influence on the design are
• Making use of the concepts of externalization, representation states, and cognitive tools
to think of how it is possible to design tools that encourage students to externalize their
thinking into persistent representations states that are more accessible to external observes,
and that can be logged by the system.
• The importance of utilizing the space, in this case the tabletop surface, to share the cog-
nitive load. As discussed in Section 2.2.1.1, the space can be used to simplify perception,
choice, and internal calculations, and also to structure and mediate collaboration. There-
fore, DC highlights the importance that the persistent representations states be ones that are
manipulable on the table surface.
• The importance of looking beyond the tangible outcomes of the process, and to look at the
verbal and non-verbal behaviour of the people involved during the process as an important

111
part in the collaborative process (verbal and non-verbal behaviour of people around tables
from a DC perspective is discussed in Section 2.2.2). Maintaining barrier-free visual and
verbal communication channels, and allowing students the freedom of movement around
the table, were therefore other main design goals of Digital Mysteries.
The concepts of cognitive tools and representation states had direct implications on the design
of Digital Mysteries and are therefore discussed in more details below.
5.4.1 The Tools
Digital Mysteries was developed for a top-projected prototype, multi-pen, horizontal Promethean
Activboard (1024 × 768 resolution) specially developed for the application. Activboard uses a
solid front projection surface which students can (and do) safely lean on, giving it many of the
physical affordances of a real table. The board reacts to three battery-free pens that look and feel
like normal whiteboard pens. The two principal physical tools involved in Digital Mysteries are
the table and the pens. In designing the application we anticipated its use on either a pen-based or
a touch-based platforms. Consequently, for the pen-based Activboard we focused on maintaining
direct touch interaction and the use of an interaction technique suitable for both pen-based and
touch-based input.
The social affordances of traditional tables as outlined in Section 1.4.1 underpin the collab-
orative learning environment. These affordances establish the conditions for effective learning
activities, including conversation and argument, by allowing people to have fluid, face-to-face,
barrier free communication. The horizontal surface of the table allows physical support and pro-
vides a space that can be used to reduce cognitive load (Hollan et al., 2000). Moreover, tables
allow people to use the surface to structure and mediate group collaboration (Tang, 1991; Kruger
et al., 2003; Scott et al., 2004). Implementing Digital Mysteries in a traditional computer setting
whether using a desktop computer, an interactive whiteboard, or even a network based solution
means sacrificing many or all of these qualities. The unique advantage of digital tabletops is that
they maintain many of the benefits of traditional tables, yet allow for the addition of digital func-
tionalities afforded by traditional desktop settings, such as structuring the task, logging, and feed-
back, in addition to digital functionalities afforded only by tabletops such as multi-synchronous
input and direct-touch interaction (see Section 1.4.2). As well as the pen and table as physical
tools, the design of Digital Mysteries uses a number of virtual tools (e.g. grouping, post-it note,
and sticky tape tools) to satisfy the design goal of externalization (these are discussed in detail in
the following sections).
5.4.2 Representation states
The approach used by DC to understand interactions between people and technology is to study
the transformations of representation states during the process. DC places a clear emphasis on

112
representation states and their importance to cognition. Representation states are not necessarily
bound to material objects, but may be mental representations, audio representations expressed in
conversation, or physical movements such as gestures. Representation states are transformed by
tools. Thus a mental representation may be transformed into a written note on a piece of paper. The
concept of cognitive tools, and how they can be used to make mental representations accessible
to interpretations, played a significant role in shaping the design of the externalization tools for
Digital Mysteries.
5.5 Mysteries: from Paper to Digital
An iterative design process was used in the development and refinement of Digital Mysteries. In
the first exploratory study, I monitored students solving both a Paper Mysteries problem and a
very basic digital version of the paper task. Based on observations from the first set of trials and
using theories and concepts of learning, collaborative learning, and computer supported learning,
a second version of Digital Mysteries was developed for which I used distributed cognition as a
framework to translate these theories and concepts into digital features and functionalities. The
third digital version was a refinement of the second version and was an incremental response to
the different issues that arose from the analysis of the application in use and the behaviour of the
students that used it.
5.5.1 First iteration: design
The first stage in the iterative design process included an exploration of how students solved a
paper mystery “in the wild” (i.e. in a real school) and how this might differ from their use of a very
basic digital version of mysteries. The digital version was in effect a direct digital translation of
Paper Mysteries with a basic set of features for moving, rotating, and resizing the digital versions
of the paper slips. These actions were all performed by clicking or dragging on icons located at the
corners of the slips (Figure 5.3). To overcome the projector’s low resolution, slips were by default
displayed at a relatively small size (so that all the slips would fit on the display) but this led to the
text on some of the slips being too small to read. The application provided an enlarged size for
each slip at which scale all the details were clearly legible (Figure 5.4 shows the slips with the one
in the centre in enlarged size). The application also allowed learners to draw on the background
with the pen. While in most Paper Mysteries all the slips contained purely textual information, the
mystery used in these trials contained some slips that were enriched with pictures in addition to
text, with a view to making the mystery more visually engaging. The same slip designs were used
in both the paper and the digital versions, but in the case of the digital version, and for slips with
a lot of details, only the enlarged size showed all the details clearly.

113
Figure 5.3: Slip manipulation icons for the first version of Digital Mysteries.
Figure 5.4: A screen capture for the first version of Digital Mysteries showing slips in normal size(which is not always readable) and one enlarged slip in the middle.

114
5.5.2 First iteration: trials and observations
Two paper-based trials, and two digital trials, were conducted with four different groups of three
students each, aged 11-13 years. The duration of the sessions ranged from 45-60 minutes. The
main goals of these trials were to understand the general behaviour of students in solving mys-
teries, identify breakdowns in the process, examine how well the layout of the slips reflects the
thinking of the students (level of externalization), and to make general observations to guide the
initial design. Observations were made on the basis of repeated viewing of video recordings of
the sessions.
5.5.2.1 General layout and externalization
The layout of the paper slips during the the process of solving the mystery reflected little of what
the students were thinking. Paper slips were scattered into a small number of piles and adjacent
slips. It was not clear whether paper slips next to each other formed a sequence, a pile that
was intentionally organized in this way, a red herring pile, or simply a bunch of unattended slips
(Figure 5.5). In a discussion with the students after the trial, one student said “we read them lots
and we had them in our heads so we were moving them around in our heads.” Students frequently
used terms like “these” and “those” to refer to the groups (which were not named) and unless the
other students were paying attention to associated deictic gestures, misunderstandings occurred.
This also meant that the teacher could not understand the layout without closely monitoring the
students behaviour, or explicitly (and repeatedly) asking them about it, for example, consider the
following exchange at the end of one of the sessions:
teacher: tell me a bit more of what this bit is about?
student: that’s about the car
teacher: and what this bit is about?
student: about the dangerous corridor
For the digital version, the layout was also not readily understandable to an external observer.
Students created only one or two collections of slips in each session and created numerous scrib-
bled annotations on the table for which original references were quickly lost as slips were sub-
sequently manipulated (Figure 5.6). This also meant that it was not easy for the teacher to know
what the students were doing and she had to ask them to explain their actions so as to identify
when scaffolding was needed.
teacher: what are you trying to do right now, are you trying to link them?
student: just try getting them into groups and then we will start linking them

115
Figure 5.5: Paper Mysteries: first iteration (at the final stage of solving the mystery for the twogroups). It is difficult to understand what the students are thinking by just examining the layout.
Figure 5.6: Digital Mysteries: first iteration (at the final stage of solving the mystery): It is noteasy to understand the layout. The background annotations lose their meanings as the slips aremoved.
5.5.2.2 Breakdown moments
For the paper version, when discussing paper slips that were part of a sequence or a group, and
due to the slips’ small size, students felt the need to pick the slips up to bring them into focus. In
one case a group lost the red herrings pile and had to re-examine the groups to locate it. In another
case an accidental movement scattered the layout and students had to re-work it again.

116
For the digital version students made use of the ability to write and mark areas on the back-
ground. They drew circles around grouped slips, named the groups, drew lines and arrows to
connect slips, and wrote short notes. However, drawing on the background lost its value (and
caused confusion) when the group or some of its slips were moved, leaving empty circles, or con-
necting lines that either pointed to empty space, or to the wrong slips. Drawing was a light-weight
action, but did not prove to be useful as the drawing action, whether for writing or drawing lines,
went unnoticed by other students and did not result in discussion. Nevertheless, a clear need to
define relations, distinguish groups, and mark slips with certain comments was established.
From an interaction perspective, we noted that students had difficulty in targeting the small
icons on the corners of the slips to resize or rotate them. Point-and-click did not appear to be an
appropriate type of interaction.
5.5.2.3 Common observations between paper and Digital Mysteries
For both the Paper and Digital Mysteries, it was clear that the students did not have suitable tools
to encourage and help them externalize their thinking. There was no clear distinction between
the reading, grouping, and webbing and sequencing stages that higher achieving students usually
go through in solving Paper Mysteries. Students started grouping as they were reading, and paid
little attention to the (most important) webbing and sequencing stage. Other than some small
sequences, many slips were not considered to be part of the solution. One group using the Digital
Mysteries did not perform any sequencing and stated their conclusion as soon as they finished
grouping. The digital version added little to the learning experience, and in both cases students
had to be monitored very closely by the teacher in order to understand what they were doing and
to assess their level of thinking. This left little opportunity for students to reflect on their work (a
task that had to be driven entirely by the teacher).
Regarding equity of participation, without careful continuous observation of the groups, it was
difficult to know if group members were participating equally, if a group member was dominating,
or if a group member was under participating. As for utilizing the physical affordances of the table,
in both the digital and paper cases students lent on the table much of the time and moved around
it as they worked. Maintaining the ability to lean on the table and not restricting the students’
mobility were thus considered among the design goals for the second version.
5.5.3 Second iteration: design
5.5.3.1 Interaction technique
The initial trials identified the difficulty that students had in targeting small icons using a point-
and-click-like interaction technique. The crossing-based polar gates introduced in Chapter 3 (see
Section 3.4.2) on the other hand, proved to be easy to learn and use, and were thus incorporated in
the second iteration. I used a modified form of the polar gates technique (Figure 5.7) as a unified

117
Figure 5.7: Slip manipulation with a crossing-based polar menu: (a) a menu is displayed for aniconic slip by a press-and-hold operation; (b) a slip enlarged to normal size by crossing down; (c)the outer ring is rotated to rotate the slip.
interaction technique for all slip manipulations and tool selection. I also noted that in the first
trial of the Digital Mysteries, students used the enlarged size to both read the slips and as a way
of attracting the attention of other students (i.e. a role similar to picking up a paper slip to bring
it into focus). When a slip is enlarged it occupies a large area of the table’s surface making it
easy for all the students to read the slip and discuss it (this was a clear advantage of the digital
version over Paper Mysteries). I also noted that students iconified slips both when they felt they
were not important, or when they had internalized their contents. Manual resizing to other than
the iconic, normal, and enlarged sizes was very rarely used. I therefore decided to support only
three sizes for the slips: iconic size, normal size (readable but not always showing the full details),
and an enlarged size (full details), and removed support for manual resizing (Figure 5.8). Starting
with this stage, all the slips in a digital mystery, must now contain some visual clues (images or
backgrounds) that help the student uniquely identify slips even when they are displayed as icons
and their textual contents are not readable. This also helps in making the mystery more interesting
and engaging for the students (compared to purely text-based slips).
5.5.3.2 Externalization and cognitive-tools
Guided by distributed cognition theory, in the second iteration I sought to create a set of cognitive
tools that would help transform students’ internal representation states to forms observable on the
table. In particular I wanted to make specific the groups and relations that the students are thinking
of in addition to allowing the students to externalize other thoughts in the form of textual notes.
For this I added a grouping tool, a relation tool, and a post-it note tool (Figures 5.9 and 5.10).
The grouping tool was introduced to make the action of grouping more explicit by eliminating
cases in which students just pile up slips without thinking explicitly of what the piles represent.
The use of the tool also makes clear the difference between attended and unattended slips at the
grouping stage. By selecting the grouping tool, the application creates an empty group and asks

118
Figure 5.8: The three display sizes for a slip: iconic, normal, and enlarged: (a) the clock in theiconic size serves as a clue to the slip; (b) the normal size shows all the details in this case; (c) theenlarged slip serves to attract attention, and in some cases to show extra details.
for a name to be assigned to this group. When the group dialog box appears, a soft keyboard is
maximized, and the application stops all other interaction so as to focus all the students’ attention
on the activity of creating the new group. Groups are represented by semi-transparent, re-sizable,
rectangular areas. A slip is made part of a group by dragging it inside the group area. The grouping
tool, thus, is used to help in building a representation state that emphasizes the students’ analysis
and classification skills.
The relation tool allows students to mark tightly related slips or to build a sequence. When
selected, a small sticky-tape-like shape is created on the table. If the sticky tape is placed on two
adjacent slips, it becomes clear that these two slips are related. Slips that have been associated
together by the grouping tool or the relation tool are moved and rotated together. The relation
tool is introduced to help in building a representation that emphasizes reasoning and models of
causation which require higher level skills than those utilized using the grouping tool. The post-it
note tool aims to encourage students to record their thoughts for themselves and for others. When
the post-it tool is selected, a small post-it-like rectangle appears on the table and the soft keyboard
is enlarged. Notes can be manipulated (rotated, re-sized, grouped, or sticky taped to another slip)
just like normal slips. The group, sticky tape, and note tools, in addition to prompting for building

119
Figure 5.9: The polar menu and the tools introduced in version 2 of Digital Mysteries.
Figure 5.10: The cognitive tools: group (dark blue area); note (yellow slip), normal (no arrow)and directional (for the sequencing stage in the final version) sticky tapes. Slips are shown in theiriconic and normal sizes.
different representations of the same problem, and in making the thinking of the students visible on
the table, create a space for discussion, explanation, and disagreement around the act of creating
and using them.
5.5.3.3 Structuring the task
When a group of higher achieving students solve a paper mystery, they typically do so in three
stages: reading the slips, grouping the slips, and putting the slips in branched sequences (Leat and
Nicholas, 2000). The last two stages correspond to two different perspectives of the problem, or in
terms of DC theory, two different representation states for the problem; the first in terms of rela-
tions and categories and the second is in terms of time sequences and models of causation. These
transformations help the students clarify and elaborate on their reasoning. Moreover, reading and
understanding the slips in stage one, grouping and organizing the slips in stage two, and finding

120
time and cause-and-effect relations in stage three correspond to the three main categories of cog-
nitive skills classified by Moseley et al. (2005): information gathering, building understanding,
and productive thinking (Figure 5.1). The second iteration of the Digital Mysteries design aims to
emphasize these tasks, and enforce these different representation states, by dividing the applica-
tion into stages. This division enforces a structure on the task which in turn has its own learning
benefits (Dillenbourg, 1999; Boyle, 1997; Jermann et al., 2001). For each stage, the application
displays a set of clear and simple instructions about what is required from the students, and how
to proceed to the next stage (Figure 5.11 shows the modified instruction dialogs that appear at the
beginning of each stage for the third version of Digital Mysteries).
The reading stage starts with all the slips displayed as icons and does not provide any tools
other than the slip manipulation tools. When the application detects that all the slips have been
enlarged at least once, it assumes that all the slips have been read and moves on to the next (group-
ing) stage. The grouping stage makes three externalization tools available: the grouping tool, the
sticky tape tool, and the post-it note tool. Other tools are provided: a save/restore tool, a help tool,
and a participation meter tool. The grouping stage ends when all the slips have been grouped.
Two pre-defined groups are provided: a red-herrings group and a background information group.
Empty groups, sticky tapes, and post-it notes may be deleted by throwing them into a trash area.
When the last ungrouped slip is placed into a group, the application moves to the final se-
quencing and webbing stage. This stage does not provide new tools, and what is required from
the students at this stage is to use the same tools (mostly the sticky tape tool) to arrange the slips
in a branched sequence layout that reflects their reasoning – showing the sequence of events and
cause-and-effect relations. This stage finishes when the students agree amongst themselves that
they have completed the task. The aim of the save/restore tool is to allow students to store their
current layout, try other layouts, and revert to the previously saved layout if desired. The help tool
provides grouping tips if used during the second stage, and sequencing or general mystery-related
tips if used during the third stage. Finally the participation meter shows pie charts indicating the
proportion of the different actions that is due to each student, these include slip manipulation,
grouping related actions, notes related actions, and relation related actions (Figure 5.12). With
regard to slip manipulation, each act of movement, rotation, or resizing of a slip is counted as one
action. For grouping, each act of creating/deleting a group, adding a slip to a group or removing
a slip from a group is counted as one action. Similarly for notes, each act of creating/deleting a
note or modifying note content is counted as one action. Finally for relations, each act of creating
a relation, or modifying a relation by adding or removing a sticky tape is counted as one action.
5.5.3.4 Supporting collaboration
As discussed in Section 5.3.1, Digital Mysteries aims to strike a balance between providing sin-
gle and multiple access points, in addition to forcing moments of collaboration and increasing
collaboration awareness. The application allows multiple-synchronous input for normal slip ma-

121
Figure 5.11: The introductory dialogs that are displayed at the beginning of each stage. ThisFigure shows the simplified version of the dialogs as used in the final version of Digital Mysteries.

122
Figure 5.12: A screen capture showing the statistics dialog, grouped slips, the participation piechart at the top left corner, and the soft keyboard.
nipulation, but when the “create new group” command is selected (by any student) the application
disables all kinds of slip manipulation interactions, and displays a single soft keyboard on the
screen. Here the aim is to attract all the students’ attention to the act of selecting a group name,
therefore creating opportunities for discussion and negotiation and preventing such important acts
from going unnoticed. Moreover, when any of the introductory, help, or statistics dialogs appear,
they show three “OK” buttons one for each student. A dialog does not close until each of the
students presses his/her corresponding button to ensure that all students fully read (and agree on)
the contents (Figure 5.12). Finally, throughout the task, the application shows a general participa-
tion meter, a pie chart at the top left corner of the screen (Figure 5.12) that shows the percentage
of participation of each students based on the total time the pen of each students is dragged over
the table. Although this is not a very accurate measure, it serves as a general indicator to the
level of participation of each student, and therefore can also be considered as a tool that promotes
reflection on the group process.

123
5.5.3.5 Scaffolding, feedback and reflection
Scaffolding, as discussed in Section 5.3.1, includes the provision of feedback and therefore the
induction of reflection on the side of the students. To recap, scaffolding includes maintaining the
students’ interest and focus on the task goals, providing structure to the task, highlighting im-
portant aspects during the process, explaining how to achieve goals, and controlling frustration.
Maintaining students’ interest in the task can be achieved by the mere presence of technology.
Using new technology, in particular digital tabletops, was found to play a significant role in main-
taining students’ interest and motivation to complete a given task (Piper and Hollan, 2009; Do-
Lenh et al., 2009). The structure enforced on the task, in addition to serving the goals discussed in
Section 5.5.3.3, can also be considered part of the scaffolding that would normally be provided by
the teacher. Moreover, dividing the task into stages, allows for the provision of simple instructions
at the beginning of each stage which can serve to maintain the students’ focus on the final goal
and sub-goals, and highlights the important aspects in the process. Finally, the provision of help
upon request aims to support the students at moments of frustration.
5.5.4 Second iteration: trials and observations
For the trials of the second iteration prototype, the Activboard hardware was integrated into a large
custom made table (Figure 5.13). The table was made large enough (185cm× 140cm, and active
display area of 160cm × 120cm) and rigid enough to provide the same physical affordances as a
normal collaborative table. The table was installed in a local high school where I ran six sets of
trials with six groups of three students (age range 11-13 years). Three new mysteries, of different
levels of difficulty, were created for this purpose and assigned to groups based on advice from the
teacher and her knowledge of the achievement levels of the students. The trials at this stage aimed
at validating the design decisions, spotting weaknesses in the design, evaluating the interaction
technique, and provide guidelines for the final design. All the trials where video recorded and the
analysis was conducted by repeatedly watching the recorded sessions and reflecting on them. A
fully detailed analysis is reserved for the final design.
5.5.4.1 Interaction technique
Students did not have any difficulty learning and using the interface, including the crossing-based
polar gates interaction technique. With directions from the teacher, students typically spent 5-10
minutes to learn about mysteries in general, and features of the Digital Mysteries application in
particular. Students worked from all sides of the table, demonstrated a degree of mobility (around
the table) and used the orientation technique to rotate slips in different directions. Students even
created multiple sticky tapes by repeated crossing without being informed of this capability. No
requirements for further improvements on the interaction techniques could be identified.

124
Figure 5.13: A custom made tabletop with a Promethean Activboard embedded inside it.
5.5.4.2 Externalization and task structure
Grouping stage: Students were required to create groups, but no limitations were enforced as
to the number and naming of the groups. Consequently, the number of groups created and their
assigned names varied significantly between the groups. Four of the six student groups created
only one or two new groups, while another group of students created five new groups in addition
to the red herrings and background information groups. Group names also ranged from “g1”
and “g2”, to more descriptive names such as “reasons 4 being late”. The sticky tape tool was
very popular and most students used it with some enthusiasm to associate strongly related slips.
Different student groups used notes to different extents, with one group using none and another
creating 8 notes during the session. When used, the notes gave a clear picture of what the students
were thinking of. However, this was more true for groups identified as higher achieving by the
teacher, while low achieving students created fewer groups, used less analytical names, made
fewer relations, and wrote fewer notes. This observation showed a clear correlation between the
extent of using the tools (level of externalization) and the attainment level of the students.
Sequencing stage: A clear need for improvement in the sequencing stage was made evident by
the weak performance of most of the groups in this stage. Only two groups created appropriate
sequences (with some branches). One group created a linear sequence without any branching, and

125
the other three groups did not create any kind of sequence. Two of these three groups created
piles of slips with sticky tapes on them, and the third left the slips unattended in their groups.
Nevertheless, this showed that the application made the distinction between higher and lower
achieving groups (as previously identified by the teacher) readily observable.
5.5.4.3 Collaboration
An examination of the percentages of interaction times for each student for the six groups showed
that for two groups two participants dominated the sessions with percentages slightly exceeding
50%. No participant showed a percentage of less than 10% although in two groups two participants
came close to (about 12%). Nevertheless, there was no evidence from the video logs of the six
sessions that any of the groups seemed to make note, or take account for the participation pie chart.
The small size and the location of the participation pie chart is one possible reason for this.
5.5.4.4 Scaffolding, feedback, and reflection
The role that the technology played in maintaining the students’ interest was very obvious. Stu-
dents expressed their full engagement in the process and their surprise that the task actually lasted
45 to 60 minutes. The instructions given at the beginning of each stage were found to be very
useful in maintaining the students focus on what was required from them at each stage, but the
need for simplifying the instructions even further was identified (Figure 5.11). The help feature,
on the other hand, was not used by any of the groups. Consequently, I specifically asked one of
the lower achieving groups who were struggling with the exercise to use the help feature, but the
students went over the tips quickly without paying attention to their contents or benefiting from
using them.
5.5.4.5 Other observations
None of the groups used the save/restore functions. When the teacher asked the students about
their answer to the mystery, they did not seem to fully agree on one and only found the need to
discuss a common answer upon the teacher’s request. Finally, the students utilized the physical
affordances of the digital table just as they would a normal table. Students lent on the table and
moved around it freely during the task.
5.5.5 Third (and final) iteration: design
Most aspects of the tools provided in the second iteration were successful in satisfying the design
goals, but still more improvements can be made, particularly for lower achieving groups. The
principal goals of the final design were to (1) encourage students to undertake more extensive and
explicit grouping of the slips; (2) encouraging students to do proper sequencing and webbing; (3)
provide more effective and integrated scaffolding for low achieving groups; and (4) add explicit

126
support for reflection and help students become more aware of the problem solving strategies they
have employed.
Figure 5.14: The grouping stage showing the group rating traffic light.
5.5.5.1 Improvements in the grouping stage
When it occurred, the act of creating a group and giving it a descriptive name was found in many
cases to trigger useful moments of discussion. For the new version, students are asked to create at
least four new groups in addition to one pre-defined red herrings group. Group names are required
to have at least three letters; otherwise, the application reminds the students to use meaningful
names. To increase the students’ awareness of the quality of their grouping, a traffic-light-like
presentation of the quality of the grouping was added, with a rating based on the number of
groups that contain two or more slips (Figure 5.14). If the students put all the slips in less than
four groups, the application gives feedback in the form of a dialog informing the students that
their grouping is not good enough (to induce reflection). The application also provides tips, in the
form of a post-it note, as to what other possible groups might be, based on meta-data associated
with the mystery (Figures 5.15 and 5.16). The save/restore and participation meter tools from the
previous iteration were also removed as they were not used in previous trials, retaining only the
grouping, post-it, and sticky tape tools (Figure 5.17). The help tool is also removed and instead,

127
reflective feedback was provided automatically at the boundary between stages when a need for
help is detected.
<?xml version=’1.0’ encoding=’utf-8’?><helpData>
<theQuestion>Should Annie leave Windy Creek or should she stay?And why?
</theQuestion><mustBeTogether>
<g>3 9 12</g><g>4 8 15</g><g>11 14</g>
</mustBeTogether><hints>
<h>You can build a sequence about Windy Creek by starting withslip number 16, then slip 7, then slip 1, and continue.
</h></hints>
</helpData>
Figure 5.15: A sample xml file that is included with each mystery to provide meta-data aboutthe mystery. The application makes use of the related groups defined in the “mustBeTogether”element to provide grouping tips. In this sample, slip numbers 3, 9, and 12 are closely linked andare expected to be in one group. The same for the other two group sets (4, 8, and 15) and (11 and14). Hints on how to start a sequence is taken from the “hints” element.
Figure 5.16: If the students put all the slips into less than 4 groups, they are provided with feedbackon how to improve their grouping and a tip in the form of a post-it note on possible relations thathave been overlooked by the students.
5.5.5.2 Improvements in the sequencing stage
In addition to the normal sticky tape tool, I added a directional, arrow shaped, sticky tape tool (see
Figures 5.10 and 5.17) with the assumption that its shape would more strongly imply a sequence
or a cause-effect relation, and that the normal sticky tape would be used only to mark strongly
related slips. The provision of two options to relate slips, which aims to encourage students to
reflect more on the type of tape to use, is a good example of how DC theory (and its use in
interpreting observations of use) can drive tool development. I also added a finish tool (Figure

128
Figure 5.17: Slip manipulation using the polar menu (a modified version of the Polar Gates –Chapter 3): the inner ring allows for switching between iconic, normal, and large sizes; and theouter ring is used for rotation (left). The group, sticky tape, and note tools available in stage 2(middle). Group, sticky tape, directional sticky tape, note, participation charts, and finish toolsavailable in stage 3 (right).
Figure 5.18: Sequence evaluation dialog. Students are asked to select a layout that resembleswhat they have done, and all students have to confirm by pressing their own OK button. Tips areprovided if students select the piles or linear sequence option.
5.17) as in the previous versions students had no way of signalling the completion of the final
stage. The absence of a way to signal completion of the task, left the process open-ended and the
teacher usually had to end the session.
The changes to the sequencing stage were designed to address the observations of the previous
prototypes that many students completed the sequencing stage with either a number of piles or a
linear (i.e. non-branching) sequence. The layout that the students are encouraged to construct, and
which higher achieving students usually build is a branched sequence corresponding to a more
complex mental model of causation. When students select the finish tool to end the sequencing
stage, they are presented with a dialog showing three images of different layouts: a number of
piles, a linear sequence of slips, and a branched sequence (Figure 5.18) and they are asked to

129
Figure 5.19: Upon selecting the piles layout, students are provided with feedback on how toimprove the sequence and a tip in the form of post-it note suggesting a possible sequence to startwith.
Figure 5.20: Upon selecting the linear layout, students are provided with feedback on how toimprove their layout to a branched one.

130
select the layout that most resembles their own. Again, each student has to confirm the selection
independently. If the layout chosen is not the branched sequence, hints on how to improve the
sequence, based on mysteries meta-data, are provided in the form of a post-it note and the appli-
cation resumes the sequencing stage (Figures 5.19 and 5.20). If the students select the branched
sequence, stage three ends. A design decision had to be made here on whether to have an algo-
rithm in the application analyse the layout (piled, linear, or properly branched) and provide tips
accordingly, or to leave it up to the students to select among a list of possible layouts. Giving the
students the option to do this analysis themselves encourages them to reflect on their solution and
opens a space for discussion as to which layout most resembles theirs, making this approach more
effective.
Finally, in the second prototype, even when some groups indicated that they had finished the
task, it turned out that the students had not actually agreed on a common answer. In the new design,
I sought to encourage the students to discuss their answers and settle on a common conclusion by
asking the students to write down a single answer and independently confirm it (Figure 5.21).
Figure 5.21: The answer dialog requires the students to write down their answer and independentlyconfirm it, opening space for discussion to agree on one answer
5.5.5.3 Collaboration
Based on the observations of use of the second prototype that the participation meter (pie chart)
did not attract enough attention, I improved the pie chart by doubling its size when the percentage
of any of the participants drops below 10% or rises above 50%. Moreover, the pie chart was placed
at the centre of the edge the table along which the projector is mounted (i.e. the top edge) rather
than in the top-left corner.

131
5.5.5.4 The new reflection stage
To support post-activity reflection, as suggested by Collins and Brown (1988) and Nunes et al.
(2003), one extra stage (referred to as the reflection stage) was introduced after the students write
down and confirm their answer. The stage allows an abstracted replay of the whole session in
addition to a simple static representation of the main points. With the supervision of the teacher,
feedback on the task, process, and self-regulation levels can be provided aiming at prompting
reflection and metacognition on the part of the students to maximize the benefit from the learning
experience.
Logging, and consequently playback of the session is designed to provide a certain level of
abstraction to the task. A recording of the session is made by logging only the initial and final
stages of the actions. That is, when a slip is moved from one point to another, for example,
only the initial and final locations are logged and not the whole movement. This allows a very
quick playback of the session showing only actions without intermediate movements or idle states
(which constitute the vast majority of the duration of a session). This makes it possible to replay
a comprehensible recording of a one-hour session in 5 to 10 minutes depending on the selected
playback speed.
The reflection stage is controlled using a reflection dialog. The reflection dialog (Figure 5.22)
is designed to provide a simple, static visualization of the whole session. The progress bar is
divided into three parts, each represents the duration of the corresponding stage, in addition to
displaying the actual duration of the stage and the duration of the whole session. The bar also
shows bookmarks indicating critical moments in the process (Collins and Brown, 1988) at which
the application provided hints to the students during the grouping or sequencing stages. The dialog
also shows four screen captures of the layout, at the beginning of the process and at the end of each
stage, so that it is possible to quickly get a general sense of how the students progressed. Clicking
on any of the images, or the bookmarks, moves the progress bar to that point in the session so the
teacher can also quickly identify and facilitate discussion about key moments in the session.
An important feature of the reflection stage is that it is possible to pause the playback at
any point in time and manipulate the slips as in a regular session. This allows the teacher and the
students to discuss and actually explore different scenarios such as creating an additional group, or
modifying a certain sequence. Being able to watch a quick playback of the whole session increases
students’ awareness of their problem solving strategy and with proper guidance from the teacher,
students can realize their mistakes and work on improving their strategy in later sessions (Collins
and Brown, 1988; Nunes et al., 2003). This reflection stage is similar to the stimulated recall
session suggested for the Paper Mysteries (Leat and Nicholas, 2000), but with Digital Mysteries,
this can be conducted far more easily and flexibly (and without the need for video recording). With
the reflection dialog controls, this session becomes an integrated part of the learning experience
using the same medium through which the task was performed.

132
Figure 5.22: Reflection stage control dialog. The four images show the layout at the beginningof the mystery and at the end of each stage. The progress bar distinguishes each stage with adifferent colour, and the small white arrow on the progress bar highlights an important moment(in this example where a sequencing tip was provided). Clicking on any of the images or thearrows, moves the recording to the corresponding point in time.
5.6 Summary
One of the main objectives of this thesis is to investigate the support of tabletop technology for
collaborative learning. I sought to focus on higher-level thinking skills, reflection and metacogni-
tion as these benefit greatly from the face-to-face collaborative environment afforded by tabletops.
For the purpose of this investigation, I chose the mysteries paper-based learning tool as it satis-
fied the requirement of the ill-defined collaborative learning tasks that best nurture the targeted
learning goals. Through an iterative design process and with the use of the distributed cognition
framework with its focus on cognitive tools and representation states, I developed Digital Mys-
teries as a model for tabletop collaborative learning applications. In addition to making use of
the functionalities made possible by digital technology in general, such as enforcing structure to
the task, logging, and providing feedback, the design also makes use of the unique features af-
forded by tabletops such as direct manipulation, structuring the interaction and collaboration, and
preserving the face-to-face collaborative nature of traditional tables.
The overall structure enforced on the task corresponds with the thinking skills framework
proposed by Moseley et al. (2005). By reference to Figure 5.1 it is possible to see how the stages
of reading, grouping, and sequencing correspond to the thinking skills required in each of the three
categories of the cognitive skills: information gathering, building understanding, and productive
thinking. Moreover, just as the metacognitive and reflective thinking skills are represented in the
model as an upper level that spans, and can be used on, all the cognitive skills; the design of Digital
Mysteries introduces feedback and reflective prompts at the boundary of each stage to encourage
the students to use such higher-level skills throughout the process. The final reflection stage, with
its full session playback, also aims to promote reflecting back on all the stages, how the basic skills
were used during each stage, and how the use of these skills can be improved in later sessions.
A detailed evaluation of the final design and how well it did satisfy its learning goals is pre-
sented in the next chapter. The analysis is based on close examination of video recordings of 12
trials conducted in a school with 6 groups. Two of these groups solved 4 mysteries of increas-

133
ing levels of difficulty in order to monitor the effect of repeated use and to monitor the groups’
progress.
The the final version of Digital Mysteries can be summarized as follows:
Task structure: A structure is enforced on the task dividing it into three stages followed by a
reflection stage. Among the main aims of this structuring is to allow for the provision of guiding
instructions at the beginning of each stage and feedback and reflective prompts at the end of each
stage based on the students performance during that stage. This allows guidance and feedback to
be provided at appropriate, not-interrupting moments in the process.
Stage 1 (reading): During stage one, students are only allowed to manipulate the slips (move,
rotate, and resize to iconic, normal and enlarged sizes).
Stage 2 (grouping): This stage introduces three externalization tools: grouping, post-it notes,
and sticky tapes. This stage requires students to create at least four groups with descriptive names.
A red-herring group is pre-defined and a trash area is provided to allow for deleting empty groups,
notes and sticky tapes. Feedback for the quality of the grouping is provided in the form of a traffic
signal, and if the students put all the slips in less than four groups, some grouping tips are provided
in the form of post-it notes. Only after the students put all the slips in at least four groups, the
application proceeds to stage three.
Stage 3 (webbing and sequencing): Stage three introduces an extra externalization tool which
is the arrow-shaped sticky tape. The shape of this tape implies time sequence, or cause and effect
relations and aims at helping the students in making their thinking in terms of relations more
explicit. A finish command is also introduced. When the students select the finish command, they
are presented with a sequence evaluation dialog which shows three types of sequences (one more
optimal and two less optimal patterns) based on previous observations of common error patterns
of students. Tips are provided to the students as to how to improve their sequencing, and the stage
resumes till the students reach the desired general layout. After selecting finish and entering an
answer that all students have to confirm, the final reflection stage starts.
Reflection stage: This final stages shows a dialog box that represents a quick static representa-
tion of the whole session with screen captures at the end of each stage, the duration of each, and
marks that indicate important points during the problem solving process. The dialog also allows
an abstracted replay of the whole session making it possible to replay the whole session in 5 to 10
minutes. It is also possible to pause the playback at any point in time and manipulate the slips to
discuss different alternatives for the solution, so the playback is not just a static video playback,
but an interactive one.

134
Collaboration: In addition to enforcing structure, providing externalization tools, providing
feedback and inducing reflection during and after the process; the application encourages pro-
ductive collaboration. This is done by balancing between allowing multi-synchronous and single
input. For example when a group is created, all interaction with the application stops and one soft
keyboard is displayed to attract all the students’ attention to this action and to encourage them to
discuss the new group. Moreover, all the dialog boxes in the application require confirmation from
all the three students. Finally, the application shows a participation pie chart at the top-centre of
the screen showing an estimate of the participation level of each student. This pie chart doubles in
size when it detects a high level of inequality in participation (domination or under-participation
of one student).
With its structure, externalization, and feedback tools, the application aims at making the
students’ thinking and problem solving process visible on the table to induce and encourage re-
flection and productive discussions, and to make it easy for a teacher to quickly asses the thinking
and performance of the students.

135
Chapter 6
Evaluating Digital Mysteries
In Chapter 5, I explained the educational theory that underpins the design of Digital Mysteries,
the iterative design process used, and the features of the final version of the application. This
chapter describes the detailed evaluation of the the final design with respect to both learning and
interaction.
The evaluation is based on the results of 12 trials conducted in a school with six groups of
students (three students per group). Two of these six groups had participated in previous trials that
used earlier versions of Digital Mysteries. The age of the participating students ranged from 11 to
14 years. Each of the six groups took part in a trial using Windy Creek mystery: “Should Annie
leave Windy Creek or should she stay? And why?” (Appendix A.4), and to explore the impact of
extended use of the application, I chose one higher achieving group and one lower achieving group
(based on discussions with their teacher) and had these groups solve three additional mysteries of
increasing levels of difficulty (Oliver Hopkins (Appendix A.5), the village shop (Appendix A.6),
and Alice White (Appendix A.7)). These repeated trials were conducted over a two-week period,
with a 1-3 day period between each session. All sessions were video recorded and the analysis was
performed through careful observations of the videos (and many repeated viewings) with a focus
on key aspects of the interaction. A training period that ranged from 5-10 minutes preceded first-
time use of the application. Students were trained in the use of the digital tabletop, the interaction
techniques, and the application. Although I was physically present for the first trial for each of the
six groups (in some case accompanied by the teacher), the repeated trials (groups 1 and 2) were
conducted by the teacher alone to approximate a more natural classroom setting.
6.1 Evaluation
As emphasised in Chapter 5, the evaluation of Digital Mysteries is not based on pre- and post-test
measures of learning but on the identification and accumulation of certain observable outcomes
that result in as a consequence of the design (Section 5.3.2). Consequently, the evaluation is based
on finding evidence that the application was successful in achieving the following:

136
1. making the students’ thinking more accessible to interpretations through the use of the ex-
ternalization tools provided and the task structure enforced by the design;
2. increasing the probability of useful discussions through the use of the externalization tools;
3. providing useful and timely feedback that prompts reflection and raises awareness of the
concept of metacognition;
4. being a sustainable learnable tool from which students benefit from repeated use;
5. encouraging useful and equitable collaboration;
6. facilitating mobility and encouraging collaborative interaction through the deployment of
adequate and easy to use interaction techniques.
Any application that can be demonstrated to meet these goals, which according to learning
theories have well established positive effects on learning, has a convincing evidence based as to
its benefits for learning. However, it is important to keep in mind that the overarching goal is
not Digital Mysteries itself, but to establish the potential of digital tabletop technology to support
face-to-face collaborative learning. The aim is that the design of Digital Mysteries, and the design
process, exemplify a general approach for designing problem-based tabletop collaborative learning
applications. Another (less explicit) goal is to encourage researchers and developers to focus on
designing for useful learning activities rather than simply measurable ones.
The purpose of this chapter is not to evaluate the mysteries activity as a learning tool, but
rather to evaluate the design choices of Digital Mysteries. This chapter also introduces design
recommendations that were concluded from the evaluation. While such guidelines are scattered
throughout this chapter, Section 7.4 re-introduces these guidelines as one coherent framework. In
the following evaluation, the samples of dialogues reported relate only to discussions that resulted
as a direct consequence of the design of Digital Mysteries and do not include discussions that
relate to solving mysteries (whether digital or paper) in general. This other class of discussions
that did not arise as a consequence of the design, even when they related to the solution of the
mystery and included activities that might result in learning, were likely to have occurred anyway.
6.2 Externalization: making thinking visible
Figures 6.1 to 6.12, and the data in tables 6.1 and 6.2, indicate that a lot of information about
the thinking of the students while solving the mystery can be extracted from the clearly marked
named groups, the notes, and the two types of sticky tapes. Figures 6.1 to 6.12 show screenshots
at the end of the grouping and the sequencing stages for all the trials. From these figures it is
possible to see only the general layouts. Tables 6.1 and 6.2 show the group names, the contents of
the notes, and the final answers for each group while solving Windy Creek. Tables 6.3 and 6.4, on

137
the other hand, show the number of attempts for the grouping and sequencing stages, the names
of the groups created, and the final answers for all the mystery trials.
While actual assessment of the attainment levels of the different groups is not required as part
of the evaluation of Digital Mysteries, it is worthwhile exploring the role of the application in
making such an assessment easy for the teacher. For the grouping stage, for example, the quality
of the grouping can be readily identified as the groups are clearly distinguished and named, and in
some cases groups are explained with associated notes (e.g. Figure 6.3 for group 1, trial 3). The
figures make clear the extra amount of information made available through the use of the cognitive
tools compared with what can be extracted from paper mysteries. As for the overall solution,
contrasting the final layout and the written answers of group 1 (Figure 6.1, Table 6.1) and group 3
(Figure 6.9, Table 6.1), for example, make clear the difference in the achievement levels of these
two groups. While group 3 failed to build a proper sequence even with the provision of hints from
the application and the supervisor, group 1 built a webbed sequence without requiring any external
support from the supervisor. The sequence of group 1 shows how students used the arrow shaped
sticky tape to mark cause and effect but used the normal sticky tape for normal relations. The
sequence is also split into a left section that relates to the reasons to stay and a right section that
relates to the reasons to leave as marked by the two notes at the top of the sequence. Students in
group 3 on the other hand, kept the slips in their groups and put a number of both types of sticky
tapes randomly on the slips. While the written answer of group 1 “we think that she should leave
because she can always visit family and friends if she moves and she could get a better job and
car if she moves. Plus this means that she would not be wasting her education” takes into account
family, friends, career, education, and how a better job can help her buy a car; the written answer
of group 3 “she should move because it is hot there” ignored all the important facts and focused
only on the weather issue. These two groups demonstrate that even with the enforced structure on
the task, enforcing the creation of a minimum of four groups, and clear instruction and feedback
prompts on how to build a proper webbed sequence, the design did not marginalize the difference
between the ability levels of the different groups.

138
(a) Grouping
(b) Sequencing
Figure 6.1: Screenshots at the end of the grouping and sequencing stages for group 1, trial 1:Windy Creek.

139
(a) Grouping
(b) Sequencing
Figure 6.2: Screenshots at the end of the grouping and sequencing stages for group 1, trial 2:Oliver Hopkins.

140
(a) Grouping
(b) Sequencing
Figure 6.3: Screenshots at the end of the grouping and sequencing stages for group 1, trial 3: TheVillage Shop.

141
(a) Grouping
(b) Sequencing
Figure 6.4: Screenshots at the end of the grouping and sequencing stages for group 1, trial 4: AliceWhite.

142
(a) Grouping
(b) Sequencing
Figure 6.5: Screenshots at the end of the grouping and sequencing stages for group 2, trial 1:Windy Creek.

143
(a) Grouping
(b) Sequencing
Figure 6.6: Screenshots at the end of the grouping and sequencing stages for group 2, trial 2:Oliver Hopkins.

144
(a) Grouping
(b) Sequencing
Figure 6.7: Screenshots at the end of the grouping and sequencing stages for group 2, trial 3: TheVillage Shop.

145
(a) Grouping
(b) Sequencing
Figure 6.8: Screenshots at the end of the grouping and sequencing stages for group 2, trial 4: AliceWhite.

146
(a) Grouping
(b) Sequencing
Figure 6.9: Screenshots at the end of the grouping and sequencing stages for group 3 solvingWindy Creek mystery.

147
(a) Grouping
(b) Sequencing
Figure 6.10: Screenshots at the end of the grouping and sequencing stages for group 4 solvingWindy Creek mystery.

148
(a) Grouping
(b) Sequencing
Figure 6.11: Screenshots at the end of the grouping and sequencing stages for group 5 solvingWindy Creek mystery.

149
(a) Grouping
(b) Sequencing
Figure 6.12: Screenshots at the end of the grouping and sequencing stages for group 6 solvingWindy Creek mystery.

150
Table 6.1: Group names, notes, and the answers for groups 1, 2, and 3 solving Windy Creekmystery: Should Annie leave Windy Creek or should she stay? and why?
Group 1
Groups
1. for2. against3. family for4. business for leaving5. for and against
Notesreasons for leavingreasons for staying
Answer we think that she should leave because she can always visit family and friends ifshe moves and she could get a better job and car if she moves. plus this means thatshe would not be wasting her education.
Group 2
Groups
1. stay2. leave3. arizona4. no money
NotesAnswer leave to get a better job and shall be able to get a car so she will be able to visit her
familyGroup 3
Groups
1. move2. dont3. maby move4. maybe stay5. notes
Noteswell if it is hot she will suffer and if she goes 2 a cold place it is sometimes hot sowhere can she gomaby stay for the boy ranch for her boyfriend and to see her family but will bedangerous because it is sunny and suffers alergies caused mainly by the sun.
Answer she should move because it is hot there.

151
Table 6.2: Group names, notes, and the answers for groups 4, 5, and 6 solving the Windy Creekmystery: Should Annie leave Windy Creek or should she stay? and why?
Group 4
Groups
1. were lives2. education3. hobbies4. relationships5. weather6. population7. shops
Notes
this all tells you about where she lives and who with.this is the population in 1370this tells you about the weather and her allergies.this is where shops arethis tells you her hobbiesthis tells you that she wants to have a good education
Answer we think she should stay because she is with all of her family and she has a goodeducation and job and she loves where she lives.
Group 5
Groups
1. arizona2. reasons to move3. reason to stay4. reasons neither to stay or to go
Notes arizona sounds like its busy, maybe she doesnt like busytowns/villages/cities/countries.
Answer she should go because there are alot more activities to do and more shopsGroup 6
Groups
1. stay2. moving3. not sure4. distance
Notes
this is to show the things to stay at Windy Creekthings why she should movegood activitiesbetter educationdifferent allergies
Answer more things to stay for

152
Table 6.3: The number of attempts, the groups created, and the answers for the six groups solvingWindy Creek mystery: Should Annie leave Windy Creek or should she stay? and why?
Group Attempts Groups The answerstg.2 stg.3
Grp1,T1 1 2 1. for2. against3. family for4. business for leaving5. for and against
we think that she should leave because shecan always visit family and friends if shemoves and she could get a better job and carif she moves. plus this means that she wouldnot be wasting her education.
Grp2,T1 2 1 1. stay2. leave3. arizona4. no money
leave to get a better job and shall be able toget a car so she will be able to visit her family
Grp3 1 2 1. move2. dont3. maby move4. maybe stay5. notes
she should move because it is hot there
Grp4 1 3 1. were lives2. education3. hobbies4. relationships5. weather6. population7. shops
we think she should stay because she is withall of her family and she has a good educationand job and she loves where she lives.
Grp5 1 1 1. arizona2. reasons to move3. reason to stay4. reasons neither to
stay or to go
she should go because there are alot more ac-tivities to do and more shops
Grp6 2 4 1. stay2. moving3. not sure4. distance
more things to stay for

153
Table 6.4: The number of attempts, the groups created, and the answer for groups 1 and 2 whilesolving the rest of the mysteries.
Group Attempts Groups The answerstg.2 stg.3
Why did Oliver decide to join up?Grp1,T2 1 1 1. oliver
2. agnes3. miscellaneous4. family5. tommy6. work/war
he wanted to join the army because he wantedmore money and to make his family andfriends proud of him. plus he was too shortto play football
Grp2,T2 1 1 1. stay2. leave3. family4. money
to get a better job
Why is the village shop in Hensford closing?Grp1,T3 1 2 1. money
2. owners of shop3. putting them out of
business4. keeping them in
business5. keep in and out of
business
its closing because they arent making enoughprofit. this is because of there are other shopsopening so there is competition.
Grp2,T3 1 2 1. no customers2. the other shop has
more customers3. theft4. awards5. good for customers
everyone is going to the other supermarketand there getting no customers
Who was responsible for the death of Alice White?Grp1,T4 1 1 1. leather
2. illnesses3. work related4. death river5. family
the tannery were responsible for alice whitesdeath because if she did not work there thenshe wouldnt have been at cockshaw burn andwould not have drowned.
Group 2, T4 1 2 1. leather2. the river where she
died3. family4. work
she was because the sides of the river wasslippy and she slipped and she drowned

154
6.3 Promoting discussions
Students’ No. of No. of No. of No. ofgroup groups group notes note
discussions discussionsGroup 1, T1 5 5 2 1Group 1, T2 6 6 3 1Group 1, T3 5 5 5 5Group 1, T4 6 1 4 2Group 2, T1 4 4 0 0Group 2, T2 4 4 0 0Group 2, T3 5 5 0 0Group 2, T4 4 4 0 0Group 3 5 4 2 2Group 4 8 8 6 6Group 5 4 1 1 0Group 6 4 4 5 4Total 60 51 28 21
Table 6.5: Number of groups and notes created, and the corresponding number of discussionactivities.
Table 6.5 presents a quantitative analysis of the number of groups and notes created during
each mystery trial, and the number of associated discussions. The sticky tape actions are not
included here because they were used very often during stage three and it is not possible to identify
discussions that are directly related to them. From the table, we see that of the 60 groups created
(counting groups that were created, temporarily used, then deleted), 51 (85%) were accompanied
by some form of discussion regarding the group and its name. Also, of the 28 notes created, 21
(75%) were accompanied by discussions regarding the contents of the note. Figures 6.13, 6.14, and
6.15 show sample conversations from three different groups around the act of creating a group,
naming it, or putting a slip into it. The conversations demonstrate the importance of assigning
names to groups in promoting valuable discussion.
Figures 6.16 and 6.17 show sample discussions related to creating notes. Again, these conver-
sations demonstrate how the act of creating a note attracted the attention of other group members
and promoted discussion. Using the sticky tapes to mark relations also created space for discus-
sions. For example, in one case a student pointed to two slips linked with a sticky tape and asked
“Why are they related?” Moreover, having an arrow shaped sticky tape increased the space for (i.e.
increases the probability of) such discussions where in a number of cases students displayed the
commands menu and discussed which type of tape to use (e.g. Figure 6.18). All these examples
demonstrate that, in addition to making the students’ thinking visible on the table, the externaliza-
tion tools (groups, notes, and the sticky tapes) served to promote discussion and created space for
disagreements and the need to provide explanations.

155
The previous discussion established the success of the application in encouraging external-
ization and the benefits of such externalizations in making students’ thinking more accessible to
observers. The sample conversations provided, give a good indication as to the type of active
discussions that can arise as a consequence of such externalizations. Consequently, encouraging
externalization should be considered as a main design recommendation for collaborative learning
applications (Refer to section 7.4-Encourage externalization)
Student 1: Put that one in ‘red herrings’?Student 2: What does that one say, I don’t remember.Student 1 makes the slip larger.Student 1 and student 2 read the slip content aloud.Student 3: It’s kind of a reason to go because she doesn’t want to waste her education but she lovesStudent 1: It could be for staying.Student 2: It’s kind of in the middle.Student 3: Or make another group like for I don’t know.Student 2: Like pie, like overlapped and it goes in the middle. and makes circular gestures with the pen.Student 3: Let’s make a group and put it in the middle. What shall we call it?Student 2: For and against.
Student 2: That’s population. What will that be, for or against? The population being really small.Student 1: I don’t know.Student 2: The population getting small. That’ll be bad because there hardly be any business.Student 3: Yeh.Student 2: That’ll be against.
Figure 6.13: Examples of discussions around grouping (group 1 solving Windy Creek).
After the students are provided with a hint that indicated some related slips that could be put in one group,they had the following discussion for selecting a name for the group for these slips.Student 1 enlarged the first slip referred to in the hint.Student 2: She can’t afford.Student 1 minimises the slip and enlarges the second one.Student 2: So she can’t go to her best friend.Student 1 minimises the second slip and enlarges the thrid.Student 3: And near the cinema.Student 2: Yeh, she can’t afford a car so she can’t go there and she can’t go there.Student 3: So how about this could beStudent 2: Can’t afford.(Laughing)Student 3: No we can’t put, can’t afford.Student 2: Emm, no money.Student 3: Yeh, no money.
Figure 6.14: Examples of discussions around naming a group (group 2 solving Windy Creek).

156
Student 1 (pointing to a slip): Could that be education?Student 2: That’s like a hobby.Student 3: It’s a hobby. Do you want me to make a thing for the hobby?Student 3 creates a group and names it ‘hobbies’.Student 1 creates a group and names it ‘1122’Student 2: Shouldn’t we put like em (pause) so we know what’s it’s about and stuff than 1122?The group is deleted, and student 2 creates a new group.Student 2: We are going to call it, where she lives.
Figure 6.15: Examples of discussions around grouping (group 4 solving Windy Creek).
After a long discussion about a slip about getting robbed and another about insurance and whether thiskeeps them in or out of business, the students linked the two slips with a sticky tape and student 2 wrote:“getting robbed would put them out of business but since they have insurance it keeps them in business”.Student 2: Does that make sense?Then the students linked the note to the two slips with another sticky tape.Student 1: We need one for that. What was that one about? (pointing to one of the slips)Students 2: A farm shop that was opened then closed.Student 1 types while student 2 dictates Farm shop open but closed a year later.
Figure 6.16: Discussion around creating notes (group 1 solving The Village Shop).
Student 1: (Referring to student 2 by name) is making something.Student 2: I am making a note.Student 3: What’s the note? Move the note so I can see it.Student 3 started reading what student 2 was typing.Mean while, student 2 was typing “well if it is hot she will suffer and if she goes 2 a cold place it issometimes hot so where can she go”.
Student 1 addressing student 3: What are you typing?Student 3: Maybe stay for the boy ranch for her boyfriend.Student 1: Yeh.Student 3 finished typing the note: “maybe stay for the boy ranch for her boyfriend and to see her familybut will be dangerous because it is sunny and suffers alergies caused mainly by the sun.”Student 3 then read what he wrote to the rest of the group.
Figure 6.17: Examples of how the act of creating a note attracts attention of the other students.
Student 3 pointed to a group of slips and said: I think we should do an arrow here because it is causingallergies.Student 2: That’s what it is.Student 1: It’s not an arrow.Student 3: It’s a sticky tape.Student 1 then creates an arrow sticky tape and passes it to student 3 to use it instead of the normal stickytape
Figure 6.18: Discussion around the type of the sticky tape to use to mark a relation between twoslips.
6.4 Feedback, reflection, metacognition, and repeated use
6.4.1 The grouping stage
In solving Windy Creek mystery (“Should Annie leave Windy Creek or should she stay? And
why?”, Appendix A.4), which was the first mystery used for all groups, the students of group 2

157
divided all the slips between two groups only, “stay” and “leave”. After the placement of the last
slip in one of these two groups, the application identified that some slips that are classified to be
tightly related in the mysteries meta-data (Appendix A.4) are put into different groups. Based on
that, feedback in the form of a grouping hint was provided to the student: “ Think about slips
(3, 9 and 12). They should be in one group. Think about slips (4, 8 and 15). They should be
in one group.” The students took the slips mentioned in the hint out of their initial groups, read
them aloud, put sticky tapes on them and discussed the relationships between them. They then
went on to create two new groups “Arizona” and “no money” (Figure 6.14 shows the discussion
for one of these two groups). This demonstrates clear evidence as to how feedback provided by
the application can lead students to reflect on and rework their grouping. Moreover, for the next
trial with the same group of students, one of the group members said: “Remember four groups not
two.” This demonstrates learning from previous trials.
6.4.2 The sequencing stage
Figure 6.22 shows three screenshots during the sequencing stage for group 4. The top figure shows
the layout when the group first selected the finish command (thinking that they have finished stage
three). By looking at the three images provided in the sequence evaluation dialog (Figure 5.18) the
students realized that they had not created a proper sequence, and chose the piled layout option.
With the instructions given on how to build an effective sequence, and the tip provided in the form
of a post it note on how to start a sequence, students moved to the layout shown in middle capture
in Figure 6.22 where they took the slips out of their groups, kept them in piles and put sticky tapes
on them. After selecting the finish command for the second time and examining the sequence
evaluation dialog again, the students again chose the piled layout realizing that they have still not
started building a sequence. At this stage, the students started to feel frustrated and the teacher
had to intervene to encourage them and gave them more tips on how to build a proper sequence.
This lead to the final layout shown in the bottom figure. While the reasoning behind the final
layout was still weak, the students, with the help of the feedback from the sequence evaluation
dialog, were able to reflect on their layout and recognized, without teacher intervention, that their
solution could have been more complex. It was this kind of reflection that made them realize that
they needed further support from the teacher, and if it were not for the feedback from the sequence
evaluation dialog, the students would have settled for the layout shown in the top figure.
A similar case occurred in the third trial for group 2 (solving The Village Shop mystery,
Appendix A.6) where the group indicated the completion of the sequencing stage with two parallel
linear sequences without any type of branching or relation between the two sequences. When the
students where asked to identify the layout type for their sequence, they correctly picked the linear
layout. After reading the subsequent hint they completely re-worked their layout, demonstrating
deeper thinking about the relations between the slips. This resulted in the sequence layout shown
in Figure 6.7.

158
Another similar case occurred in the first trial with group 1 where they also constructed a linear
layout and as a result of the sequence evaluation dialog they moved to a branched structure (Figure
6.2). During the reflection stage, the teacher clicked on the marker that indicated the layout at the
first sequencing attempt and asked the students about the difference between the final layout and
the first attempt. One of the students replied “On the final one it’s like branches out that links them
all together. It’s not just a column of why she should leave. Like linking the reasons together.”
Then the student continued by explaining the logic behind the sequence. This is a clear example
how the feedback provided by the sequence evaluation dialog can cause students to reflect on their
first layout, and improve it.
6.4.3 The reflection stage
Figure 6.20 shows the reflection dialog for group 2 at the end of The Village Shop mystery. From
the reflection dialog the teacher immediately noted that the students spent very little time in the
reading stage, and Figure 6.21 shows the related discussion. This example demonstrates how the
reflection dialog helped the teacher in observing an obvious weakness in the process, that the
students moved to the grouping stage without actually reading the slips. It also demonstrates how
the students benefited from the discussion in the reflection stage by improving their process in the
subsequent trial.
An interesting comment was made by one of the students in group 1 who had used the previous
version of Digital Mysteries. When the teacher spontaneously asked her in the reflection stage of
trial 1 about how this version differed from the previous one, the student replied “It’s got like
more options. It makes you think about how you’ve done it more. Like think about how you
link, thought and linked it.” Another example that demonstrates the students becoming aware of
the concept of metacognition (arising from use of the application) can be seen in the reflection
stage of the second trial of group 1, the higher achieving group. The teacher asked the students
which techniques they have used from a list of learning techniques written on the wall of the
room. A student replied “Thinking about thinking, because we’ve thought about how we could
have thought about it.” Another student said “we’ve already starting getting strategies and build
on them”. These comments from the students are evidence that the application was successful
in bringing the students’ attention to their own thinking process and making them aware of the
concept of metacognition. Figure 6.19 shows another example, from the second trial of group
1, of the types of reflective discussion made possible by the reflection stage. It demonstrates the
quality of thinking of this group and the level of engagement of this group with the application.
Following each stage individually with reflective-feedback prompts, and the task as a whole
with a dedicate reflection stage was demonstrated to have positive learning outcomes for the stu-
dents and thus is proposed as a design recommendation for learning applications (Refer to section
7.4-Follow the task as a whole, and each stage individually with reflective feedback). To enable
the provision of effective reflection support, and to be able to bring the students’ attention to the

159
The teacher asked the student about their layout, which basically showed two columns one about reasons tostay and one about reasons to go, and if they think that such a layout is better than a tightly interlinked one.Student 3: It would have been better if you could have like a pie char (she was trying to explain theVenn diagram but she did not know what it was called) because you can have an overlapped area.Teacher: you can’t have the Venn diagram on here but how do you think you might arrange stuff?Student 2 explained how the Venn diagram would have been useful.Student 1 then explained how one can make use of the possible grouping tool to present something similarto Venn diagram.
Figure 6.19: A sample of the type of reflective discussions made possible by the reflection stage(group 1, trial 2).
points in the process where they did not perform well, the application must support some kind of
logging of students’ interactions. The type and amount of the logged data is largely dependant on
the application, but it is important that critical moments in the interaction are logged and marked
for later reference (Refer to section 7.4-Support logging of events and identify critical moments).
6.4.4 Repeated use
Analysis of the sequence of four trials undertaken by group 1 (the higher achieving group) showed
little change in their behaviour, which was good from the outset. Group 1 made use of the feedback
from the sequence evaluation dialog in the first trial, where they moved from a linear layout to a
branched layout, and again in their third trial where despite having an acceptable layout sequence,
the evaluation dialog motivated them to improve it. The group had good problem solving abilities
and their focus was entirely on the quality of the solution. However, it is important to note that
the enforced structure, the feedback provided, and the enforced collaboration rules had no readily
apparent negative impact on the group (i.e., there was no evidence for over-structuring the task or
the collaboration).
On the other hand, the design of Digital Mysteries, and the repetitive use seemed to have
greater positive effect on the lower achieving group (group 2), and discussions like that in Figure
6.21 show clear evidence of this. The focus of group 2 was on the provision of an appropriate
looking layout with a simple underlying logic rather than a higher quality and appropriately elab-
orate solution. Their strategies in the reading, grouping, and sequencing stages notably improved
with each trial. It seems reasonable to believe, therefore, that as they get more comfortable with
the strategies to use at each stage, particularly during the sequencing stage, their focus will start
to shift more on the quality of the solution.
The observed differences in behaviour between different ability groups, and the improvement
in performance of lower achieving groups with use, indicate the importance of designing learning
applications that do not marginalize such differences in performance. Moreover, the scaffolding
support provided by the application should depend one the performance of the group. Scaffolding
should not be provided when it is not required (i.e. for higher achieving groups) and it should fade

160
Figure 6.20: The reflection dialog showing the short duration of stage one (group 2, trial 3).
Teacher: It took you no time to get from there (points to beginning) to there (points to the end of thereading stage).Student 1: Is that good?Teacher: You are going to answer that question in a second yourselves.Student 2: Because we didn’t really read them.Teacher: Didn?t really read them?The teacher explained to them that they should have read them together and how to do it next time.Same group in the next trial, the students are about to start:Student 1: Alright let’s start reading them.Student 2: One at a time, one at a time.During the reflection stage:Teacher: What did you do differently from yesterday?Student 1: We did better than yesterdayStudent 2: We read one at a time.Student 1: And we put it aside.Teacher: What were the effects of doing that? was it better, was it worse?(all said better)Student 2: Because we all knew what was going on.Teacher: So did it help you when you got to your grouping stage?Student 1: Yes, we were all working as a team.
Figure 6.21: Discussions during the reflection stage and their effect in subsequent trials (group 2,trial 3).
gradually as the performance of lower achieving groups improve (Refer to section 7.4-Design for
different ability levels).
6.5 Encouraging equitable collaboration
Figure 6.23 shows the level of participation of each student in the 12 trials conducted (expressed
as a percentage of the group as a whole). Apart from group 5 (G5), the participation levels, which
were estimated based on the time the pen was being dragged on the table, could be considered
acceptable in that no group member overly dominates (i.e. over 50%) or no member substantially
under participates (i.e. less than 10%). However three of these trials deserve further discussion.
Group 1, trial 4 (G1T4): The four participation figures of group 1 indicate that student 1 (S1)
did play an important role in the first three trials, yet Figure 6.23 shows a participation percentage

161
Selected finish the first time:After seeing the sequence eval-uation dialog, one student said:“oh my god, so we’ve donetotally wrong.” They selectedthe piled layout and resumedstage 3.
Selected finish the second time:The students realized that theirlayout is still incorrect. Theywere a little bit frustrated andselected the piled sequence lay-out again.
The final layout: After notic-ing the student’s frustration, theteacher encouraged them andgave them more tips on how todo a proper sequence and theyended up with this layout.
Figure 6.22: Screen-shot for group 4 as they select the finish command and respond to the sequenceevaluation dialog.

162
of 19% in the fourth trial. In fact, for most of the session S1’s level of participation was even lower
(and the pie chart was as, a result, doubled in size). Having observed that S1 was not participating
(it was not clear in this case if it was the pie chart that drew attention to this because it was not
explicitly referred to), one of the students (S2) created a group, pushed the keyboard closer to S1
and rotated the keyboard and the group name dialog box towards him, so S1 entered the group
name. Later on, S1 created a note, but S2 again pushed the keyboard closer to S1 and rotated
the keyboard and the note towards him, which caused S1 to type in the note. In later discussions
with the teacher I found that unfortunately S1 was upset in this instance because he had to leave
the physical education class to attend the trial. Nevertheless, the other students kept asking him
to participate which increased his percentage to 19%. This behaviour to regulate the participation
levels on behalf of the students reflects development in the students’ metacognitive regulation
skills.
Group 5 (G5): For this group, S1 was a free rider. He did not participate in the session at all
apart from isolated comments or actions. When the introduction dialog for stage two appeared
showing the participation pie chart for the past stage at the top, and when S2 read the phrase “it is
a group activity and everyone should participate”, S2 referred to S1 by name and said in a sarcastic
tone “Yeah S1”. Later in the same stage, S2 pointed to the pie chart, which had doubled in size
because of the low participation level of S1, and said “You’ve hardly done anything” (Figure 6.11
shows the enlarged pie chart). Although S1 still did not participate, these two cases demonstrate
how the pie chart and the instructions given by the application made the students aware of each
other’s participation levels.
Group 6 (G6): This group demonstrated a clear example of leadership with S2 leading the ses-
sion right from the beginning. Nevertheless, S2 was basically giving the other students instructions
on what to do rather than doing things himself. Throughout stage 1, it was S3 who was carrying
out most of S2’s instructions. This caused the pie chart to double in size after about 10 minutes
with S3 going over 50%, S2 little more than 25% and S1 little less than 25%. When the pie chart
doubled in size it attracted S2’s attention, so he pointed to the pie chart and said “What we’ll do
is, right, that we will try and catch up later because you’ve (referring to S3) got a bit too many.
S1, you go until you get even with S3, then I’ll go and make it all even”. When S3 tried to move
another slip later, S2 stopped him and asked S1 to do it. S3 however was very active and kept
moving slips around which kept his participation percentage high and the pie chart doubled in size
in a number of other cases. Each time S2 noticed this, he tried to stop S3 from moving slips and
did more work himself as well as frequently asking S1 to participate more. With this group, the
participation pie chart, and the fact that it doubled in size when the levels were highly unequal,
played an important role in raising the student’s awareness of their participation levels and bring-

163
Figure 6.23: An estimate of the participation level of each student based on the time the pen wasbeing dragged on the table (each member’s participation as a proportion of the group as a whole).
ing them closer to equity. Figure 6.12 shows how the pie chart was doubled in size at the end of
the grouping stage, and back to normal size at the end of the session.
Apart from the pie chart, the design feature of preventing all types of interaction upon nam-
ing a group succeeded in attracting all the students’ attention to this action. Using this technique
with all important actions, in addition to having confirmation buttons for each student in all im-
portant dialogs, helped in overcoming the disadvantage that is usually associated with parallel
input, and that is having students work independently and not taking note of the actions of others.
Even though allowing parallel interaction is one of the main advantages of tabletop technologies,
application designers should still utilize the ability of the technology to support other modes of in-
teraction and aim at striking a balance between parallel, single, and enforced collaboration (Refer
to section 7.4-Support the appropriate modes of group interaction).
6.6 Interaction techniques and utilizing the physical properties of thetable
The software and hardware design both sought to facilitate students’ free movement around the
table and their use of the table’s physical affordances. In addition to using the polar gates technique
(which is orientation independent) for all commands, all the objects on the table (slips, notes,
sticky tapes, keyboard, and dialogs) were rotatable. Students quickly got used to the crossing based
polar menus and a number of the students created multiple sticky tapes by repeatedly crossing the
sticky tape tool without being informed of this feature in the training period. Students did make
use of the freedom to move around the table with groups 3, 4, 5, and 6 being very mobile and used
the table from all sides and even exchanging places on a number of occasions. Groups 1 and 2, on

164
Figure 6.24: Image of a trial illustrating how students worked from all sides of the table, usedorientation, and leaned on the table.
the other hand, did not move around the table in their first trial but started to move more freely in
later trials. This was particularly true of group 2 who were very mobile in their last trial.
Similarly, rotation was used in different degrees by the different groups. Group 1 did not use
orientation at all in their first two trials, but started rotating things in a number of occasions in
their third and fourth trial, and used orientation to coordinate actions in more than one case in
their fourth trial as explained in Section 6.5. Group 2 also did not use orientation in their first trial
but started to use it more often in the subsequent trials, and in their fourth trial, they had the full
layout rotated by 90 degrees (Figure 6.8-(b)). Groups 3, 4, and 5 used rotation, but group 6 did
not use rotation at all. All the groups leaned on the table in a number of occasions, much as they
would a regular classroom table or desk. Figure 6.24 shows the students working from the three
sides of the table with the student on the right having one of the slips rotated towards him and
leaning on the table.
The design of Digital Mysteries was intentionally very different from any standard desktop
application, both in that the application filled the whole screen (without a title bar) and traditional
toolbars and menus were not used. The goal is to have the students think of the digital tabletop
as a new device with its own interaction style, and therefore not enforce on themselves (even if
subconsciously) the same restriction imposed by desktop computer technology and applications
in terms of fixed orientation, fixed seated positions, and single-user interaction. Indeed, one of the
students was surprised to see that the table was actually connected to a laptop that displayed the
same contents as the table’s surface.

165
6.7 Structuring the task
The structure enforced on the task helped students focus more on what is required from them
at each stage. In some cases, students discussed the strategy to use at the beginning of a stage
(Figure 6.25). The structuring afforded the opportunity to inject feedback at appropriate points in
time (i.e. between the stages so as not to interrupt the process). The structuring also proved to be
useful in helping the teacher identify weaknesses in the process, for example the case where the
teacher identified the short reading stage and that the students had not really read the slips before
moving to the grouping stage (Figure 6.21) (Refer to section 7.4-Structure the task).
At the beginning of the grouping stage and after reading the instructions.Student 2: Group them in reasons to stay and reasons to go first and then find more groups.Student 1: Split them in.Student 1: Yeh, then find more groups.
At the beginning of the sequencing stage and after reading the instructions.Student 1 pointed to a slip and said: that one and that one are linked.Student 2 put a sticky tape on them, and after linking a number of slips with sticky tapes.Student 2: Shall we put them in order?Student 1: Would you link them together first?
Figure 6.25: Discussion about the strategies to use at stages 2 and 3 for group 1, (trial 1) whilesolving “Windy Creek” mystery.
6.8 Conclusion
The examples provided, whether screen captures, tables, or elements of transcripts, all serve to
provide strong evidence that the application served its design goals (see Section 6.1). To an ex-
ternal observer, the level of thinking of the students was much more evident while using Digital
Mysteries than with Paper Mysteries. The level of intervention required from the teacher was
low. In most cases, teacher supervision was only required for 5-10 minutes during the reflection
stages. The only exceptions were in the need to provide further scaffolding in how to do proper
sequencing for some of the lower achieving groups.
It was also clear that the design was successful in distinguishing the application from tradi-
tional desktop applications by utilising the multi-synchronous input and large horizontal surface
afforded by tabletops. This was achieved through the following:
1. Providing a rich setting for face to face synchronous collaboration where the application
allowed the students to switch between parallel and collaborative work. This was made
possible by providing multi-synchronous input for normal slip manipulation, switching to
single entry point or enforcing collaboration as appropriate, and providing feedback about
participation levels. The benefits of this design were reflected in the generally equitable

166
levels of participation, the students’ awareness of their levels of participation, and the dis-
cussions that were the results of the single entry point during group creation.
2. Allowing for the utilization of the large horizontal space by allowing students to move freely
around the table and work from all sides, and also by providing lightweight, orientation-
independent, interaction techniques that allowed for rotating all the objects displayed on the
surface. The effects of this design were made clear by the high degree of mobility demon-
strated by some students who worked from all sides of the table and who used orientation
freely. Group 2 in its final trial even used the table from the side, that is having the whole
layout rotated by 90 degrees (Figure 6.8-(b)). Students also used the horizontal space com-
bined with orientation for coordination in a number of cases as depicted by Kruger et al.
(2003) (an example is given in Section 6.5). This proves that the interaction techniques
used were sufficiently light weight and therefore allowed for this type of usage.
Table 6.6: Features of digital mysteries compared to desktop and paper realizations.
Feature Tabletop Paper DesktopStructuring the task X × XExternalization tools X × XFeedback and reflection prompts X × XFace-to-face collaboration X X ×Multi-synchronous interaction X X ×Affords mobility X X ×Utilising the large horizontal space X X ×Regulating collaboration X × ×Increasing participation awareness X × ×
Table 6.6 lists the features of Digital Mysteries and how the digital tabletop design allowed the
combination of the benefits of what one might expect from a traditional desktop implementation
with those of a paper mysteries (in addition to providing some features only possible with digital
tabletops).

167
Chapter 7
Discussion
The overarching focus of this research has been on the support of digital tabletop technology for
face-to-face collaborative learning. The main objectives as stated in Chapter 1 were to
1. understand how traditional tables are used in learning contexts, and thus identify basic de-
sign requirements for applications aiming at supporting collaborative learning around table-
tops;
2. identify, and propose solutions for, some of the issues in tabletop interaction that have not
been thoroughly addressed;
3. investigate the potential of digital tabletop technology to support of face-to-face collabora-
tive learning with focus on higher level thinking skills;
4. build a model collaborative learning application for tabletops that utilizes our understanding
of the requirements of collaborative learning applications around this technology, and the
interaction techniques required for such applications; and
5. propose general design guidelines for collaborative tabletop learning applications.
7.1 Results and contributions
The contributions of this research fall into two categories: interaction techniques, and design of
collaborative learning applications.
7.1.1 Interaction techniques
The need for a fluid, light-weight interaction technique to control different object settings while
moving objects between tabletop territories was identified while reviewing previous research con-
cerned with tabletop interaction. Attributes Gates (Chapter 3) were introduced as a novel interac-
tion technique to address this issue. Attribute Gates rely on crossing-based interaction and allow
the setting of a number of attributes fluidly while moving the object between territories. This was

168
achieved by integrating the settings of the attributes into the main movement action. The design
of Attribute Gates was inspired by the concept of action levels from activity theory. Two types of
Attribute Gates were introduced: Grid Gates and Polar Gates. Grid Gates, as the name implies,
distributes the different settings in a grid-like layout with each set of mutually exclusive attributes
in the same row, while Polar Gates put the different sets of the mutually exclusive settings in co-
centric rings. Each of these techniques has different usage advantages. User studies contrasting
Attribute Gates with contextual menus (the most common alternative) showed significantly bet-
ter user performance for Attribute Gates. Moreover, in terms of the awareness of an observer to
the action of setting the attributes, Attribute Gates led to comparatively better performance (com-
pared to contextual menus). Although designed to address a specific problem (multiple attribute
setting while moving object between territories) Attribute Gates can be modified to suit different
applications as was demonstrated in Digital Mysteries.
The second contribution, in terms of interaction techniques, was to address the problem of
text entry with digital tabletops. More specifically, the problem of entering moderate amounts of
text for applications that require freedom of movement around the table. TANGISOFT, a hybrid
soft keyboard with tangible characteristics was shown to be an appropriate design response to this
problem (Chapter 4). Studies contrasting the use of TANGISOFT with a soft keyboard shed light
on interesting variations in users’ behaviour. The main observation was that users could be divided
into three categories according to their mobility levels when interacting with the tabletop:
• Static users who work from a fixed location regardless of the location or orientation of the
object they need to interact with, and of the interaction technique (i.e. soft or tangible tools).
• Dynamic users who move freely around the table to the be near the point of interaction
regardless of the interaction technique.
• Other users whose behaviour depend on the interaction technique at hand.
When members of this “other” class of users used TANGISOFT for text entry, they moved the
keyboard and oriented it so as to enter text from a comfortable position and orientation; but when
having to do the same task with the soft keyboard, they kept the location and the orientation of
the keyboard fixed. This demonstrated that the hybrid design of TANGISOFT, which allowed for
natural two- handed interaction, afforded for more mobility around the table than a pure software
alternative. In addition to introducing a new text-entry alternative to be considered for tabletop
applications, TANGISOFT increased our understanding of the behaviour of people around tabletop
applications and how tangible interaction can affect such patterns of behaviour.
7.1.2 Designing for collaborative learning applications
In addition to general design guidelines for tabletop applications, the review of literature and the
exploratory study described in Chapter 2 provided a basic account of the use of traditional tables

169
in a learning context. Further investigation of the potential support of tabletop technology for
collaborative learning was carried out through the design, development, and evaluation of Digital
Mysteries. The kind of support that I sought to explore is one that focuses on higher level thinking
skills, feedback, reflection and metacognition. This approach, despite being more difficult than
targeting basic thinking skills, which can be measured using pre- and post-test measures, was
taken because it truly utilizes the unique affordances of digital tabletops in combining the benefits
of face-to-face collaboration and technology. Consequently, the evaluation approach used required
the identification of evidence that the design encouraged the type of activities that theories of
learning have proved to increase the probability of effective learning. On the other hand, the design
of Digital Mysteries aims at utilizing the characteristics that are unique to tabletop technology
leading to an application that cannot be directly adapted to other settings, such as desktop or
networked environments, without losing much of its value.
The analysis of the final version of Digital Mysteries was based on 12 trials conducted in
a school setting with six groups of students. Two of these groups used the application in four
separate sessions over a two week period. This made it possible to consider the effects of repeated
use and exclude effects resulting from the novelty of the technology. The analysis proved that
the design was successful in meeting its goals by giving rise to evidences that: the cognitive tools
provided by the design encouraged the externalization of thinking which increases the probability
of useful discussions; the feedback provided was properly timed and prompted students to reflect
on their solution and progress, and increased their awareness of the concept of metacognition; the
students benefited from repeated use of the application; the levels of collaboration were generally
acceptable and that students were made aware of the their collaboration levels; and, finally, that
the interaction design was successful in utilizing the affordances of the technology and allowed
students to work freely around the table.
Digital Mysteries represents a significant contribution to the field of interactive tabletops and
surfaces by providing the following:
Increased understanding of the technology: The development of Digital Mysteries, in addi-
tion to paper based trials, had undergone three iterations with a total of 22 trials, 12 of
which were for the final design. These trials significantly add to our understanding of how
tabletop technology is used in learning contexts, and provides an additional evidence as to
the potential of tabletops to provide unique and appropriate support for collaborative learn-
ing. The large amount of interaction data logged by the application in addition to the video
recordings constitute a rich corpus for future research. Figure 7.1 represents a simple vi-
sualization1 based on the logged interaction data, and demonstrates the type of information
that can be quickly extracted by the teacher and even the students about different aspects of
the process.1This figure is taken from initial work by Ammar Al-Qaraghuli on the visualization of collaborative data logged
using Digital Mysteries.

170
Figu
re7.
1:A
basi
cvi
sual
izat
ion
show
ing
user
s’ac
tions
with
time.
The
char
tis
forg
roup
4w
hile
solv
ing
Win
dyC
reek
mys
tery
.Am
ong
the
obse
rvat
ions
that
can
bem
ade
rega
rdin
gus
ers’
cont
ribu
tion
from
this
basi
cvi
sual
izat
ion
isth
elo
wle
velc
ontr
ibut
ion
ofus
er1
with
rega
rds
togr
oupi
ng.T
hech
arta
lso
show
sth
atth
est
uden
tsco
ntin
ued
wor
king
onth
egr
oupi
ngat
the
begi
nnin
gof
stag
eth
ree
fora
long
dura
tion
befo
reth
eyst
arte
dbu
ildin
gre
latio
ns.
Thi
sde
lay
refle
cts
the
grou
p’s
stru
ggle
with
how
tost
artin
gbu
ildin
gth
ese
quen
ce(t
hank
sto
Am
mar
Al-
Qar
aghu
lifo
rthe
figur
e).

171
Design guidelines for learning application: The design of Digital Mysteries, with its strong re-
liance on theories in learning and interaction design, serves as a model for tabletop collab-
orative learning applications, in particular those centred around the solution of ill-defined
tasks. The guidelines given in section 7.4 represent a generalization of our experience in
developing learning applications for tabletops.
A new model for evaluating collaborative learning applications: The evaluation approach used
represents a shift from the standard pre- and post-test measures that are only appropriate
when evaluating basic learning skills (Higgins et al., 2004). The approach of designing for
useful learning activities and validating the occurrence of these activities serves two pur-
poses: it allows for the evaluation of higher level skills that are not easily measurable, and
it enables technology and design centric researchers (and developers), who are not ped-
agogy specialists, to design for such useful learning activities without having to concern
themselves with the problem of measuring learning outcomes directly.
An optimised model for the design process: The design process for Digital Mysteries repre-
sents a model of how collaborative learning applications should be designed. The model
can be summarized in three steps: (1) understanding use of paper and/or basic digital ver-
sion; (2) the design of a fully functional application; and (3) refinement of the design. The
design started with exploratory studies of how students use Paper Mysteries, and a literal
digital translation. From these studies a full design evolved that covered most of the targeted
learning goals. Based on careful analysis of six trials conduced using this version, the de-
sign was refined, leading to the final application. Despite the apparently obvious nature of
this process, a number of existing studies on the support of tabletops for learning are based
on a single exploratory design (e.g. Piper and Hollan, 2009; Do-Lenh et al., 2009).
7.2 Related work
In comparing this research to previous research on tabletop interaction and learning, a number of
distinguishing characteristics are apparent: a strong reliance on theory, the conduct of an explicit
and documented iterative design process, a study of the effect of repeated use, the use of an
application with a shared space and that allowed freedom of movement, and a focus on utilizing
the specific affordances of digital tabletop technology.
Most importantly is the strong and explicit reliance on applicable theory both for interaction
techniques design and collaborative learning application development. Activity theory and dis-
tributed cognition were used for analysis, design, and evaluation of a number of different aspects.
In addition, learning theories and models were used to guide the design and evaluation of Digital
Mysteries. Moreover, a proper iterative design approach, consisting of one paper and three digital
iterations, was followed in developing Digital Mysteries. All trials were conducted in a school

172
by students (rather than lab-based settings which are common). While some investigations into
the benefits of tabletops for learning did go through a proper iterative design approach (e.g. Piper
et al., 2006; Harris et al., 2009), others based their conclusions on simple exploratory applications
(e.g. Piper and Hollan, 2009; Do-Lenh et al., 2009).
With such a new technology as digital tabletops, it is difficult to make decisive conclusions
based on first use of the application by the students due to the novelty effect of the technology.
While Piper and Hollan (2009) specifically addressed this issue by basing their conclusions on
multiple repeated sessions, the conclusions of a number of other investigations were based on first
time usage of the application only (e.g. Do-Lenh et al., 2009; Harris et al., 2009). I evaluated the
use of Digital Mysteries with repeated use for two groups of different achievement levels. Each
of these two groups performed four trials of increasing levels of difficulty. It was evident that
with each repeated use, students started to feel more comfortable with using the application. One
way in which this was apparent was in the increased frequency of movement around the table,
and increased use of orientation for objects by some students. Students also showed evidence of
benefiting from repeated use when it was combined with reflection.
The choice of pen-based tabletop system for all the studies was primarily based on the ability
of such systems to identify users without imposing restrictions on their movement around the
table. Currently, the only touch-based tabletop system that can distinguish between users is the
DiamondTouch table (Dietz and Leigh, 2001) which requires its users to sit or stand on special
mats, thus restricting their movement. Other multi-touch systems cannot distinguish between
users; consequently, the only way to recognize users in applications designed for such systems is
by dividing the table space into territories and assigning a special territory for each user. Therefore,
all existing tabletop applications that have been designed to investigate the support of tabletops
for learning, assume use from fixed position around the table (e.g. Piper et al., 2006; Harris et al.,
2009), or on one side of the table (e.g. Rick and Rogers, 2008; Piper and Hollan, 2009; Do-Lenh
et al., 2009). In the design of the TANGISOFT text entry technique, I focused on the issues of
mobility, the affordability of mobility of tangible user interfaces, and how this relates to human
behaviour. Also, the design of Digital Mysteries sought to allow full freedom for students to
move around the table. This allowed the students to work in face-to-face or shoulder-to-shoulder
settings, switch between these two settings as they saw appropriate, and encouraged them to freely
use non-verbal communication to support their discussions.
A final important point relates to conclusions arising from previous research. Do-Lenh et al.
(2009) showed that learning from high-expertise peers was better in a desktop application setting
than on a tabletop application that allowed parallel interaction. This was attributed to the inability
of such students to dominate the conversation as with a normal computer setting. Piper and Hollan
(2009) and Harris et al. (2009) also made the observation that the parallel interaction afforded by
tabletop technology, might reduce awareness of others actions. Harris et al. even referred to
two competing hypotheses as to whether parallel interaction supports better collaboration due to

173
enabling equitable participation, or whether single point of input is better for collaboration due to
enforced turn-taking and increased awareness. However, it is important to note that the tabletop
applications used in the exploratory studies that lead to these conclusions were not designed to
fully utilize all the affordances of tabletop technology. In fact, the applications used in Do-Lenh
et al. (2009) and Piper and Hollan (2009) were intentionally very basic and mirrored paper, or
desktop settings rather than utilizing the benefits of tabletops.
If we are to judge whether tabletop technology is useful for collaborative learning or not,
it is important to base our conclusions on applications designed to utilize all the advantages that
tabletop technology offers. Instead of arguing whether single point of interaction or parallel points
of interaction is better, the argument should be how can we best utilize the ability of tabletop
technology to switch between these two modes of operation and enforce coordination rules to
maximize the effectiveness of collaboration thereby gaining the best of both modes. Tabletop
technology also has the distinctive advantage of allowing face-to-face collaboration. This may
lead to increased awareness of the non-verbal behaviour of the participants in addition to allowing
freedom of movement around the table, yet all the applications referred to earlier, impose fixed
positions around the table, or work from one side of the table similar to a desktop setting.
7.3 Limitations of the current research
All the studies in this research were based on a pen-based tabletop. The main reason for this
was the ability to distinguish between users and at the same time allow for free movement around
the table. Apart from DiamondTouch table (Dietz and Leigh, 2001), multi-touch surfaces can-
not distinguish between its users, which deprives applications developed for such surfaces from
the ability to regulate collaboration or provide contribution level feedback. Therefore, while the
choice of technology allowed for identifying users and provided freedom of movement, it imposed
the following restrictions which were reflected on different aspects in this research:
• Single touch interaction, due to the use of pen-based input, was used in all applications in
this research. This prevented the utilization of multi-touch gestures for scaling and rotation
which could have been supported otherwise. Indeed, using such multi-touch gestures may
not always be an advantage considering the extra amount of physical effort required from
users. The underlying ergonomic effects of using single touch combined with interaction
techniques such as attribute gates compared to multi-touch gestures on such a large surface
as that of the tabletop can be an interesting subject of investigation.
• Although TANGISOFT was developed to be used with applications that require moderate
level of text entry and freedom of movement (i.e. similar to Digital Mysteries), it was not
used with Digital Mysteries and a soft keyboard had to be used instead. This is because
the tracking mechanism used for TANGISOFT required two of the three pens allowed by the

174
ActivBoard technology, leaving only one for interaction. It would have been interesting to
observe the use of TANGISOFT in a practical application like Digital Mysteries and observe
whether the extra degree of freedom of movement afforded by its design would have lead
to more mobile users, or more incidences where the keyboard is used for coordination of
action.
Nevertheless, and as far as support for learning is concerned, these limitations affect only the
interaction style with the application and not the underlying learning goals.
The final version of Digital Mysteries revealed two limitations in the design which has already
prompted future research. First is the small amount of planning undertaken by students for the
task as a whole and at the beginning of each stage, particularly for the lower achieving groups. It
would be useful to investigate the improvement in the overall performance and students’ problem
solving strategies if a dedicated planning stage were added at the beginning of the task, in addition
to dedicated planning prompts at the beginning of each stage. In other words, bracket each stage
individually, and the task as a whole between pre-task/stage planning and post-task/stage reflective
feedback. The second point relates to the quality of the final layout. With the design encouraging
students to build suitably branched sequences, the focus of some of the lower achieving groups was
on making a properly looking layout, rather than on the reasoning behind this layout. Although
observations of repeated use lead to the expectation that students’ performance would improve
with each use and more focus would be put on the reasoning, this remains a limitation of the
current version that is worth further investigation.
7.4 Design guidelines
From the experience gained in working with digital tabletop technology and specifically with
its support for education, general guidelines for collaborative learning applications and specially
those for ill-defined tasks has been developed:
• Structure the task. Dividing a large task into smaller sub-tasks (or stages) has many ad-
vantages as it allows for providing scaffolding instructions and feedback in optimal, non-
interrupting manner; provides a space for think back moments (reflection) at the end of each
stage and giving students an opportunity to evaluate their progress and, with the help of
feedback, identify mistakes; improves students problem solving strategy by teaching them
that large problems can be solved by dividing them into smaller manageable problems; and
helps in providing different perspectives (or representations) of the same problem.
• Precede the task as a whole, and each stage individually with a planning stage. Provide
students with different strategy options on how to proceed with the task as a whole or with
each stage individually. It is also important to precede the task and the stages with clear
guiding instructions and requirements of the overall task and of each stage.

175
• Encourage externalization. Transforming ideas into forms visible to others frequently trig-
gers useful discussions leading to effective learning and collaboration. Students should have
a variety of cognitive tools that allow them to express every decision. As an example from
Digital Mysteries, providing two options for the relation tool (normal and arrow) created
more opportunities for discussion on the type of relation to use. Making the students think-
ing visible on the table in this way, also helps teachers in evaluating students’ interactions
with the application.
• Follow the task as a whole, and each stage individually, with reflective feedback. Focus
on feedback that provides reflective prompts to students encouraging them to evaluate the
strategy used, to evaluate their progress, to identify mistakes, and in some cases to think
of possible alternatives to how the task was carried out and even re-work it. Two clear
examples of this in the design of Digital Mysteries are the feedback provided by the se-
quence evaluation dialog, which required the students themselves to evaluate their solution
with further feedback given accordingly, and the dedicated reflection stage that followed the
task. Digital technology can provide structure and logging which should be exploited in the
design of such reflective tools.
Support of the four recommendations above combined with repeated use, can lead to great
learning benefits for the students and increases their awareness of the concepts of metacognitive
knowledge and metacognitive regulatory skills. These recommendations encourage students to
make explicit their strategy and their reasoning for solving the problem at hand, prompt them to
reflect on their work and progress, and detect problems in the process which would otherwise go
unnoticed. Clear evidence was found as to the benefits of following these guidelines with repeated
use of the application.
In addition to these four points, which affect how students proceed in solving the task, other
recommendations that are not directly related to the task, but to the application behaviour and
regulation of collaboration are as follows:
• Support abstract logging of events and identify critical moments. A full real-time play-
back of a session takes a lot of time and distracts attention from the important aspects in
the process. With Digital Mysteries, only results of actions were logged and not the whole
movements, and important points (as when feedback was provided regarding grouping or
sequencing) were marked. This allowed the teacher to perform a quick playback of the
whole session and to focus on the important points in the process.
• Design for different ability levels. Provide support and scaffolding based on the students’
performance. This means that the application should behave differently for higher achiev-
ing groups than for lower achieving groups, and adapt to the improvement in the groups’
performance. This prevents high achieving students from feeling too constrained, or being

176
frequently interrupted by the application, and also prevents frustration on the part of low
achieving students by providing adequate scaffolding.
• Support the appropriate modes of group interaction. Careful reasoning must underpin
the choice and use of parallel interaction, single point of entry, and enforced collaboration.
There is no reason why applications should either allow full parallel interaction or only
support a single point of interaction. A major advantage of digital tabletop technology is
in its ability to switch between these two modes of operation in addition to being able to
enforce collaboration when needed. The goal is to optimise the application to maximize the
effectiveness of collaboration.
A final recommendation is concerned with the choice of the groups to carry out the trials
throughout the iterative design process. From my work with students of different ability levels,
observation of groups of lower achieving students more readily led to insights that improved the
design. This does not mean removing higher achieving groups from the process, but the positive
results, that are a common outcome from such groups, should not be used without questioning as
evidence of successful design.
7.5 Recommendations for future research
Recent research has started to investigate digital tabletops at the application level, and more specif-
ically applications that support learning. Such investigations focused on the direct effect of the
technology on the group that is using it. As tabletop technology matures and becomes commer-
cially available and affordable to have in schools, it is important that the scope of research broadens
to include investigating the general effects of the presence of tabletops in classroom environments.
The first issue that schools adopting tabletop technology have to consider is whether to have
one tabletop at every classroom, or prepare one collaborative learning lab with a number of table-
tops? The first case implies utilizing tabletop technology to complement the classroom learning
experience (in a manner similar to interactive whiteboards), while the second case implies utilizing
the technology as the centre of the learning experience. With the first case, the main question will
be on the effect of the presence of such technology and how it can affect the learning experience
and teacher-student interaction in the classroom. This option can work best if the task of collab-
oration around the table is carried out as one among many other types of group activities with
groups using the technology in an intermittent manner. It is worth noting that Rick et al. (2009b)
also reflected briefly on the issues of introducing new technologies into schools and specifically
tabletops, and their possible revolutionary effects on learning and pedagogical visions. Rick et al.
expressed an optimistic outlook for tabletops and argued that while previous technologies, such as
personal computers and interactive whiteboards, did not have the radical effects expected, digital

177
tabletops, with their inherently collaborative nature and support for small groups, have a lot to
promise.
The second case suggests a classroom with a tabletop for each group of students. A starting
point can be to have only one such collaborative laboratory in the school. All the tabletops, in ad-
dition to a main classroom computer that connects to a large vertical display, should connect to a
local network. With such a networked environment, it is possible to display different visualisations
(either privately to the teacher’s display, or publicly on the large vertical display) summarizing dif-
ferent aspects of the groups’ interactions. This makes it easy for the teacher to gain an overview of
the performance of the groups and identify the ones that need scaffolding. Moreover, this config-
uration can be utilized to increasing the students awareness’ of the performance of other groups.
This can be either through the large vertical display, or by allowing groups to show, upon request,
visualizations of the performance of other groups. With the network connecting groups of stu-
dents, rather than individuals, a number of new pedagogical questions arise, such as: What are
the effects of increasing students’ awareness of the performance of the other groups, and whether
this is a desirable feature or not? Is it better to aim at increasing the competitive spirit among
groups, or the collaborative spirit? If the aim is to increase the competitive spirit among groups,
then knowledge about the performance of other groups can increase motivation. On the other
hand, if the goal is to increase the collaborative nature of interaction, then it is possible to provide
features that allow students to exchange ideas between tables, or to temporarily swap the displays
of two tables so that two groups can look at each other’s work. While a number of researchers
investigated different methods for exchanging data between a tabletop and other external devices
(e.g. Shen et al., 2003; Streitz et al., 1999), no research that I know of addresses the issue of col-
laboration over interconnected tables. Indeed, Wellner (1993) and Ashdown and Robinson (2004)
allowed features of collaboration, but specifically for remote collaboration between individuals so
that each user sees what is displayed on the other users’ desks. The major challenge for addressing
the issues above is that such investigations must be carried out in the wild (by students in schools)
and not in laboratory environments.
On the other hand, my principal recommendations for extending work that is related to Digital
Mysteries lie int two directions: (1) the use of data visualization to support teacher awareness of
group and individual learning at tabletops, and (2) the extension of Digital Mysteries to support
writing.
One of the key advantages of digital tabletops, over traditional tables, is the ability to log the
interactions during the process. With Digital Mysteries, each session results in a rich corpus of
interaction data, which is currently being used only for playback of the session in the reflection
stage. Such interaction data can be visualized either dynamically, through the process, or as static
visualizations at the end of the process. Dynamic is used here to refer to visualizations that reflect,
in real-time, certain features of the interaction (an example in Digital Mysteries is the collaboration
pie chart that displays the level of participation). Static visualizations refer to ones that represent

178
a summary of different aspects of the interaction with time usually displayed spatially in a way
that gives an overall summary of the interaction or the problem solving process. Visualizations
can serve to make clear different aspects of the interaction, and for different types of audience
(i.e., for the students themselves or for the teacher). Information about the participation levels, the
distribution of work throughout the process (who is doing what), the quality of the solution, and
even the types of the thinking skills used can be extracted from the data and visualized. While
visualizations that are aimed for the students should be simple, serving as reflection tools for
different aspects of the interaction, more complicated visualizations can serve as indicators for the
teachers to the amount and type of scaffolding required for the students. It is even possible use
data from previous sessions to make visible patterns of change in the students’ bahaviour with the
repeated use of Digital Mysteries. Figure7.1 shows an example of a basic visualization from the
interaction data for a group of students while solving Digital Mysteries 2.
The second important research direction is in the field of collaborative writing. Each mystery
involves a strong narrative thread. By the end of the sequencing stage, students should have built
a layout that reflects their understanding of the mystery. Such a layout represents a good starting
point for students to write about different aspects related to the mystery. Following the process of
solving mysteries with a collaborative writing task has two potential benefits: (1) it can provide
a common context for the writing task based on the students’ shared experience in solving the
mystery, and (2) it can improve the quality of the solution of the Digital Mysteries itself. When
students realise that they will have to write an essay based on their solution, they will pay more
attention to the quality of their solution. Indeed, a shortcoming of the current design is that lower
achieving students in some cases focus on building a proper looking layout rather than on the
actual reasoning behind the layout. This approach uses Digital Mysteries as an introductory phase
to later writing tasks. Another approach is to modify the design of Digital Mysteries to support
collaborative writing more directly. In this approach the type of data in the mystery slips should be
more related to a narrative thread of an essay that the students are to write about than to a problem
to solve. Further investigation of this has already started by looking into using Digital Mysteries
in combination with a writing technique called writing frames (Lewis and Wray, 1996). Writing
frames are defined as “templates consisting of starters, connectives and sentence modifiers which
offer children a structure for communicating what they want to say” (Lewis and Wray, 1996, pp.2).
A starting point in doing this integration between Digital Mysteries and writing frames can be done
with simple modifications on the grouping and sequencing stages. The goal of the grouping stage
could be modified so that each group represent a paragraph. For the sequencing stage, the contents
of the paragraph are constructed from the slips and notes written by the students which are all
linked together using the sticky tape. Then the paragraphs (groups) are linked together using the
starters and connective sentences and modifiers obtained using a new dedicated tool. In this way,
the aim of the design will be to enable the students to build the structure of the essay in a visual and2This figure is taken from the initial work of Ammar Al-Qaraghuli

179
collaborative manner. As writing frames is not originally a collaborative writing tool, and since
little is known on how students write collaboratively in face to face settings, it is important to start
by observing how students perform collaborative writing tasks along the guidelines suggested
using paper, and proceed by following a similar iterative design process to that used in developing
Digital Mysteries.
Another more specific future research topic that relates to improving Digital Mysteries, is the
addition of planning activity to the task as discussed in section 7.3. Planning can be introduced
by providing the students with different alternatives as to how to solve the problem. When the
students are forced to make such decisions before carrying out the task, they are more likely to
become aware of the strategy they are using and of its impact on their performance. The benefits
of planning are expected to become more evident with repeated use where the students can try
different approaches and draw contrasts between them. As an example in Digital Mysteries, an
initial planning stage could give the students the options between dividing the problem into smaller
stages (reading, grouping, and sequencing) or combining two or all of the stages. This helps the
students in realizing, by practice, the advantages and disadvantages of each approach. An example
of pre-stage planning for the reading stage would be to give students options as to whether each
slip should be read by all students before moving to the next, or the slips should be divided between
the students.
In recent years, and with the growing use of the Internet technology, the focus of the computer
supported collaborative learning (CSCL) community has shifted away from face-to-face collabo-
ration and focused more on distributed networked settings. Digital tabletop technology, if utilized
well, can be the tool that will bring the attention of the CSCL research community back to face-
to-face technology supported collaborative learning. This work represents a small but significant
step toward achieving this goal.

180
Bibliography
Johnny Accot and Shumin Zhai. Beyond Fitts’ law: models for trajectory-based HCI tasks. In CHI
’97: Proceedings of the 1997 SIGCHI Conference on Human Factors in Computing Systems,
pages 295–302, 1997.
Johnny Accot and Shumin Zhai. Scale effects in steering law tasks. In CHI ’01: Proceedings of
the 2001 SIGCHI Conference on Human Factors in Computing Systems, pages 1–8, 2001.
Johnny Accot and Shumin Zhai. More than dotting the i’s — foundations for crossing-based
interfaces. In CHI ’02: Proceedings of the 2002 SIGCHI Conference on Human Factors in
Computing Systems, pages 73–80, 2002.
Georg Apitz and Francois Guimbretiere. CrossY: a crossing-based drawing application. In UIST
’04: Proceedings of the 17th Annual ACM Symposium on User Interface Software and Technol-
ogy, pages 3–12, 2004.
Mark Ashdown and Peter Robinson. A personal projected display. In MULTIMEDIA ’04: Pro-
ceedings of the 12th annual ACM international conference on Multimedia, pages 932–933,
2004.
MJ Baker and K. Lund. Promoting reflective interactions in a computer-supported collaborative
learning environment. Journal of Computer Assisted Learning, 13:175–193, 1997.
Ravin Balakrishnan and Ken Hinckley. The role of kinesthetic reference frames in two-handed
input performance. In UIST ’99: Proceedings of the 12th Annual ACM Symposium on User
Interface Software and Technology, pages 171–178, 1999.
Liam J. Bannon and Kjeld Schmidt. CSCW: four characters in search of a context. In ECSCW
’89: Proceedings of the First European Conference on Computer Supported Cooperative Work,
pages 358–372, 1989.
Tom Bartindale, Jonathan Hook, and Patrick Olivier. Media Crate: tangible live media production
interface. In TEI ’09: Proceedings of the Third International Conference on Tangible and
Embedded Interaction, pages 255–262, 2009.

181
Patrick Baudisch, Edward Cutrell, Dan Robbins, Mary Czerwinski, Peter Tandler, Benjamin Bed-
erson, and Alex Zierlinger. Drag-and-Pop and Drag-and-Pick: techniques for accessing remote
screen content on touch- and pen-operated systems. In Proceedings of Interact 2003, pages
57–64, 2003.
Eric A. Bier, Maureen C. Stone, Ken Pier, William Buxton, and Tony D. DeRose. Toolglass and
magic lenses: the see-through interface. In SIGGRAPH ’93: Proceedings of the 20th Annual
Conference on Computer Graphics and Interactive Techniques, pages 73–80, 1993.
J.P. Birnholtz, T. Grossman, C. Mak, and R. Balakrishnan. An exploratory study of input config-
uration and group process in a negotiation task using a large display. In CHI ’07: Proceedings
of the 2007 SIGCHI Conference on Human Factors in Computing Systems, page 100, 2007.
C. H. Blickenstorfer. Graffiti: wow! Pen Computing Magazine, pages 30–31, 1995.
Sara A. Bly. A use of drawing surfaces in different collaborative settings. In CSCW ’88: Proceed-
ings of the 1988 ACM Conference on Computer-Supported Cooperative Work, pages 250–256,
1988.
Susanne Bødker. A human activity approach to user interfaces. Human-Computer Interaction, 4
(3):171–195, 1989.
Tom Boyle. Design for Multimedia Learning. Prentice Hall, 1997.
Peter Brandl, Clifton Forlines, Daniel Wigdor, Michael Haller, and Chia Shen. Combining and
measuring the benefits of bimanual pen and direct-touch interaction on horizontal interfaces. In
AVI ’08: Proceedings of the Working Conference on Advanced Visual Interfaces, pages 154–
161, 2008.
W. Buxton. Two-handed document navigation. XEROX Disclosure Journal, 19(2):103–108, 1994.
W. Buxton and B. Myers. A study in two-handed input. SIGCHI Bulletin, 17(4):321–326, 1986.
William A. S. Buxton. Chunking and phrasing and the design of human-computer dialogues.
Human-Computer Interaction: Toward the Year 2000, pages 494–499, 1995.
X. Cao, A.D. Wilson, R. Balakrishnan, K. Hinckley, and S.E. Hudson. ShapeTouch: leverag-
ing contact shape on interactive surfaces. In TABLETOP ’08: Proceedings of the Third IEEE
International Workshop on Horizontal Interactive Human-Computer Systems, pages 129–136,
2008.
Alessandro Cappelletti, Giulia Gelmini, Fabio Pianesi, Franca Rossi, and Massimo Zancanaro.
Enforcing cooperative storytelling: first studies. In ICALT ’04: Proceedings of the IEEE Inter-
national Conference on Advanced Learning Technologies, pages 281–285, 2004.

182
A.W. Chickering and S.C. Ehrmann. Implementing the seven principles: technology as lever.
AAHE Bulletin, 49:3–6, 1996.
A.W. Chickering and Z.F. Gamson. Seven principles for good practice in undergraduate education.
AAHE Bulletin, 39(7):3–7, 1987.
A. Collins and J. S. Brown. The computer as a tool for learning through reflection. Learning
Issues for Intelligent Tutoring Systems, pages 1–18, 1988.
C. Crook. Computers and the collaborative experience of learning. Routledge, 1994.
Paul Dietz and Darren Leigh. DiamondTouch: a multi-user touch technology. In UIST ’01:
Proceedings of the 14th Annual ACM Symposium on User Interface Software and Technology,
pages 219–226, 2001.
P. Dillenbourg. What do you mean by collaborative learning? In P. Dillenbourg (Ed)
Collaborative-learning: Cognitive and Computational Approaches, chapter 1, pages 1–19. El-
sevier, 1999.
Morgan Dixon, Francois Guimbretiere, and Nicholas Chen. Optimal parameters for efficient
crossing-based dialog boxes. In CHI ’08: Proceedings of the 2008 SIGCHI Conference on
Human Factors in Computing Systems, pages 1623–1632, 2008.
S Do-Lenh, F Kaplan, and P Dillenbourg. Paper-based concept map: the effects of tabletop on
an expressive collaborative learning task. In BCS HCI ’09: Proceedings of the 2009 British
Computer Society Conference on Human-Computer Interaction, pages 149–158, 2009.
CG Drury. Movements with lateral constraint. Ergonomics, 14:293–305, 1971.
A. Dvorak, N. L. Merrick, W. L. Dealey, and G. C. Ford. Typewriting Behaviour. American Book
Company, 1936.
Katherine Everitt, Chia Shen, Kathy Ryall, and Clifton Forlines. MultiSpace: enabling electronic
document micro-mobility in table-centric, multi-device environments. In TABLETOP ’06: Pro-
ceedings of the First IEEE International Workshop on Horizontal Interactive Human-Computer
Systems, pages 27–34, 2006.
P.M. Fitts. The information capacity of the human motor system in controlling the amplitude of
movement. Journal of Experimental Psychology, 47(6):381–391, 1954.
George W. Fitzmaurice, Hiroshi Ishii, and William A. S. Buxton. Bricks: laying the foundations
for graspable user interfaces. In CHI ’95: Proceedings of the 1995 SIGCHI Conference on
Human Factors in Computing Systems, pages 442–449, 1995.

183
Morten Fjeld, Kristina Lauche, Martin Bichsel, Fred Voorhorst, Helmut Krueger, and Matthias
Rauterberg. Physical and virtual tools: activity theory applied to the design of groupware.
Computer Supported Cooperative Work, 11(1-2):153–180, 2002.
R. Fleck, Y. Rogers, N. Yuill, P. Marshall, A. Carr, J. Rick, and V. Bonnett. Actions speak loudly
with words: unpacking collaboration around the table. In ITS ’09: Proceedings of the ACM
International Conference on Interactive Tabletops and Surfaces, pages 189–196, 2009.
Clifton Forlines, Daniel Wigdor, Chia Shen, and Ravin Balakrishnan. Direct-touch vs. mouse
input for tabletop displays. In CHI ’07: Proceedings of the 2007 SIGCHI Conference on Human
Factors in Computing Systems, pages 647–656, 2007.
Jorg Gei. Shuffle, throw or take it! working efficiently with an interactive wall. In CHI ’98: CHI
98 Conference Summary on Human Factors in Computing Systems, pages 265–266, 1998.
David Goldberg and Cate Richardson. Touch-typing with a stylus. In CHI ’93: Proceedings of
the INTERACT ’93 and CHI ’93 Conference on Human Factors in Computing Systems, pages
80–87, 1993.
Y. Guiard. Asymmetric division of labor in human skilled bimanual action: the kinematic chain
as a model. Journal of Motor Behavior, 19:486–517, 1987.
Francois Guimbretiere and Terry Winograd. FlowMenu: combining command, text, and data en-
try. In UIST ’00: Proceedings of the 13th Annual ACM Symposium on User Interface Software
and Technology, pages 213–216, 2000.
Carl Gutwin and Saul Greenberg. The mechanics of collaboration: developing low cost usability
evaluation methods for shared workspaces. In WETICE ’00: Proceedings of the 9th IEEE
International Workshops on Enabling Technologies, pages 98–103, 2000.
V. Ha, K.M. Inkpen, R.L. Mandryk, and T. Whalen. Direct intentions: the effects of input devices
on collaboration around a tabletop display. In TABLETOP ’06: Proceedings of the First IEEE
International Workshop on Horizontal Interactive Human-Computer Systems, pages 177–84,
2006.
Christine A. Halverson. Activity theory and distributed cognition: or what does CSCW need to
do with theories? Computer Supported Cooperative Work, 11(1-2):243–267, 2002.
Jefferson Y. Han. Low-cost multi-touch sensing through frustrated total internal reflection. In
UIST ’05: Proceedings of the 18th Annual ACM Symposium on User Interface Software and
Technology, pages 115–118, 2005.
A. Harris, J. Rick, V. Bonnett, N. Yuill, R. Fleck, P. Marshall, and Y. Rogers. Around the table:
are multiple-touch surfaces better than single-touch for children’s collaborative interactions? In

184
CSCL’09: Proceedings of the Ninth International Conference on Computer Supported Collab-
orative Learning, pages 335–344, 2009.
J. Hattie. What is the nature of evidence that makes a difference to learning? In Australian Council
for Educational Research Conference ‘Using Data to Support Learning’, 2005.
John Hattie and Helen Timperley. The power of feedback. Review of Educational Research, 77
(1):81–112, March 2007.
S. Higgins, V. Baumfield, M. Lin, D. Moseley, M. Butterworth, G. Downey, M. Gregson, I. Ober-
ski, M Rockett, and D Thacker. Thinking skills approaches to effective teaching and learning:
what is the evidence for impact on learners. research evidence in education library. Technical re-
port, EPPI-Centre, Social Science Research Unit,Institute of Education, University of London,
2004.
Otmar Hilliges, Lucia Terrenghi, Sebastian Boring, David Kim, Hendrik Richter, and Andreas
Butz. Designing for collaborative creative problem solving. In C&C ’07: Proceedings of the
6th ACM SIGCHI Conference on Creativity & Cognition, pages 137–146, 2007.
Ken Hinckley, Randy Pausch, Dennis Proffitt, and Neal F. Kassell. Two-handed virtual manipula-
tion. ACM Transactions on Computer-Human Interaction, 5(3):260–302, 1998.
Uta Hinrichs, Sheelagh Carpendale, and Stacey D. Scott. Interface currents: supporting fluent
face-to-face collaboration. In SIGGRAPH ’05: ACM SIGGRAPH 2005 Sketches, page 142,
2005.
Uta Hinrichs, Mark Hancock, Christopher Collins, and Sheelagh Carpendale. Examination of
text-entry methods for tabletop displays. In TABLETOP ’07: Proceedings of the Second IEEE
International Workshop on Horizontal Interactive Human-Computer Systems, pages 105–112,
2007.
Uta Hinrichs, Holly Schmidt, Tobias Isenberg, Mark Hancock, and Sheelagh Carpendale. Bubble-
Type: Enabling text entry within a walk-up tabletop installation. Technical report, University
of Calgary, 2008.
Johannes Hirche, Peter Bomark, Mikael Bauer, and Pawel Solyga. Adaptive interface for text
input on large-scale interactive surfaces. In TABLETOP ’08: Proceedings of the Third IEEE
International Workshop on Horizontal Interactive Human-Computer Systems, pages 163–166,
2008.
James Hollan, Edwin Hutchins, and David Kirsh. Distributed cognition: toward a new foundation
for human-computer interaction research. ACM Transactions on Computer-Human Interaction,
7(2):174–196, 2000.

185
Don Hopkins. The design and implementation of pie menus. Dr. Dobb’s Journal, 16(12):16–26,
1991.
E. Hornecker, P. Marshall, N.S. Dalton, and Y. Rogers. Collaboration and interference: awareness
with mice or touch input. In CSCW ’08: Proceedings of the 2008 ACM Conference on Computer
Supported Cooperative Work, pages 167–176, 2008.
Eva Hornecker, Paul Marshall, and Yvonne Rogers. From entry to access: how shareability comes
about. In DPPI ’07: Proceedings of the 2007 Conference on Designing Pleasurable Products
and Interfaces, pages 328–342, 2007.
Edwin L. Hutchins, James D. Hollan, and Donald A. Norman. Direct manipulation interfaces.
Human-Computer Interaction, 1(4):311–338, 1985.
Patrick Jermann, Amy Soller, and Martin Muehlenbrock. From mirroring to guiding: a review
of state of the art technology for supporting collaborative learning. In Proceedings of the First
European Conference on Computer-Supported Collaborative Learning, pages 324–331, 2001.
Sergi Jorda, Gunter Geiger, Marcos Alonso, and Martin Kaltenbrunner. The reacTable: exploring
the synergy between live music performance and tabletop tangible interfaces. In TEI ’07: Pro-
ceedings of the First International Conference on Tangible and Embedded Interaction, pages
139–146, 2007.
L. Jun, D. Pinelle, C. Gutwin, and S. Subramanian. Improving digital handoff in shared tabletop
workspaces. In TABLETOP ’08: Proceedings of the Third IEEE International Workshop on
Horizontal Interactive Human-Computer Systems, pages 9–16, 2008.
Martin Kaltenbrunner and Ross Bencina. reacTIVision: a computer-vision framework for table-
based tangible interaction. In TEI ’07: Proceedings of the First International Conference on
Tangible and Embedded Interaction, pages 69–74, 2007.
Victor Kaptelinin. Activity theory: implications for human-computer interaction. In Context
and Consciousness: Activity Theory and Human-Computer Interaction, pages 103–116. Mas-
sachusetts Institute of Technology, 1995.
Madhur Khandelwal and Ali Mazalek. Teaching table: a tangible mentor for pre-k math educa-
tion. In TEI ’07: Proceedings of the First International Conference on Tangible and Embedded
Interaction, pages 191–194, 2007.
David Kirsh. The intelligent use of space. Artificial Intelligence, 73(1-2):31–68, 1995.
K.S. Kitchener. Cognition, metacognition, and epistemic cognition: a three-level model of cogni-
tive processing. Human Development, 26(4):222–232, 1983.

186
M. L. Knapp and J. A. Daly. Handbook of Interpersonal Communication. SAGE, 3rd edition,
2002.
R. Kruger, S. Carpendale, and S. Greenberg. Collaborating over physical and electronic tables. In
Extended Abstract of CSCW, volume 2, pages 139–140, 2002.
Russell Kruger, Sheelagh Carpendale, Stacey D. Scott, and Saul Greenberg. How people use
orientation on tables: comprehension, coordination and communication. In GROUP ’03: Pro-
ceedings of the 2003 International ACM SIGGROUP Conference on Supporting Group Work,
pages 369–378, 2003.
Russell Kruger, Sheelagh Carpendale, Stacey D. Scott, and Saul Greenberg. Roles of orientation in
tabletop collaboration: comprehension, coordination and communication. Computer Supported
Cooperative Work, 13(5-6):501–537, 2004.
Russell Kruger, Sheelagh Carpendale, Stacey D. Scott, and Anthony Tang. Fluid integration of
rotation and translation. In CHI ’05: Proceedings of the 2005 SIGCHI Conference on Human
Factors in Computing Systems, pages 601–610, 2005.
Gordon Paul Kurtenbach. The design and evaluation of marking menus. PhD thesis, University
of Toronto, Toronto, Ont., Canada, Canada, 1993.
Kari Kuutti. Activity theory as a potential framework for human-computer interaction research. In
Context and Consciousness: Activity Theory and Human-Computer Interaction, pages 17–44.
Massachusetts Institute of Technology, 1995.
D. Leat and A. Nicholas. Brains on the table: diagnostic and formative assessment through obser-
vation. Assessment in Education: Principles, Policy and Practice, 7(1):103–121, march 2000.
Andrea Leganchuk, Shumin Zhai, and William Buxton. Manual and cognitive benefits of two-
handed input: an experimental study. ACM Transactions on Computer-Human Interaction, 5
(4):326–359, 1998.
E. Lehtinen. Computer-supported collaborative learning: an approach to powerful learning envi-
ronments. Powerful Learning Environments: Unravelling Basic Components and Dimensions,
pages 35–53, 2003.
M. Lewis and D. Wray. Writing frames. Reading, UK: Reading and Language Information Centre,
University of Reading, 1996.
Lasse Lipponen. Exploring foundations for computer-supported collaborative learning. In CSCL
’02: Proceedings of the Conference on Computer Support for Collaborative Learning, pages
72–81, 2002.

187
I. Scott MacKenzie and Shawn X. Zhang. The design and evaluation of a high-performance soft
keyboard. In CHI ’99: Proceedings of the 1999 SIGCHI Conference on Human Factors in
Computing Systems, pages 25–31, 1999.
I. Scott MacKenzie and Shawn X. Zhang. An empirical investigation of the novice experience
with soft keyboards. Behaviour & Information Technology, 20(6), pages 411–418, 2001.
I.S. MacKenzie and R.W. Soukoreff. Text entry for mobile computing: models and methods,
theory and practice. Human-Computer Interaction, 17(2):147–198, 2002.
Laurent Magnien, Jean Leon Bouraoui, and Nadine Vigouroux. Mobile devices: soft keyboard
text-entry enhanced by visual cues. In UbiMob ’04: Proceedings of the 1st French-Speaking
Conference on Mobility and Ubiquity Computing, pages 158–165, 2004.
E.I. Mansor, A. De Angeli, and O. De Bruijn. Little fingers on the tabletop: a usability evaluation
in the kindergarten. In TABLETOP ’08: Proceedings of the Third IEEE International Workshop
on Horizontal Interactive Human-Computer Systems, pages 93–96, 2008.
Paul Marshall, Eva Hornecker, Richard Morris, Nick Sheep Dalton, and Yvonne Rogers. When
the fingers do the talking: a study of group participation with varying constraints to a table-
top interface. In TABLETOP ’08: Proceedings of the Third IEEE International Workshop on
Horizontal Interactive Human-Computer Systems, pages 33–40, 2008.
J.M. Mazur. Conversation analysis for educational technologists: theoretical and methodologi-
cal issues for researching the structures, processes and meaning of on-line talk. Handbook of
Research on Educational Communications and Technology, pages 1073–1098, 2004.
C. McGuinness. From thinking skills to thinking classrooms. DFEE Research Brief, 115, 1999.
Microsoft. Microsoft Surface data sheet, June 2010. URL
http://go.microsoft.com/?linkid=9686793.
Michael Morgan and Matthew Butler. Considering multi-touch display technology for collab-
oration in the classroom. In EDMEDIA ’09: Proceedings of the 2009 World Conference on
Educational Multimedia, Hypermedia and Telecommunications, pages 674–683, 2009.
Meredith R. Morris. Supporting Effective Interaction with Tabletop Groupware. PhD thesis,
Stanford University, Computer Science Department, Stanford, CA, USA, April 2006.
Meredith Ringel Morris, Kathy Ryall, Chia Shen, Clifton Forlines, and Frederic Vernier. Beyond
“social protocols”: multi-user coordination policies for co-located groupware. In CSCW ’04:
Proceedings of the 2004 ACM Conference on Computer Supported Cooperative Work, pages
262–265, 2004.

188
Meredith Ringel Morris, Anthony Cassanego, Andreas Paepcke, Terry Winograd, Ann Marie
Piper, and Anqi Huang. Mediating group dynamics through tabletop interface design. IEEE
Computer Graphics and Applications, 26(5):65–73, 2006a.
Meredith Ringel Morris, Andreas Paepcke, Terry Winograd, and Jeannie Stamberger. TeamTag:
exploring centralized versus replicated controls for co-located tabletop groupware. In CHI ’06:
Proceedings of the 2006 SIGCHI Conference on Human Factors in Computing Systems, pages
1273–1282, 2006b.
D. Moseley, J. Elliott, M. Gregson, and S. Higgins. Thinking skills frameworks for use in educa-
tion and training. British Educational Research Journal, pages 367–390, 2005.
Christian Muller-Tomfelde and Claudia Schremmer. Touchers and mousers: commonalities and
differences in co-located collaboration with multiple input devices. In CHI ’08: Proceedings
of the 2008 SIGCHI Conference on Human Factors in Computing Systems, pages 1149–1152,
2008.
Bonnie A. Nardi. Studying context: a comparison of activity theory, situated action models, and
distributed cognition. In Context and Consciousness: Activity Theory and Human-Computer
Interaction, pages 69–102. Massachusetts Institute of Technology, 1995.
D.A. Norman. The design of future things. Basic Books, 2007.
Donald A. Norman. Things that make us smart: defending human attributes in the age of the
machine. Addison-Wesley Longman Publishing Co., Inc., 1993.
M. A. Norman and P. J. Thomas. Informing HCI design through conversation analysis. Interna-
tional Journal of Man-Machine Studies, 35(2):235–250, 1991.
Cesar A. A. Nunes, Marina M. R. Nunes, and Claudia Davis. Assessing the inaccessible: metacog-
nition and attitudes. Assessment in Education: Principles, Policy and Practice, 10(3):375–388,
November 2003.
Kenton O’Hara and Abigail Sellen. A comparison of reading paper and on-line documents. In CHI
’97: Proceedings of the 1997 SIGCHI Conference on Human Factors in Computing Systems,
pages 335–342, 1997.
James Patten and Hiroshi Ishii. Mechanical constraints as computational constraints in tabletop
tangible interfaces. In CHI ’07: Proceedings of the 2007 SIGCHI Conference on Human Fac-
tors in Computing Systems, pages 809–818, 2007.
James Patten, Hiroshi Ishii, Jim Hines, and Gian Pangaro. Sensetable: a wireless object tracking
platform for tangible user interfaces. In CHI ’01: Proceedings of the 2001 SIGCHI Conference
on Human Factors in Computing Systems, pages 253–260, 2001.

189
A. Pease. Body language: how to read others’ thoughts by their gestures. Sheldon press, 1981.
Ken Perlin. Quikwriting: continuous stylus-based text entry. In UIST ’98: Proceedings of the 11th
Annual ACM Symposium on User Interface Software and Technology, pages 215–216, 1998.
Mark Perry. HCI Models, Theories, and Frameworks, chapter Chapter 8: Distributed cognition.
Morgan Kaufmann, 2003.
D. Pinelle, T. Stach, and C. Gutwin. TableTrays: temporary, reconfigurable work surfaces for
tabletop groupware. In TABLETOP ’08: Proceedings of the Third IEEE International Workshop
on Horizontal Interactive Human-Computer Systems, pages 41–48, 2008.
David Pinelle, Carl Gutwin, and Saul Greenberg. Task analysis for groupware usability evaluation:
modeling shared-workspace tasks with the mechanics of collaboration. ACM Transactions on
Computer-Human Interaction, 10(4):281–311, 2003.
Anne M. Piper, Eileen O’Brien, Meredith R. Morris, and Terry Winograd. SIDES: a cooperative
tabletop computer game for social skills development. In CSCW ’06: Proceedings of the 20th
Conference on Computer Supported Cooperative Work, pages 1–10, 2006.
Anne Marie Piper and James D. Hollan. Tabletop displays for small group study: affordances of
paper and digital materials. In CHI ’09: Proceedings of the 27th International Conference on
Human Factors in Computing Systems, pages 1227–1236, 2009.
R. Ploetzner, P. Dillenbourg, M. Preier, and D. Traum. Learning by explaining to oneself and
to others. In P. Dillenbourg (Ed) Collaborative-Learning: Cognitive and Computational Ap-
proaches, chapter 6, pages 103–121. 1999.
Stuart Pook, Eric Lecolinet, Guy Vaysseix, and Emmanuel Barillot. Control menus: execution
and control in a single interactor. In CHI ’00: CHI ’00 Extended Abstracts on Human Factors
in Computing Systems, pages 263–264, 2000.
Jun Rekimoto, Brygg Ullmer, and Haruo Oba. DataTiles: a modular platform for mixed physical
and graphical interactions. In CHI ’01: Proceedings of the 2001 SIGCHI Conference on Human
Factors in Computing Systems, pages 269–276, 2001.
Paul Resta and Therese Laferriere. Technology in support of collaborative learning. Educational
Psychology Review, 19(1):65–83, March 2007.
J. Rick, A. Harris, P. Marshall, R. Fleck, N. Yuill, and Y. Rogers. Children designing together
on a multi-touch tabletop: an analysis of spatial orientation and user interactions. In IDC ’09:
Proceedings of the 8th International Conference on Interaction Design and Children, pages
106–114, 2009a.

190
J. Rick, Y. Rogers, C. Haig, and N. Yuill. Learning by doing with shareable interfaces. Children,
Youth and Environments, 19(1):321–342, 2009b.
Jochen Rick and Yvonne Rogers. From DigiQuilt to DigiTile: adapting educational technology to
a multi-touch table. In TABLETOP ’08: Proceedings of the Third IEEE International Workshop
on Horizontal Interactive Human-Computer Systems, pages 73–80, 2008.
Meredith Ringel, Kathy Ryall, Chia Shen, Clifton Forlines, and Frederic Vernier. Release, relo-
cate, reorient, resize: fluid techniques for document sharing on multi-user interactive tables. In
CHI ’04: CHI ’04 Extended Abstracts on Human Factors in Computing Systems, pages 1441–
1444, 2004.
Y. Rogers and J. Ellis. Distributed cognition: an alternative framework for analysing and explain-
ing collaborative working. Journal of Information Technology, 9(2):119+, 1994.
Yvonne Rogers and Sian Lindley. Collaborating around large interactive displays: which way is
best to meet? Interacting with Computers, 16(6):1133–1152, 2004.
Jeremy Roschelle and Stephanie D. Teasley. The construction of shared knowledge in collabo-
rative problem solving, pages 69–97. Computer Supported Collaborative Learning. Springer-
Verlag, 1995.
Kathy Ryall, Clifton Forlines, Chia Shen, and Meredith Ringel Morris. Exploring the effects of
group size and table size on interactions with tabletop shared-display groupware. In CSCW
’04: Proceedings of the 2004 ACM Conference on Computer Supported Cooperative Work,
pages 284–293, 2004.
Kathy Ryall, Clifton Forlines, Chia Shen, Meredith Ringel Morris, and Katherine Everitt. Expe-
riences with and observations of direct-touch tabletops. In TABLETOP ’06: Proceedings of the
First IEEE International Workshop on Horizontal Interactive Human-Computer Systems, pages
89–96, 2006.
T. Sato, K. Fukuchi, and H. Koike. Implementation and evaluations of vision-based finger flicking
gesture recognition for tabletops. In TABLETOP ’08: Proceedings of the Third IEEE Interna-
tional Workshop on Horizontal Interactive Human-Computer Systems, pages 137–144, 2008.
G. Schraw, M.E. Dunkle, and L.D. Bendixen. Cognitive processes in well-defined and ill-defined
problem solving. Applied Cognitive Psychology, 9(6):523–538, 1995.
G. Schraw, K.J. Crippen, and K. Hartley. Promoting self-regulation in science education: metacog-
nition as part of a broader perspective on learning. Research in Science Education, 36(1):111–
139, 2006.

191
Stacey D. Scott. Territory-based interaction techniques for tabletop collaboration. UIST 2003 Doc-
toral Constorium Paper, in Conference Supplement of the ACM Symposium on User Interface
Software and Technology, 2003.
Stacey D. Scott, Karen D. Grant, and Regan L. Mandryk. System guidelines for co-located,
collaborative work on a tabletop display. In ECSCW ’03: Proceedings of the Eighth Conference
on European Conference on Computer Supported Cooperative Work, pages 159–178, 2003.
Stacey D. Scott, M. Sheelagh, T. Carpendale, and Kori M. Inkpen. Territoriality in collaborative
tabletop workspaces. In CSCW ’04: Proceedings of the 2004 ACM Conference on Computer
Supported Cooperative Work, pages 294–303, 2004.
Stacey D. Scott, M. Sheelagh T. Carpendale, and Stefan Habelski. Storage Bins: mobile storage
for collaborative tabletop displays. IEEE Computer Graphics and Applications, 25(4):58–65,
2005.
Anna Sfard. On two metaphors for learning and the dangers of choosing just one. Educational
Researcher, 27(2):4–13, March 1998.
Chia Shen, Katherine Everitt, and Kathleen Ryall. UbiTable: impromptu face-to-face collabora-
tion on horizontal interactive surfaces. In UbiComp ’03: Proceedings of the Fifth International
Conference on Ubiquitous Computing, pages 281–288, 2003.
RJW Sluis, I. Weevers, C. van Schijndel, L. Kolos-Mazuryk, S. Fitrianie, and J. Martens. Read-It:
five-to-seven-year-old children learn to read in a tabletop environment. In IDC ’04: Proceedings
of the 2004 Conference on Interaction Design and Children, pages 73–80, 2004.
SMART. SMART table specifications, June 2010. URL
http://downloads01.smarttech.com/media/sitecore/en/support/
product/smarttable/230i/specsheets/smarttablespec230iv5nov09.pdf.
Amy S. Soller. Supporting social interaction in an intelligent collaborative learning system. Inter-
national Journal of Artificial Intelligence in Education, 12(1):40–62, 2001.
Gerry Stahl. Group Cognition: Computer Support for Building Collaborative Knowledge. MIT
Press, 2006.
Jason Stewart, Benjamin B. Bederson, and Allison Druin. Single display groupware: a model for
co-present collaboration. In CHI ’99: Proceedings of the 1999 SIGCHI Conference on Human
Factors in Computing Systems, pages 286–293, 1999.
Norbert A. Streitz, Jorg Gei, Torsten Holmer, Shin’ichi Konomi, Christian Muller-Tomfelde,
Wolfgang Reischl, Petra Rexroth, Peter Seitz, and Ralf Steinmetz. i-land: an interactive land-
scape for creativity and innovation. In CHI ’99: Proceedings of the SIGCHI conference on
Human factors in computing systems, pages 120–127, 1999.

192
Anthony Tang, Melanie Tory, Barry Po, Petra Neumann, and Sheelagh Carpendale. Collaborative
coupling over tabletop displays. In CHI ’06: Proceedings of the 2006 SIGCHI Conference on
Human Factors in Computing Systems, pages 1181–1190, 2006.
John C. Tang. Findings from observational studies of collaborative work. International Journal
of Man-Machine Studies, 34(2):143–160, 1991.
Lucia Terrenghi, David Kirk, Abigail Sellen, and Shahram Izadi. Affordances for manipulation
of physical versus digital media on interactive surfaces. In CHI ’07: Proceedings of the 2007
SIGCHI Conference on Human Factors in Computing Systems, pages 1157–1166, 2007.
Aaron Toney and Bruce H. Thomas. Applying reach in direct manipulation user interfaces. In
OZCHI ’06: Proceedings of the 18th Australia conference on Computer-Human Interaction,
pages 393–396, 2006a.
Aaron Toney and Bruce H. Thomas. Considering reach in tangible and table top design. In
TABLETOP ’06: Proceedings of the First IEEE International Workshop on Horizontal Interac-
tive Human-Computer Systems, pages 57–58, 2006b.
Edward Tse, Jonathan Histon, Stacey D. Scott, and Saul Greenberg. Avoiding interference: how
people use spatial separation and partitioning in SDG workspaces. In CSCW ’04: Proceedings
of the 2004 ACM Conference on Computer Supported Cooperative Work, pages 252–261, 2004.
Brygg Ullmer and Hiroshi Ishii. The metaDESK: models and prototypes for tangible user in-
terfaces. In UIST ’97: Proceedings of the 10th Annual ACM Symposium on User Interface
Software and Technology, pages 223–232, 1997.
Jos Van Der Linden, G. Erkens, H. Schmidt, and P. Renshaw. Collaborative learning. In Robert-
Jan Simons, Jos van der Linden and Tom Duffy (Ed) New learning, chapter 3, pages 37–54.
Springer Netherlands, 2000.
M.V.J. Veenman, B.H.A.M. Van Hout-Wolters, and P. Afflerbach. Metacognition and learning:
conceptual and methodological considerations. Metacognition and Learning, 1(1):3–14, 2006.
Frederic Vernier, Neal Lesh, and Chia Shen. Visualization techniques for circular tabletop inter-
faces. In AVI ’02: Proceedings of the Working Conference on Advanced Visual Interfaces, pages
257–265, 2002.
L.S. Vygotskiı, LS Vygotsky, and M. Cole. Mind in society: the development of higher psycho-
logical processes. Harvard Univ Pr, 1978.
J.R. Wallace and S.D. Scott. Contextual design considerations for co-located, collaborative ta-
bles. In TABLETOP ’08: Proceedings of the Third IEEE International Workshop on Horizontal
Interactive Human-Computer Systems, pages 57–64, 2008.

193
David J. Ward, Alan F. Blackwell, and David J. C. MacKay. Dasher—a data entry interface using
continuous gestures and language models. In UIST ’00: Proceedings of the 13th Annual ACM
Symposium on User Interface Software and Technology, pages 129–137, 2000.
Malte Weiss, Julie Wagner, Yvonne Jansen, Roger Jennings, Ramsin Khoshabeh, James D. Hollan,
and Jan Borchers. SLAP widgets: bridging the gap between virtual and physical controls on
tabletops. In CHI ’09: Proceedings of the 27th International Conference on Human Factors in
Computing Systems, pages 481–490, 2009.
Pierre Wellner. Interacting with paper on the digitaldesk. Communications of the ACM, 36(7):
87–96, 1993.
Daniel Wigdor and Ravin Balakrishnan. Empirical investigation into the effect of orientation on
text readability in tabletop displays. In ECSCW ’05: Proceedings of the Ninth Conference on
European Conference on Computer Supported Cooperative Work, pages 205–224, 2005.
Daniel Wigdor, Gerald Penn, Kathy Ryall, Alan Esenther, and Chia Shen. Living with a tabletop:
analysis and observations of long term office use of a multi-touch table. In TABLETOP ’07:
Proceedings of the Second IEEE International Workshop on Horizontal Interactive Human-
Computer Systems, pages 60–67, 2007.
Andrew D. Wilson, Shahram Izadi, Otmar Hilliges, Armando Garcia-Mendoza, and David Kirk.
Bringing physics to the surface. In UIST ’08: Proceedings of the 21st Annual ACM Symposium
on User Interface Software and Technology, pages 67–76, 2008.
Terry Winograd and Francois Guimbretiere. Visual instruments for an interactive mural. In CHI
’99: CHI ’99 Extended Abstracts on Human Factors in Computing Systems, pages 234–235,
1999.
R. Wooffitt. On the analysis of interaction: an introduction to conversation analysis. Computers
and Conversation, pages 7–38, 1990.
Ana Zanella and Saul Greenberg. Reducing interference in single display groupware through
transparency. In ECSCW ’01: Proceedings of the Seventh Conference on European Conference
on Computer Supported Cooperative Work, pages 339–358, 2001.
Shumin Zhai and Per-Ola Kristensson. Shorthand writing on stylus keyboard. In CHI ’03: Pro-
ceedings of the 2003 SIGCHI Conference on Human Factors in Computing Systems, pages
97–104, 2003.

194
Appendix A

195
Mysteries data
A.1 Will Kyle skip school on Friday? and why?
A.1.1 The slips

196

197

198

199

200
A.1.2 The meta-data<?xml version=’1.0’ encoding=’utf-8’?>
<helpData><theQuestion>
Will Kyle skip school on Friday?</theQuestion><redherrings>9 27</redherrings><notVeryUseful>18</notVeryUseful><useful>
2 3 4 5 6 7 8 14 15 19 20 21 22 23 24 25 26 28 29 30</useful><mustBeTogether>
<g>26 8 6 20</g><g>22 5 23</g><g>24 21 25 4 3</g><g>19 7</g>
</mustBeTogether><hints>
<h>Part of the sequence can be slip (22), then slip (5),then slip (23).
</h><h>
Did Kyle read the last message he got from James?</h><h>
Who are the main characters, and what are theirrelationships?
</h><h>
When does Kyle have to deliver the website?</h><h>
It might help to list seperately the reasons to goand not to go.
</h></hints>
</helpData>

201
A.2 Why did Vicky get clamped?
A.2.1 The slips

202
A.2.2 The meta-data<?xml version=’1.0’ encoding=’utf-8’?>
<helpData><theQuestion>
Why did Vicky get clamped?</theQuestion><redherrings></redherrings><notVeryUseful></notVeryUseful><useful></useful><mustBeTogether>
<g></g></mustBeTogether><hints>
<h>You can start with slip (23), followed by (6), then (30)and build on that.
</h><h>
Why did vicky park for a long period of time.</h>
</hints></helpData>

203
A.3 Who killed king Ted?
A.3.1 The slips

204

205

206

207
A.3.2 The meta-data<?xml version=’1.0’ encoding=’utf-8’?>
<helpData><theQuestion>
Who killed king Ted?</theQuestion><redherrings>10</redherrings><notVeryUseful>4</notVeryUseful><useful>
1 2 3 5 6 7 8 9 11 12 13 14 15 16 17 18 19 20 21 22 23 24</useful><mustBeTogether>
<g>15 19 22</g><g>8 23 24</g><g>1 13 20</g><g>11 17 18 21</g><g>3 7 12</g><g>5 9</g>
</mustBeTogether><hints>
<h>You can start with slip (4), then (13), then (20) andbuild on that.
</h><h>
Determine the time of death from the body’s temperature.</h><h>
If Bob the robber was going to the castle. When did hearrive there?
</h><h>
What was king Ted watching on TV when he died?</h><h>
How much of the medicine did king Ted drink? Is thisamount dangerous?
</h><h>
Why was lord Leek keen to bet?</h>
</hints></helpData>

208
A.4 Should Annie leave Windy Creek or should she stay? And why?
A.4.1 The slips

209

210
A.4.2 The meta-data<?xml version=’1.0’ encoding=’utf-8’?>
<helpData><theQuestion>
Should Annie leave Windy Creek or should she stay?And why?
</theQuestion><mustBeTogether>
<g>3 9 12</g><g>4 8 15</g><g>11 14</g>
</mustBeTogether><hints>
<h>You can build a sequence about Windy Creek by starting withslip number 16, then slip 7, then slip 1, and continue.
</h></hints>
</helpData>

211
A.5 Why did Oliver decide to join up?
A.5.1 The slips

212

213

214
A.5.2 The meta-data<?xml version=’1.0’ encoding=’utf-8’?>
<helpData><theQuestion>
Why did Oliver decide to join up?</theQuestion><mustBeTogether>
<g>2 6 14</g><g>9 13</g><g>4 10 25</g>
</mustBeTogether><hints>
<h>You can start with the following sequence: 1, 7, 6, 14,and so on.
</h></hints>
</helpData>

215
A.6 Why is the village shop in Hensford closing?
A.6.1 The slips

216

217

218
A.6.2 The meta-data<?xml version=’1.0’ encoding=’utf-8’?>
<helpData><theQuestion>
Why is the village shop in Hensford closing?</theQuestion><mustBeTogether>
<g>5 19</g><g>3 14</g><g>6 25</g><g>7 18</g>
</mustBeTogether><hints>
<h>You can start your sequcne with slips 18, 17, 8 and so on.
</h></hints>
</helpData>

219
A.7 Who was responsible for the death of Alice White?
A.7.1 The slips

220
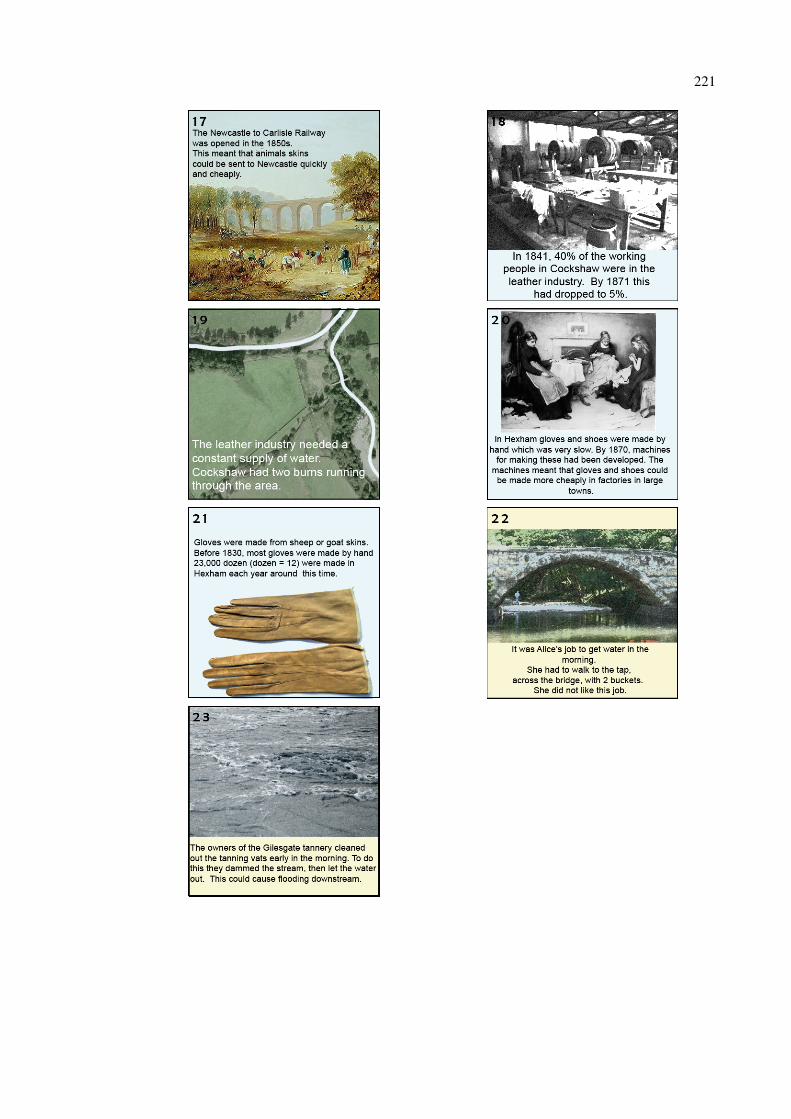
221

222
A.7.2 The meta-data<?xml version=’1.0’ encoding=’utf-8’?>
<helpData><theQuestion>
Who was responsible for the death of Alice White?</theQuestion><mustBeTogether>
<g>12 5 20</g><g>23 6</g>
</mustBeTogether><hints>
<h>Make use of the years to build a sequence.A sample sequence: 12, 13, 16, 9,...
</h></hints>
</helpData>