Antecedents of Collaborative Networked Learning in ...
299
Antecedents of Collaborative Networked Learning in Manufacturing Wee Hock Quik A thesis submitted to Auckland University of Technology in fulfilment of the requirements for the degree of Doctor of Philosophy (PhD) Business Information System Auckland, New Zealand 2013 Primary Supervisor: Assoc. Prof. Dr. Nevan Wright Secondary Supervisor: Assoc.Prof.Dr. John Tookey
-
Upload
khangminh22 -
Category
Documents
-
view
4 -
download
0
Transcript of Antecedents of Collaborative Networked Learning in ...

Antecedents of Collaborative Networked
Learning in Manufacturing
Wee Hock Quik
A thesis submitted to
Auckland University of Technology
in fulfilment of the requirements for the degree of
Doctor of Philosophy (PhD)
Business Information System
Auckland, New Zealand
2013
Primary Supervisor: Assoc. Prof. Dr. Nevan Wright
Secondary Supervisor: Assoc.Prof.Dr. John Tookey

1 | P a g e
Table of Contents
List of Figures ................................................................................................................... 7
List of Tables..................................................................................................................... 8
List of Abbreviations....................................................................................................... 10
List of Symbols or Mathematical Operants .................................................................... 13
Attestation of Authorship ................................................................................................ 14
Published Papers & Conferences .................................................................................... 15
Acknowledgement........................................................................................................... 16
Research Ethics ............................................................................................................... 18
Abstract ........................................................................................................................... 19
CHAPTER 1: INTRODUCTION ................................................................................ 20
1.1 Background to the Study ...................................................................................... 20
1.2 Rationale of the Study .......................................................................................... 21
1.3 Statement of Research Problem ........................................................................... 22
1.4 Research Aim and Objectives (RO) ..................................................................... 23
1.5 Definition of Terms .............................................................................................. 24
1.6 Key Assumptions of the Research ........................................................................ 26
1.7 Outline of the Study ............................................................................................. 27
CHAPTER 2: LITERATURE REVIEW .................................................................... 29
2.1 Introduction .......................................................................................................... 29
2.2 Knowledge and Information ................................................................................. 29
2.2.1 Knowledge and Information Sharing in Manufacturing ............................... 31
2.2.2 Networked Manufacturing and Virtual Enterprise ....................................... 32
2.2.3 Networks of Practice in Manufacturing ........................................................ 34
2.3 Collaborative Networked Learning ...................................................................... 36
2.3.1 Definition of Collaboration Networked Learning ........................................ 37
2.3.2 Difference between Collaborative Learning and Collaborative Networked
Learning ...................................................................................................... 38
2.3.3 Difference between Cooperative Learning and Collaborative Networked
Learning ...................................................................................................... 39
2.4 Research Streams in Organizational Learning ..................................................... 41
2.5 Theoretical Paradigms .......................................................................................... 45
2.5.1 Awareness Theory ........................................................................................ 47
2.5.2 Structuration Theory ..................................................................................... 48

2 | P a g e
2.5.3 Social Constructivist Theory ........................................................................ 49
2.5.4 Network Theory ............................................................................................ 51
2.5.5 Socio-technical Systems Theory .................................................................. 52
2.6 Framework and Modeling Collaborative Networked Learning ........................... 53
2.6.1 Organizational Support ................................................................................. 57
2.6.2 Interdependence ............................................................................................ 58
2.6.3 Interactions ................................................................................................... 58
2.6.4 Internal-External Learning............................................................................ 59
2.6.5 Perceived Effectiveness ................................................................................ 59
2.6.6 Perceived Usefulness .................................................................................... 60
2.7 Collaborative Technology .................................................................................... 60
2.7.1 Structured Collaboration ............................................................................... 62
2.7.2 Unstructured Collaboration .......................................................................... 63
2.7.2.1 Asynchronous Learning Network ......................................................... 64
2.7.2.2 Synchronous Learning Network ........................................................... 65
2.8 Applications of Collaborative Networked Learning ............................................ 67
2.9 Summary .............................................................................................................. 68
CHAPTER 3: RESEARCH FRAMEWORK ............................................................. 70
3.1 Introduction .......................................................................................................... 70
3.2 Restatement of the Research Questions ............................................................... 70
3.3 Conceptual Framework ........................................................................................ 70
3.4 Research Propositions (RP) .................................................................................. 75
3.4.1 Proposition 1 (P1) Organizational Support is an Antecedent of CNL .......... 76
3.4.2 Proposition 2 (P2) Positive Interdependence is an Antecedent of CNL ....... 77
3.4.3 Proposition 3 (P3) Promotive Interactions is an Antecedent of CNL ........... 77
3.4.4 Proposition 4 (P4) Internal-External Learning is an Antecedent of CNL ..... 78
3.4.5 Proposition 5 (P5) Employees’ Perceived Effectiveness is an Antecedent of
CNL ............................................................................................................. 79
3.4.6 Proposition 6 (P6) Employees’ Perceived Usefulness is an Antecedent of
CNL ............................................................................................................. 79
3.4.7 Proposition 7(P7) For MNCs and SMEs, the Influence of CNL is Different.80
3.5 Rationale for the Model Structure ........................................................................ 81
3.6 Summary .............................................................................................................. 82
CHAPTER 4: RESEARCH METHODOLOGY ....................................................... 83
4.1 Introduction .......................................................................................................... 83
4.2 Philosophical Position .......................................................................................... 83

3 | P a g e
4.3 Research Paradigm ............................................................................................... 84
4.4 Research Approach ............................................................................................... 85
4.4.1 Mixed Methods ............................................................................................. 85
4.4.2 Ethnographic ................................................................................................. 86
4.5 Unit of Analysis .................................................................................................... 88
4.6 Research Strategy and Process ............................................................................. 88
4.6.1 Quantitative Research Strategy and Data Analysis ...................................... 90
4.6.2 Qualitative Research Strategy and Data Analysis ........................................ 92
4.7 Development of Sample for the Study ................................................................. 94
4.7.1 Snowball Sampling for Survey Questionnaire ............................................. 95
4.7.2 Purposive Sampling for Semi-Structured Interview ..................................... 96
4.8 Data Collection Process ........................................................................................ 96
4.9 Ethical Considerations .......................................................................................... 97
4.10 Summary ............................................................................................................ 98
CHAPTER 5: DEVELOPMENT OF MEASUREMENT SCALE ........................... 99
5.1 Introduction .......................................................................................................... 99
5.2 Measurement of Constructs .................................................................................. 99
5.2.1 Scale Development ..................................................................................... 100
5.2.2 Scale Validation .......................................................................................... 102
5.2.3 Development of Instrument ........................................................................ 104
5.3 Data Collection for Pilot Study .......................................................................... 104
5.4 Data Preparation ................................................................................................. 105
5.4.1 Missing Data, Multiple Responses and Data Entry .................................... 105
5.4.2 Outliers ....................................................................................................... 106
5.4.3 Assessment of the Normality ...................................................................... 106
5.5 Profile of Participants ......................................................................................... 107
5.6 Assessment of Dimensionality ........................................................................... 109
5.7 Assessment of Internal Consistency ................................................................... 109
5.8 Assessment of External Consistency .................................................................. 111
5.9 Summary ............................................................................................................ 111
CHAPTER 6: QUANTITATIVE DATA ANALYSIS AND RESULTS ................ 113
6.1 Introduction ........................................................................................................ 113
6.2 Restatement of the Research Questions ............................................................. 113

4 | P a g e
6.3 Data Collection for Survey Questionnaire ......................................................... 113
6.4 Data Preparation ................................................................................................. 115
6.4.1 Missing Data, Multiple Responses and Data Entry .................................... 115
6.4.2 Outliers ....................................................................................................... 116
6.4.3 Assessment of the Normality ...................................................................... 116
6.5 Profile of Participants ......................................................................................... 117
6.6 Preliminary Investigations .................................................................................. 119
6.6.1 Measurement of Sampling Adequacy and Sphericity ................................ 119
6.6.2 Assessment of Communalities .................................................................... 120
6.7 Exploratory Investigation and Item Reduction .................................................. 122
6.7.1 Factor Analysis – Organizational Support .................................................. 123
6.7.2 Factor Analysis – Promotive Interaction .................................................... 123
6.7.3 Factor Analysis – Positive Interdependence ............................................... 124
6.7.4 Factor Analysis – Internal-External Learning ............................................ 124
6.7.5 Factor Analysis – Perceived Effectiveness ................................................. 124
6.7.6 Factor Analysis – Perceived Usefulness ..................................................... 125
6.7.7 Factor Analysis – Collaborative Networked Learning ............................... 125
6.8 Development of a Measurement Model ............................................................. 126
6.8.1 Assessment of Unidimensionality .............................................................. 126
6.8.2 Assessment of Multicollinearity ................................................................. 128
6.8.3 Assessment of Internal Consistency ........................................................... 128
6.8.4. Validity of Measurement ........................................................................... 131
6.9 Univariate Statistics ............................................................................................ 133
6.10 Bivariate Statistics ............................................................................................ 138
6.11 Multivariate Statistics ....................................................................................... 143
6.11.1 Multiple Regression – Organizational Support ........................................ 146
6.11.2 Multiple Regression – Promotive Interactions ......................................... 147
6.11.3 Multiple Regression – Positive Interdependence ..................................... 149
6.11.4 Multiple Regression – Internal-External Learning ................................... 150
6.11.5 Multiple Regression – Perceived Effectiveness ....................................... 152
6.11.6 Multiple Regression – Perceived Usefulness ........................................... 153
6.11.7 Regression Models ................................................................................... 154
6.12 Summary .......................................................................................................... 159
CHAPTER 7: QUALITATIVE DATA ANALYSIS AND RESULTS ................... 160
7.1 Introduction ........................................................................................................ 160
7.2 Restatement of the Research Questions ............................................................. 160
7.3 Data Collection for Semi-Structured Interviews ................................................ 161

5 | P a g e
7.4 Data Entry and Coding ....................................................................................... 162
7.5 Profile of Participants ......................................................................................... 163
7.6 Data Validity ...................................................................................................... 164
7.7 Result of Content Analysis ................................................................................. 164
7.7.1 Question Categories .................................................................................... 165
7.7.2 Hierarchical Coding Scheme ...................................................................... 165
7.7.3 Contributions from Individual Participants ................................................ 168
7.8 Results of Textual Contexts ............................................................................... 169
7.8.1 Organizational Support ............................................................................... 169
7.8.2 Positive Interdependence ............................................................................ 176
7.8.3 Promotive Interactions ................................................................................ 179
7.8.4 Internal-External Learning.......................................................................... 181
7.8.5 Perceived Effectiveness .............................................................................. 185
7.8.6 Perceived Usefulness .................................................................................. 188
7.9 Summary ............................................................................................................ 195
CHAPTER 8: DISCUSSION OF RESULTS ............................................................ 197
8.1 Introduction ........................................................................................................ 197
8.2 Evaluation of Research Questions (RQ) ............................................................ 197
8.2.1 Research Question 1 ................................................................................... 197
8.2.2 Research Question 2 ................................................................................... 198
8.2.3 Research Question 3 ................................................................................... 198
8.2.4 Research Question 4 ................................................................................... 199
8.3 Evaluation of Research Objectives (RO) ........................................................... 200
8.3.1 Research Objective 1 .................................................................................. 201
8.3.2 Research Objective 2 .................................................................................. 202
8.3.3 Research Objective 3 .................................................................................. 203
8.3.4 Research Objective 4 .................................................................................. 204
8.4 Evaluation of Research Propositions (RP) ......................................................... 207
8.4.1 Proposition P1 ............................................................................................. 208
8.4.2 Proposition P2 ............................................................................................. 209
8.4.3 Proposition P3 ............................................................................................. 210
8.4.4 Proposition P4 ............................................................................................. 211
8.4.5 Proposition P5 ............................................................................................. 212
8.4.6 Proposition P6 ............................................................................................. 213
8.4.7 Proposition P7 ............................................................................................. 213
8.5 Summary ............................................................................................................ 216

6 | P a g e
CHAPTER 9: CONCLUSION ................................................................................... 217
9.1 Introduction ........................................................................................................ 217
9.2 Contribution of the Study ................................................................................... 217
9.2.1 Bridging the Theory and Praxis of CNL in Manufacturing ........................ 217
9.2.2 Development of an Integrative CNL Framework for Manufacturing ........ 218
9.2.3 Development of CNL Instrument and Measurement ................................. 219
9.2.4 Adopting Mixed Methods in Exploratory Research of CNL ..................... 219
9.2.5 Integration of CNL to Operational Management........................................ 220
9.2.6 Other Practical Implications of CNL .......................................................... 220
9.3 Research Issues ................................................................................................... 222
9.4 Recommendations for Future Research ............................................................. 223
9.4.1 Development of New Collaborative Technology ....................................... 223
9.4.2 Embedding Social Contexts in Collaborative Networked Learning........... 224
9.4.3 Organizational Design for Collaborative Networked Learning.................. 224
9.4.4 New Paradigm for Workplace Learning ..................................................... 225
REFERENCES ............................................................................................................ 226
APPENDICES ............................................................................................................. 266
Appendix A – Ethics approval by AUTEC .............................................................. 267
Appendix B – Survey consent form ......................................................................... 268
Appendix C – Participant information sheet ........................................................... 270
Appendix D – Survey questionnaire ....................................................................... 274
Appendix E – Survey measurement model ............................................................. 280
Appendix F – Correlation matrix ............................................................................. 281
Appendix G – Tables on hours spent on CNL (MNCs and SMEs) ......................... 284
Appendix H – Graphs on hours spent on CNL (MNCs and SMEs) ......................... 285
Appendix I – Multiple regression stage 1 ................................................................ 286
Appendix J – Multiple regression stage 2 ................................................................ 291
Appendix K – Hierarchical coding scheme .............................................................. 296

7 | P a g e
List of Figures
Figure 2-1 Typology of collaborative networked learning ............................................. 37
Figure 2-2 Typology between cooperative learning and CNL ........................................ 40
Figure 2-3 Focus of research streams in CNL ................................................................ 42
Figure 2-4 Effect of learning on process implementation and mass customization ....... 55
Figure 2-5 Technology Acceptance Model of virtual communities ............................... 56
Figure 2-6 Technology Enhanced Learning Environment .............................................. 57
Figure 3-7 Conceptual framework of CNL ..................................................................... 75
Figure 4-8 Systematic approach to empirical research design ........................................ 89
Figure 4-9 Framework of research for quantitative phase .............................................. 91
Figure 4-10 Framework of research for qualitative phase .............................................. 93
Figure 6-11 Scree plots after items purification ............................................................ 127
Figure 6-12 Hours spent using online learning per year ............................................... 134
Figure 6-13 Hours using shared database or network information per week ............... 135
Figure 6-14 Hours using online meetings per week ..................................................... 136
Figure 6-15 Hours using emails per day ....................................................................... 136
Figure 6-16 Regression model H1 – Access information online .................................. 155
Figure 6-17 Regression model H2 – Work using online system/network .................... 156
Figure 6-18 Regression model H3 – Share and exchange online information ............. 157
Figure 6-19 Regression model H4 – Participate in online learning .............................. 158
Figure 6-20 Regression model H5 - Participate in workgroup activities ..................... 159
Figure 8-21 Framework for antecedents of CNL in manufacturing ............................ 201

8 | P a g e
List of Tables
Table 2-1 Differences between collaborative learning and CNL.................................... 39
Table 2-2 Differences between cooperative learning and CNL ...................................... 41
Table 2-3 Number of researches in streams 2000-2012.................................................. 44
Table 2-4 Number of researches and theoretical paradigms 2000-2012......................... 46
Table 3-5 Empirical studies on related areas .................................................................. 72
Table 3-6 Selection of Constructs for CNL .................................................................... 74
Table 3-7 Research questions, objectives and propositions ............................................ 81
Table 5-8 Final development of constructs and measures ............................................ 101
Table 5-9 Normality test for pilot study (n=44) ............................................................ 107
Table 5-10 Demographic profile for pilot study (n=44) ............................................... 108
Table 5-11 Pilot study - Participants by organizations and departments (n=44) .......... 109
Table 5-12 Pilot study - Cronbach’s alpha for first test (n=44) .................................... 110
Table 5-13 Pilot study - Cronbach’s alpha for re-test (n =32) ...................................... 111
Table 6-14 Testing skewness and kurtosis (n= 246) ..................................................... 117
Table 6-15 Main study - Participants by gender, age and education (n=246) ............. 118
Table 6-16 Main study – Participants by organizations and departments (n=246) ...... 119
Table 6-17 Kaiser-Meyer-Olkin and Barlett’s test........................................................ 120
Table 6-18 Item communalities .................................................................................... 121
Table 6-19 Factor loading for organizational support................................................... 123
Table 6-20 Factor loading for promotive interaction .................................................... 124
Table 6-21 Factor loading for positive interdependence ............................................... 124
Table 6-22 Factor loading for internal-external learning .............................................. 124
Table 6-23 Factor loading perceived effectiveness ....................................................... 125
Table 6-24 Factor loading for perceived usefulness ..................................................... 125
Table 6-25 Factor loading for collaborative networked learning .................................. 125
Table 6-26 Inter-item correlation matrix ...................................................................... 129
Table 6-27 Item-to-total correlation .............................................................................. 130
Table 6-28 Main study - Cronbach’s alpha ................................................................... 131
Table 6-29 Main study - split-half reliability ................................................................ 131
Table 6-30 Descriptive statistics MNC (n =177) and SME (n = 69) ............................ 133

9 | P a g e
Table 6-31 Comparing mean hours spend using collaborative tools ............................ 137
Table 6-32 Independent sample test .............................................................................. 138
Table 6-33 Cross-tabulation of manufacturing organization and email at work .......... 140
Table 6-34 Cross-tabulation of manufacturing organization and on-line meeting ....... 141
Table 6-35 Cross-tabulation of manufacturing organization and shared database ....... 142
Table 6-36 Cross-tabulation of manufacturing organization and online learning ........ 143
Table 6-37 Model fit for organizational support ........................................................... 146
Table 6-38 ANOVA for organizational support ........................................................... 146
Table 6-39 Model fit for promotive interactions .......................................................... 147
Table 6-40 ANOVA for promotive interactions ........................................................... 148
Table 6-41 Model fit for positive interdependence ....................................................... 149
Table 6-42 ANOVA for positive interdependence ....................................................... 149
Table 6-43 Model fit for internal-external learning ...................................................... 150
Table 6-44 ANOVA for internal-external learning ....................................................... 151
Table 6-45 Model fit for perceived effectiveness ......................................................... 152
Table 6-46 ANOVA for perceived effectiveness .......................................................... 152
Table 6-47 Model fit for perceived usefulness ............................................................. 153
Table 6-48 ANOVA for perceived usefulness .............................................................. 153
Table 7-49 Demographic profile semi-structured interview (n=11) ............................. 163
Table 7-50 Question categories ..................................................................................... 165
Table 7-51 Hierarchical coding scheme ........................................................................ 166
Table 7-52 Nodes and references to participants (n=11) .............................................. 168
Table 8-53 Summary of the test of propositions ........................................................... 207

10 | P a g e
List of Abbreviations
Abbreviation used in this thesis and their meanings.
ALN Asynchronous learning network
AST Adaptive structuration theory
AUT Auckland University of Technology
AUTEC Auckland University of Technology Ethics Committee
AVI Assembly visual instructions
BOM Bill-of-material
CAD Computer aided design
CAR Corrective action request
CCA Circuit card assembly
CE Concurrent engineering
CL Collaborative learning
CMC Computer mediated communication
CN Configuration number
CNL Collaborative networked learning
CNO Collaborative network organization
CPD Collaborative product development
CRM Customer relationship management
CSCL Computer supported collaborative learning
CSCW Computer supported cooperative work
CSILE Computer supported intentional learning environment
EB Engineering bulletin
ECO Engineering change order
ECN Engineering change notification
ECR Engineering change request
EDI Electronic data interchange
eCATS Electronic corrective action tracking system
ECSI Enterprise critical success indicators
EIM Enterprise information management
EIS Enterprise information system

11 | P a g e
EME Extended manufacturing enterprises
EMS Electronic manufacturing services
EPIC Enterprise planning and inventory control
ERP Enterprise resources planning
FLE Future Learning Environment
GDSS Group decision support system
HCI Human-computer interaction
HASS Highly accelerated stress screening
ICT Information and communications technology
ISO International Organization for Standardization
JIT Just-in-time
KLASS Knowledge and Learning in Advanced Supply Systems
KM Knowledge management
KMO Kaiser-Meyer-Olkin
LMHV Low mix high volume
LMS Learning management system
ME Manufacturing engineer
MES Manufacturing electronic system
NC Network computer
MNCs Multinational companies
MRP Material resources planning
MRB Material review board
NPD New product development
NPI New product introduction
OD Organizational development
OECD Organization for Economic Co-operation and Development
OEE Overall efficiency and effectiveness rate
PCBA Printed circuit card assembly
PDC Product development cycle
PDM Product database management
PLC Product lifecycle
P/OM Production/operations management
PRB Parts review board

12 | P a g e
QMS Quality management system
Q&R Quality and reliability
QN Quality notification
R&D Research and development
RO Research objectives
RP Research propositions
RQ Research questions
SAP System Applications and Products
SCM Supply chain management
SDR Socially desirable responding
SLN Synchronous learning network
SMEs Small medium enterprises
SNA Social network analysis
SOP Standard operating procedures
SPC Statistical process control
SPSS Statistical Package for Social Sciences
SQE Supplier quality engineer
SSL Secure socket layer
STS Socio-technical systems
UCN Unique control number
VF Virtual factory
VoIP Voice over Internet protocol
VPD Virtual product development
WIP Work in progress

13 | P a g e
List of Symbols or Mathematical Operants
α alpha or the probability of making Type 1 error
β beta or the probability of making Type 2 error
ϵi residual for the i unit
≤ equal or less than
≥ equal or more than
< less than
> more than
= equal
σ the standard deviation in a population of data
σ2 the variance in a population of data
R the multiple correlation coefficient
R2 the coefficient of determination
χ2 chi-square
r Pearson correlation coefficient
P the probability value e.g. p-value or significance of test
s.d. standard deviation
S.E. standard error
df degree of freedom
F F-ratio used in ANOVA
Xi value of the variable for case i
M mean
n number of cases
k constant
P1…n proposition one until the last proposition
nd. nodes
ref. reference

14 | P a g e
Attestation of Authorship
I hereby declare that this submission is my own work and that, to the best of my
knowledge and belief, it contains no material previously published or written by another
person (except where explicitly defined in the acknowledgements), nor material which
to a substantial extent has been submitted for the award of any other degree or diploma
of a university or other institution of higher learning.
Danny W.H. Quik

15 | P a g e
Published Papers & Conferences
1. Mohiuddin, A.K.M. and Quik, W.H., (2004) New Factory's Certification Process
– Use of Collaborative Technologies as a Tool, Proceedings of the 4th
International Mechanical Engineering Conference (IMEC-2004) & 9th Annual
Paper Meet (APM), 29-31 December, 2004, Dhaka, Bangladesh, pp. 296-302.
2. Mohiuddin, A.K.M. and Quik, W.H., (2005). Collaborative Technologies in
New Factory Certification Process, Journal of Applied Sciences 5(2): 267-272.
3. Quik, W.H., and Yeong M.H. (2006). Developing Organizational Capability
through Collaborative e-Learning: A Case Study of Eaton Electric Switchgear.
Proceeding of the International Conference on Distance, Collaborative and e-
Learning (DCEL 2006), Kuala Lumpur.
4. Quik, W.H., and Wright, N. (2012). Information Sharing to Transformation:
Antecedents of Collaborative Networked Learning in Manufacturing.
Proceeding of the International Conference on Computer, Electrical and System
Science, and Engineering, August 28-29, Kuala Lumpur.

16 | P a g e
Acknowledgement
I am honoured and delighted to acknowledge the many people whose counsel, support
and encouragement have contributed immensely to the completion of this project. First
and foremost, I would like to express my sincere gratitude to Associate Professor Dr.
Nevan Wright, my primary supervisor whose confidence has helped me stay focused
and for his untiring support that has helped me through the journey. My sincere
appreciation also goes to Associate Professor Dr. John Tookey (second supervisor), and
Dr. Kamrul Ahsan (Victoria University, Melbourne).
This project would not be possible without financial support in the form of the Vice-
Chancellor Scholarship from Auckland University of Technology (AUT) and ethics
approval from the Auckland University of Technology Ethics Committee (AUTEC). I
would also like to acknowledge those who have provided valuable feedback for my
research – Professor Roger Marshall, Dr. Roger Baxter, Dr. Antonio Diaz, Associate
Professor Dr. Mark Glynn for advice on research ethics and Elizabeth Ardley for
proofread my thesis.
Special thanks to all my former colleagues, engineers and friends in the manufacturing
industries from Kodama Chemicals Japan, Honeywell Aerospace USA, Intel Products
USA, and Eaton Electric Switchgears USA. On a personal note, I would also like to
thank all my good mates – Dr. Jashim Khan, Dr. Sivadass Thiruchelvam, Dr. Katherine
Ravenswood, Dr. Ammar Rashid, Karen Lo and Halimin Herjanto for many
entertaining discussions.
Last but not least, sincere gratitude and dearest love to my family: Lina (wife), Kenji
and Noriko (children), for their endless patience and unfailing love. To my parents who
have taught me much, above all the value of hard work and perseverance.
Danny W.H. Quik

17 | P a g e
This thesis is dedicated to
my wife Lina, son Kenji and daughter Noriko;
and a very good friend, teacher and mentor
Associate Professor Dr. Nevan Wright

18 | P a g e
Research Ethics
The ethics application for this study project was approved by the Auckland University
of Technology Ethics Committee, AUTEC Reference number 07/115.

19 | P a g e
Abstract
This study aims to investigate the antecedents of collaborative networked learning
(hereafter CNL), to develop an integrative CNL framework and to bridge the gap
between theory and praxis in manufacturing. Although collaborative learning has been
at the forefront of educational and pedagogical studies, there is a lack of research in the
mainstream of operations management and information systems. This study explores the
antecedents of CNL and the sharing of information among diverse employees within the
context of manufacturing industries in Malaysia. The study further extends the
boundary of networked learning beyond internal enterprises to include suppliers,
customers and external stakeholders.
To provide a holistic perspective of CNL within the complexity of the manufacturing
environment required a mixed-method research approach, including empirical
investigation using survey questionnaires and semi-structured interviews. The
qualitative findings from the interviews were corroborated with a 246 quantitative
survey of multinational companies (MNCs) and small-medium enterprises (SMEs) in
Malaysia. SPSS software was used for statistical analysis and NVivo for content
analysis. The findings and discussions draw upon socio-technical systems (STS) theory,
and present the theoretical context and interpretations through the lens of manufacturing
employees.
Results of the study show the existence of significant positive influences of
organizational support, promotive interactions, positive interdependence, internal-
external learning, perceived effectiveness and perceived usefulness of CNL among
manufacturing employees. The study further provides insights into information sharing
and collaboration within MNCs and SMEs. Although employees in MNCs are more
engaged in CNL compared to SMEs, a general consensus is found on the importance of
collaborative technologies, the usage of online meetings and shared databases. The
study offers a basis for empirical validity for measuring CNL in organizational learning,
knowledge and information sharing in manufacturing.
20 | P a g e
CHAPTER 1: INTRODUCTION
1.1 Background to the Study
Collaborative networked learning (CNL) was first proposed by Charles Findley (1988)
in his work “Collaborative networked learning: online facilitation and software
support” as part of an instructional learning design for the future of the knowledge
worker. His premise is that through electronic dialogue, learners and experts could
interactively communicate within a contextual framework to resolve problems, and/or to
improve product or process knowledge. In essence, collaboration begins with the
identification of a problem and seeking contribution from multiple parties with mutual
interest (Mohrman et al., 2008), aspirations and purposes to determine which
collaboration approach is appropriate (Shani et al., 2008) in solving operational or
engineering tasks. Collaboration has also been defined as a “process of participating in
knowledge communities” (Lipponen, 2002a, p. 73) “in a coordinated, synchronous task
to construct and maintain a shared conception of a problem” (Roschelle & Teasley,
1995, p. 70). CNL transpires when employees and their workgroups learn or attempt to
learn through organizational networks and work interactions. CNL transforms
knowledge, experiences and perspectives into a coherent shared understanding and
engages employees in knowledge construction (McConnell, 1999; Van den Bossche et
al., 2006b).
Expanding on these fundamentals, CNL can be postulated as a pedagogical form of
knowledge co-creation and information proliferation among members in networked
enterprises and networks of practice. Goodyear, Banks, McConell and Hodgson (2004)
theorise collaborative learning as an approach to stimulate interactions between one
learner to another, between learners and content experts, and between a learning
community or workgroups and their learning resources using information
communications technology (ICT). Moreover, CNL is a network that is largely
autonomous, geographically distributed and heterogeneous, yet capable of collaborating
complex information (Camarinha-Matos & Afsarmanesh, 2006b). Employees in
networked enterprises use CNL to proliferate and transform knowledge and learning

21 | P a g e
across the organization. This is consistent with Findley’s (1988) underlying premise of
interdependency, mutually seeking for a general understanding on problem resolutions.
1.2 Rationale of the Study
This study seeks to revisit the present paradigm that is educational and pedagogical
based with the aim being to develop an integrative model for improving the
collaborative efforts between employees and their workgroups. The proposed
integrative CNL framework should demonstrate how existing collaborative technology
could be effectively utilized to include CNL. With the constant advancement in
technology, it also creates a fundamental need to study the current state of CNL in
manufacturing, as compared to a decade ago when information systems were not the
predominant force in supporting both business and operational strategies. Doornbos,
Bolhuis and Simons (2004) assert that most work-related learning does not conform to
formally organized learning programmes or events, but happens implicitly through work
interactions. Henceforth, a shift from a largely educational to a non-educational
perspective is needed. Knowledge transfer and collaborative work in manufacturing are
different from those in an educational context because of the competitive nature of the
roles, hierarchical structures and organizational procedures which commonly govern the
environment (Cho et al., 2005).
Previous studies were limited to networking and sharing of information but ignored the
potential for CNL. This study extends beyond networking and data transfer to explore
how learning within and between organizations can be facilitated. Thus unlike earlier
studies of networked learning, this study includes the interactions and collaborations
between manufacturing employees and organizations with external stakeholders,
suppliers, logistics, and customers.
CNL research is a new field and draws upon a wide range of theoretical perspectives (de
Laat et al., 2006b). Previous works were mostly conceptual in nature and did not
include empirical groundwork and validation between antecedents of CNL and
manufacturing. Along with this argument, Paavola, Lipponen and Hakkarainen (2002)
observe the ways in which some of these earlier theoretical models were
operationalized. While they complemented each other, there were many fundamental

22 | P a g e
differences between these models in terms of both focus and power. Nonetheless, some
studies have made significant contributions and laid the foundations for present CNL
research. For instance, Lipponen (2002b) in his study of computer-supported
collaborative learning (CSCL) suggests focusing on the effect of technology as a result
of interaction between users, users interface with computers, and users application and
transfer of new knowledge to various work situations.
The nature of the interaction between users, their peers and workgroups are somewhat
different from the nature of the interaction between students and teachers, and this
“difference raises questions about the appropriateness of guided learning for
understanding and modelling work-related learning” (Doornbos et al., 2004, p.253).
While learning provides new knowledge or skills, insights, and the competence to
perform well at work, if learning is not shared with others in the organization, the return
on the investment is much less (Fulmer, 2000; Tobin, 1997). These contentions are
supported by Quik and Yeong (2006) in a small case study where they found employees
in MNCs to be sufficiently trained on development tools and methodologies to form
new knowledge and that CNL improved employees problem solving skills and boosted
innovations and proliferation of best practices.
1.3 Statement of Research Problem
Due to technological advancement, the importance of knowledge transfer is now
magnified and effective knowledge sharing is increasingly critical as competition
between businesses intensifies (Bhagat et al., 2002). Most organizations leverage on
technology to manage and share information among their employees. Even the training
function in workplace learning has transformed from individual-based learning to
collaborative learning, for example in networks of practice. Accompanying the move
towards the decentralisation of the training function, Smith et al. (2002) also found that
line managers are increasingly responsible for training their staff and there has been an
increase in the number of trainers, coaches and mentors to assist in this process.
Organizational learning and training has evolved from an emphasis on formal and
structured training to the decentralized participatory approach that is fundamental in
CNL. The implementation of kaizen (Elsey & Fujiwara, 2000), six sigma and lean

23 | P a g e
manufacturing, has made it necessary for the integration of learning in manufacturing
(Danilovic & Winroth, 2005; Docherty & Shani, 2008; Fenwick & Rubenson, 2005).
Intriguingly, there is lack of research in the area concerning what motivates
manufacturing organizations to share and transfer knowledge between their employees,
partners, suppliers, as well as their customers. What transpires in employees’ learning
process through the use of information communication technology (ICT)? At present,
the CNL concept is borrowed and adapted from theories and philosophies from other
disciplines such as collaborative learning. There is a large disparity in empirical studies
in the area from the perspectives of information systems and operations management.
Many scholars agree that CNL needs to be firmly grounded in appropriate theoretical
approaches and analytic perspectives to increase its rigor and relevance (de Laat &
Lally, 2004; de Laat et al., 2006b; Hakkinen et al., 2003; Hodgson & Watland, 2004;
Stahl, 2004). One cannot rely on strong theoretical grounding and empirical research
covered by other disciplines to fit CNL to manufacturing. One size does not fit all.
1.4 Research Aim and Objectives (RO)
This study answers the call for greater agility and efficiency in information sharing
among manufacturing employees. The primary aim of this study is to identify the
significant antecedents to organizational learning, development and sharing of
organizational knowledge using collaborative technologies within the organizations and
their extended enterprises. At present, there is a lack of knowledge concerning the
antecedents that promote the sharing of information and collaboration in the
manufacturing industry. Henceforth, the objectives of this study are to:
RO1. Develop an integrative CNL framework and bridge the gap between theory and
praxis. De Laat and Lally (2003) and Stahl (2004) argue that due to complexities
in both the theory and praxis1, no single theoretical framework is yet capable of
offering a sufficiently powerful articulation of description, rhetoric, inference or
application of networked learning. In order to achieve this objective and bridge
the gap, the research needs to pay close attention to numerous events, activities
1 According to McNiff et al. (1996) praxis is informed, committed action that gives rise to knowledge.

24 | P a g e
and tasks that motivates employees in diverse manufacturing organizations to
share information.
RO2. Establish a comparative study by comparing and contrasting diverse industries
and between MNCs and SMEs. The study also aims to gain a broader and more
insightful perspective to strengthen the relevance of the conclusions and
supporting framework presented in this thesis.
RO3. Examine networks of manufacturing collaborations and seek to understand the
antecedents that set the stage for information sharing and knowledge
transformation among members in manufacturing organizations. The findings
will serve as a new body of knowledge in CNL research.
RO4. Conduct a multi-disciplinary research that will include experiential learning,
workplace learning and consider other research into CNL and knowledge
sharing. The study will also revisit and validate the definition of CNL. The
proposed CNL framework should be versatile and pragmatic for both MNCs and
SMEs.
1.5 Definition of Terms
1.5.1 Multinational Corporation and Small-medium Enterprise
The definition of manufacturing used follows the Malaysia Standard Industrial
Classification (MSIC) 20082. Manufacturing is defined as the physical or chemical
transformation of materials or components into new products, whether the work is
performed by power-driven machines or by hand, whether it is done in a factory or in
the worker’s home, and whether the products are sold at wholesale or retail. The
definition of a manufacturing organization used in this study follows that of the
Malaysia Standard Industrial Classification (MSIC) 2008 and has been adopted by the
SME Development Council of Malaysia.
2 Published by the Department of Statistics Malaysia (2011)

25 | P a g e
i. MNC: A multinational corporation (MNC) also called multinational
enterprise (MNE), is a corporation or an enterprise that manages production
or delivers services in more than one country.
ii. SME: A small-medium enterprise (SME) is a company that has less than
150 employees with revenue between Ringgit Malaysia 4 to Ringgit
Malaysia 10 million per year.
To differentiate MNCs from other larger organizations, the research will adopt the
definition provided by the OECD Guideline for Multinationals Enterprises (2011),
which defines MNCs as organizations that comprised of companies or other entities
established in more than one country, and which are interconnected and coordinate their
operations in various ways. The OECD Guideline for Multinationals Enterprises (2011)
further stipulate that “while one or more of these entities may be able to exercise a
significant influence over the activities of others, their degree of autonomy within the
enterprise may vary widely from one multinational enterprise to another. The
ownerships of the enterprise may be private, state or mixed” (p.12).
Although the research is focused on the Malaysia context, the research samples are
representative of major global multinational companies, for example, Plexus,
Flextronics, Robert Borch, Intel, Honeywell, Eaton, AMD, First Solar, Samsung, Sony,
Western Digital and many more. In 2008, there were 30,709 SMEs in Malaysia while
1,826 organizations were large establishments, including MNCs (Department of
Statistics Malaysia, 2011).
1.5.2 Antecedent
Antecedent is defined as the conditional part of a hypothetical proposition (Oxford
University Press, 2013), something existing or happening before, especially as the cause
of an event or situation (Cambridge University Press, 2013). The term antecedents in
this study describes important preceding or a current course of events, circumstances, or
precursors that transpired before employees in manufacturing organizations are likely to
adopt CNL. In addition ‘antecedent variable’ is a term used in multivariate analysis.

26 | P a g e
In a study of the antecedents that affect the intention to adopt collaborative technologies
in the construction industry, Nikas, Poulymenakou and Kriaris considered the
prerequisite resources that an organisation must possess in order to adopt a novel
technology. Antecedents drivers were found to be all the internal, external factors and
perceived benefits that influenced the decision to adopt novel technology (Nikas et al.,
2007, p.632).
1.6 Key Assumptions of the Research
The basis of the research includes the following underlying assumptions:
i. The focus of the research is on the manufacturing context. The precedence
theories on collaborative learning from the educational and pedagogical context
serve as a reference and do not necessary dictate the outline of the research, and
neither will the outcome of the research be skewed towards an educational
context.
ii. The sample of the research represents the population of manufacturing
employees in Malaysia. The sample is used to make inferences to manufacturing
employees, it is not intended that the results be generalized to the entire global
population of manufacturing employees. Cultural, socio-economy, legislative,
educational levels are not equal world-wide.
iii. The participants for the survey were randomly invited using a snowball
sampling technique. It is assumed that the participants are representative of the
population of Malaysia’s manufacturing organizations.
iv. The participants for the semi-structured interviews were invited based upon their
present roles and positions in MNCs and SMEs organizations. Their opinions,
knowledge, perceptions and experiences on the subject matter are related to their
personal views and do not represent those of their peers, supervisors or
organizations.

27 | P a g e
v. The systems described and explained by the participants may be commonly used
by other manufacturing organizations, although some systems may be
developed, customized and designed specifically for individual organizations.
This does not prevent the study from investigating the functionality of those
systems to seek for commonality.
vi. Based on the literature review, this research suggests that there is no prior
research related to the antecedents of CNL in manufacturing. Exploratory
research is used to assess the opportunities for undertaking the study and to test
methodology for a larger study in the future (Nardi, 2006).
1.7 Outline of the Study
This thesis consists of eight chapters. The first chapter presents background information
pertaining to CNL in the advent of collaborative technologies development and learning
in manufacturing organizations. It identifies key issues and outlines the research aim
and objectives as well as providing some key definitions relating to the primary subjects
of the study.
Chapter 2 reviews past and present literatures to provide a holistic understanding of the
definitions of key concepts of CNL, networks of practice, current research streams,
theoretical paradigms, collaborative technologies and primary applications that are
closely linked with CNL. Identified gaps in the literature shaped the research questions
for the study.
Chapter 3 outlines the conceptual framework of the research and the development of
CNL model. The research propositions are presented and discussed. The chapter also
explains the rationale of the model structure.
Chapter 4 discusses the research design including philosophical assumptions. The
rationale for the pragmatic paradigm and mixed-method approach used to examine the
propositions developed in Chapter 3 are given. A systematic discussion is also provided
on the quantitative and qualitative approaches to data collection techniques, including
the development of the questionnaire and selection of participants.

28 | P a g e
Chapter 5 defines the measurements and explains the development for the scales used
for measuring the constructs. It discusses the techniques used in data preparation and
presents a preliminary analysis derived from a pilot study, including assessment of
dimensionality.
Chapter 6 presents the results from quantitative data analysis of the survey
questionnaire. Attention is paid to analysis methods of the quantitative data and data
frequency is systematically examined using descriptive statistics and inferential
statistics – the aim being to provide an objective view of the phenomena found in the
study.
Chapter 7 corroborates the results of the qualitative data analysis of the interview
transcripts with the quantitative results of the main research constructs. The research
framework used for the quantitative analysis is extended to accommodate the qualitative
analysis using NVivo for content analysis technique.
Chapter 8 presents the integrated findings emerging from the quantitative and
qualitative data described above, in support of the research objectives, research
questions and propositions.
Chapter 9 concludes the study with reviews and reflections of key contributions to the
body of knowledge in organizational learning and operational management. The
limitations of the research are acknowledged and explained. Further recommendations
that build on the research findings are offered for future research.
A list of references and appendices are provided at the end of this thesis.

29 | P a g e
CHAPTER 2: LITERATURE REVIEW
2.1 Introduction
The purpose of this chapter is to review relevant CNL literatures. The purpose of a
thorough review of the literature, according to Netemeyer et al. (2003), is to alert the
researcher to “previous attempts to conceptualize the constructs of interest and theories
in which the construct may prove useful as an independent or dependent variable” (p.
8). It also provides a background to the context of the research, and establishes a bridge
between the research and the current state of knowledge on the subject and what could
be anticipated in the light of existing theory (Blaikie, 2000, 2010). This chapter begins
by discussing the background of the research in the context of the sharing and
exchanging of information in manufacturing organizations, the evolution of virtual
enterprises, and employees leveraging on networks of practice. Next, it attempts to
define what are knowledge, information and data. It then attempts to explain the concept
of CNL, and the difference between cooperative and collaborative learning, to provide
more clarity to the area of research. It proceeds to discuss several mainstream
researches, presenting different theoretical paradigms and highlighting some of the
proposed frameworks from similar areas of research. Some pertinent concepts in
collaborative technologies exemplifying the differences between structured and
unstructured collaborative technologies and between asynchronous and synchronous
learning networks are also identified.
2.2 Knowledge and Information
Davenport and Prusak (1998) define knowledge as a mix of framed experience, values,
contextual information, and expert insight that provides a framework for evaluating and
incorporating new experiences and information (p.5). Information is the basic input for
organizational knowledge (Davenport et al., 1998; Garvin, 1993; Kogut & Zander,
1992). Information is data that holds relevance and purpose, while knowledge is
information which holds relevance and purpose to create meaning (Davidson & Voss,
2002; Roberts, 2000). Information is transformed into knowledge when employees
apply their own experience and contextual understanding to information through action

30 | P a g e
(Davenport et al., 1998; Nonaka & Takeuchi, 1995). Scholars like Argyris and Schon
(1978), Schein (1996), and Senge (1994) posit that knowledge is shared through social
interaction and socialisation creates shared understanding that will motivate group
collaboration. Before any new ideas are accepted, discussion is needed to align opinions
and allow ideas to be shared and integrated into the systems, culture, values and
processes of the manufacturing organization (Nonaka et al., 1995). Information from
diverse perspectives is converged and integrated into organizational knowledge.
Nonaka and Takeuchi (1996) further define explicit knowledge as information that can
easily be communicated among employees; whereas tacit knowledge such as skills,
competencies and talents is somewhat more difficult to communicate. Therefore,
Blaikie (2010) posits that the aim of scholarly research is to uncover largely tacit,
mutual knowledge, symbolic meanings, intentions and rules, which influence social
behaviour. When both tacit and explicit knowledge are combined, employees can
modify existing knowledge or create new knowledge (Addleson, 2013; Blaikie, 2010).
Knowledge does not exist either on its own or in individual minds, but emerges from
the process of participation in various cultural practices and shared learning activities
(Brown et al., 1989; Lave & Wenger, 1991; Lipponen & Hakkarainen, 2004; Paavola et
al., 2004). Employees share knowledge best when they are negotiating the context of
shared meanings (Berends, 2005), interacting and aligning for action (Addleson, 2011).
Knowledge is perceived as a cognitive process, in which learning is a matter of
construction, acquisition, and outcomes through the process of transfer (Paavola et al.,
2004). For constructivists, learning constitutes participation in practices and actions
where knowledge is acquired by social activities (Chatenier et al., 2009, p. 354).
Essentially, establishing a CNL system requires an understanding of the acquisition and
construction of knowledge of employees and their interface with technology at work.
Knowledge integration is therefore extending the scope of knowledge sharing, which is
the pre-requisite of CNL, where knowledge is effectively distributed, used to perform
tasks, (Herrmann et al., 2007), develop new competencies, produce innovations and
generate new knowledge (Paavola & Hakkarainen, 2005).

31 | P a g e
This concept of knowledge construction as a collaborative endeavour spurs this study
into investigating how information and knowledge can be learned and shared in
manufacturing organizations. Knowledge construction is the outcome of collaborative
work (Zenios, 2011), when employees work together on a shared problem, participate in
discussion, (Roschelle et al., 1995), negotiations, engagements, creating scenarios about
their circumstances, and their goals (Addleson, 2013). Upon closer examination,
collaborative knowledge from social epistemology provides invaluable insights as to the
relevance of CNL involving cyclic orientations from transmission, transaction to
transformation of organizational knowledge and information. Knowledge and
information are transmitted through a series of transactional processes using
collaborative technologies and other network communicative tools. Knowledge is
transformed by the cognitive processing of information and co-constructing new
knowledge through engagement (Lipponen, 2002b), as well as interactions and group
deliberations. The cyclic process is rejuvenated as new sets of knowledge and
information are stored, shared and re-transmitted.
2.2.1 Knowledge and Information Sharing in Manufacturing
Knowledge sharing is described as the “dissemination of information and knowledge”
across an organization (Yang, 2004, p. 119). It involves providing organizational
knowledge to employees to improve effectiveness and flexibility so as to spur
innovation (Belanger & Allport, 2008; Rafaeli & Ravid, 2003). In today’s
manufacturing environment, there is a significant emphasis on multi-organizational
collaboration, thus knowledge sharing is becoming part of an intricate network
unrestricted by geographical boundaries. With the continually strong demand on cost
reduction, quality and productivity improvement, CNL could provide the means for
sharing and integrating knowledge, and enabling diverse virtual teams to collaborate.
CNL can be manifested in many forms and functions, including virtual enterprises,
virtual teams, networks of practice and other technical and non-technical
collaboratories. With information highly distributed through organizations, it has
become paramount for networks to focus on information management to improve
knowledge construction (Achrol & Kotler, 1999), and effectively adapt to constantly
changing environments (Lusch et al., 2010).

32 | P a g e
Collaboration involves intra and inter-organizations (customers and suppliers, or nodes
in a network) sharing information to make forecasts (McCarthy & Golicic, 2002; Poler
et al., 2008) and improving inventory performance throughout the manufacturing
organizations (Rubiano & Crespo, 2003). The Knowledge and Learning in Advanced
Supply Systems (KLASS) focus on the automotive and aerospace industries to develop
CNL with suppliers (Rhodes & Carter, 2003). Web-centred learning has supported the
development of e-commerce capabilities and network group learning between multiple
or linked workplaces. CO-IMPROVE was developed to support and foster inter-
organizational collaborative improvement between extended manufacturing enterprises
(EME) (Coghlan & Coughlan, 2006) by expanding customer-supplier collaborative
relationships within the network to seek best practices and consequently enhance overall
EME performance (Nielsen et al., 2008). The best practices lend themselves to the
process oriented view of knowledge management, whilst measurement applies directly
to a resource-based view of the organization with knowledge as a valuable asset (Truch
et al., 2000).
2.2.2 Networked Manufacturing and Virtual Enterprise
Virtual enterprises can be described as a network of organizations (Danilovic et al.,
2005) from which temporary alignments are formed and combined with specific core
capabilities of members to exploit manufacturing opportunities (Camarinha-Matos &
Afsarmanesh, 2006) and to accomplish innovative problem solving (Malhotra et al.,
2007) associated with a specific product or service (Cao & Dowlatshahi, 2005). In order
to reduce time-to-market and costs, many manufacturing organizations have established
virtual enterprises to share information and to accelerate product development. Virtual
enterprise ensures appropriate manufacturing operations are assigned to the designated
units or to the best interest of the virtual consortium (Zhan et al., 2003).
Global competition has brought about changes that are characterized by product
proliferation with shorter life cycles, innovative process technology, and customer
demand for quick responses, lower costs and greater customization (Cao &
Dowlatshahi, 2005b; Kamrani, 2008; Yam et al., 2007). Manufacturing organizations
have to adapt their business strategies to compete in the new collaborative economy of
suppliers, manufacturers, distributors and customers (Basu, 2001). Integrated, dynamic

33 | P a g e
supply chains and virtual enterprises are dominating this trend (Camarinha-Matos &
Afsarmanesh, 2006a). By adopting information communication technology (ICT)
manufacturing organizations foster changes in managing customer relationships,
manufacturing, procurement, and supply chain (Agarwal & Sambamurthy, 2002; Barua
et al., 2004; Camarinha-Matos et al., 2006a); to enhance their competitive capabilities
(Sambamurthy et al., 2003), products and services (Berry et al., 2006; Chen & Tsou,
2007); and as enablers of innovation (Corso & Paolucci, 2001; Dewett & Jones, 2001;
Xu et al., 2005).
CNL dynamically transforms virtual enterprises and virtual teams to create a more
innovative, profitable, higher quality product for market. It involves moving from
transactional interactions to co-construction of knowledge, collaborative development,
and design innovations involving multiple parties. A consumer electronics manufacturer
has to collaborate with component suppliers, electronic manufacturing services (EMS),
or contract manufacturers in the design and development of products or components
(Sayah & Zhang, 2005). The establishment of networked manufacturing is a deliberate
attempt to organize virtual teams within the organization with external partners
including customers, suppliers and developers.
Virtual teams work in geographically dispersed locations using information technology
to accomplish work projects (Hertel et al., 2005; Kauppila et al., 2011; Sarker et al.,
2003), solve complex problems or tasks (Curseu et al., 2008) and to share decision
making responsibilities and operate independently (Kerber & Buono, 2004). Virtual
teams serve as knowledge actors, sharing and mediating knowledge as well as
promoting learning throughout the organization (Kauppila et al., 2011; Ratcheva, 2008).
The collaborative product development (CPD) platform provides communication
channels for geographically dispersed teams to disseminate, share, document and
manipulate product data such as product drawings and the bill of materials and process
specifications in the networked environment. Product design and development teams
can work concurrently in the design and analyse the workflow (Zhan et al., 2003).
Benefits of collaboration include higher return and accelerated product development,
reduced developmental cost, increased flexibility, reduced risk and access to the product
development capability of the suppliers (Mallick et al., 2010).

34 | P a g e
2.2.3 Networks of Practice in Manufacturing
Networks of practice have been widely studied under a variety of titles (Brown &
Duguid, 1991, 2000) including knowledge building communities (Scardamalia &
Bereiter, 1994), knowledge communities (Erickson & Kellogg, 2001), virtual
communities (Lin, 2007b), and communities of practice (Johnson, 2001; Lave et al.,
1991). Garcia (2010) posits that the different between a network of practice and a
community of practice rests in electronic communication. However, Brown and Duguid
(2000) use the term “networks” to described loose epistemic groups and relationships
that have varying degrees of proximity but do not have the degree of cohesion required
for a community (as cited by Jones & Esnault, 2004). Jones and Esnault (2004) argue
that the term “networks” allows for scalability in analysis as each network can be
carefully studied, and each node can be a network by itself in a complex system of
communications and collaborations. The term “practice” denotes the actions of
employees and workgroups performing their work and work practices that involve
interaction among employees. Networks of practice serves as virtual workspace and
source of information where knowledge can be captured, codified, stored, shared, and
transferred among manufacturing employees.
Manufacturing organizations form an integral part of an activity system which are
closely interconnected and consist of multiple networks of practice (Guile & Griffiths,
2001; McDermott & Archibald, 2010). A network of practice consists of groups of
employees who share a concern, a set of problems or expertise and passion for a joint
enterprise (Brown et al., 2000; Wenger et al., 2002; Wenger & Snyder, 2000) and are
informally bound by their shared competence and mutual interest in a given practice
(Choi, 2006; Katzenbach & Smith, 2003). Wenger (1998) describes the structure as
‘mutual engagement’, ‘joint enterprise’ and ‘shared repertoire’ (p.72-73). Through
participation in the networks of practice, employees build collaborative relationships
and through these interactions joint enterprises emerge. The networks of practice
continuously evolve as employees attempt to improve their knowledge domain as well
as develop their own conceptual artefacts (Hass et al., 2003; Scardamalia et al., 1994),
share their experience and knowledge (Choi, 2006; Scarbrough, 1996) and expand their
socio-professional circles (Bouhnik et al., 2009). Nonetheless, a network of practice is a

35 | P a g e
dynamic system that requires employees to interact on an on-going basis. A network of
practice influences ways in which employees operate and switch between other
networks. Over a period of time it develops into shared repertoires of knowledge and
methodologies that are proliferated across the manufacturing organization.
Learning transcends across knowledge networks regardless of formal boundaries or
geographical distance (Garcia, 2010; Vaast, 2004; Wasko & Faraj, 2008). A network
enables employees to collaborate in network communities and for organizations to
exchange information and manage knowledge (Garcia, 2010). It is through this
collaboration and narration that members of a network of practice negotiate meaning
and joint enterprise (Addleson, 2013; Coghlan & Shani, 2008). Therefore, collaborative
technologies play a pivotal role by providing the workspace and capacity to interact in
virtual networks of communities or virtual teams. The technological augmentation of a
network of practice further enhances the quality of collaborative support while
providing improved opportunities to distribute and extend the inherent expertise across
an organization (Eales, 2003).
Networks of practice provide many benefits to organizations, including access to
expertise, improved collaboration, and accelerated work performance. Networks of
practice are especially valuable for MNCs that constantly face challenges in
disseminating organizational knowledge which resides in individuals and dispersed
teams when the opportunity for face-to-face interactions are rather limited (Li et al.,
2009). A network of practice develops a repertoire of tacit and explicit means of
communicating and working, enabling the community to perform its practice in a
satisfying manner (Teigland, 2003). Moreover, the reuse of lessons learned and the
adoption of best practices can lead to significant cost savings and process simplification
(Hass et al., 2003). The establishment of a network of practice is a deliberate attempt to
organize workgroups within the organization and with external partners such as
customers, suppliers and developers. A network of practice bridges expertise from
various functions and extended enterprises into a common platform for a discourse in
specific areas of interest and resolutions.

36 | P a g e
2.3 Collaborative Networked Learning
This thesis uses the network metaphor in a broader perspective to describe the integral
networked organization that connects its employees, customers, suppliers and partners.
According to Addleson (2013) a network is a “hodgepodge of people with varying
interests, motives, and levels of commitment, as well as diverse specializations, who
may report to bosses with different agendas” (p. 38). Boot and Renolds (1997) suggest
using a multifaceted concept such as ‘network’ rather than viewing organizations in
terms of groups to reflect the dynamic nature of work organizations and the way
learning is organized. It enables researchers to fundamentally think about any
manufacturing organization as a network that supports patterns of activities that relate to
manufacturing operations. The increase of outsourcing also creates more dependence on
a network (Basu, 2001). According to Camarinha-Matos and Afsarmanesh (2006) a
network consists of a variety of entities that are autonomous, geographically distributed,
and heterogeneous in terms of their operating environment, culture, socio-capita and
goals; yet their interactions are well supported by computers to collaborate and to
achieve common goals.
These connections have to be recognized and negotiated before employees can work at
collaborating (Addleson, 2013). Haythornthwaite (2008) postulates that the
participatory learning created by networked technologies brings knowledge creation
from expert to learner to CNL and self-discovery. Figure 2-1 illustrates the
transformation concepts of individual learning, to learner-expert mentoring or an
apprenticeship scheme, and finally to the emergence of collaborative networked
learning (CNL).

37 | P a g e
Figure 2-1 Typology of collaborative networked learning
CNL promotes the process of collaborative learning as integral networks of individual
experts, contributing information and knowledge in their different roles and reference
domains. In this context, learning focus is shifted from individual learning to learner
expert system, to CNL. It is argued that the term collaborative networked learning
reflects the essence of learning in a networked organization using computer networks to
share information and knowledge. This contention is notably supported by Jones and
Esnault (2004) and Camarinha-Matos and Afsarmanesh (2006) and hence serves as the
basis for this study.
2.3.1 Definition of Collaboration Networked Learning
Findley (1989) first defines CNL as learning which occurs through electronic
communications between self-directed learners and experts. CNL is a means to promote
interactions between one learner to another; between learners and content experts; and
between a learning community or workgroups and their learning resources using ICT
(Brophy, 2001; de Laat, 2006; Goodyear, 2000; Goodyear et al., 2004; Goodyear et al.,
2005; Jones et al., 2004). Collaboration begins with the identification of a problem that
involves multiple parties with a mutual interest (Addleson, 2013; Camarinha-Matos et
al., 2006a; Dillenbourg, 1999; Dillenbourg et al., 1996; Mohrman et al., 2008),
aspirations and purposes in determining the appropriate collaboration approach (Shani
et al., 2008). Individuals and work groups share information, resources and
responsibilities to plan, implement and evaluate a program to achieve common goals
(Camarinha-Matos et al., 2006a). Collaboration can also be defined as a “process of

38 | P a g e
participating in knowledge communities” (Lipponen, 2002a, p. 73). CNL brings
together individuals and workgroups to learn or attempt to learn through organizational
network systems (e.g. intranet, extranet or internet), shared resources, networks of
practice and projects through reciprocal collaborations. In every sense, CNL is a
network that is largely autonomous, geographically distributed and heterogeneous, yet it
is capable of collaboration to share complex information to achieve compatible goals
(Camarinha-Matos et al., 2006b; Lipponen, 2002b). CNL transforms knowledge,
experiences and perspectives into a coherent shared understanding and engages
employees in knowledge construction (McConnell, 1999; Van den Bossche et al.,
2006b). By expanding on these principles and definitions, CNL can be broadly defined
as a systematic form of knowledge and information proliferation among members
through interacting, engaging, facilitating mutual understanding and shared goals in the
virtual enterprise. Employees use CNL to share, proliferate and transform organizational
knowledge and learning.
2.3.2 Difference between Collaborative Learning and Collaborative Networked
Learning
Although collaborative learning and CNL are computer-mediated, CNL is not
collaborative learning. Lipponen (2002b) acknowledges that collaborative learning has a
designed pedagogical purpose. While collaborative learning addresses pedagogical
issues, curriculum design and course development in educational research, CNL’s
primary focus is in both formal and informal organizational learning and sharing of
information, which addresses the process of knowledge construction and transformation
through the network. In CNL, employees or learners develop and maintain shared
conceptions of a subject matter (Roschelle et al., 1995), then move swiftly to integrate
each other’s perspectives and ideas to make sense of a task (Nastasi & Clements, 1992)
and build new sets of knowledge (Dillenbourg et al., 1996; McGrath, 1984). Learning
has thus evolved from an emphasis on formal training to the informal learning that is
fundamental in CNL. Much of the work learning happens informally (Thompson, 2010)
as it involves the goal of understanding and knowledge or skill acquisition which occurs
without the presence of externally imposed curricular criteria (Livingstone, 2001).
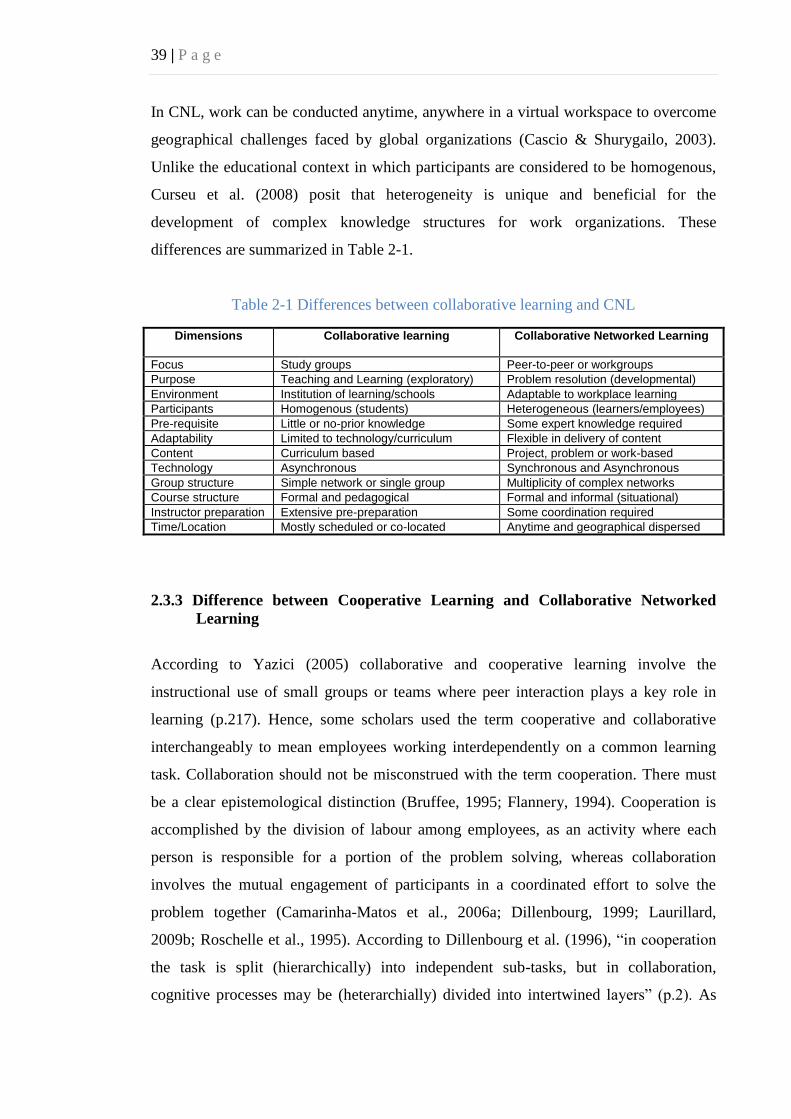
39 | P a g e
In CNL, work can be conducted anytime, anywhere in a virtual workspace to overcome
geographical challenges faced by global organizations (Cascio & Shurygailo, 2003).
Unlike the educational context in which participants are considered to be homogenous,
Curseu et al. (2008) posit that heterogeneity is unique and beneficial for the
development of complex knowledge structures for work organizations. These
differences are summarized in Table 2-1.
Table 2-1 Differences between collaborative learning and CNL
Dimensions Collaborative learning
Collaborative Networked Learning
Focus Study groups Peer-to-peer or workgroups
Purpose Teaching and Learning (exploratory) Problem resolution (developmental)
Environment Institution of learning/schools Adaptable to workplace learning
Participants Homogenous (students) Heterogeneous (learners/employees)
Pre-requisite Little or no-prior knowledge Some expert knowledge required
Adaptability Limited to technology/curriculum Flexible in delivery of content
Content Curriculum based Project, problem or work-based
Technology Asynchronous Synchronous and Asynchronous
Group structure Simple network or single group Multiplicity of complex networks
Course structure Formal and pedagogical Formal and informal (situational)
Instructor preparation Extensive pre-preparation Some coordination required
Time/Location Mostly scheduled or co-located Anytime and geographical dispersed
2.3.3 Difference between Cooperative Learning and Collaborative Networked
Learning
According to Yazici (2005) collaborative and cooperative learning involve the
instructional use of small groups or teams where peer interaction plays a key role in
learning (p.217). Hence, some scholars used the term cooperative and collaborative
interchangeably to mean employees working interdependently on a common learning
task. Collaboration should not be misconstrued with the term cooperation. There must
be a clear epistemological distinction (Bruffee, 1995; Flannery, 1994). Cooperation is
accomplished by the division of labour among employees, as an activity where each
person is responsible for a portion of the problem solving, whereas collaboration
involves the mutual engagement of participants in a coordinated effort to solve the
problem together (Camarinha-Matos et al., 2006a; Dillenbourg, 1999; Laurillard,
2009b; Roschelle et al., 1995). According to Dillenbourg et al. (1996), “in cooperation
the task is split (hierarchically) into independent sub-tasks, but in collaboration,
cognitive processes may be (heterarchially) divided into intertwined layers” (p.2). As
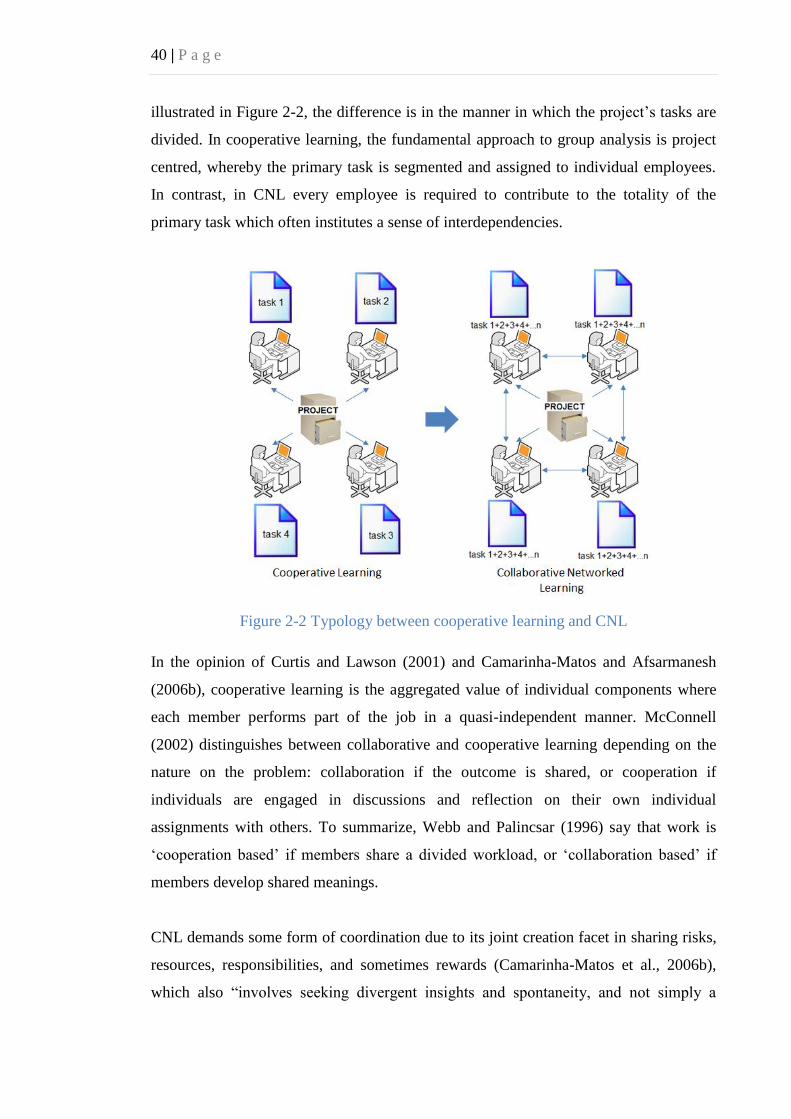
40 | P a g e
illustrated in Figure 2-2, the difference is in the manner in which the project’s tasks are
divided. In cooperative learning, the fundamental approach to group analysis is project
centred, whereby the primary task is segmented and assigned to individual employees.
In contrast, in CNL every employee is required to contribute to the totality of the
primary task which often institutes a sense of interdependencies.
Figure 2-2 Typology between cooperative learning and CNL
In the opinion of Curtis and Lawson (2001) and Camarinha-Matos and Afsarmanesh
(2006b), cooperative learning is the aggregated value of individual components where
each member performs part of the job in a quasi-independent manner. McConnell
(2002) distinguishes between collaborative and cooperative learning depending on the
nature on the problem: collaboration if the outcome is shared, or cooperation if
individuals are engaged in discussions and reflection on their own individual
assignments with others. To summarize, Webb and Palincsar (1996) say that work is
‘cooperation based’ if members share a divided workload, or ‘collaboration based’ if
members develop shared meanings.
CNL demands some form of coordination due to its joint creation facet in sharing risks,
resources, responsibilities, and sometimes rewards (Camarinha-Matos et al., 2006b),
which also “involves seeking divergent insights and spontaneity, and not simply a

41 | P a g e
structured harmony” (Camarinha-Matos et al., 2006a, p. 29). CNL occurs when
employees and their organization work together to co-construct and transform
knowledge (Barkley et al., 2005; Matthew, 1996). The product of team endeavours and
consensus is in the discovery and sharing of knowledge. The differences are
summarized in Table 2-2.
Table 2-2 Differences between cooperative learning and CNL
Dimensions Cooperative learning
Collaborative Networked Learning
Focus Peer-to-peer or workgroups Peer-to-peer or workgroups
Environment Institution of learning and workplace Adaptable to workplace learning
Participation Division of labour Mutual engagement
Pre-requisite Similar level of knowledge Different expert knowledge
Problem solving Contributes part of the resolution Coordinated effort among members
Task parcel Hierarchically divided into sub-tasks Heterarchially divided into multi-layers
Dependency Quasi-independent Highly interdependent
Knowledge Discovery, acquisition and reflection Co-construction
Cooperative learning is not always embraced because it challenges the established
notions of expertise, working identities and relationships based on traditional
hierarchies or canonical knowledge (Cullen et al., 2002; Rockwood, 1995). Knowledge
does not necessarily accrue to any individual employee. Instead, it is widely distributed
across the networks and CNL supports interaction and the sharing of information among
diverse members (heterogeneous) of the manufacturing community.
2.4 Research Streams in Organizational Learning
Docherty and Shani (2008) identify four broad streams in collaborative research,
namely: work organization; organizational learning; learning at work; and
organizational design streams. The work organization stream focuses on organizational
workgroups that would enable self-management (e.g. Emery, 1982; Gustavsen, 1992;
Mohrman et al., 1995). Learning is becoming the prime responsibility of employees
within their enterprises and workgroups. Manufacturing is shifting towards greater
interdependence among individuals and workgroups to create collective and synergistic
products and services through CNL. The organization learning stream addresses the
depth and character of the learning process (Issacs, 1993; Senge, 1994) that may be
acquired through evaluation, study, experience and innovation (Edmonson, 2002;
Goodyear, 2000; Rooke et al., 2007; Vince, 2004). Research approaches such as these
examine the conditions under which effective collaborative knowledge construction is

42 | P a g e
achieved (Baker et al., 1999; Bereiter & Scardamalia, 2003; Lipponen, 2002b;
Scardamalia et al., 1994; Wenger, 1998). Learning in the work stream evolved from the
emphasis on the formal vocational training milieu to the experiential learning of
employees and workgroups (Huang, 2002). Research in the organizational design
stream believes that conditions for learning need to be designed and not left to
emergence (Lipshitz et al., 1996). The focus is on self-directed learning and problem
solving oriented learning in relation to the needs of the workplace. Gustavsen (2001)
developed democratic dialogues for the use of collaborative research to facilitate
learning across communities and inter-organizationally, incorporating both structural
and procedural components. Others consider a wider span of studies that include
regulatory, sectorial environment and characteristics of the operations, for example,
different market conditions, regulations and technology may influence the way
organizations engage with collaborative learning (Billet, 2004; Cullen et al., 2002;
Fuller et al., 2007; Hager, 2004; Illeris, 2003; Lakkala, 2007; Phelan et al., 2004;
Strijbos et al., 2007b). New didactic technologies are constantly being introduced to
help employees to cope with changes through learning. The different research streams
and their relationships with CNL are illustrated in Figure 2-3.
Figure 2-3 Focus of research streams in CNL
Encapsulating the fundamental distinctions between different streams provides clarity
and support of CNL and how it fits into organizational learning. A review of several
journal publications (see Table 2-3) on organizational learning, knowledge
management, learning technologies, interactive learning and workplace learning
revealed the popularity of these research streams. A total of 6,162 articles from 11
journal publications (from the year 2000 to 2012) were analysed. The journals were
selected based upon primary areas of research related to collaborative learning,

43 | P a g e
operations management, computer supported learning, learning technology, knowledge
management and networked learning. The scopes of the journals are as follows:
i. The Journal of Workplace Learning focuses on formal, informal and incidental
learning in the workplace for employees and workgroups, and explores the
organizational, policy, political, resource issues and other factors which
influence learning.
ii. The Journal of Knowledge Management focuses on strategies, tools, techniques
and technologies for managing knowledge in organizations.
iii. The Knowledge and Information Systems (KAIS) provides a forum for research
on new advances related to knowledge systems and advanced information
systems, including their theoretical foundations, infrastructure, enabling
technologies and emerging applications.
iv. The Knowledge Management Research and Practice (KMRP) discusses the
current state of the knowledge management field that encompasses areas such
as: managing knowledge; organizational learning; intellectual capital; and
knowledge economics.
v. The International Journal of Learning Technologies (IJLT) publishes articles
related to theoretical foundations, design and implementation of instructional
technologies.
vi. The Journal of Interactive Learning Research (JILR) publishes articles related
to the underlying theory, design, implementation, effectiveness, and impact of
interactive learning environments in education and training.
vii. The Journal of Operations Management (JOM) publishes articles related to
operations management and supply chain empirical research that impact on
operations management theory and practice.
viii. The International Journal of Computer-Supported Collaborative Learning
investigates technological designs for collaboration and learning through
collaborative activity in education, business, and society.
ix. The Management Learning publishes research on organizational learning to
advance theory and practice.
x. The Learning Organization focuses on issues around organizational learning and
promotes critical analysis such as culture, organizational power, politics,
managerial ideologies, and employees’ participation in learning.
xi. The Computer Supported Cooperative Work (CSCW) disseminates research
results and ideas concerning theoretical, practical, technical, and social issues in
CSCW.
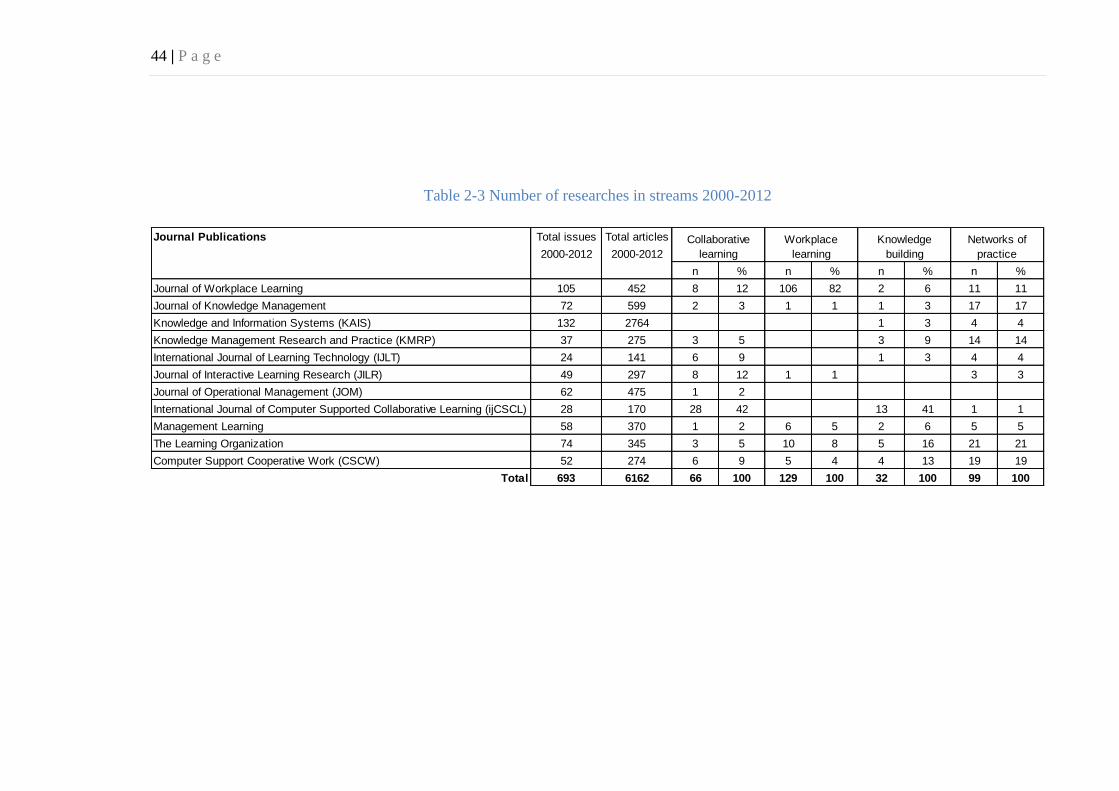
44 | P a g e
Table 2-3 Number of researches in streams 2000-2012
Journal Publications Total issues Total articles
2000-2012 2000-2012
n % n % n % n %
Journal of Workplace Learning 105 452 8 12 106 82 2 6 11 11
Journal of Knowledge Management 72 599 2 3 1 1 1 3 17 17
Knowledge and Information Systems (KAIS) 132 2764 1 3 4 4
Knowledge Management Research and Practice (KMRP) 37 275 3 5 3 9 14 14
International Journal of Learning Technology (IJLT) 24 141 6 9 1 3 4 4
Journal of Interactive Learning Research (JILR) 49 297 8 12 1 1 3 3
Journal of Operational Management (JOM) 62 475 1 2
International Journal of Computer Supported Collaborative Learning (ijCSCL) 28 170 28 42 13 41 1 1
Management Learning 58 370 1 2 6 5 2 6 5 5
The Learning Organization 74 345 3 5 10 8 5 16 21 21
Computer Support Cooperative Work (CSCW) 52 274 6 9 5 4 4 13 19 19
Total 693 6162 66 100 129 100 32 100 99 100
Collaborative
learning
Workplace
learning
Knowledge
building
Networks of
practice

45 | P a g e
The contexts of the articles were reviewed with particular attention given to the
treatment of collaborative learning, workplace learning, knowledge building and
networks of practice. The result shows that the Journal of Workplace Learning pays
more attention to workplace learning with 106 articles (82%) published in the related
area. The Learning Organization and Computer Support Collaborative Works published
the most articles on networks of practice, with 21 (21%) articles and 19 (19%) articles
respectively. From all of the eleven journals, workplace learning was the most popular
area of research with 129 articles, followed by networks of practice with 99 articles and
collaborative learning with 66 articles published. Surprisingly, this review did not find
any article with a special focus on the area of CNL.
2.5 Theoretical Paradigms
It is interesting to note that the research on CNL is still new and where technology
continues to evolve, the possibility of expanding the study of CNL will certainly grow.
The theoretical study on CNL in manufacturing is at its infancy stage, although there are
researches which support CNL infrastructures, architectures, systems and processes that
have been developed and expanded. There are a few well developed pedagogical
models for computer support collaborative learning (e.g. Cognition and Technology
Group at Vanderbilt U., 1997), but little is known on how different practices and
networked learning environments fit into different virtual learning communities and
cultures, or even support social learning within different organizational structures and
styles (Daradoumis & Marquès, 2000). CNL is a good example where the processes and
practices of collaborative learning in manufacturing organizations need exploration.
From the literature (see Table 2-4) it is found that the majority of the articles are based
on network theory (n=58), awareness theory (n=27) and constructivism theory (n=27)
published between the year 2000 and 2012. Journal of Computer Support and
Cooperative Work (CSCW) published 20 (74%) articles based on awareness theory,
while The Learning Organization published 22 (38%) articles based on network theory.

46 | P a g e
Table 2-4 Number of researches and theoretical paradigms 2000-2012
Journal Publications Total issues Total articles
2000-2012 2000-2012
n % n % n % n % n %
Journal of Workplace Learning 105 452 1 4 3 25 1 4 1 2 3 17
Journal of Knowledge Management 72 599 3 5 1 6
Knowledge and Information Systems (KAIS) 132 2764 4 7
Knowledge Management Research and Practice (KMRP) 37 275 1 8 2 7 5 9 1 6
International Journal of Learning Technology (IJLT) 24 141 1 4 3 5 1 6
Journal of Interactive Learning Research (JILR) 49 297 1 4 3 11 1 2 1 6
Journal of Operational Management (JOM) 62 475 1 2
International Journal of Computer Supported Collaborative Learning (ijCSCL) 28 170 3 11 2 7 2 3
Management Learning 58 370 5 19 1 2
The Learning Organization 74 345 2 7 4 33 10 37 22 38 6 33
Computer Support Cooperative Work (CSCW) 52 274 20 74 4 33 3 11 15 26 5 28
Total 693 6162 27 100 12 100 27 100 58 100 18 100
Socio-Technical
Theory
Awareness
Theory
Structuration
Theory
Constructivist
Theory
Network
Theory

47 | P a g e
Moving from a behaviourist and cognitive to a constructivist paradigm, collaborative
learning research has evolved from the transmission model with an emphasis on
pedagogical studies to a transformational model that is learner-oriented, where
knowledge is actively constructed and the learning process is facilitated through social
interaction. In the same way, CNL combines ideas from socio-constructivist theories of
learning using technology. Technological affordance (Brown et al., 2000) offers new
possibilities of collaborating in a virtual workspace, which affords significant time-
space independence for employees and their experts (Hara et al., 2000; Lipponen et al.,
2004; McConnell, 2000).
2.5.1 Awareness Theory
Awareness theory is based upon the fundamentals of cognitive capability to determine
the cause and effect of learning within a social environment. Awareness is widely
described and investigated in research on teamwork and collaboration (Carroll, 2008)
and was introduced because the traditional process flow-models such as data flow and
workflow models proved to be inadequate in addressing the awareness requirement of
users in collaborative work (Daneshgar et al., 2005). Awareness modelling emerged
from the area of computer supported cooperative work (CSCW) and has been at the
forefront of research for the last 20 years (Agre, 2001; Benford et al., 1994; Carroll et
al., 2009; Dourish & Bellotti, 1992; Gutwin et al., 1995; Jones et al., 2008). The review
of CSCW research and the field studies of Bjerrum and Bødker (2003), Gutwin and
Greenberg (2002) and Christiansen (2001) lead to an understanding of social awareness
through the analysis of space, mediators, and human conduct and culture. Daneshgar et
al. (2005) introduced the Awareness Net conceptual model for collaborative processes
within a virtual community. Endley (1995) also presented a theoretical model of
situation awareness in dynamic decision making. Jones et al. (2008) posit that “place-
activity-people” aggregates the influence information needs and people’s willingness to
share information (p.147).
In awareness theory, knowledge is constructed through definitive consciousness and
information awareness within the workgroup and its members (Gross et al., 2005).
Knowledge provides members with relevant information about their collaborators, their
activity, situation, or specific processes and occurrences (Gutwin et al., 2002). In that

48 | P a g e
sense, members are well informed about others’ conceptual knowledge. Digital concept
mapping tools such as Cmap (see http://cmap.ihmc.us/) fosters knowledge and
information awareness. This has been demonstrated in an empirical study for simulated
virtual groups by Engelmann, Tergan and Hesse (2010b). Knowledge and information
awareness are fostered by means of digital concept maps providing the conceptual
knowledge of the collaboration partners, as well as the background information
underlying this knowledge (Engelmann & Hesse, 2010a). To support collaboration
interactions, Carroll et al. (2009) posit that members must attain and maintain reciprocal
awareness of shared activity and information systems must design strategies
surrounding awareness support.
2.5.2 Structuration Theory
The underlying principle of structuration theory suggested by Poole and DeSanctis
(1994) and Orlikowski (Orlikowski, 1992a; 2000) is that CNL should be based on the
needs of technology users and their workgroups in appropriation of available
technologies. It evolves from Giddens’s (1984) earlier proposition which seeks to
resolve the contradictions of agency and structure theories that emphasize human action
and structuralism. Gidden (1984) uses duality to explain the reciprocal relationship of
human interaction and social structure. When employees interact with their colleagues
or workgroups they change the social structure and learning continues to evolve as
interactions continue. The structuring of technologies refers to users’ manipulation of
technologies to accomplish work and draws on a particular context of their work
(Majchrzak et al., 2000). Similarly, Seufert et al. (1999) propose a networks reference
model outlining the different dimensions using Giddens’s (1984) duality of structure.
Orlikowski et al. (1995) further introduced meta-structuring and technology-use
mediation as another source of structure. More recent work from Adamides and
Karacapilidis (2006) demonstrate reliance on structuration theory for developing the
enhanced process modelling construct (EPMC) and for adapting a participative
problem-resolution methodology (G-MoBSA) to the specific domain (p.572).
Studies that utilize structuration theory attempt to explain the relationship between
information technology and organization structure and identity. For instance, Weisinger
and Salipante (1995) use structuration theory in explaining how voluntary organizations

49 | P a g e
in the United States create a pluralistic membership by initiating cross-unit interactions
where the focus is on the organization’s superordinate identity. Rice (1994) reviews the
empirical research on the interplay of computer-mediated communication (CMC) and
information systems with pre-existing social and organizational structures. Others like
Lyytinen and Ngwenyama (1992) apply structuration theory to the research of computer
supported cooperative work (CSCW) and find that organization structure provides
essential support in the implementation of a CSCW system.
Poole and DeSanctis (1994), however, suggest using an adaptive version of
structuration theory in their study of group decision support system (GDSS). Studies
that use structuration theory focus on the appropriation and change in technology and its
impact on work structure. Adaptive structuration theory (AST) claims that appropriation
of technology does indeed affect the group decision making process, and in turn does
affect outcomes. It is further suggested that the appropriation of technology is based on
the needs and desire of the users (Belanger et al., 2008; Clear, 1999; Orlikowski, 1996)
and concludes that technologies adaptation evolves over time, sometimes gradually,
other times interrupted (Majchrzak et al., 2000; Tyre & Orlikowski, 1994). The
improved technology enables users to share knowledge and access information in a
timely fashion (Balenger et al., 2008). AST posits that the effective appropriation is
influenced by faithfulness of the appropriation, the group’s attitudes towards the
structures and the group’s level of consensus (Clear, 1999).
2.5.3 Social Constructivist Theory
Collaborative learning which combines constructivism and social learning is known as
social constructivism (Laurillard, 2009b; Vygotsky, 1978). Social constructivist theory
is socially grounded on a situated view of the learning process, as in ‘cognitive
apprenticeship’ (Brown et al., 1989), socially ‘shared cognition’ (Resnick, 1991; Stahl,
2004), learner-oriented approach (Driscoll, 2000; Pereira, 2001) and ‘situated learning’
(Lave et al., 1991). Constructivism offers significant insights into the means of
facilitating the development of problem solving capabilities (Ellis & Hafner, 2008) and
emphasizes active involvement in knowledge building by integrating new information
with existing experience (Niederhauser et al., 1999). Adopting a sociocultural
constructivist view of learning warrants conceptualising the actions of the learner within

50 | P a g e
the influences of the social origins of knowledge (Smith, 2006). According to
constructivism, knowledge is constructed by social interaction and collaboration
learning (Brophy, 2001; Huang, 2002; McDonald & Gibson, 1998).
Social constructivism assumes that an employee’s capacity for cognitive development is
enhanced with the presence of scaffolding or guidance during interaction. Employees
may appropriate knowledge that is shared and jointly created by the workgroup through
dialogic discussions and interactions. Hence, constructivist-based learning settings
reflect the conversational paradigm (Laurillard, 2002) and emphasize the necessity of
collaborative effort in the knowledge construction process (Lim, 2010). Participation in
networks of practice focus on the construction of knowledge and sense-making, which
is central to the study of online learning (Booth & Hulten, 2003; de Laat, 2006) and
functions in the context and environment in which social interaction and learning take
place.
Social constructivism promotes the design of a knowledge reflection process by
gathering insights on similar issues and past experiences. Problems and processes are
viewed from the perspectives of one another (Bryman, 1988). The main focus of the
social constructivist is on value interaction and negotiation among learners who together
construct new meaning to the knowledge (Bruffee, 1995; Dillenbourg et al., 1996).
Social constructivists also look at ways that collaborative interactions catalyse cognitive
development and they emphasize the role of co-construction of knowledge, where
learning is maximized in one’s own zone of proximal development (Vygotsky, 1987).
In the constructivist’s world view, knowledge is not drawn from a pre-conceived theory,
rather it is constructed on the patterns derived from the data (Wilson & Salmons, 2009).
Thus knowledge is drawn on contextual theories about learning and situated learning
(Cullen et al., 2002). The broad trends in organizational learning can then focus on
individuals in relation to their social context, environment and network of practice
(Illeris, 2003). According to Strijbos (2004) this is not a recent discovery as Illich
(1971) and Reimer (1971) argued that most learning does not require formal schooling
and that schooling could be replaced with self-motivated learning taking place through
learning webs or networks of people.

51 | P a g e
2.5.4 Network Theory
Network theory (Latour, 1991) explores the roles of human and non-human elements as
equals in an interactional network of connectivity as well as social behaviour leading to
sharing of information and collaborative learning. It also relates to complex interrelated
actors and their relationships with multiple domains or environments (Poell et al., 2000;
Wilson et al., 2009). Hanseth (1996) uses this theory to analyse information structure
development and applications. Network theory has proven to be a useful theoretical
framework to analyse structural conditions of technology and other enabling systems
such as flexible learning environments (Roberts, 2004), e-learning technologies (Tatnall
& Lepa, 2003), co-evolution of object and network collaboration in an innovative
process of product realization (Lehenkari, 2006; Miettinen, 1998), the collaborative-
based learning environment (Fjuk, 1998) or institutional networks for policy making
(Wilson et al., 2009). Network theory explores power differentials within networks
which states that actors are not in equilibrium due to difference in power, position or
ability (Camerer, 2004) and that hierarchies and peer relations form part of the
networks, coexisting and interacting (Heckscher, 2007).
Network theory often exemplifies the use of social network analysis (SNA) (Scott,
2000; Wasserman & Faust, 1997) to examine nodes which represent individual actors
(or employees) within the networks and ties to illustrate the interrelationships among
individual actors and introduces ‘structural variables’ to measure them (Martínez et al.,
2006, p. 384) such as degree of network centrality, patterns, size and density (Belanger
& Allport, 2008). Cohen and Prusak (2001) and Wilson et al. (2009) measure social
capita, focusing on the aspects of trust-building and the value that the individual actors
get from social networks. They argue that one cannot isolate knowledge from social
networks that involve relationships, obligations and commitments. Conversely,
centrality in a network is positively associated with satisfaction in team-based learning
(Baldwin et al., 1997) and a higher sense of belonging in the network of practice
(Haythornthwaite, 1998).
The research on networked learning highlights organizational learning as a cognitive
achievement and is about work practices that use computer networks in the

52 | P a g e
accomplishment of an individual’s goals and collective goals. Muller-Prothmann and
Frost (2009) claim that the basic element of collaboration in an organization is
knowledge sharing which serves as a function for learning, innovation and decision
making. When employees collaborate in global virtual teams there will be pressures
upon the individuals to optimize results for the overall global function as well for the
local unit (Rich & Lukens, 2009). Employees have to adopt collaborative technologies
based on the extent to which they perceive themselves as capable of using technology to
achieve their goals. However, Araujo (2009) also found that team members are likely to
exhibit different personal values, beliefs and attitudes, and cultural diversity that could
impact self-efficacy in collaborative technology adoption.
By focusing on collaboration and interpersonal relationships in organizations, academic
researches and business practices are led to various conceptualizations of informal
knowledge communication in networks of practice and social networks (Muller-
Prothmann et al., 2009). This also raises questions of identity and belonging; conflict
and cooperation; and change and continuity (Goodyear et al., 2004). Salmons and
Wilson (2009), however, recognize that few studies have actually examined
communication processes, or organizational or leadership practices that encourage or
hinder the development of working relationships needed to build and sustain online
collaboration. In short, most studies are still lacking depth in the structure, organization,
and the development process of collaboration or the degree of collaboration.
2.5.5 Socio-technical Systems Theory
Research on information systems examines more than just the technological system, or
just the social system, or even the two side by side. It investigates the phenomena that
emerges when the two interact (Lee, 2001, p. iii). The central principles of socio-
technical systems theory were first elaborated by Trist and Bamforth (1951). Luhmann
(1993) advances the approach in discussing modelling collaborative work combining
new epistemological concepts with system theory. The term socio-technical systems
(STS) relates to systems that combine social and technical sub-systems and interactions
between complex system infrastructures and human behaviour. In socio-technical
systems research, behaviour is often studied using an ethnographic approach, case
studies, social network analysis and surveys (Goggins et al., 2011).

53 | P a g e
According to Herrmann et al. (2004), social systems are defined by: the phenomena of
communications and cooperation between employees; emergence of systems; self-
referential development of systems, structures and processes; self-descriptions; and
responsible autonomy. Technical systems are defined by artefacts, control and
anticipation, state-transitions, and pre-programmed adaptability (Herrmann et al., 2004).
The relative structure and interactive patterns in the socio-technical context provide a
necessary contrast for exploring group behaviour and dynamics of interactions (Goggins
et al., 2011). It is assumed that the degree of integration between manufacturing
organizations and the CNL infrastructures is closely interrelated.
Variation in the socio-technical context does have an effect on group experience
(Dourish, 2004). The conditions affect the success (or failure) in the adoption of
collaborative technologies. Socio-technical information systems can be designed to
support storage and distribution of data as a basis of knowledge sharing within the
organization (Herrmann et al., 2007). In addition, Powell et al. (2004) reviewed 47
studies of virtual teams, and suggested that the development of virtual teams is
complex, multivalent and requires extensive study to determine the design based upon
the social technical mechanism.
2.6 Framework and Modeling Collaborative Networked Learning
Adamides and Karacapilidis (2006) observe that modelling is predominantly used in
process management, improvement, re-engineering and IT implementation initiatives.
Although there are a significant number of researches on the modelling of collaborative
networked organizations (Camarinha-Matos et al., 2006a; Huan, 2004; Löh et al., 2005),
networked learning (Stamatis et al., 1999), computer supported collaborative learning
(Weinberger & Fischer, 2006), and computer-supported collaborative work, few have
attempted to model CNL for manufacturing (Adamides & Karacapilidis, 2006; Dennis
et al., 1999; Taylor, 2001). Most of the models approach networked learning from
pedagogical, multi-agent systems, semantics or ontological standpoints. In contrast, the
participation framework is influenced by the works of Vygotsky’s sociocultural
approach and Deweyian pragmatism (Sfard, 1998), which provide appropriate tools for
observing and conceptualizing collaborative work in groups and distributed expertise

54 | P a g e
(Lipponen et al., 2004). Scardamalia and Bereiter (1994) propose a knowledge building
framework, which draws a theoretical distinction between knowledge building and
learning; and between the knowledge used in work practices, and the knowledge that is
the object or product of such work. The core of Engeström’s (1987) model of expansive
learning is the creation of a new model, concept and artefact as a consequence of a
shared understanding of a collaborative learning activity. Both address the same central
question: How is new knowledge created through collaborative activities? (Lipponen et
al., 2004).
The nearest constructivist approach to modelling is from Camarinha-Matos and
Afsarmanesh (2007) who attempted to design a framework for a collaborative
networked organization (CNO) using the following four dimensions:
i. Structural dimension - addresses the structure or composition of the
relationships between all employees or organizations (actors/nodes) and their
roles in the network.
ii. Componential dimension - focuses on the elements in the organization’s
network, for example: hardware/software resources, infrastructures and
architecture of the network supporting collaboration; information and
knowledge; human resources; and ontologies used in the network to facilitate
mutual understanding among the network members.
iii. Functional dimension - addresses the “base operations” available at the network
and the execution of time-sequenced flows of operations (processes and
procedures) related to the “operational phase” of the CNO’s life cycle.
iv. Behavioural dimension - governs the processes involved in collaborative
activities, for example, policies, governance, procedures, rules and value.
Prescribes normative guidelines or rules for formal behaviour such as principles,
strategies, and protocols. Deals with conflict resolution and contractual
obligations between the organizations and external parties.
Alavi and Liedner (2001) present a framework for e-learning, which explicitly
configures the relationships among technology capabilities, instructional strategy and

55 | P a g e
psychological processes involved in the learning process. Similarly, Gupta (2006) in his
doctoral study adapted the framework to model collaborative e-learning and end-users
training. The impact of training is mediated through learning and the interaction process
to achieve learning outcomes. The learning process is influenced by individual
differences and the support provided.
Kamrani (2008) proposes an integrative collaborative product development (CPD)
framework that provides design insight and a tool to evaluate, optimize and select better
alternatives. It consists of an analytical tool, a collaborative environment, an
optimization module, CAD modelling, and vendors’ catalogues. For the integration of
information, at every stage of product development there is a component for
collaborative technology. Gronau (2004) explores the idea of collaborative engineering
communities (CEC) as an application framework that enables Internet supported design
of the product development processes through the integration of consumers and
independent distributors in the design phase of a product lifecycle (PLC). In another
study, Huang, Kristal and Schroeder (2008) propose a model on the effect of internal
and external learning on mass customization capability (see Figure 2-4). The internal
learning generates knowledge within the organization through training and employees’
suggestions. The external learning identifies customers and suppliers as important
sources of knowledge. Internal and external learning are meta-routines that emphasize
problem solving and collaboration (Huang et al., 2008).
Figure 2-4 Effect of learning on process implementation and mass customization
(Source: Adapted from Huang, Kristal and Schroeder, 2008)
Lin (2007b) examines the impact of online information quality, system quality and
service quality and the impact of offline activities on the sustainability of networks of
practice and applies the technology acceptance model (TAM) as a theoretical

56 | P a g e
framework (see Figure 2-5). Information quality affects perceived usefulness, while
system-quality and service quality influence both perceived ease of use and perceived
usefulness of virtual communities. Perceived usefulness and ease of use are significant
antecedents of an employee’s sense of belonging and influence the intention to use a
network of practice.
Figure 2-5 Technology Acceptance Model of virtual communities
(Source: Adapted from Lin, 2007b)
Wasson (2007) proposes a framework for the technology enhanced learning
environment, which postulates the interaction between design and use and demonstrates
that the design of a technology enhanced learning scenario requires components of
organizational, pedagogical and technological aspects (see Figure 2-6). Huang, Jeng and
Huang (2009) use this framework for modelling their research on a mobile blogging
system to facilitate the learning activity in a technology enhanced collaborative learning
environment from design and use perspectives. The pedagogical view of collaborative
learning is regarded as a theoretical model of the design perspective and use perspective
where learners’ experimental activity influences the design and learning outcome.

57 | P a g e
Figure 2-6 Technology Enhanced Learning Environment
(Source: Adapted from Wasson, 2007)
Although these frameworks manifest the model in various forms of collaborative
learning, they do not depict the determinants of CNL; neither do they represent the
model for the antecedents of CNL. Nevertheless, the study advances from the
framework and guidance of socio-technical systems (STS) theory to develop an
integrative framework for CNL in manufacturing.
These models describe characteristics of effective group interaction, sharing of
information and construction of knowledge, such as organizational support (Scott &
Walczak; Mohrman et al., 1995; Harris & Bayerlein, 2003; Fuller et al., 2007, Smith,
2003), positive interdependence (Chatenier et al., 2009; Grant & Baden-Fuller, 2004;
Van der Vegt & Van de Vliert, 2001; Johnson & Johnson, 2003; Wageman, 2001;
Giuliani, 2007; Lechner et al., 2006; Lusch et al., 2010), promotive interaction (Soller &
Lesgold, 2000; Benbunan-Fich & Hiltz, 2003b; Swan, 2005; Whatley et al., 2005),
internal-external learning, perceived effectiveness and perceived usefulness.
2.6.1 Organizational Support
Organizational support in information systems is defined in terms of assistance,
feedback, encouragement and the provision of procedural support (Scott & Walczak,
2009). A support system is part of the organizational infrastructure that facilitates the
necessary processes to manage, control, coordinate and improve work (Mohrman et al.,
1995) which must be aligned with the organizational design (Harris & Bayerlein, 2003).
Ideally, employees are self-directed and the organization is willing to support their
employees’ learning goals and engagement with others in the learning networks (Fuller
et al., 2007; Smith, 2003) and extrinsic motivation to use technology (Scott et al., 2009).

58 | P a g e
The organization support is just as important in determining different forms of
knowledge construction, and influences different forms of learning using technology as
a mediator. Conversely, developing a training system, without organizational readiness
and support, may lead to failure (Billet, 2001).
2.6.2 Interdependence
According to Findley (1989) learners share a common purpose, dependent on and
accountable to individual and group successes of their work or projects. Learning
theories state that interdependencies between team members are necessary for achieving
desired learning outcomes (Chatenier et al., 2009). Task interdependence is embedded
in the jobs (Van der Vegt & Van de Vliert, 2001), and employees require assistance and
support from multiple teams to work collectively (Van der Vegt et al., 2001; Wageman,
2001). Studies have shown that self-managing teams, virtual global teams and other
cross functional teams that support joint improvement activities and new product
development (Grant & Baden-Fuller, 2004) require positive interdependence for the
groups to succeed. “When goal, task, resource and role interdependence are clearly
understood, employees realize that their efforts are required for the team to succeed”
(Johnson & Johnson, 2003, p. 174). Virtual teams have a higher rate of interaction and
higher interdependence between members than ordinary virtual groups (Furst et al.,
1999 as cited by Curseu et al., 2008). Interdependencies may shift from communication
networks, to collaborative networks involving joint technology development or
innovation projects with customers, suppliers and partners (Giuliani, 2007; Lechner et
al., 2006). Lusch, Vargo and Tanniru (2010) posit that the most challenging task is not
about technology and its intermediary support organizations’ ability to meet the value
propositions, but rather in gaining employees participation in a complex and
interdependent value network.
2.6.3 Interactions
Without interaction there is no real collaboration (Soller et al., 1999). According to
Lowyck and Poysa (2001), knowledge emerges through the network of interactions and
is distributed among employees and system that interact. Hence, learning is viewed as a
social construct, facilitated by communication, interaction, collaboration and
cooperation among employees (Benbunan-Fich & Hiltz, 2003b; Swan, 2005). The

59 | P a g e
degree of collaboration relies on the joint and shared ownership of the outcome and the
quality of interaction during the process (Whatley et al., 2005). Kreijns et al. (2003)
argue that interaction between the workgroup members will not automatically occur just
because the technology used allows social interaction. Engeström (1992) explains that
through collaborative activities, employees can focus on re-conceptualizing their own
interaction system to create new motives and artefacts. Even interactions with
computer-supported social networks (Wellman et al., 2000) should be considered as
strongly interactive. Effective collaboration increases interconnections between
organizations (Provan & Milward, 1995), increases interactions (Chen, 2011) and
fosters learning among employees (Inaba et al., 2000).
2.6.4 Internal-External Learning
According to Paiva, Roth and Fensterseifer (2008), internal knowledge development
leads manufacturing organizations to continuously fit their capabilities to environmental
changes. Internal learning resides within the organization; embedded in behaviour,
manufacturing activities, procedures, data storage, interactions, and repositories of
knowledge. Effective internal learning requires: skill in conducting self-appraisals;
ability to use appropriate learning standards and curricula; reflecting the assessment of
events and personal goals; and willingness to change learning strategies (Cortina et al.,
2004). Explicit knowledge is transformed into implicit knowledge through the process
of internalization (Curceu et al., 2008). Direct experience and interaction are the only
ways tacit knowledge can be transferred from an employee to another employee or
workgroups (Nonaka et al., 1995). On the other hand, external learning places an
emphasis on learning sources from inter-organizations, suppliers, partners and
customers; often in the forms of interactions, procedures, information sharing and inter-
organizational alliances. The ability to learn from external knowledge is a function of
skills, language and knowledge of the most recent scientific or technological
development in the field (Cohen & Levinthal, 2000).
2.6.5 Perceived Effectiveness
Soller and Lesgold (2000) posit that it would be impossible to enumerate and evaluate
the effectiveness of all possible interactions from collaboration because the dynamic
nature of human communication and interaction accounts for too many variables.

60 | P a g e
However, researchers are able to measure the perceived effectiveness and impact of
knowledge transfer and collaborative technology. Stonebraker and Hazeltine (2004)
examine the effectiveness of a virtual learning program managed by a MNC and found
that familiarity with the technology is directly associated with virtual learning
satisfaction and the positive perception of the relevance of the courses to the job.
2.6.6 Perceived Usefulness
Perceived usefulness reflects employees belief in their ability to obtain information and
services, share their experiences with others, and enhance their performance in
information exchange (Lin, 2007b). The information is useful only if the online
information is accurate, informative and updated (Perkowitz & Etzioni, 1999).
Information quality improves the usefulness by enhancing the fit between network
content and employees’ information requirements (Lin, 2007b). In addition, Lin and Lu
(2000) argue that information quality is a valuable predictor of the perceived usefulness.
Information quality is affected by its perceived usefulness and the employee’s ability to
recognise its value so that information can become integrated into experience (Cohen &
Levinthal, 1990; Lenox & King, 2004). System quality in online information system
measures the functionality of a portal (Lin, 2007b). System reliability, convenience of
access, response time and flexibility are qualities valued by users and affect the
perceived usefulness (DeLone & McLean, 2003; Nelson et al., 2005).
2.7 Collaborative Technology
Research on CNL has recently paid increasing attention to the rapid development of
collaborative technology (Goodyear, 2003; Laurillard, 2009b; Lipponen, 2002a, 2002b;
McAndrew et al., 2006; Pereira, 2001; Stonebraker et al., 2004). Collaborative
technology supports organizational learning by enabling employees to transfer and
exchange ideas and knowledge (Curseu et al., 2008; Laurillard, 2009b) through creative
use of multimedia, combined with communication tools (Pereira, 2001) and virtual
communities (Bergquist & Liungberg, 2001; de Souza & Preece, 2004; Hall & Graham,
2004). In the study on epistemological and ontological dimensions of human-computer
interaction (HCI), Brey (2005) outlines the epistemic3 and ontic
4 relation between
3 Epistemic devices extend human cognition by performing information processing tasks.
4 Ontic devices simulate environments and act as tools to interact with these environments.

61 | P a g e
humans and computer systems in support of information-processing and problem
solving. Computers are becoming ontic devices that generate and sustain new virtual
and social realities (Brey, 2005) and offer enormous potentials for collaborative learning
by overcoming time and space constraints (Laurillard, 2009a, 2009b; Lipponen, 2002a).
Based on the human-computer interaction (HCI) perspective, several studies have noted
that web site usability and service quality are the key factors for predicting members’
intention to use networks of practice (Kuo, 2003; Lin, 2007b; Preece, 2001; Soller &
Lesgold, 2000).
Advancement in the development of information communication technology (Carchiolo
et al., 2002; Serce & Yildirim, 2006) and wireless communication technology
(Motiwalla, 2005) accelerate the use of CNL through the Internet and provide new
opportunities for communication and innovative employee interaction both in and out of
the learning setting (Chen et al., 2003; Clough et al., 2007; Lakkala, 2007; Tatar et al.,
2003). Technology is easily applied for transmitting and delivering knowledge
(Lipponen, 2002b) and since wireless handheld devices support a cooperative and
collaborative learning environment, mobility, coordination, communication, and
organization of materials, negotiation, and interactivity are greatly enhanced in ways not
possible in conventional learning environments (Lai & Wu, 2006; Zurita & Nussbaum,
2004). The CNL leverage on computer technology to provide analytical capabilities,
interactivity, and networking support and to organize geographically dispersed teams
(Camarinha-Matos et al., 2006a; Suthers et al., 2008; Wasson, 2007), allowing
distributed people to communicate, collaborate, and share information over distance and
time (Belanger et al., 2008; Curseu et al., 2008; Susman et al., 2003).
In addition, Zakaria, Amelincks and Wilemon (2008) in their study on global virtual
teams describe how the heterogeneous workgroups used synchronous and asynchronous
technologies to collaborate. Although collaborative technology encompasses a variety
of functions to support group work, including information exchange, shared
repositories, learning management systems, and groupware systems to facilitate
communication and coordination (Bhatt et al., 2005; Cooper, 2003; Orlikowski &
Hoffman, 1997), employees must make sense of collaborative technology, each other
and the task at hand simultaneously (Goggins et al., 2011; Laffey et al., 2006). A CNL

62 | P a g e
environment should be flexible to promote constant growth and development, following
changes in organizational needs, employees’ expectations, and technology
advancement.
2.7.1 Structured Collaboration
Structured collaboration provides a workspace for individuals and workgroups to
communicate or collaborate. Structural mechanisms include communication channels,
organizational structure, physical, technical, and work-system infrastructure that enable
practice-based learning (Docherty et al., 2008), workspace tools and a workflow
management system (Lee & Holmquist, 2009). The establishment of lateral structures
enable CNL across organizational units to transform organizational design, organize
learning programmes, and establish global virtual teams. Collaborative tools enable
employees to share workspace for the authoring and review of documents in a
controlled manner, which fit well with organizations that use a team-based approach for
work (Lee et al., 2009). A workflow management system represents the movement of
information that flows through the sequence of steps or operations. For instance, by
analysing the historical data of workflow executions, bottlenecks, workloads, and
throughput time, missed datelines can be clearly identified for remediation or further
improvement (Haag et al., 2006). Structured collaboration is therefore a crucial
component for establishing policies and governance pertaining to CNL, and for
ensuring the effectiveness and consistency of the learning programmes.
In a study of manufacturing organizations, Choy et al. (2008) found that effective
learning occurs when employees are provided with structured learning experiences and
opportunities with graduated access to vocational experiences to achieve a higher level
of competency. In manufacturing, work-based learning encompasses a variety of job
related skill sets that are needed to perform specific roles and/or tasks. An effective
collaboration therefore requires some alignment or integration between the business
processes and the information systems. On that basis, Muller-Prothmann (2009)
introduced KMmaster®, a software application that is designed to facilitate
collaboration and create a platform to support knowledge communication in teams,
departments, or inter-organizational networks.

63 | P a g e
2.7.2 Unstructured Collaboration
Unstructured collaborative technology consists of synchronous and asynchronous
systems. Unstructured data includes application files and text data format, and other
multimedia or graphic data, which can be stored in personal folders and shared
workgroup folders, and multiple file servers (Manwani & Moon, 2004). Both
synchronous and asynchronous technologies focus on integrating the unstructured data
into useful information. Lee and Holmquist (2009) define this type of unstructured
collaboration as computer application and information tools for example, computer-
mediated communication (CMC). Some scholars believe the terms asynchronous
learning and e-learning are frequently used interchangeably (Levy, 2007). While
learning through an online forum constitutes asynchronous e-learning, learning through
chat or instant messaging is considered as synchronous e-learning (Bouhnik et al.,
2009). However, the notion of e-learning actually constricts the definition of CNL and
does not recognize other forms of informal learning and participatory-based learning.
Choosing between synchronous and asynchronous systems depends on the needs and
the stage of collaboration. The delay of asynchronous communication, for instance,
allows time for reflection in interaction and helps learners to reflect on their own and
others' ideas and to share their expertise (Lipponen, 2002a). According to Wasson
(2007), before embarking on a project task, the rate of synchronous meetings and
frequency of communication are higher than the post decision. The asynchronous nature
of the post decision work only takes precedence after the need for synchronous
meetings has diminished, or members have been reassigned to their respective area of
responsibility. Learning is then transformed into more of a cooperative, rather than a
collaborative form of work (Wasson, 2007). While the asynchronous learning has the
capability to expand time which allows extended interactions, synchronous learning has
the capability to contract time which makes it particularly appropriate for tasks that
require interactivity, spontaneity and fast decision-making. Unlike a face-to-face setting,
asynchronous communication lacks immediacy of feedback (Strijbos, 2004). On the
other hand, synchronous learning provides a sense of immediacy and communicative
presence, hence enhances interactions (Haythornthwaite et al., 2000).

64 | P a g e
2.7.2.1 Asynchronous Learning Network
The asynchronous learning network (ALN) involves the exchange of information
between group members at different times. It allows participants to contribute and
express ideas (Ingram & Hathorn, 2004) facilitated by emails and discussion forums
(Bouhnik et al., 2009; Kildare et al., 2006), while maintaining contact over time and
sharing group documents (Bennett, 2004). Coordination in asynchronous collaboration
involves the offline data capture of missed messages, traces of interactions, and the
historical view of the collaborative outcome (Balmisse et al., 2009) which include
email, listservs, newsgroup, chatrooms, Microsoft SharePoint, Lotus Notes/Domino,
podcasts and discussion forums. Other office applications (e.g. wordprocessors,
spreadsheets and presentations) are part of the collaborative tools that support the co-
authoring of electronic documents. Integration of these applications, for example
between Acrobat X with Sharepoint and Microsoft Office, delivers an efficient, easily
deployed and secure online collaboration solution, complete with document conversion,
reviewer notifications, response tracking, comment aggregation and archiving
capabilities (Forrester Consulting, 2010). The asynchronous learning network (ALN)
provides access to project documentations, accelerates decision making, reduces
turnaround time and increases team efficiency.
The development of online collaborative office applications such as CallanosTM
(for
team document sharing, workplace and project collaboration), and Google applications
and Office Web applications enhance wordprocessors, worksheets and presentations to
work virtually anywhere with a supported browser. According to Fjuk and Smodal
(2001), the Internet provides capabilities for searching, browsing and exchanging
information. More recently, wiki has been widely used by organizations as a type of
asynchronous web-based collaboration tool.
The use of computer technology in CNL is constantly expanding. The most original
applications of computer support collaborative learning (CSCL)5 and collaborative
technology are, perhaps, networked learning environments (or groupware) such as
Computer Supported Intentional Learning Environment (CSILE) (Scardamalia et al.,
5 According to Strijbos (2004) CSCL involves a simultaneous study of the interaction between cognitive,
motivational and social components in an attempt to learn through collaboration.

65 | P a g e
1994) or Future Learning Environment (FLE-Tools) (Lakkala, 2007; Muukkonen et al.,
1999) which are designed for educational use and collaborative knowledge construction
(Lipponen, 2002b; Scardamalia et al., 1994). CSCL provides users tools for posting
knowledge into a shared workspace and system tools for progressive discourse
interaction between employees (Scardamalia et al., 1994). In the same way, the
asynchronous learning network (ALN) is organized for members who use computer-
mediated communication (CMC) networks to learn, at the time, place and pace suited to
support reflective and analytical approaches to interaction (Harasim et al., 1995;
McConnell, 2000; Motterham & Teague, 2000). Moreover, Hutchins and Hutchinson
(2008) posit that the emphasis on the usability of the asynchronous sources and the
immediacy of these sources are crucial. With the increasing number of global
collaborations, it is not surprising that the ALN is more frequently used than
synchronous communications because they provide flexibility for the dispersed
employees (Wilson et al., 2009).
While the ALN enables effective knowledge sharing and allows employees to focus on
important tasks and provides freedom to initiate, and respond, it may be problematic to
get timely communication and collaboration (Lee et al., 2009). The delay allows time
for reflection in interaction (Dillenbourg et al., 1996; Lipponen, 2002b). Group
members can carry on lengthy but focused conversations with asynchronous
conferencing systems that maintain conversational threads about specific subjects of
interest (Sproull & Kiesler, 1991; Turoff, 1991), schedule activities on group calendars
(Lange, 1992), track activities through workflow systems (Abbot & Sarin, 1994), and
post and retrieve documentation comprising a repository of organizational memory and
expertise through hypertext (Ackerman, 1994; Ackerman & Malone, 1990; Conklin,
1992). A study of a mobile blogging system revealed positive and encouraging support
for collaborative learning (Huang et al., 2009).
2.7.2.2 Synchronous Learning Network
Synchronous learning network (SLN) occurs when single or multiple parties exchange
information concurrently. A synchronous system allows employees to meet online
through synchronous discussion and quickly share ideas (Ingram et al., 2004). This
includes real-time chatting, exchange of information through group interactive sessions

66 | P a g e
and audio-video conferencing such as Skype, webcast, Vyew (for collaboration and web
conferencing), Concept Share (for sharing and feedback on Web and other design
products), Twiddla (online whiteboard), instant messaging, and Microsoft’s
NetMeeting. Other systems that support real-time collaboration over work artifacts
include application sharing (Greenberg, 1990), groupware drawing systems (Greenberg
et al., 1995), groupware text editors (Baecker et al., 1993), live presentation tools and
business meeting tools for brainstorming and idea organization (Valacich et al., 1991).
All these systems encourage collaboration and sharing of expertise through
conversations and discussions (Hass et al., 2003). Instant messaging is based on peer-to-
peer (P2P) technology which requires client application over the Internet protocol.
Participating in multi-point and multi-threaded conversations over instant messaging in
the virtual workplace may pose issues to employees of older generations who do not
have a similar experience to the Internet savvy generation and desire to use the tool in
the same way (Lee et al., 2009).
Although teleconferencing and video conferencing has been around since the early
1990s, the advancement of conferencing technologies provides a forum for
geographically dispersed teams to collaborate and exchange ideas and information,
while virtual customer support centres or helpdesk technicians remotely collaborate,
using chat, email, discussion list, or screen sharing to assist and support customers in
their homes and offices. Virtual contact centres take advantage of the “anytime”,
“anywhere” characteristics of the Internet (Irons, 2009). More recent affordability of the
broad bandwidth technology further enables video over the internet protocol (VoIP) to
deliver voice communications and multimedia sessions over an internet protocol (IP)
network such as Skype. The benefits of web-conferencing include increased business
efficiencies, speeding up the process of organizing meetings, accelerate the decision
making process, and cutting travel expenses. Frequently, technology is used as a
marketing tool to give presentations and discussion with customers over the Internet
(Lee et al., 2009). Others like network conferencing (in the form of discussion forums,
bulletin boards, etc.) create unstructured group discussions.

67 | P a g e
2.8 Applications of Collaborative Networked Learning
The need to adopt CNL in manufacturing arises from three developments: 1)
widespread interest in organizational learning; 2) the present ubiquitous use of ICT for
online training and e-learning; and 3) the omnipresence of virtual teams within the
organization (Brandon & Hollingshead, 2008). These developments are well supported
by scholarly studies on networked learning (de Laat, 2006; Goodyear, 2000, 2005;
Goodyear et al., 2004; Goodyear et al., 2006) which conclude that CNL enables
organizations to adapt and respond to global demands for rapid change and to have
greater agility (Bogenrieder & Nooteboom, 2004; Knight & Pye, 2005; Polito &
Watson, 2002; Quik et al., 2006).
In product life cycle (PLC) management, employees use CNL to interact in a dynamic
virtual workspace for the entire phases from product conceptualization, design, build
and servicing (Sayah & Zhang, 2005). CNL can be applied to accelerate product
realization by reducing developmental costs and improving organizational performance
and responsiveness to market needs. With global virtual teams, operating costs are
further reduced due by cost saving in travelling, relocation and the avoidance of
expatriation assignments (Duarte & Snyder, 1999).
CNL helps build an organizational culture that fosters learning and the open sharing of
knowledge and innovations. Best practices and transferable processes can be effectively
proliferated across the globe, creating new standards and leveraging successes from
other organizations or subsidiaries. Learn by doing and guided methodology for
problem solving could transform organizational knowledge (Quik et al., 2006). Virtual
team collaborations focus on participatory learning facilitates and the sharing of
knowledge between employees and workgroups (Valkanos & Fragoulis, 2007). CNL
enables geographically dispersed employees and workgroups to document, disseminate
and share product information such as product schematics, bill of materials (BOM) and
technical specifications over the network. Vital information can be shared and
transferred on a secured and accelerated pace or real-time basis.
From an individual’s perspective, an employee is concerned about the need to acquire
new sets of knowledge and skills to improve and to simplify his/her work processes,
68 | P a g e
increase productivity and to reduce the cost of reworks (Quik et al., 2006). According to
Daradoumis and Marquès (2000), virtual team collaboration creates the potential for
cognitive and metacognitive benefits. It reinforces and improves learning of the subject-
matter and engages employees in the CNL process. Likewise, employees who are
trained on the use of collaborative tools are able to formulate new knowledge and
enhance their problem solving skills and innovations (Quik et al., 2006). CNL also leads
to extensive learning opportunities, affordance and development in communication and
socio-technical skills.
2.9 Summary
The literature review in this chapter underpinned the importance of theoretical and
conceptual development in the area of CNL. It argued that better understanding of the
inter-relationships between CNL and organizational learning is further required. It also
explored the concept of collaborative learning from multiple perspectives and
theoretical paradigms. The underlying premise is that CNL is well known and widely
used in today’s manufacturing organizations. Many have leveraged the use of
collaborative technology to share information and to accelerate learning. However, the
nature of manufacturing industries is so diverse that there is no cohesive CNL system
that could be unilaterally adopted or used by all manufacturing organizations. Although
there is a vast literature on collaborative learning in the context of education, there is
also lack of research exploring the antecedents of CNL in manufacturing.
This study attempts to fill these gaps by conducting an empirical research that examines
various antecedents influencing the adoption and utilization of CNL. The inadequacy of
knowledge in the research of CNL in manufacturing has spurred this doctoral study and
helped to shape the research propositions in the following chapter. The research
questions are presented below:
RQ1. What are the significant antecedents for a CNL model in manufacturing?
This research question addresses the need to examine the proposed constructs:
organizational support, positive interdependence, promotive interactions,
internal-external learning, perceived effectiveness and perceived usefulness in

69 | P a g e
their roles as antecedents influencing the dependent variable CNL in
manufacturing.
RQ2. How significant are the relationships between CNL and organizational support,
positive interdependence, promotive interaction, and internal-external learning?
This question examines the relationships between organizational support,
positive interdependence, promotive interaction, and internal-external learning
with CNL. This will operationalize the research objective and the antecedents of
CNL to establish an integrative framework within the manufacturing context.
RQ3. What are employees’ perceptions of CNL’s usefulness and effectiveness in
manufacturing?
This question identifies CNL implementation with employees’ perceptions of
CNL effectiveness and usefulness. It also relates to RQ2 on the need to establish
a solid CNL system within the proposed framework. Perceived effectiveness and
usefulness are expected to bear some influences.
RQ4. What are the differences between CNL for multinationals companies (MNCs)
and CNL for small medium enterprises (SMEs)?
This question aims to investigate the difference between CNL for MNCs and
CNL for SMEs. Although both exist within the manufacturing industry with
common operational models, it is of interest to determine the barriers and
challenges in implementing CNL programmes. In particular, the frequency and
intensity of CNL usage between both organizations is investigated, bearing in
mind the likely scarcity of resources in SMEs.
The research questions define the scope of the research and determine what is to be
studied, and to some extent how it will be studied (Blaikie, 2000, 2010; Creswell, 2008;
Johnson & Onwuegbuzie, 2004). The research questions are derived from and extend
the research objectives or purpose (Ridenour & Newman, 2008), as well as representing
the direction of the research (Creswell, 2008). The research questions are used to
formulate the framework for the research in the next chapter.

70 | P a g e
CHAPTER 3: RESEARCH FRAMEWORK
3.1 Introduction
From the review of the literature in Chapter 2, the study identified gaps in the literature
which lead to an outline of the research questions. This chapter provides a rationale for
the model of the study and introduces the conceptual framework. The conceptual
framework aims to illustrate the relationships between the independent variables and
dependent variables and to operationalize CNL. The relationships are supported by the
research propositions.
3.2 Restatement of the Research Questions
The purpose of this study is to establish the antecedents of collaborative networked
learning in manufacturing by addressing the following research questions:
RQ1. What are the significant antecedents for a CNL model in manufacturing?
RQ2. How significant are the relationships between CNL and organizational support,
positive interdependence, promotive interaction, and internal-external learning?
RQ3. What are employees’ perceptions of CNL’s usefulness and effectiveness in
manufacturing?
RQ4. What are the differences between CNL for multinationals companies (MNCs)
and CNL for small medium enterprises (SMEs)?
3.3 Conceptual Framework
A framework represents a set of basic assumptions or fundamental principles in which
discussion and actions can proceed (Popper, 1994). It is closely related to the
‘theoretical perspectives’ and the ‘ontological conceptual’ (Blaikie, 2010). The
conceptual framework acts as a model to focus on interpreting the phenomena relevant
to the research. When the framework is translated into measurable relationships between
concepts, then it becomes an operationalized system which eventually develops into
theory after it has been tested (Blaikie, 2010).

71 | P a g e
The initial selection of the constructs was generated from the researcher’s self-
reflections based upon years of experience as practitioner in the area of study.
Following this, a comprehensive list of constructs used in previous empirical researches
was drawn from the literature in Chapter 2. This is consistent with Netemeyer’s (2003)
recommendation that the process of research development starts with a review of the
literature in order to extract a solid theoretical definition of the constructs and domains
delineated and outlined domains. The result from the extraction of theoretical definition
of the constructs and domains from closely related empirical studies is summarized in
Table 3-5. Having identified the constructs from the literature the researcher then
engaged in consultations on the area of research with experts from manufacturing
organizations and with a panel of senior academics and researchers at AUT.
Concepts of CNL are drawn from collaborative learning, cooperative learning and
work-based learning. The related constructs are then associated to the CNL environment
to ensure compatibility in purpose and functions. The justifications on the selection
from a range of constructs to develop the antecedents of CNL are shown in Table 3-6.
The selected constructs are then adopted and developed into a conceptual framework of
CNL, as shown in Figure 3-7. These theoretical deductions are then investigated by
examining the antecedents that support CNL in manufacturing organizations.

72 | P a g e
Table 3-5 Empirical studies on related areas
Classification of Scale Authors Methodology Sample size Related construct(s)
Collaboration technologies Nikas, Poulymenakou, and Kriaris
(2006)
quantitative (survey) 285 companies, response rate 62.5% Top management support, IT
department quality, collaborative work
practices, environmental
Implicit knowledge
dissemination
Fedor, Ghosh, Caldwell, Maurer and
Singhal (2003)
qualititative (semi
structured interview)
quantitative (survey)
10 companies, 48 teams, 150
members, response rate 62.5%
organizational support, internal-
external learning, project success
and impact
Cross-functional teams Chen and Paulraj (2004) quantitative 954 sample size, 232 responded,
response rate 24.3%
top management support, information
technology, communication, cross
functional teams
Knowledge management
system
Vitari, Moro, Ravarini, and Bourdon
(2009)
quantitative 103 consultants (response rate 8%),
97 engineers (response rate 20%)
organizational culture, organizational
structure, perceived usefulness
Communities of practice Zboralski (2009) quantitative (SEM) 1 MNC, 220 active CoP, 222
participants from 36 CoP
management support, interaction
frequency, interaction quality
Interdependence (job) Dean and Snell (1991) quantitative 512 manufacturing companies, 123
plant managers, 101 operations
managers, 109 quality managers, and
97 production managers
Interdependence
Competitive and
collaborative learning
Regueras, Verdu, Verdu and Castro
(2011)
quantitative 36 students (in pairs) positive interdependence
Cooperative learning Janz and Prasarnphanich (2003) quantitative (SEM) 13 organizations, 28 teams, 231
teams members
positive interdependence, promotive
interaction, effectiveness
Continuous improvement/
learning
Anderson, Rungtusanantham,
Schroeder, and Devaraj (1995)
quantitative 41 out of 72 plants participate, 60%
response rate
Internal and external cooperation,
learning
Continuous improvement Rungtusanantham, Forza, Koka,
Salvador, and Nie (2005)
quantitative (secondary
data)
110 plants in Round Two WCM
database
Internal and external cooperation,
learning
Organizational learning
scales
Schroeder, Bates and Junttila (2002) quantitative (SEM) 164 plants, 65% response rate Internal and external learning
Knowledge transfer effort Zellmer-Bruhn (2003) quantitative 3 companies, 158 teams knowledge acquisition and transfer,
external learning
Team learning Sarin and McDermontt (2003) quantitative 52 teams, 229 members team learning, participation

73 | P a g e
Table 3-5 Empirical studies on related areas (cont’)
Classification of Scale Authors Methodology Sample size Related construct(s)
Virtual teams Lin, Wang, Tsai, and Hsu (2010) quantitative (SEM) 40 out of 200 companies,
1000 questionaires, 312 usable
response rate 31.2%
perceived job effectiveness,
perceived benefits
Computer technology Lowerison, Sclater, Sshmid, and Abrami
(2004)
quantitative 1231 students in 61 classes perceived effectiveness
Learning management
system (LMS)
Ritchie, Drew, Srite, Andrews and
Carter (2011)
quantitative (SEM) 388 sales associates, 52% from US,
48% from 31 different countries,
response rate 54%
perceived usefulness
Information system Venkatesh, Speier and Morris (2002) quantitative (SEM) not mentioned perceived usefulness
Organizational knowledge Bock, Kankanhalli and Sharma (2006) quantitative (SEM) 44 working professionals perceived usefulness
Virtual communities Lin (2007) quantitative (SEM) 200 questionaires, 165 completed,
response rate 82.5%
perceived usefulness, information
quality, system quality, service quality
Usage of intranet Lee, Kim (2009) quantitative (SEM) 333 intranet users,10 companies technical support, task
interdependence, perceived
usefulness
Design-process integration Droge, Jayaram, and Vickery (2004) quantitative 150 first-tier suppliers external integration
Information sharing Li, Rao, Ragu-Nanthan, and Ragu
Nanthan (2005)
quantitative (SEM) 3,137 respondents, 196 useable supplier partnership, information
sharing
Information sharing Monczka, Peterson, Handfield, and
Ragatz (1998)
quantitative 84 companies, response rate 41% information participants and
information sharing
Collaborative learning Martinez, Dimitriadis, Gomez-Sanchez,
Rubia-Avi, Abellan, and Marcos (2006)
qualititative
quantitative
social network analysis
CA-UVA > 100 students
AIB-OUC > 130 students
network centrality, density
Team perception of
knowledge sharing
Hoegl, Partoeeah, and Munson (2003) 145 teams, 430 interviews perception of strength, network
preference

74 | P a g e
Table 3-6 Selection of Constructs for CNL
Classification of Scale Related construct(s) Reason for Selection
Collaboration technologies Top management support, IT
department quality, collaborative work
practices, environmental
Management support is imperative for
collaborative technology e.g. resource allocation,
promotions and support structure.
Implicit knowledge
dissemination
Organizational support, internal-
external learning, project success
and impact
Organizational support and internal-external
learning supports knowledge dessemination
Cross-functional teams Top management support,
information technology,
communication, cross functional
teams
Management support key to success in cross
functional teams and IT/IS project management.
Knowledge management
system
Organizational culture, organizational
structure, perceived usefulness
Organizational structure related to organizational
support. Perceived usefulness could be key to
adoption of CNL system
Communities of practice management support, interaction
frequency, interaction quality
Management support and promotive interaction
are factors that promote workgroups in CNL
Job interdependence Interdependence Job interdependence forces employees to use
CNL.
Competitive and
collaborative learning
positive interdependence
Cooperative learning positive interdependence, promotive
interaction, effectiveness
Continuous improvement Internal and external cooperation,
learning
Internal-external learning affects continuous
improvement, which is the purpose of CNL
Organizational learning Internal and external learning Internal-external learning core to sharing and
learning within the organization
Knowledge transfer effort knowledge acquisition and transfer,
external learning
External learning influences knowledge transfer
which relates to CNL sharing of information
Team learning team learning, participation Out of scope for the study of antecedent of CNL.
This construct is more relevant in the study of
group dynamics and effect of CNL.
Virtual teams perceived job effectiveness,
perceived benefits (usefulness)
Perceived effectiveness is also to related to CNL
as it is dependent on workgroups.
Computer technology perceived effectiveness Perceived effectiveness could effect the adoption
of CNL system or collaborative technology.
Learning management
system (LMS)
perceived usefulness LMS is part of CNL's sub-system in the use of
computer support learning.
Information system perceived usefulness
Organizational knowledge perceived usefulness
Usage of intranet technical support, task
interdependence, perceived
usefulness
Intranet is a form of collaborative technology.
Technical support can be related to
organizational support.
Information sharing supplier partnership, information
sharing
Could be measured by interdependence and
interactions.
Collaborative learning network centrality, density Omitted. Related to Social Network Analysis
(SNA) theory and not STT
Team perception of
knowledge sharing
perception of strength, network
preference
Omitted. Related to Social Network Analysis
(SNA) theory and not STT
Positive interdependence, promotive interaction,
and perceived effectiveness are determinants of
competitive, cooperative and collaborative
learning.
Perceived usefulness could effect the adpotion
of CNL system or collaborative technology

75 | P a g e
Figure 3-7 Conceptual framework of CNL
The research is driven by the determination to test a provisional supposition about the
phenomena of CNL and propositions which state that there is a causal relationship
between the dependent variable and independent variables. The relationships among the
variables are shown by the following eleven propositions:
P1 Organizational support is an antecedent of CNL.
P2 Positive interdependence is an antecedent of CNL.
P3 Promotive interaction is an antecedent of CNL.
P4 Internal-external learning is an antecedent of CNL.
P5 Employees’ perceived effectiveness is an antecedent of CNL.
P6 Employees’ perceived usefulness is an antecedent of CNL.
P7 For MNCs and SMEs, the influence of CNL is different.
P7a The influence of online learning is different between MNCs and SMEs.
P7b The influence of a shared database is different between MNCs and SMEs.
P7c The influence of online meetings is different between MNCs and SMEs.
P7d The influence of email for work is different between MNCs and SMEs.
3.4 Research Propositions (RP)
This research is driven by the desire to test a provisional supposition of antecedents of
CNL. Propositions are preferred because of the exploratory nature of the study as
previously the theory of CNL had not been developed. Although the terms proposition
and hypothesis both refer to the formulation of a possible answer to specific research

76 | P a g e
questions, Whetten (1989) contrasts the two and explains that a proposition states a
relationship between two concepts, whereas a hypothesis operationalizes this
relationship into an empirically testable form of statement. The notion of hypothesis
testing is inappropriate for theory building, since it is “an interpretative exercise
designed to produce a theory for later testing” (Flynn et al., 1990, p. 255). The intent of
this study is to develop a theory by identifying relationships between the proposed
antecedents and their associations with CNL. The propositions suggest relationships
between the proposed antecedents and CNL in a condition where at present the
relationships can neither be verified nor confirmed by previous empirical research.
Thus this study proposes the following propositions in 3.4.1 to 3.4.7. The first set of
propositions (P1, P2, P3, P4, P5, and P6) seeks to identify the antecedents of CNL. The
second set of propositions (P7, P7a, P7b, P7c, and P7d) compares employees’ level of
engagement in CNL in terms of hours spent using online learning, a shared database,
online meetings, and email to perform their work.
The proposed antecedents for this research are selected from prior studies in technology
acceptance, collaborative learning and cooperative learning. They are linked to the
research questions in Section 3.2 and conceptual framework in Section 3.3. As
antecedents, the researcher considers important events, circumstances, or precursors that
transpired before employees in manufacturing organizations are likely to adopt CNL.
As such, the proposed framework must be well-grounded and supported with a multi-
dimensional approach to socio-technical system (STS) theory.
3.4.1 Proposition 1 (P1) Organizational Support is an Antecedent of CNL
A support system is part of the organizational infrastructure that facilitates the necessary
processes to manage, control, coordinate and improve work (Mohrman et al., 1995) and
in the case of CNL, the organization would support their employees’ learning goals and
engagement with others in the learning networks (Fuller et al., 2007; Smith, 2003).
Therefore, perceived organizational support is positively related to self-efficacy and the
motivation to learn (Chiaburu et al., 2010) and is strongly associated with affective
commitment (Aube et al., 2007). Thus, it can be postulated that organizational support
through the provision of opportunities for diverse employees to engage in collaborative

77 | P a g e
work and learning is an important antecedent to achieve positive CNL outcomes.
Likewise, the greater the extent to which employees perceive that the organization or
management is providing support, the more the employees are willing to learn and
engage through collaborative network.
3.4.2 Proposition 2 (P2) Positive Interdependence is an Antecedent of CNL
CNL occurs in interactive groups in which participants actively communicate and
negotiate meaning with one another. In a complex problem solving situation, employees
are required to collaborate with each other (Chan et al., 2001) resulting in positive
interdependence between learners (Hung & Chen, 2001). Although manufacturing
organizations may be highly segmented into departments, as operational knowledge
becomes more specialized and complex, solutions to problems will require
interdependence of employees working together. Positive interdependence refers to the
degree to which the performance of a single group member depends on the performance
of all other members (Strijbos et al., 2004, p. 197). Positive interdependence also relates
to the attainment of individual goals to the success of others in the workgroup (D'eon,
2005; Johnson & Johnson, 1989; Johnson et al., 1998; Kravcik et al., 2004; Kreijns et
al., 2003; Young, 2003). Building a CNL system requires employees to think in terms
of organized networks of mutual interdependence and to overcome individual
differences (Heckscher, 2007). Conversely, employees whose job requires less input
from others, requires less information access than those who do (Gray & Meister,
2004). Positive interdependence facilitates the development of new insights and
discoveries through promotive interaction (Gabbert et al., 1986; Johnson et al., 2003).
3.4.3 Proposition 3 (P3) Promotive Interactions is an Antecedent of CNL
Social interaction is the key element in CNL. An interaction in CNL encompasses
interactivity between employees and their workgroups, from information sharing to
task-oriented discussions, to achieve shared understandings and knowledge
construction. Promotive interaction means close, usually synchronous, purposeful
activity and joint decision making (D'eon, 2005) where employees participate in
workgroups to complete their tasks and goals (Johnson et al., 2003). For CNL to occur,
both action and interaction need to be well coordinated within the shared workspace in
the manufacturing network. It has to be a deliberate planning by the management or

78 | P a g e
organization to promote interaction. In a review of 168 studies between 1924 and 1997
by Johnson, Johnson and Smith (1998), cooperation among learners improved learning
outcomes relative to individual work across the board. Their finding is further supported
by Springer et al.’s (1999) review of 37 studies of students in science, mathematics,
engineering and technology. Interactions with computer-supported social networks
(Wellman et al., 2000) should also be considered as strongly interactive. In addition,
effective collaboration increases interconnections between organizations (Provan et al.,
1995), increases interactions (Chen, 2011) and fosters learning among employees (Inaba
et al., 2000).
3.4.4 Proposition 4 (P4) Internal-External Learning is an Antecedent of CNL
Wiske, Franz and Breit (2005) also assert that “collaboration with others enriches one’s
capacity to develop and apply ideas” (p.99). Employees reflect on what they learned,
consider ideas from multiple perspectives to provide an interpretive framework (Wiske
et al., 2005) and share organizationally relevant experiences and information with others
in collaboration (Lin, 2007a). A network of interdependent relationships link the
success of an organization with the success of other organizations, leveraging intra-
organizational knowledge sharing (Dyer & Nobeoka, 2000; Gutpa & Govindarajan,
2000). Intense global competition and increasing technological dynamism promote the
importance of external learning as an element of organizational success (Chesbrough,
2003a). External sources of knowledge are critical to the innovation process and most
innovative ideas are learned from competitors, developers, partners or suppliers. For
instance, Bierly and Daly (2007) found that smaller firms learn more from suppliers and
the scientific community than larger firms, while larger firms learn more from
partnerships and consultants. Huang, Kristal and Schroeder (2008) posit that internal-
external learning can translate knowledge into manufacturing processes and leads to
effective process implementation. Therefore, CNL arises from the need for employees
to share, collaborate and learn both internally and externally in order to achieve their
goals. In addition, it is assumed that CNL provides easier access to external knowledge
and allows for more rapid dissemination of organizational knowledge. Innovation, be it
undertaken internally or externally, is a complex process that requires knowledge and
information flow between organizations and other employees (Lichtenthaler, 2005;

79 | P a g e
Meagher & Roger, 2004) and innovation can only happen through interaction with
external factors (Chesbrough, 2003b).
3.4.5 Proposition 5 (P5) Employees’ Perceived Effectiveness is an Antecedent of
CNL
Effectiveness is operationalized as the usability and usefulness of the information in the
repository or through interactivity with other members. A study by Murgolo-Poore, Pitt,
Berthon and Prendegast (2003) found a significant relationship between perceived
effectiveness and the amount of information disseminated through the organization’s
intranet. Gray and Meister (2004) also found that employees who perform more
intellectual work and who require frequent interactions with others, perceive themselves
to be learning more from knowledge sharing networks than those who perform less
intellectual work and required less frequent interactions. Frequent communications
between workgroups create more opportunities for leveraging competencies, increasing
perceived effectiveness and increasing motivation to collaborate and learn (Monteiro et
al., 2008; Noorderhaven & Harzing, 2009). Employees who are required to use the
network for documenting, accessing vital information and using that information for
their work are more likely to have a perceived notion about the effectiveness of CNL as
compared to those who are not provided with collaborative technology.
3.4.6 Proposition 6 (P6) Employees’ Perceived Usefulness is an Antecedent of CNL
Perceived usefulness is defined as “the prospective user’s subjective probability that
using a specific application will increase his or her job performance within an
organizational context” (Davis et al., 1989, p. 985). If employees perceive that the
results gained from using CNL are useful for their work, then it is quite likely that
employees will continue in using CNL. In other words, employees’ ability to adopt
collaborative technology is dependent on its perceived usefulness (Davis, 1989; Iyer &
Ravindran, 2009). However, employees draw on their own experience and prejudice
when judging the usefulness of a system (Dasgupta et al., 2002; Iyer et al., 2009).
Clearly, if CNL does not provide useful information exchanges, it will not motivate
employees to collaborate and contribute to learning. Perkowitz and Etzioni (1999) argue
that information is useful only if the user considers the information on the network to be
accurate, informative and pertinent. Ritchie et al. (2011) found that those employees
who regarded the organization’s Angel software as highly useful were more likely to

80 | P a g e
use it. Employees who have positive experiences in collaborative projects and are able
to work through the complexity of their jobs are more likely to share and attain
information and knowledge from their peers and workgroups.
3.4.7 Proposition 7 (P7) For MNCs and SMEs, the Influence of CNL is Different.
Proposition 7a (P7a) The Influence of Online Learning is Different Between
MNCs and SMEs.
Proposition 7b (P7b) The Influence of a Shared Database is Different
Between MNCs and SMEs.
Proposition 7c (P7c) The Influence of Online Meetings is Different Between
MNCs and SMEs.
Proposition 7d (P7d) The Influence of Email for Work is Different Between
MNCs and SMEs.
Most studies agree that CNL is most predominant in MNCs and engagement in SMEs is
relatively small. The majority of the studies (e.g.Lee, 2004; Roffe, 2004; UNCTAD,
2004) have reported that technology acceptance among SMEs is relatively slow and the
adoption is limited to simple applications (Mohamad & Ismail, 2009). Harris (2008) in
his study of 24 SMEs found that the SMEs had more innovative business models than
MNCs; however, ironically, the SMEs perceived formal qualifications as increasing the
propensity for employees to leave the organization. In addition to cost of training as a
barrier, none of the participants surveyed had actually undertaken any form of e-
learning except those who worked in areas relating to technology (Harris, 2008).
Likewise, Nikas, Poulymenakou and Kriaris (2006) found that management
commitment in employees training and skill development is the key factor affecting the
adoption of information technology. Conversely, Allan and Lawless (2005) note that
SMEs are increasingly required to use online collaboration within the organization as a
method of working and information exchange. More and more SMEs are turning to
virtual teams collaborating online due to business requirements or demands from their
MNCs customers.
As organizations grow in capacity and the complexity of their business, the propensity
to engage in knowledge-based collaboration and the intention to adopt collaborative
technology increases (Goerzen, 2005; Ireland et al., 2002; Nikas et al., 2006). However,
employees must be prepared to collaborate and this readiness includes compliance with
a common interoperable infrastructure, and mutual agreement on the rules of

81 | P a g e
governance or engagement (Camarinha-Matos et al., 2006b), which most SMEs would
find constraining. Similarly, economic pressures on SMEs may put a greater emphasis
on treating employees as labourers and not as learners (Choy et al., 2008), reflecting a
lack of strategic focus (Riege, 2005) to develop, capture and disseminate or apply
knowledge (Beijerse, 2000). SMEs tend to be less effective in recognizing the value of
their explicit knowledge and are short of resources, infrastructure and technology (Levy
et al., 2003). Therefore, it would be interesting to investigate to what extent SMEs are
actively engaging in CNL as compared to MNCs. The literature and empirical studies
seem to be divergent in their findings.
3.5 Rationale for the Model Structure
As mentioned in section 1.4, the research objectives are operationalized as the basis on
which the scales and measurement are developed to collect data in order to prove the
constructs. The development of these scales and measurement are further explained in
Chapter 4 of the thesis. Figure 3-7 illustrates the conceptual framework and shows the
relationships between the constructs and CNL. The relationships between the research
questions, objectives and propositions are inextricably linked in the development of the
study as shown in Table 3-7.
Table 3-7 Research questions, objectives and propositions
Research Questions
(RQ)
Research Objectives
(RO)
Propositions
Research Question RQ1 Research Objective RO1 Proposition P1
Research Objective RO4 Proposition P2
Proposition P3
Proposition P4
Proposition P5
Proposition P6
Research Question RQ2 Research Objective RO3 Proposition P1
Proposition P2
Proposition P3
Proposition P4
Proposition P5
Proposition P6
Research Question RQ3 Research Objective RO1 Proposition P5
Proposition P6
Research Question RQ4 Research Objective RO2 Proposition P7
Research Objective RO4 Proposition P7a
Proposition P7b
Proposition P7c
Proposition P7d

82 | P a g e
3.6 Summary
This chapter discussed the conceptual framework of CNL in relation to the set of
propositions, and then illustrated the relationships with the research questions and
research objectives. The development of the propositions was explained and supported
from the literature and past research. The arguments presented in this chapter
established the basis for the empirical study and research design which are covered in
the next chapter.

83 | P a g e
CHAPTER 4: RESEARCH METHODOLOGY
4.1 Introduction
Research is a systematic and methodological process of enquiry and investigation
(Collis & Hussey, 2009), which often refers to paradigmatic assumptions (O'Leary,
2004; Walter, 2006) that link with theoretical principles to underpin a research (Grant &
Giddings, 2002), while method refers to the practical means or tools for collecting and
analyzing data (Bryman, 2008; Grant et al., 2002). A research design is governed by a
set of methods or rules, principles, theories and values (Somekh & Lewin, 2005), that
guide the researcher on how research is conducted (Bryman, 2008; Grant et al., 2002;
Mingers, 1997; Sarantakos, 2000).
This chapter discusses the philosophical position, paradigm and research method used
in the study. Given that the ‘quantitative-qualitative’ debate has been discussed in
length in the literature, this thesis has no intention of exacerbating or adding to the
debate. Both quantitative and qualitative researches represent different research
strategies. This study involves constructing a survey questionnaire that includes
reviewing and analysing previous and current literature. A pilot study was tested by
colleagues and academic staff of the university and a series of questions addressing the
dimensions and key variables of the study were finalised. This chapter explains how the
conceptual framework based on constructs (see Figure 3-7) was operationalized to
provide clarity and rigor to the theoretical paradigm.
4.2 Philosophical Position
Packer and Goicoechea (2000) enunciate that learning and collaboration are not only a
matter of epistemology but also a matter of ontology. Knowledge is not all that is
constructed, but a matter of personal learning, social transformation and interaction.
This study takes a different paradigmatic approach to research with different
assumptions about the nature of knowledge (ontology) and the means of generating
knowledge (epistemology). “Knowledge is the meanings people make of it; knowledge
is gained through people talking about their meanings” (Creswell, 1998, p. 19). Due to

84 | P a g e
cultural experiences and diverse worldviews, Onwuegbuzie et al. (2009) find that
employees are partially biased in their objective perceptions of reality. This study
adopts an idealist ontological assumption that accepts multiple realities; constantly
shifting due to the nature of interactions and development in collaborative and
communication technology. Social realities are made up of shared interpretations
produced and reproduced by employees as they continue to practice CNL in their daily
routines.
The social and behavioural sciences have traditionally fallen into two schools with
scholars taking different views; for example, Guba and Lincoln (1988) use the terms
“scientific” and “naturalistic” and Tashakkori and Teddlie (1998) adopt “positivist” and
“constructivist”. This study adopts the constructivist epistemological assumption and
posits that knowledge is an outcome of manufacturing employees interacting with their
work environment and dependent on how or if employees perceive opportunities to
profit from CNL learning environments and whether the organizations are considered as
learning environments (Bauer et al., 2004).
Brown et al. (1989) posit the situation as a co-construction of knowledge through
interactivity. The fundamental epistemological approach surrounding this study is not
about emulating the research of physical or natural sciences. Post-positivistic
reconstruction of scientific processes is founded on a coherence theory of reality that
emphasizes the temporarily bounded character of knowledge (Stockman, 1983) that
“incorporates a multiplicity of theoretical perspectives” on a particular phenomenon
(Fischer, 1998, p. 136). Objectivity remains as an elusive ideal and though replicated
findings are probably true, they can be subjected to falsification. This study agrees with
Blakie’s (2010) postulation that it is quite impossible for fallible humans to observe an
external world unencumbered by concepts, theories, past knowledge and experiences,
and so all social enquiry reflects the standpoint of the researcher and observation will be
theory-ladened.
4.3 Research Paradigm
This study subscribes to a pragmatic paradigm that provides the underlying
philosophical framework for mixed methods research (Somekh et al., 2005;

85 | P a g e
Tashakkhori & Teddlie, 2003) as well as different forms of data collection and analysis
(Creswell, 2003). A pragmatic paradigm is in-line with socio-technical systems (STS)
theory that shares a distinctive ontological flexibility between social and technical
aspects leading to the emergence of CNL. It also assumes that “human activity is highly
nuanced and contextualized” and there is a fundamental gap between “what is required
socially and what we can do technically” (Ackerman, 2000, p. 17). Rather than a
commitment to any single system of philosophy (Mackenzie & Knipe, 2006) or a single
scientific method (Mertens, 2005), the pragmatist centres on the research problem and
applies mixed methods approaches to understanding the phenomena (Creswell, 2003;
Johnson et al., 2004; Tashakkori & Teddlie, 1998) and to draw multiple realities of
CNL (Armitage, 2007; Creswell & Plano-Clark, 2007; Zhu, 2011). When reporting, the
pragmatist combines languages from both positivism and constructivism in order to
stress the pragmatic paradigm (Creswell & Plano-Clark, 2007).
4.4 Research Approach
This study combines a mixed methods and auto ethnographic approach. Using mixed
methods, the research was approached in a sequential manner using both quantitative
and qualitative techniques that best address the research questions (Creswell, 2003).
Sources of primary data from questionnaires and semi-structured interviews include an
‘ethnographic’ dimension “where the author is both informant and investigator”
(Cunningham & Jones, 2005, p. 2) and the approach presents a balanced insight into the
phenomenon from the perspective of the user as well as the researcher (Hackley, 2003).
4.4.1 Mixed Methods
In recent years, research that involves the integration of quantitative and qualitative
research is becoming increasingly common (Bryman, 2006) with operational research
(Zhu, 2011) for the “purpose of breadth and depth of understanding and corroboration”
(Johnson et al., 2007, p. 123). The mixed methods approach is appropriate for this study
which has both exploratory and confirmatory questions (Bryman, 2006; Teddlie &
Tashakkhori, 2009) and employs both inductive and deductive logic (Creswell et al.,
2003; Patton, 2002). Similar areas of study in collaborative learning increasingly apply
mixed method strategies (e.g. Barron, 2003; Benbunan-Fich et al., 2003a; de Laat et al.,
2006a; Hakkinen et al., 2003; Hiltz et al., 2000; Hmelo-Silver, 2003; Macgregor &
86 | P a g e
Thomas, 2005; Martínez et al., 2006; Schrire, 2006b; Strijbos & Fischer, 2007a; Strijbos
et al., 2007b; Weinberger et al., 2006). CNL reflects a complex reality where multiple
variables interact and influence each other in a rich empirical and ecological setting (de
Laat, 2006). The mixed methods approach is likely to produce a complete study of
networked learning and CNL (Benbunan-Fich et al., 2003a; de Laat, 2006; Hakkinen et
al., 2003). It has the ability to reveal high quality and complex inferences (Rauscher &
Greenfield, 2009), it is valuable in capturing individuals’ experiences and beliefs
(Kristensen et al., 2008) and it opens new ways of contextualizing and building up
understanding of CNL activities that participants are engaged in (de Laat et al., 2006).
According to Daradoumis, Martinez-Mones and Xhafa (2004), evaluating CNL is a very
complex task which requires extensive consideration on a variety of aspects, as well as
the integration of several analysis techniques, data and tools into a mixed evaluation
method. For instance, De Laat (2006) used content analysis, critical event recall and
social network analysis (SNA) to examine the interaction patterns within a networked
learning community and the ways members shared and co-constructed knowledge.
“There is a philosophical grounded a priori commitment to using mixed methods to
reach the same utility and accuracy goals held by pragmatists, but through
complementary rather than compatibility” (Rocco et al., 2003, p. 22). In the same
manner, this study uses mixed methods to complement the findings in achieving
objective interpretations of CNL.
4.4.2 Ethnographic
Auto ethnography is increasingly used as a research method of inquiry, pushing the
qualitative boundaries by focusing on a phenomenon in the life of the researcher as the
central aspect of study (Keefer, 2010, p. 207). The goal is to use analytic perspectives in
constructing multi-layered accounts of the social world (Atkinson & Delamont, 2008).
The researcher was completely immersed in several CNL manufacturing environments
for nineteen years, engaged in developing, learning, sharing and transferring
organizational knowledge. The researcher interviewed participants on CNL issues by
making sense of both the organizational cultural and technological contexts. From 1991
until 2010, the researcher served in various positions in MNCs and SMEs:

87 | P a g e
i. Assistant Manager, Human Resources, Quality Assurance, and Engineer in
Echolac Malaysia (subsidiary of Mitsubishi, Japan-based MNC). Developed a
CNL system for a quality management system for 185 employees. Master in
lean manufacturing.
ii. Material Analyst, Outsource Manufacturing Program in Intel Products Malaysia
(United States-based MNC). Power user for SAP/R3 system run by Intel
worldwide for material management and supply chain management. Super user
on teleconferencing, emails, e-learning and shared database; leader/member of
virtual teams and networks of practice. Started-up and managed three
manufacturing facilities and a virtual factory (VF) within 2 years.
iii. Factory Manager in Conplamas, Malaysia (local SME). Developed a CNL
system for the documenting and sharing of product and process information,
including an MRP system using Microsoft Access for 150 employees.
iv. Operations Manager in Eurospan, Malaysia (local SME). Initial stage of
development for learning management system (LMS).
v. Plant Manager, Production Manager & Operational Excellence, and
Manufacturing Manager in Eaton Electrical Switchgear (United States based
MNC). Mapics and Oracle System Project Leader for Enterprise Common
Platform, Lean Coordinator and Six Sigma Green-belt. Superuser on
teleconferencing, emails, and shared database. Power user of Oracle, leader/
member of networks of practice and user of Eaton’s Learning Management
System (LMS).
vi. Senior Operations Manager, SAP/R3 Project Leader in Honeywell Aerospace
(United States-based MNC). Power user and master trainer of SAP and Lean Six
Sigma Green-belt. Superuser on teleconferencing, emails, e-learning and shared
database. Leader/member of virtual teams and networks of practice. Started-up
and managed a manufacturing facility for avionic aerospace.
The researcher was engaged with a genuine situational identity as a member of the
organization and positioned as an active researcher (Adler & Adler, 1994) on
collaborative social interaction (Angrosino & Mays de Perez, 2003; Nardi et al., 2002).
The researcher reflected upon his experience in using CNL and seeks to reduce
influence on the research by “allowing a variety of voices to be expressed” (Blaikie,
2000, p. 54).
Currently, the researcher serves as a Lecturer in AUT University (from 2011 until the
present). The researcher has been directly engaged in CNL planning, designing and
implementation, as well as being a power user himself. The researcher is also teaching

88 | P a g e
Project Management, Operations Management and Advance Operational Performance
at undergraduate and postgraduate levels. As an ethnographer, the researcher leveraged
his knowledge and experience to make sense of the interviews by asking for more
clarification and evidence of CNL engagements. Based on this background, the
researcher was able to test the competency or credibility of his sources with a degree of
confidence. The researcher was also able to reflect and consider the phenomena as a
participant from his own perspective with reference to his own values and practices
(Hackley, 2003).
4.5 Unit of Analysis
A unit of analysis is the primary entity or element for collecting and analyzing data
(Nardi, 2006). Nardi et al. (2002) regard the unit of analysis for computer-supported
cooperative learning (CSCL) and computer-supported collaborative work (CSCW) as
the collective social network level or activity system (see also Engestrom, 1987). Stahl
(2005) posits learning as a blend of processes and therefore the analysis of learning
should be done with both the individual and group. Dillenbourg et al. (1996) claim that
“the group itself has become the unit of analysis and the focus has shifted to more
emergent, socially constructed, properties of interaction” (p.1). There is no consensus
whether the unit should be individuals, dyads, groups or communities as it is dependent
on the theoretical background and definition of ‘collaboration’ used (Lipponen, 2002b).
In this study, the researcher seeks for major themes that could explain the CNL
phenomenon and its hidden dimensions or antecedents with individual employees’
engagement in CNL as the focus for the unit of analysis. This study seeks to understand
the antecedents of CNL from the perspective of the individuals; the unit of analysis
being the manufacturing employees’ experience in group collaboration and their
perceptions of effectiveness and usefulness of CNL. The unit of analysis also covers the
difference between MNCs and SMEs.
4.6 Research Strategy and Process
The research process for this study is illustrated in Figure 4-8, with cross references
provided for the respective sections of the thesis. The research process serves as a guide
for conducting a well-grounded research and aligning the research questions with

89 | P a g e
research strategies and research paradigms. According to Blaikie (2010), an abductive
research strategy fits well with a combination of idealist ontological assumption and the
epistemology of constructivism. An abductive research strategy can be used to answer
the ‘what’ and ‘why’ questions, and therefore generates some “understanding rather
than explanation, by providing reasons rather than causes” (Blaikie, 2010, p.89). An
abductive research strategy incorporates what the inductive and deductive research
ignore, such as meanings and interpretations, the motives and intentions (Blaikie, 2010),
that would influence the decisions and direct behaviour of employees in manufacturing
organizations to use CNL in their routines.
Figure 4-7 Systematic approach to empirical research design
Ref. section
Research topic &
Problem Statement
Antecedents of Collaborative Networked Learning in Manufacturing
- What determines manufacturing organizations’ desire to learn, share and transfer
knowledge between their employees, partners, suppliers, as well as their customers?
1.1
1.2
1.3
RESEARCH
OBJECTIVES
- Identify antecedents to organizational learning, development and sharing of
organizational knowledge using collaborative technologies.
1.4
Review of the Literature- Review relevant CNL literatures, and discuss mainstream researches, different
theoretical paradigms and frameworks from similar areas of research.
2.2 to 2.8
RESEARCH
QUESTIONS
- Identify the antecedents of CNL; their significance; employees perceptions of
usefulness and effectiveness; and difference between MNCs and SMEs.
2.9
RESEARCH
PROPOSITIONS
- The proposition is to test the relationships between the proposed antecedents and
their associations with CNL in support of the CNL framework.
3.4
Research Philosophy
- Idealist ontological assumption accepts multiple realities, constantly changing due to
the nature of interactions between employees and collaborative technologies.
- Constructivist epistemological assumption posits knowledge is the outcome of
employees interacting with their working environment.
4.2
RESEARCH
PARADIGMS
- Post-positivism involves multi-methodologies.
- Pragmatism focuses on the 'what' and 'how' of the research problem and places the
research problem as central.
4.3
Research Approach- Mixed methods (Quan > qual).
- Ethnographic.
4.4.1
4.4.2
RESEARCH
STRATEGY
- Abductive research strategy searches for meanings, interpretations, motives and
intentions that influence the decisions and direct behaviour of employees to use CNL.
4.6
Sampling Technique- Snowball sampling for Survey Questionnaire.
- Purposive sampling for Semi-structured Interview.
4.7
Data Collection
Cross section of employees of manufacturing industry in Malaysia.
- Survey Questionnaire for Pilot Study and Quantitative method.
- Semi-structured Interviews for Qualitative method.
4.8
5.3, 6.3, 7.3
Data Analysis- Quantitative Data: Descriptive Analysis and Inferences Analysis using IBM SPSS
- Qualitattive Data: Content Analysis using Nvivo
6.1 to 6.12
7.1 to 7.9
RESEARCH
FINDINGS
- Present integrated findings from the Quantitative and Qualitative data in accordance
with the research objectives, research questions and propositions.
8.1 to 8.5

90 | P a g e
According to Creswell (2003), a pragmatic paradigm implies that the overall approach
to research is that of mixing data collection methods and data analysis procedures
within the research framework. The quantitative approach employs the strategy of the
survey questionnaire as the data collection method with pre-determined measures that
result in numeric data. In contrast, the qualitative approach employs the strategy of the
interview as the data collection method that results in open-ended textual data. The
qualitative approach which uses interview transcripts for subjective assessment of
attitudes, opinions and behaviour, aims to discover employees’ underlying motives,
motivations and perceptions in their use of CNL. Although qualitative results are
regenerated and are not subjected to rigorous quantitative analysis, when combined with
quantitative results, they can provide a holistic perspective.
Similar research on collaborative technology cited the used of quantitative and
qualitative data for complementarity purposes. Burdett (2000) conducted a comparison
study of women’s perceptions of satisfaction and participation using an Electronic
Meeting System (EMS). The quantitative results from the questionnaire were compared
using qualitative data collection and analysis strategies. In this study, a qualitative
approach was used to develop and test proposed questions for the quantitative phase of
the study. Questions drawn from the literature and from researcher’s own experience
(19 years as a practitioner) were tested with colleagues and contacts in industry and
subsequently were presented to a panel of 12 senior academics and researchers at AUT.
4.6.1 Quantitative Research Strategy and Data Analysis
The framework for quantitative research was adapted from Menor and Roth’s (2007a,
2007b) two-stage approach which is built on Churchill’s (1979) paradigm. The step-by-
step procedure in the development of the survey questionnaire is illustrated in Figure 4-
9 of the quantitative research model to ensure that the scale is valid and reliable.

91 | P a g e
Figure 4-8 Framework of research for quantitative phase
Adapted from Menor and Roth (2007a, 2007b)
The quantitative research began with generating items based upon past research in the
areas of cooperative learning, collaborative learning and workplace learning. Details of
the development of the measurement and scale are discussed in Section 5.2. Using an
ethnographic approach, the list of items was then expanded based upon the researcher’s
past experience and knowledge of CNL. The items were reworded, added or deleted, in
order to make sense of CNL’s activities, events, interdependent tasks and outcomes. In
the front-end stage, content validity and construct validity were both determined using
exploratory factor analysis (EFA). During the questionnaire development stage, Bryman
(2008) suggests conducting a pilot study before administering the survey questionnaire
in order to ensure the research instrument functions well. Therefore, a pilot study was
conducted and tested using exploratory analysis. Subsequently, some items were
reworded in order to provide clarity and to improve validity and reliability of the
instrument. Nardi (2006) argues that the pilot study will assess whether the instructions
FRONT-END BACK-END
Generate Items Content Validity
1) Literature review 3) coverage of item pool
2) Autoethnographic
Construct Validity
4) proportion of substantive agreement
5) coefficient of substantive validity
6) convergent and discriminant validity
no yes Questionaire Development
7) Define population and sample
8) Design survey instrument
9) Pilot test instrument
Survey Data Collection
Exploratory Analysis
10) Item and scale reliability
11) Scale validity
12) Factor loading and analysis
Item and Scale Refinement no
13) Review theory and construct
yes
ItemsReliable & Valid?
ScalesReliable & Valid?
end

92 | P a g e
are adequate, the wording of the items and format are clear, and the time required for
completion of the survey.
Questionnaires from the pilot study were disseminated through online surveys with the
objective of soliciting self-reported backgrounds and information pertaining to
perceptions and experiences in using CNL systems and tools. The survey used a mix of
multiple-choice questions and a structured questionnaire. For multiple-choice questions,
a 5-point Likert scale was used for indicating a level of disagreement or agreement (1=
strongly disagree; 5= strongly agree). This approach overcame ambiguity in the survey
questionnaire and increased the validity of the research instrument.
4.6.2 Qualitative Research Strategy and Data Analysis
The semi-structured interview produces “rich and illuminating data and can be used to
gather both qualitative and quantitative data” (Cameron & Price, 2009, p. 252). It allows
the researcher to explore how participants respond to complex issues pertaining to
participants’ personal experience of CNL. Semi-structured interviews use questions that
form a general frame of reference (Bryman, 2008). The questions can vary in sequence
and the researcher can probe further by asking significant questions based upon the
replies, in order to provide better perspectives. It was the conjecture of this study that
semi-structured interviews would provide better cross-examination of the motivational
factors, while a web-based survey would compare the relationship of these variables to
employees’ work experiences, in particular with the use of CNL. Therefore, the
phenomena were studied using web-based surveys and semi-structured interviews to
confirm findings through the convergence of different perspectives. Interviews were
conducted bi-lingually (in English, Malay, or both) to ensure participants were able to
comprehend the questions and were able to better articulate their thoughts and ideas
using the language with which they were comfortable.
Denzin and Lincoln (2000) define qualitative research as gathering and interpreting
narrative or textual information regarding an individual’s experience. Creswell (2007)
defines it as an inquiry “to understand the contexts or settings in which participants in a
study address a problem or issue” (p. 40). The following framework for qualitative

93 | P a g e
research was adapted from Onwuegbuzie, Johnson and Collins’ (2009) qualitative
research model as illustrated in Figure 4-10.
Figure 4-9 Framework of research for qualitative phase
Adapted from Onwuegbuzie, Johnson and Collins (2009)
After data collection was completed, the data was coded and screened. The study
followed the process recommended by Anfara, Brown and Mangione (2002) in which
the data were analysed for generic content and organized into manageable segments.
Bogden and Biklen (2003) suggest clustering similar topics and concepts together,
before recoding and refining them. This helped to reduce the data into themes and key
ideas. The underlying similarities and associations were first compared to the
explanatory model, which led to clusters that shared similar characteristics or themes
(Huberman & Miles, 1994). The final data focused on the key ideas and themes relating
to the research questions (Anfara et al., 2002). The descriptive codes were analysed
according to the conceptual framework of this study and developed into a detailed
account of the antecedents of CNL, including all influencing and contributing factors
which built the case.
Data reduction techniques are commonly used with typology construction when using
an abductive research strategy (Blaikie, 2010). Blaikie (2010) further reiterates that in
Data Collection
Data Coding
Data Screening
Data Reduction
Data Transformation
Single
Multiple
Data Consolidation Data Correlation Data Comparison
Data Integration
Data Type

94 | P a g e
the case of an abductive research strategy (see section 4.4), data collection, data
reduction and data analysis tend to blend into one another in a cyclical process. Data
correlation is used to correlate qualitative data with quantitative data and/or
quantitative data with qualitative data (Johnson et al., 2004; Onwuegbuzie & Teddlie,
2003) and is followed by data consolidation, wherein both quantitative and qualitative
data are combined to create new or consolidated variables (Johnson et al., 2004). Data
comparison is used to compare qualitative and quantitative data/findings (Onwuegbuzie
et al., 2003). Data integration characterizes the final stage, whereby both quantitative
and qualitative data are integrated into either a coherent whole or into two separate sets
of coherent wholes (Johnson et al., 2004). This is demonstrated in Chapter 8.
4.7 Development of Sample for the Study
A sample is a selection of observations from a reference set (Blaikie, 2010; Kinnear &
Gray, 2009; Tashakkori & Teddlie, 2003) to be used to make inferences about the
whole population (Blaikie, 2010) and to address the research questions (Tashakkori et
al., 2003). “A population is an aggregate of all cases that conform to some designated
set of criteria” (Blaikie, 2010, p. 172). The target population of the CNL investigation
was chosen based on the number of users in the manufacturing organizations and the
use of resources involved. Depending on the nature of the networked learning
environment, this population organized themselves through virtual teams, online-
learning, and information sharing using computer networks.
Malaysia was chosen due to the diversified nature of the industries with a high number
of manufacturing organizations. According to the Economic Census 2011 released by
the Department of Statistics Malaysia, in 2010, the Malaysia manufacturing sector
posted positive growths with the gross output expanded by RM181.0 billion or a growth
rate of 5.0% between 2005 and 2010. The employment rate increased by 137,197
persons or 1.6%. The contribution of the manufacturing sector to Gross Domestic
Product (GDP) in 2010 was 24.6%. Overall, the manufacturing sector engaged
1,812,360 persons in 2010, with male employees accounted for 1,179,024 persons
(65.1%) and female 633,336 persons (34.9%).

95 | P a g e
According to Collins (2010), the process of selecting a sampling design for a sequential
mixed methods approach requires two distinct yet interrelated decisions on sampling
schemes and sample sizes. The choice of using snowball sampling in the quantitative
phase and purposive sampling in the qualitative phase expanded the sampling schemes
available to the researcher, thereby enhancing the diversity of the mixed methods
research design. However, the sample survey only investigated a subset of the target
population, which is the Northern part of Malaysia. The participants for this study were
mainly working in high density integrated industrial areas, for example, Bayan Lepas,
Seberang Perai, and Kulim.
4.7.1 Snowball Sampling for Survey Questionnaire
For the survey questionnaire, it was considered that a sample size of 384 participants
from a population of 1.8 million manufacturing employees would statistically provide a
confidence level of 95% with a degree of accuracy of plus or minus 5% (Krejcie &
Morgan, 1970). The size of the sample was required to be large enough so that the
results could be generalized to the employees of manufacturing in Malaysia. Snowball
sampling, also known as network, chain referral or reputational sampling (Blaikie,
2010) was used to locate employees in the manufacturing network to enable a web-
based survey of 384 participants from various manufacturing organizations.
According to Black (2005), snowball sampling recruits subjects with the desired traits
or characteristics, who then recruit others with similar traits to participate. Regardless of
the types of industries, snowball sampling from diverse industries and organizational
sizes provided better representation of the target population in manufacturing, and
therefore eliminated any confirmatory and sampling bias. In this instance, participants
were also asked to recruit individuals from their organizations or anyone that worked in
manufacturing organizations to participate in the research. Participants were given an
option of using either a web-based survey questionnaire or a hardcopy survey form. The
web-based surveys were self-administered by participants at their preferred time and
location. The hardcopies of the survey forms were distributed and collected by former
colleagues, suppliers and friends of the researcher.

96 | P a g e
4.7.2 Purposive Sampling for Semi-Structured Interview
When using purposive sampling, the goal is to generate new theories by obtaining new
perspectives about the phenomenon being studied (Miles & Huberman, 1994).
Purposive sampling allows the researcher to recruit participants on the basis of specific
characteristics of the unit of analysis (Nardi, 2006), thus ensuring “balanced group sizes
when multiple groups are to be selected” (Black, 2005, p. 124). It also permits the
researcher to intentionally choose key participants based on the researcher’s perception
that the participants will yield a depth of information or a unique perspective (Maxwell,
1997; Miles et al., 1994; Patton, 2002). The aim of using a purposeful sample in this
instance was to capture the major variations rather than to identify a common core of
MNCs and SMEs.
In “studies that use semi-structured interviews that are analysed using content analysis,
sample size is justified on the basis of interviewing participants until data saturation is
reached” (Francis et al., 2010, p. 1229). Qualitative research typically focuses in depth
on relatively small samples selected purposefully (Patton, 2002). This study followed
the recommendation of Francis et al. (2010) that there should be an initial sample of 10
interviews, followed by 3 more interviews if there is no emerging theme. The size of the
sample is determined by informational considerations and the sample is terminated
when no new information is found (Lincoln & Guba, 1985). There is no deterministic
number on the sample size for purposive sampling, except when it has reached
saturation (Collins, 2010; Guest et al., 2006). In this study, the researcher implemented
a predetermined criterion of managerial staff, supervisory exempts, technical/quality
exempts, and non-exempts, such as production operators. The researcher established
this criterion in order to observe or assess any difference between the participants’
characteristics or their roles and responsibilities with regards to the conceptual
framework that structures the investigation.
4.8 Data Collection Process
As the “research problem is central” (Creswell, 2003, p. 11), data collection and
analysis methods were chosen to provide insights into the research questions. As such,
this study concurs with Gorard (2004) who posits that the mixed methods approach can
lead to “less waste of potentially useful information” (p.7). The mixed-methods

97 | P a g e
approach involves both qualitative and quantitative procedures of data collection.
Brewer and Hunter (2006) focus upon data collection approaches within the research
process and posit the notion of “multi-methods”, while Bryman (1988, 2004) alludes to
the “mixed strategy” approach whereby he suggests that qualitative as well as
quantitative research strategies can be used within the same study. According to
Mackenzie and Knipe (2006), the paradigm and research question determine the
appropriate data collection and analysis methods. This approach leads to broader data
collection rather than being restricted to any one method, which may potentially
diminish and unnecessarily limit the depth and richness of the study.
According to Biesta (2010) the combination of both “does not raise any particular
problems neither of a philosophical nor of a practical nature” (p.101). They are two
forms of information, which provide two modes of representation on the research of
interest. This study used a sequential mixed analysis [QUAN qual] which means the
quantitative phase was conducted before the qualitative phase, with a stronger emphasis
on quantitative data. Quantitative analysis was used to study the occurrence of events
and the general tendencies in CNL, followed by a qualitative analysis to study
participatory attributes (see Morse & Niehaus, 2009; Morse, 1991).
4.9 Ethical Considerations
Although participation was voluntary, participants were properly informed and their
consents for interviews were obtained. Respect for privacy and confidentiality was
imperative and the identities of the participants were protected at all stages of the
research. The survey and interview protocols were approved by the Auckland
University of Technology Ethics Committee (AUTEC) after some revisions were
incorporated based upon the suggestions and recommendations of the committee (see
Appendix A). Ethical considerations were prescribed into the research questionnaire
(see Appendix B) and participants were presented with details about the purpose of the
study, confidentiality, and contact details in case any participant required clarification
on any issues relating to the study. Collected survey data and other information
pertaining to the research samples have been kept confidential and no propriety
information has been transmitted outside the scope of the study. Every attempt has been
made to minimise any risks involved in the study.

98 | P a g e
4.10 Summary
The study adopts a constructivist epistemological assumption and idealist ontological
assumption that accepts multiple realities. The underlying pragmatic paradigm supports
a mixed methods approach. In this chapter, the research design and framework using
both quantitative and qualitative approaches, incorporating Onwuegbuzie and Teddlie’s
(2003) conceptualization and data analysis process of mixed-methods research was
presented. The research process and the process of developing the measurement and
scales in support of the constructs were described. Snowball sampling for the survey
questionnaire and purposive sampling for the semi-structured interviews was also
discussed and rationalized. Finally, data collection methods for both quantitative and
qualitative measurements were explained. The results of the pilot study were used to
develop the measurement scale, which is discussed in detail in Chapter 5.

99 | P a g e
CHAPTER 5: DEVELOPMENT OF
MEASUREMENT SCALE
5.1 Introduction
As outlined in section 4.6.1, this study aimed to develop a measurement scale for the
antecedents of CNL in manufacturing. This chapter begins with defining the
measurements and explaining the development for the scales used for measuring the
constructs. A pilot study was carried out for the 44-item scales. An online questionnaire
was offered through www.Qualtrics.com that required a self-reported background and
information pertaining to perceptions and experiences in using CNL. The survey used a
mix of multiple-choice questions and a structured questionnaire. The dataset was
transferred from Qualtrics online survey to IBM SPSS Statistics Release 19.0 for data
analysis, and assessed for normality. The aim of this section is to establish a strong
analytical basis for construct validity and reliability of the measurement scale that is
used in the main study.
5.2 Measurement of Constructs
Where parsimony is concerned in measurement the number of items required to test a
construct depends on the domain and dimension of the construct itself (Cortina, 1993).
This study did not require a large number of items as the constructs for the antecedents
of CNL have a narrow domain and few dimensions. If the scales are self-administered
and participants’ response bias is considered, scale brevity is often an advantage
(Churchill & Peter, 1984; Cortina, 1993; Nunnally & Bernstein, 1994). A self-
administered questionnaire is not only convenient to the participants, it also eliminates
interviewer variability when interviewers or researcher ask questions in a different order
or in different ways (Bryman, 2008) and is best designed for measuring variables with
numerous values or response categories (Nardi, 2006).

100 | P a g e
5.2.1 Scale Development
Scale development and validation is a time-consuming endeavour and the literature
review indicated past attempts at measuring the constructs as well as the strengths and
weaknesses of these attempts (Netemeyer et al., 2003). The adoption of existing
measures of organizational support, promotive interaction, positive interdependence,
internal-external learning, and perceived usefulness help to avoid the redundancy of
developing new scales to measure a similar construct. The approach to CNL espouses
both positive interdependence and promotive interaction. Kreijns, Kirschner and
Jochems (2003) define “positive interdependence” as team members being closely
linked to each other in a way that members cannot succeed unless the other members in
the team succeed. “Promotive interaction” requires individual members to support each
other’s effort in order to achieve the team’s goals. Johnson, Johnson and Smith (1998)
introduce scales for measuring cooperative learning: mutual interdependence, face-to-
face promotive interaction, appropriate practice of interpersonal skills, and regular
assessment of team functioning.
Netemeyer et al. (2003) suggest consulting several sources on item generation and how
previous studies have operationalized the constructs. By employing existing items, a
researcher may understand the measurement qualities of the existing questions or items
and compare the findings with past studies (Bryman, 2008). Using the same questions
or items allows the study to explore whether the context of the study appears to make
any difference to the findings (Bryman, 2008). The final measurement items were
consolidated and adapted for use in the survey questionnaire as shown in Table 5-8.

101 | P a g e
Table 5-8 Final development of constructs and measures Constructs Measurements
ORGSUP B1 Access to a computer workstation to perform job
perceived B2 Access to networked computer/email for work
organizational B3 Access to training through computer network
Support B4 Access to online shared databases to facilitate work
B5 Support from supervisor/manager to collaborate with others
POSIDP C1 Job requires to work in teams
positive C2 Job requires to hold tele-conferences with members from other sites
interdependence C3 Job requires to share ideas, work and information with others
C4 Job can only be completed if other members complete theirs
C5 Performance depends on the results of team
PROINT D1 Frequently share ideas, work and information with others
Promotive D2 Frequently interact with peers and members in the team online
interaction D3 Easily obtain help and support from team/peers online
D4 Frequently share information in online meetings or discussions
D5 Members in the team help each other to learn and engage
LEARN E1 Learn from shared information from the network
internal-external E2 Receive training to collaborate effectively
Learning E3 Participate in improvement projects
E4 Learn from suppliers/customers or external parties
E5 Learn from peers and members in the team
PEREFF F1 Work efficiently through use of information from the network
perceived F2 Work interdependently using the computer network
effectiveness F3 Use computers to share information effectively with others
F4 Team achieves goals for projects by using information from the network
F5 Team produces good quality collaborative work
PERUSE G1 The network systems/tools are useful for work
perceived G2 The shared databases are useful for work
usefulness G3 The online meetings/discussions with external parties are useful
G4 The network systems are useful for sharing information
G5 The online learning system or training are useful
COLLRN H1 Access knowledge and information through the computer system/network
collaborative H2 Update work through the computer system/network
Learning H3 Learn by sharing and exchanging information with others
H4 Participate in e-learning or online courses
H5 Participate in workgroups to complete projects or tasks
The final development for the measurements identified 35 items in support of the seven
constructs: organizational support (5), positive interdependence (5), promotive
interactions (5), internal-external learning (5), perceived effectiveness (5), perceived
usefulness (5) and collaborative networked learning (5). Netemeyer et al. (2003)
recommend large items for the initial pool that are “over inclusive of the domain”
(p.101), but depending on the “dimensionality and complexity of the construct
definition” (p.116). They further suggest considering other issues like item redundancy,
level of internal consistency and participants’ cooperation, when deciding on the
number of items for the initial pool. There is no consensus on the number of items

102 | P a g e
required to support each construct. Netemeyer, et al. (2003) suggest four or more; Clark
and Watson (1995) suggest four to five items for narrow constructs and up to 35 items
for broad concepts. Given that the scales were self-administered, and taking into
account the possibility of participants’ fatigue and non-cooperation, this study
considered scale brevity (Churchill et al., 1984; Clark et al., 1995; Cortina, 1993;
Nunnally et al., 1994).
This study chose to limit the number of items, and to use simple, concise and non-
biased wordings and statements. The wording of the items reflected the education level
and the language abilities of the participants, and refrained from jargon, acronyms,
technical terms and obscure phrases (Nardi, 2006). As suggested by Nardi (2006),
demographic questions were placed at the end of the self-administered questionnaire.
Demographic questions were also designed to be mutually exclusive and exhaustive, for
example, the category “others” for department. The final version of the questionnaire
was then used in the pilot study.
5.2.2 Scale Validation
According to Bryman (2008), validity is concerned with the integrity of the conclusions
that are generated from the research. Validity refers to the credibility of the research
results, measuring what it is designed to measure and the degree to which the results can
be applied to the general population of interest. Items on the questionnaire must relate to
the constructs being measured.
Internal validity refers to the credibility of the study and is determined by the degree to
which conclusions drawn from the items correctly related to participants’ experience
and perception of CNL. For quantitative data, the internal validity of a study is judged
by the degree to which its outcomes can be attributed to manipulation of independent
variables and not to the effects of confounding variables (Black, 2005). Therefore, the
study protocol must be designed to minimise the effect of extraneous factors so that any
potential cause-and-effect relationship between variables can be accurately measured.
However, for qualitative data, the researcher is constantly seeking for “any cause-effect
relationship that can offer a plausible explanation of the phenomenon under study”
(Diaz Andrade, 2009, p. 49), which adds credibility to the analysis and findings (Guba

103 | P a g e
& Lincoln, 1994). Comparison was made between different groups of employees: those
who use CNL and those who do not.
External validity refers to whether (and to what degree) the results of a study can be
representative of a larger population or situation to which the results are to apply
(Black, 2005; Diaz Andrade, 2009). The researcher includes temporal and spatial
dimensions of the phenomenon under study in the analysis in order to produce
theoretical generalizations (Walsham, 1995 as cited by Diaz Andrade). External validity
is primarily determined by the selection of participants through the use of snowball
sampling procedures that limit potential bias and limit direct contact with the researcher.
Participants in this study represented a general population of manufacturing employees
from diverse industries, both MNCs and SMEs. Both MNCs and SMEs were separated
to provide a comparison between different settings or contexts but with the same
treatment of variables in order to test the consistency of the findings.
Content validity implies that the measures used are practical, pertinent and related to
the purpose of the research (Bryman & Cramer, 2005; Nevo, 1985). This is a basic
requirement for a good measure, which means that the measurement items in an
instrument should cover the major content of a construct (Churchill, 1979). A content
valid instrument enhances the use of practical situations and induces the cooperation of
participants through comprehensible, clarity, clear instructions and easy-to-use response
formats (Netemeyer et al., 2003). Content validity concerns with the inspection of
instrument of measure (Nunnally et al., 1994). Content validity for this study was
achieved through a comprehensive literature review and interviews with practitioners
and scholars from multi-disciplines as well as members of the AUT University Ethics
Committee (AUTEC) for practical purpose, relevance to the research objectives,
mitigation of response bias, ease of use, easily read instructions, and clarity of the
questionnaire. In the pre-pilot study, these items were reviewed and re-evaluated
through structured interviews with practitioners who were asked to comment on the
appropriateness of the research constructs. Based upon the feedback, redundant and
ambiguous items were either modified or removed.

104 | P a g e
5.2.3 Development of Instrument
The questionnaires were designed to accomplish two basic goals: (1) to translate the
research objectives into specific questions that the participants could respond to, and (2)
to encourage the participants to cooperate and provide answers that best reflected their
feelings, opinions, perceptions of CNL in an accurate and unbiased manner. A survey
questionnaire is useful to test propositions and to generalise findings (Hair et al., 2006).
It is a widely used data collection method for organizational research (Zikmund, 2000)
and for operations management research (Forza, 2002). Structured questionnaires gather
quantitative data which can be used to produce descriptive and inferential statistical data
(Cameron et al., 2009). The web-based survey used multiple-choice questions with a 5-
point Likert scale for indicating the level of disagreement or agreement with declarative
statements (1= strongly disagree; 5= strongly agree). According to Lissitz and Green
(1975) and Cavana et al. (2001) a 5-point scale is recommended because any increment
above the scale does not improve the reliability of ratings. Therefore, a 5-point scale is
more appropriate to generate sufficient responses and was chosen for this study. To
further improve the validity of the questionnaire, all the participants were able to
undertake this study in their local language (see Appendix D).
5.3 Data Collection for Pilot Study
The questionnaire was pre-tested during the development phase, before the online
version was released for use. The pilot study checked the procedure and questionnaire to
determine if the instrument was working as it was intended. A survey questionnaire
generation, administration and reporting system was deployed on Qualtrics that allowed
the researcher to setup web-based surveys with questions having multiple response
options. The pilot study administered the preliminary questionnaire to a small group of
participants in Malaysia and the instrument was extended to other participants in the
main study based on the results. After the pilot study, the questionnaire was revised in
order to ensure the “validity and reliability of the measures, as well as making it more
user-friendly” (Flynn et al., 1990, p. 262). The pilot study provided essential feedback
on how participants had answered a range of questions and concepts within the
participants’ knowledge and experience of using CNL, either in their past or present
places of work. The summary of responses from the web-based survey also provided a
partial quantitative assessment and preliminary understanding of key issues in how the

105 | P a g e
information was being shared and collaborated. The findings of the pilot study also
formed the basis for the semi-structured interviews.
5.4 Data Preparation
Data preparation was necessary to ensure that data have been correctly recorded in
SPSS and the distributions of data to be used in the analysis are normal. Preliminary
analysis generated descriptive statistics and examined for missing data, outliers, and the
normality of data. Any missing data needs to be clearly identifiable to prevent
misrepresentation during data analysis. Outliers cause data non-normality and effect the
validity of the statistical analysis. Normality is a fundamental issue in statistical analysis
that could influence the validity of the results (Coakes, 2006).
5.4.1 Missing Data, Multiple Responses and Data Entry
There was no missing data as the participants answered all items in the questionnaire
using the web-based survey. The Qualtrics system forced the participants to response to
every item in the questionnaire, hence prevented missing data. It also prevented
participants from submitting an incomplete questionnaire by ignoring the error message
(due to incompleteness of the response). There was no missing data or multiple
responses in the hardcopies of the survey.
The dataset was directly extracted and transferred from Qualtrics database to IBM SPSS
without any need for reformatting. However, the numerical coding of data was screened
using SPSS’s Data Editor and Variable View windows to ensure the consistency and
accuracy of the codes for further analysis. All variable property descriptive values were
checked for accuracy and translated into numeric codes (e.g. 0 = male; 1 = female) and
measurement level (nominal, ordinal, or scale) as described in Appendix E. These
variable properties were correctly assigned in variable view in the data editor. In the
case of the web-based survey, the data did not generate any multiple responses sets as
all the responses were well controlled and participants were obliged to provide a single
response for each item. The data was retrievable from Qualtrics database since all
participants in the pilot study used the web-based survey. No hardcopies were necessary
in the pilot study, therefore eliminating the risk of data entry error.

106 | P a g e
5.4.2 Outliers
According to Hair et al. (2006) outliers are “observations with an unique combination of
characteristics identifiable as distinctly different from the other observations” resulting
in non-normality (p.64). Initial analysis using scatterplots identified few outliers across
the items. While this study acknowledges the importance of filtering the outliers, the
researcher decided to accept the outliers “as-is” for normality analysis (see section
5.3.3). It was considered that any attempt to eliminate or forfeit the outliers may affect
the validity of the results due to a small sample size (n =44).
5.4.3 Assessment of the Normality
The dataset was assessed for normality by testing the skewness and kurtosis. West et al.
(1995) suggest an approach to significance tests of normality by interpreting the
absolute values of the skewness and kurtosis indices. Skewness refers to the “measure
of symmetry of a distribution” and kurtosis refers to the “measure of the peakedness or
flatness of distribution when compared with a normal distribution” (Hair et al., 2006, p.
37). The normal distribution is symmetric and has a skewness value of 0. Kurtosis is a
measure of the extent to which observations cluster around a central point. A normal
distribution has a kurtosis value of 0. It is considered to be moderately non-normal if the
skewness index value is greater than 3.0 and the kurtosis index value is greater than
10.0. Kurtosis values greater than 20.0 indicate a more serious normality problem
(Kline, 2005). Forty four items from the pilot study were tested (see Table 5-9) and all
showed normality ranging between 0.0 to 1.4 for skewness (level < 3.0) and 0.0 to 2.7
(level < 10.0) for kurtosis.

107 | P a g e
Table 5-9 Normality test for pilot study (n=44)
skewness kurtosis
B1 Access to a computer workstation to perform job -0.81 -1.41 B2 Access to networked computer to work -1.06 -0.93
B3 Access to training and learning through computer network -1.13 1.40
B4 Access to on-line shared databases to facilitate work -1.05 0.94
B5 Support from supervisor/manager to collaborate -0.08 -0.28
C1 Job requires to work in teams 0.00 -2.10
C2 Job requires to tele-conference with other sites -0.71 -0.30
C3 Job requires to share ideas, work and information -0.81 0.86
C4 Job can only be completed if other members complete theirs -0.34 -0.92
C5 Performance depends on the results of the team -0.46 -0.01
D1 Frequently share ideas, work and information -0.11 -0.43
D2 Frequently interact online with peers and team -0.47 0.06
D3 Easily obtained help and support on-line -0.01 0.08
D4 Frequently share on-line meetings -0.40 -0.14
D5 Team help each other to learn -0.02 -0.62
E1 Learn from shared information from the network -1.21 2.71
E2 Receive training to collaborate effectively -0.57 0.32
E3 Participate in improvement projects -0.68 0.59
E4 Learn from external parties -0.47 0.38
E5 Learn from peers/team 0.07 0.26
F1 Work efficiently through use of information from the network -0.81 4.05
F2 Work interdependently using the computer network 1.35 -0.19
F3 Use computers to share information effectively -0.79 2.16
F4 Team achieves goals using information from the network -0.71 0.62
F5 Team produces good quality collaborative work -0.64 1.57
G1 The network system/tool is useful -0.76 0.47
G2 The shared database is useful -0.73 0.99
G3 The on-line meetings with external parties are useful -1.34 2.65
G4 The network system is useful for sharing information -0.72 1.72
G5 The on-line learning system is useful -0.70 0.75
H1 Online knowledge and information -0.04 -1.39
H2 Work using online system/network -0.83 0.11
H3 Sharing and exchanging information -0.43 -0.02
H4 Participate in e-learning -0.30 -0.81
H5 Participate in workgroup activities -0.30 -0.53
a skewness standard error 0.36
b kurtosis standard error 0.70
5.5 Profile of Participants
For the pilot study, the participants were recruited from various manufacturing
organizations using snowball sampling. The initial group of participants was known to
the researcher and mostly had worked with the researcher in the past. From a total of 61
participants invited, 44 participants responded. In addition, the study also examined the
patterns and participations of CNL by demographic profiling using frequency and
descriptive statistics.
Response Rate: The web-based survey was completed by 44 participants out of 51
participants solicited from Malaysia manufacturing organizations between December

108 | P a g e
2011 and February 2012 (86.3% response rate) with a completion rate of 100%. The
high survey response rate suggested enthusiasm to participate in the pilot study. Seven
participants who declined to participate indicated that they were either non-employees
of any manufacturing organization or had no interest in the subject area of research.
Demographics: Out of the 44 participants 24 (54.5%) were male and 20 (45.5%) were
female (Table 5-10). The majority of the participants were aged between 30-39 years
(68.2%, n= 30), compared to those aged between 20-29 years (18.2%, n= 8) and those
aged between 40-49 years (13.6%, n= 6), which is relevant to the general population of
manufacturing employees in Malaysia. The majority of the participants possessed at
least a diploma or a bachelor degree (75%, n= 33), while others possessed a
postgraduate degree (22.7%, n= 10) and 1 participant (2.3%) possessed only a high
school qualification. This shows that the majority of the participants were exempt
staff, supervisors or managers, who possessed a higher qualification compared to
production operators, line workers, store hands or general workers. The age and gender
of participants also suggested a fairly typical distribution found in the present
manufacturing environment. This indicated that there would be a general interest and
knowledge concerning collaborative technology available at their respective
organizations.
Table 5-10 Demographic profile for pilot study (n=44)
Frequency Percent
Cumulative Percent
Gender: Male
Female Total
24 54.5 54.5 20 45.5 100.0
44 100.0
Age: 20-29 years
30-39 years 40-49 years
Total
8 18.2 18.2 30 68.2 86.4
6 13.6 100.0
44 100.0
Education: Postgraduate/masters/doctorate
Bachelor degree/diploma High School/STPM/SPM
Total
10 22.7 22.7 33 75.0 97.7
1 2.3 100.0
44 100.0
Background: The overall demographic as shown in Table 5-11 provides a wide range
of participants from diverse backgrounds across organizations and departments. Out of
44 participants, the majority were from MNCs (90.9%, n=40), while the rest were from
SMEs (9.1%, n=4). The majority of the participants were from Technical or

109 | P a g e
Engineering (22.7%, n =10); Management and Leadership (20.5%, n =9); and a
diverse mix from Purchasing, Procurement, Sourcing or Materials (13.6%, n =6) and
Planning, Sales and Marketing (11.4%, n =5). The demographic of participants
suggests that CNL has appeal to a broad mix of employees in manufacturing
organizations.
Table 5-11 Pilot study - Participants by organizations and departments (n=44)
Frequency Percent
Cumulative
Percent
Organizations Multinationals (MNCs) 40 90.9 90.9 Small medium enterprises (SMEs) 4 9.1 100.0
Total 44 100.0
Departments Management/Leadership Technical/Engineering Human Resources/Administration/Security Purchasing/Procurement/Sourcing/Materials Planning/Sales/Marketing Production/Operations/Manufacturing/Assembly Quality/Safety Logistics/Warehouse/Store Others
Total
9 20.5 20.5
10 22.7 43.2
1 2.3 45.5
6 13.6 59.1
5 11.4 70.5
2 4.5 75.0
1 2.3 77.3
1 2.3 79.5
9 20.5 100.0
44 100.0
5.6 Assessment of Dimensionality
Factor analysis is a general linear model (GLM) technique used for establishing
instrument validity (Black, 2005; Flynn et al., 1990) and to discover clusters of items
with similar concepts, based on correlations or covariance between items (Field, 2005).
Although this study attempted to produce factor analysis, it was considered that it would
be inappropriate to interpret the result due to the small sample size (n =44). Exploratory
factor analysis (EFA) was carried out for a larger sample size (n=246) for the main
study as discussed in Section 6.7.
5.7 Assessment of Internal Consistency
Reliability measures the extent to which the measurement has a consistent effect from
sample to sample (Black, 2005; Bryman, 2008; Bryman et al., 2005; Flynn et al., 1990;
Nardi, 2006; Netemeyer et al., 2003). Reliability is the ability of the questionnaire to
produce the same results under the same conditions. Careful consideration is given to

110 | P a g e
the development of the scale. Psychometric theory demonstrates that reliability of the
test increases with multiple items (Kinnear et al., 2009) that represent multiple aspects
of the construct. When several questions are grouped and averaged, the potential error
that might occur in a single question can be reduced (Hair et al., 2006). Although,
constructs with multiple dimensions require more items (Netemeyer et al., 2003), scale
brevity is often an advantage (Churchill, 1979; Nunnally et al., 1994).
Another test of internal consistency is Cronbach’s coefficient alpha, which is the most
widely used method in operations management research (Davis, 1995) and for
questionnaires using Likert scales (Oppenheim, 1992). Cronbach’s coefficient alpha is
based on the degree of inter-relatedness among a set of items that comprise a measure,
with higher correlations among the items associated with high alpha coefficients
(Bryman, 2008; Netemeyer et al., 2003; Nunnally, 1978; Pedhazur & Schmelkin, 1991).
Cronbach’s alphas were calculated for all constructs and dimensions, and the results are
presented in Table 5-12.
Table 5-12 Pilot study - Cronbach’s alpha for first test (n=44)
Constructs Cronbach's Alpha N of Items
Organizational Support 0.77 5 Positive Interdependence 0.72 5 Promotive Interactions 0.78 5 Internal-External Learning 0.74 5 Perceived Effectiveness 0.82 5 Perceived Usefulness 0.88 5 Collaborative Networked Learning 0.87 5
The Cronbach’s coefficient alpha as shown in Table 5-11 were ≥0.72 which is generally
considered to be reliable in any empirical research (Hair et al., 2006; Nunnally, 1978;
Nunnally et al., 1994). The closer the α is to 1.00, the greater the internal consistency of
items in the instrument being assessed (George & Mallery, 2009; Sekaran, 2003). The
newly developed scale for CNL registered 0.87 (>0.6), and the adapted constructs had
reliabilities ranging from 0.72 to 0.88 (>0.7) for the pilot study. This suggest that the
measure’s constituent scales were internally reliable (Bryman, 2008, p. 155). However,
Cortina (1993) cautions against use of such a general guideline because the value of α
depends on the numbers of items on the scale. Therefore, the reliability test was
repeated for the main study, which consisted of a larger sample size but with fewer
items after purification and factor analysis.

111 | P a g e
5.8 Assessment of External Consistency
External consistency assesses the items degree of consistency of a measure over time
(Bryman et al., 2005; Netemeyer et al., 2003). This is done by administering the pilot
test on two occasions to the same group of participants. However, this procedure has to
be carefully considered because the intervening events between test-retest may account
for a high significance between two results. The retest was administered to 44
participants approximately two weeks after the first test which was deemed to be a
sufficient time elapse between tests so as to avoid artificial consistency. Participants
who had participated in the pilot study were identifiable in Qualtrics. Email invitations
and few rounds of reminders were also sent to the same group of participants to
complete the same survey for the second time. However, only 32 (72%) participants
successful completed the re-test after the end of the second week. The results of test-
retest show consistent reliability between the first (see Table 5-12) and the re-test (see
Table 5-13).
Table 5-13 Pilot study - Cronbach’s alpha for re-test (n =32) Constructs Cronbach's Alpha N of Items
Organizational Support 0.80 5
Positive Interdependence 0.68 5 Promotive Interactions 0.69 5 Internal-External Learning 0.71 5 Perceived Effectiveness 0.80 5 Perceived Usefulness 0.85 5 Collaborative Networked Learning 0.91 5
For the re-test of the pilot study, the reliabilities for the scale items range from 0.7 to 0.9
(>0.7) and are considered to be externally consistent. The result of reliability test shows
consistent scores between the test and re-tests.
5.9 Summary
This chapter discussed the approach used to develop the measurements and scales for
the study, and described the rationale for the procedures used to test the validity and
reliability. The result of the internal consistency test demonstrated that the instrument
was consistent and good for use in the data collection for the main study. Exploratory
factor analysis (EFA) was not carried out at this stage due to the small sample size of
the pilot study. Nonetheless, the result from Cronbach’s coefficient alpha showed that
the measures were internally reliable and externally consistent, and could therefore be

112 | P a g e
used in the main study. Chapter 6 presents the results from the main study; tabulated
and analysed to answer the research questions and propositions.

113 | P a g e
CHAPTER 6: QUANTITATIVE DATA ANALYSIS
AND RESULTS
6.1 Introduction
Descriptive procedures of SPSS were used to calculate basic univariate statistics to
summarize data and get a description of the responses to questions, including
demographic data such as age, gender, education and department. This provided
frequency tables, cross-tabulations found mean differences between groups and
correlations between factors. The measures were analysed and compared using
frequency tables with each response to variables represented as a mean and standard
deviation of the total responses. Factor analysis examined items for convergence into
valid and reliable measure of constructs. Bivariate analysis was used to examine the
relationships between two variables and to prove that they did not happen by chance.
Multivariate analysis was used to demonstrate the degree of correlation between
multiple factors which influence manufacturing employees’ decisions and perceptions
in using CNL.
6.2 Restatement of the Research Questions
To achieve the purpose of the study, the following research questions were addressed in
the quantitative data analysis:
RQ1. What are the significant antecedents for a CNL model in manufacturing?
RQ2. How significant are the relationships between CNL and organizational support,
positive interdependence, promotive interaction, and internal-external learning?
RQ3. What are employees’ perceptions of CNL’s usefulness and effectiveness in
manufacturing?
RQ4. What are the differences between CNL for multinationals companies (MNCs)
and CNL for small medium enterprises (SMEs)?
6.3 Data Collection for Survey Questionnaire
The questionnaire was made available through a Qualtrics web-based survey and
through mailed out hardcopies. The questionnaire solicited self-reported background,
and information pertaining to perceptions and experiences in using CNL. Compared to
conventional mail surveys, the cost of Qualtrics web-based surveys for sending

114 | P a g e
questionnaires and coding data is relatively low, and has a short turnaround time.
Potential errors due to data transfer and codification are eliminated (Nardi, 2006). The
Qualtrics generated electronic dataset from responses were pre-coded in SPSS format.
See Appendix D for the questionnaire. Both types of questionnaire (online and
hardcopy) consisted of 44 questions categorized into 3 sections: type of manufacturing
organizations (item A1), experience with CNL (items B1 to H5), and number of hours
using CNL systems and tools (items I1 to I4) and demographic data (items J1 to J4).
Participants were requested to answer all questions.
Biased samples and biased returns are a common problem with a web-based survey.
Participants using web-based surveys are most likely to be employees who have access
to computer networks, have some skills and feel comfortable with a Qualtrics web-
based survey tool. Nardi (2006) notes that variation in computer use and accessibility
based on roles, positions, types of organization, and education may affect the
generalizability of findings from online surveys. To mitigate this issue, hardcopies were
also distributed to those who did not have access to a computer network or who
indicated a preference for hardcopies of the survey questionnaire.
Mouton and Marais (1993), and Bryman (2008) describe various factors that could
affect the reliability of a test. A self-administered web-based survey and anonymous
administration lessen socially desirable responding (SDR) bias involving an individual’s
self-description but not self-deceptive bias (Nederhof, 1985; Netemeyer et al., 2003).
SDR can be reflected in responses with tendencies to provide a favourable position for
the participants in terms of norm and organizational practices. To mitigate the risk of
SDR, the following questions were designed to complement others:
i. Item C1 “My job requires me to work in teams” with item C5 “My performance
depends on the results of my team”.
ii. Item G2 “The shared database is useful” with item I2 “Numbers of hours using a
shared database or network information per week”.
iii. Item G3 “The online meetings with external parties are useful” with item E4 “I
learned from suppliers, customers or external parties”.
iv. Item H4 “I participated in e-learning or online courses” with item I1 “Numbers
of hours using e-learning or online learning per year”.
In order to reduce duplicate submissions from the same respondent, the researcher
conducted verification on the IP addresses which prevented any repeated or duplicated

115 | P a g e
responses. The Qualtrics web-based survey automatically prompted the participants,
should any of the questions not be answered. Hardcopies of the survey were checked for
accuracy before they were entered into the Qualtrics online database.
6.4 Data Preparation
Data preparation is necessary to ensure that data has been correctly recorded in SPSS
and the distributions of data to be used in the analysis are normal (Coakes, 2006).
Preliminary analysis generated descriptive statistics and examined the normality of data,
missing data and multicollinearity. Normality is the most fundamental assumption in
statistical analysis which could influence the validity of the results. Multicollinearity is
to be avoided if the unique contribution variables to a factor are to be ascertained.
Outliers can result in non-normality data and affect the validity of the statistical analysis
(Hair et al., 2006).
6.4.1 Missing Data, Multiple Responses and Data Entry
There was no requirement for treatment of missing data or value for both the web-based
survey and the hardcopy survey as participants answered all items in the questionnaire.
Frequency tables containing counts for each value of the scales was also used to check
and validate the data to ensure there was no missing data, data duplication or multiple
response data. The Qualtrics prevented participants from submitting an incomplete
questionnaire. However, to ensure integrity, special attention was given to hardcopies of
the survey with every response being verified to ensure no missing value or multiple
values before the data was transferred into the database. This was to ensure that all
participants’ responses were correctly entered into the system. The web-based survey
did not generate any multiple responses in any single item as all the responses were
controlled by Qualtrics. Similarly, no multiple responses were detected in the
hardcopies. This helped in the process of accumulation and consolidation of all data and
enabled ease of transfer of the formatted database directly into IBM SPSS for data
analysis, without any need for conversion or reformatting. The data was directly
extracted and transferred from Qualtrics database to IBM SPSS in the data editor. Using
SPSS variable view, the descriptive value labels for numeric codes and measurement
level (nominal, ordinal, or scale) were checked.
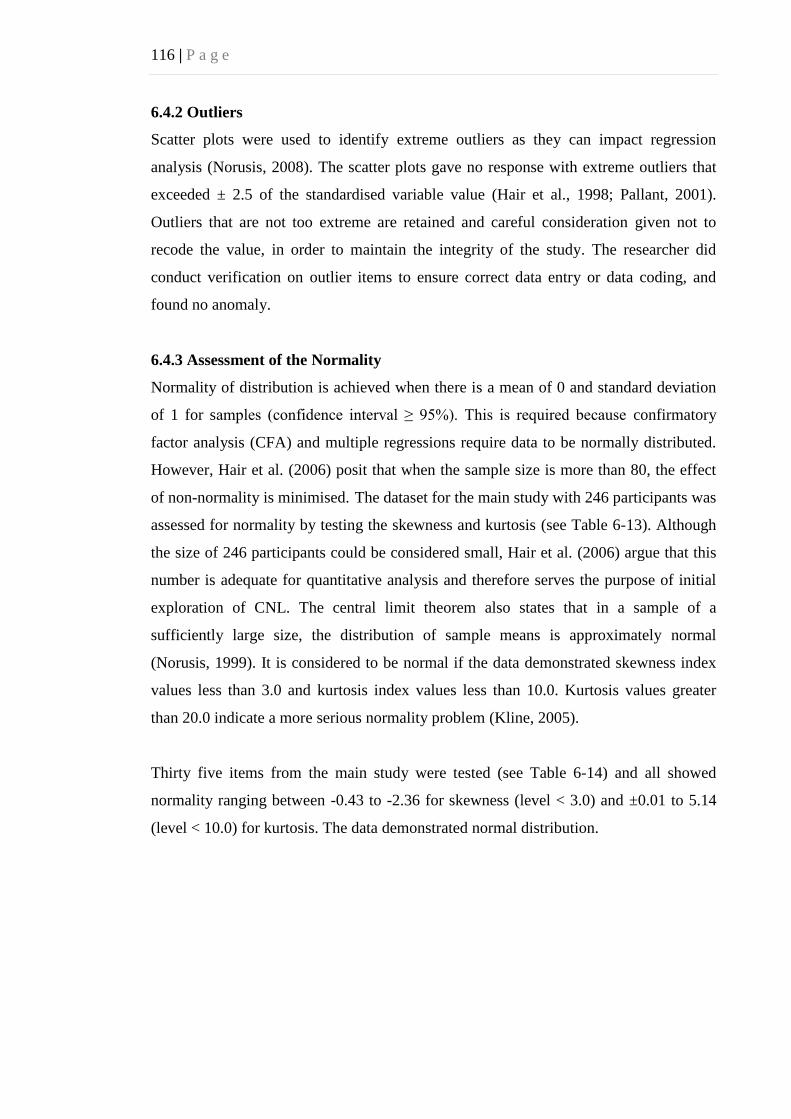
116 | P a g e
6.4.2 Outliers
Scatter plots were used to identify extreme outliers as they can impact regression
analysis (Norusis, 2008). The scatter plots gave no response with extreme outliers that
exceeded ± 2.5 of the standardised variable value (Hair et al., 1998; Pallant, 2001).
Outliers that are not too extreme are retained and careful consideration given not to
recode the value, in order to maintain the integrity of the study. The researcher did
conduct verification on outlier items to ensure correct data entry or data coding, and
found no anomaly.
6.4.3 Assessment of the Normality
Normality of distribution is achieved when there is a mean of 0 and standard deviation
of 1 for samples (confidence interval ≥ 95%). This is required because confirmatory
factor analysis (CFA) and multiple regressions require data to be normally distributed.
However, Hair et al. (2006) posit that when the sample size is more than 80, the effect
of non-normality is minimised. The dataset for the main study with 246 participants was
assessed for normality by testing the skewness and kurtosis (see Table 6-13). Although
the size of 246 participants could be considered small, Hair et al. (2006) argue that this
number is adequate for quantitative analysis and therefore serves the purpose of initial
exploration of CNL. The central limit theorem also states that in a sample of a
sufficiently large size, the distribution of sample means is approximately normal
(Norusis, 1999). It is considered to be normal if the data demonstrated skewness index
values less than 3.0 and kurtosis index values less than 10.0. Kurtosis values greater
than 20.0 indicate a more serious normality problem (Kline, 2005).
Thirty five items from the main study were tested (see Table 6-14) and all showed
normality ranging between -0.43 to -2.36 for skewness (level < 3.0) and ±0.01 to 5.14
(level < 10.0) for kurtosis. The data demonstrated normal distribution.

117 | P a g e
Table 6-14 Testing skewness and kurtosis (n= 246) skewness kurtosis
B1 Access to a computer workstation to perform job -2.36 5.14 B2 Access to networked computer/email for work -2.13 4.04
B3 Access to learning through computer network -1.30 0.94
B4 Access to on-line shared databases to facilitate work -1.26 0.51
B5 Support from supervisor/manager to collaborate -1.27 1.79
C1 Job requires to work in teams -1.45 1.48
C2 Job requires to tele-conference with other sites -0.43 -1.27
C3 Job requires to share ideas, work and information -1.18 0.36
C4 Job can only be completed if other members complete theirs -0.56 -0.80
C5 Performance depends on the results of the team -0.77 -0.31
D1 Frequently share ideas, work and information -1.10 0.33
D2 Frequently interact online with peers/team -0.80 -0.53
D3 Easily obtained help and support on-line -0.77 -0.52
D4 Frequently share on-line meetings -0.50 -1.06
D5 Team helps each other to learn -1.12 0.63
E1 Learn from shared information from the network -0.91 -0.07
E2 Receive training to collaborate effectively -0.78 -0.27
E3 Participate in improvement projects -.988 0.39
E4 Learn from external parties -.215 -1.21
E5 Learn from peers/team -1.29 1.25
F1 Work efficiently through use of information from the network -1.00 -0.01
F2 Work interdependently using the computer network -0.94 0.01
F3 Use computer to share information effectively -1.18 0.54
F4 Team achieves goals using information from the network -0.84 -0.26
F5 Team produces good quality collaborative work -0.96 0.09
G1 The network system/tool is useful -1.21 0.78
G2 The shared database is useful -1.21 0.92
G3 The on-line meetings with external parties are useful -0.66 -0.67
G4 The network system is useful for sharing information -1.17 0.51
G5 The on-line learning system is useful -0.75 -0.17
H1 Online knowledge and information -0.88 -0.04
H2 Work using online system/network -1.14 0.43
H3 Share and exchange information -0.99 0.09
H4 Participate in e-learning -0.09 -1.21
H5 Participate in workgroup activities -0.62 -0.58
Note: standard error for skewness = 0.16
standard error for kurtosis = 0.31
6.5 Profile of Participants
For the main study, the participants were again randomly recruited from various
manufacturing organizations using snowball sampling. The main study was conducted
from July 2012 until the end of November 2012 and 292 responses were obtained. The
response were analysed and were useful for the development of questions in the follow-
up with semi-structured interviews with 12 of the participants engaged in the survey.
Of the 63 potential participants identified for the initial stage, 12 were unreachable due
to change in employment. This reduced the sample size of the initial target group of
participants to 51. After the cut-off date of November 22, 246 usable responses were

118 | P a g e
attained, out of which 150 were from the web-based survey and another 96 replied
through hardcopies. Forty six potential participants declined to participate giving a non-
response rate of 14% (46 of 338). In total, 292 participants responded to the survey, of
which 246 completed responses were usable. With 63 survey invitations and 400
hardcopies printed and distributed, the overall response rate was 63% (292 of 463), and
the usable rate was 84% (246 of 292). Table 6-15 shows the profile of the 246
participants.
Table 6-15 Main study - Participants by gender, age and education (n=246)
Frequency Percent
Valid Percent
Cumulative Percent
Gender: Male 112 45.5 45.5 45.5 Female 134 54.5 54.5 100.0
Total 246 100.0 100.0
Age 20-29 years 86 35.0 35.0 35.0
30-39 years 128 52.0 52.0 87.0
40-49 years 29 11.8 11.8 98.8
Above 50 years 3 1.2 1.2 100.0
Total 246 100.0 100.0
Education: Post graduates 27 11.0 11.0 11.0
Bachelor degree/diploma 145 58.9 58.9 69.9
High school/STPM/SPM 69 28.0 28.0 98.0
Junior/SRP/PMR 4 1.6 1.6 99.6
Others 1 .4 .4 100.0
Total 246 100.0 100.0
The majority of the participants were aged between 30-39 years (52.0%, n =128),
followed by those aged between 20-29 years (35.0%, n =86), and possessed at least a
diploma or a bachelor degree (58.9%, n =145). The participants came from MNCs
(72%, n =177) and SMEs (28%, n = 69). The majority of the participants were from
Production/Operations/Manufacturing/Assembly (26.8%, n =66), followed by
Technical/ Engineering (19.9%, n =49) as shown in Table 6-16.

119 | P a g e
Table 6-16 Main study – Participants by organizations and departments (n=246)
Frequency Percent
Valid Percent
Cumulative Percent
Organization : Multinational (MNC) 177 72 72 72 Small-medium enterprise (SME) 69 28 28 100
Total 246 100.0 100.0 Departments: Management/Leadership 22 8.9 8.9 8.9 Technical/Engineering 49 19.9 19.9 28.9 Human resources/Administration /Security 9 3.7 3.7 32.5 Purchasing/Procurement /Sourcing /Materials 30 12.2 12.2 44.7 Planning/Sales /Marketing 21 8.5 8.5 53.3 Production/Operations/Manufacturing/Assembly 66 26.8 26.8 80.1 Quality/Safety 24 9.8 9.8 89.8 Logistic/Warehouse/Store 11 4.5 4.5 94.3 Finance/Accounts/Costing 4 1.6 1.6 95.9 Others 10 4.1 4.1 100.0
Total 246 100.0 100.0
6.6 Preliminary Investigations
Preliminary investigations were carried out for Bartlett’s test of sphericity and the
Kaiser-Meyer-Olkin (KMO) measure of sampling adequacy. The communalities test for
variables represented the amount of variance accounted for by the factor solution. These
tests were carried out before examining the factor loading for each item and its
construct.
6.6.1 Measurement of Sampling Adequacy and Sphericity
Bartlett’s test of sphericity and the Kaiser-Meyer-Olkin (KMO) measure of sampling
adequacy were carried out. Measure of sampling adequacy is a measure which
calculates the entire collection matrix and each individual variable, and evaluates the
appropriateness of applying factor analysis. The KMO represents the ratio of the
squared correlation between variables to the squared partial correlation between
variables (Field, 2005, p. 640). The KMO value >0.50 indicates appropriateness and
fulfils the required sampling adequacy (Field, 2005; Hair et al., 2006; Kaiser, 1974).
Values between 0.5 and 0.7 are mediocre, values 0.7 to 0.8 are good, values between 0.8
and 0.9 are great, and values above 0.9 are superb (Hutchenson & Sofroniou, 1999 as
cited by Field, 2005). Table 6-17 shows the result of Kaiser-Meyer-Olkin and Barlett’s
test for sampling adequacy and sphericity.

120 | P a g e
Table 6-17 Kaiser-Meyer-Olkin and Barlett’s test
Factors Measure of Sampling Adequacy
Test of Sphericity
Approx. Chi-Square
d.f. Sig.
Organizational Support 0.85 1206.82 10 0.000 Positive Interdependence 0.84 682.62 6 0.000 Promotive Interactions 0.85 1088.88 10 0.000 Internal-External Learning 0.80 619.35 6 0.000 Perceived Effectiveness 0.87 1493.24 10 0.000 Perceived Usefulness 0.89 1177.02 10 0.000 Collaborative Networked Learning 0.89 1065.80 10 0.000
In this study, the KMO value for 33 items ranged highly between 0.80 and 0.89 (Table
6-4) which is considered as great. The Bartlett test of sphericity tests for the overall
significance of all correlations within the correlation matrix (Hair et al., 2006) and these
were found to be significant (p<0.001), hence suggesting that the correlation matrix
demonstrates significant correlations (Field, 2005; Hair et al., 2006).
6.6.2 Assessment of Communalities
The proposition of common variance present in a variable is known as communality
(Field, 2005). In factor analysis, the researcher is interested in finding a common
dimension within the data. Correlation coefficients fluctuate sample to sample
depending on the sample size and the communality of the variable should be more than
0.5 (Field, 2005). That is why this study chose to test communality using the main study
with a larger sample size (n=246) as compared to the pilot study (n=44). The
communality for a variable represents the amount of variance accounted for by the
factor solution. A general rule is to consider that at least one-half of the variance of each
variable must be taken into account. Table 6-18 shows item communalities extraction.

121 | P a g e
Table 6-18 Item communalities communalities
B1 Access to a computer workstation to perform job 0.88 B2 Access to networked computer/email for work 0.88 B3 Access to learning through computer network 0.84 B4 Access to on-line shared databases to facilitate work 0.67 B5 Support from supervisor/manager to collaborate 0.67 C1 Job requires to work in teams 0.75 C2 Job requires to tele-conference with other sites 0.48 C3 Job requires to share ideas, work and information 0.83 C4 Job can only be completed if other members complete theirs 0.72 C5 Performance depends on the results of the team 0.80 D1 Frequently share ideas, work and information 0.79 D2 Frequently interact online with peers/team 0.87 D3 Easily obtained help and support on-line 0.86 D4 Frequently share on-line meetings 0.72 D5 Team helps each other to learn 0.71 E1 Learn from shared information from the network 0.79 E2 Receive training to collaborate effectively 0.78 E3 Participate in improvement projects 0.67 E4 Learn from external parties 0.43 E5 Learn from peers/team 0.72 F1 Work efficiently through use of information from the network 0.85 F2 Work interdependently using the computer network 0.88 F3 Use computers to share information effectively 0.87 F4 Team achieves goals using information from the network 0.90 F5 Team produces good quality collaborative work 0.84 G1 The network system/tool is useful 0.86 G2 The shared database is useful 0.88 G3 The on-line meetings with external parties are useful 0.64 G4 The network system is useful for sharing information 0.87 G5 The on-line learning is useful 0.77 H1 Online knowledge and information 0.85 H2 Work using online system/network 0.82 H3 Share and exchange information 0.85 H4 Participate in e-learning 0.70 H5 Participate in workgroup activities 0.75
Extraction Method: Principal Component Analysis
Items C2 and E4 that registered a communalities value of 0.48 and 0.43 respectively (<
0.5) were removed. In this study, exploratory factor analysis (EFA) was used to
examine the dimensionality of the constructs and factor loading. It was used in the
purification stage of the 35-items scale development. The factors extracted should
account for 50% to 60% of the total variance explained and should be attributable to
those factors (Hair et al., 1998). Field (2005) advocates retaining items with loadings of
no less than 0.4. All items that do not have an absolute loading of at least 0.4 on any
factor are recommended for elimination (Churchill et al., 1974; Field, 2005).
Eigenvalues are designed to show the proportion of variance accounted by each factor
(George et al., 2009). This study followed the recommendation by Kaiser (1960) to
retain all factors with an Eigenvalue >1.0, although Jolliffe (1972) rejects Kaiser’s

122 | P a g e
criterion on the ground that it is too strict and suggests an Eigenvalue >0.7. However,
the rationale for Eigenvalue >1.0 is that a given factor must account for at least as much
variance by a single item or variable (Netemeyer et al., 2003). Therefore, Eigenvalue
>1.0 was also chosen for the purpose of this study.
6.7 Exploratory Investigation and Item Reduction
Exploratory factor analysis (EFA) is used for establishing instrument validity (Black,
2005; Flynn et al., 1990). EFA is also used in item reduction to identify a small number
of factors that explain most of the observed variance in the manifest variables.
According to Field (2005) “by reducing a data set from interrelated variables into a
smaller set of factors, factor analysis achieves parsimony by explaining the maximum
amount of common variance in a correlation matrix using a smaller number of
explanatory concepts” (p.620). EFA attempts to identify underlying factors that account
for the pattern of correlations within the set of observed variables in multiple indicator
measures. The correlation between each pair of variables can be arranged in the R-
matrix, which is a table of correlation coefficients between variables (Field, 2005), and
classifies the tests in terms of the relatively few latent dimensions (Kinnear et al., 2009).
Therefore, the factors can be described in the following equation 6.1:
Yi = b1X1 +b2X2 + b3X3 +…+bnXn +εi …..equation 6.1
where Y is the factor of i and b is the factor loading of variable X1, X2, X3 and Xn. In
factor analysis, the principle component for data extraction procedure helps to create
compound measures by integrating several items (Hair et al., 2006) and explained
variance and covariation among the measures (Green et al., 2000). The rotated
components show the loading between each item and the extracted factors (see section
6.7.1 to 6.7.7).
Field (2005) suggests factors with 10 or more loadings greater than 0.4 are only reliable
if the sample size is greater than 150. However, there is no consensus on what is
deemed as the appropriate sample size for factor analysis. Kass and Tinsley (1979)
suggest between 5 to 10 per variable. This study used 7 participants per variable (246 of
35).

123 | P a g e
The principle component method with oblique rotation was chosen for dimension
analysis because there is theoretical ground that the latent factors are correlated to each
other (Field, 2005). Field (2005) argues that the oblique rotation is more suitable and
meaningful than orthogonal rotation. The pattern matrix produced by oblique rotation
contains factor loadings comparable to the factor matrix for the orthogonal rotation. All
the items were measured using a 5-point Likert scale that ranged from 1 (Strongly
disagree) to 5 (Strongly agree). The principal component analysis with Oblimin rotation
with Kaiser normalization was not rotated because only one factor was extracted for
organizational support, promotive interaction, positive interdependence, internal-
external learning, perceived effectiveness and perceived usefulness. The scree plot test
(Figure 6-11) also identified one factor. No item was cross-loaded and none was
eliminated from the analysis.
6.7.1 Factor Analysis – Organizational Support
Table 6-19 shows that one factor was identified: B1, B2, B3, B4 and B5. Factor
organizational support with Eigenvalue 3.94 was extracted and accounted for 78.75% of
the variance. The factor analysis of organizational support turned out to be significant
(approx. chi-square =1206.82, df = 10, Sig. =0.000).
Table 6-19 Factor loading for organizational support
Component
1
B1 Access to a computer workstation to perform job 0.94 B2 Access to networked computer/email for work 0.94 B3 Access to learning through computer network 0.92 B4 Access to on-line shared databases to facilitate work 0.82 B5 Support from supervisor/manager to collaborate 0.82
Extraction Method: Principal Component Analysis. a. 1 components extracted.
6.7.2 Factor Analysis – Promotive Interaction
Table 6-20 shows that one factor was identified: C1, C3, C4 and C5. Factor promotive
interaction with Eigenvalue 3.17 was extracted and accounted for 79.36% of the
variance. The factor analysis of promotive interaction turned out to be significant
(approx. chi-square =682.62, df = 6, Sig. =0.000).
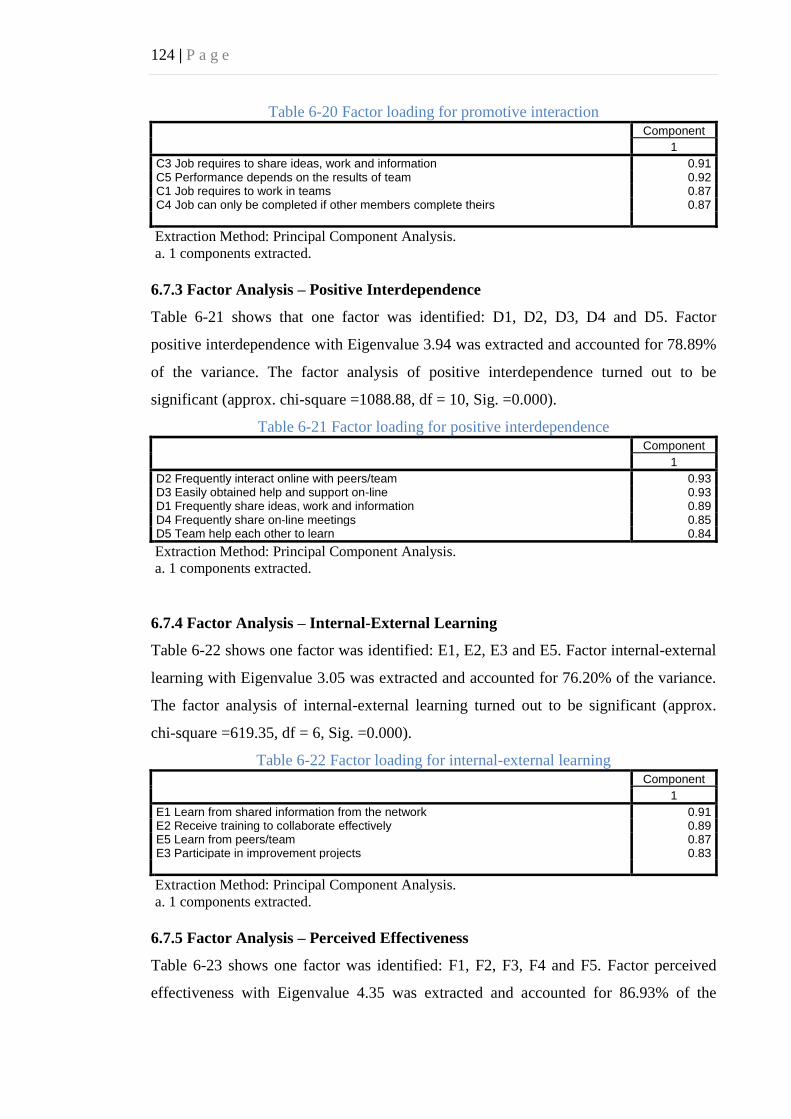
124 | P a g e
Table 6-20 Factor loading for promotive interaction
Component
1
C3 Job requires to share ideas, work and information 0.91 C5 Performance depends on the results of team 0.92 C1 Job requires to work in teams 0.87 C4 Job can only be completed if other members complete theirs 0.87
Extraction Method: Principal Component Analysis. a. 1 components extracted.
6.7.3 Factor Analysis – Positive Interdependence
Table 6-21 shows that one factor was identified: D1, D2, D3, D4 and D5. Factor
positive interdependence with Eigenvalue 3.94 was extracted and accounted for 78.89%
of the variance. The factor analysis of positive interdependence turned out to be
significant (approx. chi-square =1088.88, df = 10, Sig. =0.000).
Table 6-21 Factor loading for positive interdependence
Component
1
D2 Frequently interact online with peers/team 0.93 D3 Easily obtained help and support on-line 0.93 D1 Frequently share ideas, work and information 0.89 D4 Frequently share on-line meetings 0.85 D5 Team help each other to learn 0.84
Extraction Method: Principal Component Analysis. a. 1 components extracted.
6.7.4 Factor Analysis – Internal-External Learning
Table 6-22 shows one factor was identified: E1, E2, E3 and E5. Factor internal-external
learning with Eigenvalue 3.05 was extracted and accounted for 76.20% of the variance.
The factor analysis of internal-external learning turned out to be significant (approx.
chi-square =619.35, df = 6, Sig. =0.000).
Table 6-22 Factor loading for internal-external learning
Component
1
E1 Learn from shared information from the network 0.91 E2 Receive training to collaborate effectively 0.89 E5 Learn from peers/team 0.87 E3 Participate in improvement projects 0.83
Extraction Method: Principal Component Analysis. a. 1 components extracted.
6.7.5 Factor Analysis – Perceived Effectiveness
Table 6-23 shows one factor was identified: F1, F2, F3, F4 and F5. Factor perceived
effectiveness with Eigenvalue 4.35 was extracted and accounted for 86.93% of the

125 | P a g e
variance. The factor analysis of perceived effectiveness turned out to be significant
(approx. chi-square =1493.24, df = 10, Sig. =0.000).
Table 6-23 Factor loading perceived effectiveness
Component
1
F4 Team achieves goals using information from the network 0.95 F2 Work interdependently using the computer network 0.94 F3 Use computers to share information effectively 0.93 F1 Work efficiently through use of information from the network 0.92 F5 Team produces good quality collaborative work 0.92
Extraction Method: Principal Component Analysis. a. 1 components extracted.
6.7.6 Factor Analysis – Perceived Usefulness
Table 6-24 shows one factor was identified: G1, G2, G3, G4 and G5. Factor perceived
usefulness with Eigenvalue 4.02 was extracted and accounted for 80.39% of the
variance. The factor analysis of perceived usefulness turned out to be significant
(approx. chi-square =1177.02, df = 10, Sig. =0.000).
Table 6-24 Factor loading for perceived usefulness
Component
1
G2 The shared database is useful 0.94 G4 The network system is useful for sharing information 0.93 G1 The network systems/tool is useful 0.93 G5 The on-line learning system is useful 0.88 G3 The on-line meetings with external parties are useful 0.80
Extraction Method: Principal Component Analysis. a. 1 components extracted.
6.7.7 Factor Analysis – Collaborative Networked Learning
Table 6-25 shows one factor was identified: H1, H2, H3, H4 and H5. Factor
collaborative networked learning with Eigenvalue 3.97 was extracted and accounted for
79.36% of the variance. The factor analysis of Collaborative Networked Learning
turned out to be significant (approx. chi-square =1065.80, df = 10, Sig. =0.000).
Table 6-25 Factor loading for collaborative networked learning
Component
1
H3 Share and exchange information 0.92 H1 Online knowledge and information 0.92 H2 Work using computer system/network 0.91 H5 Participate in work groups 0.87 H4 Participate in e-learning 0.84
Extraction Method: Principal Component Analysis. a. 1 components extracted.

126 | P a g e
6.8 Development of a Measurement Model
Measurement consists of rules for numerically representing quantities of attributes
(Netemeyer et al., 2003) and includes evaluating numbers to reflect the differing
degrees of the attributes being accessed (Nunnally et al., 1994). According to Nunnally
and Bernstein (1994), the rules of measurement must be clear, practical, not demanding
of the researcher or participant and the results do not depend on the researcher. This will
ensure the measure is reliable and the results can be easily being interpreted or
analyzed. However, the measurement and scale can only be used if it is reliable and
valid, especially for the newly developed constructs for this study. After purification, all
33 items were accepted as all factors loaded between 0.80 and 0.95 and met the loading
> 0.4. All the factors extracted were between 76.2% and 86.9% exceeded 50% of the
total variance explained (as shown in section 6.7.1 until 6.7.7).
6.8.1 Assessment of Unidimensionality
Unidimensionality is a pre-requisite to validity and reliability (Cortina, 1993; Gerbing
& Anderson, 1988). A measure’s dimensionality is concerned with the homogeneity of
items (Netemeyer et al., 2003, p. 9). Netemeyer et al. (2003) further define a measure as
unidimensional when it has “statistical properties demonstrating that its items underlie a
single construct or factor” (p.9). Unidimensionality indicates that all of the scale is
measuring a single underlying factor or construct (Field, 2005). Using exploratory
factor analysis (EFA), the unidimensionality test provides evidence of a single latent
construct (Flynn et al., 1990).
Using the Eigenvalue >1.0 rule, any construct with more than a single factor should be
segregated and/or the items should be removed. However, as was demonstrated in
sections 6.7.1 to 6.7.7, all constructs rotated with only a single factor and therefore they
were unidemensional. This technique was further complemented with the use of scree
plots (see Figure 6-11), which showed the Eigenvalues against the number of factors.
For this study, measurement items had factor loadings between 0.80 and 0.95,
exceeding the minimum value of 0.60 (Nunnally et al., 1994). All the antecedents are
unidimensionals with items representing a single factor for each construct.

127 | P a g e
Organizational Support
Promotive Interactions
Positive Interdependence
Internal-external Learning
Perceived Effectiveness
Perceived Usefulness
Collaborative Networked Learning
Figure 6-10 Scree plots after items purification

128 | P a g e
6.8.2 Assessment of Multicollinearity
Multicollinearity occurs when the correlations among multiple independent variables of
regressors or predictors in a multiple regression model are highly correlated. Apart from
seeking to understand the relationships between the constructs and CNL, it is also
imperative to determine which constructs are good predictors of CNL and to answer to
RQ1: What are the significant antecedents for a CNL model in manufacturing?
By performing collinearity diagnostics (tolerence level > 0.1), any constructs with a
high level of collinearity increases the probability of a good predictor (Field, 2005).
Singularity or multicollinearity must be avoided because calculation of the regression
coefficients is done through matrix inversion. Multicollinearity or singularity may affect
the independent variables to become redundant with one another and weaken the
analysis. In general, two variables should not be highly correlated with one another at
>0.7.
According to Field (2005), although mild multicollinearity is not a problem for factor
analysis, it is important to avoid variables that are very highly correlated (R > 0.9) and
perfectly correlated (R=1.0) as it will become difficult to ascertain the unique
contribution to a factor of the variables. He further points out that multicollinearity can
be detected by first scanning the significance of values >0.05 when the determinant of
the R-matrix (or correlation matrix) is < 0.0001, and only then examine the correlations
of R > 0.9 (Field, 2005). In Appendix F, the significance values were <0.05 and the
determinants of the R-matrix were range from 0.02 to 0.78 (> 0.0001) and as a result it
can be established that there is no problem with multicollinearity, except for items B1
and B2 with R = 0.94. It was therefore decided to remove item B1.
6.8.3 Assessment of Internal Consistency
Internal consistency assesses items for their interrelatedness with their scale. According
to De Vellis (2003) internal consistency is the measure of homogeneity, where the
relationships among items within the scale are logically connected to the latent variable.
The internal consistency of the scale is measured using inter-item correlations (Table 6-
26), items-to-total correlations (Table 6-27) and Cronbach’s coefficient alpha (Table 6-
28 and Table 6-29).

129 | P a g e
There is no clear guideline to what constitutes moderate inter-item correlations.
Robinson, Shaver, and Wrightsman (1991) advocate average inter-item correlations of
>0.30 and Peterson suggests 0.31. Table 6-26, shows that the inter-item correlation for
this study rated between moderate to high of 0.6 to 0.9.
Table 6-26 Inter-item correlation matrix B2 B3 B4 B5
B2 Access to networked computer/email for work 1.00
B3 Access to learning through computer network 0.82 1.00
B4 Access to on-line shared databases to facilitate work 0.70 0.68 1.00
B5 Support from supervisor/manager to collaborate 0.67 0.72 0.60 1.00
C1 C3 C4 C5
C1 Job requires to work in teams 1.00
C3 Job requires to share ideas, work and information 0.74 1.00
C4 Job can only be completed if other members complete theirs 0.63 0.71 1.00
C5 Performance depends on the results of team 0.73 0.77 0.77 1.00
D1 D2 D3 D4 D5
D1 Frequently share ideas, work and information 1.00
D2 Frequently interact online with peers/team 0.81 1.00
D3 Easily obtained help and support on-line 0.75 0.89 1.00
D4 Frequently share on-line meetings 0.65 0.73 0.76 1.00
D5 Team help each other to learn 0.73 0.69 0.71 0.63 1.00
E1 E2 E3 E5
E1 Learn from shared information from the network 1.00
E2 Receive training to collaborate effectively 0.82 1.00
E3 Participate in improvement projects 0.63 0.61 1.00
E5 Learn from peer/team 0.71 0.65 0.67 1.00
F1 F2 F3 F4 F5
F1 Work efficiently through use of information from the network 1.00
F2 Work interdependently using the computer network 0.90 1.00
F3 Use computers to share information effectively 0.79 0.85 1.00
F4 Team achieves goals using information from the network 0.83 0.86 0.87 1.00
F5 Team produces good quality collaborative work 0.80 0.78 0.84 0.86 1.00
G1 G2 G3 G4 G5
G1 The network system/tool is useful 1.00
G2 The shared database is useful 0.90 1.00
G3 The on-line meetings with external parties are useful 0.62 0.66 1.00
G4 The network system is useful for sharing information 0.85 0.85 0.70 1.00
G5 The on-line learning is useful 0.75 0.77 0.65 0.76 1.00
H1 H2 H3 H4 H5
H1 Online knowledge and information 1.00
H2 Work using online system/network 0.84 1.00
H3 Share and exchange information 0.85 0.82 1.00
H4 Participate in e-learning 0.67 0.67 0.69 1.00
H5 Participate in workgroup activities 0.72 0.69 0.74 0.71 1.00
The item-to-total correlation examines the correlations between each item and the total
score from the questionnaire and “in a reliable scale all items should correlate with the
total” (Field, 2005, p. 672). Items-to-total correlation < 0.3 is considered weak (de
Vaus, 2002; Field, 2005). However, there is no consensus on the decision rules for item-
to-total correlation. Tian et al. (2001) suggest deleting items < 0.5; Obermiller and

130 | P a g e
Spangenberg (1998) suggest < 0.5; Bearden et al. (2001) suggest < 0.35; while
Netermeyer et al.(1996) suggest retaining item-to-total correlations in the 0.5 to 0.8
range. In this study the researcher followed the recommendation by Tian et al. (2001)
and Obermiller and Spangenberg (1998). Table 6-27 shows that all items exceeded
item-to-total correlation 0.5 and therefore all items were retained for further analysis.
The correlations within dimensions show all items were highly correlated and the items
which were within dimensions were internally consistent, with the corrected item-total
correlations values registered between 0.7 to 0.9.
Table 6-27 Item-to-total correlation
Item-Total Correlation
B2 Access to networked computer/email for work 0.89 B3 Access to learning through computer network 0.86 B4 Access to on-line shared databases to facilitate work 0.73 B5 Support from supervisor/manager to collaborate 0.73 C1 Job requires to work in teams 0.77 C3 Job requires to share ideas, work and information 0.82 C4 Job can only be completed if other members complete theirs 0.78 C5 Performance depends on the results of the team 0.85 D1 Frequently share ideas, work and information 0.82 D2 Frequently interact online with peers/team 0.88 D3 Easily obtained help and support on-line 0.88 D4 Frequently share on-line meetings 0.77 D5 Team help each other to learn 0.76 E1 Learn from shared information from the network 0.83 E2 Receive training to collaborate effectively 0.79 E3 Participate in improvement projects 0.70 E5 Learn from peers/team 0.76 F1 Work efficiently through use of information from the network 0.88 F2 Work interdependently using the computer network 0.90 F3 Use computers to share information effectively 0.89 F4 Team achieves goals using information from the network 0.92 F5 Team produces good quality collaborative work 0.87 G1 The network system/tool is useful 0.87 G2 The shared database is useful 0.89 G3 The on-line meetings with external parties are useful 0.71 G4 The network system is useful for sharing information 0.89 G5 The on-line learning system is useful 0.81 H1 Online knowledge and information 0.87 H2 Work using online system/network 0.84 H3 Share and exchange information 0.87 H4 Participate in e-learning 0.75 H5 Participate in workgroup activities 0.79
From the analysis, the researcher also sought to increase the reliability of the
Cronbach’s α. Field (2005) recommends that when items result in significant values of
α, the overall α should be deleted from the scale in order to improve its reliability.
Deletion of item B4 only increased α from 0.928 to 0.933 and item G3 from 0.935 to

131 | P a g e
0.945. These increases were not deemed to be significant and thus these items were not
deleted.
The Cronbach’s α reliability test in the pilot study was repeated to ensure consistency in
the measurement with the results previously indicated in the pilot study. The result from
the main study ranged from 0.90 to 0.96 (Table 6-28) and as this was >0.7, they were
considered to be reliable. The split-half reliability was also used to further validate this
result, since “Cronbach’s alpha would calculate the average of all possible split-half
reliability coefficients” (Bryman et al., 2005, p. 77) to clearly dictate the measurement
instrument is both reliable and valid. Cronbach’s Coefficient Alpha, using the split-half
reliability test further proved the scales to be effective (see Table 6-29) with results
ranging between 0.73 to 0.95 (level > 0.7). The closer the correlation coefficient is to
1.0 the more reliable it is (Nardi, 2006, p. 63).
Table 6-28 Main study - Cronbach’s alpha Constructs Cronbach's Alpha N of Items
Organizational Support 0.90 4
Positive Interdependence 0.91 4 Promotive Interactions 0.93 5 Internal-External Learning 0.90 4 Perceived Effectiveness 0.96 5 Perceived Usefulness 0.94 5 Collaborative Networked Learning 0.93 5
Table 6-29 Main study - split-half reliability
Constructs
Cronbach's Alpha 1
st Half N of Items
Cronbach's Alpha 2
nd Half N of Items
Organizational Support 0.90 2 0.73 2
Positive Interdependence 0.84 2 0.87 2 Promotive Interactions 0.93 3 0.77 2 Internal-External Learning 0.90 2 0.80 2 Perceived Effectiveness 0.94 3 0.92 2 Perceived Usefulness 0.88 3 0.87 2 Collaborative Networked Learning 0.93 3 0.83 2
6.8.4. Validity of Measurement
Construct validity is related to what the instrument is measuring (Churchill, 1979).
The construct validity assessment involves examining the convergent and divergent
validity of the scale items to ensure the construct variables yield good fit to the
quantitative survey data. Validity is concerned with the extent that a scale accurately
132 | P a g e
represents the construct of interest (Hair et al., 2006). Construct validity determines how
well the instrument measures or can measure the underlying constructs (Black, 2005;
Campbell & Fiske, 1959; Cooper & Schindler, 1998; Cronbach & Meehl, 1955;
Netemeyer et al., 2003). The study deduced propositions from the literature and theories
that are relevant to the concept of CNL. Furthermore, the assessment of construct
validity is a continuous process, which may require a series of refinement after multiple
tests over a period of time. Factor loading >0.4 is considered as significant for
convergent and divergent validity (Hair et al., 1998). All items had a factor loading
range from 0.80 to 0.95 (>0.4), and fulfilled the requirement for convergent and
divergent validity (as demonstrated in section 6.7.1 to 6.7.7).
Convergent validity is achieved when two items designed to measure the same scale
converge or load together in a single construct to provide the same results (Bryman et
al., 2005; Churchill, 1979; Garver & Mentzer, 1999; Hair et al., 2006; Netemeyer et al.,
2003). Convergent validity is about the extent to which there is consistency in
measurements across multiple operationalization (Campbell et al., 1959). In order to test
the convergent validity of the model, the research used exploratory factor analysis
(EFA), and the correlation matrix. The high values of item communalities also
supported convergent validity. In Table 6-5, items C2 and E4 had low communalities
values of 0.48 and 0.43 respectively and were removed. Cronbach’s coefficient alpha of
>0.7 for all items tested (as demonstrated in Table 6-27 and Table 6-28) also indicated
internal consistency and convergent validity.
Divergent validity refers to the independence of the dimensions, assesses the degree to
which measures of different latent variables are unique (Hensley, 1999). The CNL
constructs are considered to have divergent validity when the scale items are distinctly
different from each other and the measures are not related (Bryman et al., 2005; Hair et
al., 2006; Netemeyer et al., 2003) or have low correlations (Spector, 1992) because they
are supposed to represent other concepts (Bryman et al., 2005). In terms of measure
development and validation, evidence of convergent validity in this study was provided
from correlation between the measures. The method considered the estimated
correlations between the factors < 0.85 (Kline, 2005) and no items that indicated a lack
of discriminant validity were deleted.

133 | P a g e
6.9 Univariate Statistics
Univariate statistics refers to the analysis of one variable at a time (Bryman, 2008,
p.322). Descriptive procedure in the SPSS helped to calculate basic univariate statistics.
Univariate descriptive procedures focus on single variables to report the distributions of
a sample of population, which may include frequency counts; measure of central
tendency; and measure of dispersion of distribution. Table 6-30 compares descriptive
statistics on the level of agreement (Likert scale from 1= strongly disagree to 5 =
strongly agree) and the results between MNCs (n = 177) and SMEs (n = 69).
Table 6-30 Descriptive statistics MNC (n =177) and SME (n = 69)
MNCs SMEs
Mean s.d. Mean s.d.
B2 Access to networked computer/email for work 4.72 0.61 3.46 1.38
B3 Access to learning through computer network 4.52 0.77 2.97 1.24
B4 Access to on-line shared databases to facilitate work 4.28 1.10 3.19 1.33
B5 Support from supervisor/manager to collaborate 4.36 0.76 3.39 1.10
C1 Job requires to work in teams 4.56 0.73 3.29 1.19
C3 Job requires to share ideas, work and information 4.45 0.75 2.72 1.33
C4 Job can only be completed if other members complete theirs 4.07 0.98 2.35 1.08
C5 Performance depends on the results of team 4.18 0.88 2.65 1.19
D1 Frequently share ideas, work and information 4.37 0.82 2.83 1.28
D2 Frequently interact online with peers/team 4.15 0.96 2.42 1.31
D3 Easily obtained help and support on-line 4.10 0.97 2.45 1.28
D4 Frequently share on-line meetings 3.86 1.23 2.38 1.26
D5 Team helps each other to learn 4.28 0.86 3.04 1.30
E1 Learn from shared information from the network 4.11 0.93 2.80 1.34
E2 Receive training to collaborate effectively 4.01 0.97 2.75 1.32
E3 Participate in improvement projects 4.25 0.90 3.14 1.15
E5 Learn from peers/team 4.27 0.79 3.10 1.27
F1 Work efficiently through use of information from the network 4.19 0.95 2.94 1.39
F2 Work interdependently using the computer network 4.20 0.90 2.83 1.29
F3 Use computer to share information effectively 4.31 0.83 2.93 1.39
F4 Team achieves goals using information from the network 4.12 0.94 2.77 1.32
F5 Team produces good quality collaborative work 4.24 0.85 2.88 1.29
G1 The network system/tool is useful 4.35 0.81 3.01 1.30
G2 The shared database is useful 4.31 0.78 3.00 1.32
G3 The on-line meetings with external parties are useful 3.88 1.20 2.65 1.24
G4 The network system is useful for sharing information 4.34 0.85 2.90 1.32
G5 The on-line learning system is useful 4.06 0.87 2.61 1.23
H1 Online knowledge and information 4.21 0.85 2.84 1.35
H2 Work using online system/network 4.36 0.78 2.81 1.36
H3 Share and exchange information 4.25 0.83 2.84 1.37
H4 Participate in e-learning 3.64 1.14 1.87 0.98
H5 Participate in workgroup activities 4.14 0.94 2.71 1.10

134 | P a g e
This study depicts the broad experience, activities and tasks that manufacturing
employees encounter on a 5-point Likert scale (1=strongly disagree to 5=strongly agree).
The majority of the participants stated their preferences as follows:
Access to networked computer/email for work: MNCs (M = 4.72; s.d. = 0.61)
and SMEs (M = 3.46; s.d. = 1.38).
Access to learning through computer network: MNCs (M = 4.52; s.d. = 0.77)
and SMEs (M = 2.97; s.d. = 1.24).
Job requires to work in teams: MNCs (M = 4.56; s.d. = 0.73) and SMEs (M =
3.29; s.d. = 1.19).
Job requires to share ideas, work and information: MNCs (M = 4.45; s.d. = 0.75)
and SMEs (M = 2.72; s.d. = 1.33).
This clearly demonstrates that the majority of the employees in manufacturing
organizations are provided with infrastructure and hardware which enable them to
collaborate. Moreover, the observed result also implies that employees in manufacturing
organizations are expected to work in teams. However, it would be premature to
conclude that employees in manufacturing actually use CNL. This study only depicts the
high significant of employees provided with the necessary systems and tools which may
support them to engage in CNL.
Bar charts in Figures 6-12, 6-13, 6-14 and 6-15 are used to depict hours spent on online
learning, sharing databases, attending online meetings and using email for work among
employees in manufacturing organizations.
Figure 6-11 Hours spent using online learning per year

135 | P a g e
In Figure 6-12 it is interesting to note that 48.4% (n=119) of the participants spent 10
hours or less using online learning as compared with 12.6% (n=31) of those who
actually spent more than 40 hours per year. This shows that online learning is not a
main source of learning in manufacturing and not everyone has the privilege to access
the online courses.
Figure 6-12 Hours using shared database or network information per week
In Figure 6-13, 22.8% (n=56) of the participants spent between 6 to 10 hours per week
on a shared database or network information compared to 22.4% (n=55) of those who
spent more than 15 hours. Only 7.7% (n=19) had neither used nor had access to any
shared database. This shows a significant number of participants had access to a shared
database and had actually used shared information in their daily work.

136 | P a g e
Figure 6-13 Hours using online meetings per week
In Figure 6-14, it is interesting to note that 53.3% (n =131) of the participants said that
they had never used online meetings or had used them less than an hour per week. Only
4.1% (n=10) spent more than 15 hours per week using online meetings. This shows that
online meetings were not a popular mode of information sharing for all participants.
Figure 6-14 Hours using emails per day
In Figure 6-15, 25.2% (n=62) of the participants spent less than an hour per day using
emails for work. The majority, at 33.6% (n=83), spent between 1 to 5 hours, while the
rest, 41.2% (n=101), spent more than 6 hours per day using emails for their work. The

137 | P a g e
figure is quite significant considering a large percentage of participants were engaged in
the work of manufacturing, assembling or testing. Apparently, email was a common
mode of communication and possibly an effective mode for sharing information among
the participants.
Aside from looking at the hours spent on using CNL by manufacturing employees, this
study was also interested in examining the difference between employees in MNC and
SME organizations. The independent t-test was used to test the results from different
groups of participants. Samples from MNCs and SMEs were considered as independent
because there was no relationship between the participants from both groups. When
comparing two groups with a different number of participants, the pooled variance
estimate t-test is used by weighting the variance of each sample (Field, 2005). Table 6-
31 shows descriptive statistics for hours spent on using different collaborative tools
between MNCs and SMEs.
Table 6-31 Comparing mean hours spend using collaborative tools
Manufacturing organization N Mean
Std. Deviation S.E. Mean
Online learning
MNCs 177 3.35 1.45 0.11
SMEs 69 1.99 1.41 0.17
Shared database
MNCs 177 4.17 1.41 0.11
SMEs 69 2.78 1.60 0.19
Online meetings
MNCs 177 2.80 1.48 0.11
SMEs 69 1.68 1.21 0.15
Work emails
MNCs 177 3.60 1.07 0.08
SMEs 69 2.54 1.38 0.17
The pair of scores was expected to differ because of a different source of variance, such
as perceptions and motivations to use CNL. For the independent t-test, the researcher
looked at differences between participants from MNCs and SMEs and so the result
needed to divide the standard deviation of differences between the two groups. If the
standard deviation was high, then a large difference between samples could have
occurred by chance. To overcome this, the standard error of the sampling distribution is
used to assess whether the difference between samples is statistically meaningful (Field,
2005). If the observed significance level of the Levene’s test is small at p ≤ 0.05, then
the study can conclude that the variances are significantly different (Norusis, 1999) and
the assumption of homogeneity of variances has been violated (Field, 2005). Appendix
G depicts the descriptive statistics for the both groups, while Table 6-32 further reports

138 | P a g e
the result of the independent sample t-test. It can be noted that homogeneity of
variances had not been violated.
Table 6-32 Independent sample test
Levene's Test t-test for Equality of Means
F Sig. t df Sig. (2-tailed)
Mean Difference
S.E. Difference
Online learning
Equal variances assumed 4.35 0.04 6.67 244 0.00 1.37 0.21
Equal variances not assumed
6.76 127.71 0.00 1.37 0.20
Shared database
Equal variances assumed 1.65 0.20 6.68 244 0.00 1.39 0.21
Equal variances not assumed
6.32 111.42 0.00 1.39 0.22
Online meetings
Equal variances assumed 7.29 0.01 5.59 244 0.00 1.12 0.20
Equal variances not assumed
6.11 150.53 0.00 1.12 0.18
Work emails
Equal variances assumed 7.37 0.01 6.48 244 0.00 1.07 0.17
Equal variances not assumed
5.80 101.34 0.00 1.07 0.18
Participants from MNCs (n=177) spent more hours using CNL as compared to
participants from SMEs (n =69) and the results can be summarized as follows:
i. Hours spent on using online learning or e-learning per year – MNCs (M = 3.35,
s.d. = 1.45, S.E. = 0.11) and SMEs (M = 1.99, s.d.= 1.41, S.E. = 0.17). The
difference was significant ( t(127.71) = 6.76, p< 0.05).
ii. Hours spent on using a shared database or network information per week –
MNCs (M = 4.17, s.d. =1.41, S.E. =0.11) and SMEs (M = 2.78, s.d. = 1.60, S.E.
= 0.19). The difference was not significant ( t(244) = 6.68, p> 0.05).
iii. Hours spent on online meetings or tele-conferencing per week – MNCs (M =
2.80, s.d. = 1.48, S.E. =0.11) and SMEs (M = 1.68, s.d. = 1.21, S.E. =0.15). The
difference was significant ( t(111.42) = 6.32, p< 0.05).
iv. Hours spent on sending/replying to emails for work per day – MNCs (M =3.60,
s.d. = 1.07, S.E. = 0.80) and SMEs (M = 2.54, s.d. = 1.38, S.E. =0.17). The
difference was significant ( t(101.34) = 5.80, p< 0.05).
6.10 Bivariate Statistics
Bivariate analysis refers to the analysis of two variables at a time to examine the
relationships between and to recognize when “variation in one variable coincides with
variation in another variable” (Bryman, 2008, p.325). Cross-tabulation is used to
demonstrate the relationships between two or more categorical (nominal or ordinal)
variables, when the distribution of one variable is associated with the other variable
(Bryman, 2008; Bryman et al., 2005; Norusis, 1999) and it did not happen by chance.

139 | P a g e
By using cross-tabulation, the study examined the count of the number of cases in each
cell of the tables (Table 6-33, Table 6-34, Table 6-35, and Table 6-36). Again, the test
was repeatedly used to compare the frequencies of a dichotomous variable from two
groups of participants (i.e. MNCs and SMEs).
The chi square (χ2) test is used in conjunction with cross-tabulation to test the
significance level that the observed relationship between the two variables could have
arisen by chance (Bryman, 2008; Bryman et al., 2005) and to test the propositions on
data that are counts (Norusis, 1999). As a general rule, if the observed significance level
is p <0.0005, then the assumption is to reject the two variables as being independent
(Norusis, 1999, 2008). The χ2
test is only appropriate if less than 20% of the cells have
expected values of less than 5, or if the expected frequency is less than 1 (Norusis,
1999, 2008). The χ2
tests in this study met the requirement with 0% to 16.7% of the cells
having expected values of less than 5, as stipulated in the results below:
Online learning - 1 cell (8.3%) had expected count less than 5. The minimum
expected count was 4.49.
Shared database - 0 cell (0%) had expected count less than 5. The minimum
expected count was 5.33.
Online meetings - 2 cells (16.7%) had expected count less than 5. The minimum
expected count was 2.80.
E-mailing - 1 cell (8.3%) had expected count less than 5. The minimum
expected count was 4.21.
Table 6-33 shows a cross-tabulation of two categories of manufacturing organizations
and six categories of hours spent on sending/replying to work emails (χ2 = 68.87, df =5,
sig =0.000).

140 | P a g e
Table 6-33 Cross-tabulation of manufacturing organization and email at work
Type of manufacturing organization
Total MNC SME
Never Count 1 17 18
% within Hours spent on sending/replying to emails 5.6% 94.4% 100.0%
% within Type of manufacturing organization .6% 24.6% 7.3%
Less than 1 hour per day
Count 20 24 44
% within Hours spent on sending/replying to emails 45.5% 54.5% 100.0%
% within Type of manufacturing organization 11.3% 34.8% 17.9%
1- 5 hours per day
Count 71 12 83
% within Hours spent on sending/replying to emails 85.5% 14.5% 100.0%
% within Type of manufacturing organization 40.1% 17.4% 33.7%
6- 10 hours per day
Count 53 9 62
% within Hours spent on sending/replying to emails 85.5% 14.5% 100.0%
% within Type of manufacturing organization 29.9% 13.0% 25.2%
11- 15 hours per day
Count 20 4 24
% within Hours spent on sending/replying to emails 83.3% 16.7% 100.0%
% within Type of manufacturing organization 11.3% 5.8% 9.8%
More than 15 hours per day
Count 12 3 15
% within Hours spent on sending/replying to emails 80.0% 20.0% 100.0%
% within Type of manufacturing organization 6.8% 4.3% 6.1%
Total Count 177 69 246
% within Hours spent on sending/replying to emails 72.0% 28.0% 100.0%
% within Type of manufacturing organization 100.0% 100.0% 100.0%
Pearson Chi-Square = 69.870, df = 5, Asymp. Sig. (2-sided) = .000
A total of 85.5% (n =71) of the participants from MNCs, as compared to 14.5% (n=12)
from SMEs, said that they spent between 1 to 5 hours a day using emails for work. This
was followed by another 85.5% (n =53) of participants from MNCs, as compared to
14.5% (n=9) from SMEs, who spent between 6 to 10 hours a day using their emails for
work. The majority of participants from SMEs, at 94.4% (n =14), said that they had
never used emails, as compared to 5.6% (n =1) of participants from MNCs. Those who
spent more than 15 hours per day using emails for work were from MNCs at 80.0%
(n=12) as compared to SMEs at 20.0% (n =3). The observed significance level for the
Pearson chi-square value of 69.87 was less than 0.0005, which showed that participants
from MNCs and SMEs did not give the same responses to the question (independent). It
was evident that participants from MNCs spent more hours using email for work as
compared to participants from SMEs.
Table 6-34 shows a cross-tabulation of two categories of manufacturing organizations
and six categories of hours using on-line meetings or tele-conferencing (χ2 = 37.85, df
=5, sig =0.000).

141 | P a g e
Table 6-34 Cross-tabulation of manufacturing organization and on-line meeting
Type of manufacturing organization
Total MNCs SMEs
Never Count 49a 46b 95
% within Hours spent on on-line meetings or tele-conferencing
51.6% 48.4% 100.0%
% within Type of manufacturing organization 27.7% 66.7% 38.6%
Less than 1 hour per week
Count 25a 11a 36
% within Hours spent on on-line meetings or tele-conferencing
69.4% 30.6% 100.0%
% within Type of manufacturing organization 14.1% 15.9% 14.6%
1-5 hours per week
Count 48a 5b 53
% within Hours spent on on-line meetings or tele-conferencing
90.6% 9.4% 100.0%
% within Type of manufacturing organization 27.1% 7.2% 21.5%
6-10 hours per week
Count 32a 3b 35
% within Hours spent on on-line meetings or tele-conferencing
91.4% 8.6% 100.0%
% within Type of manufacturing organization 18.1% 4.3% 14.2%
11-15 hours per week
Count 14a 3a 17
% within Hours spent on on-line meetings or tele-conferencing
82.4% 17.6% 100.0%
% within Type of manufacturing organization 7.9% 4.3% 6.9%
More than 15 hours per week
Count 9a 1a 10
% within Hours spent on on-line meetings or tele-conferencing
90.0% 10.0% 100.0%
% within Type of manufacturing organization 5.1% 1.4% 4.1%
Total Count 177 69 246
% within Hours spent on on-line meetings or tele-conferencing
72.0% 28.0% 100.0%
% within Type of manufacturing organization 100.0% 100.0% 100.0%
Pearson Chi-Square = 37.854, df = 5, Asymp. Sig. (2-sided) = .000
A total of 91.4% (n =32) of the participants from MNCs said that they spent between 6
to 10 hours a week using online meetings or tele-conferencing for work, as compared to
8.6% (n=3) from SMEs. This was followed by 90.6% (n =48) from MNCs and 9.4%
(n=5) from SMEs who spent between 1 to 5 hours a week. The observed significance
level for the Pearson chi-square value of 37.85 was less than 0.0005, which shows that
participants from MNCs and SMEs did not give the same responses to the question
(independent). It is evident that participants from MNCs spent more hours using online
meetings as compared to participants from SMEs.
Table 6-35 shows a cross-tabulation of two categories of manufacturing organizations
and six categories of hours using a shared database or network information (χ2 = 56.38,
df =5, sig. =0.000).

142 | P a g e
Table 6-35 Cross-tabulation of manufacturing organization and shared database
Type of manufacturing organization
Total MNCs SMEs
Never Count 3a 16b 19
% within Hours using shared database or network information
15.8% 84.2% 100.0%
% within Type of manufacturing organization 1.7% 23.2% 7.7%
Less than 1 hour per week
Count 19a 22b 41
% within Hours using shared database or network information
46.3% 53.7% 100.0%
% within Type of manufacturing organization 10.7% 31.9% 16.7%
1- 5 hours per week
Count 39a 11a 50
% within Hours using shared database or network information
78.0% 22.0% 100.0%
% within Type of manufacturing organization 22.0% 15.9% 20.3%
6- 10 hours per week
Count 48a 8b 56
% within Hours using shared database or network information
85.7% 14.3% 100.0%
% within Type of manufacturing organization 27.1% 11.6% 22.8%
11- 15 hours per week
Count 20a 5a 25
% within Hours using shared database or network information
80.0% 20.0% 100.0%
% within Type of manufacturing organization 11.3% 7.2% 10.2%
More than 15 hours per week
Count 48a 7b 55
% within Hours using shared database or network information
87.3% 12.7% 100.0%
% within Type of manufacturing organization 27.1% 10.1% 22.4%
Total Count 177 69 246
% within Hours using shared database or network information
72.0% 28.0% 100.0%
% within Type of manufacturing organization 100.0% 100.0% 100.0%
Pearson Chi-Square = 56.382, df = 5, Asymp. Sig. (2-sided) = .000
Surprisingly, a high percentage of participants from MNCs, at 87.3% (n =43), said that
they spent more than 15 hours a week using a shared database or network information
for work as compared to just 12.7% (n=7) of those from SMEs. Another 87.7% (n =48)
from MNCs, as compared to 14.3% (n=8) from SMEs, spent between 6 to 10 hours a
week. A high percentage of participants from SMEs, at 84.2% (n=16), said that they did
not have access to a shared database or networked information. The observed
significance level for the Pearson chi-square value of 56.38 was less than 0.0005, which
shows that participants from MNCs and SMEs did not give the same responses to the
question (independent). It is evident that participants from MNCs spent more hours
using a shared database as compared to participants from SMEs.

143 | P a g e
Table 6-36 shows a cross-tabulation of two categories of manufacturing organizations
and six categories of hours using online learning or e-learning (χ2 = 91.33, df =5, sig.
=0.000).
Table 6-36 Cross-tabulation of manufacturing organization and online learning
Type of manufacturing organization
Total MNCs SMEs
Never Count 4a 34b 38
% within Hours using e-learning 10.5% 89.5% 100.0%
% within Type of manufacturing organization 2.3% 49.3% 15.4%
Less than 10 hours per year
Count 60a 21a 81
% within Hours using e-learning 74.1% 25.9% 100.0%
% within Type of manufacturing organization 33.9% 30.4% 32.9%
11- 20 hours per year
Count 51a 5b 56
% within Hours using e-learning 91.1% 8.9% 100.0%
% within Type of manufacturing organization 28.8% 7.2% 22.8%
21-30 hours per year
Count 20a 4a 24
% within Hours using e-learning 83.3% 16.7% 100.0%
% within Type of manufacturing organization 11.3% 5.8% 9.8%
31-40 hours per year
Count 16a 0b 16
% within Hours using e-learning 100.0% .0% 100.0%
% within Type of manufacturing organization 9.0% .0% 6.5%
More than 40 hours per year
Count 26a 5a 31
% within Hours using e-learning 83.9% 16.1% 100.0%
% within Type of manufacturing organization 14.7% 7.2% 12.6%
Total Count 177 69 246
% within Hours using e-learning 72.0% 28.0% 100.0%
% within Type of manufacturing organization 100.0% 100.0% 100.0%
Pearson Chi-Square = 91.328, df = 5, Asymp. Sig. (2-sided) = .000
The majority of those who had engaged in more than 40 hours per year in e-learning
were from MNCs at 83.9% (n =26). Participants from SMEs, at 89.5% (n=34) and
MNCs, at 10.5% (n=4) said that they had never engaged in any form of online learning
or e-learning. The observed significance level for the Pearson chi-square value of 91.33
was less than 0.0005, which shows that participants from MNCs and SMEs did not give
the same responses to the question (independent). It is evident that participants from
MNCs spent more hours using online learning as compared to participants from SMEs.
6.11 Multivariate Statistics
Although the bivariate statistics in Section 6.10 show evidence of correlation between
CNL and different groups, they provide limited information and an oversimplified view
of an actual multivariate reality. Multiple factors influence manufacturing employees’
decisions and perceptions in using CNL. In such a case, multivariate procedures are best

144 | P a g e
used to demonstrate the degree of correlations between three or more variables and to
examine the strength of the relationships between those variables (Bryman et al., 2005)
in making a prediction of the dependent variable (Bryman & Cramer, 2005). This study
identified a set of independent variables (e.g. organizational support, promotive
interaction, positive interdependence, internal-external learning, perceived
effectiveness, and perceived usefulness) with estimated likely scores in predicting the
scores of CNL. However, it is important that the level of measurement is more than
ordinal (Hair et al., 2006), observations are independent, and the dependent variable is
normally distributed and has the same variability at each of the independent variables in
a linear relationship (Green et al., 2000; Hair et al., 2006; Pallant, 2001). This is
achieved by the composition of multiple linear regression equation 6-2:
Y = a+ b1x1 + b2x2 + … + bnxn …..equation 6.2
where Y is the outcome score for the variable, b1, b2, bn are the regression coefficients of
the predictors x1, x2, xn and intercept a is the regression constant. The independent
variables were entered into the regression in a specified order as a means of determining
their individual and joint contributions to the dependent variable CNL, predicted from a
combination of variables multiplied by their respective coefficients and a residual term.
The multiple regression analysis procedure is used to create the predictive power of the
antecedents against CNL that include multiple predictor variables (Pallant, 2001). It
enables a study to identify a set of predictors, so that other research can focus on its use
in future studies.
All predictors were entered into the model using the “enter” method to identify “which
predictors contributed substantially to the model’s ability to predict the outcome”
(Field, 2005, p. 184). R measured the correlation between the observed value and the
predicted value of the dependent variable CNL and all of the independent variables. The
coefficient of determination (R2) measured the amount of variability in the dataset in the
context of statistical models for the purpose of predicting the future outcome. The
adjusted R2 value took into consideration the variation in the dependent variable CNL
that can be explained by the combined effect of the independent variables (Nardi, 2006).
The adjusted R2 provided a useful measure of the accuracy of the models H1, H2, H3,

145 | P a g e
H4 and H5 in section 6.11.7. The high value of adjusted R2 means that the variable is a
good predictor of the dependent variable (Nardi, 2006; Field, 2005).
Dublin-Watson statistics inform a study whether the assumption of independent errors is
tenable and conservatively suggests that a value less than 1 and greater than 3 should be
avoided (Field, 2005). In all the cases (Tables 6-36, 6-38, 6-40, 6-42, 6-44 and 6-46) the
results registered between 1.31 and 2.02 (1 < x < 3) which clearly showed that the
assumption of independent errors had been met.
The analysis of variance (ANOVA) is used to test whether the differences between
categories are larger or smaller than those other categories. The categories should be
mutually exclusive (Nardi, 2006). If the between groups variation is the same as the
within groups variation, then the F value will be 1 and there is no influence of the
independent variables on the dependent variable. In all the cases (Table 6-37, 6-39, 6-
41, 6-43, 6-45 and 6-47) the results registered between 67.22 and 363.10 (> 1) with p <
0.05 which suggests that there was a statistical significance in the effect the independent
variables had on the dependent variable (Nardi, 2006).
Collinearity diagnostics provide information about multicollinearity. The tolerance
statistic is derived from 1 minus R2 for each independent variable. Tolerance directly
measures the amount of variability of the selected independent variable not explained by
other independent variables (Hair et al., 2006). A tolerance value close to 1 indicates
that the independent variable has little of its variability explained by other independent
variables. When tolerance is low (close to 0), it indicates that the variable is almost a
linear combination of other independent variable (Norusis, 1999), or the multiple
correlation is high and there is a possibility of multicollinearity (Bryman et al., 2005).
“As multicollinearity rises, the ability to define any variables effect is diminished” (Hair
et al., 2006, p. 186.). Tolerance below 0.1 indicates a problem (Field, 2005; Norusis,
1999). The variance inflation factor (VIF) indicates whether a predictor has a strong
linear relationship with the other predictors (Field, 2005). VIF for each independent
variable is calculated as 1 divided by the tolerance level and it is useful to assess the
impact of multicollinearity on the precision of the estimates from the regression

146 | P a g e
equation (Bryman et al., 2005). If the largest VIF is greater than 10, then there is a cause
for concern (Myers, 1990 as cited by Field, 2005).
6.11.1 Multiple Regression – Organizational Support
Table 6-37 demonstrates the fit of the model and provides the value of R, R2 and the
adjusted R2. Table 6-38 shows the ANOVA in construct organizational support. There
was no problem with multicollinearity as the tolerance level was > 0.1, the VIF result
(see Appendix I) was between 1.85 and 3.54 (< 10), and there were no substantial
correlations (R>0.9) between predictors.
Table 6-37 Model fit for organizational support
Model R R Square
Adjusted R
Square
S.E. of the
Estimate
Durbin-
Watson
H1 Online knowledge and information 0.79 0.62 0.61 0.74 1.54 H2 Work using online system/network 0.74 0.54 0.54 0.81 1.46 H3 Share and exchange information 0.75 0.56 0.56 0.80 1.77 H4 Participate in online learning 0.60 0.36 0.35 1.09 1.35 H5 Participate in workgroup activities 0.67 0.46 0.45 0.87 1.58
Table 6-38 ANOVA for organizational support Model Sum of Squares df Mean Square F Sig.
H1 Regression 212.56 3 70.85 130.96 0.00
Residual 130.93 242 0.54
Total 343.48 245
H2 Regression 191.29 3 63.76 96.29 0.00
Residual 160.25 242 0.66
Total 351.53 245
H3 Regression 195.18 3 65.06 103.01 0.00
Residual 152.84 242 0.63
Total 348.02 245
H4 Regression 160.30 2 80.15 67.22 0.00
Residual 289.73 243 1.19
Total 450.02 245
H5 Regression 154.46 2 77.23 101.25 0.00
Residual 185.36 243 0.763
Total 339.83 245
In model H1, 62% of the observed variability in accessing online knowledge and
information is explained by the 3 independent variables. The adjusted R2 is 61% and the
observed value of 0.79 indicates that the linear regression model predicts well.
In model H2, 54% of the observed variability in work using the online system/network
is explained by the 3 independent variables. The adjusted R2 is 54% and the observed
value of 0.74 indicates that the linear regression model predicts moderately.

147 | P a g e
In model H3, 56% of the observed variability in sharing and exchanging information is
explained by the 3 independent variables. The adjusted R2 is 56% and the observed
value of 0.75 indicates that the linear regression model predicts moderately.
In model H4, 36% of the observed variability in participating in e-learning is explained
by the 2 independent variables. However, the adjusted R2 is 35% and the observed value
of 0.60 indicates that the linear regression model predicts poorly.
In model H5, 46% of the observed variability in participating in workgroup activities is
explained by the 2 independent variables. The adjusted R2 is 45% and the observed
value of 0.67 indicates that the linear regression model predicts moderately.
6.11.2 Multiple Regression – Promotive Interactions
Table 6-39 demonstrates the fit of the model and provides the value of R, R2 and the
adjusted R2. Table 6-40 shows the ANOVA in construct promotive interaction. There
was no problem with multicollinearity as the tolerance level was > 0.1, the VIF result
(see Appendix I) was between 1.00 and 3.69 (< 10), and there were no substantial
correlations (R>0.9) between predictors.
Table 6-39 Model fit for promotive interactions
Model R R Square
Adjusted R
Square
S.E. of the
Estimate
Durbin-
Watson
H1 Online knowledge and information 0.74 0.55 0.55 0.80 1.64 H2 Work using online system/network 0.75 0.56 0.56 0.80 1.89 H3 Share and exchange information 0.75 0.56 0.56 0.80 1.73 H4 Participate in online learning 0.61 0.37 0.36 1.08 1.31 H5 Participate in workgroup activities 0.71 0.51 0.50 0.83 1.65

148 | P a g e
Table 6-40 ANOVA for promotive interactions Model Sum of Squares df Mean Square F Sig.
H1 Regression 188.85 1 188.85 298.00 0.00
Residual 154.63 244 0.63
Total 343.48 245
H2 Regression 197.20 2 98.60 155.25 0.00
Residual 154.33 243 0.64
Total 351.53 245
H3 Regression 193.62 1 193.62 305.97 0.00
Residual 154.40 244 0.63
Total 348.02 245
H4 Regression 164.98 1 164.98 141.22 0.00
Residual 285.04 244 1.17
Total 450.02 245
H5 Regression 171.44 2 85.72 123.71 0.00
Residual 168.38 243 0.69
Total 339.83 245
In model H1, 55% of the observed variability in accessing online knowledge and
information is explained by the 1 independent variable. The adjusted R2 is 55% and the
observed value of 0.74 indicates that the linear regression model predicts moderately.
In model H2, 56% of the observed variability in work using the online system/network
is explained by the 2 independent variables. The adjusted R2 is 56% and the observed
value of 0.7 indicates that the linear regression model predicts moderately.
In model H3, 56% of the observed variability in sharing and exchanging information is
explained by the 1 independent variable. The adjusted R2 is 56% and the observed value
of 0.75 indicates that the linear regression model predicts moderately.
In model H4, 37% of the observed variability in participating in e-learning is explained
by the 1 independent variable. However, the adjusted R2 is 36% and the observed value
of 0.61 indicates that the linear regression model predicts poorly.
In model H5, 51% of the observed variability in participating in workgroup activities is
explained by the 2 independent variables. The adjusted R2 is 50% and the observed
value of 0.71 indicates that the linear regression model predicts moderately.

149 | P a g e
6.11.3 Multiple Regression – Positive Interdependence
Table 6-41 demonstrates the fit of the model and provides the value of R, R2 and the
adjusted R2. Table 6-42 shows the ANOVA in construct positive interdependence.
There was no problem with multicollinearity as the tolerance level was > 0.1, the VIF
result (see Appendix I) was between 1.67 and 3.69 (< 10), and there were no substantial
correlations (R>0.9) between predictors.
Table 6-41 Model fit for positive interdependence
Model R R Square
Adjusted R
Square
S.E. of the
Estimate
Durbin-
Watson
H1 Online knowledge and information 0.82 0.67 0.66 0.69 1.80 H2 Work using online system/network 0.81 0.66 0.66 0.70 1.81 H3 Share and exchange information 0.83 0.69 0.68 0.67 2.02 H4 Participate in online learning 0.68 0.46 0.46 1.00 1.44 H5 Participate in workgroup activities 0.72 0.52 0.51 0.82 1.68
Table 6-42 ANOVA for positive interdependence Model Sum of Squares df Mean Square F Sig.
H1 Regression 229.24 4 57.31 120.89 0.00
Residual 114.25 241 0.47
Total 343.48 245
H2 Regression 231.65 3 77.22 155.87 0.00
Residual 119.88 242 0.50
Total 351.53 245
H3 Regression 238.33 3 79.45 175.28 0.00
Residual 109.69 242 0.45
Total 348.02 245
H4 Regression 207.25 2 103.63 103.73 0.00
Residual 242.77 243 1.00
Total 450.02 245
H5 Regression 176.13 2 88.07 130.73 0.00
Residual 163.69 243 0.67
Total 339.83 245
In model H1, 67% of the observed variability in accessing online knowledge and
information is explained by the 4 independent variables. The adjusted R2 is 66% and the
observed value of 0.82 indicates that the linear regression model predicts well.
In model H2, 66% of the observed variability in work using the online system/network
is explained by the 3 independent variables. The adjusted R2 is 66% and the observed
value of 0.81 indicates that the linear regression model predicts moderately.

150 | P a g e
In model H3, 69% of the observed variability in sharing and exchanging information is
explained by the 3 independent variables. The adjusted R2 is 68% and the observed
value of 0.83 indicates that the linear regression model predicts well.
In model H4, 46% of the observed variability in participating in e-learning is explained
by the 2 independent variables. The adjusted R2 is 46% and the observed value of 0.58
indicates that the linear regression model predicts moderately.
In model H5, 52% of the observed variability in participating in workgroup activities is
explained by the 2 independent variables. The adjusted R2 is 51% and the observed
value of 0.72 indicates that the linear regression model predicts moderately.
6.11.4 Multiple Regression – Internal-External Learning
Table 6-43 demonstrates the fit of the model and provides the value of R, R2 and the
adjusted R2. Table 6-44 shows the ANOVA in construct internal-external learning.
There was no problem with multicollinearity as the tolerance level was > 0.1, the VIF
result (see Appendix I) was between 1.36 and 3.63 (< 10) and there were no substantial
correlations (R>0.9) between predictors.
Table 6-43 Model fit for internal-external learning
Model R R Square
Adjusted R
Square
S.E. of the
Estimate
Durbin-
Watson
H1 Online knowledge and information 0.82 0.67 0.66 0.69 1.80 H2 Work using online system/network 0.76 0.57 0.57 0.79 1.72 H3 Share and exchange information 0.80 0.63 0.63 0.73 1.94 H4 Participate in online learning 0.63 0.40 0.40 1.05 1.34 H5 Participate in workgroup activities 0.68 0.47 0.46 0.86 1.73

151 | P a g e
Table 6-44 ANOVA for internal-external learning
Model Sum of Squares df Mean Square F Sig.
H1 Regression 228.61 3 76.20 160.54 0.00
Residual 114.87 242 0.48
Total 343.48 245
H2 Regression 200.83 3 66.94 107.50 0.00
Residual 150.70 242 0.623
Total 351.53 245
H3 Regression 220.28 3 73.43 139.11 0.00
Residual 127.74 242 0.53
Total 348.02 245
H4 Regression 180.30 2 90.15 81.22 0.00
Residual 269.73 243 1.11
Total 450.02 245
H5 Regression 158.49 2 79.25 106.20 0.00
Residual 181.33 243 0.75
Total 339.83 245
In model H1, 67% of the observed variability in accessing online knowledge and
information is explained by the 3 independent variables. The adjusted R2 is 66% and the
observed value of 0.82 indicates that the linear regression model predicts well.
In model H2, 57% of the observed variability in work using the online system/network
is explained by the 3 independent variables. The adjusted R2 is 57% and the observed
value of 0.76 indicates that the linear regression model predicts moderately.
In model H3, 63% of the observed variability in sharing and exchanging information is
explained by the 3 independent variables. The adjusted R2 is 63% and the observed
value of 0.80 indicates that the linear regression model predicts well.
In model H4, 40% of the observed variability in participating in e-learning is explained
by the 2 independent variables. The adjusted R2 is 40% and the observed value of 0.63
indicates that the linear regression model predicts moderately.
In model H5, 47% of the observed variability in participating in workgroup activities is
explained by the 2 independent variables. The adjusted R2 is 46% and the observed
value of 0.68 indicates that the linear regression model predicts moderately.

152 | P a g e
6.11.5 Multiple Regression – Perceived Effectiveness
Table 6-45 demonstrates the fit of the model and provides the value of R, R2 and the
adjusted R2. Table 6-46 shows the ANOVA in construct perceived effectiveness. There
was no problem with multicollinearity as the tolerance level was > 0.1, the VIF result
(see Appendix I) was between 1.00 and 3.59 (< 10), and there were no substantial
correlations (R>0.9) between predictors.
Table 6-45 Model fit for perceived effectiveness
Model R R Square
Adjusted R
Square
S.E. of the
Estimate
Durbin-
Watson
H1 Online knowledge and information 0.86 0.74 0.74 0.61 1.85 H2 Work using online system/network 0.77 0.60 0.60 0.76 1.78 H3 Share and exchange information 0.83 0.69 0.68 0.67 2.01 H4 Participate in online learning 0.65 0.42 0.41 1.04 1.37 H5 Participate in workgroup activities 0.69 0.48 0.48 0.85 1.57
Table 6-46 ANOVA for perceived effectiveness
Model Sum of Squares df Mean Square F Sig.
H1 Regression 253.53 3 84.51 227.35 0.00
Residual 89.95 242 0.37
Total 343.48 245
H2 Regression 210.25 1 210.25 363.10 0.00
Residual 141.28 244 0.58
Total 351.53 245
H3 Regression 238.93 2 119.47 266.13 0.00
Residual 109.09 243 0.45
Total 348.02 245
H4 Regression 188.15 2 94.08 87.30 0.00
Residual 261.87 243 1.08
Total 450.02 245
H5 Regression 163.16 1 163.16 225.36 0.00
Residual 176.66 244 0.72
Total 339.83 245
In model H1, 74% of the observed variability in accessing online knowledge and
information is explained by the 3 independent variables. The adjusted R2 is 74% and the
observed value of 0.86 indicates that the linear regression model predicts well.
In model H2, 60% of the observed variability in work using the online system/network
is explained by the 1 independent variable. The adjusted R2 is 60% and the observed
value of 0.77 indicates that the linear regression model predicts well.

153 | P a g e
In model H3, 69% of the observed variability in sharing and exchanging information is
explained by the 2 independent variables. The adjusted R2 is 68% and the observed
value of 0.83 indicates that the linear regression model predicts well.
In model H4, 42% of the observed variability in participating in e-learning is explained
by the 2 independent variables. The adjusted R2 is 41% and the observed value of 0.65
indicates that the linear regression model predicts moderately.
In model H5, 48% of the observed variability in participating in workgroup activities is
explained by the 1 independent variable. The adjusted R2 is 48% and the observed value
of 0.69 indicates that the linear regression model predicts moderately.
6.11.6 Multiple Regression – Perceived Usefulness
Table 6-47 demonstrate the fit of the model and provides the value of R, R2 and the
adjusted R2. Table 6-48 shows the ANOVA in construct perceived usefulness. There
was no problem with multicollinearity as the tolerance level was > 0.1, the VIF result
(see Appendix I) was between 1.75 and 6.39 (< 10) and there was no substantial
correlations (R>0.9) between predictors.
Table 6-47 Model fit for perceived usefulness
Model R R Square
Adjusted R
Square
S.E. of the
Estimate
Durbin-
Watson
H1 Online knowledge and information 0.83 0.68 0.68 0.67 1.82 H2 Work using online system/network 0.77 0.59 0.59 0.77 1.94 H3 Share and exchange information 0.80 0.64 0.64 0.72 1.97 H4 Participate in online learning 0.64 0.40 0.40 1.05 1.42 H5 Participate in workgroup activities 0.71 0.51 0.50 0.83 1.71
Table 6-48 ANOVA for perceived usefulness
Model Sum of Squares df Mean Square F Sig.
H1 Regression 234.62 4 58.66 129.85 0.00
Residual 108.87 241 0.45
Total 343.48 245
H2 Regression 207.05 2 103.53 174.12 0.00
Residual 144.48 243 0.60
Total 351.53 245
H3 Regression 222.60 2 111.30 215.64 0.00
Residual 125.42 243 0.52
Total 348.02 245
H4 Regression 181.94 2 90.97 82.46 0.00
Residual 268.08 243 1.10
Total 450.02 245
H5 Regression 173.28 3 57.76 83.93 0.00
Residual 166.54 242 0.69
Total 339.83 245

154 | P a g e
In model H1, 68% of the observed variability in accessing online knowledge and
information is explained by the 4 independent variables. The adjusted R2 is 68% and the
observed value of 0.83 indicates that the linear regression model predicts well.
In model H2, 59% of the observed variability in work using the online system/network
is explained by the 2 independent variables. The adjusted R2 is 59% and the observed
value of 0.77 indicates that the linear regression model predicts moderately.
In model H3, 64% of the observed variability in sharing and exchanging information is
explained by the 2 independent variables. The adjusted R2 is 64% and the observed
value of 0.80 indicates that the linear regression model predicts well.
In model H4, 40% of the observed variability in participating in e-learning is explained
by the 2 independent variables. The adjusted R2 is 40% and the observed value of 0.64
indicates that the linear regression model predicts moderately.
In model H5, 51% of the observed variability in participating in workgroup activities is
explained by the 3 independent variables. The adjusted R2 is 50% and the observed
value of 0.71 indicates that the linear regression model predicts well.
6.11.7 Regression Models
All the predictors were entered into the regression to determine which predictors
contributed significantly to the CNL model (results shown in Appendix I). All
predictors that had low significance (p>0.05) were identified for removal. This study
adopts Field’s (2005) recommendation to rerun the analysis to include only the
important predictors and use the resulting parameter estimates to define the regression
model. The result is shown in Appendix J and was used to build the models H1-H5 in
Figures 6-16, 6-17, 6-18, 6-19 and 6-20. The results of the estimates were also
discussed in the previous sections from 6.11.1 to 6.11.6.
Path analysis technique entails the use of a causal model and examines the pattern of
relationships between variables as an extension of multiple regression procedures

155 | P a g e
(Bryman et al., 2005). The purpose is to provide quantitative estimates of the causal
relationships between a set of variables. In this study the pivotal role of the regression
model illustrates the significance of the constructs that constitute the antecedents of
CNL (as shown in Figures 6-16, 6-17, 6-18, 6-19 and 6-20). The beta (β) value
measures how strongly each predictor (independent) variable influences the criterion
(dependent) variable. The β value is measured in units of standard deviation. If the
absolute value of β is high, the more important the variable is in predicting the outcome.
The higher the β value the greater the impact of the predictor variable on the criterion
variable. Only predictors with high significance were maintained in the models after
stage two of the analysis (see Appendix K) and were completed as recommended by
Field (2005). Interestingly, all the independent variables were positively correlated with
the dependent variable CNL.
Figure 6-16 shows the regression model for H1 “Access information online”.
Figure 6-15 Regression model H1 – Access information online

156 | P a g e
The independents variables and constructs were identified and they strongly supported
dependent variable CNL for model H1. Predictors B2 (sig. =7.95), C1 (sig.=1.65, C4
(sig. =0.18), C5 (sig. =0.82), D2 (sig. =0.11), E3 (sig. =0.16), F2 (sig. =0.05), F3 (sig.
=0.17), and G3 (sig. =0.74) were removed because of low significance (p> 0.05).
Independent variable C3 “Job requires to share ideas, work and information” (β = 74%,
t= 17.26, sig = 0.01) was the strongest predictor for H1 “Access information online”.
Figure 6-17 shows the regression model for H2 “Work using the online system or
network”.
Figure 6-16 Regression model H2 – Work using online system/network
The independents variables and constructs were identified and they moderately
supported CNL for model H2. Predictors B5 (sig. =0.05), C4 (sig.=0.13), C5 (sig.
=0.38), D3 (sig. =0.24), D5 (sig. =0.05), E3 (sig. =0.17), F1 (sig. =0.33), F2 (sig.
=0.22), F4 (sig. =0.25), F5 (sig. =0.06), G1 (sig. = 0.17), G2 (sig =0.05), and G3 (sig.
=0.09) were removed because of low significance (p > 0.05). Independent variable F3
“Use of computer to share information” (β = 77%, t= 19.06, sig = 0.01) was the
strongest predictor for H2 “Work using online system or network”.

157 | P a g e
Figure 6-18 shows the regression model for H3 “Sharing and exchanging online
information”.
Figure 6-17 Regression model H3 – Share and exchange online information
The independent variables and constructs were identified and they strongly supported
CNL model H3. Predictors B2 (sig. =0.79), C1 (sig.=0.19), C4 (sig. =0.37), C5 (sig. =
0.12), D1 (sig. =0.21), D3 (sig. =0.51), E3 (sig. =0.09), F2 (sig. =0.42), F3 (sig. =0.28),
F4 (sig. =0.26), G1 (sig. = 0.16), G2 (sig =0.09), and G3 (sig. =0.66) were removed
because of low significance (p > 0.05). Again, the independent variable C3 “Job
requires to share ideas, work and information” (β = 75%, t= 17.49, sig = 0.01) was the
strongest predictor for H3 “Share and exchange information online”.
Figure 6-19 shows the regression model for H4 “Participate in online learning”.

158 | P a g e
Figure 6-18 Regression model H4 – Participate in online learning
The independent variables and constructs were identified and they moderately supported
CNL model H4. Predictors B2 (sig. =0.97), C1 (sig.=0.78), C4 (sig. =0.21), C5 (sig. =
0.16), D1 (sig. =0.35), D3 (sig. =0.64), D5 (sig. = 0.51), E1 (sig. =0.06), E5 (sig.
=0.53), F1 (sig. =0.19), F3 (sig. =0.77), F4 (sig. =0.46), G1 (sig. = 0.93), G2 (sig
=0.38), and G4 (sig. =0.24) were removed because of low significance (p > 0.05).
Again, independent variable C3 “Job requires to share ideas, work and information” (β
= 61%, t= 11.88, sig = 0.01) was the strongest predictor for H4 “Participate in online
learning”. However, the construct ‘organization support’ with adjusted R2=35% and the
observed value of 0.60, and ‘promotive interactions’ with adjusted R2=36% and the
observed value of 0.61 indicated that both constructs would predict poorly for online
learning participation.
Figure 6-20 shows the regression model for H5 “Participate in workgroup activities”.

159 | P a g e
Figure 6-19 Regression model H5 - Participate in workgroup activities
The independent variables and constructs were identified and they moderately supported
CNL model H5. Predictors B2 (sig. =0.11), B4 (sig.=0.06), C4 (sig. =0.14), C5 (sig. =
0.32), D1 (sig. =0.45), D2 (sig. =0.30), D3 (sig. = 0.76), E1 (sig. =0.12), E2 (sig.
=0.05), F1 (sig. =0.72), F2 (sig. =0.69), F3 (sig. =0.14), F4 (sig. =0.36), G3 (sig. =
0.51), and G4 (sig =0.48) were removed because of low significance (p > 0.05).
Independent variable F5 “Team produces quality collaborative work” (β = 69%, t=
15.01, sig = 0.01) was the strongest predictor for H5 “Participate in workgroup
activities”.
6.12 Summary
Descriptive statistics have clearly outlined the means between all variables and
differentiated those that were highly significant. The cross-tabulated results indicated
differences in engagement of CNL between MNCs and SMEs. Multiple regression
examined the relationships between all the independent variables with CNL. The
regression models shown in H1, H2, H3, H4 and H5 were used to construct a profile of
predictors (or antecedents) with high significance in relation to CNL. Results of the
statistical analysis are discussed in Chapter 8.

160 | P a g e
CHAPTER 7: QUALITATIVE DATA ANALYSIS
AND RESULTS
7.1 Introduction
This chapter presents findings from the semi-structured interviews and from the
analytical process of codification and interpretation of the qualitative data. The
qualitative data provided a rich source of information and insights into the participants’
experiences, thoughts, perceptions and opinions (Cameron et al., 2009). The analysis of
interview transcripts used in the content analysis sought to “quantify content in terms of
predetermined categories and in a systematic and replicable manner” (Bryman, 2008,
p.275). (Also see Cameron et al., 2009; Nardi, 2006). Similarly, de Laat et al. (2006b)
found that content analysis is the most commonly used method for studying networked
learning. Content analysis forms part of the quantitative-dominant mixed analyses
[QUAN qual], which believes the inclusion of qualitative data and approaches are
likely to enhance the findings (Onwuegbuzie et al., 2009).
Textual qualitative data was used to corroborate findings from the quantitative data.
Following Lally and De Laat’s (2002) recommendation that NVivo should be used for
coding and interpretation of CNL events and situations, NVivo was used for this study.
NVivo software provided the workspace for handling qualitative data, such as
organizing, sorting, classifying, searching and reporting. It provided a holistic view of
the study and a systematic approach to qualitative data organization and structuration.
The data was coded into themes that captured the overarching concept in textual data
and also the underlying factors that supported the research questions and propositions.
7.2 Restatement of the Research Questions
This study assumed that semi-structured interviews would provide reasonably sound
explanations and clarity to the phenomena and would answer the research questions.
Additionally, to achieve the purpose of the study, the following research questions were
addressed in the quantitative data analysis:

161 | P a g e
RQ1. What are the significant antecedents for a CNL model in manufacturing?
RQ2. How significant are the relationships between CNL and organizational support,
positive interdependence, promotive interaction, and internal-external learning?
RQ3. What are employees’ perceptions of CNL’s usefulness and effectiveness in
manufacturing?
RQ4. What are the differences between CNL for multinationals companies (MNCs)
and CNL for small medium enterprises (SMEs)?
7.3 Data Collection for Semi-Structured Interviews
Following the questionnaire surveys, semi-structured interviews were conducted with
11 participants randomly selected from various manufacturing organizations. The
participants were general managers (2), department managers (2), domain experts (5),
project leaders (1), and an assembly worker (1). Individual interviews were conducted at
various locations. According to Blaikie (2010) a semi-structured interview allows for
“interaction and provide greater insights into why certain opinions are held” (p.297).
The semi-structured interviews were designed to gather information that built on the
results from the analysis of the quantitative data and to strengthen the propositions with
descriptions of the phenomena.
The interview process was intentionally semi-structured, so that the researcher would
remain focused as to the objectives of the research and at the same time exercise
flexibility to explore further, drawing on answers to the questions. Hence, the actual
questions posed in the interviews did not necessarily match the proposed questions
word for word. In most cases, open-ended questions were asked. Asking open-ended
questions is a good way of finding out what participants think (Nardi, 2006). A
conversational style of interviewing was chosen rather than a descriptive question-
answer session to enable participants’ free-flow of information with clear examples
from past experiences.
With each participant’s agreement, interviews were digitally audio recorded. The study
sought to investigate any issues of interest that emerged from the quantitative analysis.
This approach was designed to improve the validity of the analysis. The questions had
been pilot-tested in an informal interview with three participants in order to ensure
clarity and understanding. Thereafter, the questions were simplified to remove
ambiguities.

162 | P a g e
7.4 Data Entry and Coding
According to Onwuegbuzie (2009), having a post-positivist orientation does not prevent
a pragmatist researcher from conducting qualitative analyses using content analysis that
involves the counting of words, codes, categories, or other aspects of the qualitative
data. Before codification, the transcriptions were checked against the voice recording
for accuracy and consistency. In order to gauge the general sense of the data, including
conversations with the participants in which they related their experience, impressions
and perceptions of CNL, marginal notations were made. The field notes contained
accounts of the interviews and were entered into NVivo.
Data coding was used to find themes and recurring patterns in the data for interpretation
and theoretical analysis. The central purpose of coding is to extract, generalise and
abstract from the complexity of the original data in order to find significant themes and
develop theories about the situation that illuminate it (Lally et al., 2002). The technique
follows the procedure set by Coffey and Atkinson (1996), who recommend the
generation of codes, frequent revisions of the coding, grouping of the codes,
development of categories and finally the development of themes from the data.
Relationships between specific contexts of CNL’s antecedents were identified and
expressed in codes. The transcripts in NVivo were coded into nodes and then trees, and
verified by an independent academician. Nodes were assigned to the transcripts based
upon semantic features, such as key concepts, expression of ideas, chain of argument,
and topics of discussions using the smallest unit, known as the unit of meaning (Chi,
1997). The categories were organized under a hierarchical structure as shown in
Appendix K.
Using a hierarchical structure was a useful way to illustrate relationships between the
nodes and the antecedents of CNL. Nodes organized the concepts in reference to both
the context of CNL and to the literature as a basis for the theoretical understanding of
the phenomena under study. The nodes were analysed and coded into categories and
sub-categories, included predetermined themes. The study employed ethnographic
content analysis in reference to the approach that emphasizes the role of the researcher
in the construction of meaning. This allowed categories to emerge out of the data and

163 | P a g e
enabled understanding of the meaning in the context (Bryman, 2008). As suggested by
Bogdan and Biklen (2003), the study recoded and refined the data into themes and re-
contextualised the data into key ideas. Analysis was directed by the constant
comparative method. The activity continued until “theoretical sufficiency” was
achieved, which led to theoretical generalizations (Diaz Andrade, 2009). As pointed out
by Diaz Andrade (2009) “theoretical sufficiency” (termed by Dey, 1999, p. 117) allows
the researcher “to build up and work upon constructs which emerge from the problem
under investigation” (p. 48).
7.5 Profile of Participants
This study followed the recommendation of Miles and Huberman (1994) in that it
achieved maximum variation in purposeful sampling by selecting 15 participants from
various manufacturing organizations across different functions (see Table 7-49).
WS_20001 was used for recording general information (memo) about the research.
Table 7-49 Demographic profile semi-structured interview (n=11)
Participants Age Gender Education Organization Department
WS_20002 20-29 Female Degree SME Quality
WS_20003 30-39 Male Masters MNC Production
WS_20004 40-49 Male Degree MNC Quality
WS_20005 40-49 Male Degree SME Engineering
WS_20006 30-39 Male Degree MNC Operations
WS_20007 30-39 Male Degree MNC Operations
WS_20008 40-49 Male STPM SME Management
WS_20009 30-39 Male Masters MNC Engineering
WS_20010 40-49 Male Degree SME Management
WS_20011 20-29 Female Diploma MNC Technical
WS_20012 30-39 Female SPM MNC Production
Eleven participants responded (response rate of 73%). All the participants were from
diverse manufacturing industries: 7 were from MNCs and 4 were from SMEs. Together,
they represented 8 different manufacturing organizations. All the participants were
given information about the research (see Appendix B).

164 | P a g e
7.6 Data Validity
Concurrent validity was assessed following semi-structured interviews with participants
in connection with their experiences in working and using CNL in their respective
manufacturing organizations. After transcribing the interviews, participants reviewed
the report and did not dispute the factual account presented by the researcher (Diaz
Andrade, 2009; Yin, 2003). Guba and Lincoln (1988) further propose four criteria for
judging the soundness of qualitative research. The results of qualitative research must
be credible from the perspective of the participant in the research. Interviews were
digitally audio recorded, transcribed using NVivo and checked for accuracy against the
original recording through repeated playbacks. The transcripts were also checked
against the context in which the participants made references in their conversations. The
completed transcriptions were sent to the interviewees for validation as a component of
reliability (Creswell, 2009; Kvale & Brinkman, 2009), and credibility data
trustworthiness (Keefer, 2010). Transferability is the degree to which the results of
qualitative research can be generalized or transferred to other contexts or settings.
According to Hoepfl (1997) transferability refers to the degree to which the findings of
an inquiry can be transferred or applicable to a new situation. Transferability is
promoted through the use of detailed findings, sufficient to “provide the data base that
makes transferability judgments possible on the part of potential appliers” (Lincoln et
al., 1985, p. 316). This study thoroughly describes the research context, process of data
collection and analysis that are central to the research. Dependability emphasizes the
need to account for dynamic context within the nature of the research. Studies which are
dependable exhibit the ability to adapt to changes in the research environment and the
ability to add new inputs over time during research (Hamberg et al., 1994).
Confirmability refers to the degree to which the results can be confirmed or
corroborated by others. Confirmability focuses on the neutrality of the findings which
are clearly extracted from the data, without influence of the researcher’s imagination
(Brown et al., 2002). The interview data was coded to provide criteria for gauging the
validity of the scales (Bryman, 2008).
7.7 Result of Content Analysis
The central purpose of content analysis was to generalize and extract from the
complexity of interview messages evidenced in CNL activities. Content analysis reveals

165 | P a g e
information and interaction patterns to be found below the surface of the transcripts
(Schrire, 2006a). The study used content analysis to identify the relationship between
specific contexts that are prevalent in CNL’s antecedents.
7.7.1 Question Categories
Table 7-50 illustrates the question categories that guided the interview questions and led
to obtaining the codes. Question categories were also designed to ensure the researcher
stayed focused on the research questions (RQ) in section 7.2.
Table 7-50 Question categories
Interview Questions Categories
Q1.Do you use any CNL system? Collaborative networked learning; collaborative technologies
Q2. What is your purpose in using a CNL system and tool?
Promotive interaction; positive interdependence; internal-external learning
Q3. How extensive is the use of CNL in the organization? Organizational support; promotive interaction; positive interdependence; internal-external learning; perceived effectiveness; perceived usefulness
Q4. What motivates or demotivates the company to implement CNL?
Organizational support
Q5.Could you share your experience in using any of the CNL systems and tools?
Organizational support; promotive interaction; positive interdependence; internal-external learning; perceived effectiveness; perceived usefulness
Q6. Why do you perceive that the present CNL system is effective or ineffective?
Organizational support; perceived effectiveness
Q7. Why do you perceive that the present CNL system is useful or otherwise?
Organizational support; perceived usefulness
Q8. How can the present CNL system be improved to make it more useful?
Organizational support; perceived usefulness
Q9. Why do you think CNL has or has not contributed towards helping you complete your daily tasks or project?
Promotive interaction; positive interdependence; internal-external; perceived effectiveness; perceived usefulness
The questions were designed to extract a wide array of information from the
participants, without being limited to a single category of construct. For instance,
question Q3 “how extensive is the use of CNL in your organization?” was designed as
an open question which would enable participants to relate their experience in using any
of the collaborative systems or tools for learning. The researcher then coded the
contexts in relation to organizational support, promotive interaction, positive
interdependence, internal-external learning, perceived effectiveness and perceived
usefulness.
7.7.2 Hierarchical Coding Scheme
Veldhuis-Diermanse (2002) developed a coding schema for investigating group learning
activities, while De Laat and Lally (2004) adapted the schema for their research on

166 | P a g e
asynchronous networked learning. However, the schema is irrelevant in this study
because it focuses on the outcome of learning and not the antecedents of CNL.
Therefore, the study had to develop a new coding schema for CNL. Table 7-51 shows
the hierarchical coding scheme that was developed, with consideration to the research
questions in section 7.2.
Table 7-51 Hierarchical coding scheme
T: Organizational support (1646)
C:Infrastructure and Systems (719) C:Functions and Capabilities
(749)
C:People (160)
C:Application system and
collaborative technology (161)
C:Enterprise system (283)
C:Global system (101)
C/nd.: Hardware (38)
nd.:Amorplus(7) nd.:Work instruction(43) nd.: Accardin(8) nd.:Accessible(64) nd.: IT and technical (57) nd.:AutoCad(15) nd.:Schematics(35) nd.:eCATS(17) nd.:Analysis(50)
nd.:Chat room(8) nd.:Doc con system(27) nd.:MES(16) nd.:Automatic(50)
nd.:Email(25) nd.:ECM(43) nd.: MyTech(9) nd.:Communication (23)
nd.:E-Bulletin(8) nd.:ERP or MRP(79) nd.:PDM(33) nd.:Feedback(33)
nd.:Lotus(7) nd.:Linkage(58)
nd.:Netmeeting(8) nd.:Monitoring(32) nd.: Management (40)
nd.:Sharepoint(8) nd.:Notification(42)
nd.:Video-conf(8) nd.:Online(50)
nd.:Spreadsheet(30) nd.:Real-time(25)
nd.:Shared drive(19) nd.:Recording(34)
nd.:Shared folder(34) nd.:Reporting(42)
nd.:Others(14) nd.:Revising(33) nd.:Peers (23)
nd.:Archiving(43)
nd.:Synthesis(35)
nd.:Triggering(35)
nd.:Updating(52)
T:Promotive Interaction (980)
C:With system (612) C:With people (309)
nd.:Checking (59) nd.:Engaging (59)
nd.:Developing (40)
nd.:Dispositioning (52)
nd.:Evaluating (43) nd.:Learning (52)
nd.:Extracting (52)
nd.:Generating (59)
nd.:Implementing (25) nd.:Meeting (59)
nd.:Programming (17)
nd.:Revising (27)
nd.:Transacting (49) nd.:Sharing (66)
nd.:Updating (66)
nd.:Uploading (50)
T:Positive Interdependence (480)
C/nd.:Collaborating (50)
C/nd.:Cooperating (43)
C:Exchanging (96) C:Sharing (241)
nd.:Exporting (35) nd.:Between department (66)
nd.:Importing (0) nd.:Between peer (59)
nd.:Both (18) nd.:Between sites (50)
T:Internal-External Learning (123)
C/nd.: External learning (35) C/nd.: Internal learning (44)
T:Perceived Effectiveness & Usefulness (373)
C/nd.: Useful (77) C/nd.: Effective (65) C/nd.: Relevant (65) C/nd.: Ease of use (82)
T: Themes; C: Categories; C/nd.: Categories & nodes; nd.: nodes

167 | P a g e
Queries were used to question the data and find patterns through the contexts and nodes.
Text queries searched for words and phrases about CNL and other concepts that related
to it. To ensure accuracy of the coding, the researcher avoided using auto-coding in
NVivo. Instead, the researcher used his knowledge and experience to code the data. The
result of content analysis is shown in Appendix K. The themes supported the research
objectives, and the codes supported the themes.
Relevant themes from the data were extracted and arranged in a hierarchy and their
precise meaning was documented (Glaser & Strauss, 1967). The main categories for the
theme of organizational support were infrastructure and system (nd. =719), application
system and collaborative technologies (nd. =161), enterprise systems (nd. =283), global
systems (nd. =101), hardware (nd.=38), functions and capabilities (nd.=749) and people
(nd.=160). The main categories for promotive interactions were system (nd.=612), and
people (nd.=309). The main categories for positive interdependence were collaborating
(nd.=50), cooperating (nd.=43), exchanging (nd.=96), and sharing (nd.=241). The main
categories for internal-external learning were internal learning (nd.=44) and external
learning (nd.=35). The main categories for perceived usefulness and effectiveness were
useful (nd.=77), effective (nd.=65), relevant (nd.=65) and ease of use (nd.=82).
Organizational support (nd.=1646) emerged as a predominant theme, followed by
promotive interactions (nd.=980), and positive interdependence (nd.=480). Perceived
effectiveness and usefulness (nd.=373) were grouped as one because participants
frequently related both into a single inference or context in their conversations. Internal-
external learning (nd.=123) was the least frequent. Participants felt more comfortable in
relating their experience and perception of CNL than expressing whether learning was
internally or externally oriented. Out of 75 codes identified from the transcripts, the
most frequently mentioned concepts were: ease of use (nd.=82), ERP/MRP (nd.=79),
useful (nd.=77), updating (nd.=66), sharing (nd.=66), between departments (nd.=66),
effective (nd.=65), relevant (nd.=65), and accessible (nd.=64).

168 | P a g e
7.7.3 Contributions from Individual Participants
Table 7-52 shows the number of nodes and references coded from the transcripts. The
number of nodes and references were dependent upon participants’ ability to provide
breadth and depth of information in the context of CNL.
Table 7-52 Nodes and references to participants (n=11)
Participants Organization Department Nodes (nd.) References (ref.)
WS_20002 SME Quality 3 27
WS_20003 MNC Production 61 1225
WS_20004 MNC Quality 76 1780
WS_20005 SME Engineering 46 735
WS_20006 MNC Operations 61 1136
WS_20007 MNC Operations 53 981
WS_20008 SME Management 32 457
WS_20009 MNC Engineering 86 1704
WS_20010 SME Management 31 420
WS_20011 MNC Technical 75 1360
WS_20012 MNC Production 5 20
Participant WS_20009, a MNC product engineer, was able to provide many insights
(nd.=86, ref.=1704) into the use of collaborative technology and how the systems and
tools are used in product development. Participant WS_20004, a MNC’s quality
manager, also was able to relate his experience (nd.=76, ref.=1780). However,
participant WS_20012, also from a MNC organization, could not relate much about
CNL (nd.=5, ref.=20) as she was not given access to a computer network for learning
and sharing information, or even a computer network for other needs, due to her role as
a production assembler. Similarly, participant WS_20002 (nd.=3, ref.=27), a quality
officer from a SME organization, faced the same challenge of not being provided with
support for CNL in her role. She could not relate knowledge or experience of CNL.
Ironically, participant WS_20008 (nd.=32, ref.=457), a senior manager in a local SME,
was able to share his understanding and knowledge of CNL, even though the
implementation of CNL was not extensive in his organization and far from being
mature.

169 | P a g e
7.8 Results of Textual Contexts
Semi-structured interviews allowed the researcher to plan retrospectively, recalling
issues and gaps in the survey questionnaire that could further improve the reliability and
validity of the study. The study followed the suggestion of Atkinson and Delamont
(2008) that “the analysis of the spoken language remains firmly embedded in studies of
organizational context, process of socialisation, routine of work, personal
transformation, people processing, and so forth” (p.291). The interview questions in
Table 7-50 were specifically designed to relate the responses to the operationalized
objectives. Needless to say, participants were encourage to discuss issues openly and
share their experience and understanding to include all other relevant details that may or
may not have been part of the questions asked. The role of the ethnographic researcher
is to lead the participants to provide rich information to the context of their experience
(Atkinson & Delamont, 2008).
7.8.1 Organizational Support
Different organizations, regardless of size and type, offer different support for CNL.
The question posed to the participants about their experiences in using communications
and collaborative technology was necessary in order to differentiate between those who
were using CNL systems and those who were not. In order to facilitate an environment
for CNL, ideally each and every employee has to be provided with ease of access to a
computer network and a wide variety of application-based services that include the
Intranet and/or Internet. The study found that most manufacturing organizations used
emails for communication and information sharing, Netmeeting (as described by
participant WS_20009), bulletin boards or chat rooms and other forms of asynchronous
and synchronous collaborative tools.
“Email is our number one tool, then the Internet communicator. For formal
and informal communication is the email. For informal communication is
the Internet communicator (for chatting). Those are the two most important
communication tools.” (WS_20009).
It was also found that most participants from MNCs had some experience using some
form of online learning, sharing information through chat rooms (e.g. Netmeeting), and
downloading documents from shared folders or posting forum messages in bulletin

170 | P a g e
boards seeking for problem resolution. Most production operators or assemblers from
MNCs were given access to emails and/or shared folders.
Furthermore, this study found that MNCs support enterprise information systems (EIS),
such as enterprise resource planning (ERP) which integrates manufacturing information
plus critical-to-operations supply chain modules including finance/accounting;
manufacturing and inventory management; customer relationship management (CRM);
human resources management (HRM); and purchasing/procurement across the entire
organization. This facilitates the flow of information between all business functions
within the organization as well as establishing information connections with key
external stakeholders such as customers, suppliers, subsidiaries and partners (Basu &
Wright, 2005). IT applications of ERP/MRP and data communications allow agile
manufacturing to achieve time reductions and quality improvement in product design
and development (Cao & Dowlatshahi, 2005). The ERP/MRP proliferates information
involving manufacturing resources in the organization’s efforts to collaborate across
organizations. Nonetheless, the ERP/MRP systems are widely used among large
manufacturing organizations, and more so by MNCs than SMEs. Due to the complexity
of the business environment, MNCs tend to complement the use of ERP/MRP with
other application software such as a manufacturing electronics system (MES), product
database management (PDM), as experienced by participant WS_20009, or eCATS
(electronic Corrective Action Tracking System), as experienced by participant
WS_20007. Unlike the ERP/MRP, dedicated application software such as MES, PDM
and MyTech are often used within specific department(s) rather than enterprise-wide. In
the case of participant WS_20009, PDM was being used extensively to perform daily
tasks or projects.
“The ERP system is currently in place. Then we have the MES
(Manufacturing Electronics System) to run production. In the future we will
have the SAP6 system. For Engineering we have a separate system called
the PDM (Product Database Management) for managing engineering
drawing. We used email everyday, everyhour and constantly.” (WS_20009).
Likewise, no single system caters for all uses. Most organizations run multiple systems
simultaneously and a large amount of data is transmitted between systems from
6 Founded in 1972, SAP is a highly integrated business system designed to support organizations and
provide collaborative business solutions for all types of industries.

171 | P a g e
different platforms or operating systems. This requires strong organizational support,
the provision of IT infrastructures, and software and hardware to facilitate and sustain
the system’s complexity and diversity. Thakkar, Kanda and Deshmukh (2011) in their
case studies involving SMEs also found that high investment required for purchase and
maintenance hinders SMEs from adopting ERP/MRP systems. They also found that the
inventory management in SMEs is ad-hoc and is not supported by some well-proven
strategies like the demand-pull system. Instead, most of these organizations use simple
and cost effective application tools readily available in the market, such as Microsoft
Excel for planning and scheduling (as described by participant WS_20010).
“At present, production is only using (Microsoft’s) Excel printout for
communication, work orders, etc. MRP is Excel and Excel is MRP.”
(WS_20010)
Likewise, participant WS_20004 said that expensive software was not necessary for
CNL. He felt that simple applications such as email and shared folders could serve the
purpose of communicating, collaborating and sharing information, vital for operations
with proper management and control.
“I think the best is email, then the shared folders and the data repository so
that anybody can access to the folders and information. But only to those
authorized and that is how we share”.(WS_20004)
The notion of expensive systems to promote CNL is problematical. It was found that
most SMEs have neither the financial means nor the resources to implement elaborate
systems. Suffice to say, most SMEs adapt and adopt CNL at a much smaller scale.
“Besides, we don't use Microsoft. Instead, we used Open Office
applications, or open source software. Save a lot of money, but not too sure
about the security.” (WS_20005)
“(About the R&D centre) We haven't decided. We don't know what to do.
But they introduced some modelling software and it is very costly.”
(WS_20005).
Like any system, information sharing and learning needs controls to handle different
levels of authorization (WS_20005). Management will determine employees’
accessibility to available ICT and CNL resources. Employees are authorized to access
resources and information required for them to perform their work.

172 | P a g e
“We share information through the system. But not every information is
accessible, depending on the types of information and the level of
authorization. We got SAP as a primary means of information management.
We have shared folders. We have Lotus Notes and its sub-programs.”
(WS_20005)
“We use share drive to share all our information. Secondly, we have the
Mytech system, which we can use to obtain updated information, example,
output, yield, etc.,...the WIP.” (WS_20003)
A similar question of interest is to understand whether CNL is widely proliferated and
useful to all employees regardless of their roles and positions in an organization. Ashton
(2004) found that organizational support influences learning and access to learning with
a differential impact on employees’ position and status within an organization. The
hierarchical structuring of relationships produces uneven learning opportunities and
access to knowledge within the organization (Ashton, 2004; Billett, 2001). In this study,
organizational knowledge and its resources were easily available to senior staff and
engineers but limited for support and clerical staff. Participant WS_200012 explained
that not all production operators in MNCs needed access to information in the network.
“Operator is different from... just does whatever we are told to do.
Computer is more (relevant) for supervisors or line leaders. They need it
more than us (production operators)” (WS_20012).
What is interesting is that participant WS_20012’s statement above demonstrates that
not all employees in MNCs have the privilege to use ICT or are provided with network
access. Evidently, not all MNC organizations provide organizational support for all
employees to access information in the network. Those who have access to the network
use it for updating data into the system or obtaining online work instructions critical to
perform their jobs.
This study found that SMEs recognize the importance of using better systems or tools
for planning and scheduling. All the SME organizations that provided participant
interviews had plans to deploy some form of ERP/MRP system in the long term.
Participants WS_20010 optimistically declared:
“We are going to use an ERP system. Currently, we have started with work
scheduling, work orders and sales orders modules. We have been using
Company C’s accounting system and it’s in the pipeline to implement their
ERP software. At present, we are not using any ERP system. Only software
173 | P a g e
available is for accounting and Sales. We are using EBS (Enterprise
Business System).”(WS_20010)
Most SMEs face barriers and limitations in implementing a complete system. It is also
interesting to note that the Accounts Department would normally be the first to
implement new application software, specifically for accounting purposes. In the case of
WS_20010, the Accounts Department had been using UBS for quite some time before
deciding to expand the use across the company. Upon closer examination, cost was
usually the main factor which hindered the implementation (WS_20008).
“We do use Microsoft Excel and some AutoCAD. Accounts uses a specific
accounting software (UBS Accounting)7. Production Planning still using
Excel sheets but we do have plan to use dedicated software but it is
expensive. Actually, we have bought the software (UBS Inventory
Management) but we have yet to use it.” (WS_20008).
“It is competitive and price factor is the main driver because renowned
software like Oracle is extremely expensive.” (WS_20010)
On the other hand, it has to be asked if SMEs have the resources and support to
implement CNL. It was found that most SMEs have limited IT resources or staff need to
effectively plan, deploy and sustain a new system.
“We are already delayed this project (ERP implementation) for a year. We
started a year ago and hired an IT manager, taking care of IT system. I
cannot handle the project by myself and lose focus on production.
.”(WS_20010)
It was found that training and support services play a vital role in ensuring CNL
resources are being used effectively. Collaborative technology needs to be upgraded
from time to time or evolved to meet business objectives as well as to ensure knowledge
and information is effectively managed and widely disseminated across the
organization.
What motivates or demotivates a company to implement CNL? This question is relevant
to senior managers in the organization, who hold leadership positions and
7 UBS is locally developed software with more than 135,000 SME users for accounting; inventory and
billing; payroll and human resources; point of sales (POS), etc.

174 | P a g e
responsibilities for decision making in regard to investment in IT infrastructure. One
senior manager in a SME organization (WS_20010) described how his company
continued to evolve and upgrade its enterprise system.
“Actually this (software) company is still new, not really stable; currently
they are upgrading the thing (software). Previously we used for accounting
and their support and service has been good. When they came up with an
ERP system, the company’s Managing Director who is also close with the
software company said we should engage their service.” (WS_20010).
The decision to deploy or upgrade any enterprise system solely relies upon the owner(s)
or key shareholder(s) of the SMEs organization. The relationship with the software
developer or vendor is based on trust and long-term partnership. Clearly price plays a
pivotal role in the decision making process. MNCs on the other hand, rely on
professional opinions and decisions made by managers, in particular from an IT
background.
The senior manager in a SME (WS_20010) was optimistic about the prospect of
engaging more knowledge workers to further improve business vitality. The participant
expressed hope that the new technical staff would bring change to the company for
future expansion.
“I wanted to hire Process Engineers. Currently we have the QC (quality
control) team. I think it is time we should hire Process Engineers. Actually,
I got about 7 to 8 production executives. We have regular production
meeting to share information, and we are using email quite a
lot.”(WS_20010)
The process engineers would seek opportunities for process improvements in the
manufacturing operations, reducing wastages and improving efficiency. He expected the
process engineers to engage actively in learning, collecting and analysing data, and
collaborating within the organization as well as with the customers for further
improvements.
Even post implementation presents itself as a challenge to most organizations. Many
organizations use different systems for different purposes, the integration and exchange
of data between these systems requiring extensive customization and programming.
MNCs are constantly looking for opportunities to improve and to integrate. In the case

175 | P a g e
of WS_20009, the organization had decided to implement SAP in order to integrate
different types of data and information into an enterprise system.
“However, there is problem with contradictions of data. We have JD
(Edwards) and also MES (Manufacturing Electronics System). These two
systems function as manufacturing tool to drive materials but they do not
inform finance the cost of materials. MES, which is manufacturing
electronics system plays a bigger role from inventory right up to finances.
Without either system the plant is at a standstill. That is why we are
implementing SAP, which is one tool, one stop center, integrate all the
dicrepancies or the gaps between the two systems. Right up from inventory,
inputs, to the output of sales and finance. That is the long term plan for the
company.” (WS_20009).
It has been claimed that constant upgrading is not only costly; it affects the motivation
and quality of work. Employees need to be trained and retrained whenever new systems
are introduced into organizations. New systems deployment often requires meticulous
planning, including large data migration and integration. More resource hours are
needed for the initial stage of the deployment, which may take months to complete.
“We spend RM30million for that. A lot of improvements are expected, and
suddenly we need to change. We need to do a lot of improvements. We need
people to key-in the data. At the beginning, we need more people and after
that they will get used to it. We try to reduce quite a number (of staffs)
especially from the IT. There is an increased of workloads for the
operators” (WS_20005)
“I thought the analysis part helps. Like pricing and costing; we can shorten
a lot of time for costing, but the amount of transactions is killing us.”
(WS_20005)
System integration is ideal yet costly, particularly for SMEs. In the case of WS_20005,
linking all the factories would help to support CNL through information sharing. Again,
a massive project requires substantial financial investment and strong organizational
support from the management.
“We want to make full use of the information like what we used in the Lotus,
we can get it from the SAP system, but linking up could be costly… in the
end it will benefit the company.” (WS_20005).
“(About the cost of investment of RM30 million). The board of directors
have approved. We will link-up all the other factories, about 11 or 12
factories around Malaysia.” (WS_20005).

176 | P a g e
Organizational support is also evident in the case of participant WS_20004, whereby
management ensured that all employees complied with the new standard and the
changes were effectively communicated across the organization.
“One thing good about the company is that when they want to implement
anything they will officialize it by documenting the procedures or
instructions into the SOP (standard operating procedures). That's how they
could sustain it (our improvements).”(WS_20004)
Therefore, strong organizational support is critical for CNL implementation, not just to
use ICT as a business tool but more importantly to use ICT as an enabler for employees
to learn and share information.
7.8.2 Positive Interdependence
Most of the organizations use a CNL system to collaborate and exchange manufacturing
information. In the case of WS_20011, the SAP system was being used for labour
tracking which allowed the organization to track employees’ time spent on assembling,
testing and retesting products on the line.
“SAP like the usual, to labor on and labor off units, at retest, final test, and
HASS. That's about all. Yes, it is part of the recording system because we
need to have system of record in SAP (for all units). In future, if we got
problem then we could check back our record to verify (the background of
the test operations and history of the unit).” (WS_20011)
It was noted that most shop floor employees resented the use of the labour tracking
system because it was time consuming and often subject to human error – failing to
“labour on” or “labour off” the resource hours. Obviously, it is highly task dependent.
However, from a finance standpoint it provides essential data for product costing and
impetus to improve shop floor labour efficiency. When a cost centre is created, a
specific labour charge code for employees can be assigned. In addition, manufacturing
organizations use this to report the profit margin of any product category, track
information about inventory levels, or even export the information to payroll or billing
systems. The complexity of information sharing and exchanging requires process and
task interdependencies that are crucial for the success of the business and manufacturing
operations.
177 | P a g e
Other organizations support the use of ICT for supervisory staff for line monitoring and
quality/yield triggering. Managers use the same system to generate reports to help make
decisions. That is exactly why CNL is different from conventional learning, in the sense
that information and learning is achieved through the network, and collaboration
between individuals and workgroups form an essential part of learning.
“My leaders find it useful but the operators don't have access. Their work is
just to run the production line but my leaders will monitor the results: the
aging, WIP (Work in Progress) and output. They don't go for the yeild.
Yeild is only trigger by technicians. Everyday, managers will use the system
to generate reports and check the information. They do not have to ask the
supervisors to send them emails or text every 4 hours or calling them or
sending report because the information is available online.” (WS_20003).
Besides the ERP/MRP system, it was found that some manufacturing organizations use
product database management (PDM) software to manage, track and control product
data involving technical specifications, schematics and engineering drawings,
requirements for manufacturing, test parameters, quality tests and inspections, and
materials specifications required in making the product. The PDM serves as a central
repository of product data and knowledge, and promotes integration and data exchanges
among key stakeholders (Yam et al., 2007). Those who are involved with PDM are
project managers; research and development; procurement; manufacturing; quality; and
sales and marketing. Participants WS_20011 related his experience in using PDM, as
follows:
“PDM is used for checking schematic, checking part list, components, etc.
For troubleshooting still need PDM (product database management)
because the schematics reside in PDM (product database management).”
(WS_20011).
Unlike ERP/MRP, product database management (PDM) has detailed functions that
support product development and product lifecycle (PLC), particularly useful for those
involved in developing and designing new products. New product development (NPD)
involves collaboration among different functions, in order to avoid replication, and to
ensure the right information is available to the right person at the right time
(Kleinsmann & Valkenburg, 2005; Yam et al., 2007). A collaboration process also
happens in concurrent engineering, when a team of experts jointly develop a new

178 | P a g e
product (Camarinha-Matos & Afsarmanesh, 2006). Employees interact in a dynamically
established virtual team and enterprise setting, during the concept, design, build, or
servicing of a product to create a more innovative, profitable, higher quality product
brought to market sooner than the parties would have accomplished on their own (Sayah
et al., 2005). Product engineers or design engineers like participant WS_20009 are
highly dependent on product database management (PDM) for performing their daily
tasks or work.
“For R&D (research and development), ERP is only used for setup and
tracking basis. Not for daily use. However, PDM (product database
management) is being used daily in the R&D activities because we keep
creating new part numbers, new drawings and so forth... so we are creating
information. The information is then shared across the team. When we have
created new designs or new drawings, we have to cascade the information
through communications or meetings, and to present findings, creations and
they have to be approved by dedicated management team. It happens
electronically as well as physically within the company.” (WS_20009)
CNL bridges the gap between the existing product design and new ones, so that product
engineers can optimally integrate the new design into the supply chain, sourcing and
factory capacity planning. The unique features of electronic or digital product database
management (PDM) are that it allows large data to be stored or archived into the
system. This information is then shared and transformed by other key stakeholders,
within the organization or across sites.
Apart from product and design engineers, there is a coherent relation with other
departments along the value chain. Participant WS_20011, who worked as a technician,
related her experience in using product database management (PDM) in managing
engineering drawings and schematics.
“PDM (product database management) is about schematics. After
troubleshooting, we have to access a link like in SAP. If the unit require
troubleshooting, we will create another routing for troubleshooting (in SAP
system). So that we will know, and that is how we check if we need to
change any parts or components. Then, we have to key-in those information
into SAP, like part number, ECN (engineering change notification) number,
CCA (component circuit card) part number, and their revision together with
the required components. If we do not key-in the information pertaining to
the components, how could we review back? We need the components
information to retrieve materials for replacement parts. This needs to
happen…”(WS_20011).

179 | P a g e
Product database management (PDM) provides the assemblers, technicians or repairers
with vital information such as technical specifications, test records, revision status of
the circuit cards or components, etc. CNL links large sets of databases into electronic or
digital format, which is then made accessible through the networks. Such information is
generated by product and design engineers, verified and combined with tests and
inspection parameters by quality engineers, to enable production personnel to
comprehend exact requirements.
In general, it was found that collaborative software such as email and chat or instant
messaging is useful in support of interdependent processes such as product design and
development. Examples include computer aided design (CAD), product visualization
applications, data sharing via Intranet/Extranet to carry out engineering change
management and release control on components revisions/issues in product, and product
configurations and structures such as bill of materials (BOM) for assemblies. Similarly,
in a case study by Hasbro by Yam et al. (2007), product design information, engineering
specification, product design files, product feasibility detail, costing of product, safety
requirement, product test plans, tooling authorization were captured in the systems.
Such intricate activities can be supported with the use of CNL, where information
sharing and transformation can be carried out concurrently across different geographic
locations.
7.8.3 Promotive Interactions
For MNCs a great emphasis is given to ensure all information is being consistently and
effectively managed. Indirectly, the system promotes interactions between employees
from different functions within the organizations as well as across the organizations.
According to WS_20007, eCATS (electronics Corrective Action Tracking System) was
widely used by employees to login quality issues, to track containment actions and
corrective actions, for timely closure of the case and to prevent recurrence or excursion.
“For quality there is a tool called eCATS (electronics Corrective Action
Tracking System) …. So, for every single tab we need to provide some
answers before submitting the (electronic corrective action request) and
then it will prompt for closure on the issues, and request for approve or
disapproved. We need to include preventive actions and timely closure.”
(WS_20007).

180 | P a g e
The electronics Corrective Action Tracking System (eCATS) is an Internet-based
software using secure socket layer (SSL) for data encryption, and is accessible from any
computer with Internet access and an Internet browser. The key feature of eCATS is the
ability to maintain and update information on a corrective action from the problem
description until approval and verification, as indicated by participant WS_20007. All
verifications and approvals are done electronically. The advance search and query allow
employees to find detailed information across multiple sites. A production or quality
engineer typically generates an eCATS. The supplier quality engineer (SQE) can assign
cases to the external suppliers. External suppliers can access the system to update their
part of the information exchange and value chain. After the supplier has responded, the
SQE may schedule follow up and effectiveness audits before closure. When an action is
required or overdue, the system automatically sends out an e-mail reminder. The
process is meticulous and necessary for sharing and learning in a CNL environment. It
is also a close-loop system that promotes interactions and communications among the
employees to share information and knowledge about the product and process. Key
stakeholders such as managers, engineers, technicians, supervisors, and suppliers have
to collaborate in order to fulfil the requirements of the quality management process
(Basu & Wright, 2005).
For SMEs, information management for quality information is not as vital as it is for
MNCs. Participant WS_20002, described her daily tasks as Senior Quality Control
Officer in a SME organization, and said:
“My job is on quality control. I check production area... and then... control
critical control points, approve or reject finished product, and check
incoming raw materials. We don't analyze the result (laughing). We just
keep the results.” (WS_20002)
Clearly, the simplicity of the quality management processes in a SME organization
(take the case of WS_20002) makes it evident that promotive interactions are less than
for those working in MNCs. It could be explained that the complexity of the quality
management system in MNCs (WS_20007) highlights the need to promote interactions.
Collaboration can enrich learning through promotive interactions (Lindblom-Ylänne et
al., 2003; Van den Bossche et al., 2006a). According to Dillenbourg (1999) certain
forms and types of interactions are expected to occur among participants; nevertheless,

181 | P a g e
there is no guarantee that these interactions will actually happen. However in CNL,
interactions are between individuals and individuals, individuals and workgroups, and
workgroups and workgroups, not just between users and network computers. It is also
imperative to clarify at this point, that those were the outcomes of the process of
collaborations and not cooperation. Key stakeholders are expected to contribute their
part individually. The project or task is considered as incomplete should any member
fail to contribute their part in the process.
7.8.4 Internal-External Learning
Most organizations use ICT to measure and track the performance of the operations.
Others track production units using a manufacturing electronics system (MES).
“When I was in Company B, we used MES (manufacturing electronics
system). Let say the unit build is 10, we could easily locate their
whereabouts, either test or troubleshoot or staging areas.” (WS_20011).
It was found that employees learn internally either individually or through their peers.
External learning involves training consultants and training providers as well as trainers
sent from other sites to provide training and support.
“In my previous factory, production using MES (manufacturing electronics
system), Shipping and Store use SAP. So, they has separated the functions
well beforehand. So people who need access SAP would be well verse on its
functionality and likewise people who uses MES (manufacturing electronics
system). There is no problem because they serve their functions well.”
(WS_20011).
Experienced employees were able to relate the use of MES and learn of other
application systems from other organizations. Sharing and learning is becoming
borderless as employees can easily share and learn what is good and what is bad from
other organizations, as in the case of participant WS_20007.
“...I have seen in some other company did it... We scan it auto fail or auto
pass. We don't make it human dependent.” (WS_20007)
Likewise, manufacturing and process engineering leverage on CNL to improve their
production line efficiency. Process recipes and equipment settings are shared and
learned by virtual teams. Any quality defects and process anomalies can be quickly

182 | P a g e
communicated to other virtual teams for validation, and they then collaborate to resolve
issues. Participant WS_20004 described this scenario as follows:
“Machinery and processes that are commonly used by sites… the technical
function in the corporate will look into part or component commonality, and
machine efficiency, so that new technology can be developed and we could
share the new knowledge with the rest of the sites.”(WS_20004)
The benefit of CNL in support of internal-external learning is again described by the
next participant WS_20004 in the following context:
“They developed a system that could enable all technical knowledge to be
shared and deployed down across the sites. And basically this is how we
leverage our technical competencies, and technical knowledge with the less
competent sites.”(WS_20004)
Overall, the participants in this study agreed that collaborative systems and tools if
utilized effectively as a collective system could promote learning through CNL. The
frequency of interactions and collaborations is not as important as the result of learning
itself. Learning to work collaboratively with internal and external teams helps
employees to perform their job or complete their project on time and effectively. In the
case of participant WS_20009, employees working in technical departments
demonstrated higher ability and frequency of using these technologies.
“We hold conference call is on regular basis. Sometimes, twice a week or
thrice weekly. We also have video conferencing. Video conference is only
used for milestone reviews. We have Netmeetings and a system called
Accardin. Accardin is basically a video conferencing or netmeeting system.
We only used it when we need to show or share information, other than that
we don't use it that often. We have cross functional teams in San Jose in
USA, Miser in Netherlands, Penang and Singapore. We use Accardin when
we want to view live-meeting, where we could actually share information on
real-time. People in Miser or San Jose can actually view my presentations
on their screens, or laptops, so it is cost effective, and we do not need to
send large files over the Internet.” (WS_20009).
Virtual teams are potentially much more viable facilitators of knowledge sharing than
individuals or traditional teams (Kauppila et al., 2011). Cross-site collaborations and
external learning are common and necessary for the success of the projects. Sharing and
learning among design engineers are crucial. Decisions are negotiated and members in
the workgroup each contribute their ideas, designs and recommendations. CNL not only
provides access to iterative designs among participants but enables concurrent
183 | P a g e
engineering and facilitates both the process of learning and the transformation of
explicit knowledge into product design by virtual teams.
With careful planning, CNL can be proliferated across organizations, sharing vital
information and promoting learning both internally and externally. Most of the
employees engaged in sharing and learning using CNL expressed their confidence in the
systems. CNL also involves learning by sharing ideas on improving the present systems
to create work that is more productive, efficient and better quality. It does not need to be
a costly upgrade but some incremental improvisations are sometimes well suited for the
purpose and the use of the employees from diverse backgrounds and educations.
“Perhaps they might add some columns... because now we only have the
approval column, so sometimes the approval could be different with
different owner(s). So, they might be able to add some columns for the
owners.”(WS_20006)
“We have Excel file in share drive, like troubleshooting tracking. Other
than that, we have the WIP (work in progress) aging report, which we
update constantly in the shared drive. For troubleshooting, it depends as
when we have units to troubleshoot. For WIP (work in progress) aging, we
update it twice a week.” (WS_20006)
“It needs to be more users friendly. I mean for those working in the
shopfloor…need to take into account their education level. It’s challenging
and they need to have lots of training. The staffs are okay but they are…you
know when we changed from the old system to new system.”(WS_20005)
It was determined that what is important in CNL is the employees’ engagement in the
learning process. Manufacturing employees need to feel confident in using collaborative
technology to share ideas, transform information and make sense of the information for
their work. By using simple Microsoft Excel applications and shared folders,
information can be easily stored and managed. For instance, participant WS_20006 used
Microsoft Excel and shared folders to manage factory improvement projects.
Information pertaining to type of projects, project charter, description of improvement,
timeline and implementation, significance, etc. can be clearly documented for project
tracking, cost saving reporting and archive.
“We are using share drive to update active records like Excel files and to be
used for information sharing. We are also using the shared drive to update

184 | P a g e
kaizen (improvement projects). We get online and enter all the relevant
information into the system”(WS_20006).
Although, WS_20006 related his experience working in MNCs, this simple and cost
effective tool is of use for SMEs. It does not require extensive knowledge and cost. It
just requires some basic knowledge to manipulate the tools for effective management of
information. However, internal-external learning requires a conscientious effort from
manufacturing employees. While organization support could be strong, it does not
necessary translate into employee engagement in learning and sharing. Take the case of
participant WS_20011. The technician claimed that the system was unable to provide
troubleshooting records of the defective units.
“It is odd. If all the data is sufficient, then everytime we troubleshoot we
should be able to check the historical records in the system, but often this is
not the case” (WS_20011).
Upon close examination and clarification from her supervisor, she found that the system
apparently provided avenues to document troubleshooting techniques or methods;
however, those avenues had not been effectively utilized by the former team of
technicians, thus leaving a gap in the database.
Some employees create their own systems to cater for their own needs. Participant
WS_20011, for example, created a simple yet effective database for her own reference
and to improve the quality of her work. More importantly, her own key learning was
also well proliferated among her peers.
“For my own use, I have created an excel form in the shared folder.
Whatever I do...let say retest, I will make use of the folder for my own
reference, not even my supervisor know about it. Before I do any
transaction in the SAP, I have these for my records. In future if anything
happens, I could used these as my references. Nazri (another technician) did
the same.” (WS_20011).
However, the purpose of the study is not to examine the usefulness or effectiveness of
ICT in manufacturing, but rather the effective use of ICT in promoting CNL. Participant
WS_20011 demonstrated her ability to analyse and use technology to fill in the gaps left
by the existing system.

185 | P a g e
“The first time, when I created the folder, it was really complete, with
details of any technical issues. Example, if a unit had failed HASS (Highly
accelerated stress screening) 1.2.3, and when I keyed-in 1.2.3., I will have
all the required information that I needed in details. But in the SAP, that
level of detais are not required and therefore not indicated. Only test tag
was created when I keyed-in in the UCN number, CCA (circuit card
assembly) part number which are only important, but the essential
information like why the units had failed and in which station hot or cold, I
could not obtain the complete information, which is important for me.”
(WS_20011).
7.8.5 Perceived Effectiveness
If CNL is doable in any context, large or small, then would it be effective? This study
corroborates the results of the survey questionnaire and supports the construct’s
perceived effectiveness. Participants explained the reasons for CNL and their
perceptions of its effectiveness or ineffectiveness. Participant WS_20011 claimed that it
was effective, as the engineering change notification (ECN) would update all the
necessary information in the system accordingly.
“It updates accordingly like if they implement ECN (engineering change
notification) or new ECO (engineering change order) and then they will
update the part number, so we need to check” (WS_20011).
How do employees perceive the system as being effective or ineffective? Participant
WS_20007 said that their system was ineffective because it only acted as a facility to
archive information. Other employees used eCATS (electronics Corrective Action
Tracking System) to record or document quality issues as compliance to AS90008
requirement. As a result, overloading of information created more confusion and
increased the workload for employees.
“Seems like there is no linkage. That's right. We spend so much time and
effort documenting the containment actions, corrective actions, and then
forgotten about them. We reissued again for new CAR (corrective action
request) and repeat the process. People don't realize the recurring problem.
That's one of the weakness. Some other sections may have encountered the
same problem, but we wouldn't know. Incidentally, everybody just issue new
CAR (corrective action request). Q&R (Quality and Reliability) also
wouldn't know what to update. Too many in the system.” (WS_20007).
8 Aerospace Basic Quality System Standard was developed by a group of US aerospace prime contractors
based on the ISO 9000 standard, with 27 additional requirements unique to the aerospace industry.

186 | P a g e
Others, such as participant WS_20004 favored the present system as it enabled
members in his organization to share information globally. Engineering change for
common parts and products could be effectively managed through the use of
synchronous and asynchronous networked learning (SNL/ANL). As a result any sites
could access the same information on a real-time basis to complete their part of CNL.
“The present system is meeting my expectation. For example, the
engineering change is a global system and we have this MRP system (which
is also a global system) which enables us to share information globally.
That means that any sites can accessed to our global database for data
sharing.” (WS_20004)
While it was found that CNL supports information sharing, promotes interactions
between employees and possibly generates interdependencies, it was also found to be
equally important that the system is effective. Participants said that the CNL system
should demonstrate the functions and capabilities outlined in Table 7-3 in the content
analysis. Perhaps the significance of the effectiveness of using technology is the ability
to accurately obtain large amounts of data on a real-time basis. The online system is
accessible and information can easily be obtained through any network, be at the
factory, home or elsewhere. The perception about the effectiveness of the system
appears to be evolving over time as technological boundaries advance. This was well
noted by participant WS_2003, as follows:
“They are effective because we could obtain information on real-time basis
at our fingers tip. Just a click away and then we can get online. We don't
need to reboot or refresh it or anything like that. It's online at all
times”(WS_20003).
Accessibility and speed of transmission of information are as important as the
functionality of the systems themselves. In the digital age, employees expect
information to be easily accessible, obtainable and retrievable without having to waste
precious time. Participants WS_20007 and WS_20003 echoed that need.
“PDM (product database management) is only the connection, very slow.
Very difficult to retrieve file in a short time. We need some data but we need
to download the entire file. So, these are the two weakness.” (WS_20007).
“The quality of the information is relevant, and updated. Suppose I am
talking about Mytech system. It is online, and the information is immediately

187 | P a g e
updated. Whatever there is a lot movement the information will be captured
automatically, there is no delay in 5 minutes, 10 minutes or end of the shift.
All is automated”(WS_20003).
It was evident that collaborating parties were involved in direct access and transfer of
data across sites and geographical boundaries. The product database management
(PDM) server resided in single data storage or multiple sites, apparently depending on
the needs of the organization.
All the participants had little knowledge about improving the effectiveness of a CNL
system. This is because CNL is more complex than just an ICT tool for communications
and data processing. Participant WS_20010, who is a senior manager in a SME
organization, thought that by recruiting the right personnel for the job, the task of
designing and developing an effective CNL system could be well managed.
“The IT plan has just begun. So if I want to improve the system, I need
another IT executive to work with the IT Manager. We have one manager
working closely with PBS (software developer). We are working with them,
and we need to put forward our (working) requirements. Currently it is just
their (software and operating) requirements. We are trying to fit in. So, we
purchase the software and then we will try to modify the package according
to our needs.” (WS_20010).
It can also be said that the CNL system is at a premature stage. Lack of knowledge and
competency are critical issues yet to be addressed. Participants in SMEs generally
struggled to define their needs and balance those needs with affordance. Most managers
agreed that the system should be able to generate reports or metrics for evaluation, but
that the system should not make decisions. However, some level of automation was
expected rather than a purely static bulletin board for the storing and posting of
information.
“They are effective because we could obtain information on real-time basis
at our fingers tip. It is user friendly with few clicks. There is no report that
need to run or export to excel. We don't have to do that.” (WS_20003).
Aside from being effective, the study also found an interesting statement that is out of
the scope of the research but worth noting. A product engineer from a MNC suggested
complementing the current system with a human presence.

188 | P a g e
“I would say the next step is actually having more periodical plant visits in
my sector. I speak for my sector because I work with other project leaders
across sites. So, I feel that it is necessary for us to communicate physically
rather that too much of network type of conversations. I feel face-to-face
relationship, bonding and understanding among team members is crucial. I
would say maybe half-yearly or quarterly trips between project leaders.”
(WS_20009)
The participant’s opinion is well supported by Thomas and MacGregor’s (2005) study
on online project-based learning. Some studies accentuate the role of face-to-face
interaction in creating trust and a collective identity among the team members (Kauppila
et al., 2011; Malhotra et al., 2007). Participants in this study preferred face-to-face
meetings after using the asynchronous and synchronous systems in support of their
offline activities. Whenever employees interact or engage, they create a social space,
whether they come together face-to-face, or do so virtually online (Addleson, 2013).
Earlier, the same participant (WS_20009) expressed his satisfaction with the CNL
system in his organization and explained that the system had provided a wide array of
collaborative technologies both synchronous and asynchronous.
Overall, it was found that in both MNCs and SMEs CNL is still far from being perfect.
Static information is not well perceived by manufacturing employees who constantly
demand advanced analytic tools that can help reduce workloads and improve work
efficiencies. In other words, almost all participants that were interviewed perceived that
an effective CNL system could translate and transform large information into
meaningful and concise metrics or performance indicators. They believed that it should
assist their work and bring about positive changes for quality and productivity
improvements.
7.8.6 Perceived Usefulness
Participants said that to be effective and useful, organizational knowledge and
information had to be seamlessly integrated across the organization. The dedicated
modules or sub-systems supported employees in their respective roles and functions
(see WS_20006 below). The ERP/MRP is often projected as a complex system,
analysing large pool of data for decision making in an environment that requires great
flexibility and quick response. As participant WS_20006 put it:

189 | P a g e
“SAP is mainly used across all functions and departments. But there are
different set of codes for different functions, like production use GMWB9,
MMBE10
, MEA411
and for planning maybe different set of codes. For
operators they have their own codes, for example GMWB12
is most
commonly used for every operations. They have to login to SAP to labor on
and labor off to capture the labour time.”(WS_20006)
It was found that most organizations use vital manufacturing information to collaborate
between members in different departments or workgroups. This information is
translated into meaningful reports and metrics (as described by WS_20003) for further
analysis and often requires follow-up actions and decisions from higher management.
“We keep information about our yield, WIP (work in progress), and
aging.”(WS_20003)
Employees participating in CNL collaborate with peers and teams using technology as
an enabler. However, most information in its raw form does not add value to employees
or their organizations. In order for the information to be useful, CNL technologies could
support learning by transforming information into reports, metrics and performance
indicators.
“Information in the shared folder is also accessible, but can be further
improved if the system can auto-generate report (automatic reporting).
Today it is used for depositing the raw data, then we need to extract out the
raw data to create reports. So, that is where the setback is. But I think that
can easily be done if system development can be defined the format, then the
system can be programmed. That's how I see it” (WS_20004).
By probing responses it was apparent that every function in the manufacturing
organization plays an important part in creating and transforming data at various points
of the operations. Production operators entering resource hours “labour on” and “labour
off” data may seem insignificant, but when information is transformed into performance
metrics, the usefulness of the system becomes more apparent.
9 Transaction code (T-code) for production module in SAP.
10 Transaction code (T-code) for material management module in SAP.
11 Transaction code (T-code) for purchasing module in SAP.
12 Transaction code (T-code) for manufacturing work bench in SAP.

190 | P a g e
Complex manufacturing operations like those in consumer electronics, semi-conductors
and printed circuit board assembly (PCBA) require elaborate assembling sequences or
steps. Without documented standard work instructions, it would be difficult to
manufacture components and products with precision, accuracy and high quality. The
extent of usefulness in the manufacturing environment can be best described by
WS_20006 as follows:
“For standard work instructions, they (production operators and
technicians) will have to refer back to SAP. Engineers create rework orders,
check CN (configuration numbers) and configurations. Engineering Ref
(reference) will relate to PDM (product database management). For
managers level, I think mainly they will check for inventory, how many units
are available for this part. Let say, if you are gated by parts, or CCA
(circuit card assembly), then they will need to check how many pieces are
left in the PRB (parts review board) for disposition. Then they will generate
report for analysis, like QN (quality notification) report, PRB (parts review
board) report, and also some WIP (work in progress) aging reports - all in
which are generated from the SAP. The yeild report is used for cycle time
analysis.” (WS_20006)
The complexity of a heterogeneous manufacturing environment demands a fast pace of
data processing, with inter-connected functional application software that works across
the organizational boundaries (WS_20006).
“The same information is also used for NPI (new product introduction), for
example during phase 1,2,3 and 4 of Dixie13
project. But in EM (electro-
mechanical), we don't have NPI (new product introduction) because it was
already completed (before the product transfer). We consider them as FAI
(first article inspection).” (WS_20006).
Product transfer and new product introduction may require transfer of information
through the network. Collaborative tools could enhance the design content of the
product and reduce the time for the approval of products (Yam et al., 2007). The same
piece of information is crucial in order to sustain the level of quality, that otherwise
would be compromised with the loss of essential product knowledge and information.
Perkowitz and Etzioni (1999) link information quality with usefulness by arguing that
the information is useful only if the user considers the information on the web site to be
accurate, informative and up-to-date. In another study, Cornelius and MacDonald
13 Dixie is a codename for a technology and product transfer project across two countries.

191 | P a g e
(2008) posit that rapid responses to practical questions, up-to-date information, and
discussion of current issues is considered as valuable.
Many SMEs in the study have since evolved and implemented standardized work
instructions, in compliance with the requirements of the ISO9000 standard. Most MNCs
have upgraded their network with online standard work instructions (WS_20004).
Participant WS_20004 mentioned the availability of network computers (NC) in
assembly workstations, which meant that all production operators, technicians and
engineers were able to access online information, including technical specifications and
standardized work instructions. Bouhnik et al. (2009) in their empirical research on
high-technology organizations remark that asynchronous sources “allow high
accessibility to varied and updated information” (p. 426). This key infrastructure is seen
as evidence of strong organizational support from the management or leadership of
CNL.
“We used online work instructions. We called it online assembly build
instructions. Basically, all the assembly stations will have these NCs
(network computers), so everytime they (production operators) build a part
they have to access the work instructions for that part number. It details out
instructions for the work step by step.”(WS_20004)
The response to the question whether all employees need to transform and become
involved in information transformation was generally no, not all employees are
responsible for changing or transforming the information. Obviously, production
operators are not required to change critical information such as product specifications,
test parameters, or quality requirements. However, contrary to general belief, production
operators could still initiate or influence the change by engaging primary stakeholder(s)
such as product engineers, sustaining engineers or manufacturing engineers to change
the standard work instructions.
“They (production operators) don't change the information. They have to
feedback to the engineers who maintain the work instructions. They will
raise a change request, update it and upload it back into the system with the
new revision.” (WS_20004)
Many participants expressed their hope that the CNL system could help to make their
work much easier. For instance, participant WS_20011 related her experience in using

192 | P a g e
the engineering bulletin (EB) and participant WS_20004 in using assembly visual
instruction (AVI).
“Like EB (engineering bulletin), before we start testing the unit we need to
use EB (engineering bulletin). From the EB (engineering bulletin), we will
check if the information has been updated or revised. From there we will
know. But they will provide a grace period because it requires feedback
from the United States and India. They need to update some information like
type of revision, reason(s) for revision, etc. It takes time. Before that they
need to complete the feedback form to validate and review when to cut-in,
etc.” (WS_20011).
“For the AVI (assembly visual instruction), it is very effective. We can check
the product information and made accessible to the people working on the
lines.” (WS_20004)
The usefulness and relevancy of the information depends on how employees use it to
perform their work. Several participants complained that their systems were overloaded
with information. Bouhnik et al. (2009) in their research found information that was not
always focused and on other occasions only provided partial information. Participant
WS_20011 was one such discontented user.
“I think the SAP system is not useful. Let say...it is too elaborate and yet
often it is insufficient.” (WS_20011).
Responses showed that unlike eCATS or SAP, which are often perceived as an
encumbrance, information in the engineering bulletin (EB) is constantly being updated
and pertinent information is being cascaded down to employees across the world. On
top of that, the system is unique in the sense that it requires feedback from key
stakeholders as part of the engineering change management process. It fulfils the role of
the CNL system for employees not only to share knowledge and information, but also
contribute their ideas, make sense of the information and complete their part by
transforming the information given.
Some systems, however, are simple but useful in providing essential information for
work (WS_20003). Members in a team can share information to monitor operational
performance. Therefore, the aspect of time could actually impact on the perceived
usefulness of CNL. When data is needed immediately, the response time may be too

193 | P a g e
slow (Bouhnik et al., 2009). One particular participant WS_20007 highlighted concern
about the speed of accessibility.
“Nevertheless, the PDM (product database management) is very good but it
is also very slow because the server is residing elsewhere”. (WS_20007)
PDM system was used by participant performed analytical data processing and
generated structured reports. Part of CNL’s role is to enable manufacturing employees
to gather information, analyse it, and then learn by applying this new knowledge and
information to improve their work performance. CNL provides the means to generate
reports from large databases and create virtual workspace for members to collaborate.
As described by participant WS_20003, the information is being effectively used to
identify the processes that require attention or improvements.
“For now, there is no lacking in the system. It is very useful. For me, for the
engineering folks, technicians, we constantly monitor the yeild. I am
running production, and it is important that I understand my WIP,
bottleneck process, the yeild, and the aging because we have aging units
that we need to clear. Then we could also identify the process that needs
help through use of the system.” (WS_20003)
Other findings for the use of CNL are the highlighting of production requirements to
assist repair works (WS_20011). For parts replacement, the system provides
information about the history of the product, including quality records on test results,
component part numbers, revision numbers and other technical specifications. This part
of CNL promotes learning through a combination of experimentations based on past
experience and learning. Without this component, repair or rework technicians would
have no reference, and would continue to experiment based on a series of trails and
errors.
“For example if the CCA (circuit card assembly) is faulty, then we need to
change the components, and if it happens again, we should not direct to the
UCN (unique control number) because we have the end-item part number.
So, we need to know the end-item part number and from there we will check
the build. From the build we will gather the UCN (unique control number)
and then we could trace back. Usually that how we do it.” (WS_20011).
Employees in SME organizations recognized the relevancy and usefulness of a larger
CNL. Senior manager WS_20008, from a SME organization, was optimistic that a
better system would enable shop floor employees to check inventory management

194 | P a g e
online. The SME organization although seemingly small, disorganized and certainly not
high tech, recognized the importance of sharing information and management.
“Definately (UBS and Microsoft Excel) useful. It can be seen. People
working on the shop floor can check stock directly.” (WS_20008).
Although some employees, for example WS_20006, expressed their reservations,
overall they contended that even simple application software like Microsoft Excel could
be effectively used for CNL. What is important is not the complexity of the system but
the functionality and its design to disseminate knowledge among employees in
manufacturing organizations.
“For some applications (the present systems) are useful, but not all. For
instance, the kaizen (improvement projects) system that we implement is
particularly useful. Every employee will go into sharepoint and share drive
to submit and update their kaizen projects. It has a 7 days cycle, to verify
inventory movement. The coordinator or owner(s) will assign people for the
projects, enter in the cost saving for the kaizen and update all the gains or
benefits.” (WS_20006)
Nevertheless, some enterprise systems are perceived to be burdensome. Resources are
needed to perform data entry. Time and effort are heavily invested in ensuring accuracy
and integrity of the data, as experienced by participants WS_20007 and WS_20011 in
using an ERP/MRP system.
“SAP is very human/manual dependent because we have to do every since
meticuluos transaction, one step at a time. It is prone to human error during
data entry.” (WS_20007).
“I think the SAP system is not useful. Let say...it is too elaborate and yet
often it is insufficient. Insufficient resources to enter all the information unto
the SAP.” (WS_20011).
“Right now in the SAP, we need to key-in passed or failed. Sometimes, an
operator could mistakenly keyed-in a unit which has failed as passed.
Moreover, there are a lot of transactions involved.” (WS_20007)
“Although in SAP it does show their (production units) location, still we
need to find them physically (because of insufficient information).The
system has its limitations. Like at 8.30am the unit is in pre-test. After
9.00am it is still in pre-test according to SAP. But not sure why?”
(WS_20011).

195 | P a g e
There was a general consensus that an enterprise system brought more good than harm
to manufacturing organizations. ERP usually contributes to the development of core
competencies (Gao & Dowlatshahi, 2005). The present manufacturing business
generates a large amount of data and information that require computational analysis for
reporting and decision making. Most participants agreed that the system helped to
increase productivity and promote operational efficiency in the long run.
“Yes, in the sense that SAP really helps us to shorten production cycle
times. For operators, I don't think they find it as useful because the
information and data is irrelevant to them or their work. Moreover, they
(production operators) got to do a lot of data entry and so every operator is
linked through the computer network.” (WS_20005)
“System wise, it is sufficient although there is limitation….but I believe we
can handle those limitations. With the current tools we are able to sustain
our operations and channel the messages across quite effectively. The
current system provides real-time information and helps us in making good
decision.” (WS_20009).
Almost all of the participants interviewed expressed their optimism that the systems
could and would be further improved. Today’s manufacturing employees (such as
WS_200011) are more dependent on ICT for their jobs, and that inspires greater
expectations and determination for more innovative ways of learning using CNL.
“At one time, they said they wanted to provide auto prompt. Whenever there
is a change of revision…actually, they have...like normally the documents
are handled by ME (manufacturing engineer). Let say if there is any NPI
(new product introduction), so they (the manufacturing engineers) will
check the current status (for pilot or preliminary production” (WS_20011).
7.9 Summary
The qualitative data analysis provided data for the coding of CNL patterns using content
analysis. The themes corroborated the quantitative findings in Chapter 6, and provided
clarity in explaining participants’ motivations and experiences, which supported and
strengthened the propositions in sections 3.4.1 to 3.4.7. The qualitative findings are
crucial in lending a voice to the numerical data and statistical inferences and providing a
more holistic and interpretivistic view for the research. The researcher applied an
ethnographic approach in the interpretations of the transcripts, in order to make sense of
the contexts; terminologies involving information systems and operations management;

196 | P a g e
manufacturing processes; and employees’ experiences in the manufacturing
environment. The ethnographic approach enabled the researcher to relate to
participants’ experiences, and understand the contexts of their speeches in relation to the
answers provided.

197 | P a g e
CHAPTER 8: DISCUSSION OF RESULTS
8.1 Introduction
This chapter presents the integrated findings from the quantitative and qualitative data
as presented in Chapters 6 and 7 and summarizes key findings in accordance with the
research questions, research objectives and research propositions.
8.2 Evaluation of Research Questions (RQ)
The study summarises key findings of this research in accordance with the research
questions:
RQ1. What are the significant antecedents for a CNL model in manufacturing?
RQ2. How significant are the relationships between CNL and organizational support,
positive interdependence, promotive interaction, and internal-external learning?
RQ3. What are employees’ perceptions of CNL’s usefulness and effectiveness in
manufacturing?
RQ4. What are the differences between CNL for multinationals companies (MNCs)
and CNL for small medium enterprises (SMEs)?
8.2.1 Research Question 1 - What are the significant antecedents for a CNL model in
manufacturing?
This study has extended the empirical research of CNL in the manufacturing
environment. All the proposed antecedents: organizational support, promotive
interactions, positive interdependence, internal-external learning, perceived
effectiveness and perceived usefulness were found to be significant. This is evident in
section 6.11.7 where the regression models H1, H2, H3, H4 and H5 show predictors for
each of the constructs tested and were found to be significant. The qualitative findings
in section 7.7.2 corroborated these results and all the antecedents emerged as key
themes: organizational support (nd.=1646); promotive interaction (nd.=980); positive
interdependence (nd.=480); perceived effectiveness and usefulness (nd.=373); and
internal-external learning (nd.=123). The result of the content analysis is shown in
Appendix K.

198 | P a g e
8.2.2 Research Question 2 - How significant are the relationships between CNL and
organizational support, positive interdependence, promotive interactions, and
internal-external learning?
All the antecedents: organizational support, promotive interaction, positive
interdependence, internal-external learning, perceived effectiveness and perceived
usefulness demonstrated a highly significant relationship with CNL. Only significant
predictor variables were retained in the regression models H1, H2, H3, H4 and H5 in
section 6.11.7. Results of the multiple regression are shown in Appendix J. As evident
in the multiple regression in sections 6.11.1 to 6.11.6, some antecedents were found to
be well supported by multiple predictor variables, while others were only supported by
a single predictor variable. For example predictor C3 “Job requires to share ideas, work
and information” (for Model H1, H3 and Model H4), predictor F3 “Use computers to
share information effectively” (for Model H2) and predictor F5 “Team produces good
quality collaborative work” (for Model H5) only had a single predictor. Predictors C4
“Job can only be completed if other members complete theirs” and C5 “Performance
depends on the results of the team” were eliminated as they were low in significance for
any of the models tested. From the interviews, the participants further opinioned that all
the proposed antecedents were significant (sections 7.8.1 to 7.8.6), although results
from the content analysis show organizational support and promotive interaction as the
predominant themes.
8.2.3 Research Question 3 - What are employees’ perception of CNL’s usefulness and
effectiveness in manufacturing?
Employees perceived CNL to be both effective and useful, provided the information
was relevant for their work, updated and of good quality. Employees from MNCs had a
higher perception of CNL effectiveness and usefulness than those from SMEs.
Employees from MNCs were confident in using computers to share information (M =
4.31; s.d. =0.83). Employees from SMEs felt they could work efficiently using
information from the network (M = 2.94; s.d. =1.39). However, both groups agreed that
using information from the network could not achieve their goals working as a team.
Employees from MNCs perceived the network system/tool as being useful (M = 4.35;
s.d. =0.81) for sharing information (M = 4.34; s.d. =0.85). However, they disagreed

199 | P a g e
about the online meetings with external parties (M = 3.88; s.d. =1.20). Employees from
SMEs perceived both the network system/tool (M = 3.01; s.d. =1.30) and shared
database (M = 3.00; s.d. =1.32) as being useful, but they disagreed on the usefulness of
the online learning system (M = 2.61; s.d. =1.23).
The participants from both groups generally agreed that CNL had helped to increase
productivity and promote operational efficiency (as shown from the qualitative results
in sections 7.8.5 and 7.8.6). CNL effectively stored, transferred and analysed the data
into a meaningful report to support decision making. Nevertheless, there were mixed
perceptions about CNL. Those who had disagreed claimed that the system was too
complex and time consuming, a waste of resources and costly. The following are some
of the highlights:
“For now, there is no lacking in the system. It is very useful.” (WS_20003)
“They are effective because we could obtain information on real-time basis
at our fingers tip.” (WS_20003)
“For operators, I don't think they find it as useful because the information
and data is irrelevant to them or their work.”(WS_20005)
“Definately useful” (WS_20008).
“The current system provides real-time information and help us in making
good decision.”(WS_20009)
“For some applications (the present systems) are useful, but not all.”
(WS_20011)
8.2.4 Research Question 4 - What are the differences between CNL for multinationals
companies (MNCs) and CNL for small medium enterprises (SMEs)?
In general, the proposed antecedents of CNL in manufacturing were strongly supported.
However, there were significant differences between the intensity and frequency of
usage in CNL between MNCs and SMEs. The following differences are noted from the
quantitative and qualitative findings in this study:
i. MNCs are most likely to have the means to provide sufficient resources or
organizational support for CNL strategies and programs. The study shows that
the management of SMEs has the awareness to create incremental low cost and
small scale programs.

200 | P a g e
ii. Most MNCs have implemented enterprise information management (EIM) and
enterprise resource planning (ERP) systems that support manufacturing
information integration across the entire organization and across the world.
SMEs are mostly localized and use of enterprise information management (EIM)
is either unheard of or at initial stages.
iii. The usage of CNL for MNCs is greater than SMEs in terms of online learning,
online meetings, and emails for work. The differences were found to be highly
significant.
iv. Both MNCs and SMEs do not differ significantly in the use of shared database.
Management from both MNCs and SMEs recognize the importance of using
shared databases or networks for information management and sharing.
v. There were participants from both MNCs and SMEs who engaged in more than
40 hours per year in e-learning. However, 85% of the participants from SMEs
had never engaged in any form of online learning.
vi. Eighty seven percent of the participants from MNCs spent more than 15 hours a
week using a shared database or networked information. This compares with
84% of participants from SMEs who said that they did not have access to a
shared database or networked information.
vii. Ninety one percent of the participants from MNCs as compared to only 9% from
SMEs spent between 6 to 10 hours a week using online meetings.
viii. Eighty six percent of the participants from MNCs spent between 1 to 5 hours a
day using email for work, in contrast to 94% from SMEs who had never used
emails for work. Those who spent more than 15 hours per day using emails for
work were from MNCs (80%) as compared to SMEs (20%).
8.3 Evaluation of Research Objectives (RO)
The study summarises key findings of this research in accordance with the research
objectives:
RO1. Develop an integrative CNL framework and bridge the gap between theory and
praxis.
RO2. Establish a comparative study by comparing and contrasting diverse industries
and between MNCs and SMEs.
RO3. Examine networks of manufacturing collaborations and seek to understand the
antecedents that set the stage for information sharing and knowledge
transformation among members in manufacturing organizations.
RO4. Conduct a multi-disciplinary research that will include experiential learning,
workplace learning and consider other research into CNL and knowledge
sharing. Revisit and validate the definition of CNL.

201 | P a g e
8.3.1 Research Objective 1: Develop an integrative CNL framework to bridge the gap
between theory and praxis.
This study has developed a framework for CNL to bridge the gap between theory and
praxis (as shown in Figure 8-21). The use of exploratory factor analysis resulted in 33
items being accepted with a high factor loading between 0.80 and 0.95, exceeding a
minimum value of 0.60 (Nunnally et al., 1994) and factors extracted highly between
76.20% and 86.93% exceeding 50% of the total variance explained (Hair et al., 1998),
as shown in sections 6.6.1 to 6.6.7. The Cronbach’s α reliability test range from 0.90 to
0.96 was considered to be highly reliable, exceeding > 0.7 (Hair et al., 2006; Nunnally,
1978; Nunnally et al., 1994). The proposed constructs: organizational support,
promotive interactions, positive interdependence, internal-external learning, perceived
effectiveness and perceived usefulness were proven to be excellent antecedents that
positively influence CNL in the manufacturing context. The type of organization acts as
the moderating variable for CNL with differences between MNCs and SMEs. The study
further strengthens the argument that a theoretical framework is different from the
context of the information system in practice. The distinction is clearly made from the
goal of learning. Employees’ goal of collaborating in learning networks is to resolve
work related issues where practicality and applications of knowledge is crucial for the
success of the collaborative endeavour. Moreover, the choice and decision are positively
influenced by perceptions on both the use and the effectiveness of technologies in CNL.
Figure 8-20 Framework for antecedents of CNL in manufacturing

202 | P a g e
8.3.2 Research Objective 2: Establish a comparative study by comparing and
contrasting diverse industries and between MNCs and SMEs.
A comparative study was carried out within the research to compare and contrast the use
of CNL between MNC and SME organizations. The findings reinforced the notion that
employees from MNCs spend a considerable amount of time communicating and using
CNL as compared to employees from SMEs (see Appendix G and H).
i. For online learning – Overall, the majority (32.9%, n =81) of participants spent
less than 10 hours per year on online learning, while a proportion (22.8%, n =56)
spent between 11 to 20 hours per year, and others (15.4%, n =38) never used e-
learning or any online learning tools. However, employees from MNCs (M =
3.35, s.d. 1.45) spent more hours engaging in e-learning than employees from
SMEs (M =1.99, s.d. 1.41). The difference was significant ( t(127.71) = 6.76, p<
0.05).
ii. For shared database – Overall, participants spent between 6 to 10 hours (23%,
n =56) and more than 15 hours (22.8%, n =56) accessing shared databases as
compared to those who had neither use nor accessed any shared database (7.7%,
n =19). Although employees from MNCs (M =4.17, s.d.=1.41) spent more hours
using shared databases or network systems as compared to those from SMEs (M
=2.78, s.d. =1.50), the difference was not significant ( t(244) = 6.68, p> 0.05).
iii. For online meetings – The majority of the participant (38.6%, n =95) said that
they never used online meetings. A proportion used online meetings between 1 to
5 hours (21.5%, n =53) per week, while others spent more than 15 hours per
week (4.1%, n =10) using online meetings. Employees from MNCs (M =2.80,
s.d. 1.48) spent more hours engaging in online meetings than employees from
SMEs (M = 1.68, s.d. =1.21). The difference was significant ( t(111.42) = 6.32,
p< 0.05). Both MNCs and SMEs indicated a lower frequency of use of online
meetings as compared to the other collaborative tools.

203 | P a g e
iv. For email for work – The majority of participants said that they spent 1 to 5
hours (33.7%, n= 83) per day using email for work. A proportion spent between
6 to 10 hours (25.2%, n =32) per day using email for work as compared to those
who had never use email in their workplace (7.3%, n =18). However, employees
from MNCs (M = 3.60, s.d.= 1.07) spent more hours using email for work than
employees from SMEs (M = 2.54, s.d. =1.38). The difference was significant
(t(101.34) = 5.80, p< 0.05).
8.3.3 Research Objective 3: Examine networks of manufacturing collaborations and
seek to understand the antecedents that set the stage for information sharing and
knowledge transformation among members in manufacturing organizations.
While seeking to understand how information is shared, learned and transformed, this
study found some interesting results:
i. Surprisingly, overall 13% (n =31) of employees actually spent more than 40
hours per year using e-learning or an online learning program and a large
percentage 85% (n =208) had some experience. Nevertheless, there is still a
percentage of employees who had never used an online learning program,
simply because they were not given online access, or the organizations had not
implemented an e-learning program.
ii. A large percentage, at 93% (n =228), had experienced using email in their
workplace or were using email for their work on a daily basis. Email is the
ubiquitous collaborative technology for manufacturing organizations today. The
majority of those who did not have access to email were either low position
employees such as production assemblers, operators or general workers as
explained by the participants in an interview, or the organization did not provide
an email facility to their employees.
iii. Again, a large percentage, at 92% (n =227), had accessed and used a shared
database to perform their daily work. This is because manufacturing
organizations recognize the importance of sharing information through the
network to improve their business and operational performance. Their
204 | P a g e
motivations are echoed in section 7.7.1’s interviews with senior managers from
various organizations.
iv. However, the same cannot be said about online meetings. Thirty nine percent (n
=95) of the employees said that they had never used online meetings or tele-
conferencing in their workplace. Only 4% (n =10) spent more than 15 hours per
week using online meetings for sharing information, collaborating and
reviewing projects. Interestingly, those who did not use online meetings were
most likely to have been deprived of opportunity to learn from customers,
partners or suppliers.
8.3.4 Research Objective 4: Conduct a multi-disciplinary research that will include
experiential learning, workplace learning and consider other research into CNL
and knowledge sharing. Revisit and validate the definition of CNL.
From the literature review, the study identified some overlapping contributions that may
support and corroborate this study on CNL. These include experiential learning,
workplace learning and collaborative learning. In fact, the multi-disciplinary approach
helped to develop the measurement, ensure consistency and improve the validity in the
research. Further, the key concepts and principles of CNL that were first proposed by
Findley (1988) were revisited and reviewed for relevancy and accuracy in relating to the
present context of manufacturing:
i. Learning is work, and work is learning. According to Kolb (1984) “learning is
the process whereby knowledge is created through transformation of
experience” (p.41). The study confirmed the statement, and suggests that just a
thin line separates work and learning. Thompson (2010) enunciates that much of
the work of learning happens informally. Postulating from Kolb’s (1984) and
Thompson’s (2010) contentions, work experience is transformed into knowledge
and as such organizational knowledge has to be learned and shared. Systems and
tools that are used for work are equally important instruments for
communicating, sharing information and learning. The changes that are
happening in the manufacturing workplace mean that every employee is required
to contribute, share and learn at the same time. It is an enormous challenge and

205 | P a g e
yet made easy with the use of collaborative technology embedded into the
working and learning systems.
ii. The process of learning is augmented in the computer networked environment.
The use of Internet-based information and communication technologies to
promote CNL is supported by de Laat et al. (2006a); Camarinha-Matos and
Afsarmanesh (2006a); Brophy (2001) and Lipponen (2002a). This study also
found that collaborative technology and computer networks are used to
amplified learning effectiveness, by making information easily available,
accessible and sometimes updated to the point of use. Thus, the contention that
the process of learning is augmented in the computer networked environment is
still prevalent in CNL.
iii. Group rather than individual focus. In this study, participants actively
communicated and negotiated meaning with one another and their workgroups.
CNL is proven as an interactive process of engagement in learning with others in
virtual teams, with the collaborative technology acting as enablers for sharing
and transforming information. The process of interdependence investigated by
the study inherently enforces the requirement of two or more members
completing any single task or project. One cannot do without the others, and
vice versa. Other researches on computer supported collaborative learning also
imply that learners communicate with each other to engage in an argumentative
discourse with the goal of acquiring knowledge (Weinberger et al., 2006),
learning and thinking as a collective group (Stahl, 2005) and collaborating as a
process of participation in collective activities (Lipponen, 2002b).
i. Induction, synthesis and dialogue rather than deduction analysis and one-way
transmission. The study only partially supports the statement because of its
limited scope and the fact that it did not proceed to study the learning process,
knowledge acquisition or knowledge construction. Although it found some
evidence of interactivity between members and their workgroups, it did not go
further to investigate the types of analytical processes as a function of
knowledge construction. Nevertheless, de Laat et al. (2006) postulate that CNL

206 | P a g e
has essentially developed new knowledge by connecting ideas and sharing
problems and insights in a constructive way through online dialogues and social
interactions. By converting raw data into knowledge with the use of a variety of
communication and collaborative tools simultaneously (Haythornthwaite et al.,
2000), participants’ understanding also increased (Johnson, 2001). Learning is
always a mix of individual and group processes and knowledge is constructed by
a synergistic effect that merges ideas from different individual perspectives
(Stahl, 2005).
ii. Not co-located with peers, management and/or factory. Both synchronous and
asynchronous network learning (SNL/ANL) can link geographically dispersed
members and teams into a virtual workspace for collaborating in complex tasks
or projects. In this research, participants from MNCs suggested they had more
opportunities to collaborate with their peers across multiple geographical sites,
mainly due to the requirement of their roles in support of product development
projects or quality management resolutions. The same contention is well
supported by other studies (e.g. Chudoba et al., 2005; Gressgard, 2011;
Warkentin & Beranek, 1999).
iii. Learning between self-directed co-learners and learners and experts; sharing
common purpose, interdependent and accountable to each other for their
success. Goodyear et al. (2003) also suggests the above concept be enacted
between one learner and other learners; between learners and experts; and
between learning networks and their resources. This requires learners to
explicitly schedule their activities and assign roles within the groups (Strijbos,
2004) and quite often interchange their roles as learners and experts (de Laat &
Lally, 2003) in different situations, scenarios, tasks or projects. The study is
closely related to the context and found that participants who actively interacted
and engaged in workgroup activities or projects were more likely to be
positively interdependent. Employees who are accountable for the outcome of
their results and performances are often influenced by a group’s learning
environment where employees co-create knowledge together.

207 | P a g e
8.4 Evaluation of Research Propositions (RP)
The study summarised key findings of this research in accordance with the research
propositions:
P1 Organizational support is an antecedent of CNL.
P2 Positive interdependence is an antecedent of CNL.
P3 Promotive interaction is an antecedent of CNL.
P4 Internal-external learning is an antecedent of CNL.
P5 Employees’ perceived effectiveness is an antecedent of CNL.
P6 Employees’ perceived usefulness is an antecedent of CNL.
P7 For MNCs and SMEs, the influence of CNL is different.
P7a The influence of online learning is different between MNCs and SMEs.
P7b The influence of a shared database is different between MNCs and SMEs.
P7c The influence of online meetings is different between MNCs and SMEs.
P7d The influence of email for work is different between MNCs and SMEs.
The results of proposition testing at the construct level are summarized in Table 8-53
All t-values were significant at p < 0.05 level. This indicated that all propositions were
verified at the construct level.
Table 8-53 Summary of the test of propositions
Propositions Findings
P1 - Organizational support is an antecedent of CNL Supported**
P2 - Positive interdependence is an antecedent of CNL Supported***
P3 - Promotive interaction is an antecedent of CNL Supported**
P4 - Internal-external learning is an antecedent of CNL Supported**
P5 - Employees’ perceived effectiveness is an antecedent of CNL Supported***
P6 – Employees’ perceived usefulness is an antecedent of CNL Supported**
P7 – For MNCs and SMEs, the influence of CNL is different Partially Supported
P7a – The influence of online learning is different between MNCs and SMEs Supported**
P7b – The influence of a shared database is different between MNCs and SMEs Not Supported
P7c – The influence of online meetings is different between MNCs and SMEs Supported**
P7d – The influence of email for work is different between MNCs and SMEs Supported**
*= p< 0.1; ** = p<0.05; ***=p<0.01; ****=p<0.001

208 | P a g e
8.4.1 Proposition P1 - Organizational support is an antecedent of CNL.
This study has found that organizational support is an antecedent of CNL. It is evident
that the independent construct strongly supports the dependent variable CNL:
i. Model H1 – B3 “Access to learning through computer network” (β = 0.32, t =
5.04, sig. =0.00), B4 “Access to online shared database to facilitate work” (β =
0.43, t = 7.76, sig. = 0.00) and B5 “Support from management to collaborate” (β
= 0.13, t = 2.24, sig. = 0.03).
ii. Model H2 – B2 “Access to email for work” (β = 0.20, t = 2.47, sig. = 0.01), B3
“Access to learning through computer network” (β = 0.33, t = 4.15, sig. = 0.00)
and B4 “Access to online shared database to facilitate work” (β = 0.29, t = 4.53,
sig. = 0.00).
iii. Model H3 – B3 “Access to learning through computer network” (β = 0.35, t =
5.16, sig. = 0.00), B4 “Access to online shared database to facilitate work” (β =
0.30, t = 5.14, sig. = 0.00) and B5 “Support from management to collaborate” (β
= 0.19, t = 2.97, sig. = 0.00).
iv. Model H4 – B3 “Access to learning through computer network” (β = 0.37, t =
5.31, sig. = 0.00) and B4 “Access to online shared database to facilitate work” (β
= 0.28, t = 3.99, sig. = 0.00).
v. Model H5 – B3 “Access to learning through computer network” (β = 0.40, t =
5.85, sig. = 0.00) and B5 “Support from management to collaborate” (β = 0.33, t
= 4.82, sig. = 0.00).
Employees are provided with access to a computer network to communicate and
collaborate with others. The network plays an important role in enabling employees to
access, learn and share information. Management support is pivotal in providing the
facility and infrastructure as well as learning support to collaborate. Likewise, other
researches also recommend a supportive organizational context and supportive
interpersonal climate, as well as the positive effects of facilitative leadership
(Edmondson et al., 2001; Sarin & McDermott, 2003). Most organizations provide both
asynchronous and synchronous tools for communication and collaboration as well as
workspace for sharing information. Management is supportive of employees in ways
that facilitate the accomplishment of their tasks, for example, removing barriers,
developing standards and coordinating activities (Doos et al, 2005). Similarly, Chiaburu
et al. (2010) and Fedor et al. (2003) also found that perceived organizational support is
positively related to self-efficacy and the motivation to learn. It is also related to team

209 | P a g e
members’ ratings of their project success and expectation of a project’s impact on the
organization.
8.4.2 Proposition P2 - Positive interdependence is an antecedent of CNL.
This study has proven that positive interdependence is an antecedent of CNL. It is
evident that the independent construct strongly supports the dependent variable CNL:
i. Model H1 – C3 “Job requires to share ideas, work and information” (β = 0.74, t
= 17.26, sig. =0.00).
ii. Model H2 – C1 “Job requires to work in teams” (β = 0.21, t = 3.34, sig. = 0.00)
and C3 “Job requires to share ideas, work and information” (β = 0.58, t = 9.20,
sig. =0.00).
iii. Model H3 – C3 “Job requires to share ideas, work and information” (β = 0.75, t
= 17.49, sig. = 0.00).
iv. Model H4 – C3 “Job requires to share ideas, work and information” (β = 0.61, t
= 11.88, sig. = 0.00).
v. Model H5 – C1 “Job requires to work in teams” (β = 0.29, t = 4.28, sig. = 0.00)
and C3 “Job requires to share ideas, work and information” (β = 0.47, t = 7.05,
sig. =0.00).
Employee’s mutual dependency is focused on shared tasks and working
collaboratively to accomplish the deliverables set forth by the management or
organization. Jobs that require employees to work in teams or to share ideas, work
and information are more likely to develop into CNL. Moreover, task
interdependence requires assistance and support from multiple teams to work
collectively (Van der Vegt et al., 2001; Wageman, 2001). However, it is not possible to
ascertain the extent of collaborative effort in this study as MNC employees are widely
distributed across different countries. A positive interdependence is produced among
employees, since they are aware that other members are working together with them
towards a common outcome (Kravcik et al., 2004). Therefore, co-creating of new
knowledge is defined by its genesis process that knowledge has to be shared and is often
dependent on joint task performance or a merging process between individual thought
networks (Doos et al., 2005). The study further supports Grant and Baden-Fuller’s
(2004) argument that self-managing teams, virtual global teams and other cross-

210 | P a g e
functional teams that support joint improvement activities and new product
development (NPD) require positive interdependence for the groups to succeed.
8.4.3 Proposition P3 - Promotive interaction is an antecedent of CNL.
This study has proven that promotive interaction is an antecedent of CNL. It is evident
that the independent construct strongly supports the dependent variable CNL:
i. Model H1 – D1 “Frequently share ideas, work and information” (β = 0.26, t =
4.18, sig. =0.00), D3 “Easily obtain help and support from peers/team” (β =
0.31, t = 4.54, sig. = 0.00) , D4 “Frequently share information online” (β = 0.15,
t = 2.63, sig. = 0.01) and D5 “Team helps each other to learn” (β = 0.19, t =
3.27, sig. = 0.00).
ii. Model H2 – D1 “Frequently share ideas, work and information” (β = 0.24, t =
3.74, sig. =0.00), D2 “Frequently interact with peers/members online” (β = 0.46,
t = 6.38, sig. = 0.00) and D4 “Frequently share information online” (β = 0.18, t =
3.22, sig. = 0.00).
iii. Model H3 – D2 “Frequently interact with peers/members online” (β = 0.38, t =
6.48, sig. = 0.00), D4 “Frequently share information online” (β = 0.22, t = 4.07,
sig. = 0.00) and D5 “Team helps each other to learn” (β = 0.33, t = 6.42, sig. =
0.00).
iv. Model H4 – D2 “Frequently interact with peers/members online” (β = 0.42, t =
6.16, sig. = 0.00) and D4 “Frequently share information online” (β = 0.31, t =
4.47, sig. = 0.00).
v. Model H5 – D4 “Frequently share information online” (β = 0.30, t = 5.27, sig. =
0.00) and D5 “Team helps each other to learn” (β = 0.49, t = 8.48, sig. = 0.00).
Employees who frequently interact with peers or teams are more comfortable in
working in teams and engaging in CNL. CNL requires employees to frequently share
ideas, work and information with others through the use of a computer network.
Extensive interaction is required for employees to communicate and solve problems
with other internal knowledge peers and network with external experts (Gebauer et al.,
2012). This is clearly evident in the study which has shown that participation in a
workgroup (in Model H5) requires frequent information sharing and the ability to help
each other out. Interaction between people in networked learning environments can be
synchronous, asynchronous or both, and this forms an essential part of networked
learning (Goodyear et al., 2005). It requires both technical and interactive skills from
parties in collaboration (Doos et al., 2005). The intensity of interactions may also help

211 | P a g e
to support other constructs, for example, positive interdependence and internal-external
learning. Similar research by Fedor et al. (2003) also found that knowledge generation
in both internal and external forms positively relates to team members’ rating of their
project’s level of success and positive expectation of the project’s impact on the
organization.
8.4.4 Proposition P4 - Internal-external learning is an antecedent of CNL.
This study has found internal-external learning is an antecedent of CNL. It is evident
that the independent construct strongly supports the dependent variable CNL:
i. Model H1 – E1 “Learn from shared information from the network” (β = 0.53, t =
8.21, sig. =0.00), E2 “Receive training to collaborate effectively” (β = 0.22, t =
3.30, sig. =0.00), and E5 “Learn from peers/team” (β = 0.17, t = 3.82, sig. =0.00)
ii. Model H2 – E1 “Learn from shared information from the network” (β = 0.31, t =
3.81, sig. =0.00), E2 “Receive training to collaborate effectively” (β = 0.31, t =
4.13, sig. =0.00), and E5 “Learn from peers/team” (β = 0.22, t = 3.64, sig. =0.00)
iii. Model H3 – E1 “Learn from shared information from the network” (β = 0.32, t =
6.48, sig. =0.00), E2 “Receive training to collaborate effectively” (β = 0.32, t =
4.67, sig. =0.00), and E5 “Learn from peers/team” (β = 0.24, t = 4.21, sig.
=0.00).
iv. Model H4 – E2 “Receive training to collaborate effectively” (β = 0.37, t = 5.85,
sig. =0.00), and E3 “Participate in improvement projects” (β = 0.34, t = 5.39,
sig. =0.00).
v. Model H5 – E3 “Participate in improvement projects” (β = 0.43, t = 6.81, sig.
=0.00) and E5 “Learn from peers/team” (β = 0.32, t = 5.00, sig. =0.00).
Employees learn to obtain shared information from the network and train to collaborate
effectively with their teams (in Model H1). Equally important is the ability to learn from
peers and teams in all aspects of CNL whether to access information online, work
online, share and exchange information, participate in online learning or even work in
groups. To participate in workgroup activities, employees have to learn from their peers
and participate in improvement projects. Teams perform best when engaged iteratively
in reflecting on their action of learning (Edmondson, 2002; Schippers et al., 2003);
reconstruction and involvement in learning transfer processes (Argote et al., 2001); and
internal and external learning processes. The study further confirmed the findings from
other researches on external learning. For instance, Bierly and Daly (2007) found that

212 | P a g e
learning from customers is a predictor of innovation speed, learning from suppliers is a
predictor of operational efficiency, and learning from other industries is a predictor of
superior process technologies. The learning experience forms a positive reputation,
which in turn motivates more employees and external experts to participate in the
knowledge network (Gebauer et al., 2012).
8.4.5 Proposition P5 – Employees’ perceived effectiveness is an antecedent of CNL.
This study has found employees’ perceived effectiveness is an antecedent of CNL. It is
evident that the independent construct strongly supports the dependent variable CNL:
i. Model H1 – F1 “Work efficiently through use of information from the network”
(β = 0.30, t = 4.85, sig. =0.00), F4 “Team achieves goals for projects by using
information from the network” (β = 0.38, t = 5.15, sig. =0.00), and F5 “Team
produces good quality collaborative work” (β = 0.23, t = 3.43, sig. =0.00).
ii. Model H2 – F3 “Use computer to share information effectively” (β = 0.77, t =
19.06, sig. =0.00).
iii. Model H3 – F1 “Work efficiently through use of information from the network”
(β = 0.48, t = 8.04, sig. =0.00), and F5 “Team produces good quality
collaborative work” (β = 0.39, t = 6.60, sig. =0.00).
iv. Model H4 – F2 “Work interdependently using the computer network” (β = 0.39,
t = 5.05, sig. =0.00), and F5 “Team produces good quality collaborative work”
(β = 0.29, t = 3.74, sig. =0.00).
v. Model H5 –F5 “Team produces good quality of collaborative work” (β = 0.69, t
= 15.01, sig. =0.00).
Similarly to Murgolo-Poore et al. (2003) this study found a significant relationship
between perceived effectiveness and the amount of information disseminated through
the network. The frequency at which employees access information online is influenced
by employees’ perception about the system’s ability to generate information for them to
work efficiently and as a result, the team’s ability to attain goals and produce high
quality collaborative work. Likewise, for employees to work online using CNL, the
system has to be effective in sharing information. To share and exchange information
online, employee must perceive that the information that they obtain from the network
will help them to work efficiently and produce high quality collaborative work. In fact,
in all aspects of CNL, the ability to generate high quality collaborative work

213 | P a g e
outperforms all other factors. Employees have high expectations that CNL should be
highly effective.
8.4.6 Proposition P6 - Employees perceived usefulness is an antecedent of CNL.
This study has found employees’ perceived usefulness is an antecedent of CNL. It is
evident that the independent construct strongly supports the dependent variable CNL:
i. Model H1 – G1 “Network system/tool useful for work” (β = 0.30, t = 3.41, sig.
=0.00), G2 “Shared database useful for work” (β = 0.21, t = 2.34, sig. =0.02), G4
“Network system useful for sharing information” (β = 0.22, t = 2.84, sig. =0.00),
and G5 “Online learning is useful” (β = 0.15, t = 2.43, sig. =0.02)
ii. Model H2 – G4 “Network system useful for sharing information” (β = 0.55, t =
8.59, sig. =0.00), and G5 “Online learning is useful” (β = 0.26, t = 4.12, sig.
=0.00)
iii. Model H3 – G4 “Network system useful for sharing information” (β = 0.48, t =
8.04, sig. =0.00), and G5 “Online learning is useful” (β = 0.39, t = 6.60, sig.
=0.00)
iv. Model H4 – G3 “Online meetings with external parties are useful” (β = 0.31, t =
4.73, sig. =0.00), and G5 “Online learning is useful” (β = 0.39, t = 5.94, sig.
=0.00)
v. Model H5 – G1 “Network system/tool useful for work” (β = 0.22, t = 2.08, sig.
=0.04), G2 “Shared database useful for work” (β = 0.26, t = 2.37, sig. =0.02),
and G5 “Online learning is useful” (β = 0.29, t = 4.08, sig. =0.00)
Like perceived effectiveness, the study also borrows the construct of perceived
usefulness from TAM to measure the antecedents of CNL. In general, employees expect
the online learning system or programme to be useful in order for CNL to be successful
in all aspects. To participate in workgroup activities (model H5) and a network system,
a shared database and online learning has to be useful for work. Likewise, to work
online (Model H2) and share and exchange information online (Model H3), the network
system has to be useful for sharing information, as well as online learning. In another
empirical study, Ritchie et al. (2011) found that a greater level of usefulness will lead to
higher levels of intention to use an application software.
8.4.7 Proposition P7 – For MNCs and SMEs, the influence of CNL is different.
This study has found that CNL is different between MNCs and SMEs. The results can
be summarized as follows:

214 | P a g e
i. Online learning– MNCs (M=3.35, s.d. =1.45); SMEs (M=1.99, s.d. =1.41).
ii. Shared database– MNCs(M=4.17, s.d.=1.41); SMEs (M=2.78, s.d.=1.60).
iii. Online meetings– MNCs (M= 2.80, s.d.=1.48); SMEs (M=1.68, s.d. =1.21).
iv. Email for work– MNCs (M=3.60, s.d.=1.07); SMEs (M=2.54, s.d. =1.38).
The differences can be further explained by the qualitative results. MNCs are better
equipped and have better resources at their disposal. Often SMEs struggle to adopt and
benefit from such systems, citing lack of financial resources and technical capability as
reasons (Morrell & Ezingeard, 2002). Morrell and Ezingeard (2002) also found that
“lack of vision and awareness are restricting the adoption and the realization of benefits
associated with such systems” (p.46). Past experiences, learnt beliefs and values are the
hindrances to the acceptance of new thinking and tend to place more emphasis on
management of tacit knowledge (Thakkar et al., 2011). CNL is not new to most MNCs
as e-learning and learning management systems (LMS) have been widely used among
large organizations. Higher business and operational complexity further explain why
most MNCs require the use of multiple platforms and multiple systems, which often
have to be seamlessly integrated. Branzei, Nakamura and Vertinsky (2011) and Branzei
(2005) in their empirical researches on collaborative R&D also show differences
between MNCs and domestic firms. MNCs invest more in collaborative R&D at low
levels of experiential learning that requires well-honed routines and micro-processes,
whereas collaborative R&D calls for exploration and quick adaptation. MNCs are more
likely than domestic firms to show such ambidexterity. This study supports the
proposition that CNL is indeed different between MNCs and SMEs in term of the
intensity of usage. The following propositions P7a, P7b, P7c and P7d further deliberate
on these differences.
8.4.8 Proposition P7a – The influence of online learning is different between MNCs
and SMEs.
The study found significant difference between groups t(127.71) = 6.76, p< 0.05).
Those participants from MNCs (M = 3.35, s.d. = 1.45) spent more hours on online
learning compared to those from SMEs (M = 1.99, s.d.= 1.41). Unlike, MNCs which
provide e-learning as part of the organizational development (OD) strategy, SMEs are
more focused on informal learning. The phenomena is explained by Conlon (2004) who
in his review found that more than 80% of employees’ learning content comes from

215 | P a g e
informal learning which is linked to both incidental learning and experimental learning.
Informal learning refers to the individual gains of skills, knowledge, and attitudes from
everyday experience and from one's social environment (Moreland & Lovett, 1997).
Ridoutt et al. (2002) also found that it was the nature of training, rather than the volume,
that varied by enterprise size. They found that SMEs engage in more informal training
than do larger enterprises. Similarly, Schofield (2003) found that three of the companies
studied (Ford, ANZ, and Qantas) viewed e-learning as essential in implementing a
corporate strategy to deal with the competitive pressures of today’s environment.
8.4.9 Proposition P7b – The influence of a shared database is different between MNCs
and SMEs.
The study has found that the use of a shared database is not significantly different for
CNL between MNCs and SMEs. Although there was a difference between hours
participants spent on using a shared database or network information system per week –
MNCs (M = 4.17, s.d. =1.41) and SMEs (M = 2.78, s.d. = 1.60), the difference was not
significant t(244) = 6.68, p> 0.05). In other words, both MNCs and SMEs recognize the
importance and use of a shared database or network system for their employees in the
sharing of information across the organization.
8.4.10 Proposition P7c – The influence of online meetings is different between MNCs
and SMEs.
The use of online meetings is more significant for CNL in MNCs than SMEs. Those
from participants from MNCs spent more hours using online meetings (M = 2.80, s.d. =
1.48) as compared to those from SMEs (M = 1.68, s.d. = 1.21) and the difference was
moderately significant t(111.42) = 6.32, p< 0.05). Although the proposition is well
supported, the use of online meetings is comparatively lower than other means and uses
of CNL like shared database, email and online learning.
8.4.11 Proposition P7d – The influence of email for work is different between MNCs
and SMEs.
The use of email for work is more significant for CNL in MNCs than SMEs. There was
a significant different between groups t(101.34) = 5.80, p< 0.05): Participants from
MNCs spent more hours emailing (M =3.60, s.d. = 1.07) compared to those in SMEs (M

216 | P a g e
= 2.54, s.d. = 1.38). Although employees in most SMEs are provided with email to
perform their work, the amount of hours spent on communication and sharing
information among employees from MNCs is still dominant.
8.5 Summary
The propositions P1, P2, P3, P4, P5 and P6 are strongly supported. However, proposition
P7 is partially supported due to the fact that proposition P7b being rejected. Participants
from SMEs did not show a significant difference from those from MNCs in regards to
the use of a shared database. Participants from SMEs spent as much time using a shared
database or network information system as those from MNCs.

217 | P a g e
CHAPTER 9: CONCLUSION
9.1 Introduction
This chapter highlights key contributions, acknowledges research issues and presents
avenues for future research. Martin (2004) posits that the application of theory is a vital
process, in which the researcher has a significant role to play, particularly where the
situation or the process is complex or new. The discussion in this chapter narrows the
gap between theory and praxis, and identifies practical implications for organizations,
managers and employees.
9.2 Contribution of the Study
The lack of CNL study in manufacturing in the literature has been observed and
discussed Chapter 2. Previous studies focused on knowledge management and
organizational learning. This study contributes significantly to the body of knowledge
for use of CNL in manufacturing and has explored the importance of CNL from the
perspective of the manufacturing environment linking four primary domains:
i. Bridging the theory and praxis of CNL
ii. Development of an integrative CNL framework for manufacturing
iii. Development of CNL instrument and measurement
iv. Adopting mixed method in exploratory research of CNL
v. Integration of CNL into operational management
vi. Other practical implications of CNL
9.2.1 Bridging the Theory and Praxis of CNL in Manufacturing
This study contributes significantly to the theoretical exposition on the roles of theory
and praxis of CNL in the manufacturing environment. Truch, Ezingeard and Birchall
(2000) posit that there are differences in expectations between the industry and
academics. To overcome the differences, this study proposes a set of pragmatic
antecedents through validated and critical analysis of knowledge transfer and
information sharing to the practice of CNL in manufacturing by examining employees’
perceptions and motivations to share and collaborate through complex networks of

218 | P a g e
information systems. Employees’ learning is interwoven into intricate networked
systems that are less formalized and often unstructured. As attested by Camarinha-
Matos and Afsarmanesh (2007), collaborative networked organizations (CNO) have
extended beyond the boundaries of face-to-face communication. This thesis amplifies
the relevance of socio-technical systems (STS) theory and bridges the gap between
social and collaborative technologies, and interactions between complex CNL system
infrastructures and manufacturing employees. The findings are that for CNL to be
effective, it is imperative to provide information that is relevant for employees to
perform their daily work activities. Collaborative tools have to be strategically planned,
designed, purposeful and supported by management to facilitate learning and sharing of
information.
9.2.2 Development of an Integrative CNL Framework for Manufacturing
CNL is a recent phenomenon for which no coherent theoretical framework previously
existed in manufacturing. This study presents a framework for CNL in manufacturing.
As suggested in the literature, previous theoretical frameworks are based on an
educational context (Martínez et al., 2006). Arbaugh and Benbunan-Fich (2004) also
recommend research on the application of theoretical frameworks in the study of
networked learning and supports. Redmond and Lock (2006) suggest that “the focus of
the framework is to shift from online learning environments into collaborative and
interactive space” (p.270). The co-construction of knowledge, which is an
interdependent process of interaction with the social environment, should be the
emerging force within the framework (Redmond et al., 2006). CNL is used to integrate
information sharing and transformation into collaborative business processes. Drawing
from the findings, the study recommends organizations and managers to adopt an
integrative CNL framework (see Figure 8-1) for design and development of a more
complete networked learning system. The focus expands from online learning or e-
learning to a much broader scope encompassing collaborative and interactive
workspaces. Unlike educational collaborative learning models which are restrictive, the
CNL framework provides a holistic perspective for workplace learning that is
unbounded, engaging and accounts for users’ perceptions about technology.

219 | P a g e
9.2.3 Development of CNL Instrument and Measurement
Socio-technical system (STS) theory through the development and validation of a
survey instrument and measurement scales for studying the antecedents of CNL in the
context of manufacturing is an important contribution to this study. Prior studies in
collaborative learning merely mirrored the use of computer mediated learning,
particularly among participants in learning institutions or with the focus on a population
of students. The CNL survey instrument used in this study, however, examines
employees from manufacturing organizations. The survey instrument (see Appendix D)
complements the use of the technology acceptance model (TAM) which is theoretically
grounded, well documented in the literature and widely used and accepted within
information systems to explain the acceptance of technology (Davis, 1986, 1989;
Venkatesh et al., 2003). This study has expanded the TAM model to include
organizational support, interdependence, interactions and internal-external learning as
clear factors which have a direct influence on employee’s adoptions and engagements in
CNL. Through content analysis, the importances of these factors were again emphasized
and the validity of the survey instrument was thus strongly supported.
9.2.4 Adopting Mixed Methods in Exploratory Research of CNL
Previous empirical studies used ethnographic approach, case studies, surveys (Goggins
et al., 2011), content analysis, critical event recall and social network analysis (De Laat,
2006). In this study, the findings from quantitative and qualtitative approach blends well
into the scope of the research and further strengthened social-technical systems (STS)
theory. The qualitative findings corroborated with the results from quantitative survey
and add rich explanatory dimensions and insights into the phenomena. The explanatory
findings from qualitative approach further strengthen the validity of the quantitative
study. Conversely, by using qualitative approach without quantitative findings, weaken
the transferability and confirmability of the research as described in section 7.6. In
addition, the hierarchical coding scheme (in Table 7-50) can be transfered and used for
other similar areas of networked learning research.

220 | P a g e
9.2.5 Integration of CNL to Operational Management
It is postulated that the integration of CNL into organizational design and
manufacturing work systems will accelerate organizational learning. Network thinking
that recognizes the individual elements (actors) of the system enterprise and their
reciprocal relationships is becoming increasingly important (Picot et al., 2008). Through
the use of the CNL framework, it is shown that managers are required to provide the
impetus to enhance learning and knowledge sharing. Manufacturing organizations
should expand the use of virtual teams for promotion of knowledge transformation aside
from project management, new product introduction, technology transfer and
engineering change management. The growth of collaborative networks is expected to
increase the propensity of interactions among manufacturing employees. This study has
demonstrated that employees from diverse roles and responsibilities can work
collectively and effectively in any networked organization. Inevitably, employees and
their workgroups will become more interdependent in their new roles, given that
individuals’ roles have been intertwined into a complex information network within an
organization. As a result, organizational design may be tasked to nurture organizational
development and other essential networking skills in the context of operational
management.
9.2.6 Other Practical Implications of CNL
This study finds practical implications of CNL for manufacturing organizations,
managers and employees to be as follows:
For Manufacturing Organizations, the use of CNL to:
i. Integrate between learning management system (LMS) and work systems, where
employees are enable to make sense of online learning modules as useful tools
and methods to perform their work.
ii. Create work systems that promote learning using collaborative technologies, and
which become the game changer for networked organizations. Learning evolves
beyond learning management system (LMS).
iii. Evolve mobile enterprise system from static information to transformative
applications where information can be exchanged and transformed from

221 | P a g e
anywhere and everywhere. Employees can access enterprise networks using
mobile CNL applications.
iv. Leverage on enterprise information systems (EIS) through use of CNL to
incorporate product database management (PDM), manufacturing electronic
system (MES) and other product development systems into seamless
information integrations.
v. Enforce the idea of shared network systems among employees. No longer is
there a need for one workstation for every employee. CNL can be used locally
and globally, where shared networked workstations are shared and information
is highly connected and accessible.
vi. Expand beyond intra-enterprise and provide critical learning and sharing of
information with external stakeholders like third party logistics, suppliers,
partners and customers.
For Managers, the use of CNL to:
i. Manage daily improvements (MDI) and assigned accountability to individuals
and work groups. Every transactions, interactions and information exchanges
can be tracked and updated to reflect current state of operational performance.
ii. Accelerate learning curve among new employees and old employees in cross
training. Information is easily and effectively made accessible through CNL.
iii. Appraise employees’ performance by measuring their contributions in ideas and
information shared through work groups, work tasks and projects. The
frequency, intensity and value of individual contributions can be objectively
measured and displayed in online dashboards.
iv. Use as a set of management levers that reduce barriers to collaboration leading
to value creation processes by leveraging internal-external expertise.

222 | P a g e
For Employees, the use of CNL to:
i. Access network systems and database for work and learning. This is crucial for
networked organizations. Already we see a trend whereby some manufacturing
organizations are dependent on information systems to perform their work.
ii. Share share ideas, knowledge and information designed to promote interactions
and interdependencies among employees. These interactions may not necessary
require face-to-face communication. Communication is widely established
though use of collaborative technologies.
9.3 Research Issues
This study acknowledges some of the limitations:
i. The study examined factors elicited from the literature, but also identified other
variables such as “quality of information” and “employees’ roles and
responsibilities” as antecedents. Several studies postulate that the quality of
online information may affect the sustainability of a system and quality to be
identified and understood (Ahn et al., 2004; Cao et al., 2005a; DeLone et al.,
2003; Lin, 2007b; Rodgers et al., 2005).
ii. As this study was limited to the Malaysia manufacturing environment, the
findings can only be generalized to other contexts. Outside Malaysia the outputs
of the study are referential and indicative.
iii. Participants for this study were voluntary and random. There were 246
participants. The sample size for the quantitative analysis limits generalization
of the results beyond the specific sample used in this study (Nardi, 2006). A
study with a larger sample size would allow more focus on the use of different
collaborative technologies in other industries. A larger sample would facilitate
the testing of more complex models, with the focus on group dynamisms and
could relate CNL with performance and operational outcomes.
iv. In designing the questionnaire, the researcher was aware that the quantitative
data collection method using the survey instrument has a tendency to limit the

223 | P a g e
scope of a study. Care was taken by use of the pilot study to review questions to
ensure that they were not ambiguous (Creswell, 2009).
v. The instrument was tested and survey data were collected over a seven-month
period, raising the possibility of some bias. Steps were taken to mitigate this
concern, including careful design of the questionnaire and pilot study and the
separation of qualitative data.
9.4 Recommendations for Future Research
Development of an effective CNL system requires meticulous planning and alignment
with operational and business strategies. As discussed, the level of organizational
support and employees’ perceptions influence the use of CNL. Although the adoption of
CNL is mainly determined by organizational and leadership strategies, its effectiveness
is highly dependent on the members’ acceptance (managers and workers), nuances and
in-depth application of collaborative technology in all organizational work systems as
well as in project or workgroup oriented tasks. For CNL to be effective, organization
and management of the information and knowledge produced by interaction through
collaborative or individual actions is necessary (Daradoumis et al., 2000).
9.4.1 Development of New Collaborative Technology
Although suitable infrastructures as well as information and communication
technologies (ICT) exist, especially web-based tools to facilitate and enable the process
of knowledge transfer (Muller-Prothmann et al., 2009), technology itself does not
resolve all the challenges of learning and collaboration. As such, the research on the
selective use of collaborative technology in organizational learning, information
transmission and knowledge transformation needs to be further explored. Similarly,
Rittgen (2009) cautions that those engaged in collaboration not only bring their different
organizational cultures but also different, often incompatible, information systems. This
is particularly crucial for large manufacturing organizations that require information
exchange between multiple sites, suppliers, customers and developers. Future research
could examine how organizations address this gap and develop an integration process
for the diverse operating systems and collaborative technologies, in support of learning
environment using appropriate pedagogic theory (Huang et al., 2009).
224 | P a g e
9.4.2 Embedding Social Contexts in Collaborative Networked Learning
Human activity is highly nuanced and contextualized. Collaboration takes effort and the
intention of employees to work collaboratively with others (Addleson, 2013). Lipponen
(2002) and Addleson (2013) argue against the notion that technology alone guarantees
that employees will collaborate or that technology will produce collaboration. Similarly,
Ackerman (2000) found a fundamental mismatch between what is required socially and
what technology has to offer. Most application frameworks are designed to support
business requirements and lack the technical mechanisms to support the social
dimension. The balance between human-computer interactions (HCI), and human-
human interactions are becoming vague. HCI cannot postulate all aspects of human
social requirements. Building a CNL system requires employees to think in terms of
organized networks of mutual interdependence against the strong tendencies for
employees to follow bureaucratic norms in order to secure their autonomy and
resentment towards intrusions by peers and management (Heckscher, 2007). Although
the creation of interdependencies through cross-functional teams, network ties and
training in consensual problem solving techniques enable effective collaboration, they
have failed to overcome entrenched individual differences (Heckscher, 2007). Future
research could address organizational strategies in promoting social interactions and
collaboration in manufacturing and determine how employees overcome their social and
cultural differences in order to collaborate effectively. Also, is there any moderating
effect of demographics (i.e. age, gender, education, position) on CNL?
9.4.3 Organizational Design for Collaborative Networked Learning
In order to obtain maximum value from CNL, it is found that management has to design
and provide strategies, policies, procedures, training and value to its employees
surrounding the use of technology (Lee et al., 2009). In retrospect, there must be a
consistency between policy, structure and management to propagate CNL. Lee and
Holmquist (2009) also caution against significant increase in the volume of messages,
user-to-user time to respond, length and detail of the messages, role determination of the
recipients and accountability for the information received. Therefore, organizational
design needs to envisage change in the work systems, and provide systems that will
allow manufacturing employees to openly document and share their knowledge about

225 | P a g e
the process, product and design. Others like Muller-Prothmann and Frost (2009)
highlight the importance of overcoming knowledge-related barriers such as knowledge
codification, translation, evaluation, and integration into related business processes.
Further research is needed to explore a new organizational design for CNL. How could
the Enterprise Information System (EIS) be logically, consistently and effectively
organized, so that information could easily be accessible and made use of as and when
required? Future research may also examine the dynamics of workgroups or virtual
teams in relation to the use of CNL. How could workgroups in collaboration be
effectively organized and/or structured?
9.4.4 New Paradigm for Workplace Learning
The opportunity to learn in a workplace is not just a product of training programs but
open opportunities to participate in work-related activities from which all employees
learn (Billet, 2001, 2004; Fuller et al., 2004; Keating, 2006). Manufacturing
organizations need to transform and embrace knowledge culture, create trust-building
activities, and promote team building, communication training, localization and
transparency of expertise (Muller-Prothmann et al., 2009; Rich et al., 2009). Previous
studies have also shown that employees will not share information in the absence of a
suitable organizational reward structure (Orlikowski, 1992b). Managers and employees
may not share similar incentive or reward structures, resulting in systems being less
used than desired (Grudin, 1989). In addition, managers and employees may have
different perspectives or opinions of their work because their roles are different
(Hopkins & Maglen, 2000). Whereas in the past, where boundaries between jobs were
the basis for job classifications, CNL disengages these boundaries and undermines the
system of training entitlements for employees. A workplace would ideally support
employees to identify individual learning goals and engage with others in learning
networks (Smith, 2003). Further research could focus on building trust and relationship
among employees engaging in CNL. Besides trust, how would frequency, intensity, and
centricity of interaction influence CNL and transform workplace learning?
The researcher would welcome any future replication study and the opportunity to
collaborate in using different sources of data or with longitudinal studies in different
environments.

226 | P a g e
REFERENCES
Abbot, K., & Sarin, S. (1994). Experience with workflow management: Issues for the
next generation. Proceedings of the ACM Conference on Computer-Supported
Cooperative Work (CSCW’94), 113-120.
Achrol, R. S., & Kotler, P. (1999). Marketing in the network economy. Journal of
Marketing, 63, 146-163.
Ackerman, M. S. (1994). Augmenting the organizational memory: A field study of
answer garden. Proceedings of the ACM Conference on Computer-Supported
Cooperative Work (CSCW’94), 243-252.
Ackerman, M. S. (2000). The intellectual challenge of CSCW: the gap between social
requirements and technical feasibility. Human-Computer Interaction., 15, 179-
203.
Ackerman, M. S., & Malone, T. W. (1990). Answer garden: A tool growing
organizational memory. Proceedings of the ACM Conference on office
information systems, 31-39.
Adamides, E., & Karacapilidis, N. (2006). A knowledge centred framework for
collaborative business process modelling. Business Process Management
Journal, 12(5), 557-575.
Addleson, M. (2011). Beyond management: Taking charge at work. London: Palgrave
Macmillan.
Addleson, M. (2013). Will the real story of collaboration please stand up so we can see
it properly? Knowledge Management Research & Practice, 11, 32-40.
Adler, P. A., & Adler, P. (1994). Observational techniques. In N. K. Denzin & Y. S.
Lincoln (Eds.), Handbook of Qualitative Research (pp. 377-392). Thousand
Oaks: Sage Publications.
Agarwal, R., & Sambamurthy, V. (2002). Principles and models for organizing the
information technology function. MIS Quarterly Executive, 1(1), 1-16.
Agre, P. E. (2001). Changing places: Contexts of awareness in computing. Human-
Computer Interaction, 16, 177-192.
Ahn, T., Ryu, S., & Han, I. (2004). The impact of the online and offline features on the
user acceptance of Internet shopping malls. Electronic Commerce Research and
Applications, 3(4), 405-420.
Alavi, M., & Liedner, D. E. (2001). Research commentary: Technology-mediated
learning - A call for greater depth and breadth of research. Information Systems
Research, 12(1), 1-10.

227 | P a g e
Allan, J., & Lawless, N. (2005). Learning through online collaboration by SME staff: A
scoping investigation into likely team-role stressors. Education + Training,
47(8/9), 653-664.
Anfara, V. A., Brown, K. M., & Mangione, T. L. (2002). Qualitative analysis on stage:
Making the research process more public. Educational Researcher, 31(7), 28-38.
Angrosino, M., & Mays de Perez, K. (2003). Rethinking observation: From method to
context. In N. K. Denzin & Y. S. Lincoln (Eds.), Collecting and Interpreting
Qualitative Materials (2 ed., pp. 107-154). Thousand Oaks: Sage Publications.
Araujo, A. L. (2009). Instrumental and Social Influences on Adoption of Collaborative
Technologies in Global Virtual Teams. In J. Salmons & L. Wilson (Eds.),
Handbook of Research on Electronic Collaboration and Organizational
Synergy. New York: Information Science Reference.
Arbaugh, J. B., & Benbunan-Fich, R. (2004). In defense of using quantitative
approaches to research networked management learning: A response to Hodgson
and Watland. Management Learning, 35(2), 117-124.
Argote, L., Gruenfeld, D., & Naquin, C. (2001). Group learning in organizations. In M.
E. Turner (Ed.), Groups at work: Advances in theory and research (pp. 369-
411). New York: Erlbaum.
Argyris, C., & Schon, D. A. (1978). Organisational learning: A theory action
perspective. Reading MA: Addison-Wesley.
Armitage, A. (2007, 5-8 September 2007). Mutual research designs: Redefining mixed
methods research design. presented at the meeting of the British Educational
Research Association Annual Conference, Institute of Education, University of
London.
Ashton, D. (2004). The impact of organisational structure and practices on learning in
the workplace. International Journal of Training and Development, 8(1), 43-53.
Atkinson, P., & Delamont, S. (2008). Analytic perspectives. In N. K. Denzin & Y. S.
Lincoln (Eds.), Collecting and interpreting qualitative materials (3 ed., pp. 285-
311). Thousand Oaks: Sage publication.
Aube, C., Rousseau, V., & Morin, E. M. (2007). Perceived organizational support and
organizational commitment: The moderating effect of locus of control and work
autonomy. Journal of Managerial Psychology, 22(5), 479-495.
Baecker, R. M., Nastos, D., Posner, I. R., & Mawby, K. L. (1993). The user centred
iterative design of collaborative writing software. Proceedings of the ACM
Conference on Human factors in Computing Systems (CHI’93), 399-405.
Baker, M., de Vries, E., & Lund, K. (1999). Designing computer-mediated epistemic
interactions. Proceedings of the 9th International Conference on Artificial
Intelligence in Education (AI-ED 99), 139-146.

228 | P a g e
Baldwin, T. T., Bedell, M. D., & Johnson, J. L. (1997). The social fabric of a team-
based M.B.A. program: Network effects on student satisfaction and
performance. Academy of Management Journal., 40, 1369-1397.
Balmisse, G., Meingan, D., & Passerini, K. (2009). Selecting right knowledge
management tools: Software trends and key evaluation criteria. In M. E. Jennex
(Ed.), Knowledge Management Organizational Memory, and Transfer
Behaviour. (pp. 270-280). New York: Information Science Reference.
Barkley, E. F., Cross, K. P., & Major, C. H. (2005). Collaborative learning techniques:
A handbook for college faculty. San Francisco: Jossey-Bass.
Barron, B. (2003). When smart groups fail. The Journal of the Learning Science, 12,
307-359.
Barua, A., Konana, P., & Whinston, A. B. (2004). An empirical investigation of net-
enabled business value. MIS Quarterly, 28(4), 585-620.
Basu, R. (2001). New criteria of performance management: A transition from enterprise
to collaborative supply chain. Measuring Business Excellence, 5(4), 7-12.
doi:10.1108/eum0000000006514
Basu, R., & Wright, N. (2005). Total operations solutions. Amsterdam: Elsevier
Butterworth-Heinemann.
Bauer, J., Festner, D., Gruber, H., Harteis, C., & Heid, H. (2004). The effects of
epistemological beliefs on workplace learning. The Journal of Workplace
Learning, 16(5), 284-292.
Bearden, W. O., Hardesty, T., & Rose, R. (2001). Consumer self-confidence
refinements in conceptualization and measurement. Journal of Consumer
Research, 28, 121-134.
Beijerse, R. P. (2000). Knowledge management in small and medium-sized companies:
knowledge management for entrepreneurs. Journal of Knowledge Management,
4(2), 162-177.
Belanger, F., & Allport, C. D. (2008). Collaborative technologies in knowledge
telework: An exploratory study. Information Systems Journal, 18, 101-121.
Benbunan-Fich, R., Hiltz, S. R., & Turoff, M. (2003a). A comparative content analysis
of face-to-face vs. asynchronous group decision making. Decision Support
Systems, 34(4), 457-469.
Benbunan-Fich, S., & Hiltz, S. R. (2003b). Mediators of the effectiveness of online
courses. Transactional on Professional Communication, 46(4), 298-312.
Benford, S., Bowers, J., Fahlen, L., Marian, J., & Rodden, T. (1994). Supporting
cooperative work in virtual environments. The Computer Journal, 37(8), 653-
668.

229 | P a g e
Bennett, S. (2004). Supporting collaborative project teams using computer-based
technologies. . In T. S. Roberts (Ed.), Online collaborative learning: theory and
practice (pp. 1-27). Hershey: Idea Group Publishing.
Bereiter, C., & Scardamalia, M. (2003). Learning to work creatively with knowledge. In
E. Corte, L. Verschaffel, N. Entwistle, & J. Merrienboer (Eds.), Powerful
learning environments: Unraveling basic components and dimensions. .
Amsterdam: Earli.
Berends, H. (2005). Exploring knowledge sharing: moves, problem solving and
justification. Knowledge Management Research & Practice, 3(2), 97-105.
Bergquist, M., & Liungberg, J. (2001). The power of gifts: Organizing social
relationships in open source communities. Information Systems Journal, 11(4),
305-320.
Berry, L. L., Shankar, V., Parish, J. T., Cadwallader, S., & Dotzel, T. (2006). Creating
new markets through service innovation. Sloan Management Review, 47(2), 56-
63.
Bhagat, R. S., Kedia, B. L., Harveston, P. D., & Triandis, H. C. (2002). Cultural
Variations in the Cross-Border Transfer of Organisational Knowledge: An
Integrated Framework. Academy of Management Review, 27(2), 204 –221.
Bhatt, G., Gupta, J. N. D., & Kitchens, F. (2005). An exploratory study of groupware
use in knowledge management process. Journal of Enterprise Information
Management, 18(28-46).
Bierly, P. E., & Daly, P. S. (2007). Sources of external organisational learning in small
manufacturing firms. International Journal Technology Management, 38(1/2),
45–68.
Biesta, G. (2010). Pragmatism and the philosophical foundations of mixed methods
research. In A. Tashakkhori & C. Teddlie (Eds.), Handbook mixed methods in
social and behavioral research (pp. 95-117). Thousand Oaks: Sage.
Billet, S. (2001). Learning through work: Workplace affordances and individual
engagement. Journal of Workplace Learning, 13(5), 209-214.
Billet, S. (2004). Workplace participatory practices: Conceptualizing workplace as
learning environments. Journal of Workplace Learning, 16(6), 312-324.
Bjerrum, E., & Bødker, S. (2003, 14–18 September 2003). Knowledge sharing in the
‘‘new office’’ – Possibility or problem? In E. K. Kuutti, K. G., Fitzpatrick, P.
Dourish, & K. Schmidt (Chair), Symposium conducted at the meeting of the
Proceedings of the Eighth European Conference on Computer Supported
Cooperative Work, Helsinki, Finland.
Black, T. R. (2005). Doing quantitative research in the social science. Thousand Oaks:
Sage.

230 | P a g e
Blaikie, N. (2000). Designing social research. Cambridge: Polity Press.
Blaikie, N. (2010). Designing social research (2 ed.). Cambridge: Polity Press.
Bogden, R. C., & Biklen, S. K. (2003). Qualitative research for education: An
introduction to theory and methods (4 ed.). Boston: Allyn and Bacon.
Bogenrieder, I., & Nooteboom, B. (2004). Learning groups: What types are there? A
theoretical analysis and empirical study in a consultancy firm. Organizational
Studies, 25(2), 287-313.
Boot, R., & Reynolds, M. (1997). Group, groupwork and beyond. In J. Burgoyne & M.
Reynolds (Eds.), Management learning: Integrating perspectives in theory and
practice (pp. 89-104). London: Sage.
Booth, S., & Hulten, M. (2003). Opening dimensions of variation: an empirical study of
learning in a web-based discussion. Instructional Science, 31(1-2), 65-86.
Bouhnik, D., Giat, Y., & Sanderovitch, Y. (2009). Asynchronous learning sources in a
high-tech organization. Journal of Workplace Learning, 21(5), 416-430.
Brandon, D. P., & Hollingshead, A. B. (2008). Collaborative knowledge and training in
online groups. In V. I. Sessa & M. London (Eds.), Work group learning (pp.
285-314). New York, London: Lawrence Erlbaum Associates.
Branzei, O. (2005). Product innovation in heterogeneous R&D networks. University of
British Columbia.
Brewer, J., & Hunter, A. (2006). Foundations of multimethods research: Synthesizing
styles (2 ed.). Thousand Oaks: Sage.
Brey, P. (2005). The epistemology and ontology of human–computer interaction. Minds
and Machines, 15, 383-398.
Brophy, P. (2001). Networked learning. Journal of Documentation, 57(1), 130-156.
Brown, J. S., Collins, A., & Duguid, P. (1989). Situated cognition and the culture of
learning. Educational Researcher, 18, 32-42.
Brown, J. S., & Duguid, P. (1991). Organizational learning and communities of
practice: Toward as unified view of working, learning and innovation.
Organization Science., 2(1), 40-56.
Brown, J. S., & Duguid, P. (2000). The social life of information. Boston: Harvard
University Press. .
Brown, S. C., Stevens, R. A. J., Troiano, P. F., & Schneider, M. K. (2002). Exploring
complex phenomena: Grounded theory in student affairs research. Journal of
College Student Development, 43(2), 1-11.

231 | P a g e
Bruffee, K. A. (1995). Sharing Our Toys: Cooperative Learning versus Collaborative
Learning. Change, 27(1), 12-18.
Bryman, A. (1988). Quantity and quality in social research. London: Unwin Hyman.
Bryman, A. (2004). Social Research Methods (2 ed.). Oxford: Oxford University Press.
Bryman, A. (2006). Integrating quantitative and qualitative research: How is it done?
Qualitative Research, 6(1), 97-113. doi:10.1177/1468794106058877
Bryman, A. (2008). Social research methods (3 ed.). Clarendon, Oxford: Oxford
university press.
Bryman, A., & Cramer, D. (2005). Quantitative data analysis with SPSS 12 and 13.
London: Routledge.
Camarinha-Matos, L. M., & Afsarmanesh, H. (2006a). Collaborative networks: Value
creation in a knowledge society. In K. Wang, G. Kovacs, M. Wozny, & M. Fang
(Eds.), International Federation for Information Processing (IFIP), Vol. 207.
Knowledge Enterprise: Intelligent Strategies in Product Design, Manufacturing
and Management (pp. 26-40). Boston: Springer.
Camarinha-Matos, L. M., & Afsarmanesh, H. (2006b). Knowledge enterprise:
Intelligent strategies in product design, manufacturing and management.
International Federation for Information Processing (IFIP), 207, 26-40.
Camerer, C. F. (2004). A cognitive hierarchy model of games. The Quarterly Journal of
Economics. , 119(3), 861-898.
Cameron, S., & Price, D. (2009). Business Research Method. London: Chartered
Institute of Personnel and Development.
Campbell, D. T., & Fiske, D. W. (1959). Convergent and dscriminant validation by the
multitrait-multimethod matrix. Psychological Bulletin, 56, 81-105.
Cao, M., Zhang, Q., & Seydel, J. (2005a). B2C e-commerce web site quality: An
empirical examination. Industrial Management and Data Systems, 105(5), 645-
651.
Cao, Q., & Dowlatshahi, S. (2005b). The impact of alignment between virtual enterprise
and information technology on business performance in an agile manufacturing
environment. Journal of Operations Management, 23, 531-550.
Carchiolo, V., Longheu, A., & Malgeri, M. (2002). Adaptive formative paths in a Web-
based learning environment. Educational Technology & Society, 5(4), 64-75.
Carroll, J. M., Rosson, M. B., Farooq, U., & Xiao, L. (2009). Beyond being aware.
Information and Organization, 19, 162-185.
Cascio, W. F., & Shurygailo, S. (2003). E-leadership and virtual teams. Organizational
Dynamics, 231(4), 362-376.

232 | P a g e
Cavana, R. Y., Delahaye, B. L., & Sekaran, U. (2001). Applied business research:
Qualitative and quantitative methods. Singapore: John Wiley.
Chan, T.-W., Hue, C.-W., Chua, C.-Y., & Tzeng, O. J. L. (2001). Four spaces of
network learning models. Computers & Education, 37, 141-161.
Chatenier, W. D., Verstegen, J. A. A. M., Biemans, H. J. A., Mulder, M., & Omta, O.
(2009). The challenges of collaborative knowledge creation in open innovation
team. Human Resource Development Review, 8(3), 350-381.
Chen, B. (2011). Antecedents or processes? Determinants of perceived effectiveness of
interorganizational collaboration for publc service delivery. International Public
Management Journal, 13(4), 381-407.
Chen, J. S., & Tsou, H. T. (2007). Information technology adoption for service
innovation practices and competitive advantage: the case of financial firms.
Information Research, 12(3), Paper 314.
Chen, Y. S., Kao, T. C., & Sheu, J. P. (2003). A mobile learning system for scaffolding
bird watching learning. Journal of Computer Assisted Learning, 19(3), 347-359.
Chesbrough, H. W. (2003a). The era of open innovation. MIT Sloan Management
Review, 44, 35-41.
Chesbrough, H. W. (2003b). Open innovation: The new imperative for creating and
profiting from technology. Boston, MA: Harvard Business School Press.
Chi, M. T. H. (1997). Quantifying qualitative analysis of verbal data: A practical guide.
The Journal of the Learning Sciences, 6(3), 271-315.
Chiaburu, D. S., Van Dam, K., & Hutchins, H. M. (2010). Social support in the
workplace and training transfer: A logitudinal analysis. International Journal of
Selection and Assessment, 18(2), 187-200.
Cho, H., Lee, J., Gay, G., & Stefanone, M. (2005). Development of computer-supported
collaborative social networks in a distributed learning community. Behaviour &
Information Technology, 24(6), 435-447. doi:doi:10.1080/01449290500044049
Choi, M. (2006). Communities of practice: An alternative learning model for
knowledge creation. British Journal of Educational Technology, 37(1), 143-146.
Choy, S., Bowman, K., Billett, S., Wignall, L., & Haukka, S. (2008). Effective models of
employment based learning. Melbourne: NCVER.
Christiansen, E. (2001, August 11–14). Knowledge management in a thinking system.
presented at the meeting of the IRIS24 2001, Ulvik,Norway,.
Chudoba, K. M., Wynn, E., Lu, M., & Watson-Manheim, M. B. (2005). How virtual are
we? Measuring virtuality and understanding its impact in a global organization.
Information Systems Journal, 15, 279-306.

233 | P a g e
Churchill, G. A. (1979). A paradigm for developing better measures of marketing
constructs. . Journal of Marketing Research, 16(1), 64-73.
Churchill, G. A., Ford, N. M., & Walker, O. C. (1974). Measuring the job satisfaction of
industrial salesmen. Journal of Marketing Research, 11, 254-260.
Churchill, G. A., & Peter, J. P. (1984). Research design effects on the reliability of the
rating scales: A meta analysis. Journal of Marketing Research, 21, 360-375.
Clark , L. A., & Watson, D. (1995). Constructing validity:Basic issues in scale
development. Psychological Assessment, 7(3), 309-319.
Clear, T. (1999). International collaborative learning: The facilitation processEdMedia.
Symposium conducted at the meeting of the World Conference on Educational
Multimedia, Hypermedia and Telecommunications, , Seattle.
Clough, G., Jones, A. C., McAndrew, P., & Scanlon, E. (2007). Informal learning with
PDAs and smartphones. Journal of Computer Assisted Learning, 24(5), 359-
371.
Coakes, S. J. (2006). SPSS: Analysis without anguish: version 14.0 for Windows. Milton
John Wiley & Sons.
Coffey, A., & Atkinson, P. (1996). Making sense of qualitative data: Complementary
research strategies. London: Sage.
Coghlan, D., & Coughlan, P. (2006). Designing and implementing collaborative
improvement in the extended manufacturing enterprise. The Learning
Organization, 13(2/3), 152-165.
Coghlan, D., & Shani, A. B. (2008). Collaborative management research through
communities of inquiry: Challenges and skills. . In A. B. Shani, S. A. Mohrman,
W. A. Pasmore, B. Stymne, & N. Adler (Eds.), Handbook of Collaborative
Management Research. (pp. 601-614). Singapore: Sage.
Cohen, D., & Prusak, L. (2001). In good company: How social capital makes
organizations work. Boston: Harvard Business School Press.
Cohen, W. M., & Levinthal, D. A. (1990). Absorptive capacity: A new perspective on
learning and innovation. Administrative Science Quarterly, 35, 128-152.
Cohen, W. M., & Levinthal, D. A. (2000). Absorptive capacity: A new perspective on
learning and innovation. In R. Cross & S. Israelit (Eds.), Strategic learning in a
knowledge economy: Individual, collective, and organizational learning
process. Boston, Oxford: Butterworth Hienemann.
Collins, K. M. T. (2010). Advanced sampling designs in mixed research. In A.
Tashakkhori & C. Teddlie (Eds.), Handbook of mixed methods in social and
behavioral research (pp. 353-378). Thousand Oaks: Sage.

234 | P a g e
Collis, J., & Hussey, R. (2009). Business Research: A practical guide for
undergraduate and postgraduate students (3 ed.). Hampshire: Palgrave
Macmillan.
Conklin, J. (1992). Capturing organizational memory. . Proceedings of Groupware
1992, 133-137.
Conlon, T. J. (2004). A review of informal learning literature, theory and implications
for practice in developing global professional competence. Journal of European
Industrial Training, 28(2/3/4), 283-295.
Cooper, D. R., & Schindler, P. S. (1998). Business Research Methods. New Jersey:
Irwin/McGraw-Hill.
Cooper, L. P. (2003). A research agenda to reduce risk in new product development
through knowledge management: a practitioner perspective. Journal of
Engineering and Technology Management, 20, 117-140.
Cornelius, S., & MacDonald, J. (2008). Online informal professional development for
distance tutors: Experiences from the Open University in Scotland. Open
Learning, 23(1), 43-55.
Corso, M., & Paolucci, E. (2001). Fostering innovation and knowledge transfer in
product development through information technology. International Journal of
Technology Management, 22(1/2/3), 126-148.
Cortina, J. (1993). What is coefficient alpha? An examination of theory and application.
Journal of Applied Psychology, 78, 98-104.
Cortina, J., Zaccaro, S., McFarland, L., Baughman, K., Wood, G., & E., O. (2004).
Promoting realistic self-assessment as a basis of effective leader self
development (ARI Reserach Note 2004-05). Crystal City: United States Army
Research Institute for Behavioral and Social Sciences.
Creswell, J. W. (1998). Qualitative inquiry and research design: Choosing among five
research traditions. . Thousand Oaks, CA: Sage Publications.
Creswell, J. W. (2003). Research design: Qualitative, quantitative and mixed methods
approaches (2 ed.). Thousand Oaks: Sage.
Creswell, J. W. (2007). Qualitative inquiry and research design: Choosing among five
approaches (2 ed.). Thousand Oaks, CA Sage Publications.
Creswell, J. W. (2008). Educational research: Planning, conducting and evaluating
quantitative and qualitative research (3 ed.). Upper Saddle River: Pearson.
Creswell, J. W. (2009). Research design: Qualitative, quantitative, and mixed methods
approaches (3 ed.). Thousand Oaks: Sage.
Creswell, J. W., Clark, V. L., Gutmann, M., & Hanson, W. (2003). Advanced mixed
methods research designs. In In A. Tashakkori & C. Teddlie (Eds.), Handbook

235 | P a g e
of mixed methods in social and behavioral research (pp. 209–240). Thousand
Oaks: Sage.
Creswell, J. W., & Plano-Clark, V. L. (2007). Designing and conducting mixed methods
research. Thousand Oaks: Sage Publications.
Cronbach, L. J., & Meehl, P. E. (1955). Construct validity in psychological tests.
Psychological Bulletin, 52(4), 281-302.
Cullen, J., Hadjivassiliou, K., Hamilton, E., Kelleher, J., Sommerlad, E., & Stern, E.
(2002). Review of current pedagogic research and practice in the fields of post-
compulsory education and lifelong learning (final report submitted to the
Economic and Social Research Council). London: The Tavistock Institute.
Cunningham, S., & Jones, M. (2005). Autoethnography: A tool for practice and
education. Paper presented at the 6th ACM SIGCHI New Zealand chapter's
international conference on Computer-human interaction: making CHI natural
(CHINZ'05).
Curseu, P. L., Schalk, R., & Wessel, I. (2008). How do virtual teams process
information? A literature review and implications for management. Journal of
Managerial Psychology, 23(6), 628-652.
Curtis, D. D., & Lawson, M. J. (2001). Exploring collaborative online learning. Journal
of Asynchronous Learning Network, 5(1), 21-34.
D'eon, M. (2005). A blueprint for interprofessional learning. Journal of
Interprofessional Care, Supplement 1, 49-59.
Daneshgar, F., Ray, P., Rabhi, F., Skarf-Molli, H., Molli, P., & Godart, C. (2005).
Knowledge Sharing Infrastructure and Methods for Virtual Enterprises. . In W.
L. Fong (Ed.), E-Collaborations and Virtual Organizations. (pp. 1-28).
Melbourne: : IRM Press. .
Danilovic, M., & Winroth, M. (2005). A tentative framework for analyzing integration
in collaborative manufacturing network settings: ASW case study. Journal of
Engineering and Technology Management, 22(1), 141-158.
doi:10.1016/j.jengtecman.2004.11.008
Daradoumis, T., & Marquès, J. M. (2000). A methodological approach to networked
collaborative learning: Design and pedagogy issues. .
Daradoumis, T., Martinez-Mones, A., & Xhafa, F. (2004). An integrated approach for
analysing and assessing the performance of virtual learning groups. In G. de
Vreede, L. A. Guerrero, & G. M. Raventós (Eds.), Lecture notes in computer
science (pp. 289–304). Berlin Heidelberg, New York: Springer.
Dasgupta, S., Granger, M., & McGarry, N. (2002). User acceptance of e-collaboration
technology: An extention of the technology acceptance model. Group Decision
and Negotiation, 11, 87-100.

236 | P a g e
Davenport, T. H., & Prusak, L. (1998). Working knowledge: How organisations
manage what they know. Boston, Mass: Harvard Business Press.
Davidson, C., & Voss, P. (2002). Knowledge Management: An Introduction To
Creating Competitive Advantage From Intellectual Capital. Auckland: Tandem
Press.
Davis, D. (1995). Business research for decision making. Belmount: Wadworth.
Davis, F. D. (1986). A technology acceptance model for empirically testing new end-
user information systems: Theory and results. . Massachusetts Institute of
Technology, Cambridge, MA.
Davis, F. D. (1989). Perceived usefulness, perceived ease of use and user acceptance of
information technology. MIS Quarterly, 13(3), 319-339.
Davis, F. D., Bagozzi, R. P., & Warshaw, P. R. (1989). User acceptance of computer
technology: a comparison of two theoretical models. Management Science,
35(8), 982-1003.
de Laat, M. (2006). Networked learning. University of Utrecht, Utrecht.
de Laat, M., & Lally, V. (2003). Complexity, theory and praxis: Researching
collaborative learning and tutoring processes in a networked learning
community. Journal of Instructional Science, 31(1-2), 7-39.
de Laat, M., & Lally, V. (2004). It's not easy: Researching the complexity of emergent
participant roles and awareness in asynchronous networked learning discussions
Journal of Computer Assisted Leaning, 20, 165-171.
de Laat, M., Lally, V., Lipponen, L., & Simons, R.-J. (2006a). Analysing student
engagement with learning and tutoring activities in networked learning
communities: A multi-method approach. Int. J. Web Based Communities, 2(4),
394–412.
de Laat, M., Lally, V., Simons, R.-J., & Wenger, E. (2006b). A selective analysis of
empirical findings in networked learning research in higher education: Questing
for coherence. Educational Research Review, 1(99-111).
de Souza, C. S., & Preece, J. (2004). A framework for analyzing and understanding
online communities. Interacting with Computers, 16(5), 579-610.
de Vaus, D. A. (2002). Surveys in social research (5 ed.). New South Wales: Allen &
Unwin.
de Vellis, R. F. (2003). Scale Development: Theory and Application. Thousand Oaks:
Sage.
DeLone, W. H., & McLean, E. R. (2003). The DeLone and McLean model of
information systems success: A ten-year update. Journal of Management
Information Systems, 19(4), 9-30.

237 | P a g e
Dennis, A. R., Hayes, G. S., & Daniels, R. M. (1999). Business process modeling with
group support systems. Journal of Management Information Systems, 15(4),
115-142.
Denzin, N. K., & Lincoln, Y. S. (2000). Introduction: The discipline and practice of
qualitative research. In N. K. Denzin & Y. S. Lincoln (Eds.), The handbook of
qualitative research. Thousand Oaks, CA: Sage Publications.
Department of Statistics Malaysia. (2011). Manufacturing Statistic 2009. Retrieved 15
June 2011, 2011, from http://www.statistics.gov.my
Dewett, T., & Jones, G. R. (2001). The role of information technology in the
organization: a review, model and assessment. Journal of Management, 27(3),
313-346.
Dey, I. (1999). Grounding grounded theory: Guidelines for qualititative inquiry. San
Diego: Academic Press.
Diaz Andrade, A. (2009). Interpretive reserach aiming at theory building: Adopting and
adapting the case study design. The Qualitative Report, 14(1), 42-60.
Dillenbourg, P. (1999). What do you mean by collaborative learning? In P. Dillenbourg
(Ed.), Collaborative-Learning: Cognitive and Computational Approaches (pp.
1-19). Oxford: Elsevier.
Dillenbourg, P., Baker, M., Blaye, A., & O’Malley, C. (1996). The evolution of
research on collaborative learning. . In E. Spada & P. Reiman (Eds.), Learning
in Humans and Machine: Towards an interdisciplinary learning science. (pp.
189-211). Oxford: Elsevier.
Docherty, P., & Shani, A. B. (2008). Learning mechanism as means and ends in
collaborative management research. In A. B. Shani, S. A. Mohrman, W. A.
Pasmore, B. Stymne, & N. Adler (Eds.), Handbook of Collaborative
Management Research. (pp. 163-181). Singapore: Sage.
Doornbos, A.J., Bolhuis, S., & Simons, P. R.-J. (2004). Modeling work-related learning
on the basis of intentionality and developmental relatedness: A noneducational
perspective. Human Resource Development Review, 3(3), 250-274.
Doos, M., Wilhelmson, L., & Backlund, T. (2005). Functioning at the edge of
knowledge: A study of learning processes in new product development. Journal
of Workplace Learning, 17(8), 481-492.
Dourish, P. (2004). What we talk about when we talk about context. Personal and
Ubiquitous Computing, 8, 19-30.
Dourish, P., & Bellotti, V. (1992). Awareness and coordination in shared workspaces.
CSCW’92 Proceedings.
Driscoll, M. P. (2000). Psychology of learning for instruction. Boston: Allyn & Bacon.

238 | P a g e
Duarte, D., & Snyder, N. T. (1999). Mastering virtual teams: Strategies, tools and
techniques that succeed (3 ed.). San Francisco: Jossey-Bass/John Wiley & Sons
Inc. .
Dyer, J. H., & Nobeoka, K. (2000). Creating and Managing Performance Knowledge
Sharing: The Toyota Case. Strategic Management Journal, 21, 346-366.
Eales, J. R. T. (2003). Supporting informal communities of practice within
organizations. In M. S. Ackerman, V. Pipek, & V. Wulf (Eds.), Sharing
expertise: Beyond knowledge management. London, England: The MIT Press.
Edmondson, A. C. (2002). The local and variegated nature of learning in organizations:
A group-level perspective Organization Science, 13(2), 128-146.
Edmondson, A. C., Bohmer, R., & Pisano, G. P. (2001). Disrupted routines: Team
learning and new technology adaptation. Admin. Science Quarterly, 46, 685-
716.
Edmonson, A. C. (2002). The local and variegated nature of learning in organizations.
Organization Science, 13, 128-146.
Ellis, T. J., & Hafner, W. (2008). Building a framework to support project-based
collaborative learning experiences in an asynchronous learning network.
Interdisciplinary Journal of E-Learning and Learning Objects (4), 167.
Elsey, B., & Fujiwara, A. (2000). Kaizen and technology transfer instructors as work-
based learning facilitators in overseas transplants: A case study. Journal of
Workplace Learning, 12(8), 333-341.
Emery, M. (1982). Searching in new directions in new ways for new times. Canberra.
Endley, M. R. (1995). Toward a theory of situation awareness in dynamic systems. The
Journal of the Human Factors and Ergonomics Society, 37(1), 32-64.
Engelmann, T., & Hesse, F. W. (2010a). How digital concept maps about the
collaborators’ knowledge and information influence computer-supported
collaborative problem solving. Computer-Supported Collaborative Learning, 5,
299–319. doi:10.1007/s11412-010-9089-1
Engelmann, T., Tergan, S.-O., & Hesse, F. W. (2010b). Evoking knowledge and
information awareness for enhancing computer-supported collaborative problem
solving. The Journal of Experimental Education, 78, 1-20.
Engeström, Y. (1987). Learning by expanding. An acitvity-theoretical approach to
development research Helsinki: Orienta-Konsultit Oy.
Engeström, Y. (1992). Interactive expertise. Studies in distributed working intelligence.
Erickson, T., & Kellogg, W. A. (2001). Knowledge communities: Online environments
for supporting knowledge management and its social context. In M. Ackerman,

239 | P a g e
V. Pipek, & V. Wulf (Eds.), Beyond knowledge management: Sharing expertise
(pp. 299-326). M.A.: MIT Press.
Fedor, D. B., Ghosh, S., Caldwell, S. D., Maurer, T. J., & Singhal, V. R. (2003). The
effect of knowledge management on team members ratings of project sucess and
impact. Decision Sciences, 34(3), 513-539.
Fenwick, T., & Rubenson, K. (2005. Taking stock: A review on research on learning in
work, 1999-2004. presented at the meeting of the Paper presented at the Forth
International Conference on Research on Work and Learning., University of
Technology, Sydney.
Field, A. (2005). Discovering statistics using SPSS (2 ed.). London, Thousand Oaks,
New Delhi: Sage Publication.
Findley, C. A. (1988). Collaborative Networked Learning: On-line Facilitation and
Software Support. Burlington, MA: Digital Equipment Corporation.
Fischer, F. (1998). Beyond empiricism: Policy inquiry in postpositivist perspective.
Policy Studies Journal, 26(1), 129-146.
Fjuk, A. (1998). Computer support for distributed collaborative learning. Exploring a
complex problem area. University of Oslo, Oslo.5)
Fjuk, A., & Smørdal, O. (2001, 22 - 24 March 2001). Networked computers'
incorporated role in collaborative learning. presented at the meeting of the
European Perspectives on Computer-Supported Collaborative Learning,
Maastricht.
Flannery, J. L. (1994). Teacher co-conspirator: Knowledge and authority in
collaborative learning. In K. Bosworth & S. J. Hamilton (Eds.), Collaborative
learning: Underlying process and effective techniques. New direction for
teaching and learning, No.59 (pp. 15-23). San Franciso: Jossey-Bass.
Flynn, B. B., Sakakibara, S., Schroeder, R. G., Bates, K. A., & Flynn, E. J. (1990).
Empirical research methods in operations management. Journal of Operations
Management, 9(2), 250–285.
Forrester Consulting. (2010). Using Adobe Acrobat X to enhance collaboration with
Microsoft SharePoint and Microsoft Office. Adobe Acrobat X White Paper.
Retrieved from www.futureofcollaboration.com
Forza, C. (2002). Survey research in operations management: a process-based
perspective. International Journal of Operations & Production Management,
22(2), 152-194.
Francis, J. J., Johnston, M., Robertson, C., Glidewell, L., Entwistle, V., Eccles, M. P., &
Grimshaw, J. M. (2010). What is an adequate sample size? Operationalising data
saturation for theory based interview studies. Psychology & Health, 25(10),
1229-1245.

240 | P a g e
Fuller, A., Munro, A., & Rainbird, H. (2004). Introduction and overview. In H.
Rainbird, A. Fuller, & A. Munro (Eds.), Workplace learning in context. New
York: Routledge.
Fuller, A., Unwin, L., Felstead, A., Jewson, N., & Kakavelakis, K. (2007). Creating and
using knowledge: An analysis of the differentiated nature of workplace learning
environments. British Educational Research Journal, 33(5), 743-759.
Fulmer, W. E. (2000). Shaping the Adaptive Organization: Landscape, Learning and
Leadership in Volatile Times. New York: Amacom.
Furst, S. A., Blackburn, R. S., & Rosen, B. (1999). Virtual team effectiveness: A
proposed research agenda. Information Systems Journal, 9, 249-269.
Gabbert, B., Johnson, D., & Johnson, R. (1986). Cooperative learning, group to
individual transfer, process gain and the acqusition of cognitive reasoning
strategies. Journal of Psychology, 120(3), 265-278.
Garcia, B. C. (2010). Making MAKCi: An emerging knowledge-generative network of
practice in the Web 2.0. The journal of information and knowledge management
systems, 40(1), 39-61.
Garver, M. S., & Mentzer, J. T. (1999). Logistics research methods: employing
structural equation modeling to test for construct validity. Journal of Business
Logistics, 20(1), 33-57.
Garvin, D. A. (1993). Building a learning organization. Harvard Business Review,
71(4), 78.
Gebauer, H., Worch, H., & Truffer, B. (2012). Absortive capacity, learning processes
and combinative capacities as determinants of strategic innovation. European
Management Journal, 30, 57-73.
George, D., & Mallery, P. (2009). SPSS for Windows (9 ed.). Boston: Pearson.
Gerbing, D. W., & Anderson, J. C. (1988). An updated paradigm for scale development
incorporating unidimensionality and its assessment. Journal of Marketing
Research, 25, 186-192.
Giddens, A. (1984). The constitution of society: Outline the theory of structure.
Berkeley: University of California Press.
Giuliani, E. (2007). The selective nature of knowledge networks in clusters: Evidence
from wine industry. Journal of Economic Geography, 7(2), 139-168.
Glaser, B. G., & Strauss, A. (1967). The discovery of grounded theory: Strategies for
qualitative research. New York: Aldine De Gruyter
Goerzen, A. (2005). Managing alliance networks: Emerging practice of multinational
corporations. Academy of management executive, 19, 94-107.

241 | P a g e
Goggins, S. P., Laffey, J., & Gallagher, M. (2011). Completely online group formation
and development: small group as social-technical systems. Information
Technology & People, 24(2), 104-133.
Goodyear, P. (2000). Effective networked learning in higher education. Lancaster:
Centre for Studies in Advanced Learning Technology.
Goodyear, P. (2003). Implicit theories of learning and changes: Their role in the
development of e-learning environments for higher education. In S. Naidu (Ed.),
Learning & teaching with technology: Principles and practices. London: Kogan
Page.
Goodyear, P. (2005). Educational design and networked learning: Patterns, pattern
languages and design practice. Australasian Journal of Educational Technology,
21(1), 82-101.
Goodyear, P., Banks, S., Hodgson, V., & McConnell, D., &. (2004). Advances in
research on networked learning: Kluwer Academic Publisher.
Goodyear, P., de Laat, M., & Lally, V. (2006). Using pattern languages to mediate
theory praxis conversations in design for networked learning. . Journal of the
Association for Learning Technology, 14(3), 211-223.
Goodyear, P., Jones, C., Asensio, M., Hodgson, V., & Steeples, C. (2005). Networked
learning in higher education: Students’ expectations and experiences. Higher
Education, 50, 473-508.
Goodyear, P., McConnell, D., Banks, S., & Hodgson, V. (2003). Introduction to the
Special Issue on "Advances in Research on Networked Learning.". Instructional
Science, 31(12), 1-6.
Gorard, G. (2004). Combining methods in educational and social research. Berkshire:
Open University Press.
Grant, B. M., & Giddings, L. S. (2002). Making sense of methodologies: A paradigm
framework for novice researchers. Contemporary Nurse, 13, 10-28.
Grant, R. M., & Baden-Fuller, C. (2004). A knowledge accessing theory of strategic
alliances. Journal of Management Studies, 41(1), 61-84.
Gray, P. H., & Meister, D. B. (2004). Knowledge sourcing effectiveness. Management
Science, 50, 821-834.
Green, S. B., Salkind, N. J., & Akey, T. M. (2000). Using SPSS for Windows: Analyzing
and understanding data. . New Jersey: Pentice Hall.
Greenberg, S. (1990). Sharing views and interactions with single-user applications. . In
Proceedings of the ACM Conference on Office Information Systems,, 227-237.
Greenberg, S., Hayne, S., & Rada, R. (1995). Groupware for real-time drawing: A
designer guide. New York: McGraw-Hill.

242 | P a g e
Gressgard, L. J. (2011). Virtual team collaboration and innovation in organizations.
Team Performance Management, 17(1/2), 102-119.
Gronau, N. (2004). Collaborative engineering communities – architecture and
integration approaches. In W. L. Fong (Ed.), E-collaborations and virtual
organizations (pp. 120-150). Melbourne: IRM Press.
Gross, T., Stary, C., & Totter, A. (2005). User-centered awareness in computer-
supported cooperative worksystems: Structured embedding of findings from
social sciences. International Journal of Human-Computer Interaction, 18, 323-
360.
Grudin, J. (1989). Why groupware applications fail: problems in design and evaluation.
Office: Technology and People, 4(3), 245-264.
Guba, E. G., & Lincoln, Y. S. (1988). Do inquiry paradigms imply inquiry
methodologies? In D. M. Fetterman (Ed.), Qualitative approaches to evaluation
in education: The silent scientific revolution. (pp. 89-115). London: Praeger.
Guba, E. G., & Lincoln, Y. S. (1994). Competing paradigms in qualitative research. . In
N. K. Denzin & Y. S. Lincoln (Eds.), Handbook of qualitative research. (pp.
105-117). Thousand Oaks, CA: Sage.
Guest, G., Bunce, A., & Johnson, L. (2006). How many interviews are enough? An
experiment with data saturation and variability. Field Methods, 18(1), 59-82.
Guile, D., & Griffiths, T. (2001). Learning through work experience. Journal of
Education and Work, 14(1), 113-131.
Gupta, S. (2006). Longitudinal investigation of collaborative e-Learning in an end user
training context. University of Georgia, Athens, GA.
Gustavsen, B. (1992). Dialogue and development. Assen/Maastricht, Netherlands: van
Gorum.
Gustavsen, B. (2001). Theory and practice: The mediating discourse. London: Sage.
Gutpa, A. K., & Govindarajan, V. (2000). Knowledge Flows Within Multinational
Corporations. Strategic Management Journal, 21, 473-496.
Gutwin, C., & Greenberg, S. (2002). A descriptive framework of workspace awareness
for real-time groupware. . Computer Supported Cooperative Work (CSCW), 11,
411–446.
Gutwin, C., Stark, G., & Greenberg, S. (1995). Support for workplace awareness in
educational groupware. Proceedings of the ACM Conference on Computer
Supported Learning, 147-156.
Haag, S., Baltzan, P., & Philips, A. (2006). Business Driven Technology

243 | P a g e
Hackley, C. (2003). Doing research projects: Marketing, management & consumer
research. London: Routledge.
Hager, P. (2004). Lifelong learning in the workplace? Challenges and issues. Journal of
Workplace Learning, 16(1/2), 22-32.
Hair, J. F., Anderson, R. E., Tatham, R. L., & Black, W. C. (1998). Multivariate data
analysis (5 ed.). Englewood Cliffs: Prentice-Hall.
Hair, J. F., Black, W. C., Babin, B. J., Anderson, R. E., & Tatham, R. L. (2006).
Multivariate data analysis (6 ed.). New Jersey: Prentice-Hall.
Hakkinen, P., Jarvela, S., & Makitalo, K. (2003). Sharing perspectives in virtual
interaction: Review of methods of analysis. In B. Wason, S. Ludvigson, & U.
Hoppe (Eds.), Designing for change in networked learning. Proceedings of the
international conference on computer support for collaborative learning 2003
(pp. 395–404). Dordrecht: Kluwer.
Hall, H., & Graham, D. (2004). Creation and recreation: motivating collaboration to
generate knowledge capital in online communities. International Journal of
Information, 24(4), 235-246.
Hamberg, K., Johansson, E., Lindgren, G., & Westman, G. (1994). Scientific rigour in
qualitative research - Examples from a study of women's health in family
practice. Family Practice, 11(2), 176-181.
Hanseth, O. (1996). Information technology as infrastructure. Goteberg University.10)
Hara, N., Bonk, C. J., & Angeli, C. (2000). Content analysis of online discussion in an
applied educational psychology course. Instructional Science, 28, 2.
Harasim, L., Hiltz, S. R., Teles, L., & Turoff, M. (1995). Learning Networks: A Field
Guide to Teaching and Learning Online. Cambridge MA: MIT Press.
Harris, C. L., & Bayerlein, M. M. (2003). Team-based organization: Creating an
environment for team sucess. In M. A. West, D. Tjosvold, & K. G. Smith (Eds.),
International handbook of organizational teamwork and cooperative working
(pp. 187-209). Sussex, England: John Wiley and Sons Ltd.
Harris, R. J. (2008). Improving tacit knowledge transfer within SMEs through e-
collaboration. Journal of European Industrial Training, 33(3), 215-231.
Hass, R., Aulbur, W., & Thakar, S. (2003). Enabling communities of practice at EADS
Airbus. In M. S. Ackermann, P. Volkmar, & V. Wolf (Eds.), Sharing Expertise:
Beyond Knowledge Management. (pp. 179-198). Cambridge: The MIT Press.
Haythornthwaite, C. (1998). A social network study of the growth of community among
distance learners. Information Research, 4(1).

244 | P a g e
Haythornthwaite, C., Kazmer, M., Robins, J., & Shoemaker, S. (2000). Community
development among distance learners: Temporal and technological dimensions.
Journal of Computer Mediated Communication, 6(1).
Heckscher, C. (2007). The collaborative enterprise: Managing speed and complexity in
knowledge-based businesses. New Haven, London: Yale University Press.
Hensley, R. L. (1999). A review of operations management studies using scale
development techniques. Journal of Operations Management, 17(3), 343–358.
Herrmann, T., Hoffmann, M., Kunau, G., & Loser, K.-U. (2004). A modelling method
for the development of groupware applications as sosio-technical systems.
Behaviour & Information Technology, 23(2), 119-135.
Herrmann, T., Loser, K.-U., & Jahnke, I. (2007). Sociotechnical walkthrough: A means
for knowledge integration. The Learning Organization, 14(5), 450-464.
Hertel, G., Geister, S., & Konradt, U. (2005). Managing virtual teams: A review of
current empirical research. Human Resource Management Review, 15(1), 69-95.
Hiltz, S. R., Coppola, N., Rotter, N., & Turoff, M. (2000). Measuring the importance of
collaborative learning for the effectiveness of ALN: A multi-measure, multi-
method approach. Journal of Asynchronous Learning Network, 4(2).
Hmelo-Silver, C. E. (2003). Analyzing collaborative knowledge construction: Multiple
methods for integrated understanding. Computer & Education, 41, 397-420.
Hodgson, V., & Watland, P. (2004). Researching networked management learning
Management Learning, 35(2), 99-116.
Hoepfl, M. C. (1997). Choosing qualitative research: A primer for technology education
researchers. Journal of Technology Education, 9(1), 47-63.
Hopkins, S., & Maglen, L. (2000). Learning through working: Views of managers and
personnel. Paper presented at the Working Knowledge, Productive Learning at
Work. Sydney
Huan, S. H. (2004). A review and analysis of supply chain operations reference (SCOR)
model. Supply Chain Management: An International Journal of the Academy of
Marketing Science, 9(1), 23-29.
Huang, H.-M. (2002). Towards constructivism for adult learners in online learning
environment. British Journal of Educational Technology 33(1), 27-37.
Huang, X., Kristal, M. M., & Schroeder, R. G. (2008). Linking learning and effective
process implementation to mass customization capability. Journal of Operations
Management, 26, 714-729.
Huang, Y.-M., Jeng, Y.-L., & Huang, T.-C. (2009). An educational mobile blogging
system for supporting collaborative learning. . Educational Technology &
Society, 12(2), 163–175.

245 | P a g e
Huberman, A. M., & Miles, M. B. (1994). Data management and analysis methods. . In
N. K. Denzin & Y. S. Lincoln (Eds.), Handbook of qualitative research (pp.
428-444). Thousand Oaks: Sage Publications.
Hung, D. W. L., & Chen, D.-T. (2001). Situated cognition, Vygotskian thought and
learning from the communities of practice perspective: Implications for the
design of web-based e-learning. Education Media International, 38(1), 3-12.
Hutchins, H. M., & Hutchinson, D. (2008). Cross-disciplinary contributions to e-
learning design: a tripartite design model. Journal of Workplace Learning,
20(5), 364-380.
Illeris, K. (2003). Workplace learning and learning theory. Journal of workplace
learning, 15(4), 167-178.
Illich, I. (1971). Deschooling society. Manchester, UK: Pelican Books.
Inaba, A., Supnithi, T., Ikeda, M., Mizoguchi, R., & Toyoda, J. (2000). How can we
form effective collaborative learning group? In G. Gauthier, C. Frasson, & K.
VanLehn (Eds.), ITS 2CS 1839 (pp. 282-291). Berlin
Ingram, A. L., & Hathorn, L. G. (2004). Methods for analyzing collaboration in online
communications. In T. S. Roberts (Ed.), Online collaborative learning: theory
and practice (pp. 215-241). Hershey: Idea Group Publishing.
Ireland, R. D., Hitt, M. A., & Vaidyananth, D. (2002). Alliance management as a source
of competitive advantage. Journal of management, 28, 413-446.
Irons, L. R. (2009). The Limits of Anytime, Anywhere Customer Support. In J. Salmons
& L. Wilson (Eds.), Handbook of Research on Electronic Collaboration and
Organizational Synergy (Vol. 2, pp. 500-515.). New York: Information Science
Reference.
Issacs, W. N. (1993). Taking flight: Dialogue, collective thinking, and organizational
learning. Organizational Dynamics, 22(2), 24-39.
Iyer, G. S., & Ravindran, S. (2009). Usefulness, incentives and knowledge
management. Journal of Knowledge Management, 13(6), 410-430.
Johnson, C. M. (2001). A survey on current research on communities of practice.
Internet and Higher Education, 4, 45-60.
Johnson, D. W., & Johnson, R. (1989). Cooperation and competition: Theory and
research. Edina: Interaction Book Company.
Johnson, D. W., & Johnson, R. T. (2003). Training for cooperative group work. In M.
A. West, D. Tjosvold, & K. G. Smith (Eds.), International handbook of
organizational teamwork and cooperative working. Sussex, England: John
Wiley & Sons Ltd.

246 | P a g e
Johnson, D. W., Johnson, R. T., & Smith, K. (1998). Active learning: Cooperation in
the college classroom (2 ed.). Edina: Interaction Book Co.
Johnson, R. B., & Onwuegbuzie, A. J. (2004). Mixed method research: A research
paradigm whose time has come. Educational Researcher, 33, 14-26.
Johnson, R. B., Onwuegbuzie, A. J., & Turner, L. A. (2007). Towards a definition of
mixed method research. Journal of mixed methods research, 1(2), 112-133.
Jolliffe, I. T. (1972). Discarding variables in a principal component analysis, I: artificial
data. Applied Statistics, 21, 160-173.
Jonassen, D., H., & Kwon, H. (2001). Communication patterns in computer mediated
versus face-to-face group problem solving. Educational Technology Research
and Development, V49(1), 35-51.
Jones, C., & Esnault, L. (2004). The metaphor of networks in learning: Communities,
collaboration and practice Symposium conducted at the meeting of the
Networked Learning Conference NLC2004, Lancaster.
Jones, Q., Grandhi, S. A., Karam, S., Whittaker, S., Zhou, C., & Terveen, L. (2008).
Geographic 'place' and 'community' information preferences. Computer
Supported Cooperative Work, 17, 137-167.
Kaiser, H. F. (1960). The application of electronic computers to factor analysis.
Educational and Psychological Measurement, 20, 141-151.
Kaiser, H. F. (1974). An index of factorial simplicity. Psychometrika, 39, 31-36.
Kamrani, A. K. (2008). Collaborative design approach in product design and
development In A. K. Kamrani & E. S. Abouel Nasr (Eds.), Collaborative
Engineering: Theory and Practice (pp. 1-17): Springer Science + Business
Media.
Kass, R. A., & Tinsley, H. E. A. (1979). Factor analysis. Journal of Leisure Research,
11, 120-138.
Katzenbach, J. R., & Smith, D. K. (2003). The wisdom of teams: Creating the high
performance organziation. New York: Harper Business.
Kauppila, O.-P., Rajala, R., & Jyrämä, A. (2011). Knowledge sharing through virtual
teams across borders and boundaries. Management Learning, 42(4), 395-418.
Keating, S. (2006). Learning in the workplace: A literature review: Postcompulsory
Education Centre, Victoria University.
Keefer, J. M. (2010. Autoethnographer communities of practice. presented at the
meeting of the Proceedings of the 7th International Conference on Networked
Learning 2010,

247 | P a g e
Kerber, K. W., & Buono, A. F. (2004). Leadership challenges in global virtual teams:
Lessons from the field. Advanced Management Journal, 69(4), 4-10.
Kildare, R., Williams, R. N., & Hartnett, J. (2006). An online tool for learning
collaboration and learning while collaboratingAustralian Computer Society, Inc.
. Symposium conducted at the meeting of the 8th Austalian conference on
Computing education
Kinnear, P. R., & Gray, C. D. (2009). SPSS 16 made simple. New York: Psychology
Press.
Kleinsmann, M., & Valkenburg, R. (2005). Learning from collaborative new product
development projects. Journal of Workplace Learning, 17(3), 146-156.
doi:10.1108/13665620510588671
Kline, R. B. (2005). Principles and practice of structural equation modelling (2 ed.).
New York: The Guilford Press.
Knight, L., & Pye, A. (2005). Network learning: An empirically derived model for
learning by groups of organizations. Human Relations., 58(3), 369-392.
Kogut, B., & Zander, U. (1992). Knowledge of the firm, combinative capabilities, and
the replications of technology. Organization Science, 3(3), 383-396.
Kolb, D. A. (1984). Experiential learning: Experience as the source of learning and
development. Englewood Cliffs, NJ: Prentice-Hall.
Kravcik, M., Kaibel, A., Specht, M., & Terrenghi, L. (2004). Mobile collector for field
trips. Educational Technology & Society, 7(2), 25-33.
Kreijns, K., Kirschner, P. A., & Jochems, W. (2003). Identifying the pitfalls for social
interaction in computer-supported collaborative environment: A review of the
research. Computer in Human Behavior, 19, 335-353.
Krejcie, R. V., & Morgan, D. W. (1970). Determining sample size for research
activities. Educational and psychological measurement, 30, 607-610.
Kristensen, E., Nielsen, D., Jensen, I., Vaarst, M., & Enevoldsen, C. (2008). A mixed
method inquiry into the validity of data. Acta Veterinaria Scandinavica, 50(30),
30-37.
Kuo, Y. F. (2003). A study on service quality of virtual community web sites. Total
Quality Management, 14(4), 461-473.
Kvale, S., & Brinkman, S. (2009). Interviews: Learning the craft of qualitative research
interviewing (2 ed.). Thousand Oaks, CA: Sage.
Laffey, J., Lin, G. Y., & Lin, Y. (2006). Assessing social ability in online learning
environments. Journal of Interactive Learning Research, 17(2), 163-177.

248 | P a g e
Lai, C. Y., & Wu, C. C. (2006). Using handhelds in a Jigsaw cooperative learning
environment. Journal of Computer Assisted Learning, 22(4), 284-297.
Lakkala, M. (2007. The pedagogical design of technology enhanced collaborative
learning. presented at the meeting of the Fe-ConE Workshop
Lally, V., & de Laat, M. (2002). Cracking the code: Learning to collaborate and
collaborating to learn in a networked environment Symposium conducted at the
meeting of the CSCL 2002
Lange, B. (1992). Electronic group calendaring: Experience and expectations.
Proceedings of Groupware 1992, 428-432.
Latour, B. (1991). Technology is society made durable. In J. Law (Ed.), A sociology of
monster. London: Routledge.
Laurillard, D. (2002). Rethinking university teaching: A conversational framework for
the effective use of learning technologies (2 ed.). London: Routledge Falmer.
Laurillard, D. (2009a). The pedagogical challenge to collaborative technologies.
Computer-Supported Collaborative Learning, 4, 5-20.
Laurillard, D. (2009b). The pedagogical challenges to collaborative technologies.
Computer-Supported Collaborative Learning, 4, 5-20.
Lave, J., & Wenger, E. (1991). Situated learning: Legitimate peripheral participation. .
New York: Cambridge University Press.
Lechner, C., Dowling, M., & Welpe, I. (2006). Firm networks and firm development:
The role of relational mix. Journal of Business Venturing, 21, 514-540.
Lee, A. S. (2001). Editorial. MIS Quarterly, 25(1), iii-vii.
Lee, G., & Holmquist, S. (2009). Overview on Information Systems and Tools for
Collaborative Enterprise: Business Impacts and Managerial Issues. In J. Salmons
& L. Wilson (Eds.), Handbook of Research on Electronic Collaboration and
Organizational Synergy. (Vol. 2, pp. 435-450). New York: Information Science
Reference.
Lee, J. (2004). Discriminant analysis of technology adoption behavior: A case of
Internet technology in small business. Journal of Computer Information
Systems, 44(4), 57-66.
Lehenkari, J. (2006). The networks of learning in technological innovation: The
emergence of collaboration across fields of expertise (Dissertation). University
of Helsinki, Helsinki. Retrieved from http://ethesis.helsinki.fi/julkaisut/kay/
kasva/vk/lehenkari
Lenox, M., & King, A. (2004). Prospects for developing absorptive capacity through
internal information provision. Strategic Management Journal, 25, 331-345.

249 | P a g e
Levy, M., Loebbecke, C., & Powell, P. (2003). SMEs, co-opetition and knowledge
sharing: The role of information systems. European Journal of Information
Systems, 12(1), 3-17.
Levy, Y. (2007). Comparing dropouts and persistence in e-learning courses. Computers
& Education, 48(2), 185-204.
Li, W., Ardichvili, A., Maurer, M., Wentling, T., & Stuedemann, R. (2009). Chinese
culture and virtual knowledge sharing in a multinational corporation. In M. E.
Jennex (Ed.), Knowledge Management, Organizational Memory and Transfer
Behavior. (pp. 255-269.). New York: Information Science Reference.
Lichtenthaler, U. (2005). External commercialization of knowledge: Review and
research agenda. International Journal of Management Reviews, 7, 231-255.
Lim, H. L. (2010). Scaffolding and Knowledge Appropriation in Online Collaborative
Group Discussions. Contemporary Educational Technology, 1(4), 306-321.
Lin, C. J., & Lu, H. (2000). Towards an understanding of the behavioral intention to use
a website. International Journal of Information Management, 20(3), 23-33.
Lin, C. P. (2007a). To share or not to share: Modeling tacit knowledge sharing, its
mediator and antecedents. Journal of Business Ethics, 70(4), 411-428.
Lin, H. (2007b). The role of online and offline features in sustaining virtual
communities: An empirical study. Internet Research, 17(2), 119-138.
Lincoln, Y. S., & Guba, E. G. (1985). Naturalistic inquiry. Newbury Park: Sage.
Lindblom-Ylänne, S., Pihlajamäki, H., & Kotkas, T. (2003). What Makes a Student
Group Successful? Student-Student and Student-Teacher Interaction in a
Problem-Based Learning Environment. Learning Environments Research, 6(1),
59-76.
Lipponen, L. (2002a). Computer support for collaborative learning. Proceedings of the
Conference on Computer Support for Collaborative Learning: Foundations for
a CSCL Community. International Society of the Learning Sciences, 72-81.
Lipponen, L. (2002b). Exploring foundations for computer-supported collaborative
learning. Proceedings of the Conference on Computer Support for Collaborative
Learning: Foundations for a CSCL Community. International Society of the
Learning Sciences.
Lipponen, L., & Hakkarainen, K. P., S. (2004). Practices and orientations of computer
supported collaborative learning. In J. Strijbos, P. Kirschner, & R. Martens
(Eds.), What we know about CSCL, and implementing it in higher education (pp.
31-50). Boston, MA: Kluwer Academic Publishers.
Lipshitz, R., Popper, M., & Oz, S. (1996). Building learning organizations: The design
and implementation of organizational learning mechanisms. Journal of Applied
Behavioral Science, 32(2), 292-305.

250 | P a g e
Lissitz, R. W., & Green, S. B. (1975). Effect of the number of scale points on reliability:
A Monte Carlo approach. Journal of Applied Psychology, 60, 10-13.
Livingstone, D. W. (2001). Worker control as the missing link: relation between
paid/unpaid work and work related learning. Journal of Workplace Learning,
16(1/2), 92-101.
Löh, H., Zhang, C., & Katzy, B. (2005). Modeling for virtual organizations, in virtual
organizations – systems and practices. Boston: Springer.
Luhmann, N. (1993). Soziale systeme grundrib einer allgemeinen theorie. Frankfurt:
Suhr-kamp.
Lusch, R. F., Stephen, L. V., & Tanniru, M. (2010). Service, value networks and
learning. Journal of the Academy of Marketing Science, 38, 19-31.
Lyytinen, K. J., & Ngwenyama, O. K. (1992). What does computer support for
cooperative work mean? A structurational analysis of computer supported
cooperative work. Accounting Management and Information Technology, 2(1),
19-37.
Macgregor, S. K., & Thomas, W. R. (2005). Online Project-Based Learning: How
Collaborative Strategies and Problem Solving Processes Impact Performance.
Journal of Interactive Learning Research, 16(1), 83-107.
Mackenzie, N., & Knipe, S. (2006). Research dilemmas: paradigms, methods and
methodology. Issues In Educational Research, 16.
Majchrzak, A., Rice, R. E., Malhotra, A., King, N., & Ba, S. (2000). Technology
adaptation: The case of a computer-supported inter-organizational virtual team.
MIS Quarterly, 24(4), 569-600.
Malhotra, A., Majchrzek, A., & Rosen, B. (2007). Leading virtual teams. Academy of
Management Perspective, 21(1), 60-70.
Mallick, D. N., Schroeder, R. G., & Luo, C. (2010). Collaborative product development.
European Journal of Innovation Management, 13(2), 244-266.
Manwani, S., & Moon, S. (2004). Managing information overload. In E. Truch (Ed.),
Leveraging corporate knowledge (pp. 199-210). Burlington: Gower.
Martínez, A., Dimitriadis, Y., Gómez-Sánchez, E., Rubia-Avi, B., Jorrín-Abellán, I., &
Marcos, J. A. (2006). Studying participation networks in collaboration using
mixed methods. Computer-Supported Collaborative Learning, 1, 383-408.
Matthew, R. S. (1996). Collaborative Learning: Creating Knowledge with Students. In
M. R.J. & M. Weimer (Eds.), Teaching on solid ground using scholarship to
improve practice. (pp. 101-124.). San Francisco: Jossey-Bass.

251 | P a g e
Maxwell, J. (1997). Designing qualitative study. In L. Bick & D. J. Rog (Eds.),
Handbook of applied social science methods (pp. 69-100). Thousand Oaks:
Sage.
McAndrew, P., Goodyear, P., & Dalzie, J. (2006). Patterns, designs and activities:
unifying descriptions of learning structures. International Journal of Learning
Technology, 2(2), 216-242.
McCarthy, T. M., & Golicic, S. L. (2002). Implementing collaborative forecasting to
improve supply chain performance. International Journal of Physical
Distribution & Logistics Management, 32(6), 431-454.
McConnell, D. (1999). Examining a collaborative assessment process in networked
lifelong learning. Journal of Computer-Assisted Learning, 15(3), 232-243.
McConnell, D. (2000). Implementing computer-supported co-operative learning (2 ed.).
London: Kogan Page.
McConnell, D. (2002). Action research and distributed problem-based learning in
continuing professional education. Distance Education, 23(1), 59-83.
McDermott, R., & Archibald, D. (2010). Harnessing your staffs informal networks.
Harvard Business Review, 88.
McDonald, J., & Gibson, C. C. (1998). Interpersonal dynamics and group development
in computer conferencing. The American Journal of Distance Education, 12(1),
6-24.
McGrath, J. E. (1984). Groups: Interaction and performance. Englewood Cliffs:
Prentice-Hall.
McNiff, J., Lomax, P., & Whitehead, J. (1996). You and your action research project.
London: Routledge.
Meagher, K., & Roger, M. (2004). Network density and R&D spillovers. Journal of
Economic Behavior and Organization, 53, 237-260.
Menor, L., & Roth, A. V. (2007a). Improving perceptual measurement in operations
management survey research. Toronto, Ontario: Ivey Business School ,
University of Western Ontario.
Menor, L., & Roth, A. V. (2007b). New service development competence in retail
banking: Construct development and measurement validation. Journal of
Operations Management, 25(4), 825-846.
Mertens, D. M. (2005). Research methods in education and psychology: Integrating
diversity with quantitative and qualitative approaches. (2 ed.). Thousand Oaks:
Sage.

252 | P a g e
Miettinen, R. (1998). Object construction and networks in research work: The case of
research on cellulose-degrading enzymes. Social Studies of Science, 28(3), 423-
463.
Miles, M. A., & Huberman, A. M. (1994). Qualitative data analysis: An expanded
source book (2 ed.). Thousand Oaks: Sage.
Mingers, J. (1997). Towards critical pluralism. In J. Mingers & A. Gill (Eds.),
Multimethodology: The theory and practice of combining management science
methodologies (pp. 407-440). Chichester: Wiley.
Mohamad, R., & Ismail, N. A. (2009). Electronic commerce adoption in SME: The
trend of prior studies. Journal of Internet Banking and Commerce, 14(2), 1-16.
Mohrman, S. A., Cohen, S. G., & Mohrman Jr, A. M. (1995). Designing team based
organizations: New forms for knowledge work. San Francisco: Jossey-Bass.
Mohrman, S. A., Mohrman Jr, A. M., Cohen, S. G., & Winby, S. (2008). The
collaborative learning cycle: Advancing theory and building practical design
frameworks through collaboration. In A. B. Shani, S. A. Mohrman, W. A.
Pasmore, B. Stymne, & N. Adler (Eds.), Handbook of Collaborative
Management Research (pp. 509-530.). Singapore: Sage.
Monteiro, L. F., Arvidsson, N., & Birkinshaw, J. (2008). Knowledge flows within
multinational corporations: Explaining subsidary isolation and its performance
implications. Organization Science, 19(1), 90-107.
Montoya-Weiss, M. M., Massey, A. P., & Song, M. (2001). Getting it together:
temporal coordination and conflict management in global virtual teams.
Academy of Management Journal, 44(6), 1251-1262.
Moreland, R., & Lovett, T. (1997). Lifelong learning and community development.
International Journal of Lifelong Education, 16(3), 201-216.
Morrell, M., & Ezingeard, J.-N. (2002). Revisiting adoption factors of inter-
organisational information systems in SMEs. Logistics Information
Management, 15(1), 46-57. doi:10.1108/09576050210412666
Morse, J., & Niehaus, L. (2009). Mixed method designs: Principles and procedures.
Walnut Creek: Left Coast Press.
Morse, J. M. (1991). Approaches to qualitative and quantitative methodological
trangulation. Nursing Research, 40, 120-123.
Motiwalla, L. F. (2005, April 28-30.). Speech-enabled mobile learning application.
Paper presented at the Wireless Telecommunications Symposium. Pomona.
Motterham, G., & Teague, J. (2000). 'Deep' learning and computer-mediated
communication: A case study of online teacher education. In M. Asensio, J.
Foster, V. Hodgson, & D. McConnell (Chair), Lancaster University Symposium

253 | P a g e
conducted at the meeting of the Proceedings of Network Learning 2000,
Lancaster University
Muller-Prothmann, T., & Frost, I. (2009). KMmaster® for collaboration and knowledge
management. . In J. Salmons & L. Wilson (Eds.), Handbook of Research on
Electronic Collaboration and Organizational Synergy. (Vol. 2, pp. 516-530.).
New York: Information Science Reference.
Murgolo-Poore, M. E., Pitt, L. E., Berthon, P. R., & Prendegast, G. (2003). Corporate
intelligence dissemination as the concequence of intranet effectiveness: An
empirical study. Public Relations Review, 29, 171-184.
Muukkonen, H., Hakkarainen, K., & Lakkala, M. (1999). Collaborative technology for
facilitating progressive inquiry: The Future Learning Environment Tools. In C.
Hoadley & J. Roschelle (Eds.), The proceedings of the CSCL ’99 conference,
December 12-15 1999, Palo Alto (pp. 406-415). Mahwah, NJ: Lawrence
Erlbaum and Associates.
Myers, R. (1990). Classical and modern regression with applications (2 ed.). Boston:
Duxbury.
Nardi, B. A., Whittaker, S., & Schwarz, H. (2002). Networkers and their activity in
intensional networks. Computer Supported Cooperative Work, 11, 205-242.
Nardi, P. M. (2006). Doing survey research: A guide to quantitative methods. Boston:
Pearson Education.
Nastasi, B. K., & Clements, D. H. (1992). Social-cognitive behaviors and higher-order
thinking in educational computer environments. Learning and Instruction, 2,
215-238.
Nederhof, A. (1985). Methods of coping with social desirable bias: A review. European
Journal of Social Psychology, 15, 263-280.
Nelson, R. R., Todd, P. A., & Wixom, B. H. (2005). Antecedents of information and
system quality: An empirical examination within the context of data
warehousing. Journal of Management Information Systems, 21(4), 199-235.
Netemeyer, R. G., Bearden, W. O., & Sharma, S. (2003). Scaling procedures: Issues
and applications. London: Sage.
Netemeyer, R. G., Boles, J. S., & McMurrian, R. C. (1996). Development and
validation of work-family conflict and family work conflict scales Journal of
Applied Psychology, 81(4), 400-410.
Nevo, B. (1985). Face validity revisited. Journal of Educational Measurement, 22, 287-
293.
Niederhauser, D. S., Salem, D. J., & Field, M. (1999). Exploring teaching, learning and
instructional reform in an introductory technology course. Journal of
Technology and Teacher Education, 7(2), 153-172.

254 | P a g e
Nielsen, J. S., Boer, H., & Gertsen, F. (2008). The influence of learning in collaborative
improvement. International Journal Technology Management, 42(1/2), 107-126.
Nikas, A., Poulymenakou, A., & Kriaris, P. (2006). Investigating antecedents and
drivers affecting the adoption of collaboration technologies in the construction
industry. Automation in Construction, 16, 632-641.
Nonaka, I., & Takeuchi, H. (1995). The knowledge creating company. Oxford.: Oxford
Press.
Noorderhaven, N., & Harzing, A.-W. (2009). Knowledge-sharing and social interaction
within MNEs Journal of International Business Studies, 40, 719-741.
Norusis, M. J. (1999). SPSS 9.0 guide to data analysis. New Jersey: Prentice-Hall.
Norusis, M. J. (2008). SPSS 16.0 guide to data analysis. Upper Saddle River: Prentice-
Hall.
Nunnally, J. C. (1978). Psychometric theory. New York: The Free Press.
Nunnally, J. C., & Bernstein, I. H. (1994). Psychometric theory (3 ed.). New York:
McGraw-Hill.
O'Leary, Z. (2004). The essential guide to doing research. . London: SGE Publications.
Obermiller, C., & Spangenberg, E. R. (1998). Development of a scale to measure
consumers' skepticism towards advertising. Journal of Consumer Psychology,
7(2), 159-186.
Onwuegbuzie, A. J., Johnson, R. B., & Collins, K. M. T. (2009). Call for mixed
analysis: A philosophical framework for combining qualitative and quantitative
approaches. International Journal of Multiple Research Approaches, 3(2), 114-
139.
Onwuegbuzie, A. J., & Teddlie, C. (2003). A framework for analyzing data in mixed
methods research. Thousand Oaks: Sage.
Oppenheim, A. N. (1992). Questionnaire design, interviewing and attitude
measurement (2 ed.). London: Pinter.
Organizations for Economic Cooperations and Development. (2011). OECD guidelines
for multinational enterprises. Retrieved from http://www.oecd.org/dataoecd/43
/29/48004323.pdf
Orlikowski, W. J. (1992a). The duality of technology: Rethinking the concept of
technology in organizations. Organization Science, 3(3), 398-427.
Orlikowski, W. J. (1992b). Learning from Notes: Organizational Issues in Groupware
Implementation. Proceedings of the Computer Supported Cooperative Work
(CSCW'92), 362-369.

255 | P a g e
Orlikowski, W. J. (1996). Improvising organizational transformation over time: a
situated change perspective. Information Systems Research, 7, 63-92.
Orlikowski, W. J. (2000). Using technology and constituting structures: A practice lens
for studying technology in organizations. Organization Science, 11, 404-428.
Orlikowski, W. J., & Hoffman, J. (1997). An improvisational model for change
management: The case of groupware technologies Sloan Management Review,
Winter, 11-21.
Orlikowski, W. J., Yates, J., Okamura, K., & Fujimoto, M. (1995). Shaping electronic
communication: The metastructuring of technology in the context of use.
Organizational Science, 6(4), 423-444.
Paavola, S., & Hakkarainen, K. (2005). The knowledge creation metaphor: An emergent
epistemological approach to learning. Science & Education, 14, 535-557.
Paavola, S., Lipponen, L., & Hakkarainen, K. (2002). Epistemological Foundations for
CSCL: A Comparison of Three Models of Innovative Knowledge Communities.
In G. Stahl (Ed.), Computer Support for Collaborative Learning: Foundations
for a CSCL Community (pp. 24-32). New Jersey: Lawrence Erlbaum Associates.
Paavola, S., Lipponen, L., & Hakkarainen, K. (2004). Models of innovative knowledge
communities and three metaphors of learning. Review of Educational Research,
74(4), 557-576.
Packer, M. J., & Goicoechea, J. (2000). Socialcultural and constructivist theories of
learning: Ontology, not just epistemology. Educational Psychologist, 35, 227-
241.
Paiva, E. L., Roth, A. V., & Fensterseifer, J. E. (2008). Organizational knowledge and
the manufacturing strategy process: A resource-based view analysis. Journal of
Operations Management, 26(1), 115-132. doi:10.1016/j.jom.2007.05.003
Pallant, J. (2001). SPSS Survival Manual. Canberra: Allen and Unwin.
Patton, M. Q. (2002). Qualitative research & evaluation methods (3 ed.). Thousands
Oak: Sage.
Pedhazur, E. J., & Schmelkin, L. P. (1991). Measurement, design, and analysis: An
integrated approach. Hillsdale: Lawrence Erlbaum Associates.
Pereira, M. A. (2001, 5-8 September 2001). Designing collaboration. presented at the
meeting of the ECER2001 European Conference on Educational Research, Lille.
Perkowitz, M., & Etzioni, O. (1999). Towards adaptive website: Conceptual framework
and effectiveness. Computer Networks, 31(11), 1245-1258.
Peterson, R. A. (1994). A meta-analysis of Cronbach’s coefficient alpha. Journal of
Consumer Research, 21, 381-391.

256 | P a g e
Phelan, A., Herrington, A., & Mercer, E. (2004). Researching learning at work:
Exploring an academic-workplace partnership. Journal of Workplace Learning,
16(5), 275-283.
Picot, A., Reichwald, R., & Wigand, R. (2008). Information, organization and
management. Munich, Germany: Springer.
Poell, R. F., Chivers, G. E., Van Der Krogt, F. J., & Wildemeersch, D. A. (2000).
Learning-network theory. Management Learning, 31(1), 25-49.
Poler, R., Hernandez, J. E., Mula, J., & Lario, F. C. (2008). Collaborative forecasting in
networked manufacturing enterprises. Journal of Manufacturing Technology
Management, 19(4), 514-528.
Polito, T., & Watson, K. (2002). Towards a interdisciplinary organizational framework.
Journal of American Academy of Business, 2(1), 162.
Poole, M. S., & DeSanctis, G. (1994). Capturing the complexity in advance technology
use: Adaptive structuration theory. Organizational Science, 5(2), 121-147.
Popper, K. R. (1994). The myth of the framework: In defence of science and rationality.
. London: Routledge.
Powell, A., Piccoli, G., & Ives, B. (2004). Virtual teams: A review of current literature
and directions for future research. The Database for Advances in Information
Systems, 35(1), 6-36.
Preece, J. (2001). Sociability and usability in online communities: determining and
measuring success. Behaviour and Information Technology, 20(5), 347-356.
Provan, K. G., & Milward, H. B. (1995). A preliminary theory of interorganizational
network effectiveness: A comparative study of four community of mental health
systems. Adminstrative Science Quarterly, 40(1), 1-33.
Quik, W. H., & Yeong, M. L. (2006. Developing Organizational Capability through
Collaborative e-Learning: A Case Study of Eaton Electric Switchgear. presented
at the meeting of the International Conference on Distance, Collaborative and e-
Learning (DCEL 2006). Kuala Lumpur.
Rafaeli, S., & Ravid, G. (2003). Information sharing as enabler for the virtual team: An
experiential approach to assessing the role of electronic mail in
disintermediation. Information Systems Journal, 13(191-206).
Ratcheva, V. (2008). The knowledge advantage of virtual teams. Journal of General
Management, 33(3), 53-67.
Rauscher, L., & Greenfield, B. (2009). Advancement in contemporary physical therapy
research: Use of mixed methods designs. Physical Therapy, 89(1), 91-100.
Redmond, P., & Lock, J. V. (2006). A flexible framework for online collaborative
learning. Internet and Higher Education, 9, 267-276.
257 | P a g e
Reimer, E. (1971). School is dead: An essay on alternatives in education.
Harmondsworth, UK: Penguin Books.
Resnick, L. B. (1991). Shared cognition: Thinking as social practice. In L. B. Resnick,
J. M. Levine, & S. D. Teasley (Eds.), Perspectives on socially shared cognition
(pp. 1-20). Washington, DC: American Psychological Association.
Rhodes, E., & Carter, R. (2003). Collaborative learning in advanced supply systems:
KLASS pilot project. Journal of Workplace Learning, 15(6), 271-279.
Rice, R. E. (1994). Network analysis and computer-mediated communication systems.
In S. Wesserman & J. Galaskiewicz (Eds.), Advances in social and behavioral
science from social network analysis (pp. 167-203. ). Newbury Park: Sage.
Rich, T., & Lukens, L. (2009). Globalizing a function within a company. In J. Salmons
& L. Wilson (Eds.), Handbook of Research on Electronic Collaboration and
Organizational Synergy. (Vol. 2, pp. 546-559.). New York:: Information
Science Reference.
Ridenour, C. S., & Newman, I. (2008). Mixed method research: Exploring the
interactive continuum (2 ed.). Illinois: University Press.
Ridoutt, L., Dutneall, R., Hummel, K., & Smith, C. (2002). Factors influencing the
implementation of training and learning in the workplace. Adelaide: NCVER.
Riege, A. (2005). Three dozen knowledge-sharing barriers managers must consider.
Journal of Knowledge Management, 9(3), 1367-3270.
Ritchie, W. J., Drew, S. A., Srite, M., Andrews, P., & Carter, J. E. (2011). Application
of a learning management system for knowledge management: Adoption and
cross-cultural factors. Knowledge and Process Management, 18(2), 75-84.
Rittgen, P. (2009). Supporting Inter-Business Collaboration via Contract Negotiation
and Enactment. In J. Salmons & L. Wilson (Eds.), Handbook of Research on
Electronic Collaboration and Organizational Synergy (Vol. 2, pp. 487-499).
New York: Information Science Reference.
Roberts, G. (2004). The new covert curriculum: A critical, actor-network approach to
learning technology policy Symposium conducted at the meeting of the
Networked Learning: Proceedings of the 2004 Conference, Sheffield, UK
Sheffield University. Retrieved from http://www.shef.ac.uk/nld2004/
Proceedings/Individual_Papers/Roberts.htm
Roberts, J. (2000). From know-how to show-how? Questioning the role of information
and communication technologies in knowledge transfer. Technology Analysis &
Strategic Management, 12(4), 429-443.
Robinson, J. P., Shaver, P. R., & Wrightsman, L. S. (1991). Criteria for scale selection
and evaluation. In J. P. Robinson, P. R. Shaver, & L. S. Wrightsman (Eds.),
Measure of personality & social psychological attitudes (pp. 1-15). Santiago:
Academic Press.

258 | P a g e
Rocco, T. S., Bliss, L. A., Gallagher, S., & Perez-Prado, A. (2003). Taking the next
step: Mixed methods research in organizational systems. Information
Technology, Learning and Performance Journal, 21(1), 19-29.
Rockwood, H. (1995). Cooperative and Collaborative Learning. National Teaching and
Learning Forum, 4(6).
Rodgers, W., Negash, S., & Suk, K. (2005). The moderating effect of on-line
experience on the antecedents and consequences of on-line satisfaction.
Psychology and Marketing, 22(4), 313-331.
Roffe. (2004). E-learning for SMEs: Competition and dimensions of perceived value.
Journal of European Industrial Training, 28(5), 440-455.
Rooke, J., Altounyan, C., Young, A., & Young, S. (2007). Doers of the word? An
inquiry into the nature of action in action learning. Action Learning: Research
and Practice, 4, 119-135.
Roschelle, J., & Teasley, S. (1995). The construction of shared knowledge in
collabrative problem solving. In C. E. O'Malley (Ed.), Computer supported
collaborative learning. (pp. 69-96.). Heidelberg: Springer-Verlag.
Rubiano, O., & Crespo, A. (2003). The effectiveness of using e-collaboration tools in
the supply chain: an assessment study with system dynamics. Journal of
Purchasing & Supply Management, 9, 151-163.
Salmons, J., & Wilson, L. (2009). Handbook of Research on Electronic Collaboration
and Organizational Synergy. (Vol. 2). New York: Information Science
Reference.
Sambamurthy, V., Bharadwaj, A., & Grover, V. (2003). Shaping agility through digital
options: reconceptualizing the role of information technology in contemporary
firms. MIS Quarterly, 27(2), 237-263.
Sarantakos, S. (2000). Social Research (2 ed.). Australia: Macmillan Education
Australia.
Sarin, S., & McDermott, C. (2003). Effect of team leader characteristics on learning,
knowledge application, and performance of cross-functional new product
development teams. . Decision Science, 34(4), 707-739.
Sarker, S., Valacich, J. S., & Sarker, S. (2003). Virtual team trust: Instrument
development and validation in IS educational environment. Information
Resources Management Journal, 16(2), 35-55.
Sayah, J. Y., & Zhang, L. (2005). On-demand business collaboration enablement with
web services. Decision support systems, 40, 107-127.
Scarbrough, H. (1996). The management of expertise. New York: St. Martin Press.

259 | P a g e
Scardamalia, M., & Bereiter, C. (1994). Computer support for knowledge-building
communities. The Journal of the Learning Sciences, 3, 265-283.
Schein, E. (1996). Three culture of management: The key to organisational learning.
Sloan Management Review, 38(1), 9-20.
Schippers, M. C., Den Hartog, D. N., Koopman, P. L., & Wienk, J. A. (2003).
Reflexivity and diversity in teams: The moderating effects of outcome
interdependence and group longevity. Journal of Organizational Behaviour, 24,
779-802.
Schofield, K. (2003). Think strategy: Corporate e-learning in four companies.
Adelaide: NCVER.
Schrire, S. (2006a). Knowledge building in asynchronous discussion groups: Going
beyond quantitative analysis. Computers & Education, 46, 49-70.
Schrire, S. (2006b). Knowledge building in asynchronous discussion groups: Going
beyond quantitative analysis. Computer & Education, 46, 49-70.
Scott, J. (2000). Social network analysis: A handbook. London: Sage publications.
Scott, J. E., & Walczak, S. (2009). Cognitive engagement with multimedia ERP training
tool: Assessing computer self-efficacy and technology acceptance. Information
& Management, 46(4), 221-232.
Sekaran, C., &. (2003). Research methods for business: A skill-building approach New
York: Wiley.
Senge, P. M. (1994). The Fifth Discipline: The Art and Practice of the Learning
Organization. New York.: Doubleday.
Serce, F. C., & Yildirim, S. (2006). A Web-Based synchronous collaborative review
tool: A case study of an on-line graduate course. . Educational Technology &
Society, 9(2), 166-177.
Seufert, A., Back, A., & Krogh, G. v. (1999). Towards a reference model for knowledge
networking (BE HSG/IWI 3 Nr. 5 IfB Nr. 34.): University of St. Gallen. .
Sfard, A. (1998). On two metaphors for learning and the dangers of choosing just one.
Educational Researcher, 27(4-13).
Shani, A. B., Mohrman, S. A., Pasmore, W. A., Stymne, B., & Adler, N. (2008).
Handbook of Collaborative Management Research. Singapore: Sage.
Smith, A., Oczkowski, E., Noble, C., & Macklin, R. (2002). New management practices
and enterprise training. Adelaide: NCVER.
Smith, P. J. (2003). Workplace Learning and Flexible Delivery. Review of Educational
Research, 73(1), 53-88.

260 | P a g e
Smith, R. (2006). Epistemological agency in the workplace. Journal of Workplace
Learning, 18(3), 157-170.
Soller, A., & Lesgold, A. (2000). Knowledge acquisition for adaptive collaborative
learning environments (FS-00-02): American Association for Artificial
Intelligence.
Soller, A. L., Lesgold, A., Linton, F., & Goodman, B. (1999). What makes peer
interaction effective? Modeling effective communication in an intelligent CSCL.
Proceedings of the 1999 AAAI Fall Symposium: Psychological Models of
Communication in Collaborative System, 116-123.
Somekh, B., & Lewin, C. (2005). Research methods in social sciences. London: Sage.
Spector, P. E. (1992). Summated rating scale construction: An introduction. Newbury
Park: Sage.
Springer, L., Stanne, M., & Donovan, S. (1999). Effect of small group learning on
undergraduates in science, mathematics, engineering and technology: A meta-
analysis. Review of Educational Research, 69(1), 21-52.
Sproull, L., & Kiesler, S. (1991). Connections: New ways of working in networked
organization. Cambridge, MA: The MIT Press.
Stahl, G. (2004). Building collaborative knowing: Elements of a social theory of CSCL.
. In J. W. Strijbos, P. A. Kirschner, & R. L. Martens (Eds.), P. Dillenbourg,
Computer-supported collaborative learning. What we know about CSCL: And
implementing it in higher education (Vol. 3, pp. 53-85). Boston, MA: Kluwer
Academic Publishers.
Stahl, G. (2005). Group cognition in computer-assisted collaborative learning. Journal
of Computer Assisted Leaning, 21, 79-90.
Stamatis, D., Kefalas, P., & Kargidis, T. (1999). A multi-agent framework to assist
networked learning. Journal of Computer Assisted Learning, 15, 201-210.
Stockman, N. (1983). Anti-positivist theorist of the science: Critical rationalism and
scientific realism Dordrecht: D. Reidel.
Stonebraker, P. W., & Hazeltine, J. E. (2004). Virtual learning effectiveness: An
examination of the process. The Learning Organization, 11(3), 209-225.
Strijbos, J. W. (2004). The effect of roles on computer supported collaborative learning.
Open University of the Netherlands (OUNL), Maastricht.
Strijbos, J. W., & Fischer, F. (2007a). Methodological challenges for collaborative
learning research. Learning and Instruction, 17, 389-393.
Strijbos, J. W., Martens, R. L., Jochems, W. M. G., & Broers, N. J. (2004). The effect of
functional roles on group efficiency: Using multilevel modeling and content

261 | P a g e
analysis to investigate computer-supported collaboration in small groups. Small
Group Research, 35(2), 195-229.
Strijbos, J. W., Martens, R. L., Jochems, W. M. G., & Broers, N. J. (2007b). The effect
of functional roles on perceived group efficiency during computer supported
collaborative learning: A matter of triangulation. Computer in Human Behavior,
23(353-380).
Susman, G. I., Gray, B. L., Perry, J., & Blair, C. E. (2003). Recognition and
reconciliation of differences in interpretation of misalignments when
collaborative technologies are introduced into new product development teams.
Journal of Engineering and Technology Management, 20, 141-159.
Suthers, D., Vatrapu, R., Medina, R., Joseph, S., & Dwyer, N. (2008). Beyond threaded
discussion: Representational guidance in asynchronous collaborative learning
environments. Computer & Education, 50(4), 1103-1127.
Swan, K. (2005). A constructivist model for thinking about learning online. In J. Bourne
& J. C. Moore (Eds.), Elements of quality online education: Engaging
communities. Needham: Sloan-C.
Tashakkhori, A., & Teddlie, C. (2003). Handbook of mixed methods in social and
behavioural research. London: Cassell.
Tashakkori, A., & Teddlie, C. (1998). Mixed methodology: Combining qualitative and
quantitative approaches. . Thousand Oaks, CA: Sage.
Tashakkori, A., & Teddlie, C. (2003). Handbook of mixed methods in social and
behavioral research. Thousand Oaks: Sage.
Tatar, D., Roschelle, J., Vahey, P., & Penuel, W. R. (2003). Handhelds go to school:
Lessons learned. IEEE Computer, 36(9), 30-37.
Tatnall, A., & Lepa, J. (2003). The internet, e-commerce and older people: An actor-
network approach to researching reasons for adoption and use. . Logistics
Information Management, 16(1), 56-63.
Taylor, S. J. E. (2001). Netmeeting: a tool for collaborative simulation modeling.
International Journal of Simulation: Systems, Science and Technology, 1(1/2),
59-68.
Teddlie, C., & Tashakkhori, A. (2009). Foundation of mixed methods research:
Integrating quantitative and qualitative approaches in the social and behavioral
sciences. Thousand Oaks: Sage.
Teigland, R. (2003). Knowledge networking: Structure and performance in networks of
practice. Stockholm: Gotab.
Thakkar, J., Kanda, A., & Deshmukh, S. G. (2011). Mapping of supply chain learning:
A framework for SMEs. The Learning Organization, 18(4), 313-332.

262 | P a g e
Thompson, T. L. (2010). Self-employed and online: (re)negotiating work-learning
practices. Journal of Workplace Learning, 22(6), 360-375.
Tian, K. T., Bearden, W. O., & Hunter, G. L. (2001). Consumers' need for uniqueness:
Scale development and validation. Journal of Consumer Research, 28, 50-66S.
Tobin, D. R. (1997). The Knowledge-Enable Organization: Moving from “Training” to
“Learning” to meet Business Goal. New York.: Amacom.
Trist, E., & Bamforth, K. (1951). Some social and psychological consequences of the
longwall method of coal getting Human Relations, 4, 3-38.
Truch, E., Ezingeard, J.-N., & Birchall, D. (2000). Developing a relevant research
agenda in knowledge management - bridging the gap between knowing and
doing. Journal of Systems and Information Technology, 4(2), 1-11.
doi:10.1108/13287260080000752
Turoff, M. (1991). Computer mediated communication requirements for group support.
Journal for organizational computing, 1, 85-113.
Tyre, M. J., & Orlikowski, W. J. (1994). Windows of opportunity – temporal patterns of
technological adaptation in organizations. Organizational Science, 5(1), 98-118.
UNCTAD. (2004). Electronic commerce development report 2004. Geneva: United
Nations.
Vaast, E. (2004). Brother, where are thou? From communities to networks of practice
through intranet use. Management Communication Quarterly, 18(1), 5-44.
Valacich, J., Dennis, A., & Nunamaker, J. (1991). Electronic meeting support: The
group systems concept. In S. Greenberg (Ed.), Computer-Supported Cooperative
Work and Groupware (pp. 133-154. ). New York: Academic Press. .
Valkanos, E., & Fragoulis, I. (2007). Experiential learning—its place in in-house
education and training. . Development and Learning in Organizations, 21(5),
21–23.
Van den Bossche, P., Gijselaers, W. H., Segers, M., & Kirschner, P. (2006a). Social and
cognitive factors driving teamwork in collaborative learning environments.
Team learning beliefs & behaviour. Small Group Research, 37, 490-521.
Van den Bossche, P., Segers, M., & Krischner, P. A. (2006b). Social and cognitive
factors driving teamwork in collaborative learning environments. Small Group
Research, 37, 490-521.
Van der Vegt, G., & Van de Vliert, E. (2001). Intragroup interdependence and
effectiveness: A review and proposed directions for theory and practice. Journal
of Managerial Psychology, 17(1), 50-67.
263 | P a g e
Veldhuis-Diermanse, A. E. (2002). Csclearning? Participation, learning activities and
knowledge construction in computer-supported collaborative learning in higher
education. Wageningen: Grafisch Service Centrum Van Gils.
Venkatesh, V., Morris, M. G., Davis, G. B., & Davis, F. D. (2003). User acceptance of
information technology: Toward a unified view. . MIS Quarterly, 27(3), 425-
477.
Vince, R. (2004). Action learning and organizational learning: Power, politics and
emotion in organization. Action Learning: Research and Practice, 1, 63-78.
Vygotsky, L. S. (1978). Mind in society. Cambridge, MA: Harvard University Press.
Vygotsky, L. S. (1987). Thinking and speech: The collected work of L.S.Vygotsky. New
York: Plenum.
Wageman, R. (2001). The meaning of interdependence. In M. E. Turner (Ed.), Groups
at work: Theory and research (pp. 197-217). New Jersey: Lawrence Erlbaum
Associates.
Walsham, G. (1995). The emergence of interpretivism in IS research. Information
Systems Research, 6(4), 376-394.
Walter, M. (2006). Social Science methods: an Australian perspective. Oxford: Oxford
University Press.
Warkentin, M., & Beranek, P. M. (1999). Training to improve virtual team
communication. Information Systems Journal, 9, 271-289.
Wasko, M., & Faraj, S. (2008). The web of knowledge: An investigation of knowledge
exchange in networks of practice. Academy of Management Journal.
Wasserman, S., & Faust, K. (1997). Social network analysis: Methods and applications.
Cambridge: Cambridge University Press.
Wasson, B. (2007). Design and use of collaborative network learning scenarios: The
DoCTA experience. Educational Technology & Society, 10(4), 3-16.
Webb, N. M., & Palincsar, A. S. (1996). Group processes in the classroom. In D.
Berliner & R. Calfee (Eds.), Handbook of educational psychology (pp. 841-873).
New York: Macmillian.
Weinberger, A., & Fischer, F. (2006). A framework to analyze argumentative
knowledge construction in computer-supported collaborative learning.
Computers & Education, 46, 71-95.
Weisinger, J. Y., & Salipante, P. F. (1995). Towards a method of exposing hidden
assumptions in multicultural conflict. International Journal of Conflict
Management, 6, 147-170.

264 | P a g e
Wellman, B., Salaff, J., Dimitrova, D., Garton, L., Gulia, M., & Haythornthwaite, C.
(2000). Computer networks as social networks: Collaborative work, telework,
and virtual community. In E. L. Lesser, M. A. Fontaine, & J. A. Slusher (Eds.),
Knowledge and Communities (pp. 179-207). Boston: Butterworth-Heinemann.
Wenger, E. (1998). Communities of Practice: Learning, meaning and identity.
Cambridge: Cambridge University Press.
Wenger, E., McDermontt, R., & Snyder, W. M. (2002). Cultivating communities of
practice. Boston: Harvard University Press.
Wenger, E., & Snyder, W. (2000). Communities of practice: The organizational frontier.
Harvard Business Review, 78(1), 139-145.
West, S. G., Finch, J. F., & Curran, P. J. (1995). Structural equation models with no-
normal variables: Problems and remedies. In R. H. Hoyle (Ed.), Structural
Equation Modeling (pp. 56–75.). Thousand Oaks: Sage.
Whatley, J., Bell, F., Shaylor, J., Zaitseva, E., & Zakrzewska, D. (2005). CAB -
collaboration across borders: Peer evaluation for collaborative learning The
Journal of Issues in Informing Science and Information Technology, 2, 33-48.
Whetten, D. A. (1989). What Constitute a Theoretical Contribution? . The Academy of
Management Review, 14(4), 490-495.
Williams, E. A., Duray, R., & Reddy, V. (2006). Teamwork Orientation, Group
Cohesiveness, and Student Learning: A Study of the Use of Teams in Online
Distance Education. Journal of Management Education, 30(4), 592.
Wilson, L., & Salmons, J. (2009). Online collaborative integration and recommendation
for future research. In J. Salmons & L. Wilson (Eds.), Handbook of Research on
Electronic Collaboration and Organizational Synergy (Vol. 2, pp. 757-767).
New York: Information Science Reference.
Wiske, M. S., Franz, K. R., & Breit, L. (2005). Teaching for understanding with
technology. In. San Francisco: Jossey-Bass.
Xu, H., Sharma, S. K., & Hackney, R. (2005). Web services innovation research:
towards a dual-core model. International Journal of Information Management,
25(4), 321-334.
Yam, A. Y. K., Chan, M. F. S., & Chung, W. W. C. (2007). Networked enterprise: a
case study of implementing an information network system for global product
development. Benchmarking: An International Journal, 14(3), 369-386.
Yang, J. (2004). Job related knowledge sharing:comparative case studies. Journal of
Knowledge Management, 8(118-126).
Yazici, H. J. (2005). A study of collaborative learning style and team learning
performance. Education & Training, 47(2/3), 216-229.

265 | P a g e
Yin, R. K. (2003). Case study research: Design and methods. Thousand Oaks: Sage.
Yoo, Y., & Alavi, M. (2004). Emergent leadership in virtual teams: what do emergent
leaders do? Information and organisation, 14, 27-58.
Young, G. (2003). Contexualizing cooperation. In M. A. West, D. Tjosvold, & K. G.
Smith (Eds.), International handbook of organizational teamwork and
cooperative working. West Sussex, England: Wiley.
Zakaria, N., Amelinckx, A., & Wilemon, D. (2008). Navigating across culture and
distance: Understanding the determinants of global virtual team performance. In
V. I. Sessa & M. London (Eds.), Work group learning (pp. 175-192). New York,
London: Lawrence Erlbaum Associates.
Zenios, M. (2011). Epistemic activities and collaborative learning: towards an analytical
model for studying knowledge construction in networked learning settings.
Journal of Computer Assisted Learning, 27, 259–268.
Zhan, H. F., Lee, W. B., Cheung, C. F., Kwok, S. K., & Gu, X. J. (2003). A web-based
collaborative product design platform for dispersed network manufacturing.
Journal of Materials Processing Technology(138), 600–604.
doi:DOI:10.1016/S0924-0136(03)00156-0
Zhu, Z. (2011). After paradigm: Why mixing-methodology theorising fails and how to
make it work again. Journal of the Operational Research Society, 62, 784-798.
Zikmund, W. G. (2000). Exploring marketing research (7 ed.). Florida: Harcourt Brace
& Company.
Zurita, G., & Nussbaum, M. (2004). Computer supported collaborative learning using
wirelessly interconnected handhelds computers. . Computers and Education,
42(3), 289-314.

266 | P a g e
APPENDICES

267 | P a g e
Appendix A – Ethics approval by AUTEC
M E M O R A N D U M Auckland University of Technology Ethics Committee (AUTEC)
To: Nevan Wright
From: Dr Rosemary Godbold Executive Secretary, AUTEC
Date: 24 November 2011
Subject: Ethics Application Number 11/299 Antecedents of collaborative networked learning in
manufacturing: A comparative study between multinational companies and small-medium
enterprises.
Dear Nevan
Thank you for providing written evidence as requested. I am pleased to advise that it satisfies the points raised by the
Auckland University of Technology Ethics Committee (AUTEC) at their meeting on 14 November 2011 and I have
approved your ethics application. This delegated approval is made in accordance with section 5.3.2.3 of AUTEC’s
Applying for Ethics Approval: Guidelines and Procedures and is subject to endorsement at AUTEC’s meeting on 12
December 2011.
Your ethics application is approved for a period of three years until 24 November 2014.
I advise that as part of the ethics approval process, you are required to submit the following to AUTEC:
A brief annual progress report using form EA2, which is available online through
http://www.aut.ac.nz/research/research-ethics/ethics. When necessary this form may also be used
to request an extension of the approval at least one month prior to its expiry on 24 November 2014;
A brief report on the status of the project using form EA3, which is available online through
http://www.aut.ac.nz/research/research-ethics/ethics. This report is to be submitted either when
the approval expires on 24 November 2014 or on completion of the project, whichever comes sooner;
It is a condition of approval that AUTEC is notified of any adverse events or if the research does not commence.
AUTEC approval needs to be sought for any alteration to the research, including any alteration of or addition to any
documents that are provided to participants. You are reminded that, as applicant, you are responsible for ensuring
that research undertaken under this approval occurs within the parameters outlined in the approved application.
Please note that AUTEC grants ethical approval only. If you require management approval from an institution or
organisation for your research, then you will need to make the arrangements necessary to obtain this. Also, if your
research is undertaken within a jurisdiction outside New Zealand, you will need to make the arrangements necessary
to meet the legal and ethical requirements that apply within that jurisdiction.
When communicating with us about this application, we ask that you use the application number and study title to
enable us to provide you with prompt service. Should you have any further enquiries regarding this matter, you are
welcome to contact me by email at [email protected] or by telephone on 921 9999 at extension 6902.
On behalf of AUTEC and myself, I wish you success with your research and look forward to reading about it in your
reports.
Yours sincerely
Dr Rosemary Godbold
Executive Secretary
Auckland University of Technology Ethics Committee Cc: Quik Wee Hock [email protected]

268 | P a g e
Appendix B – Survey consent form
Survey Questionnaire Collaborative Networked Learning
Dear Sir/Madam,
My name is Quik Wee Hock. As part of my research project at AUT University,
Auckland, I am conducting a survey on the use of collaborative networked learning in
manufacturing.
The aim of this study is to examine the antecedents of collaborative networked learning
in the manufacturing industry, and compare between multinationals companies and
small-medium enterprises.
Completion of this questionnaire is limited to those of 20 years of age or above and who
are employed within a manufacturing organization.
This questionnaire is intended solely for research purposes and will take about 5 to 10
minutes. There are no costs associated with it.
The Participant Information Sheet can be viewed on the next page.
______________________________________________________________
By completing this survey you indicate your consent to participate
______________________________________________________________
Instruction: Select the most appropriate answer for each question by checking the
box given.

269 | P a g e
Appendix B – Survey consent form (translated)
Soalan Kajiselidik Rangkaian Pembelajaran Kolaboratif
Tuan/puan,
Saya, Quik Wee Hock sebagai penyelidik projek untuk AUT University, Auckland,
sedang menjalankan kaji-selidik tentang rangkaian pembelajaran kolaboratif di dalam
sektor pembuatan.
Tujuan kajian ini ialah bagi mengkaji sumber-sumber rangkaian pembelajaran
kolaboratif di dalam industri pembuatan, serta membuat perbandingan antara syarikat
multinasional dengan syarikat kecil dan sederhana.
Hanya peserta-peserta yang sedang bekerja di sektor perkilangan serta berumur lebih
daripada 20 tahun ke atas dijemput menyertai kaji-selidik ini.
Kaji-selidik ini bertujuan untuk penyelidikan dan mengambil masa antara 5 hingga 10
minit. Tiada kos terlibat dalam menyertai kaji-selidik ini.
Helaian Maklumat Penyertaan boleh diperolehi daripada halaman yang seterusnya.
__________________________________________________________________
Dengan menjawab kaji-selidik ini, anda secara langsung telah memberi
persetujuan anda untuk turut-serta.
__________________________________________________________________
Arahan: Pilih jawapan yang paling tepat bagi setiap soalan dengan menandakan
pada kotak-kotak yang berkenaan.

270 | P a g e
Appendix C – Participant information sheet
Participant Information Sheet
Date Information Sheet Produced:
2/12/2011
Project Title
Antecedents of collaborative networked learning in manufacturing: A comparative study
between multinational companies and small-medium enterprises.
An Invitation
My name is Quik Wee Hock and I am a doctoral student at AUT University, undertaking
primary research as a fulfilment for my doctoral thesis. I am inviting you to participate in an
independent study into the use of Collaborative Networked Learning (CNL) in manufacturing.
Your participation is voluntary and you may withdraw at any time. Choosing to participate or
not will neither advantage nor disadvantage you.
What is the purpose of this study?
The general aim of this study is to explore the antecedents of collaborative networked learning
(CNL) in manufacturing and then compare the differences between multinational companies
and small-medium enterprises.
How was I identified and why am I being invited to participate in this study?
You have been randomly selected to participate in this study because you are an employee in a
manufacturing business in Malaysia. Those who are working in the respective manufacturing
organizations may have been identified by your manager/supervisor or human resources
manager.
What will happen in this study?
The data collected and its analysis will provide an insight into the antecedents of collaborative
networked learning in manufacturing. The findings will be published in my doctoral thesis,
academic journals and presented at conferences.
What are the discomforts and risks?
Participation in the survey is voluntary and will be anonymous. You will NOT be asked
questions pertaining to your values, beliefs, cultures or work performance. We acknowledge
that the information you will be providing is private. Your identity and the name of your
organization will not be disclosed in writings, journal publications, conferences or in the thesis.
Instead, alphanumeric codification will be used for quantitative data analysis. All information
provided shall be treated with strict confidentiality.
How will these discomforts and risks be alleviated?
If you feel uncomfortable, you may choose to discontinue or withdraw your participation at any
time.
271 | P a g e
What are the benefits?
The study has the potential to explore our understanding of collaborative networked learning in
manufacturing. By examining the CNL antecedents, manufacturing organizations will be able to
leverage on complex networks of information systems to increase the propensity of interactions
and information sharing among manufacturing employees. It may also serve as a source of
information for the development of future collaborative technologies. The researcher will
publish the key findings in his doctoral thesis as part of the requirement for a doctoral degree.
How will my privacy be protected?
All data will be held in secure locations within AUT University in compliance with Auckland
University of Technology Ethics Committee (AUTEC) regulations.
What are the costs of participating in this study?
There are no financial costs in participating in the research. Should you agree to participate in
the online questionnaire, we envisage that it will take a maximum of 10 minutes to complete.
What opportunity do I have to consider this invitation?
Please take some time to consider this invitation. If you need further information or
clarification, please contact the researcher (email and contact number below).
How do I agree to participate in this study?
Individuals may consent to participate or elect not to participate. By completing this survey, you
indicate your consent to participate.
Will I receive feedback on the results of this study?
Results of this study will be available on request from the researcher. You may access the
findings of the research through www.researchgateway.ac.nz
What do I do if I have concerns about this study?
All concerns regarding the nature of this project should be notified in the first instance to the
Project Supervisor, Associate Professor Dr. Nevan Wright, WF833, Faculty of Business and
Law, AUT University, Private Bag 92006, Auckland. Tel +649 9219999 ext 5711 email:
Concerns regarding the conduct of the research should be notified to the Executive Secretary,
AUTEC, Dr. Rosemary Godbold, [email protected] , +649 9219999 ext 6902.
Whom do I contact for further information about this study?
Quik Wee Hock, Faculty of Business & Law, Auckland University of Technology, Private Bag
92006, Auckland 1142, New Zealand. Tel: +649 9219999 ext.5338. Email:
Approved by the Auckland University of Technology Ethics Committee on 24/11/2011
AUTEC Reference number 11/299

272 | P a g e
Appendix C – Participant information sheet (translated)
Helaian Maklumat Penyertaan
Tarikh Helaian Maklumat Penyertaan Disediakan:
2/12/2011
Tajuk Penyelidikan
Latar belakang rangkaian pembelajaran kolaboratif di dalam sektor pembuatan: Satu kajian
perbandingan di antara syarikat-syarikat multinasional dan perusahaan kecil dan sederhana
Jemputan
Saya Quik Wee Hock, seorang mahasiswa kedoktoran di universiti AUT sedang membuat
kajiselidik demi memenuhi keperluan tesis kedoktoran saya. Saya ingin mengundang anda
untuk menyertai di dalam kajian bebas ke atas penggunaan rangkaian pembelajaran kolaboratif
(CNL) dalam pembuatan. Penyertaan anda adalah secara sukarela dan anda tidak diwajibkan
untuk menyertainya jika anda tidak ingin. Sama ada anda memilih untuk turut serta ataupun
tidak, langsung tidak memberi sebarang kesan ke atas diri anda.
Apakah tujuan penyelidikan?
Tujuan utama kajian ini adalah untuk menerokai latar belakang rangkaian pembelajaran
kolaboratif (CNL) di dalam sektor pembuatan dan kemudian membandingkan perbezaan di
antara syarikat-syarikat multinasional dan perusahaan kecil dan sederhana.
Bagaimana saya terpilih untuk menyertai penyelidikan ini?
Anda telah dipilih secara rambang untuk menyertai kajian ini kerana anda seorang pekerja
dalam sektor perkilangan di Malaysia. Pekerja dalam syarikat perkilangan masing-masing telah
dikenalpasti oleh pengurus / penyelia anda atau pengurus sumber manusia.
Apa yang akan berlaku di dalam penyelidikan ini?
Soal selidik penyelidikan tanpa nama. Data yang diperolehi dan analisis yang akan memberi
gambaran tentang latar belakang rangkaian pembelajaran kolaboratif di dalam sektor
pembuatan. Analisis data akan disiarkan dalam tesis kedoktoran, jurnal akademik dan
persidangan.
Apakah ketidakselesaan dan risiko?
Penyertaan anda secara sukarela. Anda tidak akan ditanya soalan yang berkaitan dengan nilai-
nilai, kepercayaan, budaya atau prestasi kerja di syarikat anda. Kami juga mengakui bahawa
maklumat yang bakal anda berikan tentang diri anda adalah sulit. Kami tidak akan
mendedahkan identiti anda atau syarikat anda baik secara bertulis, jurnal, persidangan ataupun
tesis. Sebaliknya, analisa data kuantitatif akan dilakukan dengan menggunakan rangkaian kod.
Bagaimanakah ketidakselesaan dan risiko ditangani?
Jika anda berasa tidak selesa, anda boleh memilih untuk menamatkan kajian ini atau menarik
balik penyertaan anda pada bila-bila masa.
Apakah faedah penyelidikan?
Kajian ini berpotensi untuk menerokai bidang rangkaian pembelajaran kolaboratif di dalam
sektor pembuatan. Dengan meneliti latarbelakang CNL, organisasi pembuatan akan dapat

273 | P a g e
memanfaatkan rangkaian kompleks sistem maklumat untuk meningkatkan kecenderungan
interaksi dan perkongsian maklumat di kalangan kakitangannya. Ia juga boleh dijadikan sebagai
sumber maklumat untuk pembangunan teknologi kolaboratif masa depan. Penyelidik akan
menerbitkan hasil kajian di dalam tesis kedoktoran beliau sebagai syarat ijazah falsafah
kedoktoran.
Bagaimanakah privasi saya dilindungi?
Semua data akan disimpan di arkib AUT University sejajar dengan pematuhan peraturan
Jawatankuasa Etika Auckland University of Technology (AUTEC).
Apakah kos yang terpaksa ditanggung dalam menyertai penyelidikan ini?
Tiada kos untuk menyertai penyelidikan ini. Sekiranya anda bersetuju untuk mengambil
bahagian di dalam soal selidik dalam talian, ia akan mengambil tempoh masa maksimum 10
minit untuk selesai.
Apakah peluang saya untuk mempertimbangkan jemputan ini?
Anda diminta untuk memberikan persetujuan anda untuk menyertai sebelum menjalankan soal
selidik ini. Sila ambil masa untuk mempertimbangkan jemputan ini. Jika anda memerlukan
maklumat atau penjelasan lanjut, sila hubungi penyelidik (emel dan nombor telefon tertera di
bawah).
Bagaimana saya bersetuju untuk menyertai penyelidikan ini?
Individu boleh memilih sama ada untuk menyertai atau tidak. Dengan mengemukakan soal kaji
selidik, ia akan dianggap sebagai tanda persetujuan anda.
Bolehkah saya menerima maklumkbalas keputusan penyelidikan?
Keputusan kajian boleh diperolehi daripada penyelidik atas permintaan sahaja. Anda boleh
meneliti hasil kajian ini melalui www.researchgateway.ac.nz
Apakah yang harus saya lakukan seandainya ada kemusykilan?
Segala pertanyaan berkaitan dengan penyelidikan ini harus diajukan kepada Penyelia Projek,
Profesor Madya Dr. Nevan Wright, WF833, Faculty of Business and Law, AUT University,
Private Bag 92006, Auckland. Tal +649 9219999 ext 5711 emel: [email protected]
Kebimbangan tentang tatacara penyelidikan perlu diajukan kepada Setiausaha Eksekutif,
AUTEC, Dr. Rosemary Godbold, rosemary.godbold @ aut.ac.nz, 649 9219999 ext 6902.
Siapakah yang harus saya hubungi bagi keterangan lanjut tentang penyelidikan ini?
Quik Wee Hock, Faculty of Business & Law, Auckland University of Technology, Private Bag
92006, Auckland 1142, New Zealand. Tal: +649 9219999 ext.5338. Emel:
Diluluskan oleh Jawatankuasa Etika Auckland University of Technology pada 24/11/2011.
Nombor Rujukan AUTEC 11/299

274 | P a g e
Appendix D – Survey questionnaire
Survey Questionnaire Collaborative Networked Learning
Definition: Collaborative networked learning (CNL) is a process of participating in knowledge
communities to construct and maintain a shared conception of a problem. CNL occurs when
employees and their workgroups learn or attempt to learn through organizational networks and
work interactions using collaborative technologies.
A1 Type of manufacturing organization Multinational company Small-medium enterprise
For question B1- H5, please rate your experience with collaborative networked learning.
No. Questions
Str
ongly
dis
agre
e
Dis
agre
e
Neutr
al
Agre
e
Str
ongly
agre
e
B1 I have access to a computer workstation to perform my job 1 2 3 4 5
B2 I have access to networked computer/email to work with others 1 2 3 4 5
B3 I have access to training and learning through computer network 1 2 3 4 5
B4 I have access to online shared databases to facilitate my work 1 2 3 4 5
B5 I have support from my supervisor/manager to collaborate with others 1 2 3 4 5
C1 My job requires me to work in teams 1 2 3 4 5
C2 My job requires me to hold tele-conferences with members from other sites 1 2 3 4 5
C3 My job requires me to share my ideas, work and information with others 1 2 3 4 5
C4 My job can only be completed if other members complete theirs 1 2 3 4 5
C5 My performance depends on the results of my team 1 2 3 4 5
D1 I frequently share ideas, work and information with others 1 2 3 4 5
D2 I frequently interact with my peers and members in the team online 1 2 3 4 5
D3 I can easily obtained help and support from my team/peers online 1 2 3 4 5
D4 I frequently share information in online meetings or discussions 1 2 3 4 5
D5 Members in the team help each other to learn and engage 1 2 3 4 5
E1 I learn from shared information from the network 1 2 3 4 5
E2 I received training to enable me to collaborate effectively 1 2 3 4 5
E3 I participate in improvement projects 1 2 3 4 5
E4 I learn from suppliers/customers or external parties 1 2 3 4 5
E5 I learn from my peers and members in the team 1 2 3 4 5
F1 I work efficiently through use of information from the network 1 2 3 4 5
F2 I work interdependently using the computer network 1 2 3 4 5
F3 I use computers to share information effectively with others 1 2 3 4 5
F4 My team achieved goals for projects by using information from the network 1 2 3 4 5
F5 My team produces good quality collaborative work 1 2 3 4 5
G1 The network systems and tools are useful for my work 1 2 3 4 5
G2 The shared databases are useful for my work 1 2 3 4 5
G3 The online meetings/discussions with external parties are useful 1 2 3 4 5
G4 The network systems are useful for sharing information 1 2 3 4 5
G5 The online learning system and training are useful 1 2 3 4 5
Scales

275 | P a g e
For question I1- J4, please tick [ X ] only one answer for each question.
I1 Number of hours using online learning or e-learning per year Never Less than 10 hours per year 11- 20 hours per year 21-30 hours per year 31-40 hours per year More than 40 hours per year
I2 Number of hours using a shared database or network information per week Never Less than 1 hour per week 1- 5 hours per week
6- 10 hours per week 11- 15 hours per week More than 15 hours per week
I3 Number of hours spent on online meetings or tele-conferencing per week Never Less than 1 hour per week 1- 5 hours per week 6- 10 hours per week 11- 15 hours per week More than 15 hours per week
I4 Number of hours spent on sending/replying to e-mails for work per day Never Less than 1 hour per day 1- 5 hours per day 6- 10 hours per day 11- 15 hours per day More than 15 hours per day
J1 Gender Male Female
No. Questions
Never
Seld
om
Som
etim
es
Very
often
Alw
ays
H1 I accessed knowledge and information through computer system/network 1 2 3 4 5
H2 I updated my work through the computer system/network 1 2 3 4 5
H3 I learned by sharing and exchanging information with others 1 2 3 4 5
H4 I participated in e-learning or online courses 1 2 3 4 5
H5 I participated in workgroups to complete projects or tasks 1 2 3 4 5
Scales

276 | P a g e
J2 Age 20 - 29 years 30 - 39 years 40 - 49 years Above 50 years
J3 Education Post graduate/masters/doctorate Bachelor degree/diploma STPM/SPM SRP/PMR Others (please specify: .............................................................................)
J4 Department Management / Leadership Technical / Engineering Human resources / Administration / Security Purchasing / Procurement / Sourcing / Buying / Materials Planning / Sales / Marketing Production / Operations / Manufacturing / Assembly Quality / Safety
Logistic / Warehouse / Store Finance / Accounts / Costing Others (please specify: ............................................................................)
We are grateful for the time and effort you have made to complete this survey.
Kind Regards,
Quik Wee Hock
Researcher
AUT University
Associate Professor Dr Nevan Wright
Project Supervisor
AUT University
Associate Professor Dr John Tookey
Project Supervisor
AUT University

277 | P a g e
Appendix D – Survey questionnaire (translated)
Soalan Kajiselidik Rangkaian Pembelajaran Kolaboratif
Definisi: Rangkaian pembelajaran kolaboratif (CNL) merupakan satu proses penyertaan dalam
komuniti maklumat, di mana ahli-ahlinya membina dan mengekalkan konsep penyelesaian satu-
satu permasalahan secara bersama. CNL berlaku apabila para pekerja atau pasukan kerja belajar
melalui rangkaian organisasi dan berinteraksi dengan menggunakan teknologi kolaboratif.
A1 Jenis syarikat pembuatan Syarikat multinasional (pelabur asing) Syarikat kecil dan sederhana (tempatan)
Untuk soalan B1- H5, sila nilai pengalaman anda tentang rangkaian pembelajaran
kolaboratif.
No. Soalan-soalan
Sangat ta
k s
etu
ju
Tak s
etu
ju
Berk
ecuali
Setu
ju
Sangat setu
ju
B1 Saya dibekalkan dengan sistem komputer untuk kerja harian 1 2 3 4 5
B2 Saya diberikan kemudahan rangkaian komputer/e-mail untuk berhubungan 1 2 3 4 5
B3 Saya diberikan kemudahan latihan dan pembelajaran melalui komputer 1 2 3 4 5
B4 Saya boleh menggunakan pengkalan data berkomputer untuk kemudahan kerja 1 2 3 4 5
B5 Saya digalakkan oleh penyelia/pengurus untuk bekerjasama dengan rakan lain 1 2 3 4 5
C1 Kerja memerlukan saya berkerja secara berpasukan 1 2 3 4 5
C2 Kerja memerlukan tele-sidang dengan rakan kerja luar syarikat 1 2 3 4 5
C3 Kerja memerlukan perkongsian pendapat dan maklumat kerja dengan rakan lain 1 2 3 4 5
C4 Kerja hanya boleh dijayakan dengan bantuan rakan sekerja 1 2 3 4 5
C5 Prestasi kerja saya bergantung kepada pencapaian berpasukan 1 2 3 4 5
D1 Saya sering berkongsi pendapat, dan maklumat dengan rakan lain 1 2 3 4 5
D2 Saya sering berinteraksi dengan rakan kerja secara talian 1 2 3 4 5
D3 Saya mudah mendapat bantuan serta sokongan daripada rakan secara talian 1 2 3 4 5
D4 Saya sering berkongsi maklumat di dalam sidang talian (online) 1 2 3 4 5
D5 Rakan pasukan saling membantu dalam pembelajaran 1 2 3 4 5
E1 Saya belajar untuk berkongsi maklumat daripada rangkaian komputer 1 2 3 4 5
E2 Saya menerima latihan untuk membolehkan saya berkerjasama secara efektif 1 2 3 4 5
E3 Saya menyertai projek penambah-baikan (continuos improvement) 1 2 3 4 5
E4 Saya belajar daripada pembekal/pelanggan atau pihak luar 1 2 3 4 5
E5 Saya belajar daripada rakan pasukan 1 2 3 4 5
F1 Saya bekerja secara efektif melalui sistem rangkaian komputer 1 2 3 4 5
F2 Saya bekerja secara berdikari menggunakan rangkaian berkomputer 1 2 3 4 5
F3 Saya menggunakan komputer untuk berkongsi maklumat dengan rakan lain 1 2 3 4 5
F4 Pasukan saya mencapai matlamat dengan bantuan sistem komputer 1 2 3 4 5
F5 Pasukan saya mencapai kualiti kerja tinggi secara bekerjasama 1 2 3 4 5
G1 Sistem rangkaian dan perkakasan komputer berguna untuk kerja saya 1 2 3 4 5
G2 Perkongsian pengkalan data berguna untuk kerja saya 1 2 3 4 5
G3 Mesyuarat/sidang talian dengan pihak luar amat berguna 1 2 3 4 5
G4 Sistem rangkaian berguna untuk perkongsian maklumat 1 2 3 4 5
G5 Sistem pembelajaran secara talian amat berguna 1 2 3 4 5
Skala

278 | P a g e
Untuk soalan I1- J4, sila tanda [ X ] satu jawapan yang paling tepat bagi setiap satu
soalan.
I1 Jumlah masa digunakan untuk e-pembelajaran (online) di dalam tempoh setahun Tidak pernah Kurang daripada 10 jam setahun 11- 20 jam setahun 21- 30 jam setahun 31- 40 jam setahun Lebih daripada 40 jam setahun
I2 Jumlah masa digunakan untuk pengkongsian maklumat di dalam tempoh seminggu Tidak pernah Kurang daripada 1 hour seminggu 1- 5 jam seminggu 6- 10 jam seminggu 11- 15 jam seminggu Lebih daripada 15 jam seminggu
I3 Jumlah masa digunakan untuk tele-sidang di dalam tempoh seminggu Tidak pernah Kurang daripada 1 jam seminggu 1- 5 jam seminggu 6- 10 jam seminggu 11- 15 jam seminggu Lebih daripada15 jam seminggu
I4 Jumlah masa digunakan untuk membaca/membalas email di dalam tempoh sehari Tidak pernah Kurang daripada 1 jam sehari 1- 5 jam sehari 6- 10 jam sehari 11- 15 jam sehari Lebih daripada 15 jam sehari
J1 Jantina Lelaki Wanita
No. Soalan-soalan
Tid
ak p
ern
ah
Jara
ng
Kadang-k
adang
Agak k
era
p
Sela
lu
H1 Saya boleh memperolehi maklumat dan pengetahuan melalui rangakai komputer 1 2 3 4 5
H2 Saya mengemaskinikan kerja saya melalui sistem rangkaian komputer 1 2 3 4 5
H3 Saya belajar untuk berkongsi maklumat dengan rakan lain 1 2 3 4 5
H4 Saya menyertai kursus e-pembelajaran (online) 1 2 3 4 5
H5 Saya menyertai projek berpasukan 1 2 3 4 5
Skala

279 | P a g e
J2 Umur 20 - 29 tahun 30 - 39 tahun 40 - 49 tahun Lebih 50 tahun
J3 Pendidikan Graduan/siswazah lepasan tinggi/kedoktoran Sarjana muda/diploma STPM/SPM SRP/PMR Lain-lain (sila nyatakan: .............................................................................)
J4 Jabatan/Bahagian Pengurusan / Majikan Teknikal / Kejuruteraan Sumber manusia / Pentadbiran / Keselamatan Pembelian / Pembekalan Perancang / Jualan / Pemasaran Pengeluaran / Operasi / Pembuatan / Pemasangan Kualiti / Keselamatan
Logistik / Gudang / Stor Kewangan / Perakaunan / Kos Lain-lain (sila nyatakan: .............................................................................)
Terima-kasih kerana meluangkan masa dalam menjayakan kaji-selidik ini.
Yang benar,
Quik Wee Hock
Penyelidik
AUT University
Profesor Madya Dr Nevan Wright
Penyelia Projek
AUT University
Profesor Madya Dr John Tookey
Penyelia Projek
AUT University

280 | P a g e
Appendix E – Survey measurement model
SPSS Code Item No. Variables Type Measure
Id none Identification of each participant in alphanumeric code alpha-numeric
none
TypeOrg A1 Type of company numeric nominal
ORG B1…B5 Organizational support (5 rating scale items) numeric scale
IDP C1…C5 Positive interdependence (4 rating scale items) numeric scale
INT D1…D5 Promotive interaction (5 rating scale items) numeric scale
LRN E1…E5 Internal-external learning (4 rating scale items) numeric scale
EFF F1…F5 Perceived effectiveness (5 rating scale items) numeric scale
USE G1…G5 Perceived usefulness (5 rating scale items) numeric scale
CNL H1…H5 Collaborative networked learning (5 rating scale items) numeric scale
HrOnline I1 Number of hours using online learning per year numeric ordinal
HrEmail I2 Number of hours using email per day numeric ordinal
HrSharedDB I3 Number of hours using a shared database per day numeric ordinal
HrTeleCon I4 Number of hours attending online meetings per week numeric ordinal
Gender J2 Gender numeric nominal
Age J1 Age numeric ordinal
Edu J3 Education numeric nominal
Dept J4 Department numeric nominal
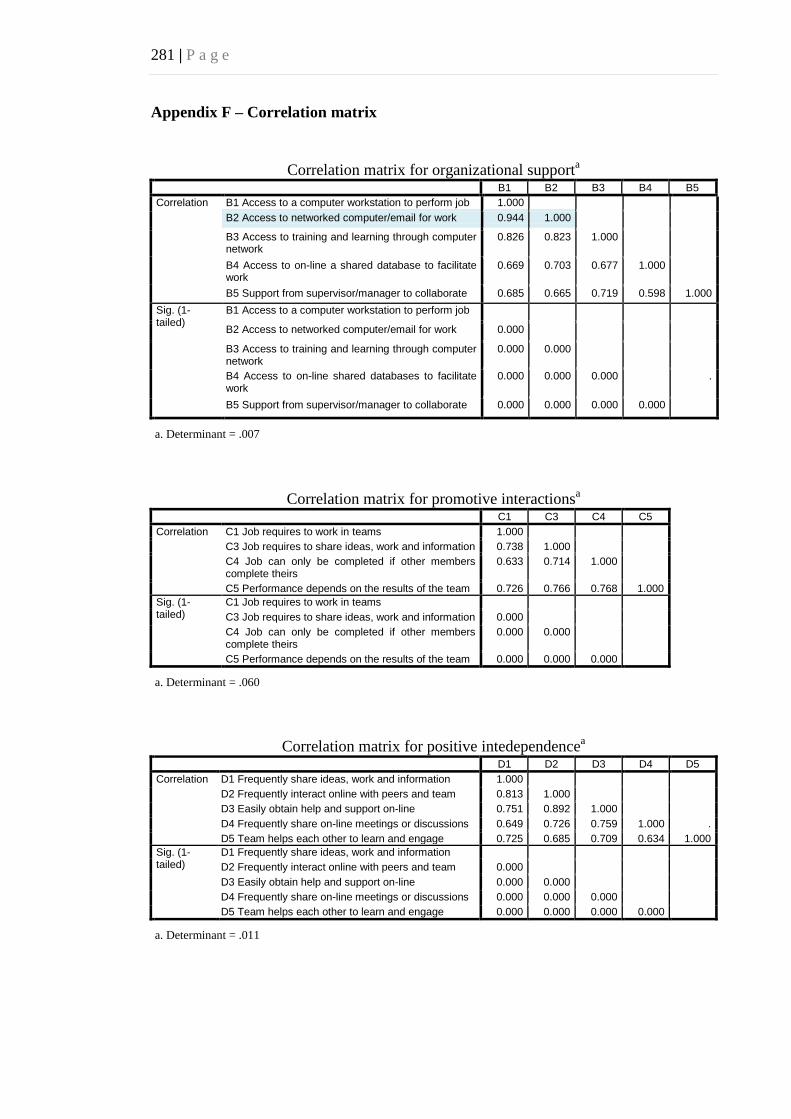
281 | P a g e
Appendix F – Correlation matrix
Correlation matrix for organizational supporta
B1 B2 B3 B4 B5
Correlation B1 Access to a computer workstation to perform job 1.000
B2 Access to networked computer/email for work 0.944 1.000
B3 Access to training and learning through computer network
0.826 0.823 1.000
B4 Access to on-line a shared database to facilitate work
0.669 0.703 0.677 1.000
B5 Support from supervisor/manager to collaborate 0.685 0.665 0.719 0.598 1.000
Sig. (1-tailed)
B1 Access to a computer workstation to perform job
B2 Access to networked computer/email for work 0.000
B3 Access to training and learning through computer network
0.000 0.000
B4 Access to on-line shared databases to facilitate work
0.000 0.000 0.000
.
B5 Support from supervisor/manager to collaborate 0.000 0.000 0.000 0.000
a. Determinant = .007
Correlation matrix for promotive interactionsa
C1 C3 C4 C5
Correlation C1 Job requires to work in teams 1.000
C3 Job requires to share ideas, work and information 0.738 1.000
C4 Job can only be completed if other members complete theirs
0.633 0.714 1.000
C5 Performance depends on the results of the team 0.726 0.766 0.768 1.000
Sig. (1-tailed)
C1 Job requires to work in teams
C3 Job requires to share ideas, work and information 0.000
C4 Job can only be completed if other members complete theirs
0.000 0.000
C5 Performance depends on the results of the team 0.000 0.000 0.000
a. Determinant = .060
Correlation matrix for positive intedependencea
D1 D2 D3 D4 D5
Correlation D1 Frequently share ideas, work and information 1.000
D2 Frequently interact online with peers and team 0.813 1.000
D3 Easily obtain help and support on-line 0.751 0.892 1.000
D4 Frequently share on-line meetings or discussions 0.649 0.726 0.759 1.000 .
D5 Team helps each other to learn and engage 0.725 0.685 0.709 0.634 1.000
Sig. (1-tailed)
D1 Frequently share ideas, work and information
D2 Frequently interact online with peers and team 0.000
D3 Easily obtain help and support on-line 0.000 0.000
D4 Frequently share on-line meetings or discussions 0.000 0.000 0.000
D5 Team helps each other to learn and engage 0.000 0.000 0.000 0.000
a. Determinant = .011

282 | P a g e
Appendix F – Correlation matrix (cont’)
Correlation matrix for internal-external learninga
E1 E2 E3 E5
Correlation E1 Learn from shared information from the network 1.000
E2 Receive training to enable me to collaborate effectively
0.817 1.000
E3 Participate in improvement projects 0.631 0.611 1.000
E5 Learn from my peers and team 0.711 0.649 0.671 1.000
Sig. (1-tailed)
E1 Learn from shared information from the network
E2 Receive training to enable me to collaborate effectively
0.000
E3 Participate in improvement projects 0.000 0.000
E5 Learn from my peers and team 0.000 0.000 0.000
a. Determinant = .078
Correlation matrix for perceived effectivenessa
F1 F2 F3 F4 F5
Correlation F1 Work efficiently through use of information from the network
1.000
F2 Work interdependently using the computer network
0.889 1.000
F3 Use computers to share information effectively 0.787 0.849 1.000
F4 Team achieves goals using information from the network
0.834 0.857 0.873 1.000
F5 Team produces good quality collaborative work 0.799 0.778 0.839 0.859 1.000
Sig. (1-tailed)
F1 Work efficiently through use of information from the network
F2 Work interdependently using the computer network
0.000
F3 Use computers to share information effectively 0.000 0.000
F4 Team achieves goals using information from the network
0.000 0.000 0.000
F5 Team produces good quality collaborative work 0.000 0.000 0.000 0.000
a. Determinant = .002
Correlation matrix for perceived usefulnessa
G1 G2 G3 G4 G5
Correlation G1 The network systems/tools are useful 1.000
G2 The shared databases are useful 0.898 1.000
G3 The on-line meetings/discussions with external parties are useful
0.624 0.664 1.000
G4 The network systems are useful for sharing information
0.850 0.854 0.697 1.000
G5 The on-line learning system is useful 0.748 0.766 0.654 0.764 1.000
Sig. (1-tailed)
G1 The network systems/tools are useful
G2 The shared databases are useful 0.000
G3 The on-line meetings/discussions with external parties are useful
0.000 0.000
G4 The network systems are useful for sharing information
0.000 0.000 0.000
G5 The on-line learning systems are useful 0.000 0.000 0.000 0.000
a. Determinant = .008

283 | P a g e
Appendix F – Correlation matrix (cont’)
Correlation matrix for collaborative networked learninga
H1 H2 H3 H4 H5
Correlation H1 Online knowledge and information 1.000
H2 Work using online system/network 0.842 1.000
H3 Sharing and exchanging information 0.847 0.816 1.000
H4 Participating in e-learning 0.674 0.673 0.690 1.000
H5 Participating in workgroup activities 0.722 0.689 0.741 0.714 1.000
Sig. (1-tailed)
H1 Online knowledge and information
H2 Work using online system/network 0.000
H3 Sharing and exchanging information 0.000 0.000
H4 Participating in e-learning 0.000 0.000 0.000
H5 Participating in workgroup activities 0.000 0.000 0.000 0.000
a. Determinant = .012

284 | P a g e
Appendix G – Tables on hours spent on CNL (MNCs and SMEs)
Small-medium enterprises (SMEs)
E-learning Shared Database Online Meeting
Emailing
N Valid 69 69 69 69
Missing 0 0 0 0 Mean 1.99 2.78 1.68 2.54 Std. Error of Mean 0.17 0.19 0.15 0.17 Median 2.00 2.00 1.00 2.00 Mode 1.00 2.00 1.00 2.00 Std. Deviation 1.41 1.60 1.21 1.38 Variance 1.99 2.56 1.46 1.90 Skewness 1.78 0.75 1.94 0.86 Std. Error of Skewness 0.29 0.29 0.29 0.29 Kurtosis 2.58 -0.53 3.12 0.06 Std. Error of Kurtosis 0.57 0.57 0.57 0.57 Range 5.00 5.00 5.00 5.00
Multinationals companies (MNCs)
E-learning Shared Database Online Meeting
Emailing
N Valid 177 177 177 177
Missing 0 0 0 0 Mean 3.35 4.17 2.80 3.60 Std. Error of Mean 0.11 0.11 0.11 0.08 Median 3.00 4.00 3.00 3.00 Mode 2.00 4.00 1.00 3.00 Std. Deviation 1.45 1.41 1.48 1.07 Variance 2.12 1.98 2.17 1.14 Skewness 0.67 -0.10 0.37 0.51 Std. Error of Skewness 0.18 0.18 0.18 0.18 Kurtosis -0.78 -1.04 -0.73 -0.06 Std. Error of Kurtosis 0.36 0.36 0.36 0.36 Range 5.00 5.00 5.00 5.00

285 | P a g e
Appendix H – Graphs on hours spent on CNL (MNCs and SMEs)
Hours spend on e-learning per year
Hours spend on tele-conferencing per week
Hours spend on shared database per week
Hours spend on email at work per day

286 | P a g e
Appendix I – Multiple regression stage 1
Model H1
Unstandardized Coefficients
Standardized Coefficients
t Sig.
Collinearity Statistics
B S.E. Beta Tolerance VIF
B2 Access to networked computer/email for work .022 .084 .020 .260 .795 .279 3.589
B3 Access to training and learning through computer network .317 .079 .310 3.992 .000 .263 3.807
B4 Access to on-line shared databases to facilitate work .397 .055 .424 7.250 .000 .462 2.163
B5 Support from supervisor/manager to collaborate .158 .072 .129 2.191 .029 .454 2.202
C1 Job requires to work in teams .107 .077 .095 1.392 .165 .392 2.554
C3 Job requires to share ideas, work and information .573 .073 .590 7.824 .000 .319 3.130
C4 Job can only be completed if other members complete theirs .087 .065 .094 1.339 .182 .370 2.699
C5 Performance depends on the results of team .018 .080 .018 .228 .820 .284 3.519
D1 Frequently share ideas, work and information .209 .069 .210 3.031 .003 .285 3.503
D2 Frequently interact online with peers and team .134 .084 .150 1.597 .112 .156 6.418
D3 Easily obtain help and support on-line .201 .082 .220 2.446 .015 .169 5.908
D4 Frequently share on-line meetings or discussions .122 .049 .145 2.462 .015 .397 2.520
D5 Team helps each other to learn and engage .203 .060 .196 3.361 .001 .402 2.490
E1 Learn from shared information from the network .402 .069 .411 5.806 .000 .272 3.680
E2 Receive training to enable me to collaborate effectively .230 .064 .236 3.589 .000 .315 3.175
E3 Participate in improvement projects .081 .057 .075 1.416 .158 .488 2.047
E5 Learn from my peers and team .205 .063 .188 3.250 .001 .408 2.450
F1 Work efficiently through use of information from the network .185 .075 .192 2.478 .014 .175 5.714
F2 Work interdependently using the computer network .168 .085 .170 1.982 .049 .143 7.010
F3 Use computers to share information effectively .106 .077 .107 1.375 .170 .175 5.707
F4 Team achieves goals using information from the network .248 .081 .255 3.063 .002 .151 6.619
F5 Team produces good quality collaborative work .205 .072 .202 2.857 .005 .211 4.733
G1 The network systems/tools are useful .317 .093 .305 3.410 .001 .165 6.060
G2 The shared databases are useful .222 .098 .210 2.272 .024 .154 6.495
G3 The on-line meetings/discussions with external parties are useful .016 .047 .018 .337 .736 .472 2.120
G4 The network systems are useful for sharing information .212 .080 .214 2.646 .009 .202 4.953
G5 The on-line learning systems are useful .142 .062 .141 2.291 .023 .346 2.888

287 | P a g e
Appendix I – Multiple regression stage 1 (cont’)
Model H2
Unstandardized Coefficients
Standardized Coefficients
t Sig.
Collinearity Statistics
B S.E. Beta Tolerance VIF
B2 I have access to networked computer/email for work with others .206 .093 .182 2.223 .027 .279 3.589
B3 I have access to training and learning through computer network .276 .087 .267 3.167 .002 .263 3.807
B4 I have access to on-line shared databases to facilitate my work .250 .060 .264 4.163 .000 .462 2.163
B5 I have support from my supervisor/manager to collaborate with others .156 .079 .126 1.973 .050 .454 2.202
C1 My job requires me to work in teams .184 .077 .161 2.393 .017 .392 2.554
C3 My job requires me to share my ideas, work and information with others .479 .073 .487 6.526 .000 .319 3.130
C4 My job can only be completed if other members complete theirs .099 .065 .105 1.514 .131 .370 2.699
C5 My performance depends on the results of my team .071 .080 .070 .888 .376 .284 3.519
D1 I frequently share ideas, work and information with others .187 .070 .186 2.675 .008 .285 3.503
D2 I frequently interact with my peers and members in the team on-line .335 .085 .369 3.915 .000 .156 6.418
D3 I can easily obtain help and support from my team/peers on-line .098 .083 .106 1.176 .241 .169 5.908
D4 I frequently share information on-line meetings or discussions .107 .050 .126 2.137 .034 .397 2.520
D5 Members in the team help each other to learn and engage .123 .061 .117 1.997 .047 .402 2.490
E1 I learn from shared information from the network .288 .080 .292 3.618 .000 .272 3.680
E2 I received training to enable me to collaborate effectively .284 .074 .289 3.858 .000 .315 3.175
E3 I participate in improvement projects .090 .066 .082 1.367 .173 .488 2.047
E5 I learn from my peers and members in the team .206 .073 .186 2.835 .005 .408 2.450
F1 I work efficiently through use of information from the network .089 .090 .091 .985 .326 .175 5.714
F2 I work interdependently using the computer network .127 .103 .127 1.240 .216 .143 7.010
F3 I use computers to share information effectively with others .359 .093 .356 3.848 .000 .175 5.707
F4 My team achieves goals for projects by using information from the network .114 .098 .116 1.164 .245 .151 6.619
F5 My team produces good quality collaborative work .167 .087 .162 1.926 .055 .211 4.733
G1 The network systems and tools are useful for my work .141 .103 .134 1.365 .173 .165 6.060
G2 The shared databases are useful for my work .212 .109 .199 1.955 .052 .154 6.495
G3 The on-line meetings/discussions with external parties are useful .090 .053 .100 1.720 .087 .472 2.120
G4 The network systems are useful for sharing information .284 .089 .282 3.175 .002 .202 4.953
G5 The on-line learning system and training are useful .150 .069 .147 2.172 .031 .346 2.888

288 | P a g e
Appendix I – Multiple regression stage 1 (cont’)
Model H3
Unstandardized Coefficients
Standardized Coefficients
t Sig.
Collinearity Statistics
B S.E. Beta Tolerance VIF
B2 Access to networked computer/email for work .025 .091 .022 .270 .787 .279 3.589
B3 Access to training and learning through computer network .350 .086 .340 4.079 .000 .263 3.807
B4 Access to on-line shared databases to facilitate work .283 .059 .300 4.778 .000 .462 2.163
B5 Support from supervisor/manager to collaborate .227 .078 .185 2.913 .004 .454 2.202
C1 Job requires to work in teams .099 .076 .087 1.301 .194 .392 2.554
C3 Job requires to share ideas, work and information .529 .072 .542 7.301 .000 .319 3.130
C4 Job can only be completed if other members complete theirs .058 .065 .062 .905 .366 .370 2.699
C5 Performance depends on the results of team .124 .079 .124 1.582 .115 .284 3.519
D1 Frequently share ideas, work and information .084 .068 .084 1.245 .214 .285 3.503
D2 Frequently interact online with peers and team .261 .083 .289 3.160 .002 .156 6.418
D3 Easily obtain help and support on-line .053 .081 .058 .661 .509 .169 5.908
D4 Frequently share on-line meetings or discussions .176 .049 .208 3.630 .000 .397 2.520
D5 Team helps each other to learn and engage .309 .059 .297 5.218 .000 .402 2.490
E1 Learn from shared information from the network .299 .073 .304 4.087 .000 .272 3.680
E2 Receive training to enable me to collaborate effectively .294 .068 .300 4.343 .000 .315 3.175
E3 Participate in improvement projects .103 .060 .095 1.708 .089 .488 2.047
E5 Learn from my peers and team .216 .067 .197 3.240 .001 .408 2.450
F1 Work efficiently through use of information from the network .342 .083 .352 4.139 .000 .175 5.714
F2 Work interdependently using the computer network .076 .094 .076 .806 .421 .143 7.010
F3 Use computers to share information effectively .092 .085 .092 1.078 .282 .175 5.707
F4 Team achieves goals using information from the network .101 .089 .103 1.129 .260 .151 6.619
F5 Team produces good quality collaborative work .278 .079 .271 3.507 .001 .211 4.733
G1 The network systems/tools are useful .138 .097 .132 1.417 .158 .165 6.060
G2 The shared databases are useful .177 .102 .167 1.730 .085 .154 6.495
G3 The on-line meetings/discussions with external parties are useful .022 .049 .024 .442 .659 .472 2.120
G4 The network systems are useful for sharing information .320 .084 .320 3.806 .000 .202 4.953
G5 The on-line learning systems are useful .240 .065 .237 3.699 .000 .346 2.888

289 | P a g e
Appendix I – Multiple regression stage 1 (cont’)
Model H4
Unstandardized Coefficients
Standardized Coefficients
t Sig.
Collinearity Statistics
B S.E. Beta Tolerance VIF
B2 Access to networked computer/email for work .005 .125 .004 .039 .969 .279 3.589
B3 Access to training and learning through computer network .362 .118 .309 3.076 .002 .263 3.807
B4 Access to on-line shared databases to facilitate work .276 .081 .257 3.395 .001 .462 2.163
B5 Support from supervisor/manager to collaborate .144 .107 .103 1.348 .179 .454 2.202
C1 Job requires to work in teams .029 .104 .022 .277 .782 .392 2.554
C3 Job requires to share ideas, work and information .459 .099 .413 4.629 .000 .319 3.130
C4 Job can only be completed if other members complete theirs .111 .088 .104 1.258 .210 .370 2.699
C5 Performance depends on the results of team .151 .108 .132 1.400 .163 .284 3.519
D1 Frequently share ideas, work and information .094 .101 .082 .932 .352 .285 3.503
D2 Frequently interact online with peers and team .308 .123 .300 2.513 .013 .156 6.418
D3 Easily obtain help and support on-line .056 .120 .054 .471 .638 .169 5.908
D4 Frequently share on-line meetings or discussions .260 .072 .269 3.599 .000 .397 2.520
D5 Team helps each other to learn and engage .059 .088 .050 .668 .505 .402 2.490
E1 Learn from shared information from the network .204 .106 .183 1.930 .055 .272 3.680
E2 Receive training to enable me to collaborate effectively .248 .098 .223 2.534 .012 .315 3.175
E3 Participate in improvement projects .344 .087 .278 3.947 .000 .488 2.047
E5 Learn from my peers and team .061 .096 .049 .632 .528 .408 2.450
F1 Work efficiently through use of information from the network .169 .129 .153 1.305 .193 .175 5.714
F2 Work interdependently using the computer network .297 .147 .262 2.020 .044 .143 7.010
F3 Use computers to share information effectively -.038 .134 -.034 -.287 .774 .175 5.707
F4 Team achieves goals using information from the network .103 .140 .093 .739 .461 .151 6.619
F5 Team produces good quality collaborative work .256 .124 .220 2.064 .040 .211 4.733
G1 The network systems/tools are useful -.012 .144 -.010 -.085 .932 .165 6.060
G2 The shared databases are useful .133 .151 .111 .882 .379 .154 6.495
G3 The on-line meetings/discussions with external parties are useful .241 .073 .236 3.296 .001 .472 2.120
G4 The network systems are useful for sharing information .147 .124 .129 1.182 .239 .202 4.953
G5 The on-line learning systems are useful .300 .096 .261 3.122 .002 .346 2.888

290 | P a g e
Appendix I – Multiple regression stage 1 (cont’)
Model H5
Unstandardized Coefficients
Standardized Coefficients
t Sig.
Collinearity Statistics
B S.E. Beta Tolerance VIF
B2 Access to networked computer/email for work .157 .099 .141 1.588 .113 .279 3.589
B3 Access to training and learning through computer network .236 .093 .231 2.538 .012 .263 3.807
B4 Access to on-line shared databases to facilitate work .122 .064 .131 1.910 .057 .462 2.163
B5 Support from supervisor/manager to collaborate .336 .084 .276 3.987 .000 .454 2.202
C1 Job requires to work in teams .260 .080 .232 3.236 .001 .392 2.554
C3 Job requires to share ideas, work and information .358 .077 .371 4.675 .000 .319 3.130
C4 Job can only be completed if other members complete theirs .101 .068 .109 1.484 .139 .370 2.699
C5 Performance depends on the results of team .082 .083 .083 .988 .324 .284 3.519
D1 Frequently share ideas, work and information .162 .081 .164 2.011 .045 .285 3.503
D2 Frequently interact online with peers and team .102 .098 .115 1.041 .299 .156 6.418
D3 Easily obtain help and support on-line .029 .096 .032 .305 .761 .169 5.908
D4 Frequently share on-line meetings or discussions .150 .058 .179 2.597 .010 .397 2.520
D5 Team help each other to learn and engage .357 .071 .347 5.058 .000 .402 2.490
E1 Learn from shared information from the network .133 .085 .137 1.569 .118 .272 3.680
E2 Receive training to enable me to collaborate effectively .157 .078 .162 2.006 .046 .315 3.175
E3 Participate in improvement projects .365 .070 .340 5.235 .000 .488 2.047
E5 Learn from my peers and team .187 .077 .173 2.426 .016 .408 2.450
F1 Work efficiently through use of information from the network .037 .104 .039 .360 .719 .175 5.714
F2 Work interdependently using the computer network .047 .118 .047 .394 .694 .143 7.010
F3 Use computers to share information effectively .160 .107 .161 1.490 .138 .175 5.707
F4 Team achieves goals using information from the network .104 .113 .107 .920 .359 .151 6.619
F5 Team produces good quality collaborative work .402 .100 .397 4.025 .000 .211 4.733
G1 The network systems/tools are useful .251 .115 .242 2.182 .030 .165 6.060
G2 The shared databases are useful .279 .121 .266 2.317 .021 .154 6.495
G3 The on-line meetings/discussions with external parties are useful .039 .058 .043 .661 .509 .472 2.120
G4 The network systems are useful for sharing information -.070 .099 -.071 -.703 .483 .202 4.953
G5 The on-line learning systems are useful .292 .077 .292 3.811 .000 .346 2.888

291 | P a g e
Appendix J – Multiple regression stage 2
Model H1
Unstandardized Coefficients
Standardized Coefficients
t Sig.
Collinearity Statistics
B S.E. Beta Tolerance VIF
B3 Access to training and learning through computer network .329 .065 .321 5.043 .000 .388 2.575
B4 Access to on-line shared databases to facilitate work .402 .052 .429 7.761 .000 .516 1.939
B5 Support from supervisor/manager to collaborate .160 .071 .131 2.244 .026 .461 2.170
C3 Job requires to share ideas, work and information .720 .042 .741 17.262 .000 1.000 1.000
D3 Easily obtain help and support on-line .286 .063 .313 4.542 .000 .291 3.442
D4 Frequently share on-line meetings or discussions .130 .049 .154 2.627 .009 .401 2.495
D5 Team helps each other to learn and engage .198 .061 .191 3.268 .001 .403 2.482
D1 Frequently share ideas, work and information .258 .062 .260 4.178 .000 .357 2.799
E1 Learn from shared information from the network .518 .063 .530 8.210 .000 .332 3.014
E2 Receive training to enable me to collaborate effectively .216 .065 .222 3.302 .001 .305 3.275
E4 Learn from suppliers/customers or external parties .140 .037 .165 3.816 .000 .735 1.360
F1 Work efficiently through use of information from the network .292 .060 .302 4.851 .000 .279 3.590
F4 Team achieves goals using information from the network .366 .071 .377 5.145 .000 .201 4.968
F5 Team produces good quality collaborative work .235 .068 .231 3.433 .001 .240 4.170
G1 The network systems/tools are useful .315 .093 .303 3.401 .001 .166 6.034
G2 The shared databases are useful .226 .097 .214 2.336 .020 .156 6.395
G4 The network systems are useful for sharing information .220 .077 .221 2.844 .005 .217 4.600
G5 The on-line learning systems are useful .147 .060 .146 2.431 .016 .364 2.746

292 | P a g e
Appendix J – Multiple regression stage 2 (cont’)
Model H2
Unstandardized Coefficients
Standardized Coefficients
t Sig.
Collinearity Statistics
B S.E. Beta Tolerance VIF
B2 Access to networked computer/email for work .228 .093 .201 2.466 .014 .283 3.536
B3 Access to training and learning through computer network .339 .082 .327 4.151 .000 .303 3.300
B4 Access to on-line shared databases to facilitate work .270 .060 .285 4.525 .000 .475 2.104
C1 Job requires to work in teams .240 .072 .211 3.340 .001 .455 2.199 C3 Job requires to share ideas, work and information .569 .062 .580 9.202 .000 .455 2.199
D1 Frequently share ideas, work and information .245 .066 .243 3.737 .000 .332 3.009
D2 Frequently interact online with peers and team .417 .065 .460 6.378 .000 .271 3.688
D4 Frequently share on-line meetings or discussions .151 .047 .178 3.219 .001 .462 2.163
E1 Learn from shared information from the network .302 .079 .305 3.805 .000 .276 3.626
E2 Receive training to collaborate effectively .301 .073 .306 4.130 .000 .324 3.090
E5 Learn from peers and team .244 .067 .221 3.643 .000 .480 2.083
F3 Use computers to share information effectively .780 .041 .773 19.055 .000 1.000 1.000
G4 The network systems are useful for sharing information .550 .064 .548 8.587 .000 .416 2.405
G5 The on-line learning systems are useful .267 .065 .263 4.118 .000 .416 2.405

293 | P a g e
Appendix J – Multiple regression stage 2 (cont’)
Model H3
Unstandardized Coefficients
Standardized Coefficients
t Sig.
Collinearity Statistics
B S.E. Beta Tolerance VIF
B3 Access to training and learning through computer network .364 .071 .352 5.156 .000 .388 2.575
B4 Access to on-line shared databases to facilitate work .288 .056 .305 5.148 .000 .516 1.939
B5 Support from supervisor/manager to collaborate .230 .077 .187 2.974 .003 .461 2.170
C3 Job requires to share ideas, work and information .729 .042 .746 17.492 .000 1.000 1.000
D2 Frequently interact online with peers and team .339 .052 .376 6.480 .000 .388 2.579
D4 Frequently share on-line meetings or discussions .188 .046 .222 4.074 .000 .437 2.286
D5 Team helps each other to learn and engage .345 .054 .331 6.423 .000 .491 2.037
E1 Learn from shared information from the network .314 .073 .320 4.309 .000 .276 3.626
E2 Receive training to collaborate effectively .313 .067 .320 4.667 .000 .324 3.090
E5 Learn from peers and team .260 .062 .237 4.214 .000 .480 2.083
F1 Work efficiently through use of information from the network .466 .058 .479 8.036 .000 .362 2.760
F5 Team produces good quality collaborative work .403 .061 .394 6.599 .000 .362 2.760
G4 The network systems are useful for sharing information .527 .060 .527 8.823 .000 .416 2.405
G5 The on-line learning systems are useful .325 .060 .321 5.377 .000 .416 2.405

294 | P a g e
Appendix J – Multiple regression stage 2 (cont’)
Model H4
Unstandardized Coefficients
Standardized Coefficients
t Sig.
Collinearity Statistics
B S.E. Beta Tolerance VIF
B3 Access to training and learning through computer network .435 .082 .371 5.305 .000 .541 1.847
B4 Access to on-line shared databases to facilitate work .299 .075 .279 3.993 .000 .541 1.847
C3 Job requires to share ideas, work and information .673 .057 .605 11.884 .000 1.000 1.000
D2 Frequently interact online with peers and team .434 .070 .422 6.161 .000 .472 2.117
D4 Frequently share on-line meetings or discussions .295 .066 .307 4.473 .000 .472 2.117
E2 Receive training to collaborate effectively .408 .070 .367 5.847 .000 .626 1.597
E3 Participate in improvement projects .417 .077 .338 5.387 .000 .626 1.597
F2 Work interdependently using the computer network .446 .088 .393 5.048 .000 .394 2.536
F5 Team produces good quality collaborative work .339 .091 .291 3.739 .000 .394 2.536
G3 The on-line meetings/discussions with external parties are useful .316 .067 .310 4.731 .000 .572 1.747
G5 The on-line learning system are useful .447 .075 .389 5.938 .000 .572 1.747

295 | P a g e
Appendix J – Multiple regression stage 2 (cont’)
Model H5
Unstandardized Coefficients
Standardized Coefficients
t Sig.
Collinearity Statistics
B S.E. Beta Tolerance VIF
B3 Access to training and learning through computer network .406 .069 .399 5.853 .000 .484 2.067
B5 Support from supervisor/manager to collaborate .399 .083 .328 4.816 .000 .484 2.067
C1 Job requires to work in teams .321 .075 .286 4.277 .000 .455 2.199
C3 Job requires to share ideas, work and information .456 .065 .472 7.051 .000 .455 2.199
D4 Frequently share on-line meetings or discussions .254 .048 .304 5.272 .000 .598 1.672
D5 Team helps each other to learn and engage .502 .059 .488 8.478 .000 .598 1.672
E3 Participate in improvement projects .462 .068 .431 6.808 .000 .549 1.821
E5 Learn from peers and team .341 .069 .315 4.977 .000 .549 1.821
F5 Team produces good quality collaborative work .701 .047 .693 15.012 .000 1.000 1.000
G1 The network systems/tools are useful .226 .108 .218 2.082 .038 .184 5.436
G2 The shared databases are useful .269 .113 .257 2.371 .019 .173 5.780
G5 The on-line learning systems are useful .292 .072 .292 4.078 .000 .395 2.534
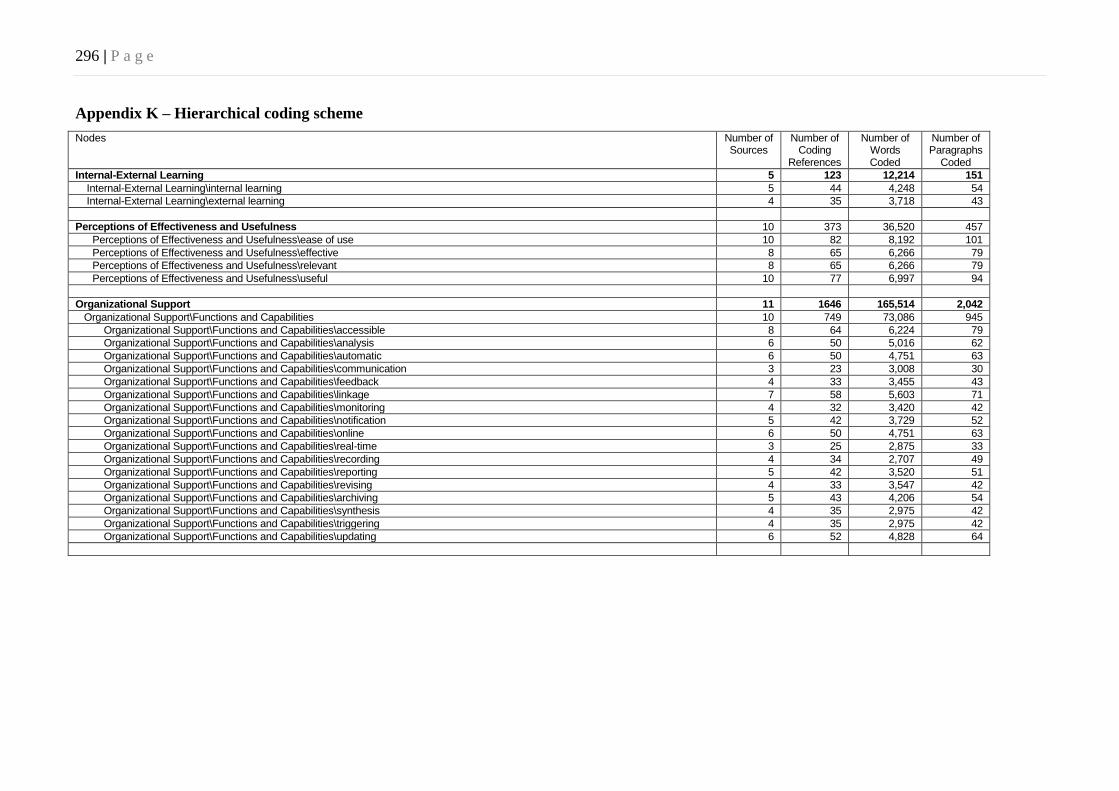
296 | P a g e
Appendix K – Hierarchical coding scheme
Nodes Number of Sources
Number of Coding
References
Number of Words Coded
Number of Paragraphs
Coded
Internal-External Learning 5 123 12,214 151
Internal-External Learning\internal learning 5 44 4,248 54
Internal-External Learning\external learning 4 35 3,718 43
Perceptions of Effectiveness and Usefulness 10 373 36,520 457
Perceptions of Effectiveness and Usefulness\ease of use 10 82 8,192 101
Perceptions of Effectiveness and Usefulness\effective 8 65 6,266 79
Perceptions of Effectiveness and Usefulness\relevant 8 65 6,266 79
Perceptions of Effectiveness and Usefulness\useful 10 77 6,997 94
Organizational Support 11 1646 165,514 2,042
Organizational Support\Functions and Capabilities 10 749 73,086 945
Organizational Support\Functions and Capabilities\accessible 8 64 6,224 79
Organizational Support\Functions and Capabilities\analysis 6 50 5,016 62
Organizational Support\Functions and Capabilities\automatic 6 50 4,751 63
Organizational Support\Functions and Capabilities\communication 3 23 3,008 30
Organizational Support\Functions and Capabilities\feedback 4 33 3,455 43
Organizational Support\Functions and Capabilities\linkage 7 58 5,603 71
Organizational Support\Functions and Capabilities\monitoring 4 32 3,420 42
Organizational Support\Functions and Capabilities\notification 5 42 3,729 52
Organizational Support\Functions and Capabilities\online 6 50 4,751 63
Organizational Support\Functions and Capabilities\real-time 3 25 2,875 33
Organizational Support\Functions and Capabilities\recording 4 34 2,707 49
Organizational Support\Functions and Capabilities\reporting 5 42 3,520 51
Organizational Support\Functions and Capabilities\revising 4 33 3,547 42
Organizational Support\Functions and Capabilities\archiving 5 43 4,206 54
Organizational Support\Functions and Capabilities\synthesis 4 35 2,975 42
Organizational Support\Functions and Capabilities\triggering 4 35 2,975 42
Organizational Support\Functions and Capabilities\updating 6 52 4,828 64

297 | P a g e
Appendix K – Hierarchical coding scheme (cont’)
Nodes Number of Sources
Number of Coding
References
Number of Words Coded
Number of Paragraphs
Coded
Organizational Support\Infrastucture and Systems 10 719 72,499 879
Organizational Support\Infrastucture and Systems\application system and collaborative technologies 7 161 17,838 200
Organizational Support\Infrastucture and Systems\application system and collaborative technologies\Amorplus 1 7 810 8
Organizational Support\Infrastucture and Systems\application system and collaborative technologies\AutoCad 2 15 1,659 19
Organizational Support\Infrastucture and Systems\application system and collaborative technologies\chat room 1 8 1,114 10
Organizational Support\Infrastucture and Systems\application system and collaborative technologies\email 3 25 2,528 29
Organizational Support\Infrastucture and Systems\application system and collaborative technologies\E-Bulletin 1 8 1,231 12
Organizational Support\Infrastucture and Systems\application system and collaborative technologies\Lotus 2 7 810 8
Organizational Support\Infrastucture and Systems\application system and collaborative technologies\Netmeeting 1 8 1,114 10
Organizational Support\Infrastucture and Systems\application system and collaborative technologies\others 2 14 1,355 17
Organizational Support\Infrastucture and Systems\application system and collaborative technologies\Sharepoint 1 8 580 10
Organizational Support\Infrastucture and Systems\application system and collaborative technologies\video-conf 1 8 1,114 10
Organizational Support\Infrastucture and Systems\application system and collaborative technologies\spreadsheet 4 30 3,019 39
Organizational Support\Infrastucture and Systems\application system and collaborative technologies\shared drive 3 19 1,333 22
Organizational Support\Infrastucture and Systems\application system and collaborative technologies\shared folder 4 34 3,322 42
Organizational Support\Infrastucture and Systems\enterprise system 9 283 27,769 344
Organizational Support\Infrastucture and Systems\enterprise system\work instruction 5 43 4,298 53
Organizational Support\Infrastucture and Systems\enterprise system\schematics 4 35 3,718 43
Organizational Support\Infrastucture and Systems\enterprise system\doc con system 3 27 2,487 31
Organizational Support\Infrastucture and Systems\enterprise system\ECM 5 43 4,298 53
Organizational Support\Infrastucture and Systems\enterprise system\ERP or MRP 10 79 7,9375 97
Organizational Support\Infrastucture and Systems\global system 6 101 10,603 126
Organizational Support\Infrastucture and Systems\global system\Accardin 1 8 1,114 10
Organizational Support\Infrastucture and Systems\global system\eCATS 2 17 1,202 20
Organizational Support\Infrastucture and Systems\global system\MES 2 16 2,345 22
Organizational Support\Infrastucture and Systems\global system\MyTech 1 9 530 11
Organizational Support\Infrastucture and Systems\global system\PDM 4 33 3,547 42
Organizational Support\Infrastucture and Systems\hardwares 5 38 3,565 46
Organizational Support\People 7 160 18,064 197
Organizational Support\People\IT and technical 7 57 5,771 69
Organizational Support\People\management 5 40 4,569 49
Organizational Support\People\peers 3 23 3,155 30

298 | P a g e
Appendix K – Hierarchical coding scheme (cont’) Nodes Number of
Sources Number of
Coding References
Number of Words Coded
Number of Paragraphs
Coded
Positive Interdependence 8 480 46,455 590
Positive Interdependence\collaborating 6 50 4,869 62
Positive Interdependence\cooperating 5 43 4,206 54
Positive Interdependence\exchanging 5 96 9,163 119
Positive Interdependence\exchanging\both 4 35 2,975 42
Positive Interdependence\exchanging\exporting data 2 18 1,982 23
Positive Interdependence\exchanging\importing data 0 0 0 0
Positive Interdependence\sharing 8 241 23,348 293
Positive Interdependence\sharing\between departments 8 66 6,301 80
Positive Interdependence\sharing\between peers 7 59 5,638 72
Positive Interdependence\sharing\between sites 6 50 5,108 61
Promotive Interactions 9 980 92,877 1,196
Promotive Interactions\with people 9 309 28,839 378
Promotive Interactions\with people\engaging 7 59 5,491 72
Promotive Interactions\with people\learning 6 52 4,828 64
Promotive Interactions\with people\meeting 7 59 5,491 72
Promotive Interactions\with people\sharing 8 66 6,183 81
Promotive Interactions\with systems 9 612 58,547 746
Promotive Interactions\with systems\checking 7 59 5,373 73
Promotive Interactions\with systems\developing 5 40 4,569 49
Promotive Interactions\with systems\dispositioning 6 52 4,828 64
Promotive Interactions\with systems\evaluating 5 43 4,206 54
Promotive Interactions\with systems\extracting 6 52 4,828 64
Promotive Interactions\with systems\generating 7 59 5,638 72
Promotive Interactions\with systems\implementing 3 25 2,528 29
Promotive Interactions\with systems\programming 2 17 1,414 19
Promotive Interactions\with systems\revising 3 27 2,487 31
Promotive Interactions\with systems\transacting 6 49 4,539 60
Promotive Interactions\with systems\updating 8 66 6,183 81
Promotive Interactions\with systems\uploading 6 50 5,108 61