digging the impact of friendship and location on crowd behavior
13
HAL Id: hal-01285971 https://hal.archives-ouvertes.fr/hal-01285971 Submitted on 10 Mar 2016 HAL is a multi-disciplinary open access archive for the deposit and dissemination of sci- entific research documents, whether they are pub- lished or not. The documents may come from teaching and research institutions in France or abroad, or from public or private research centers. L’archive ouverte pluridisciplinaire HAL, est destinée au dépôt et à la diffusion de documents scientifiques de niveau recherche, publiés ou non, émanant des établissements d’enseignement et de recherche français ou étrangers, des laboratoires publics ou privés. Reality mining: digging the impact of friendship and location on crowd behavior Yuanfang Chen, Antonio M. Ortiz, Noel Crespi, Lei Shu, Lin Lv To cite this version: Yuanfang Chen, Antonio M. Ortiz, Noel Crespi, Lei Shu, Lin Lv. Reality mining: digging the impact of friendship and location on crowd behavior. MOBIQUITOUS 2013 : 10th International Conference on Mobile and Ubiquitous Systems: Computing, Networking and Services, Dec 2013, Tokyo, Japan. pp.142 - 154, 10.1007/978-3-319-11569-6_12. hal-01285971
-
Upload
khangminh22 -
Category
Documents
-
view
5 -
download
0
Transcript of digging the impact of friendship and location on crowd behavior
HAL Id: hal-01285971https://hal.archives-ouvertes.fr/hal-01285971
Submitted on 10 Mar 2016
HAL is a multi-disciplinary open accessarchive for the deposit and dissemination of sci-entific research documents, whether they are pub-lished or not. The documents may come fromteaching and research institutions in France orabroad, or from public or private research centers.
L’archive ouverte pluridisciplinaire HAL, estdestinée au dépôt et à la diffusion de documentsscientifiques de niveau recherche, publiés ou non,émanant des établissements d’enseignement et derecherche français ou étrangers, des laboratoirespublics ou privés.
Reality mining: digging the impact of friendship andlocation on crowd behavior
Yuanfang Chen, Antonio M. Ortiz, Noel Crespi, Lei Shu, Lin Lv
To cite this version:Yuanfang Chen, Antonio M. Ortiz, Noel Crespi, Lei Shu, Lin Lv. Reality mining: digging the impactof friendship and location on crowd behavior. MOBIQUITOUS 2013 : 10th International Conferenceon Mobile and Ubiquitous Systems: Computing, Networking and Services, Dec 2013, Tokyo, Japan.pp.142 - 154, 10.1007/978-3-319-11569-6_12. hal-01285971
Reality Mining: Digging the Impact of Friendship andLocation on Crowd Behavior
Yuanfang Chen1, Antonio M. Ortiz1, Noel Crespi1, Lei Shu2, and Lin Lv3
1 Institut Mines-Telecom, Telecom SudParis, France2 Guangdong University of Petrochemical Technology, China3 School of Software, Dalian University of Technology, China
yuanfang.chen,antonio.ortiz_torres,[email protected],lei.
[email protected],[email protected]
Abstract. Crowd behavior is a natural instinct of human, which directly impactshow we form opinions and make decisions. It is a subject that deserves to be stud-ied since it is common that people change their behavior when being in a group.In pervasive computing research, plenty of work has been directed towards dis-covering human movement patterns based on wireless networks, mainly focusingon movements of individuals. It is surprising that social interactions among in-dividuals in a crowd is largely neglected. Mobile phones offer on-body trackingand they are already deployed on a large scale, allowing the characterization ofuser behavior through large amounts of wireless information collected by mo-bile phones. In this paper, we observe and analyze the impact of friendship andlocation attributes on crowd behavior, using location-based wireless mobility in-formation. This is a cornerstone for predicting crowd behavior, which can be usedin a large number of applications such as traffic management, crowd safety, andinfrastructure deployment.
Key words: Crowd behavior, Mobile phones, Wearable computing, Complex so-cial networks
1 Introduction
With the increasing size and frequency of mass events, such as traffic congestion ona highway, swarming at a tourist attraction, and clogging at weekend shopping sale,the study of crowd dynamics has become an important research area [28, 7]. Howev-er, even successful modeling approaches such as those inspired by Newtonian forcemodels are still not fully consistent with empirical observations and are sometimes d-ifficult to be adapted for crowd prediction. With the prevalence of smart devices (suchas Smart Cellphone, Tablet PC, etc.), on-body sensing, computing and communicationhave become widespread [16] (carry-on smart devices can be called “social sensors”).These developments have made it possible to obtain real-time and comprehensive em-pirical data required by crowd behavior analyses [24]. This “reality mining” [18] isdeemed adequate to provide objective measurements of human interactions, and it canbe called “honest signals” [25]. These options open up new pathways in ComputationalSocial Science [17], where large amounts of information obtained from wireless mo-
2 Yuanfang Chen et al.
bile devices can lead to new perspectives for the analysis of crowd behavior and socialdynamics.
In order to develop reliable prediction models for traffic management, urban infras-tructure deployment, or crowd safety, it is necessary to understand what laws determinethe formation of a crowd. While a lot of studies know the “physics” of crowd behavior,it is surprising that social interactions among individuals in a crowd has been large-ly neglected. Indeed, the great majority of existing studies investigate a crowd as acollection of isolated individuals, and each individual has its own motion speed anddirection [20, 1]. However, it turns out that in practice, the majority of individuals donot take actions alone, but in groups with social relationships [26, 10].
In this paper, we first focus on recognizing human crowd behavior by analyzing thedata measured by internet-accessible mobile phones from a location-aware online socialnetwork. By crowd behavior recognition, we understand that the movement of a largenumber of individuals has a pattern and can be attributed, depending on relevant param-eters such as the friendship between individuals and check-in locations (with time) ofthese individuals. Based on the recognition, we can realize that it is possible to predictthe formation of a crowd from wireless information related to individuals. For instance,the formation of downtown pedestrian flows is related to the interactions between indi-viduals, and these flows can be distinguished by collecting the wireless information ofpedestrians.
Second, we investigate how “friendship” and “location” impact human crowd be-havior. Nathan Eagle et al. have obtained an important result: “Data collected frommobile phones has the potential to provide insight into the relational dynamics of indi-viduals. Furthermore, it is possible to accurately infer 95% of friendship relations onlyconsidering the observational wireless data” [9]. This implies that there is a relationshipbetween the friendship and the behavioral patterns of humans. Based on this result, weobserve the patterns of friendship in different crowds.
The contributions of this paper are listed as follows.
– We design a crowd recognition model. One of the main challenges in crowd behaviorrecognition is to infer the most likely crowd behavior using the data collected from aset of persons. We use check-in time and location (Time and Location id. We converteach latitude/longitude coordinate of the earth into a unique Location id) to quantifythe track of each individual. Then, a clustering algorithm1 is used to find the likelycrowds.
– We investigate how friendship influences crowd behavior. In order to measure thisinfluence, we use the friendship degree of each user and the probability distributionof various degrees.
– We investigate how individuals’ locations influence crowd behavior. For measuringthe influence, we investigate these relationships for different clusters: (i) users andtheir locations; (ii) check-in time and users’ locations.
1 An Expectation-Maximization (EM) clustering algorithm is used in this paper. The EM assignsa probability distribution for each track record (instance), which indicates the probability ofeach instance belonging to each of the clusters. The EM can automatically decide how manyclusters to create.

Crowd Behavior 3
The paper is structured as follows. Section 2 introduces the related work. Section 3presents the data used in our study and statistic analysis. Section 4 shows how to rec-ognize human crowd behavior from datasets. Section 5 reveals the impact of attributes(check-in time, check-in location and friendship) on crowd behavior. Finally, some con-clusions are given in Section 6.
2 Related Work
Recently, a number of scientific communities, from computer science to physics, havebeen working in human dynamics. Pedestrian movement patterns have been studiedusing wireless-based personal location data [23]. In physics, for human crowd behav-ior analysis, many approaches have been proposed inspired by using fluid dynamic-s [13], swarms [3] and cellular automata [2]. Car-based human movement patterns havealso been studied by utilizing the data from GPS-equipped vehicles [27]. Thereinto,the approaches which are based on wireless mobility information are more reliable,objective and environment-independent compared with model-based approaches, e.g.,habit-based model [15]. Model-based approaches are environment-sensitive. Moreover,because the factors of environment influence each other, a simple model is not suffi-cient to reflect the interactions between these factors. Furthermore, the performance ofa model is related to the experience of modeler.
As an important aspect of human dynamics, “crowd dynamics” is worthy to bedeeply analyzed, since it helps to extract some useful conclusions about how human-s behave when they are in large groups. Further, predicting the formation of a crowdis helpful in some emergency situations, e.g., evacuation route control; and even theprediction is also beneficial for studying and improving the performance of public in-frastructures, e.g., network usage during a mass event. However, the prediction of crowdevents is still a challenge, even if a lot of new technologies can be used, e.g., GPS-basedhuman trace tracking technology. Moreover, GSM, bluetooth or WiFi localization tech-nologies have been explored to be used to collect sufficient data for analyzing crowdbehavior [6].
The prediction of human behavior is the main topic of a number of publication-s. The method proposed in [14] estimates an object’s future locations, by consideringthe patterns of recent movements. They present the concept of a Trajectory pattern (T-pattern), a special association rule with a timestamp that is able to define a sequence oflocations with a certain probability. They also propose the Trajectory Pattern Tree (TP-T), a data access method that indexes trajectory patterns to efficiently answer predictivequeries, and finally, they detail a Hybrid Prediction Algorithm (HPA) that provides ac-curate prediction for both near and distant time queries. T-patterns are also used in [19],where WhereNext is presented, which is a technique to predict the next location of amoving object. It uses an evaluation function that efficiently creates TPTs by consid-ering the previous movements of all moving objects in a certain area. The model pre-sented in [21] is based on behavioral heuristics that predict individual trajectories andcollective motion patterns such as the spontaneous formation of unidirectional lanes orstop-and-go waves. These heuristics consider visual information to describe the motionof pedestrians.
4 Yuanfang Chen et al.
Most of the previous research in crowd dynamics has ignored the internal connec-tion between social relationships and crowd formation. While discrete observations ofan individual’s idiosyncratic behavior seem to be merely random, and most studies ofcrowd behavior consider only interactions among isolated individuals, the results pre-sented in [22] show that up to 70% of people in a crowd are actually moving in group-s such as friends, couples, or families, concluding that the social relationships affectcrowd forming. In addition, group sizes are commonly distributed according to a pois-son distribution [12]. Thus, social ties between individuals impact the forming of crowd.In this work, we consider friendship and location relationships between individuals asan important parameter for crowd recognition.
3 Data Description
The dataset used for analyzing crowd behavior consists of anonymous check-in datafrom mobile devices collected by a location-based social networking service providerwhere users share their locations by check-in, and the friendship between these mobileusers is collected using their public API [5]. This aggregated and anonymous mobiledevice information is used to correlate, model, evaluate and analyze the relationshipsbetween the check-in time, locations, friendship and crowd behavior of users in 772, 966distinct places. The dataset consists of 58, 228 nodes (users) and 214, 078 friend edges(friendship is directed between any two nodes).
Check-in behavior of users. Based on users’ check-in behavior, we can obtainusers’ locations, and our recognition and observation are check-in-location-aware.Moreover, through check-in frequency, some special places can be inferred. For ex-ample, the home location of a user can be defined as the location which has maximumaverage number of check-ins for a period of time. Manual inspection shows that thisinfers home locations with 85% accuracy [5]. We can deduce that there is a relation-ship between users’ social relations (e.g., the kinship of users at home) and check-inlocations with check-in frequency.
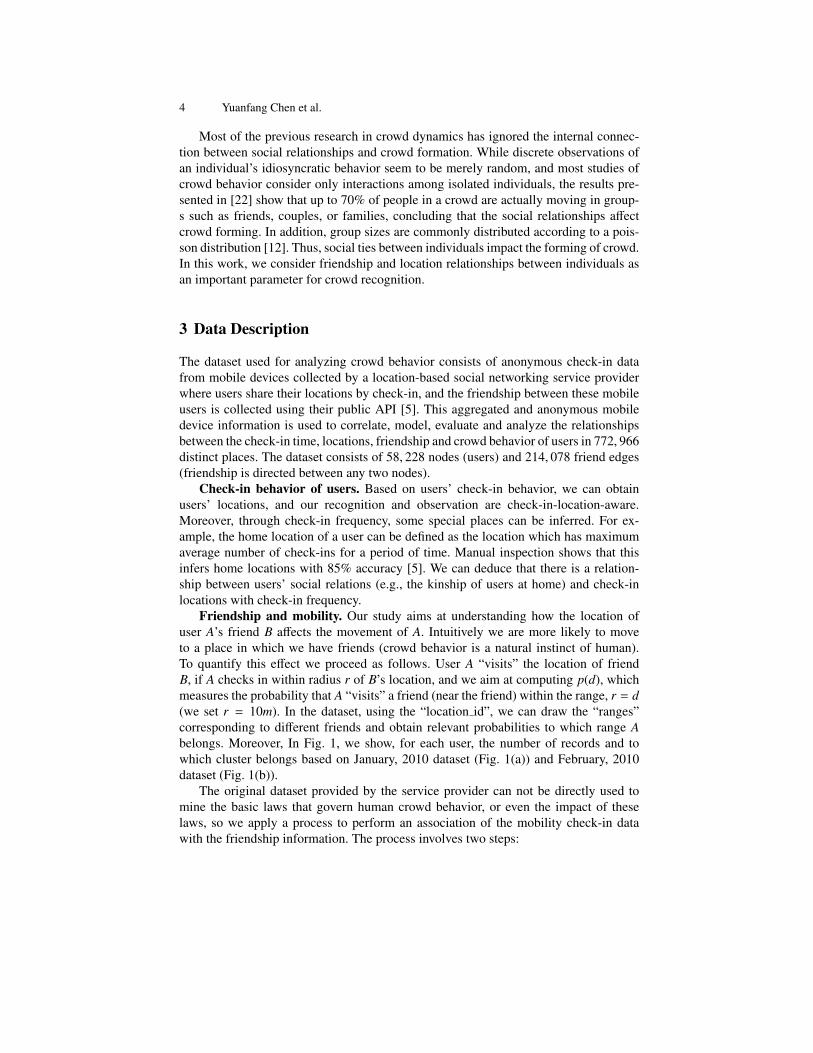
Friendship and mobility. Our study aims at understanding how the location ofuser A’s friend B affects the movement of A. Intuitively we are more likely to moveto a place in which we have friends (crowd behavior is a natural instinct of human).To quantify this effect we proceed as follows. User A “visits” the location of friendB, if A checks in within radius r of B’s location, and we aim at computing p(d), whichmeasures the probability that A “visits” a friend (near the friend) within the range, r = d(we set r = 10m). In the dataset, using the “location id”, we can draw the “ranges”corresponding to different friends and obtain relevant probabilities to which range Abelongs. Moreover, In Fig. 1, we show, for each user, the number of records and towhich cluster belongs based on January, 2010 dataset (Fig. 1(a)) and February, 2010dataset (Fig. 1(b)).
The original dataset provided by the service provider can not be directly used tomine the basic laws that govern human crowd behavior, or even the impact of theselaws, so we apply a process to perform an association of the mobility check-in datawith the friendship information. The process involves two steps:
Crowd Behavior 5
0 1 2 3 4 5 6x 10⁴
0
50
100
150
200
250
300
UserIDN
umbe
r of r
ecor
ds
(a) Result of January, 2010dataset.
0 1 2 3 4 5 6x 10⁴
0
50
100
150
200
250
300
350
400
450
500
UserID
Num
ber o
f rec
ords
(b) Result of February, 2010dataset.
Fig. 1. Number of records and which cluster belongs for each user in the January and February,2010 datasets (different colours represent different clusters).
1. Perform a spatial-temporal analysis of the records to detect which users form acrowd (e.g., places in which some people have stopped for a sufficiently long time);
2. Infer in every crowd which users are friends and what kind of friendship they have(1, 2, 3, ...,N-hop friends, e.g., “1-hop” is for direct friends).
In order to infer “where and when crowds are forming?” from a large number ofrecords, we first characterize the individual activity by mathematical modeling. Eachlocation measurement mi, collected for every mobile device, is characterized by a po-sition pi expressed in latitude and longitude, and a timestamp ti. We also measure theinterval time between different check-in activities [11]. The average interval time mea-sured for the whole population is 30 minutes. So within the interval we can detect agathering of humans from the dataset. Moreover, this time interval is comparable to theaverage length of real social events.
To confirm the friendship in a crowd, we merge the friendship dataset with thecheck-in record dataset, e.g., for a crowd, if there is a record of any two users in thefriendship dataset, the two users are 1-hop friends, and then we add this information intothe check-in record dataset as a value of a new attribute column (friendship). Multihopfriendship will be also recognized, and we record the identity number of minimum-hop-count friend for every user as the value of the friendship attribute column.
4 Crowd Behavior Recognition
We formalize a series of processing steps which can be used to infer crowd behav-ior from location-based wireless information. In this section we build a mathematicalmodel for recognizing the crowd behavior of population.
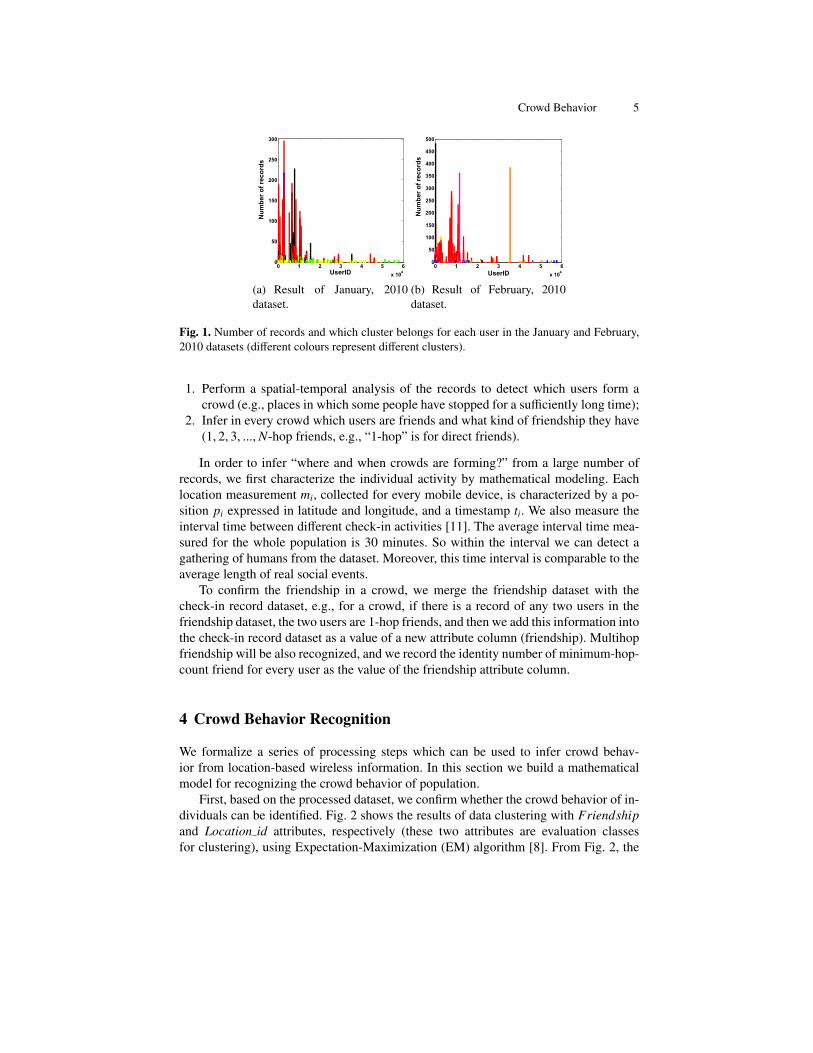
First, based on the processed dataset, we confirm whether the crowd behavior of in-dividuals can be identified. Fig. 2 shows the results of data clustering with Friendshipand Location id attributes, respectively (these two attributes are evaluation classesfor clustering), using Expectation-Maximization (EM) algorithm [8]. From Fig. 2, the
6 Yuanfang Chen et al.
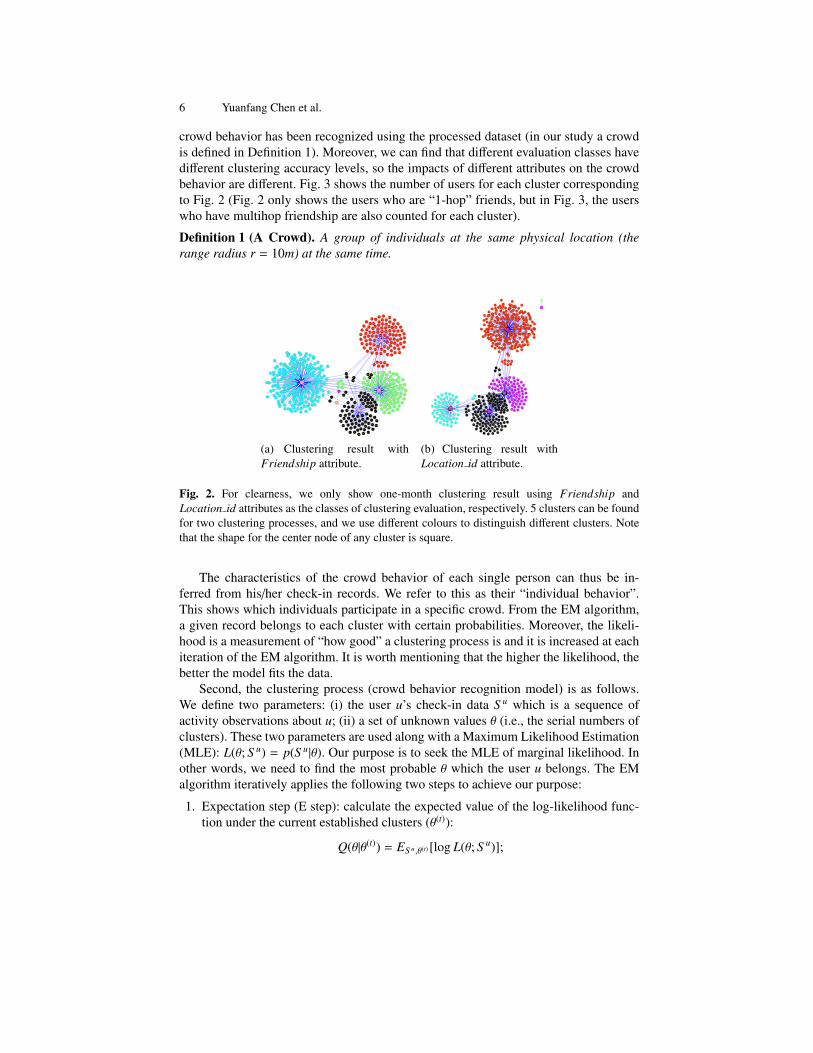
crowd behavior has been recognized using the processed dataset (in our study a crowdis defined in Definition 1). Moreover, we can find that different evaluation classes havedifferent clustering accuracy levels, so the impacts of different attributes on the crowdbehavior are different. Fig. 3 shows the number of users for each cluster correspondingto Fig. 2 (Fig. 2 only shows the users who are “1-hop” friends, but in Fig. 3, the userswho have multihop friendship are also counted for each cluster).
Definition 1 (A Crowd). A group of individuals at the same physical location (therange radius r = 10m) at the same time.
1071
1097245914
7201
44126
8724
10650
45913
646
6908 71556933
7170
2908
2897
629
179
174
4
2832
1076
21818
82402808
3010752
1
156
297511
2947
0
10986
2894
2850
6208
15542
167
1065813501
10343
10717 6782
6677
2953
2822
1386
680
1437231
1053610767
7705
10436
890710669
10668
71152834
146
9569
10612
2844
2821
217
8467
2
26792
1875
1037410350
8869
7798
3173
1077
651
28198145 8924 13265
28337620
19113
10988
2806
7715
15313
7790
10426
2920
620
2912
11746
7602
15377
3080 10632
10653
159
336
1453
35288
1041113252
7517
318911029
314615565
15385
1515
3014229710974
10554
965878
11564956634
21121
6606
7537
13361
306346708869613560
64
2874562
28539
3670
1701
24659
2799724601
3491337296
23841
10729
6825
25
3668 66921164611204
7546 2949
2969 133233058
29912
12873
53458
30058
3680
2910
55
382037436
23908
10622
2918
18601075
3160
7681
28678
10967
7794
6904
106147281
2987
291113
46488
3083
23796
1307
22518
407995604
6625
1499
9406
7162
11016
11926 7103
15815
24597
2892
1446
23541954
177712574 9403
6863
679
13653
6614
698843796
15558 11504
9130
36188
2951
2929
1308279
19389
135489971
30705
39405
10714
106716600
7376
292423838
16451
6842
11519
28059
24604
301
108097843
33361
2818613535
7755
7647
3650
3206
7783
232228750
15820
7084 1867
762121629
232
1074310353
132
15350
1582920355
1556956071
4612
3233
2264
13479
12908470
683615844
419
263
1908419731984
119017590
7594
6589
6587259
219
1594529903
14814
399994078435833
1944
9
11003
1880
7847
16447
56344
47768
7837
9592
95941985
875
1520 1693
20477
16620
21696
15375
317023
17315
40002 6213
1940
832
3302
11014
1779513579
112999977 1914
1285
987
627
8902
1697
11663
11528
9416
6916
10959
317
2855 3109
10559
10685
28451876
23
2
9417
10362 15852
2865 2839
28887
385
6902
154
26
65992861
7528
3009
1033328888
10966
2993
1419
124
42
10354
109804
81256604
5404
3313
2880
2818
267 7
2182213503
7518
12985
10375
104232902
28257558
652
8889
026494
63411282
2896
103511935
109638946
10400
6915
3332
241
2954
10380
2893
9847
7527
10990
15727
55514
6980
6638
2905
2176
23544
35129
18848
9593 15557 7251
16448
2847
253
157
779311261
28518
57713 7619
2134
1771
293
144
13834
22271
11609
11824
10336
9985
99167526
6948
15335
35562
26137
2640537001
1126724103
16709
5628
2206
9918
10801
16450
8248
1859
310
7848
513896841
5351516696
754217045
35
775637380
25003
15262
21695
6913
16529
5655
1095
66213419
6956
2773093
6955 11836
35128
8249 287766738
2873632628 623
209
1491413
1142
15
26320
10382
10590
11264
1864
26214
6249
11816
11260
10875
6588
62
1923
7529
698
(a) Clustering result withFriendship attribute.
13419
8145
26792
8249
7715
6677
2951
2894
2821179
10986
26137
89247705
104112833
167
143
146
15377
13501
10653
7602
6915
15852662
277
5
35833
6614
72312920
652
10426
10374
10671
10729
10436
7798
10668
15313
336
35288
629
6208
13265
10988
6933
10767
10423
10658
7155 5404
10400
33322908
10343
2850 1386
3080
2822
14537620
262
159
2905
2912
106693093620
8240
6956
10967
7790
1562806
2819
2897109632954
279
174
1
2825
7170
8467
10336
2844
2902
132
2947
651
283215542
6913
678213252
0
68010350
235
103541875
1864
28181076
6588 241
7755
3173
55
2181827997
7
07528
6904
28888
30
10375
2808
7115 26320
1876
1446
1419
1071646
9
10380
7756
21822
11014
3109
2839
124
26
2873
6863
11504
10362
12985
15385
8902
6587
46708
40002
3146
28059
24601
3058987
627
8946
1063210875
10351
8889 824814
15350
16620
1940
170231914
1701
36806213
28678
5634415829
11646
263
1190111519
15727
216961156
7103
13
11003
7681
1059011746
1584429912
7847
11609913010959
2910
2892
16450107171142
22271
24103
1582040784
28518
35129
2834
875012873
3
6842
761910974
1152812574
6841
13479
28186
407999847
2134
1944708423222
11663 28539
10714
9416
135793014
1307
419
219
53458
13653
19113 10622
72816916
2911
2847
1308
764711926
3336123838
1183641954
16448
9406
8470
7542
4
6948
6249
5628
1859
878
62
15557
10536
16529
6738
118241923
2206
1095
632
23841
7518
11261 45913
45914 16696
9971
7529 310
149
15
2949
6692
8869
13548
144
875
6709
9977
6955
169713834
198435128
1075
2924
2176
26494
66042874
2888710333
10650
1880
42
23
2896
679623
112671771293
1693
21695
3313
2929
209
10685
1935
9417
3009
2880
385
2162911282
2865
2993267
11
4
25
9569
2953
10382
7558
10612
7517
10559
6902
11299
154
13503
10809
634
11016
7201
7527
284510972
4412664
7526
11260
10966
109801860
34
2861
6599
6980
8125
8724
2975
10752
2855
1777
14132
30705
3160
19389
47768
3302
17795
7621
35562 1520317
9918
56071
24659
2969
13560
46488
3729625003
3206
7794
11264959213361
7376 24597
298714814
159456606
3233
1985
2893
7537149929903
9985 3743615375
43796
6282918
10614
15335
17315
232
217
7783
203557837
16451
7162
2264
22518
21121
869655514
10801
51389 725175466600
83253515
23544
20477
39405
5655
1867
1077
9594
155656638164471120418848
3820
1515
259
35
7590
36188
373801157
110297594
419737843
9593
46122297
1332323796
991657713
7793
68366589
1285 562
34913158153670
9403
1290965
301152623063 5604
3083
300587848
13535
39999
69811816
6825
239086988
1099015558
6908
15569
3189
24604370018907
10743
66253650
1908
253
3668
4956617045
26405
28776
10353
10554
(b) Clustering result withLocation id attribute.
Fig. 2. For clearness, we only show one-month clustering result using Friendship andLocation id attributes as the classes of clustering evaluation, respectively. 5 clusters can be foundfor two clustering processes, and we use different colours to distinguish different clusters. Notethat the shape for the center node of any cluster is square.
The characteristics of the crowd behavior of each single person can thus be in-ferred from his/her check-in records. We refer to this as their “individual behavior”.This shows which individuals participate in a specific crowd. From the EM algorithm,a given record belongs to each cluster with certain probabilities. Moreover, the likeli-hood is a measurement of “how good” a clustering process is and it is increased at eachiteration of the EM algorithm. It is worth mentioning that the higher the likelihood, thebetter the model fits the data.
Second, the clustering process (crowd behavior recognition model) is as follows.We define two parameters: (i) the user u’s check-in data S u which is a sequence ofactivity observations about u; (ii) a set of unknown values θ (i.e., the serial numbers ofclusters). These two parameters are used along with a Maximum Likelihood Estimation(MLE): L(θ; S u) = p(S u|θ). Our purpose is to seek the MLE of marginal likelihood. Inother words, we need to find the most probable θ which the user u belongs. The EMalgorithm iteratively applies the following two steps to achieve our purpose:
1. Expectation step (E step): calculate the expected value of the log-likelihood func-tion under the current established clusters (θ(t)):
Q(θ|θ(t)) = ES u,θ(t) [log L(θ; S u)];
Crowd Behavior 7
1 2 3 4 50
500
1000
1500
2000
2500
3000
3500
Cluster number
Num
ber o
f use
rs
(a) Number of users for eachcluster using Friendship at-tribute as the class of clusteringevaluation.
1 2 3 4 50
500
1000
1500
2000
2500
3000
3500
4000
Cluster number
Num
ber o
f use
rs
(b) Number of users for eachcluster using Location id at-tribute as the class of clusteringevaluation.
Fig. 3. Number of users for each cluster.
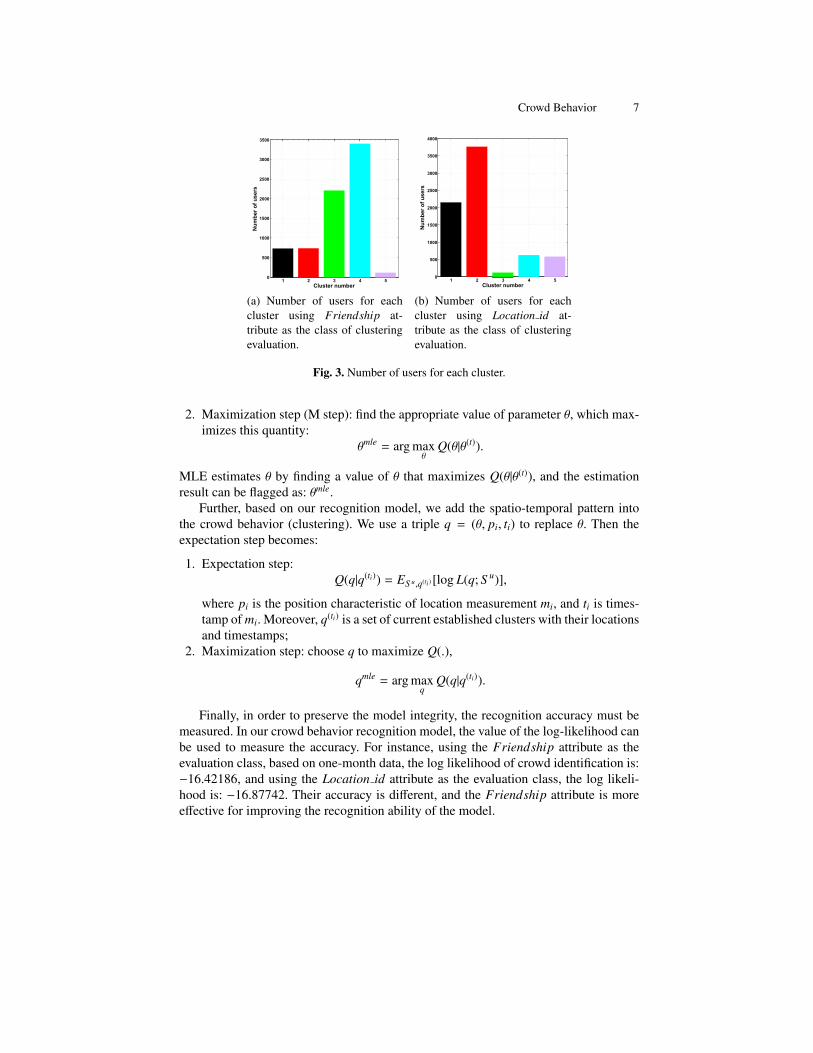
2. Maximization step (M step): find the appropriate value of parameter θ, which max-imizes this quantity:
θmle = arg maxθ
Q(θ|θ(t)).
MLE estimates θ by finding a value of θ that maximizes Q(θ|θ(t)), and the estimationresult can be flagged as: θmle.
Further, based on our recognition model, we add the spatio-temporal pattern intothe crowd behavior (clustering). We use a triple q = (θ, pi, ti) to replace θ. Then theexpectation step becomes:
1. Expectation step:Q(q|q(ti)) = ES u,q(ti ) [log L(q; S u)],
where pi is the position characteristic of location measurement mi, and ti is times-tamp of mi. Moreover, q(ti) is a set of current established clusters with their locationsand timestamps;
2. Maximization step: choose q to maximize Q(.),
qmle = arg maxq
Q(q|q(ti)).
Finally, in order to preserve the model integrity, the recognition accuracy must bemeasured. In our crowd behavior recognition model, the value of the log-likelihood canbe used to measure the accuracy. For instance, using the Friendship attribute as theevaluation class, based on one-month data, the log likelihood of crowd identification is:−16.42186, and using the Location id attribute as the evaluation class, the log likeli-hood is: −16.87742. Their accuracy is different, and the Friendship attribute is moreeffective for improving the recognition ability of the model.

8 Yuanfang Chen et al.
5 Impact of Attributes on Crowd Behavior
Most previous studies of crowd behavior only consider interactions among isolated in-dividuals, and assume that the motion of individuals is random. The work in [22] af-firms that the walking behavior of pedestrians is affected by social relationships, suchas friends, couples, or families walking together. The results presented in Fig. 2, showthat some population attributes impact the crowd motion of humans, and these impactsare different for diverse attributes. In this section, we go deeper into the impact of theseeffects by analyzing how friendship and location affect crowd behavior.
5.1 Impact of Friendship on Crowd Behavior
In this section, we analyze the impact of social relationship (friendship) on the complexdynamics of crowd behavior. For this, we use the empirical data of the motion of indi-viduals by means of check-in recordings of public areas. Observations are made undervarying-density collections of population.
0 1 2 3 4 5 6x 10⁴
0
10
20
30
40
50
60
70
UserID
Deg
ree
(k)
User−Degree Distribution
January dataFebruary data
(a) Friendship degree of each us-er.
0 10 20 30 40 50 60 700
0.1
0.2
0.3
0.4
0.5
0.6
0.7
Degree (k)
P(k)
Degree Probability Distribution
February dataJanuary data
(b) Probability distribution of var-ious degrees.
Fig. 4. Friendship degree of each user and probability distribution of various degrees (Januaryand February, 2010 datasets).
First of all, we analyze the friendship of a group of people. Fig. 4 shows the friend-ship degree of each user and the probability distribution of various degrees (based onthe data of January and February, 2010). We can find that friendship exists in almost allobserved users. It means that friendship is an important influencing factor for humanbehavior. It is worth noting that a Poisson distribution is met for the friendship degreeprobability distribution of all observed users. Moreover, from Fig. 4(b), friendship de-gree is less than 10 for almost 90% users. So the crowding propensity of an individualis not primarily oriented by friendship.
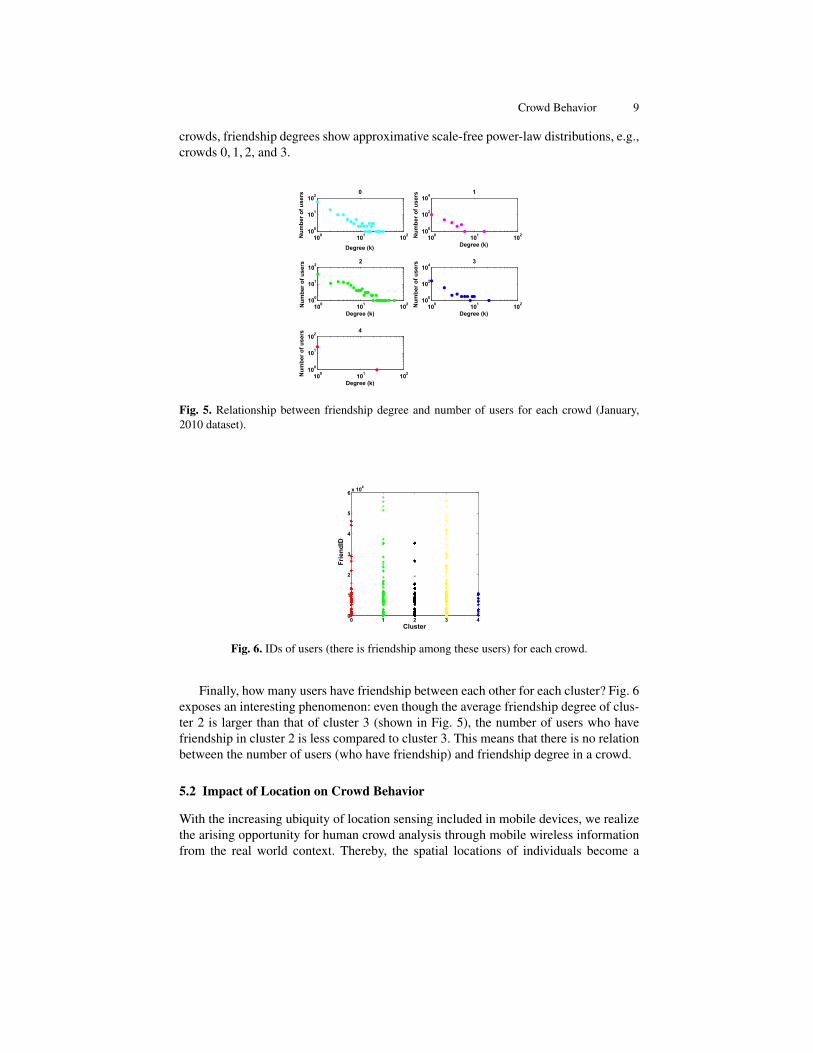
Secondly, several crowds exist in the observed group of people and we investigatethe friendship degree probability distribution of each crowd. Fig. 5 shows the friendshipdegree distributions of 5 clusters which are based on January, 2010 dataset. For some
Crowd Behavior 9
crowds, friendship degrees show approximative scale-free power-law distributions, e.g.,crowds 0, 1, 2, and 3.
100 101 102100
101
102
Degree (k)
Num
ber o
f use
rs 0
100 101 102100
102
104
Degree (k)
Num
ber o
f use
rs 1
100 101 102100
101
102
Degree (k)
Num
ber o
f use
rs 2
100 101 102100
102
104
Degree (k)
Num
ber o
f use
rs 3
100 101 102100
101
102
Degree (k)
Num
ber o
f use
rs 4
Fig. 5. Relationship between friendship degree and number of users for each crowd (January,2010 dataset).
0 1 2 3 40
1
2
3
4
5
6 x 10⁴
Cluster
Frie
ndID
Fig. 6. IDs of users (there is friendship among these users) for each crowd.
Finally, how many users have friendship between each other for each cluster? Fig. 6exposes an interesting phenomenon: even though the average friendship degree of clus-ter 2 is larger than that of cluster 3 (shown in Fig. 5), the number of users who havefriendship in cluster 2 is less compared to cluster 3. This means that there is no relationbetween the number of users (who have friendship) and friendship degree in a crowd.
5.2 Impact of Location on Crowd Behavior
With the increasing ubiquity of location sensing included in mobile devices, we realizethe arising opportunity for human crowd analysis through mobile wireless informationfrom the real world context. Thereby, the spatial locations of individuals become a
10 Yuanfang Chen et al.
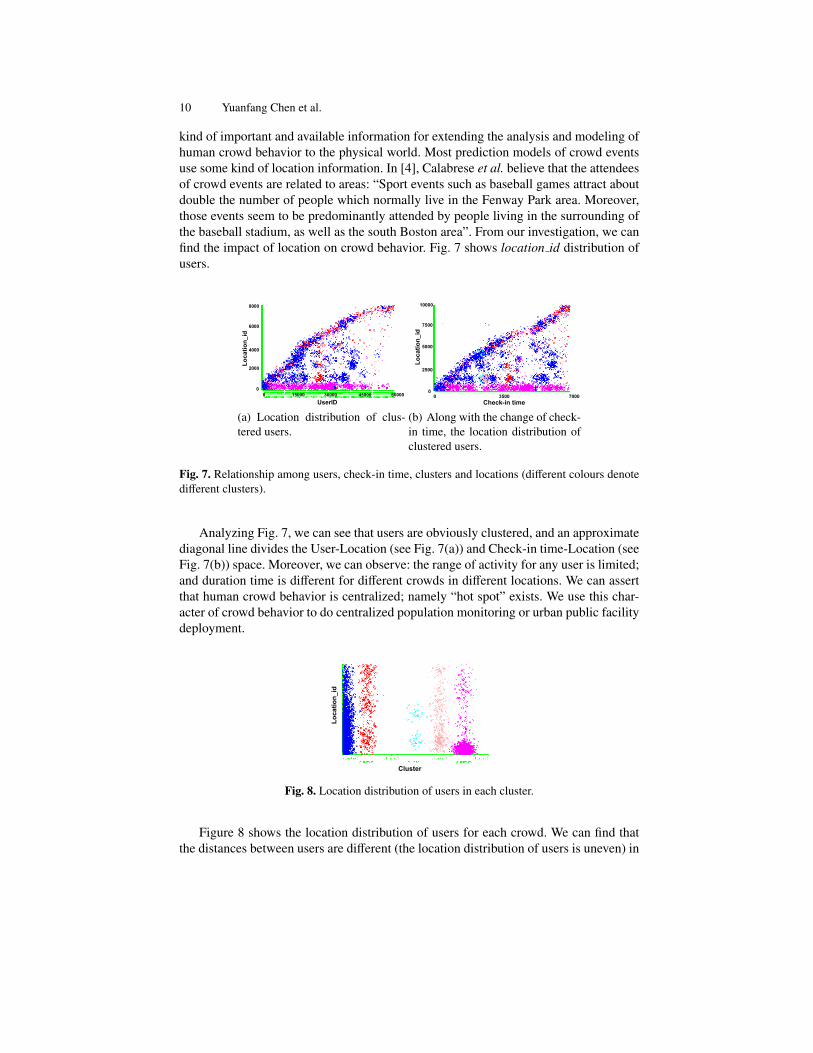
kind of important and available information for extending the analysis and modeling ofhuman crowd behavior to the physical world. Most prediction models of crowd eventsuse some kind of location information. In [4], Calabrese et al. believe that the attendeesof crowd events are related to areas: “Sport events such as baseball games attract aboutdouble the number of people which normally live in the Fenway Park area. Moreover,those events seem to be predominantly attended by people living in the surrounding ofthe baseball stadium, as well as the south Boston area”. From our investigation, we canfind the impact of location on crowd behavior. Fig. 7 shows location id distribution ofusers.
Loca
tion_
id
UserID0 60000
8000
4000
6000
2000
3000015000 450000
(a) Location distribution of clus-tered users.
Check-in time
Loca
tion_
id
00
10000
5000
2500
7500
70003500
(b) Along with the change of check-in time, the location distribution ofclustered users.
Fig. 7. Relationship among users, check-in time, clusters and locations (different colours denotedifferent clusters).
Analyzing Fig. 7, we can see that users are obviously clustered, and an approximatediagonal line divides the User-Location (see Fig. 7(a)) and Check-in time-Location (seeFig. 7(b)) space. Moreover, we can observe: the range of activity for any user is limited;and duration time is different for different crowds in different locations. We can assertthat human crowd behavior is centralized; namely “hot spot” exists. We use this char-acter of crowd behavior to do centralized population monitoring or urban public facilitydeployment.
Cluster
Loca
tion_
id
Fig. 8. Location distribution of users in each cluster.
Figure 8 shows the location distribution of users for each crowd. We can find thatthe distances between users are different (the location distribution of users is uneven) in

Crowd Behavior 11
any crowd. For instance, in cluster 3, there are two small subclusters. We believe thatthe small-world phenomenon exists in crowd behavior.
6 Conclusion
The analysis of crowd behavior can give us an idea of how we behave when we arepart of a group. Different actions can be taken by individuals when being surroundedby others. In this paper, we have focused on analyzing crowd behavior, consideringcheck-in data from location-aware mobile social networks.
There are several parameters that affect the forming way of a crowd. Social relation-ships, e.g., friendship, as well as current locations, can impact the way that a crowd isformed. Understanding how these parameters determine crowd formation and evolutionis the first step prior to the creation of predictive approaches. After grasping the rela-tionship between these parameters and crowd behavior, our ongoing research focuseson the prediction model of crowd behavior. This model will be useful for preventingdisasters from the pushing of crowds, facilitating efficient massive event planning, oreven for traffic management.
Acknowledgment
This work was supported by the EU ITEA 2 Project 11020, “Social Internet of Things-Apps by and for the Crowd” (SITAC).
References
1. Antonini, G., Bierlaire, M., Weber, M.: Discrete choice models of pedestrian walking behav-ior. Transportation Research Part B: Methodological 40(8), 667–687 (2006)
2. Bandini, S., Manzoni, S., Vizzari, G.: Crowd behaviour modeling: from cellular automatato multi-agent systems. Multi-Agent Systems: Simulation and Applications pp. 204–230(2009)
3. Bellomo, N.: Modeling crowds and swarms: congested and panic flows. Modeling ComplexLiving Systems pp. 169–188 (2008)
4. Calabrese, F., Pereira, F., Di Lorenzo, G., Liu, L., Ratti, C.: The geography of taste: analyzingcell-phone mobility and social events. Pervasive Computing 6030, 22–37 (2010)
5. Cho, E., Myers, S.A., Leskovec, J.: Friendship and mobility: user movement in location-based social networks. In: Proceedings of the 17th SIGKDD International Conference onKnowledge Discovery and Data Mining, pp. 1082–1090. ACM (2011)
6. Cook, D.J., Das, S.K.: Pervasive computing at scale: transforming the state of the art. Perva-sive and Mobile Computing 8(1), 22–35 (2012)
7. Davis, L.: Predicting travel time to limit congestion at a highway bottleneck. Physica A:Statistical Mechanics and its Applications 389(17), 3588–3599 (2010)
8. Do, C.B., Batzoglou, S.: What is the expectation maximization algorithm? Nature biotech-nology 26(8), 897–899 (2008)
12 Yuanfang Chen et al.
9. Eagle, N., Pentland, A.S., Lazer, D.: Inferring friendship network structure by using mobilephone data. Proceedings of the National Academy of Sciences 106(36), 15,274–15,278(2009)
10. Ge, W., Collins, R.T., Ruback, R.B.: Vision-based analysis of small groups in pedestriancrowds. IEEE Transactions on Pattern Analysis and Machine Intelligence 34(5), 1003–1016(2012)
11. Gonzalez, M.C., Hidalgo, C.A., Barabasi, A.L.: Understanding individual human mobilitypatterns. Nature 453(7196), 779–782 (2008)
12. Griesser, M., Ma, Q., Webber, S., Bowgen, K., Sumpter, D.J.: Understanding animal group-size distributions. PloS one 6(8), e23,438:1–9 (2011)
13. Helbing, D., Molnar, P.: Social force model for pedestrian dynamics. Physical review E51(5), 4282–4286 (1995)
14. Jeung, H., Liu, Q., Shen, H.T., Zhou, X.: A hybrid prediction model for moving objects.In: Proceedings of the 24th International Conference on Data Engineering, pp. 70–79. IEEE(2008)
15. Jiao, Y., Liu, Y., Wang, J., Wang, J.: Model for human dynamics based on habit. ChineseScience Bulletin 55(24), 2744–2749 (2010)
16. Ko, M.H., West, G., Venkatesh, S., Kumar, M.: Online context recognition in multisensorsystems using dynamic time warping. In: Intelligent Sensors, Sensor Networks and Infor-mation Processing Conference, pp. 283–288. IEEE (2005)
17. Lazer, D., Pentland, A., Adamic, L., Aral, S., Barabasi, A.L., Brewer, D., Christakis, N., Con-tractor, N., Fowler, J., Gutmann, M., Jebara, T., King, G., Macy, M., Roy, D., Van Alstyne,M.: Computational social science. Science 323(5915), 721–723 (2009)
18. Mitchell, T.M.: Mining our reality. Science 326(5960), 1644–1645 (2009)19. Monreale, A., Pinelli, F., Trasarti, R., Giannotti, F.: Wherenext: a location predictor on tra-
jectory pattern mining. In: Proceedings of the 15th ACM SIGKDD international conferenceon Knowledge discovery and data mining, pp. 637–646. ACM (2009)
20. Moussaıd, M., Helbing, D., Garnier, S., Johansson, A., Combe, M., Theraulaz, G.: Experi-mental study of the behavioural mechanisms underlying self-organization in human crowds.Proceedings of the Royal Society B: Biological Sciences 276(1668), 2755–2762 (2009)
21. Moussaid, M., Helbing, D., Theraulaz, G.: How simple rules determine pedestrian behaviorand crowd disasters. Proceedings of the National Academy of Sciences (PNAS) 108(17),6884–6888 (2011)
22. Moussaıd, M., Perozo, N., Garnier, S., Helbing, D., Theraulaz, G.: The walking behaviourof pedestrian social groups and its impact on crowd dynamics. PloS one 5(4), e10,047:1–7(2010)
23. Paul, U., Subramanian, A.P., Buddhikot, M.M., Das, S.R.: Understanding traffic dynamics incellular data networks. In: Proceedings of the 30th International Conference on ComputerCommunications, pp. 882–890. IEEE (2011)
24. Pentland, A., Choudhury, T., Eagle, N., Singh, P.: Human dynamics: computation for orga-nizations. Pattern Recognition Letters 26(4), 503–511 (2005)
25. Pentland, A.S., Pentland, S.: Honest signals: how they shape our world. MIT press (2008)26. Tang, L., Liu, H.: Toward predicting collective behavior via social dimension extraction.
Intelligent Systems 25(4), 19–25 (2010)27. Trasarti, R., Pinelli, F., Nanni, M., Giannotti, F.: Mining mobility user profiles for car pool-
ing. In: Proceedings of the 17th SIGKDD International Conference on Knowledge Discoveryand Data Mining, pp. 1190–1198. ACM (2011)
28. Zhang, X., Weng, W., Yuan, H., Chen, J.: Empirical study on unidirectional dense crowdduring a real mass event. Physica A: Statistical Mechanics and its Applications 392(12),2781–2791 (2013)