Differential Physio-Biochemical and Metabolic Responses of ...
23
Citation: Patel, J.; Khandwal, D.; Choudhary, B.; Ardeshana, D.; Jha, R.K.; Tanna, B.; Yadav, S.; Mishra, A.; Varshney, R.K.; Siddique, K.H.M. Differential Physio-Biochemical and Metabolic Responses of Peanut (Arachis hypogaea L.) under Multiple Abiotic Stress Conditions. Int. J. Mol. Sci. 2022, 23, 660. https://doi.org/ 10.3390/ijms23020660 Academic Editors: Lam-Son Phan Tran and Manish Kumar Patel Received: 14 December 2021 Accepted: 6 January 2022 Published: 8 January 2022 Publisher’s Note: MDPI stays neutral with regard to jurisdictional claims in published maps and institutional affil- iations. Copyright: © 2022 by the authors. Licensee MDPI, Basel, Switzerland. This article is an open access article distributed under the terms and conditions of the Creative Commons Attribution (CC BY) license (https:// creativecommons.org/licenses/by/ 4.0/). International Journal of Molecular Sciences Article Differential Physio-Biochemical and Metabolic Responses of Peanut (Arachis hypogaea L.) under Multiple Abiotic Stress Conditions Jaykumar Patel 1,2 , Deepesh Khandwal 1,2 , Babita Choudhary 1,2 , Dolly Ardeshana 1 , Rajesh Kumar Jha 1,2 , Bhakti Tanna 1,2,3 , Sonam Yadav 1 , Avinash Mishra 1,2, * , Rajeev K. Varshney 4,5,6 and Kadambot H. M. Siddique 6, * 1 CSIR—Central Salt and Marine Chemicals Research Institute, Bhavnagar 364002, India; [email protected] (J.P.); [email protected] (D.K.); [email protected] (B.C.); [email protected] (D.A.); [email protected] (R.K.J.); [email protected] (B.T.); [email protected] (S.Y.) 2 Academy of Scientific and Innovative Research, Ghaziabad 201002, India 3 Gujarat Biotechnology Research Centre, Gandhinagar 382011, India 4 Centre of Excellence in Genomics & Systems Biology, International Crops Research Institute for the Semi-Arid Tropics (ICRISAT), Hyderabad 502324, India; [email protected] 5 The UWA Institute of Agriculture, UWA School of Agriculture and Environment, The University of Western Australia, Perth, WA 6001, Australia 6 State Agricultural Biotechnology Centre, Centre for Crop and Food Innovation, Food Futures Institute, Murdoch University, Murdoch, WA 6150, Australia * Correspondence: [email protected] (A.M.); [email protected] (K.H.M.S.) Abstract: The frequency and severity of extreme climatic conditions such as drought, salinity, cold, and heat are increasing due to climate change. Moreover, in the field, plants are affected by multiple abiotic stresses simultaneously or sequentially. Thus, it is imperative to compare the effects of stress combinations on crop plants relative to individual stresses. This study investigated the differential regulation of physio-biochemical and metabolomics parameters in peanut (Arachis hypogaea L.) under individual (salt, drought, cold, and heat) and combined stress treatments using multivariate corre- lation analysis. The results showed that combined heat, salt, and drought stress compounds the stress effect of individual stresses. Combined stresses that included heat had the highest electrolyte leakage and lowest relative water content. Lipid peroxidation and chlorophyll contents did not significantly change under combined stresses. Biochemical parameters, such as free amino acids, polyphenol, starch, and sugars, significantly changed under combined stresses compared to individ- ual stresses. Free amino acids increased under combined stresses that included heat; starch, sugars, and polyphenols increased under combined stresses that included drought; proline concentration increased under combined stresses that included salt. Metabolomics data that were obtained under different individual and combined stresses can be used to identify molecular phenotypes that are involved in the acclimation response of plants under changing abiotic stress conditions. Peanut metabolomics identified 160 metabolites, including amino acids, sugars, sugar alcohols, organic acids, fatty acids, sugar acids, and other organic compounds. Pathway enrichment analysis revealed that abiotic stresses significantly affected amino acid, amino sugar, and sugar metabolism. The stress treatments affected the metabolites that were associated with the tricarboxylic acid (TCA) and urea cycles and associated amino acid biosynthesis pathway intermediates. Principal component analysis (PCA), partial least squares-discriminant analysis (PLS-DA), and heatmap analysis identified poten- tial marker metabolites (pinitol, malic acid, and xylopyranose) that were associated with abiotic stress combinations, which could be used in breeding efforts to develop peanut cultivars that are resilient to climate change. The study will also facilitate researchers to explore different stress indicators to identify resistant cultivars for future crop improvement programs. Keywords: cold; combined stress; drought; groundnut; heat; metabolomics; peanut; salinity Int. J. Mol. Sci. 2022, 23, 660. https://doi.org/10.3390/ijms23020660 https://www.mdpi.com/journal/ijms
-
Upload
khangminh22 -
Category
Documents
-
view
1 -
download
0
Transcript of Differential Physio-Biochemical and Metabolic Responses of ...

�����������������
Citation: Patel, J.; Khandwal, D.;
Choudhary, B.; Ardeshana, D.;
Jha, R.K.; Tanna, B.; Yadav, S.;
Mishra, A.; Varshney, R.K.;
Siddique, K.H.M. Differential
Physio-Biochemical and Metabolic
Responses of Peanut (Arachis
hypogaea L.) under Multiple Abiotic
Stress Conditions. Int. J. Mol. Sci.
2022, 23, 660. https://doi.org/
10.3390/ijms23020660
Academic Editors: Lam-Son
Phan Tran and Manish Kumar Patel
Received: 14 December 2021
Accepted: 6 January 2022
Published: 8 January 2022
Publisher’s Note: MDPI stays neutral
with regard to jurisdictional claims in
published maps and institutional affil-
iations.
Copyright: © 2022 by the authors.
Licensee MDPI, Basel, Switzerland.
This article is an open access article
distributed under the terms and
conditions of the Creative Commons
Attribution (CC BY) license (https://
creativecommons.org/licenses/by/
4.0/).
International Journal of
Molecular Sciences
Article
Differential Physio-Biochemical and Metabolic Responses ofPeanut (Arachis hypogaea L.) under Multiple Abiotic StressConditionsJaykumar Patel 1,2 , Deepesh Khandwal 1,2, Babita Choudhary 1,2, Dolly Ardeshana 1, Rajesh Kumar Jha 1,2,Bhakti Tanna 1,2,3 , Sonam Yadav 1 , Avinash Mishra 1,2,* , Rajeev K. Varshney 4,5,6
and Kadambot H. M. Siddique 6,*
1 CSIR—Central Salt and Marine Chemicals Research Institute, Bhavnagar 364002, India;[email protected] (J.P.); [email protected] (D.K.);[email protected] (B.C.); [email protected] (D.A.);[email protected] (R.K.J.); [email protected] (B.T.); [email protected] (S.Y.)
2 Academy of Scientific and Innovative Research, Ghaziabad 201002, India3 Gujarat Biotechnology Research Centre, Gandhinagar 382011, India4 Centre of Excellence in Genomics & Systems Biology, International Crops Research Institute for the Semi-Arid
Tropics (ICRISAT), Hyderabad 502324, India; [email protected] The UWA Institute of Agriculture, UWA School of Agriculture and Environment,
The University of Western Australia, Perth, WA 6001, Australia6 State Agricultural Biotechnology Centre, Centre for Crop and Food Innovation, Food Futures Institute,
Murdoch University, Murdoch, WA 6150, Australia* Correspondence: [email protected] (A.M.); [email protected] (K.H.M.S.)
Abstract: The frequency and severity of extreme climatic conditions such as drought, salinity, cold,and heat are increasing due to climate change. Moreover, in the field, plants are affected by multipleabiotic stresses simultaneously or sequentially. Thus, it is imperative to compare the effects of stresscombinations on crop plants relative to individual stresses. This study investigated the differentialregulation of physio-biochemical and metabolomics parameters in peanut (Arachis hypogaea L.) underindividual (salt, drought, cold, and heat) and combined stress treatments using multivariate corre-lation analysis. The results showed that combined heat, salt, and drought stress compounds thestress effect of individual stresses. Combined stresses that included heat had the highest electrolyteleakage and lowest relative water content. Lipid peroxidation and chlorophyll contents did notsignificantly change under combined stresses. Biochemical parameters, such as free amino acids,polyphenol, starch, and sugars, significantly changed under combined stresses compared to individ-ual stresses. Free amino acids increased under combined stresses that included heat; starch, sugars,and polyphenols increased under combined stresses that included drought; proline concentrationincreased under combined stresses that included salt. Metabolomics data that were obtained underdifferent individual and combined stresses can be used to identify molecular phenotypes that areinvolved in the acclimation response of plants under changing abiotic stress conditions. Peanutmetabolomics identified 160 metabolites, including amino acids, sugars, sugar alcohols, organic acids,fatty acids, sugar acids, and other organic compounds. Pathway enrichment analysis revealed thatabiotic stresses significantly affected amino acid, amino sugar, and sugar metabolism. The stresstreatments affected the metabolites that were associated with the tricarboxylic acid (TCA) and ureacycles and associated amino acid biosynthesis pathway intermediates. Principal component analysis(PCA), partial least squares-discriminant analysis (PLS-DA), and heatmap analysis identified poten-tial marker metabolites (pinitol, malic acid, and xylopyranose) that were associated with abiotic stresscombinations, which could be used in breeding efforts to develop peanut cultivars that are resilientto climate change. The study will also facilitate researchers to explore different stress indicators toidentify resistant cultivars for future crop improvement programs.
Keywords: cold; combined stress; drought; groundnut; heat; metabolomics; peanut; salinity
Int. J. Mol. Sci. 2022, 23, 660. https://doi.org/10.3390/ijms23020660 https://www.mdpi.com/journal/ijms

Int. J. Mol. Sci. 2022, 23, 660 2 of 23
1. Introduction
The frequency and severity of abiotic stresses are increasing due to climate changeand global warming [1]. Researchers generally study a single stressor to evaluate the mech-anism or effect on plants. However, multiple abiotic and biotic stresses can simultaneouslyaffect plants under field conditions [2]. Standard laboratory conditions that are often usedfor plant science research significantly differ from the field, so it is difficult to associateoutput results from an individual stress study to field conditions. Abiotic stresses can leadto the production of excess reactive oxygen species (ROS), mainly in chloroplasts, mito-chondria, and peroxisomes, with detrimental effects on signaling behavior [3,4]. Comparedto individual stresses, combined abiotic stresses respond differently to ROS productionthrough the differential production of enzymatic and non-enzymatic antioxidants in plantcells, resulting in a unique ROS signature and acclimation response via modifications tothe signaling pathway [2,5,6]. Plants under combined abiotic stresses also differ from thosethat are under individual stresses for photosynthesis, stomatal regulation, and water useefficiency (WUE) [7,8]. For example, the net photosynthesis rate of soybean decreasedmore under combined water deficit and heat stress than individual stresses due to reducedCO2 availability, lower relative water content (RWC), and higher leaf temperature [9,10].Similarly, WUE (directly linked to stomatal opening or closing) decreased in most studiesunder different stress combinations [11,12]. Combined abiotic stresses significantly reducecrop productivity and yield by affecting plant reproductive processes [13]. Recent studiesin maize and wheat showed that combined abiotic stresses considerably decreased cropyield by reducing stigma functionality and kernel abortion [14,15].
Metabolomics is an emerging technology in plant biology representing data outputfrom gene expression, protein interaction, and pathway regulations. Untargeted metabolicprofiling of plant samples under different abiotic stresses is a new dimension for plantmetabolic pathway and signaling research [16]. Metabolomics of rice flowering organs un-der combined drought and heat stress revealed that ribitol, pyruvic acid, and succinic acidsignificantly correlated with yield and the chalky grain fraction of seeds. In addition, thecombined stress significantly increased the arbutin levels in flag leaves; this glycoside hasstrong antioxidant and membrane-stabilizing properties [17]. Eucalyptus under combinedheat and drought stress significantly decreased WUE and differential metabolite accu-mulation compared to individual stresses [18]. Organic acids and carbohydrates, such assuccinate, malate, quinate, glycerate, mannose, and galactose, significantly decreased, whilemost amino acids, including aspartate, glutamate, aspargine, valine, leucine, isoleucine,proline threonine, lysine, and histidine, significantly increased under combined stress [18].Metabolomics can also be used to identify quantitative trait loci (QTL) and markers undervarious stresses, such as those that are related to the antioxidant enzyme system that wasidentified in barley and potato under combined drought and heat stress [19,20].
Peanut or groundnut (Arachis hypogaea L.) is a major oilseed legume that is grownin subtropical and tropical regions [21]. Peanut is a rich source of oil (40–60%), protein(10–20%), carbohydrates, vitamins, minerals, antioxidants, and monounsaturated fattyacids, and a source of medicinally important compounds [22,23]. India is the world’slargest edible oil consumer and peanut oil is the third-most consumed edible oil in Indiaafter palm and soybean oil. Abiotic stresses such as drought, salinity, and heat frequentlyaffect peanut production, as it mainly grows in subtropical and tropical regions. Therefore,efforts are underway to improve abiotic stress tolerance in peanut [21,24–26]. Some studieshave investigated the effect of abiotic stresses on physiological, biochemical, and metabolicchanges in peanut [22,23,27,28]. One study evaluated the physiological and biochemicalcharacteristics of ancestral peanut species under drought stress, revealing Arachis ipaensisas the most drought-tolerant due to higher solute accumulation in the roots than theother varieties [22]. A metabolomics study reported that drought-tolerant peanut varietiesaccumulated important polyamines and polyphenols such as agmatine, cadaverine, syringicacid, and vanillic acid under stress [23]. There were also two studies that reported stress-specific metabolite accumulation in peanut [27,28].

Int. J. Mol. Sci. 2022, 23, 660 3 of 23
This study investigates the physio-biochemical response of peanut under differentindividual (salinity, drought, heat, and cold) and combined abiotic stresses (S-D: salinityand drought, S-H: salinity and heat, S-C: salinity and cold, D-H: drought and heat, D-C:drought & cold, S-D-H: salinity, drought & heat, and S-D-C: salinity, drought and cold) bymeasuring indicator parameters of physiology, biochemical processes, and osmolytes. Themetabolic profiles were studied using GC-MS (gas chromatography–mass spectrometry),multivariate correlation analysis, pathway enrichment analysis, heatmaps, and partial leastsquare analysis.
2. Results2.1. Biochemical Status of Plants under Different Stress Conditions
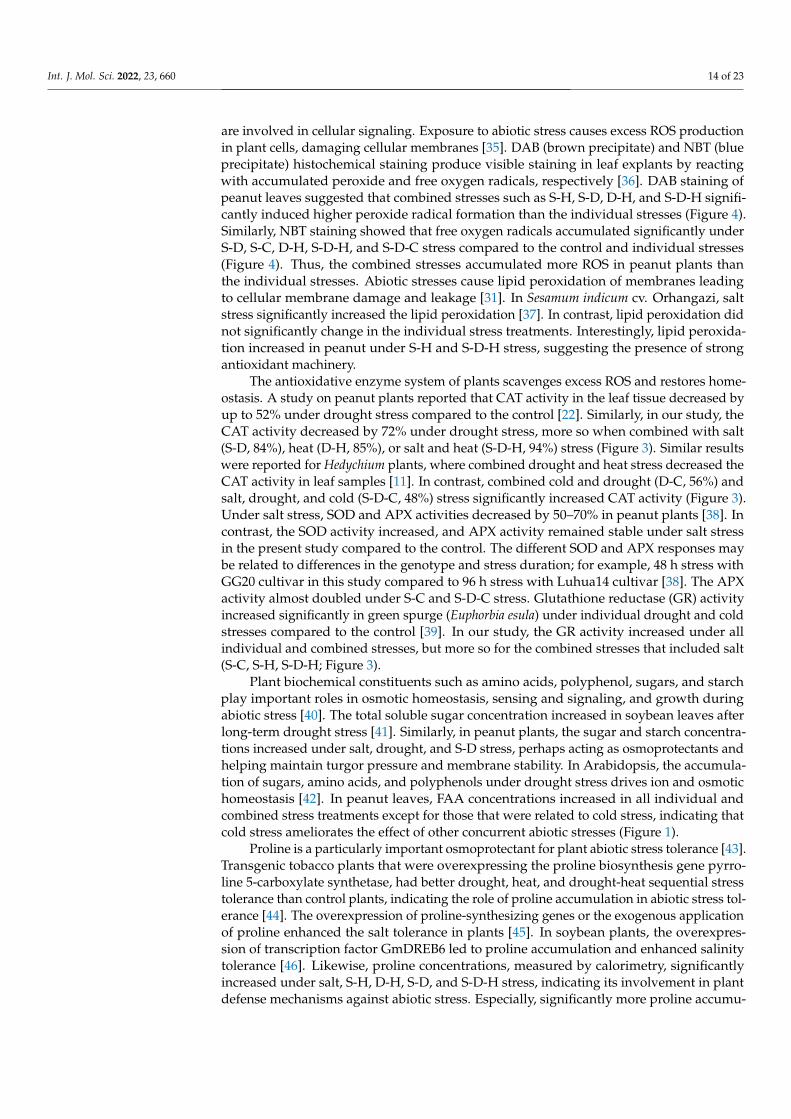
In peanut, the various stresses adversely affected the biochemical constituents, includingsugars, starch, amino acids, and polyphenols (Figure 1). Free amino acids (FAA) increasedin all the stress treatments except for individual cold stress and cold-containing combinedstresses, relative to the control (unstressed) plants (Figure 1a). The maximum increases inFAA occurred under D-H (11.64 ± 0.31 mg g−1, 9.65-fold) and S-H (11.10 ± 0.73 mg g−1, 9.2-fold) stress followed by S-D-H (8.06 ± 0.23 mg g−1, 6.68-fold) and heat (5.33 ± 0.85 mg g−1,4.4-fold) stress, compared to the unstressed plants (1.20 ± 0.20 mg g−1). In contrast, thesmallest increments in FAA occurred in plants that were grown under combined stress thatincluded cold [S-C (2.12 ± 0.15 mg g−1, 1.76-fold), D-C (2.05 ± 0.11 mg g−1, 1.70-fold), andS-D-C (2.38 ± 0.07 mg g−1, 1.97-fold)].
Int. J. Mol. Sci. 2022, 23, 660 4 of 25
Figure 1. Biochemical status of plants under different stress conditions. Estimation of (a) free amino
acids, (b) polyphenols, (c) starch, (d) total sugars, (e) reducing sugars, and (f) proline in peanut
under individual and combined stresses (S-D: salinity and drought, S-H: salinity and heat, S-C: sa-
linity and cold, D-H: drought and heat, D-C: drought and cold, S-D-H: salinity, drought, and heat,
and S-D-C: salinity, drought, and cold). The data are the mean ± SE; different letters indicate signif-
icant differences at p < 0.05.
2.2. Physiological Status of Plants under Different Stress Treatments
The relative water content of all the plant samples significantly decreased in all stress
treatments except for cold and S-H, where it did not change significantly (82.13 ± 1.86%)
compared to the unstressed plants (83.86 ± 1.34%). RWC substantially decreased in plants
under S-D (30.90 ± 2.54%), D-H (33.00 ± 1.90%), and S-D-H (29.59 ± 2.60%) stress compared
to the unstressed plants (83.86 ± 1.34%), with a notable decline for individual drought
stress (45.10 ± 2.19%), followed by the remaining stresses [salt (67.34 ± 5.29%), heat (58.76
± 2.56%), S-H (73.59 ± 2.21%), S-C (67.06 ± 4.45%), D-C (69.73 ± 8.10%), S-D-C (61.67 ±
2.75%)] (Figure 2a). Cold stress ameliorated leaf RWC when combined with drought
stress, increasing from 45.10 ± 2.19% under individual drought stress to 69.73 ± 8.10% un-
der D-C.
The individual and combined heat stress significantly increased EL (Figure 2b), par-
ticularly under S-H (99.88 ± 0.59%) and S-D-H (98.71 ± 1.50%), about five-fold higher than
the unstressed plants (20.36 ± 0.50%). Similarly, about three-fold increases in EL occurred
under heat (62.18 ± 11.00%) and D-H stress (68.39 ± 1.54%) compared to the control. Inter-
estingly, EL did not significantly change under salt, drought, cold, S-C, S-D, D-C, or S-D-
C stress. The membrane stability increased in all the abiotic stress treatments compared
to the control (Figure 2c).
Lipid peroxidation (MDA content) did not significantly change in most stress treat-
ments except for S-H and S-D-H (Figure 2d), which significantly increased [S-H (0.58 ±
0.10 mM g−1) and S-D-H (0.81 ± 0.15 mM g−1)] compared to the control (0.12 ± 0.01 mM g−1)
(Figure 2d).
Figure 1. Biochemical status of plants under different stress conditions. Estimation of (a) free aminoacids, (b) polyphenols, (c) starch, (d) total sugars, (e) reducing sugars, and (f) proline in peanut underindividual and combined stresses (S-D: salinity and drought, S-H: salinity and heat, S-C: salinityand cold, D-H: drought and heat, D-C: drought and cold, S-D-H: salinity, drought, and heat, andS-D-C: salinity, drought, and cold). The data are the mean ± SE; different letters indicate significantdifferences at p < 0.05.

Int. J. Mol. Sci. 2022, 23, 660 4 of 23
The polyphenol contents significantly increased in individual drought stress(0.98 ± 0.12 mg g−1, 5.32-fold) and S-D (2.12 ± 0.18 mg g−1, 11.45-fold), D-H (1.65 ± 0.03 mg g−1,8.92-fold), S-H (0.81 ± 0.24 mg g−1, 4.39-fold), and S-D-H (1.27 ± 0.21 mg g−1, 6.87-fold)stresses compared to the control plants (Figure 1b). Similarly, the starch content significantlyincreased under individual drought stress (0.86 ± 0.01 mg g−1, 2.1-fold) and combined stressthat included drought [S-D (1.13 ± 0.12 mg g−1, 2.75-fold), D-H (0.90 ± 0.01 mg g−1, 2.18-fold),S-D-C (0.75 ± 0.01 mg g−1, 1.83-fold)] compared to the unstressed plants (0.41 ± 0.02 mg g−1)(Figure 1c). A similar pattern occurred for the total and reducing sugar concentrations (Figure 1d,e).The sugar contents significantly increased under individual drought stress (total sugars,1.16 ± 0.07 mg g−1, 8.37-fold; reducing sugars, 5.06 ± 0.44 mg g−1, 3.56-fold) compared to thecontrol plants (total sugars, 0.13 ± 0.01 mg g−1; reducing sugars, 1.42 ± 0.01 mg g−1).
Proline provides abiotic stress tolerance to plants by modulating osmotic adjust-ment [29]. The elevated proline content occurred in plants that were grown under in-dividual salt stress and combined stresses that included salt (Figure 1f), more so forS-D (435.20 ± 37.70 µg g−1, 14.16-fold) compared to the control (30.72 ± 0.47 µg g−1).The proline concentrations significantly increased by about 7.04- and 5.32-fold under salt(216.40 ± 91.23 µg g−1) and S-D-H (163.54 ± 10.41 µg g−1) stresses, respectively, comparedto the control plants, with no significant changes in the other treatments.
2.2. Physiological Status of Plants under Different Stress Treatments
The relative water content of all the plant samples significantly decreased in all stresstreatments except for cold and S-H, where it did not change significantly (82.13 ± 1.86%)compared to the unstressed plants (83.86 ± 1.34%). RWC substantially decreased inplants under S-D (30.90 ± 2.54%), D-H (33.00 ± 1.90%), and S-D-H (29.59 ± 2.60%) stresscompared to the unstressed plants (83.86 ± 1.34%), with a notable decline for individualdrought stress (45.10 ± 2.19%), followed by the remaining stresses [salt (67.34 ± 5.29%),heat (58.76 ± 2.56%), S-H (73.59 ± 2.21%), S-C (67.06 ± 4.45%), D-C (69.73 ± 8.10%), S-D-C (61.67 ± 2.75%)] (Figure 2a). Cold stress ameliorated leaf RWC when combinedwith drought stress, increasing from 45.10 ± 2.19% under individual drought stress to69.73 ± 8.10% under D-C.
Int. J. Mol. Sci. 2022, 23, 660 5 of 25
Figure 2. Physiological status of plants under different stress conditions. The estimation of (a) rela-
tive water content (RWC), (b) electrolyte leakage, (c) membrane stability index (MSI), and (d) lipid
peroxidation (MDA content) in peanut plants under different individual and combined stresses (S-
D: salinity and drought, S-H: salinity and heat, S-C: salinity and cold, D-H: drought and heat, D-C:
drought and cold, S-D-H: salinity, drought, and heat, and S-D-C: salinity, drought, and cold). The
data are the mean ± SE; different letters indicate significant differences at p < 0.05.
The total chlorophyll content decreased negligibly under S-H (0.23 ± 0.03 mg g−1 FW)
and S-C (0.21 ± 0.02 mg g−1 FW) stress compared to the unstressed plants (0.26 ± 0.01 mg
g−1 FW). In contrast, the total chlorophyll contents significantly increased under the other
combined stresses [S-D (0.44 ± 0.02 mg g−1 FW), D-H (0.37 ± 0.07 mg g−1 FW), D-C (0.41 ±
0.005 mg g−1 FW), S-D-H (0.48 ± 0.08 mg g−1 FW), S-D-C (0.44 ± 0.006 mg g−1 FW)] compared
to the control (Supplementary Figure S1). The total chlorophyll, chlorophyll a, chlorophyll
b, and carotene did not significantly change under the individual stresses.
2.3. Antioxidant Enzyme Assays, Transcript Expression Analysis of Encoding Genes, and In
Vivo ROS Localization
Quantitative RT-PCR and biochemical enzyme assays were used to analyze the anti-
oxidant activities in peanut plants under various abiotic stresses (Supplementary Figure
S2). The transcripts of SOD (Figure S2a) and APX (Figure S2b)-encoding genes signifi-
cantly increased in plants under abiotic stress compared to the unstressed plants, with
maximum increases for SOD (9-fold) under salt stress and APX (11-fold) under D-H stress.
The CAT expression transcript (Figure S2c) decreased under all the stress conditions ex-
cept for individual cold stress, with a maximum 20-fold reduction under S-D. Similarly,
the GR transcript (Figure S2d) increased in all the stress treatments except for drought and
S-D stress. The antioxidant encoding enzymes changed the least under individual cold
stress and the combined stresses that included cold. In contrast, heat stress combined with
salt or drought stress showed the maximum differential expression of antioxidant encod-
ing transcripts. Similar results occurred for the biochemical antioxidant enzyme assays of
CAT, SOD, and GR, which showed enzyme activities that were similar to their respective
transcript profiling (Figure 3). However, APX activity increased under salt (12%), S-C
(77%), S-D-C (84%), and S-D-H (27%) stress but decreased in all other stress treatments
compared to the control. CAT activity declined, and SOD and GR activity increased in all
the stress treatments compared to the control.
Figure 2. Physiological status of plants under different stress conditions. The estimation of (a) relativewater content (RWC), (b) electrolyte leakage, (c) membrane stability index (MSI), and (d) lipidperoxidation (MDA content) in peanut plants under different individual and combined stresses (S-D:salinity and drought, S-H: salinity and heat, S-C: salinity and cold, D-H: drought and heat, D-C:drought and cold, S-D-H: salinity, drought, and heat, and S-D-C: salinity, drought, and cold). Thedata are the mean ± SE; different letters indicate significant differences at p < 0.05.

Int. J. Mol. Sci. 2022, 23, 660 5 of 23
The individual and combined heat stress significantly increased EL (Figure 2b), par-ticularly under S-H (99.88 ± 0.59%) and S-D-H (98.71 ± 1.50%), about five-fold higherthan the unstressed plants (20.36 ± 0.50%). Similarly, about three-fold increases in ELoccurred under heat (62.18 ± 11.00%) and D-H stress (68.39 ± 1.54%) compared to thecontrol. Interestingly, EL did not significantly change under salt, drought, cold, S-C, S-D,D-C, or S-D-C stress. The membrane stability increased in all the abiotic stress treatmentscompared to the control (Figure 2c).
Lipid peroxidation (MDA content) did not significantly change in most stress treatmentsexcept for S-H and S-D-H (Figure 2d), which significantly increased [S-H (0.58 ± 0.10 mM g−1)and S-D-H (0.81 ± 0.15 mM g−1)] compared to the control (0.12 ± 0.01 mM g−1) (Figure 2d).
The total chlorophyll content decreased negligibly under S-H (0.23 ± 0.03 mg g−1 FW)and S-C (0.21 ± 0.02 mg g−1 FW) stress compared to the unstressed plants (0.26 ± 0.01 mg g−1
FW). In contrast, the total chlorophyll contents significantly increased under the othercombined stresses [S-D (0.44 ± 0.02 mg g−1 FW), D-H (0.37 ± 0.07 mg g−1 FW), D-C(0.41 ± 0.005 mg g−1 FW), S-D-H (0.48 ± 0.08 mg g−1 FW), S-D-C (0.44 ± 0.006 mg g−1
FW)] compared to the control (Supplementary Figure S1). The total chlorophyll, chlorophyll a,chlorophyll b, and carotene did not significantly change under the individual stresses.
2.3. Antioxidant Enzyme Assays, Transcript Expression Analysis of Encoding Genes, and In VivoROS Localization
Quantitative RT-PCR and biochemical enzyme assays were used to analyze the antiox-idant activities in peanut plants under various abiotic stresses (Supplementary Figure S2).The transcripts of SOD (Figure S2a) and APX (Figure S2b)-encoding genes significantlyincreased in plants under abiotic stress compared to the unstressed plants, with maximumincreases for SOD (9-fold) under salt stress and APX (11-fold) under D-H stress. TheCAT expression transcript (Figure S2c) decreased under all the stress conditions except forindividual cold stress, with a maximum 20-fold reduction under S-D. Similarly, the GRtranscript (Figure S2d) increased in all the stress treatments except for drought and S-Dstress. The antioxidant encoding enzymes changed the least under individual cold stressand the combined stresses that included cold. In contrast, heat stress combined with saltor drought stress showed the maximum differential expression of antioxidant encodingtranscripts. Similar results occurred for the biochemical antioxidant enzyme assays ofCAT, SOD, and GR, which showed enzyme activities that were similar to their respectivetranscript profiling (Figure 3). However, APX activity increased under salt (12%), S-C (77%),S-D-C (84%), and S-D-H (27%) stress but decreased in all other stress treatments comparedto the control. CAT activity declined, and SOD and GR activity increased in all the stresstreatments compared to the control.
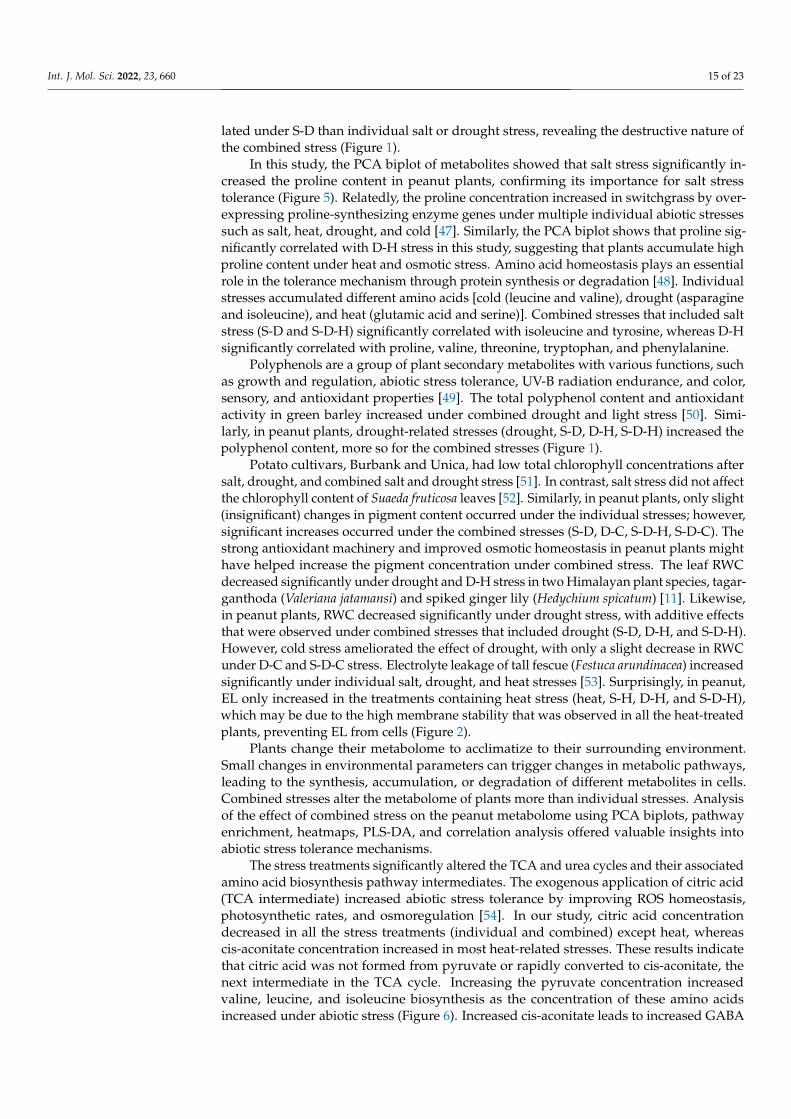
NBT (nitro-blue tetrazolium) and DAB (3,3-diaminobenzidine) staining qualitativeassays were undertaken to analyze the endogenous peroxide and free oxygen radicals thatwere generated in the leaf tissues under different stress conditions (Figure 4). The controlleaf samples had nominal staining, indicating minimal ROS production. The leaves thatwere under S-D-H stress had the most intense blue stain (NBT), indicating a high generationof free oxygen radicals, followed by salt, S-D, S-C, and S-D-C stress and relatively lowstain intensity for drought, heat, cold, and D-C stress. The DAB stain results showed thatindividual stresses did not induce much H2O2, while some combined stresses (S-D, S-H,D-H, and S-D-H) accumulated high amounts of brown DAB precipitates, suggesting highH2O2 production. Overall, individual heat stress and combined stress that included heatproduced high amounts of peroxide radicals, while cold stress ameliorated the effects ofthe other stresses by preventing peroxide radical production.

Int. J. Mol. Sci. 2022, 23, 660 6 of 23Int. J. Mol. Sci. 2022, 23, 660 6 of 25
Figure 3. Antioxidant enzyme assays. The estimation of (a) catalase (CAT), (b) ascorbate peroxidase
(APX), (c) glutathione reductase (GR), and (d) superoxide dismutase (SOD) activities in peanut
plants under different individual and combined stresses (S-D: salinity and drought, S-H: salinity
and heat, S-C: salinity and cold, D-H: drought and heat, D-C: drought and cold, S-D-H: salinity,
drought, and heat, and S-D-C: salinity, drought, and cold). The data are the mean ± SE; different
letters indicate significant differences at p < 0.05.
NBT (nitro-blue tetrazolium) and DAB (3,3-diaminobenzidine) staining qualitative
assays were undertaken to analyze the endogenous peroxide and free oxygen radicals that
were generated in the leaf tissues under different stress conditions (Figure 4). The control
leaf samples had nominal staining, indicating minimal ROS production. The leaves that
were under S-D-H stress had the most intense blue stain (NBT), indicating a high genera-
tion of free oxygen radicals, followed by salt, S-D, S-C, and S-D-C stress and relatively low
stain intensity for drought, heat, cold, and D-C stress. The DAB stain results showed that
individual stresses did not induce much H2O2, while some combined stresses (S-D, S-H,
D-H, and S-D-H) accumulated high amounts of brown DAB precipitates, suggesting high
H2O2 production. Overall, individual heat stress and combined stress that included heat
produced high amounts of peroxide radicals, while cold stress ameliorated the effects of
the other stresses by preventing peroxide radical production.
Figure 3. Antioxidant enzyme assays. The estimation of (a) catalase (CAT), (b) ascorbate peroxidase(APX), (c) glutathione reductase (GR), and (d) superoxide dismutase (SOD) activities in peanut plantsunder different individual and combined stresses (S-D: salinity and drought, S-H: salinity and heat,S-C: salinity and cold, D-H: drought and heat, D-C: drought and cold, S-D-H: salinity, drought, andheat, and S-D-C: salinity, drought, and cold). The data are the mean ± SE; different letters indicatesignificant differences at p < 0.05.
Int. J. Mol. Sci. 2022, 23, 660 7 of 25
Figure 4. Qualitative histochemical assay of peanut leaves. (a) NBT assay for identifying the accu-
mulation of free oxygen radicals, and (b) DAB assay for identifying the accumulation of H2O2 in
peanut leaves under different individual and combined stresses (S-D: salinity and drought, S-H:
salinity and heat, S-C: salinity and cold, D-H: drought and heat, D-C: drought and cold, S-D-H:
salinity, drought, and heat, and S-D-C: salinity, drought, and cold).
Dose-dependent total antioxidant and scavenging activities were observed under dif-
ferent stress conditions (Supplementary Figure S3). The total antioxidant and scavenging
activities significantly decreased under drought stress (Supplementary Figure S3). The to-
tal phenolics content increased under D-C stress but decreased under individual drought
stress compared to the control. Interestingly, negligible changes in total flavonoid content
occurred under any abiotic stress (Supplementary Figure S3).
2.4. Ion Content Analysis of Plants Subjected to Different Stress Conditions
The sodium and potassium ion contents of the treated plant samples were recorded
by ICP-OES (Supplementary Figure S4). The potassium content significantly increased
under cold (0.61 ± 0.003%wt), S-C (0.52 ± 0.005%wt), S-D (1.61 ± 0.006%wt), D-H (0.48 ±
0.002%wt), D-C (0.68 ± 0.01%wt), and S-D-C (0.53 ± 0.01%wt) stress compared to the con-
trol (0.44 ± 0.006%wt). A lower K+ content occurred under heat (0.20 ± 0.001%wt), S-H (0.16
± 0.001%wt), and S-D-H (0.15 ± 0.001% wt) stress compared to the control. In contrast, Na+
content increased under salt (0.17 ± 0.008%wt), S-H (0.14 ± 0.001%wt), D-C (0.08 ±
0.001%wt), and S-D-H (0.08 ± 0.001%wt) stressed but decreased under cold (0.03 ±
0.001%wt), S-D (0.01 ± 0.001%wt), D-H (0.01 ± 0.001%wt), and S-D-C (0.03 ± 0.005%wt)
stress compared to the control plants (0.04 ± 0.001%wt). The Na+/K+ ratio increased signif-
icantly under salt (0.52), heat (0.18), S-H (0.88), and S-D-H (0.42) stress compared to the
control (0.11) but significantly decreased under drought (0.09), cold (0.05), S-C (0.08), S-D
(0.01), D-H (0.03), and S-D-C (0.05) stress. The results indicate that the Na+/K+ ratio in-
creased under salt- and heat-related stresses but decreased under cold and drought
stresses.
Figure 4. Qualitative histochemical assay of peanut leaves. (a) NBT assay for identifying theaccumulation of free oxygen radicals, and (b) DAB assay for identifying the accumulation of H2O2
in peanut leaves under different individual and combined stresses (S-D: salinity and drought, S-H:salinity and heat, S-C: salinity and cold, D-H: drought and heat, D-C: drought and cold, S-D-H:salinity, drought, and heat, and S-D-C: salinity, drought, and cold).

Int. J. Mol. Sci. 2022, 23, 660 7 of 23
Dose-dependent total antioxidant and scavenging activities were observed underdifferent stress conditions (Supplementary Figure S3). The total antioxidant and scavengingactivities significantly decreased under drought stress (Supplementary Figure S3). Thetotal phenolics content increased under D-C stress but decreased under individual droughtstress compared to the control. Interestingly, negligible changes in total flavonoid contentoccurred under any abiotic stress (Supplementary Figure S3).
2.4. Ion Content Analysis of Plants Subjected to Different Stress Conditions
The sodium and potassium ion contents of the treated plant samples were recorded byICP-OES (Supplementary Figure S4). The potassium content significantly increased under cold(0.61 ± 0.003%wt), S-C (0.52 ± 0.005%wt), S-D (1.61 ± 0.006%wt), D-H (0.48 ± 0.002%wt), D-C(0.68± 0.01%wt), and S-D-C (0.53± 0.01%wt) stress compared to the control (0.44 ± 0.006%wt).A lower K+ content occurred under heat (0.20 ± 0.001%wt), S-H (0.16 ± 0.001%wt), andS-D-H (0.15 ± 0.001% wt) stress compared to the control. In contrast, Na+ content in-creased under salt (0.17 ± 0.008%wt), S-H (0.14 ± 0.001%wt), D-C (0.08 ± 0.001%wt),and S-D-H (0.08 ± 0.001%wt) stressed but decreased under cold (0.03 ± 0.001%wt), S-D(0.01 ± 0.001%wt), D-H (0.01 ± 0.001%wt), and S-D-C (0.03 ± 0.005%wt) stress comparedto the control plants (0.04 ± 0.001%wt). The Na+/K+ ratio increased significantly undersalt (0.52), heat (0.18), S-H (0.88), and S-D-H (0.42) stress compared to the control (0.11) butsignificantly decreased under drought (0.09), cold (0.05), S-C (0.08), S-D (0.01), D-H (0.03),and S-D-C (0.05) stress. The results indicate that the Na+/K+ ratio increased under salt- andheat-related stresses but decreased under cold and drought stresses.
2.5. Multivariate Correlation Analysis
A principal component analysis (PCA) of the studied biochemical and physiologicalvariables (excluding metabolomics data) was undertaken for all the abiotic stress treatments.The biplot shows a total variability of 58.99%, with F1 and F2 accounting for 40.17% and18.83% of the variability, respectively, between the physio-biochemical parameters andabiotic stress treatments (Figure 5). Squared cosines of the control (0.785), heat (0.315), cold(0.717), S-C (0.334), S-D (0.719), D-H (0.501), and S-D-H (0.401) stress were significantlyhigher than the other stresses indicating a greater contribution in the PCA, whereas thephysio-biochemical parameters such as free oxygen radicals (7.37%), H2O2 content (7.37%),SOD activity (7.57%), polyphenol content (9.75%), reducing sugar concentration (7.24),RWC (7.90%), and MSI (7.43%) were significant contributors to the PCA. Figure 5 showsthat cold, S-C, and S-D-C stress positively correlated with the control, while S-H, S-D-H, and D-H negatively correlated with the control. The variables including RWC, Na+
concentration, TPC (total phenolic content), and TFC (total flavonoid content) positivelycorrelated with D-C, salt, and heat stress. Similarly, the total antioxidant, radical scavenging,total sugars, reducing sugars, starch, polyphenol, proline concentration, and SOD activitypositively correlated with drought and S-D stress. Catalase and APX activities correlatedwith cold, S-C, and S-D-C stress. Similarly, EL, MSI, lipid peroxidation, FAA, H2O2,free oxygen radicals, total chlorophyll, and GR activity positively correlated with S-H,S-D-H, and D-H stress. Pearson’s correlation matrix revealed correlations among thedifferent variables at a 95% confidence interval (Supplementary Table S1). The prolineconcentration positively correlated with the total sugars (0.926; R2 = 0.857), followed by thereducing sugars (0.800; R2 = 0.640), oxygen radicals (0.714; R2 = 0.510), H2O2 concentration(0.714; R2 = 0.510), polyphenols (0.740; R2 = 0.548), potassium ion (0.659; R2 = 0.434), andstarch (0.658; R2 = 0.433). In contrast, CAT activity (−0.428; R2 = 0.183) and RWC (−0.550;R2 = 0.302) had negative but not significant correlations with the proline concentration.As expected, lipid peroxidation positively correlated with EL (0.832; R2 = 0.692), andNa+/K+ ratio (0.702; R2 = 0.493) and negatively correlated with CAT activity (−0.474;R2 = 0.225) and K+ concentration (−0.457; R2 = 0.208). Similarly, the H2O2 concentrationnegatively correlated with CAT activity (−0.565; R2 = 0.319). In contrast, GR activity

Int. J. Mol. Sci. 2022, 23, 660 8 of 23
positively correlated with free oxygen radicals (0.595; R2 = 0.354), H2O2 concentration(0.595; R2 = 0.354), and proline concentration (0.578; R2 = 0.334).
Int. J. Mol. Sci. 2022, 23, 660 9 of 25
Figure 5. Correlation analysis (PCA biplot) between the different individual and combined abiotic
stresses and physio-biochemical parameters in peanut plants (S-D: salinity and drought, S-H: salin-
ity and heat, S-C: salinity and cold, D-H: drought and heat, D-C: drought and cold, S-D-H: salinity,
drought, and heat, and S-D-C: salinity, drought, and cold).
2.6. Metabolite Profiling of Plants under Different Stress Combinations
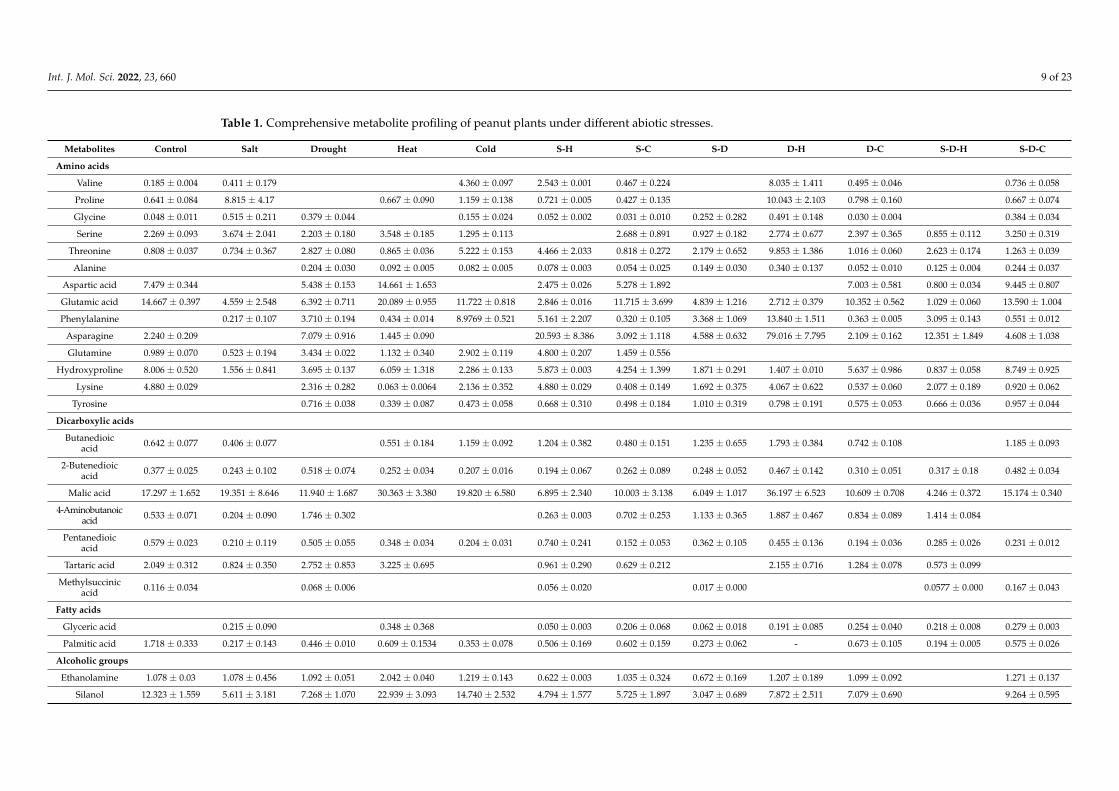
The GC-MS identified 160 metabolites, including 20 amino acids, 8 fatty acids, 33
organic acids, 28 sugars, 3 sugar acids, 4 sugar alcohols, and 64 other metabolites (Table
1).
Collectively, 23 metabolites were detected for all individual stresses, of which the
concentration of 5 decreased, 7 increased, and 11 did not change. Amino acids were prev-
alent among those that decreased, including phenylalanine (−438-fold), glycine (−11-fold),
proline (−4-fold), and threonine (−3-fold). Organic acids and sugars were prevalent among
those that increased, including palmitic acid (4-fold), xylopyranose (3-fold), and pentane-
dioic acid (3-fold). Under salt stress, amino acid concentrations decreased, such as phe-
nylalanine (−19-fold) and glycine (−11-fold), while the concentrations of metabolites that
are involved in the TCA cycle and some organic acids increased significantly [citric acid
(7-fold), tartaric acid (2-fold), propanedioic acid (5-fold), and butenedioic acid (4-fold)].
The phenylalanine concentration decreased significantly under drought (−490-fold), heat
(−57-fold), and cold (−1187-fold) stress. Similarly, glycine decreased under drought (–32-
fold) and cold (−1186-fold) stress but increased under heat stress (10-fold). In contrast,
palmitic acid increased under all individual stresses [salt (12-fold), drought (4-fold), heat
(3-fold), and cold (5-fold)].
Collectively, 25 metabolites were detected across all combined stresses, of which the
concentration of 12 decreased, 4 increased, and 9 did not change. The concentrations of
citric acid (3-fold), silanol (2-fold), glutamic acid (2-fold), and glyceric acid (15-fold) in-
creased while those of amino acids decreased [phenylalanine (−502-fold), lysine (–73-fold),
Figure 5. Correlation analysis (PCA biplot) between the different individual and combined abioticstresses and physio-biochemical parameters in peanut plants (S-D: salinity and drought, S-H: salinityand heat, S-C: salinity and cold, D-H: drought and heat, D-C: drought and cold, S-D-H: salinity,drought, and heat, and S-D-C: salinity, drought, and cold).
2.6. Metabolite Profiling of Plants under Different Stress Combinations
The GC-MS identified 160 metabolites, including 20 amino acids, 8 fatty acids, 33 or-ganic acids, 28 sugars, 3 sugar acids, 4 sugar alcohols, and 64 other metabolites (Table 1).
Int. J. Mol. Sci. 2022, 23, 660 9 of 23
Table 1. Comprehensive metabolite profiling of peanut plants under different abiotic stresses.
Metabolites Control Salt Drought Heat Cold S-H S-C S-D D-H D-C S-D-H S-D-C
Amino acids
Valine 0.185 ± 0.004 0.411 ± 0.179 4.360 ± 0.097 2.543 ± 0.001 0.467 ± 0.224 8.035 ± 1.411 0.495 ± 0.046 0.736 ± 0.058
Proline 0.641 ± 0.084 8.815 ± 4.17 0.667 ± 0.090 1.159 ± 0.138 0.721 ± 0.005 0.427 ± 0.135 10.043 ± 2.103 0.798 ± 0.160 0.667 ± 0.074
Glycine 0.048 ± 0.011 0.515 ± 0.211 0.379 ± 0.044 0.155 ± 0.024 0.052 ± 0.002 0.031 ± 0.010 0.252 ± 0.282 0.491 ± 0.148 0.030 ± 0.004 0.384 ± 0.034
Serine 2.269 ± 0.093 3.674 ± 2.041 2.203 ± 0.180 3.548 ± 0.185 1.295 ± 0.113 2.688 ± 0.891 0.927 ± 0.182 2.774 ± 0.677 2.397 ± 0.365 0.855 ± 0.112 3.250 ± 0.319
Threonine 0.808 ± 0.037 0.734 ± 0.367 2.827 ± 0.080 0.865 ± 0.036 5.222 ± 0.153 4.466 ± 2.033 0.818 ± 0.272 2.179 ± 0.652 9.853 ± 1.386 1.016 ± 0.060 2.623 ± 0.174 1.263 ± 0.039
Alanine 0.204 ± 0.030 0.092 ± 0.005 0.082 ± 0.005 0.078 ± 0.003 0.054 ± 0.025 0.149 ± 0.030 0.340 ± 0.137 0.052 ± 0.010 0.125 ± 0.004 0.244 ± 0.037
Aspartic acid 7.479 ± 0.344 5.438 ± 0.153 14.661 ± 1.653 2.475 ± 0.026 5.278 ± 1.892 7.003 ± 0.581 0.800 ± 0.034 9.445 ± 0.807
Glutamic acid 14.667 ± 0.397 4.559 ± 2.548 6.392 ± 0.711 20.089 ± 0.955 11.722 ± 0.818 2.846 ± 0.016 11.715 ± 3.699 4.839 ± 1.216 2.712 ± 0.379 10.352 ± 0.562 1.029 ± 0.060 13.590 ± 1.004
Phenylalanine 0.217 ± 0.107 3.710 ± 0.194 0.434 ± 0.014 8.9769 ± 0.521 5.161 ± 2.207 0.320 ± 0.105 3.368 ± 1.069 13.840 ± 1.511 0.363 ± 0.005 3.095 ± 0.143 0.551 ± 0.012
Asparagine 2.240 ± 0.209 7.079 ± 0.916 1.445 ± 0.090 20.593 ± 8.386 3.092 ± 1.118 4.588 ± 0.632 79.016 ± 7.795 2.109 ± 0.162 12.351 ± 1.849 4.608 ± 1.038
Glutamine 0.989 ± 0.070 0.523 ± 0.194 3.434 ± 0.022 1.132 ± 0.340 2.902 ± 0.119 4.800 ± 0.207 1.459 ± 0.556
Hydroxyproline 8.006 ± 0.520 1.556 ± 0.841 3.695 ± 0.137 6.059 ± 1.318 2.286 ± 0.133 5.873 ± 0.003 4.254 ± 1.399 1.871 ± 0.291 1.407 ± 0.010 5.637 ± 0.986 0.837 ± 0.058 8.749 ± 0.925
Lysine 4.880 ± 0.029 2.316 ± 0.282 0.063 ± 0.0064 2.136 ± 0.352 4.880 ± 0.029 0.408 ± 0.149 1.692 ± 0.375 4.067 ± 0.622 0.537 ± 0.060 2.077 ± 0.189 0.920 ± 0.062
Tyrosine 0.716 ± 0.038 0.339 ± 0.087 0.473 ± 0.058 0.668 ± 0.310 0.498 ± 0.184 1.010 ± 0.319 0.798 ± 0.191 0.575 ± 0.053 0.666 ± 0.036 0.957 ± 0.044
Dicarboxylic acids
Butanedioicacid 0.642 ± 0.077 0.406 ± 0.077 0.551 ± 0.184 1.159 ± 0.092 1.204 ± 0.382 0.480 ± 0.151 1.235 ± 0.655 1.793 ± 0.384 0.742 ± 0.108 1.185 ± 0.093
2-Butenedioicacid 0.377 ± 0.025 0.243 ± 0.102 0.518 ± 0.074 0.252 ± 0.034 0.207 ± 0.016 0.194 ± 0.067 0.262 ± 0.089 0.248 ± 0.052 0.467 ± 0.142 0.310 ± 0.051 0.317 ± 0.18 0.482 ± 0.034
Malic acid 17.297 ± 1.652 19.351 ± 8.646 11.940 ± 1.687 30.363 ± 3.380 19.820 ± 6.580 6.895 ± 2.340 10.003 ± 3.138 6.049 ± 1.017 36.197 ± 6.523 10.609 ± 0.708 4.246 ± 0.372 15.174 ± 0.340
4-Aminobutanoicacid 0.533 ± 0.071 0.204 ± 0.090 1.746 ± 0.302 0.263 ± 0.003 0.702 ± 0.253 1.133 ± 0.365 1.887 ± 0.467 0.834 ± 0.089 1.414 ± 0.084
Pentanedioicacid 0.579 ± 0.023 0.210 ± 0.119 0.505 ± 0.055 0.348 ± 0.034 0.204 ± 0.031 0.740 ± 0.241 0.152 ± 0.053 0.362 ± 0.105 0.455 ± 0.136 0.194 ± 0.036 0.285 ± 0.026 0.231 ± 0.012
Tartaric acid 2.049 ± 0.312 0.824 ± 0.350 2.752 ± 0.853 3.225 ± 0.695 0.961 ± 0.290 0.629 ± 0.212 2.155 ± 0.716 1.284 ± 0.078 0.573 ± 0.099
Methylsuccinicacid 0.116 ± 0.034 0.068 ± 0.006 0.056 ± 0.020 0.017 ± 0.000 0.0577 ± 0.000 0.167 ± 0.043
Fatty acids
Glyceric acid 0.215 ± 0.090 0.348 ± 0.368 0.050 ± 0.003 0.206 ± 0.068 0.062 ± 0.018 0.191 ± 0.085 0.254 ± 0.040 0.218 ± 0.008 0.279 ± 0.003
Palmitic acid 1.718 ± 0.333 0.217 ± 0.143 0.446 ± 0.010 0.609 ± 0.1534 0.353 ± 0.078 0.506 ± 0.169 0.602 ± 0.159 0.273 ± 0.062 - 0.673 ± 0.105 0.194 ± 0.005 0.575 ± 0.026
Alcoholic groups
Ethanolamine 1.078 ± 0.03 1.078 ± 0.456 1.092 ± 0.051 2.042 ± 0.040 1.219 ± 0.143 0.622 ± 0.003 1.035 ± 0.324 0.672 ± 0.169 1.207 ± 0.189 1.099 ± 0.092 1.271 ± 0.137
Silanol 12.323 ± 1.559 5.611 ± 3.181 7.268 ± 1.070 22.939 ± 3.093 14.740 ± 2.532 4.794 ± 1.577 5.725 ± 1.897 3.047 ± 0.689 7.872 ± 2.511 7.079 ± 0.690 9.264 ± 0.595

Int. J. Mol. Sci. 2022, 23, 660 10 of 23
Table 1. Cont.
Metabolites Control Salt Drought Heat Cold S-H S-C S-D D-H D-C S-D-H S-D-C
Aromatics
Pyrazine 0.275 ± 0.050 0.129 ± 0.015 0.137 ± 0.137 5.258 ± 0.527 0.662 ± 0.001 17.777 ± 1.049 0.553 ± 0.082 0.504 ± 0.070
Shikimic acid 0.103 ± 0.028 0.370 ± 0.157 0.585 ± 0.132 0.891 ± 0.312 0.607 ± 0.170 0.520 ± 0.199 0.517 ± 0.196 0.335 ± 0.021 0.286 ± 0.109 0.650 ± 0.108 0.127 ± 0.040 1.421 ± 0.111
Quininic acid 7.233 ± 2.744 5.944 ± 1.343 15.007 ± 5.811 2.978 ± 1.111 8.165 ± 2.673 5.274 ± 0.568 13.415 ± 5.334 7.852 ± 1.054 3.479 ± 0.403 16.217 ± 2.093
Pinitol 34.372 ± 2.76 59.312 ± 18.71 35.060 ± 2.765 71.672 ± 4.223 99.445 ± 4.692 23.775 ± 8.061 39.056 ± 11.678 21.731 ± 4.947 148.20 ± 21.20 39.972 ± 1.590 17.050 ± 0.968 45.476 ± 5.153
Caffeic acid 0.233 ± 0.143 1.581 ± 0.119 0.645 ± 0.167 0.690 ± 0.279 0.715 ± 0.278 1.350 ± 0.325 1.486 ± 0.341 0.634 ± 0.284 2.525 ± 0.096 3.101 ± 0.410
Sugars
Melibiose 0.723 ± 0.037 0.689 ± 0.1652 0.604 ± 0.019 0.537 ± 0.188 0.542 ± 0.191 0.269 ± 0.087 0.586 ± 0.030
Mannobiose 0.802 ± 0.049 0.672 ± 0.033 0.518 ± 0.0476 0.186 ± 0.073 0.439 ± 0.169 0.317 ± 0.091 0.777 ± 0.021 0.770 ± 0.052
Sucrose 63.910 ± 6.050 73.783 ± 16.69 42.000 ± 2.939 66.401 ± 4.275 3.343 ± 0.846 1.513 ± 0.595 44.004 ± 13.313 35.012 ± 11.70 6.887 ± 0.633 39.878 ± 1.824 1.518 ± 0.069 54.621 ± 3.886
Miscellaneous
Propanedioicacid 0.070 ± 0.001 0.415 ± 0.010 0.586 ± 0.214 0.517 ± 0.026 0.303 ± 0.106 0.040 ± 0.013 0.215 ± 0.052 0.556 ± 0.044 0.064 ± 0.007 0.395 ± 0.16 0.165 ± 0.014
Urea 0.535 ± 0.108 0.592 ± 0.006 0.093 ± 0.001 0.238 ± 0.097 0.123 ± 0.038 0.940 ± 0.266 0.295 ± 0.063 0.097 ± 0.035 0.279 ± 0.025 0.289 ± 0.042
Citric acid 13.080 ± 0.461 1.899 ± 0.993 3.765 ± 1.084 31.629 ±10.214 12.569 ± 1.600 3.897 ± 1.171 4.889 ± 1.752 2.409 ± 0.633 2.647 ± 0.762 5.538 ± 0.509 0.711 ± 0.123 6.835 ± 0.042

Int. J. Mol. Sci. 2022, 23, 660 11 of 23
Collectively, 23 metabolites were detected for all individual stresses, of which theconcentration of 5 decreased, 7 increased, and 11 did not change. Amino acids were preva-lent among those that decreased, including phenylalanine (−438-fold), glycine (−11-fold),proline (−4-fold), and threonine (−3-fold). Organic acids and sugars were prevalent amongthose that increased, including palmitic acid (4-fold), xylopyranose (3-fold), and pentane-dioic acid (3-fold). Under salt stress, amino acid concentrations decreased, such as pheny-lalanine (−19-fold) and glycine (−11-fold), while the concentrations of metabolites that areinvolved in the TCA cycle and some organic acids increased significantly [citric acid (7-fold),tartaric acid (2-fold), propanedioic acid (5-fold), and butenedioic acid (4-fold)]. The pheny-lalanine concentration decreased significantly under drought (−490-fold), heat (−57-fold),and cold (−1187-fold) stress. Similarly, glycine decreased under drought (−32-fold) andcold (−1186-fold) stress but increased under heat stress (10-fold). In contrast, palmitic acidincreased under all individual stresses [salt (12-fold), drought (4-fold), heat (3-fold), andcold (5-fold)].
Collectively, 25 metabolites were detected across all combined stresses, of which theconcentration of 12 decreased, 4 increased, and 9 did not change. The concentrations of cit-ric acid (3-fold), silanol (2-fold), glutamic acid (2-fold), and glyceric acid (15-fold) increasedwhile those of amino acids decreased [phenylalanine (−502-fold), lysine (−73-fold), tyro-sine (−57-fold), leucine (−20-fold), glycine (−17-fold), asparagine (−7.25-fold), threonine(−4-fold)]. The hydroxyproline (proline derivative) concentrations increased under S-D(4-fold), D-H (6-fold), and S-D-H (10-fold) stress.
2.7. Principal Component Analysis, Partial Least Square Discriminant Analysis and HeatmapAnalysis of Metabolites
The PCA was performed (Supplementary Figure S5) to identify correlations betweenthe different individual and combined abiotic stresses and changes in metabolite accu-mulation. The biplot for the individual stresses shows 65.26% total variability, with PC1contributing 35.99% and PC2 contributing 29.27%, and the control group significantly dif-fered from the individual abiotic stresses at the 95% confidence interval. Of the 60 squaredcosines, 20 metabolites were significantly higher and contributed to the principal compo-nents. Among the metabolites, isoleucine (4.28%), butenedioic acid (3.03%), glycolic acid(4.12%), aminobutanoic acid (3.790%), aconitic acid (4.12%), fructose (4.12%), ferulic acid(4.12%), caffeic acid (4.22%), and galactinol (4.12%) contributed the most to the principalcomponents. The biplot also shows a significant correlation between the accumulationof proline under salt stress, valine and leucine under cold stress, isoleucine and fructoseunder drought stress, and citric acid and ketoadipic acid under heat stress. The biplot forthe combined stresses shows 57.15% total variability, with PC1 contributing 36.77% andPC2 contributing 20.40%. The squared cosines of 28 metabolites were significantly highand contributed to the principal components. Propanedioic acid (4.08%), threonine (3.89%),phenylalanine (4.08%), asparagine (3.5%), and tryptophan (3.70%) contributed the mostto the principal components. The combined stress biplot shows two distinct groups thatsignificantly differed from the control. The first group correlated S-H, S-D, and S-D-Hstress (salt as a common factor) with the accumulation of glyceric acid, caffeic acid, urea,isoleucine, tyrosine, and glycolic acid. The second group correlated S-C, D-C, and S-D-Cstress (cold as a common factor) with the accumulation of glutamine, 2-methylalanine,psicofuranose, and shikimic acid.
The metabolomics data for peanut plants under different abiotic stresses were an-alyzed by partial least squares-discriminant analysis (PLS-DA) to understand the cor-relation between the changes in the metabolite concentration and the different abioticstresses (Supplementary Figure S6). Multivariate regression was used and performed usingthe plsr function in the R pls package. Further classification and cross-validation of themetabolomics data was performed using the caret package of Metaboanalyst ver. 5.0. Thevariable importance in projection (VIP) score of the metabolites was calculated from theweighted sum of squares of the PLS loading against each treatment. Important features

Int. J. Mol. Sci. 2022, 23, 660 12 of 23
of metabolites with the highest VIP scores were plotted against the different treatments,and a 3D score plot for each treatment was predicted (Supplementary Figure S7). The VIPscore plot showed that the individual stresses significantly changed the concentrations ofpinitol, xylopyranose, phenylalanine, and proline, while the combined stresses significantlychanged the concentrations of pinitol, malic acid, glutamic acid, silanol, and citric acid.
Metabolite heatmaps were generated with clustering features (metabolites) and vari-ables (treatments) (Supplementary Figure S8). The results showed that the control hadvery low amino acid concentrations (proline, tyrosine, alanine, glycine, and tryptophan)compared to the individual stresses (drought, salt, heat, and cold). In contrast, the individ-ual stresses significantly decreased the concentration of metabolites belonging to organicacids, fatty acids, and sugars (stearic acid, pentanedioic acid, ketoglutaric acid, tartaric acid,palmitic acid, xylopyranose, and melibiose). Proline, glycine, serine, sucrose, myo-inositol,and glyceric acid concentrations increased significantly under salt stress compared to thecontrol. Similarly, phenylalanine, threonine, tryptophan, quininic acid, butanedioic acid,leucine, and valine increased under cold stress; 2-ketoadipic acid, malic acid, ethanolamine,citric acid, shikimic acid and glutamic acid increased under heat stress; and aconitic acid,glycolic acid, fructose, ferulic acid, galactinol, asparagine, and caffeic acid increased underdrought stress compared to the control. A cluster analysis showed that, compared to thecontrol, changes in the metabolite profile were more related under cold stress and mostdivergent under drought stress. The metabolite heatmap for the combined stresses showedthat cold stresses (S-C, D-C, and S-D-C) showed the most similar changes in profilingcompared to the control. In contrast, heat stresses (D-H, S-H and D-H) were distant to thecontrol and showed the most divergent changes in metabolite profiling. The concentrationsof fructose, psicofuranose, 2-methylalanine, shikimic acid, quininic acid, and glyceric acidincreased under S-C, D-C, and S-D-C stress compared to the control. Similarly, glycolicacid, propanedioic acid, tryptophan, asparagine, phenylalanine, threonine, aconitic acid,and tyrosine accumulated under D-H, S-H, S-D, and S-D-H stress. In addition, the heatmapanalysis revealed correlations for the selected metabolites under individual and combinedstresses (Supplementary Figure S9).
2.8. Pathway Enrichment Analysis
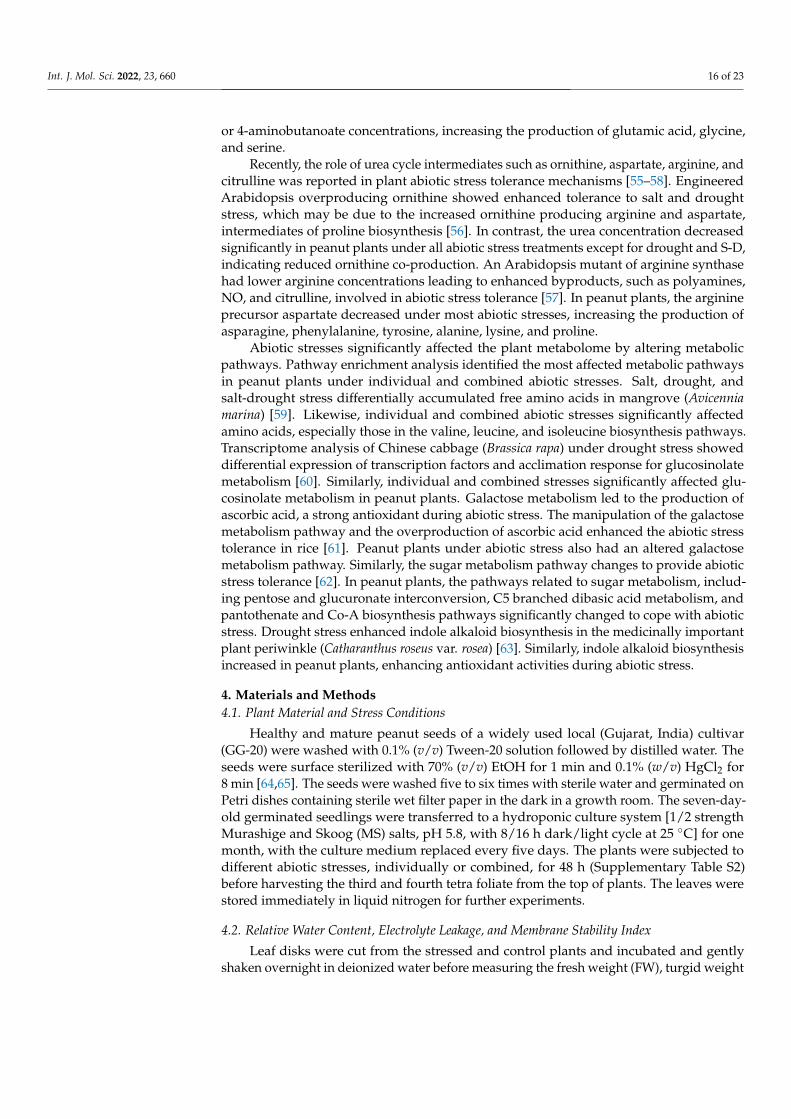
The Venn diagrams for individual and/or combined stresses show exclusive and inclu-sive metabolite accumulation (Supplementary Figure S10), with 18 metabolites that werecommon to the individual stresses and the control. Further, 39, 7, 7, and 10 metabolites wereexclusively detected under drought, salt, heat, and cold stress, respectively. For the com-bined stresses, 18, 9, 9, 16, 7, 42, and 24 metabolites were exclusively found under S-H, D-C,S-C, S-D, D-H, S-D-H, and S-D-C stress, respectively. The metabolites that were observedexclusively under abiotic stress (individual or combined stress) were used for the pathwayenrichment analysis (Supplementary Figure S11). The pathway impact summary plots weregenerated by pathway topology analysis using the Arabidopsis KEGG metabolic pathwaydatabase. The large circle on the pathway impact plot indicates the highest impact and thedarker color indicates significant changes in concentration. The individual and combinedstresses significantly affected amino acid metabolism pathways, including aminoacyl-tRNAbiosynthesis, valine, leucine and isoleucine metabolism, beta-alanine metabolism, tryp-tophan metabolism, phenylalanine metabolism, lysine metabolism, tyrosine metabolism,and arginine biosynthesis, along with the pathways of galactose metabolism, glucosinolatebiosynthesis, pentose and glucuronate interconversion, pantothenate and CoA biosynthe-sis, indole alkaloid biosynthesis, tropane, piperidine and pyridine alkaloid biosynthesis,isoquinoline alkaloid biosynthesis, and pyrimidine metabolism. The fatty acid degradation,amino sugar metabolism, and nucleotide sugar metabolism pathways were least affectedby the various abiotic stresses. Changes in the metabolite concentration from the inter-connected TCA and urea cycles and amino acid biosynthesis are shown in the heatmap(Figure 6).

Int. J. Mol. Sci. 2022, 23, 660 13 of 23Int. J. Mol. Sci. 2022, 23, 660 14 of 25
Figure 6. The differential accumulation of metabolites that are involved in the TCA and urea cycles
and various amino acid biosynthesis pathways in peanut plants under different abiotic stresses (M:
no stress, S: salinity, D: drought, H: heat, C: cold, S-D: salinity and drought, S-H: salinity and heat,
S-C: salinity and cold, D-H: drought and heat, D-C: drought and cold, S-D-H: salinity, drought, and
heat, S-D-C: salinity, drought, and cold).
3. Discussion
Climate change and global warming have increased the severity and frequency of
extreme climatic conditions. Plant biotechnology researchers often work on individual
abiotic stresses, but plants usually experience multiple abiotic stresses at once or sequen-
tially in the field, inducing different responses to individual stresses. Plants selectively
change physio-biochemical properties and metabolic pathways to adjust to the adverse
effects of these abiotic stresses. The combination of some abiotic stresses such as drought
and heat may produce conflicting responses in plants. Plant adaptation to abiotic stress is
shaped by the environment that is confronting the plant. Consequently, changes in envi-
ronmental conditions can alter the molecular, biochemical, and physiological responses
in plants.
China is the largest producer of peanut (17.99 million metric tons) followed by India
(6.70 million metric tons) and the USA (2.79 million metric tons); however, the USA pro-
duces the highest yields (4.27 metric tons per ha), followed by China (3.79 metric tons per
ha) and India (1.12 metric tons per ha) [30]. Peanut is an important cash crop worldwide,
producing India’s third-most consumed edible oil. Various abiotic stresses are the key
reason for reduced yields in India [31].
Cluster computing and yield simulation suggest that climate change will reduce pea-
nut production by 2.3–33.7% in India [32]. In this study, different abiotic stress combina-
tions were used to simulate possible future climatic conditions and their effects on peanut
plants. This study investigated the effect of individual and combined abiotic stresses on
the peanut’s physio-biochemical and metabolomic responses, elucidating their effect on
the complex metabolic networks and pathways and metabolite accumulation. In addition,
multivariate correlation analysis of the physio-biochemical and metabolomic parameters
was used to understand the molecular mechanism of abiotic stress responses in peanut
plants.
Figure 6. The differential accumulation of metabolites that are involved in the TCA and urea cyclesand various amino acid biosynthesis pathways in peanut plants under different abiotic stresses (M:no stress, S: salinity, D: drought, H: heat, C: cold, S-D: salinity and drought, S-H: salinity and heat,S-C: salinity and cold, D-H: drought and heat, D-C: drought and cold, S-D-H: salinity, drought, andheat, S-D-C: salinity, drought, and cold).
3. Discussion
Climate change and global warming have increased the severity and frequency ofextreme climatic conditions. Plant biotechnology researchers often work on individual abi-otic stresses, but plants usually experience multiple abiotic stresses at once or sequentiallyin the field, inducing different responses to individual stresses. Plants selectively changephysio-biochemical properties and metabolic pathways to adjust to the adverse effects ofthese abiotic stresses. The combination of some abiotic stresses such as drought and heatmay produce conflicting responses in plants. Plant adaptation to abiotic stress is shapedby the environment that is confronting the plant. Consequently, changes in environmentalconditions can alter the molecular, biochemical, and physiological responses in plants.
China is the largest producer of peanut (17.99 million metric tons) followed by India(6.70 million metric tons) and the USA (2.79 million metric tons); however, the USA pro-duces the highest yields (4.27 metric tons per ha), followed by China (3.79 metric tons perha) and India (1.12 metric tons per ha) [30]. Peanut is an important cash crop worldwide,producing India’s third-most consumed edible oil. Various abiotic stresses are the keyreason for reduced yields in India [31].
Cluster computing and yield simulation suggest that climate change will reducepeanut production by 2.3–33.7% in India [32]. In this study, different abiotic stress combina-tions were used to simulate possible future climatic conditions and their effects on peanutplants. This study investigated the effect of individual and combined abiotic stresses on thepeanut’s physio-biochemical and metabolomic responses, elucidating their effect on thecomplex metabolic networks and pathways and metabolite accumulation. In addition, mul-tivariate correlation analysis of the physio-biochemical and metabolomic parameters wasused to understand the molecular mechanism of abiotic stress responses in peanut plants.
ROS are an integral part of plant sensing and signaling [33,34]. Plants in unstressedenvironments maintain a delicate balance between ROS production and scavenging, which
Int. J. Mol. Sci. 2022, 23, 660 14 of 23
are involved in cellular signaling. Exposure to abiotic stress causes excess ROS productionin plant cells, damaging cellular membranes [35]. DAB (brown precipitate) and NBT (blueprecipitate) histochemical staining produce visible staining in leaf explants by reactingwith accumulated peroxide and free oxygen radicals, respectively [36]. DAB staining ofpeanut leaves suggested that combined stresses such as S-H, S-D, D-H, and S-D-H signifi-cantly induced higher peroxide radical formation than the individual stresses (Figure 4).Similarly, NBT staining showed that free oxygen radicals accumulated significantly underS-D, S-C, D-H, S-D-H, and S-D-C stress compared to the control and individual stresses(Figure 4). Thus, the combined stresses accumulated more ROS in peanut plants thanthe individual stresses. Abiotic stresses cause lipid peroxidation of membranes leadingto cellular membrane damage and leakage [31]. In Sesamum indicum cv. Orhangazi, saltstress significantly increased the lipid peroxidation [37]. In contrast, lipid peroxidation didnot significantly change in the individual stress treatments. Interestingly, lipid peroxida-tion increased in peanut under S-H and S-D-H stress, suggesting the presence of strongantioxidant machinery.
The antioxidative enzyme system of plants scavenges excess ROS and restores home-ostasis. A study on peanut plants reported that CAT activity in the leaf tissue decreased byup to 52% under drought stress compared to the control [22]. Similarly, in our study, theCAT activity decreased by 72% under drought stress, more so when combined with salt(S-D, 84%), heat (D-H, 85%), or salt and heat (S-D-H, 94%) stress (Figure 3). Similar resultswere reported for Hedychium plants, where combined drought and heat stress decreased theCAT activity in leaf samples [11]. In contrast, combined cold and drought (D-C, 56%) andsalt, drought, and cold (S-D-C, 48%) stress significantly increased CAT activity (Figure 3).Under salt stress, SOD and APX activities decreased by 50–70% in peanut plants [38]. Incontrast, the SOD activity increased, and APX activity remained stable under salt stressin the present study compared to the control. The different SOD and APX responses maybe related to differences in the genotype and stress duration; for example, 48 h stress withGG20 cultivar in this study compared to 96 h stress with Luhua14 cultivar [38]. The APXactivity almost doubled under S-C and S-D-C stress. Glutathione reductase (GR) activityincreased significantly in green spurge (Euphorbia esula) under individual drought and coldstresses compared to the control [39]. In our study, the GR activity increased under allindividual and combined stresses, but more so for the combined stresses that included salt(S-C, S-H, S-D-H; Figure 3).
Plant biochemical constituents such as amino acids, polyphenol, sugars, and starchplay important roles in osmotic homeostasis, sensing and signaling, and growth duringabiotic stress [40]. The total soluble sugar concentration increased in soybean leaves afterlong-term drought stress [41]. Similarly, in peanut plants, the sugar and starch concentra-tions increased under salt, drought, and S-D stress, perhaps acting as osmoprotectants andhelping maintain turgor pressure and membrane stability. In Arabidopsis, the accumula-tion of sugars, amino acids, and polyphenols under drought stress drives ion and osmotichomeostasis [42]. In peanut leaves, FAA concentrations increased in all individual andcombined stress treatments except for those that were related to cold stress, indicating thatcold stress ameliorates the effect of other concurrent abiotic stresses (Figure 1).
Proline is a particularly important osmoprotectant for plant abiotic stress tolerance [43].Transgenic tobacco plants that were overexpressing the proline biosynthesis gene pyrro-line 5-carboxylate synthetase, had better drought, heat, and drought-heat sequential stresstolerance than control plants, indicating the role of proline accumulation in abiotic stress tol-erance [44]. The overexpression of proline-synthesizing genes or the exogenous applicationof proline enhanced the salt tolerance in plants [45]. In soybean plants, the overexpres-sion of transcription factor GmDREB6 led to proline accumulation and enhanced salinitytolerance [46]. Likewise, proline concentrations, measured by calorimetry, significantlyincreased under salt, S-H, D-H, S-D, and S-D-H stress, indicating its involvement in plantdefense mechanisms against abiotic stress. Especially, significantly more proline accumu-
Int. J. Mol. Sci. 2022, 23, 660 15 of 23
lated under S-D than individual salt or drought stress, revealing the destructive nature ofthe combined stress (Figure 1).
In this study, the PCA biplot of metabolites showed that salt stress significantly in-creased the proline content in peanut plants, confirming its importance for salt stresstolerance (Figure 5). Relatedly, the proline concentration increased in switchgrass by over-expressing proline-synthesizing enzyme genes under multiple individual abiotic stressessuch as salt, heat, drought, and cold [47]. Similarly, the PCA biplot shows that proline sig-nificantly correlated with D-H stress in this study, suggesting that plants accumulate highproline content under heat and osmotic stress. Amino acid homeostasis plays an essentialrole in the tolerance mechanism through protein synthesis or degradation [48]. Individualstresses accumulated different amino acids [cold (leucine and valine), drought (asparagineand isoleucine), and heat (glutamic acid and serine)]. Combined stresses that included saltstress (S-D and S-D-H) significantly correlated with isoleucine and tyrosine, whereas D-Hsignificantly correlated with proline, valine, threonine, tryptophan, and phenylalanine.
Polyphenols are a group of plant secondary metabolites with various functions, suchas growth and regulation, abiotic stress tolerance, UV-B radiation endurance, and color,sensory, and antioxidant properties [49]. The total polyphenol content and antioxidantactivity in green barley increased under combined drought and light stress [50]. Simi-larly, in peanut plants, drought-related stresses (drought, S-D, D-H, S-D-H) increased thepolyphenol content, more so for the combined stresses (Figure 1).
Potato cultivars, Burbank and Unica, had low total chlorophyll concentrations aftersalt, drought, and combined salt and drought stress [51]. In contrast, salt stress did not affectthe chlorophyll content of Suaeda fruticosa leaves [52]. Similarly, in peanut plants, only slight(insignificant) changes in pigment content occurred under the individual stresses; however,significant increases occurred under the combined stresses (S-D, D-C, S-D-H, S-D-C). Thestrong antioxidant machinery and improved osmotic homeostasis in peanut plants mighthave helped increase the pigment concentration under combined stress. The leaf RWCdecreased significantly under drought and D-H stress in two Himalayan plant species, tagar-ganthoda (Valeriana jatamansi) and spiked ginger lily (Hedychium spicatum) [11]. Likewise,in peanut plants, RWC decreased significantly under drought stress, with additive effectsthat were observed under combined stresses that included drought (S-D, D-H, and S-D-H).However, cold stress ameliorated the effect of drought, with only a slight decrease in RWCunder D-C and S-D-C stress. Electrolyte leakage of tall fescue (Festuca arundinacea) increasedsignificantly under individual salt, drought, and heat stresses [53]. Surprisingly, in peanut,EL only increased in the treatments containing heat stress (heat, S-H, D-H, and S-D-H),which may be due to the high membrane stability that was observed in all the heat-treatedplants, preventing EL from cells (Figure 2).
Plants change their metabolome to acclimatize to their surrounding environment.Small changes in environmental parameters can trigger changes in metabolic pathways,leading to the synthesis, accumulation, or degradation of different metabolites in cells.Combined stresses alter the metabolome of plants more than individual stresses. Analysisof the effect of combined stress on the peanut metabolome using PCA biplots, pathwayenrichment, heatmaps, PLS-DA, and correlation analysis offered valuable insights intoabiotic stress tolerance mechanisms.
The stress treatments significantly altered the TCA and urea cycles and their associatedamino acid biosynthesis pathway intermediates. The exogenous application of citric acid(TCA intermediate) increased abiotic stress tolerance by improving ROS homeostasis,photosynthetic rates, and osmoregulation [54]. In our study, citric acid concentrationdecreased in all the stress treatments (individual and combined) except heat, whereascis-aconitate concentration increased in most heat-related stresses. These results indicatethat citric acid was not formed from pyruvate or rapidly converted to cis-aconitate, thenext intermediate in the TCA cycle. Increasing the pyruvate concentration increasedvaline, leucine, and isoleucine biosynthesis as the concentration of these amino acidsincreased under abiotic stress (Figure 6). Increased cis-aconitate leads to increased GABA
Int. J. Mol. Sci. 2022, 23, 660 16 of 23
or 4-aminobutanoate concentrations, increasing the production of glutamic acid, glycine,and serine.
Recently, the role of urea cycle intermediates such as ornithine, aspartate, arginine, andcitrulline was reported in plant abiotic stress tolerance mechanisms [55–58]. EngineeredArabidopsis overproducing ornithine showed enhanced tolerance to salt and droughtstress, which may be due to the increased ornithine producing arginine and aspartate,intermediates of proline biosynthesis [56]. In contrast, the urea concentration decreasedsignificantly in peanut plants under all abiotic stress treatments except for drought and S-D,indicating reduced ornithine co-production. An Arabidopsis mutant of arginine synthasehad lower arginine concentrations leading to enhanced byproducts, such as polyamines,NO, and citrulline, involved in abiotic stress tolerance [57]. In peanut plants, the arginineprecursor aspartate decreased under most abiotic stresses, increasing the production ofasparagine, phenylalanine, tyrosine, alanine, lysine, and proline.
Abiotic stresses significantly affected the plant metabolome by altering metabolicpathways. Pathway enrichment analysis identified the most affected metabolic pathwaysin peanut plants under individual and combined abiotic stresses. Salt, drought, andsalt-drought stress differentially accumulated free amino acids in mangrove (Avicenniamarina) [59]. Likewise, individual and combined abiotic stresses significantly affectedamino acids, especially those in the valine, leucine, and isoleucine biosynthesis pathways.Transcriptome analysis of Chinese cabbage (Brassica rapa) under drought stress showeddifferential expression of transcription factors and acclimation response for glucosinolatemetabolism [60]. Similarly, individual and combined stresses significantly affected glu-cosinolate metabolism in peanut plants. Galactose metabolism led to the production ofascorbic acid, a strong antioxidant during abiotic stress. The manipulation of the galactosemetabolism pathway and the overproduction of ascorbic acid enhanced the abiotic stresstolerance in rice [61]. Peanut plants under abiotic stress also had an altered galactosemetabolism pathway. Similarly, the sugar metabolism pathway changes to provide abioticstress tolerance [62]. In peanut plants, the pathways related to sugar metabolism, includ-ing pentose and glucuronate interconversion, C5 branched dibasic acid metabolism, andpantothenate and Co-A biosynthesis pathways significantly changed to cope with abioticstress. Drought stress enhanced indole alkaloid biosynthesis in the medicinally importantplant periwinkle (Catharanthus roseus var. rosea) [63]. Similarly, indole alkaloid biosynthesisincreased in peanut plants, enhancing antioxidant activities during abiotic stress.
4. Materials and Methods4.1. Plant Material and Stress Conditions
Healthy and mature peanut seeds of a widely used local (Gujarat, India) cultivar(GG-20) were washed with 0.1% (v/v) Tween-20 solution followed by distilled water. Theseeds were surface sterilized with 70% (v/v) EtOH for 1 min and 0.1% (w/v) HgCl2 for8 min [64,65]. The seeds were washed five to six times with sterile water and germinated onPetri dishes containing sterile wet filter paper in the dark in a growth room. The seven-day-old germinated seedlings were transferred to a hydroponic culture system [1/2 strengthMurashige and Skoog (MS) salts, pH 5.8, with 8/16 h dark/light cycle at 25 ◦C] for onemonth, with the culture medium replaced every five days. The plants were subjected todifferent abiotic stresses, individually or combined, for 48 h (Supplementary Table S2)before harvesting the third and fourth tetra foliate from the top of plants. The leaves werestored immediately in liquid nitrogen for further experiments.
4.2. Relative Water Content, Electrolyte Leakage, and Membrane Stability Index
Leaf disks were cut from the stressed and control plants and incubated and gentlyshaken overnight in deionized water before measuring the fresh weight (FW), turgid weight

Int. J. Mol. Sci. 2022, 23, 660 17 of 23
(after 24 h incubation), and the dry weight (after drying at 65 ◦C constant temperature).The percent relative water content (RWC, %) was calculated as follows:
RWC (%) = 100 × [(Fresh weight − Dry weight)/(Turgid weight − Dry weight)]
The fresh leaf disks were used to measure the membrane stability index (MSI). Thefirst set (L1) of leaves was stored at 40 ◦C for 30 min and the second set (L2) was storedat 100 ◦C for 10 min and cooled to room temperature. The electrical conductivity (EC) ofboth sets was measured with a conductivity meter (SevenEasy, Mettler Toledo, Greifensee,Switzerland). MSI was calculated as 100 × [1 − L1/L2].
For the electrolyte leakage (EL) measurement, the fresh leaf samples were thoroughlyrinsed with sterile distilled water to remove surface attached electrolytes. The samples werestored in sterile water in sealed tubes and incubated on a rotating shaker overnight. The ECwas determined (Lt) with a conductivity meter the next day. The leaf samples from eachtreatment were then autoclaved at 120 ◦C for 15 min, cooled to room temperature, and theEC (L0) was re-measured [66]. The percentage EL was determined as EL (%) = 100 × Lt/L0.
4.3. Estimation of Photosynthetic Pigments and Na+/K+ Ratio
Fresh leaf from the stressed and control plants was used to estimate the various photo-synthetic pigments. Leaf tissue (20 mg) was extracted in 100% N, N-dimethylformamide(DMF) at 4 ◦C to estimate Chl a, Chl b, total Chl (a + b), and carotenoid contents by recordingthe absorbance at 664.5, 664, 647, and 461 nm, respectively [67,68].
For the Na+ and K+ contents, the dry leaf samples (100 mg) were digested in perchloricacid and nitric acid (9:4 v/v ratio), evaporated to dryness on a hotplate, and the residuewas dissolved in 50 mL deionized water. The solution was filtered through 0.22 µm syringefilter before measuring the Na+ and K+ contents with an inductively coupled plasma atomicabsorption spectrometer (Optima 2000DV, Perkin Elmer, Waltham, MA, USA) [69].
4.4. In Vivo Localization of H2O2 and O2−
The hydrogen peroxide and O2− radical accumulation were detected in vivo [33]. The
leaf samples were dipped in nitro-blue tetrazolium (NBT) solution (1 mg mL−1 NBT in10 mM phosphate buffer; pH 7.8) at room temperature for 4 h in the dark. The presence ofH2O2 was detected by dipping the leaf samples in 3,3-diaminobenzidine (DAB) solution(1 mg mL−1 DAB, 0.1% Triton X-100, 10 mM Na2HPO4; pH 3.8) at room temperature for6 h in the dark before exposing them to the light until brown spots appeared (evidence ofH2O2 accumulation). The chlorophyll content was bleached with ethanol, and photographswere taken of the leaf samples.
4.5. Estimation of Free Amino Acids, Polyphenols, and Sugar Contents
The leaf tissue (250 mg) was extracted in 80% ethanol and centrifuged at 10,000× g for10 min. The pellet was used for starch content estimation, with the supernatant left afterevaporation dissolved in deionized water to quantify the free amino acids, polyphenol,total soluble sugars, and reducing sugars. Glycine, catechol, and glucose were used asthe reference standard for free amino acid, polyphenol, and sugar content estimation,respectively. The total free amino acid contents in the leaf tissues were determined usingninhydrin reagent [70]. The polyphenol contents in the leaves were determined by Folin-Ciocalteau’s reagent [71]. The reducing sugars were computed using a colorimetric testand DNS method [72]. The total soluble sugars and starch (after digestion of pellet with52% perchloric acid for 2 h) were estimated using anthrone-sulfuric acid [73].
4.6. Estimation of Proline Content, Lipid Peroxidation, and Antioxidant Enzyme Activity
About 200 mg leaf samples were crushed in liquid nitrogen and extracted in 3% aque-ous sulfosalicylic acid solution for proline content estimation. L-proline (Sigma, St. Louis,MO, USA) was used for standard curve preparation, and a ninhydrin reagent-based method

Int. J. Mol. Sci. 2022, 23, 660 18 of 23
was used for free proline estimation [74]. Lipid peroxidation was calculated by estimat-ing the malondialdehyde (MDA) content that was extracted in 0.1% trichloroaceatic acidsolution followed by derivatization with 0.65% thiobarbituric acid in 20% trichloroaceticacid [75].
A ~1 g leaf sample was homogenized in liquid nitrogen before extracting total proteinin 10 mL of ice-cold protein extraction buffer (50 mM phosphate buffer, pH 7.0; 1 mMEDTA, pH 8.0; 0.05% w/v Triton x-100 and 5% w/v PVPP). The total protein concentrationin the extract was determined using the Bradford method; the same protein extract wasused to determine the antioxidant enzyme activities, including catalase (CAT), superoxidedismutase (SOD), glutathione reductase (GR), and ascorbate peroxidase (APX).
The SOD activity was measured by monitoring the photo-reduction of NBT [76], withone unit of SOD activity considered to inhibit 50% photo-reduction of NBT. The CATactivity was measured following Miyagawa et al. [77]; briefly, 20 µg protein was addedto the reaction mixture (10 mM H2O2, 50 mM potassium phosphate buffer, pH 7.0), withthe decrease in absorbance at 240 nm recorded for 2 min. The APX activity was measuredfollowing Nakano and Asada [78]; briefly, H2O2 was added to initiate the reaction in thereaction mixture (0.5 mM ascorbic acid, 0.1 mM H2O2, 50 µg of protein enzyme extract,and 50 mM potassium phosphate), with the decrease in absorbance at 290 nm recorded for1 min. The GR activity was determined by observing the rate of reduction of DTNB; briefly,NADPH was added to the reaction mixture (1 mM EDTA, 1 mM oxidized glutathione(GSSG), 0.75 mM DTNB, 0.1 mM NADPH, 40 µg protein, and 100 mM potassium phosphate,pH 7.5), with the increase in absorbance at 412 nm recorded for 3 min [79].
4.7. Transcript Profiling of Antioxidant Enzymes Encoding Genes
Total RNA was isolated from the control and stressed plant samples using PureLinkPlant RNA Reagent (Invitrogen, Waltham, MA, USA) and quantified with a Nanodropspectrophotometer (NanoDrop, Wilmington, DE, USA). The cDNA was prepared using aQiagen first-strand cDNA synthesis kit. Quantitative real-time PCR (qRT-PCR) reactionswere carried out with gene-specific primers, with actin used as the internal reference gene(Supplementary Table S3). The qRT-PCR data were analyzed using the comparative CTmethod, with the relative fold-gene expression (2−∆∆CT) of APX, SOD, and CAT genesdetermined after normalizing their expression with internal control actin CT-values [80].
4.8. Total Antioxidant, Scavenging, and Reducing Activities
The antioxidant potency of the plant extract was determined by estimating the inhi-bition of free cationic radicals of ABTS (2,2-azino-bis(3-ethylbenzothiazoline-6-sulphonicacid)) compared to Trolox (6-hydroxy-2,5,7,8-tetramethylchroman-2-carboxylic acid) usedas the standard. ABTS free radicals were generated by mixing ABTS diammonium salt(7 mM) and potassium persulfate (2.45 mM), followed by incubation at ambient tempera-ture for 12–16 h in the dark. The absorbance was set to ~0.70 ± 0.02 by diluting the reactionmixture with water at 734 nm. Different concentrations (100–500 µg mL−1) of plant extractwere mixed with 1 mL ABTS ions and incubated for 90 min before recording absorbance at734 nm; the total antioxidant activity was expressed as percentage inhibition [81,82].
The scavenging activity was measured as percent inhibition of DPPH (2,2-diphenyl-1-picrylhydrazyl) free radicals. A DPPH solution containing methanol (0.024% w/v) wasdiluted to read 0.98 ± 0.02 absorbance at 517 nm, before mixing about 1 mL with variousconcentrations (100–500 µg/mL) of plant extract; the percentage radical scavenging activitywas compared with the control at 517 nm [83–85].
For reducing activity, 1 mL phosphate buffer (0.2 M, pH 6.6) and 1 mL potassiumferricyanide (K3Fe(CN)6; 10 mg mL−1) were mixed with ascorbic acid or different concen-trations (100–500 µg mL−1) of plant extract and incubated in a 50 ◦C water bath for 20 min.The reaction was terminated by adding trichloroacetic acid before centrifuging at 7000× gfor 10 min at room temperature. About 1 mL of the supernatant was blended with freshly

Int. J. Mol. Sci. 2022, 23, 660 19 of 23
prepared 0.2 mL ferric chloride (0.1%, w/v) and incubated at room temperature for 10 min,before measuring the absorbance at 700 nm [86,87].
4.9. Total Phenolic and Flavonoid Contents
The total phenolic content (TPC) and total flavonoid content (TFC) were calculatedusing standard gallic acid and quercetine that was equivalent per 100 mg of extract, respec-tively [88]. For TPC, different amounts (100–500 µg mL−1) of plant extract were combinedwith Folin-Coicalteu reagent (0.2 M) and incubated for 5 min, before adding 2 mL sodiumcarbonate (Na2CO3; 75 g L−1), and reading the absorbance after dark incubation for 90 min.For TFC, different concentrations (100–500 µg mL−1) of plant extract were mixed with0.3 mL sodium nitrite (NaNO2, 5%, w/v) and incubated at ambient temperature for 5 min.The absorbance of the reaction mixture was read at 510 nm after adding 0.3 mL aluminumchloride (AlCl3, 10%, w/v) and 2 mL sodium hydroxide (NaOH, 1 M).
4.10. Metabolite Profiling
Metabolite profiling of the plant samples was performed using GC-MS (gaschromatography-mass spectroscopy). The plant leaves (100 mg) were powdered in liquidnitrogen using a mortar and pestle for metabolite extraction using ice-cold methanol [89,90].The extracted metabolites were derivatized using methoxyamine hydrochloride and MSTFA(N-methyl-N-(trimethylsilyl) trifluoroacetamide). Ribitol/adonitol (6 µg) was used as aninternal standard. The GC analysis was performed using 1 µL sample in a flame ionizationdetection (FID)/capillary column that was equipped with an autosampler (AOC-5000,Shimadzu, Japan). The peaks were identified and verified by comparison with the libraryof mass spectra (NIST) and quantified using the internal standard.
4.11. Statistical Analysis
Each experimental set comprised of data from three biological replicates. The datawere expressed as the mean ± SE and analysis of variance (ANOVA) was used to determinesignificant differences between the treatments using IBM SPSS ver. 27. For multiple meanscomparison, LSD was used, with p < 0.05 considered statistically significant. MetaboAnalystver. 5.0 was used for the pathway enrichment, PLS-DA, and correlation analyses.
5. Conclusions
The combined abiotic stresses affected the physio-biochemical and metabolic pathwaysin peanut plants more than the conventionally studied individual stresses, suggesting theneed to emphasize stress combinations to validate newly developed peanut cultivars.Moreover, the metabolomics data revealed the differential accumulation of importantmetabolites (pinitol, malic acid, and xylopyranose) under abiotic stress conditions. In thefuture, key genes of these biosynthesis pathways should be functionally validated undercombined stress conditions to confirm their precise role in the combined stress tolerancemechanism. Superior peanut cultivars with abiotic stress tolerance can be developedusing identified molecular phenotypes and traditional breeding or genetic engineering. Inconclusion, this study provides a new perspective for crop improvement programs underthe changing climate. Future studies could identify the stressor markers that are unique tothe stress and independent of the cultivar to infer a model to detect resistant phenotypesamong different varieties.
Supplementary Materials: The following are available online at https://www.mdpi.com/article/10.3390/ijms23020660/s1.
Author Contributions: Conceptualization and designing: A.M.; Perform the experiments and dataacquisition: J.P., D.K., B.C., D.A., R.K.J., B.T. and S.Y.; Analysis and interpretation: J.P. and A.M.;Writing of the article: J.P., A.M., R.K.V. and K.H.M.S.; supervision, A.M.; funding acquisition forOA support, R.K.V. and K.H.M.S. All authors have read and agreed to the published version ofthe manuscript.

Int. J. Mol. Sci. 2022, 23, 660 20 of 23
Funding: The APC was funded by the University of Western Australia.
Institutional Review Board Statement: Not applicable.
Informed Consent Statement: Not applicable.
Data Availability Statement: Not applicable.
Acknowledgments: J.P. and B.C. are thankful to UGC for research fellowship. AESD&CIF of the Insti-tute (CSIR-CSMCRI) is duly acknowledged for running the samples. CSIR-CSMCRI CommunicationNo. is PRIS-236/2021.
Conflicts of Interest: The authors declare no conflict of interest.
References1. Patel, J.; Mishra, A. Genome editing: Advances and prospects. In Plant Biotechnology: Progress in Genomic Era; Khurana, S.M.P.,
Gaur, R.K., Eds.; Springer: Singapore, 2019; pp. 147–174. [CrossRef]2. Choudhury, F.K.; Rivero, R.M.; Blumwald, E.; Mittler, R. Reactive oxygen species, abiotic stress and stress combination. Plant J.
2017, 90, 856–867. [CrossRef]3. Gill, R.A.; Ahmar, S.; Ali, B.; Saleem, M.H.; Khan, M.U.; Zhou, W.; Liu, S. The Role of Membrane Transporters in Plant Growth
and Development, and Abiotic Stress Tolerance. Int. J. Mol. Sci. 2021, 22, 12792. [CrossRef]4. Imran, M.; Sun, X.; Hussain, S.; Ali, U.; Rana, M.S.; Rasul, F.; Saleem, M.H.; Moussa, M.G.; Bhantana, P.; Afzal, J.; et al.
Molybdenum-Induced Effects on Nitrogen Metabolism Enzymes and Elemental Profile of Winter Wheat (Triticum aestivum L.)Under Different Nitrogen Sources. Int. J. Mol. Sci. 2019, 20, 3009. [CrossRef]
5. Kamran, M.; Parveen, A.; Ahmar, S.; Malik, Z.; Hussain, S.; Chattha, M.S.; Saleem, M.H.; Adil, M.; Heidari, P.; Chen, J.-T.An Overview of Hazardous Impacts of Soil Salinity in Crops, Tolerance Mechanisms, and Amelioration through SeleniumSupplementation. Int. J. Mol. Sci. 2020, 21, 148. [CrossRef] [PubMed]
6. Nawaz, M.; Wang, X.; Saleem, M.H.; Khan, M.H.U.; Afzal, J.; Fiaz, S.; Ali, S.; Ishaq, H.; Khan, A.H.; Rehman, N.; et al. DecipheringPlantago ovata Forsk Leaf Extract Mediated Distinct Germination, Growth and Physio-Biochemical Improvements under WaterStress in Maize (Zea mays L.) at Early Growth Stage. Agronomy 2021, 11, 1404. [CrossRef]
7. Alam, H.; Khattak, J.Z.K.; Ksiksi, T.S.; Saleem, M.H.; Fahad, S.; Sohail, H.; Ali, Q.; Zamin, M.; El-Esawi, M.A.; Saud, S. Negativeimpact of long-term exposure of salinity and drought stress on native Tetraena mandavillei L. Physiol. Plant. 2020, 172, 1336–1351.[CrossRef] [PubMed]
8. Ghafar, M.A.; Akram, N.A.; Saleem, M.H.; Wang, J.; Wijaya, L.; Alyemeni, M.N. Ecotypic Morphological and Physio-BiochemicalResponses of Two Differentially Adapted Forage Grasses, Cenchrus ciliaris L. and Cyperus arenarius Retz. to Drought Stress.Sustainability 2021, 13, 8069. [CrossRef]
9. Cohen, I.; Zandalinas, S.I.; Fritschi, F.B.; Sengupta, S.; Fichman, Y.; Azad, R.K.; Mittler, R. The impact of water deficit and heatstress combination on the molecular response, physiology, and seed production of soybean. Physiol. Plant. 2021, 172, 41–52.[CrossRef]
10. Patel, J.; Mishra, A. Plant aquaporins alleviate drought tolerance in plants by modulating cellular biochemistry, root-architecture,and photosynthesis. Physiol. Plant. 2021, 172, 1030–1044. [CrossRef] [PubMed]
11. Pandey, V.; Tiwari, D.C.; Dhyani, V.; Bhatt, I.D.; Rawal, R.S.; Nandi, S.K. Physiological and metabolic changes in two Himalayanmedicinal herbs under drought, heat and combined stresses. Physiol. Mol. Biol. Plants 2021, 27, 1523–1538. [CrossRef]
12. Yasmin, H.; Bano, A.; Wilson, N.L.; Nosheen, A.; Naz, R.; Hassan, M.N.; Ilyas, N.; Saleem, M.H.; Noureldeen, A.; Ahmad, P.; et al.Drought-tolerant Pseudomonas sp. showed differential expression of stress-responsive genes and induced drought tolerance inArabidopsis thaliana. Physiol. Plant. 2021. [CrossRef] [PubMed]
13. Sinha, R.; Fritschi, F.B.; Zandalinas, S.I.; Mittler, R. The impact of stress combination on reproductive processes in crops. Plant Sci.2021, 311, 111007. [CrossRef]
14. Fábián, A.; Sáfrán, E.; Szabó-Eitel, G.; Barnabás, B.; Jäger, K. Stigma Functionality and Fertility Are Reduced by Heat and DroughtCo-stress in Wheat. Front. Plant Sci. 2019, 10, 244. [CrossRef] [PubMed]
15. Liu, X.; Wang, X.; Wang, X.; Gao, J.; Luo, N.; Meng, Q.; Wang, P. Dissecting the critical stage in the response of maize kernel set toindividual and combined drought and heat stress around flowering. Environ. Exp. Bot. 2020, 179, 104213. [CrossRef]
16. Patel, M.K.; Mishra, A.; Jha, B. Untargeted metabolomics of halophytes. In Marine Omics: Principles and Applications; Kim, S.K., Ed.;Taylor & Francis Group, CRC Press: Boca Raton, FL, USA, 2016; pp. 309–325. [CrossRef]
17. Lawas, L.M.F.; Li, X.; Erban, A.; Kopka, J.; Jagadish, S.V.K.; Zuther, E.; Hincha, D.K. Metabolic responses of rice cultivars withdifferent tolerance to combined drought and heat stress under field conditions. GigaScience 2019, 8, giz050. [CrossRef]
18. Correia, B.; Hancock, R.D.; Amaral, J.; Gomez-Cadenas, A.; Valledor, L.; Pinto, G. Combined Drought and Heat ActivatesProtective Responses in Eucalyptus globulus That Are Not Activated When Subjected to Drought or Heat Stress Alone. Front. PlantSci. 2018, 9, 819. [CrossRef]

Int. J. Mol. Sci. 2022, 23, 660 21 of 23
19. Sprenger, H.; Erban, A.; Seddig, S.; Rudack, K.; Thalhammer, A.; Le, M.Q.; Walther, D.; Zuther, E.; Köhl, K.I.; Kopka, J.; et al.Metabolite and transcript markers for the prediction of potato drought tolerance. Plant Biotechnol. J. 2018, 16, 939–950. [CrossRef][PubMed]
20. Templer, S.E.; Ammon, A.; Pscheidt, D.; Ciobotea, O.; Schuy, C.; McCollum, C.; Sonnewald, U.; Hanemann, A.; Förster, J.;Ordon, F.; et al. Metabolite profiling of barley flag leaves under drought and combined heat and drought stress reveals metabolicQTLs for metabolites associated with antioxidant defense. J. Exp. Bot. 2017, 68, 1697–1713. [CrossRef] [PubMed]
21. Jha, B.; Mishra, A.; Chaturvedi, A. Engineering stress tolerance in peanut (Arachis hypogaea L.). In Genetically Modified Organisms(GMO) Foods: Production, Regulation and Public Health; Watson, R., Preedy, V.R., Eds.; Academic Press, Elsevier: San Diego, CA,USA, 2016; pp. 305–311. [CrossRef]
22. Azevedo Neto, A.D.; Nogueira, R.J.M.C.; Melo Filho, P.A.; Santos, R.C. Physiological and biochemical responses of peanutgenotypes to water deficit. J. Plant Interact. 2010, 5, 1–10. [CrossRef]
23. Gundaraniya, S.A.; Ambalam, P.S.; Tomar, R.S. Metabolomic Profiling of Drought-Tolerant and Susceptible Peanut (Arachishypogaea L.) Genotypes in Response to Drought Stress. ACS Omega 2020, 5, 31209–31219. [CrossRef]
24. Sharma, S.; Choudhary, B.; Yadav, S.; Mishra, A.; Mishra, V.K.; Chand, R.; Chen, C.; Pandey, S.P. Metabolite profiling identifiedpipecolic acid as an important component of peanut seed resistance against Aspergillus flavus infection. J. Hazard. Mater. 2021,404, 124155. [CrossRef] [PubMed]
25. Singh, N.; Mishra, A.; Jha, B. Over-expression of the peroxisomal ascorbate peroxidase (SbpAPX) gene cloned from halophyteSalicornia brachiata confers salt and drought stress tolerance in transgenic tobacco. Mar. Biotechnol. 2014, 16, 321–332. [CrossRef][PubMed]
26. Singh, N.; Mishra, A.; Jha, B. Ectopic over-expression of peroxisomal ascorbate peroxidase (SbpAPX) gene confers salt stresstolerance in transgenic peanut (Arachis hypogaea). Gene 2014, 547, 119–125. [CrossRef]
27. Cui, F.; Sui, N.; Duan, G.; Liu, Y.; Han, Y.; Liu, S.; Wan, S.; Li, G. Identification of Metabolites and Transcripts Involved in SaltStress and Recovery in Peanut. Front. Plant Sci. 2018, 9, 217. [CrossRef]
28. Raval, S.S.; Mahatma, M.K.; Chakraborty, K.; Bishi, S.K.; Singh, A.L.; Rathod, K.J.; Jadav, J.K.; Sanghani, J.M.; Mandavia, M.K.;Gajera, H.P.; et al. Metabolomics of groundnut (Arachis hypogaea L.) genotypes under varying temperature regimes. Plant GrowthRegul. 2017, 84, 493–505. [CrossRef]
29. Jha, R.K.; Mishra, A. Introgression of SbERD4 gene encodes an early-responsive dehydration-stress protein that confers toleranceagainst different types of abiotic stresses in transgenic tobacco. Cells 2022, 11, 62. [CrossRef]
30. World Agricultural Production. Available online: https://www.fas.usda.gov/data/world-agricultural-production (accessed on13 December 2021).
31. Tiwari, V.; Chaturvedi, A.K.; Mishra, A.; Jha, B. Introgression of the SbASR-1 Gene Cloned from a Halophyte Salicornia brachiataEnhances Salinity and Drought Endurance in Transgenic Groundnut (Arachis hypogaea) and Acts as a Transcription Factor. PLoSONE 2015, 10, e0131567. [CrossRef] [PubMed]
32. Kadiyala, M.D.M.; Nedumaran, S.; Padmanabhan, J.; Gumma, M.K.; Gummadi, S.; Srigiri, S.R.; Robertson, R.; Whitbread, A.Modeling the potential impacts of climate change and adaptation strategies on groundnut production in India. Sci. Total Environ.2021, 776, 145996. [CrossRef]
33. Ashraf, M.A.; Akbar, A.; Askari, S.H.; Iqbal, M.; Rasheed, R.; Hussain, I. Recent Advances in Abiotic Stress Tolerance of Plantsthrough Chemical Priming: An Overview. In Advances in Seed Priming; Rakshit, A., Singh, H., Eds.; Springer: Singapore, 2018.[CrossRef]
34. Ashraf, M.A.; Asma, H.F.; Iqbal, M. Exogenous menadione sodium bisulfite mitigates specific ion toxicity and oxidative damagein salinity-stressed okra (Abelmoschus esculentus Moench). Acta Physiol. Plant. 2019, 41, 187. [CrossRef]
35. Patel, J.; Mishra, A. Role of sodium proton antiporters in cellular homeostasis of plants under abiotic stress conditions. InTransporters and Plant Osmotic Stress; Roychoudhury, A., Tripathi, D.K., Deshmukh, R., Eds.; Academic Press: San Diego, CA, USA;Elsevier: San Diego, CA, USA, 2021; pp. 273–290. [CrossRef]
36. Jha, R.K.; Patel, J.; Patel, M.K.; Mishra, A.; Jha, B. Introgression of a novel cold and drought regulatory-protein encodingCORA-like gene, SbCDR, induced osmotic tolerance in transgenic tobacco. Physiol. Plant. 2021, 172, 1170–1188. [CrossRef]
37. Koca, H.; Bor, M.; Özdemir, F.; Türkan, I. The effect of salt stress on lipid peroxidation, antioxidative enzymes and proline contentof sesame cultivars. Environ. Exp. Bot. 2007, 60, 344–351. [CrossRef]
38. Sui, N.; Wang, Y.; Liu, S.; Yang, Z.; Wang, F.; Wan, S. Transcriptomic and Physiological Evidence for the Relationship betweenUnsaturated Fatty Acid and Salt Stress in Peanut. Front. Plant Sci. 2018, 9, 7. [CrossRef]
39. Anderson, J.V.; Davis, D.G. Abiotic stress alters transcript profiles and activity of glutathione S-transferase, glutathione peroxidase,and glutathione reductase in Euphorbia esula. Physiol. Plant. 2004, 120, 421–433. [CrossRef]
40. Jha, R.K.; Patel, J.; Mishra, A.; Jha, B. Introgression of halophytic salt stress-responsive genes for developing stress tolerance incrop plants. In Halophytes and Climate Change: Adaptive Mechanisms and Potential Uses; Hasanuzzaman, M., Shabala, S., Fujita, M.,Eds.; CABI: Wallingford, UK, 2019; pp. 275–286. [CrossRef]
41. Mutava, R.N.; Prince, S.J.K.; Syed, N.H.; Song, L.; Valliyodan, B.; Chen, W.; Nguyen, H.T. Understanding abiotic stress tolerancemechanisms in soybean: A comparative evaluation of soybean response to drought and flooding stress. Plant Physiol. Biochem.2015, 86, 109–120. [CrossRef] [PubMed]

Int. J. Mol. Sci. 2022, 23, 660 22 of 23
42. Sperdouli, I.; Moustakas, M. Interaction of proline, sugars, and anthocyanins during photosynthetic acclimation of Arabidopsisthaliana to drought stress. J. Plant Physiol. 2012, 169, 577–585. [CrossRef] [PubMed]
43. Mfarrej, M.F.B.; Wang, X.; Saleem, M.H.; Hussain, I.; Rasheed, R.; Ashraf, M.A.; Iqbal, M.; Chattha, M.S.; Alyemeni, M.N.Hydrogen sulphide and nitric oxide mitigate the negative impacts of waterlogging stress on wheat (Triticum aestivum L.). PlantBiol. 2021. [CrossRef]
44. Dobra, J.; Motyka, V.; Dobrev, P.; Malbeck, J.; Prasil, I.T.; Haisel, D.; Gaudinova, A.; Havlova, M.; Gubis, J.; Vankova, R.Comparison of hormonal responses to heat, drought and combined stress in tobacco plants with elevated proline content. J. PlantPhysiol. 2010, 167, 1360–1370. [CrossRef]
45. El Moukhtari, A.; Cabassa-Hourton, C.; Farissi, M.; Savouré, A. How Does Proline Treatment Promote Salt Stress ToleranceDuring Crop Plant Development? Front. Plant Sci. 2020, 11, 1127. [CrossRef]
46. Nguyen, Q.H.; Vu, L.T.K.; Nguyen, L.T.N.; Pham, N.T.T.; Nguyen, Y.T.H.; Le, S.V.; Chu, M.H. Overexpression of the GmDREB6gene enhances proline accumulation and salt tolerance in genetically modified soybean plants. Sci. Rep. 2019, 9, 19663. [CrossRef][PubMed]
47. Guan, C.; Huang, Y.H.; Cui, X.; Liu, S.J.; Zhou, Y.Z.; Zhang, Y.W. Overexpression of gene encoding the key enzyme involved inproline-biosynthesis (PuP5CS) to improve salt tolerance in switchgrass (Panicum virgatum L.). Plant Cell Rep. 2018, 37, 1187–1199.[CrossRef]
48. Hildebrandt, T.M. Synthesis versus degradation: Directions of amino acid metabolism during Arabidopsis abiotic stress response.Plant Mol. Biol. 2018, 98, 121–135. [CrossRef]
49. Naikoo, M.I.; Dar, M.I.; Raghib, F.; Jaleel, H.; Ahmad, B.; Raina, A.; Khan, F.A.; Naushin, F. Role and Regulation of Plants Phenolicsin Abiotic Stress Tolerance. In Plant Signaling Molecules; Khan, M.I., Reddy, P.S., Ferrante, A., Khan, N.A., Eds.; WoodheadPublishing: Cambridge, UK, 2019; pp. 157–168.
50. Kowalczewski, P.L.; Radzikowska, D.; Ivanisova, E.; Szwengiel, A.; Kacaniova, M.; Sawinska, Z. Influence of Abiotic StressFactors on the Antioxidant Properties and Polyphenols Profile Composition of Green Barley (Hordeum vulgare L.). Int. J. Mol. Sci.2020, 21, 397. [CrossRef] [PubMed]
51. Demirel, U.; Morris, W.L.; Ducreux, L.J.M.; Yavuz, C.; Asim, A.; Tindas, I.; Campbell, R.; Morris, J.A.; Verrall, S.R.; Hedley, P.E.;et al. Physiological, Biochemical, and Transcriptional Responses to Single and Combined Abiotic Stress in Stress-Tolerant andStress-Sensitive Potato Genotypes. Front. Plant Sci. 2020, 11, 169. [CrossRef] [PubMed]
52. Bankaji, I.; Sleimi, N.; López-Climent, M.F.; Perez-Clemente, R.M.; Gomez-Cadenas, A. Effects of Combined Abiotic Stresses onGrowth, Trace Element Accumulation, and Phytohormone Regulation in Two Halophytic Species. J. Plant Growth Regul. 2014, 33,632–643. [CrossRef]
53. Xie, Y.; Sun, X.; Feng, Q.; Luo, H.; Wassie, M.; Amee, M.; Amombo, E.; Chen, L. Comparative physiological and metabolomicanalyses reveal mechanisms of Aspergillus aculeatus-mediated abiotic stress tolerance in tall fescue. Plant Physiol. Biochem. 2019,142, 342–350. [CrossRef] [PubMed]
54. Tahjib-Ul-Arif, M.; Zahan, M.I.; Karim, M.M.; Imran, S.; Hunter, C.T.; Islam, M.S.; Mia, M.A.; Hannan, M.A.; Rhaman, M.S.;Hossain, M.A.; et al. Citric Acid-Mediated Abiotic Stress Tolerance in Plants. Int. J. Mol. Sci. 2021, 22, 7235. [CrossRef] [PubMed]
55. Blume, C.; Ost, J.; Mühlenbruch, M.; Peterhänsel, C.; Laxa, M. Low CO2 induces urea cycle intermediate accumulation inArabidopsis thaliana. PLoS ONE 2019, 14, e0210342. [CrossRef]
56. Kalamaki, M.S.; Merkouropoulos, G.; Kanellis, A.K. Can ornithine accumulation modulate abiotic stress tolerance in Arabidopsis?Plant Signal. Behav. 2009, 4, 1099–1101. [CrossRef]
57. Shi, H.; Ye, T.; Chen, F.; Cheng, Z.; Wang, Y.; Yang, P.; Zhang, Y.; Chan, Z. Manipulation of arginase expression modulates abioticstress tolerance in Arabidopsis: Effect on arginine metabolism and ROS accumulation. J. Exp. Bot. 2013, 64, 1367–1379. [CrossRef]
58. Song, Q.; Joshi, M.; DiPiazza, J.; Joshi, V. Functional Relevance of Citrulline in the Vegetative Tissues of Watermelon duringAbiotic Stresses. Front. Plant Sci. 2020, 11, 512. [CrossRef]
59. Ravi, S.; Young, T.; Macinnis-Ng, C.; Nyugen, T.V.; Duxbury, M.; Alfaro, A.C.; Leuzinger, S. Untargeted metabolomics inhalophytes: The role of different metabolites in New Zealand mangroves under multi-factorial abiotic stress conditions. Environ.Exp. Bot. 2020, 173, 103993. [CrossRef]
60. Eom, S.H.; Baek, S.-A.; Kim, J.K.; Hyun, T.K. Transcriptome Analysis in Chinese Cabbage (Brassica rapa ssp. pekinensis) Providesthe Role of Glucosinolate Metabolism in Response to Drought Stress. Molecules 2018, 23, 1186. [CrossRef]
61. Zhang, G.Y.; Liu, R.R.; Zhang, C.Q.; Tang, K.X.; Sun, M.F.; Yan, G.H.; Liu, Q.Q. Manipulation of the Rice L-Galactose Pathway:Evaluation of the Effects of Transgene Overexpression on Ascorbate Accumulation and Abiotic Stress Tolerance. PLoS ONE 2015,10, e0125870. [CrossRef]
62. Rosa, M.; Prado, C.; Podazza, G.; Interdonato, R.; González, J.A.; Hilal, M.; Prado, F.E. Soluble sugars. Plant Signal. Behav. 2009, 4,388–393. [CrossRef]
63. Jaleel, C.A.; Gopi, R.; Manivannan, P.; Gomathinayagam, M.; Sridharan, R.; Panneerselvam, R. Antioxidant potential and indolealkaloid profile variations with water deficits along different parts of two varieties of Catharanthus roseus. Colloids Surf. BBiointerfaces 2008, 62, 312–318. [CrossRef] [PubMed]
64. Alexander, A.; Singh, V.K.; Mishra, A. Halotolerant PGPR Stenotrophomonas maltophilia BJ01 Induces Salt Tolerance byModulating Physiology and Biochemical Activities of Arachis hypogaea. Front. Microbiol. 2020, 11, 568289. [CrossRef] [PubMed]

Int. J. Mol. Sci. 2022, 23, 660 23 of 23
65. Alexander, A.; Singh, V.K.; Mishra, A. Interaction of the novel bacterium Brachybacterium saurashtrense JG06 with Arachishypogaea leads to changes in physio-biochemical activity of plants to cope with nitrogen starvation conditions. Plant Physiol.Biochem. 2021, 166, 974–984. [CrossRef] [PubMed]
66. Lutts, S. NaCl-induced Senescence in Leaves of Rice (Oryza sativa L.) Cultivars Differing in Salinity Resistance. Ann. Bot. 1996, 78,389–398. [CrossRef]
67. Chamovitz, D.; Sandmann, G.; Hirschberg, J. Molecular and biochemical characterization of herbicide-resistant mutants ofcyanobacteria reveals that phytoene desaturation is a rate-limiting step in carotenoid biosynthesis. J. Biol. Chem. 1993, 268,17348–17353. [CrossRef]
68. Inskeep, W.P.; Bloom, P.R. Extinction Coefficients of Chlorophyll a and b in N,N-Dimethylformamide and 80% Acetone 1. PlantPhysiol. 1985, 77, 483–485. [CrossRef]
69. Patel, M.K.; Pandey, S.; Patel, J.; Mishra, A. A type 2 metallothionein (SbMT-2) gene cloned from Salicornia brachiata confersenhanced Zn stress-tolerance in transgenic tobacco by transporting Zn2+ and maintaining photosynthesis efficacy. Environ. Exp.Bot. 2021, 191, 104626. [CrossRef]
70. Sugano, N.; Tanaka, T.; Yamamoto, E.; Nishi, A. Behaviour of phenylalanine ammonia-lyase in carrot cells in suspension cultures.Phytochemistry 1975, 14, 2435–2436. [CrossRef]
71. Chandler, S.F.; Dodds, J.H. The effect of phosphate, nitrogen and sucrose on the production of phenolics and solasodine in calluscultures of Solanum laciniatum. Plant Cell Rep. 1983, 2, 205–208. [CrossRef]
72. Miller, G.L. Use of Dinitrosalicylic Acid Reagent for Determination of Reducing Sugar. Anal. Chem. 1959, 31, 426–428. [CrossRef]73. Yemm, E.W.; Willis, A.J. The estimation of carbohydrates in plant extracts by anthrone. Biochem. J. 1954, 57, 508–514. [CrossRef]74. Bates, L.S.; Waldren, R.P.; Teare, I.D. Rapid determination of free proline for water-stress studies. Plant Soil 1973, 39, 205–207.
[CrossRef]75. Draper, H.H.; Hadley, M. Malondialdehyde determination as index of lipid Peroxidation. In Methods in Enzymology; Academic
Press: Cambridge, MA, USA, 1990; Volume 186, pp. 421–431.76. Beyer, W.F.; Fridovich, I. Assaying for superoxide dismutase activity: Some large consequences of minor changes in conditions.
Anal. Biochem. 1987, 161, 559–566. [CrossRef]77. Miyagawa, Y.; Tamoi, M.; Shigeoka, S. Evaluation of the Defense System in Chloroplasts to Photooxidative Stress Caused
by Paraquat Using Transgenic Tobacco Plants Expressing Catalase from Escherichia coli. Plant Cell Physiol. 2000, 41, 311–320.[CrossRef]
78. Nakano, Y.; Asada, K. Hydrogen Peroxide is Scavenged by Ascorbate-specific Peroxidase in Spinach Chloroplasts. Plant CellPhysiol. 1981, 22, 867–880. [CrossRef]
79. Smith, I.K.; Vierheller, T.L.; Thorne, C.A. Assay of glutathione reductase in crude tissue homogenates using 5,5’-dithiobis(2-nitrobenzoic acid). Anal. Biochem. 1988, 175, 408–413. [CrossRef]
80. Schmittgen, T.D.; Livak, K.J. Analyzing real-time PCR data by the comparative CT method. Nat. Protoc. 2008, 3, 1101–1108.[CrossRef] [PubMed]
81. Tanna, B.; Choudhary, B.; Mishra, A.; Chauhan, O.P.; Patel, M.K.; Shokralla, S.; El-Abedin, T.K.Z.; Elansary, H.O.; Mahmoud, E.A.Antioxidant, Scavenging, Reducing, and Anti-Proliferative Activities of Selected Tropical Brown Seaweeds Confirm the Nutraceu-tical Potential of Spatoglossum asperum. Foods 2021, 10, 2482. [CrossRef]
82. Tanna, B.; Mishra, A. Metabolomics of seaweeds: Tools and techniques. In Plant Metabolites and Regulation under EnvironmentalStress; Ahmad, P., Ahanger, M.A., Singh, V.P., Tripathi, D.K., Alam, P., Alyemeni, M.N., Eds.; Academic Press: Cambridge, MA,USA, 2018; pp. 37–52. [CrossRef]
83. Mishra, A.; Patel, M.K.; Jha, B. Non-targeted metabolomics and scavenging activity of reactive oxygen species reveal the potentialof Salicornia brachiata as a functional food. J. Funct. Foods 2015, 13, 21–31. [CrossRef]
84. Patel, M.K.; Mishra, A.; Jha, B. Non-targeted Metabolite Profiling and Scavenging Activity Unveil the Nutraceutical Potential ofPsyllium (Plantago ovata Forsk). Front. Plant Sci. 2016, 7, 431. [CrossRef] [PubMed]
85. Patel, M.K.; Tanna, B.; Mishra, A.; Jha, B. Physicochemical characterization, antioxidant and anti-proliferative activities of apolysaccharide extracted from psyllium (P. ovata) leaves. Int. J. Biol. Macromol. 2018, 118, 976–987. [CrossRef] [PubMed]
86. Patel, M.K.; Tanna, B.; Gupta, H.; Mishra, A.; Jha, B. Physicochemical, scavenging and anti-proliferative analyses of polysaccha-rides extracted from psyllium (Plantago ovata Forssk) husk and seeds. Int. J. Biol. Macromol. 2019, 133, 190–201. [CrossRef]
87. Tanna, B.; Choudhary, B.; Mishra, A. Metabolite profiling, antioxidant, scavenging and anti-proliferative activities of selectedtropical green seaweeds reveal the nutraceutical potential of Caulerpa spp. Algal Res. 2018, 36, 96–105. [CrossRef]
88. Tanna, B.; Brahmbhatt, H.R.; Mishra, A. Phenolic, flavonoid, and amino acid compositions reveal that selected tropical seaweedshave the potential to be functional food ingredients. J. Food Process. Preserv. 2019, 43, e14266. [CrossRef]
89. Patel, M.K.; Mishra, A.; Jaiswar, S.; Jha, B. Metabolic profiling and scavenging activities of developing circumscissile fruit ofpsyllium (Plantago ovata Forssk.) reveal variation in primary and secondary metabolites. BMC Plant Biol. 2020, 20, 116. [CrossRef]
90. Yadav, S.; Elansary, H.O.; Mattar, M.A.; Elhindi, K.M.; Alotaibi, M.A.; Mishra, A. Differential Accumulation of Metabolitesin Suaeda Species Provides New Insights into Abiotic Stress Tolerance in C4-Halophytic Species in Elevated CO2 Conditions.Agronomy 2021, 11, 131. [CrossRef]