Excess and Restraint in The Indian Blood Donation Experience

Differential effect of long-term leucine supplementationon skeletal muscle and adipose tissue in old rats: an insulinsignaling pathway approach
Gilbert Zeanandin & Michèle Balage &
Stéphane M. Schneider & Joëlle Dupont &Xavier Hébuterne & Isabelle Mothe-Satney &
Dominique Dardevet
Received: 8 October 2010 /Accepted: 24 February 2011# American Aging Association 2011
Abstract Leucine acts as a signal nutrient in promotingprotein synthesis in skeletal muscle and adipose tissuevia mTOR pathway activation, and may be of interest inage-related sarcopenia. However, hyper-activation ofmTOR/S6K1 has been suggested to inhibit the firststeps of insulin signaling and finally promote insulinresistance. The impact of long-term dietary leucinesupplementation on insulin signaling and sensitivitywas investigated in old rats (18 months old) fed a 15%protein diet supplemented (LEU group) or not (C group)with 4.5% leucine for 6 months. The resulting effects onmuscle and fat were examined. mTOR/S6K1 signalingpathway was not significantly altered in muscle fromold rats subjected to long-term dietary leucine excess,whereas it was increased in adipose tissue. Overall
glucose tolerance was not changed but insulin-stimulated glucose transport was improved in musclesfrom leucine-supplemented rats related to improvementin Akt expression and phosphorylation in response tofood intake. No change in skeletal muscle mass wasobserved, whereas perirenal adipose tissue mass accu-mulated (+45%) in leucine-supplemented rats. A pro-longed leucine supplementation in old rats differentlymodulates mTOR/S6K pathways in muscle and adiposetissue. It does not increase muscle mass but seems topromote hypertrophy and hyperplasia of adipose tissuethat did not result in insulin resistance.
Keywords Leucine supplementation . Sarcopenia .
Muscle . Adipose tissue . Insulin signaling
AGEDOI 10.1007/s11357-011-9246-0
G. Zeanandin : S. M. Schneider :X. Hébuterne :I. Mothe-SatneyCentre Hospitalier Universitaire de Nice, Pôle Digestif,Nice F-06202, France
G. Zeanandin : S. M. Schneider :X. Hébuterne :I. Mothe-SatneyFaculté de Médecine, Université de Nice Sophia–Antipolis,Nice F-06107, France
G. Zeanandin : S. M. Schneider : I. Mothe-Satney (*)INSERM, U907, IFR50,Nice F-06107, Francee-mail: [email protected]
M. Balage (*) :D. DardevetINRA, Centre Clermont-Ferrand—Theix, UMR 1019,Unité Nutrition Humaine,63122 Saint Genès Champanelle, Francee-mail: [email protected]
M. Balage :D. DardevetUniv Clermont 1, UFR Médecine, UMR 1019 UnitéNutrition Humaine,63001 Clermont-Ferrand, France
J. DupontINRA, UMR 85 Physiologie de la Reproduction et desComportements,37380 Nouzilly, France

Introduction
Aging is frequently associated with major quantita-tive changes in body composition characterized bya decrease in lean body mass (i.e., muscle mass)and an increase in body fat mass. The clinical andfunctional consequences of muscle mass loss(known as sarcopenia) are decreased physical perfor-mance and autonomy of elderly people. The consequen-ces of fat mass accumulation are less obvious but mayplay a major role in the metabolic changes observedwith aging, especially the development of insulinresistance.
The origin of age-related sarcopenia is multifacto-rial (Boirie 2009; Kim et al. 2010), but it has becomeobvious that muscle protein loss during aging may bepartly explained by a decreased ability of muscle torespond appropriately to anabolic stimuli such as foodintake (Mosoni et al. 1995; Dardevet et al. 2002)through a decreased response and/or sensitivity ofprotein synthesis and degradation to physiologic con-centrations of amino acids, especially leucine (Dardevetet al. 2000; Combaret et al. 2005; Cuthbertson et al.2005; Katsanos et al. 2005; Prod’homme et al. 2005;Katsanos et al. 2006). These age-related alterations maybe overcome by dietary leucine supplementation.Indeed, postprandial stimulation of muscle proteinsynthesis and inhibition of protein degradation in oldrats can be restored by leucine-supplemented meals(Dardevet et al. 2002; Rieu et al. 2003; Combaret et al.2005). Similarly, increasing leucine intake has beenshown to improve muscle protein synthesis in theelderly human (Rieu et al. 2006), which can be restoredto that obtained in younger subjects (Katsanos et al.2006). Overall, these data have suggested that increas-ing leucine availability may represent a nutritionalstrategy to limit muscle protein loss during aging.However, a beneficial effect of leucine supplemen-tation on muscle mass in the elderly has not beenclearly demonstrated (Balage and Dardevet 2010).Only Verhoeven et al. (2009) assessed the effect of amid-term (3 months) leucine supplementation onskeletal muscle mass and strength in healthy elderlymen, and reported no beneficial effect of thisnutritional intervention.
The anabolic effect of leucine results in its capacityto stimulate protein synthesis through activation ofcell signaling pathways involving the mammaliantarget of rapamycin complex1 (mTORC1), which
activates two key regulatory proteins involved inthe regulation of translation initiation: p70 S6kinase (S6K1) and 4EBP1 (Vary and Lynch2007). Leucine is also a potent activator of proteinsynthesis in white adipose tissue via the samepathway (Lynch et al. 2002b) suggesting thatleucine supplementation may therefore affect bothmuscle mass and fat mass.
Hyperactivation of the mTORC1→S6K1 pathwayby amino acids has been shown to increase insulinreceptor substrate 1 (IRS1) phosphorylation on serineresidues which in turn may lead to impaired activityof PI3K/Akt, critical kinases implicated in themechanism of insulin action on glucose transportand metabolism (Boura-Halfon and Zick 2009). Thus,it has been hypothesized that amino acids used topromote muscle protein metabolism might in turninhibit the first steps of insulin signaling and finallypromote insulin resistance (Um et al. 2006; Tremblayet al. 2007a). Alternatively, it has also been reportedthat dietary supplements of leucine or branched chainamino acids (BCAA) may improve glucose metabo-lism and overall glucose tolerance especially ininsulin resistant states through multiple mechanismsincluding increasing energy expenditure, food intakeregulation, and increasing glucose–alanine cycle(Layman 2003; Layman and Walker 2006; She et al.2007; Zhang et al. 2007; Jitomir and Willoughby2008). Recently, we reported that short-term leucinesupplementation (5 weeks) in young adult ratsimpaired whole body glucose tolerance but improvedinsulin-stimulated glucose transport in skeletalmuscles (Balage et al. 2011). Leucine is also aprecursor of fatty acids and sterols from its carbox-yskeleton (Odessey and Goldberg 1972; Rosenthal etal. 1974; Frick et al. 1981). Because long-term freeleucine supplementation in elderly has not beenextensively investigated, it is not possible to drawconclusions on the efficacy of leucine to counteractor prevent muscle protein loss during aging.Moreover, contradictory data do not allow conclud-ing whether chronic leucine supplementation maybe beneficial or not on overall glucose toleranceand insulin sensitivity.
This study was thus conducted to examine theimpact of a sustained dietary leucine excess (6 monthsad libitum) on overall glucose tolerance, insulinresponse on muscle glucose transport in vitro, andbody composition in old rats. A special focus was put
AGE
on studying insulin signaling pathways in skeletalmuscle and adipose tissue.
Materials and methods
Animals and diets
This experiment was performed in accordance withthe National Research Council’s Guidelines for theCare and Use of Laboratory Animals (DSV-63-08).Old Wistar rats (18 months old, n=120 at the startof experiment) were maintained in collective cages(three rats per cage) under controlled environmentalconditions (temperature 21°C, hygrometry 55%,12-h dark period starting at 0900 h) with water andfood ad libitum. They were separated into twogroups fed either a control diet (C group) or aleucine-supplemented diet (LEU group) containing15% protein from herring flour, 6% lipids, and 60%starch/sucrose (Table 1) for 6 months. The leucine-supplemented diet was supplemented with leucine(4.45%) and with appropriate amounts of valine andisoleucine in order to prevent the fall of plasmaBCAA concentrations induced by leucine supple-mentation as previously described (Rieu et al. 2003).The control diet was supplemented with glycine torender the diets isocaloric and to balance the aminoacid supplement of the LEU diet. Mean food intakeand individual body weight were recorded every2 weeks.
Oral glucose tolerance test (OGTT)
Conscious rats were subjected to oral glucose admin-istration (1 g/kg body weight) after 18 h fasting,followed by glucose and insulin measurement fromblood samples taken in the tail vein as previouslydescribed (Balage et al. 2011) at baseline (beforestarting the experimental period) and at the end of thenutritional experiment.
Experimental design at the end of nutritional period
After the 6-month period of supplementation, foodwas removed on the evening before sacrifice. On thenext morning, each group of rats (C and LEU) wasseparated into two groups: one group that received abolus of water and constituted the post-absorptive
state (PA groups), whereas the other group received anutrient bolus containing 1 g of glucose, 1.2 g ofsucrose, and 1 g of an amino acid mixture (Table 1legend) and constituted the postprandial state (PPgroups). The objective of the nutrient bolus was tostimulate acute insulin secretion without increasingacute plasma leucine level (i.e., the leucine contentwas similar in the nutrient bolus given in C and LEUgroup) in order to detect the effect of long-termleucine supplementation on postprandial stimulationof insulin signaling pathway, independently of anacute effect of leucine. Rats were then anaesthetized30 or 60 min after gavage with sodium pentobarbital(6 mg/100 g body weight) and epithrochlearismuscles from PA groups were rapidly dissected intactfor in vitro skeletal muscle glucose transport assays.Rats were then killed by exsanguination through the
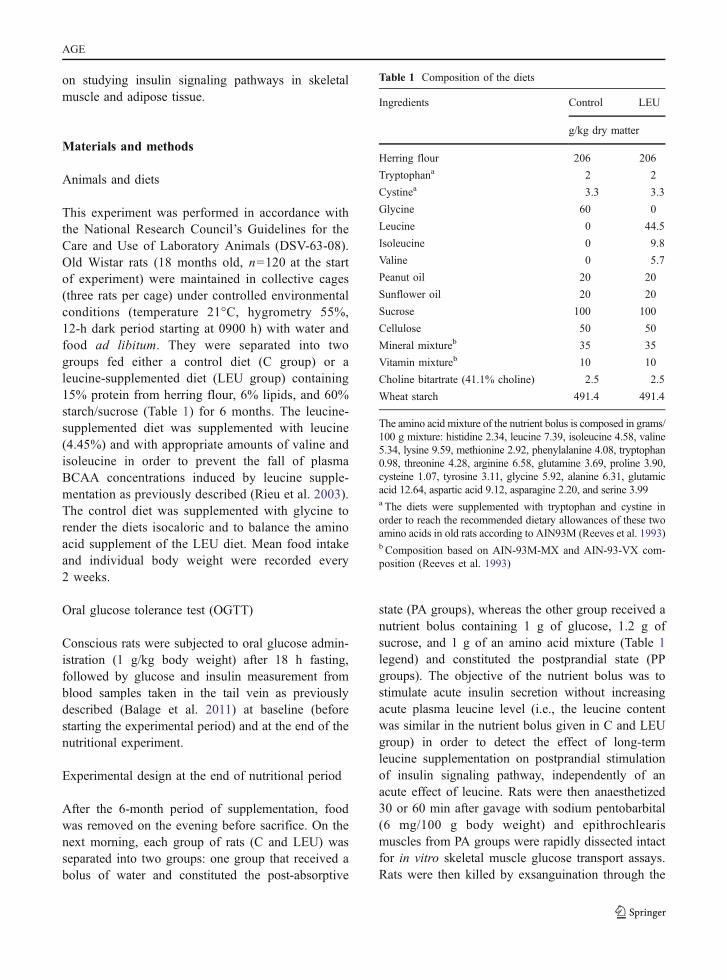
Table 1 Composition of the diets
Ingredients Control LEU
g/kg dry matter
Herring flour 206 206
Tryptophana 2 2
Cystinea 3.3 3.3
Glycine 60 0
Leucine 0 44.5
Isoleucine 0 9.8
Valine 0 5.7
Peanut oil 20 20
Sunflower oil 20 20
Sucrose 100 100
Cellulose 50 50
Mineral mixtureb 35 35
Vitamin mixtureb 10 10
Choline bitartrate (41.1% choline) 2.5 2.5
Wheat starch 491.4 491.4
The amino acid mixture of the nutrient bolus is composed in grams/100 g mixture: histidine 2.34, leucine 7.39, isoleucine 4.58, valine5.34, lysine 9.59, methionine 2.92, phenylalanine 4.08, tryptophan0.98, threonine 4.28, arginine 6.58, glutamine 3.69, proline 3.90,cysteine 1.07, tyrosine 3.11, glycine 5.92, alanine 6.31, glutamicacid 12.64, aspartic acid 9.12, asparagine 2.20, and serine 3.99a The diets were supplemented with tryptophan and cystine inorder to reach the recommended dietary allowances of these twoamino acids in old rats according to AIN93M (Reeves et al. 1993)b Composition based on AIN-93M-MX and AIN-93-VX com-position (Reeves et al. 1993)
AGE
abdominal aorta. Blood was collected, centrifuged,and frozen in liquid nitrogen. Liver, gastrocnemiusmuscles, and perirenal adipose tissue were rapidlyremoved, weighed, freeze-clamped, and frozen inliquid nitrogen. Other hindlimb skeletal muscles[tibialis anterior, extensor digitorum longus (EDL),and soleus], heart, spleen, and kidneys were quicklyexcised and weighed. All tissues were stored at −80°Cuntil analysis.
Effect of insulin on skeletal muscle glucose transportin vitro
Epitrochlearis muscles were dissected intact for the invitro measurement of skeletal muscle glucose trans-port as previously described (Dardevet et al. 1994)with 5.0 mmol/l of 2-deoxy-D-[3H] glucose (DOG;0.5 μCi/ml) in the absence or presence of variousconcentrations of insulin.
Analytical procedures
Plasma glucose, insulin, leptin, triglycerides, choles-terol, and HDL; and plasma amino acid concentra-tions were determined as previously described(Balage et al. 2011).
Western blots
Muscle analysis An aliquot of frozen gastrocnemiuspowder (0.3 g) was homogenized in 10 vol of bufferas previously described (Balage et al. 2011). Thehomogenate was centrifuged at 10,000×g at 4°C for10 min. Aliquots of supernatants were diluted insample buffer, boiled for 5 min, and stored at −20°Cuntil protein immunoblot analyses. Equal amounts ofproteins were separated by SDS–PAGE and trans-ferred to PVDF membranes. Immunoblotting wasperformed using appropriate antibodies: Akt, p-Akt(T308), p-Akt (S473), mTOR, p-mTOR (S2448),S6K1, p-S6K1 (T389), p-S6K1 (T421/S424), S6,p-S6 (S240/244), p-S6 (S235/236), eEF2 andp-eEF2 (T56) (Cell Signaling, Beverly, MA, USA),and 4EBP1 (Bethyl Laboratories, Montgomery, TX,USA). IRβ, IRS1, and PI3K were determined afterimmunoprecipitation as previously described (Balageet al. 2011). Briefly, aliquots of frozen gastrocnemiuspowder were homogenized and homogenates werecentrifuged at 12,000×g for 20 min at 4°C. After
normalization for protein concentration, 1 mg of totalprotein was used to immunoprecipitate various pro-teins using 5 μg of appropriate antibodies [IRβ(Biosciences, Le Pont de Claix, France) or IRS1(Upstate Biotechnology Inc., Lake Placid] at 4°Covernight. The immunocomplexes were precipitatedwith 40 μl of protein A-agarose for 1 h at 4°C. Aftertwo sequential washes, the resulting pellets wereboiled for 4 min in reducing Laemmli buffer containing80 mM dithiothreitol. Proteins were resolved by SDS–PAGE and transferred to nitrocellulose membranes.Membranes were then incubated overnight with appro-priate antibodies: anti-phosphotyrosine antibodies(PY20; Biosciences) or anti-phosphoserine antibody[p-IRS1 (S636/639)] and then with total IRβ or IRS1antibodies. PI3K activity was measured in p85 immu-noprecipitates frommuscle homogenates (2 mg protein)using an anti-rat p85 subunit antibody (Upstate Bio-technology Inc., Euromedex, France) and protein Gagarose beads (GE Healthcare Europe GmbH).
The blots were revealed using an enhancedchemiluminescence (ECL) western blotting kit (GEHealthcare). Films were then scanned and identifiedbands were quantified by densitometry using Image J1.41o (NIH, USA). Total signaling proteins wereexpressed in arbitrary units and phosphorylatedproteins were corrected for total proteins.
Adipose tissue analysis White adipose tissue sub-merged in liquid nitrogen was crushed using pestleand mortar. Four hundred milligrams of tissue wascollected in tubes containing ceramic beads (1.4 mmdiameter) with 1 ml of lysis buffer [10 mM potassiumphosphate, 50 mM β-glycerophosphate, 50 mMsodium fluorure, 1 mM EDTA, 1 mM EGTA,pH 7.4 supplemented with 1 mM DTT, 1 M sodiumorthovonadate, leupeptin (5 μg/ml), aprotinin(150 μg/ml), and 4-(2-aminomethyl)-benzene-sulfonyl-fluoride (AEBSF, 250 μg/ml)] and homoge-nized in a tissue/cell grinder (Precellys; BertinTechnologies, Montigny-le-Bretonneux, France) at6,500 rpm for 5 s. After a 1-min 2,500-rpmcentrifugation at 4°C, the upper lipid phase wasremoved and the tissue extract transferred into a newtube. One percent (v/v) NP-40 was added and lysiswas performed for 30 min at 4°C, then lysates werecentrifuged for 20 min at 4°C at 13,000 rpm. Thesupernatant was then removed and total protein concen-trations determined by using Bradford assay and
AGE
spectrophotometer (BioRad, 500-0006). Seventy micro-grams of proteins per sample was loaded in reducingconditions (Laemmli buffer) on SDS–PAGE (5% to 12%polyacrylamide gel depending on the size of the proteinsanalyzed). Following electrophoresis, proteins weretransferred to a PVDF membrane and immunoblottingwas performed using different antibodies according tothe aim of experiments. When phosphoproteins wereanalyzed, the membranes were stripped [for 30 min at50°C in buffer containing 2-mercaptoethanol 100 mM,SDS 2% (v/v), and Tris–HCl 62.5 mM, pH 6.7], andreprobed with antibodies recognizing the native protein.Antibody binding was revealed by enhanced chemilu-minescence and analyzed with the Kodak Image Station2000R (Rochester, NY, USA).
Analysis of adipokines
White adipose tissue was crushed using pestle andmortar submerging in liquid nitrogen. Four hundredmilligrams of pulverized tissues was then homoge-nized in phosphate buffered saline (PBS; 137 mMNaCl, 2.7 mM KCl, 10 mM NaH2PO4, 1.7 mMKH2PO4, pH 7.4) using tubes containing ceramicbeads (1.4 mm diameter) and a tissue/cell grinder(Precellys) at 6,500 rpm for 5 s. Samples werecentrifuged for 1 min at 4°C and 2,500 rpm. Theintermediary phase was then removed and submittedtwice to thermal shock (freezing in liquid nitrogenfollowed by thawing at 37°C). Samples were thencentrifuged for 5 min at 4°C and 5,000×g, and totalprotein concentrations were determined by usingBradford assay. TNF-α and IL-6 were quantified withan Elisa kit (Diaclone, Besançon, France) accordingto a protocol furnished by the manufacturer. Leptin inadipose tissue (n=18–19 per group) was quantified byusing an Elisa kits from Linco Research, Inc.(St Charles, MO, USA).
Real-time RT–PCR
Adipose tissue samples were homogenized in Trizol(InVitrogen Life Technologies Inc., Gaithersburg,MD, USA), total RNAs were extracted, and 1 μgfrom each sample was reverse-transcribed intocDNAs using Quantitect RT kit (Qiagen, Hilden,Germany). RNA concentration was determined with aspectrophotometer (MC2, SAFAS, Monte Carlo) and
quality of RNA by the OD260:280 ratio and onagarose gels. Real-time PCR was performed by usingthe ABI prism 7000 sequence detector system(Applied Biosystems). The following forward (F)and reverse (R) primers, respectively, were used foramplifications: 36B4 (used for normalization of theresults), 5′-CCACTAAAATCTCCAGAGGTAC-3′,5′-ATGATCAGCCCGAAGGAGAAGG-3′; PKBβ,5 ′ -CTCAGCATCAACTG-GCAGGAT-3 ′ , 5 ′ -GAAGGGTGGCAGGAGCTTCT-3′; RICTOR, 5′-G C AT G T G C - C T C C A C C A G AT- 3 ′ , 5 ′ -GGCCTCCTCCGTCATGG-3 ′ ; ACCα , 5 ′ -T T CGCCAGCA - GAATTTGTTA - 3 ′ , 5 ′ -AGATCGCATGCATTTCACTG-3 ′; FASn, 5 ′-GAACTGAACG-GCATTACTCGG-3 ′ , 5 ′ -AAATCCAACATGGGACAC; SREBP1c, 5 ′-A A GGATGC T C - G T G C CAG TG - 3 ′ , 5 ′ -ACTCAGTGCCAGGTTAGAAGC-3′; peroxisomeproliferator-activated receptor γ (PPARγ), 5′-TCTCACAATG-CCATCAGGTTTG-3 ′ , 5 ′ -GCTGGTCGATATCACTG-GAGATC-3′; and adipo-n e c t i n , 5 ′ -CCCCTGGCAGGAAAGGA-3 ′ ,5′-TCCAGCCCTAC-GCTGAATG-3′.
Statistical analysis
Data are presented as means±SEM. Data wereanalyzed by one-way ANOVA to analyze the supple-mentation effect (C vs. LEU) or two-way ANOVA toanalyze the supplementation and the nutritional state(PA vs. PP states) effects. When a significant overalleffect was detected, significant differences amongindividual means were assessed with Fisher test.When measurements could be repeated over time(body weight, food intake), two-way repeated mea-sure variance analysis were performed. All tests wereperformed using XLStat (Addinsoft NY, USA, ver-sion 7.5.2). Differences were considered as significantfor P <0.05.
Results
Animal characteristics
Leucine supplementation dramatically increasedplasma leucine concentration in the fed state(Fig. 1a) (+300%, P<0.0001) and moderately in thepost-absorptive (PA) state (Fig. 1b) (+20%, P<0.05).
AGE

It is important to note that other plasma BCAA levels(i.e., isoleucine and valine) were not changed byleucine supplementation in the PA state and wereslightly increased in the fed state (+25% forisoleucine, +17% for valine, P<0.05). Except forplasma methionine in the fed state, other essentialamino acid concentrations were similar in C andLEU groups.
During the 6-month nutritional period, 31 rats dieddue to aging or were sacrificed because of healthproblems: no difference was observed between controland leucine-supplemented groups. Body weights of oldrats were similar between groups at the beginning of theexperiment. Rats supplemented with leucine gainedsignificantly more weight than those on control diet did(Fig. 1c), but this weight gain only occurred during thefirst 2 weeks of the diet (+47±3 vs. +20±3 g in LEUand C groups, respectively; P<0.0001) and wasconcomitant to an increase in food intake in this group(29.7±0.6 g/day vs. 25.1±0.5 for LEU and C groups,respectively; P<0.0001) (Fig. 1d). The weight differ-ence was maintained until the end of the nutritional
period even though food intake in LEU group returnedto values in C group.
As shown in Table 2, muscle mass was not changedby leucine supplementation, whereas perirenal adipose
Table 2 Skeletal muscle and organ weight in control andleucine-supplemented rats
Control LEU
Muscles (g)
Gastrocnemius 5.31±0.1 5.15±0.11
Tibialis anterior 1.83±0.04 1.80±0.04
EDL 0.470±0.009 0.452±0.008
Soleus 0.392±0.009 0.390±0.009
Perirenal adipose tissue (g) 17.63±1.07 25.53±1.51*
Heart (g) 1.71±0.04 1.69±0.03
Liver (g) 16.19±0.44 16.90±0.34
Kidneys (g) 6.06±0.40 5.78±0.35
Spleen (g) 1.453±0.051 1.383±0.047
Values are means±SEM, n=35 and 36
*P<0.0001
0
1
2
3
0.5
1.5
2.5
* *
*
Ileu Leu Val Thr Met Phe His Trp Lys
Ileu Leu Val Thr Met Phe His Trp Lys
*
Fed state
Rel
ativ
e p
lasm
a am
ino
aci
d c
on
cen
trat
ion
0
0.5
1
1.5
2
*Postabsorptive state
A
B
ControlLEU
* *
*
*
640
660
680
700
720
740
760
780
0 2 4 6 8 10 12 14 16 18 20 22 24
Wei
gh
t (g
)
P < 0.05
620
C
Weeks of supplementation
Mea
n f
oo
d in
take
(g
)Weeks of supplementation
*
D
05
101520253035
2 4 6 8 10 12 14 16 18 20 220
ControlLEU
ControlLEU
* *
*
*
* *
*
*
Fig. 1 Effects of a 6-month leucine supplementation in old rats onplasma concentration of essential amino acids in the fed state (a),in the post-absorptive state (measured after an overnight fooddeprivation) (b) (values are expressed as relative level to control
values and are means±SEM, n=15–16 in each group), on bodyweight (c), and food intake (d) (values are expressed asmeans±SEM, n=35 and 36). *P<0.05 vs. control group
AGE

tissue weight was dramatically increased (+45%, P<0.0001). Leucine supplementation did not affect heart,liver, kidneys, or spleen weights.
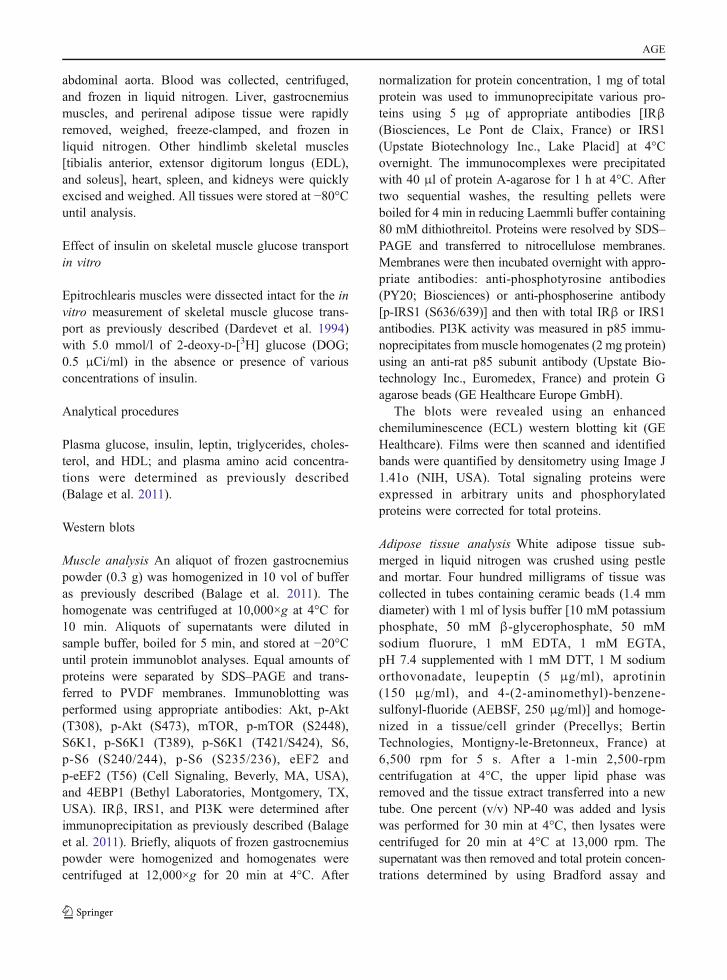
Overall insulin sensitivity (OGTT)
Because no difference was observed between controland leucine-supplemented rats before starting thenutritional experiment, OGTT data were combinedand presented as baseline results. Basal (post-absorptivestate) plasma glucose concentrations were similar in Cand LEU groups at the end of the nutritional period(5.56±0.13 and 5.48±0.20 mmol/l in C and LEUgroups, respectively) but were significantly higher thanbaseline values (4.95±0.09 mmol/l, P<0.05 vs. C and
LEU values). Basal insulin concentrations were notsignificantly different in C and LEU groups at the endof supplementation (1.19±0.12 vs. 1.51±0.14 ng/ml inC and LEU groups, respectively; P=0.09), but baselinevalues were higher than basal C group values (1.52±0.08 vs. 1.19±0.12 ng/ml, P<0.05). Glucose andinsulin plasma concentrations and areas under thecurve (AUCs) in response to the oral glucose boluswere similar in both groups at the end of the nutritionalperiod (Fig. 2a, b). We note that glucose AUCsincreased, whereas insulin AUCs decreased at the endof supplemental period compared to baseline suggest-ing a time effect of insulin response to glucosechallenge. However, the insulin–glucose indexes (over-all insulin sensitivity index) estimated by the product
Pla
sma
insu
lin (
ng
/ml)
0
1
2
3
4
5
6
7
020406080
100
Insu
linA
UC
(n
g/m
l/h)
* *
C LeuBasal
Time (min) Time (min)
Pla
sma
glu
cose
(m
mo
l/L)
A
4
5
6
7
8
9
10
0 20 40 60 80 100 120 140 0 20 40 60 80 100 120 140
04080
120160200
Glu
cose
AU
C
(mM
/h)
C LeuBasal
*
*
B
1.2
1.4
1.6
1.8
2.0
2.2
0 1 10 100
Insulin (nmol/L)
Mu
scle
glu
cose
up
take
(nm
olD
OG
/15
min
/ mg
mus
cle)
* *C
ControlLEU
ControlLEU
Baseline
*
*
* *
* * **
Fig. 2 Effects of a 6-month leucine supplementation in old ratson insulin sensitivity. Oral glucose tolerance test (OGTT) atbaseline (before experimental period) and in control and leucine-supplemented rats (a, b). Blood samples were taken from the tailvein for the determination of fasting glucose and insulin levels.Then, an oral glucose challenge (1 g/kg body weight) was givenby gavage and plasma samples were taken at 15, 30, 60, and135 min after glucose administration. Time-course changes andarea under the curve (AUC) in plasma glucose (a) and plasmainsulin levels (b). Values are means±SEM (n=34 and 35). *P<0.05 vs. baseline values. Dose–response curves of insulin-
stimulated glucose transport in isolated epitrochlearis musclesfrom control and leucine-supplemented rats after an overnightfood deprivation (c). Epitrochlearis muscles were incubated inthe absence or presence of various concentrations of insulin (1,10, and 100 nmol/l) and with 5.0 mmol/l of 2-deoxy-D-[3H]glucose (DOG). Muscle glucose transport was calculated bydividing the radioactivity within the epitrochlearis muscles by thespecific activity of the DOG into the incubation medium; it wasexpressed as nmoles DOG per milligram of muscle per 15 min.Values are means±SEM (n=13–16 determinations per insulinconcentration). *P<0.05 vs. control group
AGE
of the AUCs for glucose and insulin (Cortez et al.1991) were not changed during time and were similarin C and LEU groups (10,873±690, 10,236±1,013,and 11,034±1,593 relative units at baseline and in Cand LEU groups, respectively), demonstrating thatoverall glucose tolerance was not affected by long-term leucine supplementation in old rats.
Glucose transport in response to insulin in isolatedepitrochlearis muscles
In order to determine the effect of leucine supple-mentation on muscle insulin sensitivity, we assessedthe in vitro insulin response of glucose transport inskeletal muscles isolated from fasted control andleucine-supplemented rats. Basal glucose transportwas similar in muscles from C and LEU groups(Fig. 2c). Increasing insulin concentration in theincubation medium significantly stimulated glucosetransport in epitrochlearis muscles from LEU group(P<0.005), whereas it did not in muscles from Cgroup (P=0.4). The maximum insulin response wasthus significantly increased in leucine-supplementedrats compared to controls (Fig. 2c).
Skeletal muscle signaling pathways
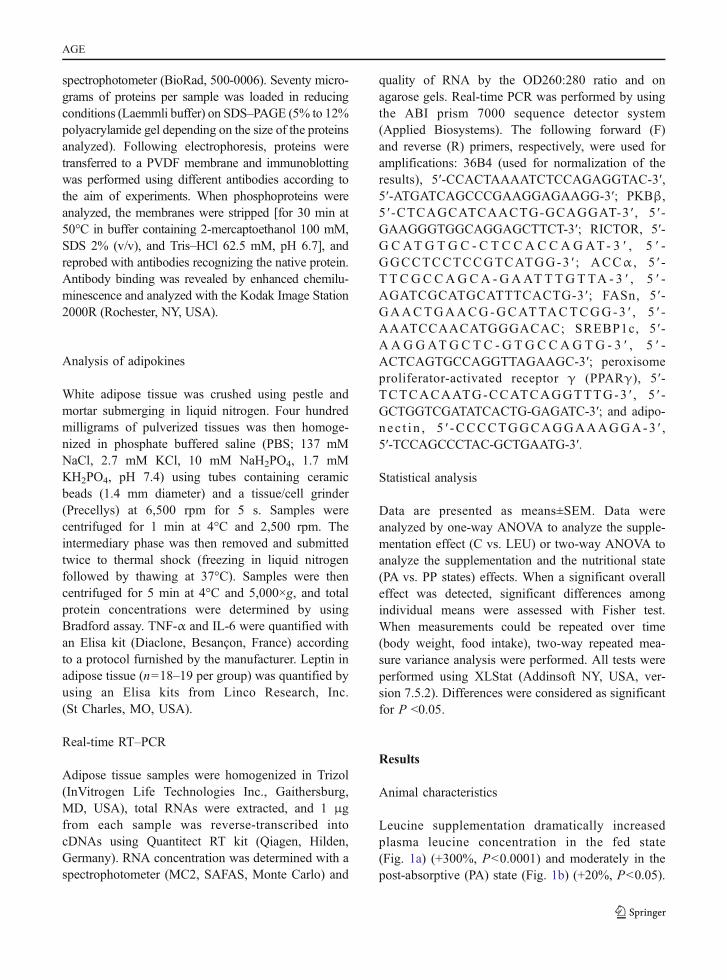
Amino acid and insulin signaling pathway analysis wereperformed on gastrocnemius muscles taken at the end ofthe experimental period in the post-absorptive state(PA), 30 min (PP30) and 60 min (PP60) after oraladministration of the nutrient bolus. The nutrient bolusinduced a similar increase in plasma insulin in C andLEU groups (Fig. 3a) with a 3.5-fold increase 30 minafter the nutrient bolus in both groups. As wanted,plasma leucine concentration was similar in C andLEU groups whatever the time after the bolus ingestion(Fig. 3b). Thus, any significant differences observedbetween C and LEU groups in signaling pathwayactivation will be due to chronic leucine exposure.
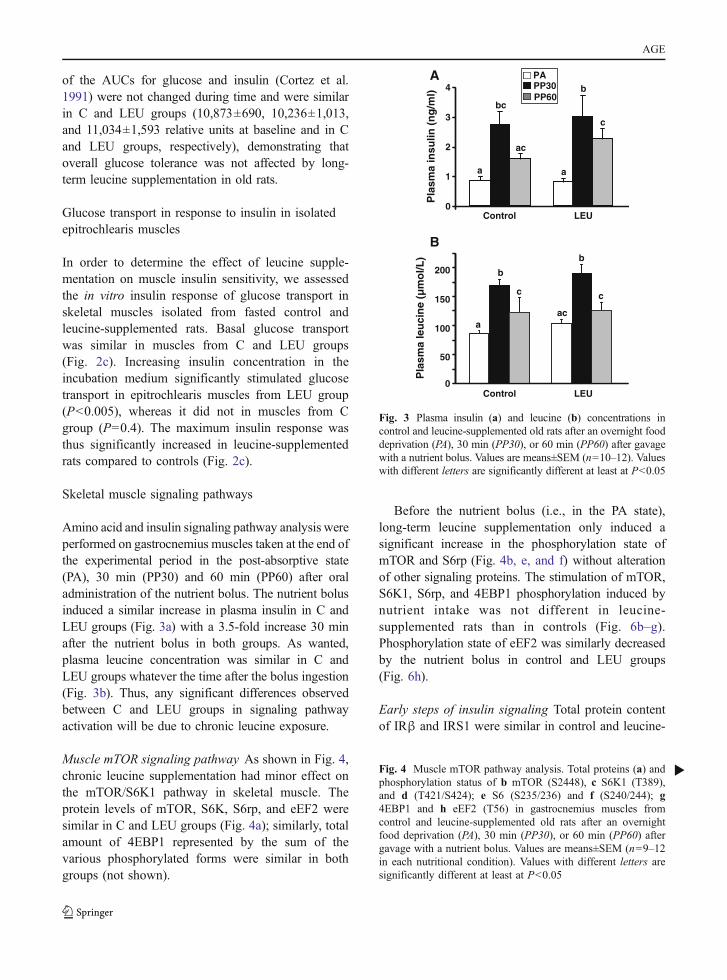
Muscle mTOR signaling pathway As shown in Fig. 4,chronic leucine supplementation had minor effect onthe mTOR/S6K1 pathway in skeletal muscle. Theprotein levels of mTOR, S6K, S6rp, and eEF2 weresimilar in C and LEU groups (Fig. 4a); similarly, totalamount of 4EBP1 represented by the sum of thevarious phosphorylated forms were similar in bothgroups (not shown).
Before the nutrient bolus (i.e., in the PA state),long-term leucine supplementation only induced asignificant increase in the phosphorylation state ofmTOR and S6rp (Fig. 4b, e, and f) without alterationof other signaling proteins. The stimulation of mTOR,S6K1, S6rp, and 4EBP1 phosphorylation induced bynutrient intake was not different in leucine-supplemented rats than in controls (Fig. 6b–g).Phosphorylation state of eEF2 was similarly decreasedby the nutrient bolus in control and LEU groups(Fig. 6h).
Early steps of insulin signaling Total protein contentof IRβ and IRS1 were similar in control and leucine-
0
1
2
3
4
Pla
sma
insu
lin (
ng
/ml)
a
bc
ac
c
b
Control LEU
Control LEU0
50
100
150
200
a
b
c
b
c
ac
Pla
sma
leu
cin
e (µ
mo
l/L)
A
B
PAPP30PP60
a
Fig. 3 Plasma insulin (a) and leucine (b) concentrations incontrol and leucine-supplemented old rats after an overnight fooddeprivation (PA), 30 min (PP30), or 60 min (PP60) after gavagewith a nutrient bolus. Values are means±SEM (n=10–12). Valueswith different letters are significantly different at least at P<0.05
Fig. 4 Muscle mTOR pathway analysis. Total proteins (a) andphosphorylation status of b mTOR (S2448), c S6K1 (T389),and d (T421/S424); e S6 (S235/236) and f (S240/244); g4EBP1 and h eEF2 (T56) in gastrocnemius muscles fromcontrol and leucine-supplemented old rats after an overnightfood deprivation (PA), 30 min (PP30), or 60 min (PP60) aftergavage with a nutrient bolus. Values are means±SEM (n=9–12in each nutritional condition). Values with different letters aresignificantly different at least at P<0.05
b
AGE

B
0
a
c c c
bb
1.0
2.0
3.0
P-m
TO
R(S
2448
) / m
TO
R(a
rbitr
ary
units
)
Anova: Diet: ns; Bolus: P < 0.0001; diet x bolus: P < 0.05
0
1.0
2.0
3.0
4.0
5.0
6.0
7.0
Control LEU
a a
abab
bb
P-S
6K(T
421-
S42
4) /
S6K
(arb
itrar
y un
its x
10)
Anova: Diet: ns; Bolus: P < 0.05; diet x bolus: ns
0
0.5
1.0
1.5
2.0
2.5
a
bbc
b
c
bc
P-S
6 (S
235/
S23
6) /
S6
(arb
itrar
y un
its)
Anova: Diet: ns; Bolus: P < 0.0001; diet x bolus: ns
Control LEU
Control LEU
a
bc
bb
bcac
0
0.5
1.0
1.5
2.0
2.5
3.0
P-S
6 (S
240/
S24
4)/ S
6(a
rbitr
ary
units
)
Anova: Diet: ns; Bolus: P < 0.01; diet x bolus= 0.09
Control LEU
Control LEU
0
1.0
2.0
3.0
4.0
5.0
6.0ac
b
a
bc
bbc
P-e
EF
2 (T
56)/
eE
F2
(arb
itrar
y un
its x
10)
Control LEU Control LEU
Anova: Diet: ns; Bolus: P < 0.001; diet x bolus: ns
mTOR
S6K
S6rp
eEF2
C LEU C LEU C LEU C LEU
Total proteinsA
Anova: Diet: ns; Bolus: P < 0.0001; diet x bolus: ns
0
1.0
2.0
3.0
4.0
a a a
ab
bc
c
P-S
6K(T
389)
/ S
6K(a
rbitr
ary
units
x 1
0)
C D
E F
G H
PAPP30
PP60
0
5
10
15
20
25
30
a
b
a
b
a
a
ANOVA: Diet: ns; Bolus: P < 0.0001, diet x bolus: ns
4E-B
P1
ph
osp
ho
ryla
tio
n(%
of γ
form
)
D
H
4E
AGE

supplemented rats (not shown). In the basal state,long-term leucine supplementation did not inducealteration of tyrosine phosphorylation of IRβ (1.31±0.10 vs. 1.37±0.22 arbitrary units in C and LEU groups,respectively) and IRS1 (1.31±0.21 vs. 1.13±0.24arbitrary units in C and LEU groups, respectively).Similarly, it did not alter serine phosphorylation of IRS1at S636/639 (0.96±0.06 vs. 0.98±0.07 arbitrary units inC and LEU groups, respectively).
We next examined the activation of key signalingproteins involved in insulin-stimulated glucose trans-port such as PI3K activity and Akt phosphorylationon T308 and S473 (Fig. 5). PI3 kinase activity wasfaintly but significantly increased after the nutrientbolus (P<0.05) in C and LEU groups (Fig. 5a). Long-term leucine supplementation induced a moderate butsignificant increase in total Akt expression in gastroc-nemius muscle (6.40±0.21 vs. 5.53±0.27 arbitraryunits in LEU and C groups, respectively; P<0.05)(Fig. 5b). Moreover, Akt phosphorylation at T308 andS473 was increased in leucine-supplemented rats30 min after the nutrient bolus, whereas it was notsignificantly changed by nutrient intake in the controlgroup.
Adipose tissue analysis
Leucine supplementation did not change basal plasmalipids measured at the end of the supplementation period(triglycerides—1.38±0.16 vs. 1.22±0.12 mmol/l;cholesterol—2.31±0.16 vs. 2.39±0.18 mmol/l;HDL—0.68±0.05 vs. 0.61±0.04 mmol/l in C andLEU groups, respectively).
Lipogenesis is dependent upon two key enzymes:fatty acid synthase (FAS) and acetylcoA carboxylase(ACC). FAS expression is regulated by a transcriptionfactor belonging to the Sterol Regulatory ElementBinding family, SREBP1c. The process of differentia-tion of preadipocytes into mature fat-loaded adipocytesinvolves major transcriptional regulators, such asperoxisome proliferator-activated receptors (PPARs).mRNA levels of FAS, ACCα, and SREBP1c were notsignificantly different between groups (Fig. 6a–c). Incontrast, the leucine group showed a significantincrease in PPARγ mRNA levels (Fig. 6d). Adiposetissue is an endocrine organ that synthesizes andexcretes different adipokines such as leptin, adiponec-tin, and cytokines (Wang et al. 2008). When produced
in excess, cytokines such as TNFα or Il-6 inducemuscle damages by activating proteolysis, which couldcounteract the anabolic effect of leucine and promotemuscle insulin resistance. On the opposite, adiponectinand leptin improve insulin sensitivity in muscle(Yaspelkis et al. 2004). In the white adipose tissue,protein levels of TNF-α and IL-6 (not shown) were notdifferent between groups. There was a significantlyhigher protein level of leptin in the white adiposetissue of the leucine-supplemented rats compared tocontrol ones (0.58±0.06 vs. 0.45±0.05 ng/μg protein,respectively; P<0.05), which correlated with a signif-icant increase in basal plasma leptin in leucine-supplemented rats (39.1±3.9 vs. 22.6±3.3 ng/ml,
P-A
kt(S
473)
/ A
kt(a
rbitr
ary
units
)
0
2
4
6
8
10
PI3
-K a
ctiv
ity
(CP
M x
10-3
)
a a
b b
Control LEU
0
0.5
1.0
1.5
2.0
0
0.5
1.0
1.5
2.0P
-Akt
(T30
8) /
Akt
(arb
itrar
y un
its)
Control LEU
Control LEU
PA PAPP30 PP30
PA PAPP30 PP30
aa
a
b
ab
a
bb
C C C CLEU LEU LEU LEU
Total Akt
PAPP30
A
PAPP30
B
C
PAPP30
Fig. 5 PI3 kinase activity (a) and phosphorylation state of Akt(T308) (b) and (S473) (c) in gastrocnemius muscles fromcontrol and leucine-supplemented old rats after an overnightfood deprivation (PA) or 30 min (PP30) after gavage with anutrient bolus. Values are means±SEM (n=7–10 in eachnutritional condition). Values with different letters are signifi-cantly different at least at P<0.05
AGE
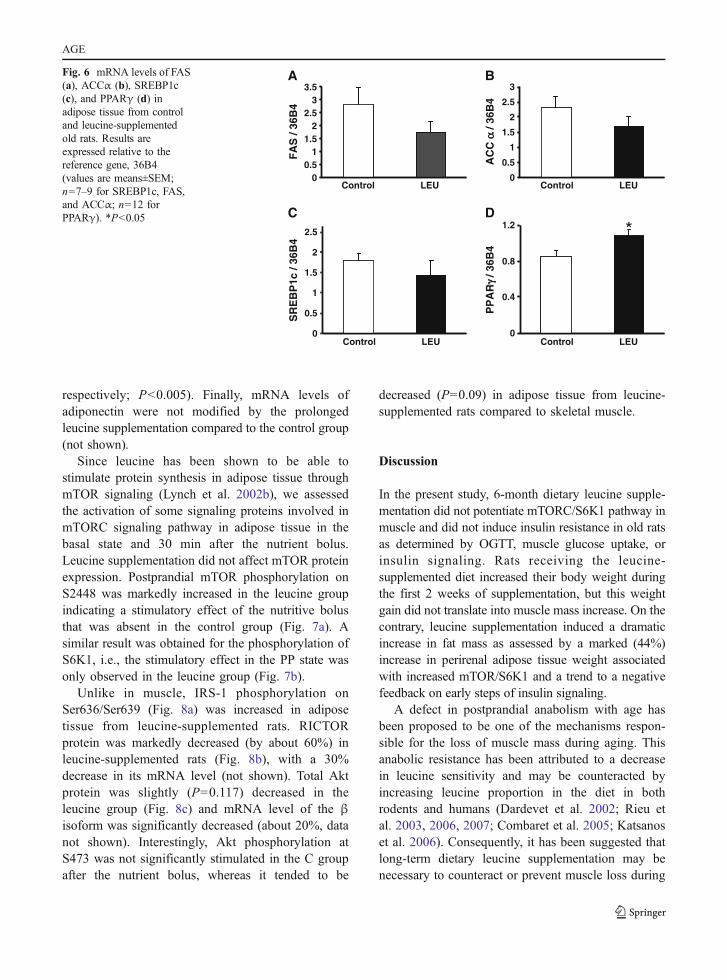
respectively; P<0.005). Finally, mRNA levels ofadiponectin were not modified by the prolongedleucine supplementation compared to the control group(not shown).
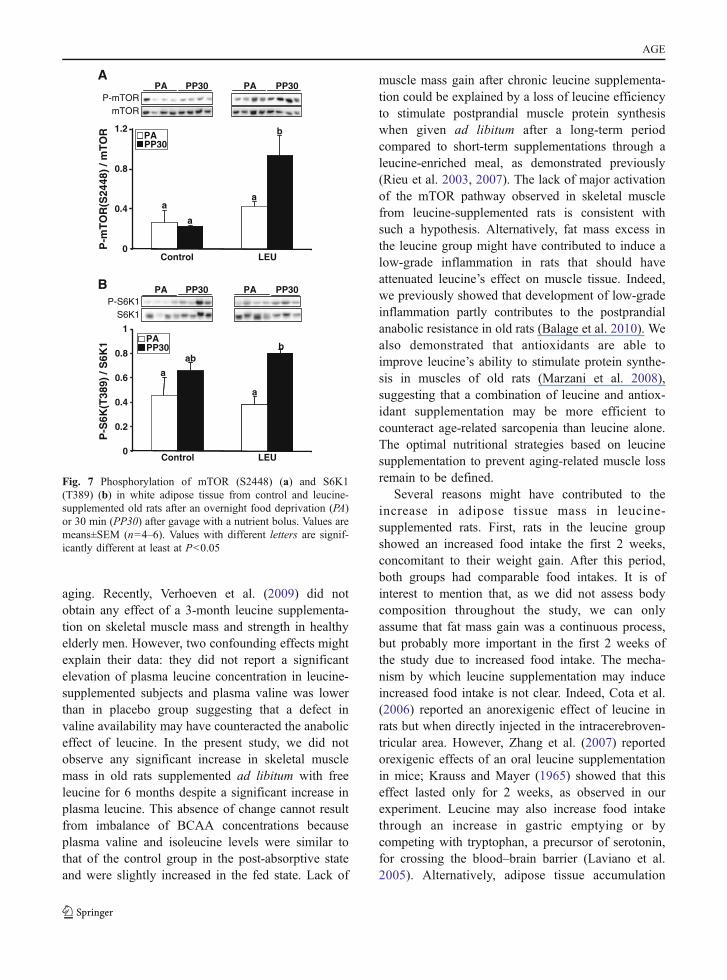
Since leucine has been shown to be able tostimulate protein synthesis in adipose tissue throughmTOR signaling (Lynch et al. 2002b), we assessedthe activation of some signaling proteins involved inmTORC signaling pathway in adipose tissue in thebasal state and 30 min after the nutrient bolus.Leucine supplementation did not affect mTOR proteinexpression. Postprandial mTOR phosphorylation onS2448 was markedly increased in the leucine groupindicating a stimulatory effect of the nutritive bolusthat was absent in the control group (Fig. 7a). Asimilar result was obtained for the phosphorylation ofS6K1, i.e., the stimulatory effect in the PP state wasonly observed in the leucine group (Fig. 7b).
Unlike in muscle, IRS-1 phosphorylation onSer636/Ser639 (Fig. 8a) was increased in adiposetissue from leucine-supplemented rats. RICTORprotein was markedly decreased (by about 60%) inleucine-supplemented rats (Fig. 8b), with a 30%decrease in its mRNA level (not shown). Total Aktprotein was slightly (P=0.117) decreased in theleucine group (Fig. 8c) and mRNA level of the βisoform was significantly decreased (about 20%, datanot shown). Interestingly, Akt phosphorylation atS473 was not significantly stimulated in the C groupafter the nutrient bolus, whereas it tended to be
decreased (P=0.09) in adipose tissue from leucine-supplemented rats compared to skeletal muscle.
Discussion
In the present study, 6-month dietary leucine supple-mentation did not potentiate mTORC/S6K1 pathway inmuscle and did not induce insulin resistance in old ratsas determined by OGTT, muscle glucose uptake, orinsulin signaling. Rats receiving the leucine-supplemented diet increased their body weight duringthe first 2 weeks of supplementation, but this weightgain did not translate into muscle mass increase. On thecontrary, leucine supplementation induced a dramaticincrease in fat mass as assessed by a marked (44%)increase in perirenal adipose tissue weight associatedwith increased mTOR/S6K1 and a trend to a negativefeedback on early steps of insulin signaling.
A defect in postprandial anabolism with age hasbeen proposed to be one of the mechanisms respon-sible for the loss of muscle mass during aging. Thisanabolic resistance has been attributed to a decreasein leucine sensitivity and may be counteracted byincreasing leucine proportion in the diet in bothrodents and humans (Dardevet et al. 2002; Rieu etal. 2003, 2006, 2007; Combaret et al. 2005; Katsanoset al. 2006). Consequently, it has been suggested thatlong-term dietary leucine supplementation may benecessary to counteract or prevent muscle loss during
Control LEU Control LEU
Control LEUControl LEU
00.5
11.5
22.5
33.5
FA
S /
36B
4
0
0.5
1
1.5
2
2.5
3
AC
C α
α / 3
6B4
0
0.4
0.8
1.2
PP
AR
γ γ / 3
6B4
*
A B
0
0.5
1
1.5
2
2.5
SR
EB
P1c
/ 36
B4
C D
Fig. 6 mRNA levels of FAS(a), ACCα (b), SREBP1c(c), and PPARγ (d) inadipose tissue from controland leucine-supplementedold rats. Results areexpressed relative to thereference gene, 36B4(values are means±SEM;n=7–9 for SREBP1c, FAS,and ACCα; n=12 forPPARγ). *P<0.05
AGE
aging. Recently, Verhoeven et al. (2009) did notobtain any effect of a 3-month leucine supplementa-tion on skeletal muscle mass and strength in healthyelderly men. However, two confounding effects mightexplain their data: they did not report a significantelevation of plasma leucine concentration in leucine-supplemented subjects and plasma valine was lowerthan in placebo group suggesting that a defect invaline availability may have counteracted the anaboliceffect of leucine. In the present study, we did notobserve any significant increase in skeletal musclemass in old rats supplemented ad libitum with freeleucine for 6 months despite a significant increase inplasma leucine. This absence of change cannot resultfrom imbalance of BCAA concentrations becauseplasma valine and isoleucine levels were similar tothat of the control group in the post-absorptive stateand were slightly increased in the fed state. Lack of
muscle mass gain after chronic leucine supplementa-tion could be explained by a loss of leucine efficiencyto stimulate postprandial muscle protein synthesiswhen given ad libitum after a long-term periodcompared to short-term supplementations through aleucine-enriched meal, as demonstrated previously(Rieu et al. 2003, 2007). The lack of major activationof the mTOR pathway observed in skeletal musclefrom leucine-supplemented rats is consistent withsuch a hypothesis. Alternatively, fat mass excess inthe leucine group might have contributed to induce alow-grade inflammation in rats that should haveattenuated leucine’s effect on muscle tissue. Indeed,we previously showed that development of low-gradeinflammation partly contributes to the postprandialanabolic resistance in old rats (Balage et al. 2010). Wealso demonstrated that antioxidants are able toimprove leucine’s ability to stimulate protein synthe-sis in muscles of old rats (Marzani et al. 2008),suggesting that a combination of leucine and antiox-idant supplementation may be more efficient tocounteract age-related sarcopenia than leucine alone.The optimal nutritional strategies based on leucinesupplementation to prevent aging-related muscle lossremain to be defined.
Several reasons might have contributed to theincrease in adipose tissue mass in leucine-supplemented rats. First, rats in the leucine groupshowed an increased food intake the first 2 weeks,concomitant to their weight gain. After this period,both groups had comparable food intakes. It is ofinterest to mention that, as we did not assess bodycomposition throughout the study, we can onlyassume that fat mass gain was a continuous process,but probably more important in the first 2 weeks ofthe study due to increased food intake. The mecha-nism by which leucine supplementation may induceincreased food intake is not clear. Indeed, Cota et al.(2006) reported an anorexigenic effect of leucine inrats but when directly injected in the intracerebroven-tricular area. However, Zhang et al. (2007) reportedorexigenic effects of an oral leucine supplementationin mice; Krauss and Mayer (1965) showed that thiseffect lasted only for 2 weeks, as observed in ourexperiment. Leucine may also increase food intakethrough an increase in gastric emptying or bycompeting with tryptophan, a precursor of serotonin,for crossing the blood–brain barrier (Laviano et al.2005). Alternatively, adipose tissue accumulation
0
0.4
0.8
1.2
PA PP30 PA PP30
PA PP30 PA PP30
Control LEU
P-m
TO
R(S
2448
) / m
TO
R
0
0.2
0.4
0.6
0.8
1
P-S
6K(T
389)
/ S
6K1
Control LEU
A
B
a
a
a
bPAPP30
PAPP30
a
ab
a
b
P-mTORmTOR
P-S6K1S6K1
Fig. 7 Phosphorylation of mTOR (S2448) (a) and S6K1(T389) (b) in white adipose tissue from control and leucine-supplemented old rats after an overnight food deprivation (PA)or 30 min (PP30) after gavage with a nutrient bolus. Values aremeans±SEM (n=4–6). Values with different letters are signif-icantly different at least at P<0.05
AGE

might result from leucine supplementation per se.Indeed, we previously showed a 25% increase inadipose tissue weight in young rats fed a leucine-supplemented diet, whereas food intake was notincreased (Balage et al. 2011). Adipose tissue gainin leucine group could also be due to decreasedenergy expenditure despite contradictory results weredescribed. Indeed, Cheng et al. (2010) reported thatyoung mice maintained on a 7-day leucine-deficientdiet underwent a rapid loss of abdominal fat andshowed an increase in total energy expenditure.Opposite findings were found by Zhang et al. (2007)who reported that leucine supplementation increasedenergy expenditure and decreased adiposity. Elevatedlevels of leptin in both adipose tissue and plasma inthe leucine group compared to the control group areconsistent with white adipose tissue hypertrophy(Lonnqvist et al. 1997). Moreover, increased activa-tion of the mTOR pathway in adipose tissue fromleucine-supplemented rats, as assessed by increasedphosphorylation of both mTOR and S6K1, is consistentwith a protein synthesis-induced hypertrophy. Previous-ly, Lynch et al. (2002a, b) showed that an acute or a 12-day leucine administration significantly increased
adipose tissue protein synthesis in young rats. Leucineseems to have also a direct positive effect on adipocytedifferentiation, as suggested by a higher PPARγ geneexpression in the leucine group. Amino acids influenceadipogenesis, as reported by in vitro experiments in3T3L1 adipocytes; a recent study has shown thatleucine acts as regulator of adipocyte differentiationfactors such as PPARγ and C/EBPα, and is a promoterof PPARγ activity via the mTOR pathway (Kim andChen 2004). The increased PPARγ gene expressionafter a 6-month leucine supplementation is consistentwith these findings and may explain the persistence ofa body weight difference between groups, 5 monthsafter their food intake became similar. Even though nomicroscopic examination was performed, we canhypothesize that leucine supplementation induced bothhypertrophy and hyperplasia of white adipose tissue.
A main objective of this work was to assess theeffect of long-term leucine supplementation on insulinsensitivity. Indeed, BCAA or leucine alone has beenimplicated in the regulation of insulin sensitivity withconflicting results. For example, Zhang et al. (2007)showed that long-term leucine supplementationreduced diet-induced obesity and hyperglycemia,
0
0.4
1.2
1.6
0.8
P-I
RS
1(S
636-
639)
/ IR
S-1
*
Control LEU
IRS1
IRS1
A
0
10000
20000
30000
RIC
TO
R(A
U)
Control LEU
**
B
P-Akt
Akt
PA PP30 PA PP30
0
0.5
1
1.5
2
P-A
kt(S
473)
/ A
kt
Control LEU
P < 0.1
C
0
P-
RIC
TO
R(A
U)
P-Akt
Akt
Fig. 8 Phosphorylation ofIRS1 (S636/639) (a), RIC-TOR expression (b), andphosphorylation of Akt(S473) (c) in white adiposetissue from control andleucine-supplemented oldrats. Akt phosphorylation(S473) was determined afteran overnight food depriva-tion (PA) or 30 min aftergavage with a nutrientbolus (PP30). Values aremeans±SEM (n=4–6).*P<0.05, **P<0.005
AGE
and improved glucose tolerance in mice fed a high-fatdiet. In addition, She et al. (2007) demonstrated thatdisruption of the mitochondrial branched-chain ami-notransferase isozyme gene (BCATm) in mice whichresulted in a dramatic increase in BCAA plasmalevels was associated with increased glucose toleranceand insulin sensitivity. Finally, co-ingestion of AAmixture or leucine with protein hydrolysate improvesglycemic control in type 2 diabetic patients (Manderset al. 2005, 2006). However, it has also been reportedthat leucine or BCAA could impair insulin sensitivityor glucose tolerance. Newgard et al. (2009) reportedthat chronic BCAA supplementation decreased glu-cose tolerance and contributed to the development ofinsulin resistance in rats fed a high-fat diet. Werecently showed that short-term (5 weeks) leucinesupplementation impaired whole-body glucose toler-ance in young adult rats that correlated with perirenaladipose tissue accumulation (Balage et al. 2011). Inthe present study, 6-month leucine supplementationdid not change overall glucose tolerance in old ratsdespite a significant increase in perirenal adiposetissue content suggesting an age-related effect ofleucine supplementation: decreased overall glucosetolerance in young vs. no effect in old rats. Inagreement, Verhoeven et al. (2009) did not observeany changes in glycemic control and/or whole-bodyglucose tolerance in healthy elderly men subjected toa long-term leucine supplementation. Alternatively, itcould be speculated that whole-body insulin resis-tance was partly present in old rats (18 months old)before leucine supplementation compared to youngones (4 months old), limiting the leucine effect onglucose tolerance. Leucine has been shown topromote glucose uptake in isolated soleus musclefrom normal rats (Nishitani et al. 2002) or in rats withliver cirrhosis (Nishitani et al. 2005). In contrast, Doiet al. (2003) found that leucine did not increaseglucose transport in C2C12 myotubes or in vivo ingastrocnemius from young rats (Doi et al. 2005, 2007).In the present study, basal glucose transport wasunchanged in isolated muscle from long-term leucine-supplemented old rats, but the insulin-stimulatedglucose transport was improved as previously observedin young rats (Balage et al. 2011). This improvementwas sustained by the elevated phosphorylation of Aktat T308 and S473 observed in muscles from leucine-supplemented rats; Akt playing a key role in insulin-stimulated glucose transport. The improved Akt phos-
phorylation in leucine-supplemented rats was notlinked to increased PI3K activity, which was similarin control and LEU groups. Besides being a down-stream effector of PI 3-kinases, Akt may also beactivated in a PI 3-kinase-independent manner(Bhaskar and Hay 2007), but this was not investigatedin the present study. It may be surprising that increasedinsulin-stimulated glucose uptake did not translate intooverall glucose tolerance increase in leucine-supplemented rats (see above). However, Kleemannet al. (2010) reported that development of insulinresistance is a time- and tissue-dependent process.They clearly showed that high-fat-diet-induced insulinresistance in mice produced overall glucose intoleranceat week 1, decreased insulin sensitivity only at week 3in liver, at week 12 in white adipose tissue, withoutchange in skeletal muscle using hyperinsulinemicclamp technique. Interestingly, phosphorylation ofIRS1 on S636/639 was increased in adipose tissuefrom leucine-supplemented rats, whereas mRNA andprotein levels of Akt as well as mRNA and proteinlevels of RICTOR (an activator of Akt phosphoryla-tion) were decreased. These data were in favor ofdecreased insulin sensitivity on glucose metabolism inadipose tissue compared to muscle despite no measure-ments were done on glucose metabolism.
It has been suggested that acute overactivation ofthe mTORC1→S6K1 pathway by amino acids mayalter early steps of insulin signaling and promoteinsulin resistance (Tremblay and Marette 2001;Tremblay et al. 2007a, b). The present study showedthat chronic leucine supplementation did not induce asimilar effect in skeletal muscle. Indeed, S6K1 phos-phorylation was similar in control and leucine-supplemented rats both in the basal state and afteradministration of the nutrient bolus, suggesting thatchronic exposure to leucine excess has not inducedsustained activation of S6K1. This correlated withsimilar (1) tyrosine phosphorylation of IRβ and IRS1,(2) serine phosphorylation of IRS1, and (3) PI3K activityin muscle from control and leucine-supplemented rats.Recently, Newgard et al. (2009) reported that chronicBCAA supplementation in young rats induced anelevation in mTOR/S6K1 phosphorylation in responseto feeding but only when rats were fed a high-fat diet.Unlike in muscle, sustained leucine excess tended toinduce activation of mTOR/S6K1 pathway in adiposetissue and inhibition of IRS/Akt pathway. Furtherstudies are needed for a better comprehension of the
AGE

cross-talk between muscle and adipose tissue in acritical situation such as aging and to determine theoptimum nutritional design to prevent age-relatedsarcopenia using dietary leucine (i.e., combination withexercise, other nutrients, or discontinuous supplemen-tation periods) without fat mass gain.
In summary, this study shows that long-termleucine supplementation in old rats does not improveskeletal muscle mass but induces a gain in fat mass,probably through initial orexigenic effects, stimulationof themTOR pathway, and increased PPARγ expressionin adipose tissue. Chronic leucine supplementation doesnot induce a sustained activation of the mTOR pathwayin skeletal muscle, consistent with an absence of insulinsignaling impairment and overall glucose tolerance. Onthe contrary, Akt phosphorylation of muscles fromleucine-supplemented rats is more responsive to nutrientintake than in control rats and correlates with improvedinsulin-stimulated glucose transport.
Acknowledgments The authors thank Claire Sornet, PhilippeDenis, Nordine Hafnaoui, and Hélène Lafarge for theirtechnical participation and Christian Lafarge for animal care.
This work was supported by the Institut Benjamin Delessert,Paris, France; by INSERM, Université de Nice Sophia–Antipolis, and Conseil Général des Alpes-Maritimes.
References
Balage M, Dardevet D (2010) Long-term effects of leucinesupplementation on body composition. Curr Opin ClinNutr Metab Care 13:265–270
Balage M, Averous J, Remond D, Bos C, Pujos-Guillot E,Papet I, Mosoni L, Combaret L, Dardevet D (2010)Presence of low-grade inflammation impaired postprandialstimulation of muscle protein synthesis in old rats. J NutrBiochem 21:325–331
Balage M, Dupont J, Mothe-Satney I, Tesseraud S, Mosoni L,Dardevet D (2011) Leucine supplementation in ratsinduced a delay in muscle IR/PI3K signaling pathwayassociated with overall impaired glucose tolerance. J NutrBiochem 22:219–226
Bhaskar PT, Hay N (2007) The two TORCs and Akt. Dev Cell12:487–502
Boirie Y (2009) Physiopathological mechanism of sarcopenia. JNutr Health Aging 13:717–723
Boura-Halfon S, Zick Y (2009) Phosphorylation of IRSproteins, insulin action, and insulin resistance. Am JPhysiol Endocrinol Metab 296:E581–E591
Cheng Y, Meng Q, Wang C, Li H, Huang Z, Chen S, Xiao F,Guo F (2010) Leucine deprivation decreases fat mass bystimulation of lipolysis in white adipose tissue andupregulation of uncoupling protein 1 (UCP1) in brownadipose tissue. Diabetes 59:17–25
Combaret L, Dardevet D, Rieu I, Pouch MN, Bechet D,Taillandier D, Grizard J, Attaix D (2005) A leucine-supplemented diet restores the defective postprandialinhibition of proteasome-dependent proteolysis in agedrat skeletal muscle. J Physiol 569:489–499
Cortez MY, Torgan CE, Brozinick JTJ, Ivy JL (1991) Insulinresistance of obese Zucker rats exercise trained at twodifferent intensities. Am J Physiol Endocrinol Metab 261:E613–E619
Cota D, Proulx K, Smith KAB, Kozma SC, Thomas G, WoodsSC, Seeley RJ (2006) Hypothalamic mTOR signalingregulates food intake. Science 312:927–930
Cuthbertson D, Smith K, Babraj J, Leese G, Waddell T,Atherton P, Wackerhage H, Taylor PM, Rennie MJ(2005) Anabolic signaling deficits underlie aminoacid resistance of wasting, aging muscle. FASEB J19:422–424
Dardevet D, Sornet C, Attaix D, Baracos VE, Grizard J (1994)Insulin-like growth factor-1 and insulin resistance inskeletal muscles of adult and old rats. Endocrinology134:1475–1484
Dardevet D, Sornet C, Balage M, Grizard J (2000) Stimulationof in vitro rat muscle protein synthesis by leucinedecreases with age. J Nutr 130:2630–2635
Dardevet D, Sornet C, Bayle G, Prugnaud J, Pouyet C, GrizardJ (2002) Postprandial stimulation of muscle proteinsynthesis in old rats can be restored by a leucine-supplemented meal. J Nutr 132:95–100
Doi M, Yamaoka I, Fukunaga T, Nakayama M (2003)Isoleucine, a potent plasma glucose-lowering amino acid,stimulates glucose uptake in C2C12 myotubes. BiochemBiophys Res Commun 312:1111–1117
Doi M, Yamaoka I, Nakayama M, Mochizuki S, SugaharaK, Yoshizawa F (2005) Isoleucine, a blood glucose-lowering amino acid, increases glucose uptake inrat skeletal muscle in the absence of increases inAMP-activated protein kinase activity. J Nutr 135:2103–2108
Doi M, Yamaoka I, Nakayama M, Sugahara K, Yoshizawa F(2007) Hypoglycemic effect of isoleucine involves increasedmuscle glucose uptake and whole body glucose oxidationand decreased hepatic gluconeogenesis. Am J PhysiolEndocrinol Metab 292:E1683–E1693
Frick GP, Tai LR, Blinder L, Goodman HM (1981) L-Leucine activates branched chain alpha-keto aciddehydrogenase in rat adipose tissue. J Biol Chem256:2618–2620
Jitomir J, Willoughby DS (2008) Leucine for retention of leanmass on a hypocaloric diet. J Med Food 11:606–609
Katsanos CS, Kobayashi H, Sheffield-Moore M, Aarsland A,Wolfe RR (2005) Aging is associated with diminishedaccretion of muscle proteins after the ingestion of asmall bolus of essential amino acids. Am J Clin Nutr82:1065–1073
Katsanos CS, Kobayashi H, Sheffield-Moore M, Aarsland A,Wolfe RR (2006) A high proportion of leucine is requiredfor optimal stimulation of the rate of muscle proteinsynthesis by essential amino acids in the elderly. Am JPhysiol Endocrinol Metab 291:E381–E387
Kim JE, Chen J (2004) Regulation of peroxisome proliferator-activated receptor-gamma activity by mammalian target of
AGE

rapamycin and amino acids in adipogenesis. Diabetes53:2748–2756
Kim JS, Wilson JM, Lee SR (2010) Dietary implications onmechanisms of sarcopenia: roles of protein, amino acidsand antioxidants. J Nutr Biochem 21:1–13
Kleemann R, van Erk M, Verschuren L, van den Hoek AM,Koek M, Wielinga PY, Jie A, Pellis L, Bobeldijk-Pastorova I, Helder T, Toet K, Wopereis S, Cnubben N,Evelo C, van Ommen B, Kooistra T (2010) Time-resolvedand tissue-specific systems analysis of pathogenesis ofinsulin resistance. PLoS ONE 5:e8817
Krauss RM, Mayer J (1965) Influence of protein andamino acids on food intake in the rat. Am J Physiol209:479–483
Laviano A, Muscaritoli M, Cascino A, Preziosa I, Inui A,Mantovani G, Rossi-Fanelli F (2005) Branched-chainamino acids: the best compromise to achieve anabolism?Curr Opin Clin Nutr Metab Care 8:408–414
Layman DK (2003) The role of leucine in weight loss diets andglucose homeostasis. J Nutr 133:261S–267S
LaymanDK,Walker DA (2006) Potential importance of leucine intreatment of obesity and the metabolic syndrome. J Nutr136:319S–323S
Lonnqvist F, Nordfors L, Jansson M, Thorne A, Schalling M,Arner P (1997) Leptin secretion from adipose tissue inwomen. Relationship to plasma levels and gene expres-sion. J Clin Invest 99:2398–2404
Lynch CJ, Hutson SM, Patson BJ, Vaval A, Vary TC (2002a)Tissue-specific effects of chronic dietary leucine andnorleucine supplementation on protein synthesis in rats.Am J Physiol Endocrinol Metab 283:E824–E835
Lynch CJ, Patson BJ, Anthony J, Vaval A, Jefferson LS, VaryTC (2002b) Leucine is a direct-acting nutrient signal thatregulates protein synthesis in adipose tissue. Am J PhysiolEndocrinol Metab 283:E503–E513
Manders RJ, Wagenmakers AJ, Koopman R, Zorenc AH,Menheere PP, Schaper NC, Saris WH, van Loon LJ (2005)Co-ingestion of a protein hydrolysate and amino acidmixture with carbohydrate improves plasma glucosedisposal in patients with type 2 diabetes. Am J Clin Nutr82:76–83
Manders RJ, Koopman R, Sluijsmans WE, van den Berg R,Verbeek K, Saris WH, Wagenmakers AJ, van Loon LJ(2006) Co-ingestion of a protein hydrolysate with orwithout additional leucine effectively reduces postprandialblood glucose excursions in type 2 diabetic men. J Nutr136:1294–1299
Marzani B, Balage M, Venien A, Astruc T, Papet I, Dardevet D,Mosoni L (2008) Antioxidant supplementation restoresdefective leucine stimulation of protein synthesis inskeletal muscle from old rats. J Nutr 138:2205–2211
Mosoni L, Valluy MC, Serrurier B, Prugnaud J, Obled C,Guezennec CY, Patureau MP (1995) Altered response ofprotein synthesis to nutritional state and endurancetraining in old rats. Am J Physiol 268:E328–E335
Newgard CB, An J, Bain JR, Muehlbauer MJ, Stevens RD,Lien LF, Haqq AM, Shah SH, Arlotto M, Slentz CA,Rochon J, Gallup D, Ilkayeva O, Wenner BR, Yancy WSJr, Eisenson H, Musante G, Surwit RS, Millington DS,Butler MD, Svetkey LP (2009) A branched-chain aminoacid-related metabolic signature that differentiates obese
and lean humans and contributes to insulin resistance. CellMetab 9:311–326
Nishitani S, Matsumura T, Fujitani S, Sonaka I, Miura Y,Yagasaki K (2002) Leucine promotes glucose uptake inskeletal muscles of rats. Biochem Biophys Res Commun299:693–696
Nishitani S, Takehana K, Fujitani S, Sonaka I (2005) Branched-chain amino acids improve glucose metabolism in ratswith liver cirrhosis. Am J Physiol Gastrointest LiverPhysiol 288:G1292–G1300
Odessey R, Goldberg AL (1972) Oxidation of leucine by ratskeletal muscle. Am J Physiol 223:1376–1383
Prod’homme M, Balage M, Debras E, Farges MC, Kimball S,Jefferson L, Grizard J (2005) Differential effects of insulinand dietary amino acids on muscle protein synthesis inadult and old rats. J Physiol 563:235–248
Reeves PG, Nielsen FH, Fahey GC (1993) AIN-93 purifieddiets for laboratory rodents: final report of the AmericanInstitute of Nutrition ad hoc writing committee on thereformulation of the AIN-76A rodent diet. J Nutr123:1939–1951
Rieu I, Sornet C, Bayle G, Prugnaud J, Pouyet C, Balage M,Papet I, Grizard J, Dardevet D (2003) Leucine-supplemented meal feeding for ten days beneficiallyaffects postprandial muscle protein synthesis in old rats.J Nutr 133:1198–1205
Rieu I, Balage M, Sornet C, Giraudet C, Pujos E, Grizard J,Mosoni L, Dardevet D (2006) Leucine supplementationimproves muscle protein synthesis in elderly menindependently of hyperaminoacidaemia. J Physiol575:305–315
Rieu I, Balage M, Sornet C, Debras E, Ripes S, Rochon-Bonhomme C, Pouyet C, Grizard J, Dardevet D (2007)Increased availability of leucine with leucine-rich wheyproteins improves postprandial muscle protein synthesis inaging rats. Nutrition 23:323–331
Rosenthal J, Angel A, Farkas J (1974) Metabolic fate ofleucine: a significant sterol precursor in adipose tissue andmuscle. Am J Physiol 226:411–418
She P, Reid TM, Bronson SK, Vary TC, Hajnal A, Lynch CJ,Hutson SM (2007) Disruption of BCATm in mice leads toincreased energy expenditure associated with the activationof a futile protein turnover cycle. Cell Metab 6:181–194
Tremblay F, Marette A (2001) Amino acid and insulin signalingvia the mTOR/p70 S6 kinase pathway—a negativefeedback mechanism leading to insulin resistance inskeletal muscle cells. J Biol Chem 276:38052–38060
Tremblay F, Brule S, Hee Um S, Li Y, Masuda K, Roden M,Sun XJ, Krebs M, Polakiewicz RD, Thomas G, Marette A(2007a) Identification of IRS-1 Ser-1101 as a target ofS6K1 in nutrient- and obesity-induced insulin resistance.Proc Natl Acad Sci USA 104:14056–14061
Tremblay F, Lavigne C, Jacques H, Marette A (2007b) Role ofdietary proteins and amino acids in the pathogenesis ofinsulin resistance. Annu Rev Nutr 27:293–310
Um SH, D’Alessio D, Thomas G (2006) Nutrient overload,insulin resistance, and ribosomal protein S6 kinase 1,S6K1. Cell Metab 3:393–402
Vary TC, Lynch CJ (2007) Nutrient signaling componentscontrolling protein synthesis in striated muscle. J Nutr137:1835–1843
AGE
Verhoeven S, Vanschoonbeek K, Verdijk LB, Koopman R,Wkwh W, Dendale P, Van Loon LJC (2009) Long-termleucine supplementation does not increase muscle massor strength in healthy elderly men. Am J Clin Nutr89:1468–1475
Wang P, Mariman E, Renes J, Keijer J (2008) The secretoryfunction of adipocytes in the physiology of white adiposetissue. J Cell Physiol 216:3–13
Yaspelkis BB, Singh MK, Krisan AD, Collins DE, Kwong CC,Bernard JR, Crain AM (2004) Chronic leptin treatmentenhances insulin-stimulated glucose disposal in skeletalmuscle of high-fat fed rodents. Life Sci 74:1801–1816
Zhang YY, Guo KY, Leblanc RE, Loh D, Schwartz GJ, Yu YH(2007) Increasing dietary leucine intake reduces diet-inducedobesity and improves glucose and cholesterol metabolism inmice via multi-mechanisms. Diabetes 56:1647–1654
AGE
Copyright © 2022 FDOKUMEN